development and water quality model validation of a
TRANSCRIPT

1
Development and Water Quality Model Validation of a Phosphorus Trading Program for the
Non-Tidal Passaic River Basin
Report prepared by:
Rutgers University, Department of Environmental Sciences
Dr. Christopher Obropta, Associate Professor and Principal Investigator Dr. William Goldfarb, Professor Emeritus
Dr. Peter Strom, Professor Dr. Christopher Uchrin, Professor
Dr. Josef Kardos
Cornell University, Department of Applied Economics and Management
Dr. Richard Boisvert, Professor Dr. Gregory Poe, Associate Professor
U.S. Environmental Protection Agency Region 2 / Land Grant University Liaison
Mr. Jeffrey Potent
Submitted to: U.S. Environmental Protection Agency Region 2 New Jersey Department of Environmental Protection Deliverable Item under Targeted Watershed Grant Contract Agreement Number WS972841-04-0

2
Table of Contents Page
Executive Summary ......................................................................................................... 5 I. Introduction ................................................................................................................. 6 II. Literature Review ........................................................................................................ 8 III. System Dynamics..................................................................................................... 10 Identification of potential hot spots ...................................................................... 10 Identification of Category 1 waters ....................................................................... 11 Surface water diversions ....................................................................................... 11 IV. Design of Trading Framework................................................................................. 13
Two categories of dischargers .............................................................................. 13 Management area approach .................................................................................. 13 V. Trading Formula ....................................................................................................... 18
Discharger concentrations vs. loads ...................................................................... 18 Allocations ............................................................................................................ 19 Trading formula ................................................................................................... 20 Trading ratios ........................................................................................................ 23 Attenuation analysis and persistence coefficients ........................................ 23 Derivation of trading ratios .......................................................................... 25 Trading with the purveyor .................................................................................... 29 VI. Trading Scenarios .................................................................................................... 32 Scenario development objectives .......................................................................... 32 Diversions ............................................................................................................. 34 Baseline simulations ............................................................................................. 34 Scenario development ........................................................................................... 35 Scenario results ..................................................................................................... 36 TMDL critical location: Wanaque South intake .......................................... 36 TMDL critical location: Dundee Lake ......................................................... 36 Initial results..................................................................................... 36 Calibrated results ............................................................................. 37 Other areas of concern ................................................................................. 37 Evaluation matrices ............................................................................................... 38 Conclusion ............................................................................................................ 38 VII. Additional topics .................................................................................................... 39 Monitoring ............................................................................................................ 39 Trading with Municipal Separate Storm Sewer Systems (MS4s) and Nonpoint Sources ..................................................................................... 39 References ...................................................................................................................... 41
3
List of Tables Table 4-1: Category 1 and Category 2 dischargers ....................................................... 44 Table 5-1 Point source zones developed for Omni attenuation analysis (Omni, 2007c) ................................................................................................... 46 Table 5-2: Rockaway Zone annual zonal persistence coefficients (ZPCs),
adapted from Omni (2007c) ................................................................................ 47 Table 5-3: Point source zones and allocations for trading, listed in order of Discharger ID (2005-2007 avg. flow based on NJDEP OPRA
DMR database, accessed August 5, 2008) ........................................................... 48 Table 5-4: Point source zones and allocations for trading, listed in order
of point source zone and allocation size (2005-2007 avg. flow based on NJDEP OPRA DMR database, accessed August 5, 2008 ................................................ 50
Table 5-5: Initial trading ratio matrix A, based on minima of three diversion scenarios (sellers in rows, buyers in columns) .................................... 52 Table 5-6: Initial trading ratio matrix B, based on averages of three diversion scenarios (sellers in rows, buyers in columns) .................................... 53 Table 5-7: FINAL trading ratio matrix, based on 90% of inter-point source zone ratios in table 5-5 (sellers in rows, buyers in columns) ................... 54 Table 5-8: Persistence coefficients at Wanaque South intake, at extreme
diversion conditions; adapted from Omni (2007c) ............................................. 55 Table 6-1: Trade scenario baseline simulations ............................................................ 56 Table 6-2: Trading scenarios and cases ........................................................................ 57 Table 6-3: Description of trading scenarios for water quality simulation .................... 62 Table 6-4: Ratio of trade scenario to baseline for TP load diverted at
Wanaque South intake (adapted from Omni, 2007d); applied trading ratios based on Table 5-5 and Table 5-6 ..................................... 63
Table 6-5: Initial result of ratio of trade scenario to baseline for summer average chl-a at Dundee Lake (adapted from Omni, 2007d) .............................. 64 Table 6-6: Trading scenarios 2 and 8 re-simulated with Table 5-7 trading ratios ........ 65 Table 6-7: Calibrated result of ratio of case-scenario to baseline for summer
average chl-a at Dundee Lake (adapted from Omni, 2007d) ............................... 66 Table 6-8: Key for Figure 6-1 ....................................................................................... 66 Table 6-9: Definition of criteria for evaluation matrices .............................................. 67 Table 6-10: Evaluation matrix of trade scenario results at Dundee Lake, using Table 5-5 trading ratios .............................................................................. 68 Table 6-11: Evaluation matrix of trade scenario results at Dundee Lake, using Table 5-6 trading ratios .............................................................................. 68 Table 6-12: Evaluation matrix of trade scenario results at Dundee Lake, using Table 5-7 trading ratios .............................................................................. 69 Table 6-13: Evaluation matrix of trade scenario results at Wanaque South intake, using Table 5-5 trading ratios .................................................................. 69 Table 6-14: Evaluation matrix of trade scenario results at Wanaque South intake, using Table 5-6 trading ratios ................................................................... 70 Table 6-15: Evaluation matrix of trade scenario results at Wanaque South intake, using Table 5-7 trading ratios .................................................................. 70
4
Table 6-16: Evaluation matrix of trade scenario results at Passaic River near Chatham, using Table 5-5 trading ratios ..................................................... 71 Table 6-17: Evaluation matrix of trade scenario results at Passaic River near Chatham, using Table 5-6 trading ratios ..................................................... 71 Table 6-18: Evaluation matrix of trade scenario results at Passaic River near Chatham, using Table 5-7 trading ratios ..................................................... 72 Table 6-19: Evaluation matrix of trade scenario results at Passaic River Little Falls intake, using Table 5-5 trading ratios ............................................... 72 Table 6-20: Evaluation matrix of trade scenario results at Passaic River Little Falls intake, using Table 5-6 trading ratios ............................................... 73 Table 6-21: Evaluation matrix of trade scenario results at Passaic River Little Falls intake, using Table 5-7 trading ratios ............................................... 73 Table 6-22: Evaluation matrix of trade scenario results at Peckman River mouth, using Table 5-5 trading ratios ................................................................. 74 Table 6-23: Evaluation matrix of trade scenario results at Peckman River mouth, using Table 5-6 trading ratios ................................................................. 74 Table 6-24: Evaluation matrix of trade scenario results at Peckman River mouth, using Table 5-7 trading ratios ................................................................. 75 List of Figures Figure 3-1: Locations with varying sensitivity to phosphorus loading
(adapted from Omni, 2007a) ................................................................................ 77 Figure 3-2: TMDL Critical Locations (identical to Potential Phosphorus Induced Hot
Spots) ................................................................................................................... 78 Figure 3-3: Antidegradation Categories for Surface Water Bodies .............................. 79 Figure 4-1: Category 1 and Category 2 Dischargers ................................................... 80 Figure 4-2: Passaic Trading Framework ....................................................................... 81 Figure 4-3: Passaic Trading Table: No Diversion Scenario ......................................... 81 Figure 4-4: Passaic Trading Table: Diversion Scenario ............................................... 82 Figure 4-5: Passaic Trading Table: Extreme Diversion Scenario ................................. 82 Figure 4-6: Passaic Trading Framework: Three Management Areas Protecting Two Critical Locations ....................................................................... 83 Figure 5-1: Percent capacity flow, 2005-2007 data (source: NJDEP OPRA DMR
database, accessed Jan 18 2008 ........................................................................... 83 Figure 6-1: TMDL critical locations and areas of concern ........................................... 84 Appendices Appendix 1: Surface Water Diversions Appendix 2: Trade Verification Forms Appendix 3: Example Trades Appendix 4: Example Derivations of Trading Ratios Appendix 5: Ten Steps to Passaic Trading Appendix 6: Draft Quality Assurance Project Plan (QAPP)

5
Executive Summary A Total Maximum Daily Load (TMDL) for phosphorus has been developed for
the Non-Tidal Passaic River Basin. The TMDL proposed watershed criteria in terms of a
seasonal average concentration (June 15-September 1) of the response indicator,
chlorophyll-a (chl-a). These criteria require each regulated discharger within the model
domain to achieve a long term average (LTA) effluent concentration of 0.4 mg/l of total
phosphorus (TP). Some of the dischargers in the watershed can easily upgrade to achieve
this long-term average effluent concentration while others are expected to require
significant upgrades. Some of the dischargers can achieve even higher levels of
phosphorus removal, beyond the required 0.4 mg/l. This wide range of discharger
characteristics renders the Non-Tidal Passaic River Basin ideal for the implementation of
a water quality trading program.
The TMDL model was used to develop trading ratios that would achieve
compliance with TMDL water quality targets at two critical locations: the Wanaque
Reservoir and Dundee Lake. These trading ratios provide the foundations for developing
a point-to-point source trading program for the Non-Tidal Passaic River Basin.
Extensive simulations of a variety of trading scenarios were conducted to validate the
proposed trading program. In-stream water quality model simulations have verified that
the recommended trading ratios will achieve compliance with TMDL water quality
targets at the critical locations under high-stress trading conditions, heavy cross-tributary
trading, critical diversion conditions, and scenarios where buyers are concentrated either
upstream or downstream.

6
Key items within the report are a) the proposed formula for trading in Section V,
b) allocations for trading listed in Table 5-4, c) recommended trading ratios listed in
Table 5-7, and d) example trades illustrated in Appendix 3.
I. Introduction The non-tidal portion of the Passaic River Basin encompasses 803 square miles,
with 669 square miles of the watershed in New Jersey and the remainder in New York.
Approximately ¼ of New Jersey’s population (i.e., two million people) lives in this
watershed. Three of New Jersey’s twenty watershed management areas (WMAs), WMA
3, 4, and 6, can be found in the Non-Tidal Passaic River Basin. WMA 3 includes the
Pompton, Pequannock, Wanaque, and Ramapo Rivers; WMA 4 includes the Lower
Passaic and Saddle Rivers, and WMA 6 includes the Upper and Middle Passaic,
Whippany, and Rockaway Rivers. In addition, 23 reservoirs, which provide potable
water to the residents of New Jersey, are located within the non-tidal portion of the
Passaic River Basin. The Wanaque Reservoir is the largest potable water source in the
watershed, and it receives surface water from diversions of the Ramapo, Pompton, and
the confluence of the Pompton and Passaic Rivers to supply water to the North Jersey
District Water Supply Commission and the Passaic Valley Water Commission. Overall,
about 50% of New Jersey’s population receives drinking water from the Non-Tidal
Passaic River Basin.
A Total Maximum Daily Load (TMDL) (NJDEP, 2008) for phosphorus has been
adopted for the Non-Tidal Passaic River Basin (i.e., the river and its tributaries upstream
of Dundee Dam, including the Wanaque Reservoir). Surface water samples have been
collected at over 70 sampling stations within the watershed, including 24 wastewater

7
treatment plants (WWTPs). For the TMDL study, a hydrodynamic model (USGS, 2007)
and a water quality model (Omni Environmental, 2007a) were developed for the non-
tidal portion of the Passaic River. These models, coupled with the LA-WATERS model
(Najarian Associates, 2005) were used to identify the Wanaque Reservoir and Dundee
Lake as the critical locations where phosphorus is causing excessive primary
productivity. As part of the TMDL, the New Jersey Department of Environmental
Protection (NJDEP) proposed watershed criteria in accordance with N.J.A.C. 7:9B-
1.5(g)3 in these locations as the best means to ensure protection of the designated uses.
The watershed criteria were proposed in terms of a seasonal average concentration (June
15-September 1) of the response indicator, chl-a. The proposed criteria were tailored to
the unique characteristics of each critical location and were proposed as a seasonal
average of 10 μg/L chl-a in the Wanaque Reservoir and a seasonal average of 20 μg/L
chl-a in Dundee Lake (NJDEP, 2008).
The wasteload allocations for wastewater treatment facilities needed to meet the
watershed criteria at Wanaque Reservoir and Dundee Lake were based on a LTA effluent
concentration of 0.4 mg/l of TP for all wastewater dischargers within the model domain.
Some of the dischargers in the watershed can easily upgrade to achieve the LTA effluent
concentrations of 0.4 mg/l while others are expected to require significant upgrades.
Some of the plants can achieve even higher levels of phosphorus removal, beyond the
required 0.4 mg/l. This distribution in the ability of the present capacity of WWTPs to
meet the designated TMDL standards, along with a wide range of flow capacities across
WWTPs provides for substantive trading opportunities that would otherwise not exist in
an industry characterized by relatively homogenous technology (Boisvert et al., 2008).

8
The goal of this project was to develop and evaluate an effective water quality
trading program for the Non-Tidal Passaic River Basin that adheres to the United
States Environmental Protection Agency (USEPA) Water Quality Trading Policy and
meets the requirements of NJDEP which will result in complying with the Passaic
Nutrient TMDL and thus attaining the State Water Quality Standards, facilitate the
implementation of the TMDL, reduce the costs of compliance with the Clean Water Act
regulations, establish incentives for voluntary reductions, and accelerate the
implementation of the TMDL load reductions. Since the main sources of phosphorus in
the watershed are point sources (i.e., WWTPs), the trading program was developed for
point-to-point source trading. This report presents the development and water quality
model validation of a water quality trading program for the Non-Tidal Passaic River
Basin.
II. Literature Review
In terms of TMDL implementation, water quality trading offers a management
alternative to regulations that specify effluent levels or particular abatement technologies
for each source of emissions. Trading is a watershed-based and market-based approach
that allows flexibility in individual emissions or abatement levels while meeting ambient
water quality standards. The EPA supports water quality trading and issued policy
guidance in 2003 on trading (USEPA, 2003). Trading is based on the premise that
sources in a watershed can face very different costs to control the same pollutant. A
trading program allocates a certain number of pollution allowances to sources in the
watershed. The sources can either discharge under their allocation and sell their excess
allowances or discharge over their allocation and purchase allowances. With appropriate
9
restrictions on trade, the net effect will be to achieve targeted ambient levels of water
quality throughout the watershed, ideally at a lower cost than requiring each individual
source of emissions to implement pollution controls that individually and collectively
comply with the required TMDL reductions. Trading can occur among point sources and
nonpoint sources. Depending on the market structure of the program, sources can trade
directly or indirectly with each other (USEPA, 2004).
The project team reviewed several water quality trading programs throughout the
U.S. to learn how to best design trading for the Passaic. Results of those studies are
detailed in Passaic Water Quality Trading Project (2006a, 2006b). Breetz et al. (2004) is
also an excellent reference on U.S. water quality trading programs. Boisvert et al. (2007)
provides an overview of economic issues germane to designing a trading program.
In terms of the scientific aspects of trading program design, there are two main
issues: hot spot avoidance and trading ratios. In addition, overall simplicity of the trading
program and clearly defined allocations are crucial. The approach toward all these issues
for Passaic trading is discussed in Sections III, IV and V. Since Passaic trading will only
involve point sources, our work benefited from several examples of point-point source
trading programs (e.g., Long Island Sound, Lower Minnesota River, Neuse River), while
recognizing that institutional and hydrologic features of the non-tidal Passaic differ from
these previous programs. For example, in addressing trading in a watershed with
complex surface water diversions and multiple TMDL critical locations like the Non-
Tidal Passaic River Basin, no precedents in the literature were found. Hence this project
offers new solutions that could be applied to similar watersheds. In a similar manner, the
economic trading models (Sado et al., 2006; Boisvert et al., 2007, Boisvert et al., 2008)
10
have broader relevance to water quality trading opportunities in watersheds of limited
size with multiple management areas.
III. System Dynamics
Identification of potential hot spots
“Hot spots” describes localized areas with unacceptably degraded water quality
due to high concentrations of a pollutant. The USEPA (2004) notes that one concern
regarding water quality trading is the potential that trades will create hot spots
immediately downstream of pollutant sources that purchase allowances. Trading
programs must be designed to avoid such outcomes.
Correspondingly, water quality trading in the Non-Tidal Passaic River Basin must
be structured so that no hot spots result from phosphorus trading. To achieve this
objective, the first task is to define the concept of “phosphorus-induced hot spots,” and
identify where and under what conditions they can occur in the Non-Tidal Passaic River
Basin.
Phosphorus-induced hot spots are locations in the watershed where excessive
loading of phosphorus can increase the risk of algal blooms. A number of primary
variables contribute to algal blooms including total phosphorus, total nitrogen,
temperature and light. In addition, there are other secondary variables that affect algal
blooms, namely stream flow, shade cover and turbidity. An extensive water quality
study of the system (Omni, 2007a) indicated that excessive phosphorus concentrations in
certain areas are more likely to stimulate algal blooms, as indicated by elevated levels of
chl-a and increased diurnal fluctuations of dissolved oxygen. In contrast, equally high
concentrations of phosphorus in other areas may not stimulate algal growth due to other
11
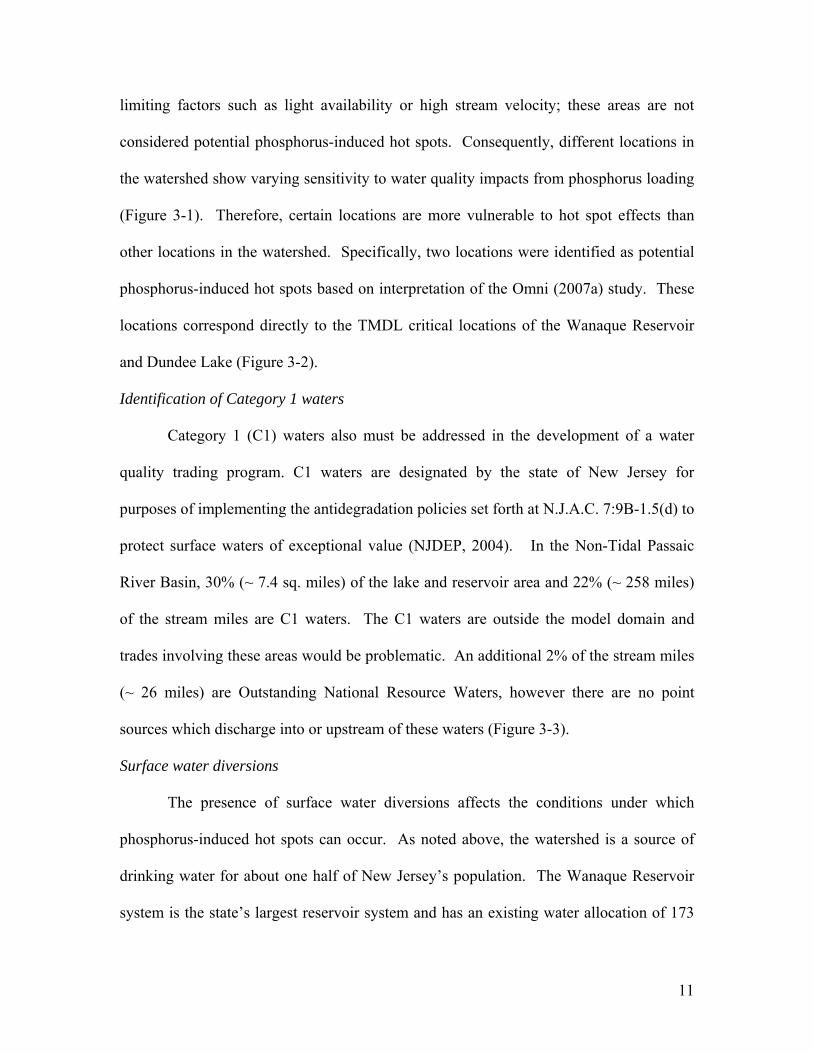
limiting factors such as light availability or high stream velocity; these areas are not
considered potential phosphorus-induced hot spots. Consequently, different locations in
the watershed show varying sensitivity to water quality impacts from phosphorus loading
(Figure 3-1). Therefore, certain locations are more vulnerable to hot spot effects than
other locations in the watershed. Specifically, two locations were identified as potential
phosphorus-induced hot spots based on interpretation of the Omni (2007a) study. These
locations correspond directly to the TMDL critical locations of the Wanaque Reservoir
and Dundee Lake (Figure 3-2).
Identification of Category 1 waters
Category 1 (C1) waters also must be addressed in the development of a water
quality trading program. C1 waters are designated by the state of New Jersey for
purposes of implementing the antidegradation policies set forth at N.J.A.C. 7:9B-1.5(d) to
protect surface waters of exceptional value (NJDEP, 2004). In the Non-Tidal Passaic
River Basin, 30% (~ 7.4 sq. miles) of the lake and reservoir area and 22% (~ 258 miles)
of the stream miles are C1 waters. The C1 waters are outside the model domain and
trades involving these areas would be problematic. An additional 2% of the stream miles
(~ 26 miles) are Outstanding National Resource Waters, however there are no point
sources which discharge into or upstream of these waters (Figure 3-3).
Surface water diversions
The presence of surface water diversions affects the conditions under which
phosphorus-induced hot spots can occur. As noted above, the watershed is a source of
drinking water for about one half of New Jersey’s population. The Wanaque Reservoir
system is the state’s largest reservoir system and has an existing water allocation of 173

12
million gallons per day (MGD). It can receive up to 400 MGD from surface water
diversions. Surface water is pumped to the Wanaque Reservoir from discrete points
located downstream at a rate according to consumer demand, water availability and
regulatory restriction (see Appendix 1 for details). This fundamentally alters the
hydrology of the watershed, and diversions to the Wanaque Reservoir transform basic
relationships of upstream and downstream between certain locations in the watershed.
For example, when the Wanaque Reservoir does not require diverted inflow, the Passaic
River is not a natural tributary or source of water to the reservoir. But when the Wanaque
Reservoir does require high volumes of diverted inflow as occurred in a 2002 drought,
the Upper Passaic River waters can be diverted to the reservoir, and the river effectively
becomes “upstream” of the reservoir (Najarian Associates, 2005). The watershed
hydrology thus fluctuates with the extent of surface water diversions, resulting in
dynamic relationships of upstream and downstream that must be accounted for in
designing a trading program that avoids the creation of hot spots.
As a result, the Wanaque Reservoir is only vulnerable to phosphorus-induced hot
spots from water quality trading under the condition that surface water diversions are
occurring; if surface water diversions are not occurring, the Wanaque Reservoir is not
vulnerable to phosphorus-induced hot spots from water quality trading. In contrast,
Dundee Lake, located at the watershed outlet, is vulnerable to being a phosphorus-
induced hot spot from water quality trading under all stream flow conditions, regardless
of the occurrence of surface water diversions. This distinction between the two locations
is critical to the development of a water quality trading framework that avoids the
creation of hot spots.
13
IV. Design of Trading Framework
This section describes the design of a framework to address the physical
boundaries that govern trading among dischargers. The trading framework ensures the
avoidance of phosphorus-induced hot spots and attainment of water quality standards.
Two categories of dischargers
To protect C1 waters, point sources that discharge either directly into C1 waters,
or naturally upstream of C1 waters, should not be allowed to participate in the trading
program; such dischargers are termed “Category 1 dischargers.” In contrast, “Category
2 dischargers” are those point sources which do not discharge directly into C1 waters, or
naturally upstream of C1 waters. Category 2 dischargers can participate in trading as
buyers or sellers, provided they were included in the TMDL model domain (see Figure
4-1 and Table 4-1 for map and list of Category 1 and 2 dischargers). Note that there are
17 Category 1 dischargers and 35 Category 2 dischargers. Of the 35 Category 2
discharges, 23 of the 35 are contained within the TMDL model domain and are eligible to
participate in the trading program. These eligible 23 Category 2 dischargers are the much
larger group in terms of capacity and comprise 93% of the total permitted flow of all
fifty-two dischargers in the basin. Trade eligibility is further restricted according to
“management area” designation as described below.
Management area approach
In light of the system dynamics, the trading program development team
(comprising experts in water quality modeling, wastewater treatment, environmental law
and policy, and environmental economics) has proposed a trading framework that is
expected to protect the Non-Tidal Passaic River Basin from phosphorus-induced hot
14
spots associated with trading and result in compliance with the TMDL endpoints. The
proposed framework establishes three “management areas” within the watershed. A
management area is delineated so that its outlet represents the only hot spot concern in
that management area. Since there are no hot spot concerns besides the management area
outlets, bidirectional trades (i.e., seller can be upstream or downstream of the buyer) are
allowed within the same management area. Trades are subject to a trading ratio to
equalize the load traded and account for differences in attenuation of load from each
WWTP relative to the management area outlet.
In contrast to a more rigid framework that stipulates the seller must always be
upstream of the buyer, the Passaic trading framework increases opportunities for trading
and potential market size. Compliance with TMDL water quality targets is defined as
achieving the net effect of 0.4 mg/l LTA from each discharger at the TMDL critical
locations. The trading framework is designed to comply with TMDL water quality
targets on the basis that high phosphorus at some, not all, locations is a hot spot concern,
namely the Wanaque Reservoir and Dundee Lake as determined from water quality
studies conducted throughout the watershed (Omni, 2007a). Dundee Lake and the pump
intake for surface water diversions to the Wanaque Reservoir (i.e., Wanaque South
intake) are the two management area outlets; both outlet locations can receive phosphorus
loads from upstream dischargers. Since the pump intake is located at the confluence of
the Passaic and Pompton Rivers, and surface water diversions are designed to draw from
either the Pompton River by itself or jointly from the Pompton and Passaic Rivers, the
pump intake is the outlet for two separate management areas. In total, three management

15
areas are delineated: the Pompton management area, the Upper Passaic management area
and the Lower Passaic management area (Figure 4-2).
As described earlier, the trading framework allows bidirectional intra-
management area trading so long as the appropriate trading ratios are applied (trading
ratios are detailed in Section V). The project team then examined the question of inter-
management area trading and the necessary restrictions to avoid phosphorus-induced hot
spots.
Due to fluctuations in precipitation and demand for drinking water from the
Wanaque Reservoir, three potential surface water diversion scenarios can occur with
respect to the Wanaque South intake. These scenarios, termed “no diversion,”
“diversion” and “extreme diversion,” are explained in detail below. Each scenario
creates a different relationship between the three management areas and potential
phosphorus-induced hot spots, and as a result restrictions on inter-management area
trading could differ with each scenario.
In the “no diversion” scenario, the Wanaque South intake is not activated, thus the
Wanaque Reservoir does not receive any phosphorus loads from dischargers (i.e., eligible
buyers) in the watershed. (The “no diversion” scenario is estimated to have occurred on
63 percent of the days from October 1, 1999 through Nov 30, 2003 (Omni, 2007b)). This
leaves Dundee Lake as the only potential phosphorus-induced hot spot. In this case,
dischargers from the three management areas affect only Dundee Lake, and bidirectional
trading can occur throughout the entire watershed; each management area can buy or sell
with the other two management areas. The trading framework for the “no diversion”
scenario is shown in Figure 4-3.

16
In the “diversion” scenario, the Wanaque South intake is partially activated. It
diverts surface water to the Wanaque Reservoir from the Pompton River only and not
from the Upper Passaic River. (The “diversion” scenario is estimated to have occurred
on 19 percent of the days from October 1, 1999 through November 30, 2003 (Omni,
2007b)). Therefore, the phosphorus load from the Pompton management area is diverted
upstream and impacts the Wanaque Reservoir, and all dischargers in the Upper and
Lower Passaic management areas impact Dundee Lake. (A portion of the Pompton
management area’s discharge reaches Dundee Lake, as well). In contrast with the “no
diversion” scenario, the “diversion” scenario has two potential phosphorus-induced hot
spots. To comply with TMDL water quality targets at the Wanaque South intake
endpoint, the Pompton management area cannot buy phosphorus allowances from the
other two management areas. Since dischargers from the Upper and Lower Passaic
management areas affect only Dundee Lake, these two management areas can trade
bidirectionally with each other. The trading framework for the “diversion” scenario is
shown in Figure 4-4.
In the “extreme diversion” scenario, the Wanaque South intake is fully activated,
and it diverts surface water to the Wanaque Reservoir from both the Pompton and Upper
Passaic Rivers. (The “extreme diversion” scenario is estimated to have occurred on 19
percent of the days from October 1, 1999 through November 30, 2003 (Omni, 2007b)).
Therefore, the phosphorus load from all dischargers in the Upper Passaic management
area and from dischargers in the Pompton management area is diverted upstream and
impacts the Wanaque Reservoir, and dischargers from the Lower Passaic management
area impact Dundee Lake. (A portion of the Pompton and Upper Passaic management
17
area discharge reaches Dundee Lake, as well). Similar to the “diversion” scenario, the
“extreme diversion” scenario has two potential phosphorus-induced hot spots. However
to comply with TMDL water quality targets at the Wanaque South intake endpoint, in
this case the Pompton and Upper Passaic management areas cannot buy phosphorus
allowances from the Lower Passaic management area. Since the Wanaque South intake
is only affected by dischargers from the Pompton and Upper Passaic management areas,
these two management areas can trade bidirectionally with each other. The trading
framework for the “extreme diversion” scenario is shown in Figure 4-5.
In selecting a final trading framework, it is important to note the activation of the
Wanaque South intake is highly variable both within a single year and between years. In
terms of the three scenarios outlined above, a shift from one scenario to another can occur
multiple times in a year. It would be impractical to expect the dischargers involved to
constantly jump from one trading framework to another with each change in scenarios.
That would likely increase transaction costs as dischargers would be forced to keep up to
date with frequently changing trading restrictions. It would also present possibly
insurmountable permitting/enforcement challenges. An alternative approach that would
reduce transaction costs, achieve compliance with TMDL water quality targets under all
diversion conditions, and reduce uncertainty and risk to water quality is to merge the
three trading frameworks into a single framework on the basis of selecting the most
stringent option in each possible inter-management area trade.
The resulting trading framework shown in Figure 4-6 restricts any trades that are
not allowed from any of the three scenarios. The result shows that the most conservative
option entails consideration of two possible diversion scenarios, and trading between

18
management areas is restricted accordingly. Thus, of the six possible inter-management
area trades, three are allowed and three are not allowed. The Lower Passaic management
area can buy from but not sell to the other management areas. Conversely, the Pompton
management area can sell to but not buy from the other management areas.
Consequently, the Upper Passaic management area can buy allowances from the
Pompton management area and sell allowances to the Lower Passaic management area.
For example, consider a pair of dischargers. Parsippany-Troy Hills Regional
Sewerage Authority, located in the Upper Passaic Management Area, could buy from the
Pompton Management Area’s Two Bridges Sewerage Authority. However, Two Bridges
could not buy from Parsippany-Troy Hills. This limitation allows for compliance with
TMDL water quality targets at the Wanaque South intake at “diversion” scenario
conditions and is applied for simplicity at all times.
As described further in the next section, all trades are subject to a trading ratio to
equalize the load traded and to account for differences in attenuation of load from each
discharger relative to the appropriate management area outlet.
V. Trading Formula
Discharger concentrations vs. loads
Achieving the goals of the proposed Passaic TMDL is driven primarily by
discharger concentration of total phosphorus rather than load (NJDEP, 2008). The
reason is that the growth of phytoplankton, the subject of proposed watershed criteria for
the Wanaque Reservoir and Dundee Lake, is more affected by the concentration of
orthophosphate in the water column than the mass of orthophosphate (Wool et al., 2003).
The TMDL concluded that, within the model domain, a total phosphorus LTA effluent of
19
0.4 mg/l on an annual basis from each discharger is necessary to achieve water quality
goals in the Wanaque Reservoir and Dundee Lake; a notable exception is dischargers
downstream of the Pompton/Passaic River confluence (hereafter referred to as the
Confluence) whose LTAs will be limited to 0.4 mg/l on a seasonal rather than annual
basis (NJDEP, 2008).
Allocations
The trading program should be based on attaining the net effect of 0.4 mg/l LTA
from each discharger on an annual basis (or seasonal basis for dischargers downstream of
the Confluence), while realizing that transactions must occur in units of mass, rather than
concentration for trading to be viable. The best way to achieve these objectives is to use
a recent history of actual discharger flow, rather than permitted flow, as the basis for
determining allocations in units of mass. If permitted flow were used instead to
determine allocations, and assuming that permitted flows exceed actual discharger flows,
sellers would receive allowances for more pounds than they had actually removed, thus
posing a risk to the water body. Therefore unused capacity cannot be sold, nor should
unused capacity be paid for, if trading is to achieve the discharger concentration-based
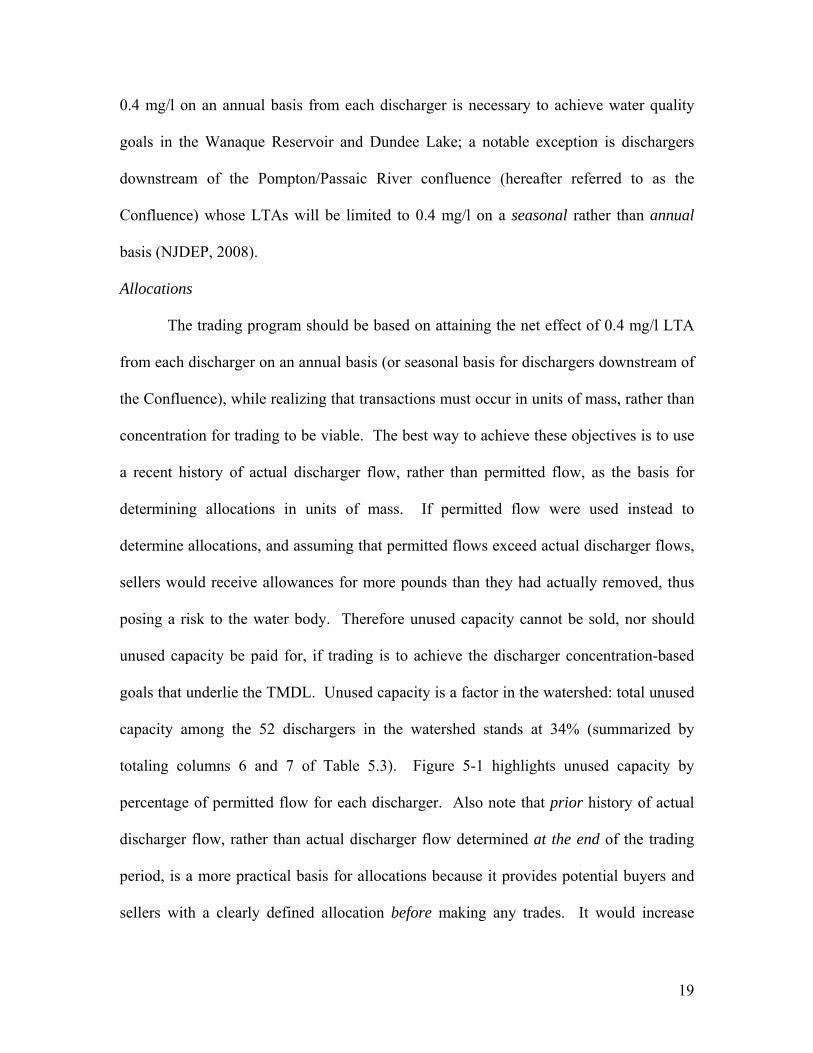
goals that underlie the TMDL. Unused capacity is a factor in the watershed: total unused
capacity among the 52 dischargers in the watershed stands at 34% (summarized by
totaling columns 6 and 7 of Table 5.3). Figure 5-1 highlights unused capacity by
percentage of permitted flow for each discharger. Also note that prior history of actual
discharger flow, rather than actual discharger flow determined at the end of the trading
period, is a more practical basis for allocations because it provides potential buyers and
sellers with a clearly defined allocation before making any trades. It would increase

20
uncertainty to design trading such that allocations were not known until after trades had
been agreed to. Using a recent history of actual discharger flow, which we term
anticipated actual discharger flow, as the basis for allocations helps to clearly define
property rights, an essential precursor for a successful trading program. See Boisvert et
al. (2007) for a discussion of the importance of clearly establishing property rights in
establishing a well-functioning trading program.
Allocations should be based on the product of 0.4 mg/l LTA and Anticipated
Actual Discharger Flow. The latter term refers to the average flow from a discharger
over the past three calendar years prior to the start of watershed trading. The formula
below proposes that actual discharger flow from 2005-2007 be the basis for Anticipated
Actual Discharger Flow in the allocation.
Trading Formula
Recommend that for each discharger, allowance balance should be calculated as follows:
Balance = Allocation – Load Discharged - Actual load sold + Equalized load purchased
where
Allocation = (0.4 mg/l LTAa * Anticipated Actual Discharger Flowb * 3.785 l/gal * 365 days),
Load Discharged = (Load discharged during the trading periodc),
Actual load sold = (Load below allocation that seller removed from wastewater and sold),
and
Equalized load purchased = (Actual load sold * Trading ratio seller to buyer).
Notes:
a. Dischargers downstream of the Confluence have a summer allocation (May-October).
All other dischargers have an annual allocation.
21
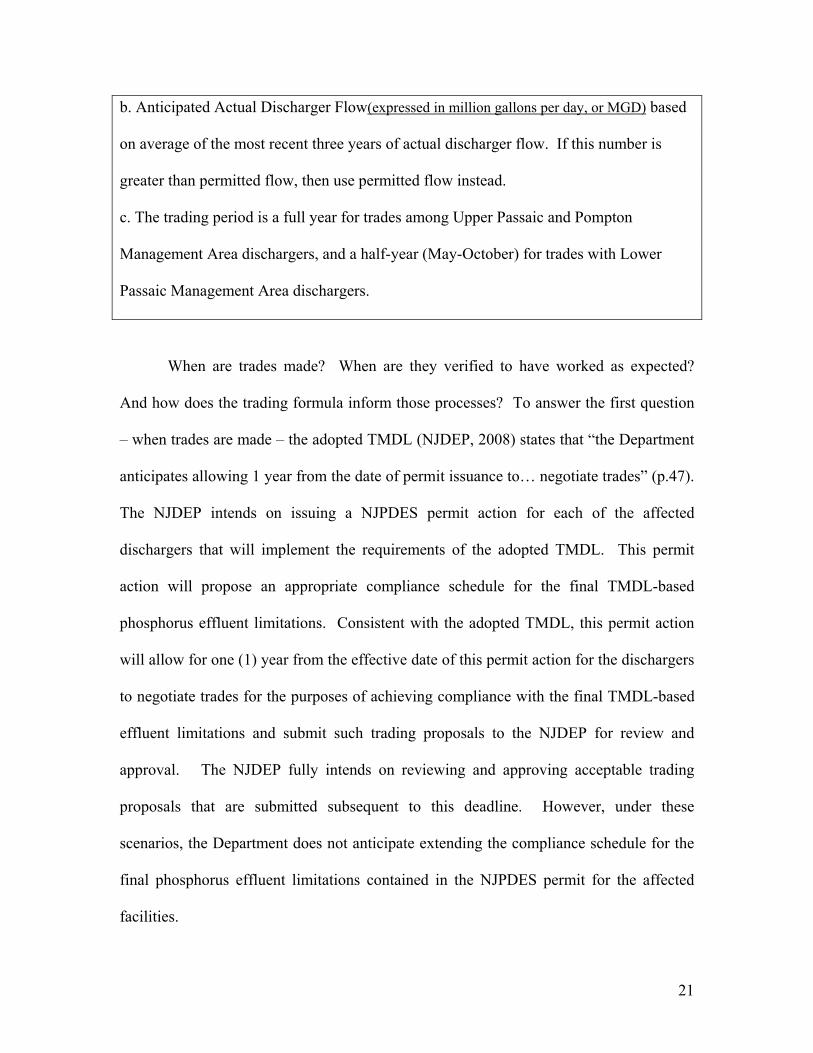
b. Anticipated Actual Discharger Flow(expressed in million gallons per day, or MGD) based
on average of the most recent three years of actual discharger flow. If this number is
greater than permitted flow, then use permitted flow instead.
c. The trading period is a full year for trades among Upper Passaic and Pompton
Management Area dischargers, and a half-year (May-October) for trades with Lower
Passaic Management Area dischargers.
When are trades made? When are they verified to have worked as expected?
And how does the trading formula inform those processes? To answer the first question
– when trades are made – the adopted TMDL (NJDEP, 2008) states that “the Department
anticipates allowing 1 year from the date of permit issuance to… negotiate trades” (p.47).
The NJDEP intends on issuing a NJPDES permit action for each of the affected
dischargers that will implement the requirements of the adopted TMDL. This permit
action will propose an appropriate compliance schedule for the final TMDL-based
phosphorus effluent limitations. Consistent with the adopted TMDL, this permit action
will allow for one (1) year from the effective date of this permit action for the dischargers
to negotiate trades for the purposes of achieving compliance with the final TMDL-based
effluent limitations and submit such trading proposals to the NJDEP for review and
approval. The NJDEP fully intends on reviewing and approving acceptable trading
proposals that are submitted subsequent to this deadline. However, under these
scenarios, the Department does not anticipate extending the compliance schedule for the
final phosphorus effluent limitations contained in the NJPDES permit for the affected
facilities.
22
During the one year period of allowed trade negotiations, interested parties would
apply the trading formula with an exact knowledge of their allocations, while needing to
estimate their expected load to be discharged for the upcoming trading period. (A trading
period is May-October when the Lower Passaic Management Area is involved, and a
calendar year in all other cases). The buyer and seller would determine their load
discharged over the trading period and apply the trading formula to verify that the seller
removed enough phosphorus to offset the buyer for that trading period. To reiterate, the
allocation is known before the trade goes into effect, while the load discharged is not
known until the end of the trading period. Trades are negotiated on the basis of
estimating the load to be discharged and subsequently verified using the actual data at the
end of the trading period. To aid the verification process, an example trade verification
form for the buyer and seller is shown in Appendix 2.
The form in Appendix 2 will not be used by NJDEP to verify trades. Final
effluent limitations resulting from the approved trading agreements will be incorporated
into NJPDES permits applicable to the appropriate dischargers. Therefore, verification of
trades will occur consistent with final effluent limitation compliance and the enforcement
provisions of N.J.A.C. 7:14 and 7:14A. As such, no NJDEP verification at the end of
each trading period is necessary.
Additionally, to comply with TMDL water quality targets on an annual basis, a
positive balance cannot be banked for use in a future trading period. Also, kilograms that
are bought and sold need to be adjusted by a trading ratio to account for attenuation
differences between the dischargers.
Appendix 3 contains examples of how to apply the trading formula.

23
This approach to calculating allowance balances will result in trades that achieve
the goals of a concentration-driven TMDL. Provided that appropriate trading ratios are
applied, trades conducted in this manner will achieve a net effect of 0.4 mg/l LTA from
each discharger, and thus achieve TMDL water quality goals at the Wanaque Reservoir
and Dundee Lake.
Trading ratios
Attenuation analysis and persistence coefficients
To successfully implement the proposed phosphorus TMDL for the Non-Tidal
Passaic River Basin, water quality trading must achieve compliance with TMDL water
quality targets at the Wanaque South intake and Dundee Lake critical locations under a
wide range of flow conditions. Periods when surface water is diverted at the Wanaque
South intake to supply the Wanaque Reservoir are of special concern in designing a
trading program that ensures compliance with TMDL water quality targets. Differences
in attenuation of effluent loads among trading participants must also be accounted for.
The unique diversion conditions of the watershed have resulted in the design of the
Passaic Trading Framework (Figure 4-6) which divides the watershed into three
management areas and specifies which inter-management area trades are allowed. The
next step, explained in this section, was to address the development of trading ratios to
account for differences in load attenuation between each eligible pair of buyers and
sellers.
A trading ratio accounts for differences in attenuation [A] of phosphorus load
from each discharger and equalizes the load that is traded. Trading ratios are a common
practice in water quality trading programs (e.g., Long Island Sound, Lower Minnesota
24
River) and are recommended by USEPA (2004) to ensure that trades protect water
quality.
As described by Omni (2007c):
Attenuation is a result of the uptake of orthophosphate by plants and the physical sorption and settling of orthophosphate and organic phosphorus that occurs in the stream. Plant uptake and settling vary spatially. This variability causes the loads from different source zones to be attenuated at different rates along the stream network. The phosphorus attenuation of a given point source zone depends on three factors: 1) the distance between the outlet of the point source zone and the target location; 2) the settling and uptake rates of orthophosphate and organic phosphorus occurring in the flow path from a given zone to a target location; and 3) the ratio of orthophosphate and organic phosphorus discharged from the point source zone.
Omni was contracted to apply the in-stream water quality model developed for the
TMDL (Omni, 2007a), and derive total phosphorus persistence coefficients for the
watershed. A persistence coefficient [P] represents the fraction of phosphorus discharged
from a point source that reaches a particular downstream location; it is the fraction of
phosphorus that is not attenuated (i.e., P=1-A). Omni’s (2007c) methodology for
deriving persistence coefficients can be summarized as follows:
1. Point sources were divided into ten zones (Table 5-1). Within each zone, no
attenuation is assumed. (The project team subsequently merged the Whippany
and Troy-Hill zones, yielding a total of nine zones).
2. A baseline simulation was executed in which each point source discharged 1.0
mg/l total phosphorus, consisting of 0.875 mg/l orthophosphate and 0.125
mg/l organic phosphorus at permitted flows.
3. One at a time, each point source zone was “turned off” and set to discharge
zero load of total phosphorus. The result was then compared to the baseline
simulation at a series of downstream locations. Thus the effect of completely

25
removing phosphorus from a particular point source zone could be quantified
downstream.
4. The persistence coefficient was calculated.
The zonal [persistence] coefficient [ or ZPC] represents the equivalent total phosphorus load reduction at target location j due to a unit load reduction in the source zone i… For every pound of phosphorus reduced from a point source zone, how much is reduced at the various target locations [downstream]? If a 10-pound reduction at a point source zone results in a 9-pound reduction at a target location, the zonal [persistence] coefficient would be 0.90 (Omni, 2007c).
5. The above steps were performed for three separate diversion scenarios to
obtain three sets of attenuation coefficients
a. Water Year 2001, without any simulated diversions (i.e., No Diversion
condition).
b. Water Year 2001, with simulated diversions. This approximates the
condition where water is diverted from only the Pompton River (i.e.,
Diversion condition).
c. Water Year 2002, with simulated diversions. This approximates the
condition where water is diverted from both the Upper Passaic and
Pompton Rivers (i.e., Extreme Diversion condition).
Table 5-2 shows an example of zonal persistence coefficients for the Rockaway
Zone under each diversion condition.
Derivation of trading ratios
The persistence coefficients were then used to develop trading ratios:
Trading ratio seller to buyer =
(Seller’s persistence coefficient)j / (Buyer’s persistence coefficient)j
where j is a shared TMDL critical location
26
The trading ratio is based on the relative persistence of phosphorus discharged
from two point sources toward a shared TMDL critical location. A trading ratio is
necessary to equalize the load exchanged relative to the shared TMDL critical location.
A trading ratio of 0.9 means that 1,000 kg abated by the seller has the same effect at the
shared TMDL critical location as 900 kg abated by the buyer, therefore the seller’s 1,000
kg is worth 900 kg to the buyer. Trading ratios vary depending on the buyer and seller in
question. The same seller might find different trading ratios available depending on who
the buyer is because relative persistence changes with each pair of point source zones.
Given the same buyer/seller pair, a lower trading ratio is more conservative with respect
to water quality protection. On the other hand, reducing the trading ratio will also make
trades less economically desirable.
Identifying the shared TMDL critical location was a key task when deriving
trading ratios for three distinct diversion conditions, as illustrated below.
In the case of the No Diversion condition, Dundee Lake is the only TMDL critical
location affected by dischargers, and all trading ratios were calculated relative to Dundee
Lake.
In the case of the Diversion condition, dischargers in the Upper and Lower
Passaic Management Areas affect Dundee Lake, and trading ratios between point source
zones of these two management areas were calculated relative to Dundee Lake.
Dischargers in the Pompton Management Area affect both the Wanaque South intake and
Dundee Lake, therefore trading ratios between point source zones of this management
area were selected according to which TMDL critical location yielded the lower and

27
more conservative trading ratio. Trading ratios between point source zones in the
Pompton and Upper or Lower Passaic Management Areas were calculated relative to
Dundee Lake.
In the case of the Extreme Diversion condition, dischargers in the Lower Passaic
Management Areas affect Dundee Lake, and trading ratios between point source zones in
this management area were calculated relative to Dundee Lake. Also, trading ratios
between point source zones in the Lower Passaic Management Area and Pompton or
Upper Passaic Management Areas were calculated relative to Dundee Lake. Dischargers
in the Upper Passaic and Pompton Management Areas affect both the Wanaque South
intake and Dundee Lake, therefore trading ratios between point source zones in these
management areas were selected according to which TMDL critical location yielded the
lower and more conservative trading ratio.
Trading ratios for prohibited inter-Management Area trades were set to zero.
Appendix 4 contains examples of the derivation of trading ratios.
Tables 5-3 and 5-4 list the point source zone and allocation for each
discharger.
This process resulted in three possible sets of trading ratios for each buyer/seller
pair. The three sets of trading ratios were then compiled into one matrix by selecting the
minimum trading ratio, or worst case, for each buyer/seller pair. The resulting trading
ratio matrix (Table 5-5) was thus expected to achieve compliance with TMDL water
quality targets under all possible diversion conditions.
However, there are a number concerns about this matrix from an economic point
of view. First, it could lead to overabatement in some areas relative to the least cost
28
solution of meeting the TMDL. Second, the proposed trading ratio matrix is not
symmetric, due to the selection of different diversion scenarios and TMDL critical
locations as the basis for establishing trading ratios. The lack of symmetry results in
multiple trading ratios related to a single trade depending on the path of the trade. In
certain cases, for example, a buyer and seller could achieve one ratio through a direct
trade or a different ratio if they trade indirectly through a third party. This is a concern
from a project implementation perspective because the expansion of trading ratios
beyond a simple symmetric pricing may discourage trading. The possibility of arbitrage,
wherein A sells to B, B sells to C, and C subsequently sells back to A in a manner that A
ends up with more allowances and/or more money than the original allocation, also arises
with asymmetric trading ratios. However, here such an outcome is not possible as the
proposed matrix is based on worst case ratios. Rather, it is more likely that price
asymmetry could result in loss, or “leakage,” of kilograms from the market. As a simple
example, suppose that A sells one kilogram to B and subsequently asks for a kilogram
back in a later trade. While such a sequence of trades might not appear rational, there is
the potential that A “oversells” allowances early in the year and then realizes a shortage
of allowances at the end of the trading period. If asymmetric worst case ratios are
applied, then the amount that B has to sell back in the second trade will be larger than
what B initially purchased from A. Although “leakage” of kilograms from the market
might be desirable for water quality protection, this will reduce the transparency of the
pricing mechanism and may inhibit trading, especially in cases for which the marginal
gains of trade are likely to be small.
29
To address this issue, an alternative trading ratio matrix (Table 5-6) was
developed that was based on the average, rather than the minimum, of the three trading
ratio sets. Economically, the alternative table had the advantage of symmetry, and the
higher trading ratios were more conducive to trading. However, in terms of water quality
protection, the higher ratios in the alternative table were less conservative.
Trading scenario simulations described in the next section demonstrated that the
alternative “average” table did not fully achieve compliance with TMDL water quality
targets. In fact, for reasons described in Section V, a third trading ratio table (Table 5-7)
was developed which reduced the ratios in Table 5-5 by 10%. (Intra-point source zone
trading ratios remained at 1.00). Although the lack of symmetry in Table 5-7 is subject to
the same economic concerns ascribed to the Table 5-5 matrix, its effects on the trading
program are somewhat mitigated by the small number of expected trades (Sado, 2006) in
that trading in the Passaic is much more likely to take the form of a limited number of
bilateral trades rather than a high volume exchange market (Boisvert et al., 2007, 2008).
Also, examination of the Table 5-7 numbers reveals that there are no situations where
trading through a third party could offer a higher and more lucrative trading ratio. Thus
the asymmetry of Table 5-7 does not allow for third party attempts to abuse the system.
Trading with the purveyor
The TMDL (NJDEP, 2008) allows for the possibility of trades between a
discharger and the North Jersey District Water Supply Commission (NJDWSC).
NJDWSC is responsible for the Wanaque Reservoir and Wanaque South intake. Since
NJDWSC is not a New Jersey Pollutant Discharge Elimination System (NJPDES)
permittee (NJDEP, 2008), a regulatory mechanism for trades between NJDWSC and

30
dischargers would need to be developed before any such trades could occur. Scenario
simulations may also need to be executed to verify compliance with TMDL water quality
targets.
Putting aside the present lack of regulatory mechanism and scenario simulations,
consider two trading scenarios where NJDWSC would purchase allowances. The first
scenario would have NJDWSC buying allowances from dischargers upstream of the
Passaic-Pompton confluence and simply retiring these allowances. The second scenario
would have NJDWSC buying allowances from dischargers upstream of the Passaic-
Pompton confluence and reselling these allowances. In the first scenario, NJDWSC
could calculate the benefit of purchasing and retiring allowances by using the persistence
coefficients in Table 5-8. This table lists the persistence coefficients relative to the
Wanaque South intake of each point source zone in the Upper Passaic and Pompton
Management Areas at extreme diversion conditions. The persistence coefficients reflect
the proportion of discharger load that affects the intake. For example, if NJDWSC were
to fund an upgrade for a discharger in the Whippany Zone, 100 kilograms abated by the
discharger has the effect of abating 13 kilograms at the Wanaque South intake at extreme
diversion conditions. In contrast, if a discharger in the Two Bridges Zone abates 100
kilograms, that translates directly into 100 kilograms abated at the Wanaque South intake.
In this type of discharger-purveyor trade, the discharger that receives funding for the
upgrade would still apply the trading formula and then calculate its new balance; in the
formula the allocation remains the same. The load discharged is updated to the level the
discharger achieves following its upgrade, and the “actual load sold” to NJDWSC is
31
deducted from its balance. Further trades between dischargers would continue to follow
the same trading formula and trading ratio matrix (Table 5-7).
In the second scenario where NJDWSC is buying and then reselling allowances,
NJDWSC would pay dischargers upstream of the Passaic-Pompton confluence to upgrade
to a higher treatment level, thereby obtaining the allowances generated from the upgrade.
The NJDWSC could then sell these allowances to other dischargers that want to purchase
allowances. In reselling the allowances, NJDWSC would adopt the trading ratio in Table
5-7 that applies to a direct sale from the discharger that upgraded to the discharger that
purchases. For example, a direct sale from Rockaway Valley SA (in the Rockaway
Zone) to Caldwell Boro STP (in the Upper Passaic Zone 2) has a trading ratio of 0.60. If
Rockaway Valley SA abates 1,000 kg, it is worth 600 kg to Calwell Boro STP.
Therefore, if NJDWSC pays Rockaway Valley SA to abate 1,000 kg at its outfall,
NJDWSC could then sell those allowances to Caldwell Boro (in the Upper Passaic Zone
2) at a trading ratio of 0.60. Both dischargers would then apply the trading formula to
update their balances. TMDL water quality targets at the critical locations are achieved
because the Table 5-7 ratios are applied.
The opposite type of trade, where dischargers pay NJDWSC to directly treat the
surface water diverted at the Wanaque South intake, is viable only if the trades address
the need for dischargers in the Upper Passaic and Pompton Management Areas to treat in
the November through April period. Provided that NJDWSC is adequately treating the
diverted water, Dundee Lake becomes the sole TMDL critical location of concern, and
the possibility of bidirectional trading between all management areas could be explored,
32
as well as seasonal limits for dischargers in the Upper Passaic and Pompton Management
Areas.
To properly compensate NJDWSC a discharger would first apply the trading
formula to determine the magnitude of its negative balance and then multiply that by the
appropriate persistence coefficient in Table 5-8 to determine its equalized load at the
Wanaque South intake. For example, if a discharger in the Rockaway Zone had a
balance of -1,000 kg, application of the 0.10 persistence coefficient equalizes that to 100
kg at the intake, and the discharger would need to compensate NJDWSC for removal of
100 kg at the intake. With respect to Dundee Lake, its balance of -1,000 kg remains
unchanged and needs to be offset using trading ratios in Table 5-7.
Note that the dischargers in the Upper Passaic Management Area and Pompton
Management Area only affect the Wanaque South intake at extreme diversion conditions
and diversion or extreme diversion conditions, respectively. Since trades of this type
would be done directly with NJDWSC, it might be feasible to only charge Upper Passaic
Management Area dischargers in years when an extreme diversion occurs. Similarly,
Pompton Management Area dischargers would only be charged in years when a diversion
or extreme diversion occurs. The practicality of this approach would need to be
determined by the parties involved.
VI. Trading scenarios
Scenario development objectives
A series of trade scenarios were simulated to investigate if the proposed
management area framework and trading ratios would achieve compliance with TMDL
water quality targets and ensure hot spot avoidance at the TMDL critical locations and

33
other areas of concern. Scenarios that would most stress the system and simulate critical
conditions were developed to test the proposed trading program.
There were four scenario development objectives:
1. Verify that trades between dischargers on different tributaries, or with the seller
downstream, achieve compliance with TMDL water quality targets.
2. Investigate if trading ratios greater than one (1) achieve compliance with TMDL water
quality targets. This applies to trades where the seller is downstream.
3. Compare trading ratios based on averages to trading ratios based on minima.
Investigate if the former fully achieves compliance with TMDL water quality targets.
4. Investigate impact of using an allocation based on anticipated discharger flow rather
than actual discharger flow. What happens in a dry year, when the actual discharger flow
is less than anticipated and discharger flow and point sources can discharge more than 0.4
mg/l and still meet their allocation?
Various intra-management area and inter-management area trades were devised to
test objectives 1 and 2. In particular, scenarios 2-13 tested objective 1, and scenarios 2,
3, 7-9 tested objective 2.
To test objectives 3 and 4, four cases were developed.
Case 1: Seller and buyer flows set to average discharger flow from 2004-2006;
minimum trading ratio (Table 5-5) applied.
Case 2: Seller and buyer flows set to average discharger flow from 2004-2006;
average trading ratio (Table 5-6) applied.
Case 3: Seller and buyer flows set to lowest annual discharger flow from 2004-
2006; minimum trading ratio (Table 5-5) applied.

34
Case 4: Seller and buyer flows set to lowest annual discharger flow from 2004-
2006; average trading ratio (Table 5-6) applied.
Note that average trading ratios (Table 5-6) are symmetric and thus more
favorable to market transactions. However minimum trading ratios (Table 5-5) are more
conservative for water quality protection. Also, the 2004-2006 period was used for
calculating average discharger flows and allocations from each discharger because the
2007 data was incomplete at the time of scenario development. Finally, the 29
dischargers outside the model domain were not included in the trading scenario
simulations because they are not eligible to trade.
Cases 3 and 4 are critical because at low effluent flow, the WWTPs can discharge
at higher concentrations than in Cases 1 and 2 and still meet trading allocations.
Diversions
For each scenario, the most vulnerable diversion condition was assessed by
referencing which diversion condition yielded the minimum trading ratio. The scenario
was then simulated at that diversion condition. Scenarios 8-10 had two possible “most
vulnerable diversion conditions;” separate simulations for the two diversion conditions
were run.
Baseline simulations
Six baseline simulations (Table 6-1) were developed for comparison to the
appropriate trading scenario and case. In each baseline, no trading occurs and all plants
discharge 0.4 mg/l of total phosphorus. Each of the baseline simulations reflects one of
the three diversion conditions, and one of the two sets of discharger flows.
35
Scenario development
Tables 6-2 and 6-3 list and describe each scenario.
In general terms:
Scenario 1 was designed to test the safest form of trading, with the seller upstream
on the same tributary.
Scenario 2 was designed to test trading on the same tributary with the seller
downstream.
Scenarios 3 and 4 were designed to test cross-tributary trading with the trading
ratio > 1 and then capped at 1.
Scenarios 5-11 were designed to test a complex variety of cross-tributary and
inter-MA (management area) trades.
Scenario 12-13 were designed to test more straightforward inter-MA trades.
In table 6-2, note that depending on the WWTP flows and trading ratio applied,
the buyer LTA can vary and still satisfy the trade. For example, in table 6-2 see Scenario
1, Case 1. In Case 1, plant flows are set to equal the anticipated actual discharger flows
(i.e., average discharger flows from 2004-2006). The trading ratio is the minimum ratio
from the three diversion conditions (in this case “extreme diversion”), so it is simulated at
that condition. If the buyer discharges an LTA of 0.85 mg/l and the seller discharges at
0.1 mg/l, then the buyer’s balance is offset. However, when scenario 1 is tested at Case 2
conditions, the higher trading ratio allows the buyer to discharge at 0.90 mg/l and still
offset its balance. Thus comparing Case 1 to Case 2, and Case 3 to Case 4 provides a test
of whether a higher trading ratio (and thus higher discharge LTAs) still results in
36
compliance with TMDL water quality targets at average and less than average WWTP
flow conditions.
Scenario results
TMDL critical location: Wanaque South intake
In all trading scenario simulations, the total phosphorus diverted at the Wanaque
South intake was equal to or less than the baseline no-trade scenario (Table 6-4). In
particular, scenarios 5 and 7-12 where the Two Bridges Sewerage Authority (TBSA) was
a seller realized the greatest reductions in total phosphorus diverted. This is due to the
TBSA outfall being located directly upstream of the intake. An upgrade at TBSA beyond
the 0.4 mg/l requirement should have direct benefits to the amount of total phosphorus
load diverted at the Wanaque South intake.
TMDL critical location: Dundee Lake
Initial results
Table 6-5 indicates that some trading scenario simulations yielded summer
average chl-a concentrations that were up to 4% greater than the baseline no-trade
scenario. Although the deviations were generally small (< 0.57 µg/l), the initial results
were not acceptable in demonstrating compliance with TMDL water quality targets at
Dundee Lake. Table 6-5 demonstrates that in Case 4, the average-based trading ratios
from Table 5-6 did not result in compliance in 6 of 13 trade scenarios (e.g., scenarios 2,
5, 8-11). Of greater concern, in Case 3 the minimum-based trading ratios from Table 5-5
did not result in compliance in 2 of 13 trade scenarios (e.g., scenarios 2 and 8).
Analysis of the initial results found that the minimum-based ratios, and to a lesser
extent the average-based ratios, were successful for most but not all cross-tributary and

37
seller downstream trades. In particular, neither set of trading ratios was successful when
buyers were concentrated upstream, as in scenarios 2 and 8.
Calibrated results
Because the minimum-based trading ratios (Table 5-5) did not achieve
compliance with TMDL water quality targets at critical conditions (i.e., Case 3) under
two scenarios, the Table 5-5 trading ratios were reduced by 10% resulting in the Table 5-
7 set of trading ratios. (Intra-point source zone trading ratios were left at 1.00). Scenarios
2 and 8 at critical Case 3 conditions were re-simulated with Table 5-7 trading ratios
(Table 6-6). With the reduced trading ratios, trading scenario simulations yielded
summer average chl-a concentrations in Dundee Lake that were less than or equal to the
baseline no-trade scenario (Table 6-7).
Other scenarios at Case 3 conditions, which had succeeded with Table 5-5 ratios,
were not re-simulated with Table 5-7 ratios. Had they been re-simulated, the result
would have been even more favorable than what is reflected in Cases 1 and 3 in Tables 6-
4 and 6-5.
Other areas of concern
The Omni (2007a) report on TMDL model development referenced three
locations as “areas of concern:” Passaic River near Chatham, Passaic River at Little Falls
intake, and Peckman River mouth. Trading scenario output was analyzed at these
locations in addition to the TMDL critical locations to verify that trades would not result
in upstream hot spots. Figure 6-1 maps the TMDL critical locations and areas of
concern.

38
The results described below are at critical Case 3 conditions, utilizing Table 5-5
trading ratios for all but scenarios 2 and 8. Had Table 5-7 trading ratios been applied to
all Case 3 scenarios, equal or better results would have been obtained.
Passaic River near Chatham: All scenarios showed negligible differences in
summer average dissolved oxygen concentrations (≤ 0.1 mg/l), maximum dissolved
oxygen swing (≤ 0.1 mg/l), and percent dissolved oxygen compliance (≤ 0.1%), as
compared to the baseline no-trade scenario.
Passaic River at Little Falls intake: All scenarios showed negligible differences (≤
0.02 mg/l TP) in annual and summer average TP concentrations, as compared to the
baseline no-trade scenario.
Peckman River mouth: All scenarios showed negligible differences in summer
average dissolved oxygen concentrations (≤ 0.1 mg/l), maximum DO swing (≤ 1.0 mg/l),
and percent dissolved oxygen compliance (≤ 0.4%), as compared to the baseline no-trade
scenario.
Evaluation matrices
Table 6-9 defines the evaluation matrix criteria for each TMDL critical location
and area of concern. Table 6-10 through 6-24 contain the evaluation matrices for each
location with each trading ratio matrix. Only the scenarios that utilized the trading ratios
of Table 5-7 (i.e., the most conservative set of ratios) were able to pass all the criteria at
all locations.
Conclusion
Extensive simulations of a variety of trading scenarios were undertaken to validate the
proposed trading program. In-stream water quality model simulations have verified that

39
the reduced trading ratios in Table 5-7 should achieve compliance with TMDL water
quality targets at the critical locations under high-stress trading conditions (dischargers
emitting less than anticipated flow), heavy cross-tributary trading, critical diversion
conditions, and scenarios where buyers are concentrated either upstream or downstream.
Similar trends were predicted to occur at other areas of concern upstream of the TMDL
critical locations. It is therefore recommended to apply the Table 5-7 trading ratios to
safely execute water quality trading within a management area framework.
VII. Additional topics
Monitoring
Monitoring is important to verify that trades are having the desired effect on water
quality. In addition to Discharge Monitoring Reports (DMRs), which document effluent
levels at the discharger outfalls and are submitted by the discharger, in-stream monitoring
should also be done. The draft Quality Assurance Project Plan (QAPP) in Appendix 6
details the methodology for in-stream monitoring of water quality for the Passaic trading
program.
Finally, the likelihood of enforcement is as important as monitoring to the
effectiveness of any trading program. There will be little incentive to verify the trade
transactions unless there exists a relative certainty of NJDEP enforcement in the case of
violation. The right of NJDEP to enforce against violating dischargers should be clearly
stated in the compliance mechanism that governs trading.
Trading with Municipal Separate Storm Sewer Systems (MS4s) and Nonpoint Sources
The water quality trading program described in this report has been designed for
trading between point sources. In the Non-Tidal Passaic River Basin, point sources are
40
the dominant source of phosphorus loading (NJDEP, 2008), thus the focus on point-point
source trading will be effective in implementing the TMDL.
A feasibility study of trading with MS4s was completed (Passaic Water Quality
Trading Project, 2006c) and found that small dischargers of less than 1 MGD average
flow could benefit if MS4s were required to reduce their load by 40% from current levels.
The adopted TMDL assigns a MS4 load reduction of 60% in most of the drainage area.
Further phosphorus load reduction to sell to other point sources would require accurate
quantification. Moreover, the legal question of how an MS4 can generate allowances to
sell if MS4s are required to remove loads to the “maximum extent feasible (MEF)” is
unresolved at this time.
The Peckman River mouth was described in the Omni (2007a) report on TMDL
model development as a potential area for nonpoint source trading. It was suggested that
increased canopy cover might decrease the large diurnal swings of dissolved oxygen
observed at this area of concern. To define the terms of a point-nonpoint source trade on
the Peckman River, further studies should be done to quantify the benefit that increased
canopy cover would have as compared to decreased phosphorus loading from point
sources on the Peckman River.

41
References Boisvert, R.N, G.L. Poe and Y. Sado, 2007. Selected Economic Aspects of Water Quality
Trading: A Primer and Interpretive Literature Review. Prepared for Passaic Water Quality Trading Project. Available at http://water.rutgers.edu/Projects/trading/Economic%20Aspect_of_Water_Quality_Trading_final_EPA.pdf
Boisvert, R.N, G.L. Poe, Y. Sado, and T. Zhao 2008. “Open Markets” v. “Structured
Bilateral Trades”: Results of Economic Modeling of the Upper Passaic Watershed” Passaic Trading Project Symposium Heldrich Center, New Brunswick July 15, 2008. http://www.water.rutgers.edu/Projects/trading/OpenMarketsStructureBilateralTrading.pdf
Breetz H.L., K. Fisher-Vanden, L. Garzon, H. Jacobs, K. Kroetz, and R. Terry, 2004.
Water Quality Trading and Offset Initiatives in the US: A Comprehensive Survey. Available at http://www.dartmouth.edu/%7Ekfv/waterqualitytradingdatabase.pdf
Najarian Associates, 2005. Development of a TMDL for the Wanaque Reservoir and
Cumulative WLAs/LAs for the Passaic River Watershed. Prepared for NJDEP Division of Watershed Management.
New Jersey Department of Environmental Protection (NJDEP), 2004. Surface Water
Quality Standards N.J.A.C. 7:9B. Trenton, NJ. New Jersey Department of Environmental Protection (NJDEP) 2008. Total Maximum
Daily Load Report for the Non-Tidal Passaic River Basin Addressing Phosphorus Impairments – Adopted. Division of Watershed Management, Trenton, New Jersey.
Omni Environmental Corporation, 2007a. The Non-Tidal Passaic River Basin Nutrient
TMDL Study Phase II Watershed Model and TMDL Calculations: Final Report. Princeton, NJ.
Omni Environmental Corporation, 2007b. “Personal Correspondence”, April 2007. Omni Environmental Corporation, 2007c. Estimation of Planning-Level Phosphorus
Attenuation Coefficients for the Non-Tidal Passaic River Basin. Prepared for Passaic Water Quality Trading Project.
Omni Environmental Corporation, 2007d. Evaluation of Phosphorus Trading Scenarios
for the Non-Tidal Passaic River Basin Nutrient TMDL. Prepared for Passaic Water Quality Trading Project.
Passaic Water Quality Trading Project, 2006a. Case Studies. Available at
http://water.rutgers.edu/Projects/trading/CaseStudies.htm

42
Passaic Water Quality Trading Project, 2006b. Review of Total Phosphorus Total
Maximum Daily Loads Implemented by Water Quality Trading Projects. Available at http://water.rutgers.edu/Projects/trading/LitRev3.pdf
Passaic Water Quality Trading Project, 2006c. Feasibility Analysis of MS4-WWTP
Trading Opportunities. Available at http://water.rutgers.edu/Projects/trading/LitRev2.pdf
Sado, Y., 2006. Potential Cost Savings from Discharge Permit Trading to Meet TMDLs
for Phosphorus on the Passaic River Watershed. Unpublished M.S. Thesis, Department of Applied Economics and Management, Cornell University.
United States Environmental Protection Agency (USEPA), 2003. Final Water Quality
Trading Policy. Available at: http://www.epa.gov/owow/watershed/trading/finalpolicy2003.html.
United States Environmental Protection Agency (USEPA), 2004. Water Quality Trading
Assessment Handbook: Can Water Quality Trading Advance Your Watershed’s Goals? (EPA-841-B-04-001). Office of Water: Washington, D.C.
United States Geological Survey (USGS), 2007. Simulation of Surface-Water Conditions
in the Non-Tidal Passaic River Basin, New Jersey. Scientific Investigations Report prepared in cooperation with NJDEP and NJEC.
Wool, A.T., R.B. Ambrose, J.L. Martin, E.A. Corner, 2003. Water Quality Analysis
Simulation Program (WASP), Version 6: Draft Users Manual. Available at: http://www.epa.gov/athens/wwqtsc/html/wasp.html.

TABLES
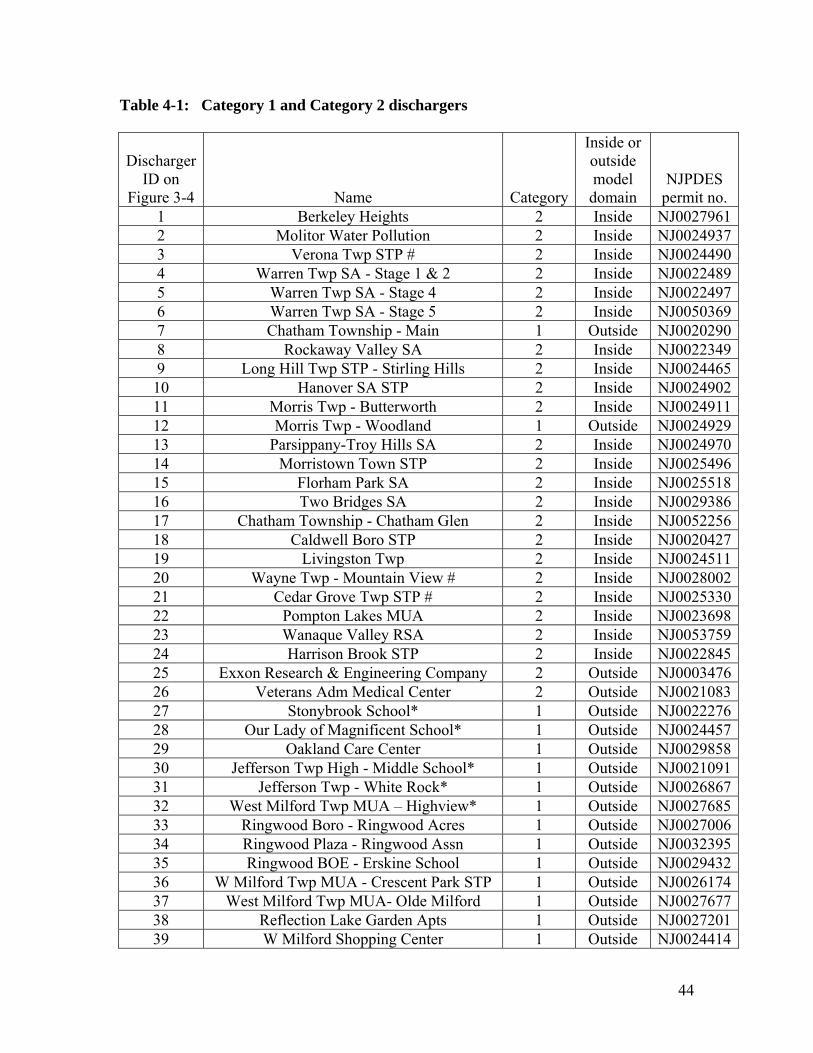
44
Table 4-1: Category 1 and Category 2 dischargers
Discharger ID on
Figure 3-4 Name Category
Inside or outside model domain
NJPDES permit no.
1 Berkeley Heights 2 Inside NJ00279612 Molitor Water Pollution 2 Inside NJ00249373 Verona Twp STP # 2 Inside NJ00244904 Warren Twp SA - Stage 1 & 2 2 Inside NJ00224895 Warren Twp SA - Stage 4 2 Inside NJ00224976 Warren Twp SA - Stage 5 2 Inside NJ00503697 Chatham Township - Main 1 Outside NJ00202908 Rockaway Valley SA 2 Inside NJ00223499 Long Hill Twp STP - Stirling Hills 2 Inside NJ002446510 Hanover SA STP 2 Inside NJ002490211 Morris Twp - Butterworth 2 Inside NJ002491112 Morris Twp - Woodland 1 Outside NJ002492913 Parsippany-Troy Hills SA 2 Inside NJ002497014 Morristown Town STP 2 Inside NJ002549615 Florham Park SA 2 Inside NJ002551816 Two Bridges SA 2 Inside NJ002938617 Chatham Township - Chatham Glen 2 Inside NJ005225618 Caldwell Boro STP 2 Inside NJ002042719 Livingston Twp 2 Inside NJ002451120 Wayne Twp - Mountain View # 2 Inside NJ002800221 Cedar Grove Twp STP # 2 Inside NJ002533022 Pompton Lakes MUA 2 Inside NJ002369823 Wanaque Valley RSA 2 Inside NJ005375924 Harrison Brook STP 2 Inside NJ002284525 Exxon Research & Engineering Company 2 Outside NJ000347626 Veterans Adm Medical Center 2 Outside NJ002108327 Stonybrook School* 1 Outside NJ002227628 Our Lady of Magnificent School* 1 Outside NJ002445729 Oakland Care Center 1 Outside NJ002985830 Jefferson Twp High - Middle School* 1 Outside NJ002109131 Jefferson Twp - White Rock* 1 Outside NJ002686732 West Milford Twp MUA – Highview* 1 Outside NJ002768533 Ringwood Boro - Ringwood Acres 1 Outside NJ002700634 Ringwood Plaza - Ringwood Assn 1 Outside NJ003239535 Ringwood BOE - Erskine School 1 Outside NJ002943236 W Milford Twp MUA - Crescent Park STP 1 Outside NJ002617437 West Milford Twp MUA- Olde Milford 1 Outside NJ002767738 Reflection Lake Garden Apts 1 Outside NJ002720139 W Milford Shopping Center 1 Outside NJ0024414
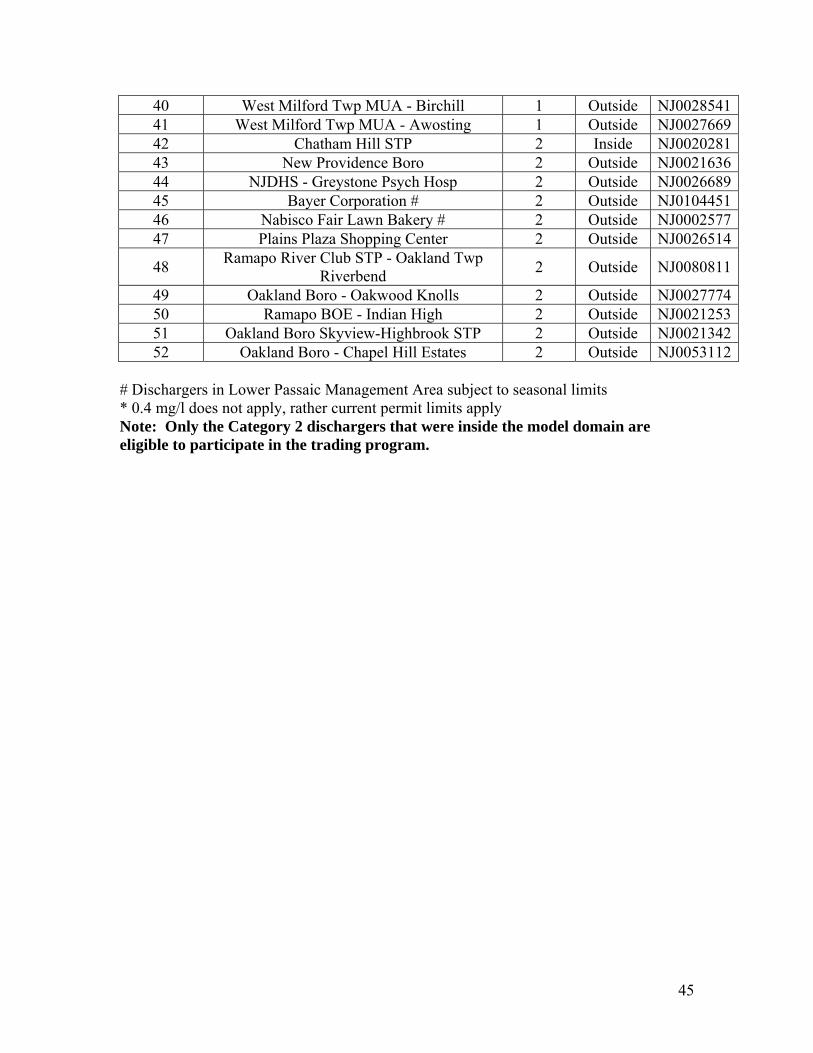
45
40 West Milford Twp MUA - Birchill 1 Outside NJ002854141 West Milford Twp MUA - Awosting 1 Outside NJ002766942 Chatham Hill STP 2 Inside NJ002028143 New Providence Boro 2 Outside NJ002163644 NJDHS - Greystone Psych Hosp 2 Outside NJ002668945 Bayer Corporation # 2 Outside NJ010445146 Nabisco Fair Lawn Bakery # 2 Outside NJ000257747 Plains Plaza Shopping Center 2 Outside NJ0026514
48 Ramapo River Club STP - Oakland Twp
Riverbend 2 Outside NJ0080811
49 Oakland Boro - Oakwood Knolls 2 Outside NJ002777450 Ramapo BOE - Indian High 2 Outside NJ002125351 Oakland Boro Skyview-Highbrook STP 2 Outside NJ002134252 Oakland Boro - Chapel Hill Estates 2 Outside NJ0053112
# Dischargers in Lower Passaic Management Area subject to seasonal limits * 0.4 mg/l does not apply, rather current permit limits apply Note: Only the Category 2 dischargers that were inside the model domain are eligible to participate in the trading program.

46
Table 5-1: Point source zones developed for Omni attenuation analysis (Omni, 2007c)
Point Source Zone Discharger
Dead River Zone Harrison Brook STP
Warren Twp SA - Stage 5 Warren Twp SA - Stage 4
Upper Passaic Zone 1
Long Hill Twp STP - Stirling Hills Warren Twp SA - Stage 1 & 2
Berkeley Heights Chatham Hill STP
Chatham Township - Chatham Glen
Upper Passaic Zone 2
Florham Park SA Livingston Twp
Caldwell Boro STP Molitor Water Pollution
Rockaway Zone Rockaway Valley SA
Whippany Zone Morris Twp - Butterworth
Morristown Town STP Hanover SA STP
Troy Hill Zone Parsippany-Troy Hills SA
Pompton Headwater Zone Wanaque Valley RSA Pompton Lakes MUA
Two Bridges Zone Two Bridges SA Singac Zone Wayne Twp - Mountain View
Peckman Zone Verona Twp STP
Cedar Grove Twp STP

47
Table 5-2: Rockaway Zone annual zonal persistence coefficients (ZPCs), adapted from Omni (2007c)
Station Miles from point
source zone outlet
ZPC, No Diversion
ZPC, Diversion
ZPC, Extreme Diversion
Rockaway just upstream of
confluence with Whippany
6.2 0.85 0.85 0.78
Passaic just upstream of
confluence with Pompton
20.5 0.67 0.67 0.54
Passaic at Little Falls
24.0 0.64 0.58 0.39
Passaic at Great Falls
28.4 0.64 0.56 0.30
Passaic at Dundee Dam
36.2 0.63 0.56 0.29
Wanaque South intake
20.7 ____ ____ 0.10

48
Table 5-3: Point source zones and allocations for trading, listed in order of Discharger ID (2005-2007 avg. flow based on NJDEP OPRA DMR database, accessed August 5, 2008)
Discharger ID on Figure
3-4 Name Category Point Source Zone
Allocation (kg/yr)
2005-2007 avg. flow (MGD)
Permitted flow
(MGD)
NJPDES permit no.
1 Berkeley Heights 2 Upper Passaic 1 872.3 1.5784 3.1 NJ0027961 2 Molitor Water Pollution 2 Upper Passaic 2 1,378.7 2.4946 3.5 NJ0024937 3 Verona Twp STP # 2 Lower Passaic 2 655.0 2.3703 3 NJ0024490
4 Warren Twp SA - Stage 1
& 2 2 Upper Passaic 1 207.7 0.3758 0.47 NJ0022489
5 Warren Twp SA - Stage 4 2 Dead 163.2 0.2953 0.8 NJ0022497 6 Warren Twp SA - Stage 5 2 Dead 93.1 0.1685 0.38 NJ0050369 8 Rockaway Valley SA 2 Rockaway 5,808.1 10.5092 12 NJ0022349
9 Long Hill Twp STP -
Stirling Hills ^ 2 Upper Passaic 1 497.4 1.0526 0.9 NJ0024465
10 Hanover SA STP 2 Whippany 1,144.2 2.0703 4.61 NJ0024902
11 Morris Twp – Butterworth
2 Whippany 1,109.4 2.0073 3.3 NJ0024911
13 Parsippany-Troy Hills SA 2 Whippany 6,946.3 12.5686 16 NJ0024970 14 Morristown Town STP 2 Whippany 1,426.5 2.5811 6.3 NJ0025496 15 Florham Park SA 2 Upper Passaic 2 500.2 0.9051 1.4 NJ0025518 16 Two Bridges SA 2 Two Bridges 3,207.5 5.8037 10 NJ0029386
17 Chatham Township -
Chatham Glen 2 Upper Passaic 1 66.4 0.1202 0.155 NJ0052256
18 Caldwell Boro STP 2 Upper Passaic 2 2,166.2 3.9194 4.5 NJ0020427 19 Livingston Twp 2 Upper Passaic 2 1,219.1 2.2058 4.6 NJ0024511
20 Wayne Twp - Mountain
View # 2 Lower Passaic 1 2,271.6 8.2203 13.5 NJ0028002
21 Cedar Grove Twp STP # 2 Lower Passaic 2 413.0 1.4947 2 NJ0025330

49
22 Pompton Lakes MUA 2 Pompton
Headwater 499.2 0.9032 1.2 NJ0023698
23 Wanaque Valley RSA 2 Pompton
Headwater 584.4 1.0574 1.25 NJ0053759
24 Harrison Brook STP 2 Dead 947.2 1.7138 2.5 NJ0022845 42 Chatham Hill STP ^ 2 Upper Passaic 1 4.3 0.0077 0.03 NJ0020281 # Lower Passaic Management Area subject to seasonal limits; summer allocation shown * 0.4 mg/l does not apply, rather current permit limits apply ^ Permitted flow < actual flow; used permitted flow for allocation
Note: Only the Category 2 dischargers that were inside the model domain are eligible to participate in the trading program.

50
Table 5-4: Point source zones and allocations for trading, listed in order of point source zone and allocation size (2005-2007 avg. flow based on NJDEP OPRA DMR database, accessed August 5, 2008)
Discharger ID on Figure
3-4 Name Point Source Zone
Allocation (kg/yr)
2005-2007 avg. flow (MGD)
Permitted flow
(MGD)
NJPDES permit no.
24 Harrison Brook STP Dead River
947.2 1.7138 2.5 NJ0022845 5 Warren Twp SA - Stage 4 163.2 0.2953 0.8 NJ0022497 6 Warren Twp SA - Stage 5 93.1 0.1685 0.38 NJ0050369
20 Wayne Twp - Mountain
View # Lower Passaic 1 2,271.6 8.2203 13.5 NJ0028002
3 Verona Twp STP # Lower Passaic 2
655.0 2.3703 3 NJ0024490 21 Cedar Grove Twp STP # 413.0 1.4947 2 NJ0025330 23 Wanaque Valley RSA
Pompton Headwater 584.4 1.0574 1.25 NJ0053759
22 Pompton Lakes MUA 499.2 0.9032 1.2 NJ0023698 8 Rockaway Valley SA Rockaway 5,808.1 10.5092 12 NJ0022349 16 Two Bridges SA Two Bridges 3,207.5 5.8037 10 NJ0029386 1 Berkeley Heights
Upper Passaic 1
872.3 1.5784 3.1 NJ0027961
9 Long Hill Twp STP -
Stirling Hills ^ 497.4 1.0526 0.9 NJ0024465
4 Warren Twp SA - Stage 1
& 2 207.7 0.3758 0.47 NJ0022489
17 Chatham Township -
Chatham Glen 66.4 0.1202 0.155 NJ0052256
42 Chatham Hill STP 4.3 0.0077 0.03 NJ0020281 18 Caldwell Boro STP
Upper Passaic 2
2,166.2 3.9194 4.5 NJ0020427 2 Molitor Water Pollution 1,378.7 2.4946 3.5 NJ0024937 19 Livingston Twp 1,219.1 2.2058 4.6 NJ0024511 15 Florham Park SA 500.2 0.9051 1.4 NJ0025518 13 Parsippany-Troy Hills SA 6,946.3 12.5686 16 NJ0024970
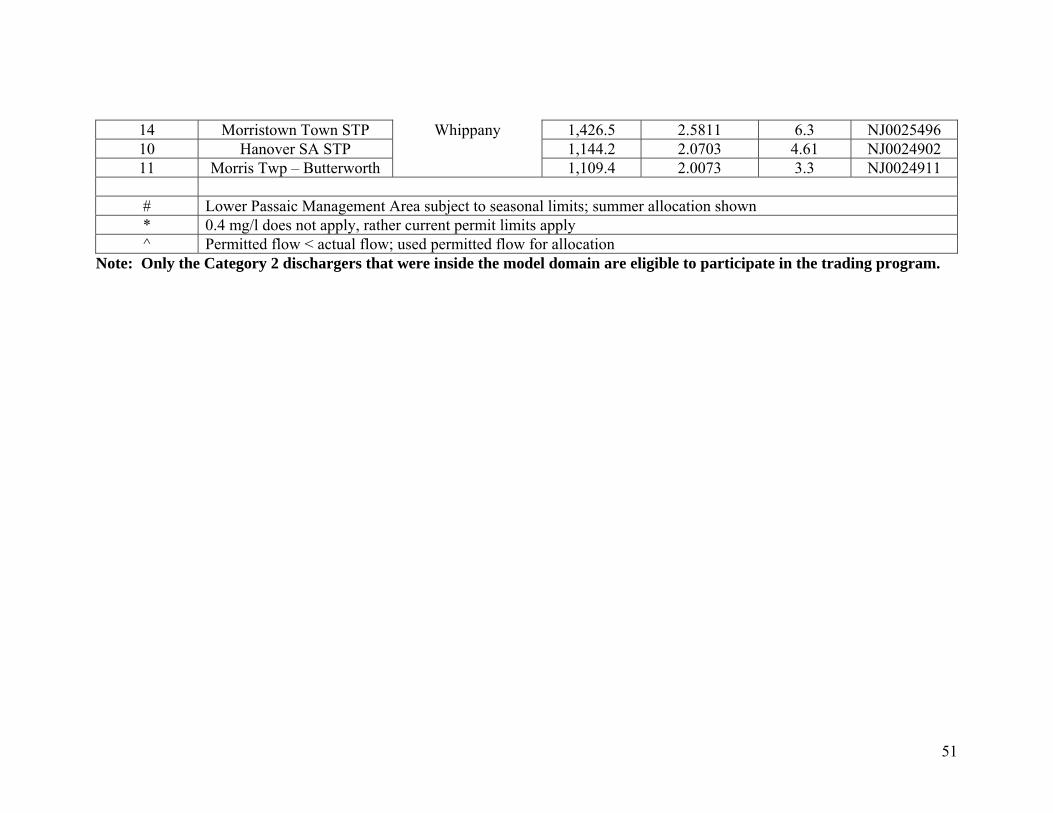
51
14 Morristown Town STP Whippany
1,426.5 2.5811 6.3 NJ0025496 10 Hanover SA STP 1,144.2 2.0703 4.61 NJ0024902 11 Morris Twp – Butterworth 1,109.4 2.0073 3.3 NJ0024911 # Lower Passaic Management Area subject to seasonal limits; summer allocation shown * 0.4 mg/l does not apply, rather current permit limits apply ^ Permitted flow < actual flow; used permitted flow for allocation
Note: Only the Category 2 dischargers that were inside the model domain are eligible to participate in the trading program.

52
Table 5-5: Initial trading ratio matrix A, based on minima of three diversion scenarios (sellers in rows, buyers in columns)
Upper Passaic Management Area
Pompton Management Area
Lower Passaic Management
Area
Buyer Seller
Dead River Zone
Upper Passaic Zone 1
Upper Passaic Zone 2
Whippany zone
Rockaway Zone
Pompton Headwater Zone
Two Bridges Zone
Lower Passaic Zone 1
Lower Passaic Zone 2
Upper Passaic Management Area
Dead River Zone
1.00 0.95 0.87 0.97 1.11 0.00 0.00 0.60 0.44
Upper Passaic Zone 1
1.00 1.00 0.87 1.00 1.14 0.00 0.00 0.63 0.46
Upper Passaic Zone 2
1.03 1.00 1.00 1.06 1.21 0.00 0.00 0.68 0.50
Whippany zone
0.91 0.89 0.86 1.00 1.14 0.00 0.00 0.58 0.43
Rockaway Zone
0.72 0.70 0.67 0.77 1.00 0.00 0.00 0.47 0.35
Pompton Management Area
Pompton Headwater Zone
0.54 0.51 0.48 0.56 0.69 1.00 0.80 0.32 0.24
Two Bridges Zone
0.68 0.64 0.60 0.69 0.84 0.92 1.00 0.40 0.30
Lower Passaic Management Area
Lower Passaic Zone 1
0.00 0.00 0.00 0.00 0.00 0.00 0.00 1.00 0.74
Lower Passaic Zone 2
0.00 0.00 0.00 0.00 0.00 0.00 0.00 0.97 1.00

53
Table 5-6: Initial trading ratio matrix B, based on averages of three diversion scenarios (sellers in rows, buyers in columns)
Upper Passaic Management Area
Pompton Management
Area Lower Passaic
Management Area
BuyerSeller
Dead River Zone
Upper Passaic Zone 1
Upper Passaic Zone 2
Whippany zone
Rockaway Zone
Pompton Headwater
Zone
Two Bridges
Zone
Lower Passaic Zone 1
Lower Passaic Zone 2
Upper Passaic Management Area
Dead River Zone
1.00 0.98 0.92 1.01 1.25 0.00 0.00 0.66 0.48
Upper Passaic Zone 1
1.02 1.00 0.96 1.03 1.28 0.00 0.00 0.69 0.51
Upper Passaic Zone 2
1.09 1.05 1.00 1.10 1.35 0.00 0.00 0.75 0.55
Whippany zone
0.99 0.97 0.91 1.00 1.18 0.00 0.00 0.64 0.47
Rockaway Zone
0.80 0.78 0.74 0.85 1.00 0.00 0.00 0.51 0.38
Pompton Management Area
Pompton Headwater
Zone 0.59 0.56 0.52 0.61 0.76 1.00 0.98 0.35 0.26
Two Bridges
Zone 0.74 0.71 0.65 0.76 0.92 1.02 1.00 0.44 0.33
Lower Passaic Management Area
Lower Passaic Zone 1
0.00 0.00 0.00 0.00 0.00 0.00 0.00 1.00 0.88
Lower Passaic Zone 2
0.00 0.00 0.00 0.00 0.00 0.00 0.00 1.14 1.00

54
Table 5-7: FINAL trading ratio matrix, based on 90% of inter-point source zone ratios in Table 5-5 (sellers in rows, buyers in columns)
Upper Passaic Management Area Pompton
Management Area
Lower Passaic Management
Area
Buyer Seller
Dead River Zone
Upper Passaic Zone 1
Upper Passaic Zone 2
Whippany zone
Rockaway Zone
Pompton Headwater Zone
Two Bridges Zone
Lower Passaic Zone 1
Lower Passaic Zone 2
Upper Passaic Management Area
Dead River Zone
1.00 0.85 0.78 0.87 1.00 0.00 0.00 0.54 0.40
Upper Passaic Zone 1
0.90 1.00 0.78 0.90 1.03 0.00 0.00 0.57 0.42
Upper Passaic Zone 2
0.92 0.90 1.00 0.96 1.09 0.00 0.00 0.61 0.45
Whippany zone
0.82 0.80 0.77 1.00 1.03 0.00 0.00 0.52 0.39
Rockaway Zone
0.65 0.63 0.60 0.69 1.00 0.00 0.00 0.42 0.31
Pompton Management Area
Pompton Headwater Zone
0.49 0.46 0.43 0.50 0.62 1.00 0.72 0.29 0.21
Two Bridges Zone
0.61 0.58 0.54 0.63 0.76 0.83 1.00 0.36 0.27
Lower Passaic Management Area
Lower Passaic Zone 1
0.00 0.00 0.00 0.00 0.00 0.00 0.00 1.00 0.66
Lower Passaic Zone 2
0.00 0.00 0.00 0.00 0.00 0.00 0.00 0.87 1.00

55
Table 5-8: Persistence coefficients at Wanaque South intake, at extreme diversion conditions; adapted from Omni (2007c)
Point source zone Persistence coefficient at Wanaque South intake
Dead River Zone 0.13 Upper Passaic Zone 1 0.13 Upper Passaic Zone 2 0.15
Whippany zone 0.13 Rockaway Zone 0.10
Pompton Headwater Zone 0.95 Two Bridges Zone 1.00
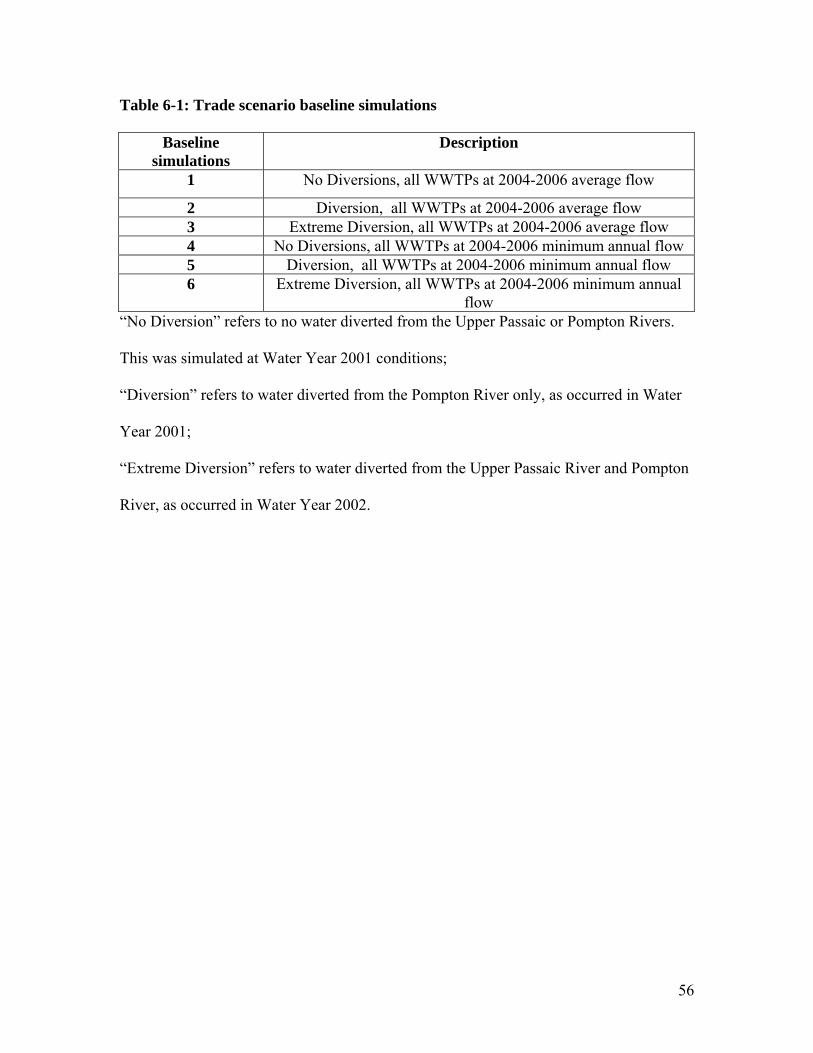
56
Table 6-1: Trade scenario baseline simulations
Baseline simulations
Description
1 No Diversions, all WWTPs at 2004-2006 average flow
2 Diversion, all WWTPs at 2004-2006 average flow 3 Extreme Diversion, all WWTPs at 2004-2006 average flow 4 No Diversions, all WWTPs at 2004-2006 minimum annual flow 5 Diversion, all WWTPs at 2004-2006 minimum annual flow 6 Extreme Diversion, all WWTPs at 2004-2006 minimum annual
flow “No Diversion” refers to no water diverted from the Upper Passaic or Pompton Rivers.
This was simulated at Water Year 2001 conditions;
“Diversion” refers to water diverted from the Pompton River only, as occurred in Water
Year 2001;
“Extreme Diversion” refers to water diverted from the Upper Passaic River and Pompton
River, as occurred in Water Year 2002.

57
Table 6-2: Trading scenarios and cases
Scenario
Seller Buyer
Case 1, 2 seller flow
(MGD)
Case 3, 4 seller flow
(MGD)
Case 1, 2 buyer flow
(MGD)
Case 3, 4 buyer flow
(MGD)
Case 1, 3
trading ratio
Case 2, 4
trading ratio
All Cases: Seller LTA
(mg/l)
Case 1:
Buyer LTA
(mg/l)
Case 2:
Buyer LTA
(mg/l)
Case 3:
Buyer LTA
(mg/l)
Case 4:
Buyer LTA
(mg/l)
1 Berkeley
Hts Florham
Park 1.61 1.61 0.9 0.86 0.87 0.96 0.100 0.850 0.900 0.890 0.940
2 Caldwell
Bernards (Harrison
Brook) 4.06 3.99 1.8 1.78
1.03 1.09 0.100 1.000 1.000 1.000 1.000
Warren V 0.16 0.15 1.450 1.900 1.700 2.200
3 Parsippany-Troy Hills Rockaway
12.61 12.48 10.31 10.06
1.13 1.17 0.100 0.955 0.987 0.980 1.015
Caldwell 4.06 3.99 1.21 1.35
4 Parsippany-Troy Hills Rockaway
12.61 12.48 10.31 10.06 1.00 0.100 0.885 0.910
Caldwell 4.06 3.99
5
Parsippany-Troy Hills
Verona 12.61 12.48
2.54 2.41 0.43 0.47 0.100
1.000 1.000 1.000 1.000
Cedar Grove
1.4 1.23 1.050 1.250 1.350 1.600
Rockaway 10.31 10.06
0.35 0.38
0.100 Bernards (Harrison
Brook) 1.8 1.78
0.72 0.80 1.000 1.000 1.000 1.000
Two Bridges
5.82 5.57 0.68 0.74
0.100 Warren V 0.16 0.15 0.68 0.74 1.000 1.000 1.000 1.000

58
Warren IV 0.34 0.28 0.68 0.74 1.000 1.000 1.000 1.000 Warren I-II 0.38 0.37 0.64 0.71 1.000 1.250 1.000 1.000
Chatham Glen
0.12 0.12 0.64 0.71 1.130 1.130 1.300 1.650
6 Wayne
(Mountain View)
Verona 8.3 8.18
2.54 2.41 0.74 0.88 0.100
0.870 0.950 0.950 1.000
Cedar Grove
1.4 1.23 0.74 0.88 0.860 0.970 0.920 1.110
7
Parsippany-Troy Hills Cedar
Grove 12.61 12.48
1.4 1.23 0.43 0.47
0.100 2.250 2.440 2.580 2.800
Rockaway 10.31 10.06 0.35 0.38
Warren V 0.16 0.15 0.72 0.80 0.100 1.700 1.700 1.700 1.700
Two Bridges
Florham Park
5.82 5.57 0.9 0.86 0.60 0.65 0.100 1.555 1.670 1.645 1.770
Berkeley Heights
Warren IV 1.61 1.61
0.34 0.28 1.00 1.02
0.100 2.280 2.360 2.780 2.870 Pompton
Lakes 0.96 0.89 0.54 0.59
Morristown Morris-
Butterworth
2.72 2.15 2.1 2.02
1.00 1.00 0.100 0.870 0.880 0.935 0.945
Wanaque RSA
1.04 0.96 0.56 0.61
8
Parsippany-Troy Hills
Bernards (Harrison
Brook)
12.61 12.48 1.8 1.78
0.90 0.98 0.100 3.130 3.450 3.200 3.525
Rockaway 10.31 10.06 0.72 0.80
0.100 Warren V 0.16 0.15 0.72 0.80 1.850 1.850 1.850 1.850 Warren I-II 0.38 0.37 0.70 0.78 1.620 1.620 1.620 1.620

59
Two Bridges
Morris- Butterworth
5.82 5.57 2.1 2.02 0.69 0.76 0.100 0.980 1.035 1.025 1.085
Berkeley Heights
Warren IV 1.61 1.61 0.34 0.28 1.00 1.02 0.100 1.820 1.840 2.200 2.250
Morristown Florham
Park
2.72 2.15 0.9 0.86
0.86 0.91 0.100 1.340 1.410 1.470 1.540
Wanaque RSA
1.04 0.96 0.48 0.52 0.100
Pompton Lakes
Chatham Glen
0.96 0.89 0.12 0.12 0.51 0.56 0.100 1.630 1.760 1.660 1.780
9
Parsippany-Troy Hills
Cedar Grove
12.61 12.48
1.4 1.23 0.43 0.47 0.100 1.000 1.105 1.160 1.282
Bernards (Harrison
Brook) 1.8 1.78 0.90 0.98 0.100 1.000 1.000 1.000 1.000
Florham Park
0.9 0.86 0.86 0.90 0.100 0.990 0.990 1.000 1.000
Rockaway
Hanover
10.31 10.06
2.14 2.1 0.77 0.85
0.100
1.000 1.000 1.000 1.000 Long Hill 1.07 1.03 0.70 0.78 1.015 1.015 1.015 1.015
Molitor (Madison-Chatham)
2.5 2.48
0.67 0.74
1.000 1.135 1.052 1.190 Two Bridges
5.82 5.57 0.60 0.65 0.100
Pompton Lakes
0.96 0.89 0.48 0.52 0.100
Morristown Morris-
Butterworth
2.72 2.15 2.1 2.02
1.00 1.00 0.100 0.870 0.880 0.937 0.945
Wanaque RSA
1.04 0.96 0.56 0.61 0.100
Berkeley Heights
Warren IV 1.61 1.61 0.34 0.28 1.00 1.02 0.100 1.000 1.000 1.000 1.000

60
Warren I-II 0.38 0.37 1.00 1.00 0.940 0.950 1.130 1.140
Chatham Glen
0.12 0.12 1.00 1.00 1.000 1.000 1.000 1.000
10
Parsippany-Troy Hills
Cedar Grove
12.61 12.48
1.4 1.23 0.43 0.47
0.100
0.900 0.990 1.065 1.170
Bernards (Harrison
Brook) 1.8 1.78 0.90 0.98 1.000 1.000 1.000 1.000
Morris-Butterworth
2.1 2.02 0.98 1.00 0.840 0.840 0.840 0.840
Rockaway Livingston
10.31 10.06 2.61 2.34 0.67 0.74
0.100 1.000 1.000 1.000 1.000
Caldwell 4.06 3.99
0.67 0.74
1.000 1.110 1.117 1.230 Morristown 2.72 2.15 0.86 0.91 0.100
Berkeley Hts
1.61 1.61 0.87 0.96 0.100
Two Bridges
5.82 5.57 0.60 0.65
0.100
Florham Park
0.9 0.86
0.60 0.65
0.960 0.960 0.960 0.960 Wanaque
RSA 1.04 0.96 0.48 0.52 0.100
Pompton Lakes
0.96 0.89 0.48 0.52 0.100
11
Parsippany-Troy Hills
Wayne (Mountain
View)
12.61 12.48
8.3 8.18
0.58 0.64 0.100
0.950 1.000 0.970 1.035 Rockaway 10.31 10.06 0.47 0.51 0.100 Two
Bridges 5.82 5.57 0.40 0.44 0.100
Morristown 2.72 2.15 0.58 0.64
0.100 Florham Park
0.9 0.86 0.86 0.91 1.400 1.575 1.495 1.495

61
Berkeley Hts
1.61 1.61 0.87 0.96 0.100
Wanaque RSA
1.04 0.96 0.48 0.52
0.100
Chatham Glen
0.12 0.12 0.51 0.56
2.030 2.030 2.030 2.030 Pompton
Lakes 0.96 0.89 0.51 0.56 0.100
12 Two
Bridges Florham
Park 5.82 5.57 0.9 0.86 0.60 0.65 0.100 1.555 1.670 1.645 1.770
13 Parsippany-Troy Hills
Verona 12.61 12.48 2.54 2.41 0.43 0.47 0.100 1.038 1.100 1.097 1.165

62
Table 6-3: Description of trading scenarios for water quality simulation
Scenario Description Diversion condition 1 Basic case with seller upstream on the same
tributary Extreme diversion
2 Seller is downstream on the same tributary No diversion 3 Cross tributary trade with trading ratio > 1,
within Upper Passaic MA Diversion
4 Same as scenario 3, but with ratio capped at 1.0
Diversion
5 Sellers are “Big Three” (Two Bridges, Rockaway, Par-Troy); inter-MA trades to Lower Passaic 2, Dead, and Upper Passaic 1 zones
Extreme diversion
6 Cross tributary trade within Lower Passaic MA
Extreme diversion
7 Complex scenario; Sellers are Big Three + 4 WWTPs currently below 0.7; several cross trib and inter-MA trades to Lower Passaic 2, Dead, Upper Passaic 2, and Whippany zones
Extreme diversion
8 Complex scenario; Sellers are Big Three + 4 WWTPs currently below 0.7; several cross trib and inter-MA trades to Dead, Upper Passic 1, Upper Passaic 2, and Whippany zones. Buyers concentrated upstream.
Extreme diversion, No Diversion
9 Complex scenario; Sellers are Big Three + 4 WWTPs currently below 0.7; several cross trib and inter-MA trades to Lower Passaic 2, Dead, Upper Passaic 1, Upper Passaic 2, and Whippany zones
Extreme diversion, No Diversion
10 Similar to scenario 9 but more buying on Upper Passaic 2 than Whippany zones
Extreme diversion, No Diversion
11 Complex scenario; Sellers are Big Three + 4 WWTPs currently below 0.7; several cross trib and inter-MA trades to Lower Passaic 1, Upper Passic 1, and Upper Passaic 2 zones.
Extreme diversion
12 Inter-MA trade from Two Bridges to Upper Passaic 2 zone
Extreme diversion
13 Inter-MA trade from Par-Troy to Lower Passaic 2 zone
Extreme diversion

63
Table 6-4: Ratio of trade scenario to baseline for TP load diverted at Wanaque South intake (adapted from Omni, 2007d); applied trading ratios based on Table 5-5 and Table 5-6
2001a 2002b
Scenario Case 1 Case 2 Case 3 Case 4 Case 1 Case 2 Case 3 Case 4 1 - - - - 1.00 1.00 1.00 1.00 2 - - - - - - - - 3 1.00 1.00 1.00 1.00 - - - - 4 1.00 - 1.00 - - - - - 5 - - - - 0.76 0.76 0.77 0.77 6 - - - - 1.00 1.00 1.00 1.00 7 - - - - 0.72 0.72 0.73 0.73 8 - - - - 0.78 0.79 0.79 0.80 9 - - - - 0.76 0.76 0.77 0.78 10 - - - - 0.76 0.77 0.78 0.78 11 - - - - 0.71 0.71 0.71 0.71 12 - - - - 0.82 0.82 0.83 0.83 13 - - - - 0.96 0.96 0.96 0.96
Ratio ≤ 1.00 indicates that the trade simulation had equal or better water quality than the no-trade baseline simulation. Cases 1 and 3 applied trading ratios from Table 5-5. Cases 2 and 4 applied trading ratios from Table 5-6. a. Water Year 2001 results are at Diversion condition. b. Water Year 2002 results are at Extreme Diversion Condition.
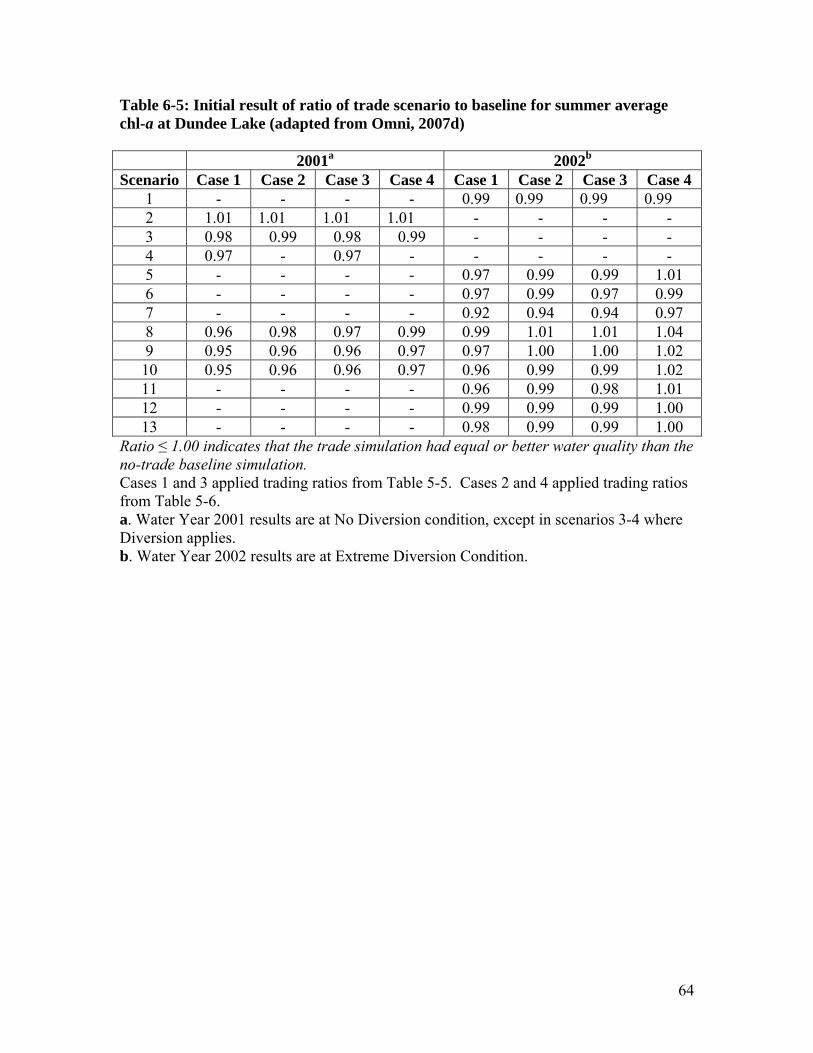
64
Table 6-5: Initial result of ratio of trade scenario to baseline for summer average chl-a at Dundee Lake (adapted from Omni, 2007d)
2001a 2002b
Scenario Case 1 Case 2 Case 3 Case 4 Case 1 Case 2 Case 3 Case 4 1 - - - - 0.99 0.99 0.99 0.99 2 1.01 1.01 1.01 1.01 - - - - 3 0.98 0.99 0.98 0.99 - - - - 4 0.97 - 0.97 - - - - - 5 - - - - 0.97 0.99 0.99 1.01 6 - - - - 0.97 0.99 0.97 0.99 7 - - - - 0.92 0.94 0.94 0.97 8 0.96 0.98 0.97 0.99 0.99 1.01 1.01 1.04 9 0.95 0.96 0.96 0.97 0.97 1.00 1.00 1.02 10 0.95 0.96 0.96 0.97 0.96 0.99 0.99 1.02 11 - - - - 0.96 0.99 0.98 1.01 12 - - - - 0.99 0.99 0.99 1.00 13 - - - - 0.98 0.99 0.99 1.00
Ratio ≤ 1.00 indicates that the trade simulation had equal or better water quality than the no-trade baseline simulation. Cases 1 and 3 applied trading ratios from Table 5-5. Cases 2 and 4 applied trading ratios from Table 5-6. a. Water Year 2001 results are at No Diversion condition, except in scenarios 3-4 where Diversion applies. b. Water Year 2002 results are at Extreme Diversion Condition.

65
Table 6-6: Trading scenarios 2 and 8 re-simulated with Table 5-7 trading ratios
Scenario Seller Buyer
Case 3 seller flow
(MGD)
Case 3 buyer flow
(MGD)
Case 3 trading
ratio
All Cases: Seller LTA
(mg/l)
Case 3:
Buyer LTA
(mg/l)
2 Caldwell
Bernards (Harrison
Brook) 3.99
1.78 0.92
0.100
0.985
Warren V 0.15 0.92 1.00
8
Parsippany-Troy Hills
Bernards (Harrison
Brook)
12.48
1.78
0.82 0.100
2.910
Rockaway 10.06
0.65
0.100 Warren V 0.15 0.65 1.850
Warren I-II 0.37 0.63 1.620
Two Bridges Morris-
Butterworth 5.57 2.02 0.63 0.100 0.968
Berkeley Heights
Warren IV 1.61 0.28 1.00 0.100 2.200
Morristown
Florham Park
2.15
0.86
0.77 0.100 1.360
Wanaque RSA
0.96 0.43 0.100
Pompton Lakes
Chatham Glen
0.89 0.12 0.46 0.100 1.530

66
Table 6-7: Calibrated result of ratio of case-scenario to baseline for summer average chl-a at Dundee Lake (adapted from Omni, 2007d)
2001a 2002b
Scenario Case 1 Case 2 Case 3 Case 4 Case 1 Case 2 Case 3 Case 4 2 - - 1.00 - - - - - 8 - - - - - - 0.98 -
Ratio ≤ 1.00 indicates that the trade simulation had equal or better water quality than the no-trade baseline simulation. Both simulations applied trading ratios from Table 5-7. a. Water Year 2001 results are at No Diversion condition. b. Water Year 2002 results are at Extreme Diversion Condition. Table 6-8: Key for Figure 6-1
Name / Location ID no. on map Class
Dundee Lake / Passaic River at Dundee Dam
1 TMDL critical
location Wanaque South intake / on Pompton
River just upstream of confluence with Passaic River
2 TMDL critical
location
Passaic River near Chatham / USGS gage 01379500
3 Area of Concern
Passaic River at Little Falls intake 4 Area of Concern Peckman River mouth 5 Area of Concern

67
Table 6-9: Definition of criteria for evaluation matrices Location Criteria 1 Criteria 2 Criteria 3 Criteria 4
Dundee Lake Are cross-tributary trades simulated?
Did trading ratios > 1.00 result in ≤ summer avg. chl-a
compared to baseline?
Did trading with WWTPs at average flows result in ≤
summer avg. chl-a compared to baseline?
Did trading with WWTPs at < average flows result in ≤
summer avg. chl-a compared to baseline?
Wanaque South intake
Are cross-tributary trades simulated?
Did trading ratios > 1.00 result in ≤ TP load diverted
compared to baseline?
Did trading with WWTPs at average flows result in ≤ TP load diverted compared to
baseline?
Did trading with WWTPs at < average flows result in ≤ TP load diverted compared to
baseline?
Passaic R. near Chatham (USGS gage 01379500)
Are cross-tributary trades simulated?
Did trading ratios > 1.00 result in summer avg. DO concentration, max DO swing, and percent DO
compliance within 0.2 mg/l, 1.0 mg/l and 0.5%,
respectively, compared to baseline?
Did trading with WWTPs at average flows result in
summer avg. DO concentration, max DO swing, and percent DO
compliance within 0.2 mg/l, 1.0 mg/l and 0.5%,
respectively, compared to baseline?
Did trading with WWTPs at < average flows result in summer
avg. DO concentration, max DO swing, and percent DO
compliance within 0.2 mg/l, 1.0 mg/l and 0.5%, respectively,
compared to baseline?
Passaic R. at Little Falls intake
Are cross-tributary trades simulated?
Did trading ratios > 1.00 result in annual and summer
avg. TP concentrations within 0.02 mg/l compared to
baseline?
Did trading with WWTPs at average flows result in annual
and summer avg. TP concentrations within 0.02 mg/l compared to baseline?
Did trading with WWTPs at < average flows result in annual
and summer avg. TP concentrations within 0.02 mg/l
compared to baseline?
Peckman R. mouth
Are cross-tributary trades simulated?
Did trading ratios > 1.00 result in summer avg. DO concentration, max DO swing, and percent DO
compliance within 0.2 mg/l, 1.0 mg/l and 0.5%,
respectively, compared to baseline?
Did trading with WWTPs at average flows result in
summer avg. DO concentration, max DO swing, and percent DO
compliance within 0.2 mg/l, 1.0 mg/l and 0.5%,
respectively, compared to baseline?
Did trading with WWTPs at < average flows result in summer
avg. DO concentration, max DO swing, and percent DO
compliance within 0.2 mg/l, 1.0 mg/l and 0.5%, respectively,
compared to baseline?

68
Table 6-10: Evaluation matrix of trade scenario results at Dundee Lake, using Table 5-5 trading ratios
Scenario Criteria 1 Criteria 2 Criteria 3 Criteria 4
1 No - Pass Pass 2 No Fail Fail Fail 3 Yes Pass Pass Pass 4 Yes - Pass Pass 5 Yes - Pass Pass 6 Yes - Pass Pass 7 Yes - Pass Pass 8 Yes - Pass Fail 9 Yes - Pass Pass 10 Yes - Pass Pass 11 Yes - Pass Pass 12 Yes - Pass Pass 13 Yes - Pass Pass
Table 6-11: Evaluation matrix of trade scenario results at Dundee Lake, using Table 5-6 trading ratios
Scenario Criteria 1 Criteria 2 Criteria 3 Criteria 4
1 No - Pass Pass 2 No Fail Fail Fail 3 Yes Pass Pass Pass 4 Yes - Pass Pass 5 Yes - Pass Fail 6 Yes - Pass Pass 7 Yes Pass Pass Pass 8 Yes Fail Fail Fail 9 Yes Fail Pass Fail 10 Yes - Pass Fail 11 Yes - Pass Fail 12 Yes - Pass Pass 13 Yes - Pass Pass

69
Table 6-12: Evaluation matrix of trade scenario results at Dundee Lake, using Table 5-7 trading ratios*
Scenario Criteria 1 Criteria 2 Criteria 3 Criteria 4
1 No - Pass Pass 2 No Pass Pass Pass 3 Yes Pass Pass Pass 4 Yes - Pass Pass 5 Yes - Pass Pass 6 Yes - Pass Pass 7 Yes - Pass Pass 8 Yes - Pass Pass 9 Yes - Pass Pass 10 Yes - Pass Pass 11 Yes - Pass Pass 12 Yes - Pass Pass 13 Yes - Pass Pass
*Only scenarios 2 and 8, at Case 3 conditions, were actually simulated with Table 5-7 trading ratios. However based on the successful results of these critical simulations, and given that Table 5-7 ratios are more conservative than Table 5-5 ratios, it is reasonable to assume that all other scenarios would have successful results. Table 6-13: Evaluation matrix of trade scenario results at Wanaque South intake, using Table 5-5 trading ratios
Scenario Criteria 1 Criteria 2 Criteria 3 Criteria 4
1 No - Pass Pass 2 No Pass Pass Pass 3 Yes Pass Pass Pass 4 Yes - Pass Pass 5 Yes - Pass Pass 6 Yes - Pass Pass 7 Yes - Pass Pass 8 Yes - Pass Pass 9 Yes - Pass Pass 10 Yes - Pass Pass 11 Yes - Pass Pass 12 Yes - Pass Pass 13 Yes - Pass Pass
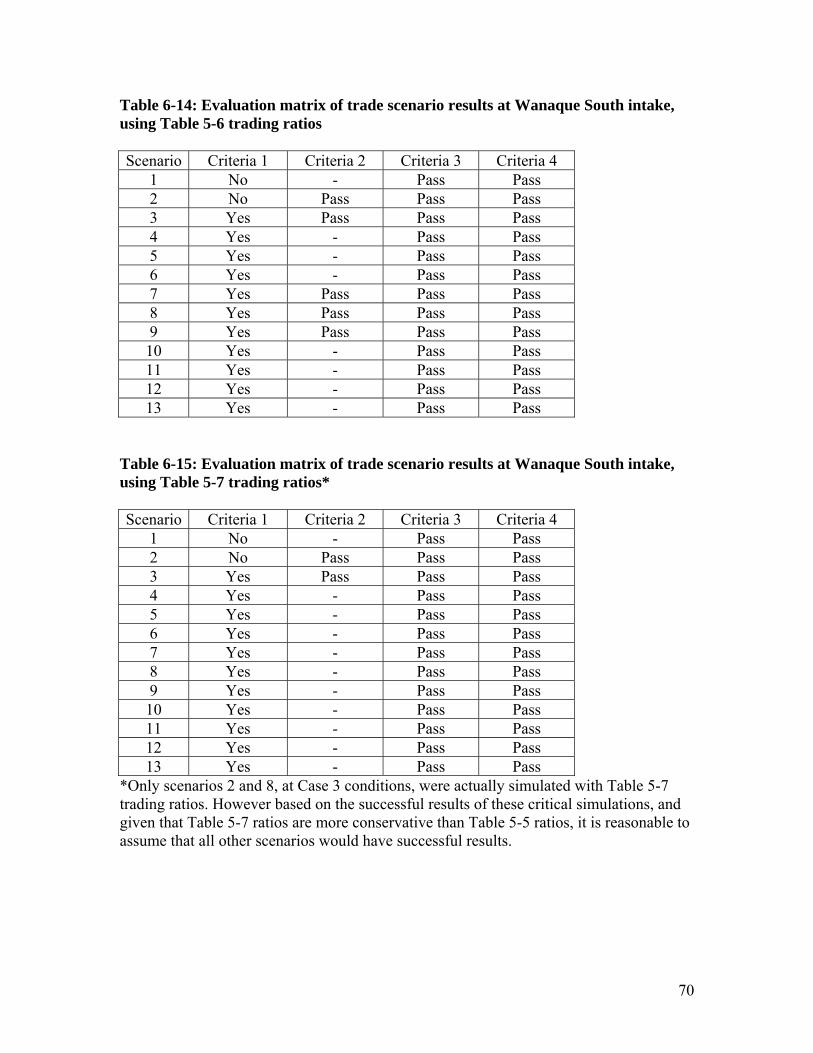
70
Table 6-14: Evaluation matrix of trade scenario results at Wanaque South intake, using Table 5-6 trading ratios
Scenario Criteria 1 Criteria 2 Criteria 3 Criteria 4
1 No - Pass Pass 2 No Pass Pass Pass 3 Yes Pass Pass Pass 4 Yes - Pass Pass 5 Yes - Pass Pass 6 Yes - Pass Pass 7 Yes Pass Pass Pass 8 Yes Pass Pass Pass 9 Yes Pass Pass Pass 10 Yes - Pass Pass 11 Yes - Pass Pass 12 Yes - Pass Pass 13 Yes - Pass Pass
Table 6-15: Evaluation matrix of trade scenario results at Wanaque South intake, using Table 5-7 trading ratios*
Scenario Criteria 1 Criteria 2 Criteria 3 Criteria 4
1 No - Pass Pass 2 No Pass Pass Pass 3 Yes Pass Pass Pass 4 Yes - Pass Pass 5 Yes - Pass Pass 6 Yes - Pass Pass 7 Yes - Pass Pass 8 Yes - Pass Pass 9 Yes - Pass Pass 10 Yes - Pass Pass 11 Yes - Pass Pass 12 Yes - Pass Pass 13 Yes - Pass Pass
*Only scenarios 2 and 8, at Case 3 conditions, were actually simulated with Table 5-7 trading ratios. However based on the successful results of these critical simulations, and given that Table 5-7 ratios are more conservative than Table 5-5 ratios, it is reasonable to assume that all other scenarios would have successful results.

71
Table 6-16: Evaluation matrix of trade scenario results at Passaic River near Chatham, using Table 5-5 trading ratios Scenario Criteria 1 Criteria 2 Criteria 3 Criteria 4
1 No - Pass Pass 2 No Pass Pass Pass 3 Yes Pass Pass Pass 4 Yes - Pass Pass 5 Yes - Pass Pass 6 Yes - Pass Pass 7 Yes - Pass Pass 8 Yes - Pass Pass 9 Yes - Pass Pass 10 Yes - Pass Pass 11 Yes - Pass Pass 12 Yes - Pass Pass 13 Yes - Pass Pass
Table 6-17: Evaluation matrix of trade scenario results at Passaic River near Chatham, using Table 5-6 trading ratios Scenario Criteria 1 Criteria 2 Criteria 3 Criteria 4
1 No - Pass Pass 2 No Pass Pass Pass 3 Yes Pass Pass Pass 4 Yes - Pass Pass 5 Yes - Pass Pass 6 Yes - Pass Pass 7 Yes - Pass Pass 8 Yes - Pass Pass 9 Yes - Pass Pass 10 Yes - Pass Pass 11 Yes - Pass Pass 12 Yes - Pass Pass 13 Yes - Pass Pass

72
Table 6-18: Evaluation matrix of trade scenario results at Passaic River near Chatham, using Table 5-7 trading ratios* Scenario Criteria 1 Criteria 2 Criteria 3 Criteria 4
1 No - Pass Pass 2 No Pass Pass Pass 3 Yes Pass Pass Pass 4 Yes - Pass Pass 5 Yes - Pass Pass 6 Yes - Pass Pass 7 Yes - Pass Pass 8 Yes - Pass Pass 9 Yes - Pass Pass 10 Yes - Pass Pass 11 Yes - Pass Pass 12 Yes - Pass Pass 13 Yes - Pass Pass
*Only scenarios 2 and 8, at Case 3 conditions, were actually simulated with Table 5-7 trading ratios. However based on the successful results of these critical simulations, and given that Table 5-7 ratios are more conservative than Table 5-5 ratios, it is reasonable to assume that all other scenarios would have successful results. Table 6-19: Evaluation matrix of trade scenario results at Passaic River Little Falls intake, using Table 5-5 trading ratios Scenario Criteria 1 Criteria 2 Criteria 3 Criteria 4
1 No - Pass Pass 2 No Pass Pass Pass 3 Yes Pass Pass Pass 4 Yes - Pass Pass 5 Yes - Pass Pass 6 Yes - Pass Pass 7 Yes - Pass Pass 8 Yes - Pass Pass 9 Yes - Pass Pass 10 Yes - Pass Pass 11 Yes - Pass Pass 12 Yes - Pass Pass 13 Yes - Pass Pass

73
Table 6-20: Evaluation matrix of trade scenario results at Passaic River Little Falls intake, using Table 5-6 trading ratios Scenario Criteria 1 Criteria 2 Criteria 3 Criteria 4
1 No - Pass Pass 2 No Pass Pass Pass 3 Yes Pass Pass Pass 4 Yes - Pass Pass 5 Yes - Pass Pass 6 Yes - Pass Pass 7 Yes - Pass Pass 8 Yes - Pass Pass 9 Yes - Pass Pass 10 Yes - Pass Pass 11 Yes - Pass Pass 12 Yes - Pass Pass 13 Yes - Pass Pass
Table 6-21: Evaluation matrix of trade scenario results at Passaic River Little Falls intake, using Table 5-7 trading ratios* Scenario Criteria 1 Criteria 2 Criteria 3 Criteria 4
1 No - Pass Pass 2 No Pass Pass Pass 3 Yes Pass Pass Pass 4 Yes - Pass Pass 5 Yes - Pass Pass 6 Yes - Pass Pass 7 Yes - Pass Pass 8 Yes - Pass Pass 9 Yes - Pass Pass 10 Yes - Pass Pass 11 Yes - Pass Pass 12 Yes - Pass Pass 13 Yes - Pass Pass
*Only scenarios 2 and 8, at Case 3 conditions, were actually simulated with Table 5-7 trading ratios. However based on the successful results of these critical simulations, and given that Table 5-7 ratios are more conservative than Table 5-5 ratios, it is reasonable to assume that all other scenarios would have successful results.

74
Table 6-22: Evaluation matrix of trade scenario results at Peckman River mouth, using Table 5-5 trading ratios Scenario Criteria 1 Criteria 2 Criteria 3 Criteria 4
1 No - Pass Pass 2 No Pass Pass Pass 3 Yes Pass Pass Pass 4 Yes - Pass Pass 5 Yes - Pass Pass 6 Yes - Pass Pass 7 Yes - Pass Pass 8 Yes - Pass Pass 9 Yes - Pass Pass 10 Yes - Pass Pass 11 Yes - Pass Pass 12 Yes - Pass Pass 13 Yes - Pass Pass
Table 6-23: Evaluation matrix of trade scenario results at Peckman River mouth, using Table 5-6 trading ratios Scenario Criteria 1 Criteria 2 Criteria 3 Criteria 4
1 No - Pass Pass 2 No Pass Pass Pass 3 Yes Pass Pass Pass 4 Yes - Pass Pass 5 Yes - Pass Pass 6 Yes - Pass Pass 7 Yes - Pass Pass 8 Yes - Pass Pass 9 Yes - Pass Pass 10 Yes - Pass Pass 11 Yes - Pass Pass 12 Yes - Pass Pass 13 Yes - Pass Pass
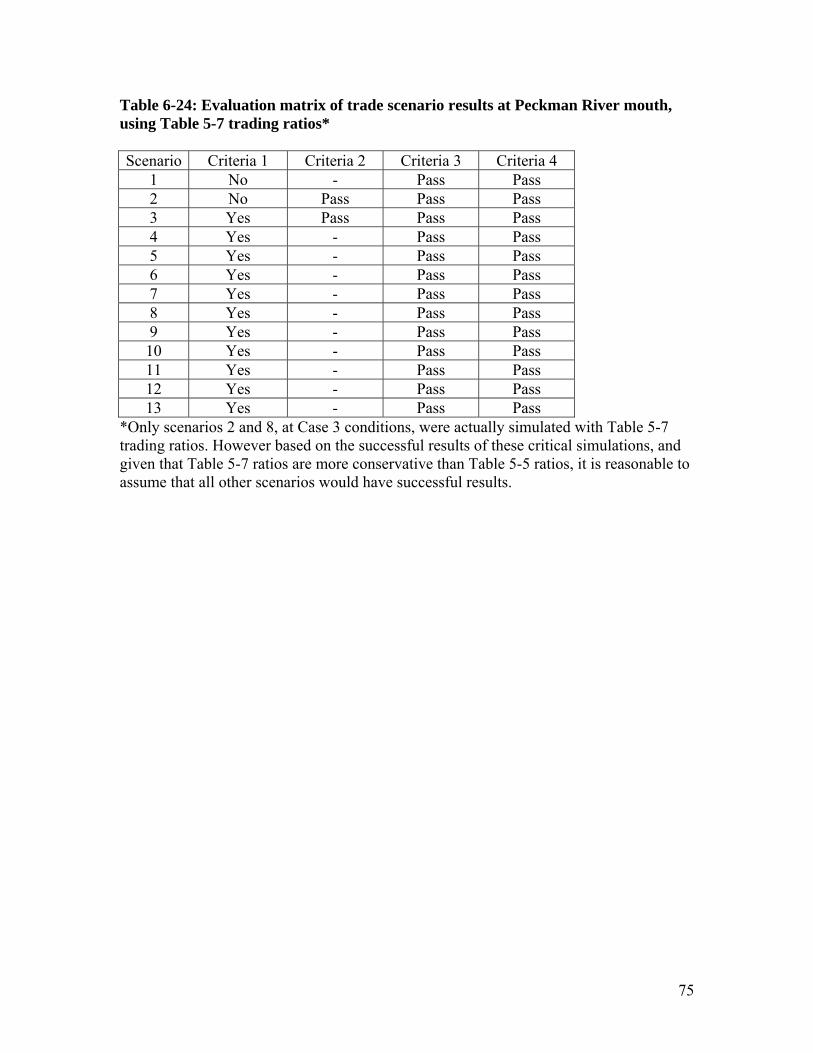
75
Table 6-24: Evaluation matrix of trade scenario results at Peckman River mouth, using Table 5-7 trading ratios* Scenario Criteria 1 Criteria 2 Criteria 3 Criteria 4
1 No - Pass Pass 2 No Pass Pass Pass 3 Yes Pass Pass Pass 4 Yes - Pass Pass 5 Yes - Pass Pass 6 Yes - Pass Pass 7 Yes - Pass Pass 8 Yes - Pass Pass 9 Yes - Pass Pass 10 Yes - Pass Pass 11 Yes - Pass Pass 12 Yes - Pass Pass 13 Yes - Pass Pass
*Only scenarios 2 and 8, at Case 3 conditions, were actually simulated with Table 5-7 trading ratios. However based on the successful results of these critical simulations, and given that Table 5-7 ratios are more conservative than Table 5-5 ratios, it is reasonable to assume that all other scenarios would have successful results.

FIGURES
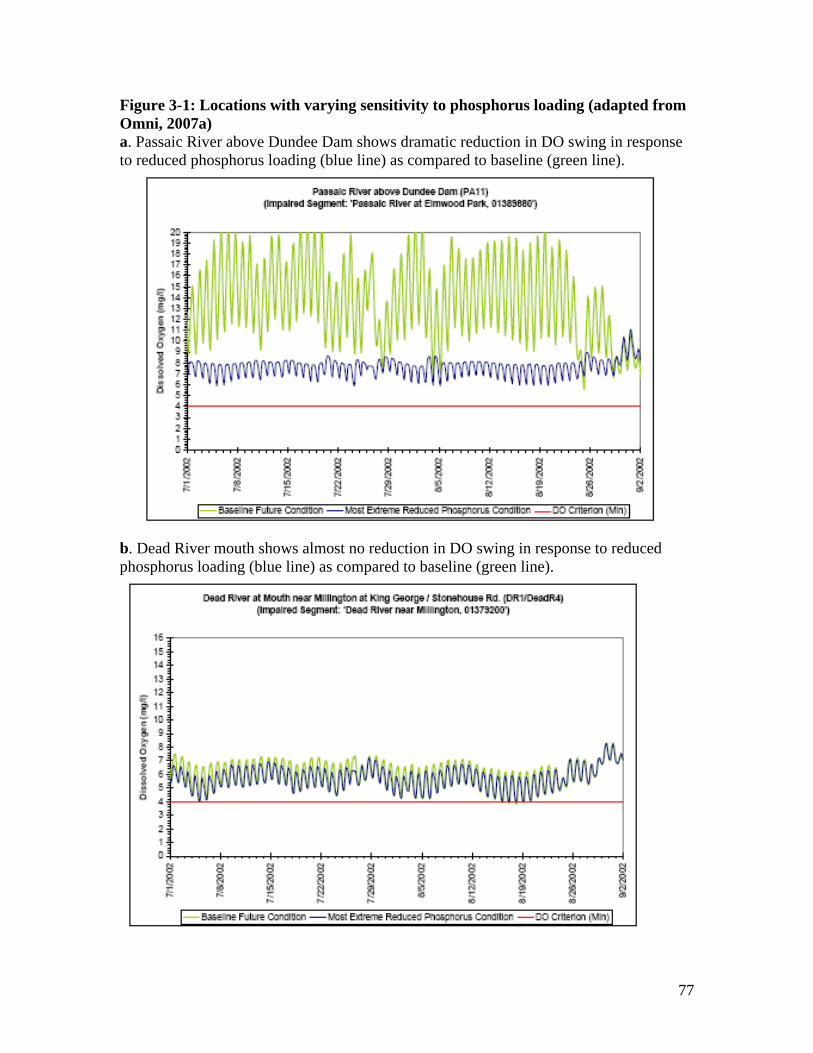
77
Figure 3-1: Locations with varying sensitivity to phosphorus loading (adapted from Omni, 2007a) a. Passaic River above Dundee Dam shows dramatic reduction in DO swing in response to reduced phosphorus loading (blue line) as compared to baseline (green line).
b. Dead River mouth shows almost no reduction in DO swing in response to reduced phosphorus loading (blue line) as compared to baseline (green line).

78

79

80

81

82
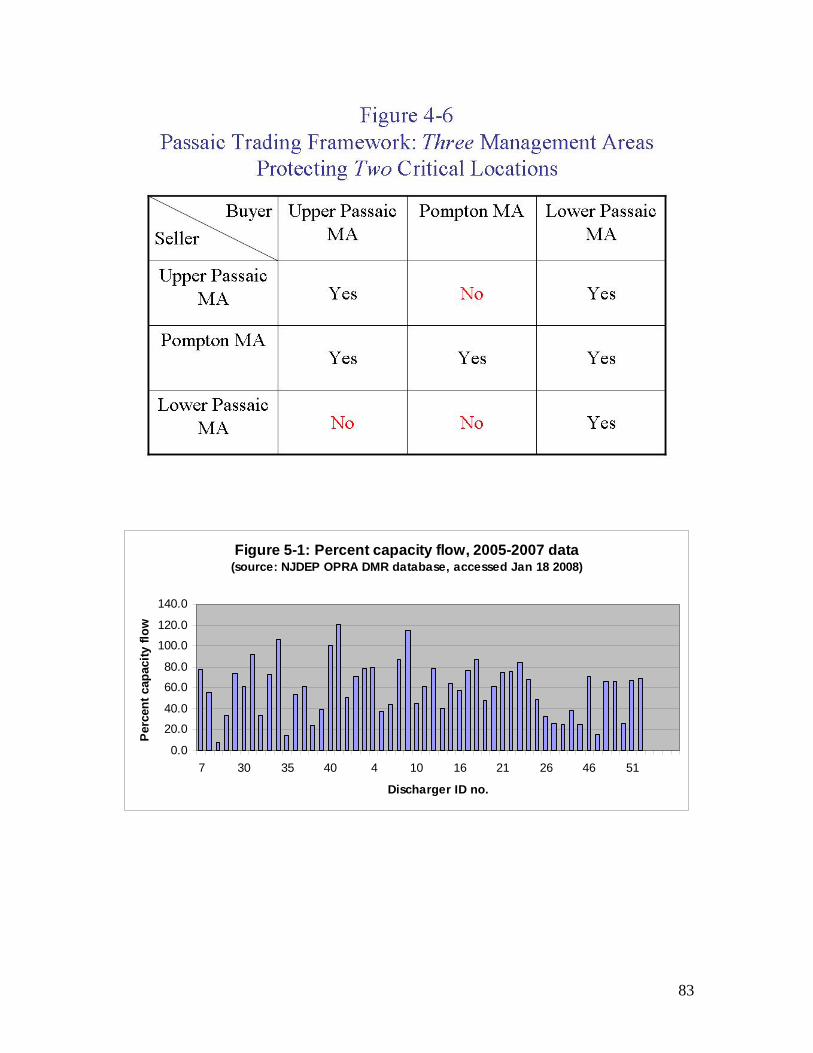
83
Figure 5-1: Percent capacity flow, 2005-2007 data (source: NJDEP OPRA DMR database, accessed Jan 18 2008)
0.0
20.0
40.0
60.0
80.0
100.0
120.0
140.0
7 30 35 40 4 10 16 21 26 46 51
Discharger ID no.
Per
cen
t ca
pac
ity
flo
w
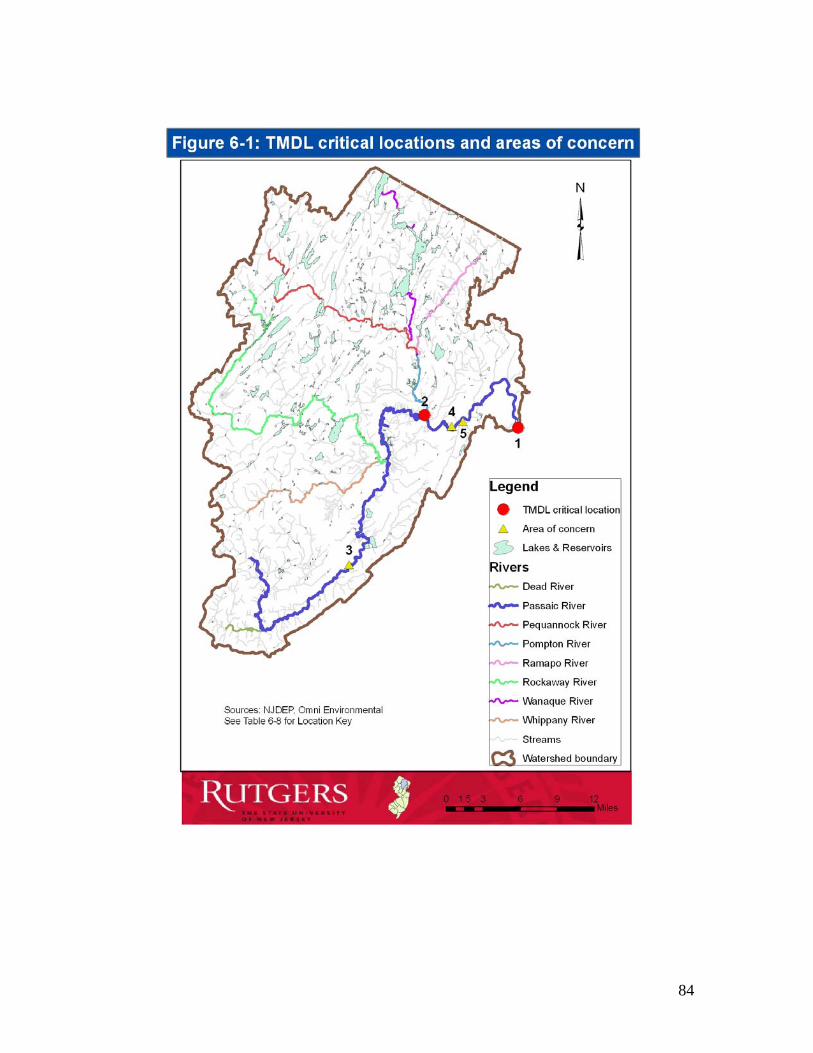
84

Appendix 1:
Surface Water Diversions

Appendix 1 A1-1
APPENDIX 1: Surface Water Diversions
Definitions Diversion – is the removal of either groundwater or surface water from the natural hydrologic cycle. The NJDEP Bureau of Water Allocation is responsible for granting the privilege to a person to divert over 100,000 gallons per day (gpd) of water for any purpose other than agricultural or horticultural use. The NJDEP maintains extensive databases on water usage. The ability to use full diversions is typically related to satisfying other criteria (e.g., surface water diversion can be limited based upon requirements to maintain a certain stream flow past the diversion – passing flow). Depletive Water Use – "surface or ground water withdrawn from a selected watershed and discharged in another watershed. Also referred by others as outof- basin transfers (or inter-basin transfers) and wastewater and water exportations, depletive use has become a significant issue in New Jersey over the last several years as competition for water has increased."
Safe Yield From Surface Sources – means the yield maintainable by a water system continuously throughout a repetition of the most severe drought of record, after compliance with requirements of maintaining minimum passing flows, assuming no significant changes in upstream or upbasin depletive withdrawals. Minimum Passing Flow – surface water diversions are limited by requirements to maintain a certain stream flow, or passing flow, downstream of the water intake. The New Jersey Department's Bureau of Water Allocation has set these passing flow requirements. Where not specified, statutory minimum passing flow is calculated as 125,000 gallons per square mile of contributing upstream unappropriated watershed for public water supplies. Source: WMAs 3, 4, 6 Characterization and Assessment Studies (2002). Available at: http://www.njdwsc.com/prbwmp/intro.htm

Appendix 1 A1-2
The Wanaque and Monksville Reservoirs are owned and operated by the North Jersey District Water Supply Commission (NJDWSC). These two “run-of-theriver” reservoirs comprise one of the largest water supply/storage systems in New Jersey. This system is the primary source of drinking water for much of Passaic, Essex, Bergen and Hudson Counties. Following the completion of the Wanaque South Project in the late 1980s, the [existing water allocation] of this combined reservoir system was upgraded to 173 mgd. The system currently provides approximately 160 mgd of potable water supply to its customers (including other water companies). To maintain this [allocation], the Wanaque Reservoir utilizes inflows from three separate sources: (1) its natural tributary system, which includes the Monksville Reservoir; (2) the Pompton Lakes intake, which is located on the Ramapo River; and (3) the Two Bridges intake, which is located on the Pompton River about 750 feet upstream from the confluence with the Passaic River. The NJDWSC has the capability of pumping up to 150 mgd from the Pompton Lakes intake, and up to 250 mgd from the Two Bridges intake. By design, when the diversion from the Two Bridges intake exceeds the available flow in the Pompton River, this intake has the ability to reverse flows in the lowermost reach of the Pompton River and tap the [the Pompton and Passaic Rivers at their confluence]. Thus, the entire upper Passaic watershed (with a drainage area of 361 square miles) becomes a contributing source to the Reservoir. To maintain water quality in the downstream portions of the Passaic, Pompton and Ramapo Rivers, NJDEP has implemented several restrictions on intake usage, including: (a) no diversions during July and August unless there is a declared drought emergency; (b) no diversions from the Pompton Lakes intake when flows in the Ramapo River are below 40 mgd; and (c) no diversions when flows in the Passaic River at Little Falls are below 17.6 mgd. (modified from Najarian (2005)). Source: New Jersey Department of Environmental Protection (NJDEP). 2005. Amendment to the Northeast, Upper Raritan, Sussex County, and Upper Delaware Water Quality Management Plans: Phase I Passaic River Study Total Maximum Daily Load for Phosphorus in Wanaque Reservoir Northeast Water Region (proposed).

Appendix 1 A1-3
North Jersey District Water Supply Commission The North Jersey District Water Supply Commission (NJDWSC) operates Wanaque Reservoir (29.6 billion gallons) above the town of Pompton Lakes on the Wanaque River and the Wanaque South Project, including Monksville Reservoir, Wanaque South Pump Station and the Ramapo Pump Station. NJDWSC was created in 1916 by enactment of the State Legislature to help develop and operate water supply systems in New Jersey's 11 northernmost counties. The NJDWSC serves as agent or trustee representing the joint interests of municipalities that contract with the Commission to share in various water projects implemented by the Commission. Beginning in 1920, the Wanaque North Project includes the original construction of Wanaque Reservoir and various improvements to raise the reservoir level. The NJDWSC, per Allocation Permit No. 5329, can divert:
"the entire runoff of the watersheds, provided, however, that at all times the flow of the Wanaque River below the Raymond Dam shall be maintained at an amount not less than seven million gallons per day (10.83 cfs) plus such quantity of water up to three million gallons per day (4.64 cfs) is discharged from storage in Greenwood Lake for use other than the use of the NJDWSC, an amount equal to such draft from Greenwood Lake shall be discharged from the Wanaque Reservoir, and, in addition thereto, such amount as shall be required to make the total discharge from the reservoir at least ten million gallons per day (15.47 cfs)."
The Wanaque North Project also includes the Ramapo Pump Station (constructed in 1953 @ 100 MGD) that transfers raw water from the Ramapo River at Pompton Lake to the Wanaque Reservoir. As part of the Wanaque South project the pumping capacity and diversion limits were increased. There are two permits with diversion limits as follows:
There is a 40 MGD passing flow requirement and other water quality constraints. No pumping is allowed between July 1st and August 31st. The Wanaque South Project includes the construction of the Monksville Dam and Reservoir (7 billion gallons) in 1987. Integral to the Wanaque South Project was the construction of the Wanaque South Pump Station , which transfers water from the confluence of the Pompton and Passaic Rivers (Two Bridges) to the Wanaque Reservoir and/or to the Oradell Reservoir in WMA 5. There are two permits with diversion limits as follows:

Appendix 1 A1-4
There is a 92.6 MGD passing flow requirement at the Wanaque South Pump Station. (Two Bridges site) and detailed water quality constraints. However, NJDWSC is allowed to pump the differential of flows between actual diversion by PVWC (total of diversion at Two Bridges and Little Falls (WMA 4)) and 75 MGD after passing 17.6 MGD. No pumping by NJDWSC is allowed between July 1st and August 31st. In addition, PVWC, as part of its Permit No. 5099 can divert up to 75 MGD at the Two Bridges site. The PVWC permit allows year round pumping at the Two Bridges site as long as certain downstream water quality criteria are maintained. It is noted that the NJSWSP indicates that the [water allocation] from the Wanaque South Project is 79.0 MGD, and the [water allocation] from the Wanaque North Project is 94.0 MGD. According to the NJSWSP the total [water allocation] of the system, as currently constructed, is therefore 173 MGD. In addition, the 173 MGD is currently completely allocated to the contracting municipalities as indicated in Table 1.16.10. Of this total, 133.5 MGD of finished water can be provided on an average daily basis by NJDWSC to contracting members (per their allotments) and up to the remaining 39.5 MGD can be provided on an average daily basis by NJDWSC to United Water NJ as raw water transferred to Oradell Reservoir.
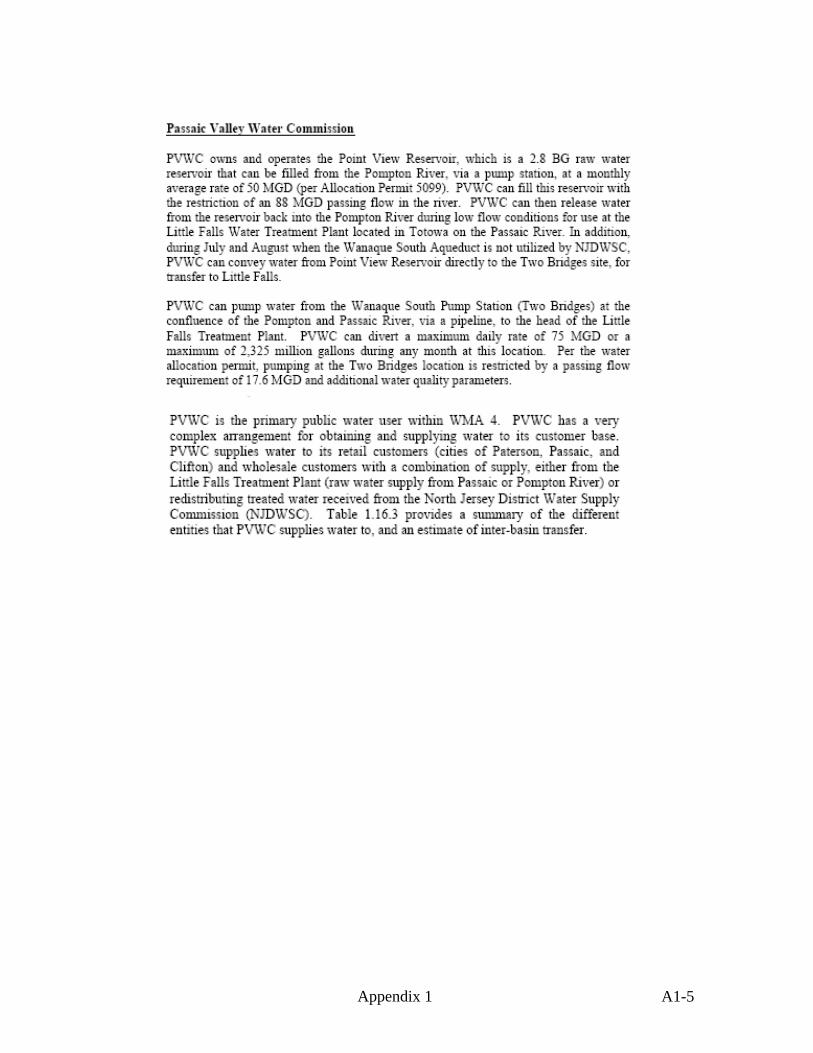
Appendix 1 A1-5

Appendix 1 A1-6

Appendix 1 A1-7
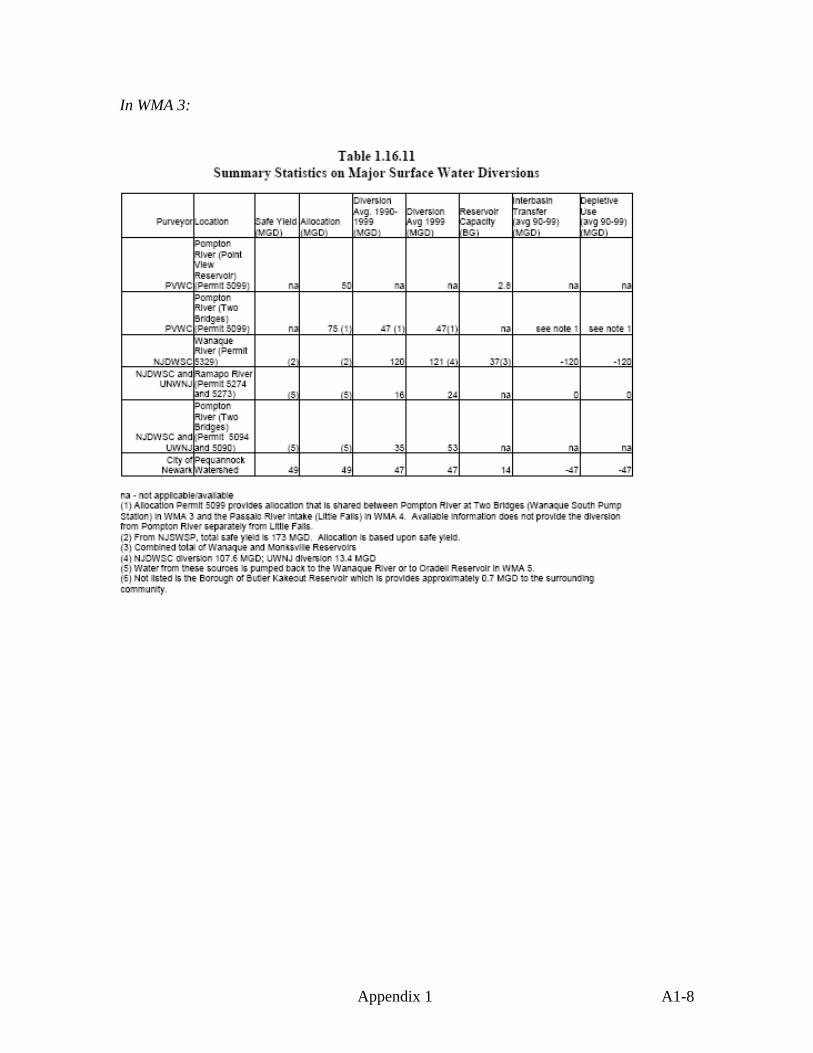
Appendix 1 A1-8
In WMA 3:
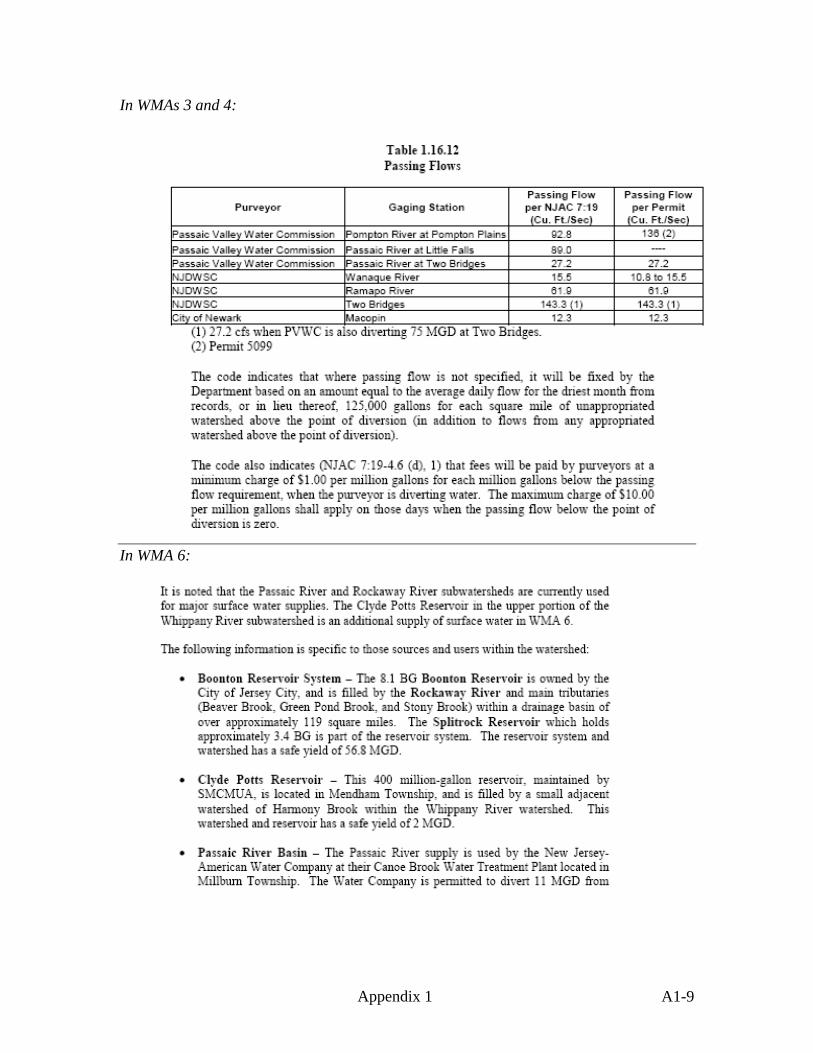
Appendix 1 A1-9
In WMAs 3 and 4:
In WMA 6:

Appendix 1 A1-10
Source: WMAs 3, 4, 6 Characterization and Assessment Studies (2002). Available at: http://www.njdwsc.com/prbwmp/intro.htm
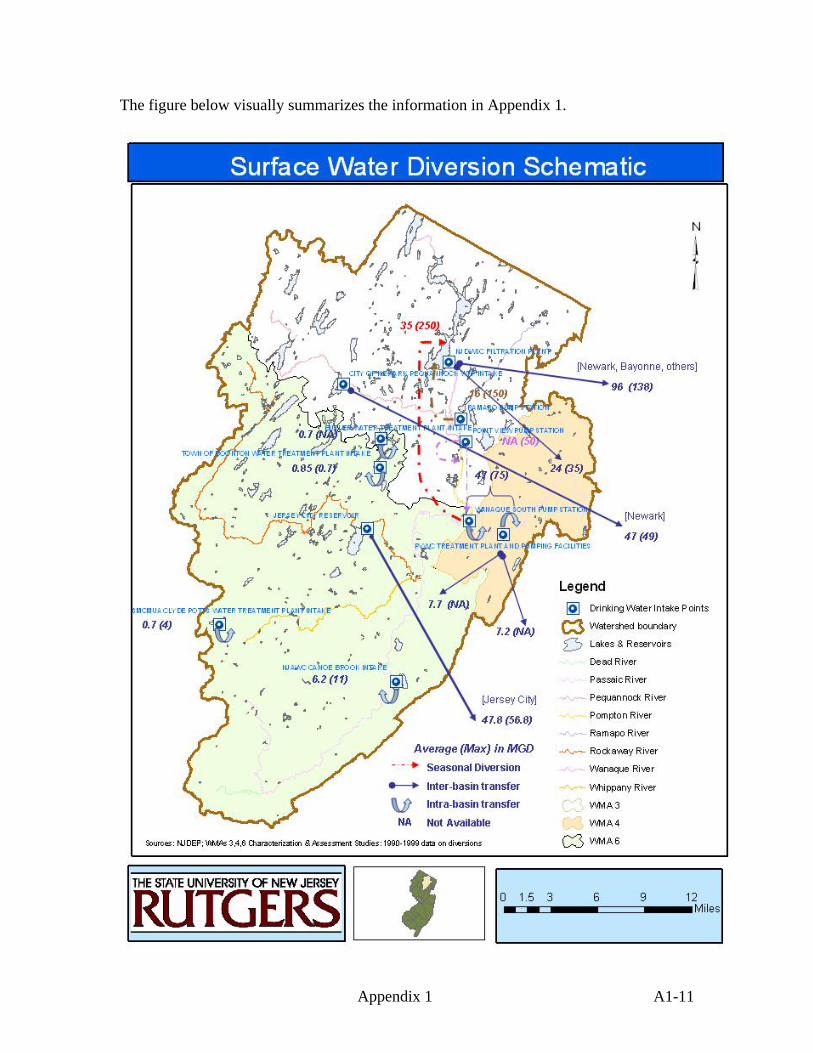
Appendix 1 A1-11
The figure below visually summarizes the information in Appendix 1.
Appendix 2:
Trade Verification Forms
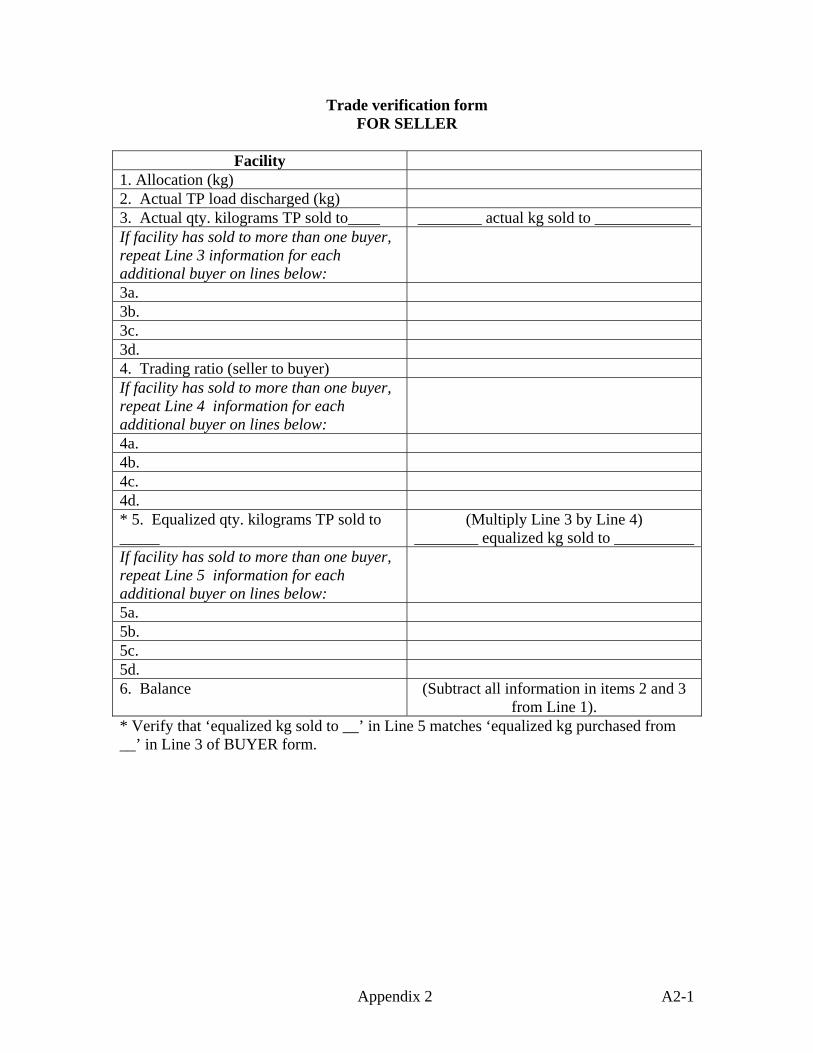
Appendix 2 A2-1
Trade verification form FOR SELLER
Facility
1. Allocation (kg) 2. Actual TP load discharged (kg) 3. Actual qty. kilograms TP sold to____ ________ actual kg sold to ____________ If facility has sold to more than one buyer, repeat Line 3 information for each additional buyer on lines below:
3a. 3b. 3c. 3d. 4. Trading ratio (seller to buyer) If facility has sold to more than one buyer, repeat Line 4 information for each additional buyer on lines below:
4a. 4b. 4c. 4d. * 5. Equalized qty. kilograms TP sold to _____
(Multiply Line 3 by Line 4) ________ equalized kg sold to __________
If facility has sold to more than one buyer, repeat Line 5 information for each additional buyer on lines below:
5a. 5b. 5c. 5d. 6. Balance (Subtract all information in items 2 and 3
from Line 1). * Verify that ‘equalized kg sold to __’ in Line 5 matches ‘equalized kg purchased from __’ in Line 3 of BUYER form.

Appendix 2 A2-2
Trade verification form FOR BUYER
Facility
1. Allocation (kg) 2. Actual TP load discharged (kg) * 3. Equalized qty. kilograms TP purchased from _____
________ equalized kg purchased from __________
If facility has purchased from more than one seller, repeat Line 3 information for each additional seller on lines below:
3a. 3b. 3c. 3d. 4. Balance (Add all information in Items 1 and 3, then
subtract Line 2). * Verify that ‘equalized kg purchased from __’ in Line 3 matches ‘equalized kg sold to ___’ in Line 5 of SELLER form.

Appendix 3:
Example Trades
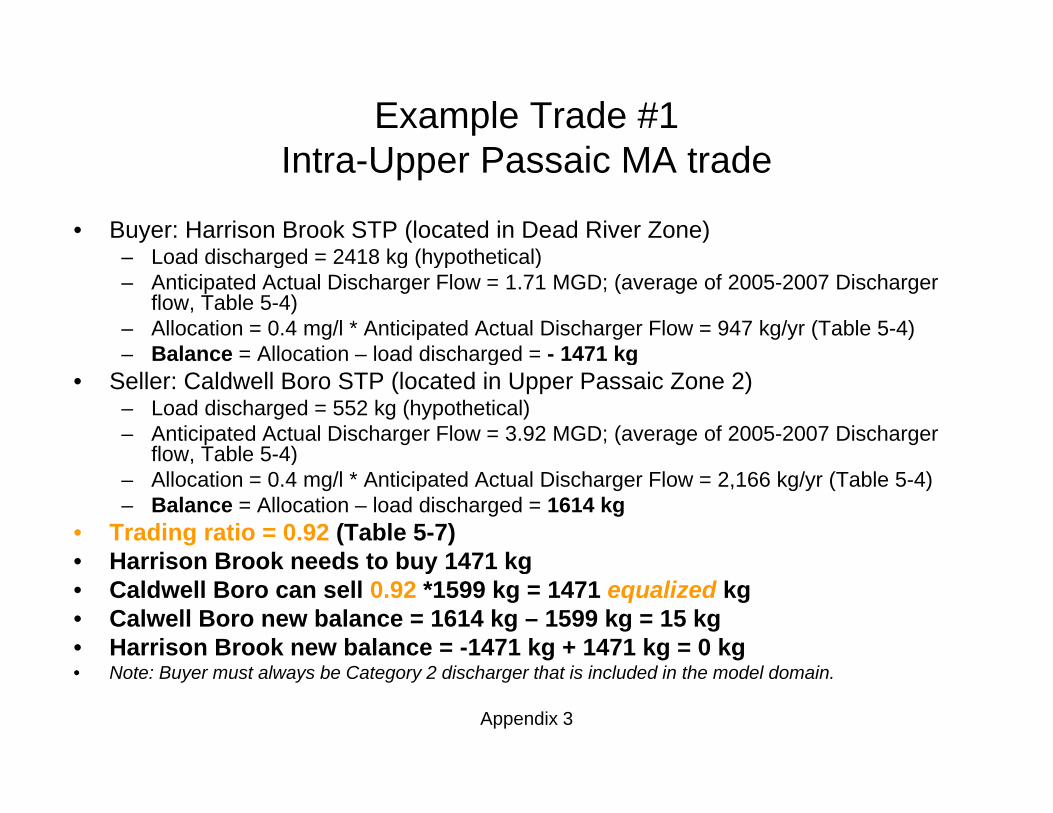
Example Trade #1I t U P i MA t dIntra-Upper Passaic MA trade
• Buyer: Harrison Brook STP (located in Dead River Zone)Load discharged 2418 kg (hypothetical)– Load discharged = 2418 kg (hypothetical)
– Anticipated Actual Discharger Flow = 1.71 MGD; (average of 2005-2007 Discharger flow, Table 5-4)
– Allocation = 0.4 mg/l * Anticipated Actual Discharger Flow = 947 kg/yr (Table 5-4)– Balance = Allocation – load discharged = - 1471 kg– Balance = Allocation – load discharged = - 1471 kg
• Seller: Caldwell Boro STP (located in Upper Passaic Zone 2)– Load discharged = 552 kg (hypothetical)– Anticipated Actual Discharger Flow = 3.92 MGD; (average of 2005-2007 Discharger
flow Table 5-4)flow, Table 5 4)– Allocation = 0.4 mg/l * Anticipated Actual Discharger Flow = 2,166 kg/yr (Table 5-4)– Balance = Allocation – load discharged = 1614 kg
• Trading ratio = 0.92 (Table 5-7)• Harrison Brook needs to buy 1471 kg• Harrison Brook needs to buy 1471 kg• Caldwell Boro can sell 0.92 *1599 kg = 1471 equalized kg • Calwell Boro new balance = 1614 kg – 1599 kg = 15 kg• Harrison Brook new balance = -1471 kg + 1471 kg = 0 kg
Appendix 3
• Note: Buyer must always be Category 2 discharger that is included in the model domain.
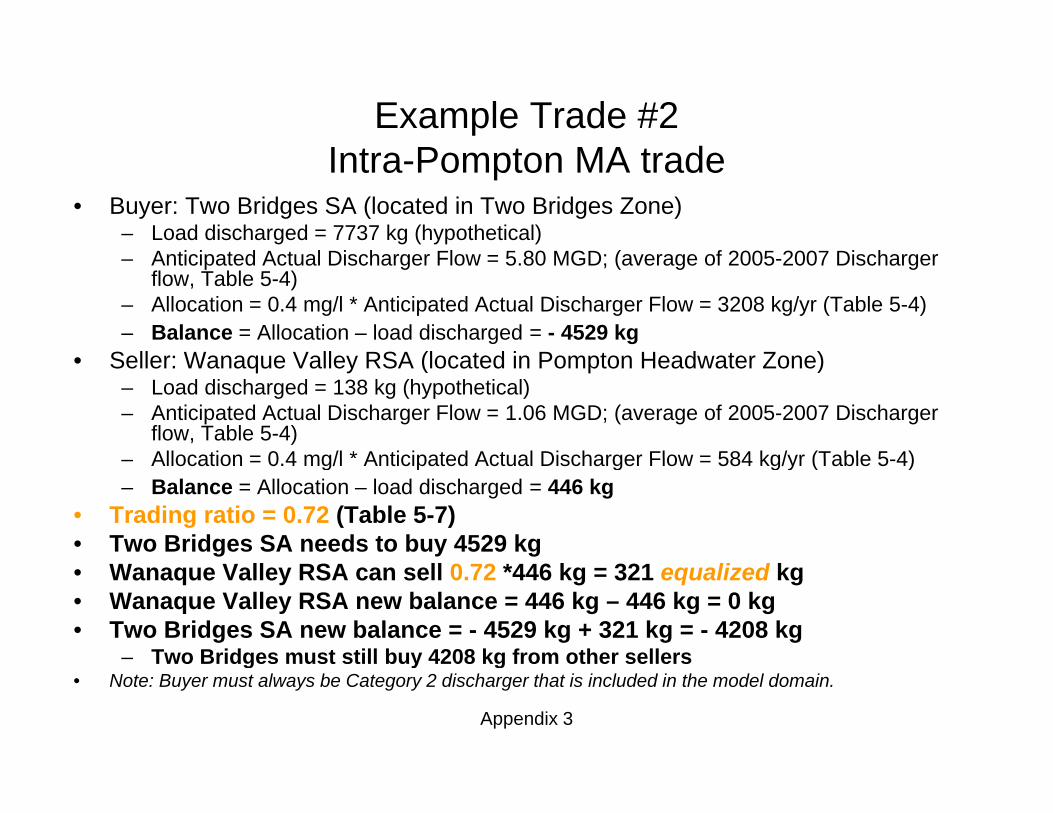
Example Trade #2I t P t MA t dIntra-Pompton MA trade
• Buyer: Two Bridges SA (located in Two Bridges Zone)– Load discharged = 7737 kg (hypothetical)
A ti i t d A t l Di h Fl 5 80 MGD ( f 2005 2007 Di h– Anticipated Actual Discharger Flow = 5.80 MGD; (average of 2005-2007 Discharger flow, Table 5-4)
– Allocation = 0.4 mg/l * Anticipated Actual Discharger Flow = 3208 kg/yr (Table 5-4)– Balance = Allocation – load discharged = - 4529 kg
S ll W V ll RSA (l t d i P t H d t Z )• Seller: Wanaque Valley RSA (located in Pompton Headwater Zone)– Load discharged = 138 kg (hypothetical)– Anticipated Actual Discharger Flow = 1.06 MGD; (average of 2005-2007 Discharger
flow, Table 5-4)Allocation = 0 4 mg/l * Anticipated Actual Discharger Flow = 584 kg/yr (Table 5 4)– Allocation = 0.4 mg/l Anticipated Actual Discharger Flow = 584 kg/yr (Table 5-4)
– Balance = Allocation – load discharged = 446 kg• Trading ratio = 0.72 (Table 5-7)• Two Bridges SA needs to buy 4529 kg• Wanaque Valley RSA can sell 0.72 *446 kg = 321 equalized kg • Wanaque Valley RSA new balance = 446 kg – 446 kg = 0 kg• Two Bridges SA new balance = - 4529 kg + 321 kg = - 4208 kg
– Two Bridges must still buy 4208 kg from other sellers
Appendix 3
Two Bridges must still buy 4208 kg from other sellers• Note: Buyer must always be Category 2 discharger that is included in the model domain.
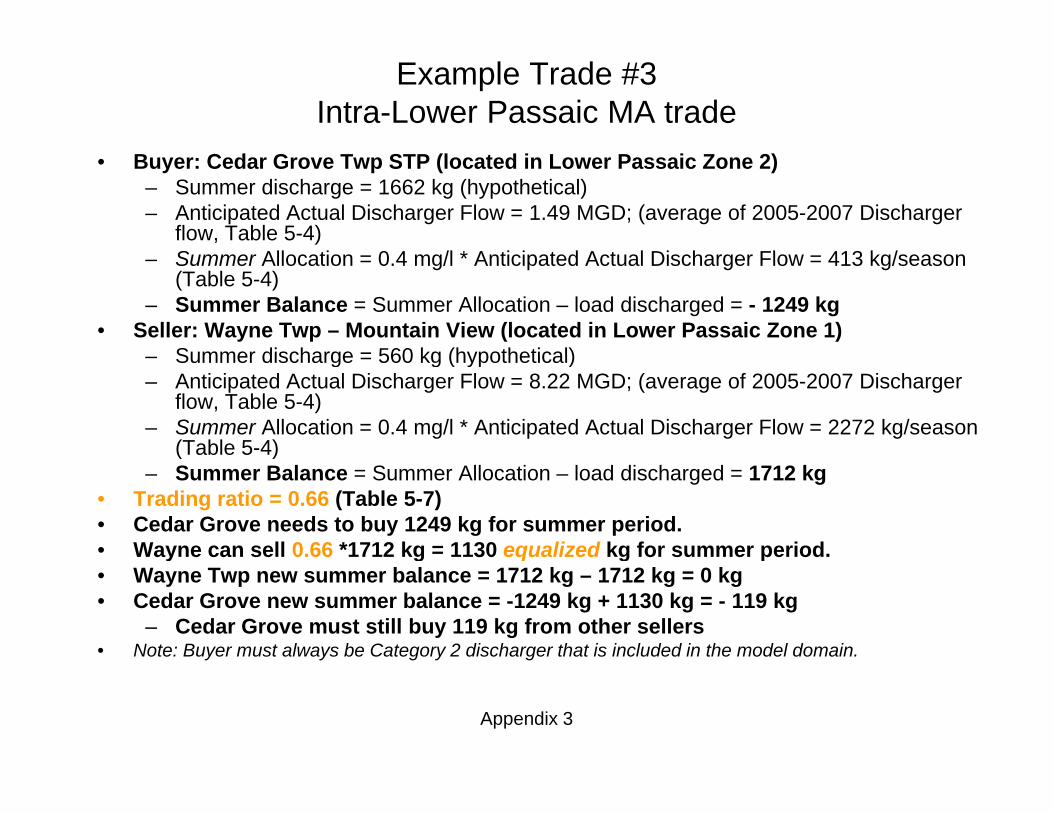
Example Trade #3Intra-Lower Passaic MA trade
• Buyer: Cedar Grove Twp STP (located in Lower Passaic Zone 2)– Summer discharge = 1662 kg (hypothetical)– Anticipated Actual Discharger Flow = 1.49 MGD; (average of 2005-2007 Discharger
flow, Table 5-4)S All ti 0 4 /l * A ti i t d A t l Di h Fl 413 k /– Summer Allocation = 0.4 mg/l * Anticipated Actual Discharger Flow = 413 kg/season (Table 5-4)
– Summer Balance = Summer Allocation – load discharged = - 1249 kg• Seller: Wayne Twp – Mountain View (located in Lower Passaic Zone 1)
Summer discharge = 560 kg (hypothetical)– Summer discharge = 560 kg (hypothetical)– Anticipated Actual Discharger Flow = 8.22 MGD; (average of 2005-2007 Discharger
flow, Table 5-4)– Summer Allocation = 0.4 mg/l * Anticipated Actual Discharger Flow = 2272 kg/season
(Table 5-4)( )– Summer Balance = Summer Allocation – load discharged = 1712 kg
• Trading ratio = 0.66 (Table 5-7)• Cedar Grove needs to buy 1249 kg for summer period. • Wayne can sell 0.66 *1712 kg = 1130 equalized kg for summer period. y g q g p• Wayne Twp new summer balance = 1712 kg – 1712 kg = 0 kg• Cedar Grove new summer balance = -1249 kg + 1130 kg = - 119 kg
– Cedar Grove must still buy 119 kg from other sellers• Note: Buyer must always be Category 2 discharger that is included in the model domain.
Appendix 3
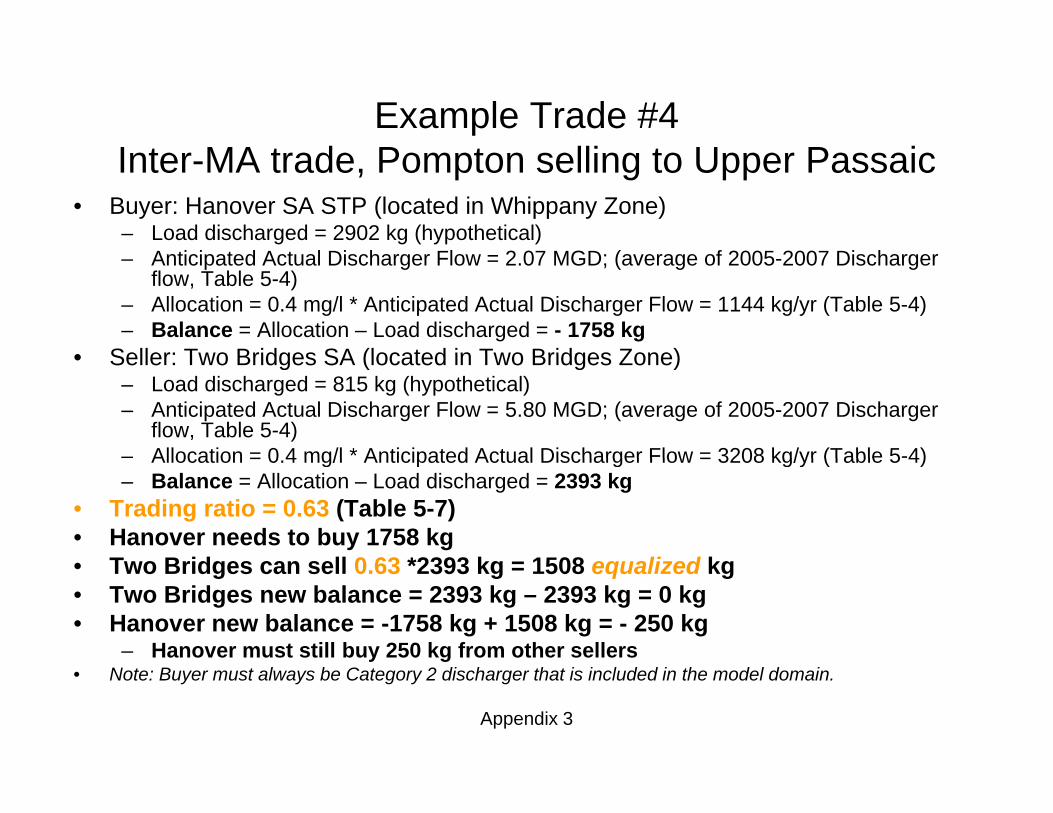
Example Trade #4I t MA t d P t lli t U P iInter-MA trade, Pompton selling to Upper Passaic
• Buyer: Hanover SA STP (located in Whippany Zone)– Load discharged = 2902 kg (hypothetical)
A ti i t d A t l Di h Fl 2 07 MGD ( f 2005 2007 Di h– Anticipated Actual Discharger Flow = 2.07 MGD; (average of 2005-2007 Discharger flow, Table 5-4)
– Allocation = 0.4 mg/l * Anticipated Actual Discharger Flow = 1144 kg/yr (Table 5-4)– Balance = Allocation – Load discharged = - 1758 kg
• Seller: Two Bridges SA (located in Two Bridges Zone)• Seller: Two Bridges SA (located in Two Bridges Zone)– Load discharged = 815 kg (hypothetical)– Anticipated Actual Discharger Flow = 5.80 MGD; (average of 2005-2007 Discharger
flow, Table 5-4)– Allocation = 0 4 mg/l * Anticipated Actual Discharger Flow = 3208 kg/yr (Table 5-4)Allocation = 0.4 mg/l Anticipated Actual Discharger Flow = 3208 kg/yr (Table 5-4)– Balance = Allocation – Load discharged = 2393 kg
• Trading ratio = 0.63 (Table 5-7)• Hanover needs to buy 1758 kg
T B id ll 0 63 *2393 k 1508 li d k• Two Bridges can sell 0.63 *2393 kg = 1508 equalized kg • Two Bridges new balance = 2393 kg – 2393 kg = 0 kg• Hanover new balance = -1758 kg + 1508 kg = - 250 kg
– Hanover must still buy 250 kg from other sellers
Appendix 3
• Note: Buyer must always be Category 2 discharger that is included in the model domain.

Example Trade #5
Inter-MA trade, Upper Passaic selling to Lower Passaic• Buyer: Verona Twp STP (located in Lower Passaic Zone 2)
– Summer discharge = 1554 kg (hypothetical)– Anticipated Actual Discharger Flow = 2.37 MGD; (average of 2005-2007 Discharger
flow, Table 5-4)– Summer Allocation = 0.4 mg/l * Anticipated Actual Discharger Flow = 655 kg/season
(Table 5-4)– Summer Balance = Summer Allocation – load discharged = - 899 kg
• Seller: Parsippany-Troy Hills SA (located in Whippany Zone)– Because buyer is in Lower Passaic MA, Parsippany-Troy Hills needs to make seasonal
trade. It can only use allowances from summer to offset balance of buyer.– Summer discharge = 850 kg (hypothetical)– Anticipated Actual Discharger Flow = 12.57 MGD; (average of 2005-2007 Discharger
flow Table 5-4)flow, Table 5-4)– Summer Allocation = 0.4 mg/l * Anticipated Actual Discharger Flow = 3473 kg/season
(Table 5-4)– Summer Balance = Summer Allocation – load discharged = 2,623 kg
• Trading ratio = 0.39 (Table 5-7)g ( )• Verona needs to buy 899 kg for summer period• Parsippany-Troy Hills can sell 0.39 *2305 kg = 899 equalized kg for summer period• Parsippany-Troy Hills new summer balance = 2623 kg – 2305 kg = 318 kg• Verona new summer balance = -899 kg + 899 kg = 0 kg
Appendix 3
g g g• Note: Buyer must always be Category 2 discharger that is included in the model domain.

Example Trade #6Inter-MA trade, Pompton selling to Lower Passaic
• Buyer: Nabisco Fair Lawn Bakery (located in Lower Passaic Zone 2)– Summer discharge = 604 kg (hypothetical)– Anticipated Actual Discharger Flow = 0.28 MGD; (average of 2005-2007 Discharger
flow, Table 5-4)– Summer Allocation = 0.4 mg/l * Anticipated Actual Discharger Flow = 78 kg/season
(Table 5-4)– Summer Balance = Summer Allocation – load discharged = - 526 kg
• Seller: Pompton Lakes MUA (located in Pompton Headwater Zone)Because buyer is in Lower Passaic MA Pompton Lakes needs to needs to make– Because buyer is in Lower Passaic MA, Pompton Lakes needs to needs to make seasonal trade. It can only use allowances from summer to offset balance of buyer.
– Summer discharge = 55 kg (hypothetical)– Anticipated Actual Discharger Flow = 0.90 MGD; (average of 2005-2007 Discharger
flow, Table 5-4)o , ab e 5 )– Summer Allocation = 0.4 mg/l * Anticipated Actual Discharger Flow = 249 kg/season
(Table 5-4)– Summer Balance = Summer Allocation – load discharged = 194 kg
• Trading ratio = 0.21 (Table 5-7)• Nabisco needs to buy 526 kg for summer period• Pompton Lakes can sell 0.21 *194 kg = 41 equalized kg for summer period• Pompton Lakes new summer balance = 194 kg – 194 kg = 0 kg• Nabisco new summer balance = -526 kg + 41 kg = -485 kg; still needs to buy 485 kg
f th ll f
Appendix 3
from other sellers for summer• Note: Buyer must always be Category 2 discharger that is included in the model domain.

Appendix 4:
Example Derivations of Trading Ratios

Derivation of trading ratios: Example 1intra Upper Passaic MA tradeintra-Upper Passaic MA trade
• Seller: Berkeley Heights (Upper Passaic Zone 1)– ZPC at Dundee Lake = 0.79, no diversion,– ZPC at Dundee Lake = 0.64, diversion– ZPC at Dundee Lake = 0.39, extreme diversion– ZPC at Wanaque South = 0.13, extreme diversion
• Buyer: Rockaway Valley SA (Rockaway Zone)– ZPC at Dundee Lake = 0.63, no diversion– ZPC at Dundee Lake = 0.56, diversion– ZPC at Dundee Lake = 0.29, extreme diversion– ZPC at Wanaque South = 0.10, extreme diversion
• Trading ratio = (Seller ZPC/Buyer ZPC)N di i t di ti 1 25 0 79/0 63– No diversion, trading ratio = 1.25 = 0.79/0.63
– Diversion, trading ratio = 1.14 = 0.64/0.56– Extreme diversion, trading ratio = 1.30 = min (0.39/0.29 , 0.13/0.10)– As in Table 5-7 select 0 90*1 14 as trading ratio = 1 03
Appendix 4
– As in Table 5-7, select 0.90 1.14 as trading ratio = 1.03

Derivation of trading ratios: Example 2intra Pompton MA tradeintra-Pompton MA trade
• Seller: Two Bridges SA (Two Bridges Zone)– ZPC at Dundee Lake = 0.93, no diversion– ZPC at Dundee Lake = 0.47, diversion– ZPC at Wanaque South = 1.00, diversion– ZPC at Dundee Lake = 0.25, extreme diversion– ZPC at Wanaque South = 1 00 extreme diversionZPC at Wanaque South 1.00, extreme diversion
• Buyer: Pompton Lakes MUA (Pompton Headwater Zone)– ZPC at Dundee Lake = 0.92, no diversion– ZPC at Dundee Lake = 0.51, diversion– ZPC at Wanaque South = 0.99, diversion– ZPC at Dundee Lake = 0.20, extreme diversion– ZPC at Wanaque South = 0.95, extreme diversion
• Trading ratio = (Seller ZPC/Buyer ZPC)• Trading ratio = (Seller ZPC/Buyer ZPC)– No diversion, trading ratio = 1.01 = 0.93/0.92– Diversion, trading ratio = 0.92 = min (0.47/0.51 , 1.0/0.99)– Extreme diversion, trading ratio = 1.05 = min (0.25/0.20 , 1.0/0.95)
Appendix 4
– As in Table 5-7, select 0.90*0.92 as trading ratio = 0.83

Derivation of trading ratios: Example 3intra Lower Passaic MA tradeintra-Lower Passaic MA trade
• Seller: Wayne Twp – Mountain View (Lower Passaic Zone 1)– ZPC at Dundee Lake = 0.93, no diversion,– ZPC at Dundee Lake = 0.86, diversion– ZPC at Dundee Lake = 0.62, extreme diversion
• Buyer: Verona Twp (Lower Passaic Zone 2)– ZPC at Dundee Lake = 0.90, no diversion– ZPC at Dundee Lake = 0.89, diversion– ZPC at Dundee Lake = 0.84, extreme diversion
• Trading ratio = (Seller ZPC/Buyer ZPC)– No diversion, trading ratio = 1.03 = (0.93/0.90)– Diversion, trading ratio = 0.97 = (0.86/0.89)
E t di i t di ti 0 74 (0 62/0 84)– Extreme diversion, trading ratio = 0.74 = (0.62/0.84)– As in Table 5-7, select 0.90*0.74 as trading ratio = 0.66
Appendix 4
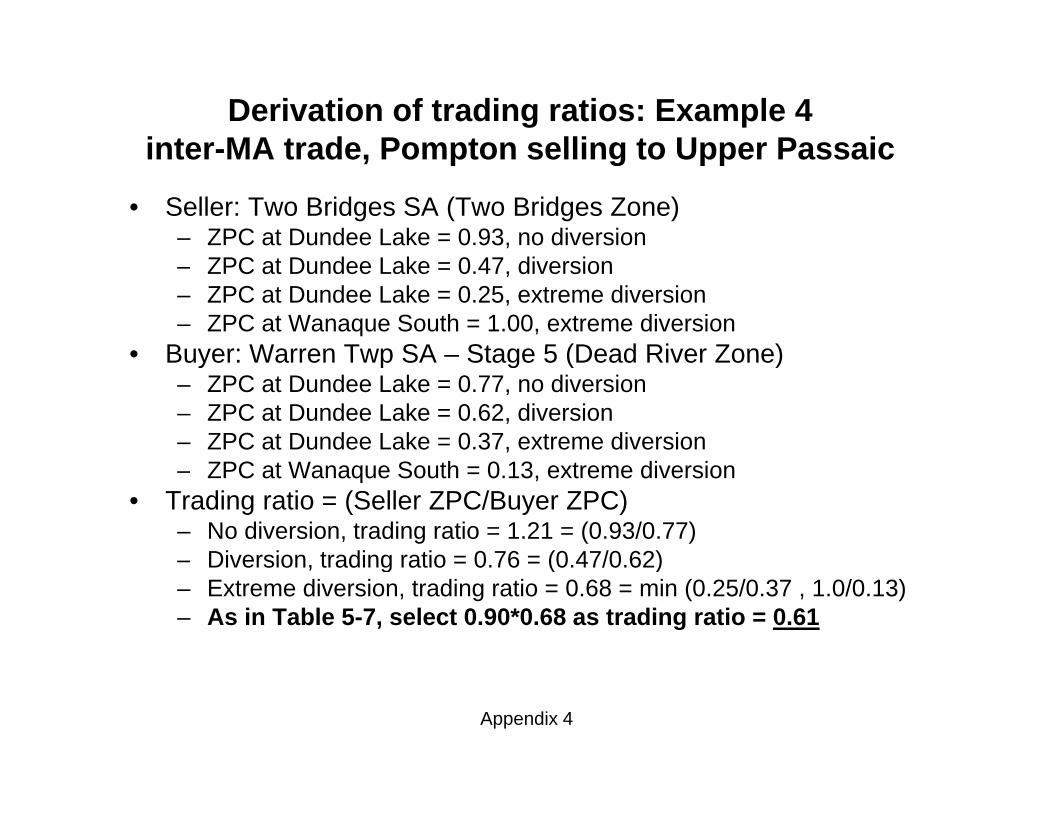
Derivation of trading ratios: Example 4inter-MA trade Pompton selling to Upper Passaicinter-MA trade, Pompton selling to Upper Passaic
• Seller: Two Bridges SA (Two Bridges Zone)– ZPC at Dundee Lake = 0.93, no diversion– ZPC at Dundee Lake = 0.47, diversion– ZPC at Dundee Lake = 0.25, extreme diversion– ZPC at Wanaque South = 1.00, extreme diversion
• Buyer: Warren Twp SA – Stage 5 (Dead River Zone)• Buyer: Warren Twp SA – Stage 5 (Dead River Zone)– ZPC at Dundee Lake = 0.77, no diversion– ZPC at Dundee Lake = 0.62, diversion– ZPC at Dundee Lake = 0.37, extreme diversion– ZPC at Wanaque South = 0.13, extreme diversion
• Trading ratio = (Seller ZPC/Buyer ZPC)– No diversion, trading ratio = 1.21 = (0.93/0.77)– Diversion trading ratio = 0 76 = (0 47/0 62)– Diversion, trading ratio = 0.76 = (0.47/0.62)– Extreme diversion, trading ratio = 0.68 = min (0.25/0.37 , 1.0/0.13)– As in Table 5-7, select 0.90*0.68 as trading ratio = 0.61
Appendix 4
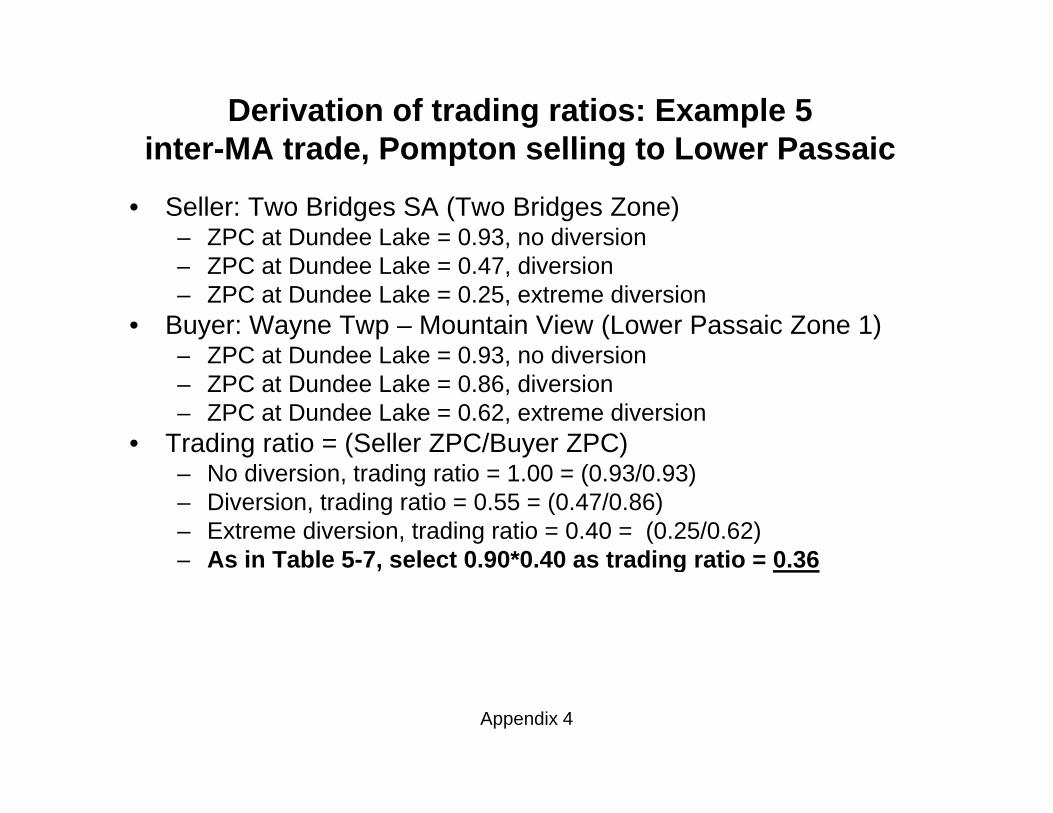
Derivation of trading ratios: Example 5inter-MA trade Pompton selling to Lower Passaicinter-MA trade, Pompton selling to Lower Passaic
• Seller: Two Bridges SA (Two Bridges Zone)– ZPC at Dundee Lake = 0.93, no diversion– ZPC at Dundee Lake = 0.47, diversion– ZPC at Dundee Lake = 0.25, extreme diversion
• Buyer: Wayne Twp – Mountain View (Lower Passaic Zone 1)ZPC at Dundee Lake = 0 93 no diversion– ZPC at Dundee Lake = 0.93, no diversion
– ZPC at Dundee Lake = 0.86, diversion– ZPC at Dundee Lake = 0.62, extreme diversion
• Trading ratio = (Seller ZPC/Buyer ZPC)– No diversion, trading ratio = 1.00 = (0.93/0.93)– Diversion, trading ratio = 0.55 = (0.47/0.86)– Extreme diversion, trading ratio = 0.40 = (0.25/0.62)– As in Table 5-7 select 0 90*0 40 as trading ratio = 0 36– As in Table 5-7, select 0.90 0.40 as trading ratio = 0.36
Appendix 4

Derivation of trading ratios: Example 6inter-MA trade Upper Passaic selling to Lower Passaicinter MA trade, Upper Passaic selling to Lower Passaic
• Seller: Parsippany-Troy Hills SA (Whippany Zone)– ZPC at Dundee Lake = 0.73, no diversion– ZPC at Dundee Lake = 0.64, diversion– ZPC at Dundee Lake = 0.36, extreme diversion
• Buyer: Cedar Grove Twp STP (Lower Passaic Zone 2)ZPC at Dundee Lake = 0 90 no diversion– ZPC at Dundee Lake = 0.90, no diversion
– ZPC at Dundee Lake = 0.89, diversion– ZPC at Dundee Lake = 0.84, extreme diversion
• Trading ratio = (Seller ZPC/Buyer ZPC)– No diversion, trading ratio = 0.81 = (0.73/0.90)– Diversion, trading ratio = 0.72 = (0.64/0.89)– Extreme diversion, trading ratio = 0.43 = (0.36/0.84)– As in Table 5-7 select 0 90*0 43 as trading ratio = 0 39– As in Table 5-7, select 0.90 0.43 as trading ratio = 0.39
Appendix 4

Appendix 5:
Ten Steps to Passaic Trading

Ten Steps to Passaic TradingTen Steps to Passaic Trading1. Are you eligible to participate in the trading program? (Check Table 5-4)
Only Category 2 dischargers that are contained within the model domain are eligible to buy phosphorus allowanceseligible to buy phosphorus allowances.
2. Which management area are you in? Check the Passaic Trading Framework to find out which management areas you can trade with.
3. Which point source zone are you in? If you’re in the Lower Passaic Zone 1 or 2 or trading with either of those zones If you’re in the Lower Passaic Zone 1 or 2, or trading with either of those zones,
then trades are made on a seasonal basis (May-Oct) Otherwise, trades are made on an annual basis (Jan – Dec)
4. What is your allocation? (Check Table 5-4)5 How many kg/yr of TP do you expect to discharge? Is that number greater5. How many kg/yr of TP do you expect to discharge? Is that number greater
or less than your allocation? 6. Who do you want to trade with?7. What is the trading ratio between you and the facility you want to trade
with? (Check Table 5 7)with? (Check Table 5-7)8. Apply the trading ratio (choose the ratio of seller to buyer in Table 5-7) to
convert the actual TP sold into equalized kg bought9. What balance will you have after trading? (Apply the trading formula on
t lid )
Appendix 5
next slide)10. See Examples in Appendix 2

Passaic Trading FormulaPassaic Trading Formula
Balance =Allocation – Load discharged
- Actual load sold + Equalized load purchased
• Equalized load = (Actual load * Trading ratio of seller to buyer)
• Allocations are listed in Table 5-4
• Trading ratios are listed in Table 5-7
• Load discharged determined on an annual basis for dischargers upstream of the Confluence. For dischargers downstream of the C fl d th di h th t d ith l dConfluence and any other dischargers they trade with, load discharged determined on a seasonal basis (May-Oct).
Appendix 5

Appendix 6:
Draft Quality Assurance Project Plan (QAPP)

1
QUALITY ASSURANCE PROJECT PLAN
Water Quality Trading in the Non-Tidal Passaic River Watershed Surface Water Quality Monitoring Program
Rutgers Cooperative Extension Water Resources Program (RCE WRP)
Contract Agreement No. WS972841-04-0 Targeted Watershed Grant
for “Development, Implementation and Evaluation of a Water Quality Trading Program”
January 30, 2008 Revised May 15, 2008
Revised September 15, 2008 Revised July 16, 2009

2
1. Title and Approval Sheet
QUALITY ASSURANCE PROJECT PLAN
Water Quality Trading in the Non-Tidal Passaic River Watershed Surface Water Quality Monitoring Program
RCE WRP Main Point of Contact: Christopher C. Obropta, Ph.D., P.E. Rutgers Cooperative Extension Water Resources Program
14 College Farm Road – 2nd Floor New Brunswick, NJ 08901-8551 732-932-9800 x 6209 (phone); 732-932-8644 (fax) [email protected] ________________________________________ Signature Date
RCE WRP QA Officer: Lisa Galloway Evrard Rutgers Cooperative Extension Water Resources Program
14 College Farm Road – 2nd Floor New Brunswick, NJ 08901-8551 732-932-9800 x 6130 (phone); 732-932-8644 (fax) [email protected] ________________________________________ Signature Date

3
USEPA Region 2 Main Point of Contact: Cyndy S. Kopitsky
US EPA Region 2 290 Broadway, 24th floor New York, NY 10007 212-637-3832 (NY) (phone) 212-637-3730 (NY) (phone) 609-485-8276 (NJ) (phone) 212-637-3889 (fax) [email protected]
___________________________________________ Signature Date
NJDEP Main Point of Contact: Barbara Hirst Chief, Bureau of Environmental Analysis & Restoration
Division of Watershed Management New Jersey Department of Environmental Protection 401 East State Street P.O. Box 418 Trenton, New Jersey 08625-0418 609-633-1441(phone); 609-777-1282 (fax) [email protected] ___________________________________________ Signature Date
NJDEP Office of Quality Assurance: Marc Ferko, Research Scientist
Office of Quality Assurance New Jersey Department of Environmental Protection 401 East State Street P.O. Box 424 Trenton, NJ 08625-0418 609-292-3950 (phone); 609-777-1774 (fax) [email protected] ___________________________________________ Signature Date
4
2. Table of Contents 1. Title & Approval Sheet ……………………………………………………………………..2 2. Table of Contents ……………………………………………………………………………..4 3. Distribution List ……………………………………………………………………………..5 4. Project/Task Organization ……………………………………………………………..6 5. Special Training Needs/Certifications ……………………………………………………..8 6. Problem Definition/Background ……………………………………………………………..8 7. Project/Task Description ……………………………………………………………………11 8. Quality Objectives and Criteria for Measurement Data ……………………………………13 9. Non-direct Measurements (Secondary Data) ……………………………………………15 10. Field Monitoring Requirements ……………………………………………………………15 11. Analytical Requirements ……………………………………………………………………16 12. Sample Handling and Custody Requirements ……………………………………………16 13. Testing, Inspection, Maintenance and Calibration ……………………………………17 14. Data Management ……………………………………………………………………………17 15. Assessments/Oversight ……………………………………………………………………17 16. Data Review, Verification, Validation, and Usability ……………………………………18 17. Reports to Management, Documentation, Records ……………………………………18 Attachment A: Proposed Monitoring Locations ……………………………………19 Attachment B: Table 1B – List of Approved Inorganic Test Procedures, 40 CFR Part
136.3, July 1, 2008……………………………………………………….24 Attachment C: Table II - Required Containers, Preservation Techniques, and Holding
Times, 40 CFR Part 136.3, July 1, 2008 ……………………………31 Attachment D: Sample Chain of Custody Form ……………………………………37 Attachment E: Table of Parameter Detection Limits, Accuracy,
and Precision ……………………………………………………………39

5
3. Distribution List RCE WRP Main Point of Contact: Christopher C. Obropta, Ph.D., P.E. Rutgers Cooperative Extension Water Resources Program
14 College Farm Road – 2nd Floor New Brunswick, NJ 08901-8551 732-932-9800 x 6209 (phone); 732-932-8644 (fax) [email protected]
RCE WRP QA Officer: Lisa Galloway Evrard
Rutgers Cooperative Extension Water Resources Program 14 College Farm Road – 2nd Floor New Brunswick, NJ 08901-8551 732-932-9800 x 6130 (phone); 732-932-8644 (fax) [email protected]
USEPA Region 2 Main Point of Contact: Cyndy S. Kopitsky
US EPA Region 2 290 Broadway, 24th floor New York, NY 10007 212-637-3832 (NY) (phone); 212-637-3730 (NY) (phone) 609-485-8276 (NJ) (phone); 212-637-3771 (fax) [email protected]
USEPA Region 2 Kathryn Seaver, Physical Scientist USEPA Region 2 2890 Woodbridge Avenue Edison, NJ 08837 732-906-6800 (phone); 732-321-6616 (fax) [email protected] NJDEP Main Point of Contact: Barbara Hirst Chief, Bureau of Environmental Analysis & Restoration
Division of Watershed Management New Jersey Department of Environmental Protection 401 East State Street P.O. Box 418 Trenton, New Jersey 08625-0418 609-633-1441(phone); 609-777-1282 (fax) [email protected]
NJDEP Office of Quality Assurance: Marc Ferko, Research Scientist
Office of Quality Assurance New Jersey Department of Environmental Protection 401 East State Street P.O. Box 424 Trenton, NJ 08625-0418 609-292-3950 (phone); 609-777-1774 (fax) [email protected]

6
4. Project/Task Organization
Project Organization and Responsibility: Laboratory Operations: (Laboratory Representative) Allen Thomas (NJ Analytical Laboratory)
(NJDEP Representative) Marc Ferko (NJDEP Office of Quality Assurance)
Sampling Operations: (RCE WRP Representative) Lisa Galloway Evrard (RCE WRP) (NJDEP Representative) Marc Ferko (NJDEP Office of Quality Assurance) Data Processing/ Data Quality Review: (RCE WRP Representative) Lisa Galloway Evrard (RCE WRP) (NJDEP Representative) Barbara Hirst (NJDEP Bureau of Environmental Analysis & Restoration) Overall QA: (RCE WRP Representative) Lisa Galloway Evrard (RCE WRP)
(USEPA Region 2 Main Point of Contact) Cyndy Kopitsky (USEPA Region 2) (NJDEP Representative) Barbara Hirst (NJDEP Bureau of Environmental Analysis & Restoration )
Overall Coordination: (RCE WRP Main Point of Contact) Christopher C. Obropta (RCE WRP)

7
Organizational Chart:
Overall Coordination
Christopher C. Obropta (RCE WRP)
Overall QA
Lisa Galloway Evrard (RCE WRP)
Overall QA USEPA Region 2
Main Point of Contact Cyndy Kopitsky
Data Processing/ Data Quality Review Lisa Galloway Evrard
(RCE WRP)
Data Processing/ Data Quality Review
NJDEP Representative ~ Barbara Hirst (NJDEP Bureau of Environmental Analysis & Restoration)
Sampling Operations Lisa Galloway Evrard
(RCE WRP)
Sampling Operations/ Laboratory Operations
NJDEP Representative ~ Marc Ferko (NJDEP Office of Quality Assurance)
Laboratory Operations Laboratory Manager
Allen Thomas (NJ Analytical Laboratory)
Overall QA NJDEP Main Point of Contact
Barbara Hirst (NJDEP Bureau of Environmental Analysis &
Restoration)

8
5. Special Training Needs/Certification Special certification requirements are not needed by any project personnel for field activities pertaining to this monitoring program. Field personnel will be trained annually in the collection of surface water quality samples in accordance with the NJDEP Field Procedures Manual (Go to http://www.state.nj.us/dep/srp/guidance/fspm/) by the Sampling Operations RCE WRP Representative. Sample analysis will be done by the NJDEP certified laboratory, New Jersey Analytical Laboratories. Laboratory certification is documented and assured by the NJDEP Office of Quality Assurance under NJAC 7:18 Regulations Governing the Certification of Laboratories and Environmental Measurements. 6. Problem Definition/Background
Background: The non-tidal portion of the Passaic River Watershed encompasses 803 square miles, with 669 square miles of the watershed in New Jersey. About 25% of New Jersey’s population (i.e., 2 million people) lives in this watershed. Three of New Jersey’s twenty watershed management areas (WMAs 3, 4, and 6) overlap with the Non-Tidal Passaic River Watershed. The New Jersey Department of Environmental Protection (NJDEP) proposed on May 7, 2007 and adopted on April 24, 2008 a total maximum daily load (TMDL) report to address phosphorus impairments in the Non-Tidal Passaic River Watershed. Excess phosphorus can cause algal blooms, reduced dissolved oxygen, and eutrophication of water bodies, which can result in fish kills and drinking water supply taste and odor problems. The surface water quality criteria for total phosphorus, as reported in NJAC 7:9B 1.14(d) – General Surface Water Quality Criteria, are as follows:
5. Phosphorus, Total (mg/L)
i. Lakes: Phosphorus as total P shall not exceed 0.05 in any lake, pond or reservoir, or in a tributary at the point where it enters such bodies of water, except where watershed or site-specific criteria are developed pursuant to N.J.A.C. 7:9B-1.5(g)3.
FW2
ii. Streams: Except as necessary to satisfy the more stringent criteria in paragraph i above or where watershed or site-specific criteria are developed pursuant to N.J.A.C 7:9B-1.5(g)3, phosphorus as total P shall not exceed 0.1 in any stream, unless it can be demonstrated that total P is not a limiting nutrient and will not otherwise render the waters unsuitable for the designated uses.
FW2
The following figure outlines phosphorus impaired streams and total phosphorus loading from wastewater treatment plants (WWTP) within the Non-Tidal Passaic River Watershed. The TMDL aims to achieve seasonal chlorophyll-a criteria in the Wanaque Reservoir (i.e., 10 μg/l for June 15-September 1) and Dundee Lake (i.e., 20 μg/l for June 15-September 1) through reduced phosphorus loading from point and nonpoint sources within the watershed.
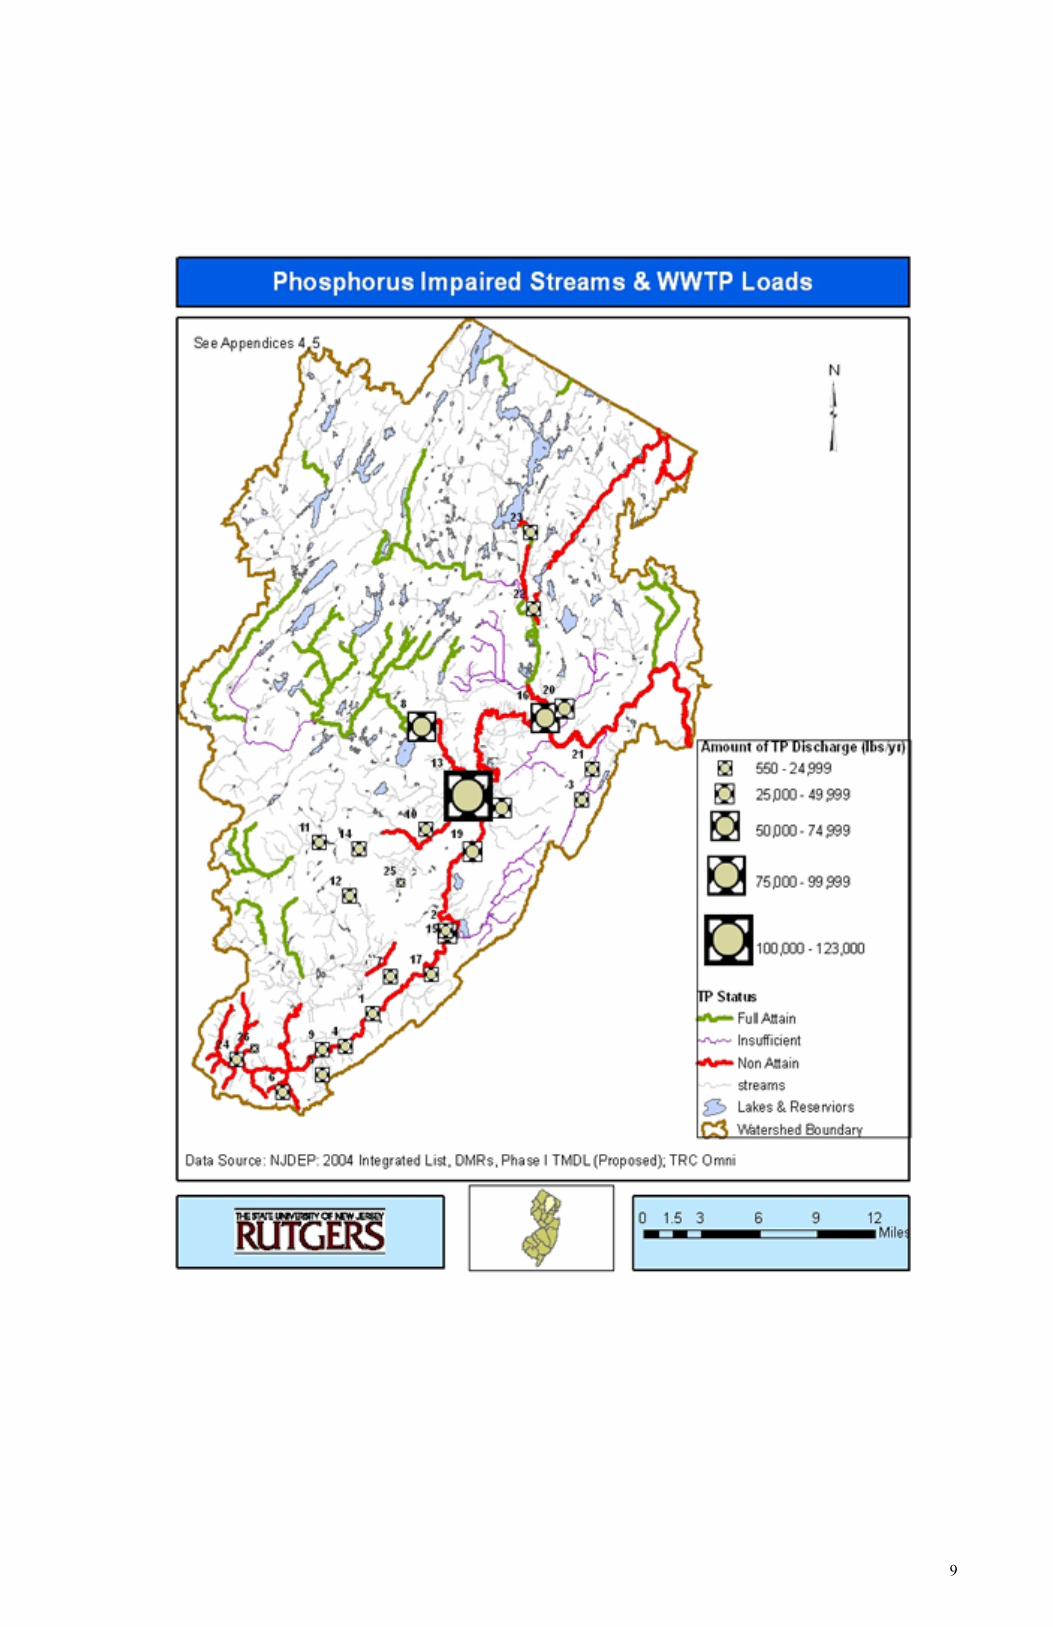
9

10
Most of the 22 sewage treatment plants in the Non-Tidal Passaic River Watershed will need to invest heavily on upgraded equipment to comply with the proposed phosphorus wasteload allocations. A trading program has been proposed as a cost effective alternative to meeting the phosphorus effluent standard. In 2005, the EPA awarded a Targeted Watershed Grant to fund the development of the trading program. An active coalition of point sources, the NJDEP, and a team of experts from Rutgers and Cornell Universities have been assembled to complete this endeavor. The project design, implementation and evaluation will extend from 2005-2010. The trading program will focus on both point-point and point-nonpoint trading opportunities. Potential participants include sewage treatment plants and municipal stormwater sources. This trading program will provide a cost-effective way to implement the TMDL.
The following is taken from the April 24, 2008 adopted TMDL report, which is available at http://www.nj.gov/dep/watershedmgt/DOCS/TMDL/passaic_tmdl.pdf :
Dischargers will be allowed to engage in water quality trading negotiations to effect a change in effluent limits, with Department approval. It should be note that, in June 2005 EPA awarded a Targeted Watershed grant in the amount of $900,000 to Rutgers University for the purpose of developing a water quality trading pilot with respect to the phosphorus impairment in the Passaic River basin. This project has been investigating the options for and overall viability of a trading approach in the Passaic River basin. This project will produce a set of tools and rules that will govern allowable trades within the study area. These will include trading ratios and management zones within which trades can occur and still achieve the TMDL outcomes at the critical locations. Once the proposed tools and rules are developed, they will be subject to public comment. Following this process, as well as Department and EPA approval of the protocols, interested permittees can proceed to negotiate trades that achieve the desired result in a more cost effective way. For example, it may be more cost effective for a few larger facilities to upgrade to a higher level than for all treatment facilities to upgrade to the same level. Because diversion of Pompton and Passaic River water into the Wanaque Reservoir is a loading source, another option in the portion of the watershed above the confluence of the Pompton and Passaic Rivers is to trade wastewater treatment plant upgrades for treatment of river water by NJDWSC prior to diversion to the reservoir. The Department anticipates allowing 1 year from the date of permit issuance, provided the terms of acceptable trades have been subject to public comment and approved by EPA and the Department, to negotiate trades so that treatment plant upgrades consistent with permit limits are implemented within the compliance schedules that will be set forth in the permits.
Purpose: This surface water quality monitoring program has been initiated by the Rutgers Cooperative Extension Water Resources Program (RCE WRP) to provide baseline monitoring of conditions before trading takes place, as well as monitoring of conditions after trading occurs. The data will simply be used to compare the pre-trade levels of the chemical parameter of concern (i.e., phosphorus) with the post-trade levels. This is not a research project; this is a monitoring program. Baseline monitoring would add to the TMDL study dataset collected in 2003 and would provide an updated description of conditions in the watershed prior to trading. (The TMDL study dataset collected in 2003 can be found at http://www.nj.gov/dep/watershedmgt/tmdl.htm under “Additional Resources” for “Total
11
Maximum Daily Load Report for the Non-Tidal Passaic River Basin Addressing Phosphorus Impairments.”) By collecting more data now before trading starts, a better evaluation can be made in the future after trading starts regarding the impacts of trading on water quality.
In addition, as stated previously, in 2005 the EPA awarded a Targeted Watershed Grant to fund the development of the trading program. Preparation/development of a monitoring program is a condition of the Targeted Watershed Grant funding. Usage: These data will be used by the NJDEP Bureau of Analysis and Restoration to compare instream phosphorus levels pre-trade and post-trade as part of the ongoing development and implementation of a water quality trading program for the Non-Tidal Passaic River Watershed. 7. Project/Task Description Monitoring Network Design and Rationale Sampling Locations: The sampling locations are shown on Map 1 and Map 2 of Attachment A. Table 1 of Attachment A describes the TMDL endpoints and areas of concern, six sampling locations in total, which should be monitored before and after trading takes place. Table 2 of Attachment A describes all the dischargers that would be eligible buyers. Monitoring will be done directly downstream of any of these dischargers that choose to buy credits, both before and after trading takes place. A WAAS-enabled Garmin Rino 120 GPS (global positioning system) unit will be used to locate and identify the sampling locations. Sampling locations will be marked with surveying flags. Field personnel will take GPS readings in the field to aid in verifying the correct sampling locations during the first sampling event. Basis for Sampling Locations: Surface water quality sampling will be conducted to assess the concentration of phosphorus in the Non-Tidal Passaic River Watershed at key locations (i.e., at TMDL endpoints, areas of concern, and at trading locations), as well as the movement of phosphorus, to document improvements in water quality due to trading.
Temporal and Spatial Aspects of Sampling: Surface water quality samples will be collected from all sampling locations in a downstream to upstream order to avoid disturbances to downstream water column samples twice per month, independent of weather, for six months prior to trading (i.e., pre-trade sampling preferably during the months of May - October) and six months after trading (i.e., post-trade sampling preferably during the months of May - October).

12
All scheduling is subject to the natural occurrence of appropriate stream flow conditions (i.e., non-flooding conditions). In accordance with the NJDEP Field Sampling Procedures Manual (Go to http://www.state.nj.us/dep/srp/guidance/fspm/ , see Section 6.8.1.1, Chapter 6D – page 59 of 188), field personnel will not wade into flowing water when the product of depth (in feet) and velocity (in feet per second) equals ten or greater to ensure the health and safety of all field personnel. If the stream flow conditions preclude entry into the stream, samples will be collected from the closest bridge crossing to that location or from the stream bank. For the most part, the waterways within the Non-Tidal Passaic River Watershed are uniformly mixed which warrants grab sampling (Go to http://www.state.nj.us/dep/srp/guidance/fspm/, see Section 6.8.2.2.3, Chapter 6D-Page 66 of 188 of the Field Sampling Procedures Manual). A single grab sample will be collected at all locations where the stream width is six feet or less. At stream locations with a width greater than six feet, a minimum of three subsurface grab samples (i.e., quarter points) will be collected at equidistant points across the stream. The number of individual samples in a composite varies with the width of the stream being sampled. Horizontal intervals will be at least one foot wide (Go to http://www.state.nj.us/dep/srp/guidance/fspm/, see Section 6.8.2.2.2, Chapter 6D – Page 64 of 188 of the Field Sampling Procedures Manual). These grab samples then will be composited in a larger volume container from which the desired volume will be transferred to the sample bottles. A dedicated large volume container will be assigned to each sample location. Field equipment used for surface water quality sample collection (i.e., bottles and buckets) will be decontaminated/cleaned in the laboratory prior to each sampling event. A dedicated large volume container will be assigned to each sample location. Prior to each sampling event, the large volume containers will be decontaminated in the laboratory using the following procedures in accordance with the Field Sampling Procedures Manual (Go to http://www.state.nj.us/dep/srp/guidance/fspm/, see Chapter 2A – Page 10 of 61): 1) laboratory grade glassware detergent plus tap water wash, 2) generous tap water rinse, 3) distilled/deionized water rinse, 4) 10% nitric acid rinse, 5) distilled/deionized water rinse. Note that the samples collected will not be analyzed for metals or organics. Also, field equipment decontamination water will be disposed of in accordance with the laboratory’s Standard Operating Procedures and Quality Assurance Manual. Monitoring Parameters Surface water quality sample collection will be conducted by the RCE WRP. Collected samples will be analyzed for total phosphorus and dissolved orthophosphate phosphorus by New Jersey Analytical Laboratories (NJDEP Certified Laboratory #11005).

13
Schedule*
Task Date
Submit QAPP January 2008
Conduct monthly surface water sampling
Six months before trading takes place (12 events, preferably during the months of May - October)
Six months after trading takes place (12 events, preferably during the months of May - October)
Submit data and summary report to NJDEP and USEPA Region 2
Within three months of conclusion of pre-trade surface water sampling (interim report – includes pre-trade data)
Within three months of conclusion of post-trade surface water sampling (final report – includes an analysis of pre-trade vs. post-trade data)
* All scheduling is subject to the natural occurrence of appropriate stream flow conditions (i.e., non-flooding conditions).
8. Quality Objectives and Criteria for Measurement Data ~ precision, bias, representativeness, comparability, completeness and sensitivity The data collected in accordance with this QAPP will help describe surface water quality conditions within the Non-Tidal Passaic River Watershed before and after trading. The data will help to verify if the trading is actually working to reduce in-stream phosphorus levels. A table of parameter detection limits, quantitation limits, accuracy, and precision applicable to this monitoring program, and which helps to ensure that the measured data is acceptable for use in comparing water quality conditions within the watershed before and after trading, is provided in Attachment E. Data validation (i.e., the determination of any bias in the data) will be performed by New Jersey Analytical Laboratories. Any irregularities noted will be reported via quality control summaries to the RCE WRP and shall include the following: Method Blank: The method blank cannot show the presence of the parameter of interest above the reported detection limit. Analysis of the batch should not continue until the source of the problem has been corrected.

14
Laboratory Fortified Blank (LFB): Where appropriate, the LFB must fall within the QC control limits. If the LFB is outside the limits, the following corrective actions should be taken:
Check data and recovery calculations Check reference QC standard Reanalyze sample batch
QC Matrix Spike: The matrix spike should fall within the QC limits established for each methodology. The corrective actions should be as follows:
Check data and recovery calculations Check whether LFB and reference standard are acceptable If only the matrix spike is not within control limits, check other analytes present for
possible sample matrix interference as detailed in the specific method. If the sample matrix is identified as the problem, this may be footnoted. If the matrix spike is consistently outside for a particular parameter, another methodology may have to be considered for sample analysis.
Check reference QC standard, if one was performed in that batch. If the matrix spike is not within control limits, check for presence of that analyte at a high
value, which may be greater than the spike amount, causing invalid spike recovery. Precision: Precision of method is evaluated by control charts, continuously maintained and updated at quarterly intervals. Matrix Spike Duplicates (MSD) must have a relative percent difference (RPD) equal to or lower than the calculated maximum RPD. If reproducibility cannot be achieved and sample matrix interferences are not apparent, batch reanalysis should occur. Calculations, dilutions, etc. should be checked prior to reanalysis. Accuracy:
Initial and continuing calibrations must be within acceptance criteria. LFB acceptance by control limits shall be continuously maintained and updated. LFB
result must fall within control limits. Recovery control charts must be continuously maintained and updated. All parameters
will have upper and lower warning limits (UWL/LWL) set at two standard deviation (SD) units, and upper and lower control limits (UCL/LCL) set at three SD units. Matrix spikes must fall within control limits unless sample value (raw) is four or more times concentrations of spike level.
Representativeness: See Section 7. Project/Task Description, Monitoring Network Design and Rationale. Surface water quality sampling will be conducted to assess the concentration of phosphorus in the Non-Tidal Passaic River Watershed at key locations (i.e., at TMDL endpoints, areas of concern, and at trading locations), as well as to assess the movement of phosphorus, to document improvements in water quality due to trading. Comparability: Sample collection and handling methods, as well as sample preparation and analytical procedures will remain consistent from pre-trade monitoring to post-trade monitoring. Any deviations will be noted in the interim and final reports.
15
Completeness: This monitoring program proposes 12 pre-trade sampling events and 12 post-trade sampling events. It is very difficult to prepare a definite schedule at this point due to the uncertain initiation of trades. Additional sampling events may be required to address seasonal variation in surface water quality under the pre and post trade scenarios. Additional sampling events will provide a more statistically robust and complete data set for comparing the pre and post trade condition. Sensitivity: As previously noted, a table of parameter detection limits, quantitation limits, accuracy, and precision applicable to this monitoring program, and which help to ensure that the measured data is acceptable for use in comparing water quality conditions within the watershed before and after trading, are provided in Attachment E. These tables also contain project detection limits which are sensitive enough to reflect exceedances of the surface water quality criteria for total phosphorus.
9. Non-direct Measurements (Secondary Data) Flow at the closest USGS gaging station (i.e., Station #01379500) will be recorded for each sampling event. The RCE WRP acknowledges that recent stream discharge data provided by the USGS is provisional data subject to revision. Stream discharge data will not be used until it is approved for publication. Information concerning the accuracy and appropriate uses of these data will be obtained from the station manager, whose name is shown on the single station data summary pages, or from the USGS surface-water specialist in USA care of the webmaster email alias NWISWeb Support Team. 10. Field Monitoring Requirements
10.1 Monitoring Process Design See Section 7.0 above, especially Monitoring Network Design and Rationale.
10.2 Monitoring Methods All sampling procedures will be in conformance with the NJDEP 2005 Field Sampling
Procedures Manual (Go to http://www.state.nj.us/dep/srp/guidance/fspm/). Field equipment used for surface water quality sample collection (i.e., bottles and buckets) will be decontaminated/cleaned in the laboratory prior to each sampling event. A dedicated large volume container will be assigned to each sample location. Prior to each sampling event, the large volume containers will be decontaminated in the laboratory using the following procedures in accordance with the Field Sampling Procedures Manual (Go to http://www.state.nj.us/dep/srp/guidance/fspm/, see Chapter 2A – Page 10 of 61): 1) laboratory grade glassware detergent plus tap water wash, 2) generous tap water rinse, 3) distilled/deionized water rinse, 4) 10% nitric acid rinse, 5) distilled/deionized water rinse. Note that the samples collected will not be analyzed for metals or organics. Also, field equipment decontamination water will be disposed of in accordance with the laboratory’s Standard Operating Procedures and Quality Assurance Manual.
16
Manual composite sampling for wider portions of the streams will be conducted in
accordance with the methods outlined in section 6.8.2.2.2 of the Field Sampling Procedures Manual (Go to http://www.state.nj.us/dep/srp/guidance/fspm/, see Chapter 6D – page 64 of 188).
Grab sampling where the natural stream conditions make compositing unnecessary will
be conducted in accordance with the methods outlined in section 6.8.2.2.3 of the Field Sampling Procedures Manual (Go to http://www.state.nj.us/dep/srp/guidance/fspm/, see Chapter 6D – page 66 of 188).
10.3 Field QC Activities To address quality control in field sampling operations, a field blank and duplicate sample will be collected. The field blank will be analyzed to assess contamination that could occur during the sampling event. The quality indicator for the duplicate sample is 10%; if the concentration difference of any of the targeted analytes in the duplicate sample is greater than ±10% of the reported value of the original sample, then the data will be discarded, and the sampling procedure will be reevaluated to provide more representative samples.
11. Analytical Requirements
11.1 Analytical Method Requirements Measurements of the sampled parameters will be performed in accordance with the methodologies identified in Table 1B – List of Approved Inorganic Test Procedures (40 CFR Part 136.3) of Attachment B. Sample containers, preservation techniques, and holding times will be in accordance with procedures/methods identified in Table II (40 CFR Part 136.3) of Attachment C. New Jersey Analytical Laboratories will provide appropriate containers for all analyses. Any deviations from the test procedures and/or preservation methods and holding times will be reported to the NJDEP Office of Quality Assurance and will be noted in the final report from the laboratory.
11.2 Laboratory QC Checks NJAC 7:18 Regulations Governing the Certification of Laboratories and Environmental Measurements (i.e., 7:18-5.5 ~ Subchapter 5 Chemical Testing Requirements for quality assurance/quality control program) will be followed for all quality assurance and quality control (QA/QC) practices, including detection limits, quantitation limits, precision, and accuracy. A table of parameter detection limits, quantitation limits, accuracy, and precision applicable to this monitoring program is provided in Attachment E. New Jersey Analytical Laboratories, in cooperation with the NJDEP Office of Quality Assurance, will perform all required laboratory QC checks.
12. Sample Handling and Custody Requirements Sample containers, preservation techniques, and holding times will be in accordance with the procedures/methods identified in Table II (40 CFR Part 136.3) of Attachment C. New Jersey

17
Analytical Laboratories will provide appropriate containers for all analyses. Samples will be stored on ice in coolers provided by New Jersey Analytical Laboratories. Any deviations from the preservation methods and holding times will be reported to the QA Officer and will be noted in the final report from the laboratory. Chain of Custody procedures will be followed for all samples collected for this monitoring program. A sample chain of custody form is provided in Attachment D. A sample is in someone's "custody" if 1) it is in one's actual physical possession, 2) it is in one's view, after being in one's physical possession, 3) it is in one's physical possession and then locked up so that no one can tamper with it, and 4) it is kept in a secured area, restricted to authorized personnel only. The samples collected will be recorded and documented on a chain of custody by the sampler and transported to the analytical laboratory. Upon arrival at the analytical laboratory, the samples will be signed for by laboratory personnel and logged in to the laboratory’s sample storage facilities for analysis in accordance with the laboratory’s standard operating procedures and QA/QC manual which are approved by the NJDEP Office of Quality Assurance under NJAC 7:18 Regulations Governing the Certification of Laboratories and Environmental Measurements (i.e., 7:18-5.5 ~ Subchapter 5 Chemical Testing Requirements for quality assurance/quality control program and 7:18 ~ Subchapter 9 Sample Requirements).
13. Testing, Inspection, Maintenance and Calibration Calibration and preventative maintenance of laboratory equipment will be in accordance with the laboratory’s standard operating procedures and QA/QC manual which are approved by the NJDEP Office of Quality Assurance under NJAC 7:18 Regulations Governing the Certification of Laboratories and Environmental Measurements (i.e., 7:18-5.5 ~ Subchapter 5 Chemical Testing Requirements for quality assurance/quality control program). . 14. Data Management The RCE WRP, for a minimum of five years, will keep all laboratory reports, quality control summaries, and chain of custody forms on file in both hard and digital format, and all applicable data will be included in the interim and summary reports to NJDEP and USEPA Region 2. An electronic version of all interim and summary reports will be provided electronically on a CD. 15. Assessments/Oversites Performance and Systems Audits: All NJDEP certified laboratories participate annually in a NJDEP mandated Performance Testing program. The NJDEP Office of Quality Assurance conducts a performance audit of each laboratory that is certified. The NJDEP Office of Quality Assurance also periodically conducts on-site technical systems audits of each certified laboratory. The findings of these audits, together with the NJDEP mandated Performance Testing program, are used to update each laboratory's certification status. The NJDEP Office of Quality Assurance periodically conducts

18
field audits of project sampling operations. The Office of Quality Assurance will be contacted during the project to schedule a field audit at their convenience. Corrective Action: All NJDEP certified laboratories must have a written corrective action procedure which they adhere to in the event that calibration standards, performance evaluation results, blanks, duplicates, spikes, etc. are out of the acceptable range or control limits. If the acceptable results cannot be obtained for the above-mentioned QA/QC samples during any given day, sample analysis must be repeated for that day with the acceptable QA/QC results. The QA Officer. will be notified if there are any deviations from the approved work plan. All signatories of this QAPP will be notified when deviations to the QAPP are made prior to their implementation. 16. Data Review, Verification, Validation, and Usability
16.1 Data Review, Validation and Verification Tables of parameter detection limits, quantitation limits, accuracy, and precision applicable to this study are provided in Attachment E. Quality objectives and criteria for measurement data are described in Section 8 of this QAPP.
16.2 Reconciliation with User Requirements Validation of the data produced by this monitoring program will be conducted by New Jersey Analytical Laboratories in cooperation with the NJDEP Office of Quality Assurance and the RCE WRP QA Officer. The QA Officer will receive notification of any deficiencies noted during sample collection or at the laboratory in regard to detection limits, quantitation limits, precision, and accuracy. The QA Officer will inspect the raw data. This inspection will include an assessment of the field blank and duplicate samples to determine the error associated with the sampling procedure. Any errors found in the sampling or laboratory procedures will be noted and reported to the monitoring program personnel, and corrected as soon as possible.
17. Reports to Management, Documentation, Records An interim and summary report will be submitted to the NJDEP Bureau of Analysis and Restoration by the Project Officer, Christopher C. Obropta, and will include at a minimum an Introduction, Purpose and Scope, Results and Discussion, Conclusions and Recommendations, and an appendix with data tables. These reports will also be submitted to Cyndy Kopitsky, the USEPA Region 2 Main Point of Contact for this monitoring program. An electronic version of all reports and data will be provided on a CD. The interim and summary report, along with all supporting data and records, will be maintained by the QA Officer, Lisa Galloway Evrard, at the offices of the RCE WRP.

19
ATTACHMENT A
Proposed Monitoring Locations Non-Tidal Passaic River Watershed

20

21
Map 1 shows the TMDL endpoints (NJDEP, 2007) and areas of concern (Omni Environmental, 2007). Monitoring should be done at these locations before and after trading takes place.
Table 1: Key for Map 1
Name / Location ID no. on map Class Dundee Lake / Passaic River at
Dundee Dam 1 TMDL endpoint
Wanaque South intake / on Pompton River just upstream of confluence
with Passaic River 2 TMDL endpoint
Passaic River near Chatham / USGS gage 01379500
3 Area of Concern
Passaic River at Two Bridges / just upstream of confluence with Pompton
River 4 Area of Concern*
Passaic River at Little Falls intake 5 Area of Concern Peckman River mouth 6 Area of Concern
* This location is not listed as an “area of concern” in the Omni Environmental (2007) report,
however its proximity to the Wanaque South intake merit its inclusion in monitoring. References: New Jersey Department of Environmental Protection (NJDEP) 2007. Total Maximum Daily
Load Report for the Non-Tidal Passaic River Basin Addressing Phosphorus Impairments – PROPOSED. Division of Watershed Management, Trenton, New Jersey.
Omni Environmental Corporation, 2007. The Non-Tidal Passaic River Basin Nutrient TMDL
Study Phase II Watershed Model and TMDL Calculations: Final Report. Princeton, New Jersey

22

23
Map 2 shows the eligible buyers in the trading program. Monitoring should be done directly downstream of any of these dischargers that choose to buy credits, before and after trading takes place.
Table 2: Key for Map 2. All dischargers shown are Category 2 (i.e., eligible buyers).
Discharger ID no.
Name
1 Berkeley Heights 2 Molitor Water Pollution 3 Verona Twp STP # 4 Warren Twp SA - Stage 1 & 2 5 Warren Twp SA - Stage 4 6 Warren Twp SA - Stage 5 8 Rockaway Valley SA 9 Long Hill Twp STP - Stirling Hills 10 Hanover SA STP 11 Morris Twp - Butterworth 13 Parsippany-Troy Hills SA 14 Morristown Town STP 15 Florham Park SA 16 Two Bridges SA 17 Chatham Township - Chatham Glen 18 Caldwell Boro STP 19 Livingston Twp 20 Wayne Twp - Mountain View # 21 Cedar Grove Twp STP # 22 Pompton Lakes MUA 23 Wanaque Valley RSA 24 Harrison Brook STP
25 Exxon Research & Engineering Company
26 Veterans Adm Medical Center 42 Chatham Hill STP 43 New Providence Boro 44 NJDHS - Greystone Psych Hosp 45 Bayer Corporation # 46 Nabisco Fair Lawn Bakery # 47 Plains Plaza Shopping Center 48 Ramapo River Club STP - Oakland Twp Riverbend 49 Oakland Boro - Oakwood Knolls 50 Ramapo BOE - Indian High 51 Oakland Boro Skyview-Highbrook STP 52 Oakland Boro - Chapel Hill Estates

24
ATTACHMENT B
Table 1B – List of Approved Inorganic Test Procedures 40 CFR Part 136.3
July 1, 2008
Available at: http://edocket.access.gpo.gov/cfr_2008/julqtr/pdf/40cfr136.3.pdf

25
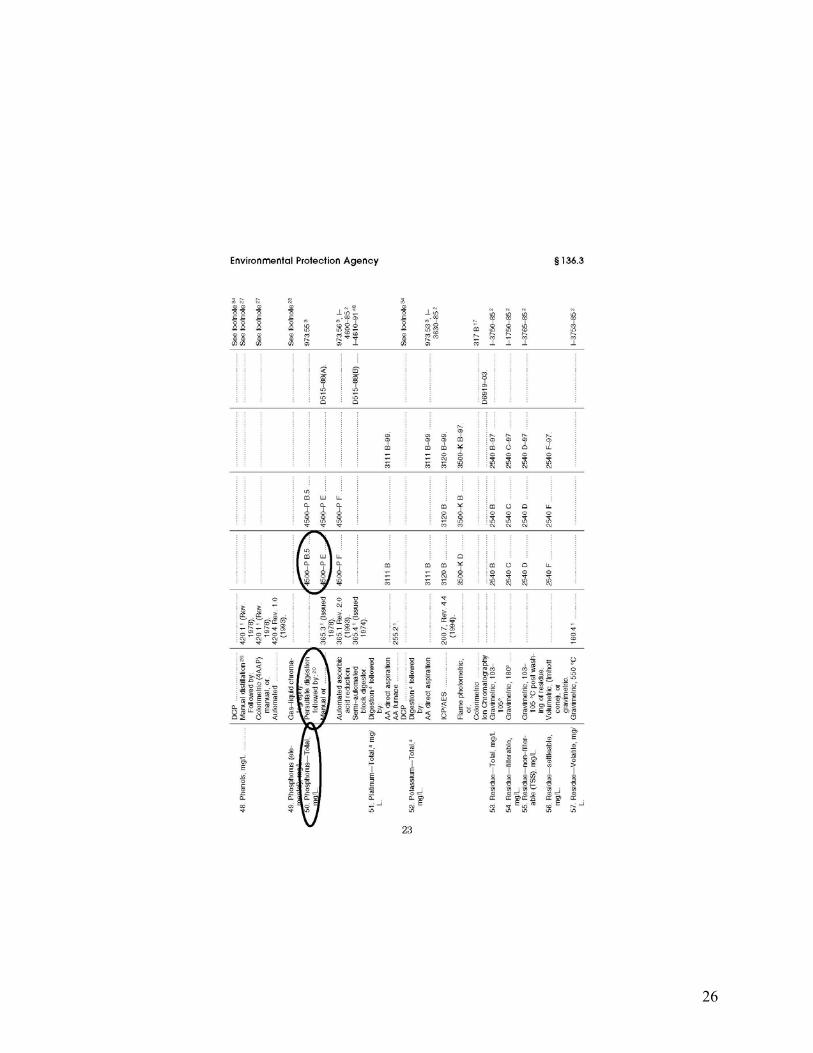
26

27

28

29

30

31
ATTACHMENT C
Table II - Required Containers, Preservation Techniques, and Holding Times 40 CFR Part 136.3
July 1, 2008
Available at: http://edocket.access.gpo.gov/cfr_2008/julqtr/pdf/40cfr136.3.pdf

32
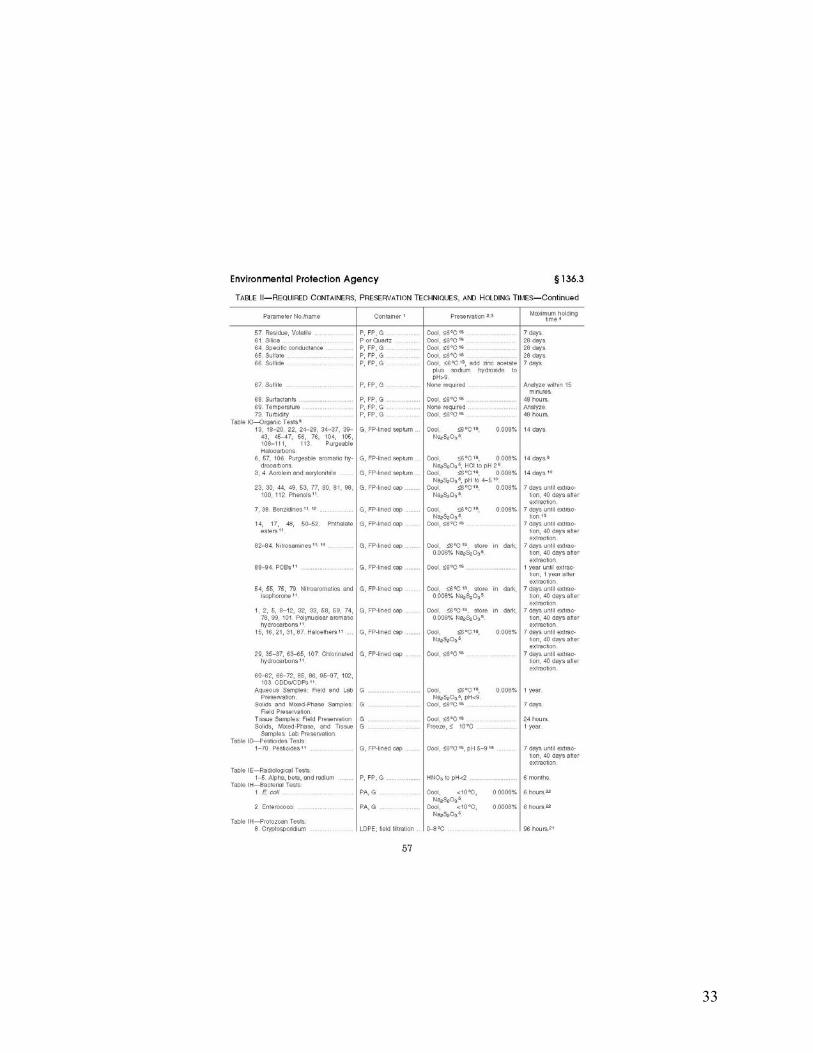
33

34

35

36

37
ATTACHMENT D
Sample Chain of Custody Form
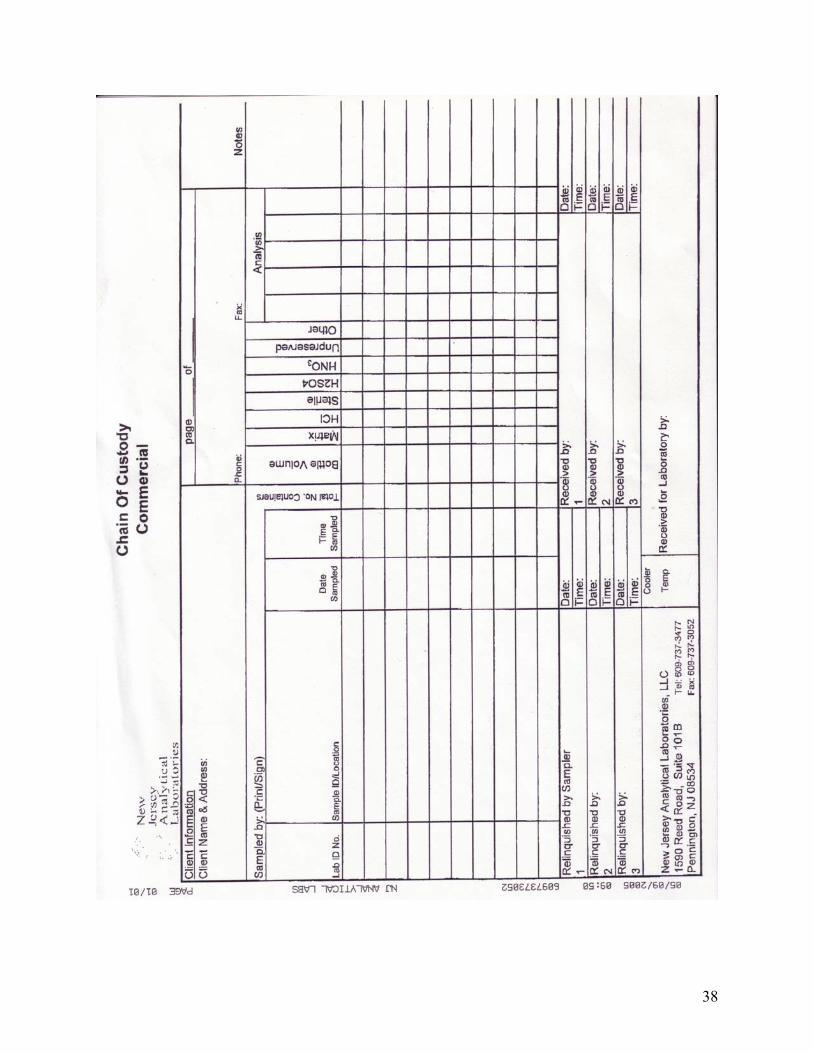
38

39
ATTACHMENT E
Table of Parameter Detection Limits, Accuracy, and Precision

40
Parameter Detection Limits, Accuracy, and Precision
RPD – Relative % Difference; NA – Not Applicable; LCL/UCL – Lower Control Limit/Upper Control Limit
Laboratory: New Jersey Analytical Laboratories (NJDEP #11005)
Parameter: Dissolved Ortho-Phosphate
(as P) (mg/L)
Total Phosphorus (as P)
(mg/L) Referenced Methodology – (NJDEP Certified Methodology)
EPA 365.3
SM 4500-P B5 + E
Technique Description Ascorbic Acid, Manual Two
Reagents Persulfate Digestion +
Manual Method Detection Limit (ppm)- Calculated
0.0029 0.0060
Instrument Detection Limit (ppm)
NA NA
Project Detection Limit (ppm)
0.01 0.02
Quantitation Limit (ppm)
0.01 0.02
Accuracy (mean % recovery)
106.9 108.6
Precision-% (mean – RPD)
2.18 2.80
Accuracy Protocol (% recovery for LCL/UCL)
83.8/ 130.0
91.3/ 126.0
Precision Protocol-% (maximum RPD)
8.10 10.13