development banking in the global economy
TRANSCRIPT

DEVELOPMENT BANKING IN THE GLOBAL ECONOMY STATE OF PLAY AND FUTURE DIRECTION
REPORT JANUARY 2021

2 | COLUMBIA CENTER ON SUSTAINABLE INVESTMENT
ccsi.columbia.edu
EXECUTIVE SUMMARY 5
PART I. INTRODUCTION 7
a. COVID 19, Sustainable Development and the Need for Development Financing 7 b. Methodology and Structure 9 c. Main Conclusions and Takeaways? 10
PART II.NATIONAL DEVELOPMENT BANKS VS MULTILATERAL DEVELOPMENT BANKS: AN OVERVIEW 11
PART III. FRAMEWORK FOR ANALYZING NATIONAL DEVELOPMENT BANKS 16
PART IV. CASE STUDIES 19
Brazil Development Bank - BNDES 20 China Development Bank - CDB 24 KfW Group 29 National Bank for Agriculture and Rural Development (India) - NABARD 33 Development Bank of Southern Africa - DBSA 37 US Development Finance Architecture 42
PART V. CONCLUSIONS 55
APPENDIX I: DEBT OUTSTANDING FOR DEVELOPMENT BANKS 57
TABLE OF CONTENTS

COLUMBIA CENTER ON SUSTAINABLE INVESTMENT | 3
DEVELOPMENT BANKING IN THE GLOBAL ECONOMY STATE OF PLAY AND FUTURE DIRECTION
TABLE 1 Assets of Largest MDBs and NDBs 13 TABLE 2 Annual Disbursements of Largest MDBs and NDBs 14 TABLE 3 Bond Issuance of Largest MDBs and NDBs 15
BRAZIL DEVELOPMENT BANK - BNDES
TABLE 4 BNDES Key Financials 21 TABLE 5 Current & Total Assets 21 TABLE 6 BNDES Loans 22 TABLE 7 Funding and Investment Type 22 TABLE 8 Loans and Onlending 23
CHINA DEVELOPMENT BANK - CDB
TABLE 9 CDB Key Financials 27 TABLE 10 Bond Length & Shareholders 27 TABLE 11 GLP Breakdown & Liabilities 28
KfW GROUP
TABLE 12 KfW Key Financials 31 TABLE 13 Funding & KfW Bonds 31 TABLE 14 Loans to Banks & Customers 32 TABLE 15 Credit Rating & Risk 32
NATIONAL BANK FOR AGRICULTURE AND RURAL DEVELOPMENT (NABARD)
TABLE 16 Key Financials 35 TABLE 17 CSR Collaboration & Funding 35 TABLE 18 Loans 36 TABLE 19 Loan Length 36 TABLE 20 Credit Rating & Exposure 36
DEVELOPMENT BANK OF SOUTHERN AFRICA - DBSA
TABLE 21 Key Financials 39 TABLE 22 Credit Rating & Other Data 39 TABLE 23 Development Loans 40 TABLE 24 Outstanding Debt 40 TABLE 25 Loans - Sector 40 TABLE 26 Loans - Client 41
US DEVELOPMENT FINANCE ARCHITECTURE
TABLE 27 Department of Energy Loan Programs 43 TABLE 28 Department of Agriculture Loan Programs 44 TABLE 29 HUD Loan Programs 45 TABLE 30 Department of Transportation Loan Programs 46 TABLE 31 Department of Treasury Loan Programs 48 TABLE 32 Small Business Administration Loan Programs 50 TABLE 33 EPA Loan Programs 50 TABLE 34 Export-Import Bank 52 TABLE 35 CARES Act 53
APPENDIX I
TABLE 36 Debt Outstanding for Development Banks, by Region 57 TABLE 37 Debt Outstanding for Development Banks, by Institution 57
LIST OF TABLES
4 | COLUMBIA CENTER ON SUSTAINABLE INVESTMENT
“There exists more than 400 NDBs, with combined assets
of an estimated US$ 8.5 trillion, equivalent to roughly
50 per cent of the assets of the entire United States
banking sector”
Cover image District Katni, Madhya pradesh, India. NABARD Indian government scheme displayed on smart phone screen. © shuttersrock/Chaturvedi. Design & copy-editing Onehemisphere AB, Sweden. [email protected]
Acknowledgments
This report was written by Ryan Lasnick, a Graduate Research Assistant at CCSI. Aniket Shah, Senior Fellow at CCSI, served as an advisor. The report benefited significantly from the comments and edits of Brooke Guven, Senior Legal Researcher at CCSI and Lisa Sachs, Director of CCSI.
WHO IS THIS REPORT FOR? • Policy-makers, in national governments that are examining different financial institutions to support economic recovery
from Covid-19 as well as long-term sustainable development solutions.
• Academics and researchers, who may be looking for research topics for under-examined aspects of the international financial system.
• Donors who are seeking opportunities to support institutional and organizational change in the development finance domain.
• Investors who are seeking to understand different scaled intermediaries with which to partner for sustainable and impact oriented investments.
• Infrastructure project developers and Small and Medium Sized Enterprises (SMEs) that are searching for new financing sources.
• Students of international development, economics and political science who wish to understand the structure of national developments banks.

EXECUTIVE SUMMARY
Agronomist with farmer in a cotton field, India. © Shutterstock/Prasannapix
National development banks (NDBs) are an under-appreciated and under-studied set of financial institutions in the global economy. As of 2020, there are at least 450 national development banks operating globally, with over US$ 8 trillion of collective assets and over US$ 2 trillion of annual disbursements. Despite the scale, reach and influence of these institutions, NDBs are not systematically understood by the academic, policy and financial communities.
In this report, we seek to bridge this knowledge-gap in three ways. First, we outline the basics of national development banking in terms of size, scale and scope. We provide recent data about the size of NDBs vs multilateral development banks (MDBs) and draw distinctions between these two sets of interrelated institutions. Second, we develop an analytical framework to guide our inquiry of NDBs. This analytical and diagnostic framework is a set of twelve questions that we believe can help guide the inquiries of academics and policy makers on how NDBs operate and how they may need to reform. Third, we undertake detailed case studies of six national development banks and their operations in order to bridge the divide
COLUMBIA CENTER ON SUSTAINABLE INVESTMENT | 5
DEVELOPMENT BANKING IN THE GLOBAL ECONOMY STATE OF PLAY AND FUTURE DIRECTION

6 | COLUMBIA CENTER ON SUSTAINABLE INVESTMENT
EXECUTIVE SUMMARY
6. Best Practices: Cross-border sharing of best practices and information is needed in order to improve the relationship/trust between civil society and NDBs.
7. Life Cycle: Most development banks lack project retirement plans and as a result may stay in specific sectors and industries longer than is necessary. This limits the potential for outside funders to invest in projects and work alongside these banks. A retirement plan will help open up development projects to funders who otherwise would be unable to invest due to NDB involvement.
8. Size: NDBs have a great potential to play a larger role in promoting private sector finance and scaling up investable projects to help achieve the Sustainable Development Goals.
9. Unique Case of the US: The bureaucratic, sporadic, and disjointed nature of the US development finance ecosystem limits the ability of the US to play a catalytic role in financing sustainable development both at home and internationally.
10. Future Opportunity and Future Research: There is no one size fits all development institution, increased research is needed to determine what type of funding and governance mechanisms work in certain political climates. A fund or specific financial vehicle that serves as an intermediary between global pools of long-term, private capital and NDBs is needed to increase the amount and speed of investment in development related projects.
between theory and practice. We undertook case studies for the following institutions: National Development Bank of Brazil (BNDES), China Development Bank (CDB), Development Bank of Southern Africa (DBSA), National Bank for Agriculture and Rural Development (NABARD) (India), KfW (Germany) and the development finance ecosystem of the United States.
We conclude the report with a set of ten conclusions based on the case study research. A summary of these ten conclusions is below:
1. Size: NDBs already play a significant role in development financing with the five largest banks representing over US$ 8 trillion in total assets.
2. Adaptability: NDBs are flexible, able to finance almost any type of industry and exist in both developing and developed economies.
3. Need: NDBs are a necessary form of financing when the private sector is unable or unwilling to invest in specific projects or industries where purely private capital is unavailable.
4. Role: NDBs can play a counter-cyclical role in catalyzing the private sector and providing necessary loan guarantees in a post-COVID economic environment due to their liquidity and scale of operations.
5. Private Sector Opportunity: NDB bonds are a secure, yet underutilized, form of financing for private sector investors as they are traditionally backed by government credit.

PART 1 INTRODUCTION
Installing solar energy, Rio de Janeiro Brazil. © Shutterstock/de freitas
The purpose of this report is to provide an analysis of the state of play of development banking in the global economy and propose future research and policy directions for this set of financial institutions.
COVID 19, SUSTAINABLE DEVELOPMENT AND THE NEED FOR DEVELOPMENT FINANCING
The global COVID-19 pandemic is plunging the world into a socioeconomic and financial crisis of an unprecedented scale. The World Bank estimates that the global economy will contract more than 5.2% this year, creating the deepest recession since the Second World War, with the largest fraction of economies experiencing declines in per capita output since 1870.1 The sheer numbers are even more staggering with cumulative financial costs related to the lost output and health reduction ranging from US$ 8.1 to US$ 16 trillion.2 Many of the gains achieved under the banner of the Sustainable Development Goals (SDGs) are under threat. The UN estimates that nearly 71 million people will be pushed back into extreme poverty in 2020, the first rise in global poverty since 1998.3 Widespread school closures and insufficient access to technology
COLUMBIA CENTER ON SUSTAINABLE INVESTMENT | 7
DEVELOPMENT BANKING IN THE GLOBAL ECONOMY STATE OF PLAY AND FUTURE DIRECTION

8 | COLUMBIA CENTER ON SUSTAINABLE INVESTMENT
PART I. INTRODUCTION
have kept more than 1.5 billion students out of school, widening the already large gap achievement gap.4 To address these issues and many more, policymakers will need comprehensive financial strategies that support recovery across all aspects of the economy; including business, infrastructure and social services.
In addition to the acute challenges of a post COVID-19 economic response, the longer-term challenges of financing the climate transition and the broader sustainable development needs remains unsolved. There is a need for a tectonic shift beyond climate finance as usual. Estimates of the investment required to achieve the low-carbon transition range from US$ 1.6 trillion to US$ 3.8 trillion annually between 2016 and 2050 for supply-side energy system investments alone,5 while the Global Commission on Adaptation estimates adaptation costs of US$ 180 billion annually from 2020 to 2030.6 Domestic, bilateral, and multilateral development finance institutions (DFIs) continue to account for the majority of public climate finance and have increased their average commitments over the past 5 years. National DFIs continued to be the largest providers of climate finance among DFIs, at an annual average of approximately US$ 150 billion.7
Pandemics, natural disasters, and climate change affect people regardless of borders or economic status and as such require global solutions. People in low socio-economic settings are more likely to bear the brunt of climate change and their countries will face outsized costs in adaptation and mitigation as a result. These costs are disproportionately borne by these countries, despite developed countries being the largest current and historic contributor of CO2 emissions. Developed countries have consistently benefitted economically and developmentally to the detriment of those bearing the brunt of the impacts of climate change. This requires a global solution that acknowledges the role that all stakeholders and sectors in society can and must contribute to. Since the UN 2030 Agenda for Sustainable Development was adopted in 2015 and the Paris Climate Agreement (PCA) in 2016, significant progress has been made toward achieving such a global solution. However, no country is on track to meet all the goals by 2030, and several challenges hamper continued progress.
The health and economic consequences of COVID-19, which are yet to be fully understood, pose extremely serious risks to the timely implementation of the SDGs and Paris Climate Agreement (PCA). Progress towards poverty reduction has slowed in recent years and will reverse in the coming years due to the impact of COVID-19. The number of people living in extreme poverty has risen in several sub-Saharan African countries, where poverty rates are already high and is expected to rise even further due to the pandemic. The World Bank conservatively estimates that the annual financing gap in achieving the SDGs is more than US$ 2.5 trillion between current funding and what is required.8 A closer look at this number shows that it is spread across all sectors, with infrastructure in need of the most funding. At up to US$ 950 billion, power infrastructure carries the greatest financing need, followed by climate change mitigation at US$ 850
billion and US$ 770 billion for transport infrastructure.9 Achieving the SDGs requires a whole of society approach that prioritizes diverse and equitable programs and recognizes that there is no singular approach to achieving sustainable development. These numbers paint an already bleak picture in the ability of the international community to fund development, and the impacts of COVID will have an even more devastating impact on any progress that has been made, making a new solution all the more needed.
The responses created to fill this gap in financing include both new financial “rules of the game,” such as fiscal and monetary policy, and the creation of new financial intermediaries like the Green Climate Fund, the PCA, The Global Environment Facility, and most recently; SDG bonds. COVID-19 has increased the scale and role that each of these financing tools can and must play in developing economic and policy solutions to the global sustainable development challenges.
Today, governments around the world find themselves in significant difficulty when formulating post-COVID economic and financial strategies that will advance long-term sustainable development outcomes. The social and economic damage of COVID-19 will be particularly pronounced in countries with weaker health systems, higher levels of debt, less fiscal space to organize stimulus packages, less easy access to international liquidity, and weak productive capacity and associated low incomes.
National development banks (NDBs) are particular institutions that have the mandate and capacity to play a critical role in financing both the post-COVID recovery and the longer-term global sustainable development efforts. While the financial and policy capacities of multilateral development banks (MDBs) are well-researched, relatively little is known about their bigger and more universal cousin, the NDB. This paper seeks to examine NDBs in order to assist researchers and policy-makers to better understand and appreciate the size, breadth, and capabilities of these banks.
The national and domestic nature of NDBs means that they often operate in a domestic policy vacuum; there practices shrouded from international eyes. There is little to no scholarly research on what their policy mandates are, what financial services they offer, which type of clients they target, how they are regulated and supervised, what business models they have adopted, what governance framework they have, and what challenges they face.10 All of this is despite the fact that globally they disburse nearly US$ 2 trillion in loans and have total assets of more than US$ 8 trillion with the top 17 accounting for more than US$ 6 trillion in total assets.11 NDBs operate in nearly every country in the world and almost every sector; 62% of these institutions are found in middle-income countries, while only 8% are located in low-income countries, and around 30% in high-income countries.12 This universal scope often makes them smaller than large commercial banks in terms of total assets, but rarely in terms of mandate or development objectives.13 Regardless of size, these banks are relevant, and governments use them to provide financial services in sectors or regions that private financial intermediaries do not serve sufficiently.

COLUMBIA CENTER ON SUSTAINABLE INVESTMENT | 9
DEVELOPMENT BANKING IN THE GLOBAL ECONOMY STATE OF PLAY AND FUTURE DIRECTION
This universality differentiates NDBs from many other forms of development finance, as there is no commonly agreed upon best organizational structure.14 With this in mind, NDBs continue to be established in both developing and developed countries with the mandate to expand infrastructure finance, provide financing for new types of environmentally friendly projects, and mobilize additional financing to meet a wide range of developmental objectives.15 NDBs not only finance projects that the private sector is unwilling or unable to finance, they also help to create and develop new market niches, develop innovative schemes to attract and channel private sector resources to large infrastructure projects, build capacity in public and private sector institutions, conceive and structure new investment projects, and facilitate the execution of public-private partnerships. This mandate provides a unique opportunity to create a set of policy prescriptions that not only defines best practices for NDBs, but also shows areas in which it may be possible to expand their work and increase their effectiveness.
NDBs possess several comparative advantages relative to other financial institutions, in particular when compared to MDBs. First, due to their generally singular domestic focus, they understand and often inform their country’s development planning efforts and have extensive knowledge of the barriers and opportunities to investment. Their proximity to the market has enabled them to cultivate long-standing relationships with local public and private sector actors, and in many cases, they have developed strong sectorial expertise. Second, they are typically mandated to utilize a range of funding sources to support their business activities and do not have to rely on donor countries for support. Most can borrow from international capital markets or institutional investors (85%) and obtain official development assistance (77%), while some can receive direct budget transfers from their governments (29%).16 Third, they can easily provide finance in local currency and assemble tailored financing packages to better meet domestic needs. Despite these advantages, NDBs are still underappreciated in the development finance context. They offer many of the same benefits as the MDBs, yet are rarely mentioned in a similar context. Increased collaboration would allow both sets of institutions to increase their scale and financial impact in order more effectively address sustainable development.
Unlike traditional banks, most NDBs enjoy preferred creditor treatment, meaning that when a sovereign nation defaults on its debt, the public debt to a NDBs is prioritized over the debt to private creditors. This means that NDBs can avoid what is known as the “debt overhang” problem. This preferred creditor treatment permits NDBs to be counter-cyclical even in the context of deteriorating public finances of their clients, which will be especially important with the high rates of debt being taken on by developing and developed countries due to COVID-19. Some of the key differences between NDBs and commercial banks is their ability to blend domestic and international policy concerns, private and public capital, as well as balancing both social and financial means.17 Traditionally, commercial banks, and other financial institutions, are assessed by
their financial flows, which provides an easy formula to monitor their effectiveness. NDBs are not solely profit seeking, making their study more difficult, but even more necessary. The duality of NDBs allows them to be assessed on a social as well as financial level, something that is not usually available for commercial banks.
A concerted focus on scaling up and directing the world's NDB resources is critical to ensuring that both the acute impacts of COVID and the structural impacts of COVID are addressed.
COVID-19 has wreaked havoc on domestic and international economic systems in a manner that has not been seen since World War II. Despite the MDBs global approach, their scale and ability to quickly mobilize and fund large scale development projects pales in comparison to what NDBs are capable of. The asset base of NDBs, make them one of the only financial institutions well-placed to lead a global recovery. A recent World Economic Forum report observed that MDBs and NDBs could substantially increase lending without threatening the AAA bond rating that most NDBs hold.18 A potential increase of US$ 1 trillion to finance a COVID recovery would bring annual disbursements to approximately US$ 3 trillion, while having no impact on credit rating.19 Just as important as the amount of financing that NDBs possess is their ability to prioritize development objectives. NDBs have the staff expertise, coordination capacity, and implementation systems to direct resources that not only provide a competitive ROI, but also provide sustainable solutions to domestic development.
Due to the current nature of development finance coupled with the growing economic uncertainty because of COVID-19 there is an immediate need for large scale investment in development projects, in both developing and developed economies.20 This report aims to fill a gap in the literature of development finance with the goal of providing a set of key takeaways/proposals on how to mobilize funds to address these current problems.
METHODOLOGY AND STRUCTURE
The report was undertaken using a mixed methods approach and conducted in three phases.
First, we conducted desk research and analysis of the current frameworks that exist for evaluating NDBs. During this process, we closely examined the traditional financial methods used to evaluate a bank in order to create a framework that could be used for NDBs. The culmination of this step in the research was the creation of a conceptual framework, or diagnostic to evaluate NDBs.
Second, we chose a group of case studies on different NDBs around the world that provided a diverse sampling of sectors, financial management, and regional focus. We then used the framework to analyze each bank and discuss their abilities and weaknesses.
Third, we gathered the data from each analyzed case study and drafted a set of 11 key takeaways and actionable recommendations for further research and potential policy prescriptions.

10 | COLUMBIA CENTER ON SUSTAINABLE INVESTMENT
PART I. INTRODUCTION
The report is presented in four sections:
7. Life Cycle: Most development banks lack project retirement plans and as a result may stay in specific sectors and industries longer than is ne
• First, we propose a framework for analyzing NDBs from both a social and financial perspective.
• Second, we discuss the different funding mechanisms of NDBs and break down the benefits and differences in how a bank is financed as well as the different ways NDBs finance projects.
• Third, we introduce the 6 different case studies and apply our framework to the chosen banks. The six banks reviewed are BNDES, CDB, DBSA, KfW, NABARD, and the United States.i
The case study approach was chosen in order to provide specific details on the inner workings of development banking. It is our belief that in order to properly assess the role these institutions can play, we must first understand their history, motives, financing structures, and development objectives. These 6 case studies were deliberately picked based on their diverse regional focus, alternative means of capital accumulation and project financing, as well as the number of years in operation. This approach creates a well-rounded view of the sector and allows us to come away with a set of insights that can be used to provide insights across the sector to policymakers, researchers, and potential investors.
• Fourth, the final section provides a set of key takeaways and recommendations for next steps.
MAIN CONCLUSIONS AND TAKEAWAYS
Through this research we developed several key takeaways that explore the role that development banks can play in leading a post-COVID economic recovery. These takeaways are listed below and explored deeper throughout the paper by examining specific NDBs. While these findings are not universal among NDBs they provide a set of insights that explain the need for further research in the NDB arena.
1. Size: NDBs already play a significant role in development financing with the five largest banks representing over US$ 8 trillion in total assets.
2. Adaptability: NDBs are flexible, able to finance almost any type of industry and exist in both developing and developed economies.
3. Need: NDBs are a necessary form of financing when the private sector is unable or unwilling to invest in specific projects or industries where purely private capital is unavailable.
4. Role: NDBs can play a counter-cyclical role in catalyzing the private sector and providing necessary loan guarantees in a post-COVID economic environment due to their liquidity and scale of operations.
5. Private Sector Opportunity: NDB bonds are a secure, yet underutilized, form of financing for private sector investors as they are traditionally backed by government credit.
6. Best Practices: Cross-border sharing of best practices and information is needed in order to improve the relationship/trust between civil society and NDBs.
7. Life Cycle: Most development banks lack project retirement plans and as a result may stay in specific sectors and industries longer than is necessary. This limits the potential for outside funders to invest in projects and work alongside these banks. A retirement plan will help open up development projects to funders who otherwise would be unable to invest due to NDB involvement.
8. Size: NDBs have a great potential to play a larger role in promoting private sector finance and scaling up investable projects to help achieve the Sustainable Development Goals.
9. Unique Case of the US: The bureaucratic, sporadic, and disjointed nature of the US development finance ecosystem limits the ability of the US to play a catalytic role in financing sustainable development both at home and internationally.
10. Future Opportunity and Future Research: There is no one size fits all development institution, increased research is needed to determine what type of funding and governance mechanisms work in certain political climates. A fund or specific financial vehicle that serves as an intermediary between global pools of long-term, private capital and NDBs is needed to increase the amount and speed of investment in development related projects.
NOTE
i Despite not technically having a NDB, this report uses the debt and credit financing by the United States federal government for “development outcomes” in order to show one of the ways that governments use federal money to finance internal development.

PART II NATIONAL DEVELOPMENT BANKS VS MULTILATERAL DEVELOPMENT BANKS
Electricity pylons, South Africa. © Shutterstock/Mercer
The public sector has become the lifeline for millions of people and companies in distress. Both developed and developing countries urgently need large-scale countercyclical funding to help maintain economic activity, and especially jobs. And one of the key instruments that governments and the international community have to help achieve this is development banks. These institutions can significantly leverage public resources to help minimize economic decline, support recovery, and finance structural transformation. International financial actors need to redeploy themselves to create a targeted package of international support measures in a post-COVID world. This response must be on both a national and global scale, involving actors from the North and South, public and private.
COLUMBIA CENTER ON SUSTAINABLE INVESTMENT | 11
DEVELOPMENT BANKING IN THE GLOBAL ECONOMY STATE OF PLAY AND FUTURE DIRECTION
12 | COLUMBIA CENTER ON SUSTAINABLE INVESTMENT
PART II. NATIONAL DEVELOPMENT BANKS VS MULTILATERAL DEVELOPMENT BANKS
Creating a set of insights into the motives, practices, and abilities of NDBs will provide private sector investors and policymakers with an increased ability to understand, work alongside, and invest with these actors in order to promote sustainable development. Understanding this, the paper proposes a two-pronged approach that takes into account both qualitative and quantitative metrics in order to diagnose the social and financial abilities of NDBs.
COMPARING MDBS AND NDBS
Since the end of World War One, both developed and developing countries have tried to bridge long-term financing needs through the creation of multilateral and national development banks. Despite their common name and objective, these are two distinct set of institutions that offer unique abilities to fund sustainable development.
Over the years, the roles of NDBs changed, from being a means to achieve industrialization to the pursuit of much more diverse objectives ranging from microfinance to student loans. However, after the 2008 financial crisis, many countries have resorted to NDBs to smooth the effects of the liquidity and credit squeeze associated with the crisis.
Today, NDBs operating on a national, regional, or global scale continue to be overlooked even by financial specialists. There exists more than 400 NDBs, with combined assets of an estimated US$ 8.5 trillion, equivalent to roughly 50 per cent of the assets of the entire United States banking sector.21 Capitalized by governments, but co-funding their lending with the private sector, NDBs commit US$ 2 trillion each year to projects in every corner of the planet.
The magnitude of domestic financing and total scale of operations of NDBs is one of the key differentiators of NDBs from other forms of development finance institutions. Unlike MDBs, there is there is little North-South cooperation among NDBs; these banks tend to be national by nature and are only concerned with internal development. MDBs on the other hand finance developing countries and offer little support to developed countries, even in times of crisis. Structurally they both finance projects in similar fashions, prioritizing debt as opposed to equity. The funding mechanisms of both institutions struggle to adequately incorporate private sector funding, oftentimes crowding out the sector and maintaining a role even when the market has proven capable of existing without it.
While pages have been written that examine the ideal makeup and organization of a MDB, little is said about how to organize a NDB. There is little to no sharing of best practices or cross-border communication from one NDB to another. This limits the reach and scale that NDBs can potentially have. With this in mind, NDBs continue to be established in both developing and developed countries with the mandate to expand infrastructure finance, provide financing for new types of environmentally friendly projects, and mobilize additional financing to meet a wide range of development objectives.22
NDBs differ from MDBs as they not only finance projects that the private sector is unwilling or unable to finance, but they help to create and develop new market niches, develop innovative schemes to attract and channel private sector resources to large infrastructure projects, build capacity in public and private sector institutions, conceive and structure new investment projects, and facilitate the execution of public-private partnerships. Although this is similar to the work of MDBs, its scale and impact is much greater when done by a NDB. Due to their international nature, MDBs often lack the ability and local knowledge to have systematic changes on industry within the country. These unique benefits provide a unique opportunity to create a set of policy prescriptions that not only defines best practices for NDBs, but also shows areas to increase their effectiveness.
There is currently a significant gap in infrastructure financing, climate mitigation and adaptation, that MDBs have struggled to close alone. This failure is due to the lack of buy-in from national governments and the comparatively low capitalization of MDBs. Although MDBs have played an important role in past counter-cyclical financing during economic crises, the COVID-19 economic crisis requires greater and more immediate action; the type of scalable financing that NDBs have proven more than capable of providing. By partnering together, both NDBs and MDBs can create financial vehicles that prioritize sustainable long-term investments.
International financial institutions (IFIs) have so far failed to provide the necessary relief to capital markets for a COVID-19 economic recovery. For instance, the US recently vetoed an increase in IMF Special Drawing Rights (SDR). There has also been no commitment to increase IMF quotas, spelling disaster for the likelihood of any sort of multilateral bailout.23 These actions are in direct opposition with the rapid increase in disbursements seen by NDBs around the world. The ability of NDBs to rapidly increase capital and disburse funds to all sectors of the economy, but especially to areas where the private sector tends to lag, make them the ideal partners to fund a recovery.
Below is a comparison of NDBs and MDBs used to show the scale of the two institutions and help explain this papers emphasis on NDBs.
COMPARING TOTAL ASSETS
There are considerably more NDBs in the international arena than recognized MDBs, so the sample size of our NDBs is larger than that of the MDBs. For NDBs we chose to include only institutions with assets over US$ 30 billion. This limit was chosen in order to create a comparable sample that looks at 90% of total financing of both MDBs and NDBs respectively. While there are certainly institutions missing from the sample below, it is used to provide a scale of the two comparable financial institutions. The below table shows that even using conservative estimates, NDB total assets are more than 3.5 times the size of MDBs. The top 5 largest MDBs make up almost 88% of all MDB financing with the largest representing approximately 40%. NDB assets are slightly more disbursed with 79% belonging to the top

COLUMBIA CENTER ON SUSTAINABLE INVESTMENT | 13
DEVELOPMENT BANKING IN THE GLOBAL ECONOMY STATE OF PLAY AND FUTURE DIRECTION
5 and 38% belonging to the largest NDB. The numbers highlighted below provide a necessary framework to look at total development banking assets, but only provide part of the picture. Taking into account the assets of all recognized NDBs raises the number from US$ 6 trillion to approximately US$ 8.3 trillion and raises the assets of MDBs from US$ 1.7 trillion to approximately US$ 2.5 trillion.
TABLE 1: ASSETS OF LARGEST MDBS AND NDBS
MDB Assets in US$ (Billion)
NDB Assets in US$ (Billion)
EIB 692.0 CDB (China) 2,361.0
IBRD 283.0 ADB (China) 996.3
ADB 221.9 China Exim (China) 611.9
IDA 188.6 KfW (Germany) 568.5
IADB 136.4 Industrial Bank of Korea (Korea) 274.8
EBRD 68.2 KDB (Korea) 232.2
AfDB 35.2 BNDES (Brazil) 182.1
AIIB 22.6 BNG (Netherlands) 168.1
IsDB 32.6 DBJ (Japan) 162.8
Af Ex-Im 14.4 Landwirtschaftliche Rentenbank (Germany) 102.1
CABEI 11.6 Korea Exim (Korea) 80.3
NDB 11.8 NABARD (India) 70.5
Total 1,718.4 AFD (France) 53.4
VEB.RF (Russia) 51.3
IDBI (India) 39.9
BDC (Canada) 30.7
NAFIN (Mexico) 29.2
Total 6,015.1

14 | COLUMBIA CENTER ON SUSTAINABLE INVESTMENT
PART II. NATIONAL DEVELOPMENT BANKS VS MULTILATERAL DEVELOPMENT BANKS
TABLE 2: ANNUAL DISBURSEMENTS OF LARGEST MDBS AND NDBS
MDB Annual Disbursements in US$ (Billion)
NDB Annual Disbursements in US$ (Billion)
EIB 48.1 CDB (China) 450.9
ADB 21.6 ADBC (China) 262.7
IBRD 20.2 China Exim (China) 195.2
IDA 17.5 KfW (Germany) 90.5
IADB 10.6 KDB (Korea) 57.0
EBRD 9.0 Korea Exim (Korea) 52.6
Af Ex-Im 8.9 DBJ (Japan) 28.0
IsDB 8.2 BNDES (Brazil) 17.2
AfDB 5.2 AFD (France) 14.1
AIIB 2.9 Landwirtschaftliche Rentenbank (Germany) 12.5
CABEI 1.9 BNG (Netherlands) 12.5
NDB 1.5 NABARD (India) 7.5
Total 155.6 BDC (Canada) 7.2
VEB.RF (Russia) 1.2
Total 1,209.1
Industrial Bank of Korea (Korea) N/A
IDBI (India) N/A
NAFIN (Mexico) N/A
COMPARING ANNUAL DISBURSEMENTS
The differences in annual disbursements between these two kinds financial institutions is the key differentiator in their ability to provide counter-cyclical funding for a post COVID recovery. MDBs disburse roughly US$ 155 billion annually compared to more than US$ 1.2 trillion by NDBs. NDBs are a more effective tool of disbursing long-term capital to both developing and developed financial markets. Every year NDBs disburse 20% of their total assets while MDBs disburse less than 9%. Despite the consistent calls for an
increase in MDB capital, little change has occurred over the past decade. MDB financing tends to be greatly politicized, with many countries refusing to donate or receive funds. On the other hand, NDB financing is traditionally done domestically, highlighting the ability of a country to pay for their own development. This difference is an essential component in understanding the role that NDBs currently play and can continue to play in economic recovery. The total number of disbursements seen below is limited by available data and a small sample size of NDBs. Total disbursements for NDBs is conservatively estimated at US$ 2 trillion a year.

COLUMBIA CENTER ON SUSTAINABLE INVESTMENT | 15
DEVELOPMENT BANKING IN THE GLOBAL ECONOMY STATE OF PLAY AND FUTURE DIRECTION
TABLE 3: BOND ISSUANCE OF LARGEST MDBS AND NDBS
MDB Bond Issuance in US$ (Billion)
NDB Bond Issuance in US$ (Billion)
IBRD 54.0 CDB (China) 270.0
EIB 50.0 ADBC (China) 160.0
IADB 20.3 China Exim (China) 83.0
ADB 13.8 KfW (Germany) 82.0
EBRD 10.1 Industrial Bank of Korea (Korea) 54.0
AfDB 6.8 KDB (Korea) 44.0
IsDB 6.0 BNG (Netherlands) 20.7
IDA 4.6 NABARD (India) 14.3
AIIB 2.5 Korea Exim (Korea) 14.0
CABEI 1.1 Landwirtschaftliche Rentenbank (Germany) 12.2
NDB 0.87 AFD (France) 7.6
Af Ex-Im 0.75 DBJ (Japan) 6.7
Total 170.8 BNDES (Brazil) 1.0
Total 769.4
VEB.RF (Russia) N/A
IDBI (India) N/A
NAFIN (Mexico) N/A
BDC (Canada) N/A
BOND ISSUANCE COMPARISON
The below table depicts the primary method of funding for both MDBs and NDBs. While there are other methods of funding, we analyze bond issuance as it accounts for more than 90% of all funding for both types of institutions. Other methods of capitalization that we have analyzed, but do not thoroughly explore in this report, are: direct taxation, private sector borrowing, membership dues, and country
contributions. 65% of analyzed NDB disbursement are funded on the domestic and international bond market, with the top 5 institutions making up 71% of all issuances. In the case of MDBs over 100% of possible funding comes from bond issuances, with MDBs regularly disbursing less than the amount they raise on the bond market. For example, IBRD raised roughly US$ 54 billion on the bond market in 2019, despite only disbursing US$ 20 billion. In 2019, 87% of funds raised on the bond market came from the top 5 MDBs.

PART III FRAMEWORK FOR ANALYZING NATIONAL DEVELOPMENT BANKS
Paddy rice, Tamil Nadu, India.. © Shutterstock/Elaaa
In this section we break down reasons for choosing these NDBs and introduce our framework.
In order to create a set of insights that can be used across the discipline we propose a regional and sectorial analysis that looks at six purposefully chosen NDBs from around the world. These banks were chosen to provide diversity in, not only locale, but in structure, history, financing, and development motive. Analyzing NDBs from this perspective will allow us to better understand and represent the entire ecosystem and provide insight into the growth opportunity of the field. The NDBs that will be analyzed are:
• Brazil Banco Nacional de Desenvolvimento Economico e Social (BNDES)
• Germany Kreditanstalt fuer Wiederaufbau (KfW)
• South Africa Development Bank of Southern Africa (DBSA)
• India National Bank for Agriculture & Rural Development (NABARD)
• China China Development Bank (CDB)
• United States
16 | COLUMBIA CENTER ON SUSTAINABLE INVESTMENT
PART III. FRAMEWORK FOR ANALYZING NATIONAL DEVELOPMENT BANKS

COLUMBIA CENTER ON SUSTAINABLE INVESTMENT | 17
DEVELOPMENT BANKING IN THE GLOBAL ECONOMY STATE OF PLAY AND FUTURE DIRECTION
MANDATE
1. What is the stated development purpose of the bank?
a. Why was the bank created?
b. Do the banks investments align with a national development plan?
STRUCTURE
2. How is the bank funded?
a. Is the bank funded by government money?
b. Is the bank funded by the private sector?
c. Does the bank have public securities?
3. How does the NDB invest its funds?
a. What is the total size of the bank’s investments?
b. Does the bank make debt investments?
c. Does the bank make equity investments?
i. How much of the equity is paid in vs. callable bond?
d. Does the bank make mixed investments?
e. What is the average size of these investments?
i. Balance of deposits small vs. jumbo.
f. What currency are the loans made in?
FINANCES
4. What is the tier 1 capital ratio?
5. What percentage is the bank’s investments of the total banking sector in the country?
6. What is the average time duration of bank deposits?
7. What is the average return on invested capital?
8. What percentage of loans are non-performing loans?
a. What kind of leniency does the bank offer?
9. What is the credit rating of the bank?
ECOSYSTEM
10. What kind of regulatory environment applies to the NDB in the country?
a. Is the NDB regulated by an independent entity?
b. What kind of board/oversight committee exists?
c. What laws exist specifically regulating the NDB?
11. What overlap exists between the NDB and the private sector?
a. What percentage of investments are made solely by the NDB?
12. What sectors does the NDB invest in?
a. What sort of products does the bank offer to each sector?
In order to create a set of insights that can be used across the sector, this paper will analyze NDBs using a four part framework – mandate, structure, finances, ecosystem – and twelve key guiding questions. These data points were chosen to provide context for the financial and social successes and/or failures of each case study. The 12 data points are as follows:
Understanding that there exists a wide variation in both the sources and uses of capital of NDBs, we determined a sample of financing tools to use in our assessment. In this sample, we wanted to ensure that the following mechanisms were represented: 1) Government debt/credit, guarantees 2) Government tax financing, 3) Market-based financing, and 4) Bond issuance. Across these types of funding we then made sure to have a representation of sectors as to show the universal nature of NDB financing.
From a source of capital perspective, development banks originate their financial capital from many sources, including governments, private investors and philanthropic organizations, and through various channels, including direct investments and capital market activities.24 These various sources of capital are injected into a development bank through various financial instruments, including equity, debt and as co-investment capital.25
From a use of capital perspective, development banks vary significantly in what types of investments they make, by both type of project and sector of project.26 Choosing case studies that operate in different sectors and through diverse investment tools will help us understand these financial flows, which projects are most successful, and why they are chosen. On the one hand, they lend to large-scale public projects, and therefore have to access sufficient low-cost funds such as fiscal revenue.27 On the other hand, receiving cheap capital from the state often results in unfair competition with other banks and discourages increased engagement by the private sector. It is essential for us to understand this dichotomy and how NDBs walk this line if we are to effectively engage with them.28
Because of this asymmetry there is a need for non-traditional forms of financing. The funding of NDBs is often a mixture of state and market capital, including borrowings from government, bond issues and deposits; where the key is that the funds are traditionally backed or guaranteed by government credit.29 Many NDBs have an implicit or explicit sovereign guarantee on their liabilities, which enables them to enhance their risk profile and access capital markets or borrow from banks on the same terms that their governments do.30

18 | COLUMBIA CENTER ON SUSTAINABLE INVESTMENT
PART III. FRAMEWORK FOR ANALYZING NATIONAL DEVELOPMENT BANKS
Guarantees usually involve an NDB providing credit enhancement to an intermediary (on-lending) that is providing a loan to a given project or program.31 The NDB assumes some or all of the project’s credit risk, which would normally dissuade lenders. There are different types of guarantees, but credit risk tends to be the one primarily used.32 A traditional credit guarantee provides an assurance to on-lenders that the principal will be paid when due, oftentimes in the form of a Government subsidy or direct payout.33
Through a guarantee or credit insurance, the government holds, under certain conditions, all or part of the risk of a loan.34 In exchange, the cost of funding to the final borrower, is reduced to a level closer to the rates charged for public debt, that, normally, are the lowest cost of funding in the local market.35 Guarantee schemes are very efficient from a fiscal point of view. They generate revenues up front and only require disbursement of public funds in the case of default. For NDBs this is extremely beneficial and allows them to report very low non-performing loans (NPLs). The main advantage of using guarantee mechanisms is the low demand for fiscal resources, but unlike the direct provision of funds, this mechanism does not create credit for businesses and can limit the growth of invested industries if they do not have the ability to access other credit markets.36
Different guarantee programs involve different levels of subsidization by, and costs, to the government. The most effective programs are those that correct some imperfection in the market or lead to the creation of a market where one did not exist.37 Such programs typically serve many relatively small borrowers. For example, in the US, Federal Housing Administration (FHA) loans in the 1930's filled a gap in the credit market, caused by a reluctance of banks to accept the risks of long-term home mortgages.38 By pooling this risk, the FHA created a new credit market, becoming a pseudo development bank, and financing homes that would not have received financing otherwise.39
Credit and loan products are not the only NDB tools that are backed by the government. Most bonds issued by NDBs are also backed up by an implicit credit guarantee by the federal government.40 In most cases these NDB bonds enjoy sovereign credibility granted by the state's banking regulatory body, which increases the attractiveness of the bonds to market investors.41 This guarantee add a certain level of safety to NDB bonds.
In contrast with other financial guarantees, the NDB does not usually pay any ‘guarantee fee’ to the state.42 The guarantee therefore is a form of implicit state subsidy for the bank to reduce its fund-raising cost and allow for more leeway in identifying investable projects. Most bonds also enjoy ‘zero-risk weighting’ granted by governments. This means that the risks that investors bear for holding the bonds is zero – they are as safe as government bonds and that investors rarely have to set capital against them.
Guarantees provide a key advantage for both NDBs and their clients A government guarantee plays a dual role in incentivizing investment in high-risk areas and limiting the funds the government, and its tax-payers, must contribute directly to a specific project. A well thought out guarantee can target certain specific classes of risk, bring investors into contact with underutilized borrowers, and help ‘crowd in’ other funding sources that are needed to finance local development.43 The government however is implicitly backstopping this capital, and therefore tax payers are still indirectly at risk if the project or company fails.

PART IV CASE STUDIES
BNDES headquarters, Rio de Janeiro, Brazil. © Shutterstock/Photocarioca.
In this section, we evaluate our proposed framework, with particular emphasis on the NDB(s) financial capabilities, with six NDBs from around the world. We identify potential risks and benefits of each financial model and determine the effectiveness for each case study.
When analyzing each bank, we also looked at their historical significance as well as stated objective, to determine to what extent the bank plays a development role within the country. This step is important, as the development or social nature of the bank is one of the chief differentiators between NDBs and other federal and commercial banks.
Each assessment concludes with a set of key financial figures that show the scale and scope of the bank’s investments.
The below NDBs are organized in no particular order. The objective of this assessment is not to criticize any of the reviewed banks, but rather to draw comparisons and best practices that can be used to improve development financing.
COLUMBIA CENTER ON SUSTAINABLE INVESTMENT | 19
DEVELOPMENT BANKING IN THE GLOBAL ECONOMY STATE OF PLAY AND FUTURE DIRECTION

BRAZIL DEVELOPMENT BANK - BNDES
History
The government of Brazil founded BNDES in 1952, when a joint Brazil-United States Development Commission, made up of engineers and technocrats from Brazil, the United States, and the World Bank, recommended the creation of a development bank to improve and renew Brazil’s energy and transportation infrastructure.44 This initial focus was then expanded to include financial support to a host of industries that the government wanted to develop, such as metals, oil, chemicals, and cement.45 By focusing on long-term loans, the bank was trying to fill a void in Brazil’s financial markets. The government created BNDES because the mechanisms firms used to finance the country’s early industrialization – private bonds and equity markets –had practically disappeared in the 1930s when the government imposed interest-rate ceilings and inflation reached two digits.46
Since that time, BNDES has played an outsized role in the development of key sectors within Brazil, specifically in infrastructure and energy.47 Despite Brazil’s recent history of privatization, BNDES remains an important source of capital in the economy; its loans represent more than 20%ii of the domestic credit to the private sector and it provides the bulk of the long-term credit available throughout the country.48, 49
Mission
BNDES has a mission to offer financial solutions that provide investments for sustainable development, generating employment, and reducing social and regional inequalities. The Bank prioritizes the following areas:50
• Expanding investments in infrastructure with support to economic, social, and urban infrastructure.51
• Increasing the competitiveness of Brazilian companies with support to investment that make them able to explore opportunities, and to overcome traditional market barriers and challenges.52
• Contribute to social and economic inclusion through products that broaden the access to credit for those lacking.53
• Supporting the development of public institutions and structuring projects associated to public concessions and public private partnerships (PPAs).54
• Stimulate innovation, environmental sustainability, and regional development in all projects.55
Role of BNDES
BNDES plays a leading role in the extension of credit for investment in infrastructure and industry, and export credit for higher value-added manufactured goods and services. Therefore, large companies have always been the development bank's main direct clients.56
In order to avoid competition in financing between BNDES and the commercial banking sector two significant policies exist. First, commercial banks have first option on every loan up to R$ 20 million
(US$ 7.5 million). Second, BNDES does not have branches, does not take deposits from the public, and does not compete with commercial banks except in capital market operations.57
Financing
BNDES has access to below-market funding resources, which allow it to offer subsidized loans. Funding sources include loans from the National Treasury (such transfers were discontinued in 2015) and constitutionally mandated transfers from the Fundo de Amparo ao Trabalhador (FAT).58 In addition, BNDES has in the past issued debentures and other instruments, and borrowed internationally, mostly from multilateral institutions.59
BNDES is an essential investment vehicle to the majority of firms within Brazil, mostly small or medium in size, which would struggle to exist without BNDES.60 Moreover, even large financially unrestricted firms benefit from BNDES financing considering the difference between the TJPL (long-term interest rates) and the market rates that all other banks offer.61 Currently BNDES is able to make loans at an interest rate of about 4.9% for traditional loans to SMEs and .9% for solar or green energy loans.62
Traditionally the only alternative source of long-term finance in Brazil, available to large and well rated companies, is foreign exchange denominated corporate bonds in the international market.63 This essentially forces the private sector to borrow from BNDES, squeezing out commercial banks from long-term financing. According to the Central Bank of Brazil, BNDES provided approximately 70% of long-term bank credit (defined as loans with over three-year repayment period) from 2013 to 2015.64
After the financial collapse of 2008 the need for long-term financing rose drastically within Brazil.65 To enable BNDES to support the demand for investments, between 2009 and 2014, the Brazilian Treasury provided BNDES with very long-term loans (up to 50 years) that added up to R$ 524 billion. These loans represented around 8.5% of Brazilian Gross Debt by the end of 2014.66 These resources came in addition to the long-standing funding from the FAT.iii
Governance
Having qualified technical staff and significant resources, the bank has been called to participate in the country’s agenda-setting since its foundation. BNDES plays a role in informing and influencing policy-making, but the ultimate entity responsible for the approval of policy are elected officials, many of which sit on the board of BNDES.67
The BNDES board only provides guidance and is apt to significant government interference in BNDES policies and operations. The federal government holds 100% of the shares and appoints all 12 Board members (employees have an elected representative also appointed by the President of the Republic).68
20 | COLUMBIA CENTER ON SUSTAINABLE INVESTMENT
PART IV. CASE STUDIES
NOTES
ii This percentage was calculated by taking the ratio of 2019 BNDES disbursements to the total amount of domestic credit given to the private sector within Brazil.
iii FAT: 1988 Constitution pledges to BNDES 40% of all revenues from FAT/PIS-PASEP Fund (a payroll tax ranging from 1.0-1.5% to finance unemployment insurance and once a year transfers to low-wage public and private employees equivalent to 1-month salary).

COLUMBIA CENTER ON SUSTAINABLE INVESTMENT | 21
DEVELOPMENT BANKING IN THE GLOBAL ECONOMY STATE OF PLAY AND FUTURE DIRECTION
BNDES Programs
The BNDES portfolio currently includes 40 programs targeting sectors and social development outcomes. The Bank categorizes them into “angles.” For example, agriculture and agroindustry, or capital goods and vehicles. Other programs focus on a cluster of activities such as health; or have an industry-specific emphasis, such as software, plastics, and paper.69 Finally, a few programs provide support for the subnational public sector like states and municipalities, and others have an anti-crisis and counter-cyclical function. Each one of these programs is linked back to the BNDES mission and is guided by the national development objectives of Brazil.70
BNDES Private Sector Partnerships
BNDES has several loan and credit programs to increase funding into private sector priority areas. These areas are defined by the board of directors.
• BNDES support for the PPI – This program is an infrastructure fund set up to increase infrastructure investments in local communities around Brazil.
• The partnership aims to couple private and public money to invest in roads and highways.71
• BNDES FGI - Investment Guarantee Fund
• The Investment Guarantee Fund (FGI), established on June 30, 2009, through a decision of the BNDES Board of Directors, is a private fund administered by the bank to facilitate credit acquisition by micro, small, and medium-sized enterprises (MSMEs).72
• For a BNDES FGI guaranteed loan, the beneficiary looks for a bank authorized to operate with the fund's guarantee. The cost to use the BNDES FGI guarantee is called the Guarantee Grant Fee (ECG), and its size depends on the amount financed, the percentage guaranteed by the fund, and the maturity of the contract.
NOTE
iv All financial data is taken from the 2019 BNDES audited annual and financial report. This data was then converted using the end of fiscal year fx rate of 0.24813.
TABLE 4: BNDES KEY FINANCIALSiv, 73
KEY FINANCIALS BRL (Billion)
US$ (Billion)
Brazil GDP (BRL) 7,430.1 1,843.6
BNDES % of GDP 9.8% 9.8%
Brazil Private Sector Credit 3,376.3 837.8
Brazil Domestic Credit to Private Sector 2,256.4 559.9
BNDES % of total Private Sector Credit 13.5% 13.5%
BNDES % of Domestic Credit to Private Sector 20.2% 20.2%
Total Exposure 450.5 111.8
Current Assets 201.4 50.0
Total Assets 728.2 180.7
BNDES Income 62.8 15.6
Moody's rating Ba2 Ba2
S&P rating BB- BB-
BNDES Interest Rate % 7.5% 7.50%
Return over Assets (% py) 2.5% 2.5%
Return over Equity (% py) 28.6% 28.6%
Return over Capital Instruments (% py) 2/ 3/ 18.0% 18.0%
TABLE 5: CURRENT & TOTAL ASSETS
CURRENT ASSETS BRL (Billion)
US$ (Billion)
Current Securities 68.9 17.1
Current Outstanding Loans 31.8 7.9
Current Interbank Onlending 38.2 9.5
Current Bank Investments 51.4 12.7
Current Assets 201.4 50.0
TOTAL ASSETS
Cash and Equivalents 51.4 12.7
Securities * 186.8 46.4
Government Securities 62.5 15.5
Shares * 103.0 25.6
Debentures 12.0 3.0
Others 9.3 2.3
Loan and Onlending Portfolio 441.8 109.6
Credit from the National Treasury 1.9 0.5
Investments * 9.1 2.3
Others 37.1 9.2
Total Assets 728.2 180.7

22 | COLUMBIA CENTER ON SUSTAINABLE INVESTMENT
PART IV. CASE STUDIES
TABLE 6: BNDES LOANS
LOANS BRL (Billion)
US$ (Billion)
Interbank Lending 278.0 69.0
BNDES Lending 178.2 44.2
Total Lending 456.2 113.2
of which short-term 71.7 17.8
of which long-term 384.5 95.4
% %
Agribusiness 13.7% 13.7%
Commerce and Services 16.3% 16.3%
Public administration 8.3% 8.3%
Commerce 2.7% 2.7%
Construction 1.3% 1.3%
Real estate, professional and administrative services
0.8%
0.8%
Insurance and financial services 1.3% 1.3%
Others 2.0% 2.0%
Industry 15.2% 15.2%
Coke, fuel and oil 0.9% 0.9%
Transportation equipment 5.2% 5.2%
Food products 2.2% 2.2%
Extractive industry 0.0% 0.0%
Vehicles, tow-trucks and chassis 1.2% 1.2%
Pulp and paper 1.6% 1.6%
Chemical 0.0% 0.0%
Metallurgy 1.0% 1.0%
Machinery 0.5% 0.5%
Others 2.6% 2.6%
Infrastructure 54.8% 54.8%
Electricity and gas 30.5% 30.5%
Land transportation 6.9% 6.9%
Waterway transportation 4.8% 4.8%
Auxiliary transportation services 6.3% 6.3%
Telecommunications 0.0% 0.0%
Construction 0.0% 0.0%
Others 6.3% 6.3%
TABLE 7: FUNDING AND INVESTMENT TYPE
FUNDING BRL (Billion)
US$ (Billion)
Domestic 3.4 0.84
Foreign 9.2 2.3
Total borrowing 12.5 3.1
National Treasury 162.9 40.4
Merchant Marine Fund 22.7 5.6
Other 0.25 0.06
Multilateral Institutions 19.6 4.9
Total Onlending 205.5 51.0
Total Loans 218.0 54.1
FAT Funds 282.5 70.1
PIS/PASEP Fund Management (0.50% management fee)
28.0
7.0
Shareholders Equity 104.8 26.0
INVESTMENT TYPE BRL (Billion) US$ (Billion)
Local Currency 408.4 101.3
Foreign Currency 47.9 11.9
Public Sector Loans 145.4 36.1
Public administration 45.4 11.3
Industry 14.3 3.6
Financial intermediation 79.7 19.8
Other 5.9 1.5
Private Sector Loans 310.8 77.1
Rural 1.9 0.46
Industry 131.2 32.5
Trade 2.7 0.66
Financial intermediation 96.2 23.9
Other 78.9 19.6
GLP 456.2 113.2
Equity Investments 112.1 27.8
Non-controlling equity (12 companies)
103.0
25.5
Controlling equity (2 companies disclosed)
9.1
2.3

COLUMBIA CENTER ON SUSTAINABLE INVESTMENT | 23
DEVELOPMENT BANKING IN THE GLOBAL ECONOMY STATE OF PLAY AND FUTURE DIRECTION
TABLE 8: LOANS AND ONLENDING
LOANS
RISK LOAN PERFORMANCE LOAN IN BRL (Billion) % NPL LOANS IN US$ (Billion)
AA Performing 30.6 7,590.54
AA Non-Performing 8.8 22% 2,188.26
A Performing 94.0 23,312.31
A Non-Performing 0 0% -
B Performing 98.5 24,435.10
B Non-Performing 0 0% -
C Performing 26.1 6,464.03
C Non-Performing 9 0% 2.23
D Performing 2.5 624.54
D Non-Performing 0 0% -
E Performing 3.9 958.03
E Non-Performing 3.3 46% 807.91
F Performing 3.2 803.69
F Non-Performing 0.6 16% 152.10
H Performing 6.2 1,532.20
H Non-Performing 0.4 6% 102.97
Total Loans 278.0 68,973.94
Performing 264.9 65,720.46
Non Performing 13.1 5% 3,253.48
ONLENDING
AA Performing 127.1 31.5
AA Non-Performing 0 0% -
A Performing 32.9 8.2
A Non-Performing 0 0% -
B Performing 18.6 4.6
B Non-Performing 0 0% -
C Performing 1.7 0.43
C Non-Performing 0 0% -
D Performing 0 0.00005
D Non-Performing 0 0% -
E Performing 0.04 0.009
E Non-Performing 0 0% -
F Performing 1.0 0.25
F Non-Performing 0 0% -
H Performing 0.07 0.016
H Non-Performing 0 0% -
Total Loans 181.4 45.0
Performing 181.4 45.0
Non Performing 0% -

24 | COLUMBIA CENTER ON SUSTAINABLE INVESTMENT
PART IV. CASE STUDIES
CHINA DEVELOPMENT BANK - CDB
The China Development Bank (CDB) focuses on national economic strategy and provides medium-to-long run financing facilities to the economy, with the aim to break through production bottlenecks and assist in the long-run sustainable development of Chinese economy and society.74 To implement the mission, the CDB has taken following actions: supporting the development of national infrastructure, basic industry, key emerging sectors, and national priority projects; promoting coordinated regional development and urbanization by financing low-income housing, small business, agricultural/rural investment, education, healthcare, and environment initiatives; facilitating China’s cross-border investment and global business cooperation.75
History
The CDB was founded in 1994 out of six state-owned investment companies that were created in 1988. The CBD was responsible for the management and operation of fixed asset investment projects funded by the central government.76 The newly created CDB was set up as a government administered policy bank under the direct leadership of the State Council with the mandate to mobilize stable long-term finance to support key development projects, specifically in infrastructure. The birth of CDB reflected the determination of the Chinese government to establish a more market-oriented economy, as China was transitioning from a planned economy to a market economy in the mid-1990s.77
When China first began to open up in the 1970s there was a need for rapid industrialization and urbanization, but little available long-term financing.78 The CDB was created to fix this problem, but by the 1990s China’s nascent capital market and stringent fiscal constraints made it unlikely any bank would succeed, despite the economic boom. The lack of open-markets combined with the poor performing loans that the CDB inherited from its predecessors, rendered the bank ineffectual for a period of time.79
In 1996 the CDB had NPLs of 47.6% and was endanger of going bankrupt due to excessive government intervention.80 The CDB not only relied on the central government’s initial RMB 50 billion capital injection, but also disproportionately depended upon the People’s Bank of China (PBoC) administrative order to force financial institutions to purchase the CDB’s bonds. The CDB was the first bank in China that issued bonds as a major funding source, which helped to turn short-term household saving into long-term funds.81 The CDB used a method named “administratively apportioned bond issuance (xingzheng paigou fazhai)” to raise funds. The PBoC required domestic financial agencies such as commercial banks, urban credit cooperatives, and the Postal Savings and Remittance Bureau to purchase policy-bank bonds. Each purchaser was assigned a quota and was required to buy their amount at a given price.82 That is to say, the PBOC determined the volume, yield and purchasers of these bonds. With such rules of play, when CDB attempted to expand its business, it inevitably brought more pressure for the other
China Development Bank tower, Shanghai, China © Shutterstock/Brookgardener.
COLUMBIA CENTER ON SUSTAINABLE INVESTMENT | 25
DEVELOPMENT BANKING IN THE GLOBAL ECONOMY STATE OF PLAY AND FUTURE DIRECTION
commercial banks to buy more CDB bonds. Besides, CDB bonds had no liquidity in the secondary market at that time. With growing assets and large NPLs on CDB’s balance sheet, the commercial banks complained and opposed this compulsory arrangement by demanding a higher yield rate premium to purchase CDB bonds. CDB’s financial costs, in turn, increased.83
The turning point occurred in the wake of the Asian financial crisis in 1997 when credit and systematic risks in China had accumulated to an alerting level.84 To guard against the turbulent financial crisis, the high-level National Financial Working Conference held in November 1997 prioritized the task of mitigating financial risks.85 To achieve this goal, the central government decided to improve the operation and management of all policy banks to fully respect their operational autonomy from excessive government interference. Against this broad background Mr. Yuan Chen, the former deputy governor of PBOC, assumed the leadership role in CDB in April 1998 with the primary task of controlling credit risk.86
Under Chen’s leadership, CDB embarked on credit reforms from 1998 to 2000. The first round of credit reform aimed to establish an internal risk control mechanism for new loans, including strengthening market analysis to improve the quality of loan reviews, bolstering basic management and monitoring indictors, building the whole-process risk management, and establishing market-oriented autonomous operational mechanisms.87 Moreover, CDB began to proactively incubate new loans instead of simply reviewing the loans nominated by the central government.
The second round of credit reform was to resolve bad debt. Stripping off bad assets was a major step. In June 1999, the State Council agreed that the newly-established national asset management company – Xinda Asset Management Company – would purchase RMB 100 billion of non-performing assets, which was completed in December 1999.88
The CDB also made every effort to resolve bad loans, including resorting to legal suits to compel financially capable borrowers to repay overdue loans, utilizing debt-to-equity swaps to solve bad loans of state-owned enterprises, facilitating the reorganization of multiple stakeholders with conflicts of interest, linking new loans with the repayment of overdue loans, and relying on the political capital of local governments to resolve bad loans.89
During this time China transitioned from an apportioning system to an auction system.90 This reform allowed market-raised bonds to be resold, which generated bond sales and energized the bond market, in essence funding the CDB. Even today when financial agencies or corporations issue bonds, CDB bonds are still considered a benchmark. Although the PBOC liberalized the yield and the amount of CDB bond issues, it still had the authority to regulate the list of bidders who could join the auction to purchase CDB bonds.91 In the first few years after its first market fund-raising attempt, the CDB was still partially supplemented by capital raised through administrative apportionment, mostly from postal savings. This was a favor given by
the PBOC to assist the CDB's transition from administrative apportionment to bond auctions.92
During the same period, the CDB adopted many other international practices to improve its appraising, lending and auditing processes, turning it into a bank that functioned with rigid market-standards and building its own credibility in accordance with international banking regulations and standards. Because of this, the bank’s NPL ratio dropped from nearly 50% at inception to below 1% today.93 The reforms also gave the CDB political power – it was able to challenge the authority of the ministries that coordinated the economy, and turn down projects that did not meet banking appraisal standards.
Infrastructure Investment
The CDB is at the heart of the system that has spurred domestic investments in infrastructure – the so called local government financing vehicle (LGFV).94 The scheme was created by the CDB as a solution to help local authorities that, as a consequence of China's fiscal recentralization reform of 1994, found themselves with limited control over tax revenue and the impossibility to issue bonds to finance new projects.95 The LGFV mechanism allows local governments to set up companies that borrow loans from the CDB and other banks, using land as collateral. The authorities pay the interest on their loans by selling or leasing the same land. Therefore, the system depends on high land values and on the revenue the local governments generate.96
International Investment
In the past decade, the CDB gained its international reputation by lending massively both inside and outside China, financing highways, airports, power plants and various other industrial and infrastructure projects. In 2018, the CDB disbursed US$ 251 billion on-balance sheet foreign-currency loans.97 This portion alone is more than twice as large as the total disbursement of loans, grants, equity investments, and guarantees of the World Bank Group.
In order to be eligible for these loans a project must meet one of these four criteria:98
1. The project will help develop natural resources in relatively short supply in China.
2. The project will promote overseas production and basic infrastructure projects aimed at fostering the export of Chinese technology, goods and equipment or Chinese manpower.
3. The project is part of an overseas R&D center using advanced overseas technology, management skills and skilled manpower.
4. The project is part of a mergers and acquisitions of overseas companies in order to make Chinese companies more competitive and better able to capture a share of overseas markets.

Governance
The CDB has 13 directors (top-level leaders). Three of them are executive directors directly managing the bank, including the head of the bank. All three have come from state-owned commercial banks. Four of the directors are government-agency directors from four ministerial-level government organizations. ie. NDRCv, MOFvi, MOFCOMvii, and the Peoples Bank of China.99
Although the CDB is currently a state-owned enterprise it has four different shareholders: the Ministry of Finance, Central Hujin Investment Ltd., the National Council for Social Security Fund, and the Buttonwood Investment Bank.100
The Ministry of Finance: The Ministry of Finance is a unit of the State Council in China. It consists of the administrative and regulatory body responsible for managing fiscal revenues and expenses. Its activities include the formulation of budgetary and fiscal policies and financial supervision over all policy banks.101
Central Hujin Investment: Hujin is a state-owned corporation with authorization from the State Council, to invest in the main state-owned financial institutions.102
The National Council for Social Security Fund: The National Council is a governmental agency responsible for the management and functioning of the National Social Security Fund. It is under direct leadership and supervision of the State Council.103
Buttonwood Investment Bank: Buttonwood was founded in 2014 and is solely owned by China’s State Administration of Foreign Exchange. Its objective is to diversify channels of investment of China’s foreign exchange reserves.104
Funding
Unlike commercial banks, the CDB does not accept deposits from individuals. Most of the CDB's depositors are either financial agencies that have business relations with the bank or local municipalities that deposit small funds after borrowing money, mostly for infrastructure projects.105
The CDB generally has closer relationships with local governments than commercial banks do. Since 1989, budgetary law has prohibited local governments in China from incurring debt.106 However, under the tax-sharing system, local governments retain only approximately 30% of tax revenue.107 As a result, while local governments are responsible for infrastructure development, they do not have the money to do so. To solve this dilemma, in 1998 the CDB began to work with local governments to help them create 100% state-owned companies as their borrowing platforms.108 Local governments are thus able to use these companies to borrow from banks off the balance sheet.
The CDB's funding mechanism is majority market-based. It raises most of its funds (about 65% of its total liabilities)109 from capital market through bond auctions, and has become one of China's largest bond issuers.
CDB’s hybrid financing model includes two parts; to issue bonds in the capital market and to use state guarantees to make domestic investors purchase them.110 CDB bonds enjoy ‘zero-risk weighting’ granted by the China Banking Regulatory Commission.111 This means that the risks that investors bear for holding CDB bonds is zero – they are as safe as government bonds and that investors do not have to set capital against them. Most CDB bonds are sold to domestic investors, with the majority going to the state-owned commercial banks.112 In other words, although the CDB uses market means to raise funds, issuing bonds via auctions, the actual capital flow takes place mainly between state actors in a domestic setting (from state-owned commercial banks to state-owned policy banks).
The government props up the CDB by allowing for interest rates that no other entity can compete with. For example, in 2018 the interest rate on deposits from financial agencies such as commercial banks was approximately 3%, compared to the rate for CDB clients which was only 0.79%.113 The yield on bond issues, however, was 4.16%.114 That is to say, the cost of raising capital from the bond market was considerably higher than that of drawing from direct deposit.
Future of CDB
In January 2007 Prime Minister Wen Jiabao announced that the CDB and the other two policy banks – the Agricultural Development Bank of China and the Export-Import Bank of China – would become commercial entities.115 To implement the commercialization reform, the CDB was restructured into a joint-stock corporation after a capital injection from state-owned entities such as Central Huijin Investment Ltd. in 2008.116 To diversify its business model in preparation for the commercialization, the CDB established subsidiaries such as China Development Bank Leasing, founded in 2008, China Development Bank Capital in 2009, and China Development Bank Securities in 2010.117 However, the process of commercialization is on hold, indicating that there is still resistance in parts of the government to the expanding role of the CDB.
The future of the CDB is unclear as it is uncertain whether the bank will be transformed into a profit-maximizing commercial bank or carry on with its mission of providing long-term finance to fulfill public policy objectives. Even with potential commercialization there are still questions of whether or not the CDB would be subject to the identical financial regulation as commercial banks are, or if the CDB could continue to rely on sovereign creditworthiness to raise funds at a cheaper price. However, when the CBRC assigned the CDB with a permanent zero-risk weighting in 2015, it assured the bank’s credit guarantee, as well as protecting its status regardless of its future make-up.118
26 | COLUMBIA CENTER ON SUSTAINABLE INVESTMENT
PART IV. CASE STUDIES
NOTE
v The NDRC is the National Development and Reform commission in charge of monitoring China’s macroeconomic performance.
vi MOF is the Ministry of Finance, a cabinet-level executive department of the State Council which administers macroeconomic policies and the annual budget.
vii MOFCOM is the Ministry of Commerce and is responsible for all foreign trade and all export/import regulation.
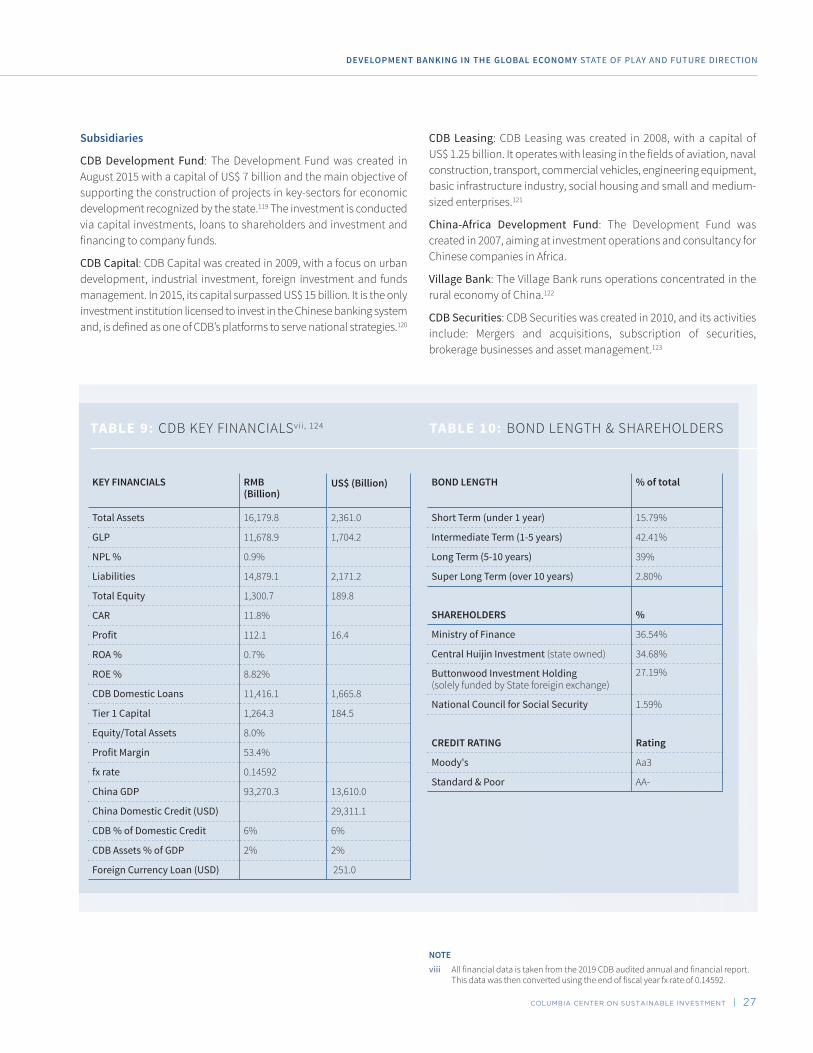
COLUMBIA CENTER ON SUSTAINABLE INVESTMENT | 27
DEVELOPMENT BANKING IN THE GLOBAL ECONOMY STATE OF PLAY AND FUTURE DIRECTION
Subsidiaries
CDB Development Fund: The Development Fund was created in August 2015 with a capital of US$ 7 billion and the main objective of supporting the construction of projects in key-sectors for economic development recognized by the state.119 The investment is conducted via capital investments, loans to shareholders and investment and financing to company funds.
CDB Capital: CDB Capital was created in 2009, with a focus on urban development, industrial investment, foreign investment and funds management. In 2015, its capital surpassed US$ 15 billion. It is the only investment institution licensed to invest in the Chinese banking system and, is defined as one of CDB’s platforms to serve national strategies.120
CDB Leasing: CDB Leasing was created in 2008, with a capital of US$ 1.25 billion. It operates with leasing in the fields of aviation, naval construction, transport, commercial vehicles, engineering equipment, basic infrastructure industry, social housing and small and medium-sized enterprises.121
China-Africa Development Fund: The Development Fund was created in 2007, aiming at investment operations and consultancy for Chinese companies in Africa.
Village Bank: The Village Bank runs operations concentrated in the rural economy of China.122
CDB Securities: CDB Securities was created in 2010, and its activities include: Mergers and acquisitions, subscription of securities, brokerage businesses and asset management.123
NOTE
viii All financial data is taken from the 2019 CDB audited annual and financial report. This data was then converted using the end of fiscal year fx rate of 0.14592.
TABLE 9: CDB KEY FINANCIALSvii , 124
KEY FINANCIALS RMB (Billion)
US$ (Billion)
Total Assets 16,179.8 2,361.0
GLP 11,678.9 1,704.2
NPL % 0.9%
Liabilities 14,879.1 2,171.2
Total Equity 1,300.7 189.8
CAR 11.8%
Profit 112.1 16.4
ROA % 0.7%
ROE % 8.82%
CDB Domestic Loans 11,416.1 1,665.8
Tier 1 Capital 1,264.3 184.5
Equity/Total Assets 8.0%
Profit Margin 53.4%
fx rate 0.14592
China GDP 93,270.3 13,610.0
China Domestic Credit (USD) 29,311.1
CDB % of Domestic Credit 6% 6%
CDB Assets % of GDP 2% 2%
Foreign Currency Loan (USD) 251.0
TABLE 10: BOND LENGTH & SHAREHOLDERS
BOND LENGTH % of total
Short Term (under 1 year) 15.79%
Intermediate Term (1-5 years) 42.41%
Long Term (5-10 years) 39%
Super Long Term (over 10 years) 2.80%
SHAREHOLDERS %
Ministry of Finance 36.54%
Central Huijin Investment (state owned) 34.68%
Buttonwood Investment Holding (solely funded by State foreigin exchange)
27.19%
National Council for Social Security 1.59%
CREDIT RATING Rating
Moody's Aa3
Standard & Poor AA-

28 | COLUMBIA CENTER ON SUSTAINABLE INVESTMENT
PART IV. CASE STUDIES
TABLE 11: GLP BREAKDOWN & LIABILITIES
INDUSTRY RMB (Billion) US$ (Billion) % of total
Railways 850.2 124.1 7.3%
Highways 1,885.0 275.1 16.1%
Electric Power 961.2 140.3 8.2%
Public Infrastructure 1,325.6 193.4 11.4%
Urban Renewal 3,200.0 467.0 27.4%
Emerging Industries 1,183.1 172.6 10.1%
Other 2,273.9 331.8 19.5%
INDUSTRY
Deposits 5,035.7 734.8
Customer Deposits 1,667.7 243.4
Bank Deposits 3,368.0 491.5
Long Term Funding 9,337.0 1,362.5
Borrowings from Government 428.0 62.5
PV panels, Shanghai, China. © Shutterstock/ArtisticPhoto
COLUMBIA CENTER ON SUSTAINABLE INVESTMENT | 29
DEVELOPMENT BANKING IN THE GLOBAL ECONOMY STATE OF PLAY AND FUTURE DIRECTION
KfW GROUP
KfW was initially founded in 1948 to finance the reconstruction of war-torn Germany after World War II. The initial capital of the KfW was financed by Marshall Plan resources, provided by the US government.125 With money from the Marshall Plan amounting to the equivalent of EUR 1 billion, KfW funded the reconstruction of the German economy. When KfW was founded it initially played a capital development role, which in the 1960s was supplemented with new programs aimed at new ventures supporting SMEs and technological innovation. Today KfW is owned 80% by the German Federal Government and 20% by the German States.126
KfW has expanded significantly over the years, both in Germany and internationally. More broadly, one of the key features of the KfW, both domestically and internationally, has been that much of its lending has been driven by a strategic direction from the German government. For example, KfW played a major role in funding and creating jobs in East Germany, post unification.127 Its large scale and its function as a German government instrument to implement policy, like the clean energy strategy,128 has allowed it to play a key role in Germany to finance one of the most important energy transformations in Europe. The organization of KfW’s operations has changed throughout the years and the KfW Group is currently divided into four functional divisions.
Two divisions are responsible for promoting investments in the German economy:
1. The Mittelstandsbank, which invests in SME’s, business start-ups, and entrepreneurs domestically.
2. The Kommunal- und Privatkundenbank/ Kreditinstitute (Municipal and Private Client Bank/Credit Institute), which oversees KfW’s housing programs, energy efficiency, and other macro-investments in the environment and climate protection areas. The subsidiary also provides educational finance for private clients in Germany, as well as financing for public investments in infrastructure projects and urbanization. The majority of this funding is done through municipalities and regional promotional banks.129
The other two divisions are the international investment wing of KfW.
1. The KfW IPEX-Bank is the export-import leg of KfW, promoting German industry abroad and structuring finance for selected projects by German companies abroad, mostly in the energy sector (examples include power plans and grid lines throughout the EU).130
2. The other wing of international investments is KfW DEG (Deutsche Investitions- und Entwicklungsgesellschaft) also known as the KfW Development Bank.131 The DEG is responsible for development aid and other investments in developing countries. In 2013, KfW also established a foundation, the KfW Stiftung, which is responsible for promoting initiatives related to major societal challenges that the government believes will result in smart, sustainable, and inclusive growth.132
Barriers to Financing
By taking a capital provision role, KfW has successfully addressed investment gaps for projects with very large upfront capital costs as well as gaps that arise owing to reduced global and local investment activity. This role in both capital accumulation and policy coherence should allow KfW to take a countercyclical role during times of economic downturn.
This supports the concept that an increase in KfW financing can play a key role in addressing structural barriers that exist for traditional private sector funders in times of political and economic uncertainty. To address these barriers, KfW offers project developers concessional fixed-rate, long-term debt via on-lending programs through local banks.133
In this case the local bank is awarded a fee for ‘originating’ the deal and can choose to take a portion of the loan onto its own books, essentially risk-sharing the project with KfW. In addition, KfW provides standardized project risk assessment profiles and due diligence processes for the local banks to follow when considering whether to lend to a project.134 This simultaneously allows KfW access to the clients of local banks, project developers to receive cheaper debt, while local banks can thoroughly ascertain the risk of any prospective project.
KfW Refinancing
KfW refinances its lending activities mainly in the international money and capital markets. The main currencies in which it borrows are US dollars and Euros, though it also uses other currencies.135 It benefits from a statutory guarantee of the German Government and associated top long-term ratings of AAA (from Fitch and Standard & Poor’s) and Aaa (from Moody’s).136 This allows KfW to issue bonds and lend at favorable terms. The main investors who buy KfW bonds are institutional investors, followed by retail investors. The main instruments used are loans, representing approximately 70%, and grants, representing around 25%.137 The rest are smaller instruments, such as equity, guarantees, and mezzanine finance Funds from the financial markets. These are supplemented by budget funds from the German Government for activities requiring an additional subsidy, for example higher concessions, such as innovation and startup finance and development assistance.
Domestic Financing
Domestically, KfW does not technically engage in project financing but reaches out to the mass-market through financial intermediaries (Hausbankprinzip).138 The financial intermediary has both a contract with KfW specifying the terms of the loan and with the client. The financial intermediary selling the KfW product fully bears the credit risk. The exceptions to this practice of working through financial intermediaries are a few large programs, such as the KfW Offshore Wind Energy Program.139 KfW can co-finance its programs with commercial banks’ own lending; however, it does not have to co-finance with these banks, and in some cases can lend up to 100%. In this aspect, it is different from other development banks; for example, the European Investment Bank typically finances no more than 50% of a project, with the rest being provided by commercial banks or private investors.140

30 | COLUMBIA CENTER ON SUSTAINABLE INVESTMENT
PART IV. CASE STUDIES
KfW focuses heavily on SMEs, but funding for large firms is available, only when considered a governmental priority and if the company observes strict environmental regulations. KfW offers loans in all sizes, and loan products include subsidized interest rates, or even grace periods for repayment. Loans are not limited to German firms, however, and are available to foreign firms headquartered in Germany, firms located outside of Germany that are either subsidiaries of German firms or have a majority Germany ownership.141
In addition to supporting private firms, the KfW also offers products for municipalities, state owned enterprises (SOEs), public private partnerships (PPPs), and charities.142 These loans serve a variety of needs including urbanization, social program development, and investment in infrastructure. On the social side, the KfW is developing a strong focus on products addressing environmental sustainability, and much of the public lending is conducted under the auspice of supporting greater energy efficiency.143
Additionally, a variety of products are also available for firms seeking “green certification,” including products for remodeling homes and office buildings. Domestic lending is also used to support education, and a wide variety of products, including direct and indirect loans, along with grants for specific areas, are available to German citizens to further their education, primarily focused on post-secondary education and professional development.144
Equity financing is another key tool used by KfW to stimulate the domestic economy. Equity investments are focused on SMEs and made indirectly through private equity firms.145 That is, KfW does not directly pick the firms for investment, but relies on specialized firms to choose the entrepreneurs to be supported. Direct investment is occasionally made in social enterprises through a partnership fund-matching model. The loans from KfW are subordinated, which improves the recipient firms’ ability to access funding from other sources. These indirect, subordinated loans are also available to firms working on improving their products, processes, or services.
The KfW also offers indirect loans to individuals for use in building or buying their own homes. Local authorities, municipal enterprises, and community associations are also eligible for indirect loans for investment in housing projects, acquisition of land (for future construction projects), and investment in social infrastructure.146 Direct lending only occurs to priority areas directed by the bank’s board and for international clients.
International Financing
Though KfW emphasizes the creation of markets in Germany, the bank has shifted its focus to international markets over the past 20 years. Germany’s role as a policy and financial leader in the EU is in large part due to the increased funding of KfW projects abroad.147 The KfW IPEX
KfW building, Frankfurt, Germany © Shutterstock/Oleksiy.

COLUMBIA CENTER ON SUSTAINABLE INVESTMENT | 31
DEVELOPMENT BANKING IN THE GLOBAL ECONOMY STATE OF PLAY AND FUTURE DIRECTION
Bank supports exporters in various sectors including aviation, in which the KfW has provided support to Airbus. IPEX Bank loans are issued at market rates. The KfW also provides international loans to foreign governments so that these governments can hire German companies to implement key projects, typically related to infrastructure.148
KfW also offers a vast portfolio of products to foreign governments in support of either social impact initiatives or of markets integral to the profitability of German firms. Financial products include development, promotional, or standard loans, a combination of grants and loans, or straight grant funding.149 Rather than offering
predefined products, the KfW customizes the financing instrument to each specific case. Some programs receive subsidies from the Federal Government, some come directly from KfW funding, and some are funded through external capital markets and simply intermediated by KfW.
Governance
KfW is regulated directly by the country’s Minister of Finance and Minister of Economics and Technologyix and complies with selected rules from the German Banking Act.150
NOTES
ix Since 2013 this became the Minister for Economic Affairs and Energy.
x All financial data is taken from the 2019 KfW audited annual and financial report. This data was then converted using the end of fiscal year fx rate of 1.1234.
TABLE 12: KfW KEY FINANCIALSx, 151
KEY FINANCIALS € (Billion) US$ (Billion)
Germany Credit to Private Sector € 4,657.2 $ 5,231.9
KfW % of Domestic Credit 10.4%
Total Assets € 506.0 $ 568.5
Outstanding Loans € 486.2 $ 546.2
Equity € 31.4 $ 35.2
Net Income € 1.4 $ 1.5
Disbursements € 80.6 $ 90.5
Loans to Banks € 309.5 $ 347.7
Loans to Customers € 101.9 $ 114.5
Equity € 31.4 $ 35.2
Tier 1 Capital 21.3%
Annual Disbursements € 77.3 $ 86.8
ROE 4.4%
Short Term Funding € 22.0 $ 24.7
Long Term Funding € 483.5 $ 543.1
NPL 0.02%
ROA 0.28%
Default 1.90%
Bonds Issued € 430.4 $ 483.5
TABLE 13: FUNDING & KfW BONDS
FUNDING € (Billion) US$ (Billion)
Domestic Promotion € 43.4 $ 48.76
SME Banks € 36 $ 40.44
Financial Markets € 1.40 $ 1.57
International Business € 32.70 $ 36.74
IPEX-Bank (Export-Import) € 22.10 $ 24.83
KfW Development Bank € 8.80 $ 9.89
Total € 77.70 $ 87.29
KfW BONDS (TYPE OF BOND) % of Total
Green Bonds 10%
Benchmark Programs 57%
Public Bonds 28%
Private Placements 5%
Currency % of Total
EUR 52%
GBP 12%
USD 24%
CNY 1%
NOK 2%
Other 9%
Total € 80.60 $ 90.55

32 | COLUMBIA CENTER ON SUSTAINABLE INVESTMENT
PART IV. CASE STUDIES
TABLE 14: LOANS TO BANKS & CUSTOMERS
LOANS TO BANKS € (Billion) US$ (Billion)
On Demand € 4.8 $ 5.4
3 Months € 20.0 $ 22.4
3 months- 1 Year € 33.7 $ 37.9
1-5 years € 138.4 $ 155.5
More than 5 Years € 109.6 $ 123.1
LOANS TO CUSTOMERS
No-fixed € 11.4 $ 12.8
3 Months € 2.9 $ 3.3
3 months- 1 Year € 8.8 $ 9.8
1-5 years € 39.6 $ 44.5
More than 5 Years € 38.5 $ 43.3
TABLE 15: CREDIT RATING & RISK
CREDIT RATING (RATING AGENCY)
CREDIT RATING
Moody's Aaa
Scope Ratings AAA
S&P AAA
TOTAL CREDIT RISK %
Investment Grade 75%
Default 2%
Non-Investment Grade 20%
Watch List 3%

COLUMBIA CENTER ON SUSTAINABLE INVESTMENT | 33
DEVELOPMENT BANKING IN THE GLOBAL ECONOMY STATE OF PLAY AND FUTURE DIRECTION
NATIONAL BANK FOR AGRICULTURE AND RURAL DEVELOPMENT (INDIA) - NABARD
NABARD is the apex financial institution that implements the Government of India’s (GoI) policies on planning and credit dispensation to agricultural and rural sectors throughout the country. NABARD was founded in 1981 through an act of parliament (NABARD Act, 1981).152 The bank was set up with an initial capital of 1 billion rupees. Throughout much of its history NABARD was a shared entity with 50% being owned by GoI and the other 50% owned by the Reserve Bank of India (RBI).153 However, today NABARD is owned entirely by GoI. NABARD was set up to provide and regulate credit and other facilities, with the aim of supporting integrated rural development and securing prosperity in the rural areas through the promotion of: agriculture; small-scale, cottage and village industries; handicraft and other rural crafts; as well as similar economic activities.154
The management of the affairs and business of the NABARD vests in a Board of Directors appointed by the Government of India in consultation with the RBI. The Board consists of a Chairman, a Managing Director and other Directors.155 Among the other Directors to be appointed on the Board, three are experts in rural economics, rural development, cottage and village industries, small scale industries, persons having experience in cooperative banks or regional rural banks or commercial banks etc., two directors are from the directors of the RBI, three directors are officials of the Government of India and four are state government officials.156 There is an Advisory Council in NABARD consisting of directors of NABARD and such other persons who in the opinion of NABARD have special knowledge of subjects with which NABARD is concerned.
NABARD refinances the entire cooperative credit system and banks around India through short- and long-term loans to help facilitate the flow of agricultural credit. NABARD also plays a role in strengthening the cooperative banking structure in order to create a sustainable rural financial system that enhances ground level credit flow to farmers and others in rural areas. NABARD has a far-reaching mandate that goes beyond that of a traditional development or policy bank. The institution is the leader in technology and innovation financing as well as policy planning for the agriculture sector in India, playing an outsized role in agricultural outputs and inputs.157
In 2019, NABARDs loan book stood at roughly 432,000 crore,xi up more than 22% from a year earlier and increasing at a compounded annual growth rate of 15% over the past five years. NABARDs loan book is divided into two segments: direct finance and refinance book. Direct finance accounts for 48% of all loans at 208,000 crore. These loans include the direct transfer of loans to state government and other agencies for rural infrastructure development, loans to cooperative banks, as well as loans to NGOs that take part in “agricultural practices.” Of the total direct loans, about 60% are towards loans under the Rural Infrastructure Development Fund (RIDF) while 16% are towards the Long Term Irrigation Fund (LTIF).158
The rest of the loans (52% or 222,000 crore) made by NABARD go towards refinancing. These loans go to state government commercial banks, State Cooperative Agriculture and Rural Development Banks (SCARDBs), and regional rural banks (RRBs) as refinance against the loans disbursed by them to the final borrowers.159 Of the total refinance loan book, about 70% is towards medium and long-term irrigation projects while 30% is towards production and marketing credit.160
NABARDs loans are extended to State Governments at 6% per annum and the difference between the cost to fund the loan for NABARD and 6% is compensated by GoI interest subvention, allowing NABARD to lend at below market rates.161
NABARD has a strong capitalization with a capital adequacy ration (CAR) of 18.96% and low asset related risks.162 NABARD's capital is also supported by a regular infusion of capital by from the GoI and steady, all be it small, return on investment. Despite a large share of NABARD's lending going to borrowers with inherently weak credit risk NABARDs non performing loans (NPL) is extremely low a 0.038%.163 This low NPA is due to the strong asset protection measures in place. To ensure the quality of its assets, the eligibility criteria for refinance is linked to net NPAs of scheduled commercial banks (SCBs), State Cooperative Banks (STCBs), RRBs, and primary urban cooperative banks (PUCBs). Not only are there strict eligibility requirements, but a majority of advances are backed by guarantees from both state governments and the GoI. Additionally, due to its role in policy creation NABARD has the option to request the Reserve Bank of India (RBI) to debit from the current account of borrowers if defaults were to occur. In most rural areas NABARD is the only source of funding available, so repayment takes precedence over other obligations. This helps contribute to NABARDs low NPL rate.164
Resource Profile:
• 18% of loans are in the form of long-term borrowings (corporate bonds, Bhavishya Nirman bonds, tax free bonds, and term loans).165
• 12% of loans are towards short-term borrowings (commercial paper, certificates of deposit, term money borrowings).166
• 55% of loans go towards what the GoI has termed Priority Sector Lending (PSL). These loans encompass the RIDF, Warehousing, Infra, Food Processing Fund, Long Term Rural Credit [LRTC], Short-Term Cooperative Rural Credit [STCRC] Fund Deposits, and Short-Term Regional Rural Banks [RRB] Fund Deposits.167
• 15% of borrowings go to GoI schemes. These bonds, raised by NABARD, provide funding for the Long-Term Irrigation Fund, Pradhan Mantri Aawas Yojna-Gramin (PMAY-G), and Swatch Bharat Mission-Gramin (SBM-G). These bonds will be fully serviced by GoI.168
NOTE
xi A Crore denotes ten million and is equal to 100 lakh in the Indian numbering system.

34 | COLUMBIA CENTER ON SUSTAINABLE INVESTMENT
PART IV. CASE STUDIES
Rural Infrastructure Development Fund (RIDF) The RIDF was set up in 1995 to increase finance into rural infrastructure projects. NABARD is the fund manager for RIDF. Domestic commercial banks contribute to the Fund in specific priority areas when federal funding is not available. The Fund primarily provides loans to State Governments and State-owned corporations to enable them to continue infrastructure projects.169
NABARD Infrastructure Development Assistance (NIDA) NABARD Infrastructure Development Assistance (NIDA), was created to complement RIDF and provide funding where the state government is unable to. This line of credit is open to financially sound state-owned institutions and corporations with sustained income streams.170
Credit Facility to Marketing Federations (CFF) In order to strengthen the arms of Marketing Federations/Cooperatives, NABARD established a separate line of credit, which promotes marketing of agricultural produce and other farm activities. The eligible institutions are Marketing Federations and Corporations, registered Companies and other Cooperatives. NABARD provides a credit facility to state entities engaged in procurement of food grains, aggregation, storage as well as supporting product marketing and practices that add value to products, so that farmers can receive increased financial returns.171
Warehouse Infrastructure Fund (WIF) The fund is used for providing loans for construction of warehouses, silos, cold storage, and other cold chain infrastructure in the public and private sectors.172
SHG–Bank Linkage Program (SBLP) SBLP is the world’s largest micro finance movement, which organizes its borrowers into savings groups and links them with banks and other credit facilities.173
Long Term Rural Credit Fund (LTRCF) In order to boost capital formation in agriculture, GoI set up the LTRCF to exclusively provide long-term refinance support to Cooperative Banks and RRBs.174
Short-Term Cooperative Rural Credit Refinance Fund (STCRC) The STCRC was created to augment NABARD’s resources to extend short-term credit facilities to cooperative institutions.175
Short-Term Rural Credit (Refinance) Fund for Regional Rural Banks (STRRB) The STRRB was created in order to augment NABARD’s resources to extend short-term credit to RRB.176
Cooperative Development Fund (CDF) NABARD provides both financial as well as technical support to rural cooperative credit institutions. Financial support is provided through the CDF while technical, capacity building, and knowledge-sharing support comes from the Centre for Professional Excellence in Cooperatives (C-PEC), established at Bankers Institute of Rural Development (BIRD).177
Sustainable Development
NABARD has taken various initiatives in addressing the challenges posed by climate change particularly in the areas of agriculture and rural livelihood. Below are several of NABARDs funds focused on sustainable development.178
Wind turbines, Kanyakumari, India © Shutterstock/Paassen.

COLUMBIA CENTER ON SUSTAINABLE INVESTMENT | 35
DEVELOPMENT BANKING IN THE GLOBAL ECONOMY STATE OF PLAY AND FUTURE DIRECTION
• Adaptation Fund (AF)
• National Adaptation Fund for Climate Change (NAFCC)
• Direct Access Entity to Green Climate Fund (GCF)
• Climate Change Fund (CCF)
• NABARD was one of the chief consulting agencies in charge with creating India’s National Development Strategy and has drafted their own Sustainable Development Plan (SDP).
Corporate Investments
NABARD has invested in ten companies, the operations of which have an impact on agriculture and rural development, in the economy.179
1. Agricultural Insurance Corporation of India Limited (AICIL): ₹60 crore
2. Agriculture Finance Corporation (AFC): ₹1 crore
3. Small Industries Development Bank of India (SIDBI): ₹966.28 crore
4. National Commodity Exchange (NCDEX): ₹16.88 crore
5. Multi Commodity Exchange (MCX): ₹0.30 crore
6. CSC e-Governance Services India Limited (CeGSIL): ₹9.75 crore
7. Agricultural Skill Council of India (ASCI): ₹0.004 crore
8. National e-Governance Services India Limited (NeSL): ₹1.50 crore
9. National e-Repository Limited (NeRL): ₹10.53 crore
10. Universal Commodity Exchange (UCX): ₹16 crore
NABARD has begun collaborating with the private sector on a corporate social responsibility (CSR) fund that blends financing from NABARD and the private sector to deliver development outcomes. These programs go towards providing various ecosystem services to rural communites through conservation and development of natural resources like soil, water crops, and horticulture.180
NOTE
xii All financial data is taken from the 2019 NABARD audited annual and financial report. This data was then converted using the end of fiscal year fx rate of 0.01446.
TABLE 16: KEY FINANCIALSxii
KEY FINANCIALS Crore US$ (Billion)
Investments 39,610.00 5.7
Loans/advances 432,010.00 62.5
Total Assets 487,470.00 70.5
Profits After Tax 3,365.00 0.49
Gross NPA 0.04%
ROE 8.29%
ROA 0.76%
CAR 18.96%
India GDP 2,719.0
India Total Credit 2,335.0
India Non-financial Credit 1,501.1
India Bank Credit 1,339.8
India Total Credit to Agriculture 162.8
NABARD Credit to Agriculture 57.7
NABARD % to National Agriculture Credit 35%
NABARD Total Credit 57.7
NABARD Total Assets USD 65.0
NABARD % to National Credit 2%
TABLE 17: CSR COLLABORATION & FUNDING
CSR COLLABORATION Crore US$ (Billion)
Total 36,669.90 5.3
NABARD 23,367.10 3.4
Private Sector 13,302.80 1.9
SOURCES OF FUNDING Crore US$ (Billion)
Capital 12,580.00 1.9
Reserves 31,094.00 4.5
NRC Fund 16,086.00 2.3
Grants 5,701.00 0.82
Government Schemes 1,244.00 0.18
Deposits 224,146.00 32.4
Bonds/Debt 105,802.00 15.3
Borrowing 77,925.00 11.3
Current Liabilities 12,888.00 1.9
Total 487,466.00 70.5
Tier 1 Capital 41,739.00 6.0
Tier 2 Capital 2,798.00 0.40
RWA 234,868.00 34.0

36 | COLUMBIA CENTER ON SUSTAINABLE INVESTMENT
PART IV. CASE STUDIES
TABLE 18: LOANS
LOANS Crore NPL Amount NPL % US$ (Billion)
Agriculture 432,144.00 133 0.03% 62.5
Central PSU 61.00 0 0.00% 0.009
State Governments 141,379.00 0 0.00% 20.4
Commercial Banks 58,665.00 0 0.00% 8.5
Regional Rural Banks 46,888.00 0 0.00% 6.8
Co-op Banks 76,915.00 0 0.00% 11.1
Private Sector (excluding banks) 72,069.00 133 0.18% 10.4
Other Funds 29,093.00 36 0.12% 4.2
State PSU 7,375.00 0 0.00% 1.1
Total 432,415.00 168 0.04% 62.5
TABLE 19: LOAN LENGTH
LOAN LENGTH Crore US$ (Billion)
1-14 Days 6,709.00 0.97
15-28 Days 5,911.00 0.84
29 Days-3 Months 10,926.00 1.6
3-6 Months 52,256.00 7.6
6 Months-1 Year 82,870.00 12.0
1-3 Years 114,935.00 16.6
3-5 Years 73,037.00 10.6
Over 5 Years 83,635.00 12.1
TABLE 20: CREDIT RATING & EXPOSURE
CREDIT RATING (RATING AGENCY)
CREDIT RATING
CRISIL AAA/Stable
Ind-Ra AAA/Stable
CREDIT EXPOSURE % OF TOTAL ASSETS
Largest Borrower 3.69%
Top 20 44.08%

COLUMBIA CENTER ON SUSTAINABLE INVESTMENT | 37
DEVELOPMENT BANKING IN THE GLOBAL ECONOMY STATE OF PLAY AND FUTURE DIRECTION
DEVELOPMENT BANK OF SOUTHERN AFRICA - DBSA
The Development Bank of Southern Africa (DBSA) was established in 1983, and is fully owned by the South African government. Originally designed to operate solely in South Africa and the apartheid-era “homelands” (in South Africa and present-day Namibia), DBSA broadened its scope of operations to the countries of the Southern African Development Community (SADC) in 1997.181 The DBSA’s role and function transformed under the new constitution, emerging as a national development bank with a sharp focus on infrastructure development in Southern Africa.
South Africa’s apartheid regime adopted a strategy of aggressive intervention in the economy through development banks such as DBSA in order to promote the development of capital accumulation for the Afrikaner population, an ethnic group descending from Dutch settlers. The objective was to industrialize itself through import substitution, industrialization, and to build a strong financial cushion against increasing international sanctions. For the apartheid regime, DBSA worked in tandem with the private sector to create a racially based industrial economy.182 During the collapse of the apartheid regime, DBSA played a role in forging an alliance of moderate Southern African states (Zimbabwe and Malawi) in order to stem the spread of outside influence. The idea was for this to be achieved through co-operation in joint infrastructural projects and by means of financial aid to be channeled through South Africa.183
In post-apartheid South Africa, DBSA has carved out a role in financing development projects with the aim of correcting some of the many inequities created throughout the years. Therefore, DBSA’s strategy takes a cue from the government’s “development” priorities with a keen awareness of the need to play an outsized role in the continued economic growth of South Africa, post-apartheid, as well as the Southern African Development Community (SADC) as a whole.184 According to the National Treasury, the current role of the DBSA is to promote “socioeconomic development and growth within South Africa and in the Southern African region”, and its primary purpose is to “contribute towards sustainable economic development and growth, human resource development and institutional capacity building through tapping into public- and private-sector resources locally and abroad.”185
As a Development Bank, DBSA sees its role as more than simply a lender. Its business is stated as being to “mobilize and provide loan finance, technical assistance and advice for sustainable development projects” but also, in addition, it “has become increasingly involved in economic reform issues pertinent to the environment in which it operates”. More specifically, DBSA focuses on providing financial support to expand social infrastructure (the delivery of basic services) and economic infrastructure (to eliminate capacity constraints and optimize economic growth potential). Lending is focused primarily on South Africa’s 283 municipalities, public utilities, state-controlled entities, and other proximate countries, majority being part of the SADC.xiii, 186
Despite its formal link to the SADC in DBSA’s legislation, the other countries receiving DBSA financing have no say in the bank’s governance. The bank is solely owned by the Government of South Africa and the entire board consists of South African citizens.187 Despite this make-up, the bank spends considerable resources on its neighboring countries. By statute, not more than one-third of total lending is allowed outside of South Africa, with current levels below 25% divided among 14 countries.188 Zambia has the largest portfolio of loans outside of South Africa (33% of total), followed by Angola (18%), Zimbabwe (15%), and Ghana (14.5%).189 Operations outside of South Africa do not require a guarantee of the host country government, nor does DBSA have preferred creditor status. Unlike operations within South Africa, financing in other countries is intended to support mainly commercially viable projects.190
The DBSA’s regional development and integration strategy, which includes the SADC, the Common Market for Eastern and Southern Africa (COMESA), and the UN Economic Commission for Africa (UNECA), aims to leverage infrastructure investments across the continent in order to improve connectivity and trade within Africa and boost the development of local industries and markets within South Africa.191
According to DBSA’s most recent annual report, the “The Bank is legally obliged to promote sustainable development through its operations and this is integrated into the Bank’s strategy…”.192 To fulfill this mandate in its lending operations, DBSA works together with the South African Department of Environmental Affairs (DEA) and the National Treasury in designing its operational plans in line with the national development strategy. The DBSA’s development position is also aligned with South Africa’s National Development Plan (NDP) Vision 2030, the African Union’s Agenda 2063, the United Nations’ Sustainable Development Goals (SDGs) and the Paris Agreement on Climate Change.193
DBSA Funding
One key issue facing DBSA in its efforts to support sustainable infrastructure is the relatively high price of loans it can offer. Based on its financing model—accessing resources mainly in a highly competitive domestic bond market—DBSA has a fairly high cost of funding, which it must pass on to borrowers to remain financially viable.194 This is particularly problematic in the case of shorter-term financing (where DBSA competes with private banks that take deposits) and in lending to countries outside of South Africa, where DBSA must fund itself in dollars.195 Within South Africa, DBSA is reasonably price-competitive on longer-term financing with private sources, but it is also slower and comes with more requirements on its loans, which dampens demand for its services.
The DBSA raises its funding from domestic and international capital markets, and also receives allocations from the National Treasury.196 The funding model employed by the institution is made up of a mix of internally generated sources and borrowing from international and domestic capital markets, supplemented by credit lines from
NOTE
xiii Ghana and Ethiopia are the only non SADC countries that receive funding from the DBSA.

38 | COLUMBIA CENTER ON SUSTAINABLE INVESTMENT
PART IV. CASE STUDIES
supranational and bilateral development finance institutions and commercial banks. The DBSA also receives funding from external development focused sources, that includes the Agence Francaise de Development (AFD), the European Investment Bank (EIB), the German Kreditanstalt fur Wiederaufbau (KfW), the Department for International Development (DFID) of the UK and the Japan International Cooperation Agency (JICA).197 More recently, the DBSA has signed a financing agreement with the EU to the tune of EUR 100 million to support project preparation and fund infrastructure investment.
Unlike most other NDBs in Africa, the DBSA relies on South Africa’s increasingly liquid domestic capital markets to fund the majority of its programs.198 While this allows DBSA to raise funds on its own, it also makes their cost of funding relatively high. Private banks in South Africa can also offer funding at competitive prices, and have less bureaucratic formalities than the DBSA.
The DBSA Approach
The DBSA relies on an integrated approach that emphasizes its experience in the infrastructure field to administer projects throughout South Africa. The five pillars of this approach are; planning, preparing, financing, building, and maintaining. The DBSA emphasizes the importance of creating programs that are able to exist outside of DBSA funding.199 For instance, several projects utilize the DBSA’s expertise in municipal infrastructure to create urbanization
renewal plans, while going outside the bank to find funding.
These projects aim to address challenges hindering infrastructure investment in South Africa, the SADC region and further afield on the African continent in Rwanda, Kenya, Ethiopia, Ghana and Nigeria.200 In many of these cases the key challenges are the availability of bankable projects, lack of capacity, capability in capital project planning as well as limited financing. Instead of just being a funder, the DBSA’s focus is providing planning to municipalities in order to develop a project pipeline that attracts both the private and public sector.
DBSA Governance
The DBSA is fully government-owned, and the sitting Minister of Finance serves as governor of the bank. The bank’s board has 13 members, of which five are currently from DBSA itself, five from the private sector, one a union leader, one academic and one the head of an urban non-profit. DBSA’s annual borrowing plan must be submitted to the National Treasury for approval, and it has statutory restrictions on capitalization (equity-to-loans minimum of 28.6%) and borrowing (maximum 2.5 times shareholder equity).201
DBSA Project Preparation Fund
The DBSA Project Preparation Fund provides funding for infrastructure projects in the transport, energy, information communication and
Electricians working on high voltage power lines, Johannesburg, South Africa. © Shutterstock/Sunshine Seeds.

COLUMBIA CENTER ON SUSTAINABLE INVESTMENT | 39
DEVELOPMENT BANKING IN THE GLOBAL ECONOMY STATE OF PLAY AND FUTURE DIRECTION
technology (ICT) and water and sanitation sectors in South Africa, the SADC region and selected African countries. The Fund provides assistance by creating an enabling environment that facilitates the implementation of infrastructure projects. Funding is provided for pre-feasibility studies, bankable feasibility studies as well as assistance with costs to reach financial close.202
Infrastructure Investment Program for South Africa (IIPSA)
The IIPSA is a joint European Union and South African government initiative, administered by the DBSA. It seeks to enhance sustainable economic growth and the delivery of key services affecting development in South Africa and in the SADC region.203 IIPSA, provides funding for infrastructure projects in South Africa and the SADC region. SADC projects must be trans-border involving two or more countries in the SADC region or a national project with a demonstrable regional impact on one or more countries in the SADC region.
Green Fund
The Green Fund is a unique national fund that supports green initiatives. The Fund’s objective is to assist the country’s transition to a low carbon, resource efficient and climate resilient development path to deliver high-impact economic, environmental and social benefits. Assistance is provided to projects through grants (recoverable and non-recoverable), loans (with concessional rates and terms) and equity.204 The funds go to green cities and towns, low-carbon economy and environmental and natural resource management.
SADC Water Fund
The DBSA is the appointed project executing agency for the SADC Regional Fund for Water Infrastructure and Basic Sanitation (Water Fund). The fund is part of the SADC Regional Development Fund (RDF), which is an instrument to further social and economic development and integration of the SADC region.205 The Water Fund is the key financing facility for the development and integration of the water sector in the region.
TABLE 21: KEY FINANCIALSxiv
KEY FINANCIALS ZAR (Million)
US$ (Million)
Total Disbursements 8,740 603.32
Disbursements to Local Governments 3,355 231.60
Social Disbursements 101 6.97
Economic Disbursements 3,581 247.20
SADC Disbursements 1,300 89.74
Non-SADC Country Disbursements 403 27.82
ROA 3.50% 3.50%
ROE 6.50% 6.50%
Permanent Government Funding 11,692 807.10
Available Liquidity 4,674 322.65
Debt to Equity Ratio 138% 138%
Top 10 Exposures 59% 59%
Top 20 Exposures 72% 72%
Total Assets 89,488 6,177.36
Total Equity 37,172 2,565.98
Total Liabilities 52,315 3,611.30
Development Loans 75,816 5,233.58
Development Bonds 1,290 89.05
TABLE 22: CREDIT RATING & OTHER DATA
CREDIT RATING Short Term
Long Term
Outlook
Moody’s Foreign Currency Ba2 Ba2 Negative
Moody’s National Scale P-1 .za Aa3. za Negative
S&P Foreign Currency BB- BB- Stable
S&P Local Currency BB BB Stable
OTHER DATA
FX Rate 0.06903
South Africa Domestic Credit (ZAR) 3,528,900.00
DBSA % of Credit 3%
South Africa GDP (USD) 368,300.00
DBSA % of GDP 2%
South Africa Domestic Credit (USD) 243,599.97
South Africa GDP (ZAR) 5,335,361.44
South Africa Infrastructure Investment (USD) 18,000.00
South Africa Infrastructure Investment (ZAR) 260,756.19
DBSA Infrastructure Investment (ZAR) 39,700.00
DBSA % of Infrastructure 15%
DBSA Infrastructure Investment (USD) 2,740.49
NOTE
xiv All financial data is taken from the 2019 DBSA audited annual and financial report. This data was then converted using the end of fiscal year fx rate of 0.06903.

40 | COLUMBIA CENTER ON SUSTAINABLE INVESTMENT
PART IV. CASE STUDIES
TABLE 25: LOANS - SECTOR
SECTOR LOAN TOTAL ZAR (Million)
NPL ZAR (Million)
LOAN TOTAL US$ (Million)
NPL US$ (Million)
NPL %
Commercial Total 1,388 966 95.81 66.68 69.60%
Fund 362 0 24.99 0.00 0.00%
Manufacturing 387 387 26.71 26.71 100.00%
Tourism 288 288 19.88 19.88 100.00%
Mining 111 111 7.66 7.66 100.00%
Other 240 180 16.57 12.43 75.00%
Communication and Transport Infrastructure 6,233 905 430.26 62.47 14.52%
Energy Total 48,701 185 3,361.83 12.77 0.38%
Electricity 47,376 0 3,270.37 0.00 0.00%
Non-Grid Standalone 1,325 185 91.46 12.77 0.39%
Human Resources 1,079 2 74.48 0.14 0.19%
Institutional Infrastructure 97 0 6.70 0.00 0.00%
Residential Facilities 2,593 287 178.99 19.81 11.07%
Roads/Drainage 12,396 704 855.70 48.60 5.68%
Sanitation 1,489 145 102.79 10.01 9.74%
Social Infrastructure 4,470 631 308.56 43.56 14.12%
Water 3,660 184 252.65 12.70 5.03%
Total 82,106 4,009 5,667.78 276.74 4.88%
TABLE 23: DEVELOPMENT LOANS
LOAN LENGTH ZAR (Million) US$ (Million)
1 year 14,594 1,007.42
1-2 Years 5,594 386.15
2-3 Years 8,553 590.41
3-4 Years 4,632 319.75
4-9 Years 23,483 1,621.03
9-14 Years 17,548 1,211.34
After 14 Years 7,702 531.67
Total 82,106 5,667.78
TABLE 24: OUTSTANDING DEBT
OUTSTANDING DEBT BY SOURCE %
Bank Lines 16%
MDBs 15%
Offshore Bonds 7%
JSE Bonds 62%
OUTSTANDING DEBT BY CURRENCY %
USD 4%
ZAR 70%
EUR 26%

COLUMBIA CENTER ON SUSTAINABLE INVESTMENT | 41
DEVELOPMENT BANKING IN THE GLOBAL ECONOMY STATE OF PLAY AND FUTURE DIRECTION
TABLE 26: LOANS - CLIENT
CLIENT CLASSIFICATION LOAN TOTAL ZAR (Million)
NPL ZAR (Million)
LOAN TOTAL US$ (Million)
NPL US$ (Million)
NPL %
DFI 352 6 24.30 0.41 1.70%
Education 1,029 3 71.03 0.21 0.29%
Local Government 26,089 469 1,800.92 32.38 1.80%
National/Provincial Government 2,617 0 180.65 0.00 0.00%
Private Sector 23,880 2,569 1,648.44 177.34 10.76%
Public Utilities 28,049 960 1,936.22 66.27 3.42%
Total 82,016 4,007 5,661.56 276.60 4.89%
Wind turbines, Western Cape, South Africa. © Shutterstock/Danie Nel Photography

42 | COLUMBIA CENTER ON SUSTAINABLE INVESTMENT
PART IV. CASE STUDIES
US DEVELOPMENT FINANCE ARCHITECTUREXV Introduction
The following section analyzes financial investment programs by the United States Federal Government Agencies that play a domestic “development finance” role in the US economy. In this specific case the term development finance is used to account for programs that play a role in catalyzing the private sector to increase investment in sustainable economic development within the US. While there are a multitude of grant and assistance programs offered by US agencies, this report looks only at debt and credit programs. This clearly does not encompass all programs that the Federal Government offers, but instead provides a comprehensive picture of the federal government development financing.
This type of development financing is not only used to finance projects that the private sector is unwilling or unable to finance, but also to help create and develop new market niches, develop innovative schemes to attract and channel private sector resources to large infrastructure projects, build capacity in public and private sector institutions, conceive and structure new investment projects, and facilitate the execution of public-private partnerships.
Each of these programs were analyzed using up to date financials, whenever applicable, as well as federal budget requests and approvals. Looking specifically at debt and credit programs aims to bring to light the similarities of US lending programs and those of National Development Banks (NDBs) in various countries around the world, as well as shed light on the capability of the US Government in financing sustainable development.
2019 US Department of Energy (DoE)xvi
The Department of Energy has three main vehicles that are used to spur investment in clean energy and climate change, the Title XVII Innovative Clean Energy Loan Guarantee Program, Advanced Technology Vehicles Manufacturing (ATVM) Direct Loan Program, and the Tribal Energy Loan Guarantee Program (TELGP).206 These investments are managed by the Loan Program Office (LPO), which opened its offices in 2008 and issued its first loan in 2009. LPO investments accelerate the deployment of innovative clean energy projects and advanced technology vehicle manufacturing facilitiesxvii across the United States. Congress has approved almost US$ 44 billion in loan authority in order to finance clean energy
NOTES
xv All numbers are in millions unless otherwise stated
xvi All financial data is taken from the US Department of Energy annual and financial report.
xvii The ATVM was created with the purpose to funding projects that help US manufacturers meet higher mileage requirements and lessen the dependence on foreign oil.
Tesla Gigafactory, Nevada, USA. © Shutterstock/Mizioznikov.

COLUMBIA CENTER ON SUSTAINABLE INVESTMENT | 43
DEVELOPMENT BANKING IN THE GLOBAL ECONOMY STATE OF PLAY AND FUTURE DIRECTION
projects; to date the LPO manages a portfolio of more than US$ 32 billion in obligated loans of which almost US$ 28 billion have been disbursed.207
Together, these projects have generated more than US$ 50 billion in total project investment, supported job creation, cut pollution, and enhanced American competitiveness in the global economy. LPO loans and loan guarantees are offered to help bridge gaps in the commercial debt market.208 These financing gaps arise when commercial lenders are unwilling to issue any or adequate debt, when a project deploys technology that has yet to demonstrate a history of commercial operations, or when segments of society have yet to demonstrate a history of commercially deploying energy projects. LPO loans are flexible, custom financing options that help to meet the specific needs of each borrower. The most common form of lending in the LPO portfolio is project finance, but some projects use a corporate lending structure. Despite the stated benefits of LPO loans, only five new guarantees have originated since 2016, with all five coming in 2019. In 2019 the LPO approved loans totaling US$ 3.7 billion, of which US$ 2 billion were disbursed.209
To date, nearly US$ 10 billion in principal has been repaid with the total portfolio carrying a 2.9% default rate. Over the next five years, LPO’s annual average repayment is expected to be about US$ 1 billion, while 57% of LPO’s outstanding portfolio balance is owed by investment grade borrowers.210
Title XVII
LPO has roughly US$ 24 billion in remaining loan authority to help finance innovative clean energy projects. The Title XVII innovative clean energy projects loan program provides loan guarantees to
accelerate the deployment of innovative clean energy technology.211 The U.S. Department of Energy is authorized to issue loan guarantees pursuant to Section 1703 of Title XVII of the Energy Policy Act of 2005.212 Loan guarantees are made to qualified projects and applicants who apply for funding in response to open technology-specific solicitations. The Title XVII loan program applies to a wide range of energy technologies, including advanced fossil energy, nuclear energy, renewable energy, and energy efficiency.213
ATVM
The ATVM loan program has more than US$ 17 billion available for loans to support the manufacture of advanced technology vehicles and qualifying components. In order for a vehicle to be an advanced technology vehicle, the vehicle must be a “light-duty” passenger vehicle that satisfies specified emission and fuel economy standards, or is an “ultra-efficient” vehicle.214 To be a qualifying component, the component must be designed and installed for the purpose of meeting the performance requirements for an advanced technology vehicle. The ATVM direct loan program was established in Section 136 of the Energy Independence and Security Act of 2007.215
TELGP
TELGP is a partial loan guarantee program that can guarantee up to US$ 2 billion in loans to support economic opportunities to Indigenous American tribes through energy development projects and activities.216 Under this solicitation, DOE can guarantee up to 90% of the unpaid principal and interest due on any loan made to a federally recognized Indigenous American tribe or Alaska Native Corporation for energy development.217
TABLE 27: DEPARTMENT OF ENERGY LOAN PROGRAMS
PROGRAM Total Authorized Disbursements Obligated 2019 Disbursements
NPL %
ATVM 17,700
TELGP 2,000
Title XVII 23,900
Advanced Fossil Energy 8,500
Advanced Nuclear Energy 10,900
Renewable Energy & Efficient Energy 4,500
Total 44,000 27,707 32,081 2,000 2.9%

44 | COLUMBIA CENTER ON SUSTAINABLE INVESTMENT
PART IV. CASE STUDIES
2019 US Department of Agriculture (USDA)218
The Department of Agriculture operates three primary loan agencies that offer more than 20 different loan programs, these loans have been consolidated in the chart above for easier viewing. The three agencies responsible for authorizing loans are the Rural Development agency, the Farm Service Agency, and the Commodity Credit Corporation. Together these agencies have an authorization to provide nearly US$ 52 billion in direct loan and guarantees and represent a total loan portfolio of US$ 104 billion.219
FSA
The FSA has a gross loan portfolio of US$ 29 billion in outstanding loans, of which US$ 12 billion are direct loans and US$ 17 billion are guaranteed loans, with a total of 205,467 loans authorized between the two.220 In 2019 the FSA disbursed almost US$ 6 billion in loans. FSA’s Direct Farm Operating loans are a valuable resource to start, maintain and strengthen a farm or ranch. For new agricultural producers, FSA direct farm operating loans provide an essential gateway into agricultural production by financing the cost of operating a farm.221 All FSA direct loans are financed and serviced by the Agency through local Farm Loan Officers and Farm Loan Managers. The funding comes from Congressional appropriations as part of the USDA budget.222
Rural Development
The rural development agency provides the bulk of USDA loans, with a gross loan portfolio of US$ 208 billion. The federal government appropriated US$ 38 billion in loan authorizations for 2019, of which Rural Development disbursed US$ 24 billion.223 These loans are provided through the Rural Housing Service, Rural Business Cooperative Service, and the Rural Utilities Service.
Rural Development offers guaranteed loan products, which are administered in coordination with conventional agricultural lenders, for up to 90 percent of the principal loan amount, with the exception of the Electric Guarantees, which are guaranteed at 100 percent.224 Borrowers interested in guaranteed loans must apply through a conventional lender, which arranges for the guarantee with the Agency. Guaranteed loans are disclosed on the balance sheet in two ways: estimated losses on loan credit guarantees, which are valued and carried as a liability; and guaranteed loans purchased from third party holders, which are carried at net present value in loans receivable and related foreclosed property, net.225
CCC
The Commodity Credit Corporation (CCC) These loans are used to
TABLE 28: DEPARTMENT OF AGRICULTURE LOAN PROGRAMS
PROGRAM Total Authorized 2019 Disbursements
FSA 11,551 5,741
Direct Operation Loans 2,463 1,147
Guaranteed Operation Loans 3,763 1,051
Guaranteed Farm Ownership Loans 2,860 2,055
Direct Farm Ownership Loans 2,343 1,473
Emergency Loans 122 13
Commodity Credit Corporation 2,449
Commodity Loans 570
Direct Loans 214
Guaranteed Loans 1,992
Rural Development 37,740 23,854
Rural Housing Service 28,293
Rural Business Cooperative Service 1,026
Rural Utilities Service 8,419
Total 51,740 31,489

COLUMBIA CENTER ON SUSTAINABLE INVESTMENT | 45
DEVELOPMENT BANKING IN THE GLOBAL ECONOMY STATE OF PLAY AND FUTURE DIRECTION
improve economic stability and provide an adequate supply of agricultural commodities. CCC credit programs provide international food assistance, expand international markets, and provide domestic low-cost financing to protect farm income and prices.226 The Commodity Credit Corporation is a Government owned and operated entity dedicated to:
• Stabilizing, supporting, and protecting farm income and prices.
• Conserving soil, air, and water resources and protecting and improving wildlife habitats.
• Maintaining balanced and adequate supplies of agricultural commodities and aiding in their orderly distribution.
• Developing new domestic and foreign markets and marketing facilities for agricultural commodities.
The CCC has an unlimited loan authorization allowing the Corporation to incur obligations and authorizes it to borrow funds to liquidate the obligations.xviii The CCC fund size is US$ 8.6 billion with 2019 disbursements totaling almost US$ 2.5 billion.227
US Department of Housing and Urban Development (HUD)
The Department of Housing and Urban Development (HUD) operates a number of loan programs with the majority of loans being authorized through the Federal Housing Authority (FHA). HUD principal outstanding loans total US$ 1,375 billion, with the first loan being issued in 1935.228 In 2019 HUD disbursed US$ 39 billion worth of loans with most loans going towards housing mortgages.229
• Federal Housing Administration (FHA)230
• GI/SRI Direct Loan Program
• MMI/CMHI Loan Guarantee Program
• GI/SRI Loan Guarantee Program
• H4H Loan Guarantee Program
• Housing for the Elderly and Disabled
• Other
• Flexible Subsidy Fund
• Section 108 Loan Guarantees
• Indian Housing Loan Guarantee Fund
• Loan Guarantee Recovery Fund
• Native Hawaiian Housing Loan Guarantee Fund
• Title VI Indian Housing Loan Guarantee Fund
• Green Retrofit Direct Loan Program
• Emergency Homeowners’ Loan Program
FHA
FHA programs are operated through three insurance funds, the Mutual Mortgage Insurance/Cooperative Management Housing Insurance (MMI/CMHI), General Insurance Risk and Special Risk Insurance (GI/SRI) and the HOPE for Homeowners (H4H) funds, with MMI fund being the largest. Direct Loan and Loan Guarantees of US$ 37.0 billion are attributed to FHA credit program receivables and HUD’s support of construction and rehabilitation of low rent housing, principally for the elderly and disabled.231
Housing for the Elderly (HED) and Other Programs*
The HED was established by the Housing Act of 1959 and the National Affordable Housing Act of 1990 respectively, to provide critical affordable housing to the elderly and supportive housing for disabled very low-income persons. Assistance was provided to eligible private nonprofit organizations to cover construction, acquisition or rehabilitation expenses as well as rental assistance.
The total disbursements in 2019 of all non FHAxix programs totaled approximately US$ 2 billion.232 The majority of these loans are made to reaffirm the commitment of the Federal Government to assist local governments in their efforts in stimulating economic and community development.
Section 108 Loans
The Section 108 Loan Guarantee program, the loan guarantee provision of the Community Development Block Grant (CDBG) program, is one of the most potent and important public investment tools that HUD offers to state and local governments. Section 108 allows communities to transform a small portion of their CDBG funds into federally guaranteed loans large enough to pursue physical and economic revitalization projects that can renew entire
TABLE 29: HUD LOAN PROGRAMS
LOAN TYPE 2019 DISBURSEMENTS
Direct Loans 3,400
Guaranteed Loans 33,612
Other 2,313
Total 39,300 NOTES
xviii Obligations consist of bonds, notes, and debintures.
xix Many of the loan programs (17) previously offered under HUD were part of the American Recovery and Reinvestment Act Programs (Recovery Act). These programs have transitioned away from yearly financial assistance to disaster assistance/grants and as such are not included in this analysis.

46 | COLUMBIA CENTER ON SUSTAINABLE INVESTMENT
PART IV. CASE STUDIES
neighborhoods. The Section 108 program is, “a source of financing for economic development, housing rehabilitation, public facilities rehabilitation, construction or installation, for the benefit of low- to moderate-income persons or to aid in the prevention of slums or blight.”233
Section 108 loans are not risk-free; the principal security for the loan guarantee is a pledge by the applicant public entity or state of its current and future CDBG funds.234 Additional security will also be required to assure repayment of guaranteed obligations. The additional security requirements will be determined on a case-by-case basis, but could include assets financed by the guaranteed loan.
The maximum repayment period for a Section 108 loan guarantee is 20 years.235 HUD has the ability to structure the principal amortization to match the needs of the project and borrower. Each annual principal amount will have a separate interest rate associated with it.
Section 108 obligations are financed through underwritten public offerings. Financing between public offerings is provided through an interim lending facility established by HUD.236
US Department of Transportation (DoT)
The Department of Transportation (DoT) administers several credit programs that provide direct loans, loan guarantees, or lines of credit to support the construction of transportation projects and infrastructure. These credit programs maximize limited Federal resources by leveraging non-Federal co-investment and enabling eventual repayment of the taxpayer.237 The Office of Credit Oversight and Risk Management oversees these transportation investment credit programs as well as the Build America Transportation Investment Center. The DoT oversees total assets of US$ 126 billion in 2019 of which nearly US$ 28 billion are loans programs.238 The four main programs that the DoT has at its disposal are TIFIA, RRIF, Title XI, and Private Activity Bonds. Together these four programs disbursed nearly US$ 7 billion dollars in credit/loans in 2019.239
TIFIA
The Transportation Infrastructure Finance and Innovation Act of 1998 (TIFIA), is a federal credit program for eligible surface transportation projects of regional or national significance under which the DOT may provide three forms of credit assistance - secured (direct) loans, loan guarantees, and standby lines of credit.240
The program's fundamental goal is to attract new investment capital to projects capable of generating revenues through user charges or dedicated funding sources and to complement existing funding sources by filling market gaps, thereby, leveraging substantial private capital for critical improvements to the nation's surface transportation system. DOT awards credit assistance to eligible applicants, which include state departments of transportation, transit operators, special authorities, local governments, special districts, and private entities or consortia that may include companies specializing in engineering, construction, materials, and/or the operation of transportation facilities.
The TIFIA program has been one of the main ways in which the federal government has encouraged the development of public private partnerships and private financing in surface transportation often backed by new, but sometimes uncertain, revenue sources such as highway tolls, other types of user charges, and incremental real estate taxes.
The TIFIA program is also a relatively low-cost way for the federal government to support surface transportation projects because it relies on loans, not grants, and the TIFIA assistance is typically one-third or less of project costs.241 Another advantage from the federal point of view is that a relatively small amount of budget authority can be leveraged into a large amount of loan capacity. Because the government expects its loans to be repaid, an appropriation need only cover administrative costs and the subsidy cost of credit assistance. Program funding of US$ 300 million can support approximately US$ 4 billion in TIFIA loans.242
TABLE 30: DEPARTMENT OF TRANSPORTATION LOAN PROGRAMS
PROGRAM Total Authorized 2019 Disbursements GLP
TIFIA
300 (1,650 combined with previous y ears unused funds)
3,363 (state departments use federal grant money to subsidize)
36,227
RRIF 35,000 737 5,878
Title XI 193 1,649
Private Activity Bonds 15,000 2,670 12,000
Total 6,963

COLUMBIA CENTER ON SUSTAINABLE INVESTMENT | 47
DEVELOPMENT BANKING IN THE GLOBAL ECONOMY STATE OF PLAY AND FUTURE DIRECTION
Since its enactment in 1998, the TIFIA program has provided assistance of US$ 32 billion to 74 projects with a total cost of about US$ 117 billion.243 All but one TIFIA credit agreement has been a loan; the exception is a loan guarantee. The average TIFIA-supported project cost is US$ 1.5 billion, and the average TIFIA loan is US$ 430 million.244 About two-thirds of TIFIA loans have gone to highway and highway bridge projects, and another quarter to public transportation. TIFIA has supported at least one project in 21 states, the District of Columbia, and Puerto Rico, but the top 10 states account for about 80% of the 74 projects supported.245
RRIF
Congress created the Railroad Rehabilitation and Improvement Financing (RRIF) program to offer long-term, low-cost loans to railroad operators, with particular attention to small freight railroads, to help them finance improvements to infrastructure and investments in equipment. The program is intended to operate at no cost to the government, and it does not receive an annual appropriation.246
Since 2000, the RRIF program has made 37 loans totaling just over US$ 5 billion.247 The program, which is administered by the Build America Bureau within the Office of the Secretary of Transportation, has approved only four loans since 2012.248 Congress has authorized US$ 35 billion in loan authority for the RRIF program and repeatedly has urged the Department of Transportation (DOT) to increase the number of loans the program makes.249
Despite the money that Congress has authorized for the program there is a consistent lack of interest in the program. Reports suggest, that the uncertain length and outcome of the RRIF loan application process, and the up-front costs to prospective borrowers, are among the elements of the program that have reduced its appeal compared with other financing options available to railroads.
Unlike DOT’s other prominent loan assistance program, the Transportation Infrastructure Finance and Innovation Act (TIFIA) program, RRIF requires loan recipients to pay a credit risk premium, which is intended to offset the risk of a default on their loan. The credit risk premium helps the program comply with a congressional requirement that federal loan assistance programs operate at no cost to the federal government. However, it may make RRIF loans less attractive to borrowers than other types of federal, state, or private financing.
The appeal of the RRIF program is that the recipient is able to borrow money at the lowest rate available (that paid by the federal government itself) and for a longer period of time than most other types of loans would permit. RRIF borrowers can also ask to defer loan repayment for a period of six years (though interest accrues during this period). Alternatively, the Build America Bureau can guarantee a private loan extension at a rate DOT determines to be reasonable; to date, no loan guarantees have been provided through the program.
US Department of Transportation, Washington DC, USA. © Shutterstock/DCStockPhotography

48 | COLUMBIA CENTER ON SUSTAINABLE INVESTMENT
PART IV. CASE STUDIES
Title XI
The Federal Ship Financing Program or Title XI provides for a full faith and credit guarantee by the United States Government to promote the growth and modernization of the U.S. merchant marine and U.S. shipyards. Through long-term debt repayment guarantees, the Program encourages U.S. ship-owners to obtain new vessels from U. S. shipyards cost effectively.250 It also assists U.S. shipyards with modernizing their facilities for building and repairing vessels. The repayment term allowed under the program generally is much longer, and the interest rates are lower than those available from the commercial lending market because of the obligations guaranteed by the U.S. Government.
Some of the program benefits include:251
• Repayment periods up to 25 years;
• Interest rates comparable to U.S. Treasury rate for comparable-term securities;
• Up to 87.5 percent financing;
• Fixed or floating rates
Private Activity Bonds (PAB)
The federal tax code allows state and local governments to use tax-exempt bonds to finance certain projects that would be considered private activities. The private activities that can be financed with tax-exempt bonds are called “qualified private activities.” Congress uses an annual state volume cap to limit the amount of tax-exempt bond financing, and restricts the types of qualified private activities that would qualify for tax-exempt financing to selected projects defined in the tax code.252
The law limits the total amount of such bonds to US$ 15 billion and directs the Secretary of Transportation to allocate this amount among qualified facilities, however, there is currently a bill in congress to increase the cap to US$ 20.8 billion. To date the DoT has issued US$ 12 billion PAB’s and allocated US$ 2 billion.
These PABs reflect the Federal Government's desire to increase private sector investment in U.S. transportation infrastructure. Providing private developers and operators with access to tax-exempt interest rates lowers the cost of capital significantly, enhancing investment prospects. Increasing the involvement of private investors in highway and freight projects generates new sources of money, ideas, and efficiency.
US Department of the Treasury *excluding CARES Act
The Department of the Treasury has two programs currently in effect that play a role in providing loans/credit. These programs are the Small Business Lending Fund (SBLF) and the Community Development Financial Institutions Fund (CDFI). Combined, these two entities disbursed nearly US$ 150 million in loans in 2019. While these are the only two active loan programs there is a bill in congress to reauthorize the US$ 1.5 billion State Small Business Credit Initiative (SSBCI) to complement the small business programs already in place.
SBLF
Established by the Small Business Jobs Act of 2010 (the Act), the Small Business Lending Fund (SBLF) is a dedicated fund designed to provide capital to qualified community banks and community development loan funds (CDLFs) in order to encourage small business lending. The purpose of the SBLF is to encourage Main Street banks and small businesses to work together, help create jobs, and promote economic growth in communities across the nation.
Treasury invested over US$ 4.0 billion in 332 institutions through the SBLF program. These amounts include investments of US$ 3.9 billion in 281 community banks and US$ 104 million in 51 CDLFs. Collectively, these institutions operate in over 3,000 locations across 47 states and the District of Columbia. As of June 1, 2020, 321 institutions with aggregate investments of US$ 3.93 billion have fully redeemed their SBLF Treasury investment and exited the program, and 4 institutions have partially redeemed $13.5 million (or 62 percent of their SBLF securities) while continuing to participate in the program.
TABLE 31: DEPARTMENT OF TREASURY LOAN PROGRAMS
PROGRAM Total Authorized 2019 Disbursements
SBLF 30,000 (fund size) 43 4,000 (aggregate investments)
CDFI Bond Guarantee 500 100 1,075 (disbursed since inception)

COLUMBIA CENTER ON SUSTAINABLE INVESTMENT | 49
DEVELOPMENT BANKING IN THE GLOBAL ECONOMY STATE OF PLAY AND FUTURE DIRECTION
CDFI Fund
The CDFI Fund works to spur economic growth, job creation, and opportunity in distressed and underserved communities by offering targeted resources and innovative programs to leverage federal dollars with private sector capital. The CDFI Fund supports mission-driven financial institutions that take a market-based approach to supporting economically underserved communities. These organizations are encouraged to apply for CDFI Certification and participate in CDFI Fund programs that inject new sources of capital into neighborhoods that lack access to financing.
CDFI Bond Guarantee Program provides a source of long-term capital for CDFIs by guaranteeing bonds issued to support CDFIs that make investment for eligible community or economic development purposes. Through the program, the Secretary of the Treasury provides a 100% guarantee of bonds issued by Qualified Issuers. The Qualified Issuers use the bond proceeds to finance loans to CDFIs, which then use the funds to make loans in underserved communities. Congress establishes the total authorization level for the CDFI Bond Guarantee Program each year as part of the annual appropriations process. For 2019, Congress authorized the CDFI Bond Guarantee
Program at US$ 500 million. The Treasury Department approved a US$ 100 million worth of loans in 2019.
Since its inception, the total amount of bonds closed and corresponding guarantees exceeds US$ 1.6 billion. To date, participating CDFIs have lent more than US$ 1.1 billion, or 73% of the total amount of the bonds, in communities around the country. They have financed projects across the country, including charter schools, rental housing facilities, commercial real estate, health care facilities, senior living and long-term care facilities, small businesses, daycare centers, not-for-profit organizations, and financing entities.
US Small Business Administration (SBA) *excluding CARES Act
The Small Business Administration (SBA) provides small businesses with capital and financial assistance though several key programs and has financial assistance portfolio of guaranteed and direct loans totaling almost US$ 123 billion. The agencies loan programs are centered around five key programs, with the 7a loan program representing the bulk ok all disbursements. In 2019 the SBA disbursed almost US$ 33 billion in loan and loan guarantees.
Treasury Department, Washington DC, USA. © Shutterstock/Michael G Smith

50 | COLUMBIA CENTER ON SUSTAINABLE INVESTMENT
PART IV. CASE STUDIES
7a
The 7a loan program is SBA’s principal vehicle for providing small business with access to credit that cannot be obtained elsewhere. 7a loans can be used to establish a new business or to assist in acquiring, operating, or expanding an existing business. The program relies on outside borrowers, loan agents, and lender, to complete loan transactions with most loans being made by lenders that the SBA has designated as “loan-making authorities”. In 2019 the 7a loan program disbursed almost US$ 24 billion loans.
504 Development Company
The CDC/504 loan program is a long-term financing tool for economic development within a community. The 504 Program provides growing businesses with long-term, fixed-rate financing for major fixed assets, such as equipment or real estate. The SBA 504 Loan program is a powerful economic development loan program that offers small businesses another avenue for business financing, while promoting business growth, and job creation. The 504 Loan Program provides approved small businesses with long-term, fixed-rate financing used to acquire fixed assets for expansion or modernization. The loans are made available through Certified Development Companies (CDCs), who are SBA's community based partners for providing 504 Loans. A Certified Development Company (CDC) is a nonprofit corporation that promotes economic development within its community through 504 Loans. CDCs are certified and regulated by the SBA, and work with SBA and participating lenders (typically banks) to provide financing to small businesses, which in turn, accomplishes the goal of community economic development. There are over 260 CDCs nationwide each having a defined Area of Operations covering a
specific geographic area. The area of operation for most CDCs is the state in which they are incorporated.
504 Loans are typically structured with SBA providing 40% of the total project costs, a participating lender covering up to 50% of the total project costs, and the borrower contributing10% of the project costs. Under certain circumstances, a borrower may be required to contribute up to 20% of the total project costs. Loans are generally capped at US$ 5 million although certain eligible energy-efficient or manufacturing projects qualify for more.
SBIC
The Small Business Investment Company (SBIC) Program is an investment program that increases access to capital for growth stage businesses. The program has an authorized loan program of US$ 4 billion per year, with about US$ 26 billion currently under management. In 2019 the SBIC disbursed US$ 1.6 billion in loans.
The SBIC program issues debt to venture capitalists, private equity funds and other vehicles that invest in America’s small, but scaling, businesses. Over the past five years, the program has channeled more than US$ 26 billion of capital to more than 6,400 U.S. small businesses spanning a variety of industries across the country. Launched in 1958 the SBIC Program has deployed more than US$ 67 billion of capital, made more than 166,000 investments in small businesses and licensed more than 2,100 funds.
US Environmental Protection Agency (EPA)
The EPA operates two separate loan programs, the WIFIA direct loan program and a fund to fund called the State Revolving Fund. Combined, the two-loan program disbursed US$ 5 billion worth of loans/credit assistance in 2019.
TABLE 32: SMALL BUSINESS ADMINISTRATION LOAN PROGRAMS
PROGRAM 2019 DISBURSEMENTS
NUMBER OF LOANS (IN HUNDREDS)
7a Small Business 23,567 51,908
504 Development Company 5,066 6,099
SBIC 1,614 36
Microloan 44 53
Disaster 2,446 42,399
Total 32,737 100,495
TABLE 33: EPA LOAN PROGRAMS
PROGRAM TOTAL AUTHORIZED
2019 DISBURSEMENTS
WIFIA 5,000 1,682
SWIFIA
1,000 *first year in operation
SRFs (Federal money to support the creation of state infrastructure banks)
3,320

COLUMBIA CENTER ON SUSTAINABLE INVESTMENT | 51
DEVELOPMENT BANKING IN THE GLOBAL ECONOMY STATE OF PLAY AND FUTURE DIRECTION
WIFIA
The Water Infrastructure Finance and Innovation Act of 2014 (WIFIA) established the WIFIA program, a federal credit program administered by EPA for eligible water and wastewater infrastructure projects. To date, WIFIA has closed 24 loans totaling US$ 5.3 billion in credit assistance to help finance US$ 11.7 billion for water infrastructure projects and create over 25,000 jobs. In 2019 WIFIA disbursed almost US$ 1.7 billion in loans.
Each WIFIA loan has a fixed interest rate, which is the U.S. Treasury rate for loans with a similar maturity on the date of loan execution. Borrowers can structure the WIFIA repayment schedule to align with anticipated receipt of revenue. Initial repayments of WIFIA assistance may be deferred up to five years after project completion, and the repayment period may be extended up to 35 years after completion.
Eligible entities for WIFIA assistance include (1) a state infrastructure financing authority (SIFA); (2) a corporation; (3) a partnership; (4) a joint venture; (5) a trust; or (6) a federal, state, local, or tribal government or instrumentality. Both public and private entities can use WIFIA assistance for eligible projects. Private entities must have a public sponsor to be WIFIA-eligible.
SWIFIA
The State infrastructure financing authority WIFIA (SWIFIA) program, authorized by Congress in section 4201 of America’s Water Infrastructure Act (AWIA) of 2018, is a new loan program exclusively for State infrastructure financing authority borrowers. EPA has approximately US$ 1 billion in WIFIA loans for State infrastructure financing authority programs. The program is currently taking loan proposals and expects to disburse its first loan in 2021.
State Revolving Fund (SRF)
The SRF program is a powerful partnership between EPA and the states that replaced EPA's Construction Grants program. States have the flexibility to fund a range of projects that address their highest priority water quality needs. The program was amended in 2014 by the Water Resources Reform and Development Act in conjunction with the Safe Drinking Water Act. The program awards grants to each state based upon the results of the most recent Drinking Water Infrastructure Needs Survey and Assessment. The state must match 20% of the grant provided. In 2019 the EPA disbursed US$ 3.3 billion to SRFs.
United States Environmental Protection Agency headquarters, Washington DC, USA. © Shutterstock/Mark Van Scyoc

52 | COLUMBIA CENTER ON SUSTAINABLE INVESTMENT
PART IV. CASE STUDIES
The state programs function like infrastructure banks by providing low interest loans to eligible recipients for water infrastructure projects. As money is paid back into the state’s revolving loan fund, the state makes new loans to other recipients. These recycled repayments of loan principal and interest earnings allow the state's SRF to “revolve” over time. States are responsible for the operation of their SRF programs. Under the SRF, states may provide various types of assistance, including:
• Loans
• Refinancing
• Purchasing
• Guaranteeing local debt
• Purchasing bond insurance
US Export-Import Bank
EXIM's direct loans help U.S. companies secure competitive financing for their international buyers. EXIM provides fixed-rate financing — up to 12 years in general and up to 18 years for renewable energy projects — to creditworthy international buyers in both the private and public sector, and finance local costs up to 30 percent. With EXIM’s direct loans, international buyers get competitive term financing that may
previously have been unavailable. EXIM supports producers when exporters in the United States or their customers are unable to access export financing from private sources. The agency will equip them with the necessary tools to compete in foreign markets—direct loans, loan guarantees, export credit insurance, and guarantees of working capital loans. In 2019 EXIM disbursed over US$ 9 billion to US producers.
TABLE 34: EXPORT-IMPORT BANK
PROGRAM TOTAL AUTHORIZED
2019 DISBURSEMENTS
Long Term Loans 5,000 2,992
Working Capital Loans 9 8
Medium Term Guarantees 240 367
Working Capital Guarantees 688 3,444
Short Term Credit 2,192 2,192
Medium Term Credit 86 97
Solar PV farm, USA © Shutterstock/Roschetzky Photography

COLUMBIA CENTER ON SUSTAINABLE INVESTMENT | 53
DEVELOPMENT BANKING IN THE GLOBAL ECONOMY STATE OF PLAY AND FUTURE DIRECTION
Working Capital
EXIM’s Working Capital Loan Guarantee can empower exporters to unlock cash flow to fulfill sales orders and take on new business abroad. With EXIM support, exporters can borrow more with the same collateral, secure performance necessary to win projects, and increase their global competitiveness.
CARES Act
The CARES Act is a bill passed by Congress to authorize over US$ 2 trillion in financing and relief due to the COVID 19 Pandemic. The above table is an overview of all loan/credit programs provided by the CARES Act. To date, there are eight main lending programs provided for in the CARES Act with the majority of disbursements being provided by the SBA through its Paycheck Protection and Small Business Loan programs.
PDCF
The PDCF is a term loan facility that provides funding to primary dealers in exchange for a broad range of collateral and is intended to foster the functioning of financial markets more generally. The facility allows primary dealersxx to support smooth market functioning and facilitate the availability of credit to businesses and households.
CPFF
The purpose of the CPFF is to provide liquidity to short-term funding markets. The CPFF provides a liquidity backstop to U.S. issuers of commercial paper, including municipalities, by purchasing three-month unsecured and asset-backed commercial paper directly from eligible issuers.
MMLF
The MMLF provides funding to U.S. depository institutions and bank holding companies to finance their purchases of certain types of assets from money market mutual funds under certain conditions. The program is intended to assist money market mutual funds that hold such paper in meeting demands for redemptions by investors and to foster liquidity in the markets for the assets held by money market mutual funds, including the market for short-term municipal securities.
CCF
The Board has established two facilities to support credit to large employers—the PMCCF for new bond and loan issuance and the SMCCF to provide liquidity for outstanding corporate bonds (together, corporate credit facilities, or the CCFs). The FRBNY has established one SPV to manage and operate the CCFs.
TABLE 35: CARES ACT
PROGRAM Total Disbursed (As of 6/30/2020)
MLF 1,200 *Special Purpose Vehicle
PDCF 2,489
MMLF 21,442
CPFF 4,243 *Special Purpose Vehicle
CCF 9,445 *Special Purpose Vehicle
TALF 252 *Special Purpose Vehicle
PPPLF 519,505
EIDL 163,818
Direct/Guaranteed Loans to Air Carriers 46,000 *Exchange Stabilization Fund
MSLP (Main Street Lending Program) 454,000 *Exchange Stabilization Fund
NOTE
xx Primary dealers are broker-dealers that serve as the trading counterparties for the Federal Reserve's open market operations, and have a key role in providing liquidity in the market for U.S. Treasury securities.

54 | COLUMBIA CENTER ON SUSTAINABLE INVESTMENT
PART IV. CASE STUDIES
TALF
Under the TALF, the FRBNY will lend to an SPV, which will make loans to U.S. companies secured by certain AAA-rated asset-backed securities (ABS) backed by recently originated consumer and business loans. The TALF is intended to support the provision of credit to consumers and businesses by enabling the issuance of ABS backed by private student loans, auto loans and leases, consumer and corporate credit card receivables, certain loans guaranteed by the Small Business Administration, and certain other assets.
MLF
The MLF is intended to support lending to state, city, and county governments, certain multistate entities, and other issuers of municipal securities. The FRBNY operates the MLF.
PPLF
The Paycheck Protection Program established by the CARES Act, is implemented by the Small Business Administration with support from the Department of the Treasury. This program provides small businesses with funds to pay up to 8 weeks of payroll costs including benefits. Funds can also be used to pay interest on mortgages, rent, and utilities.
The Paycheck Protection Program prioritizes millions of Americans employed by small businesses by authorizing up to US$ 659 billion toward job retention and certain other expenses.
Small businesses and eligible nonprofit organizations, Veterans organizations, and Tribal businesses described in the Small Business Act, as well as individuals who are self-employed or are independent contractors, are eligible if they also meet program size standards.
EIDL
The Economic Injury Disaster Loan (EIDL) program is designed to provide economic relief to businesses that are currently experiencing a temporary loss of revenue. EIDL proceeds can be used to cover a wide array of working capital and normal operating expenses, such as continuation to health care benefits, rent, utilities, and fixed debt payments.
Main Street Lending Program (MSLP)
The Main Street Lending Program, authorized under the CARES Act and Section 13(3) of the Federal Reserve Act, is designed to provide financial assistance to small and medium-sized businesses. The three Main Street loan facilities available: The Main Street New Loan Facility, the Main Street Expanded Loan Facility and the Main Street Priority Loan Facility (all such facilities being the “Main Street Loan Facilities”). The MSLP is intended to provide support for small and medium-sized businesses through four-year term loans from eligible lenders to eligible US businesses, which together with their affiliates, have up to 15,000 employees or revenues of up to US$ 5 billion. Main Street loans are full-recourse loans and are not forgivable. The Federal Reserve designed Main Street to support small and medium-sized businesses that were unable to access the PPP or that require additional financial support after receiving a PPP loan.
PART V CONCLUSIONS
Wind turbines, Washington State, USA. © Shutterstock/CatonPhoto
In the section below we delve deeper into the takeaways listed at the beginning of this report. We expand on each takeaway and develop a set of conclusions that can be used to better analyze NDBs and finish with a set of recommendations for future policy work and further research in the NDB arena.
1. Size: NDBs already play a significant role in development financing with the 5 largest banks representing almost US$ 5 trillion in total assets. The pure scale of NDBs is something that almost no other financial institution can match. The assets of the top 5 NDBs is more than Bank of American and JPMorgan combined and larger than the GDP of every country in the world besides the United States and China. This size provides an opportunity to create scalable projects that can have a development impact.
COLUMBIA CENTER ON SUSTAINABLE INVESTMENT | 55
DEVELOPMENT BANKING IN THE GLOBAL ECONOMY STATE OF PLAY AND FUTURE DIRECTION

56 | COLUMBIA CENTER ON SUSTAINABLE INVESTMENT
PART V. CONCLUSIONS
2. Adaptability: NDBs are flexible, able to finance almost any type of industry and existing in both developing and developed economies. There is no one size fits all development prescription and our study shows that NDBs have the ability to structure financial products that best meet the needs of diverse populations. For instance, despite having a similar mission, size and scale, the BNDES and KfW use very different funding tools to promote renewable energy projects. Each bank relies on its context to promote development objectives that best fit the needs of the population.
3. Need: NDBs are a necessary form of financing when the private sector is unable or unwilling to invest in projects. The majority of NDB financing involves large-scale infrastructure and energy related projects, where traditional banks are unwilling to take on the long-term risk associated with these types of investments. For example, the United States Department of Energy Loan program facilitated a US$ 465 million loan package to Tesla in 2009 when no private bank was willing to loan it money. Investments like this help grow and protect fledgling industries that may not exist otherwise.
4. Role: NDBs can play a counter-cyclical role in catalyzing the private sector and providing necessary loan guarantees in a post-COVID economic environment due to their liquidity and scale of operations. The close connection that NDBs have with federal governments allow for a rapid influx of cash when industries are struggling. Our study shows that in times like COVID, NDBs are able to support supply chains and SMEs by providing low interest rates and flexible loan packages that are too risky for traditional banks.
5. Private Sector Opportunity: NDB bonds are a secure, yet underutilized, form of financing for private sector investors as they are traditionally backed by government credit. The majority of NDBs finance their investments using bond issuances that rely on high country credit ratings. These bonds are directly linked to the credit rating of each country making them less risky than other private bank bonds. NDBs around the world have started issuing AAA government backed Pandemic Bonds to infuse capital into struggling industries.
6. Best Practices: Cross border sharing of best practices and information is needed in order to improve the relationship/trust between civil society and NDBs. Despite all of the laurels written above there is little consensus in the policy making or academic community on how to best use NDBs. More data on financial flows and development impacts is needed in order to accurately assess the role that NDBs currently play in the development arena. A comprehensive data set that establishes the players and total assets in the field is a necessary next step in the research.
7. Life Cycle: Most Development Banks lack project retirement plans staying in the sector longer than is necessary. This limits the potential for outside funders to invest in projects and work
alongside these banks. This argument is seen in the case of BNDES, where the bank has tended to crowd out infrastructure financing by offering loans that the private sector cannot compete with. Despite the maturity of the sector, the bank remains a key financier making it difficult for other actors to invest. NDBs would be well suited to create project retirement plans that provide a key set of indicators that must be met for the bank to scale back its investments.
8. Size: NDBs must play a larger role in promoting private sector finance and scaling up investable projects to help achieve the Sustainable Development Goals. NDBs disburse an estimated US$ 2.2 trillion dollars a year, setting them on par with total loans to the private sector in the United States in 2019 (US$ 2.34 billion). Despite this already large sum, there is room for growth and a need to focus on investments that lack alternative means of funding. NDBs are the chief funder of infrastructure in developing countries, but much more can be done to close the US$ 2.74 trillion infrastructure gap that the World Bank estimates.
9. Unique Case of the US: The bureaucratic, overly comprehensive yet uncoordinated set of financing tools covering a multitude of sectors limits the ability of the US to play a catalytic role in financing sustainable development both at home and internationally. Unlike most other countries, the US does not have a national development bank, instead choosing to rely on a multitude of funding mechanisms to finance development related projects. This structure has come into question because of the toll that COVID has taken on the US economy. A perfect example of this is with the Small Business Administration PPP loan. The loan program has shown the difficulty of effectively providing development financing without a singular entity or road map leading the way.
10. Future Research and Future Opportunities: Increased research is needed to determine what type of funding and governance mechanisms work in certain political climates. Questions persist on how these institutions go about funding projects and what sort of impact their projects truly have. We propose the creation of a data-set that accurately reports the source, type, and impact of all NDB funds. This type of data-set would allow future researchers and policy makers to better understand the landscape that exists and determine how to best utilize these banks.
11. Future Opportunity: Despite the size, influence, and relative importance of NDBs they are still widely underutilized as a development funder. We propose a fund or specific financial vehicle that serves as a middleman between the private sector and NDBs. Currently there is no such institution that effectively coordinates these two funding avenues. This fund will increase the amount and speed of investment in development related projects by decreasing total risk and improving scalability. We believe that this type of institution is needed to close the ever-widening gap in sustainable financing.

COLUMBIA CENTER ON SUSTAINABLE INVESTMENT | 57
DEVELOPMENT BANKING IN THE GLOBAL ECONOMY STATE OF PLAY AND FUTURE DIRECTION
APPENDIX I DEBT OUTSTANDING FOR DEVELOPMENT BANKS
TABLE 36: DEBT OUTSTANDING FOR DEVELOPMENT BANKS, BY REGION
REGION SUM OF DEBT OUTSTANDING (USD) %
Asia 2,900,507,801,873 47.57%
Supranational 1,811,829,114,123 29.71%
Europe 1,325,394,193,679 21.74%
North America 35,059,275,334 0.57%
LATAM 18,628,001,182 0.31%
Africa 5,190,601,414 0.09%
EMEA 750,000,000 0.01%
Grand Total 6,097,358,987,604 100.00%
TABLE 37: DEBT OUTSTANDING FOR DEVELOPMENT BANKS, BY INSTITUTION
INSTITUTION SUM OF DEBT OUTSTANDING (USD) %
China Development Bank 1,411,295,130,678 23.15%
Agricultural Development Bank of China 759,220,757,530 12.45%
European Investment Bank 537,117,849,091 8.81%
Export-Import Bank of China/The 534,330,806,055 8.76%
Kreditanstalt fuer Wiederaufbau 453,850,372,403 7.44%
International Bank for Reconstruction & Development 234,535,320,060 3.85%
European Financial Stability Facility 234,471,393,609 3.85%
Asian Development Bank 121,811,660,635 2.00%
Korea Development Bank/The 119,804,449,951 1.96%
BNG Bank NV 110,175,879,630 1.81%
Inter-American Development Bank 109,414,892,742 1.79%
European Union 102,821,640,910 1.69%
European Stability Mechanism 102,462,909,999 1.68%
Landwirtschaftliche Rentenbank 86,230,550,139 1.41%
NRW Bank 72,993,666,681 1.20%
Nederlandse Waterschapsbank NV 71,534,744,114 1.17%
Export-Import Bank of Korea 64,367,697,778 1.06%
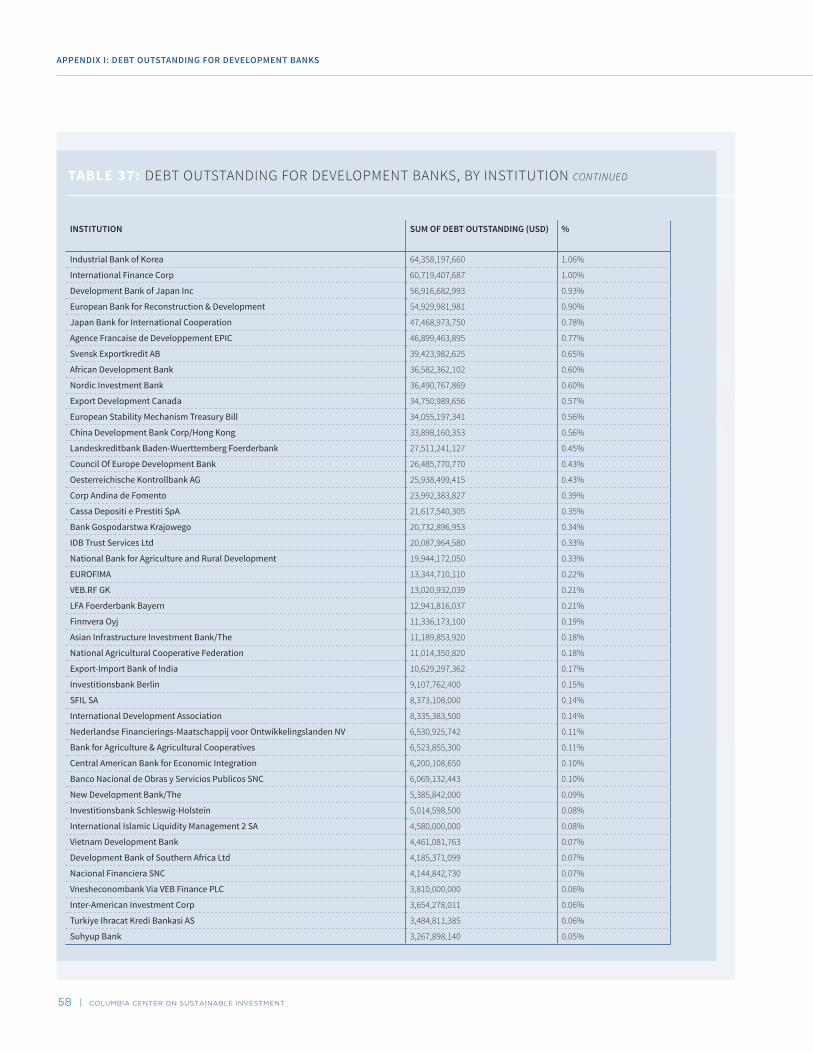
58 | COLUMBIA CENTER ON SUSTAINABLE INVESTMENT
APPENDIX I: DEBT OUTSTANDING FOR DEVELOPMENT BANKS
TABLE 37: DEBT OUTSTANDING FOR DEVELOPMENT BANKS, BY INSTITUTION CONTINUED
INSTITUTION SUM OF DEBT OUTSTANDING (USD) %
Industrial Bank of Korea 64,358,197,660 1.06%
International Finance Corp 60,719,407,687 1.00%
Development Bank of Japan Inc 56,916,682,993 0.93%
European Bank for Reconstruction & Development 54,929,981,981 0.90%
Japan Bank for International Cooperation 47,468,973,750 0.78%
Agence Francaise de Developpement EPIC 46,899,463,895 0.77%
Svensk Exportkredit AB 39,423,982,625 0.65%
African Development Bank 36,582,362,102 0.60%
Nordic Investment Bank 36,490,767,869 0.60%
Export Development Canada 34,750,989,656 0.57%
European Stability Mechanism Treasury Bill 34,055,197,341 0.56%
China Development Bank Corp/Hong Kong 33,898,160,353 0.56%
Landeskreditbank Baden-Wuerttemberg Foerderbank 27,511,241,127 0.45%
Council Of Europe Development Bank 26,485,770,770 0.43%
Oesterreichische Kontrollbank AG 25,938,499,415 0.43%
Corp Andina de Fomento 23,992,383,827 0.39%
Cassa Depositi e Prestiti SpA 21,617,540,305 0.35%
Bank Gospodarstwa Krajowego 20,732,896,953 0.34%
IDB Trust Services Ltd 20,087,964,580 0.33%
National Bank for Agriculture and Rural Development 19,944,172,050 0.33%
EUROFIMA 13,344,710,110 0.22%
VEB.RF GK 13,020,932,039 0.21%
LFA Foerderbank Bayern 12,941,816,037 0.21%
Finnvera Oyj 11,336,173,100 0.19%
Asian Infrastructure Investment Bank/The 11,189,853,920 0.18%
National Agricultural Cooperative Federation 11,014,350,820 0.18%
Export-Import Bank of India 10,629,297,362 0.17%
Investitionsbank Berlin 9,107,762,400 0.15%
SFIL SA 8,373,108,000 0.14%
International Development Association 8,335,383,500 0.14%
Nederlandse Financierings-Maatschappij voor Ontwikkelingslanden NV 6,530,925,742 0.11%
Bank for Agriculture & Agricultural Cooperatives 6,523,855,300 0.11%
Central American Bank for Economic Integration 6,200,108,650 0.10%
Banco Nacional de Obras y Servicios Publicos SNC 6,069,132,443 0.10%
New Development Bank/The 5,385,842,000 0.09%
Investitionsbank Schleswig-Holstein 5,014,598,500 0.08%
International Islamic Liquidity Management 2 SA 4,580,000,000 0.08%
Vietnam Development Bank 4,461,081,763 0.07%
Development Bank of Southern Africa Ltd 4,185,371,099 0.07%
Nacional Financiera SNC 4,144,842,730 0.07%
Vnesheconombank Via VEB Finance PLC 3,810,000,000 0.06%
Inter-American Investment Corp 3,654,278,011 0.06%
Turkiye Ihracat Kredi Bankasi AS 3,484,811,385 0.06%
Suhyup Bank 3,267,898,140 0.05%

DEVELOPMENT BANKING IN THE GLOBAL ECONOMY STATE OF PLAY AND FUTURE DIRECTION
TABLE 37: DEBT OUTSTANDING FOR DEVELOPMENT BANKS, BY INSTITUTION CONTINUED
INSTITUTION SUM OF DEBT OUTSTANDING (USD) %
African Export-Import Bank/The 3,086,500,000 0.05%
Arab Petroleum Investments Corp 3,007,059,040 0.05%
Africa Finance Corp 2,845,365,500 0.05%
Small Industries Development Bank of India 2,771,189,811 0.05%
Lembaga Pembiayaan Ekspor Indonesia 2,629,045,121 0.04%
Banque Ouest Africaine de Developpement 2,553,030,725 0.04%
MFB Magyar Fejlesztesi Bank Zrt 2,345,611,081 0.04%
Korea Development Bank/Singapore 2,108,257,350 0.03%
Corp Financiera de Desarrollo SA 1,808,770,925 0.03%
Black Sea Trade & Development Bank 1,749,396,082 0.03%
Banco Nacional de Comercio Exterior SNC/Cayman Islands 1,700,000,000 0.03%
Eurasian Development Bank 1,628,603,000 0.03%
Vietnam Bank For Social Policies 1,595,260,187 0.03%
Banco Nacional de Desenvolvimento Economico e Social 1,590,867,000 0.03%
Export Finance & Insurance Corp 1,577,166,630 0.03%
National Federation Of Fisheries Cooperatives 1,555,653,040 0.03%
Export Import Bank of Thailand 1,512,635,500 0.02%
International Investment Bank 1,462,170,161 0.02%
Eastern & Southern African Trade & Development Bank 1,450,000,000 0.02%
Banco Nacional de Comercio Exterior SNC 1,320,671,096 0.02%
International Finance Facility for Immunisation Co 1,242,369,040 0.02%
Ceska Exportni Banka AS 1,224,467,668 0.02%
Sabah Development Bank Bhd 1,204,416,930 0.02%
North American Development Bank 1,105,233,070 0.02%
Ukreximbank Via Biz Finance PLC 1,091,733,627 0.02%
Export-Import Bank of the Republic of China/The 1,086,636,140 0.02%
Export-Import Bank of Malaysia Bhd 1,006,512,320 0.02%
ICDPS Sukuk Ltd 999,920,250 0.02%
Land & Agricultural Development Bank of South Africa 983,833,406 0.02%
Banco Latinoamericano de Comercio Exterior SA 916,330,128 0.02%
Development Bank of Mongolia LLC 787,345,400 0.01%
Emirates Development Bank PJSC 750,000,000 0.01%
Export-Import Bank of China/Paris 746,376,000 0.01%
Slovenska izvozna in razvojna banka DD 709,869,250 0.01%
Korea Development Bank/London 679,368,450 0.01%
Financiera de Desarrollo Territorial SA Findeter 627,173,842 0.01%
Development Bank of the Republic of Belarus JSC 600,526,580 0.01%
Caribbean Development Bank 548,350,100 0.01%
Avi Funding Co Ltd 500,000,000 0.01%
APICORP Sukuk Ltd 500,000,000 0.01%
Agenzia Nazionale per l'Attrazione degli Investimenti e lo Sviluppo d'Impresa 407,211,000 0.01%
Korea Development Bank/New York NY 390,000,000 0.01%
Magyar Export-Import Bank Zrt 385,906,636 0.01%
ICD Private Sukuk Ltd 350,000,000 0.01%

APPENDIX I: DEBT OUTSTANDING FOR DEVELOPMENT BANKS
TABLE 37: DEBT OUTSTANDING FOR DEVELOPMENT BANKS, BY INSTITUTION CONTINUED
INSTITUTION SUM OF DEBT OUTSTANDING (USD) %
Banconal Covid Relief Facility Sarl 342,000,000 0.01%
European Atomic Energy Community 328,526,663 0.01%
Business Development Bank of Canada 308,285,678 0.01%
National Bank of Uzbekistan 300,000,000 0.00%
Development Bank of Jamaica Ltd 266,129,709 0.00%
Key Industry Stabilization Fund 212,030,160 0.00%
Financiera de Desarrollo Nacional SA 182,230,091 0.00%
Fondo Financiero para el Desarrollo de la Cuenca del Plata 148,359,150 0.00%
EXIM Sukuk Malaysia Bhd 102,300,000 0.00%
Tadamun Services Bhd 87,323,250 0.00%
IFFIm Sukuk Co III Ltd 50,000,000 0.00%
Development Bank of Namibia/The 21,396,909 0.00%
General Secretariat of the Organization of American States 17,225,000 0.00%
Pagare de Indemnizacion Carretera 1,853,220 0.00%
Bank for International Settlements 3,699 0.00%
60 | COLUMBIA CENTER ON SUSTAINABLE INVESTMENT

DEVELOPMENT BANKING IN THE GLOBAL ECONOMY STATE OF PLAY AND FUTURE DIRECTION
ENDNOTES 1. United Nations Department for Economic and Social Affairs. (2020). Report of the
Inter-agency Task Force on Financing for Development 2020: Financing for Sustainable Development report. United Nations.
2. Global Economic Prospects. (n.d.). [Text/HTML]. World Bank. Retrieved September 24, 2020, from https://www.worldbank.org/en/publication/global-economic-prospects
3. Ibid.
4. Ibid.
5. Global Warming of 1.5 oC —. (n.d.). Retrieved September 28, 2020, from https://www.ipcc.ch/sr15/
6. Global Center on Adaptation. (n.d.). Retrieved September 28, 2020, from https://gca.org/global-commission-on-adaptation/adapt-our-world
7. United Nations Department for Economic and Social Affairs. (2020). Report of the Inter-agency Task Force on Financing for Development 2020: Financing for Sustainable Development report. United Nations.
8. Global Economic Prospects. (n.d.). [Text/HTML]. World Bank. Retrieved September 24, 2020, from https://www.worldbank.org/en/publication/global-economic-prospects
9. Doumbia, D., & Lauridsen, M. L. (n.d.). Closing the SDG Financing Gap—Trends and Data. 8.
10. Serra, L., Lorenzo, J. J. G., Smallridge, D., Trabacchi, C., Netto, M., & Buchner, B. (2013). The role of national development banks in catalyzing international climate finance. Inter-American Development Bank.
11. Project Dhurie
12. 2017 Survey of National Development Banks. (2018). World Bank. https://doi.org/10.1596/29815
13. Hua, B., Schclarekb, A., Xua, J., & Yana, J. (2020). Long-Term Finance Provision: National Development Banks VS. Commercial Banks.
14. Luna-Martinez, D., Vicente, C. L., Arshad, A. B., Tatucu, R., & Song, J. (2018). 2017 Survey of National development banks (No. 125958, pp. 1-68). The World Bank.
15. Ibid.
16. 2017 Survey of National Development Banks. (2018). World Bank. https://doi.org/10.1596/29815
17. Shah, A. A. (2019). The economic geography of development banking for sustainable development (Doctoral dissertation, University of Oxford).
18. COVID-19: How multilateral development banks can lead through a crisis. (n.d.). World Economic Forum. Retrieved September 24, 2020, from https://www.weforum.org/agenda/2020/07/brics-new-development-bank-leads-member-states-through-the-COVID-19-crisis/
19. Research: Moody’s - Multilateral development banks are key to infrastructure financing recovery amid COVID-19 downturn - Moody’s. (n.d.). Retrieved September 24, 2020, from https://www.moodys.com/research/Moodys-Multilateral-development-banks-are-key-to-infrastructure-financing-recovery--PBC_1239736
20. Chandrasekhar, C. P. (2016). National development banks in a comparative perspective. Rethinking development strategies after the financial crisis, 2, 21-30.
21. The Fed - Assets and Liabilities of Commercial Banks in the United States - H.8 - September 25, 2020. (n.d.). Retrieved September 28, 2020, from https://www.federalreserve.gov/releases/h8/current/default.htm
22. Ibid.
23. Making the IMF’s Special Drawing Rights Work for COVID-19 Economic Relief. (n.d.). Center For Global Development. Retrieved September 28, 2020, from https://www.cgdev.org/publication/making-imfs-special-drawing-rights-work-COVID-19-economic-relief
24. Griffith-Jones, S., & Ocampo, J. A. (Eds.). (2018). The future of national development banks. Oxford University Press.
25. Luna-Martinez, D., Vicente, C. L., Arshad, A. B., Tatucu, R., & Song, J. (2018). 2017 Survey of National development banks (No. 125958, pp. 1-68). The World Bank.
26. United Nations, World Public Sector Report 2019.
27. Griffith-Jones, S., & Ocampo, J. A. (Eds.). (2018). The future of national development banks. Oxford University Press.
28. Ibid.
29. Luna-Martinez, D., Vicente, C. L., Arshad, A. B., Tatucu, R., & Song, J. (2018). 2017 Survey of National development banks (No. 125958, pp. 1-68). The World Bank.
30. Chen, M. (2020). State actors, market games: Credit guarantees and the funding of China Development Bank. New Political Economy, 25(3), 453-468.
31. Griffith-Jones, S., & Ocampo, J. A. (Eds.). (2018). The future of national development banks. Oxford University Press.
32. Luna-Martinez, D., Vicente, C. L., Arshad, A. B., Tatucu, R., & Song, J. (2018). 2017 Survey of National development banks (No. 125958, pp. 1-68). The World Bank.
33. Humphrey, C., & Prizzon, A. (2014). Guarantees for development. A review of multilateral development bank operations. Overseas Development Institute.
34. Ibid.
35. Ibid.
36. Ibid.
37. Mertens, D., & Thiemann, M. (2019). Building a hidden investment state? The European Investment Bank, national development banks and European economic governance. Journal of European Public Policy, 26(1), 23-43.
38. Van Order, R., & Yezer, A. M. (2014). FHA: Recent history and future prospects. Housing Policy Debate, 24(3), 644-650.
39. Ibid.
40. Amyx, J., & Toyoda, A. M. (2006). The evolving role of national development banks in East Asia. The International Centre for the Study of East Asian Development Working Paper Series, 26.
41. Ibid.
42. De Aghion, B. A. (1999). Development banking. Journal of Development Economics, 58(1), 83-100.
43. Hochstetler, K., & Montero, A. P. (2013). The renewed developmental state: The national development bank and the Brazil model. Journal of Development Studies, 49(11), 1484-1499.
44. Torres, E., & Zeidan, R. (2016). The life-cycle of national development banks: The experience of Brazil's BNDES. The Quarterly Review of Economics and Finance, 62, 97-104.
45. Ibid.
46. Ibid.
47. Lazzarini, S. G., Musacchio, A., Bandeira-de-Mello, R., & Marcon, R. (2002). What do development banks do? Evidence from BNDES, 2002-2009. Evidence from BNDES, 2009.
48. Financial Information - BNDES. (n.d.). Retrieved August 12, 2020, from https://www.bndes.gov.br//SiteBNDES/bndes/bndes_en/Institucional/Investor_Relations/Financial_Information/
49. Domestic credit to private sector by banks (% of GDP) - Brazil | Data. (n.d.). Retrieved August 12, 2020, from https://data.worldbank.org/indicator/FD.AST.PRVT.GD.ZS?locations=BR&mod=article_inline
50. Social and Environmental Responsibility - BNDES. (n.d.). Retrieved August 12, 2020, from https://www.bndes.gov.br/SiteBNDES/bndes/bndes_en/Institucional/Social_and_Environmental_Responsibility/
51. Desenvolvimento, B. I. de, & Forum, W. E. (2019). Improving infrastructure financing in Brazil. http://web.bndes.gov.br/bib/jspui/handle/1408/16620
52. Ibid.
53. Social and Environmental Responsibility - BNDES. (n.d.). Retrieved August 12, 2020, from https://www.bndes.gov.br/SiteBNDES/bndes/bndes_en/Institucional/Social_and_Environmental_Responsibility/
54. Annual Report 2018 - BNDES. (n.d.). Retrieved August 12, 2020, from https://www.bndes.gov.br/SiteBNDES/bndes/bndes_en/Institucional/Investor_Relations/Annual_Report/
55. Ibid.
56. The BNDES - BNDES. (n.d.). Retrieved August 12, 2020, from https://www.bndes.gov.br/SiteBNDES/bndes/bndes_en/Institucional/The_BNDES/
57. Frequently Asked Questions - BNDES. (n.d.). Retrieved August 12, 2020, from https://www.bndes.gov.br/SiteBNDES/bndes/bndes_en/Navegacao_Suplementar/FAQ/faq_answers.html
58. Ferraz, J. C., & Coutinho, L. (2019). Investment policies, development finance and economic transformation: Lessons from BNDES. Structural Change and Economic Dynamics, 48, 86-102.
59. Ibid.
COLUMBIA CENTER ON SUSTAINABLE INVESTMENT | 61

ENDNOTES
60. Griffith-Jones, S., & Ocampo, J. A. (Eds.). (2018). The future of national development banks. Oxford University Press.
61. Ibid.
62. BZTJLP Quote - Brazil BNDES Long Term Interest Rate TJLP Index - Bloomberg Markets. (n.d.). Retrieved August 12, 2020, from https://www.bloomberg.com/quote/BZTJLP:IND
63. Lazzarini, S. G., Musacchio, A., Bandeira-de-Mello, R., & Marcon, R. (2015). What do state-owned development banks do? Evidence from BNDES, 2002–09. World Development, 66, 237-253.
64. Financial Support - BNDES. (n.d.). Retrieved August 12, 2020, from https://www.bndes.gov.br/SiteBNDES/bndes/bndes_en/Institucional/Financial_Support/
65. Ferraz, J. C., & Coutinho, L. (2019). Investment policies, development finance and economic transformation: Lessons from BNDES. Structural Change and Economic Dynamics, 48, 86-102.
66. Ferraz, J. C., & Coutinho, L. (2019). Investment policies, development finance and economic transformation: Lessons from BNDES. Structural Change and Economic Dynamics, 48, 86-102.
67. Schapiro, M. G. (2017). Legality and discretion in public governance of state-owned banks: an analysis applied to the case of BNDES. Revista de Administração Pública, 51(1), 105-128.
68. Frischtak, C., Pazarbasioglu, C., Byskov, S., Hernandez Perez, A., & Carneiro, I. A. (2017). Towards a more effective BNDES. World Bank.
69. Annual Report 2018 - BNDES. (n.d.). Retrieved August 12, 2020, from https://www.bndes.gov.br/SiteBNDES/bndes/bndes_en/Institucional/Investor_Relations/Annual_Report/
70. Ibid.
71. Sanusi, S. L., & GOVERNOR, C. (2012, July). The Role of Development Finance Institutions in Infrastructure Development: What Nigeria Can Learn from Bndes and the Indian Infrastructure Finance. In Keynote address at the 3rd ICRC PPP Stakeholders Forum, Lagos, Nigeria (Vol. 18).
72. Micro, small and medium-sized companies (MSME) - Relatório Anual 2011 - BNDES. (n.d.). Retrieved August 12, 2020, from https://www.bndes.gov.br/SiteBNDES/bndes/bndes_en/Hotsites/Annual_Report_2011/Capitulos/the_bndes_in_numbers/highlight/micro_small_and_medium_sized_companies.html
73. Financial Information - BNDES. (n.d.). Retrieved August 12, 2020, from https://www.bndes.gov.br//SiteBNDES/bndes/bndes_en/Institucional/Investor_Relations/Financial_Information/
74. China Development Bank_Our Mission. (n.d.). Retrieved August 12, 2020, from http://www.cdb.com.cn/English/qywh/khsm/
75. Ibid.
76. Sanderson, H., & Forsythe, M. (2012). China's superbank: debt, oil and influence-how China Development Bank is rewriting the rules of finance. John Wiley & Sons.
77. Ibid.
78. Yuan, C. (2010). Development finance and urbanization development in China [J]. Economic Research Journal, 7, 4-14.
79. Ibid.
80. Chen, M. (2020). State Actors, Market Games: Credit Guarantees and the Funding of China Development Bank. New Political Economy, 25(3), 453–468. https://doi.org/10.1080/13563467.2019.1613353
81. Ibid.
82. Ibid.
83. Sanderson, H., & Forsythe, M. (2012). China's superbank: debt, oil and influence-how China Development Bank is rewriting the rules of finance. John Wiley & Sons.
84. Ibid.
85. Chen, M. (2020). State Actors, Market Games: Credit Guarantees and the Funding of China Development Bank. New Political Economy, 25(3), 453–468. https://doi.org/10.1080/13563467.2019.1613353desxwrewsza
86. Ibid.
87. Ibid.
88. Ibid.
89. Sanderson, H., & Forsythe, M. (2012). China's superbank: debt, oil and influence-how China Development Bank is rewriting the rules of finance. John Wiley & Sons.
90. Chen, M. (2020). State Actors, Market Games: Credit Guarantees and the Funding of China Development Bank. New Political Economy, 25(3), 453–468. https://doi.org/10.1080/13563467.2019.1613353
91. Ibid.
92. Sanderson, H., & Forsythe, M. (2012). China's superbank: debt, oil and influence-how China Development Bank is rewriting the rules of finance. John Wiley & Sons.
93. Chen, M. (2020). State Actors, Market Games: Credit Guarantees and the Funding of China Development Bank. New Political Economy, 25(3), 453–468. https://doi.org/10.1080/13563467.2019.1613353
94. Wang, Y. (2016). The sustainable infrastructure finance of China development bank: composition, experience and policy implications.
95. Ibid.
96. Wang, Y. (2016). The sustainable infrastructure finance of China development bank: composition, experience and policy implications.
97. China Development Bank_12018. (n.d.). Retrieved August 13, 2020, from http://www.cdb.com.cn/English/gykh_512/ndbg_jx/2018_jx/
98. Provaggi, A. (2013). China Development Bank’s financing mechanisms: focus on foreign investments.
99. China Development Bank. (n.d.). Retrieved August 13, 2020, from http://www.cdb.com.cn/English/gykh_512/khjj/
100. Ibid.
101. Ibid.
102. About Us. (n.d.). Retrieved August 13, 2020, from http://www.huijin-inv.cn/huijineng/About_Us/index.shtml
103. National Council for Social Security Fund - Company Profile and News - Bloomberg Markets. (n.d.). Retrieved August 13, 2020, from https://www.bloomberg.com/profile/company/0173893D:CH
104. Chen, M. (2020). State Actors, Market Games: Credit Guarantees and the Funding of China Development Bank. New Political Economy, 25(3), 453–468. https://doi.org/10.1080/13563467.2019.1613353
105. Griffith-Jones, S., & Ocampo, J. A. (Eds.). (2018). The future of national development banks. Oxford University Press.
106. Guo, S., & Shi, Y. (2018). Infrastructure investment in China: A model of local government choice under land financing. Journal of Asian Economics, 56, 24-35.
107. Ibid.
108. Chen, M. (2020). State Actors, Market Games: Credit Guarantees and the Funding of China Development Bank. New Political Economy, 25(3), 453–468.
109. Ibid.
110. Ibid.
111. Ibid.
112. Ibid.
113. Ru, H. (2018). Government Credit, a Double-Edged Sword: Evidence from the China Development Bank. The Journal of Finance, 73(1), 275-316.
114. Ibid.
115. Dechun, Y. (2009). The Impact of China Development Bank's Function Switch to Commercial Bank on Financial Stability. Shanghai Finance, 9.
116. Ibid.
117. Chen, M. (2020). State Actors, Market Games: Credit Guarantees and the Funding of China Development Bank. New Political Economy, 25(3), 453–468.
118. Ibid.
119. China Development Bank_CDB Development Fund. (n.d.). Retrieved August 13, 2020, from https://www.dwvoip888.com/English/ywgl/zhjryw/gkfzjj/
120. China Development Bank_CDB Capital Co., Ltd. (n.d.). Retrieved August 13, 2020, from http://www.cdb.com.cn/English/ywgl/zhjryw/gkjryxzrgs/
121. Sanderson, H., & Forsythe, M. (2012). China's superbank: debt, oil and influence-how China Development Bank is rewriting the rules of finance. John Wiley & Sons.
122. Ibid.
123. Sanderson, H., & Forsythe, M. (2012). China's superbank: debt, oil and influence-how China Development Bank is rewriting the rules of finance. John Wiley & Sons.
124. China Development Bank_12018. (n.d.). Retrieved August 13, 2020, from http://www.cdb.com.cn/English/gykh_512/ndbg_jx/2018_jx/
62 | COLUMBIA CENTER ON SUSTAINABLE INVESTMENT

DEVELOPMENT BANKING IN THE GLOBAL ECONOMY STATE OF PLAY AND FUTURE DIRECTION
125. Mazzucato, M., & Penna, C. C. (2015). The rise of mission-oriented state investment banks: the cases of Germany's KfW and Brazil's BNDES.
126. Ibid.
127. Mazzucato, M., & Penna, C. C. (2015). The rise of mission-oriented state investment banks: the cases of Germany's KfW and Brazil's BNDES.
128. Supporting local governments’ energetic urban redevelopment to step up climate action. (n.d.). Retrieved December 18, 2020, from https://www.kfw.de/KfW-Group/Newsroom/Latest-News/Pressemitteilungen-Details_524224.html
129. Griffith-Jones, S. (2016). National development banks and sustainable infrastructure; the Case of KfW.
130. Ibid.
131. Ibid.
132. Ibid.
133. Enting, K. (2013). Mobilizing Private Sector Investment: KfW Case Studies and Conclusions.
134. Ibid.
135. Griffith-Jones, S. (2016). National development banks and sustainable infrastructure; the Case of KfW.
136. KfW Credit Ratings. (n.d.). Fitch Ratings. Retrieved August 13, 2020, from /kfw-80436988
137. Annual Report. (n.d.). Retrieved August 13, 2020, from https://www.kfw.de/KfW-Group/Service/Download-Center/Financial-Publications-(D-EN)/Gesch%C3%A4ftsbericht/
138. Ibid.
139. Geddes, A., Schmidt, T. S., & Steffen, B. (2018). The multiple roles of state investment banks in low-carbon energy finance: An analysis of Australia, the UK and Germany. Energy Policy, 115, 158-170.
140. Griffith-Jones, S. (2016). National development banks and sustainable infrastructure; the Case of KfW.
141. Annual Report. (n.d.). Retrieved August 13, 2020, from https://www.kfw.de/KfW-
142. Ibid.
143. Mazzucato, M., & Penna, C. C. (2015). The rise of mission-oriented state investment banks: the cases of Germany's KfW and Brazil's BNDES.
144. Products and services of KfW IPEX-Bank. (n.d.). Retrieved August 13, 2020, from https://www.kfw-ipex-bank.de/Produkte-und-Services/Products-and-services.html
145. Equity finance. (n.d.). Retrieved August 13, 2020, from https://www.kfw.de/KfW-Group/Newsroom/Press-Material/Themen-kompakt/Beteiligungsfinanzierung/
146. Kerer, J., Tatin-Jaleran, C., Steinhäuser, L., Helmsmüller, S., Kornherr, L., Debrah, E., ... & Rakotoarimanana, A. Materials on Development Financing.
147. Griffith-Jones, S. (2016). National development banks and sustainable infrastructure; the Case of KfW.
148. Export Finance | Project Finance. (n.d.). Retrieved August 13, 2020, from https://www.kfw-ipex-bank.de/International-financing/KfW-IPEX-Bank/
149. Products and services of KfW IPEX-Bank. (n.d.). Retrieved August 13, 2020, from https://www.kfw-ipex-bank.de/Produkte-und-Services/Products-and-services.html
150. The Management of KfW Group. (n.d.). Retrieved August 13, 2020, from https://www.kfw.de/KfW-Group/About-KfW/Vorstand-und-Gremien/
151. Annual Report. (n.d.). Retrieved August 13, 2020, from https://www.kfw.de/KfW-
152. Singh, R. P. (1993). NABARD: National Bank for Agriculture and Rural Development: organisation, management and role. Deep and Deep Publications.
153. Ibid.
154. Ibid.
155. NABARD - National Bank For Agriculture And Rural Development. (n.d.). Retrieved August 14, 2020, from https://www.nabard.org/content.aspx?id=10
156. Ibid.
157. Singh, R. P. (c1993). NABARD: National Bank for Agriculture and Rural Development : organisation, management and role. Deep & Deep Publications.
158. NABARD - National Bank For Agriculture And Rural Development. (n.d.). Retrieved August 14, 2020, from https://www.nabard.org/financialreport.aspx?cid=505&id=24
159. Ibid.
160. Ibid.
161. Ibid.
162. Ibid.
163. Ibid.
164. Fatima, N. (2019). Effect of non-performing assets on the profitability of Nabard. ZENITH International Journal of Multidisciplinary Research, 9(5), 198-211.
165. NABARD - National Bank For Agriculture And Rural Development. (n.d.). Retrieved August 14, 2020, from https://www.nabard.org/financialreport.aspx?cid=505&id=24
166. Ibid.
167. Ibid.
168. Ibid.
169. Rural Infrastructure Development Fund – NABARD. (n.d.). Retrieved August 14, 2020, from https://www.nabard.org/content1.aspx?id=573&catid=8&mid=488
170. NABARD Infrastructure Development Assistance (NIDA) Scheme - IndiaFilings. (2019, August 2). IndiaFilings - Learning Centre. https://www.indiafilings.com/learn/nabard-loan/
171 NABARD - National Bank For Agriculture And Rural Development. (n.d.). Retrieved August 14, 2020, from https://www.nabard.org/content1.aspx?id=572&catid=8&mid=488
172. Singh, M. S., & Kaur, H. Role of NABARD in Development of Rural Infrastructure.
173. Ibid.
174. Ibid.
175. Ibid.
176. Ibid.
177. Ibid.
178. Goyal, P. K. (2015). The Role of NABARD in Agriculture and Rural Development: An Overview. International Research Journal of Commerce Arts and Science, 6(10).
179. NABARD - National Bank For Agriculture And Rural Development. (n.d.). Retrieved August 14, 2020, from https://www.nabard.org/financialreport.aspx?cid=505&id=24
180. Ibid.
181. Triegaardt, J. D. (2006, September). Reflections on poverty and inequality in South Africa: Policy considerations in an emerging democracy. In Annual Association of South African Social Work Education Institutions Conference, Department of Social Work, University of Venda (pp. 18-20).
182. Ibid.
183. Heymans, C., & Thome-Erasmus, J. (1998). Infrastructure: A foundation for development-key points from the DBSA Development Report 1998.
184. Binns, T., & Nel, E. (2002). Supporting local economic development in post-apartheid South Africa. Local Economy, 17(1), 8-24.
185. Ibid.
186. Building Africa’s prosperity through infrastructure finance and development | Development Bank of Southern Africa. (n.d.). Retrieved August 14, 2020, from https://web.dbsa.org/
187. DBSA Integrated Annual Report 2019. https://www.dbsa.org/EN/About-Us/Publications/Annual%20Reports/DBSA%20Integrated%20Annual%20Report%202018-19.pdf
188. Ibid.
189. Ibid.
190. Ibid.
191. Ntsimane, T. (2017). DBSA: a 21st century African development finance institution supporting the development of sub-Saharan Africa through the achievement of the sustainable development goals. Development Finance Agenda (DEFA), 3(4), 24-26.
192. Financial Reports. (n.d.). Retrieved August 14, 2020, from https://www.dbsa.org/EN/InvestorRelations/Pages/DBSA-Annual-Reports.aspx
193. Ibid.
194. Ibid.
195. Ibid.
196. Ibid.
197. Ibid.
198. Mhlanga, L. K. Exploring the gap-filling development finance role of the Development Bank of Southern Africa (DBSA) (Doctoral dissertation).
COLUMBIA CENTER ON SUSTAINABLE INVESTMENT | 63

64 | COLUMBIA CENTER ON SUSTAINABLE INVESTMENT
ENDNOTES
199. Building Africa’s prosperity through infrastructure finance and development | Development Bank of Southern Africa. (n.d.). Retrieved August 14, 2020, from https://web.dbsa.org/
200. Ibid.
201. Financial Reports. (n.d.). Retrieved August 14, 2020, from https://www.dbsa.org/EN/InvestorRelations/Pages/DBSA-Annual-Reports.aspx
202. Ibid.
203. Ibid.
204. Ibid.
205. Ibid.
206. Annual Reports. (n.d.). Energy.Gov. Retrieved August 26, 2020, from https://www.energy.gov/management/office-management/operational-management/freedom-information-act/documents/annual-reports
207. History of the Loan Programs Office. (n.d.). Energy.Gov. Retrieved August 26, 2020, from https://www.energy.gov/lpo/timeline/history-loan-programs-office
208. Portfolio. (n.d.). Energy.Gov. Retrieved August 26, 2020, from https://www.energy.gov/lpo/portfolio
209. Ibid.
210. Ibid.
211. Title XVII. Department of Energy. (n.d.). Retrieved August 26, 2020, from https://www.energy.gov/lpo/title-xvii
212. Ibid.
213. Ibid.
214. Advanced Technology Vehicles Manufacturing Loan Program. (n.d.). Energy.Gov. Retrieved August 26, 2020, from https://www.energy.gov/lpo/title-xvii/products-services/advanced-technology-vehicles-manufacturing-loan-program
215. Ibid.
216. Tribal Energy Loan Guarantee Program. Department of Energy. (n.d.). Retrieved August 26, 2020, from https://www.energy.gov/lpo/tribal-energy-loan-guarantee-program
217. Ibid.
218. Our Performance. (n.d.). Retrieved August 26, 2020, from https://www.usda.gov/our-agency/about-usda/performance
219. Grants and Loans. (n.d.). Retrieved August 28, 2020, from https://www.usda.gov/topics/farming/grants-and-loans
220. Farm Loan Programs. (n.d.). Retrieved August 28, 2020, from https://www.fsa.usda.gov/programs-and-services/farm-loan-programs/
221. Ibid.
222. Ibid.
223. Our Performance. (n.d.). Retrieved August 26, 2020, from https://www.usda.gov/our-agency/about-usda/performance
224. Kandilov, I. T., & Renkow, M. (2010). Infrastructure investment and rural economic development: An evaluation of USDA's broadband loan program. Growth and Change, 41(2), 165-191.
225. Johnson, J. (2009). Rural Economic Development in the United States: An Evaluation of the US Department of Agriculture's Business and Industry Guaranteed Loan Program. Economic Development Quarterly, 23(3), 229-241.
226 Commodity Credit Corporation. (n.d.). Retrieved August 28, 2020, from https://www.usda.gov/ccc
227. Congressional Research Service (2019). Commodity Credit Corporation: In Brief. https://fas.org/sgp/crs/misc/R44606.pdf
228. FHA Single Family Portfolio SnapShot. HUD.gov/U.S. Department of Housing and Urban Development (HUD). (n.d.). Retrieved August 28, 2020, from https://www.hud.gov/program_offices/housing/rmra/oe/rpts/sfsnap/sfsnap
229. HUD No. 19-164. HUD.gov/U.S. Department of Housing and Urban Development (HUD). (n.d.). Retrieved August 28, 2020, from https://www.hud.gov/press/press_releases_media_advisories/HUD_No_19_164
230. Loans. HUD.gov/U.S. Department of Housing and Urban Development (HUD). (n.d.). Retrieved August 28, 2020, from https://www.hud.gov/buying/loans
231. Annual Report to Congress on the Financial Status of the MMI Fund. HUD.gov/U.S. Department of Housing and Urban Development (HUD). (n.d.). Retrieved August 28, 2020, from https://www.hud.gov/fhammifrpt
232. Ibid.
233. Section 108 Loan Guarantee Program - HUD Exchange. (n.d.). Retrieved August 28, 2020, from https://www.hudexchange.info/programs/section-108/
234. Ibid.
235. Ibid.
236. Ibid.
237. Credit Oversight and Risk Management. US Department of Transportation. (n.d.). Retrieved August 28, 2020, from https://www.transportation.gov/budget/innovative-financing
238. DOT FY 2019 Agency Financial Report. US Department of Transportation. (n.d.). Retrieved August 28, 2020, from https://www.transportation.gov/mission/budget/dot-fy-2019-agency-financial-report
239. Ibid.
240. Poole Jr, R. W. (2011). Transportation Infrastructure Finance and Innovation Act (TIFIA) Policy Brief. Reason Foundation, Los Angeles.
241. Ibid.
242. Ibid.
243. Congressional Research Service (2019). The Transportation Infrastructure Finance and Innovation Act (TIFIA) Program. https://crsreports.congress.gov/product/pdf/R/R45516
244. Ibid.
245. Ibid.
246. Railroad Rehabilitation & Improvement Financing (RRIF). Build America. (n.d.). Retrieved August 28, 2020, from https://www.transportation.gov/buildamerica/financing/rrif/railroad-rehabilitation-improvement-financing-rrif
247. Ibid.
248. Ibid.
249. Ibid.
250. Financing and Debt Overview. MARAD. (n.d.). Retrieved August 28, 2020, from https://www.maritime.dot.gov/grants/title-xi/financing-and-debt-overview
251. Federal Ship Financing Program (Title XI). MARAD. (n.d.). Retrieved August 28, 2020, from https://www.maritime.dot.gov/grants/title-xi/federal-ship-financing-program-title-xi
252. Private Activity Bonds. Build America. (n.d.). Retrieved August 28, 2020, from https://www.transportation.gov/buildamerica/financing/private-activity-bonds-pabs/private-activity-bonds

COLUMBIA CENTER ON SUSTAINABLE INVESTMENT | 65
DEVELOPMENT BANKING IN THE GLOBAL ECONOMY STATE OF PLAY AND FUTURE DIRECTION

ccsi.columbia.edu
Columbia Center on Sustainable Investment
Jerome Greene Hall 435 West 116th Street New York, NY 10027 Phone: +1(212) 854-1830 Fax: +1(212) 854-7946
The Columbia Center on Sustainable Investment is a leading applied research center and forum dedicated to the study, discussion and practice of sustainable international investment.
“The ability of NDBs to rapidly increase capital and disburse
funds to all sectors of the economy, but especially to areas
where the private sector tends to lag, make them the ideal
partners to fund a recovery.”