development chapter 9 children in lundazi district of zambia
TRANSCRIPT

Development
Chapter 9
Children in Lundazi District of Zambia

Key Issue 1: Why does development vary among countries?
HDI – Human Development Index– Economic - GDP Per capita– Social – literacy rate and amount of education– Demographic – life expectancy
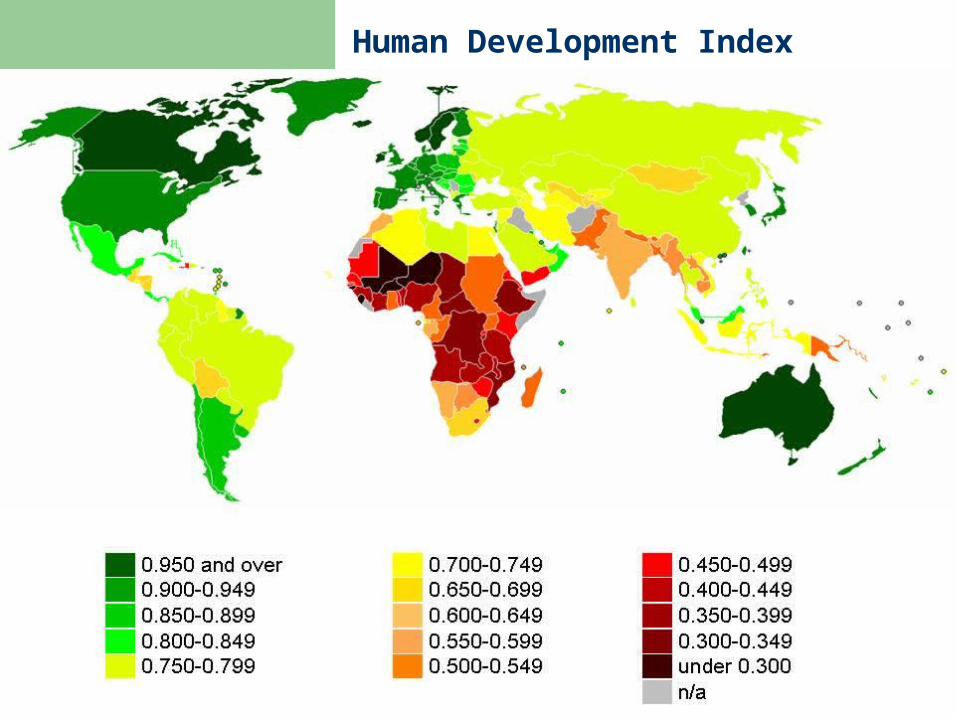
Human Development Index

Gross Domestic Product Per Capita
GDP – the value of the total output of goods and services produced in a country during the year– Per capita = per person
GDP per capita shows an individuals contribution to generating a country’s wealth

GDP Per Capita

GDP in MDCs vs. LDCs
GDP per capita exceeds $20,000 in MDCs LDC are in the $1,000 range
Problem – GDP per capita is an average, doesn’t reflect all citizens, and doesn’t necessarily reflect quality of life

Why? – Types of Jobs
Per capita income is higher in MDCs because of the way people earn their living
Sectors of the economy:– Primary – LDC 75%, MDC less than 5%– Secondary– Tertiary

Primary Sector
Directly extract materials from the Earth Examples: Agriculture, mining, fishing,
forestry

Secondary Sector
Manufacturing of raw materials into useful products
Pencil factory

Tertiary sector
Providing goods and services to people in exchange for payment


Productivity
Workers in MDCs are more productive with less effort
Why? – Technology, mechanization
Planting crops in Kenya

Raw Materials
Development requires access to raw materials AND energy resources

Consumer Goods
After buying essential goods (food, clothing, shelter), people in MDCs buy consumer goods– Cars, telephones, entertainment

Three goods in particular…
Motor vehicles, telephones, televisions Ratio is approaching 1:1 Why are these products so important?
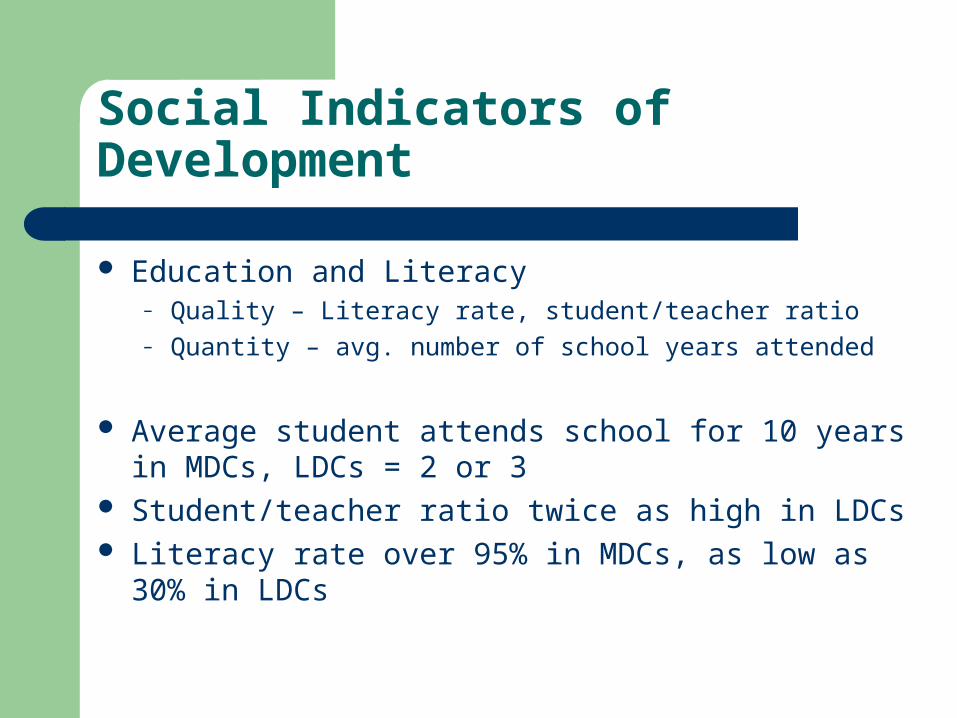
Social Indicators of Development
Education and Literacy– Quality – Literacy rate, student/teacher ratio– Quantity – avg. number of school years attended
Average student attends school for 10 years in MDCs, LDCs = 2 or 3
Student/teacher ratio twice as high in LDCs Literacy rate over 95% in MDCs, as low as 30% in
LDCs

Demographic Indicators of Development
Life expectancy – better health and welfare in MDCs, 70s vs 40s
Infant Mortality Rate– LDCs = 100/ 1000 live births– MDCs = 10/ 1000 live births

Natural Increase rate– LDCs = more than 2 percent– MDCs = less than 1 percent
Why is a high NIR difficult for a country? Crude Birth Rate – 3 or 4 times as high in
LDCs – why? Crude Death Rate – not a factor, why?

World Birth Rate

Key Issue 2: Where are more and less developed countries distributed?
More Developed Regions– Anglo-America, Western Europe, Eastern Europe,
Japan, South Pacific
Less Developed Regions– Latin America, East Asia, Southeast Asia, Middle
East, South Asia, Sub-Saharan Africa
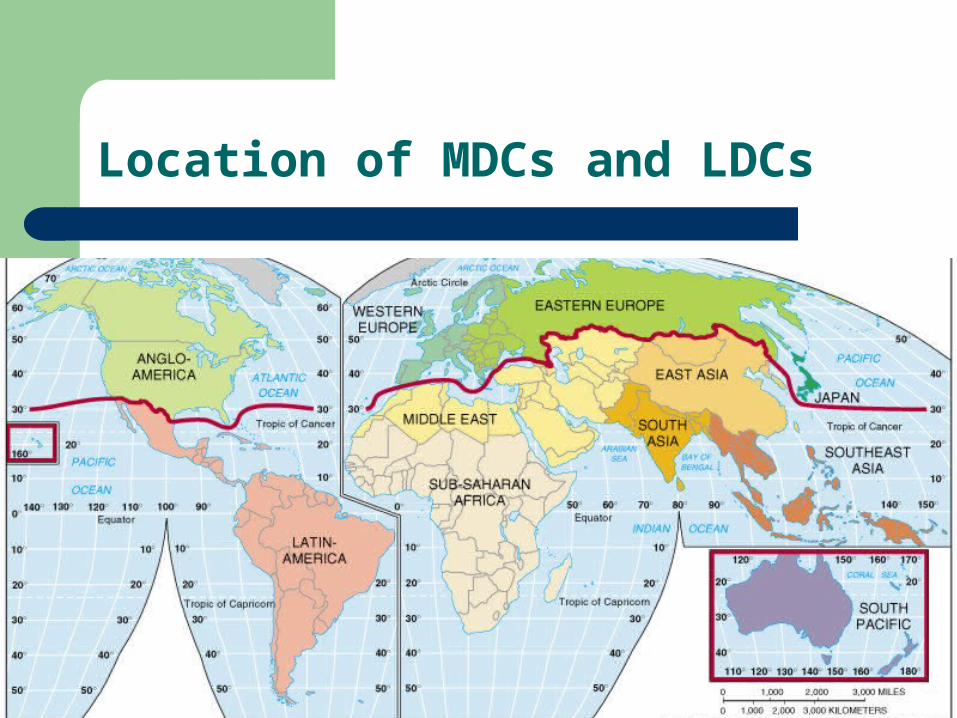
Location of MDCs and LDCs

Top countries by HDI - 2011
1. Norway
2. Australia
3. The Netherlands
4. United States
5. New Zealand
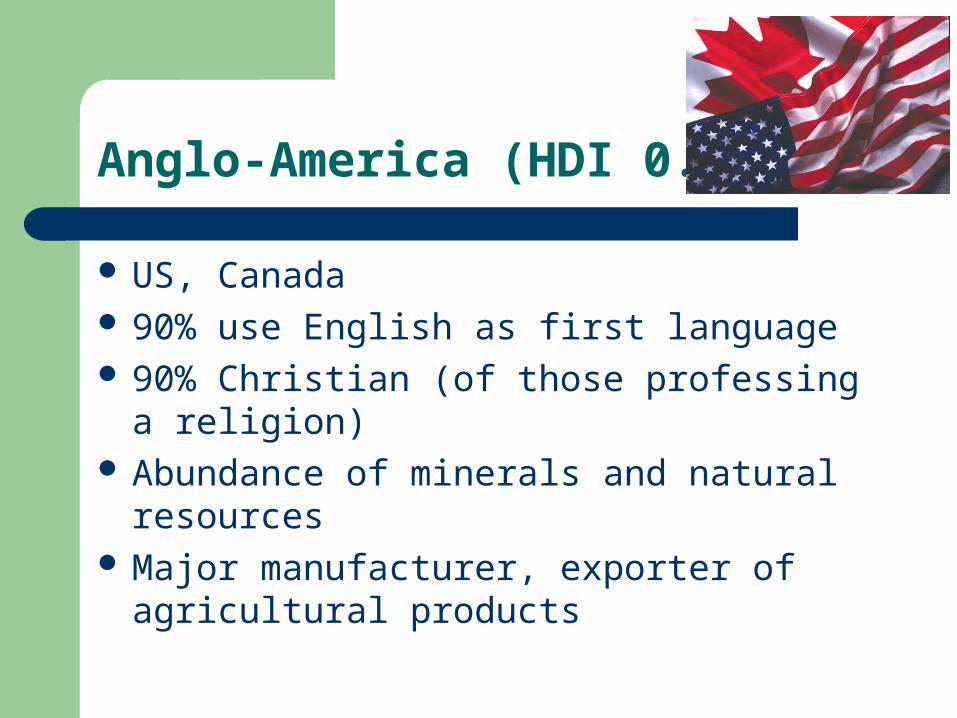
Anglo-America (HDI 0.94)
US, Canada 90% use English as first language 90% Christian (of those professing a religion) Abundance of minerals and natural
resources Major manufacturer, exporter of agricultural
products


Western Europe (0.92)
Primarily Indo-European languages and Christian religion
Post WWII – more unified politically, militarily, and economically
Colonization and after

Eastern Europe (0.78)
HDI has declined here in the last 20 years
Post WWII, rapid development controlled and led by the USSR
Difficult transition to the market economy
Previous Soviet emphasis on primary sector

Japan (0.93)
Highly developed despite lacking resources Must import food and resources like coal and
iron How? Low-wage workers to compete
internationally then transitioned to high quality/value products– Electronics, motor vehicles, cameras

Japan focused on skilled labor force– Education systems and
training
Emphasis and spend resources on research and development

South Pacific (0.93)
Australia, New Zealand 90% of residents are descendants of 19th
Century British settlers
#17 on the Forbes 40 in Australia, Foster’s is worth almost 10 billion USD

Latin America (0.78)
Spanish/Portuguese, Roman Catholicism Large urban populations Development is hindered by inequitable
income distribution and land ownership

East Asia (0.72)
China has massive economy but is also considered poor
GDP per capita is $7600– Ranked 125th in the
World (CIA Factbook) Europe and Japan have
exploited China’s resources in the past, hindering development

Communists take over in 1949
Govt. controlled agricultural land and production
Almost 40% of people work in primary sector Mao Zedong –
Chairman/Leader of PRC (1949-1976)
China’s One Child Policy– Limits NIR– Economic growth can
be used to improve standards of living for existing population
– Total Fertility Rate is at 1.7

Southeast Asia (0.71)
Indonesia is most populous country Region has suffered from warfare in the 20th
century Tropical climate limits agriculture Geography limits economic development
– Mountains, islands, volcanoes, typhoons

Rice is most important export
Cheap labor aids manufacturing efforts
Rice farmers in Vietnam
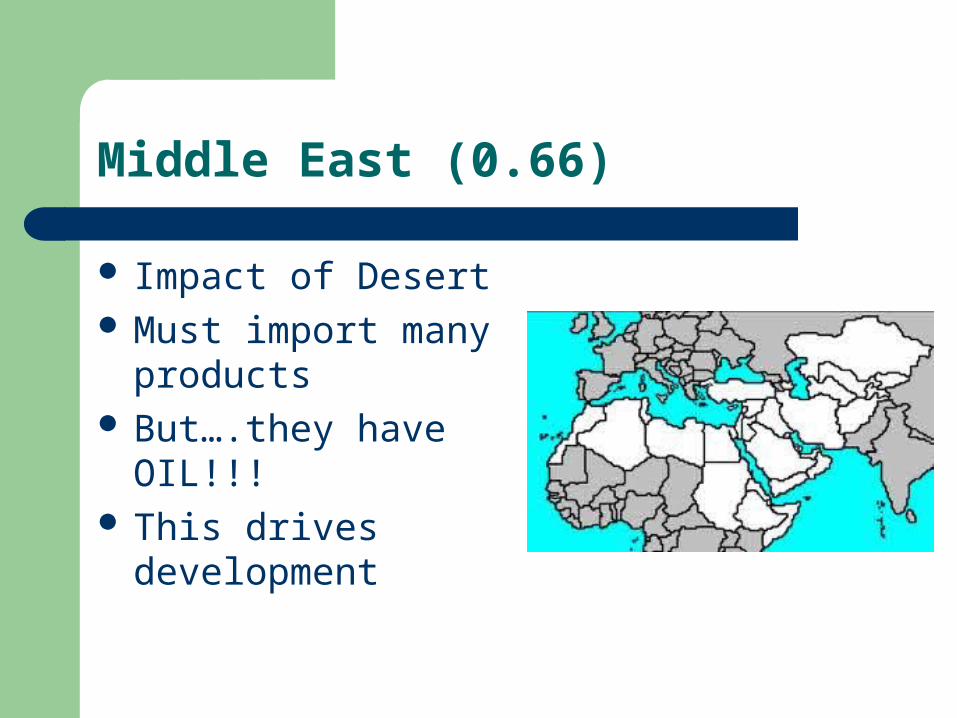
Middle East (0.66)
Impact of Desert Must import many
products But….they have OIL!!! This drives
development

Traditional cultural values of Islam can challenge development
Women’s participation in business is restricted
Low literacy rates among women (50% avg. but as low as 15% in Afghanistan)
Strong, internal cultural disputes hurt growth
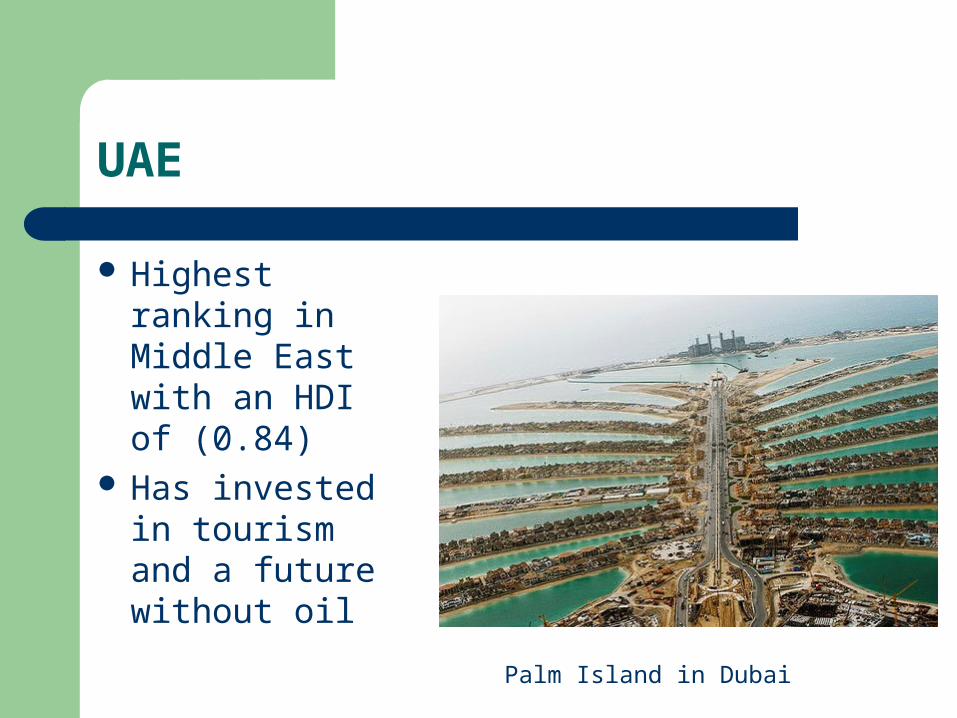
UAE
Highest ranking in Middle East with an HDI of (0.84)
Has invested in tourism and a future without oil
Palm Island in Dubai

South Asia (0.58)
2nd highest population, 2nd lowest per capita income
NIR is very high India has many
resources but a HUGE population Jute – makes burlap and
twine

Green Revolution in India – positive impact on agriculture
Production still depends on climate and the summer monsoon season

Sub-Saharan Africa (0.47)
Though SSA has many resources, prospective development is low
Worlds highest percentage of poverty, poor health, and education levels

Why?
Legacy of colonial era
Many landlocked states
Very high NIR Possibly at carrying
capacity in certain areas
Sahel – South of the Sahara

Key Issue 3: Where does level of development vary by gender?
Gender-Related Development Index (GDI)– Compares the level of development to that of both
sexes– Uses same criteria as HDI– Highest is 1.0– Lower means greater
disparity between sexes

Top Countries by GDI
1. Iceland
2. Australia
3. Norway
4. Canada
5. Sweden

Economic Indicators
Average income in every country of world is lower for women
Per capita annual income in US (2001) was $43,000 for men and $26,000 for women
MDCs have $15K or more income gap LDCs have smaller number but greater
percentage gap

Social Indicators
Education and literacy Women to men in high
school– MDCs = 99 to 100– LDCs = 60 to 100

Primary School Enrollment and Total Fertility Rates for Selected Countries, Latest Year
Rank CountryPrimary School
EnrollmentTotal Fertility
RatePercent Number of
childrenper woman
1 Japan 100.0 1.32 Spain 99.8 1.53 Iran 99.7 1.84 Georgia 99.6 1.65 United Kingdom 99.6 1.9...181 Equitorial Guinea 53.5 5.3182 Guinea-Bissau 52.1 5.7183 Djibouti 40.1 3.9184 Sudan 39.2 4.2185 Eritrea 35.7 4.6 Note: Rankings are based on a list of 185 countries for which primary enrollment data are available. See full table. Source: EPI from UNESCO

Demographic Indicators
Life expectancy– MDCs = Women outlive men by 6 years– LDCs only a year or two– Hazards of childbearing

Gender Empowerment Measure (GEM)
Compares ability of the men and women to participate in economic and political decision making
GDI shows standard of living and well-being, GEM measures ability to participate in the process of achieving those improvements
Every country has a higher GDI than GEM
Economic Indicators
% of women in professional and technical jobs– Highest percent is in Northern Europe, around
50% of professional jobs are held by women– LDCs are around 25%

Political Indicators
Managerial jobs have the ability to influence the decision making process
33% - North America, Northern Europe, South Pacific
10% - other MDCs Less than 5% - LDCs

Public Offices
No government in the world has a majority of women
Northern Europe – 33% US – 13% Other MDCs – 10% LDCs – less than 5%
Madeleine Albright – Former US Secretary of State

Why do less developed countries face obstacles to development?

Debt Matters
• The developing world now spends $13 on debt repayment for every $1 it receives in grants. • For the poorest countries (approximately 60), $550 billion has been paid in both principal and interest over the last three decades, on $540bn of loans, and yet there is still a $523 billion dollar debt burden. Source: Debt relief hope brings out the critics, Jorn Madslien, BBC, June 29, 2005

Self-Sufficiency
International Trade

Financing Development
