development charges report - king
TRANSCRIPT

Watson & Associates Economists Ltd. 905-272-3600 November 12, 2020 [email protected]
Development Charges Background
Study
Township of King

Watson & Associates Economists Ltd. H:\King\2020 DC Study\Report\Report.docx
Table of Contents
Page
Executive Summary ....................................................................................................... i
1. Introduction ........................................................................................... 1-1
1.1 Purpose of this Document ....................................................................... 1-1
1.2 Summary of the Process ......................................................................... 1-2
1.3 Changes to the D.C.A.: Bill 73 – Smart Growth for our Communities Act, 2015 ........................................................................... 1-3
1.3.1 Area Rating ................................................................................ 1-3
1.3.2 Asset Management Plan for New Infrastructure ......................... 1-3
1.3.3 60-Day Circulation of D.C. Background Study ........................... 1-4
1.3.4 Timing of Collection of D.C.s ...................................................... 1-4
1.3.5 Other Changes ........................................................................... 1-4
1.4 Further Changes to the D.C.A.: Bill 108, 138 and 197 ............................ 1-5
1.4.1 Bill 108: More Homes, More Choice Act – An Act to Amend Various Statutes with Respect to Housing, Other Development, and Various Matters ............................................ 1-5
1.4.2 Bill 138: Plan to Build Ontario Together Act, 2019 ..................... 1-6
1.4.3 Bill 197: COVID-19 Economic Recovery Act, 2020 .................... 1-6
2. Current Township of King Policy ......................................................... 2-1
2.1 Schedule of Charges .............................................................................. 2-1
2.2 Services Covered ................................................................................... 2-2
2.3 Timing of D.C. Calculation and Payment ................................................ 2-2
2.4 Indexing .................................................................................................. 2-2
2.5 Redevelopment Allowance ..................................................................... 2-3
2.6 Exemptions ............................................................................................. 2-3
3. Anticipated Development in the Township of King ............................ 3-1
3.1 Requirement of the Act ........................................................................... 3-1
3.2 Basis of Population, Household and Non-Residential Gross Floor Area Forecast ......................................................................................... 3-1
Table of Contents (Cont’d)
Page
Watson & Associates Economists Ltd. H:\King\2020 DC Study\Report\Report.docx
3.3 Summary of Growth Forecast ................................................................. 3-2
4. The Approach to the Calculation of the Charge ................................. 4-1
4.1 Introduction ............................................................................................. 4-1
4.2 Potentially Involved ................................................................................. 4-1
4.3 Increase in the Need for Service ............................................................. 4-1
4.4 Local Service Policy ................................................................................ 4-6
4.5 Capital Forecast ...................................................................................... 4-7
4.6 Treatment of Credits ............................................................................... 4-7
4.7 Classes of Services ................................................................................ 4-8
4.8 Existing Reserve Funds .......................................................................... 4-9
4.9 Deductions ............................................................................................ 4-10
4.9.1 Reduction Required by Level of Service Ceiling ...................... 4-10
4.9.2 Reduction for Uncommitted Excess Capacity .......................... 4-11
4.9.3 Reduction for Benefit to Existing Development ........................ 4-11
4.9.4 Reduction for Anticipated Grants, Subsidies and Other Contributions ............................................................................ 4-13
4.10 Municipal-wide vs. Area Rating ............................................................. 4-13
4.11 Allocation of Development .................................................................... 4-13
4.12 Asset Management ............................................................................... 4-13
4.13 Transit ................................................................................................... 4-14
5. D.C.-Eligible Cost Analysis by Service ............................................... 5-1
5.1 Introduction ............................................................................................. 5-1
5.2 Service Levels and 10-Year Capital Costs for D.C. Calculation .............. 5-1
5.2.1 Growth Studies .......................................................................... 5-1
5.2.2 Library Services ......................................................................... 5-9
5.2.3 Parks and Recreation Services ................................................ 5-12
5.3 Service Levels and Buildout Capital Costs for King’s D.C. Calculation ............................................................................................ 5-18
5.3.1 Services Related to a Highway ................................................ 5-18
5.3.2 Fire Protection Services ........................................................... 5-28
5.4 Service Levels and Urban Specific Buildout Capital Costs for King’s D.C. Calculation .................................................................................... 5-30
5.4.1 Stormwater Services ................................................................ 5-30
5.4.2 Water & Wastewater Studies and Capital Improvements ........ 5-32
5.4.3 Water Services ......................................................................... 5-34
5.5 Service Levels and Area-Specific Buildout Capital Costs for King’s D.C. Calculation .................................................................................... 5-37
5.5.1 Wastewater Services – Nobleton ............................................. 5-37
5.5.2 Wastewater Services – King City ............................................. 5-39

Table of Contents (Cont’d)
Page
Watson & Associates Economists Ltd. H:\King\2020 DC Study\Report\Report.docx
6. D.C. Calculation ..................................................................................... 6-1
7. D.C. Policy Recommendations and D.C. By-law Rules ...................... 7-1
7.1 Introduction ............................................................................................. 7-1
7.2 D.C. By-law Structure ............................................................................. 7-2
7.3 D.C. By-law Rules ................................................................................... 7-2
7.3.1 Payment in any Particular Case ................................................. 7-2
7.3.2 Determination of the Amount of the Charge ............................... 7-3
7.3.3 Application to Redevelopment of Land (Demolition and Conversion) ................................................................................ 7-4
7.3.4 Exemptions (full or partial) ......................................................... 7-4
7.3.5 Phasing in .................................................................................. 7-5
7.3.6 Timing of Collection ................................................................... 7-5
7.3.7 Indexing ..................................................................................... 7-7
7.3.8 The Applicable Areas ................................................................. 7-7
7.4 Other D.C. By-law Provisions ................................................................. 7-8
7.4.1 Categories of Services for Reserve Fund and Credit Purposes .................................................................................... 7-8
7.4.2 By-law In-force Date .................................................................. 7-8
7.4.3 Minimum Interest Rate Paid on Refunds and Charged for Inter-Reserve Fund Borrowing ................................................... 7-8
7.4.4 Area Rating ................................................................................ 7-8
7.5 Other Recommendations ...................................................................... 7-10
8. By-law Implementation ......................................................................... 8-1
8.1 Public Consultation Process ................................................................... 8-1
8.1.1 Introduction ................................................................................ 8-1
8.1.2 Public Meeting of Council........................................................... 8-1
8.1.3 Other Consultation Activity ......................................................... 8-1
8.2 Anticipated Impact of the Charge on Development ................................. 8-2
8.3 Implementation Requirements ................................................................ 8-3
8.3.1 Introduction ................................................................................ 8-3
8.3.2 Notice of Passage ...................................................................... 8-3
8.3.3 By-law Pamphlet ........................................................................ 8-3
8.3.4 Appeals ...................................................................................... 8-4
8.3.5 Complaints ................................................................................. 8-4
8.3.6 Credits ....................................................................................... 8-5
8.3.7 Front-Ending Agreements .......................................................... 8-5
8.3.8 Severance and Subdivision Agreement Conditions ................... 8-5
Appendix A Background Information on Residential and Non-Residential Growth Forecast .................................................................................. A-1

Table of Contents (Cont’d)
Page
Watson & Associates Economists Ltd. H:\King\2020 DC Study\Report\Report.docx
Appendix B Level of Service ................................................................................... B-1
Appendix C Long-Term Capital and Operating Cost Examination ...................... C-1
Appendix D D.C. Reserve Fund Policy ................................................................... D-1
Appendix E Local Service Policy ............................................................................E-1
Appendix F Asset Management Plan ...................................................................... F-1
Appendix G Proposed D.C. By-law ......................................................................... G-1

Watson & Associates Economists Ltd. H:\King\2020 DC Study\Report\Report.docx
List of Acronyms and Abbreviations
Acronym Full Description of Acronym
A.M.P. Asset management plan
CANSIM Canadian Socio-Economic Information Management System (Statistics Canada)
D.C. Development charge
D.C.A. Development Charges Act, 1997, as amended
F.I.R. Financial Information Return
G.F.A. Gross floor area
L.P.A.T. Local Planning Appeal Tribunal
N.F.P.O.W. No Fixed Place of Work
O.M.B. Ontario Municipal Board
O.P.A. Official Plan Amendment
O. Reg. Ontario Regulation
P.O.A. Provincial Offences Act
P.P.U. Persons per unit
S.D.E. Single detached equivalent
S.D.U. Single detached unit
sq.ft. square foot
sq.m square metre


Executive Summary

Watson & Associates Economists Ltd. PAGE i H:\King\2020 DC Study\Report\Report.docx
Executive Summary
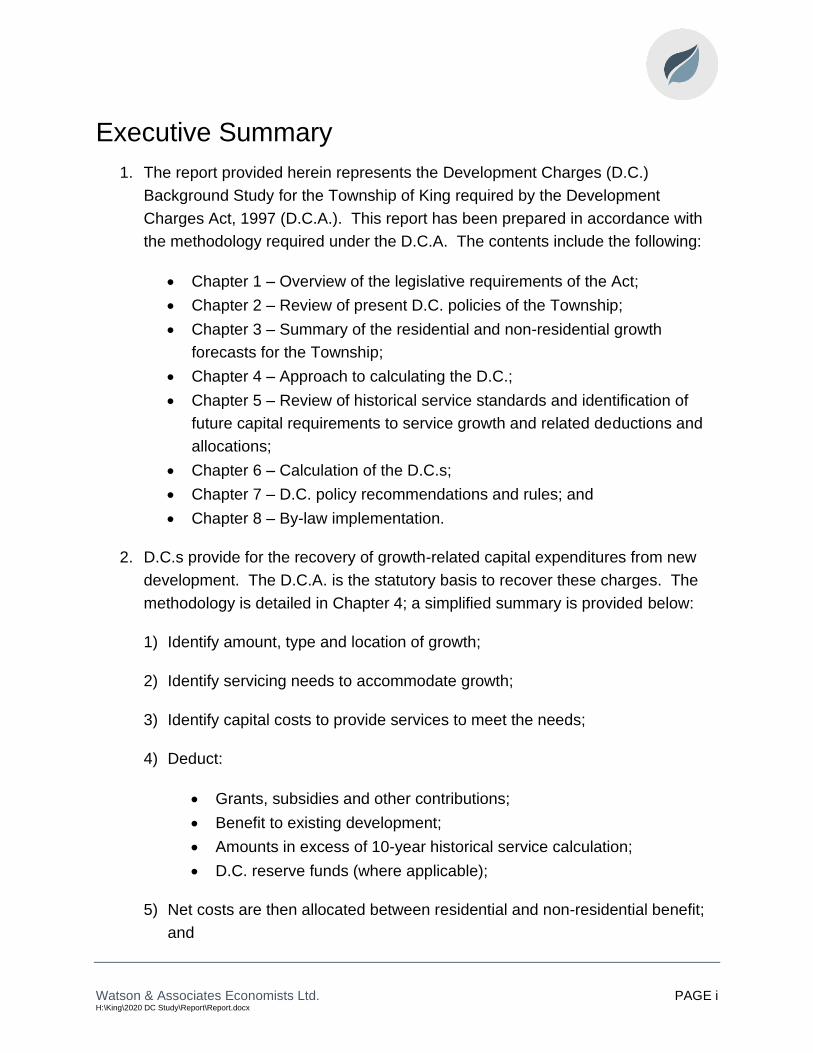
1. The report provided herein represents the Development Charges (D.C.)
Background Study for the Township of King required by the Development
Charges Act, 1997 (D.C.A.). This report has been prepared in accordance with
the methodology required under the D.C.A. The contents include the following:
• Chapter 1 – Overview of the legislative requirements of the Act;
• Chapter 2 – Review of present D.C. policies of the Township;
• Chapter 3 – Summary of the residential and non-residential growth
forecasts for the Township;
• Chapter 4 – Approach to calculating the D.C.;
• Chapter 5 – Review of historical service standards and identification of
future capital requirements to service growth and related deductions and
allocations;
• Chapter 6 – Calculation of the D.C.s;
• Chapter 7 – D.C. policy recommendations and rules; and
• Chapter 8 – By-law implementation.
2. D.C.s provide for the recovery of growth-related capital expenditures from new
development. The D.C.A. is the statutory basis to recover these charges. The
methodology is detailed in Chapter 4; a simplified summary is provided below:
1) Identify amount, type and location of growth;
2) Identify servicing needs to accommodate growth;
3) Identify capital costs to provide services to meet the needs;
4) Deduct:
• Grants, subsidies and other contributions;
• Benefit to existing development;
• Amounts in excess of 10-year historical service calculation;
• D.C. reserve funds (where applicable);
5) Net costs are then allocated between residential and non-residential benefit;
and

Watson & Associates Economists Ltd. PAGE ii H:\King\2020 DC Study\Report\Report.docx
6) Net costs divided by growth to provide the D.C.
3. A number of changes to the D.C. process need to be addressed as a result of the
Smart Growth for our Communities Act, 2015 (Bill 73). These changes have
been incorporated throughout the report and in the updated draft by-law, as
necessary. These items include:
a. Area-rating: Council must consider the use of area-specific charges.
b. Asset Management Plan for New Infrastructure: The D.C. background
study must include an asset management plan that deals with all assets
proposed to be funded, in whole or in part, by D.C.s. The asset
management plan must show that the assets are financially sustainable
over their full lifecycle.
c. 60-day Circulation Period: The D.C. background study must be released
to the public at least 60-days prior to passage of the D.C. by-law.
d. Timing of Collection of Development Charges: The D.C.A. now requires
D.C.s to be collected at the time of the first building permit.
4. Further changes to the D.C.A. were introduced through three bills passed in the
Ontario legislature: Bill 108, Bill 138, and Bill 197. The following provides a brief
summary of the proposed changes.
Bill 108: More Homes, More Choice: Ontario’s Housing Supply Action Plan
In May 2019, the Province introduced Bill 108 More Homes, More Choice Act,
2019 which would make changes to the current D.C. legislation. The Bill was
passed and given Royal Assent on June 6, 2019. While the legislation has been
passed, much of the detailed changes were to be implemented by Regulation
which were not yet passed. The following items are currently in effect:
a. Effective January 1, 2020, rental housing and institutional
developments shall pay D.C.s in six (6) equal annual payments
commencing at first occupancy. Non-profit housing developments
shall pay D.C.s in 21 equal annual payments. Interest may be charged
on the installments, and any unpaid amounts inclusive of interest

Watson & Associates Economists Ltd. PAGE iii H:\King\2020 DC Study\Report\Report.docx
payable shall be added to the property tax roll and collected in the
same manner as taxes.
b. Effective January 1, 2020, the D.C. amount for all developments
occurring within two years of a Site Plan or Zoning By-law Amendment
planning approval (for applications made after January 1, 2020), shall
be determined based on the D.C. by-law in effect on the day of Site
Plan or Zoning By-law Amendment application.
Other key elements of the changes that were not proclaimed and were dealt with
subsequently through Bill 197 are provided below:
• The D.C. would be refined to only allow for the following services to remain
within the D.C.: water, wastewater, storm water, roads, fire, policing,
ambulance, waste diversion, parks development, recreation, public libraries,
long-term care, public health;
• The mandatory 10% deduction would be removed for all services that remain
eligible in the D.C.;
• A new community benefits charge (C.B.C.) would be introduced to include
formerly eligible D.C. services that are not included in the above listing,
parkland dedication and bonus zoning contributions;
Bill 138: Plan to Build Ontario Together Act, 2019
On November 6, 2019, the Province release Bill 138 which provided further
amendments to the D.C.A. and Planning Act. This Bill received Royal Assent on
December 10, 2019 and was proclaimed which resulted in sections related to the
D.C.A. (schedule 10) becoming effective on January 1, 2020. With respect to the
D.C.A., this Act removed installment payments for commercial and industrial
developments that were originally identified in Bill 108.
Bill 197: COVID-19 Economic Recovery Act, 2020
In March 2020, Canada was impacted by the COVID-19 global pandemic. As a
result, the economy was put into a state of emergency in an effort to slow the
spread of the virus. In response, the Province tabled legislation on July 8, 2020
which amended a number of Acts, including the D.C.A. and the Planning Act.
With this Bill, many changes proposed in Bill 108 have now been revised. With

Watson & Associates Economists Ltd. PAGE iv H:\King\2020 DC Study\Report\Report.docx
respect to the above noted changes from Bill 108, the following changes are
provided in Bill 197:
• Eligible Services: The list of eligible services for the D.C. has now been
expanded to include most services eligible under the D.C.A. prior to Bill 108.
For the Township of King this means that all services currently provided in the
D.C. study remain eligible, other than municipal parking.
• Mandatory 10% Deduction: The mandatory 10% deduction is still removed
(consistent with Bill 108). This applies to all D.C.-eligible services.
• Community Benefits Charges: a municipality may, by-law impose a C.B.C. to
pay for the capital costs for formerly-eligible D.C. services in addition to
parkland dedication and bonus zoning contributions. Based on the list of
D.C.-eligible services under the new legislation, parking services will no
longer be eligible under the D.C.A. The Township may consider a C.B.C.
strategy for parking in order to collect for growth-related capital costs, as they
will no longer be able to collect for this service under the D.C.A.
The above changes to the D.C.A. were proclaimed on September 18, 2020.
These changes are described further in Section 1.4 of this report.
5. The growth forecast (Chapter 3) on which the Township-wide D.C. is based,
projects the following population, housing and non-residential floor area for the
10-year (2020 to 2029), Buildout (2020-Buildout), and Urban Buildout (2020-
Urban Buildout) periods. Furthermore, the Urban Buildout for King City and
Nobleton have been identifed for wastewater servicing purposes.
6. On September 14, 2015, the Township of King passed By-law 2015-100 under
the D.C.A. The by-law imposes D.C.s on residential and non-residential uses.
This by-law would have expired on September 15, 2020, however, the
Coronavirus (COVID-19) Support and Protection Act, 2020 came into force on
April 14, 2020 which allows the 2015 D.C. by-law to continue to be in effect for
10 Year Township TownshipKing City
Buildout
Nobleton
Buildout
2020-2029 2020-Buildout Urban Buildout 2020-Buildout 2020-Buildout
(Net) Population Increase 6,957 9,613 10,104 6,708 3,131
Residential Unit Increase 3,054 4,051 3,856 2,552 1,207
Non-Residential Gross Floor Area Increase (ft²) 1,016,500 1,340,700 1,208,700 517,700 626,000
Source: Watson & Associates Economists Ltd. Forecast 2020
Measure

Watson & Associates Economists Ltd. PAGE v H:\King\2020 DC Study\Report\Report.docx
six months after the provincial emergency declaration period. On July 24, 2020,
the Reopening Ontario (A Flexible Response to COVID-19) Act, 2020, came into
effect, bringing an end to the provincial state of emergency. Accordingly, the
2015 by-law is continued in force until January 24, 2021. The Township is
undertaking a D.C. public process and anticipates passing a new by-law in
advance of the date the existing by-law is no longer in force. The mandatory
public meeting has been set for December 14, 2020 with adoption of the by-law
on January 18, 2021.
7. The Township’s D.C.s currently in effect are $28,034 per single detached unit for
municipal-wide services. The urban area specific charge for water services and
water & wastewater studies is $3,633 per single detached unit. Furthermore, the
Township imposes additional area specific charges for wastewater services in
King City and Nobleton at a total of $6,375 and $4,554 per single detached unit,
repectively.
With respect to non-residential, the municipal-wide charge is $8.57 per square
foot ($92.25 per square metre) of building area. The urban area specific non-
residential D.C. for water services and water & wastewater studies is $0.53 per
square foot ($5.70 per square metre). For the areas of King City and Nobleton,
an additional area specific charge for wastewater services is imposed at a rate of
$0.80 per square foot ($8.61 per square metre) and $0.37 per sqaure foot ($3.98
per square metre), respectively.
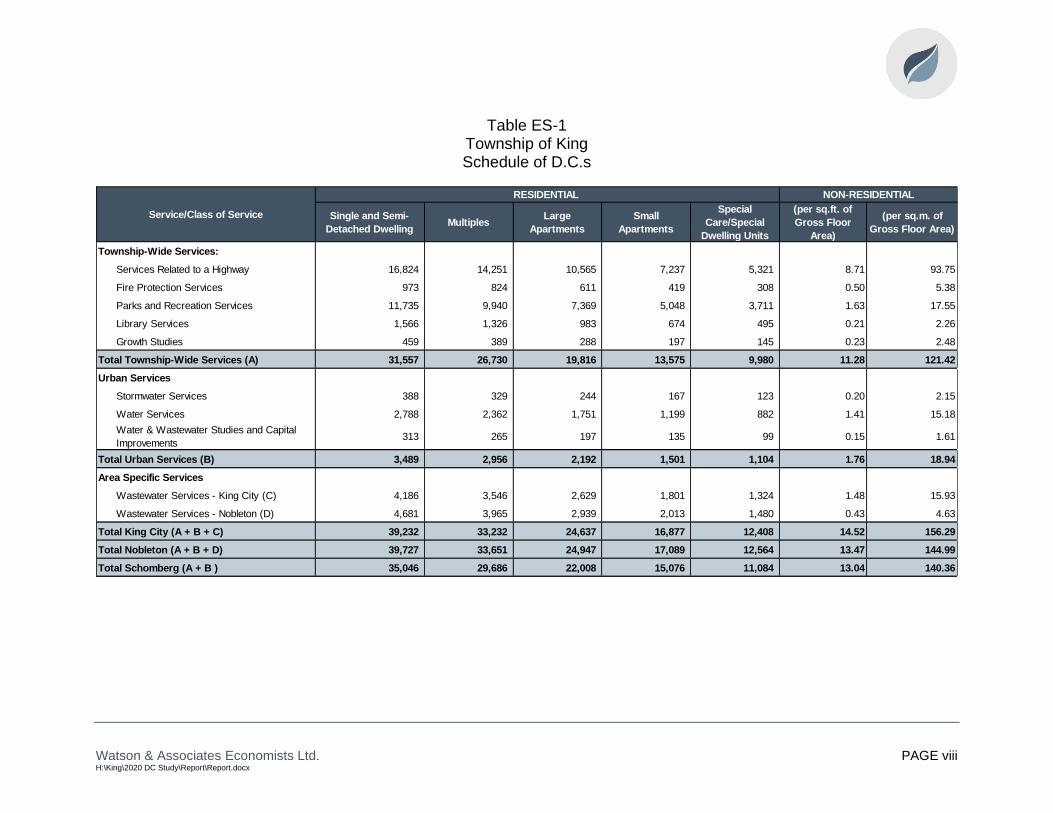
This report has undertaken a recalculation of the charge based on future
identified needs (presented in Schedule ES-1 for residential and non-residential).
Charges have been provided on a Township-wide basis for all services other
than water, stormwater, wastewater, and water & wastewater studies. The
corresponding single detached unit charge for Township-wide charges is
$31,557. The urban services charge is an additional $3,489 per single detached
unit. Area specific charges have also been calculated for wastewater services at
$4,186 per single detached unit in King City and $4,681 in Nobleton.
The non-residential charge for Township-wide services is $11.28 per square foot
($121.42 per square metre) of building area. The non-residential urban services
charge is an additional $1.76 per square foot ($18.94 per square metre).
Additonally, the area-specific wastewater charge for King City is $1.48 per

Watson & Associates Economists Ltd. PAGE vi H:\King\2020 DC Study\Report\Report.docx
square foot ($15.93 per square metre) and $0.43 per square foot ($4.63 per
square metre) in Nobleton. These rates are submitted to Council for its
consideration.
8. The D.C.A. requires a summary be provided of the gross capital costs and the
net costs to be recovered over the life of the by-law. This calculation is provided
by service and is presented in Table 6-7. A summary of these costs is provided
below:
This suggests that for the non-D.C. costs over the five-year D.C. by-law (benefit
to existing development, and the grants, subsidies and other contributions),
$50.99 million (or an annual amount of $10.20 million) will need to be contributed
from taxes and rates, or other sources.
Based on the above table, the Township plans to spend $196.53 million over the
next five years, of which $104.83 million (53%) is recoverable from D.C.s. Of this
net amount, $94.02 million is recoverable from residential development and
$10.82 million from non-residential development. It is noted also that any
exemptions or reductions in the charges would reduce this recovery further.
9. Considerations by Council – The background study represents the service needs
arising from residential and non-residential growth over the forecast periods.
The following urban specific services are calculated based on an Urban Buildout
forecast:
• Stormwater Drainage and Control Services; and
• Water Services.
The following area specific service is calculated on a King City Community
Buildout forecast:
Total gross expenditures planned over the next five years 196,532,331$
Less:
Benefit to existing development 28,300,471$
Post planning period benefit 40,711,721$
Ineligible re: Level of Service 67,530$
Grants, subsidies and other contributions 22,619,545$
Net Costs to be recovered from development charges 104,833,064$

Watson & Associates Economists Ltd. PAGE vii H:\King\2020 DC Study\Report\Report.docx
• Wastewater Services – King City.
The following area specific service is calculated on a Nobleton Community
Buildout forecast:
• Wastewater Services – Nobleton.
The following services are calculated based on a Township-wide Buildout
forecast:
• Fire Protection Services; and
• Services Related to a Highway.
The following services are calculated based on a 10-year forecast. These
include:
• Parks and Recreation Services; and
• Library Services.
In addition, classes of services have been established for the following:
• Water & Wastewater Studies and Capital Improvements; and
• Growth Studies.
Council will consider the findings and recommendations provided in the report
and, in conjunction with public input, approve such policies and rates it deems
appropriate. These directions will refine the draft D.C. by-law which is appended
in Appendix G. These decisions may include:
• adopting the charges and policies recommended herein;
• considering additional exemptions to the by-law; and
• considering reductions in the charge by class of development (obtained by
removing certain services on which the charge is based and/or by a
general reduction in the charge).
Watson & Associates Economists Ltd. PAGE viii H:\King\2020 DC Study\Report\Report.docx
Table ES-1 Township of King Schedule of D.C.s
NON-RESIDENTIAL
Single and Semi-
Detached DwellingMultiples
Large
Apartments
Small
Apartments
Special
Care/Special
Dwelling Units
(per sq.ft. of
Gross Floor
Area)
(per sq.m. of
Gross Floor Area)
Township-Wide Services:
Services Related to a Highway 16,824 14,251 10,565 7,237 5,321 8.71 93.75
Fire Protection Services 973 824 611 419 308 0.50 5.38
Parks and Recreation Services 11,735 9,940 7,369 5,048 3,711 1.63 17.55
Library Services 1,566 1,326 983 674 495 0.21 2.26
Growth Studies 459 389 288 197 145 0.23 2.48
Total Township-Wide Services (A) 31,557 26,730 19,816 13,575 9,980 11.28 121.42
Urban Services
Stormwater Services 388 329 244 167 123 0.20 2.15
Water Services 2,788 2,362 1,751 1,199 882 1.41 15.18
Water & Wastewater Studies and Capital
Improvements313 265 197 135 99 0.15 1.61
Total Urban Services (B) 3,489 2,956 2,192 1,501 1,104 1.76 18.94
Area Specific Services
Wastewater Services - King City (C) 4,186 3,546 2,629 1,801 1,324 1.48 15.93
Wastewater Services - Nobleton (D) 4,681 3,965 2,939 2,013 1,480 0.43 4.63
Total King City (A + B + C) 39,232 33,232 24,637 16,877 12,408 14.52 156.29
Total Nobleton (A + B + D) 39,727 33,651 24,947 17,089 12,564 13.47 144.99
Total Schomberg (A + B ) 35,046 29,686 22,008 15,076 11,084 13.04 140.36
Service/Class of Service
RESIDENTIAL

Report


Watson & Associates Economists Ltd. H:\King\2020 DC Study\Report\Report.docx
Chapter 1
Introduction


Watson & Associates Economists Ltd. PAGE 1-1 H:\King\2020 DC Study\Report\Report.docx
1. Introduction
1.1 Purpose of this Document
This background study has been prepared pursuant to the requirements of the D.C.A.
(section 10) and, accordingly, recommends new development charges (D.C.s) and
policies for the Township of King.
The Township retained Watson & Associates Economists Ltd. (Watson), to undertake
the D.C. study process throughout 2019 and 2020. Watson worked with Township staff
preparing the D.C. analysis and policy recommendations.
This D.C. background study, containing the proposed D.C. by-law, will be distributed to
members of the public in order to provide interested parties with sufficient background
information on the legislation, the study’s recommendations and an outline of the basis
for these recommendations.
This report has been prepared, in the first instance, to meet the statutory requirements
applicable to the Township’s D.C. background study, as summarized in Chapter 4. It
also addresses the requirement for “rules” (contained in Chapter 7) and the proposed
by-law to be made available as part of the approval process (included as Appendix G).
In addition, the report is designed to set out sufficient background on the legislation
(Chapter 4), King’s current D.C. policies (Chapter 2) and the policies underlying the
proposed by-law, to make the exercise understandable to those who are involved.
Finally, it addresses post-adoption implementation requirements (Chapter 8) which are
critical to the successful application of the new policy.
The Chapters in the report are supported by Appendices containing the data required to
explain and substantiate the calculation of the charge. A full discussion of the statutory
requirements for the preparation of a background study and calculation of a D.C. is
provided herein.

Watson & Associates Economists Ltd. PAGE 1-2 H:\King\2020 DC Study\Report\Report.docx
1.2 Summary of the Process
The public meeting required under section 12 of the D.C.A., has been scheduled for
December 14, 2020. Its purpose is to present the study to the public and to solicit
public input. The meeting is also being held to answer any questions regarding the
study’s purpose, methodology and the proposed modifications to the Township’s D.C.s.
In accordance with the legislation, the background study and proposed D.C. by-law will
be available for public review on November 12, 2020.
The process to be followed in finalizing the report and recommendations includes:
• consideration of responses received prior to, at, or immediately following the
Public Meeting; and
• finalization of the report and Council consideration of the by-law subsequent to
the public meeting.
Figure 1-1 outlines the proposed schedule to be followed with respect to the D.C. by-law
adoption process.
Figure 1-1 Schedule of Key D.C. Process Dates for the Township of King
1. Data collection, staff review, engineering work, D.C. calculations and policy work
Winter 2019 to Fall 2020
2. Background study and proposed by-law available to public
November 12, 2020
3. Public meeting advertisement placed in newspaper(s)
At least 20 clear days before the public meeting
4. Public meeting of Council December 14, 2020
5. Council considers adoption of background study and passage of by-law
January 18, 2021
6. Newspaper notice given of by-law passage
By 20 days after passage
7. Last day for by-law appeal 40 days after passage
8. Township makes pamphlet available (where by-law not appealed)
By 60 days after in force date

Watson & Associates Economists Ltd. PAGE 1-3 H:\King\2020 DC Study\Report\Report.docx
1.3 Changes to the D.C.A.: Bill 73 – Smart Growth for our Communities Act, 2015
With the amendment of the D.C.A. (as a result of Bill 73 and O. Reg. 428/15), there are
a number of areas that must be addressed to ensure that the Township is in compliance
with the D.C.A., as amended. The following provides an explanation of the changes to
the Act that affect the Township’s background study and how they have been dealt with
to ensure compliance with the amended legislation.
1.3.1 Area Rating
Bill 73 has introduced two new sections where Council must consider the use of area-
specific charges:
1) Section 2 (9) of the Act now requires a municipality to implement area-specific
D.C.s for either specific services which are prescribed and/or for specific
municipalities which are to be regulated. (Note that at this time, no municipalities
or services are prescribed by the Regulations.)
2) Section 10 (2) c.1 of the D.C.A. requires that, “the development charges
background study shall include consideration of the use of more than one
development charge by-law to reflect different needs for services in different
areas.”
In regard to the first item, there are no services or specific municipalities identified in the
regulations which must be area-rated. The second item requires Council to consider
the use of area rating. This is discussed further in section 7.4.4.
1.3.2 Asset Management Plan for New Infrastructure
The new legislation now requires that a D.C. background study must include an Asset
Management Plan (subsection 10 (2) (c.2)). The asset management plan must deal
with all assets that are proposed to be funded, in whole or in part, by D.C.s. The current
regulations provide very extensive and specific requirements for the asset management
plan related to transit services; however, they are silent with respect to how the asset
management plan is to be provided for all other services. As part of any asset
management plan, the examination should be consistent with the municipality’s existing
assumptions, approaches and policies on asset management planning. This

Watson & Associates Economists Ltd. PAGE 1-4 H:\King\2020 DC Study\Report\Report.docx
examination may include both qualitative and quantitative measures such as examining
the annual future lifecycle contributions needs (discussed further in Appendix F of this
report).
1.3.3 60-Day Circulation of D.C. Background Study
Previously the legislation required that a D.C. background study be made available to
the public at least two weeks prior to the public meeting. The amended legislation now
provides that the D.C. background study must be made available to the public (including
posting on the municipal website) at least 60 days prior to passage of the D.C. by-law.
No other changes were made to timing requirements for such things as notice of the
public meeting and notice of by-law passage.
This D.C. study is being provided to the public on November 12, 2020 to ensure the
new requirements for release of the study is met.
1.3.4 Timing of Collection of D.C.s
The D.C.A. has been refined by Bill 73 to require that D.C.s are collected at the time of
the first building permit. For the majority of development, this will not impact the
Township’s present process. There may be instances, however, where several building
permits are to be issued and either the size of the development or the uses will not be
definable at the time of the first building permit. In these instances, the Township may
enter into a delayed payment agreement in order to capture the full development.
1.3.5 Other Changes
It is also noted that a number of other changes were made through Bill 73 and O. Reg.
428/15, including changes to the way in which transit D.C. service standards are
calculated, the inclusion of waste diversion and the ability for collection of additional
levies. At this time, the Township is not providing a D.C. with respect to transit services
and waste diversion services. With respect to the ability for collection of additional
levies, a detailed local service policy is provided in Appendix E.

Watson & Associates Economists Ltd. PAGE 1-5 H:\King\2020 DC Study\Report\Report.docx
1.4 Further Changes to the D.C.A.: Bill 108, 138 and 197
1.4.1 Bill 108: More Homes, More Choice Act – An Act to Amend Various Statutes with Respect to Housing, Other Development, and Various Matters
On May 2, 2019, the Province introduced Bill 108, which proposed changes to the
D.C.A. The Bill has been introduced as part of the Province’s “More Homes, More
Choice: Ontario's Housing Supply Action Plan”. The Bill received Royal Assent on
June 6, 2019.
While having received royal assent, many of the amendments to the D.C.A. would not
come into effect until they are proclaimed by the Lieutenant Governor (many of these
changes were revised through Bill 197). At the time of writing, the following provisions
have been proclaimed:
• Effective January 1, 2020, rental housing and institutional developments will pay
D.C.s in six equal annual payments commencing at occupancy. Non-profit
housing developments will pay D.C.s in 21 equal annual payments. Interest may
be charged on the instalments, and any unpaid amounts may be added to the
property and collected as taxes.
• Effective January 1, 2020 the D.C. amount for all developments occurring within
2 years of a Site Plan or Zoning By-law Amendment planning approval (for
application submitted after this section is proclaimed), shall be determined based
on the D.C. in effect on the day of Site Plan or Zoning By-law Amendment
application. If the development is not proceeding via these planning approvals,
then the amount is determined the earlier of the date of issuance of a building
permit or occupancy.
On February 28, 2020, the Province released updated draft regulations related to the
D.C.A. and the Planning Act. A summary of these changes to take effect upon
proclamation by the Lieutenant Governor is provided below:
Changes to Eligible Services – Prior to Bill 108, the D.C.A. provided a list of ineligible
services whereby municipalities could include growth related costs for any service that
was not listed. With Bill 108, the changes to the D.C.A. would now specifically list the
services that are eligible for inclusion in the by-law. Further, the initial list of eligible
Watson & Associates Economists Ltd. PAGE 1-6 H:\King\2020 DC Study\Report\Report.docx
services under Bill 108 was limited to “hard services”, with the “soft services” being
removed from the D.C.A. These services would be considered as part of a new
community benefits charge (discussed below) imposed under the Planning Act. As
noted in the next section this list of services has been amended through Bill 197.
Mandatory 10% deduction – The amending legislation would remove the mandatory
10% deduction for all services that remain eligible under the D.C.A.
Remaining Services to be Included in a New Community Benefits Charge (C.B.C.)
Under the Planning Act – It is proposed that a municipality may, by by-law, impose a
C.B.C. against land to pay for the capital costs of facilities, services and matters
required because of development or redevelopment in the area to which the by-law
applies. The C.B.C. is proposed to include formerly eligible D.C. services that are not
included in the above listing, in addition to parkland dedication and bonus zoning
contributions.
1.4.2 Bill 138: Plan to Build Ontario Together Act, 2019
On November 6, 2019, the Province release Bill 138 which provided further
amendments to the D.C.A. and Planning Act. This Bill received Royal Assent on
December 10, 2019 and was proclaimed which resulted in sections related to the D.C.A.
(schedule 10) becoming effective on January 1, 2020. The amendments to the D.C.A.
included removal of instalment payments for commercial and industrial developments
that were originally included in Bill 108.
1.4.3 Bill 197: COVID-19 Economic Recovery Act, 2020
In response to the global pandemic that began affecting Ontario in early 2020, the
Province released Bill 197 which provided amendments to a number of Acts, including
the D.C.A. and Planning Act. This Bill also revised some of the proposed changes
identified in Bill 108. Bill 197 was tabled on July 8, 2020, received Royal Assent on July
21, 2020, and was proclaimed on September 18, 2020. The following provides a
summary of the changes:
1.4.3.1 D.C. Related Changes
List of D.C. Eligible Services

Watson & Associates Economists Ltd. PAGE 1-7 H:\King\2020 DC Study\Report\Report.docx
• As noted above, under Bill 108 some services were to be included under the
D.C.A. and some would be included under the C.B.C. authority. However, Bill
197 revised this proposed change and has included all services (with some
exceptions) under the D.C.A. These services are as follows:
o Water supply services, including distribution and treatment services.
o Wastewater services, including sewers and treatment services.
o Storm water drainage and control services.
o Services related to a highway.
o Electrical power services.
o Toronto-York subway extension.
o Transit services.
o Waste diversion services.
o Policing services.
o Fire protection services.
o Ambulance services.
o Library services
o Long-term Care services
o Parks and Recreation services, but not the acquisition of land for parks.
o Public Health services
o Childcare and early years services.
o Housing services.
o Provincial Offences Act services.
o Services related to emergency preparedness.
o Services related to airports, but only in the Regional Municipality of
Waterloo.
o Additional services as prescribed.
Classes of Services – D.C.
Pre-Bill 108/197 legislation (i.e. D.C.A., 1997) allows for categories of services to be
grouped together into a minimum of two categories (90% and 100% services).
The Act (as proclaimed) proposes to repeal that and replace the above with the four
following subsections:
• A D.C. by-law may provide for any eligible service or capital cost related to any
eligible service to be included in a class, set out in the by-law.

Watson & Associates Economists Ltd. PAGE 1-8 H:\King\2020 DC Study\Report\Report.docx
• A class may be composed of any number or combination of services and may
include parts or portions of the eligible services or parts or portions of the capital
costs in respect of those services.
• A D.C. by-law may provide for a class consisting of studies in respect of any
eligible service whose capital costs are described in paragraphs 5 and 6 of s. 5 of
the D.C.A.
• A class of service set out in the D.C. by-law is deemed to be a single service with
respect to reserve funds, use of monies, and credits.
As well, the removal of 10% deduction for soft services under Bill 108 has been
maintained.
10-Year Planning Horizon
• The “maximum” 10-year planning horizon has been removed for all services
except transit.
1.4.3.2 C.B.C. Related Changes
C.B.C. Eligibility
• The C.B.C. is limited to lower-tier and single tier municipalities, whereas upper-
tier municipalities will not be allowed to impose this charge.
• O.Reg. 509/20 was filed on September 18, 2020. This regulation provides for the
following:
o A maximum rate will be set as a percentage of the market value of the
land the day before building permit issuance. The maximum rate is set at
4%. The C.B.C may only be imposed on developing or redeveloping
buildings which have a minimum height of five stories and contain no less
than 10 residential units.
o Bill 197 states that before passing a C.B.C. by-law, the municipality shall
prepare a C.B.C. strategy that (a) identifies the facilities, services and
matters that will be funded with C.B.C.s; and (b) complies with any
prescribed requirements.
o Only one C.B.C. by-law may be in effect in a local municipality at a time.

Watson & Associates Economists Ltd. PAGE 1-9 H:\King\2020 DC Study\Report\Report.docx
1.4.3.3 Combined D.C. and C.B.C. Impacts
D.C. vs. C.B.C. Capital Cost
• A C.B.C. may be imposed with respect to the services listed in s. 2 (4) of the
D.C.A. (eligible services), "provided that the capital costs that are intended to be
funded by the community benefits charge are not capital costs that are intended
to be funded under a development charge by-law."
Transition – D.C. and C.B.C.
• The specified date for municipalities to transition to the D.C. and C.B.C. is two
years after Schedules 3 and 17 of the COVID-19 Economic Recovery Act comes
into force (i.e. September 18, 2022).
• Generally, for existing reserve funds (related to D.C. services that will be
ineligible):
o If a C.B.C. is passed, the funds are transferred to the C.B.C. special
account;
o If no C.B.C. is passed, the funds are moved to a general reserve fund for
the same purpose
o If a C.B.C. is passed subsequent to moving funds to a general reserve
fund, those monies are then moved again to the C.B.C. special account.
• For reserve funds established under s. 37 of the Planning Act (e.g. bonus zoning)
o If a C.B.C. is passed, the funds are transferred to the C.B.C. special
account;
o If no C.B.C. is passed, the funds are moved to a general reserve fund for
the same purpose;
o If a C.B.C. is passed subsequent to moving funds to a general reserve
fund, those monies are then moved again to the C.B.C. special account.
If a municipality passes a C.B.C. by-law, any existing D.C. credits a landowner may
retain may be used towards payment of that landowner’s C.B.C.
As a result of the passage of Bill 197, and subsequent proclamation on September 18,
2020, this report has provided the D.C. calculations without the 10% mandatory
deduction.

Watson & Associates Economists Ltd. PAGE 1-10 H:\King\2020 DC Study\Report\Report.docx
Chapter 2 Current Township of King Policy


Watson & Associates Economists Ltd. PAGE 2-1 H:\King\2020 DC Study\Report\Report.docx
2. Current Township of King Policy
2.1 Schedule of Charges
On September 14, 2015, the Township of King passed By-law 2015-100 under the
D.C.A. The by-law imposes D.C.s on residential and non-residential uses. This by-law
would have expired on October 6, 2020, however, the Coronavirus (COVID-19) Support
and Protection Act, 2020 came into force on April 14, 2020 which allows the 2015 by-
law to continue to be in effect for six months after the provincial emergency declaration
period. On July 24, 2020, the Reopening Ontario (A Flexible Response to COVID-19)
Act, 2020, came into effect, bringing an end to the provincial state of emergency.
Accordingly, the 2015 by-law is continued in force until January 24, 2021. The
Township is undertaking a D.C. public process and anticipates passing a new by-law in
advance of the date the existing by-law is no longer in force.
This by-law imposes D.C.s for residential and non-residential uses. The table below
provides the rates currently in effect, as at January 1, 2020.
Table 2-1 Township of King
Current D.C. Rates
Non-Residential
Single & Semi
Detached
Multiples/
Townhouse
Units
Apartments - 2
Bedrooms +
Apartments -
Bachelor and 1
Bedroom
per sq.ft.
Municipal Wide Services:
Roads and Related 15,935 13,773 9,312 6,620 6.93
Parking Services 8 7 5 3 -
Fire Protection Services 1,020 882 596 424 0.45
Outdoor Recreation Services 3,771 3,259 2,204 1,566 0.30
Indoor Recreation Services 5,119 4,424 2,992 2,126 0.43
Library Services 1,413 1,221 826 587 0.11
Administration 768 664 449 319 0.35
Total Municipal Wide Services ( A ) 28,034 24,230 16,384 11,645 8.57
Urban Services
Water & Wastewater Studies 398 343 232 165 0.05
Water Services 3,235 2,795 1,890 1,344 0.48
Total Urban Services ( B ) 3,633 3,138 2,122 1,509 0.53
Area Specific Services
Wastewater-King City ( C ) 6,375 5,509 3,726 2,649 0.80
Wastewater-Nobleton ( D ) 4,554 3,937 2,662 1,892 0.37
Total King City (A + B + C) 38,042 32,877 22,232 15,803 9.90
Total Nobleton (A + B + D) 36,221 31,305 21,168 15,046 9.47
Total Schomberg (A + B) 31,667 27,368 18,506 13,154 9.10
Service
Residential

Watson & Associates Economists Ltd. PAGE 2-2 H:\King\2020 DC Study\Report\Report.docx
2.2 Services Covered
The following services are covered under By-laws 2015-100:
• Roads and Related;
• Parking Services;
• Fire Protection Services;
• Outdoor Recreation Services;
• Indoor Recreation Services;
• Library Services;
• Administration;
• Water & Wastewater Studies;
• Water Services;
• Wastewater Services – King City; and
• Wastewater Services – Nobleton.
2.3 Timing of D.C. Calculation and Payment
D.C.s with respect to an approval of a plan of subdivision are calculated and payable at
the time of execution of the subdivision agreement or an agreement entered into as a
condition of consent. Otherwise, D.C.’s are payable at the time of building permit
issuance.
Council may enter into a written agreement providing for all or any part of the D.C. to be
paid before or after it would otherwise be payable.
2.4 Indexing
Rates shall be indexed on January 1st of every year by the percentage change recorded
in the average annual Non-Residential Building Construction Price Index produced by
Statistics Canada.
Watson & Associates Economists Ltd. PAGE 2-3 H:\King\2020 DC Study\Report\Report.docx
2.5 Redevelopment Allowance
As a result of the redevelopment of land, a building or structure existing on the same
land within 60 months prior to the date of payment of D.C.s in regard to such
redevelopment was or is to be demolished, in whole or in part, or converted from one
principal use to another principal use on the same land in order to facilitate the
redevelopment, the D.C.s otherwise payable with respect to such redevelopment shall
be reduced by the following amounts:
(a) in the case of a residential building or structure, or in the case of a mixed-use
building or structure, the residential uses in the mixed-use building or structure,
an amount calculated by multiplying the applicable D.C. by the number,
according to type, of dwelling units that have been or will be demolished or
converted to another principal use; and
(b) in the case of a non-residential building or structure or, in the case of mixed-use
building or structure, the non-residential uses in the mixed-use building or
structure, an amount calculated by multiplying the applicable D.C.s under
subsections by the gross floor area (G.F.A.) that has been or will be demolished
or converted to another principal use;
provided that such amounts shall not exceed, in total, the amount of the D.C.s otherwise
payable with respect to the redevelopment.
2.6 Exemptions
The following non-statutory exemptions are provided under By-law 2015-100:
• Lands, buildings or structures used or to be used for a place of worship or for the
purposes of a cemetery or burial ground exempt from taxation under the
Assessment Act; and
• The development of non-residential farm buildings constructed for bona fide farm
uses.


Watson & Associates Economists Ltd. H:\King\2020 DC Study\Report\Report.docx
Chapter 3 Anticipated Development in the Township of King


Watson & Associates Economists Ltd. PAGE 3-1 H:\King\2020 DC Study\Report\Report.docx
3. Anticipated Development in the Township of King
3.1 Requirement of the Act
The growth forecast contained in this chapter (with supplemental tables in Appendix A)
provides for the anticipated development for which the Township of King will be required
to provide services, over a 10-year (Mid-2020 to Mid-2030) and to the buildout1 time
horizons.
Chapter 4 provides the methodology for calculating a D.C. as per the D.C.A. Figure 4-1
presents this methodology graphically. It is noted in the first box of the schematic that in
order to determine the D.C. that may be imposed, it is a requirement of Section 5 (1) of
the D.C.A. that “the anticipated amount, type and location of development, for which
development charges can be imposed, must be estimated.”
3.2 Basis of Population, Household and Non-Residential Gross Floor Area Forecast
The D.C. growth forecast has been derived by Watson. In preparing the growth
forecast, the following information sources were consulted to assess the residential and
non-residential development potential for the Township over the forecast period,
including:
• The 10-year residential forecast has been prepared in accordance with the
Township’s current Official Plan (OP) which has been informed by the Township
of King Population, Housing and Employment Forecast Update, 2016 to 2031
(August 28, 2019);
• The 10-year non-residential forecast has been prepared in accordance with the
Town’s O.P, which has been informed by the 2020 Township of King Population,
1 The residential and non-residential urban buildout forecast represents the development yield of all designated lands within the Urban Serviced Areas of King City, Nobleton and Schomberg

Watson & Associates Economists Ltd. PAGE 3-2 H:\King\2020 DC Study\Report\Report.docx
Housing and Employment Forecast Update, 2016 to 2031, and adjusted for
recent employment growth trends;
• The residential and non-residential urban buildout forecast represents the
development yield of all designated lands within the Urban Serviced Areas of
King City, Nobleton and Schomberg;
• 2006, 2011 and 2016 population, household, and employment Census data;
• Historical residential and non-residential building permit data over the 2011 to
2019 period; and
• Discussions with Township staff regarding anticipated residential and non-
residential development in the Township of King.
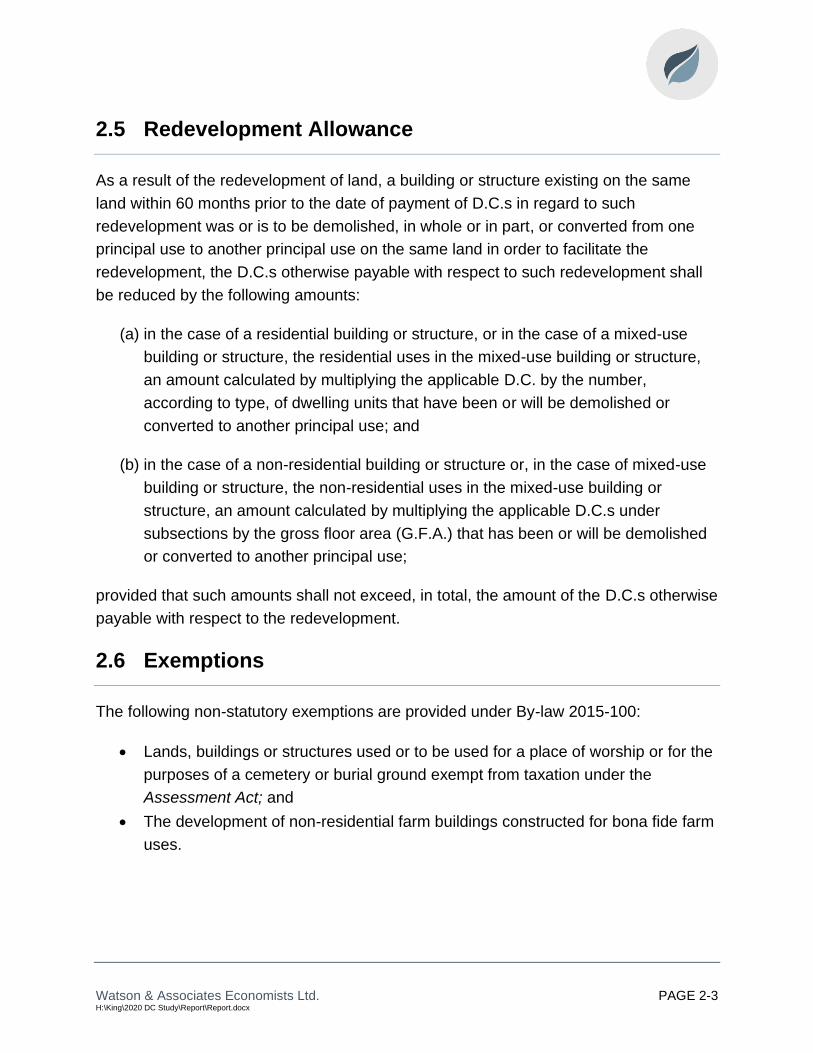
3.3 Summary of Growth Forecast
A detailed analysis of the residential and non-residential growth forecasts is provided in
Appendix A and the methodology employed is illustrated in Figure 3-1. The discussion
provided herein summarizes the anticipated growth for the Township and describes the
basis for the forecast. The results of the residential growth forecast analysis are
summarized in Table 3-1 below, and Schedule 1 in Appendix A.
As identified in Table 3-1 and Appendix A, Schedule 1, population in King is anticipated
to reach approximately 33,190 by Mid-2030 and 35,840 by Buildout of the Community
Plans for King City, Nobleton, and Schomberg, resulting in an increase of approximately
6,960 and 9,610 persons, respectively.1
1 The population figures used in the calculation of the 2020 D.C. exclude the net Census undercount, which is estimated at approximately 4.1%.
Watson & Associates Economists Ltd. PAGE 3-3 H:\King\2020 DC Study\Report\Report.docx
Figure 3-1 Population and Household Forecast Model
Intensification
Designated Lands
Servicing Capacity
Residential Units in the
Development Process
Employment Market by Local
Municipality,
Economic Outlook
Local, region
and Provincial
Forecast of
Residential Units
Decline in Existing Population
Net Population Increase
Historical Housing
Construction
DEMAND SUPPLY
Occupancy Assumptions
Gross Population Increase

Watson & Associates Economists Ltd. PAGE 3-4 H:\King\2020 DC Study\Report\Report.docx
Table 3-1 Township of King
Residential Growth Forecast Summary
PopulationInstitutional
Population
Population
Excluding
Institutional
Population
Singles &
Semi-
Detached
Multiple
Dwellings2 Apartments
3 OtherTotal
Households
20,290 19,487 127 19,360 6,070 115 180 25 6,390 3.050
20,710 19,899 149 19,750 6,245 155 225 20 6,645 2.995
25,520 24,512 147 24,365 7,185 435 500 15 8,135 3.013
27,310 26,230 159 26,071 7,819 439 500 15 8,773 2.990
34,550 33,187 202 32,985 9,791 869 1,113 15 11,788 2.815
37,313 35,843 215 35,628 10,664 966 1,128 15 12,773 2.806
420 412 22 390 175 40 45 -5 255
4,810 4,613 -2 4,615 940 280 275 -5 1,490
1,790 1,718 12 1,706 634 4 0 0 638
7,240 6,957 43 6,914 1,972 430 613 0 3,015
10,003 9,613 56 9,557 2,845 527 628 0 4,000
¹ Census undercount estimated at approximately 4.1%. Note: Population including the undercount has been rounded.
² Includes townhouses and apartments in duplexes.
³ Includes bachelor, 1-bedroom and 2-bedroom+ apartments.4 Buildout refers to the buildout in accordance to the Township's Community Plans.
Fore
cast
Mid 2020 - Buildout4
Incre
me
nta
l
Buildout4
Derived from the Township of King Population, Housing and Employment Forecast Update, 2016 to 2031 by Watson & Assoicates Economists Ltd., 2020
Population
(Including
Census
Undercount)¹
Year
Excluding Census Undercount Housing UnitsPerson Per Unit
(P.P.U.): Total
Population/
Total
Households
His
tori
ca
l
Mid 2020 - Mid 2030
Mid 2006 - Mid 2011
Mid 2011 - Mid 2016
Mid 2006
Mid 2011
Mid 2016
Mid 2020
Mid 2030
Mid 2016 - Mid 2020

Watson & Associates Economists Ltd. PAGE 3-5 H:\King\2020 DC Study\Report\Report.docx
Figure 3-2 Township of King
Annual Housing Forecast
1 Growth forecast represents calendar year.
Source: Historical housing activity derived from Statistics Canada building permit data for the Township of King (2007-2011), King Township building permit data (2011-2016) and King Township Building Permit
Reports (2017-2019).
30 23
117
252
284
627
361
281
461
346
166
62 64
135
320 320 320 320 320 320 320 320 320
0
100
200
300
400
500
600
700
Ho
usin
g U
nit
s
Years
Historical Low Density Medium Density High Density Historical Average

Watson & Associates Economists Ltd. PAGE 3-6 H:\King\2020 DC Study\Report\Report.docx
Provided below is a summary of the key assumptions and findings regarding the
Township of King D.C. growth forecast:
1. Housing Unit Mix (Appendix A – Schedules 1)
• The housing unit mix for the Township was derived from a detailed review of
residential development yields of all designated lands within the Urban Serviced
Areas of King City, Nobleton and Schomberg.
• Based on the above indicators, the 10-year household growth forecast for the
Township is comprised of a unit mix of 65% low density units (single detached
and semi-detached), 14% medium density (multiples except apartments) and
20% high density (large apartments (700 sq.ft. and larger) and small apartments
(less than 700 sq.ft.)).
2. Geographic Location of Residential Development (Appendix A – Schedule 2)
• Schedule 2 summarizes the anticipated amount, type, and location of
development by servicing area for the Township of King.
• In accordance with forecast demand and available designated land supply, the
amount and percentage of forecast housing growth between 2020 and Buildout
by development location is summarized below.
Development Location
Approximate Amount
of Housing Growth,
2020 to Buildout
Percentage of
Housing Growth,
2020 to Buildout
Urban 3,805 95%
King City 2,529 63%
Nobleton 1,189 30%
Schomberg 87 2%
Rural 195 5%
Township Total 4,000 100%

Watson & Associates Economists Ltd. PAGE 3-7 H:\King\2020 DC Study\Report\Report.docx
3. Planning Period
• Short- and longer-term time horizons are required for the D.C. process. The
D.C.A. limits the planning horizon for transit services to a 10-year planning
horizon. All other services can utilize a longer planning period if the municipality
has identified the growth-related capital infrastructure needs associated with the
longer-term growth planning period.
4. Population in New Housing Units (Appendix A - Schedules 3, 4 and 5)
• The number of housing units to be constructed by Buildout in the Township of
King over the forecast period is presented in Figure 3-2. Over the 2020 to
Buildout forecast period, the Township is anticipated to average approximately
300 new housing units per year.
• Institutional population1 is anticipated to increase by approximately 56 people
between 2020 to buildout.
• Population in new units is derived from Schedules 3, 4, and 5, which incorporate
historical development activity, anticipated units (see unit mix discussion) and
average persons per unit (P.P.U.) by dwelling type for new units.
• Schedule 7a (low density) and 7b (medium and high density) summarizes the
average P.P.U. assumed for the new housing units by age and type of dwelling
based on a 2016 custom Census data for the Township of King. Due to data
limitations, medium and high density P.P.U.’s were derived from York Region,
which includes the Township of King as per Statistics Canada, and is outlined in
Schedule 7b. The total calculated 20-year average P.P.U.s by dwelling type are
as follows:
o Low density: 3.478
o Medium density: 2.946
o High density2: 1.860
1 Institutional includes special care facilities such as nursing home or residences for senior citizens. A P.P.U. of 1.100 depicts 1-bedroom and 2- or more bedroom units in these special care facilities. 2 Includes bachelor, 1-bedroom and 2- or more bedroom apartments.

Watson & Associates Economists Ltd. PAGE 3-8 H:\King\2020 DC Study\Report\Report.docx
5. Existing Units and Population Change (Appendix A - Schedules 3, 4 and 5)
• Existing households for Mid-2020 are based on the 2016 Census households,
plus estimated residential units constructed between Mid-2016 and 2019 year
end, assuming a 6-month lag between construction and occupancy (see
Schedule 3).
• The decline in average occupancy levels for existing housing units is calculated
in Schedules 3 through 5, by aging the existing population over the forecast
period. The forecast population decline in existing households over the 2020 to
2030 forecast period is approximately 2,350.
6. Employment (Appendix A, Schedules 9a, 9b, 9c)
• The employment projections provided herein are largely based on the activity
rate method, which is defined as the number of jobs in the Township divided by
the number of residents. Key employment sectors include primary, industrial,
commercial/ population-related, institutional, and work at home, which are
considered individually below.
• 2016 employment data1 (place of work) for the Township of King is outlined in
Schedule 9a. The 2016 employment base is comprised of the following sectors:
o 379 primary (4%);
o 1,765 work at home employment (19%);
o 2,360 industrial (26%);
o 3,167 commercial/population related (35%); and
o 1,469 institutional (16%).
• The 2016 employment by usual place of work, including work at home, is 9,140.
An additional 820 employees have been identified for the Township in 2016 that
have no fixed place of work (N.F.P.O.W.).2
• Total employment, including work at home and N.F.P.O.W. for the Township is
anticipated to reach approximately 12,590 by Mid-2030 and 13,360 by Buildout.
1 2016 employment is based on Statistics Canada 2016 Place of Work Employment dataset by Watson & Associates Economists Ltd. 2 No fixed place of work is defined by Statistics Canada as "persons who do not go from home to the same work place location at the beginning of each shift". Such persons include building and landscape contractors, travelling salespersons, independent truck drivers, etc.

Watson & Associates Economists Ltd. PAGE 3-9 H:\King\2020 DC Study\Report\Report.docx
This represents an employment increase of approximately 2,020 for the 10-year
forecast period, and 2,780 for the 2020 to buildout forecast.
• Schedule 9b, Appendix A, summarizes the employment forecast, excluding work
at home employment and N.F.P.O.W. employment, which is the basis for the
D.C. employment forecast. The impact on municipal services from work at home
employees has already been included in the population forecast. The need for
municipal services related to N.F.P.O.W. employees has largely been included in
the employment forecast by usual place of work (i.e. employment and gross floor
area generated from N.F.P.O.W. construction employment). Furthermore, since
these employees have no fixed work address, they cannot be captured in the
non-residential gross floor area (G.F.A.) calculation.
• Total employment for the Township of King (excluding work at home and
N.F.P.O.W. employment) is anticipated to reach approximately 9,160 by Mid-
2030 and 9,650 by Buildout. This represents an employment increase of
approximately 1,350 for the 10-year forecast period and 1,840 for the 2020 to
Buildout forecast period.
7. Non-Residential Sq.ft. Estimates (G.F.A., Appendix A, Schedule 9b)
• Square footage estimates were calculated in Schedule 9b based on the following
employee density assumptions:
o 1,100 sq.ft. per employee for industrial;
o 500 sq.ft. per employee for commercial/population-related;
o 700 sq.ft. per employee for institutional employment; and
o 3,000 sq.ft. per employee for primary employment.
• The Township-wide incremental Gross Floor Area (G.F.A.) is anticipated to
increase by 1,016,500 sq.ft. over the 10-year forecast period and 1,340,700 sq.ft.
over the 2020 to Buildout forecast period.
• In terms of percentage growth, the 2020 to buildout incremental G.F.A. forecast
by sector is broken down as follows:
o primary – 10%
o industrial – 34.5%;
o commercial/population-related – 40.5%; and
o institutional – 15%.
Watson & Associates Economists Ltd. PAGE 3-10 H:\King\2020 DC Study\Report\Report.docx
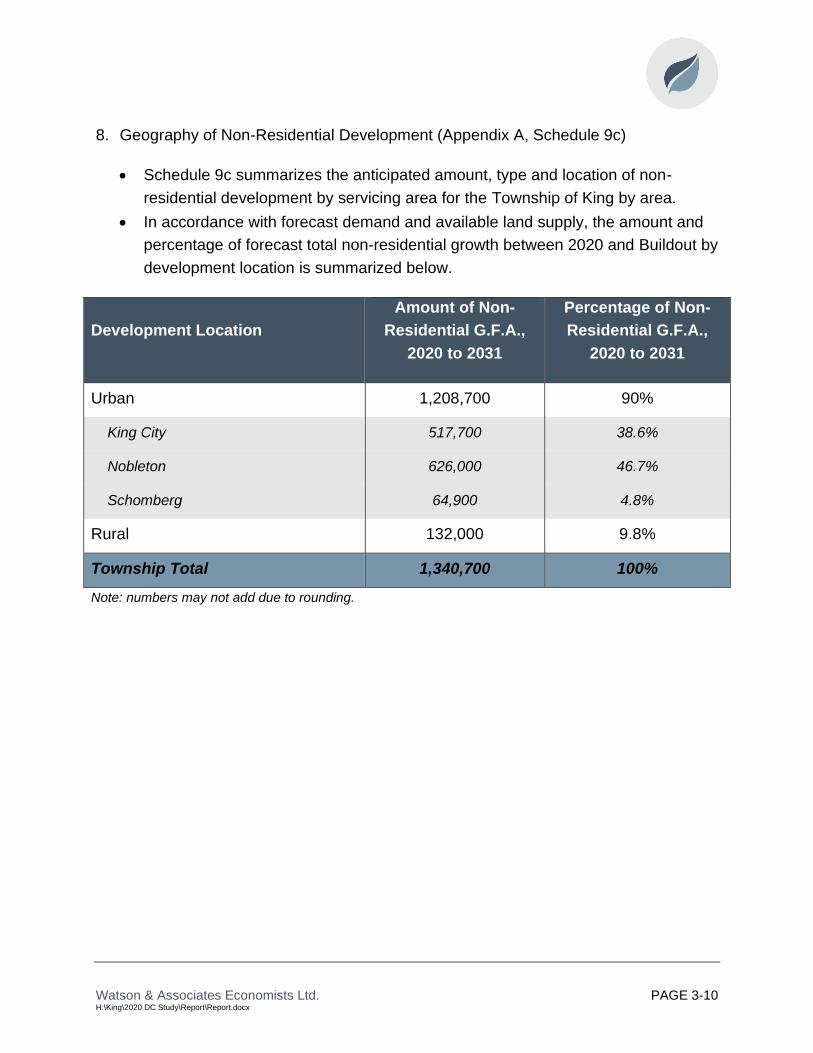
8. Geography of Non-Residential Development (Appendix A, Schedule 9c)
• Schedule 9c summarizes the anticipated amount, type and location of non-
residential development by servicing area for the Township of King by area.
• In accordance with forecast demand and available land supply, the amount and
percentage of forecast total non-residential growth between 2020 and Buildout by
development location is summarized below.
Development Location
Amount of Non-
Residential G.F.A.,
2020 to 2031
Percentage of Non-
Residential G.F.A.,
2020 to 2031
Urban 1,208,700 90%
King City 517,700 38.6%
Nobleton 626,000 46.7%
Schomberg 64,900 4.8%
Rural 132,000 9.8%
Township Total 1,340,700 100%
Note: numbers may not add due to rounding.
Watson & Associates Economists Ltd. H:\King\2020 DC Study\Report\Report.docx
Chapter 4 The Approach to the Calculation of the Charge


Watson & Associates Economists Ltd. PAGE 4-1 H:\King\2020 DC Study\Report\Report.docx
4. The Approach to the Calculation of the Charge
4.1 Introduction
This chapter addresses the requirements of subsection 5 (1) of the D.C.A. with respect
to the establishment of the need for service which underpins the D.C. calculation.
These requirements are illustrated schematically in Figure 4-1.
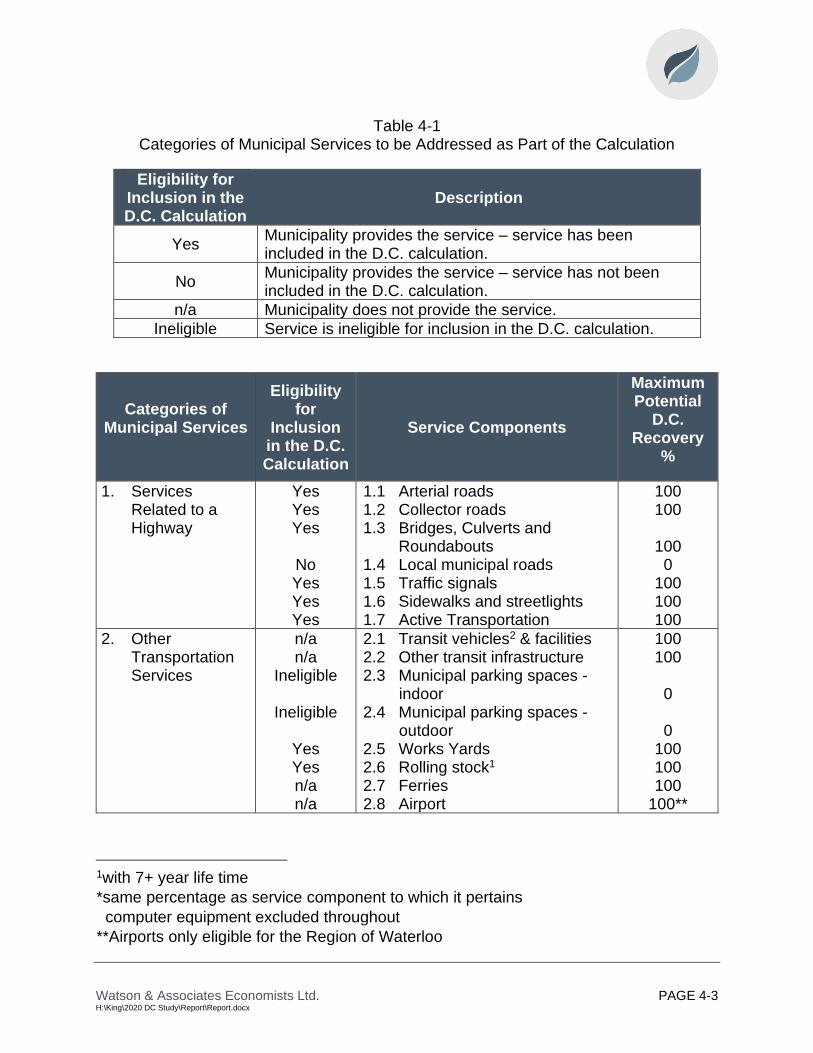
4.2 Potentially Involved
Table 4-1 lists the full range of municipal service categories which are provided within
the Township.
A number of these services are not defined in subsection 2 (4) of the D.C.A. as being
eligible for inclusion in D.C.s. These are shown as “ineligible” on Table 4-1. Two
ineligible costs defined in subsection 5 (3) of the D.C.A. are “computer equipment” and
“rolling stock with an estimated useful life of (less than) seven years...” In addition, local
roads are covered separately under subdivision agreements and related means (as are
other local services). Services which are potentially eligible for inclusion in the
Township’s D.C. are indicated with a “Yes.”
4.3 Increase in the Need for Service
The D.C. calculation commences with an estimate of “the increase in the need for
service attributable to the anticipated development,” for each service to be covered by
the by-law. There must be some form of link or attribution between the anticipated
development and the estimated increase in the need for service. While the need could
conceivably be expressed generally in terms of units of capacity, subsection 5 (1) 3,
which requires that Township Council indicate that it intends to ensure that such an
increase in need will be met, suggests that a project-specific expression of need would
be most appropriate.

Watson & Associates Economists Ltd. PAGE 4-2 H:\King\2020 DC Study\Report\Report.docx
Figure 4-1 The Process of Calculating a Development Charge under the Act
that must be followed
Watson & Associates Economists Ltd. PAGE 4-3 H:\King\2020 DC Study\Report\Report.docx
Table 4-1 Categories of Municipal Services to be Addressed as Part of the Calculation
Eligibility for Inclusion in the D.C. Calculation
Description
Yes Municipality provides the service – service has been included in the D.C. calculation.
No Municipality provides the service – service has not been included in the D.C. calculation.
n/a Municipality does not provide the service.
Ineligible Service is ineligible for inclusion in the D.C. calculation.
Categories of Municipal Services
Eligibility for
Inclusion in the D.C. Calculation
Service Components
Maximum Potential
D.C. Recovery
%
1. Services Related to a Highway
Yes Yes Yes
No Yes Yes Yes
1.1 Arterial roads 1.2 Collector roads 1.3 Bridges, Culverts and Roundabouts 1.4 Local municipal roads 1.5 Traffic signals 1.6 Sidewalks and streetlights 1.7 Active Transportation
100 100
100
0 100 100 100
2. Other Transportation Services
n/a n/a
Ineligible
Ineligible
Yes Yes n/a n/a
2.1 Transit vehicles2 & facilities 2.2 Other transit infrastructure 2.3 Municipal parking spaces -
indoor 2.4 Municipal parking spaces -
outdoor 2.5 Works Yards 2.6 Rolling stock1 2.7 Ferries 2.8 Airport
100 100
0
0 100 100 100
100**
1with 7+ year life time
*same percentage as service component to which it pertains
computer equipment excluded throughout
**Airports only eligible for the Region of Waterloo

Watson & Associates Economists Ltd. PAGE 4-4 H:\King\2020 DC Study\Report\Report.docx
Categories of Municipal Services
Eligibility for
Inclusion in the D.C. Calculation
Service Components
Maximum Potential
D.C. Recovery
%
3. Stormwater Drainage and Control Services
Yes
Yes Yes
3.1 Main channels and drainage trunks 3.2 Channel connections 3.3 Retention/detention ponds
100
100 100
4. Fire Protection Services
Yes Yes
Yes
4.1 Fire stations 4.2 Fire pumpers, aerials and
rescue vehicles1 4.3 Small equipment and gear
100 100
100
5. Parks Services (i.e. Parks and Open Space)
Ineligible
Yes
Yes Yes
Yes
Yes
5.1 Acquisition of land for parks, woodlots and E.S.A.s
5.2 Development of area municipal parks
5.3 Development of district parks 5.4 Development of municipal-
wide parks 5.5 Development of special
purpose parks 5.6 Parks rolling stock1 and yards
0
100
100
100
100 100
6. Recreation Services
Yes
Yes
6.1 Arenas, indoor pools, fitness facilities, community centres, etc. (including land)
6.2 Recreation vehicles and equipment11
100
100
7. Library Services Yes
n/a Yes
7.1 Public library space (incl. furniture and equipment)
7.2 Library vehicles1 7.3 Library materials
100 100 100
8. Electrical Power Services
Ineligible Ineligible Ineligible
8.1 Electrical substations 8.2 Electrical distribution system 8.3 Electrical system rolling stock
0 0 0
1with 7+ year lifetime

Watson & Associates Economists Ltd. PAGE 4-5 H:\King\2020 DC Study\Report\Report.docx
Categories of Municipal Services
Eligibility for
Inclusion in the D.C. Calculation
Service Components
Maximum Potential
D.C. Recovery
%
9. Provision of Cultural, Entertainment and Tourism Facilities and Convention Centres
Ineligible
Ineligible
9.1 Cultural space (e.g. art galleries, museums and theatres)
9.2 Tourism facilities and convention centres
0
0
10. Wastewater Services
n/a Yes No No
10.1 Treatment plants 10.2 Sewage trunks 10.3 Local systems 10.4 Vehicles and equipment1
100 100
0 100
11. Water Supply Services
n/a Yes No No
11.1 Treatment plants 11.2 Distribution systems 11.3 Local systems 11.4 Vehicles and equipment1
100 100
0 100
12. Waste Management Services
Ineligible
Ineligible
n/a No
12.1 Landfill collection, transfer vehicles and equipment
12.2 Landfills and other disposal facilities
12.3 Waste diversion facilities 12.4 Waste diversion vehicles and
equipment1
0
0 100
100
13. Policing Services
n/a n/a n/a
13.1 Police detachments 13.2 Police rolling stock11 13.3 Small equipment and gear
100 100 100
14. Long-term Care n/a n/a
14.1 Long-term Care space 14.2 Vehicles1
100 100
15. Child Care and Early Years
n/a n/a
15.1 Child care space 15.2 Vehicles1
100 100
16. Public Health n/a n/a
16.1 Health department space 16.2 Health department vehicles2
100 100
17. Housing n/a 17.1 Social Housing space 100
18. Provincial Offences Act (P.O.A.)
n/a n/a
18.1 P.O.A. space 18.2 Vehicles and equipment1
100 100
1with a 7+ year lifetime

Watson & Associates Economists Ltd. PAGE 4-6 H:\King\2020 DC Study\Report\Report.docx
Categories of Municipal Services
Eligibility for
Inclusion in the D.C. Calculation
Service Components
Maximum Potential
D.C. Recovery
%
19. Social Services n/a 19.1 Social service space 0
20. Ambulance n/a n/a
20.1 Ambulance station space 20.2 Vehicles1
100 100
21. Hospital Provision
Ineligible 21.1 Hospital capital contributions 0
22. Emergency Preparedness Services
No
No
22.1 Emergency Preparedness space
22.2 Vehicles and equipment1
100
100
23. Provision of Headquarters for the General Administration of Municipalities and Area Municipal Boards
Ineligible Ineligible Ineligible
23.1 Office space 23.2 Office furniture 23.3 Computer equipment
0 0 0
24. Other Services Yes
Yes
24.1 Studies in connection with acquiring buildings, rolling stock, materials and equipment, and improving land2 and facilities, including the D.C. background study cost
24.2 Interest on money borrowed to pay for growth-related capital
0-100
0-100
1with a 7+ year lifetime 2same percentage as service component to which it pertains
4.4 Local Service Policy
Some of the need for services generated by additional development consists of local
services related to a plan of subdivision. As such, they will be required as a condition of
subdivision agreements or consent conditions. The Township’s detailed Local Service
Policy is provided in Appendix E.

Watson & Associates Economists Ltd. PAGE 4-7 H:\King\2020 DC Study\Report\Report.docx
4.5 Capital Forecast
Paragraph 7 of subsection 5 (1) of the D.C.A. requires that “the capital costs necessary
to provide the increased services must be estimated.” The Act goes on to require two
potential cost reductions and the Regulation sets out the way in which such costs are to
be presented. These requirements are outlined below.
These estimates involve capital costing of the increased services discussed above.
This entails costing actual projects or the provision of service units, depending on how
each service has been addressed.
The capital costs include:
a) costs to acquire land or an interest therein (including a leasehold interest);
b) costs to improve land;
c) costs to acquire, lease, construct or improve buildings and structures;
d) costs to acquire, lease or improve facilities, including rolling stock (with a useful
life of 7 or more years), furniture and equipment (other than computer
equipment), materials acquired for library circulation, reference or information
purposes;
e) interest on money borrowed to pay for the above-referenced costs;
f) costs to undertake studies in connection with the above-referenced matters; and
g) costs of the D.C. background study.
In order for an increase in need for service to be included in the D.C. calculation,
Township Council must indicate “...that it intends to ensure that such an increase in
need will be met” (subsection 5 (1) 3). This can be done if the increase in service forms
part of a Council-approved Official Plan, capital forecast or similar expression of the
intention of Council (O. Reg. 82/98 section 3). The capital program contained herein
reflects the Township’s approved and proposed capital budgets and master
servicing/needs studies.
4.6 Treatment of Credits
Section 8, paragraph 5, of O. Reg. 82/98 indicates that a D.C. background study must
set out “the estimated value of credits that are being carried forward relating to the
service.” Subsection 17, paragraph 4, of the same Regulation indicates that “...the

Watson & Associates Economists Ltd. PAGE 4-8 H:\King\2020 DC Study\Report\Report.docx
value of the credit cannot be recovered from future D.C.s,” if the credit pertains to an
ineligible service. This implies that a credit for eligible services can be recovered from
future D.C.s. As a result, this provision should be made in the calculation, in order to
avoid a funding shortfall with respect to future service needs. Outstanding credit
obligations have been included in the D.C. calculations.
4.7 Classes of Services
Section 7 of the D.C.A. states that a D.C. by-law may provide for any D.C. eligible
service or the capital costs with respect to those services. Further, a class may be
composed of any number or combination of services and may include parts or portions
of each D.C. eligible services. With respect to growth-related studies, Section 7(3) of
the D.C.A. states that:
“For greater certainty, a development charge by-law may provide for a class
consisting of studies in respect of any service listed in subsection 2 (4) whose capital
costs are described in paragraphs 5 and 6 of subsection 5 (3).”
These provisions allow for services to be grouped together to create a class for the
purposes of the D.C. by-law and D.C. reserve funds. The D.C. calculations and by-law
provided herein include the following classes: growth studies, and water & wastewater
studies and capital improvements. These classes are comprised of the following
services:
• Growth Studies
o Stormwater Drainage and Control Services;
o Wastewater Services – King City;
o Wastewater Services – Nobleton;
o Services Related to a Highway;
o Water Services;
o Fire Protection Services;
o Parks and Recreation Services; and
o Library Services.
• Water & Wastewater Studies and Capital Improvements
o Water Services; and
o Wastewater Services.

Watson & Associates Economists Ltd. PAGE 4-9 H:\King\2020 DC Study\Report\Report.docx
4.8 Existing Reserve Funds
Section 35 of the D.C.A. states that:
“The money in a reserve fund established for a service may be spent only for capital costs determined under paragraphs 2 to 7 of subsection 5 (1).”
There is no explicit requirement under the D.C.A. calculation method set out in
subsection 5 (1) to net the outstanding reserve fund balance as part of making the D.C.
calculation; however, section 35 does restrict the way in which the funds are used in
future.
For services which are subject to a per capita based, service level “cap,” the reserve
fund balance should be applied against the development-related costs for which the
charge was imposed once the project is constructed (i.e. the needs of recent growth).
This cost component is distinct from the development-related costs for the next 10-year
period, which underlie the D.C. calculation herein.
The alternative would involve the Township spending all reserve fund monies prior to
renewing each by-law, which would not be a sound basis for capital budgeting. Thus,
the Township will use these reserve funds for the Township’s cost share of applicable
development-related projects, which are required but have not yet been undertaken, as
a way of directing the funds to the benefit of the development which contributed them
(rather than to future development, which will generate the need for additional facilities
directly proportionate to future growth).
The Township’s D.C. reserve fund balances by service (net of any adjustments or
commitments) as of December 31, 2019 are shown below:

Watson & Associates Economists Ltd. PAGE 4-10 H:\King\2020 DC Study\Report\Report.docx
4.9 Deductions
The D.C.A. potentially requires that five deductions be made to the increase in the need
for service. These relate to:
• the level of service ceiling;
• uncommitted excess capacity;
• benefit to existing development; and
• anticipated grants, subsidies and other contributions.
The requirements behind each of these reductions are addressed as follows:
4.9.1 Reduction Required by Level of Service Ceiling
This is designed to ensure that the increase in need included in section 4.3 does “…not
include an increase that would result in the level of service (for the additional
development increment) exceeding the average level of the service provided in the
municipality over the 10-year period immediately preceding the preparation of the
background study…” O. Reg. 82.98 (section 4) goes further to indicate that “…both the
quantity and quality of a service shall be taken into account in determining the level of
service and the average level of service.”
Service
Balance as of
December 31,
2019
Adjustments/
Commitments Adjusted Balance
Services Related to a Highway $5,014,095 $5,014,095
Parking Services* $7,791 $7,791
Fire Protection Services $1,198,427 $1,198,427
Outdoor Recreation Services $317,351 $317,351
Indoor Recreation Services $5,825,207 ($1,424,921) $4,400,286
Library Services ($170,545) ($905,479) ($1,076,024)
Growth Studies $292,144 $292,144
Water and Wastewater Studies $107,202 $107,202
Wastewater - Nobleton $791,867 ($1,111,000) ($319,133)
Wastewater - King $2,060,903 $2,060,903
Water Services $652,867 $652,867
Total $16,097,309 ($3,441,400) $12,655,909
*Parking is no longer a D.C. Eligible Service. The funds must be transferred to a Special Account
(CBC) or into the Township's General Reserve
Watson & Associates Economists Ltd. PAGE 4-11 H:\King\2020 DC Study\Report\Report.docx
In many cases, this can be done by establishing a quantity measure in terms of units as
floor area, land area or road length per capita and a quality measure, in terms of the
average cost of providing such units based on replacement costs, engineering
standards or recognized performance measurement systems, depending on
circumstances. When the quantity and quality factor are multiplied together, they
produce a measure of the level of service, which meets the requirements of the Act, i.e.
cost per unit.
With respect to transit services, the changes to the Act as a result of Bill 73 have
provided for an alternative method for calculating the services standard ceiling. Transit
services must now utilize a forward-looking service standard analysis, described later in
this section.
The average service level calculation sheets for each service component in the D.C.
calculation are set out in Appendix B.
4.9.2 Reduction for Uncommitted Excess Capacity
Paragraph 5 of subsection 5 (1) requires a deduction from the increase in the need for
service attributable to the anticipated development that can be met using the
Township’s “excess capacity,” other than excess capacity which is “committed.”
“Excess capacity” is undefined, but in this case must be able to meet some or all of the
increase in need for service, in order to potentially represent a deduction. The
deduction of uncommitted excess capacity from the future increase in the need for
service would normally occur as part of the conceptual planning and feasibility work
associated with justifying and sizing new facilities, e.g. if a road widening to
accommodate increased traffic is not required because sufficient excess capacity is
already available, then widening would not be included as an increase in need, in the
first instance.
4.9.3 Reduction for Benefit to Existing Development
Section 5 (1) 6 of the D.C.A. provides that, “The increase in the need for service must
be reduced by the extent to which an increase in service to meet the increased need
would benefit existing development.” The general guidelines used to consider benefit to
existing development include:

Watson & Associates Economists Ltd. PAGE 4-12 H:\King\2020 DC Study\Report\Report.docx
• the repair or unexpanded replacement of existing assets that are in need of
repair;
• an increase in average service level of quantity or quality (compare water as an
example);
• the elimination of a chronic servicing problem not created by growth; and
• providing services where none previously existed (generally considered for water
or wastewater services).
This step involves a further reduction in the need, by the extent to which such an
increase in service would benefit existing development. The level of services cap
discussed in section 4.4 of this report is related but is not the identical requirement.
Sanitary, storm and water trunks are highly localized to growth areas and can be more
readily allocated in this regard than other services such as services related to a
highway, which do not have a fixed service area.
Where existing development has an adequate service level which will not be tangibly
increased by an increase in service, no benefit would appear to be involved. For
example, where expanding existing library facilities simply replicates what existing
residents are receiving, they receive very limited (or no) benefit as a result. On the
other hand, where a clear existing service problem is to be remedied, a deduction
should be made accordingly.
In the case of services such as recreation facilities, community parks, libraries, etc., the
service is typically provided on a Township-wide system basis. For example, facilities of
the same type may provide different services (i.e. leisure pool vs. competitive pool),
different programs (i.e. hockey vs. figure skating) and different time availability for the
same service (i.e. leisure skating available on Wednesday in one arena and Thursday in
another). As a result, residents will travel to different facilities to access the services
they want at the times they wish to use them, and facility location generally does not
correlate directly with residence location. Even where it does, displacing users from an
existing facility to a new facility frees up capacity for use by others and generally results
in only a very limited benefit to existing development. Further, where an increase in
demand is not met for a number of years, a negative service impact to existing
development is involved for a portion of the planning period.

Watson & Associates Economists Ltd. PAGE 4-13 H:\King\2020 DC Study\Report\Report.docx
4.9.4 Reduction for Anticipated Grants, Subsidies and Other Contributions
This step involves reducing the capital costs necessary to provide the increased
services by capital grants, subsidies and other contributions (including direct developer
contributions required due to the local service policy) made or anticipated by Council
and in accordance with various rules such as the attribution between the share related
to new vs. existing development. That is, some grants and contributions may not
specifically be applicable to growth or where Council targets fundraising as a measure
to offset impacts on taxes (O. Reg. 82/98 section 6).
4.10 Municipal-wide vs. Area Rating
This step involves determining whether all of the subject costs are to be recovered on a
uniform municipal-wide basis or whether some or all are to be recovered on an area-
specific basis. Under the amended D.C.A., it is now mandatory to “consider” area-rating
of services (providing charges for specific areas and services), however, it is not
mandatory to implement area-rating. Further discussion is provided in section 7.4.4.
4.11 Allocation of Development
This step involves relating the costs involved to anticipated development for each period
under consideration and using allocations between residential and non-residential
development and between one type of development and another, to arrive at a schedule
of charges.
4.12 Asset Management
The new legislation now requires that a D.C. background study must include an asset
management plan (subsection 10 (2) c. 2). The asset management plan (A.M.P.) must
deal with all assets that are proposed to be funded, in whole or in part, by D.C.s. The
current regulations provide very extensive and specific requirements for the A.M.P.
related to transit services (as noted in the subsequent subsection); however, they are
silent with respect to how the A.M.P. is to be provided for all other services. As part of
any A.M.P., the examination should be consistent with the municipality’s existing

Watson & Associates Economists Ltd. PAGE 4-14 H:\King\2020 DC Study\Report\Report.docx
assumptions, approaches and policies on the asset management planning. This
examination has been included in Appendix F.
4.13 Transit
The most significant changes to the Act relate to the transit service. These changes
relate to four areas of the calculations, as follows:
A. Transit no longer requires the statutory 10% mandatory deduction from the net
capital cost (subsection 5.2 (i) of the D.C.A.).
B. The background study requires the following in regard to transit costs (as per
subsection 8 (2) of the Regulations):
1. The calculations that were used to prepare the estimate for the planned level
of service for the transit services, as mentioned in subsection 5.2 (3) of the
Act.
2. An identification of the portion of the total estimated capital cost relating to the
transit services that would benefit,
i. the anticipated development over the 10-year period immediately
following the preparation of the background study, or
ii. the anticipated development after the 10-year period immediately
following the preparation of the background study.
3. An identification of the anticipated excess capacity that would exist at the end
of the 10-year period immediately following the preparation of the background
study.
4. An assessment of ridership forecasts for all modes of transit services
proposed to be funded by the development charge over the 10-year period
immediately following the preparation of the background study, categorized
by development types, and whether the forecasted ridership will be from
existing or planned development.
Watson & Associates Economists Ltd. PAGE 4-15 H:\King\2020 DC Study\Report\Report.docx
5. An assessment of the ridership capacity for all modes of transit services
proposed to be funded by the development charge over the 10-year period
immediately following the preparation of the background study.
C. A new forward-looking service standard (as per subsection 6.1 (2) of the
Regulations):
1. The service is a discrete service.
2. No portion of the service that is intended to benefit anticipated development
after the 10-year period immediately following the preparation of the
background study may be included in the estimate.
3. No portion of the service that is anticipated to exist as excess capacity at the
end of the 10-year period immediately following the preparation of the
background study may be included in the estimate.
D. A very detailed asset management strategy and reporting requirements
(subsection 6.1 (3) of the Regulation) that includes lifecycle costs, action plans
that will enable the assets to be sustainable, summary of how to achieve the
proposed level of service, discussion on procurement measures and risk.
The Township does not currently provide transit services. Therefore, the above
calculations and reporting requirements are not required.

Watson & Associates Economists Ltd. H:\King\2020 DC Study\Report\Report.docx
Chapter 5 D.C.-Eligible Cost Analysis by Service


Watson & Associates Economists Ltd. PAGE 5-1 H:\King\2020 DC Study\Report\Report.docx
5. D.C.-Eligible Cost Analysis by Service
5.1 Introduction
This chapter outlines the basis for calculating eligible costs for the D.C.s to be applied
on a uniform basis. In each case, the required calculation process set out in subsection
5 (1) paragraphs 2 to 8 in the D.C.A. and described in Chapter 4, was followed in
determining D.C.-eligible costs.
The nature of the capital projects and timing identified in this Chapter reflects Council’s
current intention. Over time, however, Township projects and Council priorities change
and accordingly, Council’s intentions may alter and different capital projects (and timing)
may be required to meet the need for services required by new growth.
5.2 Service Levels and 10-Year Capital Costs for D.C. Calculation
This section evaluates the development-related capital requirements for all of the
“softer” services over a 10-year planning period. Each service component is evaluated
on two format sheets: the average historical 10-year level of service calculation (see
Appendix B), which “caps” the D.C. amounts; and, the infrastructure cost calculation,
which determines the potential D.C. recoverable cost.

Watson & Associates Economists Ltd. PAGE 5-1 H:\King\2020 DC Study\Report\Report.docx
5.2.1 Growth Studies
The D.C.A. permits the inclusion of studies undertaken to facilitate the completion of the
Township’s capital works program. As discussed in Section 4.7, these studies have
been allocated as a class of services based on each service to which the study relates.
For planning related studies, a deduction of 10% has been applied to recognize the
extent to which the studies relate to non-D.C.-eligible services. All planning studies
have been allocated to each service within the class in the following manner:
• Stormwater Drainage and Control Services – 10%
• Wastewater Services – 25%
• Water Services – 25%
• Services Related to a Highway – 25%
• Fire Protection Services – 5%
• Parks and Recreation – 5%
• Library Services – 5%
In addition, the capital cost of D.C. background studies has been allocated across the
different services based on the proportion of the total net growth-related capital costs.
The following provides a breakdown of the allocation of D.C. background studies to
each service:
• Stormwater Drainage and Control Services – 1%
• Wastewater Services – King City – 7%
• Wastewater Services – Nobleton – 4%
• Water Services – 8%
• Services Related to a Highway – 51%
• Fire Protection Services – 3%
• Parks and Recreation – 23%
• Library Services – 3%
The remainder of the growth studies identified are as follows:
• Services Related to a Highway:
o Active Transportation Strategies;
o Paving Strategies;

Watson & Associates Economists Ltd. PAGE 5-2 H:\King\2020 DC Study\Report\Report.docx
o Traffic Calming Strategies;
o Road Culvert Condition Assessments;
o Bridge Structure Assessments;
o Transportation Master Plan Updates;
o Development Guidelines and Engineering Design Criteria Manual
Updates;
o Highway 11 Corridor Study;
o Major Transit Study Area; and
o Asset Management & Needs Study.
• Parks and Recreation Services:
o Community Services Master Plan Update;
• Library Services:
o Collection Development Studies;
o Strategic Plans;
o Service Delivery Assessment/Master Plan; and
o Library Expansion/Feasibility Studies.
• Fire Protection Services:
o Community Risk Assessment Study;
o Fire Master Plan Update; and
o Full Fire Master Plan.
The gross capital cost of these studies is $3,443,300 of which $1,616,400 is attributable
to existing benefit. A deduction of $72,330 has been made to recognize the portion of
planning studies related to D.C.-ineligible services, as mentioned above. The existing
reserve fund balance of $292,144 has been deducted as well, resulting in a net D.C.-
eligible cost of $1,462,426 to be included in the calculations.
These costs have been allocated 84% residential and 16% non-residential based on the
incremental growth in population to employment for the 10-year forecast period.

Watson & Associates Economists Ltd. PAGE 5-3 H:\King\2020 DC Study\Report\Report.docx
Infrastructure Costs Included in the Development Charges Calculation
Township of King
Class of Service: Growth Studies
Prj.No CategoryResidential
Share
Non-
Residential
Share
2020-2029 84% 16%
1A Development Charge StudyStormwater Drainage and Control
Services2020 750 - 750 - 750 630 120
1B Development Charge Study Wastewater Services 2020 8,250 - 8,250 - 8,250 6,930 1,320
1D Development Charge Study Water Services 2020 6,000 - 6,000 - 6,000 5,040 960
1E Development Charge Study Services Related to a Highway 2020 38,250 - 38,250 - 38,250 32,130 6,120
1F Development Charge Study Fire Protection Services 2020 2,250 - 2,250 - 2,250 1,890 360
1G Development Charge Study Parks and Recreation Services 2020 17,250 - 17,250 - 17,250 14,490 2,760
1H Development Charge Study Library Services 2020 2,250 - 2,250 - 2,250 1,890 360
2A Development Charge StudyStormwater Drainage and Control
Services2025 750 - 750 - 750 630 120
2B Development Charge Study Wastewater Services 2025 8,250 - 8,250 - 8,250 6,930 1,320
2D Development Charge Study Water Services 2025 6,000 - 6,000 - 6,000 5,040 960
2E Development Charge Study Services Related to a Highway 2025 38,250 - 38,250 - 38,250 32,130 6,120
2F Development Charge Study Fire Protection Services 2025 2,250 - 2,250 - 2,250 1,890 360
2G Development Charge Study Parks and Recreation Services 2025 17,250 - 17,250 - 17,250 14,490 2,760
2H Development Charge Study Library Services 2025 2,250 - 2,250 - 2,250 1,890 360
Services Related to a Highway
310 YR AT Strategy (active
transportation)Services Related to a Highway 2020 75,000 - 75,000 15,000 60,000 50,400 9,600
4 10 YR Paving Strategy Services Related to a Highway 2020 100,000 - 100,000 80,000 20,000 16,800 3,200
5 Traffic Calming Strategy Services Related to a Highway 2020 60,000 - 60,000 30,000 30,000 25,200 4,800
6Road Culvert Condition Assessment
(over 3.0m dia.) Every 2 years.Services Related to a Highway 2021 75,000 - 75,000 60,000 15,000 12,600 2,400
7Road Culvert Condition Assessment
(over 3.0m dia.) Every 2 years.Services Related to a Highway 2023 75,000 - 75,000 60,000 15,000 12,600 2,400
8Road Culvert Condition Assessment
(over 3.0m dia.) Every 2 years.Services Related to a Highway 2025 75,000 - 75,000 60,000 15,000 12,600 2,400
9Road Culvert Condition Assessment
(over 3.0m dia.) Every 2 years.Services Related to a Highway 2027 75,000 - 75,000 60,000 15,000 12,600 2,400
10Bridge Structure Assessment
(every 2 years)Services Related to a Highway 2021 60,000 - 60,000 48,000 12,000 10,080 1,920
11Bridge Structure Assessment
(every 2 years)Services Related to a Highway 2023 60,000 - 60,000 48,000 12,000 10,080 1,920
12Bridge Structure Assessment
(every 2 years)Services Related to a Highway 2025 60,000 - 60,000 48,000 12,000 10,080 1,920
13Bridge Structure Assessment
(every 2 years)Services Related to a Highway 2027 60,000 - 60,000 48,000 12,000 10,080 1,920
Increased Service Needs Attributable
to Anticipated DevelopmentTiming
(year)
Gross
Capital Cost
Estimate
(2020$)
Post
Period
Benefit
Other
Deductions
(To
Recognize
Benefit to
Non-D.C.
Services)
Net Capital
Cost
Benefit to
Existing
Development
Grants,
Subsidies and
Other
Contributions
Attributable to
New
Development
Total
Less: Potential D.C. Recoverable Cost

Watson & Associates Economists Ltd. PAGE 5-4 H:\King\2020 DC Study\Report\Report.docx
Infrastructure Costs Included in the Development Charges Calculation
Township of King
Class of Service: Growth Studies
Prj.No CategoryResidential
Share
Non-
Residential
Share
2020-2029 84% 16%
14Bridge Structure Assessment
(every 2 years)Services Related to a Highway 2029 60,000 - 60,000 48,000 12,000 10,080 1,920
15Transportation Master Plan Update
( 5 year cycle )Services Related to a Highway 2024 100,000 - 100,000 50,000 50,000 42,000 8,000
16 10 YR AT Strategy Services Related to a Highway 2024 75,000 - 75,000 15,000 60,000 50,400 9,600
17 10 YR Paving Strategy Services Related to a Highway 2024 100,000 - 100,000 80,000 20,000 16,800 3,200
18 Traffic Calming Strategy Services Related to a Highway 2024 60,000 - 60,000 30,000 30,000 25,200 4,800
19Transportation Master Plan Update
( 5 year cycle )Services Related to a Highway 2029 100,000 - 100,000 50,000 50,000 42,000 8,000
20 10 YR AT Strategy Services Related to a Highway 2028 75,000 - 75,000 15,000 60,000 50,400 9,600
21 10 YR Paving Strategy Services Related to a Highway 2028 100,000 - 100,000 80,000 20,000 16,800 3,200
22 Traffic Calming Strategy Services Related to a Highway 2028 60,000 - 60,000 30,000 30,000 25,200 4,800
23
Development Guidelines and
Engineering Design Criteria Manual
Update
Services Related to a Highway 2021 50,000 - 50,000 - 50,000 42,000 8,000
24
Development Guidelines and
Engineering Design Criteria Manual
Update - Every 2 Years
Services Related to a Highway 2023-2029 200,000 - 200,000 - 200,000 168,000 32,000
25 Highway 11 Corridor Study Services Related to a Highway 2021 35,000 - 35,000 17,500 17,500 14,700 2,800
26 Major Transit Study Area Services Related to a Highway 2023 25,000 - 25,000 12,500 12,500 10,500 2,000
27 Asset Management & Needs Study Services Related to a Highway 2020 119,000 - 119,000 47,600 71,400 59,976 11,424
Parks and Recreation
28Community Services
Master Plan UpdateParks and Recreation Services 2024 125,000 - 125,000 62,500 62,500 52,500 10,000
Library
29 Collection Development Study Library Services 2022 20,000 - 20,000 12,000 8,000 6,720 1,280
30 Strategic Plan 2021-2025 (Library) Library Services 2020 48,000 - 48,000 28,800 19,200 16,128 3,072
31Service Delivery Assessment / Master
PlanLibrary Services 2026 75,000 - 75,000 37,500 37,500 31,500 6,000
32Schomberg Library Expansion
Feasibility / Architectural RenderingsLibrary Services 2024 70,000 - 70,000 35,000 35,000 29,400 5,600
33Nobleton Library Expansion
Feasibility / Architectural RenderingsLibrary Services 2021 70,000 - 70,000 35,000 35,000 29,400 5,600
34 Strategic Plan 2026-2030 (Library) Library Services 2025 50,000 - 50,000 30,000 20,000 16,800 3,200
35 Collection Development Study Library Services 2027 20,000 - 20,000 12,000 8,000 6,720 1,280
Increased Service Needs Attributable
to Anticipated DevelopmentTiming
(year)
Gross
Capital Cost
Estimate
(2020$)
Post
Period
Benefit
Other
Deductions
(To
Recognize
Benefit to
Non-D.C.
Services)
Net Capital
Cost
Benefit to
Existing
Development
Grants,
Subsidies and
Other
Contributions
Attributable to
New
Development
Total
Less: Potential D.C. Recoverable Cost

Watson & Associates Economists Ltd. PAGE 5-5 H:\King\2020 DC Study\Report\Report.docx
Infrastructure Costs Included in the Development Charges Calculation
Township of King
Class of Service: Growth Studies
Prj.No CategoryResidential
Share
Non-
Residential
Share
2020-2029 84% 16%
Fire
36 Community Risk Assessment re growth Fire Protection Services 2023 42,000 - 42,000 21,000 21,000 17,640 3,360
37 Fire Master Plan update Fire Protection Services 2023 45,000 - 45,000 22,500 22,500 18,900 3,600
38 Fire Master Plan full Fire Protection Services 2026 71,000 - 71,000 35,500 35,500 29,820 5,680
Planning Related Studies
39A
Official Plan Update Conformity
including Natural Heritage Study for
Village and Hamlets
Stormwater Drainage and Control
Services2022 20,000 - 2,000 18,000 9,000 9,000 7,560 1,440
39B
Official Plan Update Conformity
including Natural Heritage Study for
Village and Hamlets
Wastewater Services 2022 50,000 - 5,000 45,000 22,500 22,500 18,900 3,600
39C
Official Plan Update Conformity
including Natural Heritage Study for
Village and Hamlets
Water Services 2022 50,000 - 5,000 45,000 22,500 22,500 18,900 3,600
39D
Official Plan Update Conformity
including Natural Heritage Study for
Village and Hamlets
Services Related to a Highway 2022 50,000 - 5,000 45,000 22,500 22,500 18,900 3,600
39E
Official Plan Update Conformity
including Natural Heritage Study for
Village and Hamlets
Fire Protection Services 2022 10,000 - 1,000 9,000 4,500 4,500 3,780 720
39F
Official Plan Update Conformity
including Natural Heritage Study for
Village and Hamlets
Parks and Recreation Services 2022 10,000 - 1,000 9,000 4,500 4,500 3,780 720
39G
Official Plan Update Conformity
including Natural Heritage Study for
Village and Hamlets
Library Services 2022 10,000 - 1,000 9,000 4,500 4,500 3,780 720
40A Zoning By-law Consolidation/UpdateStormwater Drainage and Control
Services2023 10,000 - 1,000 9,000 4,500 4,500 3,780 720
40B Zoning By-law Consolidation/Update Wastewater Services 2023 25,000 - 2,500 22,500 11,300 11,200 9,408 1,792
40C Zoning By-law Consolidation/Update Water Services 2023 25,000 - 2,500 22,500 11,300 11,200 9,408 1,792
40D Zoning By-law Consolidation/Update Services Related to a Highway 2023 25,000 - 2,500 22,500 11,300 11,200 9,408 1,792
40E Zoning By-law Consolidation/Update Fire Protection Services 2023 5,000 - 500 4,500 2,300 2,200 1,848 352
40F Zoning By-law Consolidation/Update Parks and Recreation Services 2023 5,000 - 500 4,500 2,300 2,200 1,848 352
40G Zoning By-law Consolidation/Update Library Services 2023 5,000 - 500 4,500 2,300 2,200 1,848 352
41ACommunity Planning Permit System
Study
Stormwater Drainage and Control
Services2024 5,000 - 500 4,500 2,300 2,200 1,848 352
41BCommunity Planning Permit System
StudyWastewater Services 2024 12,500 - 1,250 11,250 5,600 5,650 4,746 904
41CCommunity Planning Permit System
StudyWater Services 2024 12,500 - 1,250 11,250 5,600 5,650 4,746 904
Increased Service Needs Attributable
to Anticipated DevelopmentTiming
(year)
Gross
Capital Cost
Estimate
(2020$)
Post
Period
Benefit
Other
Deductions
(To
Recognize
Benefit to
Non-D.C.
Services)
Net Capital
Cost
Benefit to
Existing
Development
Grants,
Subsidies and
Other
Contributions
Attributable to
New
Development
Total
Less: Potential D.C. Recoverable Cost
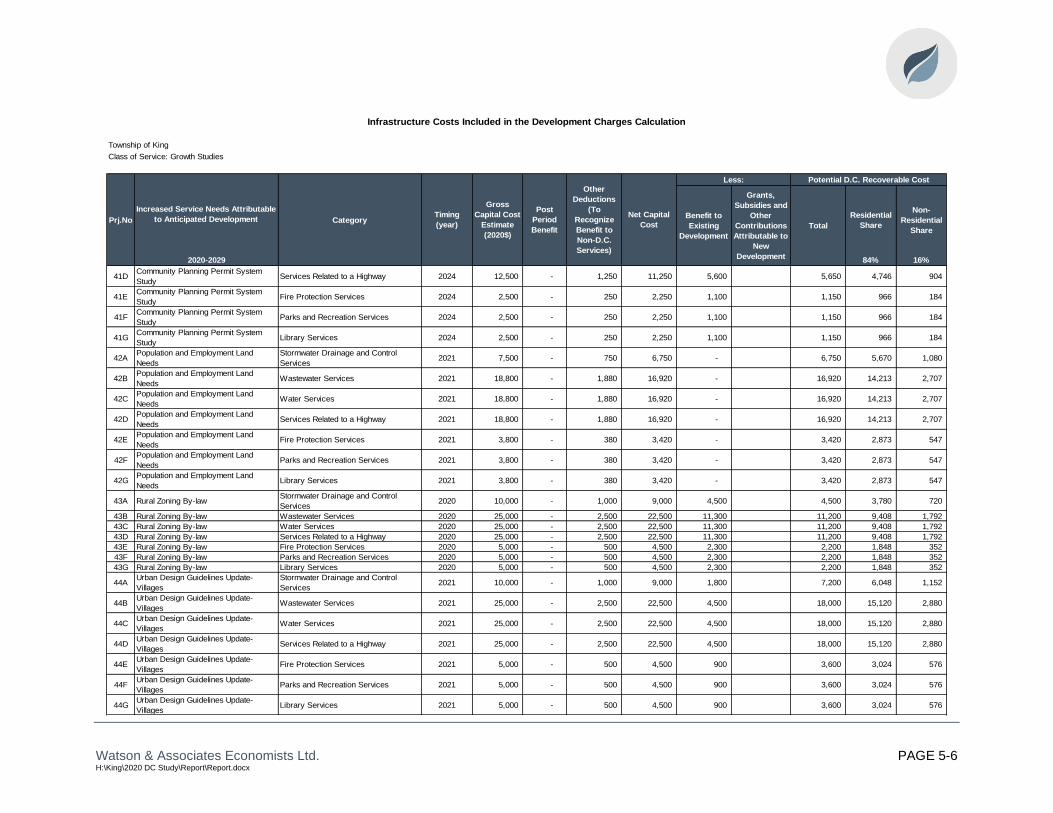
Watson & Associates Economists Ltd. PAGE 5-6 H:\King\2020 DC Study\Report\Report.docx
Infrastructure Costs Included in the Development Charges Calculation
Township of King
Class of Service: Growth Studies
Prj.No CategoryResidential
Share
Non-
Residential
Share
2020-2029 84% 16%
41DCommunity Planning Permit System
StudyServices Related to a Highway 2024 12,500 - 1,250 11,250 5,600 5,650 4,746 904
41ECommunity Planning Permit System
StudyFire Protection Services 2024 2,500 - 250 2,250 1,100 1,150 966 184
41FCommunity Planning Permit System
StudyParks and Recreation Services 2024 2,500 - 250 2,250 1,100 1,150 966 184
41GCommunity Planning Permit System
StudyLibrary Services 2024 2,500 - 250 2,250 1,100 1,150 966 184
42APopulation and Employment Land
Needs
Stormwater Drainage and Control
Services2021 7,500 - 750 6,750 - 6,750 5,670 1,080
42BPopulation and Employment Land
NeedsWastewater Services 2021 18,800 - 1,880 16,920 - 16,920 14,213 2,707
42CPopulation and Employment Land
NeedsWater Services 2021 18,800 - 1,880 16,920 - 16,920 14,213 2,707
42DPopulation and Employment Land
NeedsServices Related to a Highway 2021 18,800 - 1,880 16,920 - 16,920 14,213 2,707
42EPopulation and Employment Land
NeedsFire Protection Services 2021 3,800 - 380 3,420 - 3,420 2,873 547
42FPopulation and Employment Land
NeedsParks and Recreation Services 2021 3,800 - 380 3,420 - 3,420 2,873 547
42GPopulation and Employment Land
NeedsLibrary Services 2021 3,800 - 380 3,420 - 3,420 2,873 547
43A Rural Zoning By-lawStormwater Drainage and Control
Services2020 10,000 - 1,000 9,000 4,500 4,500 3,780 720
43B Rural Zoning By-law Wastewater Services 2020 25,000 - 2,500 22,500 11,300 11,200 9,408 1,792
43C Rural Zoning By-law Water Services 2020 25,000 - 2,500 22,500 11,300 11,200 9,408 1,792
43D Rural Zoning By-law Services Related to a Highway 2020 25,000 - 2,500 22,500 11,300 11,200 9,408 1,792
43E Rural Zoning By-law Fire Protection Services 2020 5,000 - 500 4,500 2,300 2,200 1,848 352
43F Rural Zoning By-law Parks and Recreation Services 2020 5,000 - 500 4,500 2,300 2,200 1,848 352
43G Rural Zoning By-law Library Services 2020 5,000 - 500 4,500 2,300 2,200 1,848 352
44AUrban Design Guidelines Update-
Villages
Stormwater Drainage and Control
Services2021 10,000 - 1,000 9,000 1,800 7,200 6,048 1,152
44BUrban Design Guidelines Update-
VillagesWastewater Services 2021 25,000 - 2,500 22,500 4,500 18,000 15,120 2,880
44CUrban Design Guidelines Update-
VillagesWater Services 2021 25,000 - 2,500 22,500 4,500 18,000 15,120 2,880
44DUrban Design Guidelines Update-
VillagesServices Related to a Highway 2021 25,000 - 2,500 22,500 4,500 18,000 15,120 2,880
44EUrban Design Guidelines Update-
VillagesFire Protection Services 2021 5,000 - 500 4,500 900 3,600 3,024 576
44FUrban Design Guidelines Update-
VillagesParks and Recreation Services 2021 5,000 - 500 4,500 900 3,600 3,024 576
44GUrban Design Guidelines Update-
VillagesLibrary Services 2021 5,000 - 500 4,500 900 3,600 3,024 576
Increased Service Needs Attributable
to Anticipated DevelopmentTiming
(year)
Gross
Capital Cost
Estimate
(2020$)
Post
Period
Benefit
Other
Deductions
(To
Recognize
Benefit to
Non-D.C.
Services)
Net Capital
Cost
Benefit to
Existing
Development
Grants,
Subsidies and
Other
Contributions
Attributable to
New
Development
Total
Less: Potential D.C. Recoverable Cost

Watson & Associates Economists Ltd. PAGE 5-7 H:\King\2020 DC Study\Report\Report.docx
Infrastructure Costs Included in the Development Charges Calculation
Township of King
Class of Service: Growth Studies
Prj.N
oCategory
Residential
Share
Non-
Residential
Share
2020-2029 84% 16%
42B Zoning By-law Consolidation/Update Wastewater Services - King City 2023 12,500 - 1,250 11,250 5,600 5,650 4,746 904
42C Zoning By-law Consolidation/Update Wastewater Services - Nobleton 2023 12,500 - 1,250 11,250 5,600 5,650 4,746 904
42D Zoning By-law Consolidation/Update Water Services 2023 25,000 - 2,500 22,500 11,300 11,200 9,408 1,792
42E Zoning By-law Consolidation/Update Services Related to a Highway 2023 25,000 - 2,500 22,500 11,300 11,200 9,408 1,792
42F Zoning By-law Consolidation/Update Fire Protection Services 2023 5,000 - 500 4,500 2,300 2,200 1,848 352
42G Zoning By-law Consolidation/Update Parks and Recreation Services 2023 5,000 - 500 4,500 2,300 2,200 1,848 352
42H Zoning By-law Consolidation/Update Library Services 2023 5,000 - 500 4,500 2,300 2,200 1,848 352
43ACommunity Planning Permit System
Study
Stormwater Drainage and Control
Services2024 5,000 - 500 4,500 2,300 2,200 1,848 352
43BCommunity Planning Permit System
StudyWastewater Services - King City 2024 6,300 - 630 5,670 2,800 2,870 2,411 459
43CCommunity Planning Permit System
StudyWastewater Services - Nobleton 2024 6,300 - 630 5,670 2,800 2,870 2,411 459
43DCommunity Planning Permit System
StudyWater Services 2024 12,500 - 1,250 11,250 5,600 5,650 4,746 904
43ECommunity Planning Permit System
StudyServices Related to a Highway 2024 12,500 - 1,250 11,250 5,600 5,650 4,746 904
43FCommunity Planning Permit System
StudyFire Protection Services 2024 2,500 - 250 2,250 1,100 1,150 966 184
43G.Community Planning Permit System
StudyParks and Recreation Services 2024 2,500 - 250 2,250 1,100 1,150 966 184
43HCommunity Planning Permit System
StudyLibrary Services 2024 2,500 - 250 2,250 1,100 1,150 966 184
44A Major Transit Study AreaStormwater Drainage and Control
Services2023 2,500 - 250 2,250 1,100 1,150 966 184
44B Major Transit Study Area Wastewater Services - King City 2023 3,100 - 310 2,790 1,400 1,390 1,168 222
44C Major Transit Study Area Wastewater Services - Nobleton 2023 3,100 - 310 2,790 1,400 1,390 1,168 222
44D Major Transit Study Area Water Services 2023 6,300 - 630 5,670 2,800 2,870 2,411 459
44E Major Transit Study Area Services Related to a Highway 2023 6,300 - 630 5,670 2,800 2,870 2,411 459
44F Major Transit Study Area Fire Protection Services 2023 1,300 - 130 1,170 600 570 479 91
44G Major Transit Study Area Parks and Recreation Services 2023 1,300 - 130 1,170 600 570 479 91
44H Major Transit Study Area Library Services 2023 1,300 - 130 1,170 600 570 479 91
45ACore Areas Parking Study (PW/GMS-
PD lead)
Stormwater Drainage and Control
Services2022 8,500 - 850 7,650 3,800 3,850 3,234 616
45BCore Areas Parking Study (PW/GMS-
PD lead)Wastewater Services - King City 2022 10,600 - 1,060 9,540 4,800 4,740 3,982 758
45CCore Areas Parking Study (PW/GMS-
PD lead)Wastewater Services - Nobleton 2022 10,600 - 1,060 9,540 4,800 4,740 3,982 758
45DCore Areas Parking Study (PW/GMS-
PD lead)Water Services 2022 21,300 - 2,130 19,170 9,600 9,570 8,039 1,531
Net Capital
Cost
Benefit to
Existing
Development
Grants,
Subsidies and
Other
Contributions
Attributable to
New
Development
Total
Less: Potential D.C. Recoverable Cost
Increased Service Needs Attributable
to Anticipated DevelopmentTiming
(year)
Gross
Capital Cost
Estimate
(2020$)
Post
Period
Benefit
Other
Deductions
(To
Recognize
Benefit to
Non-D.C.
Services)

Watson & Associates Economists Ltd. PAGE 5-8 H:\King\2020 DC Study\Report\Report.docx
Infrastructure Costs Included in the Development Charges Calculation
Township of King
Class of Service: Growth Studies
Prj.No CategoryResidential
Share
Non-
Residential
Share
2020-2029 84% 16%
45AEmployment Area Lands Need Study
(PD/ED)
Stormwater Drainage and Control
Services2021 5,000 - 500 4,500 900 3,600 3,024 576
45BEmployment Area Lands Need Study
(PD/ED)Wastewater Services 2021 12,500 - 1,250 11,250 2,300 8,950 7,518 1,432
45CEmployment Area Lands Need Study
(PD/ED)Water Services 2021 12,500 - 1,250 11,250 2,300 8,950 7,518 1,432
45DEmployment Area Lands Need Study
(PD/ED)Services Related to a Highway 2021 12,500 - 1,250 11,250 2,300 8,950 7,518 1,432
45EEmployment Area Lands Need Study
(PD/ED)Fire Protection Services 2021 2,500 - 250 2,250 500 1,750 1,470 280
45FEmployment Area Lands Need Study
(PD/ED)Parks and Recreation Services 2021 2,500 - 250 2,250 500 1,750 1,470 280
45GEmployment Area Lands Need Study
(PD/ED)Library Services 2021 2,500 - 250 2,250 500 1,750 1,470 280
46ACommunity Improvement Plan Review
(PD/ED)
Stormwater Drainage and Control
Services2025 4,800 - 480 4,320 2,200 2,120 1,781 339
46BCommunity Improvement Plan Review
(PD/ED)Wastewater Services 2025 12,000 - 1,200 10,800 5,400 5,400 4,536 864
46CCommunity Improvement Plan Review
(PD/ED)Water Services 2025 12,000 - 1,200 10,800 5,400 5,400 4,536 864
46DCommunity Improvement Plan Review
(PD/ED)Services Related to a Highway 2025 12,000 - 1,200 10,800 5,400 5,400 4,536 864
46ECommunity Improvement Plan Review
(PD/ED)Fire Protection Services 2025 2,400 - 240 2,160 1,100 1,060 890 170
46FCommunity Improvement Plan Review
(PD/ED)Parks and Recreation Services 2025 2,400 - 240 2,160 1,100 1,060 890 170
46GCommunity Improvement Plan Review
(PD/ED)Library Services 2025 2,400 - 240 2,160 1,100 1,060 890 170
47 Reserve Fund Adjustment Reserve - - - 292,144 (292,144) (245,401) (46,743)
Total 3,443,300 - 72,330 3,370,970 1,908,544 - 1,462,426 1,228,438 233,988
Increased Service Needs Attributable
to Anticipated DevelopmentTiming
(year)
Gross
Capital Cost
Estimate
(2020$)
Post
Period
Benefit
Other
Deductions
(To
Recognize
Benefit to
Non-D.C.
Services)
Net Capital
Cost
Benefit to
Existing
Development
Grants,
Subsidies and
Other
Contributions
Attributable to
New
Development
Total
Less: Potential D.C. Recoverable Cost

Watson & Associates Economists Ltd. PAGE 5-9 H:\King\2020 DC Study\Report\Report.docx
5.2.2 Library Services
The Township currently operates its library services from four facilities which total
17,372 sq.ft. in space. Based on the space provided over the past 10 years, the
historical average level of service provided by the Township equates to an investment of
$544 per capita. This level of service provides the Township with a maximum D.C.-
eligible amount for recovery over the forecast period of $3,787,321 for facilities.
The Township has identified the need for expansions to the Schomberg and Nobleton
libraries as well as an Integrated Library System, as a result of growth. The gross
capital cost of these projects is $5,678,000, with a deduction of $727,300 to recognize
the benefit to existing development. A further deduction of $2,266,480 has been made
in order to recognize the benefit to growth beyond the forecast period. A recovery of
$1,076,024 has been included in order to recognize the existing reserve fund deficit.
Based on the above, the net-D.C. eligible amount of $3,760,244 is being included in the
calculations.
The Township also has an inventory of 150,233 library collection items, which
comprises of items such as books, periodicals, CDs, DVDs, E-books, etc. Over the past
ten years, the average level of service was $99 per capita. Based on this growth
forecast, the Township would be eligible to collect $686,725 from D.C.s for library
collection items over the next ten-year forecast period.
To complement the proposed facility expansions, the Township has identified the need
for additional collection materials as a result of growth. A provision in the amount of
$650,000 has been identified and included in the D.C. calculations.
While library services are predominantly residential based, there is some use of the
facilities by non-residential users, for the purpose of research. To acknowledge this
use, the capital costs would be allocated 95% residential and 5% non-residential.
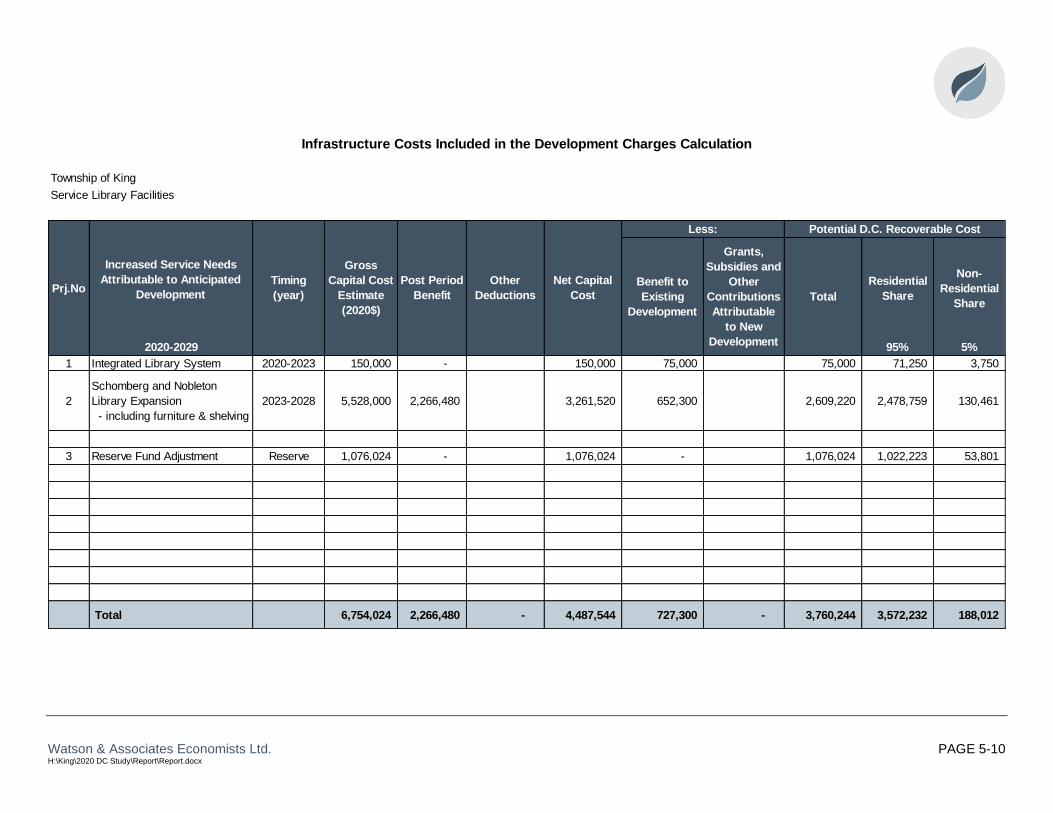
Watson & Associates Economists Ltd. PAGE 5-10 H:\King\2020 DC Study\Report\Report.docx
Infrastructure Costs Included in the Development Charges Calculation
Township of King
Service:Library Facilities
Prj.NoResidential
Share
Non-
Residential
Share
2020-2029 95% 5%
1 Integrated Library System 2020-2023 150,000 - 150,000 75,000 75,000 71,250 3,750
2
Schomberg and Nobleton
Library Expansion
- including furniture & shelving
2023-2028 5,528,000 2,266,480 3,261,520 652,300 2,609,220 2,478,759 130,461
3 Reserve Fund Adjustment Reserve 1,076,024 - 1,076,024 - 1,076,024 1,022,223 53,801
Total 6,754,024 2,266,480 - 4,487,544 727,300 - 3,760,244 3,572,232 188,012
Net Capital
Cost
Benefit to
Existing
Development
Grants,
Subsidies and
Other
Contributions
Attributable
to New
Development
Total
Less: Potential D.C. Recoverable Cost
Increased Service Needs
Attributable to Anticipated
Development
Timing
(year)
Gross
Capital Cost
Estimate
(2020$)
Post Period
Benefit
Other
Deductions

Watson & Associates Economists Ltd. PAGE 5-11 H:\King\2020 DC Study\Report\Report.docx
Infrastructure Costs Included in the Development Charges Calculation
Township of King
Service:Library Collection Materials
Prj.NoResidential
Share
Non-
Residential
Share
2020-2029 95% 5%
1Provision for Additional Collection
Material2020-2029 650,000 - 650,000 - 650,000 617,500 32,500
Total 650,000 - - 650,000 - - 650,000 617,500 32,500
Increased Service Needs Attributable
to Anticipated DevelopmentTiming
(year)
Gross
Capital
Cost
Estimate
(2020$)
Post
Period
Benefit
Other
Deductions
Net Capital
Cost
Benefit to
Existing
Development
Grants,
Subsidies
and Other
Contribution
s Attributable
to New
Development
Total
Less: Potential D.C. Recoverable Cost

Watson & Associates Economists Ltd. PAGE 5-12 H:\King\2020 DC Study\Report\Report.docx
5.2.3 Parks and Recreation Services
The Township Parks and Recreation department currently maintains the following
inventory:
• 896 acres of parkland (various sized parks, parkettes, active parks, and passive
parks);
• 139 parkland amenities (playgrounds, shade structures, washrooms, splash
pads, basketball courts, etc.);
• 45 kilometres of trails;
• 52 Parks and Recreation vehicles (totalling $2.89 million in value); and
• 231,769 sq.ft. of Indoor Recreation space.
Based on the assets provided above, the Township has provided a parks and recreation
historical 10-year level of service of $4,755 per capita. This level of service, when
applied to the 10-year growth forecast population of 6,957, results in a total D.C.-eligible
amount of $33,078,865.
Due to the projected growth over the forecast period, the Township has identified
$93,983,515 in future growth capital costs for Parks and Recreation Services. These
projects include:
• the development of additional parks and park upgrades (neighbourhood parks,
community parks, tennis courts, sports park, artificial turf, etc.)
• additional parks vehicles and equipment (trailers, pick up trucks, wood chippers,
mowers, etc.); and
• new recreation facilities (tennis clubhouse, washrooms, community centre, etc.).
Additionally, D.C. credits for works to be constructed by developers are also included.
Deductions in the amount of $13,229,360 has been made to account for the benefit to
existing development, $26,908,500 to recognize the benefit to growth beyond the
forecast period, and $4,717,637 to recognize the existing reserve fund balance.
Additionally, the Township has identified $16,065,000 of contributions from other
sources to be used towards the new community centre. Therefore, the net growth
capital cost of $33,063,018 has been included in the D.C. calculations.

Watson & Associates Economists Ltd. PAGE 5-13 H:\King\2020 DC Study\Report\Report.docx
As the predominant users of parks and recreation tend to be residents of the Township,
the forecast growth-related costs have been allocated 95% to residential and 5% to
non-residential.

Watson & Associates Economists Ltd. PAGE 5-14 H:\King\2020 DC Study\Report\Report.docx
Infrastructure Costs Included in the Development Charges Calculation
Township of King
Service:Parks & Recreation Services
Prj.NoResidential
Share
Non-
Residential
Share
2020-2029 95% 5%
Parkland Development
1Cold Creek Phase 2 (challenge course
and rock wall expansion, gate)2020 43,000 - 43,000 - 43,000 40,850 2,150
2 Community Park - Metrus 2020 1,564,400 - 1,564,400 - 1,564,400 1,486,180 78,220
3 Neighbourhood Park - Genview 2020 163,200 - 163,200 - 163,200 155,040 8,160
4 Neighbourhood Park - King Valley 2020 235,200 - 235,200 - 235,200 223,440 11,760
5 Neighbourhood Park - Osmington 2020 197,200 - 197,200 - 197,200 187,340 9,860
6Community Park
- Nobleton Sports Park (Phase 2)2020 370,800 - 370,800 - 370,800 352,260 18,540
7 Neighbourhood Park - Maidenstone 2020 235,200 - 235,200 - 235,200 223,440 11,760
8 Neighbourhood Park - Centennial 2020 164,000 - 164,000 - 164,000 155,800 8,200
9Int. soccer fields (3) upgrade
(proper draining and grading)2020 202,800 - 202,800 - 202,800 192,660 10,140
10Neighbourhood Park
- Tomlinson Gardens2020 235,200 - 235,200 - 235,200 223,440 11,760
11Rising Star Lands
- Bridge, Trail & Development2024 119,000 119,000 - - - - -
12 Community Park - Osin Park Phase 2 2025 596,000 596,000 - - - - -
13 Schomberg Tennis Courts (lighting) 2025 119,000 119,000 - - - - -
14Neighbourhood Park
- King Dufferin North2022 900,000 - 900,000 - 900,000 855,000 45,000
15 King City Tennis Courts (lighting) 2024 119,000 119,000 - - - - -
16 Retrofit sport field to include lighting 2022 400,000 - 400,000 80,000 320,000 304,000 16,000
17 Skatepark - Schomberg 2021 297,400 - 297,400 118,960 178,440 169,518 8,922
Benefit to
Existing
Development
Grants,
Subsidies
and Other
Contribution
s Attributable
to New
Development
Total
Less: Potential D.C. Recoverable Cost
Post Period
Benefit
Other
Deductions
Net Capital
Cost
Gross
Capital Cost
Estimate
(2020$)
Increased Service Needs Attributable
to Anticipated DevelopmentTiming
(year)
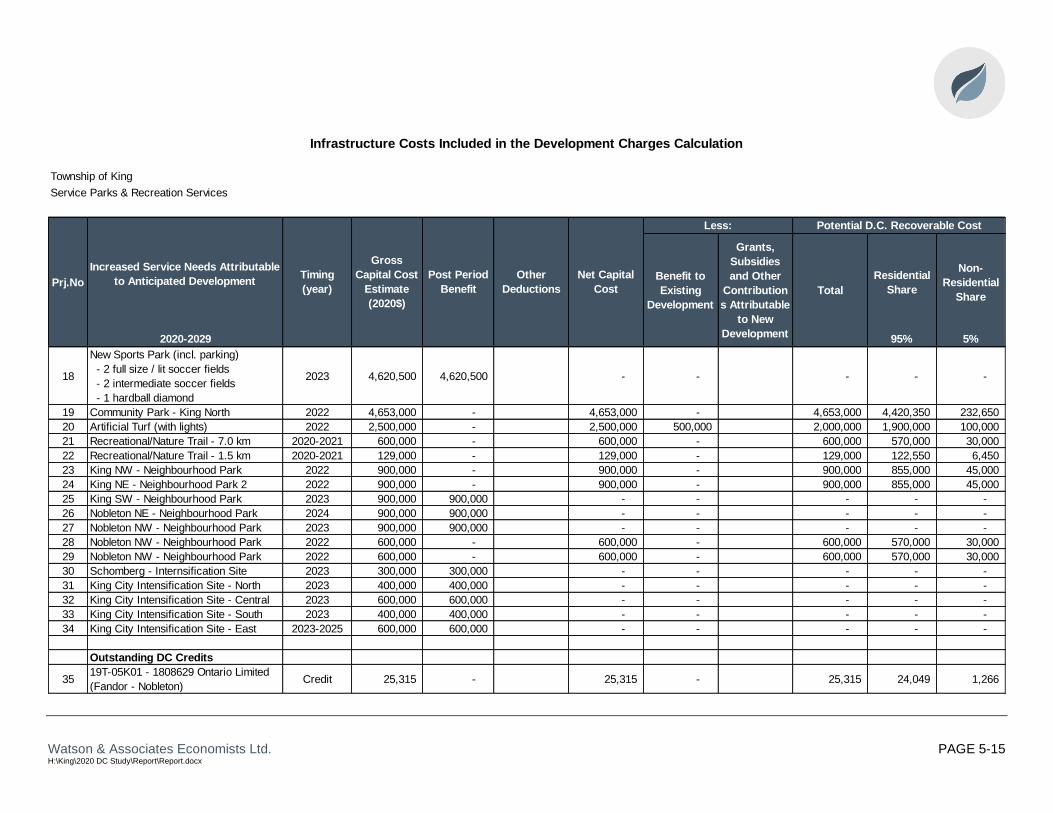
Watson & Associates Economists Ltd. PAGE 5-15 H:\King\2020 DC Study\Report\Report.docx
Infrastructure Costs Included in the Development Charges Calculation
Township of King
Service:Parks & Recreation Services
Prj.NoResidential
Share
Non-
Residential
Share
2020-2029 95% 5%
18
New Sports Park (incl. parking)
- 2 full size / lit soccer fields
- 2 intermediate soccer fields
- 1 hardball diamond
2023 4,620,500 4,620,500 - - - - -
19 Community Park - King North 2022 4,653,000 - 4,653,000 - 4,653,000 4,420,350 232,650
20 Artificial Turf (with lights) 2022 2,500,000 - 2,500,000 500,000 2,000,000 1,900,000 100,000
21 Recreational/Nature Trail - 7.0 km 2020-2021 600,000 - 600,000 - 600,000 570,000 30,000
22 Recreational/Nature Trail - 1.5 km 2020-2021 129,000 - 129,000 - 129,000 122,550 6,450
23 King NW - Neighbourhood Park 2022 900,000 - 900,000 - 900,000 855,000 45,000
24 King NE - Neighbourhood Park 2 2022 900,000 - 900,000 - 900,000 855,000 45,000
25 King SW - Neighbourhood Park 2023 900,000 900,000 - - - - -
26 Nobleton NE - Neighbourhood Park 2024 900,000 900,000 - - - - -
27 Nobleton NW - Neighbourhood Park 2023 900,000 900,000 - - - - -
28 Nobleton NW - Neighbourhood Park 2022 600,000 - 600,000 - 600,000 570,000 30,000
29 Nobleton NW - Neighbourhood Park 2022 600,000 - 600,000 - 600,000 570,000 30,000
30 Schomberg - Internsification Site 2023 300,000 300,000 - - - - -
31 King City Intensification Site - North 2023 400,000 400,000 - - - - -
32 King City Intensification Site - Central 2023 600,000 600,000 - - - - -
33 King City Intensification Site - South 2023 400,000 400,000 - - - - -
34 King City Intensification Site - East 2023-2025 600,000 600,000 - - - - -
Outstanding DC Credits
3519T-05K01 - 1808629 Ontario Limited
(Fandor - Nobleton)Credit 25,315 - 25,315 - 25,315 24,049 1,266
Benefit to
Existing
Development
Grants,
Subsidies
and Other
Contribution
s Attributable
to New
Development
Total
Less: Potential D.C. Recoverable Cost
Post Period
Benefit
Other
Deductions
Net Capital
Cost
Gross
Capital Cost
Estimate
(2020$)
Increased Service Needs Attributable
to Anticipated DevelopmentTiming
(year)
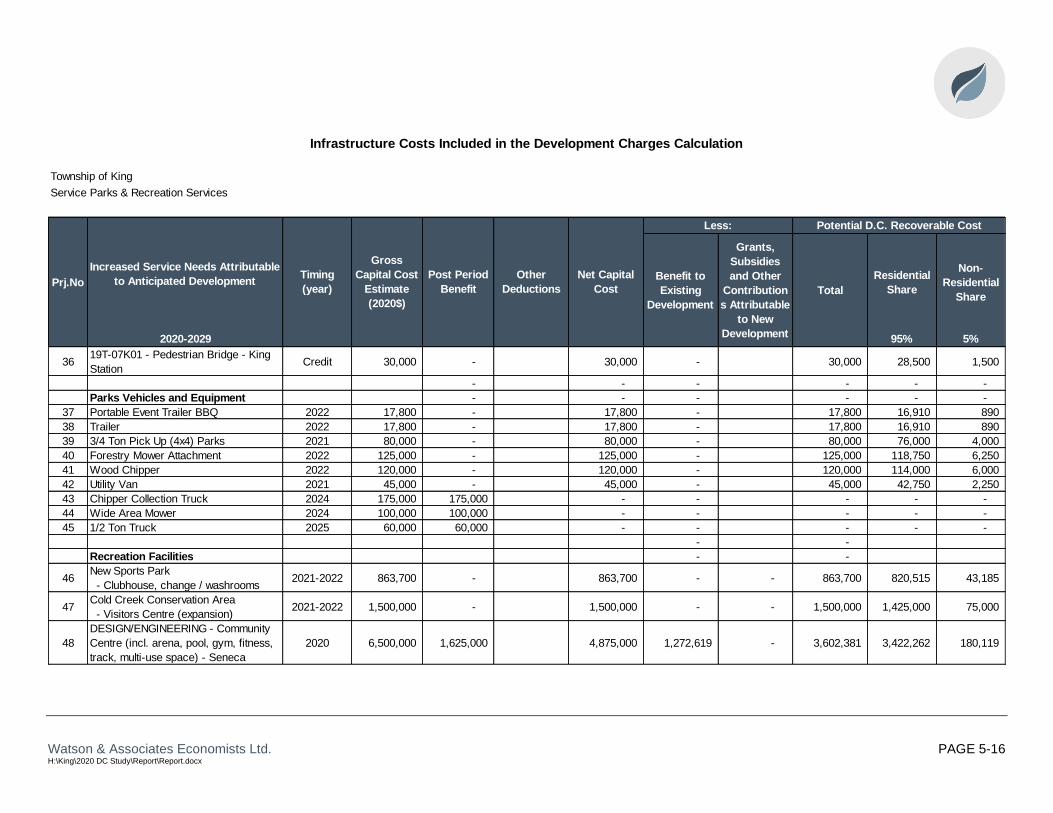
Watson & Associates Economists Ltd. PAGE 5-16 H:\King\2020 DC Study\Report\Report.docx
Infrastructure Costs Included in the Development Charges Calculation
Township of King
Service:Parks & Recreation Services
Prj.NoResidential
Share
Non-
Residential
Share
2020-2029 95% 5%
3619T-07K01 - Pedestrian Bridge - King
StationCredit 30,000 - 30,000 - 30,000 28,500 1,500
- - - - - -
Parks Vehicles and Equipment - - - - - -
37 Portable Event Trailer BBQ 2022 17,800 - 17,800 - 17,800 16,910 890
38 Trailer 2022 17,800 - 17,800 - 17,800 16,910 890
39 3/4 Ton Pick Up (4x4) Parks 2021 80,000 - 80,000 - 80,000 76,000 4,000
40 Forestry Mower Attachment 2022 125,000 - 125,000 - 125,000 118,750 6,250
41 Wood Chipper 2022 120,000 - 120,000 - 120,000 114,000 6,000
42 Utility Van 2021 45,000 - 45,000 - 45,000 42,750 2,250
43 Chipper Collection Truck 2024 175,000 175,000 - - - - -
44 Wide Area Mower 2024 100,000 100,000 - - - - -
45 1/2 Ton Truck 2025 60,000 60,000 - - - - -
- -
Recreation Facilities - -
46New Sports Park
- Clubhouse, change / washrooms 2021-2022 863,700 - 863,700 - - 863,700 820,515 43,185
47Cold Creek Conservation Area
- Visitors Centre (expansion)2021-2022 1,500,000 - 1,500,000 - - 1,500,000 1,425,000 75,000
48
DESIGN/ENGINEERING - Community
Centre (incl. arena, pool, gym, fitness,
track, multi-use space) - Seneca
2020 6,500,000 1,625,000 4,875,000 1,272,619 - 3,602,381 3,422,262 180,119
Gross
Capital Cost
Estimate
(2020$)
Increased Service Needs Attributable
to Anticipated DevelopmentTiming
(year)
Post Period
Benefit
Other
Deductions
Net Capital
Cost
Benefit to
Existing
Development
Grants,
Subsidies
and Other
Contribution
s Attributable
to New
Development
Total
Less: Potential D.C. Recoverable Cost

Watson & Associates Economists Ltd. PAGE 5-17 H:\King\2020 DC Study\Report\Report.docx
Infrastructure Costs Included in the Development Charges Calculation
Township of King
Service:Parks & Recreation Services
Prj.NoResidential
Share
Non-
Residential
Share
2020-2029 95% 5%
49
Community Centre (incl. arena, pool,
gym, fitness, track, multi-use space) -
Seneca
2021-2023 57,500,000 14,375,000 43,125,000 11,257,781 16,065,000 15,802,219 15,012,108 790,111
50Tennis Clubhouse and storage space
(Nobleton)2021 360,000 - 360,000 - - 360,000 342,000 18,000
51 Reserve Fund Adjustment Reserve - - - 4,717,637 (4,717,637) (4,481,755) (235,882)
Total 93,983,515 26,908,500 - 67,075,015 17,946,997 16,065,000 33,063,018 31,409,867 1,653,151
Gross
Capital Cost
Estimate
(2020$)
Increased Service Needs Attributable
to Anticipated DevelopmentTiming
(year)
Post Period
Benefit
Other
Deductions
Net Capital
Cost
Benefit to
Existing
Development
Grants,
Subsidies
and Other
Contribution
s Attributable
to New
Development
Total
Less: Potential D.C. Recoverable Cost

Watson & Associates Economists Ltd. PAGE 5-18 H:\King\2020 DC Study\Report\Report.docx
5.3 Service Levels and Buildout Capital Costs for King’s D.C. Calculation
This section evaluates the development-related capital requirements for those services
with Buildout capital costs.
5.3.1 Services Related to a Highway
5.3.1.1 Roads and Related
King owns and maintains 109 km of rural and urban roads (both arterial and collector).
Over the historical 10-year period, the Township has provided an average level of
investment of $19,253 per capita. Based on this service standard, the Township would
be eligible to collect $185,078,128 from D.C.s over the forecast period.
With respect to future growth-related needs, the Township’s capital program are based
on the forecasted budgets and works identified through the 2020 Transportation Master
Plan, as prepared by the engineers from WSP. The capital program includes various
works related to adding capacity to the highway system which consists of road
improvements, urbanization, paving program, expansions, as well as new roadways.
Additionally, projects related to traffic calming, sidewalks/walkways, active
transportation, capital from developer agreements, outstanding D.C. credits, and
purchases for right of way allowances have been included. These works provide a
gross capital cost of $160,271,762.
To recognize the benefit of these works to the existing community, a deduction of
$17,123,000. In addition, a deduction of $59,192,300 has been applied to recognize the
benefit of these works to the growth beyond the forecast period. Furthermore, a
deduction of $18,025,000 has been made to recognize dedications with respect to the
right of way purchases. Finally, a deduction of $5,014,095 has been made to account
for the existing reserve fund balance. After all the deductions have been applied, the net
D.C.-eligible amount of $60,917,367 has been included for recovery in the calculations.
5.3.1.2 Depots and Domes
The Township operates their Public Works service out of a number of facilities, totalling
28,343 sq.ft. of facility space. Over the previous 10-year period, the average level of
Watson & Associates Economists Ltd. PAGE 5-19 H:\King\2020 DC Study\Report\Report.docx
service provided by the Township is 1.24 sq.ft. per capita or $1,452 per capita. This
level of service provides the Township with a maximum D.C.-eligible amount for
recovery over the buildout forecast period of $13,961,729 related to Public Works
Facilities.
Based on the growth identified, the Township has included the need for three facility-
related projects: expansions to the operations facility, works yard, and a new Southern
works yard. The total cost of the projects identified is $23,738,000. The scope of the
new southern works yard has been assumed to service both growth and existing
communities with the Township; therefore, an existing benefit deduction of $2,200,000
has been made. In addition, a deduction to account for the benefit to growth beyond the
forecast period of $11,000,000 has been applied. Therefore, the net D.C.-eligible
amount to be included in the calculations is $10,538,000.
5.3.1.3 Vehicles and Equipment
The public works department has a variety of vehicles and major equipment totalling
approximately $7.61 million. The inventory provides for a per capita standard of $268.
Over the forecast period, the D.C.-eligible amount for vehicles and equipment is
$2,580,033.
Additional vehicle and equipment items have been identified for the forecast period,
amounting to $1,520,000 of growth-related capital which has been included in the D.C.
calculation.
The residential/non-residential capital cost allocation for services related to a highway is
84% residential and 16% non-residential based on the incremental growth in population
to employment for the buildout forecast period.

Watson & Associates Economists Ltd. PAGE 5-20 H:\King\2020 DC Study\Report\Report.docx
Township of King
Service: Services Related to a Highway - Roads
Less: Potential D.C. Recoverable Cost
Prj .NoResidential
Share
Non-
Residential
Share
2020-Buildout 84% 16%
Schomberg Area:
1Main Street Schomberg Reconstruction with
Main Street Typology, incl. Bridges2023 5,079,700 - 5,079,700 4,063,800 1,015,900 853,356 162,544
2 Dr. Kay 2021 169,500 - 169,500 152,600 16,900 14,196 2,704
3
Centre St. - Rebellion Way to Church St.
and Queen St. - Rebellion Way to 10th
Conc. (Design + Construction)
2021 1,100,000 - 1,100,000 110,000 990,000 831,600 158,400
4 8th Conc - 15th S.R. to King Road 2025-2028 3,729,500 - 3,729,500 1,864,800 1,864,700 1,566,348 298,352
King City and Rural Areas: -
5 King Boulevard 2022 1,249,100 - 1,249,100 624,600 624,500 524,580 99,920
6 William St 2025 666,200 - 666,200 333,100 333,100 279,804 53,296
Nobleton:
7 Culvert Improvements 2024-2026 2,037,000 - 2,037,000 509,300 1,527,700 1,283,268 244,432
8 Sheardown 2020 327,100 - 327,100 261,700 65,400 54,936 10,464
9Holden Dr. - MacTaggart Dr. to turning
circle2022 32,700 - 32,700 26,200 6,500 5,460 1,040
10 MacTaggart - Witherspoon Way to YR #27 2022 232,000 - 232,000 185,600 46,400 38,976 7,424
11 10th Conc - King Road to 15th S.R. 2022 3,836,500 - 3,836,500 1,918,300 1,918,200 1,611,288 306,912
12 15th S.R. - 10th Conc. to Y.R. #27 2022 3,568,900 - 3,568,900 1,784,500 1,784,400 1,498,896 285,504
13 Gilbert Fuller 2024 59,500 - 59,500 47,600 11,900 9,996 1,904
14 Woodhill 2024 119,000 - 119,000 95,200 23,800 19,992 3,808
New Road Construction (From WSP) -
1515th Sideroad Extension Interchange (from
15th SR to Hwy 400) - Township's Portion2028-2031 16,933,000 12,699,800 4,233,200 423,300 - 3,809,900 3,200,316 609,584
1610th Concession Extension (from Queen St
to 19th SR)2026-2030 1,480,000 1,110,000 370,000 - 370,000 310,800 59,200
1715th Sideroad Extension (from 15th SR N of
Chelsea Ln to Jane St)2027 3,052,000 2,289,000 763,000 - 763,000 640,920 122,080
Infrastructure Costs Included in the Development Charges Calculation
Increased Service Needs Attributable to
Anticipated DevelopmentTiming
(year)
Gross Capital
Cost
Estimate
(2020$)
Post Period
Benefit
Other
Deductions
Net Capital
Cost
Benefit to
Existing
Development
Grants, Subsidies
and Other
Contributions
Attributable to New
Development
Total
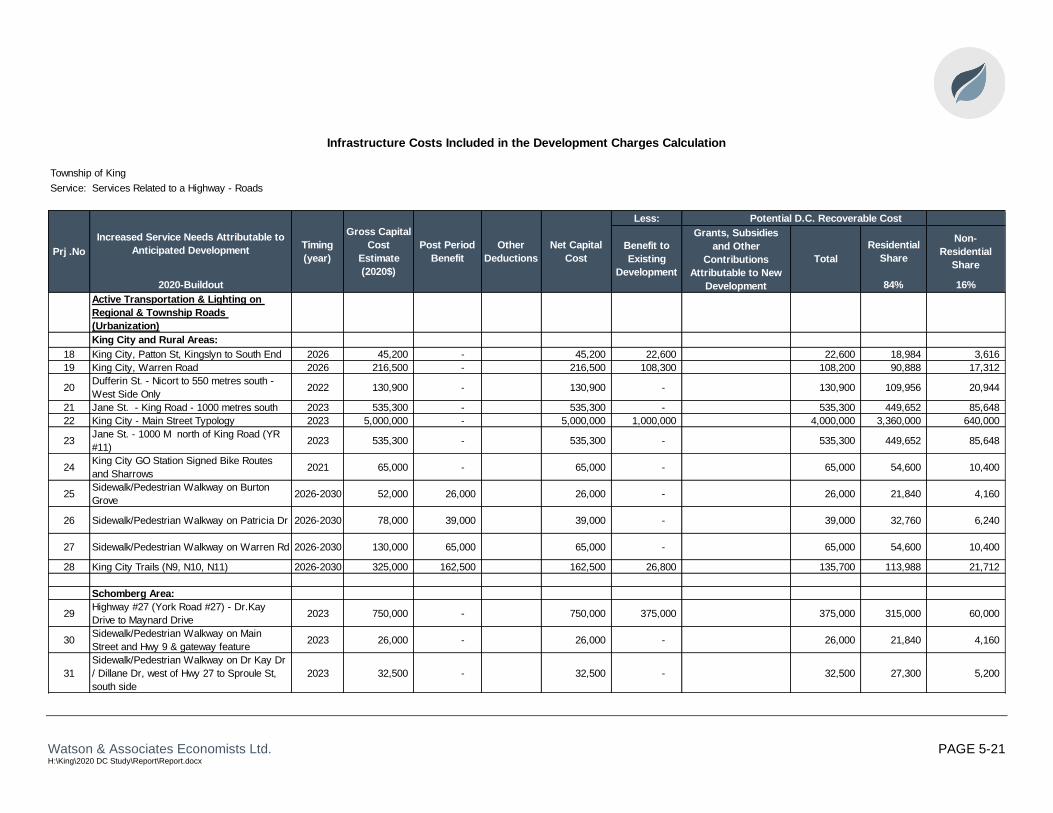
Watson & Associates Economists Ltd. PAGE 5-21 H:\King\2020 DC Study\Report\Report.docx
Township of King
Service: Services Related to a Highway - Roads
Less: Potential D.C. Recoverable Cost
Prj .NoResidential
Share
Non-
Residential
Share
2020-Buildout 84% 16%
Active Transportation & Lighting on
Regional & Township Roads
(Urbanization)
King City and Rural Areas:
18 King City, Patton St, Kingslyn to South End 2026 45,200 - 45,200 22,600 22,600 18,984 3,616
19 King City, Warren Road 2026 216,500 - 216,500 108,300 108,200 90,888 17,312
20Dufferin St. - Nicort to 550 metres south -
West Side Only2022 130,900 - 130,900 - 130,900 109,956 20,944
21 Jane St. - King Road - 1000 metres south 2023 535,300 - 535,300 - 535,300 449,652 85,648
22 King City - Main Street Typology 2023 5,000,000 - 5,000,000 1,000,000 4,000,000 3,360,000 640,000
23Jane St. - 1000 M north of King Road (YR
#11)2023 535,300 - 535,300 - 535,300 449,652 85,648
24King City GO Station Signed Bike Routes
and Sharrows2021 65,000 - 65,000 - 65,000 54,600 10,400
25Sidewalk/Pedestrian Walkway on Burton
Grove2026-2030 52,000 26,000 26,000 - 26,000 21,840 4,160
26 Sidewalk/Pedestrian Walkway on Patricia Dr 2026-2030 78,000 39,000 39,000 - 39,000 32,760 6,240
27 Sidewalk/Pedestrian Walkway on Warren Rd 2026-2030 130,000 65,000 65,000 - 65,000 54,600 10,400
28 King City Trails (N9, N10, N11) 2026-2030 325,000 162,500 162,500 26,800 135,700 113,988 21,712
Schomberg Area:
29Highway #27 (York Road #27) - Dr.Kay
Drive to Maynard Drive2023 750,000 - 750,000 375,000 375,000 315,000 60,000
30Sidewalk/Pedestrian Walkway on Main
Street and Hwy 9 & gateway feature2023 26,000 - 26,000 - 26,000 21,840 4,160
31
Sidewalk/Pedestrian Walkway on Dr Kay Dr
/ Dillane Dr, west of Hwy 27 to Sproule St,
south side
2023 32,500 - 32,500 - 32,500 27,300 5,200
Infrastructure Costs Included in the Development Charges Calculation
Increased Service Needs Attributable to
Anticipated DevelopmentTiming
(year)
Gross Capital
Cost
Estimate
(2020$)
Post Period
Benefit
Other
Deductions
Net Capital
Cost
Benefit to
Existing
Development
Grants, Subsidies
and Other
Contributions
Attributable to New
Development
Total

Watson & Associates Economists Ltd. PAGE 5-22 H:\King\2020 DC Study\Report\Report.docx
Township of King
Service: Services Related to a Highway - Roads
Less: Potential D.C. Recoverable Cost
Prj .NoResidential
Share
Non-
Residential
Share
2020-Buildout 84% 16%
32Sidewalk/Pedestrian Walkway on Western
Ave2026-2030 325,000 162,500 162,500 - 162,500 136,500 26,000
33Sidewalk/Pedestrian Walkway on Hwy 27
from Dr Kay Dr to Hwy 92026-2030 130,000 65,000 65,000 - 65,000 54,600 10,400
34Schomberg Trails (Connections to Foxtrail
Park)2023 50,000 - 50,000 - 50,000 42,000 8,000
Nobleton Area:
35 Nobleton Area - Main Street Typology 2024-2025 6,500,000 - 6,500,000 1,300,000 5,200,000 4,368,000 832,000
36 Nobleton Pedestrian Connectivitity 2028 900,000 - 900,000 450,000 450,000 378,000 72,000
37Pedestrian Connection from 225 Church St
to 14 Church St2022 175,000 - 175,000 - 175,000 147,000 28,000
38Multi-use Path on King Road from Old King
Road to Greenside, south side2021-2024 259,400 - 259,400 - 259,400 217,896 41,504
39Midblock Crossing at Ellis Avenue and
Parkview Avenue2021-2024 29,300 - 29,300 - 29,300 24,612 4,688
40Midblock Crossing at King Road and Henry
Gate / Tomlinson Gate2021-2024 29,300 - 29,300 - 29,300 24,612 4,688
41Multi-use Path on King Road from Henry
Gate to Wellington St, south side2026-2030 259,400 129,700 129,700 - 129,700 108,948 20,752
42 Nobleton Trails (N2, N5, N6) 2026-2030 325,000 162,500 162,500 26,800 135,700 113,988 21,712
Roadway Paving (from WSP)
43 89-18th Sideroad from Weston Road to End 2021 172,200 - 172,200 17,200 155,000 130,200 24,800
44235-Concession Road 7 from 15th Sideroad
to 16th Sideroad2021 654,000 - 654,000 65,400 588,600 494,424 94,176
45229-Concession Road 7 from King Road to
15th Sideroad2021 135,000 - 135,000 13,500 121,500 102,060 19,440
4639—16th Sideroad from Concession 11 to
Concession 122022 627,000 - 627,000 62,700 564,300 474,012 90,288
47285- Davis Road from 2nd Concession to
Schomberg River2022 231,240 - 231,240 23,100 208,140 174,838 33,302
Infrastructure Costs Included in the Development Charges Calculation
Increased Service Needs Attributable to
Anticipated DevelopmentTiming
(year)
Gross Capital
Cost
Estimate
(2020$)
Post Period
Benefit
Other
Deductions
Net Capital
Cost
Benefit to
Existing
Development
Grants, Subsidies
and Other
Contributions
Attributable to New
Development
Total

Watson & Associates Economists Ltd. PAGE 5-23 H:\King\2020 DC Study\Report\Report.docx
Township of King
Service: Services Related to a Highway - Roads
Less: Potential D.C. Recoverable Cost
Prj .NoResidential
Share
Non-
Residential
Share
2020-Buildout 84% 16%
48209-Concession Road 8 from King Road to
South End2022 167,280 - 167,280 16,700 150,580 126,487 24,093
49283- Davis Road from South Canal Bank
Road to 2nd Concession Road2023 231,240 - 231,240 23,100 208,140 174,838 33,302
5037- 16th Sideroad from Concession Road 10
to Concession Road 112023 504,300 - 504,300 50,400 453,900 381,276 72,624
51 85-18th Sideroad from Jane Street to End 2023 222,015 - 222,015 22,200 199,815 167,845 31,970
52 87- 18th Sideroad from Weston Road to End 2023 231,240 - 231,240 23,100 208,140 174,838 33,302
53345-Toll Road from Bathurst Street to
Highway 112024 332,920 - 332,920 33,300 299,620 251,681 47,939
5431-16th Sideroad from Concession 7 to
Concession 82024 519,060 - 519,060 51,900 467,160 392,414 74,746
55269-Dufferin Street from 19th Sideroad to
Davis Drive2024 477,660 - 477,660 47,800 429,860 361,082 68,778
56227-Elmpine Trail from Mill Road to West
End2025 143,424 - 143,424 14,300 129,124 108,464 20,660
57233-Concession Road 7 from King Road to
15th Sideroad2026 708,960 354,500 354,460 35,400 319,060 268,010 51,050
58337-Dufferin Street from Graham Sideroad
to North End2026 165,984 83,000 82,984 8,300 74,684 62,735 11,949
59225-Mill Road from Elmpine Trail to King
Road2026 430,080 215,000 215,080 21,500 193,580 162,607 30,973
60113-19th Sideroad from Dufferin Street to
Keele Street2027 754,992 377,500 377,492 37,700 339,792 285,425 54,367
61331-Wilhelmina Road from Dufferin Street to
West End2027 219,300 109,700 109,600 11,000 98,600 82,824 15,776
62151-Caledon/King Townline North from 19th
Sideroad to Highway 92027 781,550 390,800 390,750 39,100 351,650 295,386 56,264
63239- Concession Road 7 from 18th Sideroad
to South End2028 506,400 253,200 253,200 25,300 227,900 191,436 36,464
Infrastructure Costs Included in the Development Charges Calculation
Increased Service Needs Attributable to
Anticipated DevelopmentTiming
(year)
Gross Capital
Cost
Estimate
(2020$)
Post Period
Benefit
Other
Deductions
Net Capital
Cost
Benefit to
Existing
Development
Grants, Subsidies
and Other
Contributions
Attributable to New
Development
Total

Watson & Associates Economists Ltd. PAGE 5-24 H:\King\2020 DC Study\Report\Report.docx
Township of King
Service: Services Related to a Highway - Roads
Less: Potential D.C. Recoverable Cost
Prj .NoResidential
Share
Non-
Residential
Share
2020-Buildout 84% 16%
649-15th Sideroad from Weston Road to Hwy
4002028 232,050 116,000 116,050 11,600 104,450 87,738 16,712
65139-19th Sideroad from Concession Road
11 to Concession Road 122028 624,000 312,000 312,000 31,200 280,800 235,872 44,928
66237-Concession Road 7 from 16th Sideroad
to North End2028 267,750 133,900 133,850 13,400 120,450 101,178 19,272
6719- 15th Sideroad from Concession 11 to
West End2028 231,336 115,700 115,636 11,600 104,036 87,390 16,646
68275-Bernhardt Road from Hwy 9 to
Schomberg River2029 446,880 223,400 223,480 22,300 201,180 168,991 32,189
6919-15th Sideroad from Concession Road 11
to West End2029 231,336 115,700 115,636 11,600 104,036 87,390 16,646
7045-Burrows Road from Weston Road to
Weston Road2029 69,003 34,500 34,503 3,500 31,003 26,043 4,960
7167-17th Sideroad from Concession 8 to RR
272030 651,168 325,600 325,568 32,600 292,968 246,093 46,875
72 67-17th Sideroad from Weston to Hwy 400 2030 267,900 134,000 133,900 13,400 120,500 101,220 19,280
73141-19th Sideroad drom Concession Road
12 to Caledon/King Townline2030 617,288 308,600 308,688 30,900 277,788 233,342 44,446
74239-Concession Road 7 from 18th Sideroad
to South End2026 506,400 253,200 253,200 25,300 227,900 191,436 36,464
Right of Way Purchases (from WSP)
75Right of Way Purchase of Land (Arterial
Roads)2021-2031 66,100,000 33,050,000 33,050,000 - 16,525,000 16,525,000 13,881,000 2,644,000
76Right of Way Purchase of Land (Collector
Roads)2021-2031 10,000,000 5,000,000 5,000,000 - 1,500,000 3,500,000 2,940,000 560,000
-
Other -
77Growth-Related Traffic Calming
Implementation2021-2031 1,500,000 375,000 1,125,000 562,500 562,500 472,500 90,000
Infrastructure Costs Included in the Development Charges Calculation
Increased Service Needs Attributable to
Anticipated DevelopmentTiming
(year)
Gross Capital
Cost
Estimate
(2020$)
Post Period
Benefit
Other
Deductions
Net Capital
Cost
Benefit to
Existing
Development
Grants, Subsidies
and Other
Contributions
Attributable to New
Development
Total

Watson & Associates Economists Ltd. PAGE 5-25 H:\King\2020 DC Study\Report\Report.docx
Township of King
Service: Services Related to a Highway - Roads
Less: Potential D.C. Recoverable Cost
Prj .NoResidential
Share
Non-
Residential
Share
2020-Buildout 84% 16%
Capital From Agreements (Net Growth
Amount)-
78 Eaton Hall Creek Brdge 2021-2022 6,480,100 - 6,480,100 - 6,480,100 5,443,284 1,036,816
79Multi-use Path (MUP) Dufferin St.- Tatton Crt
to 15th Sideroad2021-2022 412,979 - 412,979 - 412,979 346,902 66,077
80Multi-use Path (MUP) 15th Sideroad, SS
Dufferin to St. A2021-2022 869,512 - 869,512 - 869,512 730,390 139,122
81 Ped connection to Tawes Trail from KCE 2021-2022 1,225,000 - 1,225,000 - 1,225,000 1,029,000 196,000
82 King Trails (N12) from KCE 2023-2024 500,000 - 500,000 - 500,000 420,000 80,000
Outstanding D.C. Credits
8319T-05K02 - Road and concurrent works -
Noblewood Drive & Hollywood Crescent2020 29,560 - 29,560 - 29,560 24,830 4,730
8419T-98K01 - Road and concurrent works on
Dillane Dr. - north limit to Proctor Road2020 80,855 - 80,855 - 80,855 67,918 12,937
84
19T-06K07 - Sidewalk - East side of Keele
Street, from entrance to the plan, north
connecting to existing sidewalk at Elizabeth
Grove
2020 137,000 - 137,000 - 137,000 115,080 21,920
85 Reserve Fund Adjustment Reserve - - - 5,014,095 (5,014,095) (4,211,840) (802,255)
Total 160,271,762 59,192,300 - 101,079,462 22,137,095 18,025,000 60,917,367 51,170,588 9,746,779
Infrastructure Costs Included in the Development Charges Calculation
Increased Service Needs Attributable to
Anticipated DevelopmentTiming
(year)
Gross Capital
Cost
Estimate
(2020$)
Post Period
Benefit
Other
Deductions
Net Capital
Cost
Benefit to
Existing
Development
Grants, Subsidies
and Other
Contributions
Attributable to New
Development
Total
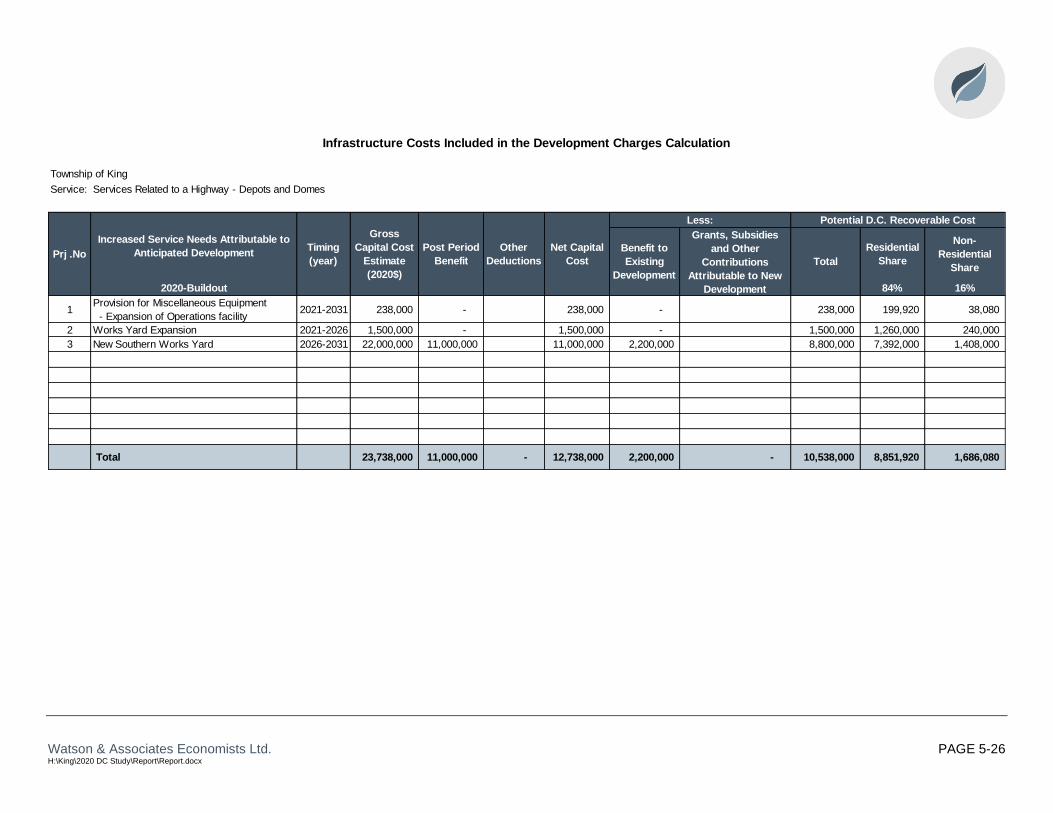
Watson & Associates Economists Ltd. PAGE 5-26 H:\King\2020 DC Study\Report\Report.docx
Infrastructure Costs Included in the Development Charges Calculation
Township of King
Service: Services Related to a Highway - Depots and Domes
Less: Potential D.C. Recoverable Cost
Prj .NoResidential
Share
Non-
Residential
Share
2020-Buildout 84% 16%
1Provision for Miscellaneous Equipment
- Expansion of Operations facility2021-2031 238,000 - 238,000 - 238,000 199,920 38,080
2 Works Yard Expansion 2021-2026 1,500,000 - 1,500,000 - 1,500,000 1,260,000 240,000
3 New Southern Works Yard 2026-2031 22,000,000 11,000,000 11,000,000 2,200,000 8,800,000 7,392,000 1,408,000
Total 23,738,000 11,000,000 - 12,738,000 2,200,000 - 10,538,000 8,851,920 1,686,080
Increased Service Needs Attributable to
Anticipated DevelopmentTiming
(year)
Gross
Capital Cost
Estimate
(2020$)
Post Period
Benefit
Other
Deductions
Net Capital
Cost
Benefit to
Existing
Development
Grants, Subsidies
and Other
Contributions
Attributable to New
Development
Total

Watson & Associates Economists Ltd. PAGE 5-27 H:\King\2020 DC Study\Report\Report.docx
Infrastructure Costs Included in the Development Charges Calculation
Township of King
Service: Services Related to a Highway - Roads and Related Vehicles
Less: Potential D.C. Recoverable Cost
Prj .NoResidential
Share
Non-
Residential
Share
2020-Buildout 84% 16%
1 Tandem Axle and Plow 2021-2024 375,000 - 375,000 - 375,000 315,000 60,000
2 Tandem Axle and Plow 2024-2028 375,000 - 375,000 - 375,000 315,000 60,000
3 Provision for (2) Additional Vehicles 2021-2031 150,000 - 150,000 - 150,000 126,000 24,000
4 Provision for Contracted Vehicles* 2021-2031 200,000 - 200,000 - 200,000 168,000 32,000
5 3/4 Ton Pick Up (4x4) 2023 80,000 - 80,000 - 80,000 67,200 12,800
6 3/4 Ton Pick Up (4x4) 2023 80,000 - 80,000 - 80,000 67,200 12,800
7 Aerial Bucket Truck 2025 260,000 - 260,000 - 260,000 218,400 41,600
Total 1,520,000 - - 1,520,000 - - 1,520,000 1,276,800 243,200
*Note: contracted vehicles include street sweeping, plowing, sidewalk plowing, etc.
Increased Service Needs Attributable to
Anticipated DevelopmentTiming
(year)
Gross
Capital
Cost
Estimate
(2020$)
Post Period
Benefit
Other
Deductions
Net Capital
Cost
Benefit to
Existing
Development
Grants, Subsidies
and Other
Contributions
Attributable to New
Development
Total
Watson & Associates Economists Ltd. PAGE 5-28 H:\King\2020 DC Study\Report\Report.docx
5.3.2 Fire Protection Services
The Township currently operates its fire services from three stations with a combined
square footage of 28,404 sq.ft.. Over the historical 10-year period, the per capita
average level of service was 1.25 sq.ft. or $581 per capita. This level of service
provides the Township with a maximum D.C.-eligible amount for recovery over the
forecast period of $5,589,863.
The Fire Department has a current inventory of 24 vehicles. The historical 10-year level
of service equates to a level of investment of $411 per capita which translates into a
D.C.-eligible amount of $3,949,886.
In addition to the vehicles, the Township also provides 734 items of equipment and gear
for use in the fire services. This results in a calculated average level of service for the
historical 10-year period of $81 per capita, providing for a D.C.-eligible amount over the
forecast period of $777,596 for small equipment and gear.
Based on the above, the maximum D.C.-eligible amount for recovery over the buildout
forecast period for fire services is $10,317,345.
In order to service the forecast population, the Township has identified several projects
for inclusion into the D.C. These include expansions to current fire facilities, new
vehicles and equipment, additional turnout gear and breathing apparatus for new fire
fighters, and other provisions for fire prevention. The gross capital cost for these
projects is $6,418,000. A benefit to existing deduction of $250,000 has been made to
recognize the upgrades to existing vehicles. A $750,000 deduction to recognize the
benefit of these works for future growth has also been applied. Finally, the existing
reserve fund balance of $1,198,427 has been considered as well. Therefore, the net
growth-related capital cost of $4,219,573 has been included in the calculations.
These costs are shared between residential and non-residential based on the
population to employment ratio over the forecast period, resulting in 84% being
allocated to residential development and 16% being allocated to non-residential
development.
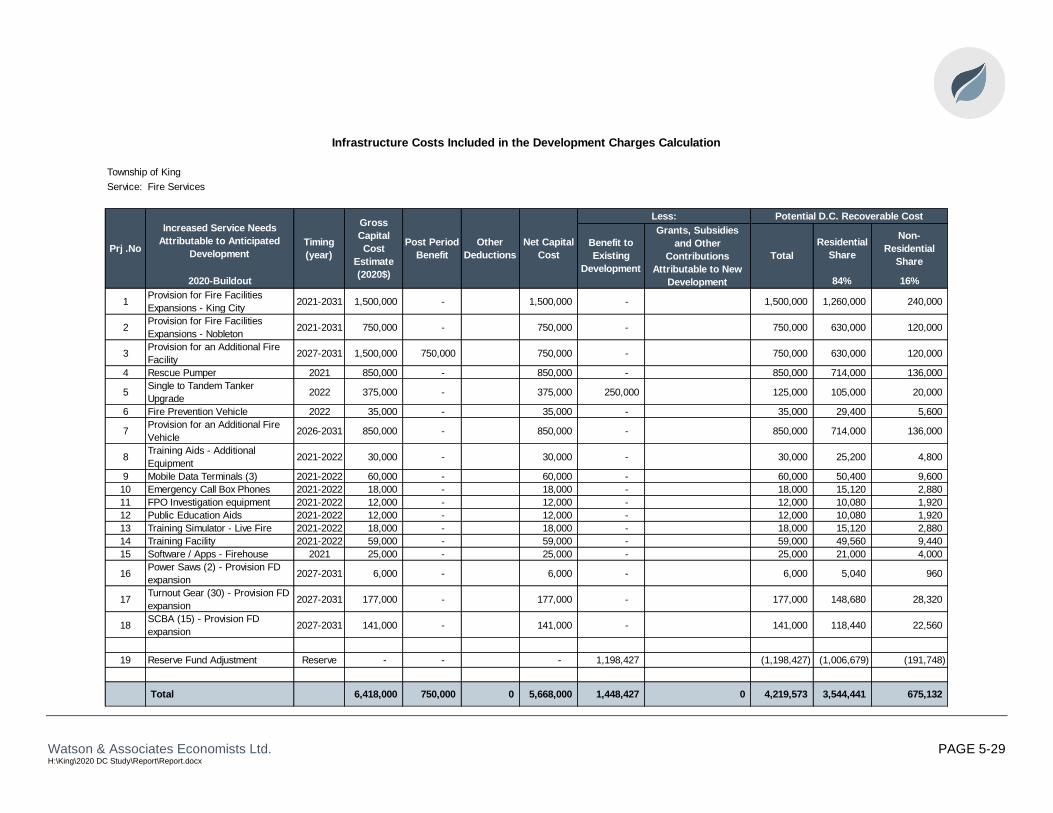
Watson & Associates Economists Ltd. PAGE 5-29 H:\King\2020 DC Study\Report\Report.docx
Infrastructure Costs Included in the Development Charges Calculation
Township of King
Service: Fire Services
Less: Potential D.C. Recoverable Cost
Prj .NoResidential
Share
Non-
Residential
Share
2020-Buildout 84% 16%
1Provision for Fire Facilities
Expansions - King City2021-2031 1,500,000 - 1,500,000 - 1,500,000 1,260,000 240,000
2Provision for Fire Facilities
Expansions - Nobleton2021-2031 750,000 - 750,000 - 750,000 630,000 120,000
3Provision for an Additional Fire
Facility2027-2031 1,500,000 750,000 750,000 - 750,000 630,000 120,000
4 Rescue Pumper 2021 850,000 - 850,000 - 850,000 714,000 136,000
5Single to Tandem Tanker
Upgrade2022 375,000 - 375,000 250,000 125,000 105,000 20,000
6 Fire Prevention Vehicle 2022 35,000 - 35,000 - 35,000 29,400 5,600
7Provision for an Additional Fire
Vehicle2026-2031 850,000 - 850,000 - 850,000 714,000 136,000
8Training Aids - Additional
Equipment2021-2022 30,000 - 30,000 - 30,000 25,200 4,800
9 Mobile Data Terminals (3) 2021-2022 60,000 - 60,000 - 60,000 50,400 9,600
10 Emergency Call Box Phones 2021-2022 18,000 - 18,000 - 18,000 15,120 2,880
11 FPO Investigation equipment 2021-2022 12,000 - 12,000 - 12,000 10,080 1,920
12 Public Education Aids 2021-2022 12,000 - 12,000 - 12,000 10,080 1,920
13 Training Simulator - Live Fire 2021-2022 18,000 - 18,000 - 18,000 15,120 2,880
14 Training Facility 2021-2022 59,000 - 59,000 - 59,000 49,560 9,440
15 Software / Apps - Firehouse 2021 25,000 - 25,000 - 25,000 21,000 4,000
16Power Saws (2) - Provision FD
expansion2027-2031 6,000 - 6,000 - 6,000 5,040 960
17Turnout Gear (30) - Provision FD
expansion2027-2031 177,000 - 177,000 - 177,000 148,680 28,320
18SCBA (15) - Provision FD
expansion2027-2031 141,000 - 141,000 - 141,000 118,440 22,560
19 Reserve Fund Adjustment Reserve - - - 1,198,427 (1,198,427) (1,006,679) (191,748)
Total 6,418,000 750,000 0 5,668,000 1,448,427 0 4,219,573 3,544,441 675,132
Post Period
Benefit
Other
Deductions
Net Capital
Cost
Gross
Capital
Cost
Estimate
(2020$)
Benefit to
Existing
Development
Grants, Subsidies
and Other
Contributions
Attributable to New
Development
Total
Increased Service Needs
Attributable to Anticipated
Development
Timing
(year)

Watson & Associates Economists Ltd. PAGE 5-30 H:\King\2020 DC Study\Report\Report.docx
5.4 Service Levels and Urban Specific Buildout Capital Costs for King’s D.C. Calculation
This section evaluates the development-related capital requirements for those services
and classes of services with urban Buildout capital costs.
5.4.1 Stormwater Services
Historically, the Township has not included a D.C. for stormwater as the works
undertaken by developers provided the requirements of this service. However, due to
the growth experienced within the Township, the stormwater infrastructure needs to be
upgraded in order to meet the increasing capacity requirements.
Therefore, the Township has identified several growth-related capital projects related to
its stormwater. These projects include intensification upgrades for the areas of King
City, Nobleton, and Schomberg. Additionally, Stormwater Master Plans have also been
identified in order to determine the stormwater needs into the future. The total gross
capital cost related to these projects is approximately $1,650,000.
Deductions in the amount of $75,000 to recognize the master plan’s benefit to the
existing community have been made. This provides for a net D.C.-eligible amount of
$1,575,000 to be recovered from D.C.s.
These costs are shared between residential and non-residential based on the population to employment ratio over the urban buildout forecast period, resulting in 85% being allocated to residential development and 15% being allocated to non-residential development.

Watson & Associates Economists Ltd. PAGE 5-31 H:\King\2020 DC Study\Report\Report.docx
Infrastructure Costs Included in the Development Charges Calculation
Township of King
Service: Stormwater
Residential
Share
Non-
Residential
Share
Urban Buildout 85% 15%
1
King City
- Storm Water Management
Intensification Upgrades
2021-2031 500,000 - 500,000 - 500,000 425,000 75,000
2
Nobleton
- Storm Water Management
Intensification Upgrades
2021-2031 500,000 - 500,000 - 500,000 425,000 75,000
3
Schomberg
- Storm Water Management
Intensification Upgrades
2021-2031 500,000 - 500,000 - 500,000 425,000 75,000
4Stormwater Management
Master Plan Update2021 75,000 - 75,000 37,500 37,500 31,875 5,625
5Stormwater Management
Master Plan Update2024 75,000 - 75,000 37,500 37,500 31,875 5,625
Total 1,650,000 - - 1,650,000 75,000 - 1,575,000 1,338,750 236,250
Prj.No
Increased Service Needs
Attributable to Anticipated
Development
Timing
(year)
Gross
Capital
Cost
Estimate
(2020$)
Post Period
Benefit
Other
Deductions
Net Capital
Cost
Benefit to
Existing
Development
Grants, Subsidies
and Other
Contributions
Attributable to New
Development
Total
Less: Potential D.C. Recoverable Cost

Watson & Associates Economists Ltd. PAGE 5-32 H:\King\2020 DC Study\Report\Report.docx
5.4.2 Water & Wastewater Studies and Capital Improvements
The Township has separated the studies related to water & wastewater works and other
capital improvements to ensure that the corresponding D.C. for these types of studies is
only recovered from future serviced development areas. The studies included in the
D.C. calculations are for the water and wastewater master plan (both full and updates)
that the Township undertakes every few years, as well as a DMA Implementation study
and growth capacity modelling. The total cost identified at this time is $1,350,000.
Additionally, capital improvements related to the wastewater system has also been
included at a total cost of $250,000. Therefore, the total gross costs for the above is
$1,600,000.
Deductions in the amounts of $225,000 for existing benefit and $107,202 for the existing
reserve fund balance has been made. This provides for a net D.C.-eligible amount of
$1,267,798 to be recovered from D.C.s.
These costs are shared between residential and non-residential based on the
population to employment ratio over the urban buildout forecast period, resulting in 85%
being allocated to residential development and 15% being allocated to non-residential
development.

Watson & Associates Economists Ltd. PAGE 5-33 H:\King\2020 DC Study\Report\Report.docx
Infrastructure Costs Included in the Development Charges Calculation
Township of King
Class of Service: Water & Wastewater Studies & Capital Improvements
CategoryResidential
Share
Non-
Residential
Share
Urban Buildout 85% 15%
1A Water and Wastewater Master Plan Water Services 2020 225,000 - 225,000 - 225,000 191,250 33,750
1B Water and Wastewater Master Plan Wastewater Services 2020 225,000 - 225,000 - 225,000 191,250 33,750
2AWater and Wastewater Master Plan -
UpdateWater Services 2024 50,000 - 50,000 - 50,000 42,500 7,500
2BWater and Wastewater Master Plan -
UpdateWastewater Services 2024 50,000 - 50,000 - 50,000 42,500 7,500
3A Water and Wastewater Master Plan Water Services 2028 225,000 - 225,000 - 225,000 191,250 33,750
3B Water and Wastewater Master Plan Wastewater Services 2028 225,000 - 225,000 - 225,000 191,250 33,750
4A DMA Implementation Study Water Services 2022 62,500 - 62,500 37,500 25,000 21,250 3,750
4B DMA Implementation Study Wastewater Services 2022 62,500 - 62,500 37,500 25,000 21,250 3,750
5
Pumping Station Communciations
and Base Station Equipment and
SCADA system
Wastewater Services 2026-2028 250,000 - 250,000 150,000 100,000 85,000 15,000
6AWater-Wastewater Master Plan and
Growth Capacity ModellingWater Services 2021 112,500 - 112,500 - 112,500 95,625 16,875
6BWater-Wastewater Master Plan and
Growth Capacity ModellingWastewater Services 2021 112,500 - 112,500 - 112,500 95,625 16,875
7 Reserve Fund Adjustment Reserve - - - 107,202 (107,202) (91,122) (16,080)
Total 1,600,000 - - 1,600,000 332,202 - 1,267,798 1,077,628 190,170
Prj.No
Increased Service Needs
Attributable to Anticipated
Development
Timing
(year)
Gross
Capital
Cost
Estimate
(2020$)
Post Period
Benefit
Other
Deductions
Net Capital
Cost
Benefit to
Existing
Development
Grants, Subsidies
and Other
Contributions
Attributable to New
Development
Total
Less: Potential D.C. Recoverable Cost

Watson & Associates Economists Ltd. PAGE 5-34 H:\King\2020 DC Study\Report\Report.docx
5.4.3 Water Services
The Township has identified several growth-related capital projects related to its water
services. These projects include new watermains and replacement of existing mains
with upsized mains in order to service growth for the areas of King City, Nobleton, and
Schomberg. Additionally, projects related to the Township’s Spine Servicing
Agreements have also been included, along with and outstanding D.C. credits for works
to be constructed by developers. The total gross capital cost related to these projects is
approximately $13.47 million.
Deductions in the amounts of $1.51 million to recognize the benefit to the existing
community and $652,867 for the existing reserve fund balance have been made. This
provides for a net D.C.-eligible amount of $11,312,450 to be recovered from D.C.s.
These costs are shared between residential and non-residential based on the
population to employment ratio over the urban buildout forecast period, resulting in 85%
being allocated to residential development and 15% being allocated to non-residential
development.

Watson & Associates Economists Ltd. PAGE 5-35 H:\King\2020 DC Study\Report\Report.docx
Infrastructure Costs Included in the Development Charges Calculation
Township of King
Service: Water Distribution
Residential
Share
Non-
Residential
Share
Urban Buildout 85% 15%
Nobleton:
1
Highway #27
- Well #4 - Oliver Emmerson (Tribute)
300mm
2024 252,300 - 252,300 25,230 227,070 193,010 34,061
King City: -
2
Keele Street
- Norman Drive to 15th SR
(increase existing 250mm to 300mm+)
2027 1,868,500 - 1,868,500 934,250 934,250 794,113 140,138
3Jane Street
- King Road 1,000 meters North2028 1,681,700 - 1,681,700 - 1,681,700 1,429,445 252,255
4Jane Street
- King Road 1,000 meters South2028 1,681,700 - 1,681,700 - 1,681,700 1,429,445 252,255
Schomberg: -
5 Highway #27, Main St to Dr. Kay
(upsizing 250mm to 300mm)
2028 1,093,100 - 1,093,100 546,550 546,550 464,568 81,983
Spine Servicing
615th SR Keele to Dufferin
- (Seneca and KEG) 300mm2021-2022 3,084,433 - 3,084,433 - 3,084,433 2,621,768 462,665
7
Dufferin St
- Railway Crossing to 15th SR
(Seneca and KEG, CDS) 300mm
2021-2022 2,382,037 - 2,382,037 - 2,382,037 2,024,731 357,306
8Tawes Trail Ext.
- Keele to End (KEG) 300mm2021-2022 374,102 - 374,102 - 374,102 317,987 56,115
9Watermain – Keele St w/s - 15th to existing
termination2021-2022 117,800 - 117,800 - 117,800 100,130 17,670
Prj.No
Increased Service Needs Attributable to
Anticipated DevelopmentTiming
(year)
Gross
Capital Cost
Estimate
(2020$)
Post Period
Benefit
Other
Deductions
Net Capital
Cost
Benefit to
Existing
Development
Grants, Subsidies
and Other
Contributions
Attributable to New
Development
Total
Less: Potential D.C. Recoverable Cost

Watson & Associates Economists Ltd. PAGE 5-36 H:\King\2020 DC Study\Report\Report.docx
Infrastructure Costs Included in the Development Charges Calculation
Township of King
Service: Water Distribution
Residential
Share
Non-
Residential
Share
Urban Buildout 85% 15%
Outstanding DC Credits
11 19T-08K02 - King Road - Charles to Jane Credit 935,675 - 935,675 - 935,675 795,324 140,351
12 Reserve Fund Adjustment Reserve - - - 652,867 (652,867) (554,937) (97,930)
Total 13,471,347 - - 13,471,347 2,158,897 - 11,312,450 9,615,583 1,696,868
Prj.No
Increased Service Needs Attributable to
Anticipated DevelopmentTiming
(year)
Gross
Capital Cost
Estimate
(2020$)
Post Period
Benefit
Other
Deductions
Net Capital
Cost
Benefit to
Existing
Development
Grants, Subsidies
and Other
Contributions
Attributable to New
Development
Total
Less: Potential D.C. Recoverable Cost

Watson & Associates Economists Ltd. PAGE 5-37 H:\King\2020 DC Study\Report\Report.docx
5.5 Service Levels and Area-Specific Buildout Capital Costs for King’s D.C. Calculation
This section evaluates the development-related capital requirements for area specific
D.C.s for wastewater services over the urban community plan buildout forecast for the
areas of Nobleton and King City.
5.5.1 Wastewater Services – Nobleton
Currently, the Township of King is collecting an area-specific development charge for
wastewater in the Nobleton Area. The Township intends to continue with the area-
specific charge in the Nobleton Area.
The Township has identified growth-related wastewater capital projects related to
Nobleton. These projects include new sewer mains along several streets and sewer
upgrades as identified in the Township’s 2020 Water and Wastewater Master Plan.
Additionally, D.C. credits for works to be constructed by developers and the reserve
fund deficit have also been included. The total gross capital cost related to these
projects is approximately $6.93 million.
Deductions in the amount of $1.16 million to recognize the benefit to the existing
community have been made. This provides for a net D.C.-eligible amount of $5,773,383
to be recovered from D.C.s.
The allocation between residential and non-residential growth is calculated based on
the anticipated flows as identified in the Nobleton Servicing Study, resulting in 95.3% of
the costs to be borne by residential development and 4.7% to be borne by non-
residential development.

Watson & Associates Economists Ltd. PAGE 5-38 H:\King\2020 DC Study\Report\Report.docx
Infrastructure Costs Included in the Development Charges Calculation
Township of King
Service: Wastewater - Nobleton
Residential
Share
Non-
Residential
Share
2020-Buildout - Nobleton 95.3% 4.7%
1Holden Drive 115 m North of
MacTaggart Drive to Sheardown Drive2022 1,042,100 - 1,042,100 708,628 333,472 317,799 15,673
2Chamberlain Court
- Sheardown Drive Cul-de-Sac2021 246,300 - 246,300 167,484 78,816 75,112 3,704
3 Easement Chamberlain Court to Hwy #27 2021 215,300 - 215,300 146,404 68,896 65,658 3,238
4 Gilbert Fuller Drive Cul-de-Sac Road bend 2024 95,200 - 95,200 - 95,200 90,726 4,474
5Woodhill Avenue
Cul-de-Sac to Gilbert Fuller Dr2024 155,800 - 155,800 15,580 140,220 133,630 6,590
6Gilbert Fuller Drive
to Woodhill Avenue Road bend2024 286,700 - 286,700 28,670 258,030 245,903 12,127
7Easement Gilbert Fuller Drive
to Pumping Station2024 295,000 - 295,000 9,440 285,560 272,139 13,421
8Hawthorne Valley Rd
Cul-de-Sac to Woodhill Avenue2024 792,300 - 792,300 79,230 713,070 679,556 33,514
From Master Plan
9King Road and Hwy 27 Sewer Upgrade
(WW-N-1)2022 1,701,000 - 1,701,000 - 1,701,000 1,621,053 79,947
10 Wellar Avenue Sewer Upgrade (WW-N-2) 2022 1,691,000 - 1,691,000 - 1,691,000 1,611,523 79,477
Outstanding DC Credits
1119T-05K03 - Road and concurrent works
- Noblewood Drive & Hollywood CresCredit 88,986 - 88,986 - 88,986 84,804 4,182
12 Reserve Fund Adjustment Reserve 319,133 - 319,133 - 319,133 304,134 14,999
Total 6,928,819 - - 6,928,819 1,155,436 - 5,773,383 5,502,034 271,349
Prj.No
Increased Service Needs Attributable to
Anticipated DevelopmentTiming
(year)
Gross
Capital
Cost
Estimate
(2020$)
Post Period
Benefit
Other
Deductions
Net Capital
Cost
Less:
Benefit to
Existing
Development
Grants, Subsidies
and Other
Contributions
Attributable to New
Development
Total
Potential D.C. Recoverable Cost
Watson & Associates Economists Ltd. PAGE 5-39 H:\King\2020 DC Study\Report\Report.docx
5.5.2 Wastewater Services – King City
Similar to Nobleton, the Township of King also collects an area-specific development
charge for wastewater in the King City Area and intends to continue this practice.
The Township has identified growth-related wastewater capital projects related to King
City. These projects include new pumping station and a sewer upgrade (as described in
the Township’s 2020 Water and Wastewater Master Plan). Additionally, a pumping
station related to the Township’s Spine Servicing Agreements have also been included.
The total gross capital cost related to these projects is approximately $12.23 million.
Deductions in the amounts of $245,000 to recognize the benefit to the existing
community and $2,060,903 for the existing reserve fund balance have been made. This
provides for a net D.C.-eligible amount of $9,924,007 to be recovered from D.C.s.
The allocation between residential and non-residential growth is calculated based on
the results of the “King City Sanitary Sewer Financial Analysis” Report, resulting in
92.3% of the costs to be borne by residential development and 7.7% to be borne by
non-residential development.

Watson & Associates Economists Ltd. PAGE 5-40 H:\King\2020 DC Study\Report\Report.docx
Infrastructure Costs Included in the Development Charges Calculation
Township of King
Service: Wastewater - King City
Residential
Share
Non-
Residential
Share
2020-Buildout - King City 92.3% 7.7%
1Pumping Station A - West
- Genview2022 4,900,000 - 4,900,000 245,000 4,655,000 4,296,565 358,435
2King Road and Keele Street Sewer Upgrade
(WW-K-1)2021 1,701,000 - 1,701,000 - 1,701,000 1,570,023 130,977
Spine Services
3Pumping Station B (East)
- King East Group 2022 5,628,910 - 5,628,910 - 5,628,910 5,195,484 433,426
4 Reserve Fund Adjustment Reserve - - - 2,060,903 (2,060,903) (1,902,213) (158,690)
Total 12,229,910 - - 12,229,910 2,305,903 - 9,924,007 9,159,858 764,149
Increased Service Needs Attributable to
Anticipated DevelopmentTiming
(year)
Gross
Capital Cost
Estimate
(2020$)
Post Period
Benefit
Other
Deductions
Net Capital
Cost
Benefit to
Existing
Development
Grants, Subsidies
and Other
Contributions
Attributable to New
Development
Total
Less: Potential D.C. Recoverable Cost
Prj.No


Watson & Associates Economists Ltd. H:\King\2020 DC Study\Report\Report.docx
Chapter 6 D.C. Calculation


Watson & Associates Economists Ltd. PAGE 6-1 H:\King\2020 DC Study\Report\Report.docx
6. D.C. Calculation
Table 6-1 calculates the proposed urban service area to be imposed for water services,
stormwater drainage and control services, and water & wastewater studies/capital
improvements in the urban services areas over the urban buildout forecast period.
Table 6-2 calculates the proposed area-specific D.C. forecast for wastewater services in
the King City area (over the King City urban buildout forecast period). Table 6-3
calculates the proposed area-specific D.C. forecast for wastewater services in the
Nobleton area (over the Nobleton urban buildout forecast period). Table 6-4 calculates
the uniform D.C. to be imposed on anticipated development in the Township for
Township-wide services over the buildout planning horizon. Table 6-5 calculates the
proposed uniform D.C. to be imposed on anticipated development in the Township for
Township-wide services and classes over a 10-year planning horizon
The calculation for residential development is generated on a per capita basis and is
based upon four forms of housing types (singles and semi-detached, multiples, large
apartments (700 sq.ft. and larger), small apartments (less than 700 sq.ft.), and special
care/special dwellings). The non-residential D.C. has been calculated on a per sq.ft. of
gross floor area basis for all types of non-residential development (industrial,
commercial, and institutional).
The D.C.-eligible costs for each service component were developed in Chapter 5 for all
Township services, based on their proposed capital programs.
For the residential calculations, the total cost is divided by the “gross” (new resident)
population to determine the per capita amount. The eligible D.C. cost calculations set
out in Chapter 5 are based on the net anticipated population increase (the forecast new
unit population less the anticipated decline in existing units). The cost per capita is then
multiplied by the average occupancy of the new units (Appendix A, Schedule 5) to
calculate the charge in Tables 6-1, 6-2, 6-3, 6-4 and 6-5.
With respect to non-residential development, the total costs in the uniform charge
allocated to non-residential development (based on need for service) have been divided
by the anticipated development over the planning period to calculate a cost per sq.ft. of
gross floor area.

Watson & Associates Economists Ltd. PAGE 6-2 H:\King\2020 DC Study\Report\Report.docx
Table 6-6 summarizes the total D.C. that is applicable for the Township and Table 6-7
summarizes the gross capital expenditures and sources of revenue for works to be
undertaken during the 5-year life of the by-law.

Watson & Associates Economists Ltd. PAGE 6-3 H:\King\2020 DC Study\Report\Report.docx
Table 6-1 Township of King D.C. Calculation
Township-wide Services 2020-Urban Buildout
2020$ D.C.-Eligible Cost 2020$ D.C.-Eligible Cost
SERVICE/CLASS OF SERVICE Residential Non-Residential S.D.U. per sq.ft.
$ $ $ $
1. Water & Wastewater Studies and Capital Improvements
1.1 Water Services 499,628 88,170 145 0.07
1.2 Wastewater Services 578,001 102,000 168 0.08
1,077,628 190,170 313 0.15
2. Stormwater Services
2.1 Channels, drainage and ponds 1,338,750 236,250 388 0.20
3. Water Services
3.1 Distribution systems 9,615,583 1,696,868 2,788 1.41
TOTAL 12,031,961 2,123,287 3,489 1.76
D.C.-Eligible Capital Cost $12,031,961 $2,123,287
Urban Buildout Gross Population/GFA Growth (sq.ft.) 11,994 1,208,700
Cost Per Capita/Non-Residential GFA (sq.ft.) $1,003 $1.76
By Residential Unit Type P.P.U.
Single and Semi-Detached Dwelling 3.478 $3,489
Large Apartments 2.184 $2,191
Small Apartments 1.496 $1,501
Multiples 2.946 $2,955
Special Care/Special Dwelling Units 1.100 $1,103

Watson & Associates Economists Ltd. PAGE 6-4 H:\King\2020 DC Study\Report\Report.docx
Table 6-2 Township of King D.C. Calculation
Area-Specific Services (Wastewater Services – King City) 2020-Urban Buildout (King City)
2020$ D.C.-Eligible Cost 2020$ D.C.-Eligible Cost
SERVICE Residential Non-Residential S.D.U. per sq.ft.
$ $ $ $
4. Wastewater Services - King City
4.1 Sewers 9,159,858 764,149 4,186 1.48
TOTAL $9,159,858 $764,149 $4,186 1.48
D.C.-Eligible Capital Cost 9,159,858 $764,149
King City Buildout Gross Population/GFA Growth (sq.ft.) 7,611 517,700
Cost Per Capita/Non-Residential GFA (sq.ft.) $1,204 $1.48
By Residential Unit Type P.P.U.
Single and Semi-Detached Dwelling 3.478 $4,186
Large Apartments 2.184 $2,628
Small Apartments 1.496 $1,800
Multiples 2.946 $3,546
Special Care/Special Dwelling Units 1.100 $1,324

Watson & Associates Economists Ltd. PAGE 6-5 H:\King\2020 DC Study\Report\Report.docx
Table 6-3 Township of King D.C. Calculation
Area-Specific Services (Wastewater Services – Nobleton) 2020-Urban Buildout (Nobleton)
2020$ D.C.-Eligible Cost 2020$ D.C.-Eligible Cost
SERVICE Residential Non-Residential S.D.U. per sq.ft.
$ $ $ $
5. Wastewater Services - Nobleton
5.1 Sewers 5,502,034 271,349 4,681 0.43
TOTAL $5,502,034 $271,349 $4,681 0.43
D.C.-Eligible Capital Cost 5,502,034 $271,349
Nobleton Buildout Gross Population/GFA Growth (sq.ft.) 4,088 626,000
Cost Per Capita/Non-Residential GFA (sq.ft.) $1,346 $0.43
By Residential Unit Type P.P.U.
Single and Semi-Detached Dwelling 3.478 $4,681
Large Apartments 2.184 $2,939
Small Apartments 1.496 $2,013
Multiples 2.946 $3,965
Special Care/Special Dwelling Units 1.100 $1,480

Watson & Associates Economists Ltd. PAGE 6-6 H:\King\2020 DC Study\Report\Report.docx
Table 6-4 Township of King D.C. Calculation
Township-wide Services 2020-Buildout
2020$ D.C.-Eligible Cost 2020$ D.C.-Eligible Cost
SERVICE Residential Non-Residential S.D.U. per sq.ft.
$ $ $ $
6. Services Related to a Highway
6.1 Roads 51,170,588 9,746,779 14,045 7.27
6.2 Depots and Domes 8,851,920 1,686,080 2,429 1.26
6.3 PW Rolling Stock 1,276,800 243,200 350 0.18
61,299,308 11,676,059 16,824 8.71
7. Fire Protection Services
7.1 Fire facilities, vehicles & equipment 3,544,441 675,132 973 0.50
3,544,441 675,132 973 0.50
TOTAL $64,843,750 $12,351,190 $17,797 $9.21
D.C.-Eligible Capital Cost $64,843,750 $12,351,190
Buildout Gross Population/GFA Growth (sq.ft.) 12,672 1,340,700
Cost Per Capita/Non-Residential GFA (sq.ft.) $5,117 $9.21
By Residential Unit Type P.P.U.
Single and Semi-Detached Dwelling 3.478 $17,797
Large Apartments 2.184 $11,176
Small Apartments 1.496 $7,655
Multiples 2.946 $15,075
Special Care/Special Dwelling Units 1.100 $5,629

Watson & Associates Economists Ltd. PAGE 6-7 H:\King\2020 DC Study\Report\Report.docx
Table 6-5 Township of King D.C. Calculation
Township-wide Services 2020-2029
2020$ D.C.-Eligible Cost 2020$ D.C.-Eligible Cost
SERVICE/CLASS OF SERVICE Residential Non-Residential S.D.U. per sq.ft.
$ $ $ $
8. Parks and Recreation Services
8.1
31,409,867 1,653,151 11,735 1.63
31,409,867 1,653,151 11,735 1.63
9. Library Services
9.1 Library facilities 3,572,232 188,012 1,335 0.18
9.2 Library materials 617,500 32,500 231 0.03
4,189,732 220,512 1,566 0.21
10. Growth Studies
10.1 Stormwater Drainage and Control Services 28,965 5,517 11 0.01
10.2 Wastewater Services 81,440 15,512 30 0.02
10.3 Water Services 78,289 14,912 29 0.01
10.4 Services Related to a Highway 754,551 143,724 282 0.14
10.5 Fire Protection Services 72,380 13,787 27 0.01
10.6 Parks and Recreation Services 81,832 15,587 31 0.02
10.7 Library Services 130,981 24,949 49 0.02
1,228,438 233,988 459 0.23
TOTAL 36,828,037 $2,107,651 13,760 $2.07
D.C.-Eligible Capital Cost $36,828,037 $2,107,651
10-Year Gross Population/GFA Growth (sq.ft.) 9,309 1,016,500
Cost Per Capita/Non-Residential GFA (sq.ft.) $3,956 $2.07
By Residential Unit Type P.P.U.
Single and Semi-Detached Dwelling 3.478 $13,760
Large Apartments 2.184 $8,640
Small Apartments 1.496 $5,918
Multiples 2.946 $11,655
Special Care/Special Dwelling Units 1.100 $4,352
Parkland development, amenities, trails, recreation facilities,
vehicles & equipment

Watson & Associates Economists Ltd. PAGE 6-8 H:\King\2020 DC Study\Report\Report.docx
Table 6-6 Township of King D.C. Calculation Total All Services
2020$ D.C.-Eligible Cost 2020$ D.C.-Eligible Cost
Residential Non-Residential S.D.U. per sq.ft.
$ $ $ $
Urban-wide Services/Class of Services Buildout 12,031,961 2,123,287 3,489 1.76
Area Specific Services Buildout (King City) 9,159,858 764,149 4,186 1.48
Area Specific Services Buildout (Nobleton) 5,502,034 271,349 4,681 0.43
Township-wide Services Buildout 64,843,750 12,351,190 17,797 9.21
Township-wide Services/Class of Services 10 Year 36,828,037 2,107,651 13,760 2.07
TOTAL TOWNSHIP-WIDE 101,671,786 14,458,842 31,557 11.28
TOTAL KING CITY 122,863,606 17,346,277 39,232 14.52
TOTAL NOBLETON 119,205,781 16,853,478 39,727 13.47
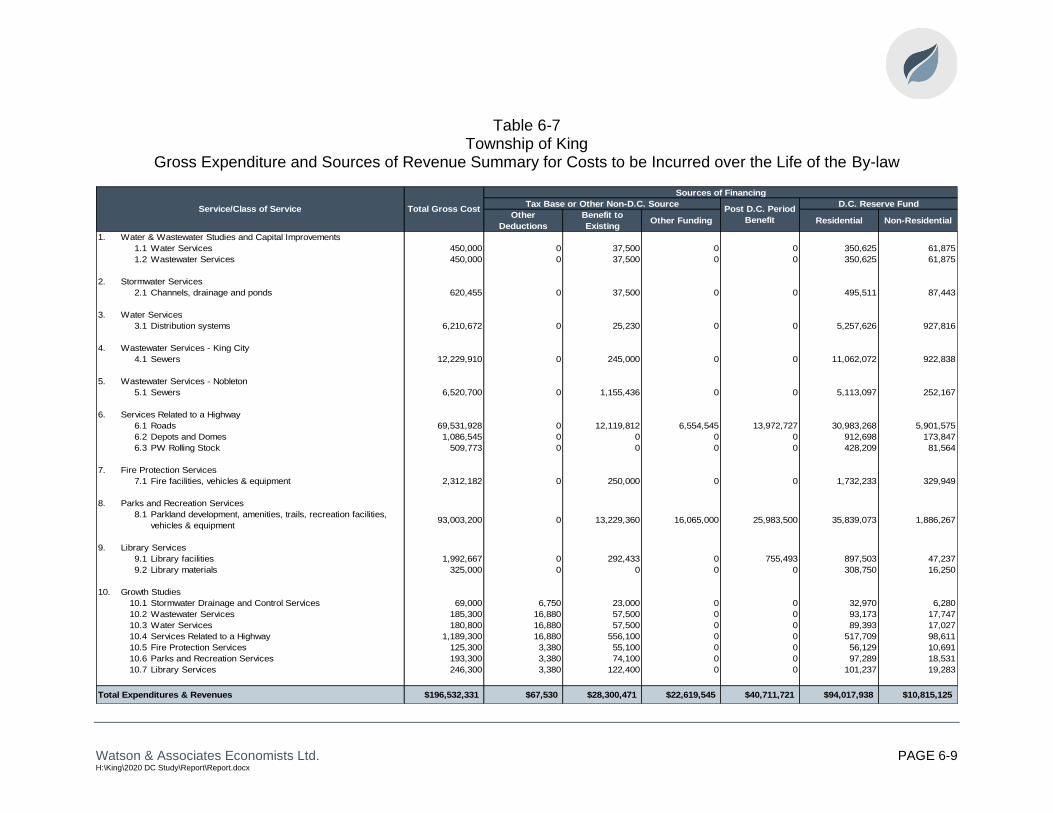
Watson & Associates Economists Ltd. PAGE 6-9 H:\King\2020 DC Study\Report\Report.docx
Table 6-7 Township of King
Gross Expenditure and Sources of Revenue Summary for Costs to be Incurred over the Life of the By-law
Sources of Financing
Tax Base or Other Non-D.C. Source D.C. Reserve Fund
Other
Deductions
Benefit to
ExistingOther Funding Residential Non-Residential
1. Water & Wastewater Studies and Capital Improvements
1.1 Water Services 450,000 0 37,500 0 0 350,625 61,875
1.2 Wastewater Services 450,000 0 37,500 0 0 350,625 61,875
2. Stormwater Services
2.1 Channels, drainage and ponds 620,455 0 37,500 0 0 495,511 87,443
3. Water Services
3.1 Distribution systems 6,210,672 0 25,230 0 0 5,257,626 927,816
4. Wastewater Services - King City
4.1 Sewers 12,229,910 0 245,000 0 0 11,062,072 922,838
5. Wastewater Services - Nobleton
5.1 Sewers 6,520,700 0 1,155,436 0 0 5,113,097 252,167
6. Services Related to a Highway
6.1 Roads 69,531,928 0 12,119,812 6,554,545 13,972,727 30,983,268 5,901,575
6.2 Depots and Domes 1,086,545 0 0 0 0 912,698 173,847
6.3 PW Rolling Stock 509,773 0 0 0 0 428,209 81,564
7. Fire Protection Services
7.1 Fire facilities, vehicles & equipment 2,312,182 0 250,000 0 0 1,732,233 329,949
8. Parks and Recreation Services
8.1 Parkland development, amenities, trails, recreation facilities,
vehicles & equipment93,003,200 0 13,229,360 16,065,000 25,983,500 35,839,073 1,886,267
9. Library Services
9.1 Library facilities 1,992,667 0 292,433 0 755,493 897,503 47,237
9.2 Library materials 325,000 0 0 0 0 308,750 16,250
10. Growth Studies
10.1 Stormwater Drainage and Control Services 69,000 6,750 23,000 0 0 32,970 6,280
10.2 Wastewater Services 185,300 16,880 57,500 0 0 93,173 17,747
10.3 Water Services 180,800 16,880 57,500 0 0 89,393 17,027
10.4 Services Related to a Highway 1,189,300 16,880 556,100 0 0 517,709 98,611
10.5 Fire Protection Services 125,300 3,380 55,100 0 0 56,129 10,691
10.6 Parks and Recreation Services 193,300 3,380 74,100 0 0 97,289 18,531
10.7 Library Services 246,300 3,380 122,400 0 0 101,237 19,283
Total Expenditures & Revenues $196,532,331 $67,530 $28,300,471 $22,619,545 $40,711,721 $94,017,938 $10,815,125
Post D.C. Period
Benefit
Total Gross CostService/Class of Service


Watson & Associates Economists Ltd. H:\King\2020 DC Study\Report\Report.docx
Chapter 7 D.C. Policy Recommendations and D.C. By-law Rules

Watson & Associates Economists Ltd. PAGE 7-1 H:\King\2020 DC Study\Report\Report.docx
7. D.C. Policy Recommendations and D.C. By-law Rules
7.1 Introduction
Subsection 5 (1) 9 states that rules must be developed:
“...to determine if a development charge is payable in any particular case and to determine the amount of the charge, subject to the limitations set out in subsection 6.”
Paragraph 10 of the section goes on to state that the rules may provide for exemptions,
phasing in and/or indexing of D.C.s.
Subsection 5 (6) establishes the following restrictions on the rules:
• the total of all D.C.s that would be imposed on anticipated development must not
exceed the capital costs determined under 5(1) 2-8 for all services involved;
• if the rules expressly identify a type of development, they must not provide for it
to pay D.C.s that exceed the capital costs that arise from the increase in the
need for service for that type of development; however, this requirement does not
relate to any particular development; and
• if the rules provide for a type of development to have a lower D.C. than is
allowed, the rules for determining D.C.s may not provide for any resulting
shortfall to be made up via other development.
With respect to “the rules,” section 6 states that a D.C. by-law must expressly address
the matters referred to above re subsection 5 (1) paragraphs 9 and 10, as well as how
the rules apply to the redevelopment of land.
The rules provided are based on the Township’s existing policies; with consideration for
the updates from Bill 108 and Bill 197.
Watson & Associates Economists Ltd. PAGE 7-2 H:\King\2020 DC Study\Report\Report.docx
7.2 D.C. By-law Structure
It is recommended that:
• classes of services be established for growth studies and water & wastewater
studies/capital improvements;
• the Township uses a uniform Township-wide D.C. calculation for all municipal
services, other than water services, wastewater services, stormwater services
and water & wastewater studies/capital improvements;
• water services, stormwater services, and water & wastewater studies/capital
improvements be imposed on the urban service areas of the Township;
• wastewater services – King City be imposed on the urban service areas of King
City;
• wastewater services – Nobleton be imposed on the urban service areas of
Nobleton; and
• one municipal D.C. by-law be used for all services.
7.3 D.C. By-law Rules
The following subsections set out the recommended rules governing the calculation,
payment and collection of D.C.s in accordance with section 6 of the D.C.A.
It is recommended that the following sections provide the basis for the D.C.s.:
7.3.1 Payment in any Particular Case
In accordance with the D.C.A., subsection 2 (2), a D.C. be calculated, payable and
collected where the development requires one or more of the following:
“(a) the passing of a zoning by-law or of an amendment to a zoning by-law under section 34 of the Planning Act;
(b) the approval of a minor variance under section 45 of the Planning Act;
(c) a conveyance of land to which a by-law passed under subsection 50 (7) of the Planning Act applies;

Watson & Associates Economists Ltd. PAGE 7-3 H:\King\2020 DC Study\Report\Report.docx
(d) the approval of a plan of subdivision under section 51 of the Planning Act;
(e) a consent under section 53 of the Planning Act;
(f) the approval of a description under section 9 of the Condominium Act, 1998; or
(g) the issuing of a permit under the Building Code Act, 1992 in relation to a building or structure.”
7.3.2 Determination of the Amount of the Charge
The following conventions be adopted:
1) Costs allocated to residential uses will be assigned to different types of
residential units based on the average occupancy for each housing type
constructed during the previous decade. Costs allocated to non-residential uses
will be assigned based on the amount of square feet of gross floor area
constructed for eligible uses (i.e. industrial, commercial and institutional).
2) Costs allocated to residential and non-residential uses are based upon a number
of conventions, as may be suited to each municipal circumstance, e.g.
• for parks and recreation services, and library services, a 5% non-residential
attribution has been made to recognize use by the non-residential sector;
• for growth studies, an 84% residential/16% non-residential allocation has
been made based on the anticipated population and employment growth over
the 10-year forecast period;
• for services related to a highway and fire protection services, an 87%
residential/13% non-residential attribution has been made based on a
population vs. employment growth ratio over the buildout forecast period;
• for water services, stormwater services, and water & wastewater
studies/capital improvements, an 85% residential/15% non-residential
attribution has been made based on a population vs. employment growth ratio
over the urban buildout forecast period;
• for King City area specific - wastewater services, a 92.3% residential/7.7%
non-residential attribution has been made based on the findings in the King
City Sanitary Sewer Financial Analysis Report; and
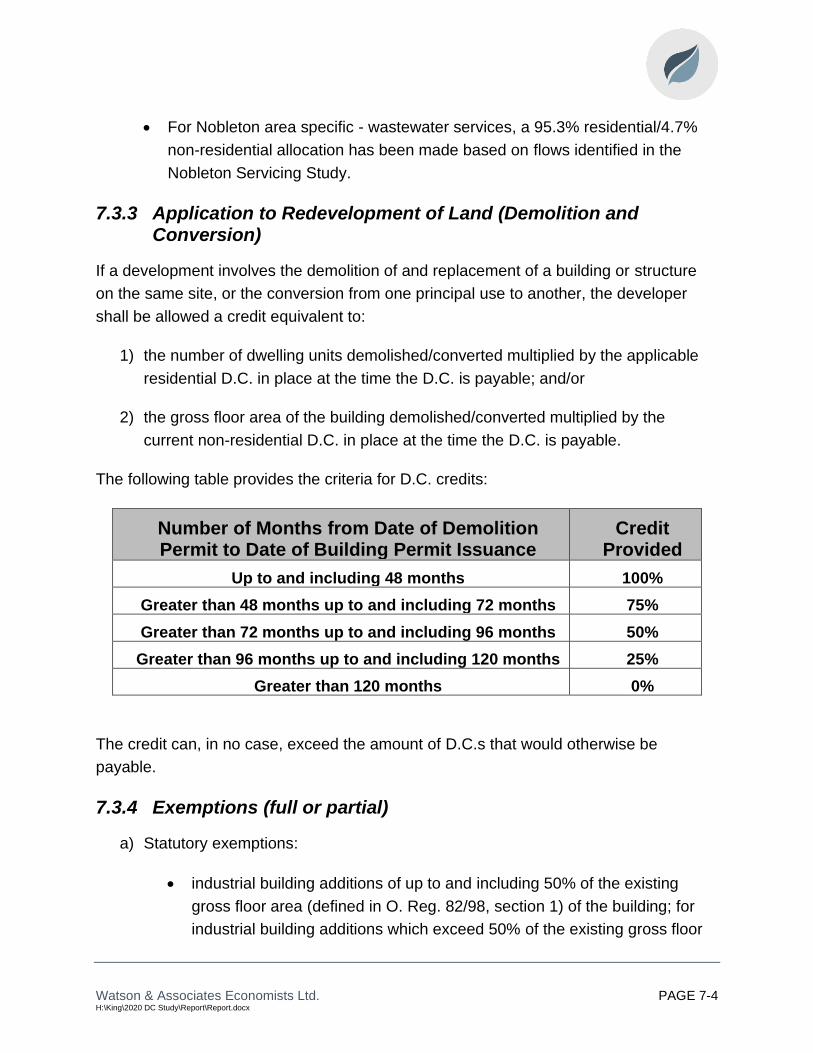
Watson & Associates Economists Ltd. PAGE 7-4 H:\King\2020 DC Study\Report\Report.docx
• For Nobleton area specific - wastewater services, a 95.3% residential/4.7%
non-residential allocation has been made based on flows identified in the
Nobleton Servicing Study.
7.3.3 Application to Redevelopment of Land (Demolition and Conversion)
If a development involves the demolition of and replacement of a building or structure
on the same site, or the conversion from one principal use to another, the developer
shall be allowed a credit equivalent to:
1) the number of dwelling units demolished/converted multiplied by the applicable
residential D.C. in place at the time the D.C. is payable; and/or
2) the gross floor area of the building demolished/converted multiplied by the
current non-residential D.C. in place at the time the D.C. is payable.
The following table provides the criteria for D.C. credits:
Number of Months from Date of Demolition Permit to Date of Building Permit Issuance
Credit Provided
Up to and including 48 months 100%
Greater than 48 months up to and including 72 months 75%
Greater than 72 months up to and including 96 months 50%
Greater than 96 months up to and including 120 months 25%
Greater than 120 months 0%
The credit can, in no case, exceed the amount of D.C.s that would otherwise be
payable.
7.3.4 Exemptions (full or partial)
a) Statutory exemptions:
• industrial building additions of up to and including 50% of the existing
gross floor area (defined in O. Reg. 82/98, section 1) of the building; for
industrial building additions which exceed 50% of the existing gross floor

Watson & Associates Economists Ltd. PAGE 7-5 H:\King\2020 DC Study\Report\Report.docx
area, only the portion of the addition in excess of 50% is subject to D.C.s
(subsection 4 (3) of the D.C.A.);
• buildings or structures owned by and used for the purposes of any
municipality, local board or Board of Education (section 3);
• residential development that results only in the enlargement of an existing
dwelling unit, or that results only in the creation of up to two additional
dwelling units (based on prescribed limits set out in section 2 of O. Reg.
82/98);
• residential development in new dwellings: development that includes the
creation of an additional unit within the dwelling unit (detached, semi-
detached, or row dwelling and based on prescribed limits set out in section
2 of O. Reg. 82/98); and
• residential development of a new dwelling unit (detached, semi-detached,
or row dwelling) would allow for an additional ancillary dwelling unit (based
on prescribed limits set out in section 2 of O. Reg. 82/98)
b) Non-statutory exemptions to be considered by Council:
• Lands or buildings used or to be used for a place of worship or for the
purposes of a cemetery or burial ground exempt from taxation under the
Assessment Act; and
• The development of non-residential agricultural use buildings constructed
for bona fide farm uses.
7.3.5 Phasing in
No provisions for phasing in the D.C. are provided in the D.C. by-law.
7.3.6 Timing of Collection
The D.C.s for all services are payable upon issuance of the first building permit for each
dwelling unit, building, or structure, subject to early or late payment agreements entered
into by the Township and an owner under s.27 of the D.C.A., 1997.
Commencing January 1, 2020, rental housing and institutional developments will pay
D.C.s in six equal annual payments commencing at occupancy. Non-profit housing
developments will pay D.C.s in 21 equal annual payments. Moreover, the D.C. amount
for all developments occurring within 2 years of a Site Plan or Zoning By-law

Watson & Associates Economists Ltd. PAGE 7-6 H:\King\2020 DC Study\Report\Report.docx
Amendment planning approval (for applications submitted after January 1, 2020), shall
be determined based on the D.C. in effect on the day of the Site Plan or Zoning By-law
Amendment application.
Installment payments and payments determined at the time of Site Plan or Zoning
Bylaw Amendment application may be subject to annual interest charges. The
applicable interest rate is provided in the D.C. by-law at a rate of 5% per year.
Subsequent to the passing of the D.C. by-law, staff will conduct a review of appropriate
interest rates and will present a staff report to Council for their consideration.
For the purposes of administering the By-law, the following definitions are provided as
per O. Reg. 454-19:
“Rental Housing” means a Building with four or more Dwelling Units all of which are
intended for use as rented Residential premises;
“Institutional” means lands or Buildings used or designed or intended for use by an
organized body, society or religious group for promoting a public or non-profit purpose
and shall include, but without limiting the generality of the foregoing, places of worship,
and Special Care Facilities;
“Non-profit Housing” means a Building intended for uses as Residential premises by,
a. corporation without share capital to which the Business Corporations Act or the
Canada Not-for-profit Corporations Act applies, that is in good standing under
that Act and whose primary object is to provide housing; or
b. a non-profit housing co-operative that is in good standing under the Co-operative
Corporations Act
A D.C. that is applicable under section 5 of the D.C.A. shall be calculated and payable:
• where a permit is required under the Building Code Act in relation to a building or
structure, the owner shall pay the D.C. prior to the issuance of a permit of prior to
the commencement of development or redevelopment as the case may be; and
• despite the above, Council, from time to time and at any time, may enter into
agreements providing for all or any part of a D.C. to be paid before or after it
would otherwise be payable.

Watson & Associates Economists Ltd. PAGE 7-7 H:\King\2020 DC Study\Report\Report.docx
7.3.7 Indexing
Indexing of the D.C.s shall be implemented on a mandatory basis and adjusted semi-
annually, without amendment to this By-law, on the first day of January and July of each
year, commencing on July 1, 2021, in accordance with the index prescribed in the Act,
in accordance with the Statistics Canada Quarterly, Non-Residential Building
Construction Price Index (Table 18-10-0135-01)1 for the most recent year-over-year
period.
7.3.8 The Applicable Areas
The charges developed herein provide for varying charges within the Township, as
follows:
• Municipal-wide services – the full residential and non-residential charge will be
imposed on all lands within the Township.
• Urban Area Services – Water Services, Stormwater Drainage and Control
Services, and Water & Wastewater Studies/Capital Improvements – the full
residential and non-residential charges will be imposed within the urban areas of
the Township.
• Area Specific services – Nobleton Wastewater Services – the full residential and
non-residential charge will be imposed on the urban service areas of Nobleton;
and
• Area Specific services – King City Wastewater Services – the full residential and
non-residential charge will be imposed on the urban service areas of King City.
1 O. Reg. 82/98 referenced “The Statistics Canada Quarterly, Construction Price
Statistics, catalogue number 62-007” as the index source. Since implementation,
Statistics Canada has modified this index twice and the above-noted index is the most
current. The draft by-law provided herein refers to O. Reg. 82/98 to ensure traceability
should this index continue to be modified over time.

Watson & Associates Economists Ltd. PAGE 7-8 H:\King\2020 DC Study\Report\Report.docx
7.4 Other D.C. By-law Provisions
It is recommended that:
7.4.1 Categories of Services for Reserve Fund and Credit Purposes
The Township’s D.C. collections are currently reserved in eleven separate reserve
funds: services related to a highway, parking, fire protection services, parks services,
recreation services, library services, growth studies, water and wastewater studies,
wastewater services – Nobleton, wastewater services – King City, and water services.
It is recommended that the Township establish a reserve fund for stormwater services.
In addition, parks and recreation reserve funds should be combined into one reserve.
Also, with the changes from Bill 108 and Bill 197, the parking reserve fund must be
transferred into a special account (i.e. a Parking Services C.B.C. reserve) or into the
Township’s General Reserve as it is no longer a D.C. eligible service.
Appendix F outlines the reserve fund policies that the Township is required to follow as
per the D.C.A.
7.4.2 By-law In-force Date
A by-law under the D.C.A. comes into force on the day after which the by-law is passed
by Council.
7.4.3 Minimum Interest Rate Paid on Refunds and Charged for Inter-Reserve Fund Borrowing
The minimum interest rate is the Bank of Canada rate on the day on which the by-law
comes into force (as per section 11 of O. Reg. 82/98).
7.4.4 Area Rating
As noted earlier, Bill 73 has introduced two new sections where Council must consider
the use of area specific charges:
1. Section 2 (9) of the Act now requires a municipality to implement area-specific
D.C.s for either specific services which are prescribed and/or for specific
municipalities which are to be regulated (note that at this time, no municipalities
or services are prescribed by the Regulations).

Watson & Associates Economists Ltd. PAGE 7-9 H:\King\2020 DC Study\Report\Report.docx
2. Section 10 (2) c.1 of the D.C.A. requires that “the development charges
background study shall include consideration of the use of more than one
development charge by-law to reflect different needs for services in different
areas.”
In regard to the first item, there are no services or specific municipalities identified in the
regulations which must be area-rated. The second item requires Council to consider
the use of area-rating.
At present, all Township services other than water, wastewater, and water & wastewater
studies are recovered based on a uniform, Township-wide basis. There have been
several reasons why area-rating has not been imposed on these services including:
1. All Township services, with the exception of water, wastewater and stormwater,
require that the average 10-year service standard be calculated. This average
service standard multiplied by growth in the Township, establishes an upper
ceiling on the amount of funds which can be collected from all developing
landowners. Section 4 (4) of O. Reg. 82/98 provides that “…if a development
charge by-law applies to a part of the municipality, the level of service and
average level of service cannot exceed that which would be determined if the by-
law applied to the whole municipality.” Put in layman terms, the average service
standard multiplied by the growth within the specific area, would establish an
area specific ceiling which would significantly reduce the total revenue
recoverable for the Township hence potentially resulting in D.C. revenue
shortfalls and impacts on property taxes.
2. Extending on item 1, attempting to impose an area charge potentially causes
equity issues in transitioning from a Township-wide approach to an area specific
approach. For example, if all services were now built (and funded) within Area A
(which is 75% built out) and this was funded with some revenues from Areas B
and C, moving to an area rating approach would see Area A contribute no funds
to the costs of services in Areas B and C. The development charges would be
lower in Area A (as all services are now funded) and higher in Areas B and C.
As well, funding shortfalls may then potentially encourage the municipality to
provide less services to Areas B and C due to reduced revenue.

Watson & Associates Economists Ltd. PAGE 7-10 H:\King\2020 DC Study\Report\Report.docx
3. Many services which are provided (roads, parks, recreation facilities, library) are
not restricted to one specific area and are often used by all residents. For
example, arenas located in different parts of the Township will be used by
residents from all areas depending on the programing of the facility (i.e. a public
skate is available each night, but at a different arena; hence usage of any one
facility at any given time is based on programing availability).
For the reasons noted above, it is recommended that Council continue the D.C.
approach to calculate the charges on a uniform Township-wide basis for all services
other than water, wastewater, stormwater, and water & wastewater studies.
7.5 Other Recommendations
It is recommended that Council:
“Whenever appropriate, request that grants, subsidies and other contributions be
clearly designated by the donor as being to the benefit of existing development or
new development, as applicable;”
“Adopt the assumptions contained herein as an ‘anticipation’ with respect to
capital grants, subsidies and other contributions;”
“Growth Studies be established as a Class of service;
“Continue the D.C. approach to calculate the charges on a uniform Township-
wide basis for all services other than water, wastewater, stormwater, and water
and wastewater studies/capital improvements;”
“Continue the D.C. approach to calculate the charges for water and water and
wastewater studies/capital improvements on an urban area basis, with the
addition of stormwater;”
“Continue the D.C. approach to calculate the charges for wastewater in King City
and Nobleton on an area specific basis;”
“Approve the capital project listing set out in Chapter 5 of the D.C.s Background
Study dated November 12, 2020, subject to further annual review during the
capital budget process;”

Watson & Associates Economists Ltd. PAGE 7-11 H:\King\2020 DC Study\Report\Report.docx
“Approve the D.C.s Background Study dated November 12 ,2020, as amended (if
applicable);"
“Determine that no further public meeting is required;” and
“Approve the D.C. By-law as set out in Appendix G.”

Watson & Associates Economists Ltd. H:\King\2020 DC Study\Report\Report.docx
Chapter 8 By-law Implementation


Watson & Associates Economists Ltd. PAGE 8-1 H:\King\2020 DC Study\Report\Report.docx
8. By-law Implementation
8.1 Public Consultation Process
8.1.1 Introduction
This chapter addresses the mandatory, formal public consultation process (section
8.1.2), as well as the optional, informal consultation process (section 8.1.3). The latter
is designed to seek the co-operation and participation of those involved, in order to
produce the most suitable policy. Section 8.1.4 addresses the anticipated impact of the
D.C. on development from a generic viewpoint.
8.1.2 Public Meeting of Council
Section 12 of the D.C.A. indicates that before passing a D.C. by-law, Council must hold
at least one public meeting, giving at least 20 clear days’ notice thereof, in accordance
with the Regulation. Council must also ensure that the proposed by-law and
background report are made available to the public at least two weeks prior to the (first)
meeting.
Any person who attends such a meeting may make representations related to the
proposed by-law.
If a proposed by-law is changed following such a meeting, Council must determine
whether a further meeting (under this section) is necessary (i.e. if the proposed by-law
which is proposed for adoption has been changed in any respect, Council should
formally consider whether an additional public meeting is required, incorporating this
determination as part of the final by-law or associated resolution. It is noted that
Council’s decision, once made, is final and not subject to review by a Court or the Local
Planning Appeal Tribunal (L.P.A.T.) (formerly the Ontario Municipal Board (O.M.B.)).
8.1.3 Other Consultation Activity
There are three broad groupings of the public who are generally the most concerned
with Township D.C. policy:
1. The first grouping is the residential development community, consisting of land
developers and builders, who are typically responsible for generating the majority

Watson & Associates Economists Ltd. PAGE 8-2 H:\King\2020 DC Study\Report\Report.docx
of the D.C. revenues. Others, such as realtors, are directly impacted by D.C.
policy. They are, therefore, potentially interested in all aspects of the charge,
particularly the quantum by unit type, projects to be funded by the D.C. and the
timing thereof, and Township policy with respect to development agreements,
D.C. credits and front-ending requirements.
2. The second public grouping embraces the public at large and includes taxpayer
coalition groups and others interested in public policy.
3. The third grouping is the industrial/commercial/institutional development sector,
consisting of land developers and major owners or organizations with significant
construction plans, such as hotels, entertainment complexes, shopping centres,
offices, industrial buildings and institutions. Also involved are organizations such
as Industry Associations, the Chamber of Commerce, the Board of Trade and the
Economic Development Agencies, who are all potentially interested in Township
D.C. policy. Their primary concern is frequently with the quantum of the charge,
gross floor area exclusions such as basements, mechanical or indoor parking
areas, or exemptions and phase-in or capping provisions in order to moderate
the impact.
8.2 Anticipated Impact of the Charge on Development
The establishment of sound D.C. policy often requires the achievement of an
acceptable balance between two competing realities. The first is that high non-
residential D.C.s can, to some degree, represent a barrier to increased economic
activity and sustained industrial/commercial growth, particularly for capital intensive
uses. Also, in many cases, increased residential D.C.s can ultimately be expected to be
recovered via higher housing prices and can impact project feasibility in some cases
(e.g. rental apartments).
On the other hand, D.C.s or other Township capital funding sources need to be
obtained in order to help ensure that the necessary infrastructure and amenities are
installed. The timely installation of such works is a key initiative in providing adequate
service levels and in facilitating strong economic growth, investment and wealth
generation.
Watson & Associates Economists Ltd. PAGE 8-3 H:\King\2020 DC Study\Report\Report.docx
8.3 Implementation Requirements
8.3.1 Introduction
Once the Township has calculated the charge, prepared the complete background
study, carried out the public process and passed a new by-law, the emphasis shifts to
implementation matters.
These include notices, potential appeals and complaints, credits, front-ending
agreements, subdivision agreement conditions and finally the collection of revenues and
funding of projects.
The sections which follow overview the requirements in each case.
8.3.2 Notice of Passage
In accordance with section 13 of the D.C.A., when a D.C. by-law is passed, the
Township clerk shall give written notice of the passing and of the last day for appealing
the by-law (the day that is 40 days after the day it was passed). Such notice must be
given no later than 20 days after the day the by-law is passed (i.e. as of the day of
newspaper publication or the mailing of the notice).
Section 10 of O. Reg. 82/98 further defines the notice requirements which are
summarized as follows:
• notice may be given by publication in a newspaper which is (in the Clerk’s
opinion) of sufficient circulation to give the public reasonable notice, or by
personal service, fax or mail to every owner of land in the area to which the by-
law relates;
• subsection 10 (4) lists the persons/organizations who must be given notice; and
• subsection 10 (5) lists the eight items which the notice must cover.
8.3.3 By-law Pamphlet
In addition to the “notice” information, the Township must prepare a “pamphlet”
explaining each D.C. by-law in force, setting out:
• a description of the general purpose of the D.C.s;
Watson & Associates Economists Ltd. PAGE 8-4 H:\King\2020 DC Study\Report\Report.docx
• the “rules” for determining if a charge is payable in a particular case and for
determining the amount of the charge;
• the services to which the D.C.s relate; and
• a description of the general purpose of the Treasurer’s statement and where it
may be received by the public.
Where a by-law is not appealed to the L.P.A.T., the pamphlet must be readied within 60
days after the by-law comes into force. Later dates apply to appealed by-laws.
The Township must give one copy of the most recent pamphlet without charge, to any
person who requests one.
8.3.4 Appeals
Sections 13 to 19 of the D.C.A. set out the requirements relative to making and
processing a D.C. by-law appeal and L.P.A.T. Hearing in response to an appeal. Any
person or organization may appeal a D.C. by-law to the L.P.A.T. by filing a notice of
appeal with the Township clerk, setting out the objection to the by-law and the reasons
supporting the objection. This must be done by the last day for appealing the by-law,
which is 40 days after the by-law is passed.
The Township is carrying out a public consultation process, in order to address the
issues that come forward as part of that process, thereby avoiding or reducing the need
for an appeal to be made.
8.3.5 Complaints
A person required to pay a D.C., or his agent, may complain to the Township Council
imposing the charge that:
• the amount of the charge was incorrectly determined;
• the reduction to be used against the D.C. was incorrectly determined; or
• there was an error in the application of the D.C.
Sections 20 to 25 of the D.C.A. set out the requirements that exist, including the fact
that a complaint may not be made later than 90 days after a D.C. (or any part of it) is
payable. A complainant may appeal the decision of Township Council to the L.P.A.T.

Watson & Associates Economists Ltd. PAGE 8-5 H:\King\2020 DC Study\Report\Report.docx
8.3.6 Credits
Sections 38 to 41 of the D.C.A. set out a number of credit requirements, which apply
where a Township agrees to allow a person to perform work in the future that relates to
a service in the D.C. by-law.
These credits would be used to reduce the amount of D.C.s to be paid. The value of
the credit is limited to the reasonable cost of the work which does not exceed the
average level of service. The credit applies only to the service to which the work
relates, unless the Township agrees to expand the credit to other services for which a
D.C. is payable.
8.3.7 Front-Ending Agreements
The Township and one or more landowners may enter into a front-ending agreement
which provides for the costs of a project which will benefit an area in the Township to
which the D.C. by-law applies. Such an agreement can provide for the costs to be
borne by one or more parties to the agreement who are, in turn, reimbursed in future by
persons who develop land defined in the agreement.
Part III of the D.C.A. (sections 44 to 58) addresses front-ending agreements and
removes some of the obstacles to their use which were contained in the D.C.A., 1989.
Accordingly, the Township assesses whether this mechanism is appropriate for its use,
as part of funding projects prior to Township funds being available.
8.3.8 Severance and Subdivision Agreement Conditions
Section 59 of the D.C.A. prevents a municipality from imposing directly or indirectly, a
charge related to development or a requirement to construct a service related to
development, by way of a condition or agreement under section 51 or section 53 of the
Planning Act, except for:
• “local services, related to a plan of subdivision or within the area to which the
plan relates, to be installed or paid for by the owner as a condition of approval
under section 51 of the Planning Act;” and
• “local services to be installed or paid for by the owner as a condition of approval
under section 53 of the Planning Act.”

Watson & Associates Economists Ltd. PAGE 8-6 H:\King\2020 DC Study\Report\Report.docx
It is also noted that subsection 59 (4) of the D.C.A. requires that the municipal approval
authority for a draft plan of subdivision under subsection 51 (31) of the Planning Act,
use its power to impose conditions to ensure that the first purchaser of newly subdivided
land is informed of all the D.C.s related to the development, at the time the land is
transferred.
In this regard, if the Township in question is a commenting agency, in order to comply
with subsection 59 (4) of the D.C.A. it would need to provide to the approval authority,
information regarding the applicable Township D.C.s related to the site.
If the Township is an approval authority for the purposes of section 51 of the Planning
Act, it would be responsible to ensure that it collects information from all entities which
can impose a D.C.
The most effective way to ensure that purchasers are aware of this condition would be
to require it as a provision in a registered subdivision agreement, so that any purchaser
of the property would be aware of the charges at the time the title was searched prior to
closing a transaction conveying the lands.

Appendices


Watson & Associates Economists Ltd. PAGE A-1 H:\King\2020 DC Study\Report\Report.docx
Appendix A Background Information on Residential and Non-Residential Growth Forecast

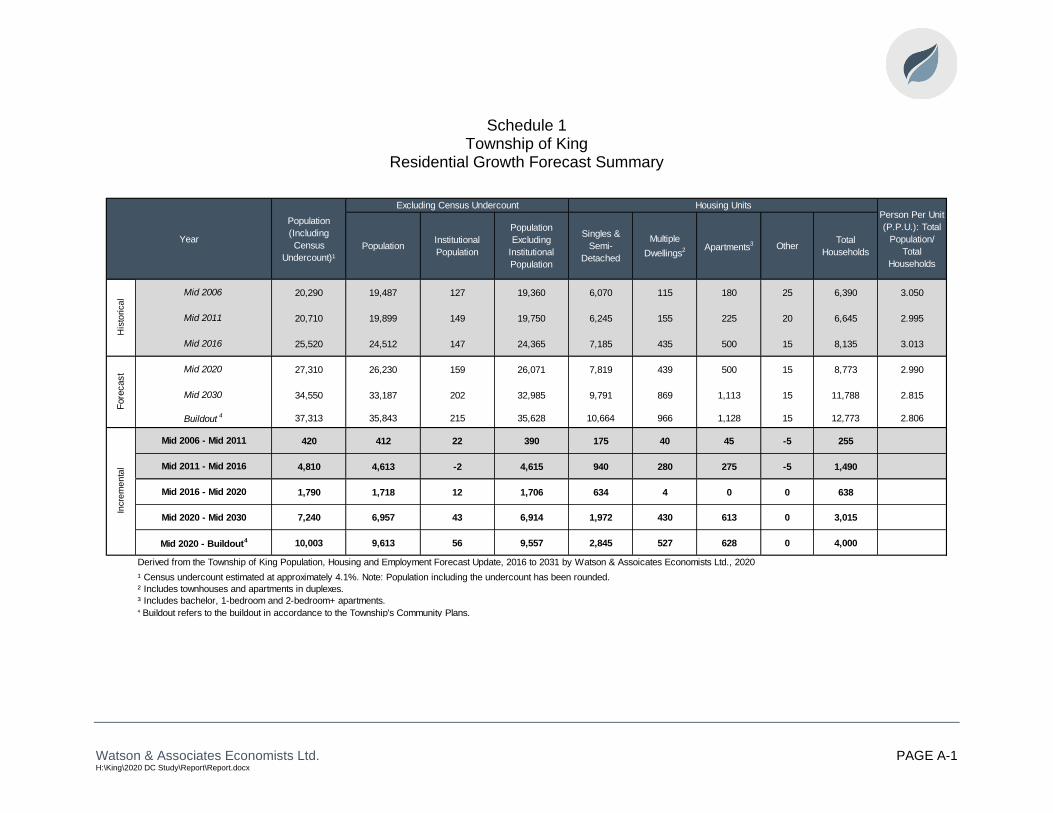
Watson & Associates Economists Ltd. PAGE A-1 H:\King\2020 DC Study\Report\Report.docx
Schedule 1 Township of King
Residential Growth Forecast Summary
PopulationInstitutional
Population
Population
Excluding
Institutional
Population
Singles &
Semi-
Detached
Multiple
Dwellings2 Apartments
3 OtherTotal
Households
20,290 19,487 127 19,360 6,070 115 180 25 6,390 3.050
20,710 19,899 149 19,750 6,245 155 225 20 6,645 2.995
25,520 24,512 147 24,365 7,185 435 500 15 8,135 3.013
27,310 26,230 159 26,071 7,819 439 500 15 8,773 2.990
34,550 33,187 202 32,985 9,791 869 1,113 15 11,788 2.815
37,313 35,843 215 35,628 10,664 966 1,128 15 12,773 2.806
420 412 22 390 175 40 45 -5 255
4,810 4,613 -2 4,615 940 280 275 -5 1,490
1,790 1,718 12 1,706 634 4 0 0 638
7,240 6,957 43 6,914 1,972 430 613 0 3,015
10,003 9,613 56 9,557 2,845 527 628 0 4,000
¹ Census undercount estimated at approximately 4.1%. Note: Population including the undercount has been rounded.
² Includes townhouses and apartments in duplexes.
³ Includes bachelor, 1-bedroom and 2-bedroom+ apartments.4 Buildout refers to the buildout in accordance to the Township's Community Plans.
Fore
cast
Mid 2020 - Buildout4
Incre
me
nta
l
Buildout4
Derived from the Township of King Population, Housing and Employment Forecast Update, 2016 to 2031 by Watson & Assoicates Economists Ltd., 2020
Population
(Including
Census
Undercount)¹
Year
Excluding Census Undercount Housing UnitsPerson Per Unit
(P.P.U.): Total
Population/
Total
Households
His
tori
ca
l
Mid 2020 - Mid 2030
Mid 2006 - Mid 2011
Mid 2011 - Mid 2016
Mid 2006
Mid 2011
Mid 2016
Mid 2020
Mid 2030
Mid 2016 - Mid 2020
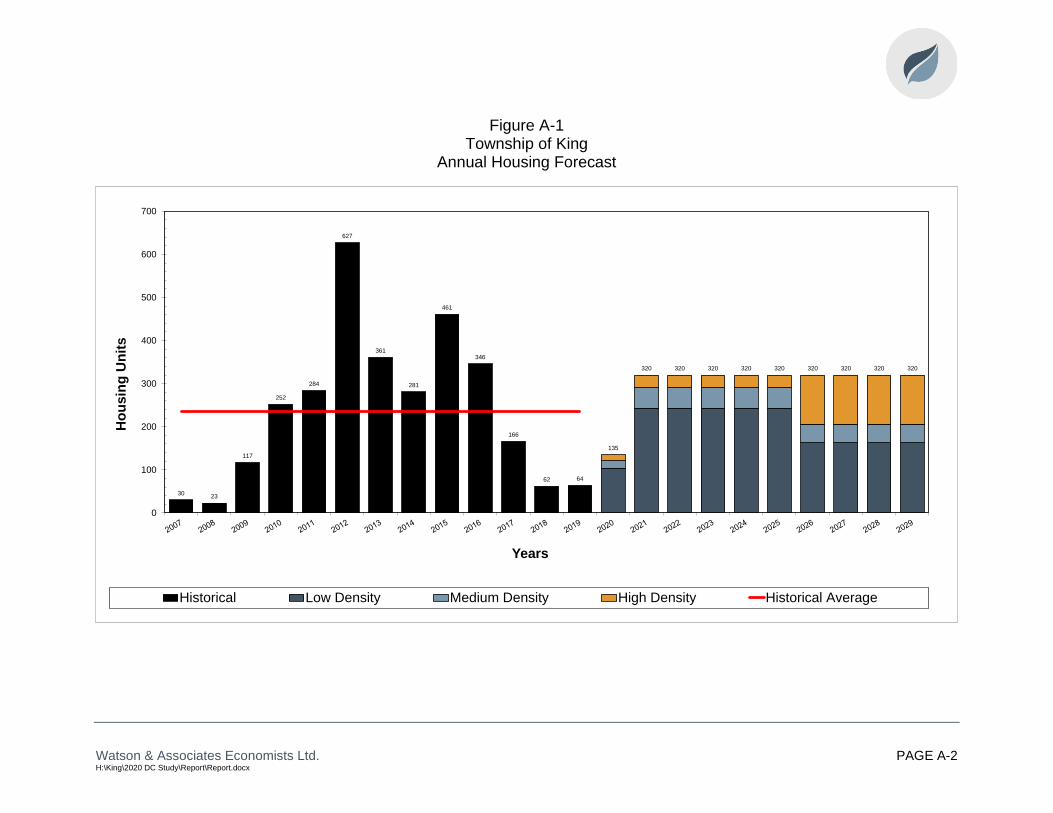
Watson & Associates Economists Ltd. PAGE A-2 H:\King\2020 DC Study\Report\Report.docx
Figure A-1 Township of King
Annual Housing Forecast
3023
117
252
284
627
361
281
461
346
166
62 64
135
320 320 320 320 320 320 320 320 320
0
100
200
300
400
500
600
700
Ho
usin
g U
nit
s
Years
Historical Low Density Medium Density High Density Historical Average
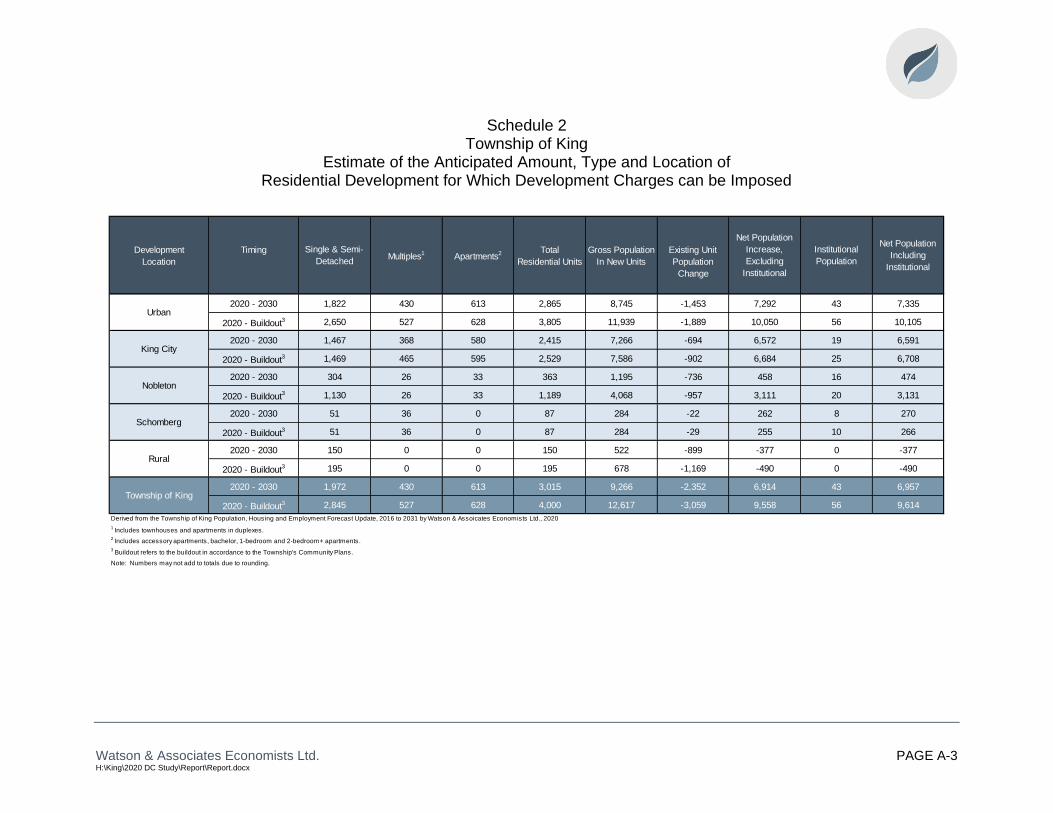
Watson & Associates Economists Ltd. PAGE A-3 H:\King\2020 DC Study\Report\Report.docx
Schedule 2 Township of King
Estimate of the Anticipated Amount, Type and Location of Residential Development for Which Development Charges can be Imposed
2020 - 2030 1,822 430 613 2,865 8,745 -1,453 7,292 43 7,335
2020 - Buildout3 2,650 527 628 3,805 11,939 -1,889 10,050 56 10,105
2020 - 2030 1,467 368 580 2,415 7,266 -694 6,572 19 6,591
2020 - Buildout3 1,469 465 595 2,529 7,586 -902 6,684 25 6,708
2020 - 2030 304 26 33 363 1,195 -736 458 16 474
2020 - Buildout3 1,130 26 33 1,189 4,068 -957 3,111 20 3,131
2020 - 2030 51 36 0 87 284 -22 262 8 270
2020 - Buildout3 51 36 0 87 284 -29 255 10 266
2020 - 2030 150 0 0 150 522 -899 -377 0 -377
2020 - Buildout3 195 0 0 195 678 -1,169 -490 0 -490
2020 - 2030 1,972 430 613 3,015 9,266 -2,352 6,914 43 6,957
2020 - Buildout3 2,845 527 628 4,000 12,617 -3,059 9,558 56 9,614
1 Includes townhouses and apartments in duplexes.
2 Includes accessory apartments, bachelor, 1-bedroom and 2-bedroom+ apartments.
3 Buildout refers to the buildout in accordance to the Township's Community Plans.
Note: Numbers may not add to totals due to rounding.
King City
Nobleton
Schomberg
Urban
Development Timing Single & Semi-
DetachedMultiples
1Apartments
2 Total Gross Population Existing Unit
Net Population
Increase,
Excluding
Institutional
Institutional
Population
Net Population
Including
InstitutionalLocation
Residential Units In New Units Population
Change
Derived from the Township of King Population, Housing and Employment Forecast Update, 2016 to 2031 by Watson & Assoicates Economists Ltd., 2020
Township of King
Rural

Watson & Associates Economists Ltd. PAGE B-1 H:\King\2020 DC Study\Report\Report.docx
Schedule 3 Township of King
Current Year Growth Forecast Mid 2016 to Mid 2020
Mid 2016 Population 24,512
Occupants of Units (2) 638
New Housing Units, multiplied by P.P.U. (3) 3.617
Mid 2016 to Mid 2020 gross population increase 2,307 2,307
Occupants of New Units 11
Equivalent Institutional Units, multiplied by P.P.U. (3) 1.100
Mid 2016 to Mid 2020 gross population increase 12 12
Decline in Housing Units (4) 8,135
Unit Occupancy, multiplied by P.P.U. decline rate (5) -0.074
Mid 2016 to Mid 2020 total decline in population -601 -601
Population Estimate to Mid 2020 26,230
Net Population Increase, Mid 2016 to Mid 2020 1,718
(1) 2016 population based on Statistics Canada Census unadjusted for Census undercount.
(2)
(3) Average number of persons per unit (P.P.U.) is assumed to be:
Singles & Semi Detached 3.622 99% 3.599
Multiples (6) 2.775 1% 0.017
Apartments (7) 1.764 0% 0.000
Total 100% 3.617
¹ Based on 2016 Census custom database
² Based on Building permit/completion activity
(4) 2016 households taken from Statistics Canada Census.
(5) Decline occurs due to aging of the population and family life cycle changes, lower fertility rates and
changing economic conditions.
(6) Includes townhouses and apartments in duplexes.
(7) Includes bachelor, 1-bedroom and 2-bedroom+ apartments.
Note: Numbers may not add to totals due to rounding.
Estimated residential units constructed, Mid-2016 to the beginning of the growth period assuming a six-month lag between construction
and occupancy.
Population
Structural TypePersons Per Unit¹
(P.P.U.)
% Distribution of
Estimated Units²
Weighted Persons
Per Unit Average

Watson & Associates Economists Ltd. PAGE B-2 H:\King\2020 DC Study\Report\Report.docx
Schedule 4 Township of King
Ten Year Growth Forecast Mid 2020 to Mid 2030
Mid 2020 Population 26,230
Occupants of Units (2) 3,015
New Housing Units, multiplied by P.P.U. (3) 3.073
Mid 2020 to Mid 2030 gross population increase 9,266 9,266
Occupants of New Units 39
Equivalent Institutional Units, multiplied by P.P.U. (3) 1.100
Mid 2020 to Mid 2030 gross population increase 43 43
Decline in Housing Units (4) 8,773
Unit Occupancy, multiplied by P.P.U. decline rate (5) -0.268
Mid 2020 to Mid 2030 total decline in population -2,352 -2,352
Population Estimate to Mid 2030 33,187
Net Population Increase, Mid 2020 to Mid 2030 6,957
(1) Mid 2020 Population based on:
(2) Based upon forecast building permits/completions assuming a lag between construction and occupancy.
(3) Average number of persons per unit (P.P.U.) is assumed to be:
Singles & Semi Detached 3.478 65% 2.275
Multiples (6) 2.946 14% 0.421
Apartments (7) 1.860 20% 0.378
one bedroom or less 1.496
two bedrooms or more 2.184
Total 100% 3.073
¹ Persons per unit based on adjusted Statistics Canada Custom 2016 Census database.
² Forecast unit mix based upon historical trends and housing units in the development process.
(4) Mid 2020 households based upon 2016 Census (8,135 units) + Mid 2016 to Mid 2020 unit estimate (638 units) = 8,773 units.
(5)
(6) Includes townhouses and apartments in duplexes.
(7) Includes bachelor, 1-bedroom and 2-bedroom+ apartments.
Note: Numbers may not add to totals due to rounding.
Decline occurs due to aging of the population and family life cycle changes, lower fertility rates and changing economic conditions.
Population
2016 Population (24,512) + Mid 2016 to Mid 2020 estimated housing units to beginning of forecast period (638 x 3.617 = 2,307) + (11 x 1.1
= 12) + (8,135 x -0.074 = -601) = 26,230
Structural TypePersons Per Unit¹
(P.P.U.)
% Distribution of
Estimated Units²
Weighted Persons
Per Unit Average

Watson & Associates Economists Ltd. PAGE B-3 H:\King\2020 DC Study\Report\Report.docx
Schedule 5 Township of King
Mid 2020 to Buildout
Mid 2020 Population 26,230
Occupants of Units (2) 4,000
New Housing Units, multiplied by P.P.U. (3) 3.154
Mid 2020 to Buildout gross population increase 12,616 12,616
Occupants of New Units 50
Equivalent Institutional Units, multiplied by P.P.U. (3) 1.100
Mid 2020 to Buildout gross population increase 56 56
Decline in Housing Units (4) 8,773
Unit Occupancy, multiplied by P.P.U. decline rate (5) -0.349
Mid 2020 to Buildout total decline in population -3,059 -3,059
Population Estimate to Buildout 35,843
Net Population Increase, Mid 2020 to Buildout 9,613
(1) Mid 2020 Population based on:
(2) Based upon forecast building permits/completions assuming a lag between construction and occupancy.
(3) Average number of persons per unit (P.P.U.) is assumed to be:
Singles & Semi Detached 3.478 71% 2.474
Multiples (6) 2.946 13% 0.388
Apartments (7) 1.860 16% 0.292
one bedroom or less 1.496
two bedrooms or more 2.184
Total 100% 3.154
¹ Persons per unit based on Statistics Canada Custom 2016 Census database.
² Forecast unit mix based upon historical trends and housing units in the development process.
(4) Mid 2020 households based upon 8,135 (2016 Census) + 638 (Mid 2016 to Mid 2020 unit estimate) = 8,773
(5) Decline occurs due to aging of the population and family life cycle changes, lower fertility rates and changing economic conditions.
(6) Includes townhouses and apartments in duplexes.
(7) Includes bachelor, 1-bedroom and 2-bedroom+ apartments.
(8) Buildout refers to the buildout in accordance to the Township's Community Plans.
Note: Numbers may not add to totals due to rounding.
Population
Structural TypePersons Per Unit¹
(P.P.U.)
% Distribution of
Estimated Units²
Weighted Persons
Per Unit Average
2016 Population (24,512) + Mid 2016 to Mid 2020 estimated housing units to beginning of forecast period (638 x = 2,307) + (8,135 x -
0.0724 = -589) = 26,230

Watson & Associates Economists Ltd. PAGE B-4 H:\King\2020 DC Study\Report\Report.docx
Schedule 6 Township of King
Historical Residential Building Permits Years 2007 to 2019
Residential Building Permits Residential Building Completions
Total Year
2007 30 0 0 30
2008 23 0 0 23
2009 117 0 0 117
2010 222 30 0 252
2011 99 48 137 284
Average (2007 - 2011) 98 16 27 141
% Breakdown 69.5% 11.0% 19.4% 100.0%
2012 406 95 126 627
2013 305 56 0 361
2014 208 73 0 281
2015 423 38 0 461
2016 342 4 0 346
Sub-total 1,684 266 126 2,076
Average (2012 - 2016) 337 53 25 415
% Breakdown 81.1% 12.8% 6.1% 100.0%
2017 166 0 0 166
2018 62 0 0 62
2019 64 0 0 64
Sub-total 292 0 0 292
% Breakdown 100.0% 0.0% 0.0% 100.0%
2007 - 2019
Total 2,467 344 263 3,074
Average 213 31 24 278
% Breakdown 80.3% 11.2% 8.6% 100.0%
1 Includes townhouses and apartments in duplexes.
2 Includes bachelor, 1 bedroom and 2 bedroom+ apartments.
Singles &
Semi
DetachedMultiples
1Apartments
2
Year
Source: Township of King Monthly Building Reports
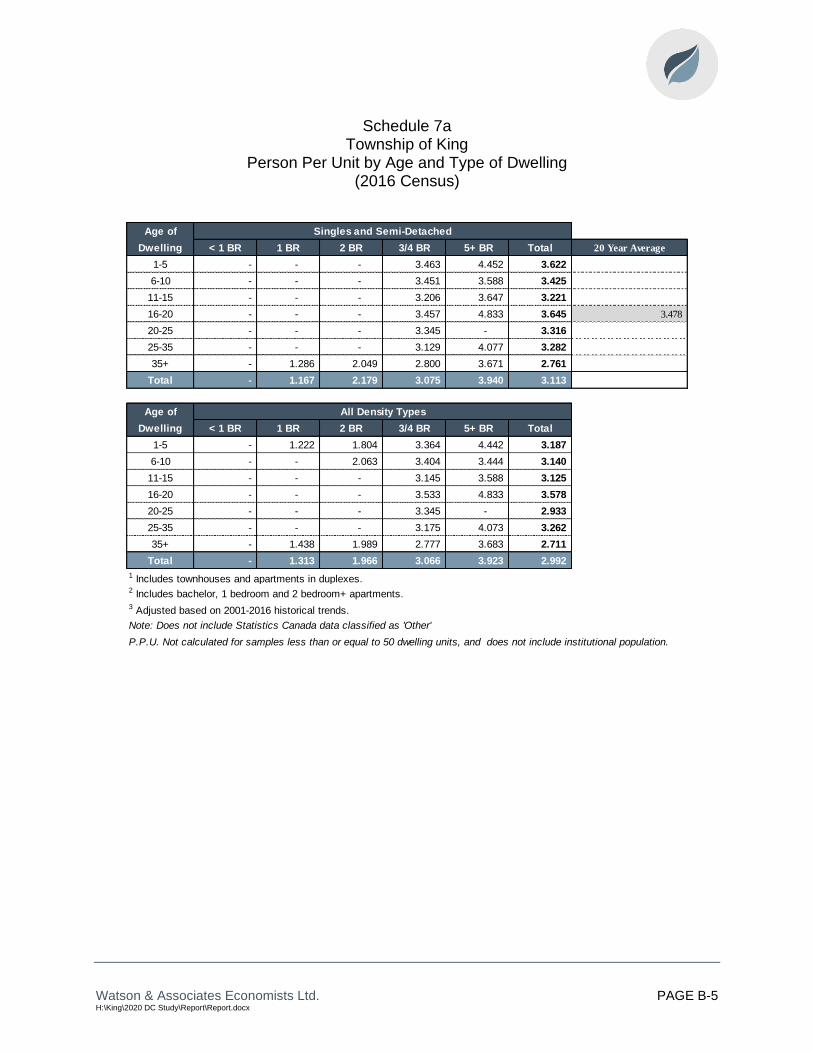
Watson & Associates Economists Ltd. PAGE B-5 H:\King\2020 DC Study\Report\Report.docx
Schedule 7a Township of King
Person Per Unit by Age and Type of Dwelling (2016 Census)
Age of Singles and Semi-Detached
Dwelling < 1 BR 1 BR 2 BR 3/4 BR 5+ BR Total 20 Year Average
1-5 - - - 3.463 4.452 3.622
6-10 - - - 3.451 3.588 3.425 3.523
11-15 - - - 3.206 3.647 3.221 3.422
16-20 - - - 3.457 4.833 3.645 3.478
20-25 - - - 3.345 - 3.316 3.446
25-35 - - - 3.129 4.077 3.282
35+ - 1.286 2.049 2.800 3.671 2.761 3.325
Total - 1.167 2.179 3.075 3.940 3.113
Age of All Density Types
Dwelling < 1 BR 1 BR 2 BR 3/4 BR 5+ BR Total
1-5 - 1.222 1.804 3.364 4.442 3.187
6-10 - - 2.063 3.404 3.444 3.140
11-15 - - - 3.145 3.588 3.125
16-20 - - - 3.533 4.833 3.578
20-25 - - - 3.345 - 2.933
25-35 - - - 3.175 4.073 3.262
35+ - 1.438 1.989 2.777 3.683 2.711
Total - 1.313 1.966 3.066 3.923 2.992
2 Includes bachelor, 1 bedroom and 2 bedroom+ apartments.3 Adjusted based on 2001-2016 historical trends.
Note: Does not include Statistics Canada data classified as 'Other'
P.P.U. Not calculated for samples less than or equal to 50 dwelling units, and does not include institutional population.
1 Includes townhouses and apartments in duplexes.
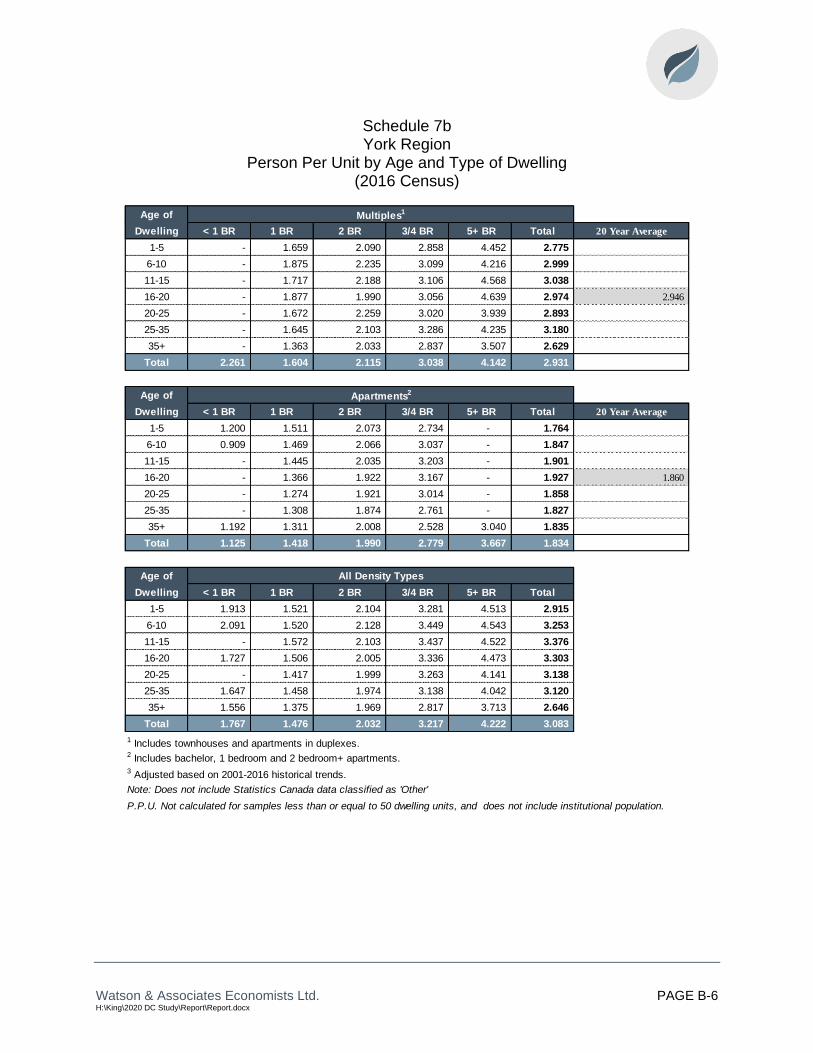
Watson & Associates Economists Ltd. PAGE B-6 H:\King\2020 DC Study\Report\Report.docx
Schedule 7b York Region
Person Per Unit by Age and Type of Dwelling (2016 Census)
Age of Multiples1
Dwelling < 1 BR 1 BR 2 BR 3/4 BR 5+ BR Total 20 Year Average
1-5 - 1.659 2.090 2.858 4.452 2.775
6-10 - 1.875 2.235 3.099 4.216 2.999
11-15 - 1.717 2.188 3.106 4.568 3.038 2.937
16-20 - 1.877 1.990 3.056 4.639 2.974 2.946
20-25 - 1.672 2.259 3.020 3.939 2.893 2.936
25-35 - 1.645 2.103 3.286 4.235 3.180
35+ - 1.363 2.033 2.837 3.507 2.629
Total 2.261 1.604 2.115 3.038 4.142 2.931
Age of Apartments2
Dwelling < 1 BR 1 BR 2 BR 3/4 BR 5+ BR Total 20 Year Average
1-5 1.200 1.511 2.073 2.734 - 1.764
6-10 0.909 1.469 2.066 3.037 - 1.847
11-15 - 1.445 2.035 3.203 - 1.901 1.838
16-20 - 1.366 1.922 3.167 - 1.927 1.860
20-25 - 1.274 1.921 3.014 - 1.858 1.860
25-35 - 1.308 1.874 2.761 - 1.827
35+ 1.192 1.311 2.008 2.528 3.040 1.835
Total 1.125 1.418 1.990 2.779 3.667 1.834
Age of All Density Types
Dwelling < 1 BR 1 BR 2 BR 3/4 BR 5+ BR Total
1-5 1.913 1.521 2.104 3.281 4.513 2.915
6-10 2.091 1.520 2.128 3.449 4.543 3.253
11-15 - 1.572 2.103 3.437 4.522 3.376
16-20 1.727 1.506 2.005 3.336 4.473 3.303
20-25 - 1.417 1.999 3.263 4.141 3.138
25-35 1.647 1.458 1.974 3.138 4.042 3.120
35+ 1.556 1.375 1.969 2.817 3.713 2.646
Total 1.767 1.476 2.032 3.217 4.222 3.083
2 Includes bachelor, 1 bedroom and 2 bedroom+ apartments.3 Adjusted based on 2001-2016 historical trends.
Note: Does not include Statistics Canada data classified as 'Other'
P.P.U. Not calculated for samples less than or equal to 50 dwelling units, and does not include institutional population.
1 Includes townhouses and apartments in duplexes.

Watson & Associates Economists Ltd. PAGE B-1 H:\King\2020 DC Study\Report\Report.docx
Schedule 8 Township of King
Person Per Unit Structural Type and Age of Dwelling (2016 Census)
3.62
3.42
3.22
3.65
3.32 3.28
2.762.77
3.00 3.04 2.972.89
3.18
2.63
1.761.85 1.90 1.93 1.86 1.83 1.83
0.00
0.50
1.00
1.50
2.00
2.50
3.00
3.50
4.00
1-5 6-10 11-15 16-20 20-25 25-35 35+
Pers
on
s P
er
Dw
ell
ing
Age of Dwelling
Singles and Semi-Detached Multiples Apartments
Multiple and Apartment P.P.U.s are based on York Region.

Watson & Associates Economists Ltd. PAGE B-2 H:\King\2020 DC Study\Report\Report.docx
Schedule 9a – A: Activity Rate Township of King
Employment Forecast, 2020 to Buildout
Total Employment
Mid 2006 19,487 0.017 0.075 0.078 0.106 0.057 0.333 0.031 0.364
Mid 2011 19,899 0.015 0.070 0.077 0.112 0.069 0.343 0.032 0.375
Mid 20162 24,512 0.015 0.072 0.096 0.129 0.060 0.373 0.033 0.406
Mid 2020 26,230 0.015 0.072 0.095 0.129 0.059 0.371 0.033 0.404
Mid 2030 33,187 0.012 0.070 0.088 0.125 0.051 0.346 0.033 0.379
Buildout4 35,843 0.012 0.070 0.081 0.125 0.051 0.339 0.033 0.373
Mid 2006 - Mid 2011 412 -0.002 -0.005 -0.002 0.006 0.012 0.010 0.001 0.011
Mid 2011 - Mid 2016 4,613 0.0006 0.0017 0.0196 0.0169 -0.0092 0.0296 0.0014 0.0311
Mid 2016 - Mid 2020 1,718 0.0000 0.0000 -0.0013 0.0000 -0.0009 -0.0022 0.0000 -0.0022
Mid 2020 - Mid 2030 6,957 -0.0033 -0.0020 -0.0072 -0.0043 -0.0078 -0.0247 0.0000 -0.0247
Mid 2020 - Buildout4 9,613 -0.0037 -0.0020 -0.0137 -0.0043 -0.0078 -0.0315 0.0000 -0.0315
Derived from the Township of King Population, Housing and Employment Forecast Update, 2016 to 2031 and adjusted by Watson & Assoicates Economists Ltd., 2020
2 2016 Data derived from 2016 York Region Employment Survey4 Buildout refers to the buildout in accordance to the Township's Community Plans.
N.F.P.O.W.1
Activity Rate
Period PopulationPrimary
Work at
HomeIndustrial
Commercial/
Population RelatedInstitutional Total
Incremental Change
Total
Including
NFPOW
¹ Statistics Canada defines no fixed place of work (N.F.P.O.W.) employees as "persons who do not go from home to the same work place location at the beginning of each shift". Such persons include
building and landscape contractors, travelling salespersons, independent truck drivers, etc.

Watson & Associates Economists Ltd. PAGE B-3 H:\King\2020 DC Study\Report\Report.docx
Schedule 9a – B: Employment Township of King
Employment Forecast, 2020 to Buildout
Employment Total Employment
Mid 2006 19,487 325 1,470 1,525 2,070 1,105 6,495 605 7,100 5,025
Mid 2011 19,899 295 1,400 1,525 2,235 1,375 6,830 637 7,467 5,430
Mid 20162 24,512 379 1,765 2,360 3,167 1,469 9,140 820 9,960 7,375
Mid 2020 26,230 379 1,889 2,492 3,389 1,548 9,697 877 10,574 7,808
Mid 2030 33,187 402 2,323 2,913 4,145 1,700 11,483 1,110 12,593 9,160
Buildout4 35,843 423 2,509 2,913 4,477 1,836 12,158 1,199 13,357 9,649
Mid 2006 - Mid 2011 412 -30 -70 0 165 270 335 32 367 405
Mid 2011 - Mid 2016 4,613 84 365 835 932 94 2,310 183 2,493 1,945
Mid 2016 - Mid 2020 1,718 0 124 132 222 79 557 57 614 433
Mid 2020 - Mid 2030 6,957 23 434 421 756 152 1,786 233 2,019 1,352
Mid 2020 - Buildout4 9,613 44 620 421 1,088 288 2,461 322 2,783 1,841
Derived from the Township of King Population, Housing and Employment Forecast Update, 2016 to 2031 and adjusted by Watson & Assoicates Economists Ltd., 2020
2 2016 Data derived from 2016 York Region Employment Survey4 Buildout refers to the buildout in accordance to the Township's Community Plans.
Period Population
Employment
Primary Total
Total Employment
(Including
N.F.P.O.W.)
Institutional
Total (Excluding
Work at Home and
N.F.P.O.W.)
Incremental Change
N.F.P.O.W.1Work at
HomeIndustrial
Commercial/
Population
Related
¹ Statistics Canada defines no fixed place of work (N.F.P.O.W.) employees as "persons who do not go from home to the same work place location at the beginning of each shift". Such persons include building and landscape contractors, travelling salespersons, independent
truck drivers, etc.

Watson & Associates Economists Ltd. PAGE B-4 H:\King\2020 DC Study\Report\Report.docx
Schedule 9b Township of King
Employment and Gross Floor Area (G.F.A.) Forecast, 2020 to Buildout
Re-Allocation of Building Area Forecast (in Sq. Ft.)
Mid 2006 19,487 325 1,525 2,070 1,105 5,025
Mid 2011 19,899 295 1,525 2,235 1,375 5,430
Mid 2016 24,512 379 2,360 3,167 1,469 7,375
Mid 2020 26,230 379 2,492 3,389 1,548 7,808
Mid 2030 33,187 402 2,913 4,145 1,700 9,160
Buildout2 35,843 423 2,913 4,477 1,836 9,649
Mid 2006 - Mid 2011 412 -30 0 165 270 405
Mid 2011 - Mid 2016 4,613 84 835 932 94 1,945
Mid 2016 - Mid 2020 1,718 0 132 222 79 433 0 145,200 111,000 55,300 311,500
Mid 2020 - Mid 2030 6,957 23 421 756 152 1,352 69,000 463,100 378,000 106,400 1,016,500
Mid 2020 - Buildout4 9,613 44 421 1,088 288 1,841 132,000 463,100 544,000 201,600 1,340,700
Derived from the Township of King Population, Housing and Employment Forecast Update, 2016 to 2031 and adjusted by Watson & Assoicates Economists Ltd., 20201 Square Foot Per Employee Assumptions
Industrial 1,100
Commercial/ Population Related 500
Institutional 700
Primary 3,000
Note: Numbers may not add to totals due to rounding.
2 Buildout refers to the buildout in accordance to the Township's Community Plans.
Period Population
Employment
TotalPrimary
Gross Floor Area in Square Feet (Estimated)¹
Industrial Institutional Total
Incremental Change
Commercial/
Population
Related
Institutional Industrial
Commercial/
Population
Related
Primary
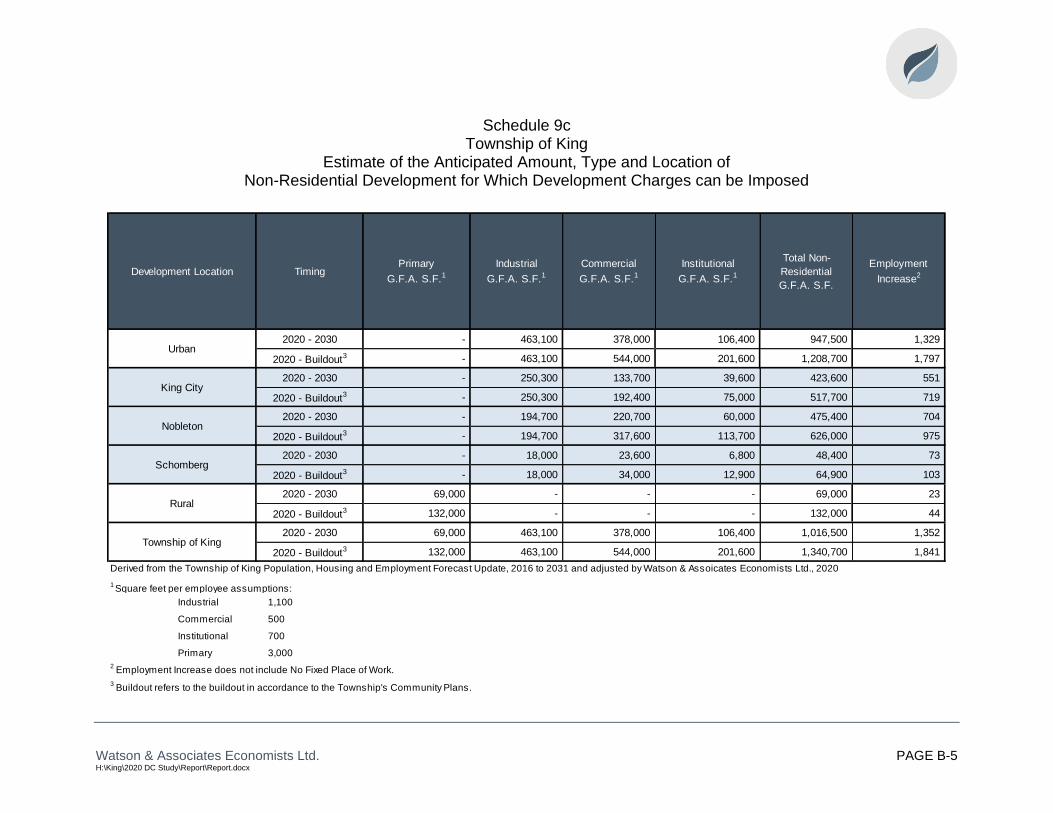
Watson & Associates Economists Ltd. PAGE B-5 H:\King\2020 DC Study\Report\Report.docx
Schedule 9c Township of King
Estimate of the Anticipated Amount, Type and Location of Non-Residential Development for Which Development Charges can be Imposed
2020 - 2030 - 463,100 378,000 106,400 947,500 1,329
2020 - Buildout3 - 463,100 544,000 201,600 1,208,700 1,797
2020 - 2030 - 250,300 133,700 39,600 423,600 551
2020 - Buildout3 - 250,300 192,400 75,000 517,700 719
2020 - 2030 - 194,700 220,700 60,000 475,400 704
2020 - Buildout3 - 194,700 317,600 113,700 626,000 975
2020 - 2030 - 18,000 23,600 6,800 48,400 73
2020 - Buildout3 - 18,000 34,000 12,900 64,900 103
2020 - 2030 69,000 - - - 69,000 23
2020 - Buildout3 132,000 - - - 132,000 44
2020 - 2030 69,000 463,100 378,000 106,400 1,016,500 1,352
2020 - Buildout3 132,000 463,100 544,000 201,600 1,340,700 1,841
1 Square feet per employee assumptions:
Industrial 1,100
Commercial 500
Institutional 700
Primary 3,000
2 Employment Increase does not include No Fixed Place of Work.
3 Buildout refers to the buildout in accordance to the Township's Community Plans.
Township of King
Industrial
G.F.A. S.F.1
Commercial
G.F.A. S.F.1
Institutional
G.F.A. S.F.1
Total Non-
Residential
G.F.A. S.F.
Primary
G.F.A. S.F.1
Employment
Increase2
Rural
Derived from the Township of King Population, Housing and Employment Forecast Update, 2016 to 2031 and adjusted by Watson & Assoicates Economists Ltd., 2020
Schomberg
Urban
King City
Nobleton
Development Location Timing

Watson & Associates Economists Ltd. PAGE B-6 H:\King\2020 DC Study\Report\Report.docx
Schedule 10 Township of King
Non-Residential Construction Value Years 2007 to 2016
(000’s 2018 $)
New Improve Additions Total New Improve Additions Total New Improve Additions Total New Improve Additions Total
2007 21,883 579 0 22,462 218 1,653 0 1,871 0 54 5,820 5,874 22,101 2,285 5,820 30,206
2008 4,494 147 0 4,641 2,579 456 0 3,035 7,533 285 0 7,818 14,606 888 0 15,494
2009 1,792 59 0 1,851 9,481 254 0 9,735 1,695 390 0 2,085 12,968 703 0 13,671
2010 5,572 1,074 0 6,645 22 379 0 401 613 185 1,117 1,916 6,207 1,638 1,117 8,962
2012 4,204 214 0 4,419 4,717 477 0 5,194 0 213 5,038 5,252 8,921 905 5,038 14,864
2013 3,930 63 263 4,256 2,914 798 0 3,713 0 757 0 757 6,844 1,619 263 8,726
2014 5,496 1,022 0 6,518 6,866 1,077 0 7,943 222 248 0 470 12,584 2,347 0 14,931
2015 2,332 2,222 0 4,554 4,245 1,142 2,698 8,085 271 633 0 904 6,847 3,997 2,698 13,542
2016 7,428 147 2,600 10,176 4,887 2,315 0 7,202 47,918 320 0 48,238 60,232 2,782 2,600 65,615
Subtotal 7,230,633 6,370 2,863 7,239,867 14,905,129 8,793 2,698 14,916,621 ######## 3,340 21,224 21,766,747 43,877,946 18,503 26,785 43,923,234
Percent of Total 100% 0% 0% 100% 100% 0% 0% 100% 100% 0% 0% 100% 100% 0% 0% 100%
Average 602,553 637 1,432 603,322 1,355,012 879 2,698 1,243,052 2,415,798 334 5,306 1,813,896 3,656,495 1,850 3,826 3,660,269
2007 - 2011
Period Total 40,122 15,282 36,172 91,576
2007 - 2011 Average 8,024 3,056 7,234 18,315
% Breakdown 43.8% 16.7% 39.5% 100.0%
2012 - 2016
Period Total 29,923 32,136 55,620 117,679
2012 - 2016 Average 5,985 6,427 11,124 23,536
% Breakdown 25.4% 27.3% 47.3% 100.0%
2007 - 2016
Period Total 70,045 47,419 91,792 209,255
2007 - 2016 Average 7,004 4,742 9,179 20,925
% Breakdown 33.5% 22.7% 43.9% 100.0%
Source: Statistics Canada Publication, 64-001-XIB
Note: Inflated to year-end 2017 (January, 2018) dollars using Reed Construction Cost Index
YEAR Industrial Commercial Institutional Total
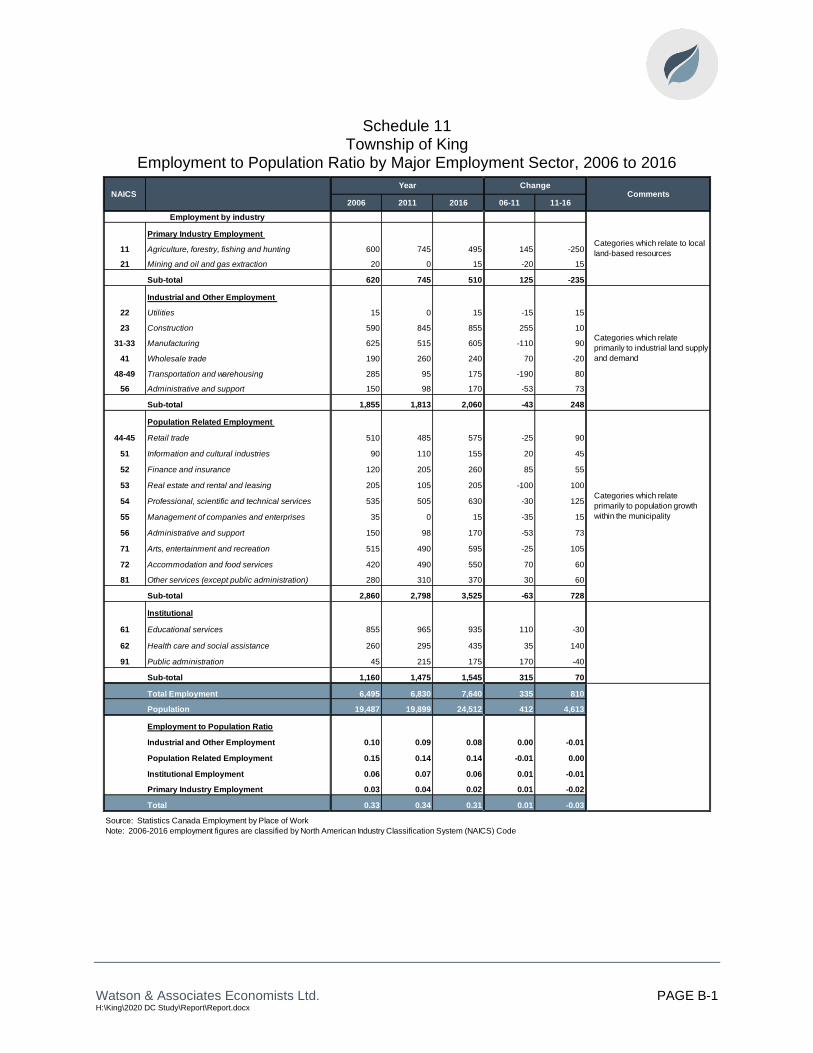
Watson & Associates Economists Ltd. PAGE B-1 H:\King\2020 DC Study\Report\Report.docx
Schedule 11 Township of King
Employment to Population Ratio by Major Employment Sector, 2006 to 2016
2006 2011 2016 06-11 11-16
Primary Industry Employment
11 Agriculture, forestry, fishing and hunting 600 745 495 145 -250
21 Mining and oil and gas extraction 20 0 15 -20 15
Sub-total 620 745 510 125 -235
Industrial and Other Employment
22 Utilities 15 0 15 -15 15
23 Construction 590 845 855 255 10
31-33 Manufacturing 625 515 605 -110 90
41 Wholesale trade 190 260 240 70 -20
48-49 Transportation and warehousing 285 95 175 -190 80
56 Administrative and support 150 98 170 -53 73
Sub-total 1,855 1,813 2,060 -43 248
Population Related Employment
44-45 Retail trade 510 485 575 -25 90
51 Information and cultural industries 90 110 155 20 45
52 Finance and insurance 120 205 260 85 55
53 Real estate and rental and leasing 205 105 205 -100 100
54 Professional, scientific and technical services 535 505 630 -30 125
55 Management of companies and enterprises 35 0 15 -35 15
56 Administrative and support 150 98 170 -53 73
71 Arts, entertainment and recreation 515 490 595 -25 105
72 Accommodation and food services 420 490 550 70 60
81 Other services (except public administration) 280 310 370 30 60
Sub-total 2,860 2,798 3,525 -63 728
Institutional
61 Educational services 855 965 935 110 -30
62 Health care and social assistance 260 295 435 35 140
91 Public administration 45 215 175 170 -40
Sub-total 1,160 1,475 1,545 315 70
Total Employment 6,495 6,830 7,640 335 810
Population 19,487 19,899 24,512 412 4,613
Employment to Population Ratio
Industrial and Other Employment 0.10 0.09 0.08 0.00 -0.01
Population Related Employment 0.15 0.14 0.14 -0.01 0.00
Institutional Employment 0.06 0.07 0.06 0.01 -0.01
Primary Industry Employment 0.03 0.04 0.02 0.01 -0.02
Total 0.33 0.34 0.31 0.01 -0.03
Source: Statistics Canada Employment by Place of Work
Note: 2006-2016 employment figures are classified by North American Industry Classification System (NAICS) Code
NAICS Year
Categories which relate
primarily to industrial land supply
and demand
Categories which relate
primarily to population growth
within the municipality
Employment by industry
CommentsChange
Categories which relate to local
land-based resources

Watson & Associates Economists Ltd. PAGE B-1 H:\King\2020 DC Study\Report\Report.docx
Appendix B
Level of Service


Watson & Associates Economists Ltd. PAGE B-2 H:\King\2020 DC Study\Report\Report.docx
Appendix B: Level of Service
Cost (per capita)
Services Related to a Highway - Roads $19,252.90 0.0048 km of roadways 4,011,021 per lane km 185,078,128
Depots and Domes $1,452.38 1.2389 sq.ft. of building area 1,172 per sq.ft. 13,961,729
Roads and Related Vehicles $268.39 0.0018 No. of vehicles and equipment 149,106 per vehicle 2,580,033
Fire Facilities $581.49 1.2472 sq.ft. of building area 466 per sq.ft. 5,589,863
Fire Vehicles $410.89 0.0010 No. of vehicles 410,890 per vehicle 3,949,886
Fire Small Equipment and Gear $80.89 0.0310 No. of equipment and gear 2,609 per Firefighter 777,596
Parks & Recreation - Parkland Development $841.53 0.0347 Acres of Parkland 24,252 per acre 5,854,524
Parks & Recreation - Parkland Amenities $845.81 0.0053 No. of parkland amenities 159,587 per amenity 5,884,300
Parks & Recreation - Parkland Trails $66.03 0.0017 Linear Kilometres of Paths and Trails 38,841 per lin km. 459,371
Parks & Recreation - Parks Vehicles and
Equipment$95.10 0.0017 No. of vehicles and equipment 55,941 per vehicle 661,611
Parks & Recreation - Recreation Facilities $2,906.29 8.4184 sq.ft. of building area 345 per sq.ft. 20,219,060
Library Facilities $544.39 0.7761 sq.ft. of building area 701 per sq.ft. 3,787,321
Library Collection Materials $98.71 5.1319 No. of library collection items 19 per collection item 686,725
Fire Protection Services
Library Services
Parks and Recreation
Services
Services Related to a
Highway
10 Year Average Service Standard
Quality (per capita)Quantity (per capita)Service Category Sub-Component
Maximum
Ceiling LOS
SUMMARY OF SERVICE STANDARDS AS PER DEVELOPMENT CHARGES ACT, 1997, AS AMENDED
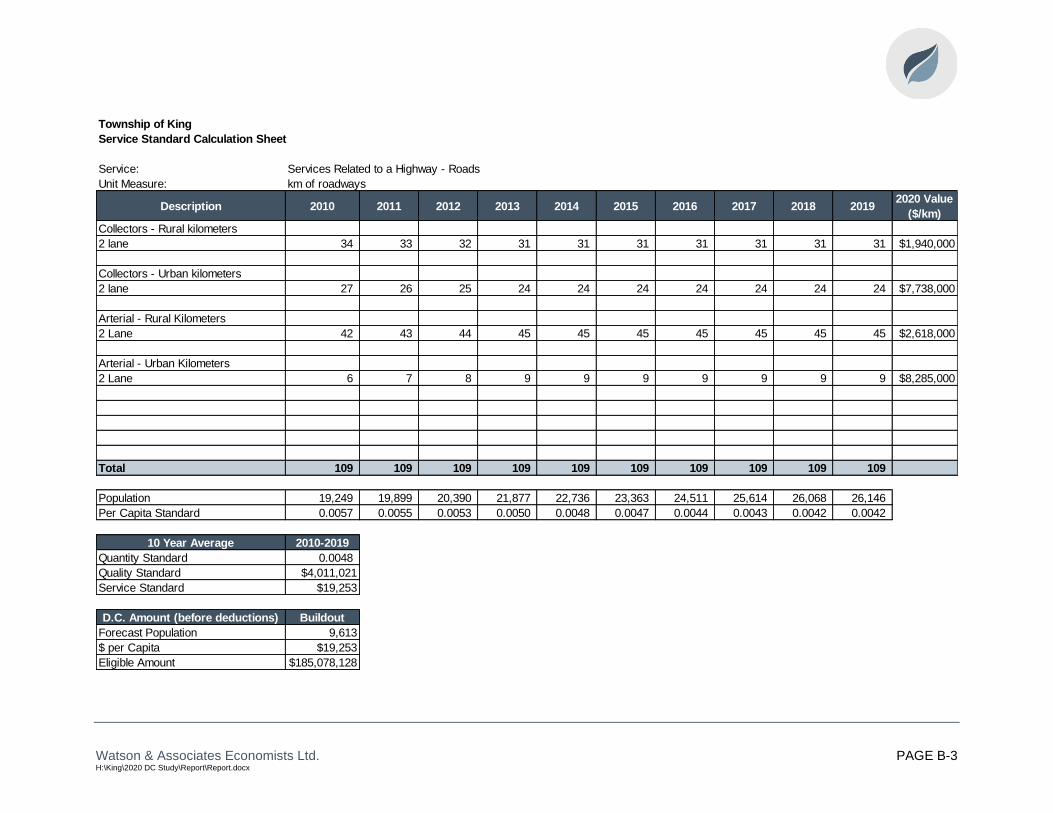
Watson & Associates Economists Ltd. PAGE B-3 H:\King\2020 DC Study\Report\Report.docx
Township of King
Service Standard Calculation Sheet
Service: Services Related to a Highway - Roads
Unit Measure: km of roadways
Description 2010 2011 2012 2013 2014 2015 2016 2017 2018 20192020 Value
($/km)
Collectors - Rural kilometers
2 lane 34 33 32 31 31 31 31 31 31 31 $1,940,000
Collectors - Urban kilometers
2 lane 27 26 25 24 24 24 24 24 24 24 $7,738,000
Arterial - Rural Kilometers
2 Lane 42 43 44 45 45 45 45 45 45 45 $2,618,000
Arterial - Urban Kilometers
2 Lane 6 7 8 9 9 9 9 9 9 9 $8,285,000
Total 109 109 109 109 109 109 109 109 109 109
Population 19,249 19,899 20,390 21,877 22,736 23,363 24,511 25,614 26,068 26,146
Per Capita Standard 0.0057 0.0055 0.0053 0.0050 0.0048 0.0047 0.0044 0.0043 0.0042 0.0042
10 Year Average 2010-2019
Quantity Standard 0.0048
Quality Standard $4,011,021
Service Standard $19,253
D.C. Amount (before deductions) Buildout
Forecast Population 9,613
$ per Capita $19,253
Eligible Amount $185,078,128
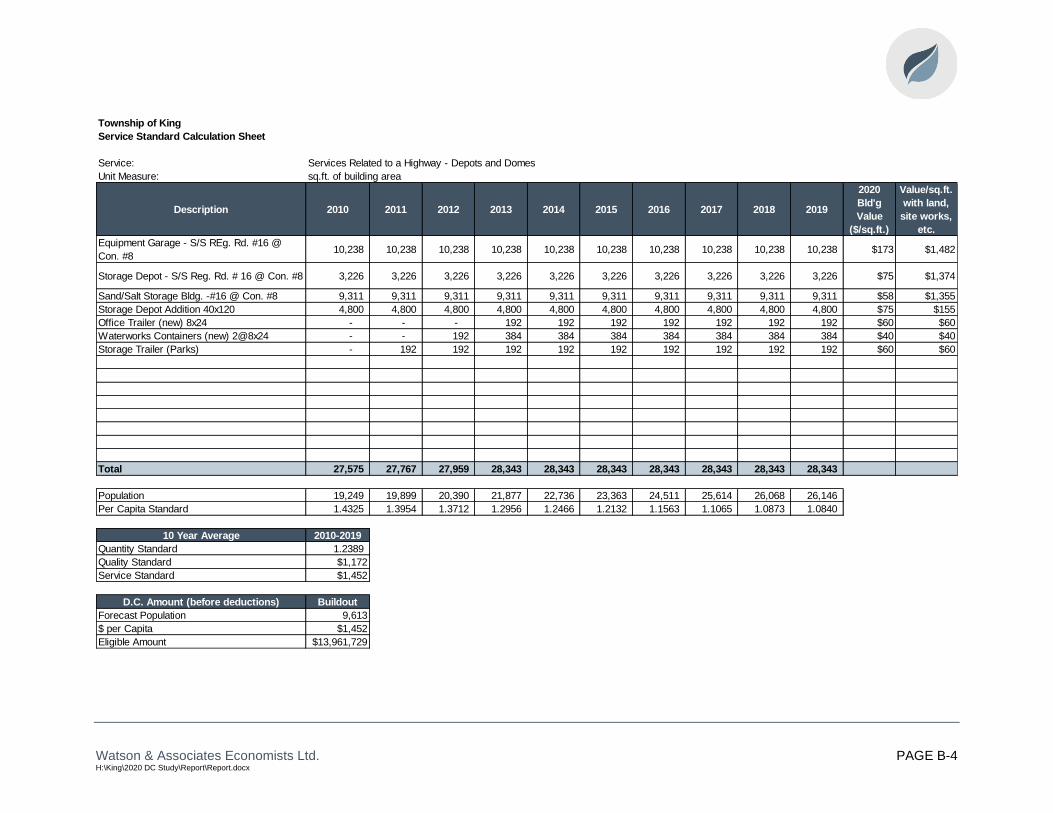
Watson & Associates Economists Ltd. PAGE B-4 H:\King\2020 DC Study\Report\Report.docx
Township of King
Service Standard Calculation Sheet
Service: Services Related to a Highway - Depots and Domes
Unit Measure: sq.ft. of building area
Description 2010 2011 2012 2013 2014 2015 2016 2017 2018 2019
2020
Bld'g
Value
($/sq.ft.)
Value/sq.ft.
with land,
site works,
etc.
Equipment Garage - S/S REg. Rd. #16 @
Con. #810,238 10,238 10,238 10,238 10,238 10,238 10,238 10,238 10,238 10,238 $173 $1,482
Storage Depot - S/S Reg. Rd. # 16 @ Con. #8 3,226 3,226 3,226 3,226 3,226 3,226 3,226 3,226 3,226 3,226 $75 $1,374
Sand/Salt Storage Bldg. -#16 @ Con. #8 9,311 9,311 9,311 9,311 9,311 9,311 9,311 9,311 9,311 9,311 $58 $1,355
Storage Depot Addition 40x120 4,800 4,800 4,800 4,800 4,800 4,800 4,800 4,800 4,800 4,800 $75 $155
Office Trailer (new) 8x24 - - - 192 192 192 192 192 192 192 $60 $60
Waterworks Containers (new) 2@8x24 - - 192 384 384 384 384 384 384 384 $40 $40
Storage Trailer (Parks) - 192 192 192 192 192 192 192 192 192 $60 $60
Total 27,575 27,767 27,959 28,343 28,343 28,343 28,343 28,343 28,343 28,343
Population 19,249 19,899 20,390 21,877 22,736 23,363 24,511 25,614 26,068 26,146
Per Capita Standard 1.4325 1.3954 1.3712 1.2956 1.2466 1.2132 1.1563 1.1065 1.0873 1.0840
10 Year Average 2010-2019
Quantity Standard 1.2389
Quality Standard $1,172
Service Standard $1,452
D.C. Amount (before deductions) Buildout
Forecast Population 9,613
$ per Capita $1,452
Eligible Amount $13,961,729
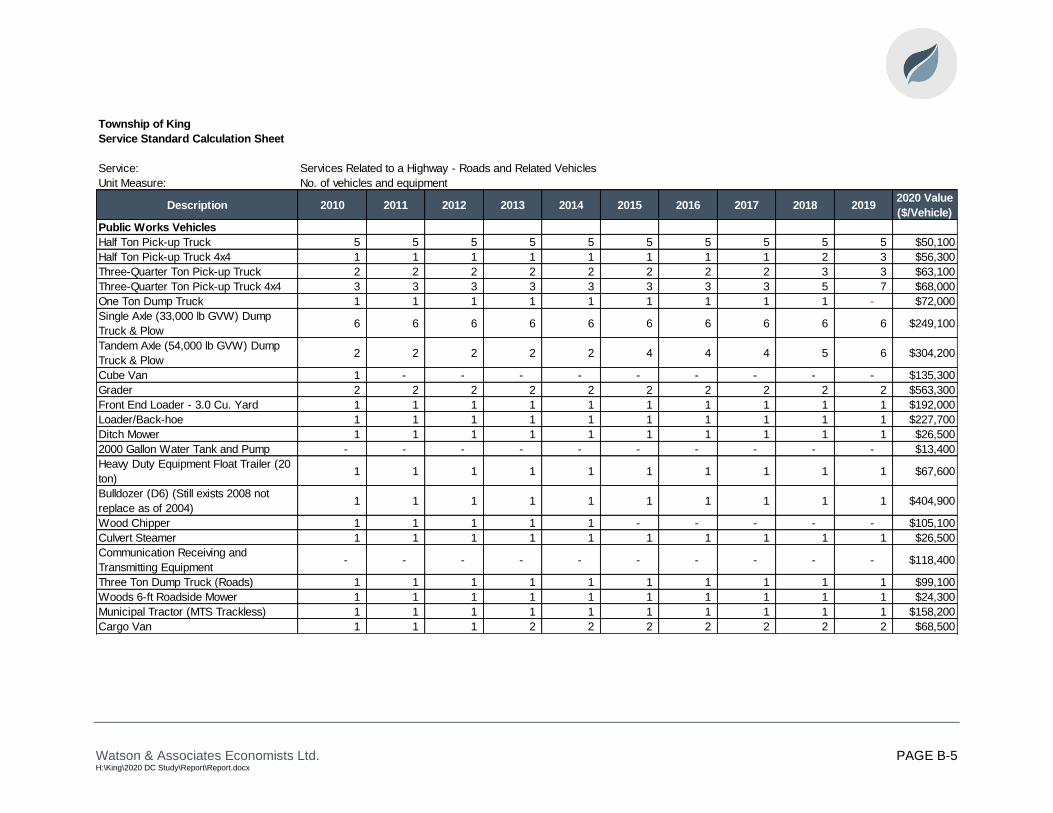
Watson & Associates Economists Ltd. PAGE B-5 H:\King\2020 DC Study\Report\Report.docx
Township of King
Service Standard Calculation Sheet
Service: Services Related to a Highway - Roads and Related Vehicles
Unit Measure: No. of vehicles and equipment
Description 2010 2011 2012 2013 2014 2015 2016 2017 2018 20192020 Value
($/Vehicle)
Public Works Vehicles
Half Ton Pick-up Truck 5 5 5 5 5 5 5 5 5 5 $50,100
Half Ton Pick-up Truck 4x4 1 1 1 1 1 1 1 1 2 3 $56,300
Three-Quarter Ton Pick-up Truck 2 2 2 2 2 2 2 2 3 3 $63,100
Three-Quarter Ton Pick-up Truck 4x4 3 3 3 3 3 3 3 3 5 7 $68,000
One Ton Dump Truck 1 1 1 1 1 1 1 1 1 - $72,000
Single Axle (33,000 lb GVW) Dump
Truck & Plow6 6 6 6 6 6 6 6 6 6 $249,100
Tandem Axle (54,000 lb GVW) Dump
Truck & Plow2 2 2 2 2 4 4 4 5 6 $304,200
Cube Van 1 - - - - - - - - - $135,300
Grader 2 2 2 2 2 2 2 2 2 2 $563,300
Front End Loader - 3.0 Cu. Yard 1 1 1 1 1 1 1 1 1 1 $192,000
Loader/Back-hoe 1 1 1 1 1 1 1 1 1 1 $227,700
Ditch Mower 1 1 1 1 1 1 1 1 1 1 $26,500
2000 Gallon Water Tank and Pump - - - - - - - - - - $13,400
Heavy Duty Equipment Float Trailer (20
ton)1 1 1 1 1 1 1 1 1 1 $67,600
Bulldozer (D6) (Still exists 2008 not
replace as of 2004)1 1 1 1 1 1 1 1 1 1 $404,900
Wood Chipper 1 1 1 1 1 - - - - - $105,100
Culvert Steamer 1 1 1 1 1 1 1 1 1 1 $26,500
Communication Receiving and
Transmitting Equipment- - - - - - - - - - $118,400
Three Ton Dump Truck (Roads) 1 1 1 1 1 1 1 1 1 1 $99,100
Woods 6-ft Roadside Mower 1 1 1 1 1 1 1 1 1 1 $24,300
Municipal Tractor (MTS Trackless) 1 1 1 1 1 1 1 1 1 1 $158,200
Cargo Van 1 1 1 2 2 2 2 2 2 2 $68,500
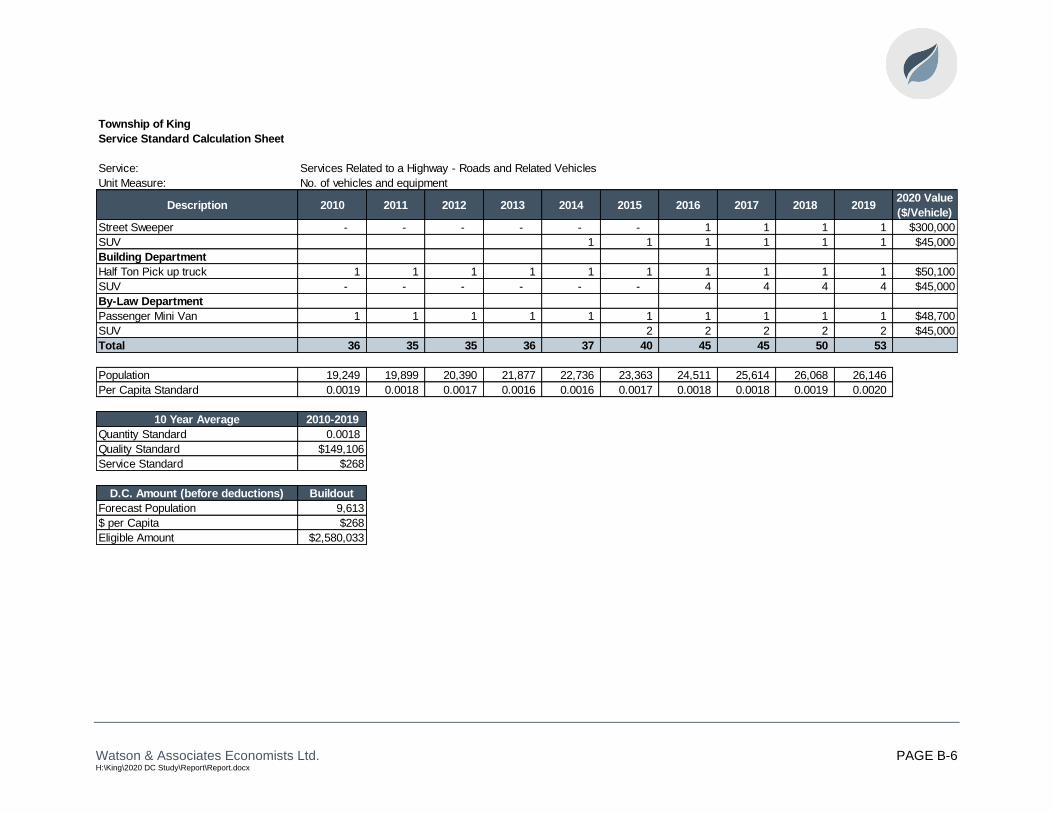
Watson & Associates Economists Ltd. PAGE B-6 H:\King\2020 DC Study\Report\Report.docx
Township of King
Service Standard Calculation Sheet
Service: Services Related to a Highway - Roads and Related Vehicles
Unit Measure: No. of vehicles and equipment
Description 2010 2011 2012 2013 2014 2015 2016 2017 2018 20192020 Value
($/Vehicle)
Street Sweeper - - - - - - 1 1 1 1 $300,000
SUV 1 1 1 1 1 1 $45,000
Building Department
Half Ton Pick up truck 1 1 1 1 1 1 1 1 1 1 $50,100
SUV - - - - - - 4 4 4 4 $45,000
By-Law Department
Passenger Mini Van 1 1 1 1 1 1 1 1 1 1 $48,700
SUV 2 2 2 2 2 $45,000
Total 36 35 35 36 37 40 45 45 50 53
Population 19,249 19,899 20,390 21,877 22,736 23,363 24,511 25,614 26,068 26,146
Per Capita Standard 0.0019 0.0018 0.0017 0.0016 0.0016 0.0017 0.0018 0.0018 0.0019 0.0020
10 Year Average 2010-2019
Quantity Standard 0.0018
Quality Standard $149,106
Service Standard $268
D.C. Amount (before deductions) Buildout
Forecast Population 9,613
$ per Capita $268
Eligible Amount $2,580,033

Watson & Associates Economists Ltd. PAGE B-7 H:\King\2020 DC Study\Report\Report.docx
Township of King
Service Standard Calculation Sheet
Service: Fire Facilities
Unit Measure: sq.ft. of building area
Description 2010 2011 2012 2013 2014 2015 2016 2017 2018 2019
2020
Bld'g
Value
($/sq.ft.)
Value/sq.ft.
with land,
site works,
etc.
91 Proctor Rd., Schomberg P.Lot 6 10,920 11,528 11,528 11,528 11,528 11,528 11,528 11,528 11,528 11,528 $275 $389
2045 King Rd, King City 7,084 7,084 7,084 7,084 7,084 7,084 7,084 7,084 7,084 7,084 $404 $539
5926 King Rd. Nobleton 9,792 9,792 9,792 9,792 9,792 9,792 9,792 9,792 9,792 9,792 $374 $504
Total 27,796 28,404 28,404 28,404 28,404 28,404 28,404 28,404 28,404 28,404
Population 19,249 19,899 20,390 21,877 22,736 23,363 24,511 25,614 26,068 26,146
Per Capita Standard 1.4440 1.4274 1.3930 1.2983 1.2493 1.2158 1.1588 1.1089 1.0896 1.0864
10 Year Average 2010-2019
Quantity Standard 1.2472
Quality Standard $466
Service Standard $581
D.C. Amount (before deductions) Buildout
Forecast Population 9,613
$ per Capita $581
Eligible Amount $5,589,863

Watson & Associates Economists Ltd. PAGE B-8 H:\King\2020 DC Study\Report\Report.docx
Township of King
Service Standard Calculation Sheet
Service: Fire Vehicles
Unit Measure: No. of vehicles
Description 2010 2011 2012 2013 2014 2015 2016 2017 2018 20192020 Value
($/Vehicle)
Pumpers 3 3 3 3 3 3 3 3 3 3 $650,000
Rescue Pumpers 3 3 3 3 3 3 3 3 3 3 $850,000
Telesquirts 2 2 2 2 1 1 1 1 1 1 $1,000,000
Tankers (Singles) 5 5 5 5 5 5 3 3 3 3 $250,000
Tankers (Tandems) - - - - - - 2 2 2 2 $375,000
Rescues 1 1 1 1 1 1 1 1 1 1 $650,000
Rehab/Command 1 1 1 1 1 1 1 1 1 1 $200,000
Utility Vehicles 3 3 3 3 3 3 3 3 3 3 $50,000
Fire Prevention Vehicle 1 1 1 1 1 1 2 2 2 2 $35,000
Chief Vehicles 2 2 2 2 2 2 2 2 2 2 $55,000
Fire Safety Trailer 1 1 1 1 1 1 1 1 1 1 $95,000
100' Ladder Truck - - - 1 1 1 1 1 1 1 $1,200,000
20' Float Trailer - - - 1 1 1 1 1 1 1 $12,000
Total 22 22 22 24 23 23 24 24 24 24
Population 19,249 19,899 20,390 21,877 22,736 23,363 24,511 25,614 26,068 26,146
Per Capita Standard 0.001 0.001 0.001 0.001 0.001 0.001 0.001 0.001 0.001 0.001
10 Year Average 2010-2019
Quantity Standard 0.0010
Quality Standard $410,890
Service Standard $411
D.C. Amount (before deductions) Buildout
Forecast Population 9,613
$ per Capita $411
Eligible Amount $3,949,886
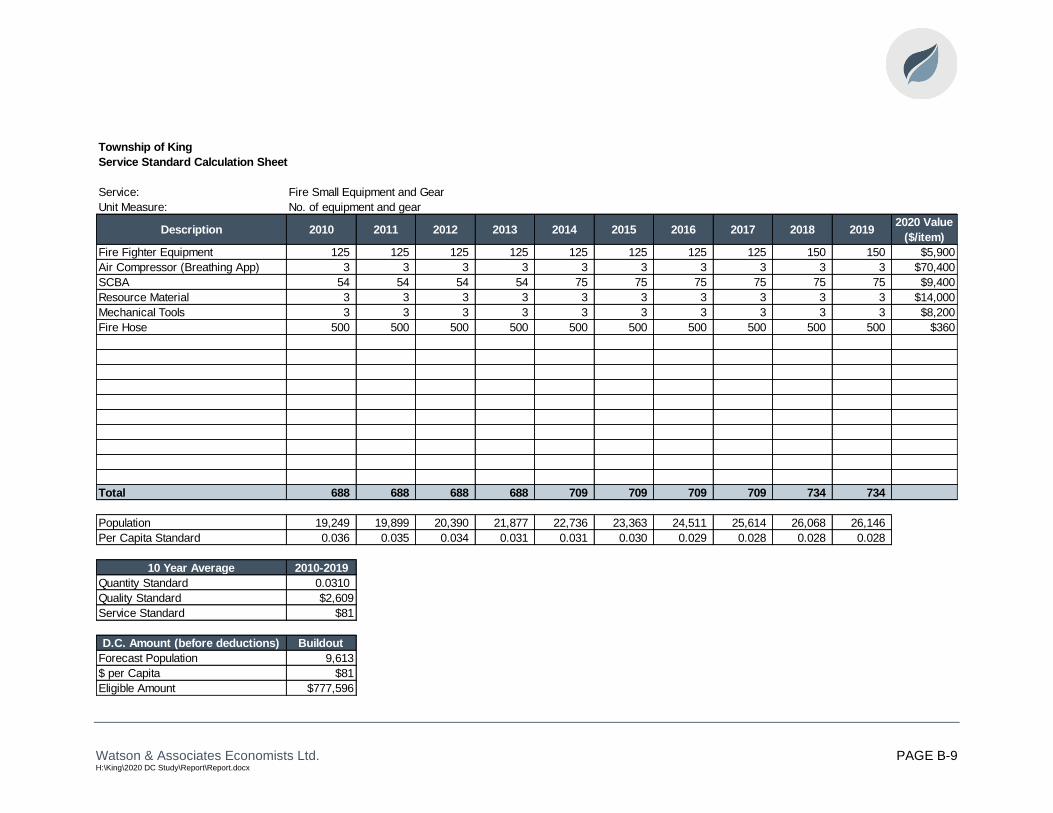
Watson & Associates Economists Ltd. PAGE B-9 H:\King\2020 DC Study\Report\Report.docx
Township of King
Service Standard Calculation Sheet
Service: Fire Small Equipment and Gear
Unit Measure: No. of equipment and gear
Description 2010 2011 2012 2013 2014 2015 2016 2017 2018 20192020 Value
($/item)
Fire Fighter Equipment 125 125 125 125 125 125 125 125 150 150 $5,900
Air Compressor (Breathing App) 3 3 3 3 3 3 3 3 3 3 $70,400
SCBA 54 54 54 54 75 75 75 75 75 75 $9,400
Resource Material 3 3 3 3 3 3 3 3 3 3 $14,000
Mechanical Tools 3 3 3 3 3 3 3 3 3 3 $8,200
Fire Hose 500 500 500 500 500 500 500 500 500 500 $360
Total 688 688 688 688 709 709 709 709 734 734
Population 19,249 19,899 20,390 21,877 22,736 23,363 24,511 25,614 26,068 26,146
Per Capita Standard 0.036 0.035 0.034 0.031 0.031 0.030 0.029 0.028 0.028 0.028
10 Year Average 2010-2019
Quantity Standard 0.0310
Quality Standard $2,609
Service Standard $81
D.C. Amount (before deductions) Buildout
Forecast Population 9,613
$ per Capita $81
Eligible Amount $777,596
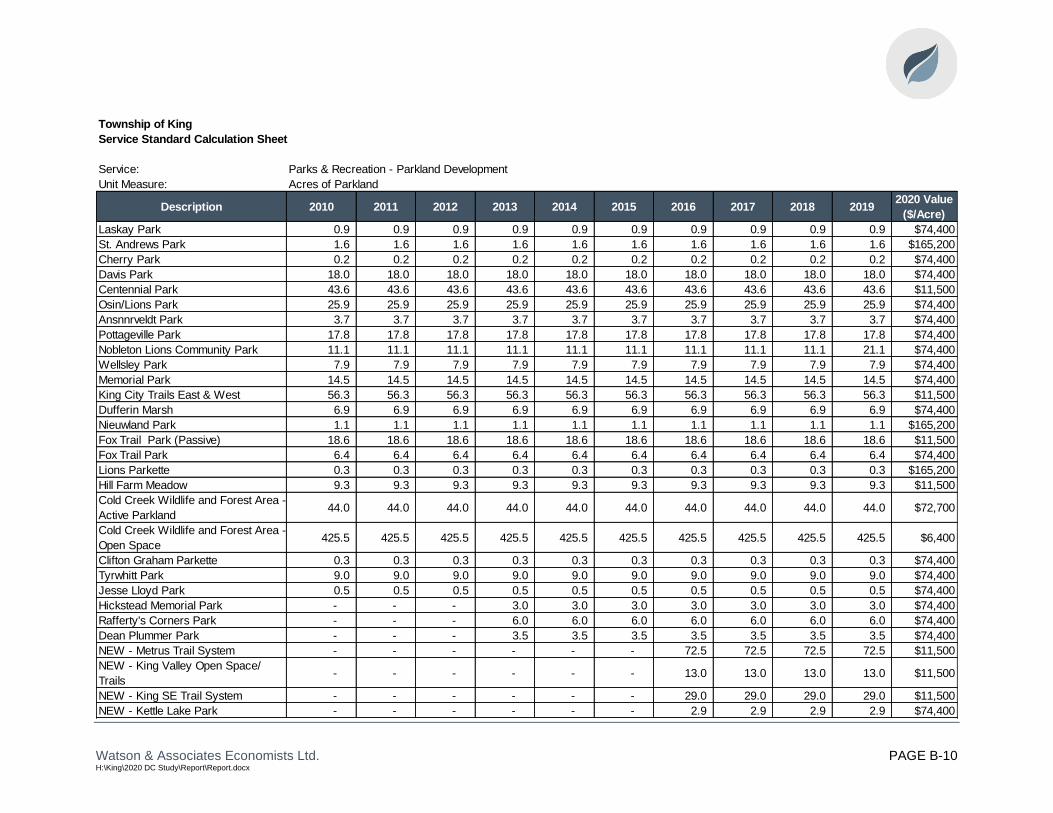
Watson & Associates Economists Ltd. PAGE B-10 H:\King\2020 DC Study\Report\Report.docx
Township of King
Service Standard Calculation Sheet
Service: Parks & Recreation - Parkland Development
Unit Measure: Acres of Parkland
Description 2010 2011 2012 2013 2014 2015 2016 2017 2018 20192020 Value
($/Acre)
Laskay Park 0.9 0.9 0.9 0.9 0.9 0.9 0.9 0.9 0.9 0.9 $74,400
St. Andrews Park 1.6 1.6 1.6 1.6 1.6 1.6 1.6 1.6 1.6 1.6 $165,200
Cherry Park 0.2 0.2 0.2 0.2 0.2 0.2 0.2 0.2 0.2 0.2 $74,400
Davis Park 18.0 18.0 18.0 18.0 18.0 18.0 18.0 18.0 18.0 18.0 $74,400
Centennial Park 43.6 43.6 43.6 43.6 43.6 43.6 43.6 43.6 43.6 43.6 $11,500
Osin/Lions Park 25.9 25.9 25.9 25.9 25.9 25.9 25.9 25.9 25.9 25.9 $74,400
Ansnnrveldt Park 3.7 3.7 3.7 3.7 3.7 3.7 3.7 3.7 3.7 3.7 $74,400
Pottageville Park 17.8 17.8 17.8 17.8 17.8 17.8 17.8 17.8 17.8 17.8 $74,400
Nobleton Lions Community Park 11.1 11.1 11.1 11.1 11.1 11.1 11.1 11.1 11.1 21.1 $74,400
Wellsley Park 7.9 7.9 7.9 7.9 7.9 7.9 7.9 7.9 7.9 7.9 $74,400
Memorial Park 14.5 14.5 14.5 14.5 14.5 14.5 14.5 14.5 14.5 14.5 $74,400
King City Trails East & West 56.3 56.3 56.3 56.3 56.3 56.3 56.3 56.3 56.3 56.3 $11,500
Dufferin Marsh 6.9 6.9 6.9 6.9 6.9 6.9 6.9 6.9 6.9 6.9 $74,400
Nieuwland Park 1.1 1.1 1.1 1.1 1.1 1.1 1.1 1.1 1.1 1.1 $165,200
Fox Trail Park (Passive) 18.6 18.6 18.6 18.6 18.6 18.6 18.6 18.6 18.6 18.6 $11,500
Fox Trail Park 6.4 6.4 6.4 6.4 6.4 6.4 6.4 6.4 6.4 6.4 $74,400
Lions Parkette 0.3 0.3 0.3 0.3 0.3 0.3 0.3 0.3 0.3 0.3 $165,200
Hill Farm Meadow 9.3 9.3 9.3 9.3 9.3 9.3 9.3 9.3 9.3 9.3 $11,500
Cold Creek Wildlife and Forest Area -
Active Parkland44.0 44.0 44.0 44.0 44.0 44.0 44.0 44.0 44.0 44.0 $72,700
Cold Creek Wildlife and Forest Area -
Open Space425.5 425.5 425.5 425.5 425.5 425.5 425.5 425.5 425.5 425.5 $6,400
Clifton Graham Parkette 0.3 0.3 0.3 0.3 0.3 0.3 0.3 0.3 0.3 0.3 $74,400
Tyrwhitt Park 9.0 9.0 9.0 9.0 9.0 9.0 9.0 9.0 9.0 9.0 $74,400
Jesse Lloyd Park 0.5 0.5 0.5 0.5 0.5 0.5 0.5 0.5 0.5 0.5 $74,400
Hickstead Memorial Park - - - 3.0 3.0 3.0 3.0 3.0 3.0 3.0 $74,400
Rafferty's Corners Park - - - 6.0 6.0 6.0 6.0 6.0 6.0 6.0 $74,400
Dean Plummer Park - - - 3.5 3.5 3.5 3.5 3.5 3.5 3.5 $74,400
NEW - Metrus Trail System - - - - - - 72.5 72.5 72.5 72.5 $11,500
NEW - King Valley Open Space/
Trails- - - - - - 13.0 13.0 13.0 13.0 $11,500
NEW - King SE Trail System - - - - - - 29.0 29.0 29.0 29.0 $11,500
NEW - Kettle Lake Park - - - - - - 2.9 2.9 2.9 2.9 $74,400

Watson & Associates Economists Ltd. PAGE B-11 H:\King\2020 DC Study\Report\Report.docx
Township of King
Service Standard Calculation Sheet
Service: Parks & Recreation - Parkland Development
Unit Measure: Acres of Parkland
Description 2010 2011 2012 2013 2014 2015 2016 2017 2018 20192020 Value
($/Acre)
NEW - Salmander Park - - - - - - 2.6 2.6 2.6 2.6 $74,400
NEW - Blue Heron Park - - - - - - 1.2 1.2 1.2 1.2 $74,400
NEW - Mary Lake Park - - - - - - - - - 0.8 $74,400
NEW - King Valley Passive - - - - - - - - 4.1 4.1 $11,500
NEW - Tasca Park Passive - - - - - 2.6 2.6 2.6 2.6 2.6 $11,500
NEW - Tasca Park Active - - - - - 21.4 21.4 21.4 21.4 21.4 $74,400
Total 723.3 723.3 723.3 735.8 735.8 759.8 881.0 881.0 885.1 896.0
Population 19,249 19,899 20,390 21,877 22,736 23,363 24,511 25,614 26,068 26,146
Per Capita Standard 0.04 0.04 0.04 0.03 0.03 0.03 0.04 0.03 0.03 0.03
10 Year Average 2010-2019
Quantity Standard 0.0347
Quality Standard $24,252
Service Standard $842
D.C. Amount (before deductions) 10 Year
Forecast Population 6,957
$ per Capita $842
Eligible Amount $5,854,524

Watson & Associates Economists Ltd. PAGE B-12 H:\King\2020 DC Study\Report\Report.docx
Township of King
Service Standard Calculation Sheet
Service: Parks & Recreation - Parkland Amenities
Unit Measure: No. of parkland amenities
Description 2010 2011 2012 2013 2014 2015 2016 2017 2018 20192020 Value
($/item)
Bleachers - All Locations 9 11 12 12 12 12 12 12 12 12 $5,900
Outdoor Basketball Courts 1 1 1 1 1 1 2 4 4 4 $66,100
Lit intermediate 1 1 1 1 1 1 1 1 1 1 $416,400
Lit Major Ball Diamond, Non
Municipality Owned1 1 1 1 1 1 1 1 1 1 $416,400
Lit Major Ball Diamond 2 2 2 2 2 2 2 2 2 2 $565,100
Lit Major Ball Diamond, irrigated 1 1 1 1 1 1 1 1 1 1 $654,300
Unlit/Intermediate Diamonds 1 1 1 1 1 1 1 1 1 1 $237,900
T-Ball/Junior Diamonds 2 2 2 2 2 2 2 2 2 2 $178,400
T-Ball/Junior Diamonds - Non
Municipality owned5 5 5 5 5 5 5 5 5 5 $82,700
Unlit Full Size Soccer/Football 2 2 2 2 2 2 3 3 3 3 $267,700
Unlit Full Size Soccer/Football - Non
Municipality owned8 9 10 10 10 10 10 10 10 10 $267,700
Lit Full Size Soccer/Football,
Artificial Turf - Non Municipality
Owned
1 1 1 1 1 1 1 1 1 1 $1,903,400
Unlit Intermediate Soccer 1 1 1 1 1 1 1 1 1 2 $184,400
Unlit Intermediate Soccer- Non
Municipality Owned5 5 5 5 5 5 5 5 5 4 $184,400
Junior Soccer 10 10 10 10 10 10 10 10 10 10 $122,500
Junior Soccer - Non Municipality
Owned4 4 4 4 4 4 4 4 4 4 $122,500
Mini Soccer 8 8 8 8 8 8 8 8 8 8 $49,600
Running Track - Non Municipality
Owned3 3 3 3 3 3 3 3 3 3 $36,400
Lit Tennis Courts 8 8 8 8 8 8 8 8 8 8 $124,000
Unlit Tennis Courts 4 4 4 4 4 4 4 4 4 4 $72,300
Outdoor Beach Vollyball Courts 1 1 1 1 1 1 1 1 1 1 $41,300
Playgrounds - Small 9 9 10 12 12 12 12 12 12 12 $142,800
Playgrounds - Large 2 2 2 2 2 2 2 2 2 2 $200,000

Watson & Associates Economists Ltd. PAGE B-13 H:\King\2020 DC Study\Report\Report.docx
Township of King
Service Standard Calculation Sheet
Service: Parks & Recreation - Parkland Amenities
Unit Measure: No. of parkland amenities
Description 2010 2011 2012 2013 2014 2015 2016 2017 2018 20192020 Value
($/item)
Playgrounds at Schools - Small 7 7 7 7 7 7 7 7 7 7 $142,800
Playgrounds at Schools - Large 2 1 1 1 1 1 1 1 1 1 $200,000
Shade Structures - - - 3 3 3 3 6 7 8 $71,400
Pavilions/Picnic Shelters 1 2 2 2 3 3 4 4 6 7 $178,400
Permanent Washrooms 2 2 2 2 2 2 2 2 2 4 $178,400
Skateboard Park 1 1 1 1 2 2 2 2 $594,800
Multi-purpose Outdoor
Rink/Basketball1 1 2 2 2 2 2 2 2 2 $237,900
Challenge Course 1 1 1 1 1 1 1 2 2 2 $29,700
Rock Climbing Wall 1 1 1 1 1 1 1 1 1 1 $47,600
Dog Park - - - - - - - - - 1 $60,000
Splash pads - - - 1 1 1 2 2 3 3 $237,900
Total 104 107 112 118 119 119 124 130 134 139
Population 19,249 19,899 20,390 21,877 22,736 23,363 24,511 25,614 26,068 26,146
Per Capita Standard 0.0054 0.0054 0.0055 0.0054 0.0052 0.0051 0.0051 0.0051 0.0051 0.0053
10 Year Average 2010-2019
Quantity Standard 0.0053
Quality Standard $159,587
Service Standard $846
D.C. Amount (before deductions) 10 Year
Forecast Population 6,957
$ per Capita $846
Eligible Amount $5,884,300

Watson & Associates Economists Ltd. PAGE B-14 H:\King\2020 DC Study\Report\Report.docx
Township of King
Service Standard Calculation Sheet
Service: Parks & Recreation - Parkland Trails
Unit Measure: Linear Kilometres of Paths and Trails
Description 2010 2011 2012 2013 2014 2015 2016 2017 2018 2019
2020 Value
($/ Linear
Kilometre)
Trails King City East 2.4 2.4 2.4 2.4 2.4 2.4 2.4 2.4 2.4 2.4 $36,400
Trails King City West 2.0 2.0 2.0 2.0 2.0 2.0 2.0 2.0 2.0 2.0 $36,400
Centennial Park 8.0 8.0 8.0 8.0 8.0 8.0 8.0 8.0 8.0 8.0 $36,400
Davis Park Nobleton 3.0 3.0 3.0 3.0 3.0 3.0 3.0 3.0 3.0 3.0 $36,400
Fox Trail 2.5 2.5 2.5 2.5 2.5 2.5 2.5 2.5 2.5 2.5 $36,400
Fox Trail asphalt 1.0 1.0 1.0 1.0 1.0 1.0 1.0 1.0 1.0 1.0 $74,400
Pottageville Trail 2.0 2.0 2.0 2.0 2.0 2.0 2.0 2.0 2.0 2.0 $36,400
Cold Creek 12.5 12.5 12.5 12.5 12.5 12.5 12.5 12.5 12.5 12.5 $36,400
Rising Star 0.5 0.5 0.5 0.5 0.5 0.5 0.5 0.5 0.5 0.5 $36,400
Dufferin Marsh Path - Asphalt - - 1.0 1.0 1.0 1.0 1.0 1.0 1.0 1.0 $74,400
Laurier - - 0.5 0.5 0.5 0.5 0.5 0.5 0.5 0.5 $36,400
Metrus Subdivision - - - 3.0 3.0 3.0 3.0 3.0 3.0 3.0 $36,400
NEW - Jane Underhill Trail - - - - - - 1.8 1.8 1.8 1.8 $36,400
NEW - King Valley - - - - - - 1.3 1.3 1.3 1.3 $36,400
NEW - King SE - - - - - - 3.5 3.5 3.5 3.5 $36,400
Total 33.9 33.9 35.4 38.4 38.4 38.4 45.0 45.0 45.0 45.0
Population 19,249 19,899 20,390 21,877 22,736 23,363 24,511 25,614 26,068 26,146
Per Capita Standard 0.0018 0.0017 0.0017 0.0018 0.0017 0.0016 0.0018 0.0018 0.0017 0.0017
10 Year Average 2010-2019
Quantity Standard 0.0017
Quality Standard $38,841
Service Standard $66
D.C. Amount (before deductions) 10 Year
Forecast Population 6,957
$ per Capita $66
Eligible Amount $459,371

Watson & Associates Economists Ltd. PAGE B-15 H:\King\2020 DC Study\Report\Report.docx
Township of King
Service Standard Calculation Sheet
Service: Parks & Recreation - Parks Vehicles and Equipment
Unit Measure: No. of vehicles and equipment
Description 2010 2011 2012 2013 2014 2015 2016 2017 2018 20192020 Value
($/Vehicle)
Parks and Recreation Vehicles
Half Ton pick up truck 4x4 - - - - - - 1 2 2 2 $60,000
Three Quarter ton pick up truck 4 x 4 3 3 3 5 5 5 5 5 5 3 $80,000
Three Ton 4x4 Dump Truck 1 1 1 1 1 1 1 1 1 2 $100,000
One ton dump truck 2 2 2 3 3 3 3 3 3 2 $81,700
Utlity Van 1 1 2 3 3 3 3 3 3 3 $46,700
SUV 1 1 1 $52,600
Light Duty Equipment Float Trailer 7 7 6 6 6 6 6 6 6 9 $15,200
Enclosed Trailer 2 2 2 3 3 3 3 3 3 2 $18,600
40hp tractor loader/blade/sander 2 2 2 3 3 3 3 3 3 4 $75,900
7ft Riding Mower 4 4 4 5 5 5 5 5 5 7 $32,700
60hpTractor with loader 1 1 1 1 1 1 1 1 1 2 $64,200
Wide area Mower 1 1 1 2 2 2 2 2 2 2 $93,400
Backhoe - - - - - - - - 1 1 $128,500
All Terrain Vehicle 1 1 1 1 1 1 1 1 1 2 $35,000
250-Gallon Water Tank and
Watering Nozzles 2 2 2 2 2 2 2 2 2 2 $4,100
Toro Pro Core Aerator - - 1 1 1 1 1 1 1 1 $35,000
Wood Chipper - - - - - 1 1 1 1 1 $105,100
Water Truck Pumper - - - - - - - - - 1 $58,400
Sikd steer - - - - - - - - 1 1 $87,600
Trisan Center Arena - Ice Surfacing
Machine 1 2 2 2 2 2 2 2 2 2 $114,900
King City Arena - Ice Surfacing
Machine 1 1 1 1 1 1 1 1 1 1 $114,900
Nobleton Arena - Ice Surfacing
Machine 1 1 1 1 1 1 1 1 1 1 $114,900
Total 30 31 32 40 40 41 42 44 46 52
Population 19,249 19,899 20,390 21,877 22,736 23,363 24,511 25,614 26,068 26,146
Per Capita Standard 0.0016 0.0016 0.0016 0.0018 0.0018 0.0018 0.0017 0.0017 0.0018 0.0020
10 Year Average 2010-2019
Quantity Standard 0.0017
Quality Standard $55,941
Service Standard $95
D.C. Amount (before deductions) 10 Year
Forecast Population 6,957
$ per Capita $95
Eligible Amount $661,611

Watson & Associates Economists Ltd. PAGE B-16 H:\King\2020 DC Study\Report\Report.docx
Township of King
Service Standard Calculation Sheet
Service: Parks & Recreation - Recreation Facilities
Unit Measure: sq.ft. of building area
Description 2010 2011 2012 2013 2014 2015 2016 2017 2018 2019
2020
Bld'g
Value
($/sq.ft.)
Value/sq.ft.
with land,
site works,
etc.
Arena/Community Centre - E/S Doctors
Lane, King City36,547 36,547 36,547 36,547 36,547 36,547 36,547 36,547 36,547 36,547 $263 $362
Storage Bldg. - E/S Doctors Lane, King
City3,040 3,040 3,040 3,040 3,040 3,040 3,040 3,040 3,040 3,040 $57 $135
Senior Citizens Centre - W/S Fisher St.,
King City3,390 3,390 3,390 3,390 3,390 3,390 3,390 3,390 3,390 3,390 $217 $312
Arena/Community Centre - 15 Old King
Rd., Nobleton41,160 41,160 41,160 41,160 41,160 41,160 41,160 41,160 41,160 41,160 $264 $363
Community Hall - S/S Old King Rd.,
Nobleton4,776 4,776 4,776 4,776 4,776 4,776 4,776 4,776 4,776 4,776 $207 $301
Swimming Pool - Old King Rd., Nobleton
Park945 945 945 945 945 945 945 945 945 945 $546 $674
Parks Depot Ops - 251 Weston Rd.,
Schomberg- - - - - - 33,875 33,875 33,875 33,875 $263 $362
Community Hall - 325 Main St.,
Schomberg8,868 8,868 8,868 8,868 8,868 8,868 8,868 8,868 8,868 8,868 $191 $283
Community Hall - W/S Reg. Rd. #56,
Laskey2,068 2,068 2,068 2,068 2,068 2,068 2,068 2,068 2,068 2,068 $249 $347
Community Centre - Pottageville 5,000 5,000 5,000 5,000 5,000 5,000 5,000 5,000 5,000 5,000 $245 $342
Cold Creek Barn** 2,200 2,200 2,200 2,200 2,200 2,200 2,200 2,200 2,200 2,200 $57 $135
Cold Creek Visitor Centre** 1,300 1,300 1,300 1,300 1,300 1,300 1,300 1,300 1,300 1,300 $171 $261
Cold Creek Education Centre** 2,400 2,400 2,400 2,400 2,400 2,400 2,400 2,400 2,400 2,400 $218 $313
Pottageville Pavilion* 1,200 1,200 1,200 1,200 1,200 1,200 1,200 1,200 1,200 1,200 $181 $272
Trisan Centre - 68,000 68,000 68,000 68,000 68,000 68,000 68,000 68,000 68,000 $253 $351
Holy Name - - - 7,000 7,000 7,000 7,000 7,000 - - $253 $351
Ansnorveldt Former School - - - - - - - - 11,000 11,000 $191 $283
King Township Municipal Centre - - - - - - - - 6,000 6,000 $500 $500
Total 112,894 180,894 180,894 187,894 187,894 187,894 221,769 221,769 231,769 231,769
Population 19,249 19,899 20,390 21,877 22,736 23,363 24,511 25,614 26,068 26,146
Per Capita Standard 5.8649 9.0906 8.8717 8.5887 8.2642 8.0424 9.0477 8.6581 8.8909 8.8644
10 Year Average 2010-2019
Quantity Standard 8.4184
Quality Standard $345
Service Standard $2,906
D.C. Amount (before deductions) 10 Year
Forecast Population 6,957
$ per Capita $2,906
Eligible Amount $20,219,060
** all located in Cold Creek 570 acre site
* located in Pottageville Park 17.78 acre site
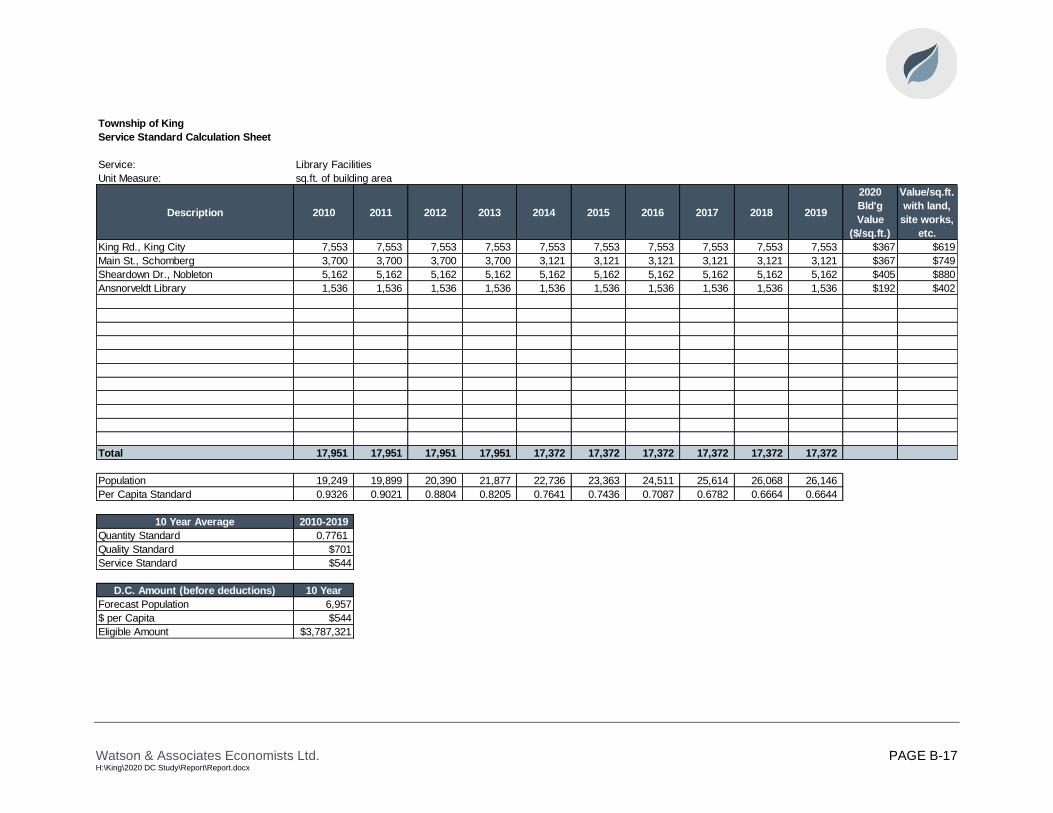
Watson & Associates Economists Ltd. PAGE B-17 H:\King\2020 DC Study\Report\Report.docx
Township of King
Service Standard Calculation Sheet
Service: Library Facilities
Unit Measure: sq.ft. of building area
Description 2010 2011 2012 2013 2014 2015 2016 2017 2018 2019
2020
Bld'g
Value
($/sq.ft.)
Value/sq.ft.
with land,
site works,
etc.
King Rd., King City 7,553 7,553 7,553 7,553 7,553 7,553 7,553 7,553 7,553 7,553 $367 $619
Main St., Schomberg 3,700 3,700 3,700 3,700 3,121 3,121 3,121 3,121 3,121 3,121 $367 $749
Sheardown Dr., Nobleton 5,162 5,162 5,162 5,162 5,162 5,162 5,162 5,162 5,162 5,162 $405 $880
Ansnorveldt Library 1,536 1,536 1,536 1,536 1,536 1,536 1,536 1,536 1,536 1,536 $192 $402
Total 17,951 17,951 17,951 17,951 17,372 17,372 17,372 17,372 17,372 17,372
Population 19,249 19,899 20,390 21,877 22,736 23,363 24,511 25,614 26,068 26,146
Per Capita Standard 0.9326 0.9021 0.8804 0.8205 0.7641 0.7436 0.7087 0.6782 0.6664 0.6644
10 Year Average 2010-2019
Quantity Standard 0.7761
Quality Standard $701
Service Standard $544
D.C. Amount (before deductions) 10 Year
Forecast Population 6,957
$ per Capita $544
Eligible Amount $3,787,321

Watson & Associates Economists Ltd. PAGE B-18 H:\King\2020 DC Study\Report\Report.docx
Township of King
Service Standard Calculation Sheet
Service: Library Collection Materials
Unit Measure: No. of library collection items
Description 2010 2011 2012 2013 2014 2015 2016 2017 2018 20192020 Value
($/item)
Books - Adult 32,170 34,789 37,809 32,705 42,258 36,588 30,471 30,417 28,649 27,354 $36
Books - Junior 26,321 28,463 30,934 26,758 34,574 29,936 24,930 24,886 23,440 22,380 $19
CDs 1,743 1,917 1,996 1,972 1,000 750 500 250 100 40 $27
Talking Books 1,523 1,819 1,997 1,978 1,920 1,920 1,920 1,920 1,920 1,861 $58
Videos/DVDs 3,239 4,219 5,000 5,905 4,958 6,560 6,203 6,367 6,828 7,282 $40
CD ROMS 39 39 39 53 40 33 25 21 21 21 $36
Video Games 13 16 26 56 65 74 79 95 174 174 $70
Periodical (Print subscriptions) 156 155 157 156 156 156 152 152 150 148 $451
Electronic databases (pre 2014 - all
econtent)9 10 12 15 - - - - - - $1,432
Databases - - - - 22 24 36 38 40 37 $1,432
Owned econtent - - - - 75 123 182 442 1,150 1,335 $79
ebooks consortium (Overdrive) - - - 3,022 76,397 78,689 81,050 83,481 85,985 87,677 $0
eaudio consortium (RBI) - - - - - 1,742 1,742 1,742 1,742 1,742 $1
e-periodicals - - - 90 90 90 90 90 90 90 $92
Loaning Laptops - - - - - - 7 7 7 7 $918
Loaning Tablets - - - - - - 7 7 7 7 $270
Curated Music I-pods - - - - - - - - 19 19 $439
3D Printers - Public Use - - - - - - - - 1 3 $4,522
STEAM/DIY Devices - - - - - - - 22 29 47 $165
E-Readers (Kobo) see Technology - - - 6 6 4 4 4 2 2 $204
Early Literacy Stations - - - - - - - 7 7 7 $3,943
Total 65,212 71,427 77,970 72,716 161,560 156,688 147,397 149,947 150,360 150,233
Population 19,249 19,899 20,390 21,877 22,736 23,363 24,511 25,614 26,068 26,146
Per Capita Standard 3.39 3.59 3.82 3.32 7.11 6.71 6.01 5.85 5.77 5.75
10 Year Average 2010-2019
Quantity Standard 5.1319
Quality Standard $19
Service Standard $99
D.C. Amount (before deductions) 10 Year
Forecast Population 6,957
$ per Capita $99
Eligible Amount $686,725

Watson & Associates Economists Ltd. PAGE C-1 H:\King\2020 DC Study\Report\Report.docx
Appendix C Long-Term Capital and Operating Cost Examination


Watson & Associates Economists Ltd. PAGE C-2 H:\King\2020 DC Study\Report\Report.docx
Appendix C: Long-Term Capital and Operating Cost Examination
Township of King
Annual Capital and Operating Cost Impact
As a requirement of the D.C.A. under subsection 10 (2) (c), an analysis must be
undertaken to assess the long-term capital and operating cost impacts for the capital
infrastructure projects identified within the D.C. As part of this analysis, it was deemed
necessary to isolate the incremental operating expenditures directly associated with
these capital projects, factor in cost saving attributable to economies of scale or cost
sharing where applicable and prorate the cost on a per unit basis (i.e. sq.ft. of building
space, per vehicle, etc.). This was undertaken through a review of the Township’s
approved 2019 Financial Information Return (F.I.R.).
In addition to the operational impacts, over time the initial capital projects will require
replacement. This replacement of capital is often referred to as life cycle cost. By
definition, life cycle costs are all the costs which are incurred during the life of a physical
asset, from the time its acquisition is first considered, to the time it is taken out of
service for disposal or redeployment. The method selected for life cycle costing is the
sinking fund method which provides that money will be contributed annually and
invested, so that those funds will grow over time to equal the amount required for future
replacement. The following factors were utilized to calculate the annual replacement
cost of the capital projects (annual contribution = factor X capital asset cost) and are
based on an annual growth rate of 2% (net of inflation) over the average useful life of
the asset:

Watson & Associates Economists Ltd. PAGE C-3 H:\King\2020 DC Study\Report\Report.docx
Table C-1 depicts the annual operating impact resulting from the proposed gross capital
projects at the time they are all in place. It is important to note that, while Township
program expenditures will increase with growth in population, the costs associated with
the new infrastructure (i.e. facilities) would be delayed until the time these works are in
place.
Average Useful Life Factor
Water Distribution 75 0.00585508
Wastewater Sewers 75 0.00585508
Stormwater Management 75 0.00585508
Public Works Vehicles & Equipment 12 0.07455960
Parkland Development 30 0.02464992
Parks and Recreation Vehicles & Equipment 10 0.09132653
Facilities 40 0.01655575
Library Collection Materials 7 0.13451196
Roads 35 0.02000221
Sidewalks 35 0.02000221
Fire Vehicles 10 0.09132653
Fire Equipment and Gear 10 0.09132653
AssetLifecycle Cost Factors

Watson & Associates Economists Ltd. PAGE C-4 H:\King\2020 DC Study\Report\Report.docx
Table C-1 Township of King
Operating and Capital Expenditure Impacts for Future Capital Expenditures
SERVICE/CLASS OF SERVICE
GROSS COST LESS
BENEFIT TO
EXISTING
ANNUAL LIFECYCLE
EXPENDITURES
ANNUAL
OPERATING
EXPENDITURES
TOTAL ANNUAL
EXPENDITURES
1. Water & Wastewater Studies and Capital Improvements
1.1 Water Services 637,500 - - -
1.2 Wastewater Services 737,500 3,183 96,571 96,571
2. Stormwater Services
2.1 Channels, drainage and ponds 1,575,000 38,775 - 38,775
3. Water Services
3.1 Distribution systems 11,312,450 286,526 1,584,201 1,870,727
4. Wastewater Services - King City
4.1 Sewers 9,924,007 371,246 862,724 1,233,970
5. Wastewater Services - Nobleton
5.1 Sewers 5,773,383 138,717 234,264 372,981
6. Services Related to a Highway
6.1 Roads 138,134,667 2,634,693 3,183,587 5,818,280
6.2 Depots and Domes 21,538,000 1,317,189 496,386 1,813,575
6.3 PW Rolling Stock 1,520,000 144,088 35,031 179,119
7. Fire Protection Services
7.1 Fire facilities, vehicles & equipment 4,969,573 347,562 1,392,143 1,739,705
8. Parks and Recreation Services
8.1
Parkland development, amenities, trails, recreation facilities, vehicles &
equipment76,036,518
3,419,442 1,820,247 5,239,689
9. Library Services
9.1 Library facilities 6,026,724 385,288 449,172 834,460
9.2 Library materials 650,000 100,430 48,445 148,875
10. Growth Studies
10.1 Stormwater Drainage and Control Services 48,600 - -
10.2 Wastewater Services 134,400 - -
10.3 Water Services 129,900 - -
10.4 Services Related to a Highway 1,095,800 - -
10.5 Fire Protection Services 107,000 - -
10.6 Parks and Recreation Services 120,500 - -
10.7 Library Services 190,700 - -
Total 280,662,222 9,187,139 10,202,771 19,386,727


Watson & Associates Economists Ltd. PAGE D-1 H:\King\2020 DC Study\Report\Report.docx
Appendix D D.C. Reserve Fund Policy

Watson & Associates Economists Ltd. PAGE D-2 H:\King\2020 DC Study\Report\Report.docx
Appendix D: D.C. Reserve Fund Policy
D.1 Legislative Requirements
The Development Charges Act, 1997 (D.C.A.) requires development charge collections
(and associated interest) to be placed in separate reserve funds. Sections 33 through
36 of the Act provide the following regarding reserve fund establishment and use:
• A municipality shall establish a reserve fund for each service to which the D.C.
by-law relates; section 7, however, allows services to be grouped into categories
of services for reserve fund (and credit) purposes and for classes of services to
be established.
• The municipality shall pay each development charge it collects into a reserve
fund or funds to which the charge relates.
• The money in a reserve fund shall be spent only for the “capital costs”
determined through the legislated calculation process (as per subsection 5 (1)
2-8).
• Money may be borrowed from the fund but must be paid back with interest
(O. Reg. 82/98, subsection 11 (1) defines this as Bank of Canada rate either on
the day the by-law comes into force or, if specified in the by-law, the first
business day of each quarter).
• D.C. reserve funds may not be consolidated with other municipal reserve funds
for investment purposes and may only be as an interim financing source for
capital undertakings for which development charges may be spent (section 37).
Annually, the Treasurer of the municipality is required to provide Council with a financial
statement related to the D.C. by-law(s) and reserve funds. This statement must be
made available to the public and may be requested to be forwarded to the Minister of
Municipal Affairs and Housing. The D.C.A. does not prescribe how the statement is to
be made available to the public. We would recommend that a resolution of Council
make the statement available on the municipality’s website or upon request.
Subsection 43 (2) and O. Reg. 82/98 prescribes the information that must be included in
the Treasurer’s statement, as follows:
• opening balance;
• closing balance;
Watson & Associates Economists Ltd. PAGE D-3 H:\King\2020 DC Study\Report\Report.docx
• description of each service and/or service category for which the reserve fund
was established (including a list of services within a service category);
• transactions for the year (e.g. collections, draws) including each assets capital
costs to be funded from the D.C. reserve fund and the manner for funding the
capital costs not funded under the D.C. by-law (i.e. non-D.C. recoverable cost
share and post-period D.C. recoverable cost share);
• for projects financed by development charges, the amount spent on the project
from the D.C. reserve fund and the amount and source of any other monies
spent on the project.
• amounts borrowed, purpose of the borrowing and interest accrued during
previous year;
• amount and source of money used by the municipality to repay municipal
obligations to the D.C. reserve fund;
• list of credits by service or service category (outstanding at beginning of the year,
given in the year and outstanding at the end of the year by holder);
• for credits granted under section 14 of the previous D.C.A., a schedule identifying
the value of credits recognized by the municipality, the service to which it applies
and the source of funding used to finance the credit; and
• a statement as to compliance with subsection 59 (1) of the D.C.A., whereby the
municipality shall not impose, directly or indirectly, a charge related to a
development or a requirement to construct a service related to development,
except as permitted by the D.C.A. or another Act.
Based upon the above, Figure 1, and Attachments 1 and 2, set out the format for which
annual reporting to Council should be provided.
D.2 D.C. Reserve Fund Application
Section 35 of the D.C.A. states that:
“The money in a reserve fund established for a service may be spent only for capital costs determined under paragraphs 2 to 8 of subsection 5(1).”
This provision clearly establishes that reserve funds collected for a specific service are
only to be used for that service, or to be used as a source of interim financing of capital
undertakings for which a development charge may be spent.

Watson & Associates Economists Ltd. PAGE D-4 H:\King\2020 DC Study\Report\Report.docx
Figure D-1 Township of King
Annual Treasurer’s Statement of D.C. Reserve Funds
Services
Related to a
Highway
Water
Services
Wastewater
Services -
King City
Wastewater
Services -
Nobleton
Water and
Wastewater
Studies
Stormwater
Drainage and
Control Services
Fire
Protection
Services
Parks and
Recreation
Services
Library
Services Growth Studies
Opening Balance, January 1, ________ 0
Plus:
Development Charge Collections 0
Accrued Interest 0
Repayment of Monies Borrowed from Fund and Associated Interest1 0
Sub-Total 0 0 0 0 0 0 0 0 0
Less:
Amount Transferred to Capital (or Other) Funds2 0
Amounts Refunded 0
Amounts Loaned to Other D.C. Service Category for Interim Financing 0
Credits3
0
Sub-Total 0 0 0 0 0 0 0 0 0
Closing Balance, December 31, ________ 0 0 0 0 0 0 0 0 01 Source of funds used to repay the D.C. reserve fund
2 See Attachment 1 for details
3 See Attachment 2 for details
The Municipality is compliant with s.s. 59.1 (1) of the Development Charges Act , whereby charges are not directly or indirectly imposed on development nor has a requirement to construct a service related to development been
imposed, except as permitted by the Development Charges Act or another Act.
Total
Services to which the Development Charge Relates
Description

Watson & Associates Economists Ltd. PAGE D-5 H:\King\2020 DC Study\Report\Report.docx
Attachment D-1 Township of King
Amount Transferred to Capital (or Other) Funds – Capital Fund Transaction
D.C. Recoverable Cost Share Non-D.C. Recoverable Cost Share
D.C. Forecast Period Post D.C. Forecast Period
Capital Fund Transactions
Gross Capital
Cost
D.C. Reserve
Fund Draw
D.C. Debt
Financing
Grants,
Subsidies
Other
Contributions
Post-Period
Benefit/
Capacity Interim
Financing
Grants,
Subsidies
Other
Contributions
Other
Reserve/Reser
ve Fund Draws
Tax Supported
Operating Fund
Contributions
Rate Supported
Operating Fund
Contributions Debt Financing
Grants,
Subsidies
Other
Contributions
Services Related to a Highway
Capital Cost A
Capital Cost B
Capital Cost C
Sub-Total - Services Related to Highways $0 $0 $0 $0 $0 $0 $0 $0 $0 $0 $0
Parks and Recreation
Capital Cost D
Capita Cost E
Capital Cost F
Sub-Total - Parks and Recreation $0 $0 $0 $0 $0 $0 $0 $0 $0 $0 $0
Library Services
Capital Cost G
Capita Cost H
Capital Cost I
Sub-Total - Library Services $0 $0 $0 $0 $0 $0 $0 $0 $0 $0 $0

Watson & Associates Economists Ltd. PAGE D-6 H:\King\2020 DC Study\Report\Report.docx
Attachment D-2 Township of King
Statement of Credit Holder Transactions
Credit Holder
Applicable D.C.
Reserve Fund
Credit Balance
Outstanding
Beginning of
Year ________
Additional
Credits
Granted During
Year
Credits Used
by Holder
During Year
Credit Balance
Outstanding
End of Year
________
Credit Holder A
Credit Holder B
Credit Holder C
Credit Holder D
Credit Holder E
Credit Holder F

Watson & Associates Economists Ltd. PAGE E-1 H:\King\2020 DC Study\Report\Report.docx
Appendix E Local Service Policy


Watson & Associates Economists Ltd. PAGE E-2 H:\King\2020 DC Study\Report\Report.docx
Appendix E: Local Service Policy
This Appendix sets out the Township of King’s General Policy Guidelines on
Development Charges (D.C.) and local service funding for Services Related to a
Highway, Stormwater Management, Parkland Development, and Underground Linear
Services. The guidelines outline, in general terms, the nature of engineered
infrastructure that is included in the study as a development charge project, versus
infrastructure that is considered as a local service, to be emplaced separately by
landowners, pursuant to a development agreement.
The following policy guidelines are general principles by which staff will be guided in
considering development applications. However, each application will be considered, in
the context of these policy guidelines and subsection 59(2) of the Development
Charges Act, 1997, on its own merits having regard to, among other factors, the nature,
type and location of the development and any existing and proposed development in the
surrounding area, as well as the location and type of services required and their
relationship to the proposed development and to existing and proposed development in
the area.
E.1 Services Related to a Highway
A highway and services related to a highway are intended for the transportation of
people and goods via many different modes including, but not limited to passenger
automobiles, commercial vehicles, transit vehicles, bicycles, and pedestrians. The
highway shall consist of all land and associated infrastructure built to support (or
service) this movement of people and goods regardless of the mode of transportation
employed, thereby achieving a complete street. A complete street is the concept
whereby a highway is planned, designed, operated and maintained to enable
pedestrians, cyclists, public transit users and motorists to safely and comfortably be
moved, thereby allowing for the efficient movement of persons and goods.
The associated infrastructure to achieve this concept shall include, but is not limited to:
road pavement structure and curbs; grade separation/bridge structures (for any
vehicles, railways and/or pedestrians); traffic calming and control, grading, drainage and
retaining wall features; culvert structures; storm water drainage systems; utilities; traffic
control systems; signage; gateway features; street furniture; active transportation

Watson & Associates Economists Ltd. PAGE E-3 H:\King\2020 DC Study\Report\Report.docx
facilities (e.g. sidewalks, bike lanes, multi-use trails which interconnect the
transportation network, etc.); roadway illumination systems; boulevard and median
surfaces (e.g. sod & topsoil, paving, etc.); street trees and landscaping; parking lanes &
lay-bys; and driveway entrances; noise attenuation systems; railings and safety barriers.
E.1.1 Local and Collector Roads (including land)
a. Collector Roads Internal to Development, inclusive of all land and associated
infrastructure – direct developer responsibility under s.59 of the D.C.A. as a local
service.
b. Collector Roads External to Development, inclusive of all land and associated
infrastructure – if needed to support a specific development or required to link with
the area to which the plan relates, direct developer responsibility under s.59 of the
D.C.A.; otherwise, included in D.C. calculation to the extent permitted under s.5(1)
of the D.C.A. (dependent on local circumstances).
c. All local roads are considered to be the developer’s responsibility.
E.1.2 Arterial Roads
a. New, widened, extended or upgraded arterial roads, inclusive of all associated
infrastructure: Included as part of road costing funded through D.C.A., s.5(1).
b. Land acquisition for arterial roads on existing rights-of-way to achieve a complete
street: dedication under the Planning Act provisions (s. 41, 51 and s. 53) through
development lands; in area with limited development: included in D.C.’s.
c. Land acquisition for arterial roads on new rights-of-way to achieve a complete street:
dedication, where possible, under the Planning Act provisions (s. 51 and s. 53)
through development lands up to the R.O.W. specified in the Official Plan.
d. Land acquisition beyond normal dedication requirements to achieve transportation
corridors as services related to highways including grade separation infrastructure
for the movement of pedestrians, cyclists, public transit and/or railway vehicles:
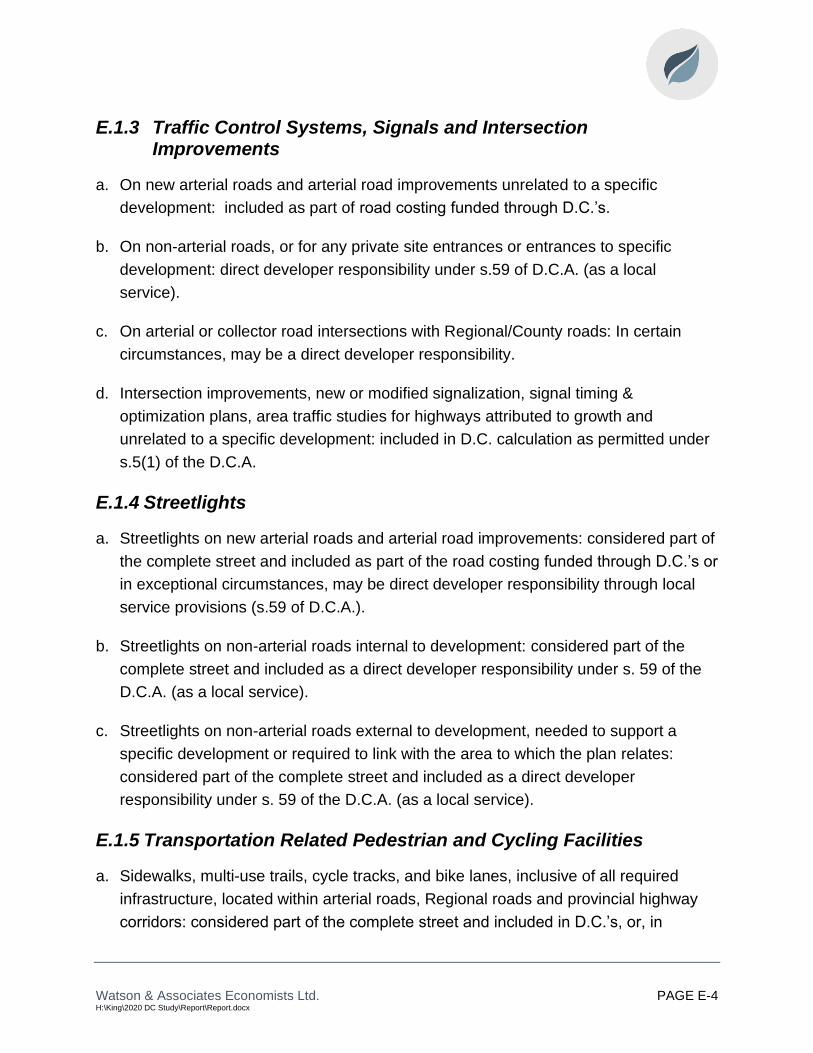
Watson & Associates Economists Ltd. PAGE E-4 H:\King\2020 DC Study\Report\Report.docx
E.1.3 Traffic Control Systems, Signals and Intersection Improvements
a. On new arterial roads and arterial road improvements unrelated to a specific
development: included as part of road costing funded through D.C.’s.
b. On non-arterial roads, or for any private site entrances or entrances to specific
development: direct developer responsibility under s.59 of D.C.A. (as a local
service).
c. On arterial or collector road intersections with Regional/County roads: In certain
circumstances, may be a direct developer responsibility.
d. Intersection improvements, new or modified signalization, signal timing &
optimization plans, area traffic studies for highways attributed to growth and
unrelated to a specific development: included in D.C. calculation as permitted under
s.5(1) of the D.C.A.
E.1.4 Streetlights
a. Streetlights on new arterial roads and arterial road improvements: considered part of
the complete street and included as part of the road costing funded through D.C.’s or
in exceptional circumstances, may be direct developer responsibility through local
service provisions (s.59 of D.C.A.).
b. Streetlights on non-arterial roads internal to development: considered part of the
complete street and included as a direct developer responsibility under s. 59 of the
D.C.A. (as a local service).
c. Streetlights on non-arterial roads external to development, needed to support a
specific development or required to link with the area to which the plan relates:
considered part of the complete street and included as a direct developer
responsibility under s. 59 of the D.C.A. (as a local service).
E.1.5 Transportation Related Pedestrian and Cycling Facilities
a. Sidewalks, multi-use trails, cycle tracks, and bike lanes, inclusive of all required
infrastructure, located within arterial roads, Regional roads and provincial highway
corridors: considered part of the complete street and included in D.C.’s, or, in

Watson & Associates Economists Ltd. PAGE E-5 H:\King\2020 DC Study\Report\Report.docx
exceptional circumstances, may be direct developer responsibility through local
service provisions (s.59 of D.C.A.).
b. Sidewalks, multi-use trails, cycle tracks, and bike lanes, inclusive of all required
infrastructure, located within or linking to non-arterial road corridors internal to
development: considered part of the complete street; direct developer responsibility
under s.59 of D.C.A. (as a local service).
c. Other sidewalks, multi-use trails, cycle tracks, and bike lanes, inclusive of all
required infrastructure, located within non-arterial road corridors external to
development and needed to support a specific development or required to link with
the area to which the plan relates: direct developer responsibility under s.59 of
D.C.A. (as a local service).
d. Multi-use trails (not associated with a road), inclusive of all land and required
infrastructure, that go beyond the function of a (parkland) recreational trail and form
part of the municipality’s active transportation network for cycling and/or walking:
included in D.C.’s
E.1.6 Noise Abatement Measures
a. a. Noise abatement measures external and internal to development where it is
related to, or a requirement of a specific development: direct developer responsibility
under s.59 of D.C.A. (as a local service).
b. Noise abatement measures on new arterial roads and arterial road improvements
abutting an existing community and unrelated to a specific development: included as
part of road costing funded through D.C.’s.
E.2 Stormwater Management
a. Stormwater facilities for quality and/or quantity management, including downstream
erosion works, inclusive of land and all associated infrastructure, such as
landscaping and perimeter fencing: direct developer responsibility under s.59 of
D.C.A. (as a local service).
b. Over-sizing cost of stormwater facilities capacity, excluding land, to accommodate
runoff from new, widened, extended or upgraded municipal arterial roads that are

Watson & Associates Economists Ltd. PAGE E-6 H:\King\2020 DC Study\Report\Report.docx
funded as a development charges project: included as part of road costing funded
through D.C.’s.
c. Erosion works, inclusive of all restoration requirements, related to a development
application: direct developer responsibility under s. 59 of the D.C.A. (as a local
service).
d. Monitoring works: included in D.C.’s consistent with the D.C.A., s.5(1).
e. Storm sewer systems and drainage works that are required for a specific
development, either internal or external to the area to which the plan relates: direct
developer responsibility under s. 59 of the D.C.A. (as a local service).
f. Capacity upsizing or improvements to storm sewer systems and drainage works that
are required as a result of recent, planned or anticipated intensification or
development: in some circumstances, these costs may be included in the D.C.
g. Note: for stormwater minimum pipe sizes, refer to section E.5.
E.3 Parkland Development
E.3.1 Parkland
a. Parkland Development for Community Parks, District Parks, Neighbourhood Parks
and Village Squares: direct developer responsibility to provide at base condition, as
follows:
• Clearing and grubbing. Tree removals as per the subdivision’s tree preservation
and removals plan.
• Topsoil Stripping, screening, and stockpiling.
• Rough grading (pre-grading) to allow for positive drainage of the Park, with
minimum slopes of 2%. If necessary, this may include some minor drainage tile
work and grading as per the overall subdivision grading design complete with any
required swales or catch basins. Runoff from the development property shall not
drain into the park unless approved by the Director of Community Services.
• Spreading of topsoil up to 300 mm with a minimum depth of 150mm (screened
imported topsoil if existing on-site is insufficient to reach required depth).

Watson & Associates Economists Ltd. PAGE E-7 H:\King\2020 DC Study\Report\Report.docx
• Sodding of site, maintenance of sod until acceptance by the Township. If park is
to be constructed by the Township, a financial contribution will be required.
• Parks shall be free of any contaminated soil or subsoil.
• Parks shall not be mined for fill.
• Parks shall be conveyed free and clear of all encumbrances.
• 100% of 1.5m chain link perimeter fencing to the Township standards to separate
the development lands from Township lands or lands to be dedicated to the
Township, unless the perimeter fencing is on land that will be dedicated to the
Township to fulfil the requirement of parkland dedication under the Planning Act,
in which case the cost shall be shared 50/50.
• When Park parcels cannot be developed in a timely manner, they shall be
graded to ensure positive drainage and seeded to minimize erosion and dust.
These shall be maintained by the developer until construction commences
thereon.
• The Park block shall not be used for the storage of topsoil or other construction
material, equipment storage, or sales pavilions.
• Required heritage features within the Park as set out within the Planning
approval conditions.
b. Program facilities, amenities, and furniture, within parkland: are included in D.C.’s.
E.3.2. Landscape Buffer Blocks, Features, Cul-de-sac Islands, Berms, Grade Transition Areas, Walkway Connections to Adjacent Arterial Roads, Open Space, Etc.
a. The cost of developing all landscape buffer blocks, landscape features, cul-de- sac
islands, berms, grade transition areas, walkway connections to adjacent arterial
roads, open space and other remnant pieces of land conveyed to the Township shall
be a direct developer responsibility as a local service. Such costs include but are not
limited to:
• pre-grading, sodding or seeding, supply and installation of amended topsoil, (to the
Township’s 150mm required depth), landscape features, perimeter fencing and
amenities and all planting.
• Perimeter fencing to the Township standard located on the public property side of
the property line adjacent land uses (such as but limited to arterial roads) as
directed by the Township.

Watson & Associates Economists Ltd. PAGE E-8 H:\King\2020 DC Study\Report\Report.docx
E.4 Natural Heritage System (N.H.S.)
N.H.S. includes engineered and in situ stream corridors, natural buffers for woodlots,
wetland remnants, etc. as well as subwatersheds within the boundaries of the
Township.
Direct developer responsibility as a local service provision including but not limited to
the following:
a. Riparian planting and landscaping requirements (as required by the Township,
Conservation Authority or other authorities having jurisdiction) as a result of creation
of, or construction within in the N.H.S. and associated buffers.
b. Perimeter fencing of the N.H.S. to the Township standard located on the public
property side of the property line adjacent land uses (residential, industrial,
commercial) as required by the Township.
E.4.1 Infrastructure Assets Constructed by Developers
c. All infrastructure assets constructed by Developers must be designed in accordance
with the Township’s Engineering and Parks Standards Manual as revised
d. All infrastructure assets shall be conveyed in accordance with the Township’s
Engineering and Parks Standards Manual as revised
e. Any Parks and Open Space infrastructure assets approved to be built by the
developer on behalf of the Township shall be in accordance with the Township’s
Park Development Standards Policy.
E.5 Underground Services (Stormwater, Water and Sanitary Sewers)
Underground services (linear infrastructure for stormwater, water, and sanitary services)
within the road allowance are not included in the cost of road infrastructure and are
treated separately. The responsibility for such services as well as stormwater
management ponds and pumping stations, which are undertaken as part of new
developments or redevelopments, will be determined by the following principles:

Watson & Associates Economists Ltd. PAGE E-9 H:\King\2020 DC Study\Report\Report.docx
The costs of the following items shall be direct developer responsibilities as a local
service:
a. providing all underground services internal to the development, including storm,
water and sanitary services;
b. providing service connections from existing underground services to the
development;
c. providing new underground services or upgrading existing underground services
external to the development if the services are required to service the development,
and if the pipe sizes do not exceed 300mm for water and sanitary services and 900
mm for stormwater services. If external services are required by two or more
developments, the developer for the first development will be responsible for the
cost of the external services and may enter into front-ending/cost-sharing
agreements with other developers independent of the Township;
d. providing stormwater management ponds and other facilities required by the
development including all associated features such as landscaping and fencing; and
e. water booster pumping stations, reservoir pumping stations and/or sanitary pumping
stations serving individual developments.
The costs of the following items shall be paid through development charges:
f. Sampling stations associated with municipal service areas to be included within the
D.C.;
g. Water and wastewater transmission mains associated with municipal service areas
shall be included in the D.C.;
h. external underground services involving trunk infrastructure; and
i. water, and/or sanitary pumping stations not required for the individual development.
Watson & Associates Economists Ltd. PAGE F-1 H:\King\2020 DC Study\Report\Report.docx
Appendix F Asset Management Plan

Watson & Associates Economists Ltd. PAGE F-2 H:\King\2020 DC Study\Report\Report.docx
Appendix F: Asset Management Plan
The recent changes to the D.C.A. (new subsection 10 (2) (c.2)) require that the
background study must include an asset management plan (A.M.P.) related to new
infrastructure. Section 10 (3) of the D.C.A. provides:
“The asset management plan shall,
(a) deal with all assets whose capital costs are proposed to be funded under the development charge by-law;
(b) demonstrate that all the assets mentioned in clause (a) are financially sustainable over their full life cycle;
(c) contain any other information that is prescribed; and
(d) be prepared in the prescribed manner.”
In regard to the above, section 8 of the Regulations was amended to include
subsections (2), (3) and (4) which set out for specific detailed requirements for transit
(only). For all services except transit, there are no prescribed requirements at this time
thus requiring the municipality to define the approach to include within the background
study.
At a broad level, the A.M.P. provides for the long-term investment in an asset over its
entire useful life along with the funding. The schematic below identifies the costs for an
asset through its entire lifecycle. For growth-related works, the majority of capital costs
will be funded by the D.C. Non-growth-related expenditures will then be funded from
non-D.C. revenues as noted below. During the useful life of the asset, there will be
minor maintenance costs to extend the life of the asset along with additional program
related expenditures to provide the full services to the residents. At the end of the life of
the asset, it will be replaced by non-D.C. financing sources.
It should be noted that with the recent passing of the Infrastructure for Jobs and
Prosperity Act (I.J.P.A.) municipalities are now required to complete A.M.P.s, based on
certain criteria, which are to be completed by 2021 for core municipal services and 2023
for all other services. The amendments to the D.C.A. do not require municipalities to
complete these A.M.P.s (required under I.J.P.A.) for the D.C. background study, rather
the D.C.A. requires that the D.C. background study include information to show the
assets to be funded by the D.C. are sustainable over their full lifecycle.

Watson & Associates Economists Ltd. PAGE F-3 H:\King\2020 DC Study\Report\Report.docx
Purchase
Install
Commission
Operate
Maintain
Monitor
(Throughout Life
of Assets)
(To End of
Useful Life)
Removal/Decommission
Disposal
New Assets
Replacement Assets
Reserves/Reserve Funds
Debentures
User Fees
Grants
Other
Proceeds on Disposal
Funding of Disposal /
Decommissioning Costs
Operating Budget
Financing Methods
Purchase
Install
Commission
Operate
Maintain
Monitor
(Throughout Life
of Assets)
(To End of
Useful Life)
Removal/Decommission
Disposal
In 2012, the Province developed Building Together: Guide for municipal asset
management plans which outlines the key elements for an A.M.P., as follows:
State of local infrastructure: asset types, quantities, age, condition, financial
accounting valuation and replacement cost valuation.
Desired levels of service: defines levels of service through performance measures
and discusses any external trends or issues that may affect expected levels of service
or the municipality’s ability to meet them (for example, new accessibility standards,
climate change impacts).
Asset management strategy: the asset management strategy is the set of planned
actions that will seek to generate the desired levels of service in a sustainable way,
while managing risk, at the lowest lifecycle cost.
Financing strategy: having a financial plan is critical for putting an A.M.P. into action.
By having a strong financial plan, municipalities can also demonstrate that they have

Watson & Associates Economists Ltd. PAGE F-4 H:\King\2020 DC Study\Report\Report.docx
made a concerted effort to integrate the A.M.P. with financial planning and municipal
budgeting and are making full use of all available infrastructure financing tools.
Commensurate with the above, the Township prepared an A.M.P. in 2016 for its existing
assets however, did not take into account future growth-related assets. As a result, the
asset management requirement for the D.C. must be undertaken in the absence of this
information.
In recognition to the schematic above, the following table (presented in 2020 $) has
been developed to provide the annualized expenditures and revenues associated with
new growth. Note that the D.C.A. does not require an analysis of the non-D.C. capital
needs or their associated operating costs so these are omitted from the table below. As
well, as all capital costs included in the D.C.-eligible capital costs are not included in the
Township’s A.M.P., the present infrastructure gap and associated funding plan have not
been considered at this time. Hence the following does not represent a fiscal impact
assessment (including future tax/rate increases) but provides insight into the potential
affordability of the new assets:
1. The non-D.C. recoverable portion of the projects which will require financing from
municipal financial resources (i.e. taxation, rates, fees, etc.). This amount has
been presented on an annual debt charge amount based on 20-year financing.
2. Lifecycle costs for the 2020 D.C. capital works have been presented based on a
sinking fund basis. The assets have been considered over their estimated useful
lives.
3. Incremental operating costs for the D.C. services (only) have been included.
4. The resultant total annualized expenditures are $23 million.
5. Consideration was given to the potential new taxation and user fee revenues
which will be generated as a result of new growth. These revenues will be
available to finance the expenditures above. The new operating revenues are
$16.3 million. This amount, totalled with the existing operating revenues of $77.9
million, provide annual revenues of $94.2 million by the end of the period.
6. In consideration of the above, the capital plan is deemed to be financially
sustainable.
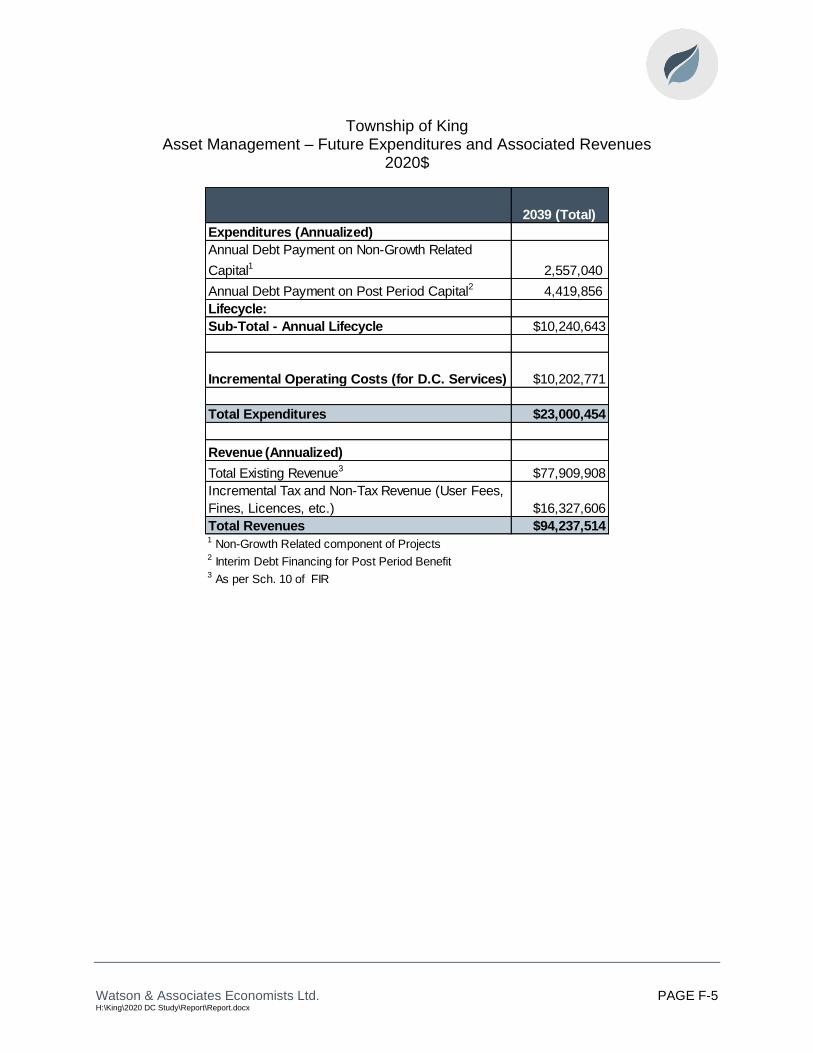
Watson & Associates Economists Ltd. PAGE F-5 H:\King\2020 DC Study\Report\Report.docx
Township of King Asset Management – Future Expenditures and Associated Revenues
2020$
2039 (Total)
Expenditures (Annualized)
Annual Debt Payment on Non-Growth Related
Capital1
2,557,040
Annual Debt Payment on Post Period Capital2
4,419,856
Lifecycle:
Sub-Total - Annual Lifecycle $10,240,643
Incremental Operating Costs (for D.C. Services) $10,202,771
Total Expenditures $23,000,454
Revenue (Annualized)
Total Existing Revenue3
$77,909,908
Incremental Tax and Non-Tax Revenue (User Fees,
Fines, Licences, etc.) $16,327,606
Total Revenues $94,237,514
3 As per Sch. 10 of FIR
1 Non-Growth Related component of Projects2 Interim Debt Financing for Post Period Benefit
Watson & Associates Economists Ltd. PAGE G-1 H:\King\2020 DC Study\Report\Report.docx
Appendix G Proposed D.C. By-law


Page 1 of 20
THE CORPORATION OF THE TOWNSHIP OF KING
BY-LAW NUMBER 2021-XXX
A BY-LAW FOR THE IMPOSITION OF DEVELOPMENT CHARGES
WHEREAS the Corporation of the Township of King will experience growth through
Development and redevelopment;
AND WHEREAS Development and redevelopment requires the provision of physical and
social services by the Township of King;
AND WHEREAS Council desires to ensure that the capital cost of meeting growth-related
demands for or burden on municipal services does not place an excessive financial burden on
the Township of King or its existing taxpayers while at the same time ensuring new taxpayers
contribute no more than the net capital cost attributable to providing the current level of municipal
services;
AND WHEREAS the Development Charge Act, 1997 (the “Act”) provides that the council
of a municipality may by by-law impose Development Charges against land to pay for increased
capital costs required because of increased needs for services;
AND WHEREAS a Development Charge Background Study has been completed in
accordance with the Act;
AND WHEREAS the Council of The Corporation of the Township of King has given notice
of and held a public meeting on the 14th day of December, 2020 in accordance with the Act and
the regulations thereto;
NOW THEREFORE THE COUNCIL OF THE CORPORATION OF THE TOWNSHIP OF
KING ENACTS AS FOLLOWS:
1. DEFINITIONS

Page 2 of 20
1.1 In this By-law the following items shall have the corresponding meanings:
1.1.1 “Act” means the Development Charge Act, 1997 as amended, or any successor thereof;
1.1.2 “Accessory” use means that the use, Building or Structure is naturally and normally
incidental to or subordinate in purpose or both, and exclusively devoted to a principal use,
Building or Structure
1.1.3 “Agricultural Use” means lands or Buildings, excluding any portion thereof used as a
Dwelling Unit, used or designed or intended for use for the purpose of a bona fide farming
operation operated by a Bona Fide Farmer, including, but not limited to, animal husbandry,
dairying, livestock, fallow, field crops, removal of sod, forestry, fruit farming, horticulture,
market gardening, pasturage, poultry keeping, equestrian facilities and any other activities
customarily carried on in agriculture, but does not include a Building, Structure or
greenhouse or part thereof solely designed, used or intended to be used for the growing,
cultivation, harvesting, drying, processing, testing, trimming, storage, or sale of Cannabis;
1.1.4 “Apartment Building” means a Residential Building or the Residential portion of a mixed
use Building, other than a townhouse or stacked townhouse, consisting of more than three
(3) Dwelling Units, which Dwelling Units have a common access or entrance to Grade;
1.1.5 “Board of Education” has the same meaning as set out in the Education Act, R.S.O. 1990,
Chap. E.2, as amended, or any successor thereof;
1.1.6 “Bona Fide Farmer” means an individual currently actively engaged in a farm operation
with a valid Province of Ontario Farm Business Registration number within the Township
of King;
1.1.7 “Building” means a building or structure occupying an area greater than 10 square meters
consisting of a wall, roof, and floor or any of them or a structural system serving the
function thereof, including an air supported Structure or mezzanine.
1.1.8 “Cannabis” means”:
1.1.8.1 A plant that belongs to the genus cannabis;
Page 3 of 20
1.1.8.2 Any part of such a plant, including the phytocannabinoids produced by , or found
in, such a plant, regardless of whether that part has been processed or not;
1.1.8.3 Any substance or mixture of substances that contains or has on it any part of
such a plant; and
1.1.8.4 Any substance that is identical to any phytocannabinoid produced by, or found
in, such a plant, regardless of how the substance was obtained or produced
1.1.9 “Class” means a grouping of services combined to create a single service for the purposes
of this by-law and as provided in section 7 of the Development Charges Act;
1.1.10 “Commercial” means any Non-Residential Development other than “Institutional” or
“Industrial”;
1.1.11 “Council” means the Council of the Corporation of the Township of King;
1.1.12 “Development” means the construction, erection or placing of one or more Buildings on
land or the making of an addition or alteration to a Building that has the effect of increasing
the size of usability thereof, and includes redevelopment;
1.1.13 “Development Charge” means a charge imposed with respect to this By-law;
1.1.14 “Dwelling Unit” means a room or suite of rooms used, or designed or intended for use by
one person or persons living together, in which culinary and sanitary facilities are provided
for the exclusive use of such person or persons;
1.1.15 “Existing” means the number, use and size that existed as of the date this by-law was
passed;
1.1.16 “Grade” means the average level of finished ground adjoining a Building at all exterior
walls;
1.1.17 “Gross Floor Area” means:
1.1.17.1 in the case of a Residential Building, the total area of all floors above Grade of
a Dwelling Unit measured between the outside surfaces of exterior walls or
between the outside surfaces of exterior walls and the centre line of party walls

Page 4 of 20
dividing the Dwelling Unit from any other Dwelling Unit or other portion of a
Building; and
1.1.17.2 in the case of a Non-Residential Building, or the Non-Residential portion of a
mixed-use Building, the aggregate of the areas of each floor, whether above or
below Grade, measured between the exterior faces of the exterior walls of the
Building or from the centre line of a common wall separating a Non-Residential
and a Residential use, excluding, in the case of a Building containing an atrium,
the sum of the areas of the atrium at the level of each floor surrounding the
atrium above the floor level of the atrium, and excluding, in the case of a Building
containing parking spaces, the sum of the areas of each floor used, or designed
or intended for use for the parking of motor vehicles unless the Building is a
parking Structure, and, for the purposes of this definition, notwithstanding any
other section of this by-law, the Non-Residential portion of a mixed-use Building
is deemed to include one-half of any area common to the Residential and Non-
Residential portions of such mixed-use Building. Notwithstanding any other
section of this by-law, Gross Floor Area shall not include the surface area of
swimming pools or the playing surfaces of indoor sport fields including hockey
arenas and basketball courts, or, in the case of Industrial, office or Institutional
Buildings, a part of such Building above or below Grade or a stand-alone
Building above or below Grade that is used for the parking of motor vehicles
which is associated with but Accessory to such Industrial, office or Institutional
Building;
1.1.17.3 The measures determined in subsection (b) above shall be expressed or
converted to metric square meters and rounded to two decimal places for
application to the non-residential development charge rates set out in Schedule
“B”. For clarity, the conversion rate to be used is 1 sq. ft. = 0.09290304 m².
1.1.18 “Group Home” means a Residential Building or the Residential portion of a mixed use
Building containing a single housekeeping unit supervised on a 24 hours a day basis on
site by agency staff on a shift rotation basis, funded wholly or in part by any government
and licensed, approved or supervised by the Province of Ontario under any general or

Page 5 of 20
special act, for the accommodation of not fewer than 3 and not more than 8 residents,
exclusive of staff;
1.1.19 “Industrial” means lands or Buildings used or designed or intended for use for
manufacturing, processing, fabricating or assembly of raw goods, warehousing or bulk
storage of goods, and includes office uses and the sale of commodities to the public where
such uses are Accessory to an Industrial use, but does not include the sale of commodities
to the general public through a warehouse club or a self storage building;
1.1.20 “Institutional” means lands or Buildings used or designed or intended for use by an
organized body, society or religious group for promoting a public or non-profit purpose and
shall include, but without limiting the generality of the foregoing, places of worship, and
Special Care Facilities;
1.1.21 “Interest Rate” means five percent (5%) per annum in respect of deferred payment of
Development Charge under any provision of this By-law;
1.1.22 “Large Apartment” means a Dwelling Unit in an Apartment Building that is 700 square feet
or larger in size;
1.1.23 “Local Board” means a local board as defined in the Development Charge Act;
1.1.24 “Mobile Home” means any dwelling that is designed to be made mobile, and constructed
or manufactured to provide a permanent residence for one or more persons, but does not
include a travel trailer or tent trailer;
1.1.25 “Multiple Dwellings” includes townhouses, stacked and back to back townhouses, Mobile
Homes, and all other Residential uses that are not included in the definition of Small
Apartment, Large Apartment, Single Detached Dwelling Unit, or Semi-Detached Dwelling
Unit;
1.1.26 “Municipality” means the Corporation of the Township of King;
1.1.27 “Non-profit Housing” means a Building intended for uses as Residential premises by,

Page 6 of 20
1.1.27.1 a corporation without share capital to which the Business Corporations Act or
the Canada Not-for-profit Corporations Act applies, that is in good standing
under that Act and whose primary object is to provide housing; or
1.1.27.2 a non-profit housing co-operative that is in good standing under the Co-
operative Corporations Act
1.1.28 “Non-Residential” use means a Building of any kind whatsoever used, designed or
intended to be used for other than a Residential use and includes all Commercial,
Industrial and Institutional uses;
1.1.29 “Owner” means the Owner of land or a person who has made application for an approval
for the Development of land upon which a Development Charge is imposed’
1.1.30 “Place of Worship” means a Building that is used primarily for worship and religious
practices and purposes, including related administrative, teaching, assembly and
associated spaces including a gymnasium, but does not include portions of such Building
used for any continuous Commercial uses, including but not limited to daycare facilities or
office spaces for the administration of a regional district of such places of worship;
1.1.31 “Rental Housing” means a Building with four or more Dwelling Units all of which are
intended for use as rented Residential premises;
1.1.32 “Residential” use means lands or Buildings used, or designed or intended for use as a
residence for one or more individuals, and shall include, but is not limited to, a Single
Detached Dwelling, a Semi-detached Dwelling Unit, a Multiple Unit Dwelling, a Small
Apartment, a Large Apartment, a Group Home, a Mobile Home and a Residential Dwelling
Unit Accessory to a Non-Residential use but shall not include a motel or hotel or lodging
house;
1.1.33 “Semi-detached Dwelling Unit” means a Dwelling Unit in a Residential Building consisting
of two Dwelling Units having one vertical wall or one horizontal wall, but not other parts,
attached or another Dwelling Unit where the Residential unit are not connected by an
interior corridor;
1.1.34 “Service” (or “Services”) means a service designated in Schedule “A” to this By-law;

Page 7 of 20
1.1.35 “Single Detached Dwelling Unit” means a Residential Building consisting of one Dwelling
Unit and not attached to another Structure and includes Mobile Homes. For greater
certainty, a Residential Building consisting of one Dwelling Unit that is attached to another
Structure by footings only shall be considered a single family dwelling for purposes of this
by-law.
1.1.36 “Small Apartment” means a Dwelling Unit in an Apartment Building that is less than 700
square feet in size;
1.1.37 “Special Care Facilities” means lands or Buildings without dwelling units, which are used
or designed or intended for use for the purpose of providing supervision, nursing care or
medical treatment, that are licensed, approved or supervised under any special or general
Act.
1.1.38 “Special Care/Special Dwelling” means the residential portion of Special Care Facilities,
including Group Homes, containing rooms or suites of rooms designed or intended to be
used for sleeping and living accommodations that have a common entrance from street
level:
1.1.38.1 Where the occupants have the right to use in common, halls, stairs, yards,
common rooms, and accessory buildings;
1.1.38.2 Which may or may not have exclusive sanitary and/or culinary facilities;
1.1.38.3 That is designed to accommodate persons with specific needs. Including, but
not limited to, independent permanent living arrangements; and
1.1.38.4 Where support services such as meal preparation, grocery shopping, laundry,
housekeeping, nursing, respite care, and attendant services may be provided
at various levels.
2. DESIGNATION OF SERVICES
2.1 The categories of services and classes of services for which Development Charges are
imposed under this By-law are as follows:
(a) Water and Wastewater Studies/Capital Improvements;
Page 8 of 20
(b) Water Distribution;
(c) Wastewater Services – King City;
(d) Wastewater Services - Nobleton;
(e) Services Related to a Highway;
(f) Fire protection services;
(g) Library Services;
(h) Parks and Recreation Services; and
(i) Growth Studies.
2.2 The components of the services and classes of services designated in section 2.1 are
described in Schedule A.
3. APPLICATION OF BY-LAW RULES
3.1 Development Charges shall be payable in the amounts set out in this By-law where:
(a) the lands are located in the area described in section 3.2; and
(b) the Development of the lands requires any of the approvals set out in subsection
3.4(a).
Area to Which By-law Applies
3.2 Subject to section 3.3, this By-law applies to all lands in the Township of King whether or
not the land or use thereof is exempt from taxation under subsection3(1) or the
Assessment Act.
3.3. Notwithstanding subsection 3.2 above, this by-law shall not apply to lands that are owned
by and used for the purposes of:
(a) the Municipality or a Local Board thereof;
(b) a Board of Education; or
Page 9 of 20
(c) the Region of York or a Local Board thereof.
Approvals for Development
3.4 (a) Development Charges shall be imposed on all lands or Buildings that are
developed for Residential or Non-Residential uses if the Development requires:
(i) the passing of a zoning by-law or of an amendment to a zoning by-law
under section 34 of the Planning Act;
(ii) the approval of a minor variance under section 45 of the Planning Act;
(iii) a conveyance of land to which a by-law passed under subsection 50(7) of
the Planning Act applies;
(iv) the approval of a plan of subdivision under section 51 of the Planning Act;
(v) a consent under section 53 of the Planning Act;
(vi) the approval of a description under section 50 of the Condominium Act,
R.S.O. 1990, Chap. C.26, as amended, or any successor thereof; or
(vii) the issuing of a permit under the Building Code Act in relation to a Building.
(b) No more than one Development Charge for each service or class of services
designated in subsection 2.1 shall be imposed upon any lands or Buildings to
which this By-law applies even though two or more of the actions described in
subsection 3.4(a) are required before the lands or Buildings can be developed.
(i) Despite subsection 3.4(b), if two or more of the actions described in subsection
3.4(a) occur at different times, additional Development Charges shall be imposed
if the subsequent action has the effect of increasing the need for services.
Exemptions
3.5 Notwithstanding the provisions of this By-law, Development Charges shall not be imposed
with respect to:

Page 10 of 20
(a) an enlargement to an Existing Dwelling Unit;
(b) one or two additional Dwelling Units in an Existing Single Detached Dwelling Unit;
(c) one additional Dwelling Unit in any other Existing Residential Building;
(d) the creation of an additional dwelling unit as prescribed, in prescribed classes of
new residential buildings as set out in the Regulations to the Development Charges
Act, 1997; or
(e) the creation of an additional dwelling unit ancillary to a new dwelling unit for
prescribed classes of new residential buildings as set out in the Regulations to the
Development Charges Act, 1997.
3.6 Notwithstanding section 3.5(b), Development Charges shall be imposed if the additional
unit has a Gross Floor Area greater than:
(i) in the case of a Semi-detached Dwelling Unit or row dwelling, the Gross Floor
Area of the existing Dwelling Unit; and
(ii) in the case of any other Residential Building, the Gross Floor Area of the
smallest Dwelling Unit contained in the Residential Building.
3.7 Notwithstanding the provisions of this by-law, Development Charges shall not be imposed
with respect to:
a) lands or Buildings used or to be used for a Place of Worship as defined above, or
for the purposes of a cemetery or burial ground exempt from taxation under the
Assessment Act; or
b) the Development of Non-residential Agricultural Use Buildings constructed for
bona fide farm uses.
Exemption for Industrial Enlargement
3.8 As set out in Section 4 of the Act, if a Development includes the enlargement of the Gross
Floor Area of an Existing Industrial Building, the amount of the Development Charge that
is payable in respect of the enlargement is determined in accordance with this section. For

Page 11 of 20
the purposes of this subsection, the term “Existing Industrial Building” shall have the same
meaning as defined in O.Reg. 82/98 under the Act, as amended, or successor thereto.
(a) The exemption for Industrial enlargement provided for in this subsection shall apply
only to the enlargement of the Gross Floor Area of an Existing Industrial Building which
at the time of application for a Building permit, shall have fifty (50) per cent or more of
its Gross Floor Area occupied by Industrial uses;
(b) Such enlargement must be attached to, or within, the Existing Industrial Building, but
shall not be attached by means only of a tunnel, bridge, passageway, shared below
Grade connection, foundation, footing, shared connected roof, or parking facility;
(c) Both the enlargement and Existing Industrial Building must be constructed on lands
owned by the same beneficial Owner;
(d) The enlargement shall be for use for, or in connection with, an Industrial purpose as
set out in this By-law on lands owned by the same beneficial Owner;
(e) The enlargement shall be for the exclusive use of the occupant in occupation at the
time of the application for a Building permit, whose occupancy equals fifty (50) percent
or more of the total Gross Floor Area of the existing Structure immediately prior to the
issuance of the subject expansion Building permit;
(f) The Building permit for the construction of the enlargement is to be issued no earlier
than five (5) years from most recent occupancy or Building permit issued for the
Building;
(g) For the purposes of the calculation of the applicable Development Charge, the Gross
Floor Area of an existing Industrial Building shall be calculated as it existed prior to the
first enlargement in respect of that Building for which an exemption under Section 4 of
the Act is sought;
(h) For the purposes of the calculation of the applicable Development Charge, the
enlargement shall be measured to also include all prior enlargements from the Existing
Industrial Building as determined in clause 3.8(g) above;

Page 12 of 20
(i) If the area of the enlargement, as determined in clause 3.8(h) above, is fifty (50)
percent or less of the Gross Floor Area determined in clause 3.8(g) above, the amount
of the Development Charge in respect of the enlargement is zero (0) dollars; and
(j) If the area of the enlargement as determined in clause 3.8(h) above is more than fifty
(50) percent of the Gross Floor Area determined in clause 3.8(g) above, the amount
of the Development Charge in respect of the enlargement is the amount of the
Development Charge that would otherwise be payable less that portion related to any
Gross Floor Area of the enlargement which brings the cumulative amount of
enlargements to the fifty (50) percent limit, as determined in accordance with clause
3.8(g) above.
Amount of Charges - Residential
3.9 The Development Charges set out in Schedule B shall be imposed on Residential uses of
lands or Buildings, including a Dwelling Unit Accessory to a Non-Residential use and, in
the case of a mixed use Building, on the Residential uses in the mixed use Building,
according to the type and number of Residential units, and calculated with respect to each
of the services and classes of services according to the type of Residential use.
Amount of Charges - Non-Residential
3.10 The Development Charges described in Schedule B to this by-law shall be imposed on
Non-Residential uses of lands or Buildings, and, in the case of a mixed use Building, on
the Non-Residential uses in the mixed use Building, and calculated with respect to each
of the services and classes of services according to the Gross Floor Area of the Non-
Residential use.
Reduction of Development Charge for Redevelopment
3.11 Despite any other provisions of this By-law, where, as a result of the redevelopment of
land, a Building existing on the same land within 48 months prior to the date of payment
of Development Charge in regard to such redevelopment was, or is to be: (i) demolished,

Page 13 of 20
in whole or in part; or (ii) converted from one principal use to another principal use on the
same land, then the Development Charge otherwise payable with respect to such
redevelopment shall be reduced by the following amounts:
(a) in the case of a Residential Building, or in the case of a mixed-use Building, the
Residential uses in the mixed-use Building, an amount calculated by multiplying
the applicable Development Charge under subsection 3.9 by the number,
according to type, of Dwelling Units that have been or will be demolished or
converted to another principal use; and
(b) in the case of a Non-Residential Building or, in the case of mixed-use Building, the
Non-Residential uses in the mixed-use Building, an amount calculated by
multiplying the applicable Development Charge under subsection 3.10, by the
Gross Floor Area that has been or will be demolished or converted to another
principal use; provided that such amounts shall not exceed, in total, the amount of
the Development Charge otherwise payable with respect to the redevelopment.
3.12 For the purposes of section 3.11, a demolition is deemed to have occurred on the date of
issuance of a demolition permit, or in the case of accidental or natural destruction of the
structure, or relocation of the structure from the lands, the date of such occurrence.
3.13 For purposes of section 3.11, the onus in on the applicant to produce evidence to the
satisfaction of the Township, acting reasonably, to establish the following:
a) The number of dwelling units that have bene or will be demolished, relocated from
the lands or converted to another principal use; or
b) The non-residential Gross Floor Area that has been or will be demolished,
relocated from the lands or converted to another principal use; and
c) In the case of a demolition, that the dwelling units and /or non-residential Gross
Floor Area were demolished within 48 months prior to the date of the payment of
development charges in regard to the redevelopment.

Page 14 of 20
3.14 Any Building that is determined to be derelict, or the equivalent of derelict, and ordered to
be demolished by the Council of the Township of King, or any duly appointed officer of the
municipality with appropriate authority, shall be eligible for development charge credits if
a building permit is issued for a Building on the lands previously occupied by the deemed
derelict Building within one hundred and twenty (120) months or less of the issuance of
the demolition permit for the deemed derelict Building. The development charge credit
shall be calculated in accordance with the time requirements between demolition permit
issuance and building permit issuance as set out in Schedule “C” to this By-law. For
redevelopment to which this section applies, the development charge otherwise payable
with respect to such redevelopment shall be reduced by the amount of the credit calculated
in this subsection. Should the calculated credit exceed the amount of development charge
otherwise payable, no development charge shall be payable, and any excess credit shall
have no cash or credit value for any purpose.
Timing of Payment of Development Charge
3.15 A Development Charge imposed under this By-law is payable upon the issuance of the
first Building permit with respect to each Building. Where applicable, Development Charge
in respect of engineered services shall be payable upon execution of a vacant land
condominium agreement, a Development agreement, or a subdivision agreement, with the
remaining applicable portions of the Development Charge to be payable at issuance of
the Building permit as above.
3.16 Notwithstanding section 3.15, Development Charge for Rental Housing and Institutional
Developments are due and payable in six (6) installments commencing with the first
installment payable on the date of first occupancy certificate issued, and each subsequent
installment, including interest calculated at the Interest Rate, payable on the anniversary
date each year thereafter;
3.17 Notwithstanding section 3.15, Development Charge for Non-Profit Housing Developments
are due and payable in twenty-one (21) installments commencing with the first installment
payable on the date of first occupancy certificate issued, and each subsequent installment,
including interest calculated at the Interest Rate, payable on the anniversary date each
year thereafter.
Page 15 of 20
3.18 Where the Development of land results from the approval of a site plan or zoning by-law
amendment received on or after January 1, 2020, and the approval of the application
occurred within 2 years of Building permit issuance, the Development Charge under
subsections 3.15, 3.16, and 3.17 shall be calculated on the Development Charge rates
effective on the date of the complete planning application, including interest. Where both
planning applications apply, Development Charge under subsections 3.15, 3.16, and 3.17
shall be calculated on the Development Charge rates on the date of the later planning
application, including interest.
3.19 Despite sections 3.15, 3.16, 3.17, or 3.18, Council from time to time, and at any time, may
enter into agreements providing for all or any part of a Development Charge to be paid
before or after it would otherwise be payable, in accordance with section 27 of the Act.
3.20 Despite the payment required under subsections 3.9 and 3.10, Council may, by
agreement, give a credit towards a Development Charge in exchange for work that relates
to a service to which a Development Charge is imposed under this By-law.
4. TRANSITION PROVISION – PERMITS IN PROCESS AT COMMENCEMENT
4.1 For any Residential Building permit which was issued prior to the effective date of this By-
law, and for which the Chief Building Official of the Township has determined that
construction has not commenced within six (6) months of the permit issuance, such
Building permit may be revoked until such time as any increase in Development Charge
owing when calculated in accordance with this By-law are paid.
4.2 Any complete Residential Building permit application which was received prior to the date
which is ten (10) days prior to the effective date of this By-law, but for which a Building
permit had not been issued by the effective date, shall be subject to the Development
Charge rates which were in effect at the time the complete application was received by
the Township.
5. INDEXING
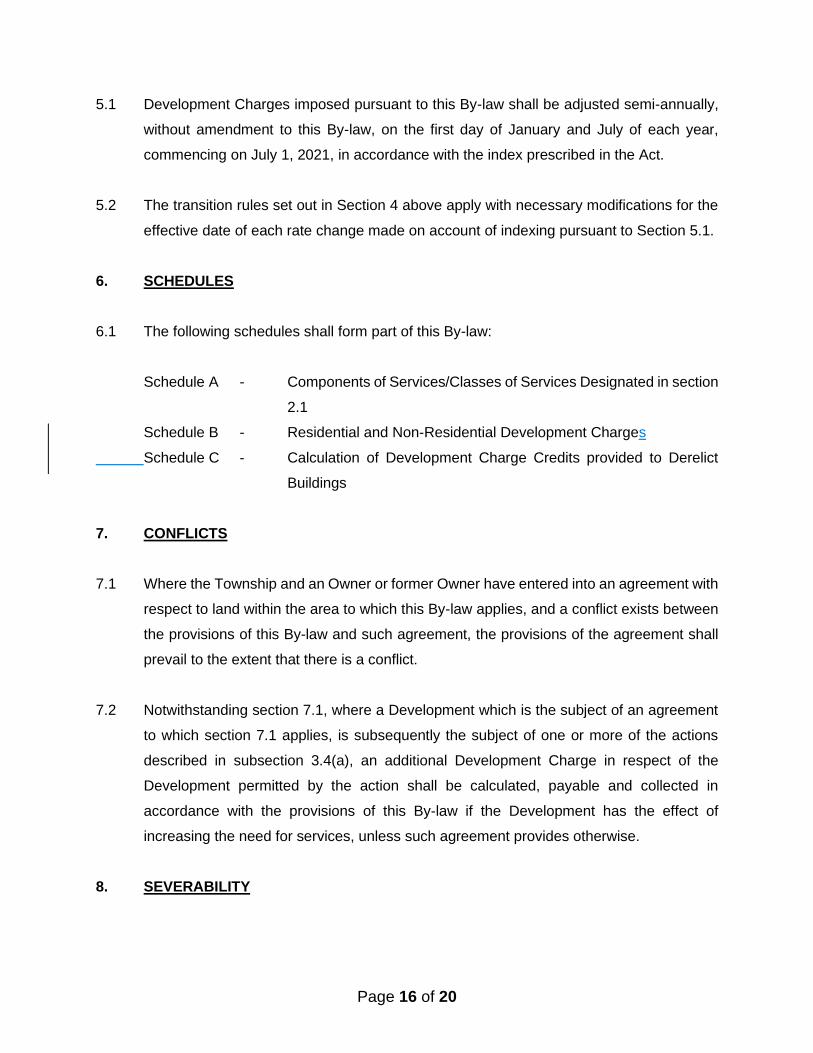
Page 16 of 20
5.1 Development Charges imposed pursuant to this By-law shall be adjusted semi-annually,
without amendment to this By-law, on the first day of January and July of each year,
commencing on July 1, 2021, in accordance with the index prescribed in the Act.
5.2 The transition rules set out in Section 4 above apply with necessary modifications for the
effective date of each rate change made on account of indexing pursuant to Section 5.1.
6. SCHEDULES
6.1 The following schedules shall form part of this By-law:
Schedule A - Components of Services/Classes of Services Designated in section
2.1
Schedule B - Residential and Non-Residential Development Charges
Schedule C - Calculation of Development Charge Credits provided to Derelict
Buildings
7. CONFLICTS
7.1 Where the Township and an Owner or former Owner have entered into an agreement with
respect to land within the area to which this By-law applies, and a conflict exists between
the provisions of this By-law and such agreement, the provisions of the agreement shall
prevail to the extent that there is a conflict.
7.2 Notwithstanding section 7.1, where a Development which is the subject of an agreement
to which section 7.1 applies, is subsequently the subject of one or more of the actions
described in subsection 3.4(a), an additional Development Charge in respect of the
Development permitted by the action shall be calculated, payable and collected in
accordance with the provisions of this By-law if the Development has the effect of
increasing the need for services, unless such agreement provides otherwise.
8. SEVERABILITY

Page 17 of 20
8.1 If, for any reason, any provision of this By-law is held to be invalid, it is hereby declared to
be the intention of Council that all the remainder of this By-law shall continue in full force
and effect until repealed, re-enacted, amended or modified.
9. DATE BY-LAW IN FORCE
9.1 This By-law shall come into effect at 12:01 AM on January xx, 2021.
10. DATE BY-LAW EXPIRES
10.1 This By-law will expire at 12:01 AM on January xx, 2026 unless it is repealed by Council
at an earlier date.
11. EXISTING BY-LAW REPEALED
11.1 By-law Number 2015-100 is hereby repealed as of the date and time of this By-law coming
into effect.
12. SHORT TITLE
12.1 This By-law may be referred to as the “Development Charge By-law”.
READ a FIRST and SECOND time this 18th day of January, 2021.
READ a THIRD time and FINALLY PASSED this 18th day of January, 2021.
_______________________________
Steve Pellegrini Mayor
_______________________________ Kathryn Smyth
Director of Corporate Services Township Clerk

Page 18 of 20
SCHEDULE “A” TO BY-LAW NO. 2021-XXX
DESIGNATED MUNICIPAL SERVICES/CLASSES OF SERVICES UNDER THIS BY-LAW
Engineered Services/Classes of Services: Water and Wastewater Studies and Capital Improvements Water Services Wastewater Services Wastewater Services – King City Collection System Water Services – Urban Service Areas Distribution System Wastewater Services – Nobleton Collection System Roads and Related Roads Facilities Rolling Stock Other Services/Classes of Services: Fire Protection Facilities Vehicles Firefighter Equipment and Gear Parks and Recreation Services Parkland Development Amenities Trails Vehicles Facilities Library Services Facilities Materials Growth Studies Stormwater Drainage and Control Services Wastewater Services Water Services Services Related to a Highway Fire Protection Services Parks and Recreation Services Library Services
THIS IS SCHEDULE “A’ TO BY-LAW NO. 202115-100XXX PASSED ON THIS 184TH DAY OF JANUARY, 2021SEPTEMBER, 2015
________________________________ _____________________________ Steve Pellegrini Kathryn Smyth Mayor Director of Clerks/By-law Enforcement Township Clerk
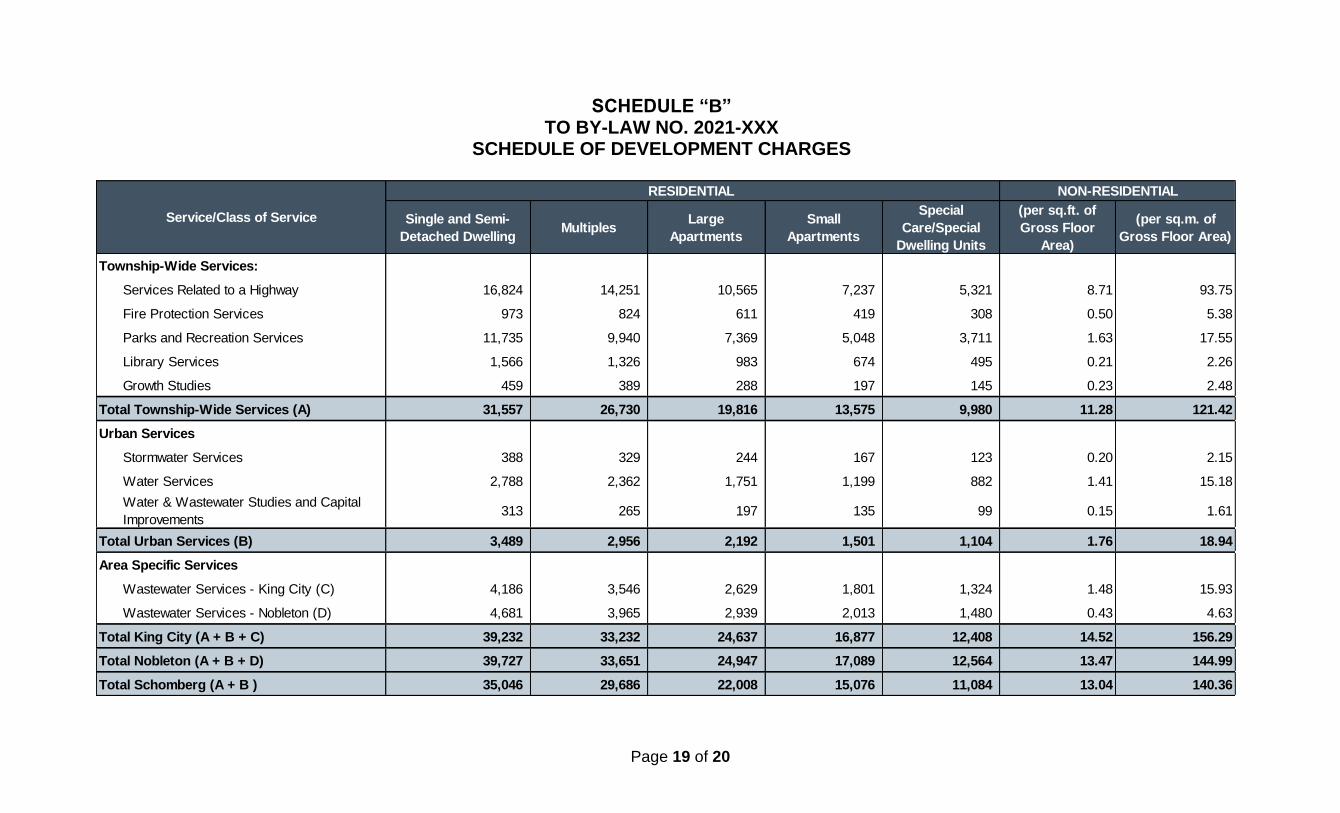
Page 19 of 20
SCHEDULE “B” TO BY-LAW NO. 2021-XXX
SCHEDULE OF DEVELOPMENT CHARGES
NON-RESIDENTIAL
Single and Semi-
Detached DwellingMultiples
Large
Apartments
Small
Apartments
Special
Care/Special
Dwelling Units
(per sq.ft. of
Gross Floor
Area)
(per sq.m. of
Gross Floor Area)
Township-Wide Services:
Services Related to a Highway 16,824 14,251 10,565 7,237 5,321 8.71 93.75
Fire Protection Services 973 824 611 419 308 0.50 5.38
Parks and Recreation Services 11,735 9,940 7,369 5,048 3,711 1.63 17.55
Library Services 1,566 1,326 983 674 495 0.21 2.26
Growth Studies 459 389 288 197 145 0.23 2.48
Total Township-Wide Services (A) 31,557 26,730 19,816 13,575 9,980 11.28 121.42
Urban Services
Stormwater Services 388 329 244 167 123 0.20 2.15
Water Services 2,788 2,362 1,751 1,199 882 1.41 15.18
Water & Wastewater Studies and Capital
Improvements313 265 197 135 99 0.15 1.61
Total Urban Services (B) 3,489 2,956 2,192 1,501 1,104 1.76 18.94
Area Specific Services
Wastewater Services - King City (C) 4,186 3,546 2,629 1,801 1,324 1.48 15.93
Wastewater Services - Nobleton (D) 4,681 3,965 2,939 2,013 1,480 0.43 4.63
Total King City (A + B + C) 39,232 33,232 24,637 16,877 12,408 14.52 156.29
Total Nobleton (A + B + D) 39,727 33,651 24,947 17,089 12,564 13.47 144.99
Total Schomberg (A + B ) 35,046 29,686 22,008 15,076 11,084 13.04 140.36
Service/Class of Service
RESIDENTIAL

Page 20 of 20
SCHEDULE “C” TO BY-LAW NO. 2021-XXX
Township of King Calculation of Development Charge Credits Provided to Derelict Buildings
Demolished Under Clause 3.14
Number of Months from Date of Demolition Permit to Date of Building Permit Issuance
Credit Provided
Up to and including 48 months 100%
Greater than 48 months up to and including 72 months 75%
Greater than 72 months up to and including 96 months 50%
Greater than 96 months up to and including 120 months 25%
Greater than 120 months 0%
Credits are calculated as a percentage of the development charge rates
prevailing at the time of building permit issuance for the type of structure demolished.