development indicators gianni vaggi and clara capelli university of pavia november 2013
DESCRIPTION
Development indicators Gianni Vaggi and Clara Capelli University of Pavia November 2013. Inequality. Relative concept;. Focus on distribution (wealth, income, opportunities, etc.);. - PowerPoint PPT PresentationTRANSCRIPT

Development indicators
Gianni Vaggi and Clara CapelliUniversity of Pavia November 2013
Inequality

• Relative concept;
• Focus on distribution (wealth, income, opportunities, etc.);
• Unlike efficiency (see Pareto), there is no widespread consensus onthe definition of equity/distributive justice;
• Income distribution can be functional (i.e. wages, profits, rents) or personal.
Economia dello Sviluppo
The personal distribution of income depends on:
• Personal features and skills;
• Personal position wrt to an economy’s productive structure;
• Welfare schemes (the so-called "secondary personal distribution ofincome)
Economia dello Sviluppo
The Lorenz CurveThe Lorenz Curve
• Developed in 1905 by Max Lorenz;
• Relates the cumulative proportion of income to the cumulativeproportion of individuals;
• The x-axis records the cumulative proportion of individuals, rankedby income level (from the poorest to the richest);
• The y-axis records the income share for each proportion ofpopulation.
Economia dello Sviluppo

Economia dello Sviluppo

Measuring InequalityInequality Trends
How to Draw a Lorenz Curve
Calculate the proportion of income belonging to each individual;
Calculate which proportion of total population each individualrepresents;
Sort these individuals on the basis of the income they own;
Define the line of equidistributed income;
Plot the cumulative proportion of income against the cumulativeproportion of population.
Economia dello Sviluppo

The Gini CoefficientThe Gini Coefficient
How can we compare Lorenz Curves? An index allows for easiercomparisons.
• Introduced by Corrado Gini in 1912 (Variability and Mutability);
• Measures the inequality among values of a frequency distribution;
• Ranges from 0 (perfect equality) to 1 (complete inequality);
• It is equal to the area between the equality line and the Lorenz Curve, divided by the area below the equality line;
Economia dello Sviluppo

Gini coefficients, 2008Gini coefficients, 2008
Afghanistan 27.8Argentina 46.3Brazil 55.1Colombia 57.2China (2005) 42.5Ghana (2006) 42.8Egypt 30.8India 33.4Nigeria 44.8Malaysia (2007) 46.2Mozambique 45.7Russia 42.3Thailandia 40.5Turkey 39.0Venezuela (2006) 44.8West Bank & Gaza (2007) 38.7
Source: WB DatabaseEconomia dello Sviluppo

Economia dello Sviluppo

Economia dello Sviluppo

Economia dello Sviluppo

Kuznets CurveKuznets Curve
Economia dello Sviluppo

Kuznets Curve/2Kuznets Curve/2
• Industrialization and rural-urban migration lead to a rise ininequality;
• After a certain level of income, democracy and welfare schemesallow for more equality;
Economia dello Sviluppo

Again on China & India, Brazil & VenezuelaAgain on China & India, Brazil & Venezuela
Economia dello Sviluppo

Kuznets Curve: CriticismsKuznets Curve: Criticisms
Fields (2001): other factors matter more than the stage ofdevelopment (history&geography, role of mining, access to land,etc.);
Stiglitz (1996): East Asian Miracles shows that Kuznets’ story doesnot hold;
Palma (2011): The real difference is made by what is appropriatedby the richest decile.
Economia dello Sviluppo

The Gini coefficient fell in 44 countries (out of 81 examined):
Source: WBI, 2012
Economia dello Sviluppo

Maddison, The World Economy. Historical Statistics (2003)
• World inequality falls between 1950 and 1960 (post-war catching upof Europe and Japan);
• It then rises strongly until 1980 (rapid growth of developedcountries);
• It then falls, mainly because of China.
Economia dello Sviluppo
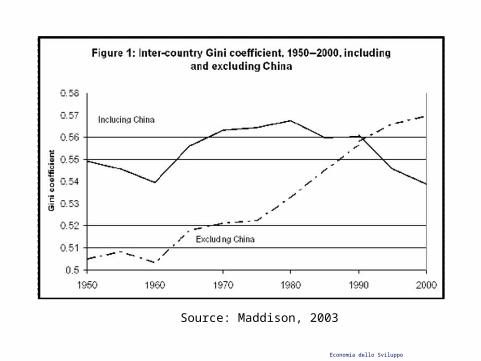
Source: Maddison, 2003
Economia dello Sviluppo

Source: Maddison, 2003
Economia dello Sviluppo

Measuring InequalityInequality Trends
Bourguignon & Morrisson, Inequality Among World Citizens, 1820-1992 (2001):
• World inequality (global Gini) increased by 30 percent, hitting 0.6;
• This is mostly due to the "between" component;• A comparatively little difference was found between the world
distribution of the 1990s and in the 1950s;• Stabilizing effect of the "within" component.
Economia dello Sviluppo