development of a bioanalytical test battery for water
TRANSCRIPT

Development of a bioanalytical test battery for water qualitymonitoring: Fingerprinting identified micropollutants andtheir contribution to effects in surface water
Author
Neale, Peta A, Altenburger, Rolf, Ait-Aissa, Selim, Brion, Francois, Busch, Wibke, Umbuzeiro,Gisela de Aragao, Denison, Michael S, Du Pasquier, David, Hilscherova, Klara, Hollert, Henner,Morales, Daniel A, Novak, Jiri, Schlichting, Rita, Seiler, Thomas-Benjamin, Serra, Helene, Shao,Ying, Tindall, Andrew J, Tollefsen, Knut Erik, Williams, Timothy D, Escher, Beate I
Published
2017
Journal Title
Water Research
Version
Accepted Manuscript (AM)
DOI
https://doi.org/10.1016/j.watres.2017.07.016
Copyright Statement
© 2017 Elsevier. Licensed under the Creative Commons Attribution-NonCommercial-NoDerivatives 4.0 International Licence (http://creativecommons.org/licenses/by-nc-nd/4.0/)which permits unrestricted, non-commercial use, distribution and reproduction in any medium,providing that the work is properly cited.
Downloaded from
http://hdl.handle.net/10072/348912
Funder(s)
NHMRC
Grant identifier(s)
APP1074775

Griffith Research Online
https://research-repository.griffith.edu.au

1
Available at http://www.sciencedirect.com/science/article/pii/S0043135417305894 1
2
Development of a bioanalytical test battery for water quality 3
monitoring: Fingerprinting identified micropollutants and 4
their contribution to effects in surface water 5
6
Peta A. Nealea, b
, Rolf Altenburgerc, Selim Aїt-Aїssa
d, François Brion
d, Wibke Busch
c, 7
Gisela de Aragão Umbuzeiroe, Michael S. Denison
f, David Du Pasquierg, Klára Hilscherová
h, 8
Henner Hollerti, Daniel A. Morales
e, Jiří Novák
h, Rita Schlichting
c, Thomas-Benjamin Seiler
i, 9
Helene Serrad, Ying Shao
i, Andrew J. Tindallg, Knut Erik Tollefsen
j, Timothy D. Williams
k, 10
Beate I. Escherb, c, l
* 11
12
aAustralian Rivers Institute, Griffith School of Environment, Griffith University, Southport QLD 13
4222, Australia 14
bThe University of Queensland, National Research Centre for Environmental Toxicology (Entox), 15
Brisbane QLD 4108, Australia 16
cUFZ – Helmholtz Centre for Environmental Research, 04318 Leipzig, Germany 17
dInstitut National de l'Environnement Industriel et des Risques INERIS, Unité d’Ecotoxicologie, 18
60550 Verneuil-en-Halatte, France 19
eFaculdade de Tecnologia, FT-UNICAMP, Universidade Estadual de Campinas, Limeira, SP 20
13484-332, Brazil 21
fDepartment of Environmental Toxicology, University of California, Davis, California 95616, 22
United States 23
gWatchFrog, Bâtiment Genavenir 3, 1 rue Pierre Fontaine, 91000 Evry, France 24

2
hMasaryk University, Research Centre for Toxic Compounds in the Environment (RECETOX), 1
Kamenice 753/5, 62500 Brno, Czech Republic 2
iDepartment of Ecosystem Analysis, Institute for Environmental Research, RWTH Aachen 3
University, 52074 Aachen, Germany 4
jNorwegian Institute for Water Research NIVA, Gaustadalléen 21, N-0349 Oslo, Norway 5
kSchool of Biosciences, The University of Birmingham, Birmingham B15 2TT, UK 6
lEberhard Karls University Tübingen, Environmental Toxicology, Center for Applied Geosciences, 7
72074 Tübingen, Germany 8
9
10
*corresponding author: [email protected]; Ph: +49 341 235 1244 11
Abstract 12
Surface waters can contain a diverse range of organic pollutants, including pesticides, 13
pharmaceuticals and industrial compounds. While bioassays have been used for water quality 14
monitoring, there is limited knowledge regarding the effects of individual micropollutants and their 15
relationship to the overall mixture effect in water samples. In this study, a battery of in vitro 16
bioassays based on human and fish cell lines and whole organism assays using bacteria, algae, 17
daphnids and fish embryos was assembled for use in water quality monitoring. The selection of 18
bioassays was guided by the principles of adverse outcome pathways in order to cover relevant 19
steps in toxicity pathways known to be triggered by environmental water samples. The effects of 34 20
water pollutants, which were selected based on hazard quotients, available environmental quality 21
standards and mode of action information, were fingerprinted in the bioassay test battery. There was 22
a relatively good agreement between the experimental results and available literature effect data. 23
The majority of the chemicals were active in the assays indicative of apical effects, while fewer 24
chemicals had a response in the specific reporter gene assays, but these effects were typically 25
triggered at lower concentrations. The single chemical effect data were used to improve published 26
3
mixture toxicity modeling of water samples from the Danube River. While there was a slight 1
increase in the fraction of the bioanalytical equivalents explained for the Danube River samples, for 2
some endpoints less than 1% of the observed effect could be explained by the studied chemicals. 3
The new mixture models essentially confirmed previous findings from many studies monitoring 4
water quality using both chemical analysis and bioanalytical tools. In short, our results indicate that 5
many more chemicals contribute to the biological effect than those that are typically quantified by 6
chemical monitoring programs or those regulated by environmental quality standards. This study 7
not only demonstrates the utility of fingerprinting single chemicals for an improved understanding 8
of the biological effect of pollutants, but also highlights the need to apply bioassays for water 9
quality monitoring in order to prevent underestimation of the overall biological effect. 10
11
Keyword: In vitro; cell-based bioassay, fish embryo toxicity test; ToxCast; mixture toxicity 12

4
1. Introduction 1
Chemical pollution in rivers has been identified as a major threat to ecosystem and public health 2
(Malaj et al. 2014, Vörösmarty et al. 2010). Busch et al. (2016) identified 426 different chemicals 3
present in European rivers, including the Danube and Rhine. While the huge number of chemicals 4
present in surface waters indicates that targeted chemical analysis alone is unsuitable for 5
understanding the overall chemical burden, it is still the main approach used for water quality 6
monitoring, e.g., in the European Union Water Framework Directive (WFD) (European 7
Commission 2011, 2012). 8
A diverse set of in vivo, in vitro and ecological indicators were proposed as monitoring tools 9
within the WFD (Wernersson et al. 2015). In vivo bioassays have a long tradition of application in 10
effluent assessment and water quality monitoring studies (Escher and Leusch 2012). In contrast, in 11
vitro cellular bioassays have mainly been applied to assess technical water treatment processes, 12
such as sewage treatment (Prasse et al. 2015), advanced water treatment (Leusch and Snyder 2015) 13
and drinking water treatment (Neale et al. 2012). In most applications, in vitro bioassays are not 14
being used as a direct link to the ecological health of aquatic organisms, but rather as a 15
complementary analytical tool to detect and quantify chemicals via their effects within 16
environmental mixtures. The EU Project SOLUTIONS proposes to connect both approaches and 17
employ bioassays for water quality monitoring whilst linking them to chemical assessment 18
(Altenburger et al. 2015). Cell-based bioassays have also been proposed as part of the first tier 19
screening step of a new conceptual framework for monitoring water contaminants in California 20
(Maruya et al. 2016). 21
Programs such as the United States Environmental Protection Agency (US EPA) Toxicity 22
Forecaster (ToxCast) and Toxicity Testing in the 21st Century (Tox21) have screened a large 23
number of chemicals in more than a thousand in vitro assays (US EPA 2015). These programs focus 24
on human health assessment (Tice et al. 2013), with less attention on effects relevant to 25
environmental risk assessment. More recently, Schroeder et al. (2016) proposed the application of 26

5
the high-throughput screening tools used in ToxCast and Tox21 for environmental surveillance and 1
water quality monitoring initiatives. 2
Consequently, the goal of the current study was to assemble a battery of bioassays that 3
covers both the expected effects and safeguards against overlooking others with unidentified modes 4
of action. Cell-based assays based on different steps of cellular toxicity pathways were applied, as 5
well as whole organism assays indicative of both apical and specific effects. Cellular effects are key 6
parts of adverse outcome pathways (Ankley et al. 2010), with the studied bioassays covering 7
induction of xenobiotic metabolism, receptor-mediated effects, reactive modes of action, induction 8
of adaptive stress response pathways and cell viability. Assays using bacteria (Aliivibrio fischeri 9
and Salmonella typhimurium), algae (Chlamydomonas reinhardtii), crustaceans (Daphnia magna), 10
fish (embryonic Danio rerio and Oryzias latipes) and amphibians (embryonic Xenopus laevis) were 11
applied, while cellular responses were evaluated using cultured fish cells (Danio rerio), as well as 12
mammalian cells (human and rat cell lines), allowing comparison with the existing US EPA 13
ToxCast database (US EPA 2015). Effect data from peer-reviewed literature and the US EPA 14
ToxCast database were collected and compared with our experimental effect data. In vitro and 15
whole organism specific effects were compared to determine if the studied pollutants acted as 16
baseline toxicants, meaning they would result in non-specific effects, or would produce specific 17
effects in the whole organism assays. The generated effects data were finally applied to improve 18
mixture toxicity modeling for environmental water samples. 19
20
2. Assembling a bioanalytical test battery for surface water quality monitoring 21
Ideally, a bioanalytical test battery for water quality monitoring should be motivated by effects 22
found typically in water and include assays covering a wide range of environmentally relevant 23
modes of action and different stages of cellular toxicity pathways, as well as low-complexity whole-24
organism effects (Figure 1). To narrow down the large number of available bioassays to a smaller 25
list of indicator bioassays, a balance must be struck between the desire to cover all possible effects 26

6
and practicability issues. Broad coverage of modes of action, inclusion of the contributions from all 1
chemicals and relevance for ecological health through the alignment of the bioassays to relevant 2
steps of adverse outcome pathways are desirable (Schroeder et al. 2016), as well as a focus on 3
effects that have been previously observed in water samples (Escher et al. 2014). Practicability, 4
assay robustness, applicability for less specialized laboratories and the possibility to run the assays 5
in a high-throughput mode for low-volume tests were further considered (Escher and Leusch 2012). 6
Reducing the sample volume requirements for each test is also important as it facilitates routine 7
monitoring by decreasing the total volume required at each sampling location. 8
A large screening study using more than a hundred individual in vitro bioassays as well as a 9
multifactorial assay that quantifies the activation of 25 nuclear receptors and 45 transcription factors 10
demonstrated that the estrogen receptor (ER), and to a lesser degree the glucocorticoid receptor 11
(GR), were amongst the most responsive hormonal nuclear receptors in wastewater and surface 12
water testing (Escher et al. 2014). Therefore, ER reporter gene assays were a prominent component 13
of the test battery in this study and we included assays using human and fish cell lines. Furthermore, 14
surface water samples have also been shown to inhibit the androgen receptor (AR) (Escher et al. 15
2014, Jálová et al. 2013). Given the high relevance of hormone receptors, we added three transgenic 16
assays that have been developed in recent years to assess hormone-mediated effects in early life-17
stage organisms (Brion et al. 2012, Fini et al. 2007, Spirhanzlova et al. 2016). Nuclear receptors 18
triggering the activation of metabolism and other biological effects such as the aryl hydrocarbon 19
receptor (AhR), the pregnane X receptor (PXR) and the peroxisome- proliferator-activated receptor 20
(PPARγ) were even more prominently activated by water sample extracts (Escher et al. 2014) and 21
play a prominent role in the proposed test battery. 22
We also included reporter gene assays for activation of adaptive stress responses in the 23
present study (Table 1, Figure 1). Adaptive stress responses are key events (Simmons et al. 2009) 24
and very recent work has elucidated the key event relationships of the toxicologically relevant Nrf2- 25
and p53- mediated adaptive stress responses in response to reference chemicals (Hiemstra et al. 26
7
2017, Wink et al. 2014, Wink et al. 2017). Nrf2, which activates the oxidative stress response, was 1
most responsive in water samples in a large number of studies (Escher et al. 2012, Escher et al. 2
2014, Escher et al. 2015b, König et al. 2017, Neale et al. 2015, Neale et al. 2017), while p53 3
activity was only occasionally detected in water samples (e.g., Yeh et al. 2014). A recent study 4
using the Attagene battery as part of the ToxCast high-throughput screening assays identified this 5
same transcription factor Nrf2 as being relevant for surface water quality monitoring and also 6
identified the hypoxia pathway as relevant (Schroeder et al. 2016). A reporter gene assay for 7
hypoxia was not included in the present effort but will be added to the test battery in the near future. 8
Mutagenicity, a reactive mode of action, is another important endpoint of ecological and 9
human health relevance. With the exception of the p53 transcription factor assay, which is often 10
masked by cytotoxicity when applied to surface water samples (e.g., Neale et al. 2017), available 11
reporter gene assays are not suitable for detecting DNA damage. Instead, we included two protocols 12
of the classic Ames assay in the present study (Table 1, Figure 1). The Ames assay detects gene 13
mutations and has been widely used for environmental and wastewater assessment (Claxton et al. 14
2010, Reifferscheid et al. 2012, Umbuzeiro et al. 2016). 15
Whole organism assays indicative of apical effects, such as algal growth inhibition, Daphnia 16
immobilization and fish embryo toxicity (FET), are more widely used for water quality assessment 17
than cellular assays to date and can provide information about effects on mortality, growth, 18
development and reproduction (Di Paolo et al. 2016, Wernersson et al. 2015). They are 19
comprehensive as they cover the effects from multiple toxicity pathways leading to the same apical 20
endpoint. Consequently, whole organism assays integrate the mixture effects of all chemicals that 21
are present in a sample, depending on their effect potency. Therefore, they constitute an important 22
complement to the specific bioassays. In this study we have included the Microtox test, a rapid 23
assay based on bioluminescence inhibition of bacteria that has been demonstrated to be a useful pre-24
screening tool for water samples (Tang et al. 2013), the algal growth inhibition test, the 25
immobilization test with Daphnia magna and the fish embryo toxicity test with Danio rerio as 26

8
typical representatives of apical endpoints and whole organism tests that are still legally considered 1
to be in vitro test systems (Table 1, Figure 1). This latter aspect is not only an important 2
consideration for animal ethics but also because only in vitro assays can be scaled up to high-3
throughput. In fact, several of the applied bioassays are already running on robotic systems in 384 4
well (cell-based assays) or 96 well (FET, algae) format, though they can also be run in a low-5
throughput mode, making the panel of indicator bioassays very versatile. 6
The panel of bioassays selected here is one possible example of a test battery design, but the 7
reasoning provided above should be considered when designing any fit-for-purpose monitoring test 8
battery. For example, the number of bioassays may be reduced for routine monitoring applications, 9
whereas evaluation of highly impacted sites may require expansion of the number of bioassays to 10
cover unusual responses triggered in whole organism endpoints. As specific and selective reporter 11
gene assays will not capture all relevant modes of action, it is important to complement these 12
endpoints with whole organism assays indicative of apical effects and to ensure that the bioassay 13
battery covers different events/steps in selected toxicity pathways (Figure 1). 14
15
3. Materials and methods 16
3.1 Chemical selection 17
A total of 34 water pollutants were selected for the current study (Table 2). Thirty-two of the 18
chemicals were selected from the list of 214 chemicals identified as relevant river pollutants by 19
Busch et al. (2016) due to their presence in European river systems and hazard quotients > 10-4
. The 20
hazard quotients were calculated based on the 95th
percentile measured environmental concentration 21
and measured or predicted algal, daphnid and fish 5th
percentile acute effect concentration data. 22
Further details are available in Busch et al. (2016). In addition, the pharmaceutical flutamide and 23
the fungicide picoxystrobin were also included to represent a potent anti-androgen and a respiration 24
inhibitor, respectively. Picoxystrobin, which inhibits respiration by blocking electron transport, was 25

9
added to complement the pesticide dinoseb, which also inhibits respiration but via uncoupling i.e., 1
by protonophoric shuttle mechanisms. 2
The studied chemicals included pharmaceuticals, pesticides and industrial compounds, and 3
the selection process was based on scoring (a) their rank in the hazard quotient list, (b) the 4
availability of an environmental quality standard (EQS) from the WFD or at least a published 5
proposed EQS, (c) a unique mode of action that is not covered by a higher ranked chemical, (d) 6
diversity of chemical use groups, (e) a specific mode of action that is covered by the test battery, (f) 7
a specific mode of action expected to lead to enhanced toxicity in the whole organism bioassays and 8
(g) lack of rapid biodegradation based on BIOWINTM
(US EPA 2008). The final scores for 9
prioritization are given in Table S1 of the Supplementary Information. 10
A minimum score of three points was required to qualify a chemical for experimental 11
analysis and preference was given to chemicals ranked in the top 100 of Busch et al. (2016). An 12
exception was hexadecylpyridinium, which had a score of two, but was still included as it was the 13
only surface active antiseptic compound and was ranked 2nd
in Busch et al. (2016) based on its 14
hazard quotient. The non-steroidal anti-androgenic compound flutamide only had a score of 2 15
because no information about its degradability was available in BIOWINTM
. All other compounds, 16
with the exception of hexadecylpyridinium, were not readily biodegradable according to 17
BIOWINTM
, which meets the expectation that more recalcitrant chemicals will be found in surface 18
water. The antibiotic sulfamethoxazole was the only antibiotic selected despite its low rank in 19
Busch et al. (2016) because no other sulfonamides were ranked higher and they are an important 20
antibiotic group. Apart from these exceptions, all other chemicals were selected based on their high 21
score. If chemicals with a similar structure and function had an equal score, the chemical ranked 22
higher in Busch et al. (2016) was included. 23
24
3.2 Data mining 25

10
Effect data for the 34 selected chemicals were collected from either the peer reviewed literature or 1
the US EPA ToxCast database (US EPA 2015) for the studied bioassays. The effect data were 2
categorized based on data availability and quality (Figure S1). A chemical was considered active if 3
it had a response in the studied assay, while a chemical was considered inactive if it was tested in a 4
studied assay and had no effect (or was inactive up to cytotoxic concentrations). When experimental 5
data were unavailable for the studied assay, but available in another assay covering the same mode 6
of action, chemicals were assigned the class of likely active or likely inactive, based on whether 7
they produced an effect or not. If no experimental data were available, but the mode of action of the 8
studied chemical and bioassays theoretically matched, the chemicals were assigned as potentially 9
active or potentially inactive. Chemicals were considered as ‘inactive’ if they were only active in 10
the whole organism assays indicative of apical effects at effect concentrations (EC) greater than 1 11
mM. The 1 mM cut-off was based on the highest tested chemical concentration in many assays in 12
the ToxCast database. In some cases, no information could be found and the chemical was 13
designated as ‘no information available’. 14
15
3.3 Bioanalysis 16
Bioassays applied in this study are listed in Table 1. A summary of experimental conditions, test 17
media and quality controls are provided in Table S2. Detailed standard operating procedures of the 18
bioassays, also detailing whether cytotoxicity controls were performed, are presented in the SI. All 19
chemicals were run with at least two independent replicates in each assay, with each chemical 20
assessed over a range of concentrations. Concentration-effect curves for each assay’s positive 21
reference compound are shown in Figure S2. The assays were run by eight different laboratories 22
and it should be noted that not all 34 selected chemicals were run in all assays, but the average 23
coverage was 71% with the exact numbers tested given in Table 1 and the percentage tested given 24
in Table S2. The coverage depended on the capacity of each laboratory and prior knowledge of the 25
mechanism of action. For example, the algae growth inhibition assay focused on chemicals with 26

11
known effects on photosynthesis or other modes of action likely to lead to substantial toxicity, with 1
only 50% of the chemicals tested, while the Microtox assay was applied to all 34 chemicals. The 2
chemical concentration ranges studied in the different assays are provided in Table S3, with the 3
maximum tested concentrations selected based on the physicochemical properties of the studied 4
chemicals including solubility. 5
6
3.4 Data evaluation 7
EC values were derived from concentration-effect curves, with different models applied depending 8
on the assay type. All EC values are expressed in molar units. The data evaluation, which aimed to 9
be as simple and standardized as possible across the entire panel of bioassays, was developed in a 10
previous study (Escher et al. 2014). Briefly, for assays where a maximum effect could be reached, 11
such as induction of xenobiotic metabolism, hormone-mediated effects and apical effects, the 12
experimental % effect was calculated using Equation 1, where signalsample is the signal of the tested 13
chemical, signalcontrol is the signal of the solvent control and signalmax is the maximum response of 14
the positive reference compound in the assay. Signal refers to measured luminescence or 15
fluorescence and is specific for each assay. Details are given in the SOPs of the assays in the SI. 16
17
%effect=signal
sample-signal
control
signalmax
-signalcontrol
100%
(1) 18
19
Both linear and log-sigmoidal concentration-effect curves were applied to determine EC values for 20
% effect data and only linear concentration-effect curves were applied to induction ratio (IR) effect 21
data. 22
Sigmoidal log concentration-effect curves (Equation 2) were applied for the reference 23
compounds in the reporter gene assays and for all chemicals in the bioassays indicative of apical 24

12
effects. The concentration causing 50% effect (EC50) was derived from the fit applied to the 1
experimental data using Equation 2, where the slope and the EC50 value were the adjustable 2
parameters. 3
4
% effect=100%
1+10slope(logEC50- log concentration)
(2) 5
6
Log-logistic concentration-effect curves are linear with respect to linear concentrations up to an 7
effect level of approximately 40% (Escher et al. 2014). Linear concentration-effect curves 8
(Equation 3) were applied to determine the concentration causing 10% effect (EC10) (Equation 4) in 9
the induction of xenobiotic metabolism, hormone-mediated effects and Ames fluctuation test assays 10
because many of the tested compounds did not reach 50% effect in these assays and because in 11
some cases cytotoxicity can mask the specific effect at high concentrations in reporter gene assays. 12
Cytotoxicity was measured in parallel to induction for many cell-based reporter gene assays and 13
concentrations that caused more than 10% cytotoxicity were excluded from the data evaluation in 14
the reporter gene assays because they would produce false positive (“cytotoxicity burst” (Judson et 15
al. 2016)) or false negative results (masking of effect by cytotoxicity). 16
17
% effect = concentration x slope
(3) 18
19
20
EC10=10%
slope
(4) 21
22

13
EC values derived from both linear and log-sigmoidal curves are shown in Figure S3 for the AhR 1
CALUX, HG5LN-hPXR, anti-MDA-kb2 and MELN assays, with both approaches yielding similar 2
EC values. Linear concentration-effect curves are a necessity when cytotoxicity occurs at higher 3
concentrations, but are also advantageous for the calculation of bioanalytical equivalent 4
concentrations (BEQ), which requires in principle parallel log-sigmoidal concentration-effect 5
curves, but this is not a restriction for linear concentration-effect curves as was discussed in more 6
detail in Neale et al. (2015). 7
8
For those assays where a maximum effect could not be defined, such as the adaptive stress response 9
(AREc32) and Ames microplate agar assays, an IR was calculated using Equation 5. The 10
concentration causing an induction ratio of 1.5 (ECIR1.5) was determined for linear concentration-11
effect curves (Equation 6) up to an IR of 5 using Equation 7. 12
13
14
IR=signal
sample
signalcontrol
(5) 15
16
IR = 1 + concentration x slope
(6) 17
18
ECIR1.5=0.5
slope
19
(7) 20
21
14
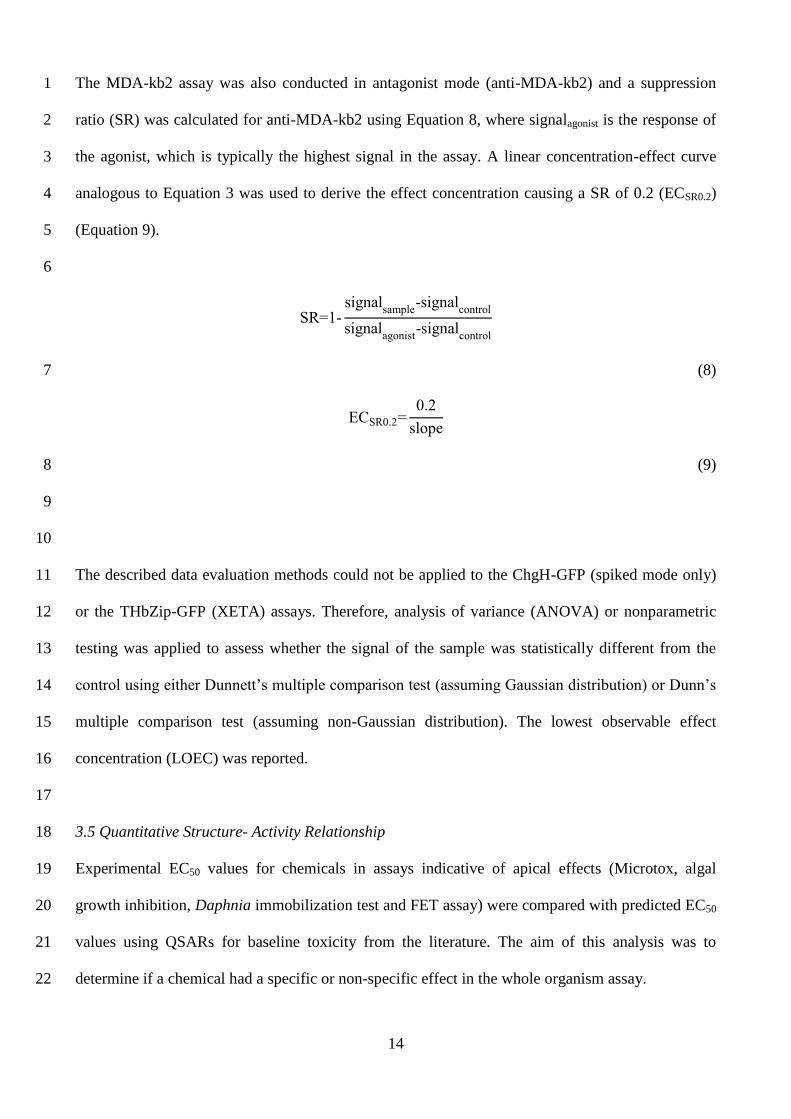
The MDA-kb2 assay was also conducted in antagonist mode (anti-MDA-kb2) and a suppression 1
ratio (SR) was calculated for anti-MDA-kb2 using Equation 8, where signalagonist is the response of 2
the agonist, which is typically the highest signal in the assay. A linear concentration-effect curve 3
analogous to Equation 3 was used to derive the effect concentration causing a SR of 0.2 (ECSR0.2) 4
(Equation 9). 5
6
SR=1-signal
sample-signal
control
signalagonist
-signalcontrol
(8) 7
ECSR0.2=0.2
slope
(9) 8
9
10
The described data evaluation methods could not be applied to the ChgH-GFP (spiked mode only) 11
or the THbZip-GFP (XETA) assays. Therefore, analysis of variance (ANOVA) or nonparametric 12
testing was applied to assess whether the signal of the sample was statistically different from the 13
control using either Dunnett’s multiple comparison test (assuming Gaussian distribution) or Dunn’s 14
multiple comparison test (assuming non-Gaussian distribution). The lowest observable effect 15
concentration (LOEC) was reported. 16
17
3.5 Quantitative Structure- Activity Relationship 18
Experimental EC50 values for chemicals in assays indicative of apical effects (Microtox, algal 19
growth inhibition, Daphnia immobilization test and FET assay) were compared with predicted EC50 20
values using QSARs for baseline toxicity from the literature. The aim of this analysis was to 21
determine if a chemical had a specific or non-specific effect in the whole organism assay. 22

15
The liposome water partition constant Klipw was used in the QSAR instead of the octanol-1
water partition constant Kow to account for speciation and diversity of the chemicals as Klipw are 2
applicable for polar and nonpolar baseline toxicants (Escher and Schwarzenbach 2002). For 3
ionizable compounds, the Klipw was replaced by the ionization-corrected liposome-water 4
distribution ratio (Dlipw) with Dlipw for the studied chemicals provided in Table S4. The Microtox 5
QSAR was developed by Escher et al. (2017) (Equation 10), the algal growth inhibition (Equation 6
11) and Daphnia immobilization test (Equation 12) were rescaled from Kow according to Escher and 7
Schwarzenbach (2002). The algal growth inhibition QSAR was based on Chlorella vulgaris, but the 8
experimental data were derived for Chlamydomonas reinhardtii. The FET QSAR was developed by 9
Klüver et al. (2016) (Equation 13). 10
11
log (1
EC50
) (Microtox) (M) =0.75∙logDlipw
+ 0.97
(10) 12
log (1
EC50
) (algal growth inhibition) (M) =0.91∙logDlipw
+ 0.63
(11) 13
log (1
EC50
) (Daphnia immobilization test) (M) =0.77∙logDlipw
+ 1.89
(12) 14
log (1
EC50
) (FET) (M) =0.99∙logDlipw
+ 0.78
(13) 15
16
The toxic ratio (TRi) was derived using Equation 14 from Verhaar et al. (1992), with a chemical 17
with a TR of >0.1 to <10 considered a baseline toxicant, while a chemical with a TR>10 was 18
considered to have a specific effect in the assay. 19
20

16
TRi=EC50-baseline QSAR,i
EC50-experimental,i
(14) 1
3.6. Mixture toxicity modeling 2
To compare different chemicals in one bioassay and as a basis for mixture toxicity modeling (Neale 3
et al. 2015), the relative effect potency (REPi) was calculated from the effect concentration of the 4
reference compound divided by the effect concentration of compound i (Equation 15). The REPi can 5
be defined for any effect concentration ECx for any matching effect level x but it is only 6
independent of effect level for linear concentration-effect curves (Neale et al. 2015) or if the slopes 7
of the sigmoidal log-concentration-effect curves are similar for the reference compound and the 8
compound of interest, i (Villeneuve et al. 2000). 9
10
REPi=ECx (ref)
ECx (i)
(15) 11
12
In mixture toxicity modeling we compare the bioanalytical equivalent concentrations from 13
bioassays (BEQbio, Equation 16) with the bioanalytical equivalent concentrations from chemical 14
analysis (BEQchem, Equation 17) for environmental samples using the detected concentration of an 15
individual chemical (Ci) and its REPi (Neale et al. 2015). 16
17
BEQbio=
ECx (ref)
ECx (sample)
(16) 18
BEQchem
= ∑ REPi∙Ci
n
i=1

17
(17) 1
2
4. Results 3
4.1 Availability of effect data in literature 4
A variable picture of available effect data emerged for the 34 selected chemicals in the 20 studied 5
assays (Figure S4, Table S5). Several of the studied compounds, including fipronil, carbendazim, 6
bisphenol A, propiconazole, triclocarban, chlorophene, benzo(a)pyrene, benzo(b)fluoranthene and 7
genistein, were expected to be active, likely active or potentially active in more than 50% of the 8
studied assays. In contrast, no information was available regarding the effect of telmisartan, 9
hexadecylpyridinium, clofibric acid and mefenamic acid in 50% or more of the selected assays. 10
Data availability tended to be more comprehensive for the conventional ecotoxicology tests, such as 11
the Daphnia immobilization test and the FET assay, while there was no information available 12
regarding the effect for 50% or more of these relevant water contaminants for the HG5LN-hPXR, 13
ZELH-zfERalpha, ZELH-zfERbeta2 and Cyp19a1b-GFP assays. The US EPA ToxCast database 14
proved to be a valuable tool, with effect or likely effect data available for 33 of the 34 studied 15
chemicals for the AhR CALUX, PPARγ-bla, MDA-kb2 and AREc32 assays. Overall, the data 16
mining exercise highlights the lack of effect data for many of the detected water pollutants, 17
emphasizing the importance of fingerprinting their biological effects. 18
19
4.2 Experimental effect data 20
The experimental EC values for the studied chemicals are reported in Table 3, with a summary of 21
the active and inactive chemicals shown in Figure 2A and all concentration-effect curves provided 22
in Figures S5 to S27. Twenty-four of the representative chemicals were run in 10 or more assays, 23
with bisphenol A (70%), diazinon (55%), cyprodinil (50%) and triphenylphosphate (50%) active in 24
50% or more of the applied assays. In contrast, hexadecylpyridinium (20%), 2,4-25
dichlorophenoxyacetic acid (18%), telmisartan (15%) and triclocarban (17%) were active in 20% or 26

18
less of the studied assays, while carbendazim was only active in the FET assay, despite being 1
predicted to be active, likely active or potentially active in 50% of the assays and ranked at 16th
in 2
the list of potentially bioactive chemicals by Busch et al. (2016). The comparison between the 3
experimental data and expected activity based on the data mining exercise is shown in Figure 2B. 4
While only a qualitative assessment was possible, between 39% and 100% of the experimental 5
effect data matched the expected activity, with over 60% similarity observed for most assays (Table 6
S6). The observed effects of the chemicals for each assay class are described below. 7
8
4.2.1 Induction of xenobiotic metabolism 9
Assays indicative of activation of AhR (AhR CALUX (ID 1)), activation of PXR (HG5LN-hPXR 10
(ID 2)) and binding to PPARγ (PPARγ-bla (ID 3)) were applied in the current study. Seven of the 11
18 tested chemicals were active in the AhR CALUX assay, while 20 of the 34 chemicals were 12
active in the HG5LN-hPXR assay, which fits with previous findings by Martin et al. (2010) that 13
many environmental chemicals can activate AhR and PXR. In contrast, only 4 out of the 18 tested 14
chemicals were active in the PPARγ-bla assay, with the pharmaceutical telmisartan the only active 15
compound that matched with the available effect data from the US EPA ToxCast database (US EPA 16
2015). 17
18
4.2.2 Hormone receptor-mediated effects 19
In vitro assays indicative of activation and inhibition of AR (MDA-kb2 (ID 4), anti-MDA-kb2 (ID 20
5)), activation of ER (MELN (ID 6), ZELH-zfERalpha (ID 7), ZELH-zfERbeta2 (ID 8)) and 21
activation of GR (GR CALUX (ID 9)) were included in the test battery. Twenty-four compounds 22
were run in the MDA-kb2 assay, with only three chemicals, benzo(a)pyrene, benzo(b)fluoranthene 23
and genistein, inducing more than 10% effect in the assay. The MDA-kb2 assay contains both AR 24
and GR (Wilson et al. 2002), and the active samples were also analyzed in the presence of the AR 25
antagonist flutamide, which suppressed the response, confirming that the three chemicals were 26

19
indeed AR agonists (Figure S9). In contrast, 12 of the 25 tested chemicals were active in the anti-1
MDA-kb2 assay, with seven of these active chemicals also reported to be active in the US EPA 2
ToxCast database (US EPA 2015). Between 2 to 9 of the 34 tested chemicals were active in the 3
activation of ER assays, with the human based MELN assay proving more responsive than the 4
zebrafish based ZELH-zfERalpha and ZELH-zfERbeta2 assays. In contrast, none of the 20 tested 5
chemicals had a response in the GR CALUX assay, despite the fact that some of the studied 6
compounds were predicted by QSARs to be potentially active based on their chemical mode of 7
action. The fact that none of the tested chemicals were active fits with previous findings by Leusch 8
et al. (2014), who found that the majority of tested environmental chemicals were inactive in the 9
GR CALUX assay. 10
In addition to the cell-based assays, embryonic fish and tadpole-stage amphibian assays 11
were applied to assess whether the representative chemicals can interfere with the endocrine system 12
in whole organisms. Among the 26 tested compounds, several, including hexadecylpyridinium, 13
diclofenac, chlorpyrifos and chlorophene, caused 100% mortality of transgenic zebrafish 14
Cyp19a1b-GFP embryos (ID 10), while bisphenol A and genistein induced aromatase in a 15
concentration-dependent manner in the developing brain. The concentrations inducing 100% 16
mortality were lower than in the FET assays (ID 19 and 20), which may be related to the longer 17
exposure duration in the cyp19a1b-GFP assay (96 h) compared to the FET assays (48 h). The 18
ChgH-GFP assay (ID 11) provided information about estrogenic signaling in medaka embryos 19
(unspiked mode), as well as anti-estrogenic signaling and aromatase activity when co-exposed to 20
testosterone (spiked mode) (Spirhanzlova et al. 2016), while the THbZIP-GFP (XETA) assay (ID 21
12) detected chemicals that act as thyroid agonists in tadpoles (unspiked mode), as well as 22
chemicals that interfere with thyroid receptors and thyroid hormone transport and metabolism when 23
exposed to thyroid hormone triiodothyronine (spiked mode) (Fini et al. 2007). Of the 24 tested 24
chemicals, EC10 values could only be derived for 3 chemicals, bisphenol A, triphenylphosphate and 25
chlorophene, in unspiked mode in the ChgH-GFP assay, while 17 of the tested chemicals were 26

20
active in spiked mode. In contrast, 7 and 5 of the 20 tested chemicals were active in spiked and 1
unspiked mode, respectively, in the THbZIP-GFP (XETA) assay. 2
3
4.2.3 Reactive modes of action 4
Two bacterial assays, the Ames fluctuation test (ID 13) and Ames microplate agar (ID 14) assays, 5
were applied to assess mutagenicity in 22 and 12 tested chemicals, respectively. In both assays, 6
benzo(a)pyrene was the only active chemical, despite a large number of the tested chemicals 7
predicted to be potentially active based on mode of action analyses. 8
9
4.2.4 Adaptive stress response pathway 10
Induction of the oxidative stress response was assessed using the AREc32 assay (ID 15), with 9 of 11
the 18 tested chemicals active in the assay. All active chemicals were predicted to be likely active 12
based on the ARE GeneBLAzer assay in the ToxCast database (US EPA 2015), with cytotoxicity 13
masking induction for four of the chemicals (fipronil, diclofenac, carbendazim and perfluoroctanoic 14
acid) predicted to be likely active. 15
16
4.2.5 Apical effects in whole organisms 17
Between 47 to 88% of the tested chemicals were active in the whole organism assays indicative of 18
apical effects. Diclofenac, bisphenol A, chlorophene and triclosan all caused an effect in bacteria, 19
algae, crustaceans and embryonic fish (Table 3). Furthermore, 4-nonylphenol, cyprodinil, diazinon, 20
diuron, propiconazole and triphenylphosphate also produced a response in all apical assays, with the 21
exception of the Microtox assay (ID 16), which has a solubility cutoff for baseline toxicants with 22
high melting points as described in more detail by Escher et al. (2017). Benzo(b)fluoranthene had 23
no effect in any of the assays up to the highest tested concentration, while effects were only 24
observed for metoprolol at concentrations above 1×10⁻³
M in the algae growth inhibition (ID 17) 25
and Daphnia immobilization (ID 18) assays. Fipronil, triclocarban and benzo(a)pyrene only 26

21
produced a positive response in the Daphnia immobilization assay, with no observed effect at the 1
highest concentrations tested in the other apical assays. 2
3
5. Discussion 4
5.1 Suitability of the bioassay test battery to detect representative pollutants 5
The majority of assays indicative of induction of xenobiotic metabolism, adaptive stress responses 6
and apical effects in whole organisms were able to detect a large number of studied chemicals 7
compared to assays indicative of hormone receptor-mediated effects or reactive modes of action. In 8
many cases, the same chemical was active in a number of assays, but at different concentrations 9
(Figure 2A). For example, consistent with mechanistic considerations, the endocrine-active 10
chemical bisphenol A induced an effect at lower concentrations in the MELN, anti-MDA-kb2 and 11
Cyp19a1b-GFP assays compared to the AREc32 assay and apical endpoints. While some modes of 12
action, such as endocrine disruption, were well covered by assays indicative of specific effects, 13
other modes of action were covered indirectly by the whole organism assays indicative of apical 14
effects. This suggests that a single bioassay cannot be representative for all effects but the applied 15
bioassay battery was generally suitable to detect the effect of the selected pollutants. 16
The discrepancy between expected and observed activity in the same bioassay (Figure 2B) 17
could be attributed to several factors including the quality of the expected activity data and 18
solubility issues. For example, the experimental results from the GR CALUX assay had the lowest 19
correspondence with the expected activity, but many of the chemicals expected to be potentially 20
active were based on a theoretical match with mode of action from QSAR predictions, rather than 21
being based on experimental data. Furthermore, many of the studied pollutants showed less effect 22
than predicted in the Microtox assay due to the solubility cutoff for chemicals with high melting 23
points, which is discussed in more detail in Escher et al. (2017) and which might also apply for 24
other bioassays. 25

22
Bioassays are typically applied to enriched water samples, with solid-phase extraction 1
commonly used. In order to assess whether the studied assays were suitable for detecting the 2
individual compounds from the list of studied water contaminants at environmentally relevant 3
concentrations, occurrence data were compared with the EC values. Busch et al. (2016) reported the 4
95th
percentile of all measured environmental concentrations (MEC95) from six studies on 5
European rivers, with the maximum MEC95 reprinted in Table S7. Based on the MEC95 values the 6
MELN assay could potentially detect bisphenol A and genistein in water samples after 17 and 15-7
fold enrichment, respectively, while the Daphnia immobilization assay could detect chlorpyrifos 8
and diazinon in water samples after 17 and 3-fold enrichment, respectively (Table S7). A larger 9
number of assays, including AhR CALUX, HG5LN-hPXR, PPARγ-bla, Anti-MDA-kb2, ZELH-10
zfERalpha and ZELH-zfERbeta2, are potentially able to detect more of the studied chemicals with 11
up to 500-fold enrichment. However, it is important to note that in environmental samples, 12
bioassays will not detect single compounds, but rather mixtures of compounds. Therefore, it does 13
not mean that a particular bioassay is unsuitable for water quality monitoring if a single chemical is 14
not detected. It is rather likely that none of the known pollutants cause an effect alone, but instead it 15
is the mixture effect that will be detected by the assay. This is termed a “something from nothing” 16
effect (Silva et al. 2002), which has been demonstrated numerous times in defined mixture 17
experiments where chemicals mixed at concentrations below their observable effect level show an 18
effect in combination. 19
20
5.2 Comparing cellular effects with whole organism specific effects 21
Three in vitro assays indicative of activation of ER in a human cell line (MELN) and zebrafish cell 22
lines (ZELH-zfERalpha and ZELH-zfERbeta2) and two whole organism assays indicative of ER-23
regulated effects in early life-stage fish (Cyp19a1b-GFP (zebrafish) and ChgH-GFP (medaka) were 24
applied in the current study, allowing a comparison of estrogenic effects between different cell lines 25
and different organisms. While 9 of the tested chemicals (diazinon, bisphenol A, 26

23
triphenylphosphate, 4-nonylphenol, chlorpyrifos, benzo(a)pyrene, benzo(b)fluoranthene, 1
terbutylazine and genistein) were active in the MELN assay, only two, bisphenol A and genistein, 2
had a response in the ZELH-zfERalpha and ZELH-zfERbeta2 assays. This could be due to either 3
species-specific differences in sensitivity or selectivity, as has previously been observed in 4
environmental samples for the studied assays (Sonavane et al. 2016), and/or due to the higher 5
metabolic capacity of the hepatic zebrafish cell line, which may potentially lead to more 6
biotransformation of the test compounds than the MELN assay, which is based on a breast cancer 7
cell line (Le Fol et al. 2015). At the organism level, the Cyp19a1b-GFP assay results were very 8
consistent with the ZELH-zfERalpha and ZELH-zfERbeta2 assays, with bisphenol A and genistein 9
able to induce the expression of ER-regulated aromatase in the developing brain. Other bisphenol 10
compounds have also been shown to induce estrogenic responses in the studied zebrafish in vitro 11
and whole organism assays (Le Fol et al. 2017). This emphasizes the relevance of applying fish-12
specific in vitro assays, as well as early life-stage organism assays, for environmental risk 13
assessment. 14
The ChgH-GFP assay using medaka embryos also responded to bisphenol A, but genistein, 15
which was active in all other estrogenic assays, did not induce a response in the ChgH-GFP assay. 16
This has also been observed in a previous study and was attributed to the lower sensitivity of 17
medaka to genistein, with reverse transcriptase-polymerase chain reaction (RT-PCR) indicating no 18
change in choriogenin H or vitellogenin transcription in the presence of genistein (Scholz et al. 19
2005). In addition to bisphenol A, EC10 values could be determined for triphenylphosphate and 20
chlorophene in unspiked mode, with triphenylphosphate also active in the MELN assay. The 21
observed differences between the zebrafish and medaka assays may be due to differences in species 22
sensitivity to (xeno)-estrogens. It is noteworthy that both transgenic models presented differences in 23
sensitivity to the reference compound 17α-ethinylestradiol (Figure S2) and to some xenoestrogens 24
(e.g. bisphenol A and genistein) (Figures S14 and S15), thus highlighting the different intrinsic 25
sensitivities in the estrogenic response. The exposure duration (96 h for the Cyp19a1b-GFP assay 26

24
and 24 h for the ChgH-GFP assay), the tissue context (brain versus liver) and the metabolic capacity 1
of the models may account for these differences. The variability in responsiveness and sensitivity of 2
the many different estrogenicity assays is well known (Kunz et al. 2017) and can be used to 3
investigate the exact toxic mechanisms and to differentiate true effects from assay interferences 4
(Browne et al. 2015, Judson et al. 2015). In turn this does not mean that for water quality 5
monitoring that many different assays indicative of the one endpoint should be used or that one 6
assay should be favored over others. However, when undertaking mixture toxicity modeling or 7
when deriving effect-based trigger values, one should use data from the same bioassay as the BEQ 8
value will be specific for each assay (Escher et al. 2015a). 9
10
5.3 Are the representative compounds acting specifically or as baseline toxicants on the apical 11
endpoints? 12
The majority of tested chemicals were active in the whole organism assays indicative of apical 13
effects given these endpoints cover effects of multiple toxicity pathways. To determine whether the 14
tested chemicals were baseline toxicants in the studied assays (0.1 < TR < 10) or if they had a 15
specific mode of action (TR >10), the derived EC50 values were compared with EC50 values 16
predicted by baseline toxicity QSARs (Figure 3), with the TR calculated using Equation 14 (Table 17
S8). 18
The majority of studied chemicals acted as baseline toxicants (01 < TR < 10) for the 30-min 19
bioluminescence inhibition assay with A. fischeri (Microtox assay, Figure 3A). The exceptions were 20
1,2-benzisothiazolinone, which had a TR of 488, and dinoseb, which had a TR of 22. 1,2-21
Benzisothiazolinone is a biocide and soft electrophile, while the pesticide dinoseb is a potent 22
uncoupler, meaning that it can interfere with cellular energy transduction (Escher et al. 1996), and 23
both can have a specific effect on bacteria, as supported by the higher TR. The antibiotic 24
sulfamethoxazole had a TR of 4.8, thus was not considered as having a specific effect, which was 25
also observed by Tang et al. (2013), although antibiotics are often specifically acting in bacteria. 26

25
This may be due to the 30 min exposure duration, with previous studies showing that antibiotics 1
often only have a specific effect on bacteria after longer exposure durations when growth becomes 2
important (Backhaus et al. 1997). 3
Despite being based on a different algal species, the experimental data for Chlamydomonas 4
reinhardtii fit well with the Chlorella vulgaris baseline toxicity QSAR predictions (Figure 3B). The 5
one chemical expected to be acting specifically was the photosystem II inhibitor diuron, which had 6
a TR of 852, which confirms earlier studies identifying diuron to be specifically acting on growth in 7
green algae (Neuwoehner et al. 2008). 8
Five chemicals, chlorpyrifos, diazinon, fipronil, cyprodinil and triclocarban, had a TR > 10 9
in the Daphnia immobilization assay (Figure 3C). The most potent chemicals, chlorpyrifos 10
(TR=123818) and diazinon (TR=96043), are both neuroactive chemicals that inhibit 11
acetylcholinesterase (AChE), with previous studies showing that daphnids are particularly sensitive 12
to the AChE inhibitors (Vaal et al. 2000). 13
Many chemicals act as baseline toxicants in the FET assay (Ellison et al. 2016, Klüver et al. 14
2016), with the majority of pollutants in our test set showing baseline toxicity. Three compounds, 15
carbendazim, 1,2-benzisothiazolinone and mefenamic acid, had a TR > 10 in the FET assay (Figure 16
3D). The fungicide carbendazim had a TR of 1775 and has previously been shown to have a 17
specific effect in the FET assay (Schmidt et al. 2016). In contrast, the TR was less than 0.1 for 4-18
nonylphenol, which may be due to its hydrophobicity. The EC50 values of some of the more 19
hydrophobic compounds, including 4-nonylphenol and triphenylphosphate, were lower in the FET 20
assay conducted in glass vials than the FET assay run in 96 well polystyrene plates, despite both 21
assays using a 48 h exposure period. Chemical sorption to the plastic may have reduced the 22
bioavailable chemical concentration in the 96 well plate assay. This limitation could potentially be 23
overcome through passive dosing, which has been recently applied to the FET assay using silicone 24
O-rings (Vergauwen et al. 2015), though this approach has yet to be scaled down to the 96 well 25
format. 26

26
1
5.4 Application of the fingerprinting data for mixture toxicity modeling 2
Recent work has focused on trying to understand mixture effects of known and analyzed chemicals 3
compared to the overall risk of known mixtures in wastewater treatment plant effluent and surface 4
water and it appears that a small number of chemicals determine the overall risk (Backhaus and 5
Karlsson 2014, Munz et al. 2017). In case studies on water treatment and surface water, some 6
industrial compounds, including benzothiazoles and fragrance chemicals, may be present at high 7
concentrations, but they were often less potent than other chemicals and consequently contributed 8
little to the observed biological effects (Tang et al. 2014). In another study, pesticides present at 9
lower concentrations than pharmaceuticals were found to be the drivers of toxicity in aquatic 10
organisms (Munz et al. 2017). 11
Another approach is to additionally quantify the contribution of detected chemicals to the 12
observed effect in a bioassay. This helps to not only apportion the toxicity to the various known 13
constituents of the mixture, but also to estimate the contribution of unknown chemicals in the 14
mixture effect of the entire water sample. This approach is termed iceberg modeling, because it 15
allows a quantification of the unknown chemicals contribution to the effect of the mixture without 16
having to identify them. Both modeling approaches for mixture effects can be combined as we have 17
demonstrated in previous studies (Neale et al. 2015, Neale et al. 2017, Tang et al. 2013, Tang et al. 18
2014) but this approach is limited by the lack of effect data for commonly detected chemicals. As a 19
result, it is often unclear whether the detected chemicals are active, and potentially contributing to 20
the effect, or inactive in the applied assays. This knowledge gap can be overcome by fingerprinting 21
the effects of relevant chemicals in bioassays. Consequently, the generated effect data from the 22
current study can be applied for improved mixture toxicity modeling. 23
If the majority of chemicals in mixtures are acting in a concentration additive manner, which 24
has been confirmed for most reporter gene assays and is also supported by the design principle of a 25
reporter gene assay that is based on a single mode of action, BEQ values from bioanalysis (BEQbio, 26

27
Equation 16) can be compared to BEQ values from chemical analysis (BEQchem, Equation 17) 1
(Neale et al. 2015). This approach has been applied to a range of water types, using initially 2
estrogenicity assays (Aerni et al. 2004, Leusch et al. 2010, Murk et al. 2002) but later other reporter 3
gene assays, such as those that detect additional hormonal effects (König et al. 2017), PXR and 4
AhR activity (Creusot et al. 2010) or adaptive stress responses (Escher et al. 2013, Tang et al. 5
2014). 6
It is more daring to apply the iceberg-modeling concept to apical endpoints in whole 7
organism tests because, as demonstrated in Section 5.3, single chemicals can have very high TR, 8
which would mean that diverse modes of action are involved and that the mixture model of 9
concentration addition would not necessarily apply. However, in those studies simulating 10
environmental mixtures using the Microtox assay, water pollutants were typically well described by 11
the mixture toxicity model of concentration addition (Escher et al. 2017, Tang et al. 2013), therefore 12
the iceberg-modeling approach should also be feasible for this endpoint. Likewise for the 13
investigated water pollutants, the TRs in the FET assays were fairly low, which means that potential 14
specific effects were not of high potency; therefore, it can be expected that deviations from the 15
model of concentration addition would not be substantial. 16
In contrast, for algae and daphnia, some of the water pollutants that were tested here had 17
high TRs and therefore the assumption of concentration addition can be challenged. In practice, we 18
observed that concentration addition was a robust tool for algal toxicity when considering typical 19
water pollutants at concentrations encountered in environmental water samples (Tang et al. 2013), 20
but this remains to be confirmed for daphnids. Ongoing experiments with defined mixtures of the 21
water pollutants presented here, carried out within the framework of the EU project SOLUTIONS 22
(www.solutions-project.eu) will hopefully shed more light on these questions. 23
Using the EC values fingerprinted in the current study, mixture toxicity modeling of Danube 24
River samples previously presented in Neale et al. (2015) was revised for the HG5LN-hPXR, 25

28
MELN and FET assays. The revised REPi values are shown in Table S9, while the REPi values 1
used previously can be found in Table 3 of Neale et al. (2015). 2
The percentage of effect explained by individual detected chemicals for both existing and 3
revised mixture toxicity modeling is shown in Figure 4. EC values in the HG5LN-hPXR assay are 4
now available for 17 of the detected chemicals, but even with the additional chemicals, only 0.2% 5
of PXR activation can be explained. Previously, there was no information about the effect of 6
genistein in the HG5LN-hPXR assay, but using the new effect data genistein was found to 7
contribute to over half of the explained effect in some of the samples. A similar picture emerges for 8
the FET assay; although EC values are now available for 19 chemicals, they account for less than 9
0.4% of the observed effect. Since a large number of chemicals can produce a response in both of 10
these assays, the low fraction of effect that can be explained is not surprising, even with EC values 11
for up to 19 chemicals. In contrast, much of the observed effect in the MELN assay at some sites 12
can already be explained, with the new EC values having a negligible effect as diazinon and 13
terbutylazine are weakly active in the assay. It should be noted that the contribution of some of the 14
detected chemicals changed with the revised EC values, with some chemicals found to be more or 15
less potent than the previously published. For example, estrone was found to be more potent in the 16
MELN assay than previously reported by Pillon et al. (2005). This exercise highlights the 17
importance of applying effect-based tools for water quality assessment as targeted chemical analysis 18
alone often provides a limited view of the chemical burden. 19
20
6. Conclusions 21
A battery of bioassays covering different modes of action was assembled in the current study to 22
detect the effects of representative water pollutants. It is important to stress that the exact type of 23
bioassay is not essential but a diverse panel of bioassays that includes apical endpoints is essential, 24
as well as specific bioassays indicative of crucial steps in toxicity pathways relevant for 25

29
micropollutants occurring in surface water. This is why the selection of bioassays was also guided 1
by what types of effects were detected in the surface water samples. 2
All studied chemicals were active in at least one of the applied assays, with the industrial 3
compound bisphenol A active in 70% of the studied assays. As expected, more chemicals were 4
active in the assays indicative of apical effects, but the concentrations at which some chemicals 5
induced an effect were much lower in assays that were based on a specific pathway/mechanism. For 6
example, genistein and bisphenol A were more responsive in the ER mediated assays compared to 7
the whole organism assays. These patterns illustrate how important it is to combine bioassays with 8
apical endpoints and specific pathway endpoints to comprehensively capture the hazard potential of 9
micropollutants in surface water. 10
There was reasonable agreement between the experimental results and the expected activity, 11
though the data mining exercise highlighted the lack of available data, particularly for some 12
recently developed mechanism-based assays, which is a common limitation of such investigations. 13
Effect data for individual chemicals are required as input parameters for mixture toxicity modeling 14
and the data generated in the current study will be applied in ongoing and future studies to assess 15
the mixture effects of representative pollutants in river and other water samples. 16
17
Acknowledgements 18
The project SOLUTIONS is supported by the European Union Seventh Framework Programme 19
(FP7-ENV-2013-two-stage Collaborative project) under grant agreement number 603437. Neale 20
was supported by the National Health and Medical Research Council (NHMRC) – European Union 21
Collaborative Research Grant (APP1074775). Umbuzeiro and Morales acknowledge Fapesp for 22
research funding (2015/24758-5 and 2013/16956-6); Morales thanks CAPES for PhD fellowship 23
and Shao thanks CSC for a PhD fellowship. Hollert, Seiler and Shao would like to kindly thank 24
Nikon Deutschland GmbH, Promega Corporation and ibs tecnomara GmbH for their contribution to 25
this study as a partner of the Students Lab "Fascinating Environment" at Aachen Biology and 26

30
Biotechnology (ABBt). We thank Maria König (UFZ), Christin Kühnert (UFZ), Janet Krüger 1
(UFZ), Ana Catarina Almeida (NIVA), José Zwarg (FT/UNICAMP), Letícia Ferreira 2
(FT/UNICAMP) and Elodie Paillard (WatchFrog) for experimental assistance and Nils Klüver 3
(UFZ) for helpful discussions. 4
5
References 6
Aerni, H.R., Kobler, B., Rutishauser, B.V., Wettstein, F.E., Fischer, R., Giger, W., Hungerbuhler, 7
A., Marazuela, M.D., Peter, A., Schonenberger, R., Vogeli, A.C., Suter, M.J.F., Eggen, 8
R.I.L., 2004. Combined biological and chemical assessment of estrogenic activities in 9
wastewater treatment plant effluents. Anal. Bioanal. Chem. 378(3), 688-696. 10
Altenburger, R., Aït-Aïssa, S., Antczak, P., Backhaus, T., Barcelo, D., Seiler, T.-B., Brion, F., 11
Busch, W., Chipman, K., de Alda, M.L., de Aragao Umbuzeiro, G., Escher, B.I., Falciani, 12
F., Faust, M., Focks, A., Hilscherová, K., Hollender, J., Hollert, H., Jager, F., Jahnke, A., 13
Kortenkamp, A., Krauss, M., Lemkine, G.F., Munthe, J., Neumann, S., Schymanski, E.L., 14
Scrimshaw, M., Segner, H., Slobodnik, J., Smedes, F., Kughathas, S., Teodorovic, I., 15
Tindall, A.J., Tollefsen, K.E., Walz, K.-H., Williams, T.D., Van den Brink, P.J., van Gils, J., 16
Vrana, B., Zhang, X., Brack, W., 2015. Future water quality monitoring - Adapting tools to 17
deal with mixtures of pollutants in water resource management. Sci. Total Environ. 512-513, 18
540-551. 19
Ankley, G.T., Bennett, R.S., Erickson, R.J., Hoff, D.J., Hornung, M.W., Johnson, R.D., Mount, 20
D.R., Nichols, J.W., Russom, C.L., Schmieder, P.K., Serrrano, J.A., Tietge, J.E., Villeneuve, 21
D.L., 2010. Adverse outcome pathways: A conceptual framework to support ecotoxicology 22
research and risk assessment. Environ. Toxicol. Chem. 29(3), 730-741. 23
Backhaus, T., Froehner, K., Altenburger, R., Grimme, L.H., 1997. Toxicity testing with Vibrio 24
fischeri: A comparison between the long term (24 h) and the short term (30 min) bioassay. 25
Chemosphere 35(12), 2925-2938. 26

31
Backhaus, T., Karlsson, M., 2014. Screening level mixture risk assessment of pharmaceuticals in 1
STP effluents. Water Res. 49, 157-165. 2
Balaguer, P., Francois, F., Comunale, F., Fenet, H., Boussioux, A.M., Pons, M., Nicolas, J.C., 3
Casellas, C., 1999. Reporter cell lines to study the estrogenic effects of xenoestrogens. Sci. 4
Total Environ. 233(1-3), 47-56. 5
Basketter, D.A., Rodford, R., Kimber, I., Smith, I., Wahlberg, J.E., 1999. Skin sensitization risk 6
assessment: a comparative evaluation of 3 isothiazolinone biocides. Contact Derm. 40(3), 7
150-154. 8
Brennan, J.C., He, G.C., Tsutsumi, T., Zhao, J., Wirth, E., Fulton, M.H., Denison, M.S., 2015. 9
Development of species-specific Ah receptor-responsive third generation CALUX cell lines 10
with enhanced responsiveness and improved detection limits. Environ. Sci. Technol. 49(19), 11
11903-11912. 12
Brion, F., Le Page, Y., Piccini, B., Cardoso, O., Tong, S.K., Chung, B.C., Kah, O., 2012. Screening 13
estrogenic activities of chemicals or mixtures in vivo using transgenic (cyp19a1b-GFP) 14
zebrafish embryos. Plos One 7(5), e36069. 15
Browne, P., Judson, R.S., Casey, W.M., Kleinstreuer, N.C., Thomas, R.S., 2015. Screening 16
chemicals for estrogen receptor bioactivity using a computational model. Environ. Sci. 17
Technol. 49(14), 8804-8814. 18
Busch, W., Schmidt, S., Kuhne, R., Schulze, T., Krauss, M., Altenburger, R., 2016. Micropollutants 19
in European rivers: A mode of action survey to support the development of effect-based 20
tools for water monitoring. Environ. Toxicol. Chem. 35(8), 1887-1899. 21
Claxton, L.D., Umbuzeiro, G.D.A., DeMarini, D.M., 2010. The Salmonella mutagenicity assay: 22
The stethoscope of genetic toxicology for the 21st century. Environ. Health Perspect. 118, 23
1515-1522. 24
Cosnefroy, A., Brion, F., Maillot-Marechal, E., Porcher, J.M., Pakdel, F., Balaguer, P., Aït-Aïssa, 25
S., 2012. Selective activation of zebrafish estrogen receptor subtypes by chemicals by using 26

32
stable reporter gene assay developed in a zebrafish liver cell line. Toxicol. Sci. 125(2), 439-1
449. 2
Creusot, N., Kinani, S., Balaguer, P., Tapie, N., LeMenach, K., Maillot-Maréchal, E., Porcher, J.M., 3
Budzinski, H., Aït-Aïssa, S., 2010. Evaluation of an hPXR reporter gene assay for the 4
detection of aquatic emerging pollutants: Screening of chemicals and application to water 5
samples. Anal. Bioanal. Chem. 396(2), 569-583. 6
DeMarini, D.M., Dallas, M.M., Lewtas, J., 1989. Cytotoxicity and effect on mutagenicity of buffers 7
in a microsuspension assay. Teratogen. Carcin. Mut. 9(5), 287-295. 8
Di Paolo, C., Ottermanns, R., Keiter, S., Aït-Aïssa, S., Bluhm, K., Brack, W., Breitholtz, M., 9
Buchinger, S., Carere, M., Chalon, C., Cousin, X., Dulio, V., Escher, B.I., Hamers, T., 10
Hilscherová, K., Jarque, S., Jonas, A., Maillot-Marechal, E., Marneffe, Y., Nguyen, M.T., 11
Pandard, P., Schifferli, A., Schulze, T., Seidensticker, S., Seiler, T.B., Tang, J., van der 12
Oost, R., Vermeirssen, E., Zounkova, R., Zwart, N., Hollert, H., 2016. Bioassay battery 13
interlaboratory investigation of emerging contaminants in spiked water extracts - Towards 14
the implementation of bioanalytical monitoring tools in water quality assessment and 15
monitoring. Water Res. 104, 473-484. 16
Ellison, C.M., Piechota, P., Madden, J.C., Enoch, S.J., Cronin, M.T.D., 2016. Adverse outcome 17
pathway (AOP) informed modeling of aquatic toxicology: QSARs, read-across, and 18
interspecies verification of modes of action. Environ. Sci. Technol. 50(7), 3995-4007. 19
Escher, B.I., Snozzi, M., Schwarzenbach, R.P., 1996. Uptake, speciation, and uncoupling activity of 20
substituted phenols in energy transducing membranes. Environ. Sci. Technol. 30(10), 3071-21
3079. 22
Escher, B.I., Schwarzenbach, R.P., 2002. Mechanistic studies on baseline toxicity and uncoupling 23
of organic compounds as a basis for modeling effective membrane concentrations in aquatic 24
organisms. Aquat. Sci. 64(1), 20-35. 25

33
Escher, B.I., Dutt, M., Maylin, E., Tang, J.Y.M., Toze, S., Wolf, C.R., Lang, M., 2012. Water 1
quality assessment using the AREc32 reporter gene assay indicative of the oxidative stress 2
response pathway. J. Environ. Monit. 14(11), 2877-2885. 3
Escher, B.I., Leusch, F.D.L., 2012. Bioanalytical tools in water quality assessment, IWA 4
Publishing, London. 5
Escher, B.I., van Daele, C., Dutt, M., Tang, J.Y.M., Altenburger, R., 2013. Most oxidative stress 6
response in water samples comes from unknown chemicals: The need for effect-based water 7
quality trigger values. Environ. Sci. Technol. 47(13), 7002-7011. 8
Escher, B.I., Allinson, M., Altenburger, R., Bain, P.A., Balaguer, P., Busch, W., Crago, J., 9
Denslow, N.D., Dopp, E., Hilscherová, K., Humpage, A.R., Kumar, A., Grimaldi, M., 10
Jayasinghe, B.S., Jarosova, B., Jia, A., Makarov, S., Maruya, K.A., Medvedev, A., Mehinto, 11
A.C., Mendez, J.E., Poulsen, A., Prochazka, E., Richard, J., Schifferli, A., Schlenk, D., 12
Scholz, S., Shiraish, F., Snyder, S., Su, G.Y., Tang, J.Y.M., van der Burg, B., van der 13
Linden, S.C., Werner, I., Westerheide, S.D., Wong, C.K.C., Yang, M., Yeung, B.H.Y., 14
Zhang, X.W., Leusch, F.D.L., 2014. Benchmarking organic micropollutants in wastewater, 15
recycled water and drinking water with in vitro bioassays. Environ. Sci. Technol. 48(3), 16
1940-1956. 17
Escher, B.I., Neale, P.A., Leusch, F.D.L., 2015a. Effect-based trigger values for in vitro bioassays: 18
Reading across from existing water quality guideline values. Water Res. 81, 137-148. 19
Escher, B.I., Neale, P.A., Leusch, F.D.L., 2015b. Effect-based trigger values for in vitro bioassays: 20
Reading across from existing water quality guideline values. Water Res. 81(0), 137-148. 21
Escher, B.I., Baumer, A., König, M., Kühnert, C., Mayer, P., Klüver, N., 2017. General baseline 22
toxicity QSAR for non-polar, polar and ionisable chemicals in the bioluminescence 23
inhibition assay with Aliivibrio fischeri. Env. Sci. Process. Impact 19(3), 414-428. 24

34
European Commission, 2011. Common implementation strategy for the water framework directive 1
(2000/60/EC). Guidance document No. 27. Technical guidance for deriving environmental 2
quality standards, Brussels. 3
European Commission, 2012. Proposal for a Directive of the European Parliament and the Council 4
amending Directives 2000/60/EC and 2008/105/EC as regards priority substances in the 5
field of water policy, COM/2011/0876 final - 2011/0429 (COD), Brussels. 6
European Commission, 2013. Directive 2013/39/EU of the European Parliament and the Council of 7
12. August 2013 amending Directives 2000/60/EC and 2008/105/EC as regards priority 8
substances in the field of water policy. Off. J. Eur. Union, L226/221-L226/217. 9
Fini, J.B., Le Mevel, S., Turque, N., Palmier, K., Zalko, D., Cravedi, J.P., Demeneix, B.A., 2007. 10
An in vivo multiwell-based fluorescent screen for monitoring vertebrate thyroid hormone 11
disruption. Environ. Sci. Technol. 41(16), 5908-5914. 12
Hiemstra, S., Niemeijer, M., Koedoot, E., Wink, S., Pip, J.E., Vlasveld, M., de Zeeuw, E., van Os, 13
B., White, A., van de Water, B., 2017. Comprehensive Landscape of Nrf2 and p53 Pathway 14
Activation Dynamics by Oxidative Stress and DNA Damage. Chem. Res. Toxicol. 30(4), 15
923-933. 16
Invitrogen, 2010. GeneBLAzer® PPAR gamma 293H DA and PPAR gamma-UAS-bla 293H Cell-17
based Assay Protocol, Invitrogen Corporation, Carslbad, CA, USA. 18
Jálová, V., Jarošová, B., Bláha, L., Giesy, J.P., Ocelka, T., Grabic, R., Jurčíková, J., Vrana, B., 19
Hilscherová, K., 2013. Estrogen-, androgen- and aryl hydrocarbon receptor mediated 20
activities in passive and composite samples from municipal waste and surface waters. 21
Environ. Int. 59, 372-383. 22
Judson, R., Houck, K., Martin, M., Richard, A.M., Knudsen, T.B., Shah, I., Little, S., Wambaugh, 23
J., Setzer, R.W., Kothya, P., Phuong, J., Filer, D., Smith, D., Reif, D., Rotroff, D., 24
Kleinstreuer, N., Sipes, N., Xia, M.H., Huang, R.L., Crofton, K., Thomas, R.S., 2016. 25

35
Analysis of the effects of cell stress and cytotoxicity on in vitro assay activity across a 1
diverse chemical and assay space. Toxicol. Sci. 152(2), 323-339. 2
Judson, R.S., Magpantay, F.M., Chickarmane, V., Haskell, C., Tania, N., Taylor, J., Xia, M.H., 3
Huang, R.L., Rotroff, D.M., Filer, D.L., Houck, K.A., Martin, M.T., Sipes, N., Richard, 4
A.M., Mansouri, K., Setzer, R.W., Knudsen, T.B., Crofton, K.M., Thomas, R.S., 2015. 5
Integrated model of chemical perturbations of a biological pathway using 18 in vitro high-6
throughput screening assays for the estrogen receptor. Toxicol. Sci. 148(1), 137-154. 7
Klüver, N., Vogs, C., Altenburger, R., Escher, B.I., Scholz, S., 2016. Development of a general 8
baseline toxicity QSAR model for the fish embryo acute toxicity test. Chemosphere 164, 9
164-173. 10
König, M., Escher, B.I., Neale, P.A., Krauss, M., Hilscherová, K., Novák, J., Teodorović, I., 11
Schulze, T., Seidensticker, S., Kamal Hashmi, M.A., Ahlheim, J., Brack, W., 2017. Impact 12
of untreated wastewater on a major European river evaluated with a combination of in vitro 13
bioassays and chemical analysis. Environ. Pollut. 220, 1220–1230. 14
Kunz, P.Y., Simon, E., Creusot, N., Jayasinghe, B.S., Kienle, C., Maletz, S., Schifferli, A., 15
Schönlau, C., Aït-Aïssa, S., Denslow, N.D., Hollert, H., Werner, I., Vermeirssen, E.L.M., 16
2017. Effect-based tools for monitoring estrogenic mixtures: Evaluation of five in vitro 17
bioassays. Water Res., In Press http://dx.doi.org/10.1016/j.watres.2016.1010.1062. 18
Le Fol, V., Aït-Aïssa, S., Cabaton, N., Dolo, L., Grimaldi, M., Balaguer, P., Perdu, E., Debrauwer, 19
L., Brion, F., Zalko, D., 2015. Cell-specific biotransformation of benzophenone-2 and 20
bisphenol-S in zebrafish and human in vitro models used for toxicity and estrogenicity 21
screening. Environ. Sci. Technol. 49(6), 3860-3868. 22
Le Fol, V., Aït-Aïssa, S., Sonavane, M., Porcher, J.-M., Balaguer, P., Cravedi, J.-P., Zalko, D., 23
Brion, F., 2017. In vitro and in vivo estrogenic activity of BPA, BPF and BPS in zebrafish-24
specific assays. Ecotoxicol. Environ. Saf. 142, 150-156. 25

36
Lemaire, G., Mnif, W., Pascussi, J.M., Pillon, A., Rabenoelina, F., Fenet, H., Gomez, E., Casellas, 1
C., Nicolas, J.C., Cavailles, V., Duchesne, M.J., Balaguer, P., 2006. Identification of new 2
human pregnane X receptor ligands among pesticides using a stable reporter cell system. 3
Toxicol. Sci. 91(2), 501-509. 4
Leusch, F.D.L., De Jager, C., Levi, Y., Lim, R., Puijker, L., Sacher, F., Tremblay, L.A., Wilson, 5
V.S., Chapman, H.F., 2010. Comparison of five in vitro bioassays to measure estrogenic 6
activity in environmental waters. Environ. Sci. Technol. 44(10), 3853-3860. 7
Leusch, F.D.L., Khan, S.J., Laingam, S., Prochazka, E., Froscio, S., Trang, T., Chapman, H.F., 8
Humpage, A., 2014. Assessment of the application of bioanalytical tools as surrogate 9
measure of chemical contaminants in recycled water. Water Res. 49, 300-315. 10
Leusch, F.D.L., Snyder, S.A., 2015. Bioanalytical tools: half a century of application for potable 11
reuse. Environ. Sci. Water Res. Technol. 1, 606-621. 12
Malaj, E., von der Ohe, P.C., Grote, M., Kuhne, R., Mondy, C.P., Usseglio-Polatera, P., Brack, W., 13
Schafer, R.B., 2014. Organic chemicals jeopardize the health of freshwater ecosystems on 14
the continental scale. Proc. Natl. Acad. Sci. U.S.A. 111(26), 9549-9554. 15
Martin, M.T., Dix, D.J., Judson, R.S., Kavlock, R.J., Reif, D.M., Richard, A.M., Rotroff, D.M., 16
Romanov, S., Medvedev, A., Poltoratskaya, N., Gambarian, M., Moeser, M., Makarov, S.S., 17
Houck, K.A., 2010. Impact of environmental chemicals on key transcription regulators and 18
correlation to toxicity end points within EPA's ToxCast program. Chem. Res. Toxicol. 19
23(3), 578-590. 20
Maruya, K.A., Dodder, N.G., Mehinto, A.C., Denslow, N.D., Schlenk, D., Snyder, S.A., Weisberg, 21
S.B., 2016. A tiered, integrated biological and chemical monitoring framework for 22
contaminants of emerging concern in aquatic ecosystems. Integr. Environ. Assess. Manag. 23
12(3), 540-547. 24
Mortelmans, K., Zeiger, E., 2000. The Ames Salmonella/microsome mutagenicity assay. Mutat. 25
Res. Fund. Mol. Mech. Mut. 455(1-2), 29-60. 26

37
Munz, N.A., Burdon, F.J., de Zwart, D., Junghans, M., Melo, L., Reyes, M., Schonenberger, U., 1
Singer, H.P., Spycher, B., Hollender, J., Stamm, C., 2017. Pesticides drive risk of 2
micropollutants in wastewater-impacted streams during low flow conditions. Water Res. 3
110, 366-377. 4
Murk, A.J., Legler, J., van Lipzig, M.M.H., Meerman, J.H.N., Belfroid, A.C., Spenkelink, A., van 5
der Burg, B., Rijs, G.B.J., Vethaak, D., 2002. Detection of estrogenic potency in wastewater 6
and surface water with three in vitro bioassays. Environ. Toxicol. Chem. 21(1), 16-23. 7
Neale, P.A., Antony, A., Bartkow, M., Farre, M., Heitz, A., Kristiana, I., Tang, J.Y.M., Escher, B.I., 8
2012. Bioanalytical assessment of the formation of disinfection by-products in a drinking 9
water treatment plant. Environ. Sci. Technol. 46(18), 10317–10325. 10
Neale, P.A., Aït-Aïssa, S., Brack, W., Creusot, N., Denison, M.S., Deutschmann, B., Hilscherová, 11
K., Hollert, H., Krauss, M., Novak, J., Schulze, T., Seiler, T.-B., Serra, H., Shao, Y., Escher, 12
B.I., 2015. Linking in vitro effects and detected organic micropollutants in surface water 13
using mixture-toxicity modeling. Environ. Sci. Technol. 49(24), 14614-14624. 14
Neale, P.A., Munz, N.A., Aït-Aïssa, S., Altenburger, R., Brion, F., Busch, W., Escher, B.I., 15
Hilscherová, K., Kienle, C., Novak, J., Seiler, T.B., Shao, Y., Stamm, C., Hollender, J., 16
2017. Integrating chemical analysis and bioanalysis to evaluate the contribution of 17
wastewater effluent on the micropollutant burden in small streams. Sci. Total Environ. 576, 18
785–795. 19
Neuwoehner, J., Junghans, M., Koller, M., Escher, B.I., 2008. QSAR analysis and specific 20
endpoints for classifying the physiological modes of action of biocides in synchronous green 21
algae. Aquat. Toxicol. 90(1), 8-18. 22
OECD, 2004. Test No. 202: Daphnia sp. Acute Immobilisation Test, OECD Publishing, Paris. 23
OECD, 2011. Test No. 201: Freshwater Alga and Cyanobacteria, Growth Inhibition Test, OECD 24
Publishing, Paris. 25

38
OECD, 2013. Test No. 236: Fish Embryo Acute Toxicity (FET) Test, OECD Guidelines for the 1
Testing of Chemicals, Section 2, OECD Publishing, Paris. 2
Oekotoxzentrum, 2017. Proposals for Acute and Chronic Quality Standards, 3
http://www.ecotoxcentre.ch/expert-service/quality-standards/proposals-for-acute-and-4
chronic-quality-standards/, accessed 26 February 2017. 5
Pillon, A., Boussioux, A.M., Escande, A., Aït-Aïssa, S., Gomez, E., Fenet, H., Ruff, M., Moras, D., 6
Vignon, F., Duchesne, M.J., Casellas, C., Nicolas, J.C., Balaguer, P., 2005. Binding of 7
estrogenic compounds to recombinant estrogen receptor alpha: Application to environmental 8
analysis. Environ. Health Perspect. 113(3), 278-284. 9
Prasse, C., Stalter, D., Schulte-Oehlmann, U., Oehlmann, J., 2015. Spoilt for choice: A critical 10
review on the chemical and biological assessment of current wastewater treatment 11
technologies. Water Res. 87, 237-270. 12
Reifferscheid, G., Maes, H.M., Allner, B., Badurova, J., Belkin, S., Bluhm, K., Brauer, F., 13
Bressling, J., Domeneghetti, S., Elad, T., Fluckiger-Isler, S., Grummt, H.J., Guertler, R., 14
Hecht, A., Heringa, M.B., Hollert, H., Huber, S., Kramer, M., Magdeburg, A., Ratte, H.T., 15
Sauerborn-Klobucar, R., Sokolowski, A., Soldan, P., Smital, T., Stalter, D., Venier, P., 16
Ziemann, C., Zipperle, J., Buchinger, S., 2012. International round-robin study on the Ames 17
fluctuation test. Environ. Mol. Mutagen. 53(3), 185-197. 18
Schmidt, S., Busch, W., Altenburger, R., Küster, E., 2016. Mixture toxicity of water contaminants-19
effect analysis using the zebrafish embryo assay (Danio rerio). Chemosphere 152, 503-512. 20
Scholz, S., Kurauchi, K., Kinoshita, M., Oshima, Y., Ozato, K., Schirmer, K., Wakamatsu, Y., 21
2005. Analysis of estrogenic effects by quantification of green fluorescent protein in 22
juvenile fish of a transgenic medaka. Environ. Toxicol. Chem. 24(10), 2553-2561. 23
Schroeder, A.L., Ankley, G.T., Houck, K.A., Villeneuve, D.L., 2016. Environmental surveillance 24
and monitoring—The next frontiers for high-throughput toxicology. Environ. Toxicol. 25
Chem. 35(3), 513-525. 26

39
Silva, E., Rajapakse, N., Kortenkamp, A., 2002. Something from "nothing" - Eight weak estrogenic 1
chemicals combined at concentrations below NOECs produce significant mixture effects. 2
Environ. Sci. Technol. 36(8), 1751-1756. 3
Simmons, S.O., Fan, C.-Y., Ramabhadran, R., 2009. Cellular Stress Response Pathway System as a 4
Sentinel Ensemble in Toxicological Screening. Toxicol. Sci. 111(2), 202-225. 5
Sonavane, M., Creusot, N., Maillot-Maréchal, E., Péry, A., Brion, F., Aїt-Aïssa, S., 2016. 6
Zebrafish-based reporter gene assays reveal different estrogenic activities in river waters 7
compared to a conventional human-derived assay. Sci. Total Environ. 550, 934-939. 8
Spirhanzlova, P., Leleu, M., Sebillot, A., Lemkine, G.F., Iguchi, T., Demeneix, B.A., Tindall, A.J., 9
2016. Oestrogen reporter transgenic medaka for non-invasive evaluation of aromatase 10
activity. Comp. Biochem. Physiol. C Toxicol. Pharmacol. 179, 64-71. 11
Spycher, S., Smejtek, P., Netzeva, T.I., Escher, B.I., 2008. Toward a class-independent quantitative 12
structure - Activity relationship model for uncouplers of oxidative phosphorylation. Chem. 13
Res. Toxicol. 21(4), 911-927. 14
Tang, J.Y.M., McCarty, S., Glenn, E., Neale, P.A., Warne, M.S.J., Escher, B.I., 2013. Mixture 15
effects of organic micropollutants present in water: Towards the development of effect-16
based water quality trigger values for baseline toxicity. Water Res. 47(10), 3300-3314. 17
Tang, J.Y.M., Busetti, F., Charrois, J.W.A., Escher, B.I., 2014. Which chemicals drive biological 18
effects in wastewater and recycled water? Water Res. 60, 289-299. 19
Tice, R.R., Austin, C.P., Kavlock, R.J., Bucher, J.R., 2013. Improving the human hazard 20
characterization of chemicals: A Tox21 update. Environ. Health Perspect. 121(7), 756-765. 21
Umbuzeiro, G.D.A., Heringa, M., Zeiger, E., 2016. In vitro genotoxicity testing: Significance and 22
use in environmental monitoring. Adv. Biochem. Eng. Biotechnol., 1-22. 23
US EPA, 2008. Estimation Programs Interface Suite for Windows, v4.1., United States 24
Environmental Protection Agency, Washington, DC, USA. 25

40
US EPA, 2015. Interactive Chemical Safety for Sustainability (iCSS) Dashboard v2, 1
http://actor.epa.gov/dashboard/, Accessed 5th Jan 2016. 2
Vaal, M.A., Van Leeuwen, C.J., Hoekstra, J.A., Hermens, J.L.M., 2000. Variation in sensitivity of 3
aquatic species to toxicants: Practical consequences for effect assessment of chemical 4
substances. Environ. Manage. 25(4), 415-423. 5
Van der Linden, S.C., Heringa, M.B., Man, H.Y., Sonneveld, E., Puijker, L.M., Brouwer, A., Van 6
der Burg, B., 2008. Detection of multiple hormonal activities in wastewater effluents and 7
surface water, using a panel of steroid receptor CALUX bioassays. Environ. Sci. Technol. 8
42(15), 5814-5820. 9
Vergauwen, L., Schmidt, S.N., Stinckens, E., Maho, W., Blust, R., Mayer, P., Covaci, A., Knapen, 10
D., 2015. A high throughput passive dosing format for the Fish Embryo Acute Toxicity test. 11
Chemosphere 139, 9-17. 12
Verhaar, H.J.M., Vanleeuwen, C.J., Hermens, J.L.M., 1992. Classifying environmental pollutants 1. 13
Structure-activity-relationships for prediction of aquatic toxicity. Chemosphere 25(4), 471-14
491. 15
Villeneuve, D.L., Blankenship, A.L., Giesy, J.P., 2000. Derivation and application of relative 16
potency estimates based on in vitro bioassay results. Environ. Toxicol. Chem. 19(11), 2835-17
2843. 18
Vörösmarty, C.J., McIntyre, P.B., Gessner, M.O., Dudgeon, D., Prusevich, A., Green, P., Glidden, 19
S., Bunn, S.E., Sullivan, C.A., Liermann, C.R., Davies, P.M., 2010. Global threats to human 20
water security and river biodiversity. Nature 467(7315), 555-561. 21
Wernersson, A.-S., Carere, M., Maggi, C., Tusil, P., Soldan, P., James, A., Sanchez, W., Dulio, V., 22
Broeg, K., Reifferscheid, G., Buchinger, S., Maas, H., Van Der Grinten, E., O’Toole, S., 23
Ausili, A., Manfra, L., Marziali, L., Polesello, S., Lacchetti, I., Mancini, L., Lilja, K., 24
Linderoth, M., Lundeberg, T., Fjällborg, B., Porsbring, T., Larsson, D.J., Bengtsson-Palme, 25
J., Förlin, L., Kienle, C., Kunz, P., Vermeirssen, E., Werner, I., Robinson, C.D., Lyons, B., 26

41
Katsiadaki, I., Whalley, C., den Haan, K., Messiaen, M., Clayton, H., Lettieri, T., Carvalho, 1
R.N., Gawlik, B.M., Hollert, H., Di Paolo, C., Brack, W., Kammann, U., Kase, R., 2015. 2
The European technical report on aquatic effect-based monitoring tools under the water 3
framework directive. Env. Sci. Eur. 27(7), 1-11. 4
Wilson, V.S., Bobseine, K., Lambright, C.R., Gray, L.E., 2002. A novel cell line, MDA-kb2, that 5
stably expresses an androgen- and glucocorticoid-responsive reporter for the detection of 6
hormone receptor agonists and antagonists. Toxicol. Sci. 66(1), 69-81. 7
Wink, S., Hiemstra, S., Huppelschoten, S., Danen, E., Niemeijer, M., Hendriks, G., Vrieling, H., 8
Herpers, B., van de Water, B., 2014. Quantitative High Content Imaging of Cellular 9
Adaptive Stress Response Pathways in Toxicity for Chemical Safety Assessment. Chem. 10
Res. Toxicol. 27(3), 338-355. 11
Wink, S., Hiemstra, S., Herpers, B., van de Water, B., 2017. High-content imaging-based BAC-12
GFP toxicity pathway reporters to assess chemical adversity liabilities. Archives of 13
Toxicology 91(3), 1367-1383. 14
Yamarik, T.A., Andersen, F.A., Cosmetic Ingredient Review, E., 2004. Safety assessment of 15
dichlorophene and chlorophene. Int. J. Toxicol. 23, 1-27. 16
Yeh, R.Y.L., Farre, M.J., Stalter, D., Tang, J.Y.M., Molendijk, J., Escher, B.I., 2014. Bioanalytical 17
and chemical evaluation of disinfection by-products in swimming pool water. Water Res. 18
59, 172-184. 19
20

42
Table 1: The applied assays with the number of chemicals tested per assay and the number of chemicals active in each assay. 21
Assay ID Assay name Measured endpoint or molecular target Method reference
No. of tested
chemicals
No. of active
chemicals
1 AhR CALUX Activation of aryl hydrocarbon receptor (AhR) Brennan et al. (2015) 18 7
2 HG5LN-hPXR Activation of pregnane x receptor (PXR) Lemaire et al. (2006) 34 20
3 PPARγ-bla
Binding of chemicals to peroxisome proliferator-
activated receptor gamma (PPARγ)
Invitrogen (2010) 18 4
4 MDA-kb2 Activation of androgen receptor (AR) Wilson et al. (2002) 24 3
5 Anti-MDA-kb2 Inhibition of androgen receptor (AR) Wilson et al. (2002) 25 12
6 MELN Activation of estrogen receptor (ER) Balaguer et al. (1999) 34 9
7 ZELH-zfERalpha Activation of estrogen receptor (ER) Cosnefroy et al. (2012) 34 2
8 ZELH-zfERbeta2 Activation of estrogen receptor (ER) Cosnefroy et al. (2012) 34 2
9 GR CALUX Activation of glucocorticoid receptor (GR) Van der Linden et al. (2008) 20 0
10 cyp19a1b-GFP cyp19a1b gene expression Brion et al. (2012) 26 2
11 ChgH-GFP
Estrogen receptor (ER) modulation, modulation
of steroidogenesis
Spirhanzlova et al. (2016) 24 17
12 THbZIP-GFP (XETA) Modulation of thyroid hormone signaling Fini et al. (2007) 20 9
13 Ames fluctuation test Mutagenicity (+/-S9) Reifferscheid et al. (2012) 22 1

43
14 Ames microplate agar Mutagenicity (+/-S9)
DeMarini et al. (1989),
Mortelmans and Zeiger (2000)
12 1
15 AREc32 Induction of oxidative stress response Escher et al. (2012) 18 9
16 Microtox Inhibition of bioluminescence (Escher et al. 2017) 34 16
17 Algal growth inhibition Growth inhibition OECD (2011) 17 12
18 Daphnia immobilization test Immobilization OECD (2004) 17 15
19 FET (96 well plate) Mortality OECD (2013) 20 13
20 FET (glass vial) Mortality OECD (2013) 29 17

44
Table 2: Summary of the selected test chemicals, their mode of action, proposed annual average concentration environmental quality standard (AA-22
EQS), maximum hazard quotient in Busch et al. (2016) and chemical score given in this study. 23
Chemical
ID
Chemical CAS No.
Molecular
Weight
(g/mol)
Chemical use
group
Mode of actiona
Annual Average
Environmental
Quality Standards
(µg/L)
Maximum
hazard
quotient†
(Busch et
al. 2016)
Chemical
score*
1 1,2-Benzisothiazolinone 2634-33-5 151.18 Biocide
Skin sensitization
(soft electrophilic
reactive toxicity)b
7.88×10⁻⁴g
6
2
2,4-
Dichlorophenoxyacetic
acid
94-75-7 221.04 Herbicide Synthetic auxin 0.2e 1.78×10
-3 4
3 4-Nonylphenol 104-40-5 220.35
Industrial
Chemical
Endocrine disruption 0.043e; 0.3
f 2.14×10
-2 5
4 Benzo(a)pyrene 50-32-8 252.32
Combustion
by-product
Nucleic acid damage 1.7×10⁻⁴f
4.88×10⁻³
4
5 Benzo(b)fluoranthene 205-99-2 252.31 Combustion Nucleic acid damage 3.34×10⁻³
4

45
by-product
6 Bezafibrate 41859-67-0 361.83 Pharmaceutical Lipid metabolism 2.3e 4.15×10
-2 4
7 Bisphenol A 80-05-7 228.29
Industrial
Chemical
Endocrine disruption 0.24e 2.10×10
-2 5
8 Carbamazepine 298-46-4 236.28 Pharmaceutical
Ion channel
modulation
2.0e 1.48×10
-3 4
9 Carbendazim 10605-21-7 191.19 Fungicide Mitosis, cell cycle 0.44e 2.65×10
-2 4
10 Chlorophene 120-32-1 218.68
Industrial
Chemical
Skin sensitization
(soft electrophilic
reactive toxicity)c
4.19×10⁻³
5
11 Chlorpyrifos 2921-88-2 350.59 Insecticide Neuroactive 4.6 10-4e
1.07×10⁻¹
6
12 Clofibric acid 882-09-7 214.65 Herbicide Synthetic auxin 5.64×10⁻³
5
13 Cyprodinil 121552-61-2 225.29 Fungicide
Protein biosynthesis
inhibition
0.33e 5.34×10
-3 4
14 Diazinon 333-41-5 304.35 Insecticide Neuroactive 0.012e 4.67×10
0 5
15 Diclofenac 15307-86-5 296.15 Pharmaceutical Antiinflammatory 0.05e 6.77×10
-2 5
16 Dinoseb 88-85-7 240.21 Herbicide
Respiration inhibition,
uncoupler of
1.65×10⁻³
5

46
oxidative
phosphorylationd
17 Diuron 330-54-1 233.10 Herbicide
Photosynthesis
inhibition
0.07e; 0.2
f 7.06×10
-1 6
18 Fipronil 120068-37-3 437.15 Insecticide Neuroactive 1.44×10⁻¹
4
19 Flutamide 13311-84-7 276.21 Pharmaceutical Endocrine disruption - 2
20 Genistein 446-72-0 270.24 Phytoestrogen Mitosis, cell cycle 6.13×10⁻⁴
4
21 Hexadecylpyridinium 7773-52-6 304.54
Industrial
Chemical
Cell membrane
disruption
1.24×10² 2
22 Mefenamic acid 61-68-7 241.29 Pharmaceutical Antiinflammatory 1.0e 8.70×10
-2 5
23 Metolachlor 51218-45-2 283.80 Herbicide Mitosis, cell cycle 3.23×10⁻²
4
24 Metoprolol 37350-58-6 267.37 Pharmaceutical Beta blocker 8.6e 3.51×10
-4 3
25 Perfluorooctanoic acid 335-67-1 414.07
Industrial
Chemical
Carcinogen,
Endocrine disruption,
lipid metabolism
1.63×10⁻³
3
26 Picoxystrobin 117428-22-5 367.32 Fungicide Respiration inhibition - 3
27 Propiconazole 60207-90-1 342.23 Fungicide
Sterol biosynthesis
inhibition
3.49×10⁻²
4

47
28 Sulfamethoxazole 723-46-6 253.28 Antibiotic Antibiotic 0.6e 9.81×10
-4 4
29 Tebuconazole 107534-96-3 307.82 Fungicide
Sterol biosynthesis
inhibition
0.24e 2.40×10
-3 4
30 Telmisartan 144701-48-4 514.62 Pharmaceutical
Angiotensin receptor
or enzyme
3.09×10² 4
31 Terbutylazine 5915-41-3 229.71 Herbicide
Photosynthesis
inhibition
0.22e 3.86×10
-1 4
32 Triclocarban 101-20-2 315.59 Biocide Lipid metabolism 1.64×10⁻²
3
33 Triclosan 3380-34-5 289.55 Biocide
Lipid metabolism,
uncoupler of
oxidative
phosphorylationd
0.02e 4.22×10
-1 4
34 Triphenylphosphate 115-86-6 326.29
Industrial
Chemical
Neuroactive 2.01×10⁻²
4
aBusch et al. (2016);
bBasketter et al. (1999);
cYamarik et al. (2004);
dSpycher et al. (2008);
eProposed by Oekotoxzentrum (2017);
fEuropean Commission (2013). 24
†maximum hazard quotient in fish, daphnia or algae is presented. *Chemical score based on rank in the hazard quotient list, the availability of an EQS, a unique 25
mode of action that is not covered by a higher ranked chemical, diversity of chemical use group, specific mode of action that is covered by the test battery, specific 26
mode of action that leads to expectation of enhanced toxicity in the whole organism bioassays and not readily biodegradable based on BIOWIN. Further information 27
is provided in Table S1. 28

48
Table 3: Effect concentrations EC (M) for the selected water pollutants in the studied assays. Lowest observable effect concentration (LOEC) reported 29
for the ChgH-GFP (spiked) and THbZIP-GFP (XETA) assays. SE=standard error, CI=95% confidence intervals. 30
Chemical AhR CALUX (1)
HG5LN-hPXR
(2)
PPARγ-bla (3) MDA-kb2 (4)
Anti-MDA-kb2
(5)
MELN (6)
ZELH-zfERalpha
(7)
ZELH-
zfERbeta2 (8)
EC10 ± SE EC10 ± SE EC10 ± SE EC10 ± SE ECSR0.2 ± SE EC10 ± SE EC10 ± SE EC10 ± SE
1,2-Benzisothiazolinone - >3.00×10⁻⁵
- - - >3.00×10⁻⁵
>3.00×10⁻⁵
>3.00×10⁻⁵
2,4-
Dichlorophenoxyacetic
acid
- >3.00×10⁻⁵
- >2.00×10⁻⁴
>2.00×10⁻⁴
>3.00×10⁻⁵
>3.00×10⁻⁵
>3.00×10⁻⁵
4-Nonylphenol (1.36±0.06)×10-5
>3.00×10⁻⁵
>1.07×10⁻⁵
>2.00×10⁻⁴
>6.67×10⁻⁵
(9.69±0.61)×10-7
>1.00×10⁻⁵ >1.00×10
-5
Benzo(a)pyrene (8.38±0.55)×10-10
>1.00×10⁻⁵
>4.61×10⁻⁶
(5.20±0.40)×10-6
(1.29±0.14)×10-6
(5.30±0.69)×10-7
>1.00×10⁻⁵
>1.00×10⁻⁵
Benzo(b)fluoranthene (8.23±0.94)×10-10
>3.00×10⁻⁵
>3.96×10⁻⁶
(5.08±0.69)×10-6
>2.00×10⁻⁴
(7.26±1.35)×10-7
>1.00×10⁻⁵
>1.00×10⁻⁵
Bezafibrate - >3.00×10⁻⁵
- - - >3.00×10⁻⁵
>3.00×10⁻⁵
>3.00×10⁻⁵
Bisphenol A >4.47×10⁻⁵
(4.75±0.48)×10-6
>2.51×10⁻⁵
>6.67×10⁻⁵
(1.72±0.24)×10-7
(6.91±0.21)×10-8
(1.41±0.19)×10-6
(2.86±0.27)×10-6
Carbamazepine - (3.63±0.32)×10-5
- >2.00×10⁻⁴
(5.37±1.48)×10-5
>3.00×10⁻⁵
>3.00×10⁻⁵
>3.00×10⁻⁵
Carbendazim >2.00×10⁻⁵
>3.00×10⁻⁶
>5.44×10⁻⁶
>2.00×10⁻⁴
>2.00×10⁻⁴
>3.00×10⁻⁶
>3.00×10⁻⁶
>3.00×10⁻⁶
Chlorophene >9.67×10⁻⁵
(1.02±0.06)×10-5
>1.01×10⁻⁵
>2.00×10⁻⁴
(2.10±0.24)×10-7
>3.00×10⁻⁵
>3.00×10⁻⁵
>3.00×10⁻⁵
Chlorpyrifos (1.25±0.10)×10-6
(5.11±0.34)×10-6
>5.84×10⁻⁵
>2.00×10⁻⁴
(1.42±0.16)×10-5
(8.91±0.41)×10-6
>3.00×10⁻⁵
>3.00×10⁻⁵
Clofibric acid - >3.00×10⁻⁵
- - - >3.00×10⁻⁵
>3.00×10⁻⁵
>3.00×10⁻⁵
Cyprodinil (6.36±0.88)×10-6
(5.26±0.23)×10-6
>4.21×10⁻⁵
>2.00×10⁻⁴
(1.34±0.36)×10-5
>3.00×10⁻⁵
>3.00×10⁻⁵
>3.00×10⁻⁵
Diazinon (1.35±0.06)×10-5
(1.44±0.11)×10-6
(5.30±0.46)×10-5
>2.00×10⁻⁴
(8.77±0.58)×10-6
(8.53±0.34)×10-6
>3.00×10⁻⁵
>3.00×10⁻⁵

49
Diclofenac >1.37×10⁻⁴
(3.78±0.32)×10-5
(1.21±0.09)×10-6
>2.00×10⁻⁴
>6.67×10⁻⁵
>3.00×10⁻⁵
>3.00×10⁻⁵
>3.00×10⁻⁵
Dinoseb - >3.00×10⁻⁵
- - - >3.00×10⁻⁵
>3.00×10⁻⁵
>3.00×10⁻⁵
Diuron - (3.64±0.34)×10-5
- >2.00×10⁻⁴
>5.00×10⁻⁵
>3.00×10⁻⁵
>3.00×10⁻⁵
>3.00×10⁻⁵
Fipronil >3.32×10⁻⁶
(6.35±0.78)×10-6
>1.64×10⁻⁶
>2.22×10⁻⁵
(1.83±0.24)×10-6
>3.00×10⁻⁵
>3.00×10⁻⁵
>3.00×10⁻⁵
Flutamide - (2.17±0.10)×10-6
- - (2.07±0.08)×10-7
>3.00×10⁻⁵
>3.00×10⁻⁵
>3.00×10⁻⁵
Genistein >1.30×10⁻⁵
(1.24±0.13)×10-6
>1.41×10⁻⁵
(4.14±0.42)×10-5
>3.33×10⁻⁵
(1.22±0.23)×10-8
(9.71±0.71)×10-7
(2.54±0.37)×10-8
Hexadecylpyridinium - (1.00±0.11)×10-6
- >1.00×10⁻⁵
>5.56×10⁻⁷
>1.00×10⁻⁵
>1.00×10⁻⁵
>1.00×10⁻⁵
Mefenamic acid - (1.08±0.06)×10-5
- >2.00×10⁻⁴
>6.67×10⁻⁵
>3.00×10⁻⁵
>3.00×10⁻⁵
>3.00×10⁻⁵
Metolachlor - (2.68±0.11)×10-7
- - - >3.00×10⁻⁵
>3.00×10⁻⁵
>3.00×10⁻⁵
Metoprolol - >3.00×10⁻⁵
- >2.00×10⁻⁴
>2.00×10⁻⁴
>3.00×10⁻⁵
>3.00×10⁻⁵ >3.00×10⁻⁵
Perfluorooctanoic acid >1.18×10⁻⁴
>3.00×10⁻⁵
>2.19×10⁻⁵
>2.00×10⁻⁴
>6.67×10⁻⁵
>3.00×10⁻⁵
>3.00×10⁻⁵
>3.00×10⁻⁵
Picoxystrobin - (1.73±0.21)×10-5
- - - >3.00×10⁻⁵
>3.00×10⁻⁵
>3.00×10⁻⁵
Propiconazole >2.20×10⁻⁵
(2.94±0.18)×10-6
>2.23×10⁻⁵
>2.00×10⁻⁴
(2.87±0.39)×10-6
>3.00×10⁻⁵
>3.00×10⁻⁵
>3.00×10⁻⁵
Sulfamethoxazole - >3.00×10⁻⁵
- - - >3.00×10⁻⁵
>3.00×10⁻⁵
>3.00×10⁻⁵
Tebuconazole - (1.88±0.27)×10-6
- - - >3.00×10⁻⁵
>3.00×10⁻⁵
>3.00×10⁻⁵
Telmisartan (1.57±0.08)×10-5
>5.00×10⁻⁶
(1.43±0.10)×10-7
>2.00×10⁻⁴
>5.00×10⁻⁵
>5.00×10⁻⁶
>5.00×10⁻⁶
>5.00×10⁻⁶
Terbutylazine - (1.03±0.06)×10-5
- - - (1.52±0.06)×10-5
>3.00×10⁻⁵
>3.00×10⁻⁵
Triclocarban >4.80×10⁻⁶
>3.00×10⁻⁵
>3.31×10⁻⁷
>3.33×10⁻⁶
>2.22×10⁻⁶
>1.00×10⁻⁵
>1.00×10⁻⁵ >1.00×10
-5
Triclosan >8.50×10⁻⁵
(1.77±0.16)×10-6
>2.05×10⁻⁶
>7.41×10⁻⁶
(6.52±0.68)×10-7
>3.00×10⁻⁵
>1.00×10⁻⁵ >1.00×10
-5
Triphenylphosphate
>1.00×10⁻⁶
(9.10±0.26)×10-7
(4.24±0.34)×10-6
>2.00×10⁻⁴
(6.25±1.13)×10-6
(1.71±0.09)×10-6
>3.00×10⁻⁵
>3.00×10⁻⁵

50
Chemical
GR
CALUX
(9)
cyp19a1b-GFP (10) ChgH-GFP (11) THbZIP-GFP (XETA) (12)
Ames fluctuation
test (13)
Ames microplate
agar (14)
EC10 ± SE EC10 ± SE (M)
EC10 (unspiked)
(M)
LOEC
(spiked)
(M)†
LOEC (unspiked)
(M)†
LOEC (spiked)
(M)†
EC10 ± SE ECIR1.5 ± SE (M)
1,2-Benzisothiazolinone - - - - - - - -
2,4-
Dichlorophenoxyacetic
acid
>4.52×10⁻⁴
>3.00×10⁻⁵
>4.52×10⁻⁴
3.39×10⁻⁴b
>4.52×10⁻⁴
>4.52×10⁻⁴
- -
4-Nonylphenol >2.84×10⁻⁵
>2.50×10⁻⁶
>2.27×10⁻⁶
2.27×10⁻⁶b
- - - -
Benzo(a)pyrene >9.91×10⁻⁵
>3.00×10⁻⁶
- - - - (1.70±0.11)×10-7c
(6.90±0.79)×10-6c
Benzo(b)fluoranthene - >3.00×10⁻⁶
>3.96×10⁻⁸
>3.96×10⁻⁸
>3.96×10⁻⁸
>3.96×10⁻⁸
>9.91×10⁻⁸
>3.96×10⁻³
Bezafibrate >2.76×10⁻⁴
- - - - - - -
Bisphenol A >1.10×10⁻⁴
(1.58±0.09)×10-6
(1.24±0.21)×10-5
2.19×10⁻⁶a
1.64×10⁻⁵a
1.64×10⁻⁵a
>1.10×10⁻⁵
>1.31×10⁻²
Carbamazepine - >3.00×10⁻⁵
>1.27×10⁻⁴
1.27×10⁻⁴a
8.56×10⁻⁵a
>1.27×10⁻⁴
>4.23×10⁻⁴
-
Carbendazim >2.64×10⁻⁴
>3.00×10⁻⁵
>2.62×10⁻⁶
>2.62×10⁻⁶
>2.62×10⁻⁶
>2.62×10⁻⁶
- -
Chlorophene >5.72×10⁻⁵
>3.00×10⁻⁶
(5.27±0.70)×10-6
4.57×10⁻⁶a
>9.14×10⁻⁵
>9.14×10⁻⁵
>1.43×10⁻⁶
>1.37×10⁻⁴
Chlorpyrifos >3.57×10⁻⁵
>3.00×10⁻⁶
>2.85×10⁻⁶
2.85×10⁻⁶a
1.43×10⁻⁶a
7.13×10⁻⁶a
>2.85×10⁻⁵
-
Clofibric acid - - - - - - - -
Cyprodinil >4.44×10⁻⁴
>1.00×10⁻⁵
>8.88×10⁻⁶
4.44×10⁻⁶a
- - >1.61×10⁻⁵
>4.44×10⁻³

51
Diazinon >1.64×10⁻⁵
>1.00×10⁻⁴
>6.16×10⁻⁵
8.21×10⁻⁶a
4.11×10⁻⁵a
>6.16×10⁻⁵
>1.64×10⁻⁵
>3.29×10⁻²
Diclofenac >3.38×10⁻⁵
>1.00×10⁻⁶
>1.57×10⁻⁴
1.57×10⁻⁴b
>1.59×10⁻⁴
7.86×10⁻⁵a
>3.38×10⁻⁵
>3.38×10⁻²
Dinoseb - - - - - - >4.16×10⁻⁷
-
Diuron >2.15×10⁻⁴
>3.00×10⁻⁵
>8.58×10⁻⁵
4.29×10⁻⁵a
>8.58×10⁻⁵
>8.58×10⁻⁵
>4.29×10⁻⁵
>4.29×10⁻²
Fipronil - >3.00×10⁻⁵
>2.29×10⁻⁷
2.29×10⁻⁷b
>2.29×10⁻⁶
>2.29×10⁻⁶
>2.29×10⁻⁷
-
Flutamide - - - - - - >3.62×10⁻⁷
-
Genistein >2.31×10⁻⁵
(4.20±0.24)×10-7
>3.70×10⁻⁶
>3.70×10⁻⁶
>3.70×10⁻⁶
>3.70×10⁻⁶
>4.63×10⁻⁶
>1.11×10⁻³
Hexadecylpyridinium - >3.00×10⁻⁷
>2.79×10⁻⁸
>2.79×10⁻⁸
>2.79×10⁻⁸
>2.79×10⁻⁸
- -
Mefenamic acid - >3.00×10⁻⁶
>4.14×10⁻⁵
3.11×10⁻⁵a
>2.07×10⁻⁶
2.07×10⁻⁶a
- -
Metolachlor - >3.00×10⁻⁵
>3.52×10⁻⁵
>3.52×10⁻⁵
- - >2.22×10⁻⁸
-
Metoprolol >3.74×10⁻⁴
>3.00×10⁻⁵
>1.02×10⁻⁴
>1.02×10⁻⁴
5.11×10⁻⁵a
5.11×10⁻⁵a
>3.74×10⁻⁵
-
Perfluorooctanoic acid >1.12×10⁻⁴
>3.00×10⁻⁵
>2.42×10⁻⁴
1.81×10⁻⁴a
2.42×10⁻⁴a
>2.42×10⁻⁴
- -
Picoxystrobin - - - - - - - -
Propiconazole >7.31×10⁻⁵
>3.00×10⁻⁵
>2.92×10⁻⁶
2.92×10⁻⁷a
>2.92×10⁻⁶
>2.92×10⁻⁶
>7.31×10⁻⁶
>8.77×10⁻³
Sulfamethoxazole - - - - - - >3.95×10⁻⁷
-
Tebuconazole - - - - - - >3.25×10⁻⁷
-
Telmisartan - >1.00×10⁻⁶
>9.72×10⁻⁶
>9.72×10⁻⁶
- - - -
Terbutylazine >4.35×10⁻⁴
>3.00×10⁻⁵
- - - - >4.37×10⁻⁷
-
Triclocarban >3.17×10⁻⁴
>3.00×10⁻⁷
>3.17×10⁻⁶
1.58×10⁻⁶a
>1.59×10⁻⁷
>1.59×10⁻⁷
- -
Triclosan >2.16×10⁻⁵
>1.00×10⁻⁶
>1.73×10⁻⁶
>1.73×10⁻⁶
>1.73×10⁻⁶
>1.73×10⁻⁶
>1.08×10⁻⁶
>1.04×10⁻³
Triphenylphosphate >1.92×10⁻⁵
>3.00×10⁻⁵
(2.08±0.20)×10-6
3.06×10⁻⁶a
6.13×10⁻⁶a
>6.13×10⁻⁶
>1.92×10⁻⁶
>3.06×10⁻²
ap-value <0.01;
bp-value <0.05
cbenzo(a)pyrene only active with S9 31

52
32
Chemical AREc32 (15)
Microtox (16)
Escher et al. (2017)
Algae growth
inhibition (17)
Daphnia
immobilization
test (18)
FET (96 well plate)
(19)
FET (Glass vial) (20)
ECIR1.5 ± SE EC50 (95% CI) EC50 (95% CI) EC50 (95% CI) EC50 (95% CI) EC50 (95% CI)
1,2-Benzisothiazolinone - 1.62(1.44 to 1.83)×10-5
- - - 2.14(1.94 to 2.37)×10-5
2,4-Dichlorophenoxyacetic
acid
- 2.34(2.03 to 2.69)×10-3
- - - >7.71×10⁻⁴
4-Nonylphenol (6.73±0.73)×10-5
>2.50×10-5*
6.78(6.48 to 7.08)×10-6
7.21(6.80 to 7.64)×10-8
2.71(2.10 to 3.51)×10-5
5.09(4.54 to 5.69)×10-6
Benzo(a)pyrene (2.22±0.10)×10-7
>1.90×10⁻⁵
>3.00×10⁻⁴
5.12(4.46 to 5.87)×10-9
>2.48×10⁻⁵
>3.94×10⁻⁵
Benzo(b)fluoranthene (2.33±0.16)×10-7
>1.78×10⁻⁵
>3.00×10⁻⁵
>1.19×10⁻⁵
>2.48×10⁻⁵
>1.92×10⁻⁵
Bezafibrate - 2.56(2.35 to 2.79)×10-3
- - >2.76×10⁻⁴
>3.21×10⁻⁵
Bisphenol A (1.24±0.11)×10-4
6.08(5.66 to 6.52)×10-5
1.12(1.03 to 1.21)×10-4
1.86(1.02 to 3.40)×10-5
6.67(5.94 to 7.50)×10-5
7.67(7.15 to 8.24)×10-5
Carbamazepine - 7.41(6.29 to 8.72)×10-4
- - 1.59(1.13 to 2.25)×10-4
>4.23×10⁻⁴
Carbendazim >1.24×10⁻⁴
>1.20×10⁻²
- - - 1.94(1.50 to 2.50)×10-6
Chlorophene (7.49±0.71)×10-5
2.42(2.13 to 2.75)×10-5
1.26(1.18 to 1.36)×10-5
2.21(1.93 to 2.53)×10-6
2.07(1.74 to 2.46)×10-5
1.13(1.05 to 1.23)×10-5
Chlorpyrifos >1.31×10⁻⁴
>2.82×10⁻⁴
1.85(1.76 to 1.95)×10-5
2.42(1.95 to 3.00)×10-10
>2.84×10⁻⁴
>2.45×10⁻⁵
Clofibric acid - 2.07(1.98 to 2.16)×10-3
- - - >2.39×10⁻³
Cyprodinil (2.75±0.11)×10-5
>4.57×10-5
* 2.71(2.48 to 2.97)×10-5
1.49(1.10 to 2.02)×10-7
5.61(4.76 to 6.61)×10-6
2.78(2.56 to 3.03)×10-6
Diazinon >1.30×10⁻⁴
>1.12×10⁻³
2.51(2.36 to 2.66)×10-4
4.86(4.29 to 5.49)×10-10
2.36(2.24 to 2.50)×10-5
1.84(1.49 to 2.27)×10-5
Diclofenac >1.00×10⁻³
1.28(1.23 to 1.33)×10-4
8.66(7.56 to 9.92)×10-4
0.98(0.87 to 1.10)×10-4
4.19(3.68 to 4.77)×10-5
4.33(3.15 to 5.96)×10-5

53
Dinoseb - 1.43(1.36 to 1.50)×10-5
- - - -
Diuron - >1.54×10-4
* 3.44(3.04 to 3.89)×10-7
0.98(0.91 to 1.07)×10-4
4.43(3.58 to 5.48)×10-5
1.30(1.19 to 1.43)×10-5
Fipronil >4.00×10⁻⁴
>3.47×10⁻⁶
* >3.00×10⁻⁵
0.96(0.62 to 1.49)×10-7
>2.86×10⁻⁵
>4.61×10⁻⁵
Flutamide - >4.67×10⁻⁵
* - - 1.98(1.62 to 2.44)×10-5
-
Genistein (7.15±0.46)×10-5
>6.61×10⁻⁴
>3.00×10⁻⁵
>3.70×10⁻⁵
1.10(0.72 to 1.68)×10-5
1.91(1.46 to 2.50)×10-5
Hexadecylpyridinium - 8.34(7.72 to 9.63)×10-6
- - - -
Mefenamic acid - 3.55(3.29 to 3.38)×10-4
- - - 0.92(0.61 to 1.39)×10-5
Metolachlor - 7.33(6.65 to 8.09)×10-4
- - - 2.51(1.56 to 4.05)×10-4
Metoprolol - >9.12×10⁻³
2.51(2.25 to 2.81)×10-3
1.54(1.29 to 1.83)×10-3
>3.74×10⁻⁴
>2.92×10⁻³
Perfluorooctanoic acid >3.79×10⁻⁴
4.45(4.23 to 4.69)×10-3
- - - 2.16(1.98 to 2.35)×10-3
Picoxystrobin - >1.05×10⁻³
- - - -
Propiconazole >4.59×10⁻⁵
>6.92×10⁻⁴
4.00(3.48 to 4.18)×10-5
1.09(0.74 to 1.59)×10-5
6.48(5.03 to 8.35)×10-5
5.09(4.88 to 5.31)×10-5
Sulfamethoxazole - 1.48(1.40 to 1.56)×10-3
- - - -
Tebuconazole - 2.67(2.49 to 2.87)×10-4
- - - 4.84(3.75 to 6.25)×10-5
Telmisartan >4.04×10⁻⁵
>4.79×10⁻³
- - - >8.01×10⁻⁶
Terbutylazine - >1.78×10⁻³
- - - >2.46×10⁻⁵
Triclocarban (4.81±0.40)×10-6
>6.31×10⁻⁴
>3.00×10⁻⁵
4.06(3.20 to 5.15)×10-8
>1.98×10⁻⁵
>4.18×10⁻⁶
Triclosan (1.71±0.14)×10-5
3.02(2.90 to 3.15)×10-5
1.01(0.96 to 1.07)×10-6
1.05(0.86 to 1.30)×10-6
4.66(3.79 to 5.72)×10-6
1.47(1.25 to 1.73)×10-6
Triphenylphosphate >3.81×10⁻⁴
>1.82×10⁻³
3.57(3.36 to 3.80)×10-5
1.81(1.28 to 2.57)×10-6
3.16(1.88 to 5.31)×10-5
6.30(5.58 to 7.11)×10-6
*EC50 > water solubility Cwsat
(salt) (Escher et al. 2017). 33

54
Figure 1: Design of the panel of bioassays/biological endpoints (ovals) recommended for water 34
quality assessment and where they are situated along the adverse outcome pathway (boxes). The 35
cyp19a1b-GFP and ChgH-GFP assays were also included in the study, but are not shown in the 36
Figure. 37
38
Figure 2: A) Summary of experimental results of this study with the selected representative water 39
pollutants. Active chemicals are grouped according to their effect concentration (EC) with yellow 40
indicating least potent and red indicating most potent, inactive chemicals are shown in green, and 41
grey indicates no experimental data (all EC values can be found in Table 3) and B) comparison 42
between the experimental results from the current study and the expected activity based on the data 43
mining exercise. 44
45
Figure 3: Experimental log(1/EC50) values versus QSAR-predicted log(1/EC50) baseline toxicity 46
values for A) Microtox, B) algal growth inhibition, C) Daphnia immobilization test and D) 48 h 47
FET. Note 48 h FET experimental log(1/EC50) values are the average of two assays. TR=toxic ratio. 48
49
Figure 4: Percent effect elucidated by enriched water samples from different sites of the Danube 50
River explained by detected chemicals for HG5LN-hPXR based on A) literature EC values and B) 51
EC values measured in the present study, MELN based on C) literature EC values and D) EC values 52
measured in the present study and FET based on E) literature EC values and F) EC values measured 53
in the present study (Figures 4A, C and E are reprinted with permission from Neale et al. (2015). 54
Linking in vitro effects and detected organic micropollutants in surface water using mixture-toxicity 55
modeling. Environmental Science & Technology, 49(24): 14614-14624. Copyright 2015 American 56
Chemical Society). 57
58
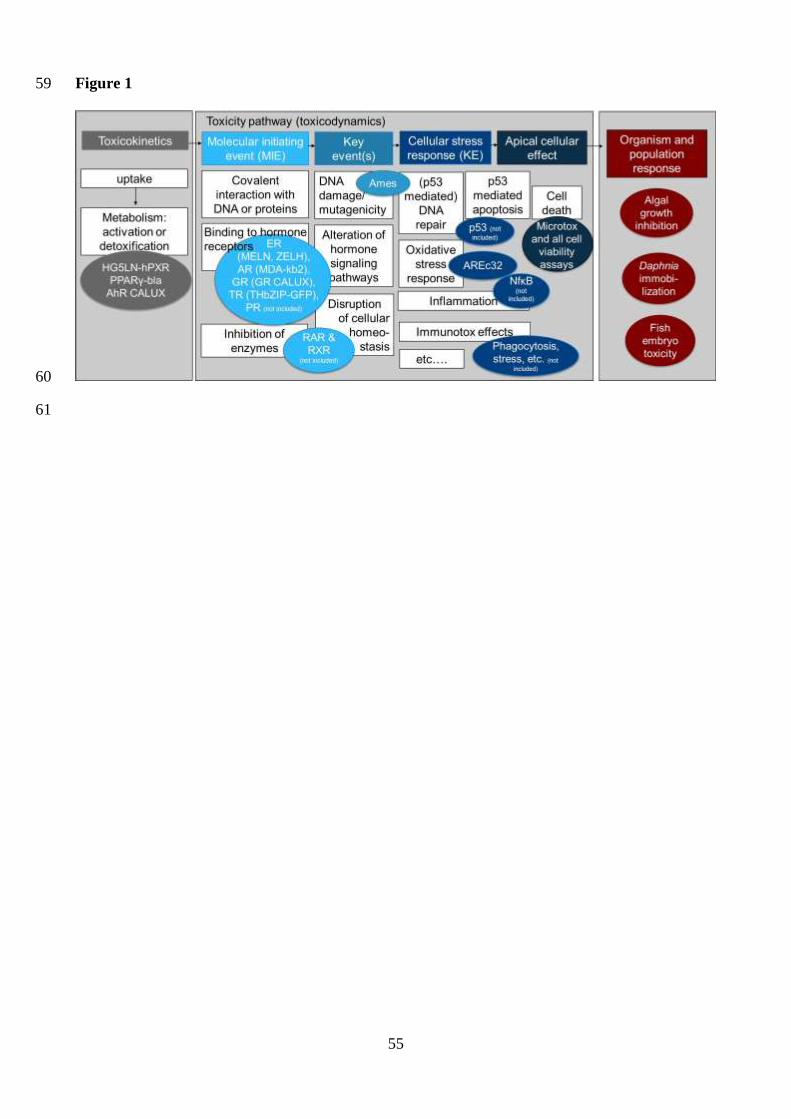
55
Figure 1 59
60
61

56
Figure 2 62
63

57
64
65
66
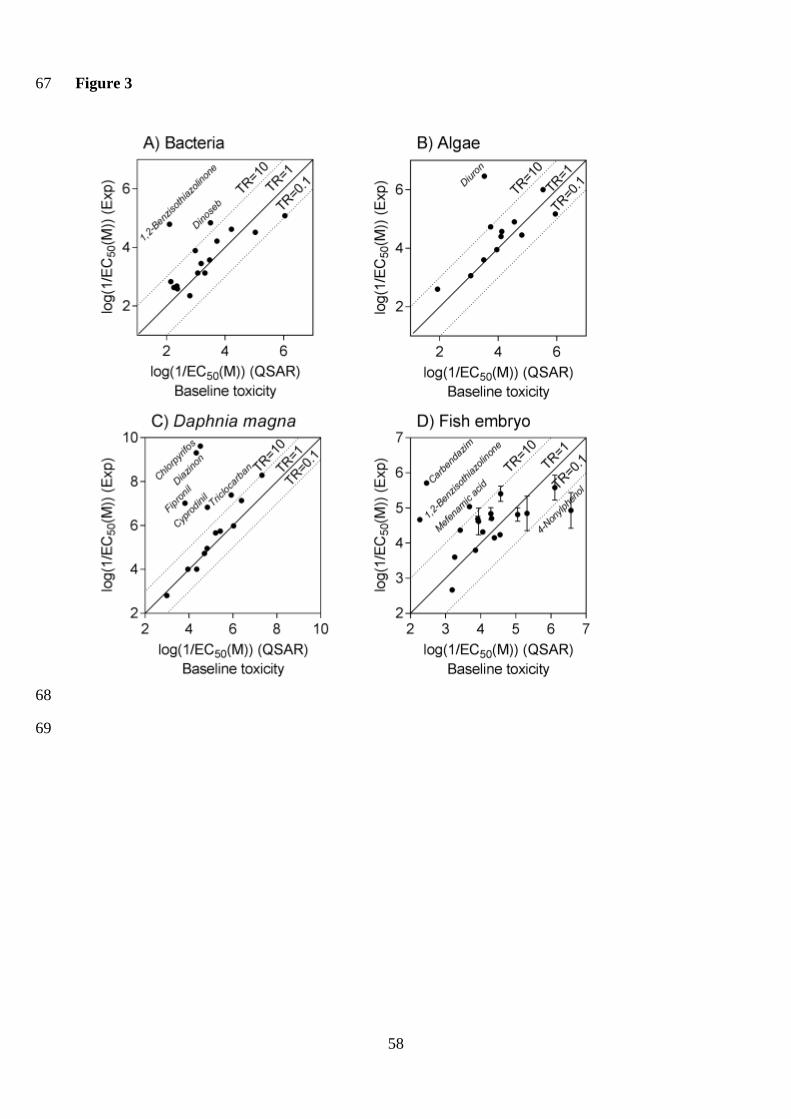
58
Figure 3 67
68
69

59
Figure 4 70
71