development of a design tool for modern gas
TRANSCRIPT

8/12/2019 Development of a Design Tool for Modern Gas
http://slidepdf.com/reader/full/development-of-a-design-tool-for-modern-gas 1/380
Development of a Design Tool for Modern Gas
Turbine Com bustors and Comm issioning of a Gas
Turbine Combustion Research Laboratory
by
Michele Capurro
B. Eng, Carleton, 2004
A thesis submitted to the Faculty of Graduate Studies and Research
In partial fulfillment of the requirements for the degree of
Master of Applied Science
Ottawa-Carleton Institute for Mechanical and A erospace Engineering
Department of Mechanical and Aerospace Engineering
Carleton University
Ottawa, Ontario
Canada
April 2008
© Copyright by Michele Capurro, 2008

8/12/2019 Development of a Design Tool for Modern Gas
http://slidepdf.com/reader/full/development-of-a-design-tool-for-modern-gas 2/380
1*1 Library andArchives Canada
Published HeritageBranch
395 Wellington StreetOttawa ON K1A0N4Canada
Bibliotheque etArchives Canada
Direction duPatrimoine de I'edition
395, rue WellingtonOttawa ON K1A0N4Canada
Your file Votre referenceISBN: 978-0-494-40634-2Our file Notre referenceISBN: 978-0-494-40634-2
NOTICE:
The author has granted a non
exclusive l icense al lowing Library
and Archives Canada to reproduce,publ ish, archive, preserve, conserve ,
com mu nicate to the publ ic by
telecommunication or on the Internet,
loan, distr ibute and sel l theses
worldwide, for commercial or non
commercial purposes, in microform,
paper, electronic and/or any other
formats.
AVIS:
L'auteur a accorde une l icence non exclusiv
permettant a la Bibl iotheque et Archives
Canada de reproduire, publ ier, archiver,sauvegarder, conserver, transmettre au pub
par telecommunication ou par Plntemet, pref
distr ibuer et vendre des theses partout dans
le mo nde, a des fins comm erciales ou au tre
sur support microforme, papier, electronique
et/ou autres forma ts.
The author retains copyrightownership and moral r ights in
this thesis. Neither the thesis
nor substantial extracts from i t
may be printed or otherwise
reproduced wi thout the author 's
permission.
L'auteur conserve la propriete du droit d'autet des droits moraux qui protege cette these
Ni la these ni des extrai ts substantiels de
cel le-ci ne doivent etre imprimes ou autreme
reproduits sans son autorisation.
In com pl iance wi th the Can adian
Privacy Act som e support ing
forms may have been removed
from this thesis.
Conformement a la lo i canadienne
sur la protection de la vie privee,
quelques formulai res secondaires
ont ete enleves de cette these.
Whi le these forms may be inc luded
in the docum ent page coun t ,
their removal does not represent
any loss of content from the
thesis.
Bien que ces formulaires
aient inclus dans la pagination,
i l n'y aura aucun contenu manquant.

8/12/2019 Development of a Design Tool for Modern Gas
http://slidepdf.com/reader/full/development-of-a-design-tool-for-modern-gas 3/380
ABSTRACT
In response to rising environmental concerns, Natural Resources Canada contracted
the Mechanical and Aerospace Engineering Department of Carleton University to
develop a preliminary d esign for a 50 kW zero-emission power plant. The work presented
in this thesis focuses on the microturbine combustor for this particular type of power
plant.
The first major task w as the development of a design tool for the design of gas turbine
comb ustors. The design methodology is largely based on established empirical and semi-
empirical correlations for conventional gas turbine combustors. The methodology was
updated and supplemented by recent correlations to address the particular issues of
modern lean premixed combustor. The preliminary design of a lean premixed gas turbine
combustor was generated using the new design tool. The new combustor was
manufactured and instrumented, and is ready for testing.
The second major task was the commissioning of a gas turbine combustion research
laboratory. The laboratory was designed and constructed so that the performance of the
new gas turbine combustor and the accuracy of the design tool could be evaluated at a
later time.
i i i

8/12/2019 Development of a Design Tool for Modern Gas
http://slidepdf.com/reader/full/development-of-a-design-tool-for-modern-gas 4/380
A C K N O W L E D G E M E N T S
I am especially grateful to Dr. Donald G authier for giving me the op portunity to workon such an interesting and challenging research project. Thank you whole-heartedly for
all the supervision, guidance and professional advice you have given me throughout thisthesis.
My gratitude goes out as well to the staff at Environment Canada. A special thankyou is expressed to Jim Fearn, Guy Bracewell, Peter Barton and Fred Hendren for theirsupport during this effort.
I would also like to acknowledge the Mechanical and Aerospace Department atCarleton University. Many thanks goes to Ms. Christie Egbert and Ms. Nancy Pow ell forall the adm inistrative support and M r. Alex Proctor and K evin Sangster for letting me usethe mechanical workshop and, more importantly, for the valuable assistance and
expertise.
A special thank you goes out to Mr. Get Nunez for supporting my enrolment in theMa ster's program and for providing parts needed for the research laboratory.
I would like to acknowledge and express my deep gratitude to Dr. Ali Mahallati forall his generous assistance.
A much felt thank you goes to Mr. Carlo Rea and Scanivalve Corporation whodonated an expensive piece of equipmen t to the research laboratory.
My utmost respect and gratitude is expressed to a true gentleman, my father-in-lawDavid Emery. I whole-heartedly thank you for all the unconditional support and lovegiven to me over the years.
W ords can not express the gratitude and appreciation I feel towards m y wife, A udrey,who sacrificed so much throug h the years so that I could fulfil my am bition s. I also thankyou for your time and patience in editing my th esis.
I would like to thank my family in Italy for the wisdom, guidance and help providedto me throughout the ye ars.
Finally, I would like to thank everybody w ho con tributed to the successful realizationof th is thesis , while expressing a t the same t ime my apologies for not being able to
mention you personally one by one.
iv
8/12/2019 Development of a Design Tool for Modern Gas
http://slidepdf.com/reader/full/development-of-a-design-tool-for-modern-gas 5/380
TABLE OF CONTENTS
Abstract i i i
Acknowledgements iv
Table of Con tents v
List of Tab les x
List of Figu res xi
Nomenclature xxi
1 In t roduct ion 1
1.1 Rese arch Pro ject Overv iew 1
1.2 Rese arch Pro ject Details 5
1.3 Thesis Overview 6
1.4 Th esis Ob jectives 7
1.5 Thesis Ou tline 9
2 Lit erat ure Review 11
2.1 Com bustion Modell ing 112.1.1 CFD Modelling 132.1.2 Reactor Theory Mod elling 182.1.3 Em pirical and Semi-empirical Design Methodology 22
2.2 Man ufac tur ing of Com bustor and Gas Turb ine Com bust ion ResearchLabora tory 23
3 Techonology and Terminology 26
3.1 Gas Tu rbin e Layo ut and Cycle Analysis 26
3.2 Com bustion Flame Types 30
3.3 Flame Tem pera tu re 30
3.4 Stoichiom etry 30
3.5 Equivalence Ratio 31
v
8/12/2019 Development of a Design Tool for Modern Gas
http://slidepdf.com/reader/full/development-of-a-design-tool-for-modern-gas 6/380
3.6 Flammability Limits 32
3.7 Stability Limits 32
3.8 Autoignition 33
3.9 Flashback 33
3.10 Combustor Nomenclature 33
3.11 Combustor Types 38
4 Design Methodology for the Preliminary Design of a Gas Turbine Combustor40
4.1 Combustor Preliminary Design Approach 42
4.2 Equivalence Ratio Estimation 44
4.3 Adiabatic Flame Temperature and Mixture Mole Fractions 45
4.4 Liner Air Mass Flow Rate Distribution 52
4.5 Casing and Liner Sizing 56
4.5.1 Casing and Liner Area 56
4.5.2 Annulus Area 60
4.5.3 Liner Primary, Secondary and Dilution Zone Lengths 60
4.6 Swirler Design 64
4.7 Dome Sizing 71
4.8 Combustor Resizing for Lean Premixed Combustion 74
4.8.1 Resizing Motivations 74
4.8.2 Resizing Approach for Lean Premixed Combustors 76
4.9 Diffuser and Snout Sizing 78
4.10 Liner Cooling Mechanism 84
4.10.1 Heat Transfer Terminology 84
4.10.2 Uncooled Wall Temperature 85
4.10.2.1 Internal Radiation, Ri 87
4.10.2.2 External Radiation, R2 89
4.10.2.3 Internal Convection, Ci 90
4.10.2.4 External Convection, C2 91
4.10.2.5 Calculation of Uncooled Liner Wall Temperature 92
4.10.3 Calculation of Cooled Liner Wall Temperature and Cooling Mass Flow.... 934.10.3.1 Cooling Slot Effectiveness, ric 944.10.3.2 Equivalent Hot Gas Temperature, Tg 95
vi

8/12/2019 Development of a Design Tool for Modern Gas
http://slidepdf.com/reader/full/development-of-a-design-tool-for-modern-gas 7/380
4.10.3.3 Film Coolant Tem perature, T c 96
4.10.3.4 Cooling Air Mass Flow Rate, rhc 96
4.10.3.5 Hot Gas Ma ss Flow Rate, m 97
4.10.3.6 Annulus Mass Flow Rate, m AK1 98' AN
4.10.3.7 Area Calculations A c, A g, AAN 98
4.10.3.8 Calculation of Cooled W all Temperature 98
4.11 Injection Hole Sizing 99
4.12 Fuel Injection Theory 106
4.12.1 Fuel Atomization Process 1074.12.2 Droplet Evaporation Process and Evaporation Model I l l4.12.3 Droplet Mo tion 1184.12.4 Ignition Process and Ignition Model 120
4.12.4.1 Au toignition 1234.12.4.2 Flashback 125
4.13 Pollutant Em issions Prediction 125
4.14 Com bustor Structural Con siderations 127
5 Com bustor Preliminary Design Geom etry 131
5.1 Preliminary Geom etry of Lean Prem ixed Com bustor 131
5.1.1 Design Con siderations 1335.1.2 Overview of Com bustor Dimensions 1345.1.3 Selection of Fuel No zzle 1395.1.4 Selection of Ignition System 140
6 Premixed Combu stor Manufacturing Process 142
6.1 Material Overview for Engine Hot Section Com ponents 142
6.2 Selection of Com bustor Liner Ma terial 145
6.3 Overview of Superalloys Ma nufacturing Processes 146
6.4 Overview of Superalloys Joining Processes 147
6.5 Selection of the Com bustor Liner Ma nufacturing Method 150
6.6 Com bustor Casing Material Selection 157
6.7 Selection of Com bustor Casing Man ufacturing M ethod 159
6.8 Liner Casing Assembly 161
vii

8/12/2019 Development of a Design Tool for Modern Gas
http://slidepdf.com/reader/full/development-of-a-design-tool-for-modern-gas 8/380
6.9 Prem ixer Man ufacturing Process 164
6.10 Fuel Nozzle Mod ifications 166
7 Gas Turbine Com bustion Research Laboratory 170
7.1 Gas Turbine Com bustion Research Laboratory Layout and Loca tion... 170
7.2 Gas Turb ine Room 173
7.2.1 Allison 250-C20B Overview 1737.2.2 Allison 250-C20B Air Flow Path 1757.2.3 Allison 250-C20B Engine Modifications 1767.2.4 Allison 250-C20B Instrumentation 188
7.3 Com bustion Room 1987.3.1 High Pressure Air Delivery System 1997.3.2 Air Delivery System Design and Flow 199
7.3.3 Air Delivery System Com ponents 2117.3.4 Air Delivery System Instrumentation 219
7.3.4.1 Microturbine Com bustor Instrumentation 2197.3.4.2 Orifice Instrumentation 232
7.3.5 Data Acquisition System 2387.3.6 Atmo spheric Pressure Air Delivery System 2407.3.7 Fuel Delivery System 2507.3.8 Control Room 257
8 Instrument Calibration Process and Shakedo wn Tests 266
8.1 Therm ocouples Calibration 266
8.2 Pressure Transducers Calibration 268
8.3 Pressure Probes Calibration 271
8.4 Orifice Calibration 274
8.5 Shakedow n Tests 275
8.5.1 Wall Tap Averaging 2768.5.2 Leak Tests of Instrumentation Pressure Lines 2778.5.3 Air Delivery System Pressure Leak Tests 279
8.5.4 Air Delivery System Shakedown Tests 2808.5.5 Repeatability Shakedown Tests 2828.5.6 Fuel Delivery System Shakedown Tests 2848.5.7 Allison 250-C20B Shakedow n Tests 2878.5.8 Bleed Shakedown Tests 289
9 Conclusions and Recomm endations 294
viii

8/12/2019 Development of a Design Tool for Modern Gas
http://slidepdf.com/reader/full/development-of-a-design-tool-for-modern-gas 9/380
9.1 Con clusions 294
9.2 Recom men dations 296
10 References 298
Appendix A : Exam ple of Microturb ine Com bustor Technica l Drawing 305
App endix B : M aterials Prop erties 307
Appendix C : BET E PJ Model Informat ion 310
Ap pen dix D : Stainless Steel Pipe Dia me ters 316
App endix E : Piping Guide ASM E B31.3 317
Appendix F : Ins t rum ent Cal ibra t ion Curves 318
Appe ndix G : Allison 250-C20B Limits and Op eratin g Pro ced ure 346
ix

8/12/2019 Development of a Design Tool for Modern Gas
http://slidepdf.com/reader/full/development-of-a-design-tool-for-modern-gas 10/380
L I S T O F T A B L E S
Ta ble 1.1 Zero-em ission pow er plan t specifications 3
Tab le 4.1 Pre ssure loss term s for aircraft and indus trial engine com bustors 58
Ta ble 4.2 Ge om etry factors 59
Tab le 4.3 Emissions index (EI) of m odern aircrafts dur ing cruise (Cum psty,
2003) 74
Table 4.4 Summary of empirical constants used in diesel autoignit ion
correlations 124
Ta ble 5.1 M icr otu rbi ne specifications 132
Table 5.2 Design par am eters 134
Table 5.3 Crit ical com bustor dimensions 135
Ta ble 5.4 Dim ensions of swirlers 137
Table 6.1 Operation and maintenance l ife for typical industrial combustor l iner
(Ad apted from Boyce, 2006) 144
Ta ble 6.2 High tem pe rat ur e alloys (Boyce, 2006) 145
Ta ble 7.1 Air delivery system non -reco verab le coefficients 205
Table 7.2 Predicted therm odyn am ic perform ance of T63-A-700 (Haa s, 1996) 215
Table 7.3 Calculated therm ody nam ic perform ance of Allison 250-C20B 215
Tab le 7.4 An gu lar location of sensor 239
x

8/12/2019 Development of a Design Tool for Modern Gas
http://slidepdf.com/reader/full/development-of-a-design-tool-for-modern-gas 11/380
LI ST OF FI GURES
Fig ure 1.1 Zero-em ission pow er pla nt cycle schem atic 4
Fi gu re 1.2 The sis overview flowchart 7
Fig ure 2.1 CF D mo delling process outline (Ha nsen et al., 2005) 13
Figu re 2.2 Co mb ustor l iner uns truc ture d surface mesh (Chok , 2003) 15
Figure 2.3 Bragg combustor, s implest form of an idealized gas turbine
com bus tor (M attingly et al., 2002) 19
Figure 2.4 Idealized gas turb ine com bustor (Adapted from Allaire, 2006) 20
Figure 3.1 T-s diagram for simple cycle gas turbine used for electrical power
generation (Top: Adapted from Rolls-Royce pic, 1996; Bottom:
Kurzke ,2005) 28
Figu re 3.2 Effect of pre ssur e ratio and T IT on cycle the rm al efficiency 29
Fig ure 3.3 Effect of pre ssur e ratio and T IT on specific fuel cons um ption 29
Figu re 3.4 Co mb ustion stability loop 33
Figure 3.5 Co mb ustor layout 34
Figure 3.6 Conven tional com bustor zones 35
Figure 3.7 Conven tional com bustor l iner 36
Figure 3.8 Prem ixed com bustor zones 37
Figure 3.9 Prem ixed com bustor l iner 37
Figure 3.10 Common combustor configurations (Adapted from Rolls-Royce,
1996) 38
Figure 4.1 Co m busto r prelim inary design algorithm 41
xi

8/12/2019 Development of a Design Tool for Modern Gas
http://slidepdf.com/reader/full/development-of-a-design-tool-for-modern-gas 12/380
Figu re 4.2 Adiab atic flame tem per atu re algorithm 48
Figure 4.3 Effect of equivalence ratio on adiaba tic flame tem per atu re 51
Figure 4.4 Co m busto r design evolution (Adap ted from Cu mp sty, 2003) 52
Figure 4.5 Typical conventional com bustor air flow distribution 54
Figure 4.6 Effect of PZ tem per atur e on formation of pollutants for conventional
com bustor (Adapted from Mattingly, 2002) 55
Figure 4.7 Prem ixed com bustor air flow distribution 56
Figure 4.8 Co mb ustor nom enclature 56
Figure 4.9 Pa ttern Fac tor (Adapted from Lefebvre, 1999) 63
Figure 4.10 Swirler nom enclature 64
Fig ure 4.11 Rec irculatio n zones 65
Figure 4.12 Prem ixer nom enclature 65
Figure 4.13 Size of recirculation zone as function of swirl number (Adapted
from Bee r and Ch igier, 1983) 68
Figure 4.14 En train m en t ratio versus swirl nu m ber (Lefebvre, 1999) 70
Figu re 4.15 Swirl angle versu s solidity (Kilik, 1976) 71
Figure 4.16 Dome nom enclatu re 72
Figu re 4.17 M agic circles 73
Fig ure 4.18 Effect of tem pe rat ur e on forw ard rat e coefficient 76
Fig ure 4.19 Diffuser no m enc latu re 80
Figure 4.20 Performance chart for conical diffusers (Adapted from Lefebvre,
1999) 83
Figure 4.21 He at transfe r mechanism (Sawyer, 1985) 86
xii

8/12/2019 Development of a Design Tool for Modern Gas
http://slidepdf.com/reader/full/development-of-a-design-tool-for-modern-gas 13/380
Fig ure 4.22 Coo ling schemes (Rolls-Royce pic, 1996) 93
Figure 4.23 Effect of hole pressure drop coefficient on discharge coefficient
(Adapted from Ka dd ah, 1964) 104
Figure 4.24 Effects of hole pressure loss factor and hole geometry on discharge
coefficient (F re em an , 1965) 104
Figu re 4.25 Injection hole nom enc latur e (Ad apted from Lefeb vre, 1999) 105
Figure 4.26 Pro gram algorithm for s ingle drop let evaporation 113
Figure 4.27 D 2 law for drop let evap oratio n using simplified analysis 118
Figure 4.28 Droplet part icle trajectory (Ch arest , 2005) 119
Figu re 4.29 Ign iter location 123
Figure 4.30 Force diagram of thin walled pressure vessel (Adapted from
M atthe ws , 2005) 128
Figure 4.31 M aterial principle s tresses (Adap ted from M atthew s, 2005) 130
Figure 5.1 M icrotu rbine schematic 133
Figure 5.2 Com busto r key dimensions 134
Fig ure 5.3 Li ne r mass flow distrib utio n 135
Figure 5.4 Prem ixer dimensions 136
Fig ure 5.5 Diesel fuel pre mi xer 137
Fig ure 5.6 Effect of blad e tur nin g angle on swirl nu m be r 138
Fig ure 5.7 Effect of blade tur nin g angle on pre ssu re loss across swirle r 138
Figure 5.8 BE TE impingem ent nozzle (model PJ) (A dapted from BE TE , 2007). .. . 140
Figure 5.9 Ignit ion system and spark igniter (Adapted from Allison Engine
Co mp any , 1999) 141
xi i i

8/12/2019 Development of a Design Tool for Modern Gas
http://slidepdf.com/reader/full/development-of-a-design-tool-for-modern-gas 14/380
Figure 6.1 Evolution of turb ine blades with firing tem per atur e (Boyce, 2006) 143
Fig ure 6.2 W eldability limits (Ca mp bell, 2006) 148
Figure 6.3 W elding techniques schematics (Cam pbell , 2006) 149
Figure 6.4 Hy droform ing process 151
Fig ure 6.5 M etal spin ning process (Spinc raft, 2007) 151
Fig ure 6.6 Roll form ing 152
Figure 6.7 Co mb ustor l iner ma nufac turing process 153
Figure 6.8 Liner exploded view (top) and actual parts (bottom) after roll
forming 154
Fig ure 6.9 M achin ed cooling ring 155
Fig ure 6.10 Coo ling rin g weld 156
Fig ure 6.11 Li ne r solid mod el and final pro du ct 156
Figure 6.12 Co mb ustor casing ma nufa cturing process 160
Figure 6.13 Casing exploded view (top), cross-section (middle) and final product
(bottom) 161
Fig ure 6.14 Li ne r and casing assembly 162
Fig ure 6.15 Li ne r and casing final assembly 164
Fig ure 6.16 Pre m ixer pa rts before final assembly 165
Fig ure 6.17 Pr em ixe r final assembly 166
Fig ure 6.18 Fuel nozzle m achin ing 167
Fig ure 6.19 Fuel nozzle after m achin ing with fuel line welde d 167
Figu re 6.20 Mixer swirler with impingem ent pin 168
Figu re 6.21 W ate r atomization tests 169
xiv

8/12/2019 Development of a Design Tool for Modern Gas
http://slidepdf.com/reader/full/development-of-a-design-tool-for-modern-gas 15/380
Figu re 7.1 Gas turb ine combustion research labo ratory layout 171
Figure 7.2 Allison 250-C20B configuration and air flow (Adapted from
An ony mo us, 2008) 174
Figure 7.3 Allison 250-C20B isometric view and air flow path (Adapted from
Allison Eng ine Co m pan y, 1999) 175
Figure 7.4 Allison 250-C20B and dyn am om eter 177
Fig ure 7.5 Pa rtia l disassembly of Allison 250-C20B engine 178
Fig ure 7.6 Ex am ple of tool used for engine disassembly 179
Figure 7.7 Third s tage low pressu re turb ine wheel before and after mac hining. . . . 179
Fig ure 7.8 Exp loded view of low pre ssu re tur bin e section 180
Figure 7.9 Low pressu re turb ine section reassembly 181
Fig ure 7.10 Oil pu m p assembly 181
Fig ure 7.11 Allison 250-C20B final assembly after mod ification 182
Figure 7.12 Allison 250-C20B discharge air tube (Adapted from Allison Engine
Co m pan y, 1999) 182
Fig ure 7.13 Air bleed system assembly (M urp hy , 2004) 183
Figu re 7.14 M eteri ng bellm outh 184
Fig ure 7.15 Bellm outh mold 185
Fig ure 7.16 Inlet protectiv e screen 186
Fig ure 7.17 Fail-safe mec hanism 188
Figure 7.18 M etering bellmouth principle 189
Fig ure 7.19 Av eraging manifold 192
Figure 7.20 Therm ocoup le wo rking principle (Omega Eng ineering, 2004) 193
xv

8/12/2019 Development of a Design Tool for Modern Gas
http://slidepdf.com/reader/full/development-of-a-design-tool-for-modern-gas 16/380
Figure 7.21 Type K thermocouple nomenclature (Adapted from Omega
En gine ering , 2004) 194
Figure 7.22 Accelerometer working principle and actual ACC101 accelerometer
(Adap ted from Om ega Eng ineering, 2000) 195
Figure 7.23 Accelerometer installation points (Adapted from Allison Engine
Co m pan y, 1999) 196
Figure 7.24 Gea rbox accelerometer installation 196
Fig ure 7.25 Test cell instr um enta tion 197
Figure 7.26 Gas turb ine combustion research labo rator y layout 198
Figure 7.27 Air delivery system layout in Gas Tu rbin e Room 200
Figure 7.28 Air delivery system layout in Com bustion Room 200
Figu re 7.29 Jam esb ur y 815W flow coefficient as a function of valve ap er tur e 204
Figu re 7.30 Pipe flows (Bak er, 2003) 206
Figu re 7.31 Air delivery system total length 206
Figure 7.32 Maximum operating conditions of sch. 40S stainless steel (316L)
pipes 207
Figu re 7.33 Ex am ple of pipe section 208
Figu re 7.34 Ex am ple of pipe weldin g 209
Figure 7.35 Brea king load of fine versus coarse threa ds (Nayy ar, 2000) 210
Figure 7.36 Sup portin g frame 211
Figure 7.37 Jam esb ury 815W butterfly valve 212
Fig ure 7.38 Orifice plate 213
Figu re 7.39 Pr og ram algorithm for s imple gas turb ine therm ody nam ic cycle 214
xvi

8/12/2019 Development of a Design Tool for Modern Gas
http://slidepdf.com/reader/full/development-of-a-design-tool-for-modern-gas 17/380
Figure 7.40 Effects of bleed mass flow rate and engine operating point on EGT... 216
Figure 7.41 Pressure switch location in air delivery system (Adapted from
Om ega Eng ineering, 2000) 217
Figure 7.42 PSW-108 pressure switch details (Adapted from Omega
Eng ineering, 2000) 218
Fig ure 7.43 Pitot rak e 220
Fig ure 7.44 Pitot rak e assembly 221
Figure 7.45 Instru m enta tion upstrea m of mic rotur bine com bustor 221
Figure 7.46 W all tap ma nufac turing process 222
Figure 7.47 M icrotu rbine air inlet tem per atu re thermo couple 223
Fig ure 7.48 Kiel pr ob e design 224
Fig ure 7.49 Kiel pro be flow angles 225
Figure 7.50 Instru m entatio n dow nstream of mic roturb ine com bustor 226
Figure 7.51 Thermocouple assembly for measuring combustor outlet
tempera ture 227
Figure 7.52 Te m per atu re sensor insert ion point 227
Figure 7.53 Ther mo coup le wire s tripp er (Om ega Eng ineering, 2004) 228
Figure 7.54 Type K thermocouple nomenclature (Adapted from Omega
Eng ineering, 2004) 229
Figure 7.55 Thermocouple connectors (Adapted from Omega Engineering,
2004) 229
Figu re 7.56 Views of l iner instrum entation thro ugh a 270° rotation 231
Fig ure 7.57 Th erm oco uple s spot welds detailed view 231
xvii

8/12/2019 Development of a Design Tool for Modern Gas
http://slidepdf.com/reader/full/development-of-a-design-tool-for-modern-gas 18/380
Fig ure 7.58 Orifice plate with 1-D and - -D wall taps 233
Fig ure 7.59 Orifice plate wall tap s (up strea m ) 233
Figure 7.60 W all tap and pitot rak e press ure l ines 235
Figure 7.61 Scanivalve pressu re scanne r and solenoid controller 235
Figu re 7.62 Pressu re scann er comp onents 236
Fig ure 7.63 Keithley 2700 da ta acquisition system 238
Figu re 7.64 M easurem ents identification 240
Figure 7.65 Lay out top view of atmo spheric pressu re air delivery system 241
Figu re 7.66 Atm ospheric configuration set-up 242
Figu re 7.67 Spencer Tu rbin e Com pany blower model 30104A3 243
Figure 7.68 Blower perform ance curve and hose press ure losses 243
Figure 7.69 Atmospheric and high pressure configurations of air delivery
system 244
Fig ure 7.70 Close-up of air and fuel delivery systems 244
Fig ure 7.71 Lin er pre pa rat ion for disch arge coefficient type tests 246
Figure 7.72 La m ina r flow element assembly 248
Figure 7.73 La m ina r flow element instrum entatio n 249
Figu re 7.74 Fuel delivery system layout top view 250
Figu re 7.75 Fuel delivery system com ponents 251
Fig ure 7 .76 Fue l de l ive ry sys tem f low 252
Figure 7.77 Hydra-Cell C62 pressure regulator valve (Adapted from Wanner,
2002) 254
Fig ure 7.78 Fue l delivery systems close-up 257
xviii

8/12/2019 Development of a Design Tool for Modern Gas
http://slidepdf.com/reader/full/development-of-a-design-tool-for-modern-gas 19/380
Figure 7.79 Con trol Room layout top view 257
Fig ure 7.80 Allison 250-C20B contr ol and m onito ring station 259
Fig ure 7.81 Fra ctio nal flow con trol valve actua tion system 261
Figu re 7.82 Op eratin g console wiring details 261
Figur e 7.83 Op eratin g console top panel and mo nitors 262
Figur e 7.84 Mo nitoring cam era, model VK77A 263
Figure 7.85 La b View pro gra m fragment with detailed tran sdu cer subro utine 264
Fig ure 7.86 La b View front pane ls as displayed by m onito rs 265
Figure 8.1 CL 122-2 block calibrator and Allison 250-C20B inlet thermocouple... 267
Figure 8.2 EG T thermo couple calibration 268
Figure 8.3 Dru ck DP I 605 pressu re calibra tor 269
Figure 8.4 PX243A-1 pressu re tran sdu cer calibration curves 271
Figure 8.5 Kiel pro be calibration rig (Adapted from Ma hallati , 2003) 272
Fig ure 8.6 Effect of Kiel pro be pitch angle on total pre ssu re coefficient 272
Figu re 8.7 Calib ration rig sensor location (Adap ted from M ahallati , 2003) 273
Figure 8.8 Viscosity and wall proximity correction for pitot tubes (Ower and
Pa nk hu rst , 1977) 274
Figure 8.9 Atm ospheric blower instrum ented with me tering bellmouth 275
Figu re 8.10 Perfo rman ce assessment of me tering bellmouth wall taps 276
Figure 8.11 Perfo rman ce assessment of me tering bellmouth wall taps 277
Fig ure 8.12 Pr ess ure leak test for S30B01 pre ssu re line 278
Figu re 8.13 Pressur e leak test for air delivery system; pre ssure r egu lator details . 280
Fig ure 8.14 Pr essu re leak test for air delivery system; sealing plate details 280
xix

8/12/2019 Development of a Design Tool for Modern Gas
http://slidepdf.com/reader/full/development-of-a-design-tool-for-modern-gas 20/380
Figure 8.15 Repeatability tests 283
Figure 8.16 Effect of differential p ressu re across PJ12 nozzle on water flow r at e. 286
Figure 8.17 Effect of differential pres sure across PJ12 nozzle on diesel flow r at e. 287
Figure 8.18 Effect of gas generator rotational speed on Allison 250-C20B
vibrations 289
Figu re 8.19 Allison 250-C20B bleed shakedow n test 290
Figure 8.20 Effect of testing time on Gas Tu rbine Room tem per ature 291
Figure 8.21 Effect of testing time on gas turbin e exhaust tem pera ture 292
xx

8/12/2019 Development of a Design Tool for Modern Gas
http://slidepdf.com/reader/full/development-of-a-design-tool-for-modern-gas 21/380
N O M E N C L A T U R E
A Area or empirical constant, Equation (4.126)
A Coo ling slot outlet area0 °
A Coo ling slot overall effective areaef f &
AR Casing area to com bustor inlet area ratio
B Coo ling slot blockage factor
B ., Stoichiom etric fuel ma ss transfer num berstolen
BT Spalding numb er
C Convection heat transfer
Cd Discha rge coefficient or drag coefficient
c Specific heat
C Pressure recove ry coefficient
C Flam eholder shape factor
d Diameter
dh Hydraulic diameter
d Quenching distance
D Diameter
D Flameholder characteristic dimension
xx i

8/12/2019 Development of a Design Tool for Modern Gas
http://slidepdf.com/reader/full/development-of-a-design-tool-for-modern-gas 22/380
D Orifice diame ter0
D32 Sauter mean diameter (SM D)
e Electrical charge
E Dynamic You ng's modulus
E Activation energy
E Minim um ignition energymm ° OJ
GF Geom etry factor
—ogf Standard Gibb s free energy of formation
G Axial flux of angular mom entumm °
G, Axial thrustt
AG T Standard Gibbs free energy change
H Molar based absolute enthalpy
k Thermal conductivity or proportionality constant, Equation (4.45)
k Forw ard rate coefficient, Equ ation (4.40)
k Optimum parameter, Equation (4.26)
K Con duction heat transfer or pressure loss factor or constant, Eq uation
(4.120)
K Equilibrium constant, Equation (4.15)
A T Swirler vane geom etry factor
J Mom entum flux ratio
xxi i

8/12/2019 Development of a Design Tool for Modern Gas
http://slidepdf.com/reader/full/development-of-a-design-tool-for-modern-gas 23/380
/ Beam length
L Leng th or lumino sity factor
M Molecular weight
rh Mass flow rate
n Em pirical constant, Equation (4.126)
n Number of vanesV
n, Num ber of holes
h
N Casing diffuser length
Nu Nusselt number
p Static pressure
P Pressure or partial pressure
P Saturation pressure
P Mass flow weighted pressure
Pr Prandtl number
q Dynam ic pressure or fuel/air ratio by mass or empirical constant, Equation
(4.100)
q Mass flow weighted dynam ic pressure or bulk mean turbulent fluctuation
Q Pattern factor or liquid fuel total volum e fraction
r Radius
R Rad ius or radiation heat transfer
R Air gas constant
xxi i i

8/12/2019 Development of a Design Tool for Modern Gas
http://slidepdf.com/reader/full/development-of-a-design-tool-for-modern-gas 24/380
R Gas constantgas
R Universal gas constant
Re Reynolds number
s Slot depth
S Van e spacing or stress
S Laminar flame speed
S i ; Swirl number
t Thickness or time
T Temperature
T Equivalent gas temperature
u Particle velocity compon ent in x direction
u Me an bulk fluctuation in x direction
v Particle velocity comp onent in x direction
v Mean bulk fluctuation in y direction
V Voltage
V Velocity
VBQ Lean blowout velocity
Vol Volume
w Mea n bulk fluctuation in z direction
We Weber number
x Axial distance downstream of cooling device
xxiv
8/12/2019 Development of a Design Tool for Modern Gas
http://slidepdf.com/reader/full/development-of-a-design-tool-for-modern-gas 25/380
x Poten tial core lengthp °
X Jet axial length or emp irical constan t, Equ ation (4.100)
X M ole fraction
w Cooling slot width or particle velocity component z direction
Y Jet radial length
Y„ Fuel m ass fractionF
YR Fuel m ass fraction at drople t surface
Y Fuel m ass fraction far from drople t
AP Pressure drop
a Hole area ra t io or coeff ic ient of therma l expans ion
cc The rm al diffusivity
P Hole bleed ra t io
S Thermal expans ion
s Em issivi ty or s tra in
£ Therm al s tra in
A Pres sure loss coefficient
X Evapo rat ion constant
i 7 C o m b Com bustion efficiency
tj Efficiency or effectiveness
ju Dynam ic viscosity or velocity area ratio
f Equivalence ratio
XXV

8/12/2019 Development of a Design Tool for Modern Gas
http://slidepdf.com/reader/full/development-of-a-design-tool-for-modern-gas 26/380
O J e t angle
y / Diffuser ang le
(p Ca sin g diffuser ang le
9 Angle
A Difference
p Density
cr Stephan-Boltzmann constant o r surface tension o r yield stress
T Tim e constant
T Autoig nition delay time
v Kinem atic viscosity
v Po isson's ratio
Subscripts
0 Initial
1 Conventional combustor or inner liner wall
2 Premixed combustor or outer liner wall
3 Com bustor inlet
4 Com bustor outlet
a Air
ad Adiabatic
am b Ambient
axial Axial
AN Annulus
b Bulk or boiling
xxvi

8/12/2019 Development of a Design Tool for Modern Gas
http://slidepdf.com/reader/full/development-of-a-design-tool-for-modern-gas 27/380
bleed
c
casing
crit
Comb
comp
D
diff
DZ
eff
e v
f
g
gas
global
h
hot
hub
ideal
igin
J
I
Bleed
Cooling
Casing
Critical
Combustor
Compressor
Dome
Diffuser
Dilution zone
Effective
Evaporation
Fuel
Flame or hot gasses
Gas
Global
Hole
Hot gasses
Hub
Ideal
Ignition
Inlet
Jet
Liquid fuel

8/12/2019 Development of a Design Tool for Modern Gas
http://slidepdf.com/reader/full/development-of-a-design-tool-for-modern-gas 28/380

8/12/2019 Development of a Design Tool for Modern Gas
http://slidepdf.com/reader/full/development-of-a-design-tool-for-modern-gas 29/380

8/12/2019 Development of a Design Tool for Modern Gas
http://slidepdf.com/reader/full/development-of-a-design-tool-for-modern-gas 30/380
MN PT Male national pipe thread
NR Can Natural Resources Canada
PDR Pressure drop ratio
PFR Plug flow reactor
PLF Pressure loss factor
ppmv Parts per million volume
PSR Perfectly stirred reactor
RAN S Reynolds-average Navier-Stokes equations
RQL Rich-burn, quick-quench and lean burn
RSM Reynolds stress model
SFC Specific fuel consu mp tion
SMD Sauter mean diameter
TBC Thermal barrier coating
77 Turbulence intensity
TIT Turbine inlet temperature
UHC Unburned hydrocarbons
VA C Voltage alternating current
VDC Voltage direct current
WSR Well stirred reactor
X X X

8/12/2019 Development of a Design Tool for Modern Gas
http://slidepdf.com/reader/full/development-of-a-design-tool-for-modern-gas 31/380
1 I N T R O D U C T I O N
This chapter first gives an overview of a zero-emission power plant which has been
developed by Carleton University under a contract given by Natural Resources Canada
(NRCan). This research project has been the basis for the work presented in this thesis.
The chapter then elaborates on the motivations for the work and the approach used to
meet the research project objectives. It concludes by giving a chronological outline and a
brief explanation of the various chapters mak ing up th is thesis.
1.1 Re search Project Overview
In response to rising environmental con cerns, NR Can contracted Carleton U niversity,
more specifically the Mechanical and Aerospace Engineering Department, to develop the
preliminary design for a zero-emission power plant.
The deregulation of utilities and the increase in costs of bringing electrical power to
the buying public favoured the introduction of a number of new technologies for
distributed power generation, especially in the 30 kW to 300 kW electrical output range
(Kolanowsky, 2004). Consequently, NRCan requested the preliminary design of a 50 kW
zero-emissions microturbine and then to scale the technology to a conceptual design of a
100 MW power plant.
When burning hydrocarbon fuels, the reduction of pollutants such as carbon dioxide
(CO2) and water vapour (IfeOg) can only be achieved through a decrease in fuel
consumption since these two products are an inescapable outcome of the combustion
process. On the other hand, oxides of nitrogen (NO x = NO + NO2), carbon monoxide
(CO), unburned hydrocarbons (UHC) and particulates, also known as soot (unburned
1

8/12/2019 Development of a Design Tool for Modern Gas
http://slidepdf.com/reader/full/development-of-a-design-tool-for-modern-gas 32/380
2
carbon), are directly related to the type of fuel and oxidizer used, as well as to the gas
turbine combustor design and performance.
The development of a semi-closed, recuperated cycle, combusting natural gas and
oxygen (O2), and using the resulting CO2 combustion product as the primary working
fluid for the turbine engine, addressed the zero-emissions and 50 kW electrical power
output requirements.
By assuming com plete combustion and a combustion efficiency (77c 6 ) of 100%, the
burning of methane (CH 4) with pure oxygen would lead to the formation of carbon
dioxide and water vapour, as can be seen by the following chem ical reaction:
C H 4 + 2 ( 0 2 + C 0 2 ) ^ 3 C 0 2 + 2 ( H 2 0 ) g +Heat (1.1)
As can be seen from the above reaction, using an oxidizer and a fuel that do not
contain nitrogen eliminates NO x formation during the combustion process. Oxides of
nitrogen (NO x), which are obtained from combustion processes that use air as the
oxidizer, are responsible for chemical smog, depletion of stratospheric ozone, acid rain
and, to a lesser degree tha n CO2, greenho use effects.
In addition to using CH4 and O2, a semi-closed, recuperated cycle enables to capture
the pollutant responsible for most greenhouse effects, namely CO2.
Table 1.1 and Figure 1.1 show the pow er plant specifications given by NR Ca n and
the cycle schematic developed by C arleton University.

8/12/2019 Development of a Design Tool for Modern Gas
http://slidepdf.com/reader/full/development-of-a-design-tool-for-modern-gas 33/380
3
Table 1.1 Zero-emission power plant specifications
1. Release zero CO2, NO x, SO x emissions to surroundings
2. Fuelled by natural gas (assumed to have the following com position on a volume
basis; 95.60% CH4 ,1 .75% C 2H 6, 0.10% C3H 8, 1.75% N 2 and 0.8% CQ2)3. Use high purity oxygen (99% by volume) from liquid storage vessel with
evaporator able to generate gaseous oxygen at pressure needed to combu stor
4. Use high-p urity propa ne as test fuel
5. Hav e a net electrical output of 50 kW at 480 VAC, 60 Hz (ISO conditions,unistalled)
6. Hav e an efficiency of 2 5% (thermal to electric), accounting for CO2compression b y the plant to its discharge value, but not the Q 2 supply
7. M aintain a high efficiency at part load
8. Be continually pressurized to eliminate air infiltration
9. Use an air cooled indirect contact condenser to cool the recycled steam
10. Store C 02 w ith purity of 98%, at a pressure of 80 bar in liquid phase
11. Have zero oil contamination in C0 2
12. Vent water and steam for disposal (small quantity of C 0 2 in water permitted)
13. Be capable of safe start-up, operation and shut-down under automatic control
14. Be able of operating between -40°C and + 40°C
15. Have a casing capable of con taining a rotor failure assuming a w orst casescenario of one third (1/3) rotor loss
16. Be instrumented for test purposes
17. Have low m aintenance and capital costs

8/12/2019 Development of a Design Tool for Modern Gas
http://slidepdf.com/reader/full/development-of-a-design-tool-for-modern-gas 34/380
Air Air
Natural Gas
CoolingFluid
Generator
Heat
Exchanger
Pump
Figure 1.1 Zero-emission power plant cycle schematic
Figure 1.1 shows the flow path analysis of the plant. The cycle working fluid is CO2
that, during engine start-up, comes from a storage tank where it was previously captured
and accumulated.

8/12/2019 Development of a Design Tool for Modern Gas
http://slidepdf.com/reader/full/development-of-a-design-tool-for-modern-gas 35/380
5
The CO2 gas enters the compressor where it is pressurised from 3 bar to 21 bar. The
fluid then flows into the recuperator where it is preheated, from an inlet temperature of
485 K to an outlet temperature of 875 K, by the hot gasses exhausted from the turbine.
In the combustor, natural gas is mixed with just enough O2 for all the fuel to
completely burn, technically referred to as stoichiometric combustion. The CO2 entering
the combustor promotes mixing of the CH4 and O2 prior to combustion, cools the
combustor walls for structural integrity purposes and lowers, through a dilution process,
the exhaust gas temperature to 1200 K. The dilution process, as will be discussed in more
detail later, extends the life of com ponents do wnstream of the com bustor.
The hot gasses, now including CO2, water vapour, and the CO2 produced by the
combustion process, enter the turbine where they are expanded to approximately 3 bar.
The hot exhaust gasses then enter the recuperator where, as mentioned before, they are
used to preheat the incom ing CO2.
The last plant component encountered by the working fluid, before the cycle is
repeated, is the condenser. T he condenser, not only lowers the CO2 temperature before it
re-enters the compressor, but it also condenses the unwanted water vapour, created in the
combustion proce ss, into liquid which is then expelled from the plant.
1 .2 R e s e a r c h P r o j e c t D e t a i l s
The main focus of this thesis is the microturbine combustor of the previously
presented power plant. T he combu stor specifications are as follows:
• provide a turbine inlet temperature (TIT) of 1200 K;
• sustain a pressure loss across the combustor not higher than 3% of the
comb ustor inlet pressure;

8/12/2019 Development of a Design Tool for Modern Gas
http://slidepdf.com/reader/full/development-of-a-design-tool-for-modern-gas 36/380
• ensure 99 % combustion efficiency (rj , ) ;
• ensure combustor wall temperatures below 1300 K; and
• operate at a working pressure of 21 bar.
The work contained in this thesis is built upon initial efforts done on the combustor.
More specifically, preliminary combustor design work, carried out by senior mechanical
and aerospace engineering students at Carleton University, was used as basis for the
thesis objectives presented next.
1.3 The sis Ov erview
The scope of the w ork presented in this thesis, summarized in F igure 1.2, was to:
• carefully scrutinize a design methodology that had been developed before the
start of this research project;
• manufacture a combu stor whose preliminary geometry came from the above
mentioned design methodology;
• update and further develop the methodo logy; and
• design and construct a gas turbine combu stion research laboratory.

8/12/2019 Development of a Design Tool for Modern Gas
http://slidepdf.com/reader/full/development-of-a-design-tool-for-modern-gas 37/380
7
' r
Design ofCombustion
Research La boratory
Construction ofCombustion
Research Laboratory
. :Shakedown ofCombustion
Research Laboratory
Literature Review
few*. . M m^K aBm
Testing of MicroturbineCombustor
(Future Work)
'
"Assessment of Design
Methodology
1
r
Preliminary Design ofMicroturbine Combustor
i r
Manufacture of
Microturbine Combustor
'Update of
Design Methodology
'Design of Future
Combustors
r
Manufacture of Future
Combustors
Figure 1.2 Thesis overview flowchart
1.4 Th esis Ob jectives
To carry out the thesis objectives in a timely fashion, an initial concurrent approach,
addressing all major project aspects simultaneously, had to be taken. Furthermore,
executive decisions, in the early phases of the project, had to be made because of
manufacturing lead times and costs. In particular, the prohibitive costs in building a
laboratory that could operate with natural gas, oxygen and carbon dioxide at 21 bar
required essential decisions to be made prom ptly.
Two of these crucial decisions were to:
• manufacture the lean premixed comb ustor, even though no compu ter
modelling work w as carried out; and

8/12/2019 Development of a Design Tool for Modern Gas
http://slidepdf.com/reader/full/development-of-a-design-tool-for-modern-gas 38/380
8
• construct a gas turbine combustion research laboratory that, as one of the
many goals, could be used as a "calibration tool" for future modelling
work on the microturbine com bustor under investigation.
In particular, a gas turbine combustion research laboratory using pressurized air (7
bar) and diesel fuel h ad to be designed, constructed and equipped with instrumentation so
that experimental work on the microturbine combustor could later be conducted. The
experimental data, obtained from future combustor testing, would then be used as inputs
for upcom ing com puter simulations as well as serving as a validation tool for the outputs
of the simulations.
Additional computer simulations, after having validated and obtained confidence in
the outputs of the combustor computational models, would then replicate intended
combustor operating parameters (natural gas, oxygen and carbon dioxide at a working
pressure of 21 bar) so that the combustor geom etry and performance could be reassessed.
In addition to serving as a validation tool, the gas turbine combustion research
laboratory w as designed and constructed to allow for:
• testing of future gas turbine combustor designs, which are operating on air
and liquid fuels;
• development of new empirical and semi-empirical correlations derived
from combustion tests;
• possib le testing of new alternative fuels, throug h min or fuel delivery
system m odifications; and
• testing of gas turbine hot section component materials and coatings
through the addition of a material test rig downstream of the combu stor.
8/12/2019 Development of a Design Tool for Modern Gas
http://slidepdf.com/reader/full/development-of-a-design-tool-for-modern-gas 39/380
9
Prior to proceeding with the manufacturing of the microturbine combustor, careful
examination of the previously developed design methodology was undertaken. The
assessed methodology was deemed adequate. However, as part of the thesis objectives,
obsolete empirical and semi-empirical correlations were updated. New research findings
were incorporated and liquid fuel correlations, as well as expressions that can predict gas
turbine pollutant emissions were added to the design m ethodology.
1 .5 T h e s i s O u t l i n e
This thesis was written to provide as much information as possible on the developed
design methodology as well as on the processes used and decisions made when
manufacturing the microturbine combustor and commissioning the gas turbine
combustion research laboratory. The extensive details presented in this thesis were given
so that future individuals involved in using the design methodology and/or the research
laboratory can quickly and easily understand key factors related to this research.
The development of the design methodology, the manufacture of the combustor and
the commissioning of the research laboratory were the objectives of this project.
Although, these objectives were interlinked in that one led to the achievem ent of the next,
they had fundamental differences. The design methodology was developed from science
of gas turbine combustion, while the combustor manufacturing and the research
laboratory com missioning w ere based on applied knowledge from va rious fields. Because
of this, the literature review pertaining to this research project was presented in three
different ch apters. Therefore, Chapter 4 outlines the design methodology, Chapter 6
describes the microturbine combustor manufacturing process and Chapter 7 covers the
comm issioning of the gas turbine com bustion research laboratory.

8/12/2019 Development of a Design Tool for Modern Gas
http://slidepdf.com/reader/full/development-of-a-design-tool-for-modern-gas 40/380
10
In total, this thesis is composed of 9 Chapters as follows:
• Chapter 1 gives an overview of and specifications for a zero-em ission pow er plant
which was the basis for the work presented in this thesis. This chapter also
presents the thesis objectives.
• Chapter 2 outlines different com putational approaches that can be used as tools to
design a gas turbine combustor and builds a case for the necessity of a design
methodology based on proven empirical and semi-empirical co rrelations.
• Chapter 3 gives an overview of technology and terminology used in the gas
turbine field w ith particular emphasis on the combustor.
• Chapter 4 gives details of the design methodo logy used to design a lean premixed ,
prevaporized microturbine combustor.
• Chapter 5 presents design details of the microturbine combustor which has been
developed from the methodology described in Chapter 4
• Chapter 6 focuses on the combu stor manufacturing process.
• Chapter 7 centres on the comm issioning of the gas turbine combustion research
laboratory.
• Chapter 8 presents instrumentation calibration and shakedown test results.
• Chapter 9 gives the thesis conclusions and recomm endations.

8/12/2019 Development of a Design Tool for Modern Gas
http://slidepdf.com/reader/full/development-of-a-design-tool-for-modern-gas 41/380
2 L I T E R A T U R E R E V I E W
This chapter first gives a general overview of different compu tational approaches that
can be used as design tools for the development of gas turbine combustors. After having
reviewed the various approaches, the author emphasizes the need for the development of
a computationally efficient design methodology for the preliminary sizing of a gas
turbine combustor. The chapter then gives reasons for the necessity of developing and
constructing a gas turbine combustion research laboratory. In conclusion, the chapter
summarizes sources considered during the design of the above mentioned gas turbine
combu stion research laboratory.
2 .1 C o m b u s t i o n M o d e l l i n g
Until recent years, the gas turbine combustor was the least understood engine
component in comparison to other engine parts, namely the compressor and turbine. This
was due to the fact that students and engineers did not have the opportunity to study all
the relevant engineering courses to understand and design a gas turbine com bustor. In the
past, combustor design has been referred to as a "black art" (Mattingly, 2002) since new
combustor designs were developed from previously established combustor geometries
through a trial-and-error approach (Dodds and B ahr, 1990).
Presently, combustion theory and gas turbine combustor design have greatly
progressed thanks to years of research which translated into a better understanding o f the
subject, and the availability and affordability of computers and software which allow to
conduct "numerical experiments" without incurring exorbitant developmental and testing
costs. Furthermore, constant pressure in meeting more stringent emissions regulations
11

8/12/2019 Development of a Design Tool for Modern Gas
http://slidepdf.com/reader/full/development-of-a-design-tool-for-modern-gas 42/380
12
compelled engine manufacturers to constantly develop leading edge technologies and to
persistently evolve the com bustor design.
Recently published gas turbine combustion papers show that computer modelling and
experimental work play a crucial role in the development of new combustor designs.
Computer models, dealing with reacting flows, are based on the following four
fundamental principles; 1) conservation of fluid momentum, 2) mass conservation, 3)
energy conservation and 4) conservation of number of moles of each of the elements
present in the initial reacting mixture. In theory, these physical principles are expressed
through integral equations or partial differential equations whose solutions are an infinite
continuum of values throughout some domain.
To numerically solve these expressions through the use of computers, the governing
equations are converted, through the introduction of some simplifying assumptions, into
algebraic equations that can be numerically solved. This conversion process is also
known as discretization. The discretized equations are solved by the computer and
provide a finite num ber of discrete points or volum es within the dom ain. Graphically, the
discretization process can be regarded as a geometrical grid, also called a mesh, which
has been shaped by the solution of each discrete point or volume (Anderson, 1995).
Discretization techniques can be carried out by using a finite difference, a finite
volume and a finite element method. For more detailed information on the topic, the
reader is encouraged to look at work published by Anderson (1995) and Hansen et al.
(2005).
There are various commercially available software which employ the above
mentioned techniques and which can be used as design tools for combustor modelling.

8/12/2019 Development of a Design Tool for Modern Gas
http://slidepdf.com/reader/full/development-of-a-design-tool-for-modern-gas 43/380
13
Depending on the modelling approach, these software can be divided into two categories;
1) computational fluid dynamics (CFD) models or 2) chemical reactor models (CRJVI).
The following sections will briefly present an overview of recently published CFD
and CRM work, focusing particularly on turbulent reacting flows which are the
foundation of gas turbine combu stors.
2.1.1 CFD Mo delling
Gas turbine combustion is characterized by turbulent flow behaviour due to the high
Reynolds numbers at which the process occurs. Therefore, CFD simulations must predict
turbulent flows by modelling turbulent transport (diffusion) and the interaction between
chemical reactions and turbulent fluctuations. Two commercially available software that
1 9
can do this are FLU ENT and ANSY S CFX . However, regardless of the software used,
the process to solve CFD problems is shown in Figure 2.1 .
MathematicalModel
Development
IGeometricModeling
Mesh Generationand
Enhancement
IApply Numerical
Approximation
Obtain Numeri
cal Solution,
Verify/Validate
Figure 2.1 CFD modelling process outline (Hansen et al., 2005)
ANSYS, Inc. 10 Cavendish Court Lebanon, NH 03766 U.S.A
ANSYS, Inc. Southpointe 275 Technology D rive, Canonsburg, PA 15317 U.S.A

8/12/2019 Development of a Design Tool for Modern Gas
http://slidepdf.com/reader/full/development-of-a-design-tool-for-modern-gas 44/380
14
In Figure 2. 1, two factors that greatly influence the outcome of a CFD simulation are
the quality of the mesh generated and the numerical technique used. Recently published
CFD work focuses on the trade-offs between mesh enhancement, adequacy of the
numerical technique used and computational costs. A typical example of this type of
studies is published by Schneider e t al. (2007).
Mesh enhancement deals with the improvement of computability and numerical
accuracy of the numerical simulation. The term computability, also referred to as
robustness, usually relates undesirable mesh characteristics to the ability of a particular
simulation to proceed to completion.
Mesh enhancement is handled through the type of discretization method used. Gas
turbine combustor simulations, which must describe complex physical processes that
evolve in a turbulent and unsteady manner, use mainly the finite volume method and,
more recently (Anderson, 1995), the finite element method as discretization techniques.
The finite volume and finite element methods, as opposed to the finite difference method,
are more readily utilized since they do not require a uniform, rectangular grid (structured
grid) for computation (Anderson, 1995). Unstructured meshes allow for maximum
flexibility in combining mesh cell with combustor surface boundaries (Figure 2.2).
Furthermore, as can be seen from Figure 2.2, unstructured meshes allow cells to be put in
locations that are deemed critical. This is a very important aspect of unstructured grids
since the fluid dynamics of combustors is a combination of confined swirled flows with
multiple recirculation zones and reattachmen ts points.

8/12/2019 Development of a Design Tool for Modern Gas
http://slidepdf.com/reader/full/development-of-a-design-tool-for-modern-gas 45/380
15
Figure 2.2 Combustor liner unstructured surface mesh (Chok, 2003)
Another aspect of interest in CFD simulations is the numerical technique used and the
effect of the model on computational time. There is an ample selection of such models
outlined in literature. In particular, books written by Fox (2003) and Hewitt and
Vassilicos (2005) give detailed explanations on models currently used in turbulent
reacting flows.
The following paragraphs introduce only some of the main classes of numerical
techniques dealing w ith turbulent reacting flows, since covering the large variety of such
numerical approaches described in the literature would require a thesis of its own.
The first numerical technique presented, namely direct numerical simulation (DNS),
can be used to solve turbulent com busting flows. W hen high accuracy is required (above
the 10th order) (Hewitt and Vassilicos, 2005), DNS methods are usually discretized
through the finite difference method. However, DNS simulations are often limited to
simplified studies due to its extensive computational time. The computational costs are
related to the fact that the DNS approach captures all of the relevant scales of turbulent
motion. As mentioned by Hewitt and Vassilicos (2005), simulation of a turbulent flame

8/12/2019 Development of a Design Tool for Modern Gas
http://slidepdf.com/reader/full/development-of-a-design-tool-for-modern-gas 46/380
16
by DNS would require an order of 106 grid nodes per mm3 of flame, since the orientation
and position of the flame is a random function of time with respect to any fixed grid.
These extremely fine computational grid cells translate into prohibitive computational
costs, even with today's great enhancement in computer power and memory storage.
Another numerical technique is large eddy simulations (LES). In LES, the smaller
eddies are filtered and are modeled using a sub-grid scale model, while the larger energy-
carrying eddies are simulated. This method generally requires a more refined mesh than
the Reynolds-average Navier-Stokes (RAN S) m odel, presented next, but has a far coarser
mesh than a DNS solution.
The oldest approach to turbulence modelling is the Reynolds-average Navier-Stokes
equations. Reynolds averaging is used to separate the Navier-Stokes equations into mean
(time averaged) and fluctuating components. This allows for the creation of a time
averaged (also known as ensemble averaged) version of the governing equations that can
be numerically solved. Detailed description of this computational method is beyond the
scope of this thesis and more information on the topic can be found in Poinsot and
Veynante, 200 1.
The reader should be aware, however, that RANS models are divided into two broad
approaches, namely the Boussinesq hypothesis and the Reynolds stress model (RSM).
Work carried out by Jiang and Campbell (2005 and 2007) indicates that RSM models
have superior performance when compared to models founded upon the Boussinesq
hypothesis, in particular the k-s model. The higher accuracy of RSM come s from the fact
that this model accounts for the anisotropic effect of turbulent flow, whereas the k-e
model considers the turbulent viscosity as an isotropic scalar quantity (Chok, 2003,

8/12/2019 Development of a Design Tool for Modern Gas
http://slidepdf.com/reader/full/development-of-a-design-tool-for-modern-gas 47/380
17
FLU EN T, 1998). Since, for highly swirled flow situations, the anisotropy of turbulence is
the dominant effect, the Reynolds stress model w ould be the preferred solving technique
for gas turbine combustor CFD work. Nevertheless, the drawbacks to this model, as
mentioned in the FLUENT 5 manual, are that RSM requires 50% to 60% more CPU
(central processing unit) time per iteration and needs 15% to 20 % more mem ory
compared to the k-s models (FLUENT, 1998).
The last type of numerical technique to be considered here is the hybrid model.
Hybrid models are researched and developed to achieve an optimal compromise between
robustness, numerical costs and physical accuracy. An example of one such model is the
detached eddy simulation (DES). DES is a modification of the RANS model. With this
modification, the DES technique switches to a subgrid scale formulation in regions fine
enough for LES calculations. Regions near solid boundaries and where the turbulent
length scale is less than the maximum grid dimension are assigned the RANS mode of
solution. The ability to switch between LES and RAN S allows for a grid resolution w hich
is not as demanding as pure LES, thereby considerably cutting down on the cost of the
computation.
In conclusion, the challenges to overcome when using CFD as a design tool are
selecting the adequate m esh as well as choosing the best nu merical technique for the type
of application at hand. In addition, a compromise between robustness, computational
costs and physical accuracy must also be attained. A way to avoid the aforementioned
constraints is by using chemical reactor model (CRM ) as the design tool for developing a
gas turbine com bustor, as will be discussed in the next section.

8/12/2019 Development of a Design Tool for Modern Gas
http://slidepdf.com/reader/full/development-of-a-design-tool-for-modern-gas 48/380
18
2.1.2 Reactor Theory M odelling
As previously mentioned, solving combustion flows in detail through CFD can be
computationally costly. Therefore, since there are stringent emission regulations on the
formation of pollutants, such as oxides of nitrogen (NO x = NO +NO2), carbon monoxide
(CO) and carbon dioxide (CO2), another modelling method, chemical reactor model
(CRM) which is based on reactor theory, can be employed. Using CRM, reactor theory
can predict emissions, through simplified versions of physics and chemistry governing
equations, without solving combustion flow dynamics. Hence, computational time is
drastically reduced. In other words, reactor theory can decouple fluid dynamics from
detailed chemical kinetics analysis, therefore, cutting down greatly on computational
costs.
Chemkin , a commercially available software, has been developed on the basis of
reactor theory, and can be used as a design tool for gas turbine combustors. Another
software based on reactor theory, which also could be used as a design tool for
combustion design purposes is Cantera4. However, Cantera, unlike Chemkin, is available
at no cost to the pu blic.
The simplest idealized form of a gas turbine combustor, using reactor theory, is the
Bragg comb ustor (Mattingly et al, 2002). The Bragg combustor (Figure 2.3) is composed
of a well stirred reactor (WSR), also referred to as a perfectly stirred reactor (PSR), in
which inflowing reactants are vigorously mixed together and come into contact with
previously burned gasses. The Bragg combustor is also made up of a plug flow reactor
3 Reaction Design, 6440 Lusk Boulevard, Suite D-205, San Diego, CA 92121, U.S.A4 http://sourceforge.net/projects/cantera/
8/12/2019 Development of a Design Tool for Modern Gas
http://slidepdf.com/reader/full/development-of-a-design-tool-for-modern-gas 49/380
19
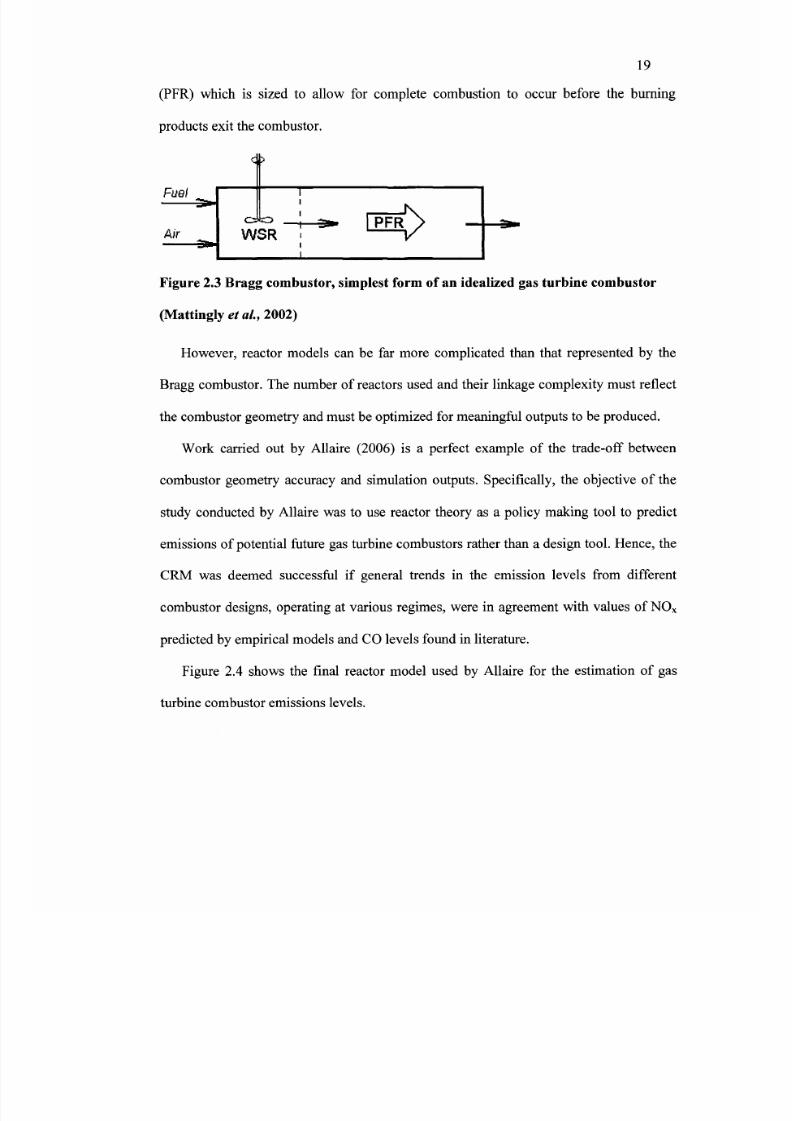
(PFR) which is sized to allow for complete combustion to occur before the burning
products exit the comb ustor.
Fuel
Air
Figure 2.3 Bragg combustor, simplest form of an idealized gas turbine combustor
(Mattingly et al., 2002)
However, reactor models can be far more complicated than that represented by the
Bragg comb ustor. The number of reactors used and their linkage complexity must reflect
the combustor geom etry and must be optimized for meaningful outputs to be produced.
Work carried out by Allaire (2006) is a perfect example of the trade-off between
combustor geometry accuracy and simulation outputs. Specifically, the objective of the
study conducted by Allaire was to use reactor theory as a policy making tool to predict
emissions of potential future gas turbine com bustors rather than a design tool. Hence, the
CRM was deem ed successful if general trends in the emission levels from different
combustor designs, operating at various regimes, were in agreement with values of NO x
predicted by empirical models and CO levels found in literature.
Figure 2.4 shows the final reactor model used by Allaire for the estimation of gas
turbine comb ustor emissions levels.

8/12/2019 Development of a Design Tool for Modern Gas
http://slidepdf.com/reader/full/development-of-a-design-tool-for-modern-gas 50/380
20
Inputs
-o-o-
-o-o-o
-o
Dilution
11
1 *\y ^ ^ H
» »Dilution Cooling
T r i i
J—» Outputs
PSRs
Figure 2.4 Idealized gas turbine combustor (Adapted from Allaire, 2006)
Even though in Allaire's study the reactors' configuration is not combustor specific,
the model still had to represent a generic gas turbine com bustor geom etry to better predict
the emissions levels. As can be seen, the complexity of the reactors in Figure 2.4 is far
greater than that of the Bragg combustor. This intricacy would further increase if the
model had to investigate a specific combu stor geom etry.
In addition, the model inputs had to represent parameters and operating conditions
corresponding to present gas turbine engines and had to be able to be modif ied for
projecting future technology. The reactor model inputs are the combustor inlet
temperature and p ressure, the mass flow rate into the com bustor and its partitioning (i.e.,
percentage of combustor inlet flow rate going into dilution and cooling holes), the fuel

8/12/2019 Development of a Design Tool for Modern Gas
http://slidepdf.com/reader/full/development-of-a-design-tool-for-modern-gas 51/380
21
flow rate, the combustor volumes, and how well mixed the fuel and air are before
burning.
The extent of mixing of the fuel and air prior to burning, also referred to as
unmixedness, depends on how vigorously the reactants are mixed and the physical phase
of the fuel used, namely liquid versus gaseous. In general, liquid fuels require longer
mixing times since the liquid fuel droplets have to evaporate before burning can take
place.
Unmixedness has a significant effect on pollutant emissions. The emissions of NO x
and CO , which are dependent on flame tem perature, are highly sensitive to the local fuel-
to-air ratio. As will be explained in more detail in Chapter 4, the fuel-to-air ratio
determines the temperature of the flame, which in turns establishes the amount of
pollutant formation during the combustion process.
Within the volume occupied by the PSRs, which represent the primary zone of a
combustor, the fuel-to-air ratio varies from point to point (hence the use of multiple
PSRs). Some areas of the primary zone will contain more fuel than air (fuel-rich zones),
others will have less fuel than air (fuel-lean zones) and some zones will have
stoichiometric fuel-to-air ratios where a sufficient amount of air is present for all the fuel
to completely burn. The variation in the fuel-to-air ratios is due to the fact that in a
conventional gas turbine combustor, as was in the case of Allaire, the fuel is sprayed and
mixed, in the combustor primary zone, with air under highly turbulent and random
conditions.
In reactor theory, the unmixedness in the primary zone can be approximated by a
normal distribution about some mean equivalence ratio (Rizk et ah, 2002) where, by

8/12/2019 Development of a Design Tool for Modern Gas
http://slidepdf.com/reader/full/development-of-a-design-tool-for-modern-gas 52/380
22
definition, the equivalence ratio is the fuel-to-air ratio at stoichiometric conditions
divided by the fuel-to-air ratio that is actually burned (see Section 3.5 for details).
In the study, Allaire determined that 16 PSRs represented adequately the
unmixedness distribution of the primary zone and that a further increase in number of
PSRs used in the model had no significant impact on the emissions of N Ox and CO.
The remainder of the reactor model was comprised of plug flow reactors which were
sized to allow for completion of the burning process while taking into consideration
dilution and cooling.
The output of the m odel, as previously m entioned, is to predict pollutant em issions of
potential future gas turbine combu stors. More precisely, the model estimates the ratio of
grams of a particular pollutant to kilograms of fuel burned. These ratios are know n as the
emissions index (EI). Therefore, even for a detailed reactor model, the outputs of CRM
simulations do not provide any fluid dynamics information. Furthermore, these outputs
are greatly influenced by combustor geometry (reactors volume) and by the presumed
fluid dynamics (dilution and cooling flow rates). For these reasons, studies like that of
Russo et al. (2007) combined both CFD and CRM computational tools to create an
acceptable compromise between computational time efforts and accuracy of results that
satisfy both the fluid dynamics and the chemical kinetics aspects.
2.1.3 Em pirical and Sem i-empirical Design Method ology
As can be deduced from the above brief introduction of current computational
models, whether using CFD or CRM simulations, a preliminary knowledge on the design
of the gas turbine combustor under investigation is indispensable. Regarding CFD
simulations, as seen in Figure 2. 1, the final combustor design is achieved through an

8/12/2019 Development of a Design Tool for Modern Gas
http://slidepdf.com/reader/full/development-of-a-design-tool-for-modern-gas 53/380
23
iterative process. Hence, starting with an accurate preliminary combustor design can
therefore reduce the amount of CFD iterations needed in meeting the design
specifications, thus minimizing the overall computational time of this already expensive
process. The appropriate combustor design is even more critical in CRM simulations. As
was seen from Allaire's work, the outputs of CRM models can only give meaningful
predictions if the proper combustor geometry is investigated.
Therefore, the above shows the need for a design methodology based on established
empirical and semi-empirical correlations that, without prohibitive computational costs,
permits designing a gas turbine com bustor that meets specific engine requirem ents.
2 .2 M a n u f a c t u r i n g o f C o m b u s t o r a n d G a s T u r b i n e C o m b u s t i o n
R e s e a r c h L a b o r a t o r y
The manufacturing of the combustor, developed from the above mentioned
methodology, and the design and construction of the gas turbine combustion research
laboratory required knowledge in various engineering fields based on aerodynamic,
thermody namic, metallurgical, manufacturing and electrical knowledge.
Safety considerations also played a large role in the manufacturing of the combustor
and gas turbine combustion research laboratory.
The selection of high temperature materials for the construction of the combustor and
the gas turbine combustion research laboratory were aided by material science books like
Nickel, Cobalt, and Their Alloys by Davis (2000) as well as previous work experience of
the author.
The manufacturing techniques used in the building of the combustor and the research
laboratory were determined by the author's background experience, manufacturing

8/12/2019 Development of a Design Tool for Modern Gas
http://slidepdf.com/reader/full/development-of-a-design-tool-for-modern-gas 54/380

8/12/2019 Development of a Design Tool for Modern Gas
http://slidepdf.com/reader/full/development-of-a-design-tool-for-modern-gas 55/380
25
The design of the gas turbine combustion research laboratory w as aided greatly by the
theoretical knowledge gained on gas turbine engines through courses like those offered
by Carleton University and books such as those of Saravanamuttoo (2001) and Boyce
(2006). In addition, the design modification and safe operation of the gas turbine engine
(Allison 250-C20B) present in the laboratory was aided by operational and maintenance
manuals specific to the just mentioned en gine.
In conclusion, the design and construction of the combustor and gas turbine
combustion research laboratory were based on knowledge gained from various
engineering fields and, in particular, on the investigation of current gas turbine
combustion research.
The successful completion of the entire research project relied ultimately on careful
planning, attention to details and hours of shakedo wn testing.

8/12/2019 Development of a Design Tool for Modern Gas
http://slidepdf.com/reader/full/development-of-a-design-tool-for-modern-gas 56/380
3 T E C H O N O L O G Y A ND T E R M I N O L O G Y
The first section of this chapter gives an overview of a gas turbine en gine used for
electrical power generation. More specifically, it describes how a gas turbine works and
the major compon ents that comprise such an engine. The chapter then focuses on the
combustor, one of the major co mponen ts making up a gas turbine engine . The chapter
introduces terminology used to describe comb ustors and the combustion process.
3.1 Ga s Tu rbin e Lay out and Cycle Analysis
This section will give an overview of a gas turbine engine used for electrical power
generation, with particular em phasis on the combu stor. Figure 3.1 shows the layout of the
engine as well as the temperature versus entropy diagram (T -s diagram) of the gas turbine
cycle (Brayton cycle) (Gauthier, 2005).
In a simple cycle gas turbine engine, the air enters the engine through the intake (1 in
Figure 3.1) and it then travels through the compressor where the air gets pressurized (2 to
3 in Figure 3.1). The pressurized air is then discharged via a diffuser into the combustor
(3 in Figure 3.1). The comb ustion section is made up of a casing (outer shell) and a liner.
The air enters the combustion liner through a series of holes. Once in the liner, the air is
mixed with fuel which is sprayed via a fuel nozzle and ignited by a spark igniter. The
combustion products then leave the combustor to enter the turbine section (4 in Figure
3.1) where they are expanded and useful work is extracted. This useful work is then
converted into electrical power by a generator. After the combustion products are fully
expanded, they exit the engine through an exhaust (5 in Figure 3.1).
26

8/12/2019 Development of a Design Tool for Modern Gas
http://slidepdf.com/reader/full/development-of-a-design-tool-for-modern-gas 57/380
27
In the T-s diagram, the compression process is represented by the curve going from
Station 2 to Station 3. Combustion, at nearly constant pressure, corresponds to the curve
delimited by Stations 3 and 4 and finally, the expansion process is shown by the curve
between Stations 4 and 5. The temperature increase, going from the combustor inlet
temperature (Station 3) to the turbine inlet temperature (TIT) (Station 4), is due to the fact
that combustion is an exothermic process where the chemical energy contained in the
flammable mixture is released in form of thermal energy (heat). In particular, when
looking at Figure 3.2 and Figure 3.3, it can be seen that the engine efficiency and fuel
consumption are dependent on TIT and engine pressure ratio. The rise in TIT is limited
by the materials and type of cooling techniques used in the engine hot section
comp onents, such as the combustor liner, nozzle guide vanes and turbine b lades.
As previously mentioned, the combustion process occurs at almost constant pressure.
One of the aims in the design of a combustor is to minimize its parasitic pressure loss. A
high combustor pressure loss would translate in a loss of useful work that could be
extracted by the turbine.
In addition to the above, other combustor design requirem ents are (Lefebvre, 1999):
• High comb ustion efficiency
• Wide stability limits
• Low emissions
• Durability (of combustor as well as compo nents downstream of combustor such
as high pressure nozzle guide vanes and high p ressure turbine blades)
• Manufacturability
• Maintainability

8/12/2019 Development of a Design Tool for Modern Gas
http://slidepdf.com/reader/full/development-of-a-design-tool-for-modern-gas 58/380
• Low cost
Multifuel capability
TnlrtCombnstor
Compressor Turbine
Exhaust
1600'
UCOH
12QQ-
10QCH
800H
600-
4t»
wo± 0
a3 A .6
ErtfopylkJWgK)]
ElectricGenerator
1
b1.2
Figure 3 .1 T -s d iag ram fo r s imple cyc le gas tu rb ine used fo r e lec t r ica l power
generation (Top: Adapted from R olls-Royce p ic, 1996; Bottom: Kurzke, 2005)

8/12/2019 Development of a Design Tool for Modern Gas
http://slidepdf.com/reader/full/development-of-a-design-tool-for-modern-gas 59/380
29
0.5
0.4
•g 0.3
sS Iab 0.2
H
0.1
T IT = 1000 K
TIT = 1500 K
^ \ T IT = 1400 K
N. TI T = 1300 K
X TI T = 1200 KTIT = 1100
0.0
0 5 10 15 20 25 30 35 40 45 50
Pressure Ratio
Figure 3 .2 Effect of pressure ratio and TIT on cycle therm al eff ic iency
0.30
0.25
v0.20
1»0.
ub-
15
0.10
0.05
0.00
TI T = 1000 K
/ TIT=110(
TIT
)K /
= 1200 K
TI T = 1300 K
TI T = 1400 K
TI T = 1500 K
5 10 15 20 25 30 35 40 45 50
Pressure Ratio
Figure 3 .3 Effect of pressure ratio and TIT on specif ic fuel consumption

8/12/2019 Development of a Design Tool for Modern Gas
http://slidepdf.com/reader/full/development-of-a-design-tool-for-modern-gas 60/380
3.2 Combustion Flame Types
To achieve combustion, a gaseous or prevaporized fuel must be mixed with an
oxidizer as shown in the following chemical reaction (G authier, 2005 ).
Fuel + Oxidizer => Combustion Products + Heat (3-1)
Flames can be defined as premixed flames or diffusion flames depending on whether
the fuel and ox idizer are mixed prior to entering the com bustor or are mixed by diffusion
within the combustor. Furthermore, depending on the burning velocities, i.e., the rate at
which a plane combustion wave will propagate through a gaseous flammable mixture
(Lefebvre 1999), the above mentioned flames can be additionally classified as laminar or
turbulent.
3.3 Flame Temperature
Depending on the context, the flame temperature is the actual measured temperature
of the flame or a value which as been calculated through mathematical expressions
(Lefebvre, 1999). When calculated, the flame temperature is usually referred to as
adiabatic flame temperature {T ) . The term adiabatic (no heat transfer to the
surroundings) implies that the chemical energy contained in the flammable mixture is
released as thermal energy (exothermic reaction) which is completely used in heating the
combustion products.
3 . 4 S t o i c h i o m e t r y
For a generic hydrocarbon fuel mixed with an oxidizer such as air (C-H-O-N system),
the stoichiometric chemical equation is given by (Turns, 2000):
30

8/12/2019 Development of a Design Tool for Modern Gas
http://slidepdf.com/reader/full/development-of-a-design-tool-for-modern-gas 61/380
C H +a(02 + 3 . 7 6 N J = > x C 0 2 +fy^
v ^ y
H 2 0 + 3 . 7 6 a N 2
31
(3.2)
The above chemical reaction assumes that air is composed of 2 1% oxygen and 79%
nitrogen (Turns, 2000) and a is defined as,
a = x +(y)UJ
(3.3)
Stoichiometry is achieved when a sufficient amount o f oxidizer is present for all the
fuel to completely bum. The stoichiometric fuel-to-air ratio can be expressed as (Turns,
2000):
( Air \ M.= 4.76 a
yFuel ;s t o i c h M
(3.4)
/
where Ma is the molecular weight of air
Mj is the mo lecular weigh t of fuel
3 . 5 E q u i v a l e n c e R a t i o
By definition the equivalence ratio is the ratio of fuel-to-air at stoichiometric
conditions divided by the ratio of fuel-to-air that is actually burned (Turns, 2000).
Air
Fuel' Stoich
Air
Fuel
(3.5)
s Actual
Fuel-lean mixtures have equivalence ratios less than unity (0 < 1). Fuel-rich mixtures
have equivalence ratios higher than unity (<j) > 1) . An equivalence ratio equal to one
indicates a stoichiometric m ixture ((/) = 1).

8/12/2019 Development of a Design Tool for Modern Gas
http://slidepdf.com/reader/full/development-of-a-design-tool-for-modern-gas 62/380
32
3.6 Flam ma bil i ty Limits
The lower flammability limit, also known as the weak or lean limit, corresponds to
the minimum amount of fuel which will make the mixture flammable. At the other
extreme, the point at which the reactive mixture will stop burning is called the upper
flammability limit or rich limit. This is reached when too much fuel is added to the
oxidizer. For many fuels, the weak limit corresponds to an equivalence ratio of
approximately 0.5, whereas the rich limit corresponds to an equivalence ratio of 3
(Lefebvre, 1999).
3.7 Stability Lim its
Stability, in gas turbine combustion terminology, is frequently used either to describe
the range of fuel-to-air ratios over which stable combustion can be achieved, or as a
measure of the maximum air velocity the combustor can tolerate before flame extinction
occurs (Lefebvre, 1999). For example (see Figure 3.4), for a fixed air flow rate, the
equivalence ratio can be increased or decreased to reach points which can extend beyond
the stability loop. At the points beyond the stability loop, along the vertical axis A, the
mixture can no longer react and flame blowout will occur. Similarly, with a fixed
equivalence ratio, an increase in air flow rate would move the combustor operating point
horizontally along axis B. In this case, a point outside the stability loop would indicate
that the flame has been swept downstream and blowoff has occurred. Lastly, as can be
seen by Figure 3.4, the most stable point (Point C) will occur close to stoichiometric
conditions. This point corresponds to maxim um flame temperature, maximum burning
velocity and incipient blowoff (maxim um flow rate) (Lefebvre, 1999).

8/12/2019 Development of a Design Tool for Modern Gas
http://slidepdf.com/reader/full/development-of-a-design-tool-for-modern-gas 63/380
33
*.
o s
c
if13 j .*5
Unstable Combustion
IA #
Stability Loop
Stable Com bustion
B
Unstable Combustion
Air Flow Rate
Figure 3.4 Combustion stability loop
3 . 8 A u t o i g n i t i o n
Autoignition, also known as spontaneous ignition, takes place when a combustible
mixture begins to burn in the absence of a concentrated ignition energy source such as a
spark or flame.
3.9 Flashback
Flashback occurs when the burning v elocity, also known as flame speed, exceeds the
approach flow velocity of the gaseous flammable mixture and upstream propagation of
the flame occurs.
3.10 Co mb ustor Nom enclature
The objective of a gas turbine combustor is to convert chemical energy to thermal
energy while meeting the previously m entioned design requirem ents.
The combustor is made up of a casing and a liner, the latter also referred to as a flame
tube (Figure 3.5). The casing may be considered a pressure vessel that encloses the liner
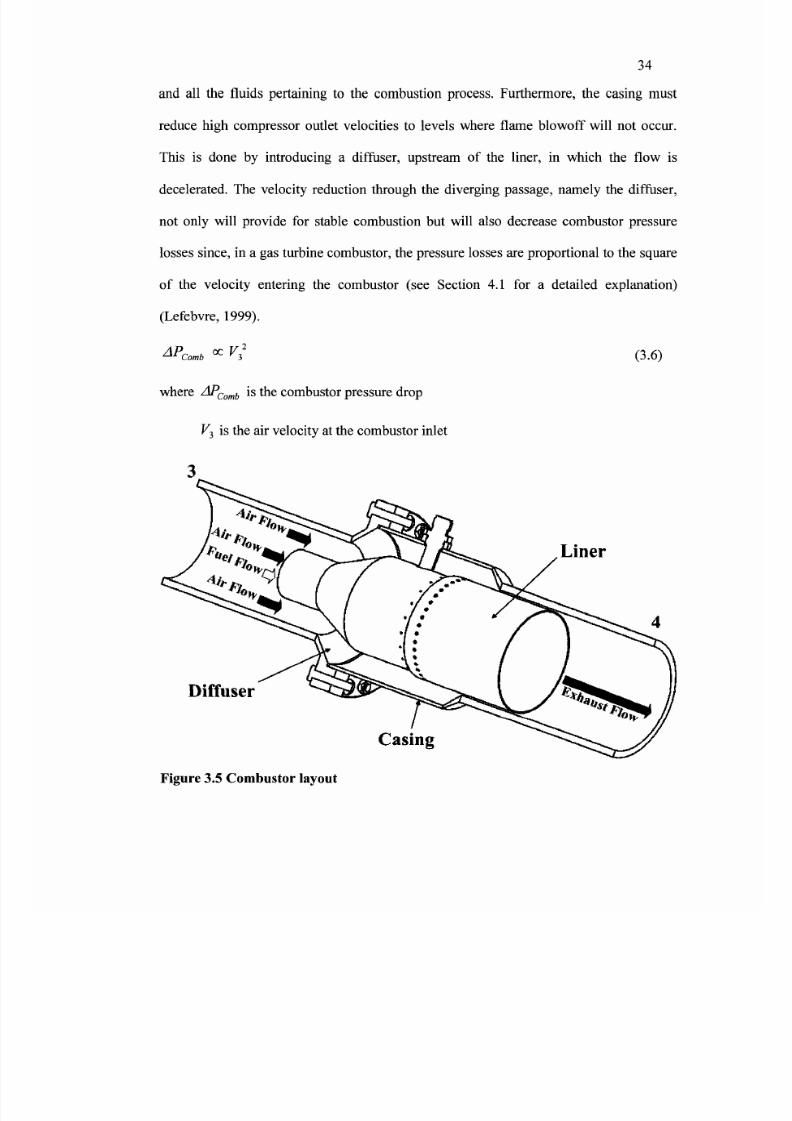
8/12/2019 Development of a Design Tool for Modern Gas
http://slidepdf.com/reader/full/development-of-a-design-tool-for-modern-gas 64/380
34
and all the fluids pertaining to the combustion process. Furthermore, the casing must
reduce high compressor outlet velocities to levels where flame blowoff will not occur.
This is done by introducing a diffuser, upstream of the liner, in which the flow is
decelerated. The velocity reduction through the diverging passage, namely the diffuser,
not only will provide for stable combustion but will also decrease combustor pressure
losses since, in a gas turbine combustor, the pressure losses are proportional to the square
of the velocity entering the combustor (see Section 4.1 for a detailed explanation)
(Lefebvre, 1999).
(3.6)P C o m b * * V
where APComb ls m e combustor pressure drop
V 3 is the air velocity at the com bustor inlet
fat
Ut
^hty**
«<*&
Mf° H r
* • * ? «° * j
Liner
Diffuser
Figure 3.5 Combustor layout

8/12/2019 Development of a Design Tool for Modern Gas
http://slidepdf.com/reader/full/development-of-a-design-tool-for-modern-gas 65/380
35
Primary Zone-Secondary
ZoneA—Dilution Zone— W
©
oooo
9
9
O
O
O
O
99
oooo
C om bustion- -Di ut ion-
Figure 3.6 Conventional combustor zones
The role of the liner is to facilitate combustion and to contain hot combustion
products.
In a conventional combustor the liner, is comprised of three areas called primary,
secondary and dilution zones (Figure 3.6). By design the primary zone must anchor the
flame and provide enough time, turbulence and temperature for the combustible mixture
to efficiently burn. The secondary or intermediate zone allows for the combustion process
to terminate. The scope of the dilution zone, also known as the tertiary zone, is to ensure
that the combustion exhaust gasses have a temperature distribution that is satisfactory for
the turbine (see Section 4.5.3 for more dilution details).
In a conventional combustor, the liner (Figure 3.7) is made up of a snout, dome,
swirler, injection holes, cooling devices and a fuel nozzle(s) which injects fuel directly
into the primary zo ne.

8/12/2019 Development of a Design Tool for Modern Gas
http://slidepdf.com/reader/full/development-of-a-design-tool-for-modern-gas 66/380
36
Fuel Injector Injection Holes
Swirler Cooling Devices
Figure 3.7 Conventional combustor liner
In a lean-premixed combustor, hereafter referred to as a premixed combustor, fuel is
injected and mixed with air within a premixer fitted to the liner prior to entering the
primary zone (Figure 3.9). Since the mixing of fuel and air is begun before entering the
primary zone, the combustion process terminates within the primary zone. Hence, when
compared to a conventional combustor, a premixed combustor has only two areas,
namely the primary and the dilution zones (Figure 3.8). The primary zone must anchor
the flame and provide enough time, turbulence and temperature for the combustible
mixture to efficiently and completely burn. The dilution zone must ensure that the
combustion exhaust gasses have a temperature distribution that is satisfactory for the
turbine.

8/12/2019 Development of a Design Tool for Modern Gas
http://slidepdf.com/reader/full/development-of-a-design-tool-for-modern-gas 67/380
37
PrimaryZone
DilutionZone
NHCombustion-#i# -Dilution-
Figure 3.8 Premixed combustor zones
Fuel Injector
Figure 3 .9 Premixed comb ustor l iner

8/12/2019 Development of a Design Tool for Modern Gas
http://slidepdf.com/reader/full/development-of-a-design-tool-for-modern-gas 68/380
38
3.11 Com bustor Types
When taking into consideration the geometry of the combustor, the four most
common designs are; 1) the can, 2) multi-can, 3) can-annular and 4) annular
configurations (Figure 3.10) (Rolls-Royce, 1996). Can com bustors, also know n as tubular
comb ustors, have cylindrical liners and casings. A gas turbine engine can contain one can
combustor or multiple can combustors (multi-can). Annular combustors have a single
annular liner and a concentric annular casing. Can-annular combustors are a combination
of the two designs described above. This type of combustor, also called a tuboannular
combustor, has a series of cylindrical liners enclosed within an annular casing.
Can Combustor Multi-can Combustor
Can-annular Combustor Annular Com bustor
Figure 3.10 Common combustor configurations (Adapted from Rolls-Royce, 1996)

8/12/2019 Development of a Design Tool for Modern Gas
http://slidepdf.com/reader/full/development-of-a-design-tool-for-modern-gas 69/380
39
Aerodynamically, combustors are divided as (Peters and Hammond, 1990):
• diffusion flame com bustors, also called conve ntional com busto rs, whe re the fuel
and oxidizer are injected and mixed w ithin the primary zone ;
• premixed combu stors where the fuel and oxidizer are injected and mixed before
they enter the combustor primary zone;
• staged com bustors wh ere, in addition to the prim ary fuel injector (main stage),
supplementary fuel nozzles (pilot stage) are employed to provide better
combustion stability and lower pollutant emissions throughout the various engine
power settings; and
• catalytic combustors where combu stor stability, in very lean fuel mixtures, is
improved by the inclusion of a catalytic stabilizer whose main function is to
reduce the concentrations of carbon monoxide (CO) and unburned hydrocarbons
(UHC).
The nature of the gas turbine engine application (aerospace, industrial, or vehicular)
will determine the type of combustor to be used. For example, the main concerns in an
aircraft engine are weight and reliability. The selection of an annular combustor will
ensure a low engine cross sectional area and therefore, minimize airplane weight
(Saravanamuttoo, 2001). The reliability of this combustor will be achieved by designing
it to operate well within the stability loop (Figure 3.4) at all operating conditions (i.e.,
from ground to high altitudes).

8/12/2019 Development of a Design Tool for Modern Gas
http://slidepdf.com/reader/full/development-of-a-design-tool-for-modern-gas 70/380
4 D E S IG N M E T H O D O L O G Y F O R T H E P R E L I M I N A R Y D E S IG N
OF A GAS TURBI NE COM BUSTO R
The following chapter will focus on the theory used to develop a methodology
(computer program) to preliminary design a gas turbine combustor to meet given engine
specifications. The program, which is composed of many interlinked subroutines, allows
the user to design a conventional or a premixed (or premixed prevaporized, LPP, for
liquid fuel) combustor that m eets engine requiremen ts.
Figure 4.1 shows the design methodology algorithm. The various subroutines of the
program, symbolized by the rectangular boxes, will be described in more detail in the
following sections.
The programm ing was carried out using the computer software, M athcad5.
5 PTC Corporate Headquarters, 140 Kendrick Street, Needham, MA 02494, U.S.A
40

8/12/2019 Development of a Design Tool for Modern Gas
http://slidepdf.com/reader/full/development-of-a-design-tool-for-modern-gas 71/380
41
Combustor Specifications
iSelection of Com bustor Type(Can, Can-annular, Annular)
ICom bustor Air Flow Distribution
ICombustor Equivalence Ratios
ICasing Reference Area
Liner Area
Combustor Zone Lengths
Dome Sizing
Liner Cooling Estimation
Reassessment of Dilution Zone Size
1Diffuser and Snout Sizing
ISwirler or Prem.ix.er Sizing
Injection Holes Sizing
I
,: * • • • • - , \ * 2
Design of wall cooling
Combustor Preliminary Design
Figure 4.1 Combustor preliminary design algorithm

8/12/2019 Development of a Design Tool for Modern Gas
http://slidepdf.com/reader/full/development-of-a-design-tool-for-modern-gas 72/380
42
4.1 Co mb ustor Prel iminary Design Ap proach
The initial dimensions of a combustor can be determined using either an aerodynamic
approach or a reaction rate (chemical kinetics) approach. The design methodology
presented in this work sizes the combustor implementing the former. This means that the
combustor will be sized to meet a specified pressure loss across it.
The overall combustor pressure drop is comprised of two components; 1) "hot loss",
also known as fundamental loss, and 2) cold loss as shown in the following equation
(Lefebvre, 1999):
A P , u = A P + A P A r 4 nComb hot 3 - 4 V* -1)
The hot loss is defined as:
A P « ^ - 5 -ho t o v T
V 3 J
(4.2)
where p3 is the air density at the combu stor inlet
V 3 is the air velocity at the com bustor inlet
T 3 is the total temperature at the combustor inlet
T A is the total temperature at the combustor outlet
The cold loss is defined as:
pV2
A P A = A P + A P = A P + ^ ^ (4.3)3 - 4 diff L diff 2
where A P is the pressure drop in the diffuser
A P is the pressure drop across the liner

8/12/2019 Development of a Design Tool for Modern Gas
http://slidepdf.com/reader/full/development-of-a-design-tool-for-modern-gas 73/380
43
The "hot loss" ( A P ) represents the loss of the combustor stagnation pressure
associated with the mom entum change produced by the rapid release of energy during the
combustion process (exothermic reaction process) (Saravanamuttoo, 2001 ).
The cold loss ( A F ) consists of the pressure drop in the diffuser ( A P ) and the
pressure drop across the liner ( A P L ). Since the pressure drop in the diffuser is a parasitic
loss, which means that it does not contribute to combustion, it should be minimized. The
pressure loss across the liner, on the other hand, aids combustion in the primary zone,
preserves the combustor structural integrity and ensures that a suitable exhaust
temperature profile is seen by components downstream of the combustor. Combustion in
the primary zone is aided by vigorous mixing of the fuel and the oxidizer. To mix these
reactants, turbulence must be created which in turn results in liner pressure losses. To
ensure combustor structural integrity cooling devices are strategically located throughout
the liner. These devices create drag and therefore additional liner pressure losses. Finally,
dilution holes are also present in the liner. The purpose of these holes is to allow for some
of the air to enter the liner and mix with the hot combustion products to ensure that a
suitable exhaust temperature profile is seen by the nozzle guide vanes and the turbine,
which are located downstream of the combustor. The high velocity and expansion
process as the air flowing through the dilution holes as well as the mixing process with
the hot gasses is the last pressure drop component of the liner. However, even though a
liner pressure drop is vital to the com bustion process, it should also be m inimized so that,
as explained in Section 3.1 , the useful w ork done by the turbine can be maxim ized and
engine performance is not com promised.

8/12/2019 Development of a Design Tool for Modern Gas
http://slidepdf.com/reader/full/development-of-a-design-tool-for-modern-gas 74/380
44
The importance of the diffuser in minimizing the combustor pressure losses can be
appreciated by looking at Equations (4.2) and (4.3). As can be seen, the combustor
pressure loss is proportional to the square of the compressor exit velocity (V ) .
Therefore, as mentioned in Section 3.10, the reduction of high compressor outlet
velocities, through the combustor diffuser, will greatly diminish the combustor pressure
losses.
The preliminary sizing of a combustor using the aerodynamic design approach will
yield a combustor volume that is bigger than the volume given by a chemical kinetic
design. This is because the turbulent mixing rate, which is based on aerodynamic
fundamentals, is not fast when compared to the chemical kinetics rates related to a
combustion system (Sawyer, 1985; Chemkin, 2006).
4 . 2 E q u i v a l e n c e R a t i o E s t i m a t i o n
From previously established engine performance parameters (i.e., power output,
specific fuel consumption, turbine inlet temperature, air and fuel mass flow rates, etc.) the
global equivalence ratio, which is the ratio of fuel-to-air at stoichiometric conditions
divided by the ratio of air entering the combustor to fuel used by the gas turbine, can be
calculated from Equation (3.5) as follows (T urns, 2000):
' Air "
A _ V Fuel JStoich (4 4)
™ global f . \w 3
v mf iv J /Ac tua l
where m is the air mass flow entering the combustor

8/12/2019 Development of a Design Tool for Modern Gas
http://slidepdf.com/reader/full/development-of-a-design-tool-for-modern-gas 75/380
45
m is the fuel mass flow entering the combustor
The primary zone equivalence ratio, Equation (4.5), which is the ratio of fuel-to-air at
stoichiometric conditions divided by the ratio of air entering the com bustor primary zone
to fuel used by the gas turbine, can be expressed, through mathematical manipulation, as
follows:
(h =<h [T )=6 — aY PZ r PZ\ g ) Y global ,„•,lobal ^. (4.5)
PI
However, as can be see from Equation (4.5), the amount of air entering the primary zone
is determined by the combustor flame temperature yg). The methodology used to
estimate the combustor flame temperature is given in the following section.
Similarly, the secondary and dilution zone equivalence ratios can be calculated as:
A =d ^ i _ (4.6)SZ
r global yj.
sz
YDZ ^global rf,
DZ
However, prior to calculating these two ratios, the air flow distribution for the whole
combustor (m D 7 , m„7 and tnn7) must be determined (Section 4.4).
4 . 3 A d i a b a t i c F l a m e T e m p e r a t u r e a n d M i x t u r e M o l e F r a c t i o n s
The fol lowing sect ion presents the methodology used for obta ining the combustor
flame temperature and the mole fractions of major combustion product species. The
program is based on theory found in work pub lished by Turns (2000 ).

8/12/2019 Development of a Design Tool for Modern Gas
http://slidepdf.com/reader/full/development-of-a-design-tool-for-modern-gas 76/380
46
Since gas turbine com bustion occurs at approximately constant pressure and heat loss
is negligible compared to the energy added by the fuel, the flame temperature can be
estimated by the constant pressure adiabatic flame temperature. For an accurate
estimation of this temperature, the dissociation of major species involved in the
combustion process should be taken into account. In high temperature combustion
processes, as found in gas turbines, major species, such as CO2, H2O, O2 and N2
dissociate to produce H2, OH, C O, H, O, N and N O. The dissociation process uses energy
to break molecule bonds and to form new molecules. Therefore, omission of the
dissociation process would lead to an overestimation of the constant pressure adiabatic
flame temperature, since the calculations w ould not take into account the energy loss due
to dissociation.
The program (see Figure 4.2 for algorithm), which is used as a subroutine in the
combustor design methodology, assumes that the C-H-O-N system is a mixture of ideal
gasses, that the air is composed of 21% oxygen and 79% nitrogen and that the fuel is in
its vapour state.
The programm ing aspect was simplified by assuming that heat release reactions occur
much more quickly than those which form NO, that the concentrations of NO, N and O
are very small (parts per million, ppm) and that the concentration of N2 changes very
little. By making these assumptions, the chemical equilibrium composition could be
solved in two steps. The first part of the program calculates the dissociation of the C- H -0
system (no N2 dissociation) and the heat released by the reaction (Tad ). The second part
of the program uses the above outputs to solve for the dissociation of nitrogen (N2) to

8/12/2019 Development of a Design Tool for Modern Gas
http://slidepdf.com/reader/full/development-of-a-design-tool-for-modern-gas 77/380
47
form NO, N and O. The following chemical reactions illustrate the two-step method
approach (Gauthier, 2005):
STEP1
x .C aH pO y + - ^ ( 0 2 + 3 . 7 6 N 2 ) ^ > N C 0 2 C 0 2 + N c o CO + N H 2 0 H 2 0 + .
x„. + N H H 2 + N 0 0 2+ N OH O H + 3.76--S--N2 for <j)< 12 2
§
(4.8)
where N represents the coefficients of product species
r n\
xs-a +
0) (r^
w \^J
(4.9)
An iterative process, described later, is used to simultaneously solve for N c o , N H ,
N 0 H and adiabatic flame temperature (T ).
STEP 2
x„C a H p O ? + - ^ ( 0 2 + 3 . 7 6 N 2 ) ^ N c 0 2 C 0 2 + N c o C O + N H 2 0 H 2 0 + N H 2 H 2 + . . .
. . . + N 0 0 2 + N O H O H + N N O NO + N N N + N 0 0 + N N N 2 for (|><1
Solving for N N 0 , N N , N 0

8/12/2019 Development of a Design Tool for Modern Gas
http://slidepdf.com/reader/full/development-of-a-design-tool-for-modern-gas 78/380
48
Program Inputs
C-H-O-h'System
Temperature r(K),Enthalphy of formation, h, (kJ/kmol)
Program InputsFuel
Temperature, T(K),Enthalphy of formation, h ,- (kJ/kmol)
Program InputsCarbon, Hydrogen, Oxygen Atoms ( a, ji, /),
Kquivalence ratio {$),Combustion efficiency (ty)
Calculation C-H-O-N
molar-based specific heatr„(kJ/kmolK)
Calculation C-H-O-N
molar based absolute enthalpyh (kJ/kmol)
Calculation C-H-O-N
molar based sensible enthalpyAh , (kJ/kmol)
Calculation fuel
molar-based specific heatct, (kJ/kmol K)
Atom Balance
Calculation fuelmolar based absolute enthalpy
h (kJ/kmol)Reaction Coefficients
Calculation fuel molar basedsensible enthalpy
Mi, (kJ/kmol)
6Program InputsTemperature of reactants and products
Trmc: ( K ) . Tpnul ( K )
Calculation o f enthalphy of com bustion,Q(kJ/kg)
Calculation o f higher heating value,HHV(W/kg)
Calculation of lower heating value,LHV (W/kg)
Calculation of constant-pressure adiabatic flame temperature7*, K)
Figure 4.2 Adiabatic flame temperature algorithm
The calculation of the adiabatic flame temperature, ( T a d ), is based on energy
conservation theory which dictates that the absolute enthalpy of the reactants at their
initial states must equal the absolute enthalpy of the products at their final states as shown
below (Turns, 2000):

8/12/2019 Development of a Design Tool for Modern Gas
http://slidepdf.com/reader/full/development-of-a-design-tool-for-modern-gas 79/380
H (T.,P)=H ATJ,P)react \ ; / prod ^ ad '
49
(4.11)
where H is the enthalpy , J
T is the temperature, K
P is the pressure, Pa
The second law of thermodynamics, and in particular, the standard Gibbs free energy
change AGT, allows the calculation of the mixture equilibrium com position for a given
reactant temperature, pressure and equivalence ratio.
AG°T =-RT\n(Kp)
where 7? is the universal gas constant (8.3144 J/mol K)
K is the equilibrium constant, calculated in Equation (4.15).
For a general chemical system, as shown below,
aA+bB +... <-> eE + fF + . . .
the standard-state Gibbs function change ( A G r ) is determined as (Turns, 2000):
(4.12)
(4.13)
AG°T =eg,E + fgf„ + a&f,A °&f,B (4.14)
—owhere g f i is the standard Gibbs free energy of formation for the /th species.
The equilibrium constant K is calculated as (Turns, 2000 ):
K„ = [P°j( P Y
r A
yP°J
( P ^
P°
i= A,B,...E,F. (4.15)
where P is the partial pressure of the /th species

8/12/2019 Development of a Design Tool for Modern Gas
http://slidepdf.com/reader/full/development-of-a-design-tool-for-modern-gas 80/380
50
P is the standard state pressure, 1 atm.
By noting that the p artial pressure (P.) can be expressed in terms of mole fractions, X
Pt = *iP (4.16)
and by substituting Equation (4.15) into Equation (4.12), the equation below can be
yielded (Turns, 2000):
x ' E • xj •etc
X°A • *\ • etC
\ ( e + / + . . . - a - 6 - . . . )
exp\ r j
AG°T
RT(4.17)
Lastly, conservation of elements, Equation (4.13) imposes that the summation of the
mole fractions must equal unity (4.18) (T urns, 2000):
2 > , = 1 (4.18)i
In summary, the solution of Equation (4.11) determines the constant pressure
adiabatic flame temperature and the simultaneous solution of Equations (4.13), (4.17) and
(4.18) solves for the m ixture equilibrium co mposition (i.e., the mixture m ole fractions).
Confidence in the program outputs was obtained through a verification process. The
subroutine verification was carried out by comparing its results with outputs obtained
from HPFLA ME, a FORTRAN program developed by Olikara and Borman (1975) which
also calculates the adiabatic constant pressure flame temperature and the mixture mole
fractions. As can be seen from Figure 4.3 the Mathcad and HPFLAME program results
are in very good agreement.

8/12/2019 Development of a Design Tool for Modern Gas
http://slidepdf.com/reader/full/development-of-a-design-tool-for-modern-gas 81/380
51
2400
2200
g 2 0 0 0
jj 18002 1600
a Moo
« 1200
| 1000
Mathcad (P = 40 bar)
— HPFLAME (P = 40 bar) |
2 0 0 ' i • • •
0 : \ • • • • | • •
0.5 0.6 0.7 0.8 0.9 1Equivalence Ratio, </>
Figure 4.3 Effect of equivalence ratio on adiabatic flame tempera ture
As can be seen from the algorithm (Figure 4.2) and the theory described above, the
calculation of the adiabatic flame temperature and the mixture mole fractions requires a
lengthy program that has to solve many equations simultaneously. A simpler approach,
based on work presented by Giilder (1986), could be found useful for users who are
solely interested in the adiabatic flame temperature or when the combustion work
requires a large amount of program iterations, making the computational time too
expensive. In the publication, Giilder presents em pirical correlations that can estimate the
adiabatic flame temperature through the implementation of a simple formula. Although
not as accurate as the results obtained from chemical equilibrium programs (0.4 to 0.8%
error) (Giilder, 1986), the correlations take into account reactants pressure, temperature,
equivalence ratio, and it can be applied to diesel, gasoline, pure alkanes, aromatics as
.a 800
I 600
% 400

8/12/2019 Development of a Design Tool for Modern Gas
http://slidepdf.com/reader/full/development-of-a-design-tool-for-modern-gas 82/380
52
well as jet fuel. The simplicity and good estimation of this approach makes it very
suitable for preliminary design work.
4 . 4 L i n e r A i r M a s s F l o w R a t e D i s t r i b u t i o n
The drive to reach higher gas turbine performance levels and the adherence to
stringent emissions regulations have caused the design of the combustor to evolve over
the past few decades.
1975 1978 1981 1984 1987 1990Year
1993 1996 1999 2002 2005
Variation in NO with dateX
Figure 4.4 Combustor design evolution (Adapted from Cumpsty, 2003)
Figure 4.4 shows the progression of com bustor design for gas turbine eng ines used in
aircraft applications. The fact that premixed combustors for aerospace usage are still at an
early service stage when compared to gas turbine combustors designed for land-based
power generation is of particular interest. Premixed combustors for aircraft engine

8/12/2019 Development of a Design Tool for Modern Gas
http://slidepdf.com/reader/full/development-of-a-design-tool-for-modern-gas 83/380
53
applications have still practical difficulties (engine reliability from ground to high altitude
operations as well as engine relight problems at high altitude) that need to be addressed
before prem ixing becom es viable for the aerospace industry (Cum psty, 2003).
Combustor design evolution was further investigated by the author by reviewing
combustor design guidelines published in the last 20 years. Revision of design guidelines
published by Sawyer (1985), Kretschmer (2000), Saravanamuttoo (2001), Lefebvre
(1999), Mellor (1990) and Gauthier (2007), not only illustrated how the gas turbine
combustor has evolved, but also provides useful information, like the combustor air flow
distribution, that has been the foundation upon which the design methodology has been
developed.
The air flow distribution of past and more recent combustors, based on the above
references, is presented next.
As a general guideline, for a conventional combustor, Saravanamuttoo (2001)
suggests that approximately 15 to 20% of the total air entering the combustor should be
introduced in the primary zone around the fuel nozzle. Roughly 30% of the total air
should be admitted in the secondary zone and between 50 and 55% should be admitted in
the dilution zone. Similarly, Sawyer (1985) and Kretschmer (2000) indicated that 25% of
the total air entering the combustor should be admitted within the primary zone, 20% in
the secondary zone and 55% (which includes film cooling) in the dilution zone (Figure
4.5). Lefebvre (1999) and Rolls-Royce (1996) indicated that the need for larger quantities
of liner cooling air, to keep up with progressively higher gas turbine pressure ratios,
resulted in am ount of air available for the dilution zone ranging betw een 2 0% and 4 0% of
the total air entering the combustor.

8/12/2019 Development of a Design Tool for Modern Gas
http://slidepdf.com/reader/full/development-of-a-design-tool-for-modern-gas 84/380
54
AWVHWh
j j i j j j > > > j i j i > i > j i * i i j j i j > j * j y
VZZZZZL
H t f t t f i l t f*& ~
77m
25% • 2 0% • 5 5 % *© i O O
PrimaryZone
SecondaryZone
DilutionZone
Figure 4.5 Typical conventional combustor air flow distribution
More recent gas turbine combustion work on conventional combustors, published by
Mattingly (2002), shows that typical primary zone equivalence ratios take into
consideration the formation of pollutants. In fact, the increase in combustor entry and exit
temperatures and pressures allowed reaching combustion stability with lower primary
zone equivalence ratios. In particular, more recent combustors operate with an
equivalence ratio in the primary zone in the order of <j>pz =0.8 or with a target flame
temperature in the range of 1700 K to 1900 K (Mattingly, 2002). As can be seen in
Figure 4.6, within this temperature range the formation of air pollutants such as carbon
monoxide (CO) and nitrogen oxides (NO x) can be minimized.
The above work is in accordance with work published by Lefebvre (1999) which
suggests that the flame tem perature should be kept below 20 00 K.

8/12/2019 Development of a Design Tool for Modern Gas
http://slidepdf.com/reader/full/development-of-a-design-tool-for-modern-gas 85/380
55
| 100
§tftJ 80
©
© 40
1° 2 0
0
iJ Low Emissions i^ .
r Range ( f
f # N O
co\ i /
• • ' i ^ T i i T i
30
25 |
ftft
2 0 S~
e15 |
C M
IO 2
o
01500 1600 1700 1800 1900 2000 2100
Primary Zone T emperature, K
Figure 4.6 Effect of PZ temp erature on formation of pollutants for conventional
combustor (Adapted from Mattingly, 2002)
The air flow distribution for premixed combustors is shown in Figure 4.7. As a
general guideline, for a premixed combustor, Gauthier (2007) suggests that
approximately 60 to 80% of the total air entering the combustor should be introduced in
the primary zone through the premixer. Between 0 to 20% of the total air should be
admitted in the primary zone via injection holes and between 10 to 20% of the total air
should be adm itted in the dilution zon e.

8/12/2019 Development of a Design Tool for Modern Gas
http://slidepdf.com/reader/full/development-of-a-design-tool-for-modern-gas 86/380
56
rf77?V7<
v//////////////.
7X77^
/t/firittififiifitttizzz.0 to20% X
60 to 80%
>;;;;;;;;;;;/7777\
10 to 20%
PrimaryZone
DilutionZone
Figure 4.7 Premixed combustor air flow distribution
4.5 Casing and Liner Sizing
4.5.1 Casing and Liner Area
The first objective in the sizing of a combustor (see Figure 4.8 for nomenclature) is
the determination of the reference area.
r iwi svu
7^
Section A-A
Figure 4.8 Combustor nomenclature
The reference area, A , which defines the max imum casing area, is calculated byref
(Sawyer, 1985; Lefebvre, 1999; Kretschmer, 2000 ):

8/12/2019 Development of a Design Tool for Modern Gas
http://slidepdf.com/reader/full/development-of-a-design-tool-for-modern-gas 87/380
57
Aref ~2
0.5 Ym3 T3
V " 3 J
AP,- 4
««
AP - 4
V * 3 J
0.5
(4.19)
where Aref is the reference area, m2
Ra is the air gas constant, 286.9N m
kgK
w 3 is the mass flow rate at the com bustor inlet,kg
P3 is the total pressure at the combustor inlet, Pa
7/3 is the total temperature at the combustor inlet, K
zlP3_4 is the cold pressure loss, Pa
q re f is the reference dynamic pressure Equation (4.20), Pa
Equation (4.19) contains two important aerodynamic dimensionless parameters.
These parameters are the pressure drop ratio (PD R) and the pressure loss factor (PLF ).
The PDR (A F 3 4 JP ) is the ratio of the total pressure drop across the combustor (A P )
to the combustor inlet total pressure ( P ). The PLF ( A P q ) is the ratio of the total
pressure drop across the com bustor to the reference dynamic pressure ( q f).ef •
q =-pV2
1 re f 9 3 ref (4.20)
where p3 is the air density at the combusto r inlet
Vrej is the reference velocity, Equation (4.21)

8/12/2019 Development of a Design Tool for Modern Gas
http://slidepdf.com/reader/full/development-of-a-design-tool-for-modern-gas 88/380

8/12/2019 Development of a Design Tool for Modern Gas
http://slidepdf.com/reader/full/development-of-a-design-tool-for-modern-gas 89/380
59
GF = 3
3 ref(4.22)
Table 4.2 Geometry factors
Author
Geometry Factor
Multi-can
Annular
Can-annular
Sawyer (1985)
™3 V r 3P i A t
3 ref
3.0xl0"3
4.5 xl(T3
3.5xl(T
3
Kretschmer (2000)
™3 V r 3
3 re/
3.0xl0" 3
4.5 xlO"3
3.5 xlO"
3
Lefebvre (1999)
™3 V r 3P. A .
3 ^ /
3.6xl(T 3
4.6xl0~3
3.9xl0"
3
With the reference area (maximum casing area) calculated, the liner area ( A ) can
now b e estimated, using the following guidelines:
Sawyer (1985) suggests that the liner area should be in the following range:
0 .6 A <A, <0J2A ,ref L ref
(4.23)
The above is in agreement w ith Kretschmer (2000) which presented the liner area to be,
A =0.7A ,L ref
(4.24)
where A, is the liner area, m2
Lefebvre (1999) proposes the following expression:
A =k A ,L opt rej
(4.25)
where k t is the optimal value determined from Equation (4.26)

8/12/2019 Development of a Design Tool for Modern Gas
http://slidepdf.com/reader/full/development-of-a-design-tool-for-modern-gas 90/380
60
"opt
( i - > 0 2 - ^ iff
AR— ~ ^dw AR 2
(4.26)
4rtf
where msn is the ratio of air entering snou t to total comb ustor air flow
/idjf f is the diffuser pressure loss coefficient
AR is the ratio of the outlet to inlet areas of the diffuser
How ever, usage of Equation (4.26) requires more detailed know ledge on diffuser and
snout geometry. More specifically, the ratio of air entering the snout to total combustor
air flowm
sn
v m 3 j, the diffuser pr essure loss coefficient (A ) and the ratio of casing area
to combu stor inlet area ( A R ) must be know n or estimated. Therefore, for the com bustor
design, the methodo logy used Equation (4.24) due to its simplicity.
4.5.2 Ann ulus Area
The annulus area ( A A N ) is the region confined by the casing inner wall and the liner
outer wall (Figure 4.8). With the casing reference area and liner area determined, the
annulus area is calculated as,
A.N=A -ArAN re f L
(All)
4.5.3 Liner Primary, Secondary and Dilution Zone Lengths
The next step in the design process is the calculation of the three zone lengths which
make up the com bustor liner.

8/12/2019 Development of a Design Tool for Modern Gas
http://slidepdf.com/reader/full/development-of-a-design-tool-for-modern-gas 91/380
61
For the primary zone, the length ( L ) is usually found between the following range
(Sawyer, 1985):
-D <L <-D (4-28)2 L P Z A L
where D is the liner diame ter
Noting that a longer primary zone length would give more residence time to the
reacting mixture, and that a longer residence time will in turn lead to higher combustion
efficiency, the primary zone length should be a compromise between combustor
efficiency and engine costs incurred due to a longer combustor.
Lefebvre (1999) propo ses two correlations for sizing the volume of the primary zone.
However, upon review of the suggested expressions, the following conclusions were
drawn:
• for combustors burning heterogeneous mixtures (mixtures which contain fuel in
both gaseous and liquid phases), the correlation was dependent on geometry and
mixing characteristics which were too com bustor specific, and
• the correlation given for the lean premixed prevaporized (LPP) combustor (i.e. a
premixed combustor which uses liquid fuel, hence the term prevaporized)
depends on a constant which, due to scarce data availability, has to be determined
experimentally. Thus, this made the correlation unusable at the present time.
The secondary zone, L should be estimated to be 50% of the liner diameter
(Sawyer, 1985; Kretschmer, 2000 ):
L =-D (4-
29)
SZ 2 L

8/12/2019 Development of a Design Tool for Modern Gas
http://slidepdf.com/reader/full/development-of-a-design-tool-for-modern-gas 92/380
62
The last zone to be sized is the dilution zone. The goal of the dilution zone is to
"shape" the temperature profile of the hot combustion products into an acceptable and
consistent temperature distribution as they are discharged into the high pressure turbine.
The temperature profile of the hot gasses is contoured by the injection and mixing of
cooler air, entering from the dilution holes, with the hot gasses contained within the liner.
The length of the dilution zone, LDZ , is greatly dependent on the pattern factor (Q )
defined by Equation (4.30), which is sometimes also named as the transverse quality
(Lefebvre, 1999):
Q = ^max ~ T4 (4.30)
where Tmax is the maximu m total temperature value at the combustor o utlet
T 4 is the total tempe rature at the combu stor outlet
T 3 is the total temp erature at the com bustor inlet
The pattern factor has a great impact on the life of the stationary nozzle guide vanes and
on the life of the rotating first stage turbine blades. To prolong the life of these
components, the combustor designer must create a combustor that will not have "hot
spots" (localized high gas temperatures) and that will deliver a reasonable variation of
gas temperature profiles in both the radial and circumferential directions. Figure 4.9 and
correlation expressed by Equation (4.31) show how the pattern factor of can and can-
annular combustors is influenced by the liner pressure loss factor and by the liner length
and diam eter.
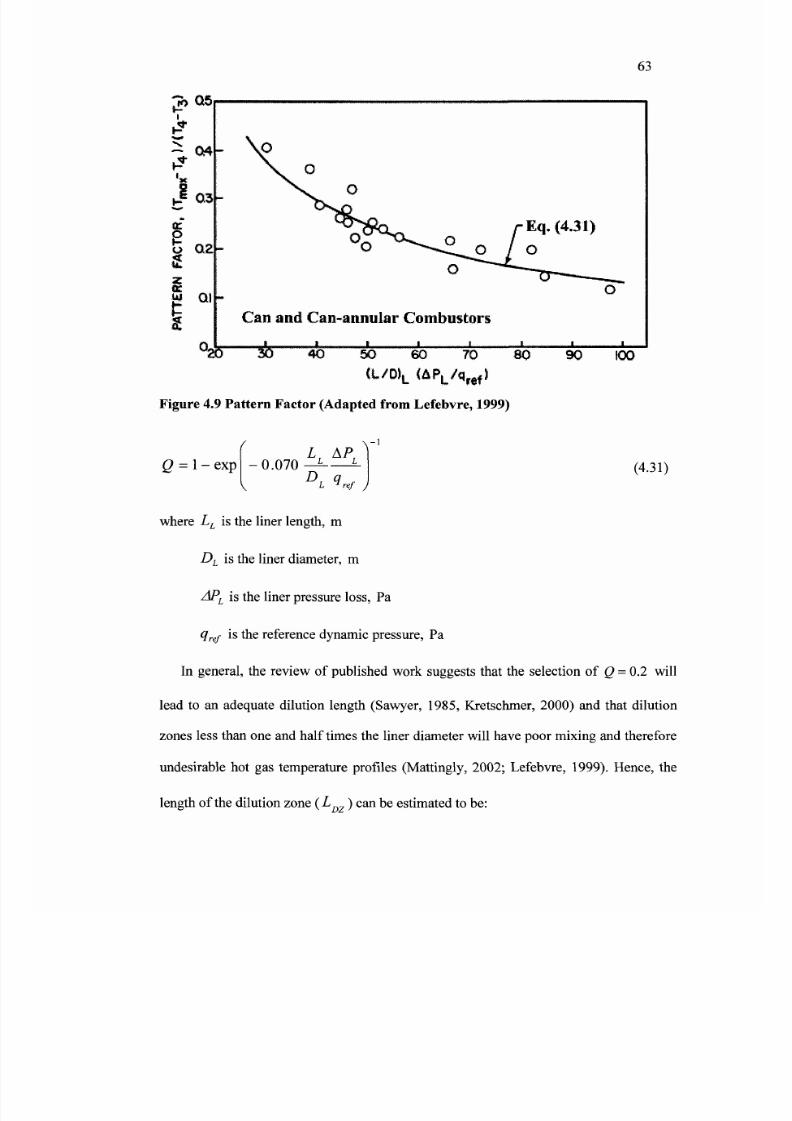
8/12/2019 Development of a Design Tool for Modern Gas
http://slidepdf.com/reader/full/development-of-a-design-tool-for-modern-gas 93/380
63
jh OS
~L 04-
ofotf QZ
z
N Ql
-
-
•**
M*
\ . o
Can and Can-annular Combustors
rEq . (4 .3 I )
/ O
O
-1 A - - -«- - -
~20 30 40 50 60 70 80<L/D>L (A PL /q r e f)
Figure 4.9 Pattern Factor (Adapted from Lefebvre, 1999)
90 100
Q = 1 - expLr A P
0.070 L L
- i
DL 9 ref )
(4.31)
where LL is the liner length, m
DL is the liner diameter, m
APL is the liner pressure loss, Pa
q re f is the reference dynamic pressure, P a
In general, the review of published work suggests that the selection of Q = 0.2 will
lead to an adequate dilution length (Sawyer, 1985, Kretschmer, 2000) and that dilution
zones less than one and half times the liner diameter will have poor m ixing and therefore
undesirable hot gas temperature profiles (Mattingly, 2002; Lefebvre, 1999). Hence, the
length of the dilution zon e ( L ) can be estimated to be

8/12/2019 Development of a Design Tool for Modern Gas
http://slidepdf.com/reader/full/development-of-a-design-tool-for-modern-gas 94/380
L «1.5£>DZ L
64
(4.32)
4 . 6 S w i r l e r D e s i g n
During engine start-up, initial ignition of the fuel/oxidizer mixture is achieved with
the help of an igniter which produces a concentrated source of energy, namely a spark.
However, after the engine start-up procedure is successfully completed, the igniter is
disengaged and combustion is now a self-sustaining process. This self-sustaining
mechanism is achieved through the swirler (Figure 4.10) whose design is primarily
influenced by aerod ynam ics.
Dsw Di,ub
1_
Solid Model
Figure 4.10 Swirler nomenclature
Side View
SimplifiedTop View
In a conventional combustor, the scope of the swirler is to generate a recirculation
bubble in the primary zone by creating a toroidal flow reversal that allows for som e of the
hot combustion products to get entrained, to recirculate and to come in contact with the
fresh mixture of fuel and oxidizer. In a typical combustor, the swirl induced recirculation
zone is also augmented by air flow entering through injection holes strategically placed in
the primary zone (Figure 4.11).

8/12/2019 Development of a Design Tool for Modern Gas
http://slidepdf.com/reader/full/development-of-a-design-tool-for-modern-gas 95/380
65
OxidizerJ H
S/J////////J
///////////// /s ///////*//7v y/ ;; ;; ;j ;/ / sfJT-F r-A
o >Jnjection>^ Holes
RecirculationZones
^;;•;;;;;;;1>; ;>
Figure 4.11 Recirculation zones
In a premixed com bustor, a set of swirlers are located within the mixer tube to form a
premixer (Figure 4.12).
Mixer Swiricr Mixer Tube Com bustor Swiricr
' ' J
' ' J
> J
' ' • ' > ' ' ' ' > ' J iL
\
L
s?' j
' ' ^ >>>'>> s ; , , s s , -r-
Figure 4.12 Premixer nomenclature
The premixer is designed to fulfil three main objectives; 1) to facilitate fuel
evaporation (if liquid fuel is used), 2) to favour mixing of the fuel with the oxidizer and
3) to induce flow recirculation in the primary zone so that combustion can be sustained.

8/12/2019 Development of a Design Tool for Modern Gas
http://slidepdf.com/reader/full/development-of-a-design-tool-for-modern-gas 96/380
66
The evaporation and mixing processes occur downstream of the first swirler, the mixer
swirler. Flow recirculation in the primary zone is dependent on the design of the second
swirler, the combustor swirler. There has been extensive work conducted on premixer
and swirler designs. This work led to general guidelines which are presented next.
The unmixedness (Section 2.1.2) and fuel evaporation determine the length of the
mixer tube. When sizing the premixer, the spontaneous ignition phenomena must be
taken into consideration. Spontaneous ignition occurs when the residence time of the
combustible m ixture, flowing through the premixer, is more than the mixture autoignition
delay time for these conditions (see Section 4.12.4.1 for details). Therefore, to prevent
autoignition, the premixer length must be less than the length traveled by the mixture
before autoignition occurs. Furthermore, no flow recirculation must be present
downstream of the mixer swirler. A recirculation zone within the premixer would
translate into an increase in the combustible mixture residence time, which could
therefore cause autoignition to occur. To obtain thorough mixing, but still avoid the
formation of a recirculation zone within the premixer, the usage of a co-axial swirler is
suggested. If space and manufacturing costs are an issue, as they were in this research
project, a single swirler with a swirl number (defined next) less than 0.4 should be
employed (Lefebvre, 1999).
The swirl number (S ), defined in Equation (4.33), is a nondimensional param eter
that characterizes the amount of swirl impaired to the axial flow.
C - 2Gm
where G is the axial flux of angular mom entum

8/12/2019 Development of a Design Tool for Modern Gas
http://slidepdf.com/reader/full/development-of-a-design-tool-for-modern-gas 97/380
67
G is the axial thrust
D$w is the swirier outer diameter (Figure 4.10)
The swirl number can be calculated as (Lefebvre, 1999):
tan(9 v) ( 4 3 4 )
where D is the swirler outer diam eter (Figure 4.10)
D is the swirler inner (hub) diameter (Figure 4.10)
& v is the blade turning angle (Figure 4.10)
Lefebvre (1999), gives the following guidelines for the design of a combustor swirler.
Generally, the amount of oxidizer entering the swirler varies from 3 to 12% of the total
flow rate entering the combustor (W 3) and the pressure drop across the swirler ( A P )
can be estimated to be 3 to 4% of the combustor inlet pressure (P 3 ). To create a
recirculation zone, strong swirl conditions corresponding to swirl numbers higher than
0.6 (S > 0 .6 ), are needed (Lefebvre, 1999). Figure 4.13 show s how the size of the
recirculation zone is affected by the swirl number.
The swirl number and the pressure drop across the swirler, & PSW , calculated next,
are interlinked by the blade turning angle ( 9 ). A sw irler is designed to me et a specific
pressure drop, which as previously mentioned is between 3 to 4% of the combustor inlet
pressure (P 3 ) .
S N -•
D hub
\L>SW J
D hub
\^SW J

8/12/2019 Development of a Design Tool for Modern Gas
http://slidepdf.com/reader/full/development-of-a-design-tool-for-modern-gas 98/380

8/12/2019 Development of a Design Tool for Modern Gas
http://slidepdf.com/reader/full/development-of-a-design-tool-for-modern-gas 99/380
69
As a general rule, combustor swirlers are designed for swirl numbers above 0.6, they are
made up of eight to 16 blades equally spaced and the blades turning angle, 9 , is usually
set between 30° and 70° (Lefebvre, 1999 and Mellor, 1990). The shape of the blades
(curved versus flat) also has an effect on the recirculation zone size. Curved vanes induce
larger reverse mass flows (m ) with respect to flat vanes for the same swirl numb er
(Figure 4.14). Furthermore, as can be seen in Figure 4.14, for very strong swirl conditions
( S N > 2 for curved vanes and SN > 2.5 for flat va ne s), which corresponds to blades
turning angles above 65°, the amount of entrained flow exceeds that of the swirler flow
f • \
m\msw J
This suggests that some of the oxidizer entering through the primary
injection holes will be part of the recirculation bubble. Mattingly (2002) proposes the
following expression for the approximation of the entrainment ratio.
m / \ 3
^ = 0 - ¥ J for S„<2.5
where rh is the maxim um reverse mass flow rate
(4.37)

8/12/2019 Development of a Design Tool for Modern Gas
http://slidepdf.com/reader/full/development-of-a-design-tool-for-modern-gas 100/380
70
2 . 0 i 1
O CURVED VANES
D FLAT VANES
1.5-
3*
I 1.0-
0 . 5
SWIRL NUMBER, S N
Figure 4.14 Entrainment ratio versus swirl number (Lefebvre, 1999)
In addition, the combustor swirler should be designed w ith a solidity equal or greater than
one at the tip of the swirler vane {D ), where the vane solidity is defined as the ratio of
the vane length ( L ) to the vane spacing (S ) (see Figure 4.10 for nomenclature).
An explanation for the above design guideline can be found in work published by
Kilik (1976). This author conducted experiments for various swirler designs. The study
results showed that in swirlers having solidity values greater than one, the swirl angle
matched the blade turning angle (& v), even when swirl angles were high (Figure 4.15).

8/12/2019 Development of a Design Tool for Modern Gas
http://slidepdf.com/reader/full/development-of-a-design-tool-for-modern-gas 101/380
71
Solidity (Lv/S v)
Figure 4.15 Sw irl angle versus solidity (K ilik, 1976)
The reason for these findings relies on swirler aerodynamics. As previously mentioned,
swirl is induce to the flow entering the swirler by having vanes arranged at a determined
angle. Due to this angle, the swirler vanes, whether flat or curved, will cause the flow to
separate at their leading edges. To ensure that the flow will exit at the desired swirl angle
(0 ) the passage length (L ) should be long enough to allow for the flow to reattach
within the vane passage (Kilik, 1976).
4 . 7 D o m e S i z i n g
As a general guideline, the combustor dome is shaped so that most of the swirling air
is captured in the recirculation eddy (Mattingly, 2002). To achieve this, authors like

8/12/2019 Development of a Design Tool for Modern Gas
http://slidepdf.com/reader/full/development-of-a-design-tool-for-modern-gas 102/380
72
Sawyer (1985) and Kretschmer (2000) suggest wall angles (&D) between 45° and 60°
(see Figure 4.16 for n om enclature).
Dome
Snout
Figure 4.16 Dome nomenclature
The length of the dome depen ds on the wall angle used. Once a wall angle is selected,
the dome length can be calculated as:
(JD DL
D,sw tan(&D) (4.38)
With the completion of the dome design, the length of the recirculation zone, which is
based on the principle of "magic circles", can be obtained (Figure 4.17). The idea behind
this principle is to represent the flow behaviour within the recirculation zone by two
imaginary circles whose diameters are half that of the liner. These circles are placed so
that the dome and liner walls function as borders to the circles (Sawyer, 1985).

8/12/2019 Development of a Design Tool for Modern Gas
http://slidepdf.com/reader/full/development-of-a-design-tool-for-modern-gas 103/380
73
Figure 4.17 Mag ic circles
However, as previously mentioned, experimental work shows that the size of the
recirculation zone is affected by the swirler geometry (Figure 4.13). Therefore, upon
completion of the swirler design, comparison of the axial length estimation of the
recirculation zone obtained form the "magic circles" method to the estimation given by
the following equation, which takes into consideration the swirler design by introducing
the swirl number, S (Mattingly, 2002), is suggested.
LRz
K2SN
rt (4.39)
where rt is the tip radius of the swirler vane s
In particular, it was found that an increase in the size of the recirculation zone was
directly linked to one or more of the following factors (Lefebvre, 1999):
• an increase in vane angle
• an increase in number of vanes
• a decrease in aspect ratio

8/12/2019 Development of a Design Tool for Modern Gas
http://slidepdf.com/reader/full/development-of-a-design-tool-for-modern-gas 104/380
74
• a change from flat to curved vane s.
4 .8 C o m b u s t o r R e s i z i n g f o r L e a n P r e m i x e d C o m b u s t i o n
4.8.1 Resizing Mo tivations
In recent years, stringent emissions regulations forced the com bustor design to evolve
to meet current and future emissions targets.
Reduction of pollutants such as CO2 and H20 g (vapour phase) can only be achieved
through a decrease in hydrocarbon fuel consumption, since these two products are an
inescapable outcome of combustion (Lefebvre, 1999). Oxides of nitrogen (NO x = NO +
NO2), carbon monoxide (CO), unburned hydrocarbons (UHC) and particulates, also
known as soot (unburned carbon), are directly related to the combustor design and its
performance. The following table shows the emissions index (EI) of modern aircraft gas
turbine engines during cruise.
Table 4.3 Em issions index (EI) of modern aircrafts during cruise (Cum psty, 2003)
SpeciesEI
(g per kg of fuel)
C 0 2
3200
H 2 0 s
1300
NO x
9-15
sox
0.3-0.8
CO
0.2-0.6
UHC
0-0.1
Particulate
0.01-0.05
As can be seen from the table, the highest emission which can be addressed by
combustor design is that of the oxides of nitrogen. However, the needs for the alteration
in the combustor design can only be understood by first exploring ho w oxides of nitrogen
are formed.
When fuel, which contains no nitrogen, and air are mixed and combusted, three
chemical mechanism s take place and nitric oxide (NO) is formed. Once in the atmosph ere
NO oxidizes to form nitrogen dioxide (NO2) which is responsible for acid rain and

8/12/2019 Development of a Design Tool for Modern Gas
http://slidepdf.com/reader/full/development-of-a-design-tool-for-modern-gas 105/380
75
photochemical smog. Some NO2 is also produced during the combustion process when
the HO2 radicals, formed in relatively low temperature regions, mix with NO molecules,
present in the high temperature regions.
The chemical mechanisms involved in NO formation are the thermal or Zeldovich
mechanism, the Fenimore or prompt mechanism and the N20-intermediate mechanism
(Turns, 2000 and Lefebvre, 1999). The Zeldovich mechanism is typical in high
temperature combustion over a wide spectrum of equivalence ratios. The prompt
mechanism is prevalent in rich combustion whereas the NaO-intermediate mechanism is
common in low temperature conditions where equivalence ratios are lower than 0.8
(Turns, 2000).
In the Zeldovich m echanism the concentration rate of NO is derived to be (Turns, 2000):
^ ^ M O L K I , (4.40)
where [O] and [N2] are the equilibrium concentrations of the oxygen atom and of
nitrogen respectively
kj- is the forward rate coefficient of the following chemical reaction:
0 + N 2 < - > N O + N ( 4 4 1 )
The forward rate coefficient is defined as (Turns, 2000):
38370"k f=l.S-\0 llexp
T(K)
( cm3 ^
gmols(4.42)
As can be seen in Figure 4.18, the above chemical reaction has strong dependence on
temperature.

8/12/2019 Development of a Design Tool for Modern Gas
http://slidepdf.com/reader/full/development-of-a-design-tool-for-modern-gas 106/380
76
40000 T
35000
30000 -
J 25000oa-2* 20000 -
a
J 15000 -
10000
5000
0 -1500 1600 1700 1800 1900 2000 2100 2200 2300 2400 2500
Temperature (K )
Figure 4.18 Effect of temp erature on forward rate coefficient
One of the various methods for restraining the primary zone flame temperature is
premixing. Premixing allows combustion to take place at leaner equivalence ratios and
therefore, produces cooler flame temperatures. The conventional combustor resizing to
account for premixing will be discussed in the following section.
4.8.2 Resizing App roach for Lean Prem ixed Com bustors
The following conventional combustor resizing approach, to include premixing, has
been reported by Charest (2005). The resizing process is based on maintaining an
equivalent flame stability when converting a conventional combustor configuration to a
premixed combustor design. The scaling parameter used, to maintain this equivalent
flame stability, is the lean blowout velocity, V (Ballal and Lefebvre, 1981),
Equation (4.42) /

8/12/2019 Development of a Design Tool for Modern Gas
http://slidepdf.com/reader/full/development-of-a-design-tool-for-modern-gas 107/380
V =CBO s
c L
V o J
11
(4.43)
where C is the flameholder shape factor (dependent on flameholder geom etry)
D is the flameholder characteristic dimension, m
aQ = A, c p is the therm al diffusivity upstream of the flameholder, n rs
mS is the laminar flame speed, —
L s
By non-dimensionalizing and through some simple assumptions, given in more detail
in Charest's work, Equation (4.43) can be manipulated into Equation (4.44) and the
resizing, from a conventional combustor to a premixed combustor, can be carried out as
follows:
f A \
D. =Dx</>PZ,
fa \
X
V rpz
* J V L
i J
(4.44)
where the subscripts 1 and 2 refer to the conventional and premixed combu stors
respectively.
Based on work published by Mattingly (2002), the equivalence ratio of the primary
zone of the conventional com bustor ( $ p z ) can be set to 0.8.
The laminar flame speed, which is the maximum homogeneous burning velocity, is
calculated from the modified Semenov equ ation (Gauthier e t al, 1996):

8/12/2019 Development of a Design Tool for Modern Gas
http://slidepdf.com/reader/full/development-of-a-design-tool-for-modern-gas 108/380
78
u g r>
(4.45)
I T - r )3
where k is the proportion ality constant
T u is the reactant temperature
T is the flame temp erature
Ea is the activation energy
R is the universal gas constant
The proportionality constant k, if not known, can be calculated at normal ambient
conditions (T = 293 K and P = 1 atm) with a flame temperature (T ) estimated at an
equivalence ratio of 1.05, an activation energy (E ) of 92 kJ/mole and a maxim um
homogeneous burning velocity ( S L ), for alkanes, of approximately 43 cm/s (Gauthier e t
ah , 1996). After having calculated the constant k, the laminar flame speeds for the
conventional (S ) and premixed (S ) cases can be determined and sizing of the
premixed combustor can be undertaken.
4.9 Diffuser and Snout Sizing
With the combustor resizing completed, the diffuser and snout sizing can be initiated.
As mentioned in Section 4.1, the com bustor design includes parasitic pressure losses that
need to be minim ized. An example of these parasitic losses is the pressure loss across the
diffuser, HP,-.' diff

8/12/2019 Development of a Design Tool for Modern Gas
http://slidepdf.com/reader/full/development-of-a-design-tool-for-modern-gas 109/380
79
diff~ in,diff~ out,diff (4-
4 6)
The purpose of the diffuser (see Figure 4.19 for nomenclature) is to reduce high
compressor outlet velocities, which can be higher than 170 m/s (Saravanamuttoo, 2001),
to values where flame blowoff will not occur. In general, the compressor outlet velocity
must be reduced to a velocity within the range of 30 to 60 m/s (Saravanamuttoo, 2001).
This is in agreement with Lefebvre (1999) who indicates that the compressor outlet
velocity (higher than 170 m/s) must be decreased to about one fifth for combustion to
take place. The diffuser consists of a diverging passage through which the compressor
outlet velocity is decreased. A good diffuser design will minimize pressure loss, will
maximize static pressure recovery, will be fairly insensitive to engine operating
conditions and will minimize engine production costs by being as short as possible
(Klein, 1995). According to Sawyer (1985) the pressure loss across the diffuser is usually
limited to 1% of the total pressure at the combustor inlet ( m = 0.01 i^).
After having estimated the percentage of oxidizer needed in the primary zone, about
half of this quantity will enter the snout (~ 20 ) while the remaining amount will flow
through the annulus and will enter the primary zone via strategically located injection
holes. At the snout inlet, most of the air (~ 80%) is subjected to a change in direction as it
enters the diffusing passage. To minimize the possibility of flow separation, the change in
flow direction should be carried out at a constant velocity. Therefore, the location of the
snout inlet ( L0 ) should be placed where the velocity of the flow entering the combustor
is equal to the velocity of the flow entering the annulus as shown by the following
equation (Sawyer, 1985):
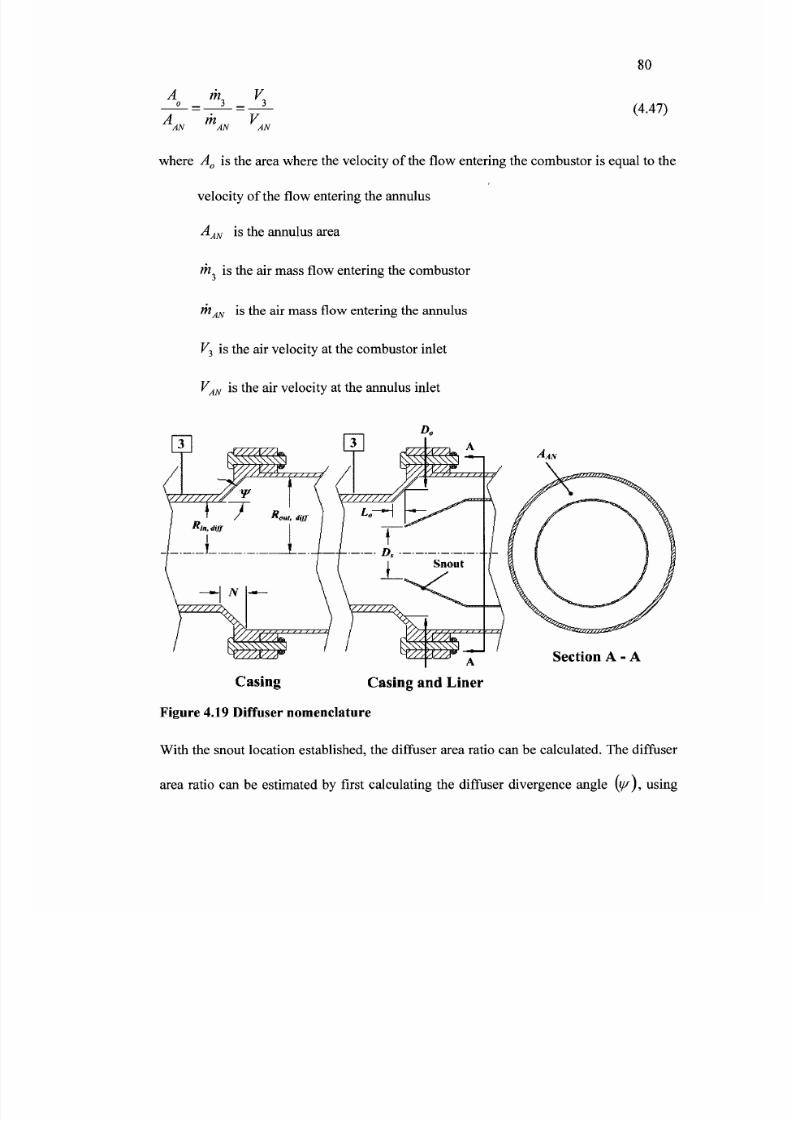
8/12/2019 Development of a Design Tool for Modern Gas
http://slidepdf.com/reader/full/development-of-a-design-tool-for-modern-gas 110/380
80
A m K„o_ _ 3 _ _ 3 _
A. nt VAN AN AN
(4.47)
where A0 is the area where the velocity of the flow entering the combustor is equal to the
velocity of the flow en tering the annulus
AAN is the annulus area
m is the air mass flow entering the combustor
ihAN is the air ma ss flow entering the annulus
V 3 is the air velocity at the com bustor inlet
VAN is the air velocity at the annulus inlet
OUt, itiff
J //>
' '
\
Section A - A
Casing Cas ing and Liner
Figure 4.19 Diffuser nomenclature
With the snout location established, the diffuser area ratio can be calculated. The diffuser
area ratio can be estimated by first calculating the diffuser divergence angle {i//), using

8/12/2019 Development of a Design Tool for Modern Gas
http://slidepdf.com/reader/full/development-of-a-design-tool-for-modern-gas 111/380
81
Equation (4.48), and then guaranteeing that the effect of the calculated angle will still
ensure that the pressure loss across the diffuser y^Pdiff ) is m e t (Sawyer, 1985).
APdtf f ' h^
l 3 J
2
tafii//)12 2 —
f A^
where y/ is the diffuser diverg ence angle, degrees
P3 is the combustor inlet pressure, Pa
(4.48)
T 3 is the combustor inlet temperature, K
m is the air mass flow entering the combu stor, kg
A3 is the com bustor inlet area, m 2
A0 is the area where the velocity of the flow entering the comb ustor is equal to the
velocity of the flow entering the annulus, m 2
J
Ra is the is the air gas constant, 287 m o l K
By applying the continuity equation and Bernoulli's equation to the control volume
around the diffuser, the area ratio ( A R ) and the rise in static pressure (static pressure
recovery) can be calculated as follows (Lefebvre, 1999):
AR =out,diff _ in,diff
A V Vin,diff out,diff out,diff
(4.49)
* out,diff "in,diff "in,di.iff AR2-AP,
diff(4.50)
where A is the area at the inlet (in, diff) and outlet (o ut, diff) of the diffuser, m2

8/12/2019 Development of a Design Tool for Modern Gas
http://slidepdf.com/reader/full/development-of-a-design-tool-for-modern-gas 112/380
82
V is the air ve locity at the inlet (Hdiff) and outlet (out,diff) of the diffuser, —
s
V3 is the air velocity at the com bustor inlet, —s
p is the static pressure at the inlet (in,diff) and outlet (out,diff) of the diffuser, Pa
q is the inlet (in,diff) and outlet {out,diff) dynamic pressure of the diffuser, Pa
The diffuser pressure recovery coefficient (C ) and the ideal diffuser pressure
recovery coefficient C _idealdjff are calculated as (Lefebvre, 1999):
pM f a
C = 1 — ^ T (4-
52>
p-ideal,diff y^i?
To understand if the diffuser is well designed, its performance must be assessed. The
performance of the diffuser is evaluated by the overall effectiveness ( TJ ), which is
typically found to be between 0.5 and 0.9 (Mattingly, 2002), or by the loss coefficient
( ditr) which is usually found to be in the range of 0.15 to 0.45 (Lefebvre, 1999)
depending on the diffuser design (i.e., faired versus dump).
The overall effectiveness is given by (Lefebvre, 1999):
Cp-meas (4.53)
p—ideal,diff
where Cp_meas is the diffuser pressure recovery coefficient calculated from experimental
results.
The loss coefficient is found as (Lefebvre, 1999):

8/12/2019 Development of a Design Tool for Modern Gas
http://slidepdf.com/reader/full/development-of-a-design-tool-for-modern-gas 113/380
83
, _Pin,diff-Pout,diff (4.54)
where the overbar indicates a mass flow weighted value derived from a detailed
transverse across the duct.
With the selection of the divergence angle, the diffuser performance can be compared
against characteristic curves found in literature such as the one shown in Figure 4.20.
1 2 5 10 20
Figure 4.20 Performan ce chart for conical diffusers (Adapted from L efebvre, 1999)
In particular, when looking at Figure 4.20, it should be noted that the maximum static
pressure recovery and therefore, the optimum diffuser geometry is found between the two
lines named C and C .p P
The last step in the diffuser design is the calculation o f the snout area, A .

8/12/2019 Development of a Design Tool for Modern Gas
http://slidepdf.com/reader/full/development-of-a-design-tool-for-modern-gas 114/380
84
A m 1sn _ sn |
A ~ m' C , (4-
55)
o 3 d,sn
where msn is the air ma ss flow enterin g the snout
C is the snout discharge coefficient and can be assum ed to be one (Saw yer,
1985).
4.10 Lin er Cooling M echanism
The following section will review gas turbine heat transfer work published by Sawyer
(1985), Kretschmer (2000) and Lefebvre (19 99). The estimation of the am ount of cooling
flow required to maintain the liner structural integrity is based on heat transfer science.
Some familiarization with heat transfer terminology, related to gas turbine com bustion, is
needed and is presented next.
4.10.1 Heat Transfer Terminology
A gas turbine combustor will gain and loose heat via conduction, convection and
radiation (Saw yer, 1985).
Conduction heat transfer occurs when a temperature difference within a material
exists. Through conduction, heat from one area is transferred to another by random
molecular motion or by diffusion in the absence of a velocity gradient (Cengel, 1997).
Usually conduction is associated with solid materials but it also applies to liquids and
gasses (Cengel, 1997).
Convection occurs when a solid surface transfers energy to an adjacent moving fluid
(Cengel, 1997).

8/12/2019 Development of a Design Tool for Modern Gas
http://slidepdf.com/reader/full/development-of-a-design-tool-for-modern-gas 115/380
85
Radiation is the transfer of energy as pho tons. The sun heating up earth is an exam ple
of heat transfer via radiation. Radiation can be transferred through a transparent
substance, such as air, or even through a perfect vacuum. All surfaces emit and absorb
radiation energy to and from the surroundings. The ratio of the radiation emitted by a
surface at a given temperature to the radiation emitted by a blackbody at the same
temperature is known as emissivity, s. A b lackbody, w hich is defined as a perfect emitter
and absorber of radiation (e = 1), emits radiation energy uniformly in all directions per
unit area normal to direction of emission and absorbs all incident radiation, regardless of
wavelength and d irection (Ceng el, 1997).
4.10.2 Uncooled Wall Temperature
The methodology to calculate the amount of liner cooling needed entails, first
calculating the uncooled wall temperature, and then re-evaluating the wall temperature
after having selected a cooling technique.
When looking at Figure 4.21, it can be seen that the liner wall receives heat by
convection and radiation from the hot gasses contained within the liner and loses heat by
convection to the flow traveling through the annulus and by radiation from the liner wall
to the casing wall. Conduction heat transfer is also present due to a temperature gradient
along and through the combustor wall. At steady state, the rate of heat transfer into the
wall element must be equal to the rate of heat transfer out. Equation (4.56) shows the
mathe matical formulat ion of th is phen om enon (Saw yer, 1985).

8/12/2019 Development of a Design Tool for Modern Gas
http://slidepdf.com/reader/full/development-of-a-design-tool-for-modern-gas 116/380

8/12/2019 Development of a Design Tool for Modern Gas
http://slidepdf.com/reader/full/development-of-a-design-tool-for-modern-gas 117/380
87
M,x =
M,2 (4.57)
Hence, Equ ation (4.56) can be simplified to
* .+ C
. = * 2
+ C
2 = * » - 2 (4.58)
where the conduction heat transfer through the wall ( K ) due to a temperature
gradient is defined as (Sawyer, 1985):
kK.=^-(T-T.)
1-2 ^ V wl w2 /
(4.59)
where kw is the thermal conductivity
tw is the ma terial thickn ess
T wl is the liner inner wall tem perature
T w2 is the liner outer wall temperature
The coefficient of thermal conductivity, kw, is dependent on the material used to
fabricate the combustor liner and t , is the m aterial thickness.w
The various terms of the governing heat transfer equation can now be defined.
4.10.2.1 Internal Radiation, Ri
Radiation heat transfer from the flame ( T ) to the liner inner wall (T ) is comprised
of two terms; 1) the nonluminous and 2) the luminous radiation terms. Nonluminous
radiation is emanated by combustion products like carbon dioxide and water vapour.
Lum inous radiation dep ends on the fuel com busted, and, in particular, on the num ber and

8/12/2019 Development of a Design Tool for Modern Gas
http://slidepdf.com/reader/full/development-of-a-design-tool-for-modern-gas 118/380
88
size of particles contained within the flame. The formula for estimating internal radiation
is given by Equation (4.60) (Sawyer, 1985):
R, = 0.5<r(l + SW)S£S(T;S - T>f) ( 4.60)
where CT = 5 . 6 7 X 1 0 " 8 W / m2K 4 is the Stephan-Boltzmann constant
Sw is the liner wall emissivity (Nimonic = 0.7; Sawyer, 1985)
s is the hot gas emissivity
The gas emissivity for luminous gasses is estimated by (Lefebvre, 1999)
s = J- exp 0.5 , 5 (4.61)\-290PL{qlb) T g'-
where P is the gas pressure, kPa
L is the lumino sity factor
q is the fuel-to-air ratio by mass
lb is the beam length, m
The luminosity factor, L, can be calculated from the correlation published by
Kretschmer (2000) and Odger (1978):
1 = 0.0691
fc ^2.71
— - 1 . 8 2v H j
(4.62)
Cwhere — is the fuel carbon to hydrogen carbon ratio by mass.
H
Typically, the beam length (/ ) can be estimated as (Lefebvre, 1999):
/ „ = 3 .4 -b
gas volu m e (463)
gas surface area

8/12/2019 Development of a Design Tool for Modern Gas
http://slidepdf.com/reader/full/development-of-a-design-tool-for-modern-gas 119/380
89
For can and can-annular comb ustors, the beam length ranges from 0.6-D^ to 0.9Z)
(Lefebvre, 1999).
4.10.2.2 E xternal Radiation, R2
The expression for the estimation of the external radiation R2, from the liner wall to
the casing, is given by Equation (4.64). This formula assumes that the liner and casing
walls behave as gray surfaces with emissivities s and s . respectively. In addition,0 J w casing r J '
the outer wall and the casing temperatures are assumed to be uniform in the axial
direction. Furthermore, the annulus air temperature ( T ) is used in the estimation of the
external radiation because of lack of accurate knowledge of the casing temperature
(T . ) (Lefebv re, 1999).v casing ' v ' '
Given the above, the expression for the net radiation flux is given by (Lefebvre,
1999),
R2 = cr S — - \ r A , f e - r 34 ) (4.64)
+ s ( 1 -asing w \ casing / A\ casing J
where ^casing is the casing wall emissivity (S tainless steel = 0.7 - 0.8; Cenge l, 1997)
£w is the liner wall emissivity (Nimonic = 0.7; Sawyer, 1985)
Aw i s t h e l i n e r w a l l s u r f a c e a r e a
^casing i s m e casing surface area
T w2 is the liner outer wall temp erature

8/12/2019 Development of a Design Tool for Modern Gas
http://slidepdf.com/reader/full/development-of-a-design-tool-for-modern-gas 120/380
90
where, in the case of tubular chambers, the ratio of the liner wall surface area to the
casing surface area equal to the liner-casing diam eter ratio, — — .Dref
4.10.2.3 Internal Convection, Ci
The rapid physical changes and chemical reaction rates make the estimation of
internal convection very challenging, especially in the primary zone. Conventional heat
transfer theory used for straight pipes is applied here with the understanding that the
Reynolds number is consistent with that of very high turbulence intensity (Lefebvre,
1999).
kC, = 0.020-1:<1
f • \ ° -m
g_
Au\ L
^s J
(T -T) (4.65)
, Wwhere ft is the hot gas thermal conductivity,* m K
kgm is the hot gas mass flow rate, —-8 s
AL is the liner area, m 2
ju is the hot gas dynamic viscosity,kg
g m s
T is the flame temperature, K
T wl is the liner inner wall temp erature , K
dhL is the hydraulic diameter (m) of the liner is calculated as:

8/12/2019 Development of a Design Tool for Modern Gas
http://slidepdf.com/reader/full/development-of-a-design-tool-for-modern-gas 121/380
91
. cross sectional flow area ^
d = 4 = DhL wetted perimeter L (4.66)
4.10.2.4 External Convection, C2
External convection (Equation (4.68)) is calculated using the approach outlined in
Section 4.10.2.3. However, the Reynolds number for this expression is based on the
annulus hydraulic mean diameter.
DAN
=Dref-
DL (4.67)
The air flowing throu gh the annulus is assumed to be adequately stirred in order
that turbulent heat transfer theory can be applied, giving (Lefebvre, 1999),
C = 0.0202 £,0.2
AN
i f - k ' _^v.
\AAN^aJ(
T*2~
T3)
(4.68)
. . Wwhere k is the air therm al conductivity,
m K
kgju is the air dynam ic viscosity," ms
kgmAN is the air ma ss flow rate in the annulu s, —-
s
AAN is the annu lus area, m2
DAN is the annulus diameter, m
kg
ju is the hot gas dynamic viscosity, ——g ms
T w2 is the liner outer wall temperature, K

8/12/2019 Development of a Design Tool for Modern Gas
http://slidepdf.com/reader/full/development-of-a-design-tool-for-modern-gas 122/380
92
4.10.2.5 C alculation of Uncoo led L iner Wall Temperature
The following section outlines the methodology to iteratively solve Equation (4.58)
and estimate the liner wall temperature when cooling techniques are not present. The
procedure is as follows (Lefebvre, 1999):
1) Estimate the mean fuel-to-air ratio for the zone under investigation. Within the
primary zone, stoichiometric conditions should be assumed if a maximum value for
the wall temperature is required;
2) Calculate the gas emissivity from Equation (4.61);
3) Calculate the net internal radiation hea t flux (Eq uation (4.60)) as a function of the
internal wall temperature;
4) Calculate the net external radiation heat flux (Equa tion (4.64)) as a function o f the
external wall temperature;
5) Calculate the net internal convection heat flux (Equ ation (4.65)) as a function of the
internal wall temperature making sure that the coefficient of thermal conductivity and
the dynamic viscosity are evaluated at the hot gas temp erature;
6) Calculate the net external conve ction heat flux (Equation (4.68)) as a function of the
external wall temperature making sure that the coefficient of thermal conductivity and
the dynam ic viscosity are evaluated at the com bustor inlet temperature.
With the estimation of the uncooled liner wall temperature completed; the selection of a
cooling scheme and the evaluation of its performance on the liner wall temperature can
be undertaken.

8/12/2019 Development of a Design Tool for Modern Gas
http://slidepdf.com/reader/full/development-of-a-design-tool-for-modern-gas 123/380
93
4.10.3 Calculation of Cooled Liner W all Tem perature and Coo ling M ass Flow
Innovative technologies as well as new material and coating developments give an
array of choices when selecting a cooling scheme and the amount of coolant needed.
Performance versus costs and manufacturing feasibility are usually the determining
factors wh en deciding on a cooling schem e.
CORRUGATED STRIP FLAME TUBE FLAM E TUBE
CORRUGATED STRIP COOLING MA CH INE D COOLING RING
TRANSPIRATION COOLING
Figure 4.22 Cooling schemes (Rolls-Royce pic, 1996)
Figure 4.22 shows various cooling techniques used in gas turbine combustors. Each
design has its pros and cons. However, they all have the same function, which is to
provide a cooling flow that runs between the liner wall and the hot gasses so that a barrier
is formed to protect the liner wall from the heat of the combustion process. As the film
cooling and hot gasses travel downstream together, they m ix and the effectiveness of the
coolant depreciates. Prior to reaching the maximum operating temperature of the liner
wall material, another cooling film must be introduced.
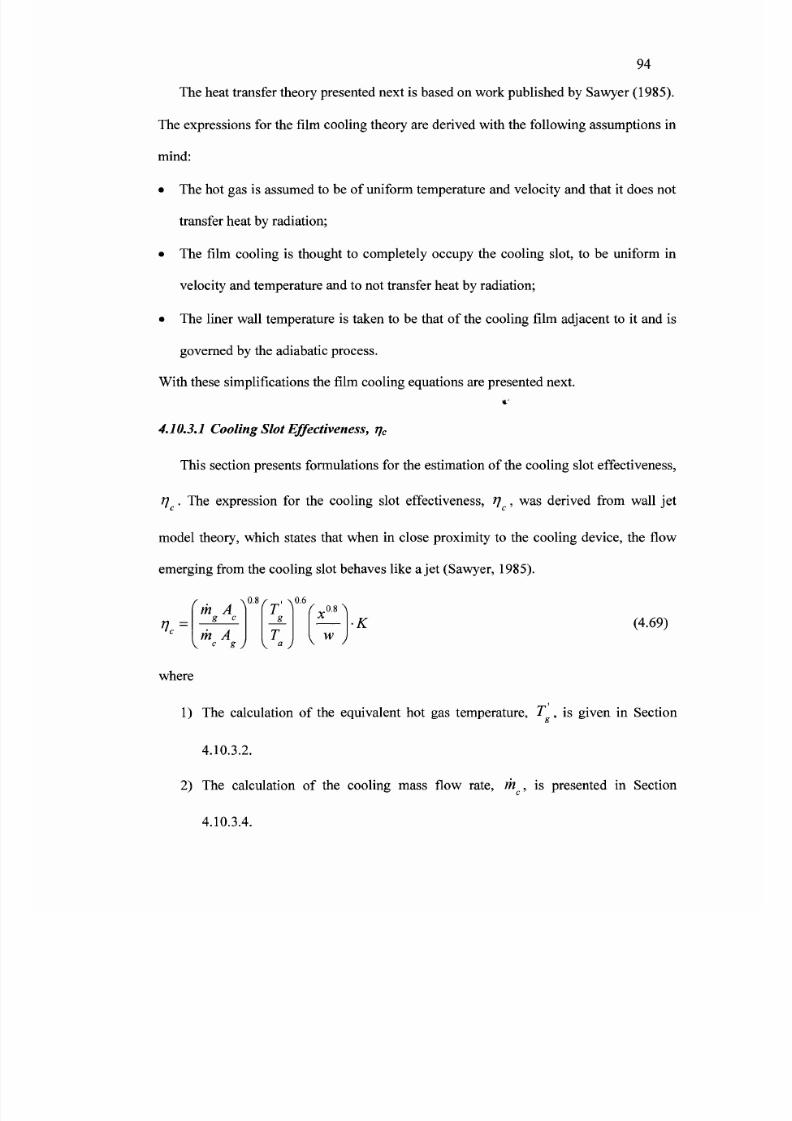
8/12/2019 Development of a Design Tool for Modern Gas
http://slidepdf.com/reader/full/development-of-a-design-tool-for-modern-gas 124/380
94
The heat transfer theory presented next is based on work published by Sawyer (198 5).
The expressions for the film cooling theory are derived with the following assum ptions in
mind:
• The hot gas is assumed to be of uniform temperature and velocity and that it does not
transfer heat by radiation;
• The film cooling is thought to completely occupy the cooling slot, to be uniform in
velocity and temperature and to not transfer heat by radiation;
• The liner wall tem perature is taken to be that of the cooling film adjacent to it and is
governed by the adiabatic process.
With these simplifications the film cooling equations are presented nex t.
4.10.3.1 Cooling S lot Effectiveness, TJC
This section presents formulations for the estimation of the cooling slot effectiveness,
T] . The expression for the cooling slot effectiveness, rj , was derived from wall jet
model theory, which states that when in close proximity to the cooling device, the flow
emerging from the cooling slot behaves like a jet (Sawyer, 1985).
7 7 =' c
f \0 - 8
' m A 'g c
m A\ c g J
f f \g
TV a J
V 8 ^V w
J
•K (4.69)
where
1) The calculation of the equivalent hot gas temperature, T , is given in Section
4.10.3.2.
2) The calculation of the cooling mass flow rate, m , is presented in Section
4.10.3.4.

8/12/2019 Development of a Design Tool for Modern Gas
http://slidepdf.com/reader/full/development-of-a-design-tool-for-modern-gas 125/380
95
3) The hot gas mass flow rate ( m ) calculation, is defined in Section 4.10 .3.5.
4) The coolant and hot gas areas are calculated in Section 4.10.3.6.
5) x and w are the distance (m) from the dome to the cooling slot and the slot gap
dimension respectively and
6) where the constant K is defined as follows:
VK = 1 for y > 0.8
(4.70)
K = g XI V (
4
-
71
)+ 0.2 for 0 < - £ - < 0 . 8V
where V is the hot gas velocity
Vc is the coolant velocity
4.10.3.2 Equivalent Hot Gas Temperature, T g*
The change in the local hot gas temperature due to film cooling must be taken into
account when evaluating the film cooling effectiveness. This is done by introducing the
"equivalent" hot gas temperature, T , which represents the average hot gas temperature
encountered by the film cooling span. The mean value from the area under the curve Tg
versus x gives T (Sawy er, 1985).8
T=l-\Tdx <
4 7 2>
g Y J gX 0

8/12/2019 Development of a Design Tool for Modern Gas
http://slidepdf.com/reader/full/development-of-a-design-tool-for-modern-gas 126/380
96
4.10.3.3 Film Coolant Temperature, T c
Assuming that the film coolant is not subjected to heat transfer, the adiabatic film
effectiveness can be calculated as (Sawyer, 1985):
fg-T,,ad (4-73)
r/ = - H —T -T
g c
where Tg is the equivalent hot gas temperature
Twad is the adiabatic wall temperature
Tc is the film coolant tempera ture
Hence, the film coolant temperature as a function of liner length can be calculated as:
T =T ' -—IT' -T ,) (4-
7 4)
I c
4.10.3.4 Cooling Air Mass F low Rate, rh
The methodology for the estimation of the cooling air mass flow rate is shown next.
The calculation is identical for each cooling device but, factors such as geometry and
location of the cooling device must be taken into consideration. For ex ample, the pressure
loss across the dome cooling slot will be dependent upon the pressure drop of the snout,
since this cooling device takes its flow from the snout, and the type of cooling geometry
used (i.e., corrugated strip or machined rings, etc.). The cooling air mass flow rate is
calculated as (Sawyer, 1985):
JAP . P}A\m = J c'' 3 e ff
( 4 . 7 5 )" P3 kT3
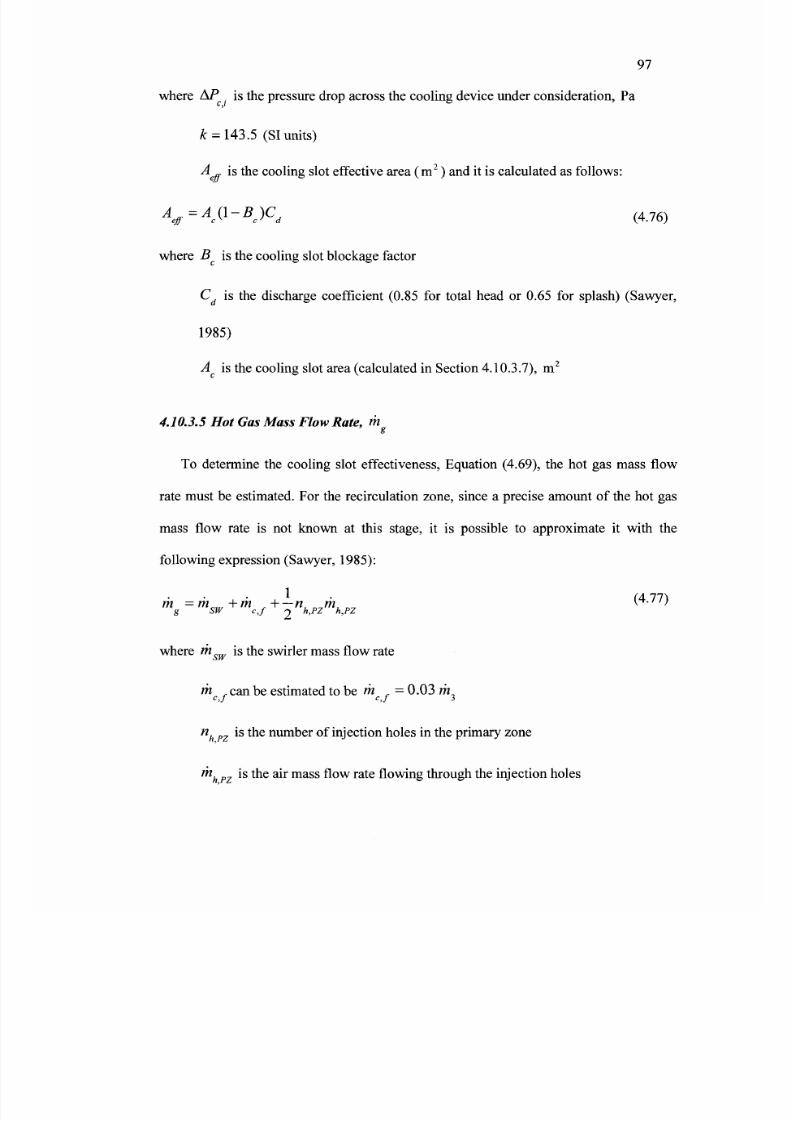
8/12/2019 Development of a Design Tool for Modern Gas
http://slidepdf.com/reader/full/development-of-a-design-tool-for-modern-gas 127/380
97
where A F is the pressure drop across the cooling device under consideration, P a
k = 143.5 (SI units)
A is the cooling slot effective area ( m
2
) and it is calculated as follows:
Aeff=
Afi~
BJ
Cd (4.76)
where B is the cooling slot block age factor
Cd is the discharge coefficient (0.85 for total head or 0.65 for splash) (Saw yer,
1985)
A is the cooling slot area (calculated in Section 4.10.3.7), m2
4.10.3.5 Hot Gas Mass Flow Rate, m
To determine the cooling slot effectiveness, Equation (4.69), the hot gas mass flow
rate must be estimated. For the recirculation zone, since a precise amount of the hot gas
mass flow rate is not known at this stage, it is possible to approximate it with the
following expression (Sawyer, 1985):
1tn =m„„+m , + - « , „ , / » , „ ,
g sw cj h>
pz h pz
where mour is the swirler m ass flow ratesw
m can be estimated to be m = 0.03 m.
c,f c,f 3
(4.77)
nh pz is the number of injection holes in the primary zon e
m h pz is the air ma ss flow rate flowing throug h the injection h oles

8/12/2019 Development of a Design Tool for Modern Gas
http://slidepdf.com/reader/full/development-of-a-design-tool-for-modern-gas 128/380
98
4.10.3.6 Annulus Mass Flow Rate, m AN
The an nulus mass flow rate, along the liner, is simply the mathematical subtraction of
the flow rate entering the liner from the total mass flow rate entering the combustor inlet.
4.10.3.7 Area Calculations Aa Ag, A A N
The cooling device area is calculated as
Ac=7t-D c-w (4.78)
where D is the arithmetic diameter of the cooling slot gap
w is the slot gap width
The hot gas area, A , is the area of the liner without the cooling film thickn ess
(which thickness is estimated to be equal to the slot gap width w). Note that, as more
cooling devices are introduced, this area will be altered to reflect the changes.
The annulus area, AAN , is the area enclosed by the outer liner wall and the casing
inner wall. This area decreases as more co oling devices are introduced.
4.10.3.8 Calculation of Cooled Wall Temperature
The heat transfer Equations (4.58) derived in Section 4.10.2 still hold true and can be
applied to calculate the liner wall temperature when cooling devices are introduced.
However, the internal convection expression (Equation (4.65)) must now take into
considerat ion that the f i lm cooling changes the temperature and veloci ty of the hot gas in
proximity to the w all.
When using Sawyer's approach, this change is taken into account by evaluating the
expression using cooling film properties. This is shown ne xt:

8/12/2019 Development of a Design Tool for Modern Gas
http://slidepdf.com/reader/full/development-of-a-design-tool-for-modern-gas 129/380
C =0.017— C -Tdu c
he
' mc
V C c J
(Tc~
TJ
99
(4.79)
, W
where kc is the coolant thermal conductivity mK
dhc is the hydraulic diameter of the coolant, m
T c is the film coo lant temperature, K
T wl is the liner inner wall temperature, K
Ac is the cooling device area, m2
kgm is the coolant mass flow rate, —-
kgju c is the coo lant dynam ic viscosity, ——
m s
With Cj defined, the cooled liner wall temperature can be undertaken using the
methodology reported in Section 4.10.2.5. Equation (4.58) can now be solved iteratively
making sure that the internal convection com ponent is defined by Equation (4.79).
4 . 1 1 I n j e c t i o n H o l e S i z i n g
The last step in the preliminary design of a gas turbine combustor is the sizing of the
injection holes (see Figure 4.25 for nomenclature). The following section will present
work which has been published by Sawyer (1985) and Lefebvre (1999) on the subject.
Both authors recog nize that the injection hole geom etry, the liner pressure loss, the liner
geometry and the injection hole bleed ratio (shown next) have an effect on injection hole
performance.

8/12/2019 Development of a Design Tool for Modern Gas
http://slidepdf.com/reader/full/development-of-a-design-tool-for-modern-gas 130/380

8/12/2019 Development of a Design Tool for Modern Gas
http://slidepdf.com/reader/full/development-of-a-design-tool-for-modern-gas 131/380
« = A (4AAN
where Ah is the hole area
A A N is the annu lus area
the hole bleed ratio, j3
m,
mAN
where rhh is the air mass flow rate through the hole
mAN is the air mass flow rate throug h the annulus
and the velocity area ratio, ju
a
The jet angle ( o ) is given by:
(4
(4
1 K~
l (4
sin 0> = v+
l.6Cd K
For plunged ho les, the discharge coefficient is calculated as:
Q = K
~l (4
ti.6\\K7 -K(l-p)2\
with the hole pressure loss factor expressed as:
K = l + 0.36 [ifi2 + [4ju
4 + 2.77 ju
2 (4/3 - /3
2 )]°'
s} (4
and the jet angle defined as:

8/12/2019 Development of a Design Tool for Modern Gas
http://slidepdf.com/reader/full/development-of-a-design-tool-for-modern-gas 132/380
102
^ < D = - i - — (4-89)\.2Cd K
When looking at Lefebvre's work, the following formulations can be found
(Lefebvre, 1999):
where C rf is the hole discharge coefficient
Ah is the hole area
p3 is the air density upstream of the hole
P3 is the total pressure upstream of the hole
p . is the static pressure down stream of the hole
The discharge coefficient for plain holes, according to Lefebvre (1999), can be
calculated as follows:
1-25 fc-1) ( 4 . 9 1 )
\A K2-K(2-P)
2\
r —d r . , . j o i
where /? is the hole bleed ratio, Equation (4.84)
K , the hole pressure loss factor, calculated as:
K = — ^ (4.92)
9 AN
where q} is the jet dy namic p ressure
qAN is the annulus dynamic pressure upstream of the hole

8/12/2019 Development of a Design Tool for Modern Gas
http://slidepdf.com/reader/full/development-of-a-design-tool-for-modern-gas 133/380
103
For plunged h oles, the discharge coefficient and the initial jet an gle equatio ns, given
by Lefebvre, are respectively
C d- l - a K * - l ) (4.93)
[4K 2-K(2-J3)2]° 5
sin2Q> = -^- (4.94)
where Cd x is the asymptotic value as the hole bleed ratio (/ ? ) tends to infinity (i.e.
Figure 4.23 and Figure 4.24 show results of experimental work carried out by Kaddah
(1964) and Freeman (1965) on discharge coefficient for various hole geometry
configurations. In particular, as can be seen in Figure 4.23, Equation (4.91) has a good
level of agreement w ith the experimental data.
By analyzing the above mentioned figures, the following can be concluded. High ratio
values of the jet dynamic pressure to the annulus dynamic pressure upstream of the hole
( K ) ensure high discharge coefficients which are insensitive to small chang es in the hole
pressure loss factor. This is important since high K values will mak e the injection hole
insensitive to manufacturing tolerances, circumferential variations in combustor inlet
velocity profile and small changes in air flow distribution during the development of the
combustor (Lefebvre, 1999). The expense of this advantage, however, will be an
increased diffuser area ratio.

8/12/2019 Development of a Design Tool for Modern Gas
http://slidepdf.com/reader/full/development-of-a-design-tool-for-modern-gas 134/380
o
Q8
Q 7 h
u 0.6
Z
UJ 0,5
y
o(EX
oCO
0.4
0 3
0,2
0,1
x JL
O OVAL HOLES
A RECTANGULAR SLOTS
0 ROUND HOLES
fcq,<4,91) (a = 0.25)
J L_L X X2 3 4 6 8 10 20 30 4 0 60 80
HOLE PRESSURE DROP COEFFICIENT, K
Figure 4.23 Effect of hole pres sure dro p coefficient on discharg e coefficient
(Adapted from Kad dah , 1964)
1.0,
0.9
PLUNGED HOLES
PLAIN HOLES
3 4 6 8 10 20 30 40HOLE PRESSURE LOSS FACTOR, K
_L _L
60 80100
Figure 4.24 Effects of hole pressure loss factor and hole geometry on discharge
coefficient (Freeman, 1965)

8/12/2019 Development of a Design Tool for Modern Gas
http://slidepdf.com/reader/full/development-of-a-design-tool-for-modern-gas 135/380
105
For primary injection holes, Lefebvre suggests that the hole pressure loss factor (K)
should not be less than six due to poor com bustor inlet flow conditions.
The dilution injection holes, as mentioned in Sections 3.10 and 4.5.3, have the critical
job of injecting cold air into hot combustion products to ensure an outlet temperature
profile which is satisfactory for the components directly downstream of the combustor.
Therefore, jet penetration and mixing are of primary importance when designing dilution
injection holes.
://? ttttttt/ttttttttttt U.J.U//J/ tt rrti r/trrr tttit trr
n»AN
it itt u itii iirt:
Figure 4.25 Injection hole nomenclature (Adapted from Lefebvre, 1999)
Based on single jet experiments, Lefebvre (1999) concluded that the trajectory of a jet
in a crossflow (see Figure 4.25 for nom enclature) can be represented by (Figure 4.25)
D= 0.82 J 0.5
f \
DV } J
0.33
(4.95)
where X and 7 are the jet axial and radial lengths respectively, m

8/12/2019 Development of a Design Tool for Modern Gas
http://slidepdf.com/reader/full/development-of-a-design-tool-for-modern-gas 136/380
106
D, is the jet diameter, m
J is the mo me ntum flux ratio, is defined as:
pV
2
J = U-J- (4.96)pV2
g 8
where Pj is the density of the air je t flowing trou gh the hole
Vj is the jet v elocity
p g is the hot gas density
V is the hot gas velocity
For a single round jet introduced into a circular duct, the maximum jet penetration
Vmax ) is given by the following equation (Lefebvre, 1999)
Y lSDJsinO (4.97)
In the case of multiple round jets (Lefebvre, 1999) injected into a can liner,
the maximu m jet penetration is given by
Y =125 D.J0-
5 m ( 4 ' 9 8 )
max\m + m )
4 . 1 2 F u e l I n j e c t i o n T h e o r y
This chapter discussed, thus far, how to carry out preliminary design of
conventional or premixed combustor via the usage of a design methodology based on
empirical and semi-empirical correlations. In addition to this, however, ano ther im portant
combustion aspect, fuel injection, needs to be addressed. Particularly, since the fuel used

8/12/2019 Development of a Design Tool for Modern Gas
http://slidepdf.com/reader/full/development-of-a-design-tool-for-modern-gas 137/380
107
in the laboratory is liquid diesel the theory reported in the following sections will expand
on liquid fuel injection.
Specifically, the next sections will present correlations of the various interacting
mechanisms related to the injection process, such as fuel atomization, fuel evaporation
and fuel ignition processes. The following mod els will aid in the design of the prem ixer,
will assist in the selection of suitable fuel nozzle, and will quantify the igniter
requirements. The premixer design as well as the selected fuel nozzle and the ignition
system will be further discussed in Chapter 5.
4.12.1 Fuel Atomization Process
The atomization process facilitates combustion since it converts bulk fuel into small
drops which subsequently evaporate, mix (essential for combustion) and burn. These
droplets form when the disruptive forces created by the atomization process exceed the
consolidating surface tension of the liquid fuel (Lefebvre, 1999).
Atomization is achieved through the use of pressure atomizers which can be of
different types as reported by Lefebvre (1999). Depending on the type of atomizer used,
the mechanisms of atomization can be divided into either classical or prompt. In the
classical mechanism, fuel drops are formed from a fuel jet or sheet which interacts with
the surrounding air. The interaction between the fuel jet or sheet with the air creates
disturbances which lead to the formation of waves then change into ligaments which
ultimately turn into drops (Lefebvre, 1999).
The prompt mechanism is based on the same principles as the classical mechanism,
but the jet or sheet brake-up occurs very rapidly. Atom ization processes are referred to as
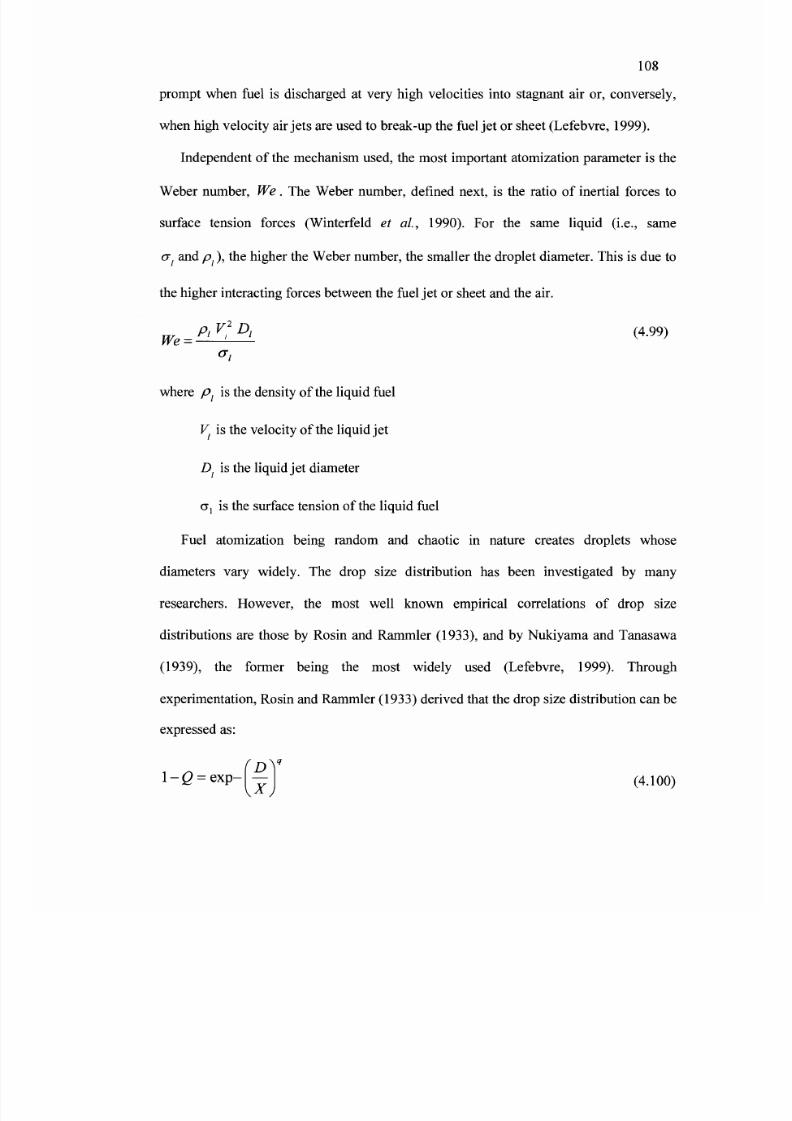
8/12/2019 Development of a Design Tool for Modern Gas
http://slidepdf.com/reader/full/development-of-a-design-tool-for-modern-gas 138/380
108
prompt when fuel is discharged at very high velocities into stagnant air or, conversely,
when high velocity air jets are used to break-up the fuel jet or sheet (Lefebvre, 1999).
Independent of the mechanism used, the most important atomization parameter is the
Weber number, We . The W eber numb er, defined next, is the ratio of inertial forces to
surface tension forces (Winterfeld et al, 1990). For the same liquid (i.e., same
cr/ and pt), the higher the Weber num ber, the smaller the droplet diameter. This is due to
the higher interacting forces between the fuel jet or sheet and the air.
Pi Vf D, (4.99)We = -
°i
where p. is the density of the liquid fuel
V is the velocity of the liquid jet
D is the liquid jet diameter
a, is the surface tension of the liquid fuel
Fuel atomization being random and chaotic in nature creates droplets whose
diameters vary widely. The drop size distribution has been investigated by many
researchers. However, the most well known empirical correlations of drop size
distributions are those by Rosin and Rammler (1933), and by Nukiyama and Tanasawa
(1939), the former being the most widely used (Lefebvre, 1999). Through
experimentation, Rosin and Ram mler (1933) derived that the drop size distribution can be
expressed as:
(DYl - 0 = e x p- — (4>100)
\A J

8/12/2019 Development of a Design Tool for Modern Gas
http://slidepdf.com/reader/full/development-of-a-design-tool-for-modern-gas 139/380
109
where Q is the fraction of the total volume contained in drops of diameter less than D
X and q are constants that are determined experimentally
In Equation (4.100), the exponent q represents the spread of drop sizes, which, for
most practical purposes, lies between 1.8 and 3.0 (Lefebvre, 1999), and X is the drop
diameter such that 63.2% of the total liquid volume is in drops of smaller diameter than
D.
When investigating the evaporation process, working with the entire drop size
distribution is not practical. For this reason, evaporation calculations deal with mean or
average drop diameters.
For gas turbine combustion calculations, the Sauter mean diameter (SMD or D32) is
the most important representative fuel drop diameter of the many possible choices given
in literature (Lefebvre, 1999). The SMD represents the diameter of a drop within the
spray whose volume to surface area ratio is the same as that of the whole spray
(Lefebvre, 1999). The estimation of SM D, which ranges between 50 and 100 microns in
gas turbine combustion (Saravanamuttoo, 2001), can be carried out through the use of
purely empirical correlations. Winterfed (1990) and Lefebvre (1999) give a number of
SMD correlations. These correlations take into account the type of pressure atomizer
used, its size, geometry and operating conditions as well as the fuel properties and the
properties of the gas surrounding the atomizer. The simplest geometry presented by
Lefebvre (1999) is a simple circular orifice which injects at high velocity a fuel jet into
the surrounding gas. The corresponding S MD correlation is given as (Elkotb, 1982):
SMD = 3.08vr fo A )°7 5 7 PT ^°54 (4.101)

8/12/2019 Development of a Design Tool for Modern Gas
http://slidepdf.com/reader/full/development-of-a-design-tool-for-modern-gas 140/380
110
2
where v is the kinem atic viscosity of the fuel, —s
kg<7f is the fuel surface tension, -f -
s
kgp , is the liquid fuel density, —2-
m
kgp is the air density, —=ra m
AP ; is the pressure differential across the orifice, Pa
Another important aspect of the atomization process is the spray cone angle which
indicates the spread of the scattered drops. A spray cone angle permits the formation of a
symmetrical and well distributed spray which improves the atomization quality by
increasing the contact volume between the fuel spray and the surrounding gas or air. The
spray angle is defined as that angle formed by two straight lines starting from the
discharge orifice and ending downstream at a distance of 60 discharge orifice diameters
(D g) (Lefebv re, 199 9). The simplest expressio n for spray angles (0 ) is that of the sim ple
circular orifice. This expression is presented by A bramovich (1963) as:
t a n < 9 / = 0 . 1 3 ( ^
Pi(4.102)
kgwhere p is the air density, — -
a m
kgPi is the liquid fuel de nsity, — \
m

8/12/2019 Development of a Design Tool for Modern Gas
http://slidepdf.com/reader/full/development-of-a-design-tool-for-modern-gas 141/380
I l l
Having don e a brief overview of the atomization process, the next important aspect of
fuel injection theory is the evaporation process w here, through mass and heat transfer, the
liquid fuel droplets evaporate.
4.12.2 Droplet Evaporation Process and Evapo ration Model
As previously m entioned, comb ustion can only occur if the fuel b urnt is in its vapour
phase and it is mixed with air at a molecular level. Therefore, a simple model for
estimating droplet evaporation is presented below. The theory discussed in this section
gives a general overview of the model. For more details, work published by Turns (2000)
should be consulted.
The evaporation process occurs through mass and heat transfer. In other words, the
heat surrounding the liquid droplet supplies the energy needed for evaporation to take
place. Initially, the higher heat from the surroundings increases the droplet temperature
through a conduction and convection heat transfer process. Once the droplet temperature
reached steady state, the heat transfer acts solely towards the evaporation process. The
vapour which is formed, cool the droplet by transporting away some of the heat, then
diffuses from the droplet surface to the surroundings. The loss of mass causes the droplet
diameter to decrease until it is completely evaporated.
The model presented next is applied to a single droplet of liquid fuel and contains
many simplifying assumptions to avoid dealing with mass transfer aspects of the
evaporation process. However, as mentioned by Turns (2000), the model still agrees
reasonably well with experimental results. The model main assum ptions are:
• the evaporation process is quasi-steady and occurs at constant pressure;

8/12/2019 Development of a Design Tool for Modern Gas
http://slidepdf.com/reader/full/development-of-a-design-tool-for-modern-gas 142/380
112
• the single droplet evapo rates in quiescen t, infinite surroun dings, is spherical in
shape, and has a constant, uniform temperature equal to the fuel boiling
temperature;
• the fuel is a single com ponen t liquid with zero solubility for gasses and with
constant thermo-physical properties;
• the fuel mo lar and therm al diffusivities [aQ = Xjcpp) are considered equal;
• the liquid and the vapou r are at equilibrium at the droplet surface, and no heat
transfer through radiation is considered.
The model algorithm is shown in Figure 4.26.

8/12/2019 Development of a Design Tool for Modern Gas
http://slidepdf.com/reader/full/development-of-a-design-tool-for-modern-gas 143/380
113
InputsBoiling Tem perature, 7*,,* (K), Ambient Temperature, Tv (K), Fuel Temperature, TFK (K),Initial Droplet Diameter (£>«, urn). Relative Velocity (Vn,b m/s), Ambient Pressure (P, Pa)
Fuel Mass Fraction Inside Droplet (>VRX Fuel Mass Fraction Far From Droplet (Ym)Fuels Critical Pressures (Pc, Pa), Fuels Heats of Vaporization (h/g, kJ/kg)
Molecular Weights fair, octane, dodecane) (M, kg/kmol), Densities (air, octane, dodecane) (p , kg/m3)
Calculation of m olar-based specific heat(air, octane, dodecane), cp (kJ/kmol K)
Droplet surface tem perature, Tw (K.)GUESS
ICalculation of fuel saturation pressure.
Pm, (Pa)
,_ . -_ ' 'Calculation of fuel mass fraction at droplet
wall, YK
Calculation of fuel evaporation tem perature,Tn, (K)
; 'Calculation of fuel mass fraction at
evaporation tcinpcrature, }>,„,
Calculation o f fuel critical temperature,
Ti:rit ( K )
Calculation of fuel mass transfer number,
Bo
*'
Calculation of fuel heat of vaporization atwall, hk (kJ/kg)
Calculation of air thermal conductivity,JU(W/mK)
Calculation of mixture thermal conductivity,A^W/mK)
Calculation of fuel thermal conductivity,£„(W/mK)
Calculation of expansion coefficient,*~ t'X
Calculation of liquid fuel specific heat,
C, (J/kgK)
Calculation of Spalding transfer number
Calculation of evaporation constant, Xn,
Calculation of evaporation time, t„
Figure 4 .26 Program algorithm for s ingle droplet evaporation
NO
Through mass and energy conservat ion, and by solving the droplet surface energy
balance, the evaporat ion ra te is der ived to be :
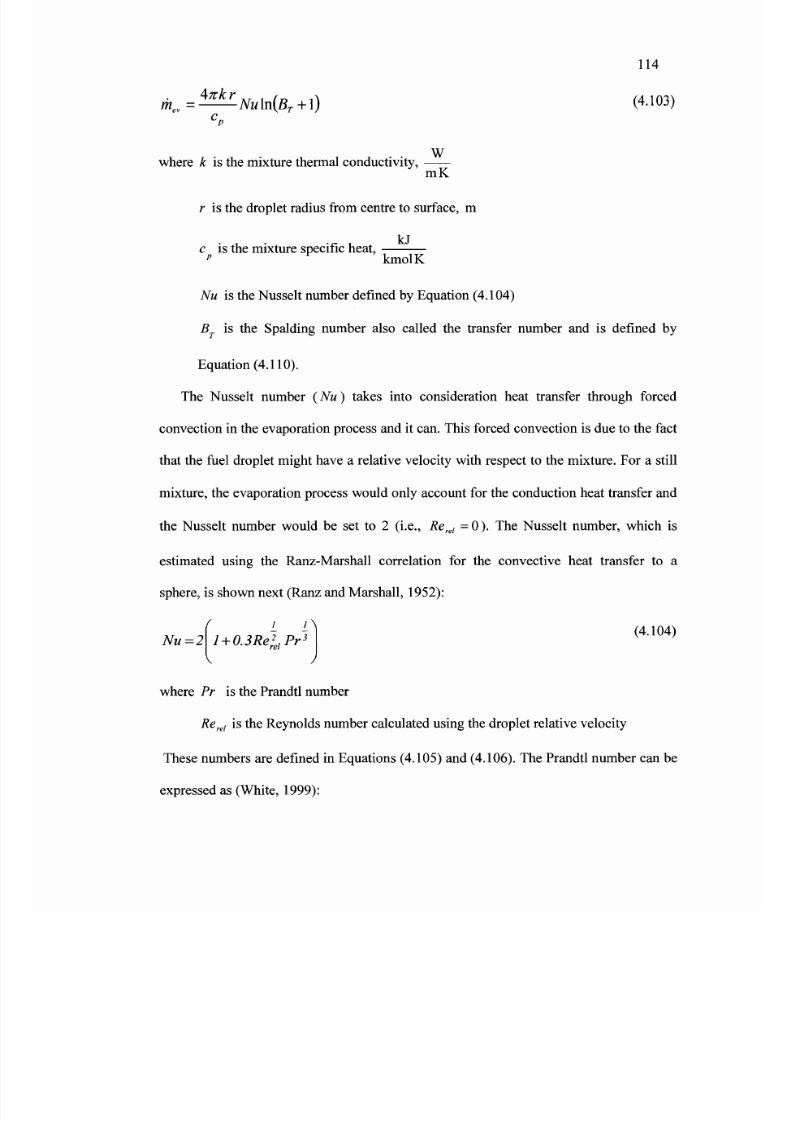
8/12/2019 Development of a Design Tool for Modern Gas
http://slidepdf.com/reader/full/development-of-a-design-tool-for-modern-gas 144/380
114
m„=—Nuln BT+\) (4-103)CP
Wwhere k is the mixture thermal conductivity,
m K
r is the droplet radius from centre to surface, m
c is the mixtu re specific heat," kmolK
Nu is the Nusselt number defined by Eq uation (4.104)
B is the S palding number also called the transfer n umber and is defined by
Equation (4.110).
The Nusselt number Nu) takes into co nsideration heat transfer thro ugh forced
convection in the evaporation process and it can. This forced convection is due to the fact
that the fuel droplet might have a relative velocity with respect to the mixture. For a still
mixture, the evaporation process would only account for the conduction h eat transfer and
the Nusselt number would be set to 2 (i.e., Rere l = 0 ). The Nusselt number, which is
estimated using the Ranz-Marshall correlation for the convective heat transfer to a
sphere, is shown next (Ranz and M arshall, 1952):
( i n
Nu=2 l + 0.3Rer2elPr
3 (4.104)
V
where Pr is the Prandtl number
Re re l is the Reynolds num ber calculated using the droplet relative velocity
These numbers are defined in Equations (4.105) and (4.106). The Prandtl number can be
expressed as (White, 1999):

8/12/2019 Development of a Design Tool for Modern Gas
http://slidepdf.com/reader/full/development-of-a-design-tool-for-modern-gas 145/380
115
Pr = t^L. (4-105)
k
. . . kgwhere // is the mix ture dynamic viscosity, ——
m s
kJc is the mixtu re specific heat,
" kmolK
Wk is the mixture thermal co nductivity,
m K
The Reynolds number, which is calculated from the relative velocity of the fuel droplet
with respect to the mixture, is defined as (White, 1999):
PV^DRerel=Eli (4.106)
kgwhere p is the mixture density, — -
m
V is the relative velocity of the fuel droplet with respect to the mix ture, —re l g
D is the droplet diameter, m
However, Equation (4.106) should take into consideration that gas turbine combustion is
a turbulent process. This turbulent process increases the rate of convective heat and mass
transfer. Therefore, the above eq uation is modified to be (Charest, 2005):
pqDRe re l = P ^ - (4-107)
where q is the mean turbulent fluctuation of the bulk flow and is calculated from W hite
(1999) as:

8/12/2019 Development of a Design Tool for Modern Gas
http://slidepdf.com/reader/full/development-of-a-design-tool-for-modern-gas 146/380
116
,.*_,_ ^ — ^ (4.108)-W7 '-
where u2, v2 , a n d w 2 are the mean bulk fluctuations in the x, y, z directio ns.
In practice, these fluctuations are presented as percentage of the free stream velocity and
are named turbulence intensity, 7 7 . For gas turbine com bustors, the turbulence intensities
range between 10% to 15% (Taylor, 1978; Dodds and Bahr, 1990) and are calculated as
follows,
TI = ^- (4-
109)
where V is the bulk flow velocity.
The last parameter in Equation (4.103) that must be addressed is the Spalding number
(B T ) which is expressed as,
B =YR~
Y™ (4.110)
T Y -Y
F R
where JMs the fuel mass fraction far from the droplet, which, as a simplifying
assumption, can be assumed to be zero
Y is the fuel mass fraction inside the droplet and is set to unity
Y is the fuel ma ss fraction at the surface of the droplet and is calculated as:
YR
fp \P
V sat J
— 2 - (4.111)M f
where P is the surrounding pressure

8/12/2019 Development of a Design Tool for Modern Gas
http://slidepdf.com/reader/full/development-of-a-design-tool-for-modern-gas 147/380
117
M x and M f are the mo lecular weigh ts of the surrounding gas or air and fuel
respectively
P is the fuel saturation pressure and can be calculated as (Gau thier, 200 5):
P sa l = 1 a tmV crit J
^ l a t m H ^ J U ^ J (4.112)
where Pcrit is the fuel critical pressu re, atm
TcrU are the fuel critical pressure and temperature respectively, K
T is the fuel droplet surface (wall) tem peratu re, K
T h is the fuel boiling temperature, K
By noting that the evaporation rate, m (Equa tion (4.10 3)), is directly related to the
rate at which the ma ss of the droplet decreases ( ), the droplet lifetime can be
derived as (G authier, 2005):
^ = - J L t f M t a ( » + l ) (4 . H 3 )
r i p
where the right-hand side of Equation (4.113) is the evaporation con stant, X , thus,
Sk
ev P,cNu\n(BT+l) (4 .H4)
p
2By integrating Equation (4.113), the D law for droplet evaporation can be evaluated
to be (Turns, 2000),
D 2(t) = D20-X j ( 4 1 1 5 )

8/12/2019 Development of a Design Tool for Modern Gas
http://slidepdf.com/reader/full/development-of-a-design-tool-for-modern-gas 148/380

8/12/2019 Development of a Design Tool for Modern Gas
http://slidepdf.com/reader/full/development-of-a-design-tool-for-modern-gas 149/380
119
relating mean particle trajectory to the evaporation process. The theory presented is based
on Charest's (2005) work.
As can be seen in Figure 4.28, the motion of a droplet particle is three-dimensional.
Area = Const
Figure 4.28 Droplet particle trajectory Charest, 2005)
The motion or velocity of the droplet particle is described by Newton's second law.
In cylindrical coordinates, the components of the particle velocity are given as (Hallett,
2003):
dup
dt
dvp
dt
dw
Pdt
l )
w
U ) V
PW
P
—\w -wL]—-—-~ \ P b I
(4.117)
(4.118)
(4.119)
where the subscripts p and b are for the particle and bulk fuel respectively.
The time constant for particle motion, T , is defined as (Hallett, 2003):

8/12/2019 Development of a Design Tool for Modern Gas
http://slidepdf.com/reader/full/development-of-a-design-tool-for-modern-gas 150/380

8/12/2019 Development of a Design Tool for Modern Gas
http://slidepdf.com/reader/full/development-of-a-design-tool-for-modern-gas 151/380
121
In the absence of a flame, the ignition process of a reactant mixture is carried out
through the use of electrical sparks. Ignition occurs if the kernel energy of the spark is
sufficient to increase the temperature of a critical mixture volume from its initial state to
the flame temperature (T ) (Lefebvre, 1999).
The minimum ignition energy is defined as the smallest amount of energy needed to
heat the smallest volume of the reactant mixture to its adiabatic flame temperature. The
smallest volume of reactant mixture is determined by the minimum quenching distance
(Lefebvre, 1999) as explained below. The quenching distance of a quiescent or slow
moving m ultidroplet mist is given by (Lefebvre, 1999):
d =
i ~\0.5
A A 2 (4.123)
Pa(/>PZln{l + Bstoich)
where pl and p are the liquid fuel and air density respectively
D is the droplet diameter
<f> pz is the primary zone equivalence ratio
B , is the stoichiometric fuel mass transfer number calculated as (Gauthier,stowh v
2005):
stoich
Cpa^stoich- Tw) (4.124)
hf g+c,(Tw-T R)
kJwhere c is the air specific heat,a r kmolK
kJc, is the fuel specific heat,
kmolK
T n o t c h 1S m e
free stream stoichiometric temperature (far from droplet), K

8/12/2019 Development of a Design Tool for Modern Gas
http://slidepdf.com/reader/full/development-of-a-design-tool-for-modern-gas 152/380
122
T w is the temperature of the droplet surface (wall), K
T R is the reservoir temperature (inside droplet), K
kJ
h fg is the fuel heat of vapo rization, —
The minimum energy needed to ignite the smallest spherical volume of a mixture is
therefore calculated as (Lefebvre, 1999):
E =c p AT, .hmin pa ra stolen
fAf (4.125)
v67
where c is the air specific heat,pa kmolK
• , • , kgp is the air density, —r-
a m
AT , is the rise from the reactant temperatu re to the flame temperatu re for astolen A L
primary zone equivalence ratio of unity (0pz = 1 ), K
d is the quenching distance, m
By estimating the minimum energy needed for ignition, a suitable igniter can be
selected for engine start-up, or, in the case of this research project, test combustor start
up. The location of the igniter is determined by following guidelines given by Sawyer
(1986) and Kretschmer (2000). The authors suggest that the igniter location should be
based on the principles of the "magic circles", which have been presented in Section 4.7.
Hence, the igniter should be inserted where the circle touches the liner wall, as shown in
Figure 4.29, since high m ixture concentrations of reactants are expected at this location.

8/12/2019 Development of a Design Tool for Modern Gas
http://slidepdf.com/reader/full/development-of-a-design-tool-for-modern-gas 153/380
123
Igniter
Figure 4.29 Igniter location
The following sub-sections will discuss autoignition and flashback, two phenomena
that must be avoided to ensure safe com bustor o peration.
4.12.4.1 Autoignition
Autoignition is a process by which a reactant mixture ignites spontaneously. This
phenomenon, if occurring within the premixer, can have catastrophic results and
therefore, m ust be addressed.
Autoignition has been studied for many years. This fact is evident in a published
work by Assanis et al. (2003) where the author lists a number of references on the topic
and, more specifically, on the autoignition delay time ( rid ) of diesel. The article focuses
on experimental work wh ose correlations use the Arrhenius expression given below.
T =AP~n e
id
(4.126)
where A and n are empirical constants

8/12/2019 Development of a Design Tool for Modern Gas
http://slidepdf.com/reader/full/development-of-a-design-tool-for-modern-gas 154/380
124
P is the operating pressure, b ar
JE is the activation energy,
mol
R is the universal gas constant, 8.3144molK
T is the operating temperature, K
Table 4.4 lists empirical constants fitted to Equation (4.126) as well as the researchers
who conducted the study (Assanis e t al., 2003).
Table 4.4 Summ ary of empirical constants used in diesel autoignition correlations
Correlation
Wolfer
Kadota
Spadaccini
Stringer
Hiroyasu
Fujimoto
Pischinger
Watson
Test
Apparatus
C.V. bomb
single droplet
steady flow
steady flow
C.V. bomb
C.V. bomb p
< 40 bar
steady flow
diesel engine
Fuel
Cetane No.> 50
n-dodecane
diesel No. 2
diesel
Cetane No . = 49
diesel
Heavy oil
Cetane No. 52.5
diesel
Cetane No. 50
diesel
A
0.44
6.58
4.00 XI0" 1 0
0.0409
0.01 Xf1-
04
0.134
0.0081
3.45
n
1.19
0.52
1
0.757
2.5
1.06
1.14
1.02
Ea
R
4650
4400
20080
5473
6000
5130
7813
2100
C.V. = C alorific Value
Using the appropria te operat ing pressure and temperature , the est imation of the
premixer length before spontaneous ignition occurs can be assessed a s:
L =V rig premixer id
(4.127)

8/12/2019 Development of a Design Tool for Modern Gas
http://slidepdf.com/reader/full/development-of-a-design-tool-for-modern-gas 155/380
125
Therefore, the premixer length m ust be shorter than the autoignition length, L .
4.12.4.2 Flashback
Flashback occurs w hen the flow velocity of the reactant mixture falls below the flame
speed, which causes the flame to propagate upstream. T his phenomen on, if not addressed,
can result in significant dam age to the fuel nozzles and com bustor liner. Flashback w ithin
the premixer should not be a problem as long as the reactant mixture velocity is higher
than 20— (Poeschl e t al, 1994).s
4.13 Pollutant Emissions Predict ion
As previously mentioned, pollutants emissions cannot be ignored when designing a
combustor. Therefore, the design methodology should include correlations that predict
the emissions of pollutants such as NO x and CO.
Review of published work (e.g., Lefebvre, 1999; Derr and Mellor, 1990; Mongia,
2003; and Allaire, 2006) revealed a number of empirical and semi-empirical correlations
for estimating pollutant emissions from gas turbine engines. In particular, Tsague et al.
(2007) give very simple empirical correlations that relate NO x formation to gas turbine
operating conditions such as, for example; fuel flow rate versus EI N O x (where EI is the
pollutant emission index), output power versus EINOX, compression ratio versus EINOX, to
name a few.
The correlations presented below, however, were selected because they are directly
related to the combustion process and, in particular, factors comprising the expressions
have been already calculated by the design methodology or can be easily estimated.

8/12/2019 Development of a Design Tool for Modern Gas
http://slidepdf.com/reader/full/development-of-a-design-tool-for-modern-gas 156/380
126
Fur thermore , th e correla tions sim plicity keep s t h e complexi ty o f the design method ology
to a min im um , while giving insightful inform ation o n emis sion s of polluta nts.
The correlat ions presented below come from work publ ished b y Lefebvre (1999).
N O x and CO emissions can be estimated with Equations (4.128) and (4.129) respectively.
NO x = 9 x 10⁻⁸ P312 5 VolComb e *-
T™ (g /k g fuel)
0.00345 TPZ
( v o i C a m b - v o aA P
?i' * - >
CO = 86 ma Tpz e
where P3 i s the comb ustor inlet pressure, k P a
(g/kg fuel)
(4.128)
(4.129)
• stoich 1S ^ e
stoichiometric flame temperature (i .e. , </>pz -1), K
T i s the primary zone temperatur e, Equat ion (4 .130), K
kgm i s the c om bu sto r m as s flow rate , ——
s
VoL t i s the combust ion v olum e = Vol , m 3
Comb PZ '
Vol is the volume occupied i n evaporat ion, Equa t ion (4.132), m 3
The primary zone temperature c a n b e estima ted using guidelin es given b y Sawyer
(1985) and Kretschmer (2000) a s follows,
T =T\n (T -T)] (4-130)
PZ 3 V'PZ V arf 3/J
where T J is the primar y zone efficiency and i s calculate d a s:
TJ PZ = 0.71 + 0.29 tanh{l.5475xl0~3 [T3 +108 ln{P3-1863% (4.131)

8/12/2019 Development of a Design Tool for Modern Gas
http://slidepdf.com/reader/full/development-of-a-design-tool-for-modern-gas 157/380
127
where P is the combustor inlet pressure, Pa3
T 3 is the combustor inlet temperature, K
From L efebvre (1999), the volum e occupied in evaporation is calculated as,
Ppz Ae v
kgwhere m is the mass flow rate in the primary zone, —-
n s
DQ is the SMD droplet diameter, m
kgp is the density in the primary zone, —^rPZ mi
A is the evaporation constant calculated by Equation (4.114)
The estimation of pollutant formation during the combustion process concludes the
design methodology analysis. How ever, prior to introducing the com bustor design, a brief
overview on combustor structural considerations, which need to be addressed to ensure
mechanical integrity during com bustor operation, will be given in the next section.
4.14 Combustor St ructural Considerat ions
This section focuses on the combustor structural design. In particular, the following
section elaborates on the theory that was consulted to determine the thickness of the
material used for the combustor liner and casing.
Since the diameter to wall thickness ratios for the combustor casing and liner were
estimated to be higher than 20, mechanics of materials theory for thin cylinders could be
used to estimate the strain and stresses seen by the casing and liner during operation
(Matthews, 2005) (Figure 4.30).

8/12/2019 Development of a Design Tool for Modern Gas
http://slidepdf.com/reader/full/development-of-a-design-tool-for-modern-gas 158/380
128
*J radial "radial
Figure 4.30 Force diagram of thin walled pressure vessel (Adapted from Matthews,
2005)
The fundamental stress and strain equations, which are the basis for all pressure
vessel codes and standards, are as follows; 1) the circumferential hoop stress, Equation
(4.133), 2) the hoop strain, Equation (4.134), 3) the longitudinal (axial) stress, Equation
(4.135) and 4) longitudinal strain, Equation (4.136) (M atthews, 2005).
APdadial2t
(4.133)
£radial j^\rradial U^axia/)+£ T
E
S = —axial A f
(4.134)
(4.135)
e ,= — (s ,-vS J ,)+erraxial E1 v axial radial' T
(4.136)
where AP is the pressure difference b etween cy linder's internal and external pressure
d is the cylinder diameter

8/12/2019 Development of a Design Tool for Modern Gas
http://slidepdf.com/reader/full/development-of-a-design-tool-for-modern-gas 159/380
129
t is the cylinder wall thickness
E is the dynamic You ng's mod ulus of the material used
v is the Po isson's ratio for the material used
sT is the therm al strain and is calculated as,
sr=a(T)(T-Tj ( 4 1 3 7 )
where oe(T) is the coefficient of thermal expansion, as a function of temperature, for the
material used
TQ and T are the initial and operating temperatures of the material respectively
Another important factor to consider in the structural design of a combustor is the
thermal expansion due to high combustion temperatures. The axial (Saxial ) and radial
8 thermal expansions can be calculated as,
Saxu = STL (4-138)
8 =e d <
4
-
1 3 9
)"radial bT u
where L is the cylinder length
d is the cylinder diameter
s is the therm al strain
Once the equations are defined, bo th the casing and liner must be designed to sustain
maximum operating conditions. More specifically, they must withstand plastic
deformation (yielding) at these conditions.
At high temperatures many materials become very ductile. Therefore, the von Mises
yield criterion is used to estimate material failure. The criterion states that material failure

8/12/2019 Development of a Design Tool for Modern Gas
http://slidepdf.com/reader/full/development-of-a-design-tool-for-modern-gas 160/380
130
(yield) occurs as a function of the difference between principal stresses (Sj,S2 andS3) as
shown by Figure 4.31 and expressed in Equation (4.140) (Matthews, 2005).
Figure 4.31 Material principle stresses (Adapted from Matthews, 2005)
4iV(s,-sJ +(s2-s,f +(s,-sty <<7;ield
(4.140)
Noting that the thin cylindrical case is a two-dimensional case (i.e., S3 - 0) with
S l = S^M and S2 = Sradial, the above equation becom es,
I axial radial axial radial yield(4.141)
For the liner, Equations (4.133) to (4.141) are solved with AP * APL « 0 . 0 3 P r For
the casing, the same equations are solved using AP « P' - P . The material properties
used in solving Equations (4.133) to (4.141) have to reflect those of the m aterials selected
for the liner and casing respectively.

8/12/2019 Development of a Design Tool for Modern Gas
http://slidepdf.com/reader/full/development-of-a-design-tool-for-modern-gas 161/380
5 C O M B U S T O R P R E L I M I N A R Y D E S IG N G E O M E T R Y
The following chapter presents the combustor liner, casing and premixer designs and
discusses the selection of a suitable fuel nozzle and igniter.
A preliminary design of the combustor was done by senior mechanical and aerospace
engineering students at Carleton University using an earlier version of the methodology
described in Chapter 4. Since the manufacturing had already been initiated by the
undergraduate students (combustor casing), completion of the construction of the
combustor for future testing was undertaken. Given that the algorithm presented in
Chapter 4 has evolved significantly from the undergraduate version, its performance will
be assessed indirectly by changing its structure, but not its content, to analyse the existing
combustor. Therefore, when experimental results become available, possibly
supplemented by CFD simulations, assessing the accuracy of the preliminary design
methodology will be feasible.
The premixer, fuel nozzle and igniter were sized taking into consideration combu stion
laboratory requirements. More specifically, they were designed (premixer) and selected
(fuel nozzle and igniter) for liquid fuel applications since the gas turbine combustion
laboratory at Environm ent C anada is presently not equipped to burn gaseous fuels.
5.1 Prel imina ry Geom etry of Lean Premixed Co m bustor
The combustor liner and casing geometries were sized to meet the microturbine
engine specifications as shown in Table 5.1 and Figure 5.1. Specifically, the combustor
was designed to burn natural gas and oxygen in a carbon dioxide environment. Other
requirements for the combustor w ere:
131

8/12/2019 Development of a Design Tool for Modern Gas
http://slidepdf.com/reader/full/development-of-a-design-tool-for-modern-gas 162/380
132
• to provide a turbine inlet temperature (TIT) of 1200 K;
• to ma intain a pressure loss of, at mo st 3%, across the com bustor;
• to ensure 99% combu stion efficiency;
• to ensure that the liner wall temperature remains below 1300 K; and
• to operate at a working pressure of 21 bar.
With the above engine specifications in mind, the combustor geometry evolved from a
series of design parameter selections. Some of these design choices are presented below .
Table 5.1 Microturbine specifications
Compressor Inle t
Compressor Outle t
Recuperator Inle t
(Cold Side)
Recuperator Outle t
(Cold Side)
Combustor Inle t
Combustor Outle t
Turbine Inle t
Turbine Outle t
Fuel Inlet
Oxygen Inlet
Thermal Efficiency
Pressure(bar)
3.00
21.00
20.995
20.58
20.58
19.96
19.50
3.15
22.53
22.53
25.7%
Tempera ture(K)298
482.15
482.15
893.05
893.05
1200
1200
949.08
654
298
Mass Flow(kg/s)
0.444
0.444
0.444
0.444
0.444
0.463
0.463
0.463
0.0038
0.015

8/12/2019 Development of a Design Tool for Modern Gas
http://slidepdf.com/reader/full/development-of-a-design-tool-for-modern-gas 163/380
133
Air Air
Natural Gas
CoolingFluid
Generator
co 2
Compressor
Heat
Exchanger
Pump
Figure 5.1 Microturbine schematic
5.1.1 Design Considerations
The developed combustor design was shaped by the engine specifications and by the
use of correlations and guidelines outlined in Chapter 4. The following (Table 5.2) are
some of the critical parameters that created the final combustor geometry.

8/12/2019 Development of a Design Tool for Modern Gas
http://slidepdf.com/reader/full/development-of-a-design-tool-for-modern-gas 164/380
Table 5.2 Design parameters
134
DescriptionCombustor Efficiency
Turbine Inlet Temperature
Global Fuel Ratio
Primary Zone Equivalence Ratio
Pressure Drop Ratio
Pressure Loss Factor
Geometric Factor
Liner Area Factor
Patter Factor
Dome W all Angle
Diffuser Pressure Loss
Symbol and Value
; 7 C = 0 . 9 9
TIT = 1200 K
'global
4m = 0.79
PDR = 0 . 0 3 P 3
PLF = 37
GF = 3 . 0 x l 0 " 3
k = 0 . 7opt
0 = 0.2
^ = 6 0 °
A ^ = 0 . 0 1 / > 3
Equation
Specifications
Specifications
(4.4)
(4.5)
(4.19)
(4.19)
(4.22)
(4.25)
(4.31)
(4.38)
(4.48)
5.1.2 Overview of Com bustor Dim ensions
Important casing and liner dimensions are summarized in Figure 5.2 and Table 5.3.
An example of the many combustor technical drawings, provided to companies for
quotations and manufacturing purposes, can be found in Appendix A. Figure 5.3 shows
the mass flow distribution of the co mbustor.
SECTION A-A
Figure 5.2 Combustor key dimensions

8/12/2019 Development of a Design Tool for Modern Gas
http://slidepdf.com/reader/full/development-of-a-design-tool-for-modern-gas 165/380
135
Table 5.3 Critical combustor dimensionsD e s c r i p t i o n
Combustor Length
Liner Length
Primary Zone LengthDilution Zone Length
Maximum Casing Diameter
Liner Diameter
Dome Wall Angle
Liner Diffuser Wall Angle
Casing Diffuser Wall Angle
S y m b o l
'-'Comb
L L
Lpz
LDZ
Dref
DL
©D
V
9
D i m e n s i o n m m ( i n )
290(11.4)
157(6.18)
59.7 (2.35)97.5 (3.84)
115(4.53)
78.9(3.15)
60°
24°
45°
rf r K
> 1 1 1 1 1 1 I 1 1 1 1 I > > > > > A S .
8.0 ^v i o/»*^ZZZZZZZZZZZZZZ2ZZ
w ^ w ^ ^ ^
Figure 5.3 Liner mass flow distribution
The location of the cooling rings and the amount of the cooling flows were estimated
by employing the design methodology reported in Section 4.10 using a maximum liner
wall temperature (T ) of 1200 K (upper limit of usefulness for Hastelloy X; Davis,
2000). As the wall temperature approached the maximum material temperature, a cooling
ring was inserted to bring the material temperature down to acceptable levels. The
material properties used in the calculations presented in Section 4.10 were those of
Hastelloy X (Appendix B). The calculations also used a material wall thickness of 1 mm.
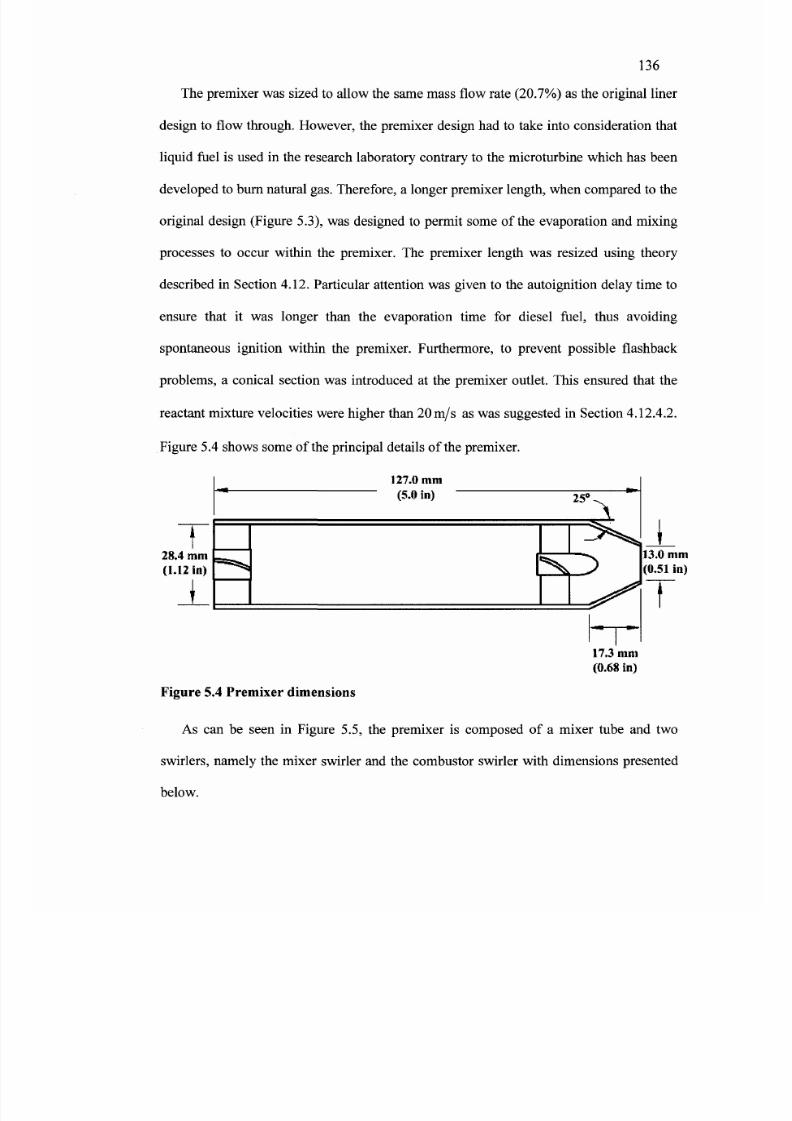
8/12/2019 Development of a Design Tool for Modern Gas
http://slidepdf.com/reader/full/development-of-a-design-tool-for-modern-gas 166/380

8/12/2019 Development of a Design Tool for Modern Gas
http://slidepdf.com/reader/full/development-of-a-design-tool-for-modern-gas 167/380

8/12/2019 Development of a Design Tool for Modern Gas
http://slidepdf.com/reader/full/development-of-a-design-tool-for-modern-gas 168/380
138
1.4
1.2
~ 1to,
S 0.8
I 0.6
to 0.4
0.2
0
Combustor Swirler
Mixer Swirler
A Design Point Combustor Swirler
• Design Point Mixer Swirler
^^^^—
Eq. (4.34) /
y ^ ^
^•Z^
S S
//
0 10 15 20 25 30 35 40 45
Blade Turning Angle (6V) (deg)
Figure 5.6 Effect of blade turn ing an gle on swirl n um ber
50 55 60
9 i
1 2
<
Mixer Swirler
• Design Point Mixer Swirler
Combustor Swirler
A Design Point Com bustor Swirler
L — -=•- — -= =-=*•
— — » ^
Eq.( 4.35)
/
/ ' /
11
1 /
if( /
10 15 20 25 30 35 40 45 50 55 60 65 70 75
Blade Turning Angle (#„ ) (deg)
Figure 5.7 Effect of blade turning angle on pressure loss across swirler

8/12/2019 Development of a Design Tool for Modern Gas
http://slidepdf.com/reader/full/development-of-a-design-tool-for-modern-gas 169/380

8/12/2019 Development of a Design Tool for Modern Gas
http://slidepdf.com/reader/full/development-of-a-design-tool-for-modern-gas 170/380
140
r B
A
*=# :.
Figure 5.8 BETE impingement nozzle (model PJ) (Adapted from B ETE , 2007)
The principal nozzle dimensions A and B, as shown in Figure 5.8, are 24.6 mm (0.97
in) and 14.2 mm (0.56 in) respectively. As can be seen, dimension B is more than double
the diameter of the m ixer swirler bore (Dnozzie = 6.4 mm (0.25 in); Figure 5.5). T herefore,
before being able to utilize the nozzle, modifications had to be made to its geometry as
presented in Section 6.10.
The nozzle selection (i.e., nozzle model number) took into consideration the
properties of the fuel used (diesel) as well as the operating pressures and temperatures of
the fuel and air delivery systems. The fuel nozzle was also sized to deliver fuel flow rates
that would achieve, in the combustor primary zone, equivalence ratios covering a lean to
rich spectrum. These nozzle models, namely the PJ10, PJ12 and PJ15, were purchased
from BETE so that various ranges of fuel flows could be achieved. Three no zzles of each
model were acquired in case of possible machining problems during the modification
process.
5.1.4 Selection of Ignition System
The ignition system is a high energy, capacitor type ignition system that produces a
high voltage and an exceptionally hot spark which covers a large area. The exciter box is
powered by a 28 VDC power supply. The energy supplied is stored into a capacitor
located within the exciter box. During test start-up, the exciter box is triggered (push

8/12/2019 Development of a Design Tool for Modern Gas
http://slidepdf.com/reader/full/development-of-a-design-tool-for-modern-gas 171/380
141
button type switch) and current begins to flow through the lead to the spark igniter. This
current is then discharged by the igniter as a high voltage and high temperature. This
spark is created by an arc which forms between the centre electrode and the grounded
electrode (igniter body) as seen in Figure 5.9.
The ignition system used in the laboratory had been previously acquired by Murphy
(2004). The exciter box, lead and spark igniter purchased are those used by the Allison
250-C20B ignition system. The exciter box, lead and spark igniter part numbers are
6870885, 6870097 and 6877518 respectively.
Since the ignition system in Murphy's work successfully ignited diesel fuel, it was
also used in this research project, so that laboratory construction costs could be
minimized. Furthermore, since Murphy's test conditions (i.e., pressure and temperature)
were similar to those of this research project, the ignition system was deemed suitable.
Figure 5.9 Ignition system and spark igniter (Adapted from Allison Engine
Company, 1999)

8/12/2019 Development of a Design Tool for Modern Gas
http://slidepdf.com/reader/full/development-of-a-design-tool-for-modern-gas 172/380
6 P R E M I X E D C O M B U S T O R M A N U F A C T U R I N G P R O C E S S
The following chapter focuses on the combustor manufacturing process. It first gives
an overview of nickel based superalloy materials found in gas turbine hot section
componen ts (i.e., combustor, nozzle guide vanes and turbine). Following this, the chapter
focuses on specific superalloys used in gas turbine combustors and then lists the
superalloys chosen for the developed combustor liner. With the material selection
undertaken, the chapter then gives an overview of the manufacturing processes of the
chosen superalloys after which the casing material and the casing manufacturing process
are discussed. Finally, the chapter elaborates on the manufacturing of the premixer and
concludes by showing the fuel no zzle modification.
6 .1 M a t e r i a l O v e r v i e w f o r E n g i n e H o t S e c t i o n C o m p o n e n t s
Nickel based superalloys are the materials used for gas turbine hot section
components, such as the combustor, the nozzle guide vanes and the turbine. These
components use nickel based superalloys because they have to withstand high
combustion temperatures, high temperature corrosion as well as mechanical and thermal
stresses.
As m entioned in Section 3.1, the material operating temperature is the limiting factor
for the efficiency of a gas turbine engine. Having a high TIT allows for a decrease in
specific fuel consumption. However, a high engine TIT has a direct effect on the life of
the combustor liner, the nozzle guide vanes and the turbine blades. As a general
guideline, at high temperature conditions encountered inside gas turbine hot sections, a
50°C increase in temperature reduces co mpo nents lives by 50% (Gauthier, 2005).
142

8/12/2019 Development of a Design Tool for Modern Gas
http://slidepdf.com/reader/full/development-of-a-design-tool-for-modern-gas 173/380
143
Gas turbine blades are the most affected by high T ITs since the blade material has to
sustain high combustion temperatures, high temperature corrosion, and extreme
conditions of stress, due to blades rotation. In particular, Figure 6.1 shows how the
increase in combustor firing temperature has caused the blade materials, manufacturing
processes and cooling techniques to evo lve. As can be seen from the figure, the properties
of blade materials have been enhanced by the use of new nickel based superalloys (U
500, RENE 77, IN 733 and GTD 111). Changing the manufacturing processes from
conventional investment casting to single crystal casting and advancements in cooling
techniques also have allowed to sustain the constant increase in combustor firing
temperatures.
(1538°C)
8
2800
2600
(1316'C)2400
<1204"C)2200
g 2000
&I (9820Qg 1800
& 1600
(760»C)i
1400
1200
(538°C)1400,
Steam Cooling
U500Blade Metal Temperature
OTD111
1950 1960 1970 1980
YEAR
1990 2000 2010
Figure 6.1 Evolution of turbine blades with firing temperature (Boyce, 2006)
High firing temperatures also affect the performance of combustor m aterials, but in a
different way than that of turbine blades. When compared to turbine blad es, a combu stor
operates in low mechanical stress conditions since it is a stationary component.
Nevertheless, its life is affected by high temperature gradients during engine start-up and
shut-down, by buckling problems if thermal expansion is not taken into consideration

8/12/2019 Development of a Design Tool for Modern Gas
http://slidepdf.com/reader/full/development-of-a-design-tool-for-modern-gas 174/380
144
during the design phase, and by potential melting problems if the liner cooling is not
addressed properly.
The life of the combustor is also affected by the type of application and fuel used.
Table 6.1 shows the effect of these on the life of industrial gas turbine combustor liners.
As can be seen from the table, one engine start-up sequence every 1000 operating hours
can consume the equivalent of 30,000 hours of combustor service before maintenance is
performed (Boyce, 2006). The long life of the combustor liner is greatly depen dent on the
selection of suitable nickel based superalloys and the implementation of effective cooling
techniques.
Table 6.1 Operation and maintenance life for typical industrial combustor liner(Adapted from Boyce, 2006)
Type of Application and
FuelStarts/hr
Firing Temperature
below 1200 K (927°C)
Maintenance Life hr)
Firing Temperature
above 1200 K (927°C)
Maintenance Life hr)
BASE LOAD
Natural gas
Natural gas
Distillate oil
Distillate oil
Residual
1/1000
1/10
1/1000
1/10
1/1000
SYSTEM PEAKING (Normal maximum 1Natural gas
Natural gas
Distillate
Distillate
1/10
1/5
1/10
1/5
30,000
7,500
22,000
6,000
3,500
15,000
3,750
11,250
3,000
2,500
oad of short duration and daily starts)7,500
3,800
6,000
3,000
5,000
3,000
4,000
2,500TURB INE PEAK ING (Operating above 283 K-311 K (28°C -56°C) firing tem perature)
Natural gas
Natural gas
Distillate
Distillate
1/5
1/1
1/5
1/1
2,000
400
1,600
400
2,000
400
1,700
400
Depending on the engine application and the engine capital cost, the combustor life is
further aided by additional protective thermal barrier coatings (TBC) which are plasma
sprayed on the inner walls of the combustor liner. The high thermal resistance and low
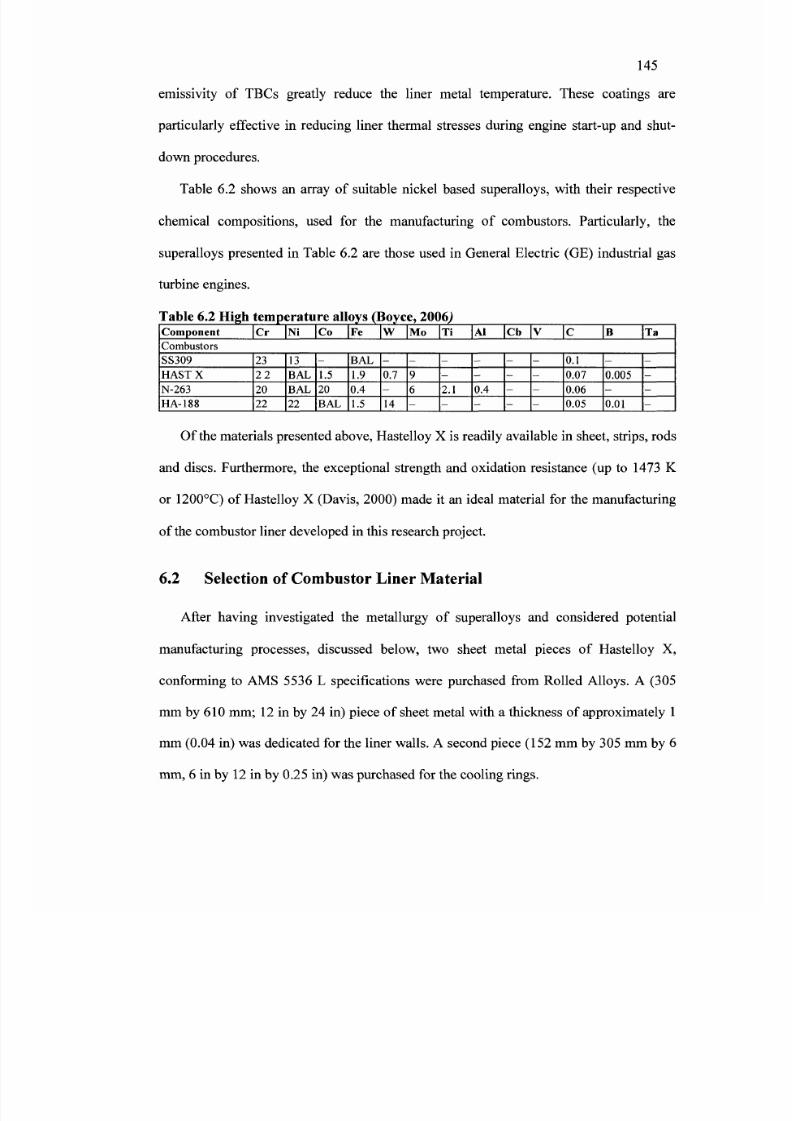
8/12/2019 Development of a Design Tool for Modern Gas
http://slidepdf.com/reader/full/development-of-a-design-tool-for-modern-gas 175/380
145
emissivity of TBCs greatly reduce the liner metal temperature. These coatings are
particularly effective in reducing liner thermal stresses during engine start-up and shut
down procedures.
Table 6.2 shows an array of suitable nickel based superalloys, with their respective
chemical compositions, used for the manufacturing of combustors. Particularly, the
superalloys presented in Table 6.2 are those used in General Electric (GE) industrial gas
turbine engines.
Table 6.2 High temperature alloys (Boyce, 2006)Component C r Ni Co Fe W Mo Ti Al Cb V c B TaCombustors
SS309
H A S T X
N-263
HA-188
23
2 2
20
22
13
BAL
BAL
22
-
1.5
20
BAL
BAL
1.9
0.4
1.5
-
0.7
-
14
-
9
6
-
-
2.1
-
-
0.4
-
-
-
-
-
-
0.1
0.07
0.06
0.05
-
0.005
-
0.01
-
-
-
-
Of the m aterials presented above, Hastelloy X is readily available in sheet, strips, rods
and discs. Furthermore, the exceptional strength and oxidation resistance (up to 1473 K
or 1200°C) of Hastelloy X (Davis, 2000) made it an ideal material for the manufacturing
of the combustor liner developed in this research project.
6.2 Selection of Co m busto r Lin er M aterial
After having investigated the metallurgy of superalloys and considered potential
manufacturing processes, discussed below, two sheet metal pieces of Hastelloy X,
conforming to AMS 5536 L specifications were purchased from Rolled Alloys. A (305
mm by 610 mm ; 12 in by 24 in) piece of sheet metal with a thickness of approximately 1
mm (0.04 in) was dedicated for the liner walls. A second piece (152 mm by 305 mm by 6
mm , 6 in by 12 in by 0.25 in) was purchased for the cooling rings.

8/12/2019 Development of a Design Tool for Modern Gas
http://slidepdf.com/reader/full/development-of-a-design-tool-for-modern-gas 176/380
146
6.3 Overview of Superal loys M anu factu ring Processes
The selection of a satisfactory manufacturing process to build the com bustor liner was
undertaken after having obtained proper fabrication kn owledge on superalloys.
Superalloys can be found in cast, rolled, extruded, forged and powder forms. W rought
alloy forms, such as rolled, extruded and forged, have better fatigue properties, due to the
alloy finer grain sizes resulting from the fabrication process. Even though superalloys can
be formed in many w ays, there are some restrictions to certain production processes.
One such fabrication process that is restricted is forging. The excellent high
temperature strength of superalloys, makes forging a difficult process to perform when
compared to other materials used in gas turbine eng ines.
Superalloys hot forming is also a difficult process since it can only be performed
within a narrow temperature range of 1200 K to 1500 K (Campbell, 2006). At
temperatures higher than 1500 K, the alloy microstructure starts to coarsen (grain growth)
which leads to poor mechanical properties of the metal. For this reason, cold forming,
followed by anneal treatments, is a preferred approach.
The cold forming process, for wrought superalloys, is similar to that used for stainless
steel. The same stainless steel forming presses can be used to cold work superalloys.
How ever, due to their higher strength, the forming process of superalloys requires 5 0% to
100% more power when compared to that needed for stainless steel (Campbell, 2006).
One superalloy that responds well to the cold working pro cess is Hastelloy X since it can
be reduced by as much as 90% before annealing is required (Campbell, 2006), thus
reducing manufacturing costs. Annealing is a heat treatment process which relieves

8/12/2019 Development of a Design Tool for Modern Gas
http://slidepdf.com/reader/full/development-of-a-design-tool-for-modern-gas 177/380
147
internal stresses caused by the cold working process and which improves the mechanical
properties of alloys.
In conclusion, of all the metals used in gas turbine engines, superalloys are
considered the most difficult metal to mach ine. The superalloys retention of high strength
properties at elevated temperatures put the machining tools under extreme stress. The
excessive heat, pressure and abrasion conditions make the nose of the cutting tool wear
away rapidly or break off, thus making m achining a problematic pro cess.
6 .4 O v e r v i e w o f S u p e r a l l o y s J o i n i n g P r o c e s s e s
Superalloys can be joined by one of the following m ethods: fusion welding, diffusion
bonding, brazing/soldering, adhesive bonding , or mechanical fasteners (Cam pbell, 2006).
However, of the above mentioned processes, the combustors intricate geometries
combined w ith very thin wall thicknesses make the fusion welding process to be the mo st
flexible and cost effective of all joining techniques. Nevertheless, when considering
fusion welding as a joining process, close attention must be given to the aluminum and
titanium contents making up the superalloy. As can be seen in Figure 6.2, there is a clear
line which demarks the m aterials that are readily w eldable from those w hich are difficult
to weld. Specifically, Figure 6.2 shows that for determined percent weight contents of
aluminum and titanium, the superalloys can be susceptible to hot cracking during welding
or to delay cracking after welding. For mo re details on the causes of these phenom ena the
reader is encouraged to look at Reed (2006) for information on superalloy
microstructures and Cam pbell (2006) for crack causes and welding gu idelines.

8/12/2019 Development of a Design Tool for Modern Gas
http://slidepdf.com/reader/full/development-of-a-design-tool-for-modern-gas 178/380
148
6 [ - 0
^ 3EDC
£< 2
Inconel100
AF2
Udimet 600
Udimet 700
Astroloy
Difficult to Weld:Weld a nd Strain-Age Cracking
I
ReadilyWeldable
Q Unite mp 1753
Rene 62
Ren4 41
Waspaloy
Inconei X-750
Inconel 718
M-252
Inconel Xj _
0 1 2 3 4 5 6Titanium (wt%)
Figure 6.2 Wettability limits (Campbell, 2006)
When looking at the composition (Table 6.2) of the selected liner material, namely
Hastelloy X, neither the presence of aluminum nor titanium can be seen. This, therefore,
makes the alloy readily weldable by fusion arc welding processes such as Gas Tungsten
Arc Welding (GTA W) and Gas Metal Arc Welding (GMAW )
Figure 6.3 shows the schematics of the above mentioned welding processes. In gas
tungsten arc welding, the fusion heat is provided by an arc maintained between a non-
consumable tungsten electrode, the cathode, and the workpiece, the anode. The negative
tungsten electrode, which has a melting temperature of 3665 K (3392°C) (Campbell,
2006), can carry a large amount of current which is then discharged, v ia the arc , to the
positive charged workpiece. The extreme heat produced by the arc results in the melting
of the workpiece. Furthermore, since the heat is very localized, by keeping the gap

8/12/2019 Development of a Design Tool for Modern Gas
http://slidepdf.com/reader/full/development-of-a-design-tool-for-modern-gas 179/380

8/12/2019 Development of a Design Tool for Modern Gas
http://slidepdf.com/reader/full/development-of-a-design-tool-for-modern-gas 180/380
150
Furthermore, when comparing GMAW with GTAW, the latter technique has a better
ability to control welding process variables such joint design, joint position, weld speed,
electrode type, electrode size, filler metal type and its size to name a few. Therefore,
GTA W w as the preferred joining m ethod for joining the com bustor liner.
After choosing the combustor liner material and after gaining a better understanding
of the manufacturing processes of superalloys the production method of the liner was
selected and is presented below.
6.5 Selection of the Co m bu stor Lin er M anu factu ring Metho d
The geometry (i.e., long thin walls) of the combustor liner and the fact that only one
liner was going to be manufactured, made cold forming the most appealing
manufacturing process for the research project. Three cold forming methods were
explored in more detail. These methods were hydroforming, metal spinning and roll
forming.
In hydroforming (Figure 6.4), a tubular, metal, starting stock is contained within a
completely sealed die. The die has been previously m achined to be the negative geom etry
of the part being manufactured. The desired geometry of the part is achieved by
permanently deforming (plastic deformation) the metal stock via high internal pressure
created by a fluid (typically water or oil) injected into the inner area of the stock. The
plastic expansion of the metal stock is completed w hen the part geometry is delimited by
the die w alls.

8/12/2019 Development of a Design Tool for Modern Gas
http://slidepdf.com/reader/full/development-of-a-design-tool-for-modern-gas 181/380
151
Figure 6.4 Hydroforming process
Another cold forming method is metal spinning. Metal spinning (Figure 6.5) is when
tensile and compressive forces are used to form pre-cut, round sections of sheet or hollow
blanks into axisymmetric (rotationally symmetric) hollow parts with various kinds of
outlines. This is done with roller tools which indent points, or occasionally lines, on
workpieces w hich are rotating (Tschaetsch, 2006).
Figure 6.5 M etal spinning process (Spincraft, 2007)

8/12/2019 Development of a Design Tool for Modern Gas
http://slidepdf.com/reader/full/development-of-a-design-tool-for-modern-gas 182/380
152
The third technique, roll forming, is the cheapest and fastest method since extra
tooling costs (material and machining costs as well as machining time costs associated
with the making of dies or mandrels) are not incurred by this process. Because of these
reasons, roll forming w as the selected process for shaping the combu stor liner. As can be
seen in Figure 6.6, almost any diameter can be achieved by roll forming. The smallest
diameter is limited by the size of the bending rolls while the largest diameter is limited by
the properties and, in particular, the plasticity of the metal.
Figure 6.6 Roll forming
Based on the gained kno wledge, a liner manufacturing process scheme w as developed
and it is presented in Figure 6.7.

8/12/2019 Development of a Design Tool for Modern Gas
http://slidepdf.com/reader/full/development-of-a-design-tool-for-modern-gas 183/380
153
Combustor LinerTechnical Drawings
Material Purchasing
Liner W alls
Water Jet Cutting(Final Dimensions)
Final A ssemblyand
GTAW Joining
Final Product
Liner Cooling Rings
Water Jet Cutting(Rough Dimensions)
ICNC Milling
Injection & Igniter Holes
"Walls Roll Formingand GTAW Joining
' ^ W B B B H B H H B P
iCNC Turning
(Final Dimensions)
ir
EDM DrillingCooling H oles
Figure 6.7 Combustor liner manufacturing process
To manufacture the combustor liner out of sheet metal, the unfolded view of the
various parts making up the liner walls had to be draw n.
Once the above was accomplished, the outlines of the various combustor liner parts
needed to be cut. Two methods were considered, namely abrasive water jet cutting and
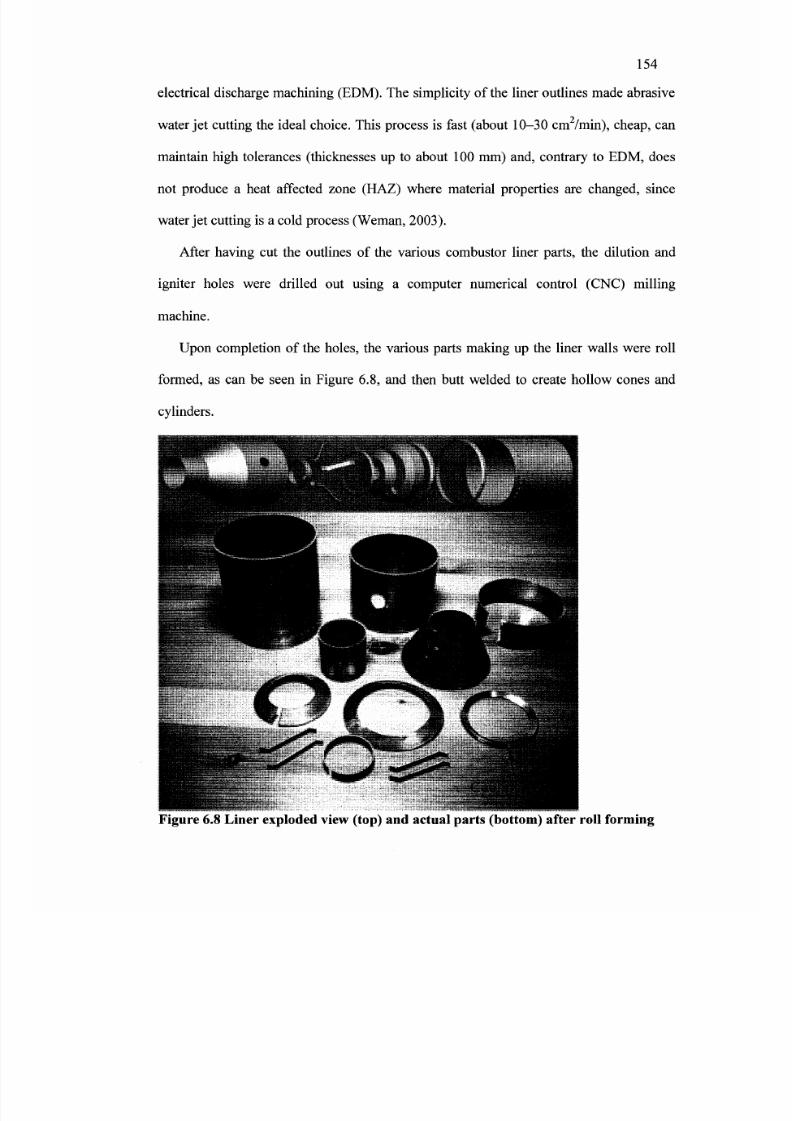
8/12/2019 Development of a Design Tool for Modern Gas
http://slidepdf.com/reader/full/development-of-a-design-tool-for-modern-gas 184/380
154
electrical discharge machining (EDM ). The simplicity of the liner outlines made abrasive
water jet cutting the ideal choice. This process is fast (about 10-30 cm /min), cheap, can
maintain high tolerances (thicknesses up to about 100 mm) and, contrary to EDM, does
not produce a heat affected zone (HAZ) where material properties are changed, since
water jet cu tting is a cold process (W eman, 2 003).
After having cut the outlines of the various combustor liner parts, the dilution and
igniter holes were drilled out using a computer numerical control (CNC) milling
machine.
Upon completion of the holes, the various parts making up the liner walls were roll
formed, as can be seen in Figure 6.8, and then butt welded to create hollow cones and
cylinders.
Figure 6.8 Liner exploded view (top) and actual parts (bottom) after roll forming

8/12/2019 Development of a Design Tool for Modern Gas
http://slidepdf.com/reader/full/development-of-a-design-tool-for-modern-gas 185/380
155
Figure 6.8 also shows one of the three cooling rings (dome cooling ring) present in
the liner. The cooling rings were first cut from the thicker sheet metal by water jet to
rough dimensions and then machined to their final dimensions through turning. Due to
small diameter dimensions (0.8 mm) the cooling holes were EDM drilled. The final
machining for the dom e cooling ring is shown in Figure 6.9.
Figure 6.9 Machined cooling ring
With all the liner comp onents com pleted, the final step of the manufacturing process
was the joining process.
As previously mentioned, the GTAW process was found to be the most flexible and
cost effective of all fusion welding techniques investigated. The suitability of the selected
GTAW process as the joining method for the developed combustor liner can be fully
appreciated w hen looking at Figure 6.10. Figure 6.10 shows a partially sectioned view of
the combustor liner solid m odel as well as a detailed view of an actual cooling ring w eld.
As can be seen from the figure, in order not to damage, distort or even plug the small
cooling ring holes (0.8 mm in diameter), the weld beads had to be less than 1.5 mm thick.
The proper selection of the tungsten electrode d iameter, which is com mercially available
in diameters from 0.25 mm to 6.4 mm, combined with a suitable operating current
allowed to carefully control the weld penetration depth and bead width resulting in very
successful welds with negligible liner distortion.

8/12/2019 Development of a Design Tool for Modern Gas
http://slidepdf.com/reader/full/development-of-a-design-tool-for-modern-gas 186/380
156
Figure 6.10 Cooling ring weld
The machining process was carried out by A-Line7. The welds were produced by
FullFusion Welding8
. Figure 6.11 shows the liner after having completed the
manufacturing process.
Solid Model Actual Pa rtFigure 6.11 L iner solid m odel and final produ ct
51 McCormack St, YORK, Ontario M6N 1X8, Canada
1 345 Wyecroft Rd, Unit 4B, Oakville, Ontario L6K 2H2, Canada
8/12/2019 Development of a Design Tool for Modern Gas
http://slidepdf.com/reader/full/development-of-a-design-tool-for-modern-gas 187/380
157
6.6 Co m bu stor Casing M ater ial Selection
Like the liner, the com bustor casing operates at low-stress conditions. However, whe n
compared to the liner, the casing functions at lower o perating tem peratures since some of
the heat is removed by the cool air flowing between the casing and liner walls, as it was
previously introduced in Section 4.10.
Due to the low stress conditions and cooler operating temperatures, austenitic steel
(stainless steel) with a 316L grade was considered as the casing material. In addition,
research on high temperature materials revealed that, not only austenitic stainless steels
had very good properties for hot environments, but it was also considerably cheaper than
superalloys materials, thus, making austenitic steel 316L the selected candidate for the
casing material.
Austenitic steels are iron based alloys that contain at least 16% chromium and 10%
nickel (Bhadeshia and Honeycombe, 2006). To make them suitable for high temperature
and corrosion resistant applications some austenitic alloy compositions also contain
elements like molybdenum (see Appendix B for further metallurgical information). In
general, austenitic steels have high corrosion resistance, and very high ductility,
weldability and resistance to high temperature environments. However, when operating
in high temperature conditions austenitic steels are susceptible to intergranular corrosion.
Intergranular corrosion is a localized corrosion phenomenon associated with carbide
precipitation. Carbide particles precipitation occurs when the chromium and carbon
contained in the alloy com bine due to long periods of exposure to high temp eratures (700
K to 1125 K or 425°C to 850°C) (Bhadeshia and Honeycombe, 2006). The formation of
carbide particles in the grain boundaries results in the depletion of chromium in areas

8/12/2019 Development of a Design Tool for Modern Gas
http://slidepdf.com/reader/full/development-of-a-design-tool-for-modern-gas 188/380

8/12/2019 Development of a Design Tool for Modern Gas
http://slidepdf.com/reader/full/development-of-a-design-tool-for-modern-gas 189/380
159
After considering the above, the casing material chosen was austenitic steel with a
316L grade.
6.7 Se lect ion of Com bustor Casing M anufactur ing M ethod
Like superalloys, austenitic steels can be found in cast, rolled, extruded, forged and
powder forms. The same manufacturing and joining processes presented for the
superalloys can be applied to austenitic steels and thus are not repeated here. The casing
manufacturing process scheme is outlined in Figure 6.12.
For ease of manufacturing and low fabrication costs, the casing was designed to be
composed of five different parts. Figure 6.13 shows the parts making up the casing
which, depending on the shape, were either CNC turned or CNC turned and milled. Once
the machining process was completed, the different components were joined using
GTAW to produce the front and aft casing sections (Figure 6.13). The casing
manufacturing process was carried out by the Science Technology Centre9. The final
product can be seen in Figure 6.12.
9 Carleton University Science Technology Centre, 1125 Colonel By Drive, Ottawa, ON K1S 5B6, Canada
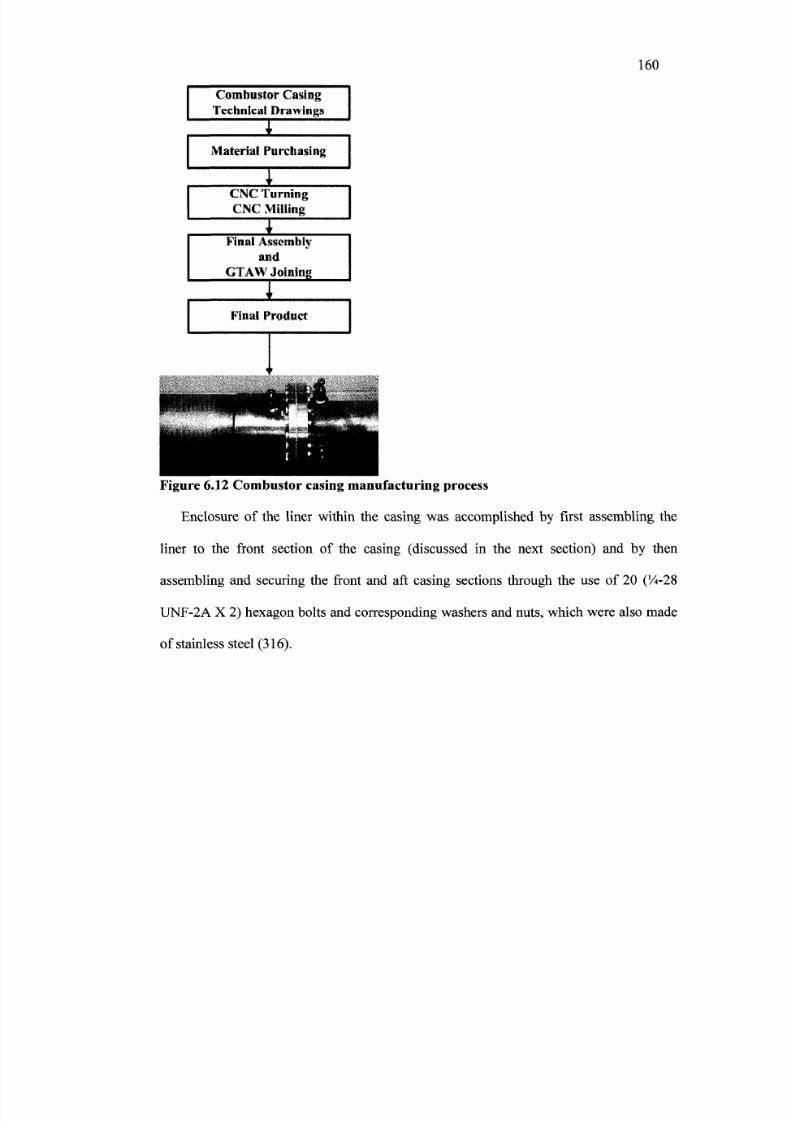
8/12/2019 Development of a Design Tool for Modern Gas
http://slidepdf.com/reader/full/development-of-a-design-tool-for-modern-gas 190/380
160
Combustor CasingTechnical Drawings
Material Purchasing
CNC TurningCMC Mitiing
Finai Assemblyand
GTAW Joining
Final Product
Figure 6.12 Combustor casing manufacturing process
Enclosure of the liner within the casing was accomplished by first assembling the
liner to the front section of the casing (discussed in the next section) and by then
assembling and securing the front and aft casing sections through the use of 20 (74-28
UNF-2A X 2) hexagon bolts and corresponding washers and nuts, which were also made
of stainless steel (316).

8/12/2019 Development of a Design Tool for Modern Gas
http://slidepdf.com/reader/full/development-of-a-design-tool-for-modern-gas 191/380
161
Figure 6.13 Casing exploded view (top), cross-section (middle) and final product
(bottom)
6.8 Lin er Casing Assembly
The liner-casing coupling mechanism was designed for ease of manufacturing. The
design also had to ensure effortless assembly and repeatability. Here, repeatability means
that every time that the liner had to be disassembled and then reassembled, the coupling
mechanism had to consistently guarantee liner alignment and concentricity with respect

8/12/2019 Development of a Design Tool for Modern Gas
http://slidepdf.com/reader/full/development-of-a-design-tool-for-modern-gas 192/380
162
to the casing, as well as maintain excellent gas-tight sealing properties. Through the
inventive usage of tube fittings, readily available from companies such as Swagelok or
Parker, all the above men tioned conditions could be m et.
Figure 6.14 Liner and casing assembly
Tube fittings, such as the one shown in Figure 6.14, are used in a wide variety of
markets such as alternative fuels, oil and gas, food, beverage and dairy, to name a few,
where advanced fluid system designs are present. These fittings, which come in many
sizes, materials and configurations, offer leak-tight tube connections, even at high fluid
working pressures. The liner-casing assembly, through the usage of tube fittings, took
advantage of the patented two-ferrule mechanical grip design, but used stainless steel
bolts instead of the intended tubing, as it will be further explained next.

8/12/2019 Development of a Design Tool for Modern Gas
http://slidepdf.com/reader/full/development-of-a-design-tool-for-modern-gas 193/380

8/12/2019 Development of a Design Tool for Modern Gas
http://slidepdf.com/reader/full/development-of-a-design-tool-for-modern-gas 194/380
164
6 .9 P r e m i x e r M a n u f a c t u r i n g P r o c e s s
The premixer manufacturing process adopted readily available techniques and its
production was carried out by the machine shop at the National Research Council in
Ottawa, Canada.
The premixer outline is made up of a cylindrical tube followed by a conical
contraction. Within the mixer tube there are two swirlers whose geometries were
presented before in Section 4.6. All the parts forming the premixer are made out of
stainless steel (316) and were manufactured using computer numerical control (CNC)
turning and milling machines.

8/12/2019 Development of a Design Tool for Modern Gas
http://slidepdf.com/reader/full/development-of-a-design-tool-for-modern-gas 195/380
165
The swirlers and conical contractions were machined from a rod, whereas the
cylindrical tube was readily available and, except for cutting the proper length, further
turning was not required. Figure 6.19 shows the final machined parts before assembly
and welding took place.
Figure 6.16 Premixer parts before final assembly
The joining process was carried out in steps using the GTAW technique. First, the
combustor swirler was placed into position and was spot welded onto the cylindrical tube
wall. Next, the cylindrical tube and conical contraction were butt welded. Lastly, the
mixer swirler was placed into position and firmly fastened by four stainless steel set
screws equally spaced at a 90° interval. This non-permanent fastening method of the
mixer swirler, as opposed to a more permanent method such as welding, was chosen to
have more flexibility during installation of the fuel nozzle within the mixer swirler.
The completed premixer was press fitted into the premixer holder to obtain a firm
assembly between the combustor liner and the premixer. The accurate mating of the

8/12/2019 Development of a Design Tool for Modern Gas
http://slidepdf.com/reader/full/development-of-a-design-tool-for-modern-gas 196/380
166
swirler with the dome wall was ensured by the previously machined lip at the conical
contraction outlet (Figure 6.17).
tfZZZZZZ2cx
M \ W N \ N > F
Figure 6.17 Prem ixer final assembly
6.10 Fu el Nozzle M odifications
As mentioned in Section 5.1.3, the fuel atomization process is carried out by an
impingement type nozzle; in particular, the PJ model was selected and purchased from
BETE. The discussion below outlines the modifications that needed to be done to the
nozzle before it could be coupled w ith the p remixer.
The PJ nozzle met all the required laboratory specifications for proper fuel
atomization to take place, however, its dimensions were more than double than that
permit ted by the bore in the mixer swir ler . Nevertheless , the low nozzle cost ($ 63 CAD)
and good performance characteristics outweighed the major modifications needed to
assemble the nozzle within the mixer swirler.

8/12/2019 Development of a Design Tool for Modern Gas
http://slidepdf.com/reader/full/development-of-a-design-tool-for-modern-gas 197/380
167
The scope of the PJ nozzle modifications was to reduce the nozzle original
dimensions to a nozzle outer diameter of 6.3 mm (~ 0.25 in) so that it could be inserted
inside the mixer swirler while maintaining the atomization properties of the original
design. To meet this objective, the nozzle was carefully machined until the press fitted
impingement pin could be safely removed (Figure 6.18).
• * A
As Received
Figure 6.18 Fuel nozzle machining
Before Removing Impingement Pin
Once the pin was removed, the nozzle was turned to the final dimen sions shown in Figure
6.19.
12.45 mm(0.49 in)(0-49 in) 6.00 mm
I f—— 17.78 mm _ _ J ( 2. 3 6 j n
, J ' (0.70 in) r |
J V// VA - 1 - 14.75 mm \2 J _(0.19 in ) U T I
/ / ; ; ; ; ry-fA
5.08 mm(0.20 in)
TPJ10
brifice =0.254 mm(0.010 in)
PJ12Orifice >
0.304 mm'(0.012 in)
PJ15brifice =
0.381 mm |(0.015 in)
Fuel Line I'm i No//U»
Wnlc r l i t
Figure 6.19 Fuel nozzle after machining with fuel line welded

8/12/2019 Development of a Design Tool for Modern Gas
http://slidepdf.com/reader/full/development-of-a-design-tool-for-modern-gas 198/380
168
Once the machining process was completed, a fuel line (details given in Section
7.3.7) was directly welded onto the nozzle (Figure 6.19). The removed impingement pin
was then carefully press fitted into the hole present on the mixer swirler wall (Figure
6.20).
Figure 6.20 Mixer swirler with impingement pin
As an increased safety measure in the locking technique, the pre-established hole was
also filled with high temperature epoxy (Loctite®-Hysol® 9492 A&B). Particular
attention was given to the pin assembly process to ensure that, once the fuel nozzle was
inserted within the mixer swirler, the distance between the impact pin and the nozzle
orifice was the same as that of the original design. Another critical assembly aspect was
to guarantee that the nozzle orifice and impact pin were perfectly aligned after assembly.
To guarantee that the modification process was carried out successfully, a series of
atomization tests, using w ater, were executed. F igure 6.21 shows one of such tests.

8/12/2019 Development of a Design Tool for Modern Gas
http://slidepdf.com/reader/full/development-of-a-design-tool-for-modern-gas 199/380
169
As Received
Figure 6.21 Water atomization tests
Once the validation process was concluded and deemed successful, the stainless steel
fuel line was connected to the fuel delivery system through the usage of tube fittings as it
will be presented in Section 7.3.7.

8/12/2019 Development of a Design Tool for Modern Gas
http://slidepdf.com/reader/full/development-of-a-design-tool-for-modern-gas 200/380

8/12/2019 Development of a Design Tool for Modern Gas
http://slidepdf.com/reader/full/development-of-a-design-tool-for-modern-gas 201/380
171
D
1
Gas Turbine
Room
i A l
U JU\
fK^SB
Combustion
Room
DA Vil
Control Room
I
.; Atmospheric
Blower
P
3 0:c •
u
IFigure 7.1 Gas turbine combustion research laboratory layout
The gas turbine combustion research laboratory is composed of three rooms. These
rooms are the Gas Turbine Room (1), the Combustion Room (2) and the Control Room
(3). The Gas Turbine Room, as the name implies, is an engine test cell which has been
allocated to an Allison 250-C20B gas turbine engine. The purpose of this engine is to
deliver pressurized (7 bar) air to the microturbine combustor under investigation, which
resides in the adjacent room, the Combustion Room. The Combustion Room is where
experimentations take place and where all test data pertaining to the combustor are
acquired. The third area is the Control Room. Within this area, two control and
monitoring stations are present. One station is for controlling and monitoring the gas
turbine engine, and the second station is for controlling and monitoring the various
systems residing in the Com bustion Room . In other words, the latter station controls and

8/12/2019 Development of a Design Tool for Modern Gas
http://slidepdf.com/reader/full/development-of-a-design-tool-for-modern-gas 202/380
172
monitors the air delivery system (A in Figure 7.1) and the fuel delivery system (B in
Figure 7.1).
The air delivery system can be coupled either to the gas turbine eng ine, to deliver air
at high pressures, or to an "atmospheric" blower, to deliver air at near-atmospheric
pressures. Coupling it to the gas turbine m ore closely represents the gas turbine operating
conditions of full engine tests without incurring the related costs. Coupling it to an
atmospheric blower, on the other hand, permits tests on combustion parameters that are
independent from engine operating conditions, such as the discharge coefficients of the
injection and cooling holes, to be carried out. The use of an atmospheric blower in this
case enables useful information to be collected w hile minimizing experimental costs. The
costs are reduced by the elimination of extra personnel needed to operate the gas turbine
and by the removal of expenditures, such as fuel and maintenance costs, related to the
running of the gas turbine engine.
In addition to carrying out tests, the blower was extensively used throughout the
comm issioning of the laboratory. Specifically, the b lower w as used to:
• check for proper assembly and operation of com ponents;
• verify the correct installation and proper working cond itions of the
instrumentation;
• perform component calibration;
• select prop er data acquisition system settings; and
• carry out shakedown tests of the various LabView program s developed for data
reduction, monitoring, and storage purposes.

8/12/2019 Development of a Design Tool for Modern Gas
http://slidepdf.com/reader/full/development-of-a-design-tool-for-modern-gas 203/380
173
7.2 Gas Tu rbine Room
The Gas Turbine Room with dimensions of 3.5 m (~ 12 ft) by 5.2 m (~ 17 ft) and a
ceiling height of 6 m (~ 20 ft) w as the room devoted to the Allison 250-C20 B gas turbine
engine. The purpose of the gas turbine engine was to supply pressurized air, through a
system of stainless steel pipes (A in Figure 7.1), to the microturbine combustor under
investigation in the Com bustion Room .
At the start of this research project the Allison 250 -C20B was already installed in the
Gas Turbine Room. In addition, a means by which to bleed pressurized air from the
engine had also been previously addressed (Murphy, 2004). However, due to a damaged
oil pump, the turbine engine was not in good working order and therefore, repair of the
pump had to be undertaken before the engine could run. More significantly, to reduce
testing costs, the Allison 250-C20B was modified by the author from its original
turboshaft configuration to an auxiliary power unit (APU) configuration. This
modification eliminated one person from the Control Room . Such an alteration decreased
testing complexity by streamlining the operation of the laboratory and more importantly
reduced experimental costs. The following sections, after giving a brief overview of the
Allison 250-C20B engine, will report on the modifications, repair work and
instrumentation done to the turbine eng ine.
7.2.1 Allison 250-C20B Overview
The Allison 250-C20B gas turbine engine used in the laboratory is a Rolls-Royce
turboshaft engine.
The high power to low weight ratio and the reverse flow design of the Allison 250-
C20B engine makes it ideal for helicopter applications (Figure 7.2). The mechanically

8/12/2019 Development of a Design Tool for Modern Gas
http://slidepdf.com/reader/full/development-of-a-design-tool-for-modern-gas 204/380
174
independent (or free) power turbine also favours this application since it permits the
helicopter rotor to operate at constant speed (Figure 7.2). The helicopter rotor constant
speed is achieved by changing the rotor blade pitch and by adjusting the engine power
through controlling the amoun t of fuel burnt by the engine.
Figure 7.2 Allison 250-C20B configuration and air flow (Adapted from Anonymous,
2008)
As can be seen from Figure 7.2, the major components of the Allison 250-C20B
engine are a compressor, which is composed of six axial compressor stages followed by
one centrifugal stage, a single comb ustor, a two-stage gas producer turbine (high pressure
turbine) and a two-stage power turbine (low pressure turbine) which supplies power to
the helicopter rotor through a gearbox (Allison Engine Company, 1999). In this twin-
shaft arrangement, the high pressure turbine drives the compressor through one shaft
while on the second shaft, the pow er turbine transmits the engine power to the helicopter
rotor through a gearbox.

8/12/2019 Development of a Design Tool for Modern Gas
http://slidepdf.com/reader/full/development-of-a-design-tool-for-modern-gas 205/380
175
7.2.2 Allison 250-C20 B Air Flow Path
Figure 7.2 and Figure 7.3 show the air flow p ath of the Allison 250-C 20B engine.
Figure 7.3 Allison 250-C20B isometric view and air flow path (Adapted from Allison
Engine Compan y, 1999)
In the Allison 250-C20B, as seen in Figure 7.3, the air enters the engine through the
intake (A) and is pressurized by the compressor. From the compressor, it is discharged
via a scroll type diffuser (B) into two ducts (C) w ith a pressure ratio o f 7.1:1 (Allison
Engine Company, 1999). The ducted and pressurized air then turns 180 degrees to enter
the combustion section (D). The com bustion section is made u p of a combustion case and
liner. The air enters the single combustion liner through a series of holes in the liner aft
end. It is then mixed with fuel which is sprayed via a fuel nozzle and ignited by a spark
igniter. The com bustion products then leave the com bustor to enter the turbine section (E)

8/12/2019 Development of a Design Tool for Modern Gas
http://slidepdf.com/reader/full/development-of-a-design-tool-for-modern-gas 206/380
176
where they are expanded close to atmospheric pressure (F) after which they are expelled
into the atmosphere via two exhaust manifolds (G) (Allison Engine Co mpany, 1999).
7.2.3 Allison 250-C20B Engine Mod ifications
As previously mentioned, before the engine could be run, a cracked shaft in the oil
pump had to be repaired. Furthermore, a major engine modification that would greatly
reduce testing costs and experimental com plexity was also undertaken. T his modification
was to change the engine configuration from a turboshaft engine to an APU through the
removal of the power turbine.
Since the operating principles of a turboshaft engine were previously discussed, only
the auxiliary power un it (APU) concept w ill be covered here. An A PU , by definition, is a
device on a vehicle whose purpose is to provide energy for functions other than
propulsion (Gunstone, 2004). For example, in large commercial aircrafts, the APU is a
relatively small gas turbine that starts the aircraft main engines, through the use of
compressed air, and provides electricity, hydraulic pressure and air conditioning while
the aircraft is on the ground.
In the laboratory, the original turboshaft engine configuration had to be carefully
aligned with and coupled to a hydraulic dynamometer (Figure 7.4) so that the output
power produced by the engine could be safely dissipated. The removal of the Allison
250-C20B power turbine, which transformed the turboshaft engine into an APU, made
the hydraulic dynamometer and the person control l ing the equipment no longer
necessary. Hence, the modification reduced testing costs by eliminating one person from
the Control Room and decreased testing complexity by streamlining the operation of the
laboratory.

8/12/2019 Development of a Design Tool for Modern Gas
http://slidepdf.com/reader/full/development-of-a-design-tool-for-modern-gas 207/380
177
Figure 7.4 Allison 250-C20B and dynamometer
The Emissions Research and Measurement Department, where the combustion
laboratory is located, routinely uses dynamometers to provide simulated road loading
conditions for internal comb ustion engines so that detailed investigations into com bustion
emissions can be carried out. However, the scope of the hydraulic dynamometer used in
this research project was neither to simulate engine loadings nor to measure torque and
rotational speed from which power produced by the Allison 250-C20B engine could be
calculated. The hydraulic dynamometer was used to prevent the free turbine from
overspeeding. The power dissipation process was carried out using the hydraulic
dynamometer as a water brake absorber. Specifically, water was added within the
dynamometer housing until the turboshaft engine was held at a steady rotational speed
against the load. As the turboshaft power settings were changed, the hydraulic
dynamometer settings were also adjusted to compensate and to keep constant the new
rotational speed of the power turbine shaft. This process involved the use of two people -
one person to control and monitor the Allison 250-C20B engine and the second person to

8/12/2019 Development of a Design Tool for Modern Gas
http://slidepdf.com/reader/full/development-of-a-design-tool-for-modern-gas 208/380
178
control and monitor the hydraulic dynamometer. With the removal of the power turbine,
therefore, the need to control the power shaft rotational speed was eliminated since the
shaft was now stationary. Therefore, the dynamometer and its operator became no longer
necessary.
Not to compromise the engine air flow path and structural integrity, the original two-
stage power turbine wheels were substituted with two (same part numbers) modified
scrap turbine wheels. A set of scrap turbine wheels were supplied from Magellan
Aerospace Corporation10 . With the scrap turbine wheels on hand and with the help of the
engine maintenance manual, the low pressure turbine module, housing the two-stage
power turbine w heels, was disassembled from the rest of the engine (Figure 7.5).
Figure 7.5 Partial disassembly of Allison 250-C20B engine
Tools were designed and manufactured so that complete disassembly of the various
components making up the low pressure turbine section could be undertaken. An
example of such a tool can be seen in Figure 7.6.
Magellan Aerospace Corporation, 3160 Deny Road East, Mississauga, Ontario L4T 1A9, Canada

8/12/2019 Development of a Design Tool for Modern Gas
http://slidepdf.com/reader/full/development-of-a-design-tool-for-modern-gas 209/380
179
Turbine BearingExtraction Tool
H i
Figure 7.6 Examp le of tool used for engine d isassembly
In addition to the creation of tools, a photo documentation process was initiated to
record the modification progress.
Figure 7.7 shows one of the two scrap turbine wheels before and after modifications.
, r t l3™ Stage Turbine W heelPart Number: 6853279
After Machiningefore
Machining
Figure 7.7 Third stage low pressure turbine wheel before and after m achining

8/12/2019 Development of a Design Tool for Modern Gas
http://slidepdf.com/reader/full/development-of-a-design-tool-for-modern-gas 210/380
180
As can be seen by the exploded view of the low pressure turbine section (Figure 7.8),
to retain the engine configuration and air flow path, the turbine disks were left untouched
and only the turbine blades and shrouds were removed. The machining process was
carried out, first by cutting the blades at their roots using an angle grinder and then by
stone grinding the left over material. Since, without blades, the turbine wheels could no
longer rotate, balancing of the disks was not necessary.
Station
Figure 7.8 Exploded view of low pressure turbine section

8/12/2019 Development of a Design Tool for Modern Gas
http://slidepdf.com/reader/full/development-of-a-design-tool-for-modern-gas 211/380
181
Once the modifications were completed, the reassembly of the low pressure turbine
section was undertaken (Figure 7.9). With a new shaft in the oil pump, the engine was
then reassembled (Figure 7.10 and Figure 7.11 respectively). Since the dynam ometer was
no longer of u s e , it was removed from the test cell.
Assembly
M a c h i n i n g • > * . :> . - . • • jgfm&h.?' SI11IB
Figure 7.9 Low pressure turbine section reassembly
Figure 7.10 Oil pump assembly

8/12/2019 Development of a Design Tool for Modern Gas
http://slidepdf.com/reader/full/development-of-a-design-tool-for-modern-gas 212/380
182
Figure 7.11 Allison 250-C20B final assembly after mod ification
Another fundamental engine modification was the inclusion of a bleed system. This
work cam e from previous efforts carried out by M urphy (200 4). The concepts behind this
system will briefly be introduced below. For detailed information, the above reference
should be consulted.
The bleed scheme used one of the two compressor discharge air tubes, which run
between the com pressor and combustor (Figure 7.12), to accomplish the design go al.
Figure 7.12 Allison 250-C20B discharge air tube (Adapted from Allison Engine
Company, 1999)

8/12/2019 Development of a Design Tool for Modern Gas
http://slidepdf.com/reader/full/development-of-a-design-tool-for-modern-gas 213/380
183
Three holes were made in the right discharge tube and a chamber, made of aluminum,
was fastened around the duct enclosing the three holes (Figure 7.13). To ensure that there
were no air leaks out of the bleed chamber, room temperature vulcanizing (RTV) material
was used to make gaskets. These custom-fitted gaskets were then placed around all
mating surfaces. Furthermore, an o-ring was used to stop air leakages where the bleed
chamber flange mates with the stainless steel pipe that routes the compressed air to the
Combustion Room. The bleed system was designed to permit for roughly one third of the
engine mass flow rate (0.5 kg/s or 1.1 lb/sec) to be bled (Murphy, 2004). The bled air
would have an approximate pressure of 7 bar (100 psi) (Murphy, 2 004).
Figure 7.13 Air bleed system assembly (Murphy, 2004)
To improve engine performance, another adaptation to the gas turbine engine was
carried out in this research project. A metering bellmouth was designed, constructed and
installed to improve flow quality into the compressor and to accurately measure air mass
flow rates (Section 7.2.4 for details) into the engine. The bellmouth design, consisting of
an elliptical inlet followed by a cylindrical throat, was taken from the ASM E long-radius

8/12/2019 Development of a Design Tool for Modern Gas
http://slidepdf.com/reader/full/development-of-a-design-tool-for-modern-gas 214/380
184
nozzle guidelines provided by Blevins (1984). The metering bellmouth geometry and its
dimensions can be seen in Figure 7.14.
Flow
184.1 mm
Aluminum Ring ^ -—
y ; ; ; ; ; ; ; ; ; ; ; ; ; m.6 mm
zzzzzzzzzz-\ - 1.0 mm
108.0 mm
130.0 mm Static Tap
Figure 7.14 Metering bellmouth
The bellmouth was manufactured using a vacuum forming process which was carried
out in the Industrial Designs Laboratory at Carleton University. In the vacuum forming
process, a thermoplastic sheet was heated and stretched onto a previously machined mold
which represented the negative geometry of the bellmouth (Figure 7.15). The stretched
sheet was held against the mold until the thermoplastic completely cooled. This clinging
process was achieved by creating a vacuum between the mold surface and the sheet via
strategically located holes. The mold, which was made of previously stacked and glued
medium-density fiberboards (MDF), was machined having a longer cylindrical throat
than the original design. This was done to ensure safe remov al of extra material plugg ing

8/12/2019 Development of a Design Tool for Modern Gas
http://slidepdf.com/reader/full/development-of-a-design-tool-for-modern-gas 215/380
185
the bellmouth outlet and to include a 45° draft angle to simplify the release of the formed
bellmouth from the mold.
Figure 7.15 Bellmouth mold
The final product was a smooth and structurally sound metering bellmouth which had to
be instrumented and then installed onto the compressor inlet as can be seen in Figure
7.16.
After having completed the metering bellmouth installation, a protective screen
(0.6 m by 0.6 m and 0.3 m deep) of 6 mm wire mesh was designed, manufactured and
assembled around the engine bellmouth to prevent foreign objects from entering and
damaging the engine (Figure 7.16) while it was runn ing.

8/12/2019 Development of a Design Tool for Modern Gas
http://slidepdf.com/reader/full/development-of-a-design-tool-for-modern-gas 216/380
186
Figure 7.16 Inlet protective screen
For safety reasons, the last modification performed on the Allison 250-C20B engine
was the addition of a fail-safe mechan ism. The purpose of the fail-safe mechan ism w as to
bring the running gas turbine down to idle conditions in case of engine control loss due to
failure of the hydraulic control system, which w ill be discussed b elow.
In the gas turbine combustion research laboratory, the Allison 250-C20B engine is
controlled by a hydraulic system which starts in the Control Room, spans across the
Combustion Room and finishes in the Gas Turbine Room. The hydraulic control system,
which regulates the amount of fuel injected into the Allison 25 0-C2 0B, is composed of a
throttle, in the Control Room, and a hydraulic actuator, in the Gas Turbine Room. These
two components are linked by stainless steel tubings and tube fittings to form a
completely closed loop system w hich is filled with hydraulic oil. A throttle movem ent in

8/12/2019 Development of a Design Tool for Modern Gas
http://slidepdf.com/reader/full/development-of-a-design-tool-for-modern-gas 217/380
187
the Control Room, therefore, makes the hydraulic actuator in the Gas Turbine Room
mov e. This actuator, which is mechanically linked via a rod to the Allison 250-C 20B fuel
control/governor system, in turn delivers more or less fuel into the gas turbine combustor.
In case of hydraulic oil loss, due to the breakage of any of the co mpon ents (i.e., throttle,
hydraulic actuator, tubings or tube fittings) making up the hydraulic control system, the
Allison 250-C20B would no longer be able to be remotely controlled, creating a
dangerous situation.
Adding an extension spring to the hydraulic control system is a way to evade the
above-mentioned potential problem. Once incorporated into the system the spring is
under a small load (spring almost unstretched) at idle engine conditions. As the engine is
brought to operating co nditions, other than idle, the spring, which is fixed at one end and
fastened to the fuel control/governor arm at the other end, stretches, increasing the
potential energy stored within it. In case of hydraulic control system failure (i.e.,
hydraulic oil loss and therefore, pressure loss in the control system) the potential energy
stored by the spring would then be released, returning the spring to its original
configuration. The contraction of the spring would bring the fuel control/governor arm
back to its idle position, thus, reducing the amount of fuel injected into the Allison 250-
C20B combustor. O nce at idle conditions, the gas turbine engine can be safely shut down
and the hydraulic control system failure can be addressed. Figure 7.17 shows various
views of the fail-safe mechanism.
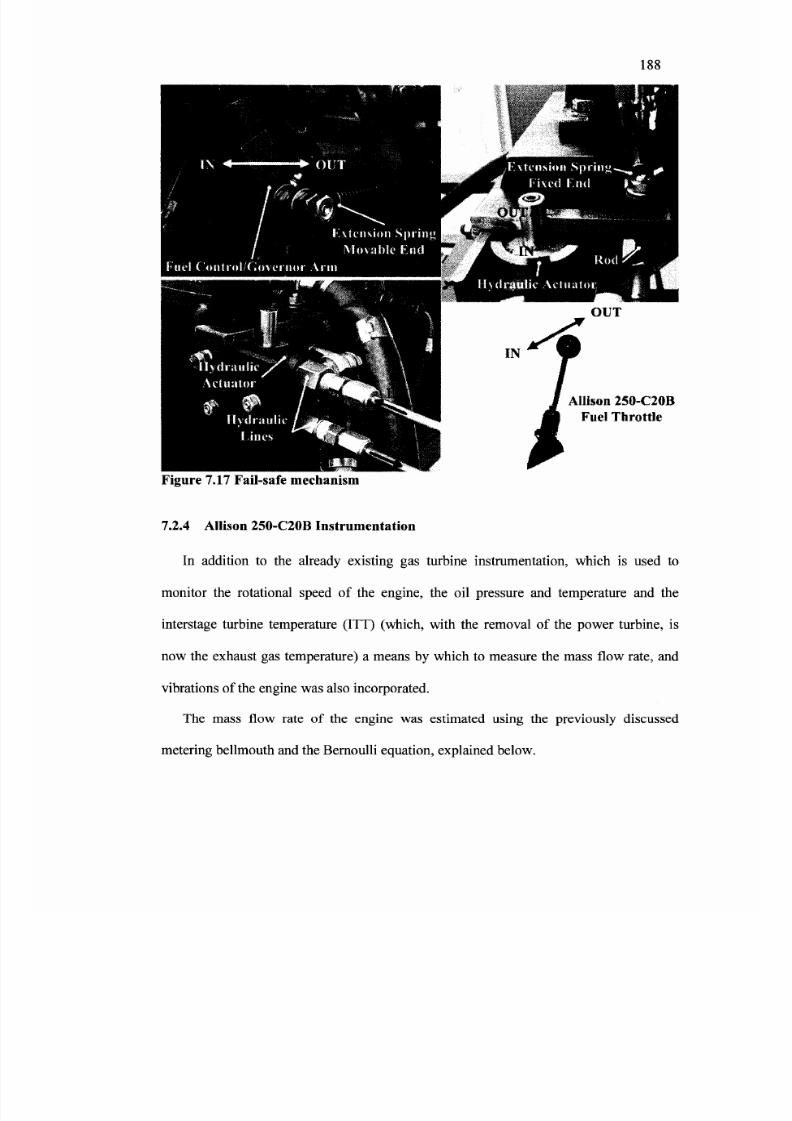
8/12/2019 Development of a Design Tool for Modern Gas
http://slidepdf.com/reader/full/development-of-a-design-tool-for-modern-gas 218/380
188
Allison 250-C20BFuel Th rottle
Figure 7.17 Fail-safe mechanism
7.2.4 Allison 250-C2 0B Instrumentation
In addition to the already existing gas turbine instrumentation, which is used to
monitor the rotational speed of the engine, the oil pressure and temperature and the
interstage turbine temperature (ITT) (which, with the removal of the power turbine, is
now the exhaust gas temperature) a means by which to measure the mass flow rate, and
vibrations of the engine was also incorporated.
The mass flow rate of the engine was estimated using the previously discussed
metering bellmouth and the Bernoulli equation, explained below.

8/12/2019 Development of a Design Tool for Modern Gas
http://slidepdf.com/reader/full/development-of-a-design-tool-for-modern-gas 219/380
189
Static TapFigure 7.18 Metering bellmouth principle
Assuming a steady state flow which is incompressible (Mach number, M < 0.3) and
frictionless, the Bernoulli Equation (7.1) can be applied to any two points on a streamline
(Figure 7.18) (White, 1999).
Px V
P 2 P 2(7.1)
If point 1 on the streamline is taken far upstream of the bellmouth w here the flow is
motionless (V = 0 ) and given that there are no streamline elevation changes (z , = z2 ),
the Bernoulli equation can be rewritten as:
Pi= Po +
(7.2)

8/12/2019 Development of a Design Tool for Modern Gas
http://slidepdf.com/reader/full/development-of-a-design-tool-for-modern-gas 220/380
190
w h e r e P=Pr 1
r atm
Hence, by measuring the atmospheric pressure ( p ) and the static pressu re inside the
bellmouth ( p 2 ), the velocity (V ) can be calculated.
Once the air velocity inside the bellmouth is obtained, the engine mass flow rate can
be estimated using the following equation:
™ 1 = P V2 Al (7.3)
With V2 obtained and A2 calculated using the bellmouth diameter at the wall taps
location, the only factor missing in Equation (7.3) is the air density ( p ) . A ssuming that
air behaves as an ideal gas, the density can be calculated as,
p = JL - (7-4)R T
a
where p is the air atmospheric pressure (p )
T is the air temperature
R is the air gas constant
As can be concluded from the above theory, the three experimental measurements
needed to estimate the gas turbine m ass flow rate are the atmo spheric pressure, the static
pressure at the bellmou th throat and the air temperature entering the engine.
The Gas Turbine Room atmospheric pressure was measured by a pressure transducer
whose company and model number are Viatran 218. The range of this absolute pressure
transducer, shown in Figure 7.25, varies between 0 Pa to 103.42 kPa (0 psi to 15.0 psia)
with a corresponding ou tput signal of 0 VDC to 5 VDC.

8/12/2019 Development of a Design Tool for Modern Gas
http://slidepdf.com/reader/full/development-of-a-design-tool-for-modern-gas 221/380
191
Experimentally, the static pressure can be measured using wall taps whose design is
shown in Figure 7.18. Static pressure is a difficult measurement to make. Therefore,
general guidelines are given for machining wall taps so that measurement accuracy can
be maximized. The three recommended practices given by Saravanamuttoo (1990) for
machining wall taps, are as follows:
• the wall tap hole(s) mu st be betw een 1.0 mm and 1.2 mm ;
• the hole(s) has to be drilled perfectly normal to the wall where the pressure is to
be measured; and
• the hole(s) edges mu st be perfectly square and free of any burrs (if they exist)
produced by the drilling process.
Closely following the above recommendations will ensure a minimum of disturbance to
the flow passing over the wall tap(s), thus, giving m ore accurate m easurements.
To make a better estimate of the static pressure, the Allison 250-C20B metering
bellmouth was instrumented with four wall taps, circumferentially spaced at 90° intervals.
To reduce instrumentation costs as well as data acquisition times, the four wall taps w ere
connected, via Teflon tubings, to an averaging manifold, which in turn was connected,
through a single Teflon tubing, to a second pressure transducer present in the engine test
cell, as shown schematically in Figure 7.19. The Teflon tubing, purchased from
Scanivalve11 , had a 1.37 mm (0.054 in) inner diameter and a 2.18 mm (0.086 in) outer
diameter with a recommended maximum working pressure of 3450 kPa (500 psi) and a
maximum working temperature of 260°C. The pressure transducer used to measure the
Technel Engineering Inc., 60 Marycroft Ave. Unit 2, Woodbridge, Ontario L4L 5Y 5, Canada

8/12/2019 Development of a Design Tool for Modern Gas
http://slidepdf.com/reader/full/development-of-a-design-tool-for-modern-gas 222/380
192
bellmouth static pressure was a PX243A, purchased from Omega Enginnering 12 (Figure
7.25). The pressure range measured by this instrument varied within a gauge pressure of
± 17.23 kPa (± 2.5 psi) and the transducer analog output (1 to 6 VDC) was temperature
compensated.
Static Pressure
Figure 7.19 Averaging manifold
To estimate the air density to be used in Equation (7.4), a means b y which to measure
temperature was needed. The most common gas temperature sensor used when
instrumenting gas turbine engines are thermocouples (Saravanamuttoo, 1990).
Therm ocouples, in their simplest form, consist of two wires made of different metals and
joined at one end as shown in Figure 7.20.
12 Omega Engineering 976 Bergar, Laval (Quebec) H7L 5A1, Canada

8/12/2019 Development of a Design Tool for Modern Gas
http://slidepdf.com/reader/full/development-of-a-design-tool-for-modern-gas 223/380
193
+ _ Metat A
_ oMetal B
eAB = SEEBECK VOLTAGE
Figure 7.20 Thermocouple working principle (Omega Engineering, 2004)
With a change in temperature, the dissimilar metals produce a continuous current which
flows in the thermoelectric circuit. The change in electromotive force (emf) between the
two metal ends can be read by a voltmeter. Through mathematical manipulations,
(Omega E ngineering, 2004) the millivoltage is then transformed into engineering un its of
temp erature such as °C, K, °F, or °R.
For this research project, from the many ty pes of thermocou ples available, the type K
thermocouple was chosen to be used throughout the gas turbine combustion research
laboratory. The type K thermocouple was selected because of its operating temperature
range which is from -270°C to 1372°C and because of its lower cost when compared to
other thermocouple types used in high temperature applications. In the type K
thermocou ple, the two m etals making up the wires of the sensor are nickel-chromium (+),
also known as Chromel, and nickel-aluminun (-), also referred to as Alumel (Figure
7.21). The sheath metal protecting the wires was chosen to be stainless steel (316) for the
thermocouples measuring temperatures upstream of the combustor and for the Allison
250-C20B inlet and Hastelloy for the thermoco uples m easuring the liner wall temperature
and the exhaust gasses from the microturbine com bustor and from the Allison 25 0-C20 B.
>

8/12/2019 Development of a Design Tool for Modern Gas
http://slidepdf.com/reader/full/development-of-a-design-tool-for-modern-gas 224/380
194
Sheath Metal ^ , , , x
Chrome (+)
Magnesium OxideInsulation
Alumel {-)
Figure 7.21 Type K thermocouple nomenclature (Adapted from Omega
Engineering, 2004)
After having selected the type of gas temperature sensor to be used, the engine was
instrumented with two type K thermocouples. One thermocouple was placed at the
bellmouth inlet, as is shown in Figure 7.16, and a second thermocouple was inserted into
the exhaust manifold. The inlet thermocouple measured the air temperature entering the
engine, needed for estimating the air density. The second thermocouple, measuring the
exhaust gas temperature, was a redundant measurement since, as previously mentioned,
the engine manufacturer had already provided a means by which to measure this hot gas
temperature. However, having two sensors measuring the exhaust gas temperature
permitted both people in the Control Room to monitor this very critical engine operating
parameter so that, in case of emergency, reaction time delays or confusion could be
minimized.
Since the engine configuration had been changed, a piezoelectric accelerometer was
also insta l led on the All ison 250-C20B to see i f the engine vibrat ion s ignature ( i .e . , the
engine natural frequencies) had been altered.
The piezoelectric accelerometer is a sensor that produces an electrical signal
proportional to acceleration. Specifically, the accelerometer is composed of a

8/12/2019 Development of a Design Tool for Modern Gas
http://slidepdf.com/reader/full/development-of-a-design-tool-for-modern-gas 225/380
195
piezoelectric crystal element and an attached mass (Figure 7.22). As the engine vibrates
relative to its surroundings, the mass exerts an inertial force on the piezoelectric crystal
(Omega Engineering, 200 0). The force prod uces a proportional electrical charge (V = e in
Figure 7.22) on the crystal which is then mathematically manipulated to display units of
acceleration (g). The accelerometer, purchased from Omega Engineering, was an
ACC101 (Figure 7.22). The output of this accelerometer is 100 mV per gravitational
acceleration (g) with a maxim um operating range of ± 80 g.
DIMENSIONS IN MM (INCHES)
Figure 7.22 Accelerometer working principle and actual ACC101 accelerometer
(Adapted from Omega Engineering, 2000)
The Allison 250-C2 0B accelerometer installation points were suggested by the engine
manufacturer. Figure 7.23 shows such installation points.
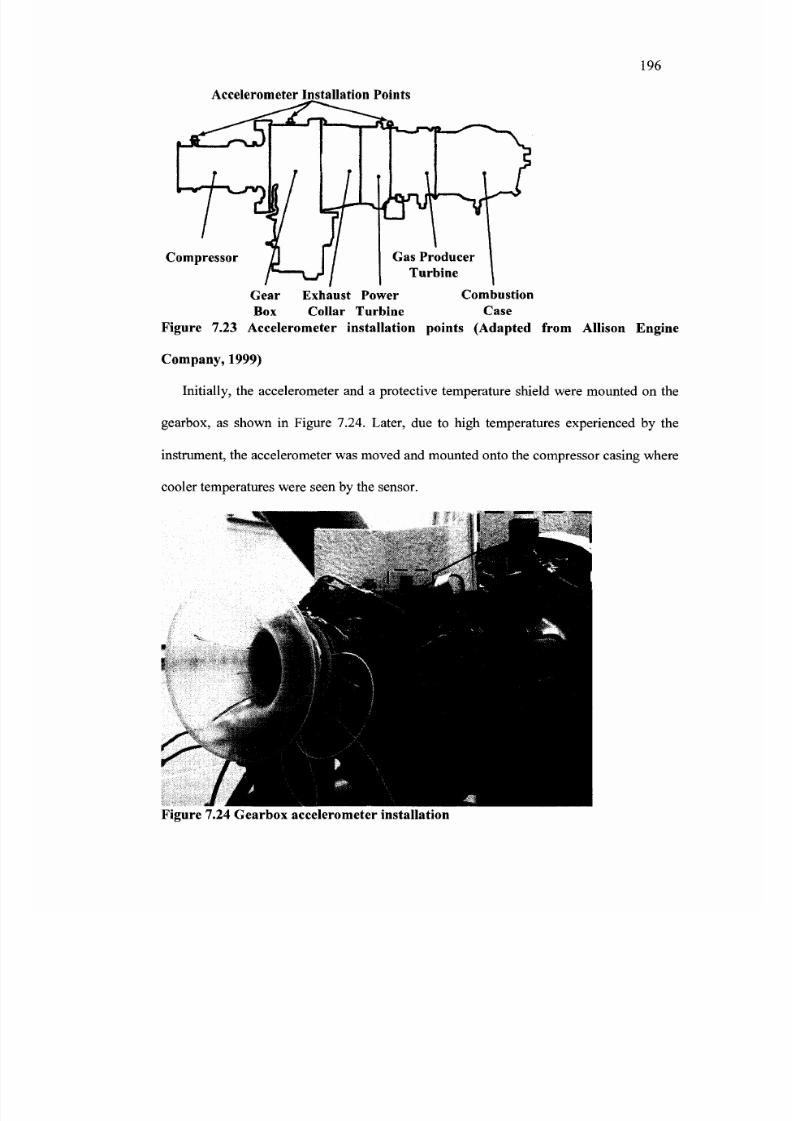
8/12/2019 Development of a Design Tool for Modern Gas
http://slidepdf.com/reader/full/development-of-a-design-tool-for-modern-gas 226/380

8/12/2019 Development of a Design Tool for Modern Gas
http://slidepdf.com/reader/full/development-of-a-design-tool-for-modern-gas 227/380
197
The pressure traducers used in the engine test cell were mounted within an enclosure
for extra protection (Figure 7.25). All the pressure, temperature, and vibration
measurements taken from the Allison 250-C20B were routed from the enclosure to the
data acquisition system in the Comb ustion Room . From there, the acquired measurem ents
were then directed to the Control Room where they were transformed from non-
engineering units (VDC, mVDC) into engineering units (Pa, °C and g) for monitoring
and storage purposes.
A e c e l e r o m e t e r
* P o w e r SUDDIV
A t m o s p h e r i c
P r e s s u r e T r a n s d u c e r
V i a t r a n 2 l 8
Data ToControl Room
>w WSS»i*?»»#«w*
T r a n s d u c e r s
Power Supp ly Itatic P ressu re
Transducer
P X 2 4 3 A
Figure 7.25 Test cell instrumentation

8/12/2019 Development of a Design Tool for Modern Gas
http://slidepdf.com/reader/full/development-of-a-design-tool-for-modern-gas 228/380
198
7.3 Com bustion Room
The Combustion Room (2 in Figure 7.26) is an L shaped area, with lengths of 8.5 m
(28 ft) by 7.6 m (25 ft) and a distance between walls of 3.3 m (lift). This room, in
addition to housing the atmospheric blower (system C in Figure 7.26), is where the
microturbine combustor under investigation is located. The following sections will
describe the design, construction and instrumentation of the apparatuses present in this
room, namely, the air delivery system (system A in Figure 7.26) and the fuel delivery
system (system B in Figure 7.26).
D
1Gas Turbine
Room
I SIDE V I E W1 vn
I A 1
^
M l
:
K7l£B
Combustion
Room
(SIDE VIEW I
05 vnControl Room
a
I:
t .J Atmospheric
.; BlowerI*
P
\1 — — J*j j
Figure 7.26 Gas turbine combustion research laboratory layout

8/12/2019 Development of a Design Tool for Modern Gas
http://slidepdf.com/reader/full/development-of-a-design-tool-for-modern-gas 229/380

8/12/2019 Development of a Design Tool for Modern Gas
http://slidepdf.com/reader/full/development-of-a-design-tool-for-modern-gas 230/380
200
the air delivery system coupled to the Allison 250-C20B engine. Figure 7.28 shows the
side view of the air delivery system found in the Co mbustion Room .
The air delivery system dimensions, reported below, will be given in imperial units
since this is the dominant system used when dealing with piping and pipelines. A table
with piping dimension details and unit conversions can be found in A ppendix D.
Pressurized Airto
Combustion Room
k
i yc
Figure 7.27 Air delivery system layout in Gas Turbine Room
Combus t ion Room
Exhaust To Atmosphere
r3fl
IAir From Gas Turbine Room
^ Butterfly Valve Pressure Switch
ExpansionBellows
\ \
\
//////// ////)/// \Orifice\ ///////; tScale
Figure 7.28 Air delivery system layout in Combustion Room

8/12/2019 Development of a Design Tool for Modern Gas
http://slidepdf.com/reader/full/development-of-a-design-tool-for-modern-gas 231/380

8/12/2019 Development of a Design Tool for Modern Gas
http://slidepdf.com/reader/full/development-of-a-design-tool-for-modern-gas 232/380
202
The pressure losses of the air delivery system were estimated by the creation of two
Mathcad programs. The first program (details given in Section 7.3.3) could
thermodynamically model the Allison 250-C20B gas turbine engine. The second program
used the thermodynamic outputs, calculated by the first program, to estimate the air
delivery system pressure drop. For detailed information on how to estimate pressure
losses in pipe and duct flows, please refer to B levins (1984) and W hite (1999).
Using the first program, with the engine operating at 100% rotational speed, the air
mass flow rate bled by the engine was estimated to be 0.5 kg/s (Murphy, 2004). The bled
air would have a pressure of 7 .1 bar (Allison Engine Company, 1999) and a temperature
of 645 K (calculated by program). Using these air properties as input for the second
program, the pipe system pressure loss could be estimated as described belo w.
The air velocities and Reynolds numbers inside the various pipe diameters were
calculated. Since the Reynolds numbers were found to be above 4000 (Re>1.8xl05),
the flow within the pipes was determined to be turbulent. Using a stainless steel pipe
roughness (8 ) of 0.002 mm (W hite, 1999), the turbulent friction factors ( / ) throughout
the system were calculated as,
f -
f „ , „ . V -2
1.14-2hgj 10
e 21.25+ •
£ > , „ Re09
(7.5)
\^pipe "~pipej_
The pressure drop caused by friction was then estimated using the Darc-Weisbach
formula shown below.
P a p i p e J L p i p e (7.6). v r
AP =pipe
where AP is the pipe pressure drop

8/12/2019 Development of a Design Tool for Modern Gas
http://slidepdf.com/reader/full/development-of-a-design-tool-for-modern-gas 233/380
203
Dpipe is the pipe inner diameter
Lp iP e
i s t h e PiPe l e n S t h
V i is the average flow velocity over the pipe cross section
p a is the air density
/ is the turbulen t friction factor
Ne xt, the program calculated the non-recoverable loss coefficients of the various parts
making up the air delivery system, such as the butterfly valve, gradual expansions,
gradual contractions (conical pipes), and the many bends. Only the non-recoverable loss
coefficient calculations for the butterfly valve will be shown below. The remaining
calculated non-recoverable coefficients are presented in Table 7.1. The formulas to
calculate the tabulated non-recoverable coefficients can be found in Blevins (1984).
The process to calculate the butterfly valve non-recoverable coefficient started by
digitizing the com pany provided performance curve of the Jam esbury 815 W butterfly
valve (Figure 7.29). Figure 7.29 shows the flow coefficient as the butterfly valve aperture
goes from fully closed (0% ) to fully open (1 00% ). To convert the flow coefficient (C v )
into the non-recoverable loss coefficient (Kvalve), the following equation was used
(Jamesbury, 2003):
^ r a / v e = 0 . 8 5 6 9 C v (7.7)
where Kvahe is the butterfly valve non-recoverable loss coefficient
Cv is the butterfly valve flow coefficient

8/12/2019 Development of a Design Tool for Modern Gas
http://slidepdf.com/reader/full/development-of-a-design-tool-for-modern-gas 234/380
204
165
150
135
120
105
90
75
60
45
30
15
0
—— Jamesbury 815W Butterfy Valve
—x— Mathcad Curve
0 20 40 60 80 100% Open
Figure 7.29 Jamesbury 815W flow coefficient as a function of valve ap erture
Finally, the pressure drop caused by the butterfly valve w as calculated as,
T2
AP =n Vra valve y alve
(7.8)
Equation (7.8) can be used to estimate the pressure losses created by the gradual
expansions, gradual contractions and many bends present in the air delivery system.
However, the non-recoverable loss coefficient and air velocity used in the above formula
should reflect the component being analyzed. The following table shows the calculated
results for the non-recoverable loss coefficient of the aforementioned components. The
total pressure drop in the air delivery system, from bleed to orifice plate, was the
mathematical addition of the pressure drops across each of the components and the
pressure losses due to friction. Therefore, the total pressure drop in the air delivery
system was estimated to be 2700 Pa (3.8 psi). This value, calculated with a fully open
butterfly valve, also included a 3 % pressure drop across the combu stor.

8/12/2019 Development of a Design Tool for Modern Gas
http://slidepdf.com/reader/full/development-of-a-design-tool-for-modern-gas 235/380
205
Table 7.1 Air delivery system n on-recoverable coefficientsComponent Description
Butterfly Valve
Conical Contraction
Conical Expansion45° Bend
90° Bend
180° Bend
Component Amount
1
1
21
51
Non-recoverable Coefficient(K)
2.6
0.03
0.070.140.21
0.28
The overall length of the air delivery system resulted from guidelines which ensure
that the air flow is fully developed before pressure measurements can be taken. Major
flow disturbances created by elbows present in the air delivery system design produce
secondary and swirling flows within the pipe system (Figure 7.30). For air flow pressure
measurements to be repeatable during testing, the flow within the pipes has to be fully
developed (Figure 7.30). Therefore, a sufficient length of straight pipes has to be present
downstream of these disturbances. Blevins (1984) suggests a minimum of 10 straight
pipe diameters upstream of any pressure instrumentation. When considering the metering
orifice plate, Blevins suggests 20 diameters of straight pipe upstream of the orifice and
four diameters of straight pipe downstream of the orifice. These guidelines were followed
in the design of the air delivery system resulting in a total rig length of 7.7 m (25.2 ft) as
shown in Figure 7.31.

8/12/2019 Development of a Design Tool for Modern Gas
http://slidepdf.com/reader/full/development-of-a-design-tool-for-modern-gas 236/380
206
Highvelocity
Pipe Fully Developed Flow
Laminar Turbulentfle<»00 «e = 2 .3 x i 0 * /?« -1 .1x1 0 * f i e = 3 .2x lO e
Swirl results atoutlet fromtwo bends inperpendicular
(b) planesFigure 7.30 Pipe flows (Baker, 2003)
n
I
T I m-s' H tnt
Combustion Room
i t
3\ \\ V\ \
77777777
\ \
//////// \Orifice \ 7777777?-/
_ 7,7 m
(25.2 ft)
Figure 7.31 Air delivery system total length
The material selected for the pipes making up the air delivery system was stainless
steel with a 316L grade. This material was found to be a good compromise between cost
and performance since, as previously mentioned, 316L grades can be used up to 1200 K

8/12/2019 Development of a Design Tool for Modern Gas
http://slidepdf.com/reader/full/development-of-a-design-tool-for-modern-gas 237/380
207
(925°C) for continuous temperature operations and up to 1140 K (870°C) for intermitted
temperature operations (Bhadeshia and Honeycombe, 2006).
The pipe thicknesses were chosen according to guidelines given in the Process Piping
ASME B31.3 (2002) code and in the engineering standards manual from the Los Alamos
National Laboratory (LANL, 2005). Figure 7.32 summarizes, in a graphical manner, the
maximum allowable operating conditions for non-threaded stainless steel (316L) pipes
having a schedule 40S for wall thickness (for data please refer to Appendix E).
x
I
mnn -
100 -
10 -
l -
Air I leliver 1 Systom Des gn I'o ini
4 0 S P i p e ( 3 1 6 L )
| |
2.4 6.9 8.6 17.9 27.9 30.7
Maximum Operat ing Pressure (bar )
33.1 41.4
Figure 7.32 Maximum operating conditions of sch. 40S stainless steel (316L) pipes
Therefore, from the guidelines given by the aforementioned references, the decision was
made to have a 40S schedule for the wall thickness for all the pipes. Furthermore, the
maximum allowable operating temperature and pressure of the air delivery system were
established to be 900 K and 6.9 bar respectively.
To absorb thermal expansion two bellow-type expansion joints were used in the air
delivery system. These bellows, made of corrugated stainless steel (316), had been
purchased during Murphy's work. The main attraction of this type of expansion joint,

8/12/2019 Development of a Design Tool for Modern Gas
http://slidepdf.com/reader/full/development-of-a-design-tool-for-modern-gas 238/380
208
when compared to slip joints, is that they do not have leakage problems and they do not
require periodic maintenance. One bellow was installed downstream of the butterfly
valve and the second bellow w as installed dow nstream of the orifice p late.
The design of the air delivery system w as envisioned to be modu lar so that it could be
easily installed and adapted for future research projects. For these reasons, the system
was made up of various pipe sections which were fastened together via slip-on flanges.
Figure 7.33 shows an example of a pipe section whose ends are composed of stub ends
and slip on flanges. The stub ends were joined at each end of the pipe section using
GTAW as the welding process.
Flange
Stub End
Straight Pipe
90* Long
RadiusElbow
Welded Joints
Stub End Flange
Figure 7.33 Example of pipe section
The welding process, joining the various pipe segments (i.e., pipes, elbows,
contractions, expansions and stub ends), followed guidelines given by the American
Welding Society (AWS D14.6, 2005, AWS C5.5-80). In particular, a bevel (see detail in
Figure 7.34), if not already existing, was machined on all the surfaces of the compo nents
to be butt welded. M achining bevels ensured that full weld penetration could be achieved.

8/12/2019 Development of a Design Tool for Modern Gas
http://slidepdf.com/reader/full/development-of-a-design-tool-for-modern-gas 239/380
209
Figure 7.34 shows one of the many welding drawings given to FullFusion W elding which
carried out the pipe welding process. For clarification of welding symbols, please refer to
the following standard AWS A2.4-98 (AWS A2.4, 1998).
GTAW
£ V x x x \ \ < > v x x x x /; // ////////////// // //////// /AX J X X X X X X \ X X N X X X X ' // // // /S S/ // / , /S // S/ // // // /, /
x x x x x xK \ \ x 1 x
I I ^ V. ^ V 177 S? WSi t
\ i r T ;\ 2.4 mm
\x.
X
/ /y // // // // ss \s/ // // y
PipeStub End
Slip-on Flange
Figure 7.34 Example of pipe welding
Once the joining process was completed, the pipe sections could then be fastened
together via the slip on flanges and the use of bolts and nuts. The selection of the bolts
and nuts took into consideration the high pressure and high temperature of the air
delivery system. To reduce laboratory construction costs, two types of bolt and nut
material were used. Upstream of the combustor, the cooler operating temperatures
permitted to use of medium-carbon, grade 7 type bolts and nuts. Downstream of the
combustor austenitic chromium nickel 18/8 steel type (stainless steel) bolts and nuts were
used because of their higher temperature applications (848 K; 575°C). All the bolts and

8/12/2019 Development of a Design Tool for Modern Gas
http://slidepdf.com/reader/full/development-of-a-design-tool-for-modern-gas 240/380

8/12/2019 Development of a Design Tool for Modern Gas
http://slidepdf.com/reader/full/development-of-a-design-tool-for-modern-gas 241/380
211
tubing. The 5 cm (2 in) square tubing, made of mild steel, had a wall thickness of 3 mm
(1/8 in). The tubing w as cut and welded to its final geometry as seen in Figure 7.36. The
pipes were supported by riser clamps whose height could be adjusted through turning
stainless steel nuts fastened onto 1.35 cm (0.5 in) stainless steel threaded rods. The
number of frames used to support the air delivery structure was guided by information
found in literature (Nayyar, 2000) and by introducing a safety factor to take into
consideration the high tem perature application.
1.6 m
Figure 7.36 Supporting frame
7.3.3 Air Delivery System Com ponents
The com ponent that controls the amount of air that can be bled from the Allison 250-
C20B is the Jamesbury 815W butterfly valve shown in Figure 7.37. The butterfly valve,

8/12/2019 Development of a Design Tool for Modern Gas
http://slidepdf.com/reader/full/development-of-a-design-tool-for-modern-gas 242/380
212
which had been purchased during Murphy's work, was originally manually controlled.
The actuation mode was updated to be electrically operated so that the butterfly valve
could be remotely handled from the Control Room.
//
/
/
t
t n j ]
/
, Butterfly Valve/ Jam esbury 815W
/
nL tr S 5)
//////// //////// ////////Figure 7.37 Jamesbury 815W butterfly valve
////////
With the butterfly valve fully open, the component that constrained the maximum
amount of air bled from the engine was the orifice plate hole diameter. The orifice plate
material was Hastelloy X and the plate geometry (Figure 7.38) was cut out of a piece of
sheet 1.6 mm (1 /16 in) thick. The ma chining proc ess used to fabricate the orifice plate
was abrasive water jet cutting performed by Hydrotech Cutting14
. The estimation of the
orifice hole diameter required some reverse en gineering work w hich is presented next.
Hydrotech Cutting Inc., 75 Bongard Av., Nepean, Ontario K2E 6V2, Canada

8/12/2019 Development of a Design Tool for Modern Gas
http://slidepdf.com/reader/full/development-of-a-design-tool-for-modern-gas 243/380
213
n
u
X 2 )T-A\ \\ \
\ \
//////// ////'////\ \ //////// ////////
Orifice Plate
Figure 7.38 Orifice plate
The orifice hole diameter had to be sized in such a way that the maximum amount of
air mass flow rate bled from the Allison 250-C20B would not cause the interstage turbine
temperature (ITT) to exceed its limit. For the engine model this maximum allowable ITT
was 1083 K (810°C) (Allison Engine Company, 1999). There is a relationship between
the amount of air bled from the engine and the engine ITT which, with the removal of the
power turbine, is now the EGT. As air is bled downstream of the compressor, a work
unbalance between the shaft coupled compressor and the turbine is created, where the
compressor work is higher than that of the turbine. To compensate for this work
unbalance, more fuel is injected into the combustor. The combustion process transforms
the chemical energy of the reactants into kinetic energy which is then changed into work
by the turbine until equilibrium is once again reached. The injection of more fuel into the
combustor to compensate for the work unbalance translates into higher gas temperatures
and, if not careful, the maximum allowable EGT can easily be exceeded. Therefore, a
Mathcad program was created to size more precisely the orifice hole diameter so that

8/12/2019 Development of a Design Tool for Modern Gas
http://slidepdf.com/reader/full/development-of-a-design-tool-for-modern-gas 244/380
214
when the butterfly valve was fully open, the amount of air bled from the Allison 250-
C20B w ould, therefore, be limited..
The program, whose algorithm is presented in Figure 7.39, modeled a simple gas
turbine thermodynamic cycle and used the outputs to size the orifice plate hole. The
program w as based on theory found in Saravanam uttoo (2001) and G authier (2005).
Test Cell Input
Ambient Temperature (Tu)Ambient Pressure (Palm)
i '
Compressor OutputsCompressor Discharge Temperature (T02)Compressor Discharge Pressure (P 2)
i 'Compressor Outputs
Net Compressor Work (wcam/l)
i 'Combustor O utputs
Combustor Discharge Pressure (Pos)
..-.——J '
TurbineExhaust Gas Temp
Turbine DischarNet Turbine
Outputsattune (EGT) (T04)JC Pressure (Pm)Work (wltl,b)
Gas Turbine InputEngine Rotational Speed (% N t)
Air Mass Flow (« JCompressor Pressure Ratio (PR)
Compressor Isentropic Efficiency (j jlvm/,)
Gas Turbine InputMechanical Losses (rj„, = 0,99)
Gas Turbine InputBleed fajfej
Combustor Efficiency (r}cmik = 0.99)Combustor Pressure Losses
(AP,m, 0.04 x P02 )
Fuel Heating Value (50032 kJ/kg)
Gas Turbine InputTurbine Inlet Temperature (TIT)
Turbine Isentropic Efficiency (>/,„,/,)
Figure 7.39 Program algorithm for simple gas turbine thermodynamic cycle
Due to lack of Allison 250-C20B engine performance data, the program inputs used
information found on a T-63-A-700 (Haas, 1996) gas turbine engine (Table 7.2), which is
the military derivative of the 250 model. In particular, the developed Mathcad program
assumed that these two engines had the same compressor (Tlcom ) and turbine (7 < u r i )

8/12/2019 Development of a Design Tool for Modern Gas
http://slidepdf.com/reader/full/development-of-a-design-tool-for-modern-gas 245/380
215
isentropic efficiencies which varied depending on the engine rotational speed (Ni). The
remaining program inputs, such as air mass flow rate ( m ) and pressure ratio (PR), were
those of the Allison 250-C20B. The key program outputs, which permitted the sizing of
the orifice h ole diameter, were the compressor discharge pressure (CDP) and temperature
(CDT) as well as the exhaust gas temperature (EGT). The program outputs, shown in
Table 7.3, were verified against Haas (1996) and the commercially available software
GasTurb 10 and were found in good agreem ent.
Table 7.2 Predicted thermodynamic performance of T63-A-700 (Haas, 1996)
T 6 3 - A - 7 0 0
N , (%)
70.0
75.0
80.0
85.0
90.0
95.0
100.0
m a
(kg/s)
0.9
1.0
1.1
1.1
1.2
1.3
1.4
A i r M a s s
F low %
(Tota l )
62.7
66.9
74.8
78.8
87.3
94.4
100.0
P* arm
( b a r )
1.0
1.0
1.0
1.0
1.0
1.0
1.0
^7comp
0.764
0.772
0.781
0.786
0.787
0.771
0.743
^turb
0.872
0.879
0.882
0.881
0.883
0.883
0.883
C D P
( b a r )
2.9
3.4
3.9
4.5
5.1
5.7
6.3
C D T
(K)
422
442
462
481
502
526
552
E G T
( K )
642
673
739
780
833
902
980
Table 7.3 Calculated thermodynamic performance of Allison 250-C20B
Allison 250-C20B
Ni (%)
85.0
90.0
95.0
100.0
m a
(kg/s)
1.2
1.4
1.5
1.6
Air Mass
Flow %
(Total)
78.8
87.3
94.4
100.0
atm
(bar)
1.0
1.0
1.0
1.0
' /comp
0.786
0.787
0.771
0.743
^ t u r b
0.881
0.883
0.883
0.883
CD P
(bar)
5.1
5.8
6.6
7.1
CD T
(K)
502
524
549
576
E G T
(K)
786
838
908
987
After having obtained confidence in the program outputs, a series of computer
simulations were carried out. The purpose of the simulations was to estimate the
maxim um amount of air that could be safely bled from the engine before the E GT lim it of

8/12/2019 Development of a Design Tool for Modern Gas
http://slidepdf.com/reader/full/development-of-a-design-tool-for-modern-gas 246/380
216
1083 K (810°C) was exceeded. The simulation results can be seen graphically in Figure
7.40.
1100
1000
900
800
700
£ 600H
§ 500
400
300
200
100
0
— - —
• -
jmmm * " ^ ^ *
<Mfi<
- — "
« — * " ^ ^
e Sizing
r • —
- ^ - " '
_ . _ -
. — - '
^^ , -
. «__- * 00^ v
>M
9 5 % R P M
— - 90% R P M
- - - 8 5 % R P M
— EGT LIMIT
0.0 0.1 0.7 0.8.2 0.3 0.4 0.5 0.6
Bleed Mass Flow Ra te [kg/s]
Figure 7.40 Effects of bleed mass flow rate and engine operating p oint on EG T
Figure 7.40, shows that theoretically the maximum amount of air that can be safely
bled from the Allison 250-C20B while running at full rotational speed is approximately
kg0.37 — . By reducing the engine rotational speed by 5% , the amount of air that can be
s
kgsafely bled is approximately 0.63 —^. With these results in mind a conservative app roach
sfor the orifice hole sizing was taken. Therefore, the orifice hole diameter was calculated
with the engine operating at 95% of the full rotational speed and a maximum bleed mass
kgflow rate of 0.40-^.
s

8/12/2019 Development of a Design Tool for Modern Gas
http://slidepdf.com/reader/full/development-of-a-design-tool-for-modern-gas 247/380
217
Using theory found in Blevins (1984), the orifice hole diameter was calculated to be
19.0 mm (0.75 in). Taking into consideration that the orifice sizing was done using an
analytical tool (Mathcad program), which is based on simplifying assumptions two more
orifices with their holes slightly oversized when compared to the original design were
manufactured. The two orifice hole diameters were 20.8 mm (0.82 in) and 22.9 mm (0.90
in) respectively.
The last component making up the air delivery system is a pressure switch. The
pressure switch in Figure 7.41 was purchased from Omega Engineering and its model
number is PSW-108. The air delivery system was equipped with a pressure switch for
safety reasons.
As the name implies, the pressure switch is a switch that senses pressure and that
actuates an electrical signal by changing the position of the electrical contacts within the
15 amp , single pole, double throw switch (Figure 7.42). The pressure sensing mechanism
(actuator) can be adjusted between 0.2 bar and 6.9 bar (3 psi to 100 psi) and the switch
can be wired either "normally open" (i.e., no electrical current flowing through the
switch) or "norm ally closed".
f ^ J ^ T N
7T7V7TT7 / / / / / / / /
Figure 7.41 Pressure switch location in air delivery system (Adapted from Omega
Engineering, 2000)

8/12/2019 Development of a Design Tool for Modern Gas
http://slidepdf.com/reader/full/development-of-a-design-tool-for-modern-gas 248/380
218
In the gas turbine combustion research laboratory the pressure switch was
mechanically connected to the air delivery system via a 6.4 mm (0.25 in) stainless steel
tubing and was electrically linked, through wires, to the on/off solenoid valve (ASCO
8223G027) p resent in the fuel delivery system (valve details given in S ection 7.3.7). The
switch was wired in the normally open position and the pressure sensing mechanism was
adjusted to actuate at pressures higher than 2 bar (30 psi). In other words, at pressures
higher than 2 bar, the pressure sensing mechanism would change the position of the
electrical contacts from open to closed, allowing current to reach the on/off solenoid
valve in the fuel delivery system. In case of a sudden pressure loss in the air delivery
system, due to an Allison 250-C20B malfunction for exam ple, the pressure switch w ould
automatically open, stopping the current from flowing to the on/off solenoid valve. The
now de-energized on/off solenoid valve would automatically close, stopping the fuel flow
into the microturbine com bustor and therefore, im peding any further combu stion process.
Electrical Wires { • • ^ • • • S . S P D T Switch
On/Off Solenoid Valve
Actuator
Air Delivery SystemPressure
Figure 7.42 PSW-108 pressure switch details (Adapted from Omega Engineering,
2000)

8/12/2019 Development of a Design Tool for Modern Gas
http://slidepdf.com/reader/full/development-of-a-design-tool-for-modern-gas 249/380
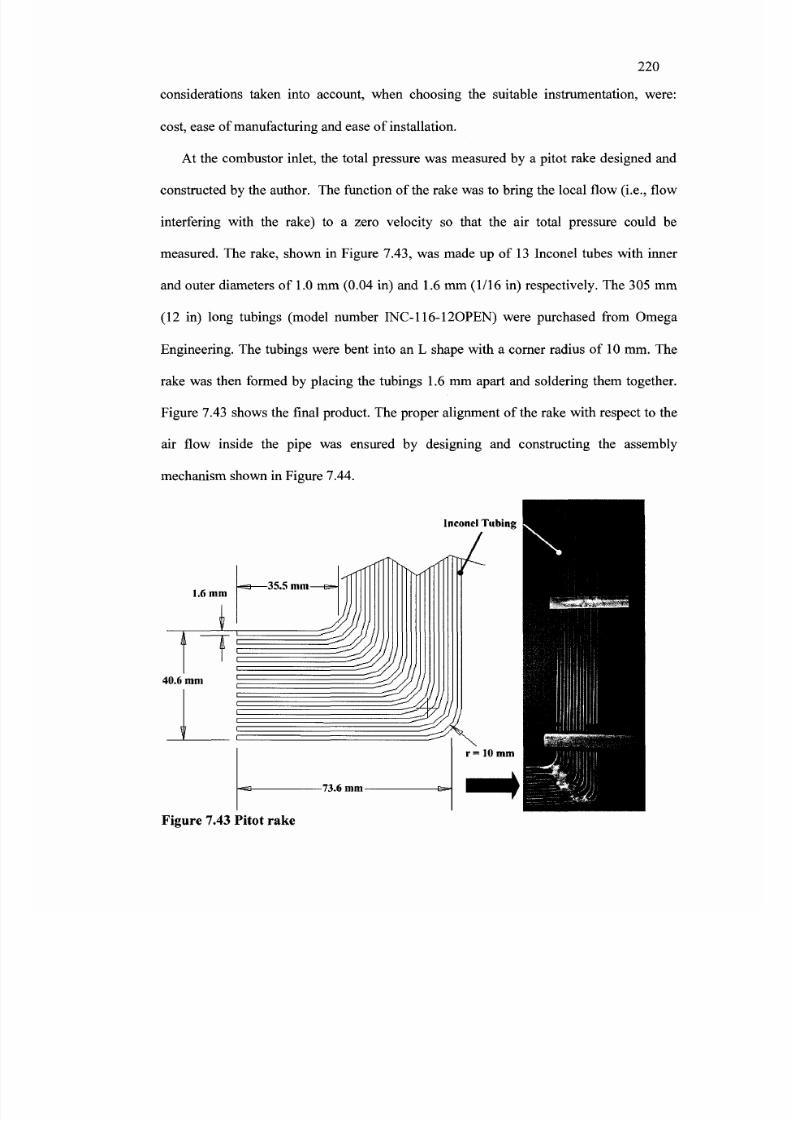
8/12/2019 Development of a Design Tool for Modern Gas
http://slidepdf.com/reader/full/development-of-a-design-tool-for-modern-gas 250/380
220
considerations taken into account, when choosing the suitable instrumentation, were:
cost, ease of manufacturing and ease of installation.
At the combustor inlet, the total pressure was measured by a pitot rake designed and
constructed by the author. The function of the rake was to bring the local flow (i.e., flow
interfering with the rake) to a zero velocity so that the air total pressure could be
measured. The rake, shown in Figure 7.43, was made up of 13 Inconel tubes with inner
and outer diameters of 1.0 mm (0.04 in) and 1.6 mm (1/16 in) respectively. The 305 mm
(12 in) long tubings (model number INC-116-120PEN) were purchased from Omega
Engineering. The tubings were bent into an L shape with a corner radius of 10 mm. The
rake was then formed by placing the tubings 1.6 mm apart and soldering them together.
Figure 7.43 shows the final product. T he proper alignment of the rake w ith respect to the
air flow inside the pipe was ensured by designing and constructing the assembly
mechanism shown in Figure 7.44.
Figure 7.43 Pitot rake

8/12/2019 Development of a Design Tool for Modern Gas
http://slidepdf.com/reader/full/development-of-a-design-tool-for-modern-gas 251/380
221
IStopPlate
\ 1
TraversePlate
/ *
#
Welded ^ " 4Plate
#
Figure 7.44 Pitot rake assembly
The location of the rake w ith respect to the inlet of the microturbine com bustor can be
seen in Figure 7.45. The figure also shows the location of the w all taps. To ensure that the
static pressure measurements were not influenced by the pitot rake, the wall taps were
located 150 mm (6 in) upstream of the rake.
p/ / /^ / /w / / / /w / / / /«^^^
Figure 7.45 Instrumentation upstream of microturbine combustor

8/12/2019 Development of a Design Tool for Modern Gas
http://slidepdf.com/reader/full/development-of-a-design-tool-for-modern-gas 252/380
222
The wall taps were manufactured by the author using the guidelines reported in
Section 7.2.4. The wall tap manufacturing process was carried out by first drilling the 1.0
mm hole, normal to the pipe wall, and by then GTAW welding a modified tube fitting
(MN PT threads removed) onto the pipe outer wall (Figure 7.46).
Figure 7.46 Wall tap manufacturing process
The last instrument found upstream of the comb ustor was a type K thermocouple. T he
thermocouple, which was inserted inside one of the rake's pitot tubes (Figure 7.47),
measured the air temperature entering the microturbine combustor.

8/12/2019 Development of a Design Tool for Modern Gas
http://slidepdf.com/reader/full/development-of-a-design-tool-for-modern-gas 253/380
Figure 7.47 Microturbine air inlet temperature thermocouple
The measurements conducted at the combustor outlet were the total and static
pressures and the exhaust gas temperature. The instrumentation used to carry out these
measurements was selected to sustain high temperatures while keeping the blockage
factor below 5% .
In addition to being small, the total pressure probe chosen had to be insensitive to
angles of attack (i.e., flow directions) since the exhaust gas flow exiting the combustor
could approach the probe from many different directions. The pitot probe selected, to
measure the total pressure downstream of the combustor, had a Kiel type head. The
details of the probe (model KB C-8-W ), purchased from United Sensor Corporation , can
be seen in Figure 7.48. The advantage of this particular probe head design was the
insensitivity to flow direction. The K iel probe calibration curves presented in Figure 7.49
15 United Sensor Corporation, 3 Northern Boulevard, Amherst, NH 03031-2329 U.S.A

8/12/2019 Development of a Design Tool for Modern Gas
http://slidepdf.com/reader/full/development-of-a-design-tool-for-modern-gas 254/380
224
show the sensor insensitivity to flow direction. Figure 7.49 shows that the purchased
probe can measure the total pressure of flows approaching at yaw and pitch angles
ranging between ±55° and ±50° respectively. The probe insensitivity to flow directions
is achieved due to its outer tube which realigns the streamtube with the centerline of the
probe with minimal total pressure loss (Ower and Pankhurst, 1977). The inner tube then
measures the total pressure.
3.2 mm >203 m m
m.
Inner Tube
3.2 mm
Kiel Cross-section Head Detail
Figure 7.48 Kiel probe design

8/12/2019 Development of a Design Tool for Modern Gas
http://slidepdf.com/reader/full/development-of-a-design-tool-for-modern-gas 255/380
225
/
1
-40 -20 0 20
Pitch Angle (deg)60
Pitch Angle $ 06°
+ ^ •
&
P, 0.20
0.00 -40 -20 0 20 40 60
Yaw Angle (deg)
Figure 7.49 Kiel probe flow an gles
The purchased Kiel probe can be used up to 1366 K temperatures (U nited Sensor, 2005).
The suitability of the probe selection was further confirmed when reviewing work from
Haas (1996) who purchased, from United Sensor Corporation, the same type of Kiel
probe. In Haas' work, as it was for this research project, the Kiel probe was placed
downstream of a gas turbine combustor (Allison T63-A-700, military derivative of
Allison 250 model) and the total pressure at the turbine inlet was successfully measured.
The static pressure downstream of the microturbine combustor was measured using
four wall taps. The guidelines and actual manufacturing technique used to fabricate the
wall taps has previously been addressed in this section. Figure 7.50 shows the placement
of the Kiel probe and wall taps with respect to the microturbine com bustor. Specifically,
the wall taps were located 230 mm (9 in) from the combustor casing outlet and the Kiel
probe was inserted 38 mm (1.5 in) downstream of the wall taps.

8/12/2019 Development of a Design Tool for Modern Gas
http://slidepdf.com/reader/full/development-of-a-design-tool-for-modern-gas 256/380
226
"Wall Tap Co mb ustor Casing
Figure 7.50 Instrumentation downstream of microturbine combustor
The temperature of the exhaust gasses exiting the microturbine combustor was
measured by a type K thermocouple. To minimize radiation, conduction and convection
measurement errors (Saravanamuttoo, 1990), the thermocouple was placed within a
ceramic protection tube. The protection tube (model PTRA-11618-12), purchased from
Omega Engineering, had an outer diameter of 3.1 mm (1/8 in), an inner diameter of 1.6
mm (1/16) and a length of 305 mm (12 in). The protection tube material was pure
alumina ceramic (AI2O3). Two small holes had to be machined onto the protection tube
so that the exhaust gasses could interact with the thermocouple. The grinding process,
used to create the holes in the protection tube, w as a difficult process due to the hardness
and brittleness of the AI2O3 material. The final product with some key details can be seen
in Figure 7.51.

8/12/2019 Development of a Design Tool for Modern Gas
http://slidepdf.com/reader/full/development-of-a-design-tool-for-modern-gas 257/380
227
Type KThermocouple
A1203 Tube
- * ) | *—1.5mm
&//\ r / / / / / / < y — f) )A 3.1 mm
-1 .5 mm -» | j * -_L •^H0J
Side View
Side ViewCross-section
Figure 7.51 Thermocouple assembly for measuring combustor outlet temperature
After having completed the thermocouple assembly, the sensor was inserted 305 mm
(12 in) downstream of the combustor outlet. The insertion point of the temperature sensor
was positioned in such a way to minimize disruption to total and static pressure
measurements occurring downstream. In other words, the sensor insertion point was not
in line with any of the pressure sensors located downstream. This can be seen in Figure
7.52.
Figure 7.52 Temperature sensor insertion point

8/12/2019 Development of a Design Tool for Modern Gas
http://slidepdf.com/reader/full/development-of-a-design-tool-for-modern-gas 258/380
228
The traverse mechanism for both the Kiel probe and the temperature sensor was
accounted for by using tube fittings as the support structure. At this point, the traverse
mechanisms can only be operated manually. Creating a means by which remote actuation
can be achieved should be addressed in the future.
To asses the cooling performance of the liner, as well as to provide test data that
could be used for validation purposes in future combustor modelling simulations, the
liner walls were instrumented with a series of strategically placed thermocouples. Ten
meters (~ 33 feet) of sheathed, type K thermocouple wire, was purchased from Omega
Engineering for the liner walls instrumentation. Hastelloy X was chosen for the sheath
metal because of its resistance to high temperature and high temperature oxidation. One
mm (0.04 in), smallest available size, was chosen to be the outer diameter of the
thermocouple w ire to minimize com bustor flow disturbances.
Upon having received the thermocouple wire, 20 segments of various lengths were
cut. The sheath metal at both ends of each thermocouple segment was then manually
stripped to expose the enclosed thermocouple wires. The stripping process was carried
out through the use of a commercially available tool retailed by Omega Engineering
(Figure 7.53).
Figure 7.53 Thermocouple wire stripper (Omega Engineering.

8/12/2019 Development of a Design Tool for Modern Gas
http://slidepdf.com/reader/full/development-of-a-design-tool-for-modern-gas 259/380

8/12/2019 Development of a Design Tool for Modern Gas
http://slidepdf.com/reader/full/development-of-a-design-tool-for-modern-gas 260/380
230
As shown in Figure 7.56, the exposed thermocouple wires have fixed references. In
other words, one wire is positive (Chromel) while the other is negative (Alumel). An
important part of the connection process of the wires and female connector was to
carefully assess which wire was negative and w hich was positive and then to fasten them
to their correct places within the connector. To determine the proper reference of these
extremely small wires, the magnetic properties of the Alumel wire were relied upon.
Hence, with the use of a magnet, the distinction between the two wires was obtained and
correct installation within the female connector was carried out.
Since no CFD modelling on the combustor was carried out, the locations for the
thermocouples were chosen according to engineering judgement. The number of
thermocouples used was decided by the number of available channels in the data
acquisition system. Therefore, the total number of temperature sensors used in the liner
wall instrumentation was 20. Given the limited amount of temperature sensors, eight
thermocouples were used to acquire the axial temperature distribution along the liner wall
and the remaining 12 thermocouples were spaced out over other wall locations so that a
comprehensive liner wall temperature distribution could be obtained (Figure 7.56).
To reduce the possibility of thermocouple detachment from the liner wall during
testing, a 0.03 mm (0.001 in) thick nickel foil was purchased and cut into small strips
which were then spot welded along the thermocouple lengths. The nickel foil was
purchased from McMaster-Carr16 . As can be seen from Figure 7.56 and Figure 7.57, the
thermocouple wires were bent approximately normal to the liner centre axis. This
permitted for the spot welds to follow the temperature induced thermal expansion and
16 McMaster-Carr, 200 New Canton Way, Robbinsville, NJ 08691-2343, U.S.A

8/12/2019 Development of a Design Tool for Modern Gas
http://slidepdf.com/reader/full/development-of-a-design-tool-for-modern-gas 261/380

8/12/2019 Development of a Design Tool for Modern Gas
http://slidepdf.com/reader/full/development-of-a-design-tool-for-modern-gas 262/380
232
7.3.4.2 Orifice Instrumentation
The thin square-edged orifice plate introduced in Section 7.3.3 was used to measure
the amount of air bled from the Allison 250-C20B engine, thus quantifying the amount of
air entering the microturbine combustor. The orifice plate measuring technique relies on
the large drop in static pressure experienced by the flow when it travels from the full pipe
diameter to the smaller hole in the orifice plate. This static pressure difference can be
measured by strategically located w all taps. There are three wall tap designs that m easure
the mass flow rate accurately-namely, flange taps, vena contracta tap and 1-D and — -D
taps. The author selected the last type of design where, as can be deduced from the nam e,
this design uses one or more wall taps at 1 diameter upstream of the orifice and one or
more w all taps at — diameter downstream of the orifice. Fu rthermore, as mentioned
before, a straight pipe span of 20 diameters upstream and 10 diameters dow nstream of the
orifice are needed to ensure accurate flow measurem ents.
The orifice plate in the air delivery system was instrumented with four wall taps
upstream and four wall taps downstream. Once again, the guidelines and manufacturing
techniques followed to fabricate the orifice wall taps are those that have been previously
described in Sections 7.2.4 and 7.3.4.1. Figure 7.58 shows the orifice plate measuring
principle. Figure 7.59 show s the wall taps upstream of the orifice plate.

8/12/2019 Development of a Design Tool for Modern Gas
http://slidepdf.com/reader/full/development-of-a-design-tool-for-modern-gas 263/380
233
D
Figure 7.58 Orifice plate with 1-D and — -D wall taps
Figure 7.59 Orifice plate wall taps (upstream)
The welded tube fittings used in the wall taps and a detachable tube fitting at the Kiel
probe outlet were utilized to couple the pressure sensors to the pressure transducers.
Specifically, these fittings were coupled to Inconel tubings, which in turn were linked to
the pressure transducers via Teflon tubings. The purpose of the Inconel tubings, which
had the same specifications as those used for the pitot rake, was two-fold. The Inconel

8/12/2019 Development of a Design Tool for Modern Gas
http://slidepdf.com/reader/full/development-of-a-design-tool-for-modern-gas 264/380

8/12/2019 Development of a Design Tool for Modern Gas
http://slidepdf.com/reader/full/development-of-a-design-tool-for-modern-gas 265/380

8/12/2019 Development of a Design Tool for Modern Gas
http://slidepdf.com/reader/full/development-of-a-design-tool-for-modern-gas 266/380
236
scanner allowed one pressure line at the time to be open. Therefore, multiple sensor
locations could be scanned with only a single transducer measuring the various scanned
pressures.
Figure 7.62 Pressure scanner components
The inlet pressure lines (Teflon tubings) coming from the various sensors located
throughout the air delivery system were inserted onto the bulged tubings present in the
round pneumatic connector (Figure 7.62). The pneumatic connector was then screwed
onto the main body of the pressure scanner namely, the solenoid drive (Figure 7.62). A
flat gasket was inserted between the pneumatic connector and the solenoid drive mating
surfaces for sealing purposes, thus, ensuring that each pressure tubing was isolated from
the other. The solenoid drive, which could be directly or remotely operated, was
electrically triggered via push button switches, present in the Control Room, or directly

8/12/2019 Development of a Design Tool for Modern Gas
http://slidepdf.com/reader/full/development-of-a-design-tool-for-modern-gas 267/380

8/12/2019 Development of a Design Tool for Modern Gas
http://slidepdf.com/reader/full/development-of-a-design-tool-for-modern-gas 268/380
238
7.3.5 Data Acqu isition System
The analog outputs produced by all the pressure and temperature sensors making up
the gas turbine combustion research laboratory were acquired by a Keithley 2700 data
acquisition system (DAQ) through two cards having 20 input channels each (Figure
7.63). The acquisition system, located in the Combustion Room, then converted the
analog measurements into digital signals which were then sent via wire to a desktop
computer located in the Control Room.
Data Acquisition Card
Figure 7.63 Keithley 2700 data acquisition system
Lab View p rograms created by the author manipulated these digital signals from non-
engineering units (VDC , mVD C) to units that could readily be interpreted, such as bar for
pressures and Kelvin for temperatures. In addition to displaying the data for monitoring
purposes, the computer w as also used to store the m easurements.

8/12/2019 Development of a Design Tool for Modern Gas
http://slidepdf.com/reader/full/development-of-a-design-tool-for-modern-gas 269/380
239
Due to the large amount of temperature and pressure sensors used in the air delivery
system more precisely, 22 thermocouples and 29 pressure ports, a measurement
identification technique suggested by Saravanamuttoo (1990) was adopted. The
thermocouple extension wires and pressure lines were identified w ith tags as follows:
Measured Parameter P, S, T
Microturbine Station 3, 4
Sensor Station 0, 1, 2 99
Angular Position A, B, C, Y
Sensor Number 01,0 2,03 99
On the identification tags the P indicated total pressure, the S indicated static pressure
and the temperature was indicated with a T. All the measurements taken upstream of the
microturbine combustor inlet were indicated by the number 3 whereas the measurements
downstream of the combustor were labelled with 4s. The sensor stations along the air
delivery system were labelled sequentially starting from the num ber 0. The angular
positions of the sensors were determined by viewing the air delivery system cross section
from the upstream to the downstream direction. The pipe angles were divided into
segments of 15° increments as shown in Table 7.4.
Table 7.4 Angular location of sensor
0 ° < A < 1 5 °
1 5 ° < B < 3 0 °
30° < C < 45°45° < D < 60°
60° < E < 75°
75° < F < 90°
9 0 ° < G < 1 0 5 °
1 0 5 ° < H < 1 2 0 °
1 2 0 ° < I < 1 3 5 °1 3 5 ° < J < 1 5 0 °
1 5 0 ° < K < 1 6 5 °
1 6 5 ° < L < 1 8 0 °
1 8 0 ° < M < 1 9 5 °
1 9 5 ° < N < 2 1 0 °
2 1 0 ° < P < 2 2 5 °225° < Q < 240°
240° < R < 255°
255° < S < 270°
270° < T < 285°
2 8 5 ° < U < 3 0 0 °
3 0 0 ° < V < 3 1 5 °3 1 5 ° < W < 3 3 0 °
330° < X< 345°
345° < Y< 360°

8/12/2019 Development of a Design Tool for Modern Gas
http://slidepdf.com/reader/full/development-of-a-design-tool-for-modern-gas 270/380
240
Finally, if more than one sensor was used at the same measurement location the
instrument lines were sequentially numbered. This was the case for the pitot rake in
which each tube was numbered sequentially in ascending order towards the mounting
flange. Figure 7.64 gives a graphical example of the labelling system for the
instrumentation up stream of the microturbine combustor.
Figure 7.64 Measurements identification
Lastly, the air delivery system was also equipped with an access port downstream of
the combustor outlet so that a probe could be inserted to sample the exhaust gasses. The
results of the samples could then measure the efficiency of the microturbine combustion
and the amount of pollutants produced by the combustion process. This part of the test
would use equipment belonging to ERMD.
7.3.6 Atm ospheric Pressure Air Delivery System
The air delivery layout, in the atmospheric pressure configuration, resided within the
Com bustion Room as shown in Figure 7.65. The bleed pipe coming from the G as Turbine
Room and protruding into the Combustion Room had to be disconnected so that the

8/12/2019 Development of a Design Tool for Modern Gas
http://slidepdf.com/reader/full/development-of-a-design-tool-for-modern-gas 271/380
241
atmospheric blower (Spencer Turbine Company, model 30104A3) could be coupled to
the air delivery system using a rubber hose and two 90° long radius elbows, as seen in
Figure 7.66.
Ifl
I
I- I
a
CombustionRoom
~A
O
Control Room
if
(Atmospheric
Blower
| pe l
Figure 7.65 Layout top view of atmospheric pressure air delivery system

8/12/2019 Development of a Design Tool for Modern Gas
http://slidepdf.com/reader/full/development-of-a-design-tool-for-modern-gas 272/380
242
Figure 7.66 Atmospheric configuration set-up
m 3
The blower (Figure 7.67) could deliver volumetric flow rates up to 0.67 — with a
s
pressure slightly above atmospheric (1.12 bar). The blower performance curve was used
to size the rubber hose which would couple the blower to the air delivery system. More
specifically, a parametric study was conducted to calculate the pressure drop sustained by
the coupling system as a function of the hose diameter to be used at the blower outlet.
Figure 7.68 shows the blower performance curve and the pressure drops sustained for
different hose diameters. The small difference in pressure losses between hoses having
diameters of 102 mm and 152 mm (4 in and 6 in) did not justify the price difference
between the diameters. Therefore, a rubber hose having smooth internal walls with an

8/12/2019 Development of a Design Tool for Modern Gas
http://slidepdf.com/reader/full/development-of-a-design-tool-for-modern-gas 273/380
243
internal diameter of 102 mm (4 in) was deemed to be an acceptable compromise between
system pressure drop and cost.
Figure 7.67 Spencer Turbine Com pany b lower model 30104A3
20000
18000
16000
14000 -
£ 12000 -in
I 10000©
p4 8000
6000
4000
2000
0
T II M \ Hose. 0 5 1 m m _ r - • ; •• •
/ Diameter
0 76|mm j
Extrapolation"/
y
yj 0lQ2mm
j^OperatiifgRoititi
r~ - -i — •
-f~ T—i 1 1 1 1 1 1 1 1 1 1
0 0.1 0.2 0.3 0.4 0.5 0.6 0.7 0.8 0.9 1 1.1 1.2 1.3 1.4 1.5
Mass Flow (kg/s)
Figure 7.68 Blower performance curve and hose pressure losses
The air delivery system configuration downstream of the blower hose w as exactly the
same as that for the high pressure configuration as shown in Figure 7.69 and Figure 7.70.

8/12/2019 Development of a Design Tool for Modern Gas
http://slidepdf.com/reader/full/development-of-a-design-tool-for-modern-gas 274/380
244
| Microturbine Casing • • ' • '•£]$&Figure 7.69 Atmosp heric and high p ressure configurations of air delivery system
' ifj-xl'-tSf
~ gr* *<w^j&
cm -
LIB*'1
.2 / ' IPt-J^
" * ¥ It ~*m*W ^
' ^ * * „ # » J " * * "
Figure 7.70 Close-up of air and fuel delivery systems
As mentioned in Section 7.1, one of the objectives of the atmospheric set-up was to
determine the discharge coefficients of the dilution and cooling holes present in the
combustor liner under investigation. As part of the comm issioning of the laboratory, trial

8/12/2019 Development of a Design Tool for Modern Gas
http://slidepdf.com/reader/full/development-of-a-design-tool-for-modern-gas 275/380
245
tests for determining liner hole discharge coefficients were, therefore, carried out. By
performing these tests, possible unforeseen problems could be identified and resolved.
From the conducted tests, minor modifications to the air delivery system
configuration and instrumentation were needed to obtain the discharge coefficients of the
holes present in the microturbine liner. Details on how to experimentally obtain the liner
hole discharge coefficients and on the needed air delivery system modifications are
discussed below.
The liner hole discharge coefficients can be calculated using Equation (4.90) repeated
here for convenience.
m h=CdAh[2p3{p 3-p J)]°J (4.90)
The discharge coefficient (Cd) of an opening with an area Ah can be obtained
experimentally by measuring the total pressure (P3) upstream of the hole, the static
pressure ( p . ) downstream of the hole, the air temperature (for calculating the air density,
p3) and the air ma ss flow rate (f hh) through the hole. Thus, to carry out these
measurements, the only flow path allowed through the liner is that entering the hole(s)
under investigation.
Since the microturbine combustor has a large number of very small holes, tests on a
set of holes rather than a single hole were carried out. For example, to test and calculate
the discharge coefficients of the dome cooling holes (16 holes with 0.8 mm diameter
each), all other liner openings had to be sealed. This was done using aluminum tape and a
product called Tac'N Stick produced by Ross. The latter product, which is a reusable
adhesive, was found to be ideal for this application. In particular, the moisture retention

8/12/2019 Development of a Design Tool for Modern Gas
http://slidepdf.com/reader/full/development-of-a-design-tool-for-modern-gas 276/380
246
of the product m ade it very easy to mould around the cooling rings and as easy to remove
after testing, as can be seen in Figure 7.71.
Dome Cooling Holes f% •» » •; ' „ ,, /*?
Figure 7.71 Liner p reparation for discharge coefficient type tests
After having assembled the liner inside the casing, the annulus area (i.e., area
constrained by the casing inner wall and the liner outer wall) was also plugged so that all
the air mass flow entering the combustor would only travel through the dome cooling
holes.
During testing, the total pressure ( P3) upstream of the dome holes was sensed by the
pitot rake and measured by a PX243 transducer (±0.17 bar gauge; ± 2.5 psig). The static
pressure ( p .) dow nstream of the dom e holes was sensed by the wall taps at the outlet of
the combustor and measured by a second PX243 transducer (± 0.17 bar gauge; ± 2.5
psig). The air temperature was measured by the pitot rake thermocouple. The air mass
flow rate ( m h ) throug h the holes, however, was so small that it could not be measured by

8/12/2019 Development of a Design Tool for Modern Gas
http://slidepdf.com/reader/full/development-of-a-design-tool-for-modern-gas 277/380
247
the orifice plate. To solve this problem, the orifice plate was replaced by a laminar flow
element.
A laminar flow element, patented and manufactured by Meriam Instrument
•I n
Corp oration , is designed to produ ce a pressure differential directly proportio nal to the
flow rate. More specifically, laminar flow elements (LFE), permits the measurement of
flow rates using the capillary flow principle.
A LFE contains a matrix that is either made from individual stainless steel tubes or
windings of stainless steel foil. These tubes are long enough, relative to their inside
diameter, to cause laminar flow to occur inside each tube. The result is a near linear
relationship between the differential pressure across the tubes and the flow rate entering
the LFE as shown by the equation below (Fox and McDo nald, 1994):
Q = ^ ~ (7.9)
128/uL
where Ap is the static pressure drop across the tube, Pa
D is the tube diameter, m
kgju is the fluid dynam ic viscosity, ——
m s
L is the tube length, m
As can be seen from Equation (7.9), the relationship between the pressure drop and
the flow rate for laminar flows depends on the fluid dynamic viscosity ( ju ) which is a
function of temperature. Therefore, the fluid temperature must be known to obtain
accurate metering when using LFE.
17
SRP Control Systems Ltd., 19-5155 Specturm Way, Mississauga, Ontario L4W 5A1, Canada

8/12/2019 Development of a Design Tool for Modern Gas
http://slidepdf.com/reader/full/development-of-a-design-tool-for-modern-gas 278/380
248
During the discharge coefficients tests, the LFE replaced the orifice plate as shown in
Figure 7.72.
Figure 7.72 Laminar flow element assembly
To have a fully developed flow entering the LFE, a pipe, having a 51 mm (2 in)
nominal diam eter and a length of 635 mm (26 in), was inserted upstream of the LFE .
The LFE (model 50MW20-1 or 50MW20-2) was instrumented to measure the static
pressure difference across the matrix as well as the absolute pressure and temperature of
the air entering the sensor. Figure 7.73 show s the instrumentation schematic.

8/12/2019 Development of a Design Tool for Modern Gas
http://slidepdf.com/reader/full/development-of-a-design-tool-for-modern-gas 279/380
249
MKS 223BD Viatran 118
DifferentialStatic Pressure
AbsolutePressure
AirTemperature
Ecriam Laminar Flow Element
Figure 7.73 Laminar flow element instrumentation
The absolute pressure of the air was measured via a Viatran 118 transducer. The
range of this absolute pressure transducer, shown in Figure 7.73, varies between 0 bar
and 1.034 bar (0 psi to 15.0 psia) with a corresponding output signal between 0 mVDC
and 100 mVDC. The measurements of the absolute pressure and temperature of the air
(type K thermocouple upstream of the LFE) permitted the air density entering the LFE to
be determined. The pressure loss across the LFE m atrix was measured using a differential
pressure transducer whose brand and mod el were MK S 223BD -0010. The pressure range
of this pressure was between 0 inch H2O and 10 inch H2O (0 bar and 0.025 bar) with a
0 VDC to 5 VDC analog output.
The laminar flow elem ent used during testing for cooling hole discharge coefficients
(i.e., dome, primary zone and dilution zone cooling holes) was a LFE model 50MW20-1.

8/12/2019 Development of a Design Tool for Modern Gas
http://slidepdf.com/reader/full/development-of-a-design-tool-for-modern-gas 280/380
250
kgThis LFE could measure mass flow rates up to 0.25 ——. The higher flow rates through
min
the primary and dilution holes were measured using a LFE model 50MW20-2. The
kgmaxim um mass flow rate that this instrument could measure was 1.36m m
7.3.7 Fuel Delivery System
The other apparatus that can be found in the Combustion Room is the fuel delivery
system (B in Figure 7.74). The fuel delivery system was designed to deliver liquid fuels
to gauge pressures up to 34.5 bar (500 psig) and flow rates up to 4.2 . This system,
min
designed and constructed by the author, took advantage of, as much as possible,
components which had been purchased during Murphy's work (2004). The components
of the fuel delivery system can be seen in Figure 7.75.
D
^ ^
1
Gas TurbineRoom
fKTf
JmFuel Delivery]
System
CombustionRoom
V^
Control Room
a
p
= »
Figure 7.74 Fuel delivery system layout top view

8/12/2019 Development of a Design Tool for Modern Gas
http://slidepdf.com/reader/full/development-of-a-design-tool-for-modern-gas 281/380
251
Dial Pressure Transducer Check Control Valve PressureGage and Valve | Regulator
Thermocouple
Pressure Snubbcr Flexibleand Line
Drain
On/Off / Pressure Transducer FlowSolenoid/ and Meter
Valve Dial GageFigure 7.75 Fuel delivery system components
Fuel Pressure Transducers FuelFilter and Pump
Dial Gages
The fuel to be used in future microturbine combustion tests is No. 2 diesel with low
sulphur content. This is the same fuel that is used by the Allison 250-C20B engine
present in the research laboratory. Particularly, both the gas turbine engine and the
microturbine combustor acquire the fuel from the same 200 litre barrel stored in an
explosion proof cabinet located outside the Gas Turbine Room (D in Figure 7.74). The
fuel lines (stainless steel tubes with an outside diameter of 12.7 mm and 1.25 mm wall
thickness) running from the barrel to the Allison 250-C20B fuel pump and to the pump
residing in the Combustion R oom w ere always kept full of fuel using a priming pum p.
The fuel delivery system found in the Combustion Room can be seen in Figure 7.75.
All the component materials making up the system were selected to be compatible with
alternative fuels, such as pyrolytic oil. This was done so that such fuels could be used by
possible future research projects. Specifically, the wetted parts materials of the
components making up the fuel delivery system were stainless steel, brass and Teflon.
The fuel delivery system used stainless steel tubings (12.7 mm outer diameter and
1.25 mm wall thickness) and tube fittings to connect the various parts together. The

8/12/2019 Development of a Design Tool for Modern Gas
http://slidepdf.com/reader/full/development-of-a-design-tool-for-modern-gas 282/380
252
maximum working pressure of the stainless steel tubings is 220 bar at 311 K (Swagelok,
2003).
Figure 7.76 Fuel delivery system flow
Figure 7.76 shows the fuel flow path of the fuel delivery system. The first component
in the path is the fuel pump head. The fuel pump head is a Hydra-Cell M03B which is
coupled to a 0.75 kW (1.0 hp) electric motor. This diaphragm pump can deliver a
maxim um flow rate of 4.2 (1.1 gpm) at an 83 bar (1200 psig) gauge pressure.
min
Downstream of the pump, a polytetrafluoroethylene (PTFE) lined, stainless steel
braided hose was installed to isolate the fuel delivery system from vibrations created by
the fuel pump. The maximum working pressure and temperature of the braided hose are
206 bar and 503 K respectively.
To reduce pressure pulses created by the diaphragm pump, a 500 mm long piece of
tubing (same tubing material and diameter as described above) was inserted downstream
of the braided hose. The vertical installation and the long length of the tubing permit it to
be partially filled with air. The air volume within the tubing functions as a pulsation
dampener by contracting and expanding as a result of the pressure pulses created by the

8/12/2019 Development of a Design Tool for Modern Gas
http://slidepdf.com/reader/full/development-of-a-design-tool-for-modern-gas 283/380
253
diaphragm fuel pump during its operation. By absorbing the pulsations, the lives of the
components and instrumentation downstream of the pump are extended.
To mo nitor the pressure along the fuel delivery system, four pressure transducers and
four dial gauges were installed along the fuel line. The locations of the transducers were
selected to monitor possible malfunctions of critical components, such as the control
valve, or obstructions in the fuel line. The last pressure transducer located before the fuel
enters the microturbine combustor, was used to monitor the pressure at which the fuel
was injected into the com bustor premixer. The model of the pressure transducers used in
the system was PX481A (Omega Engineering), having a temperature compensated
analog output between 1 VDC and 5 VDC. Specifically, the pressure transducer just
downstream of the pump has a gauge pressure range between 0 bar and 69 bar (0 psig to
1000 psig) whereas all the other pressure transducers have a gauge pressure range
between 0 bar and 34.5 bar (0 psig to 500 psig). The dial gauges, with the same pressure
range as that given for the transducers, permitted to acquire and to inspect pressures
visually. The dial gauges proved to be very helpful during initial construction of the fuel
delivery system.
The purpose of the pressure regulator, as the name implies, was to regulate the fuel
delivery system pressure. The key components of the Hydra-Cell C62 valve (pressure
regulator), as seen in the exploded view (Figure 7.77), are an adjusting bolt, a spring and
a plunger. By torquing the bolt, the pressure regulator could be manually adjusted to open
between a pressure range of 5.3 bar and 34.5 bar (75 psig to 500 psig). Therefore, if the
pressure of the fuel entering the valve was higher than the set pressure exerted by the
spring on the plunger, the plunger would lift up, allowing the fuel to bypass the system,

8/12/2019 Development of a Design Tool for Modern Gas
http://slidepdf.com/reader/full/development-of-a-design-tool-for-modern-gas 284/380
254
thus, reducing the pressure in the system. The bypassed fuel w ould then return to the 200
litre barrel housed outside the turbine room .
AdjustingBolt
Sping
Plunger
Bypass
Figure 7.77 Hydra-Cell C62 pressure regulator valve (Adapted from Wanner, 2002)
The diesel fuel filter, located downstream of the pressure regulator, can block
particles bigger than 74 microns, thus, preventing possible blockage of the fuel line and
fuel nozzle. The brand and model number of the filter were Flow Ezy 6ILA-03-74
respectively. The m aximum operating gauge pressure of the filter is 69 bar (1000 psig).
To control the amount of fuel injected into the microturbine combustor, a fractional
flow control valve was sized and purchased. The purchased control valve (Jordan, m odel:

8/12/2019 Development of a Design Tool for Modern Gas
http://slidepdf.com/reader/full/development-of-a-design-tool-for-modern-gas 285/380
255
Mark 708MV -050-S6) has a Cv value of 0.5 which permits a maximum fuel flow rate of
8.5 —— and a maximum gauge operating pressure of 69 bar (1000 psig). One of themm
attractive features of this valve, other than it can be remotely controlled, is that the travel
of the valve (i.e., valve opening) with respect to the input control voltage can be adjusted.
For example, as received, the valve was set to the full operational range, that is, fully
closed at an input signal of 0 VDC and fully open (8.5 maxim um flow rate) at 5
min
VDC. However, for the microturbine combustor operation, the opening span of the valve
was adjusted so that, for a 5 VDC input signal, the valve would only permit for a
maximum fuel flow rate of 1 ——. The accuracy of the opening position (± 0.051mm)
min
combined with the adjustable control span permitted to accurately control the amount of
fuel injected into the combustor. For safety reasons, the valve was wired so that upon loss
of input signal, it would automatically close, thus stopping the fuel from being injected
into the combustor.
Downstream of the fractional flow control valve, a self-actuating check valve assured
that the fuel would only travel in one direction; towards the fuel nozzle.
The amount of fuel burned was measured by an FTB 502 low flow rate meter. The
meter utilized a pelton wheel-like rotor whose motion is converted into analog output
signals ranging between 0 VDC and 5 VDC. The maximum flow and operating pressure
of the flow meter is 69 bar (gauge) (1000 psig) and 0.94 respectively.
min
An ASCO 8223G027 on/off solenoid valve is the component that allows the fuel to
enter the microturbine combustor. The valve, which is either open or closed, can quickly

8/12/2019 Development of a Design Tool for Modern Gas
http://slidepdf.com/reader/full/development-of-a-design-tool-for-modern-gas 286/380
256
cut off the fuel flow to the combustor. This aspect was considered very important for
reasons of possible emergency shut-downs. As mentioned in Section 7.3.3, the on/off
solenoid valve was electrically wired to the pressure switch present in the air delivery
system. In case of a sudden pressure loss in the air delivery system, the on/off solenoid
valve would de-energize, stopping the fuel from flowing into the combustor. Another
way to stop the fuel is to discontinue the current to the solenoid valve via an on/off
electrical switch and/or by an emergency switch which are both located on the operating
console in the Control Room. T hese redundant w ays of de-energizing the on/off solenoid
valve were deemed m ore than adequate to address any possible emergency scenarios.
Finally, before entering the microturbine combustor, the fuel pressure and
temperature were measured by a PX481A transducer (gauge pressure range between 0
bar and 69 bar) and by a type K therm ocouple.
A PTFE lined, stainless steel braided, hose connects the fuel delivery system to the
fuel nozzle. The purpose of the hose is to isolate the fuel nozzle, and thus the combustor,
from experiencing possible vibration created by the fuel delivery system.
Two drains were included in the design of the fuel delivery system to limit the
amount of fuel spillage during disassembly of the apparatus. The drain dow nstream of the
pump removes fuel up to the on/off solenoid valve. The second drain empties the pipes
up to the fuel nozzle.
For mounting purposes and to better detect possible fuel leaks, the fuel delivery
system was fastened to a frame with an aluminum plate backing. The complete fuel
delivery system can be seen in Figure 7.78.

8/12/2019 Development of a Design Tool for Modern Gas
http://slidepdf.com/reader/full/development-of-a-design-tool-for-modern-gas 287/380
257
Figure 7.78 Fuel delivery systems close-up
7.3.8 Control Room
The last room of the constructed gas turbine combustion research laboratory is the
Control Room. Within this room there are two controlling stations. One station for
operating and monitoring the Allison 250-C20B gas turbine and a second station for
controlling and monitoring the systems present in the Combustion Room and for
acquiring all the experimental data. The Control R oom layout can be seen in Figure 7.79.
Camera •
Gas Turbine
Room
V |Camera
CombustionRoom
U S
A
\ Allison 250
Station
ControlRoom
CombustionRoomStation
J
P
=to
Figure 7.79 Control Room layout top view

8/12/2019 Development of a Design Tool for Modern Gas
http://slidepdf.com/reader/full/development-of-a-design-tool-for-modern-gas 288/380
258
The Allison 250-C20B controlling and mo nitoring station was already in full w orking
condition when construction of the research laboratory was begun and therefore, except
for the introduction of the fail-safe mechanism (Section 7.2.3) no further work on it was
needed.
As previously mentioned, the Allison 250-C20B engine was controlled by a throttle
on the station console which was hydraulically connected to the engine fuel
control/governor. The fuel control/governor in turn regulated the amount of fuel injected
into the Allison 250-C20B engine. A computer and data acquisition system was used to
monitor critical engine parameters such as gas generator rotational speed (Ni), power
turbine rotational speed (N2), which is now zero due to the engine modification, inter
turbine temperature, which is now the exhaust gas temperature due to the removal of the
power turbine, oil pressure, oil temperature and finally, the Gas Turbine Room
temperature.
A camera, located in the Gas Turbine Room (Figure 7.79), was connected to a
television, located in the Control Room, so that additional information on the engine
operating status could be gained. Thus, the main scope of this surveillance system was to
detect engine operation anomalies such as fuel or oils leaks, smoke or fire. In case of an
emergency, the fuel flow into the gas turbine engine could be cut by pressing an
emergency switch. Figure 7.80 shows the Allison 250-C20B control and monitoring
station.

8/12/2019 Development of a Design Tool for Modern Gas
http://slidepdf.com/reader/full/development-of-a-design-tool-for-modern-gas 289/380

8/12/2019 Development of a Design Tool for Modern Gas
http://slidepdf.com/reader/full/development-of-a-design-tool-for-modern-gas 290/380
260
relay box and connecting to the various components making up the air and fuel delivery
systems carried a high voltage alternating current (> 110 VA C). The use of low voltage in
the operating station created a safer working environment. Furthermore, to minimize
potential accide nts or loss of equipm ent, all the electrical wires were carefully identified
with labels. All the electrical circuits were also fitted with one time use fuses. In case of
current surges or short circuits, the fuse filament would break, interrupting the flowing
current and preventing harm from coming to either personnel or equipment.
Except for the fractional flow control valve, all the other components were operated
using on/off switches (SPDT bat handle type switches). The on/off solenoid valve in the
fuel delivery system was also wired to an emergency switch for quick reaction times in
case of an em ergency.
Indicator lights were installed throughout the operating console so that the operator
could be aware of the status of the components (i.e., component either energized or de-
energized).
To accurately control the amount of fuel flowing through the fractional flow control
valve, a NI USB-6009 multifunction data acquisition system coupled to LabView was
used. Using the NI USB-6009 and LabView, the input voltage (i.e., NI USB-6009 output
voltage) experienced by the fractional flow control valve could be precisely controlled. In
other words, through the use of a computer interface the fuel flow rate could be increased
or decreased by accurately changing the NI USB-6009 output voltage. This output
voltage could be adjusted by very sm all intervals (0.1 V) by simply typing or by using the
mouse to obtain the desired voltage. This is shown schematically in Figure 7.81 .

8/12/2019 Development of a Design Tool for Modern Gas
http://slidepdf.com/reader/full/development-of-a-design-tool-for-modern-gas 291/380
261
LABVIEWProgram
CPU Nl USB-6009 Fuel ControlValve
c
Va lve (V)
\ 3.2Mouse
Figure 7.81 Fractional flow control valve actuation system
Figure 7.82 and Figure 7.83 show various views of the completed Combustion Room
operating station. As can be seen from Figure 7.82, the operating console was equipped
with two computers, one having two monitors (Figure 7.83). More specifically, one
computer was used to survey the status of the systems present in the combustion room
whereas the second computer was used to actuate the fuel control valve as well as to
monitor, acquire and store data pertaining to the air and fuel delivery systems.
Surveillance
Control, Monitor and Data Acquisition
Figure 7.82 Operating console wiring details
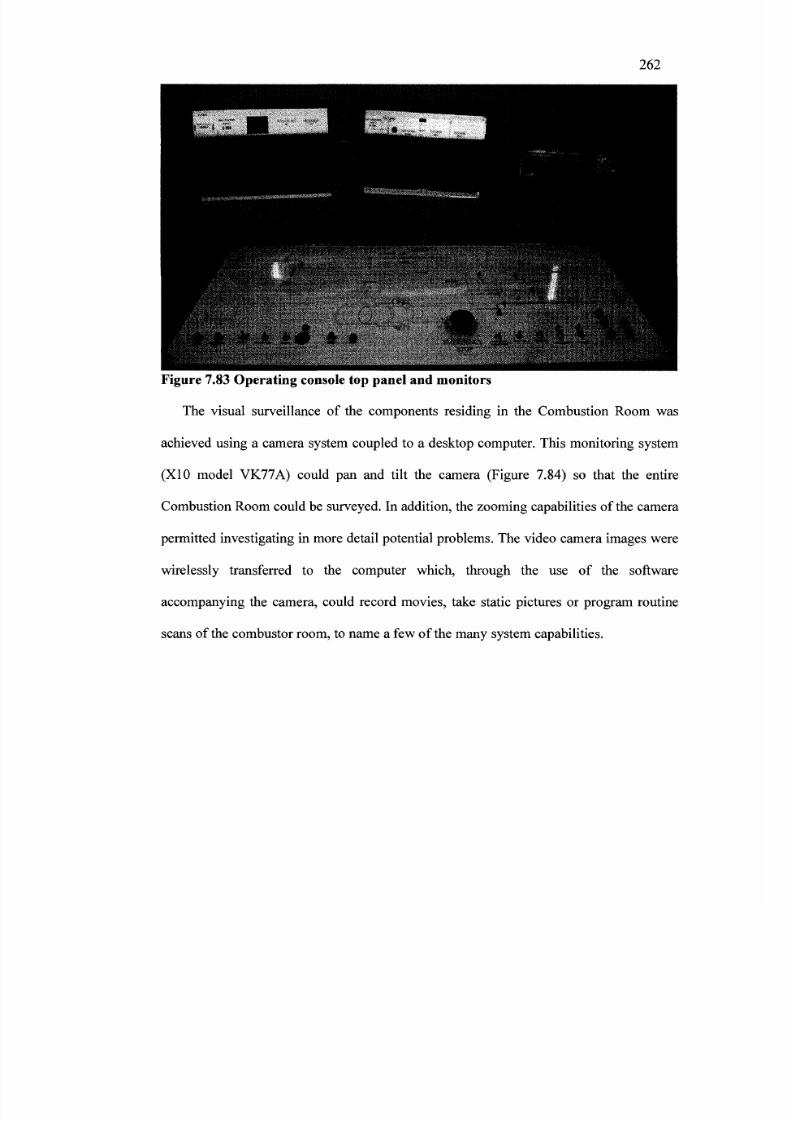
8/12/2019 Development of a Design Tool for Modern Gas
http://slidepdf.com/reader/full/development-of-a-design-tool-for-modern-gas 292/380
262
Figure 7.83 Operating console top panel and monitors
The visual surveillance of the components residing in the Combustion Room was
achieved using a camera system coupled to a desktop computer. This monitoring system
(X10 model VK77A) could pan and tilt the camera (Figure 7.84) so that the entire
Com bustion Room could be surveyed. In addition, the zooming capabilities of the cam era
permitted investigating in more detail potential problems. The video camera images were
wirelessly transferred to the computer which, through the use of the software
accompanying the camera, could record movies, take static pictures or program routine
scans of the combustor room , to name a few of the many system capabilities.

8/12/2019 Development of a Design Tool for Modern Gas
http://slidepdf.com/reader/full/development-of-a-design-tool-for-modern-gas 293/380
263
Figure 7.84 M onitoring cam era, model VK77A
The other computer was used to control the flow control valve as well as to acquire,
monitor and store all the experimental data produced by the air and fuel delivery sy stems.
As mentioned in Section 7.3.5, all the analog outputs produced by the
instrumentations were collected by the Keithley 2700 DAQ system. Within the DAQ, the
analog measurem ents were conv erted into digital signals which were then sent, through a
cable, to the comp uter located in the Control Roo m.
Once in the computer the data was manipulated from non-engineering units (VDC
and mVDC) to units that could be readily understood such as bar for pressures and
Kelvin for temperatures. The software used for data manipulation, display and storage
was Lab View . The LabV iew program , created by the author, was a compilation of m any
subroutines as shown in Figure 7 .85. Figure 7 .85 shows a fragment of the LabView
program, and gives details on one of the many subroutines created. The subroutine, called
Fuel 2.vi, was written for manipulating the data acquired by the transducer located just
downstream of the fuel pump. During pump operation, the gauge pressure sensed by the

8/12/2019 Development of a Design Tool for Modern Gas
http://slidepdf.com/reader/full/development-of-a-design-tool-for-modern-gas 294/380
264
transducer would be outputted as a voltage signal. This voltage signal would then be
mathematically manipulated using coefficients that had been previously obtained from
the transducer calibration process (see Chapter 8 for details). At the end of the
mathematical manipulation, the voltage would then be transformed into a pressure
measurement of imperial units (psig). Finally, through a conversion factor, the pressure
would then be converted from imperial units to SI units (bar) for display and storage
purposes. Before being displayed and stored, the measurement would enter a warning
subroutine. If the measured pressure was higher than 62 bar, a red light and a warning
sound would be triggered.
Fuel 2.vi
{IS
VDC
IN '
Input :Voltage
fromKeith ley
From Cal ibrat ion Curve Convers ion Factor
bar gauge'""** OUT
Pressure
Output :Warn ingDisplay
Storage
IFuel l .v i l
IUSI
flfSS,
R g3^i e S ^ a
li nna j g g niatl
fuel5 ^ j | | ^/ARNTNGl
aIMl.OCurve.vf
m•JiUrf
Fuel
jFkwRa t? Lp ttm in.v i l Eud Bow Rate MminSl fue l Mass How Ratal
Iflow Rate (ka per ri.vl]
Figure 7.85 Lab View program fragment w ith detailed transducer subroutine

8/12/2019 Development of a Design Tool for Modern Gas
http://slidepdf.com/reader/full/development-of-a-design-tool-for-modern-gas 295/380
265
Figure 7.86 shows the graphical interfaces resulting from the program created using
LabView. The interfaces were designed such that they could be displayed onto two
monitors. One monitor focused on the air delivery system while the second monitor
showed details on the fuel delivery system. As can be seen from the figure, the interfaces
displayed critical testing parameters and tracked operating changes through real time
graphs. Warning lights, coupled with sounds, were strategically located throughout the
interface so that the operator could easily be alerted when operating limits were about to
be exceeded.
M O N I T O R 1
Figure 7.86 LabView front panels as displayed by monitors

8/12/2019 Development of a Design Tool for Modern Gas
http://slidepdf.com/reader/full/development-of-a-design-tool-for-modern-gas 296/380
8 I NSTRUM ENT CALI BRAT I ON PROC ESS AND SHAKE DOW N
TESTS
All the instrumentation used in the gas turbine combustion research laboratory
underwent a calibration process. This process verified the working condition of the
instrumentation used in the laboratory as well as provided coefficients that were later
used for manipulating instrument o utputs from non-engineering units into units that could
be readily understood.
Since the execution process for calibrating the various pressure transducers and
thermocouples was the same only one example per type of instrument will be given next.
Before describing the calibration process details, the fact that the transducers and
thermocouples were calibrated in line should be m entioned. In other words, the junction s
and wires used to link the instruments (i.e., pressure transducer or thermocouple) to the
Keithley DAQ were the same as those used during testing, thus avoiding possible
calibration discrepancies that could have otherw ise occurred.
8 .1 T h e r m o c o u p l e s C a l i b r a t i o n
Static calibration of the thermocouples was conducted using an Omega Engineering
CL 122-2 block calibrator. This portable equipment, shown in Figure 8.1 , calibrated all
the thermocouples (except for the liner wall thermocouples) used throughout the
laboratory. The temperature range of the CL122-2 is between - 30°C and 500°C.
266

8/12/2019 Development of a Design Tool for Modern Gas
http://slidepdf.com/reader/full/development-of-a-design-tool-for-modern-gas 297/380
267
Figure 8.1 CL 122-2 block calibrator and Allison 250-C20B inlet thermocouple
The calibration process involved inserting the thermocouple under investigation into
the block calibrator and comparing the setpoint temperature of the equipment to the
temperature measured by the thermocouple. The setpoint temperature of the equipment
could be incremented by 0.1 °C steps. The setpoints were increased by 50°C intervals
until the CL 122-2 upper range was reached. After having selected the setpoint, a 10
minute period was allowed so that the equipment could stabilize. With the block
calibrator at equilibrium, a series of temperature measurements were taken. The process
was then repeated at different temperature setpoints until the maximum temperature
range of the CL122-2 was reached. Figure 8.2 shows the calibration curve for the
thermocouple measuring the EGT exiting the Allison 250-C20B.

8/12/2019 Development of a Design Tool for Modern Gas
http://slidepdf.com/reader/full/development-of-a-design-tool-for-modern-gas 298/380
268
^„^
u41
Uara
<ua.E0
H*?r»
JU
500
450
400
350
300
250
200
150
100
50
0 100 200 300 400 500
Thermocouple Temperature ( C)
Figure 8.2 EGT thermocouple calibration
Figure 8.2 shows that 10 different setpoints were used to calibrate the EGT
thermocouple. The coefficients given by the linear trendline were then used, in the
LabView program to correct the temperature measurements. Except for the
thermocouples spot welded onto the liner wall, similar calibration processes were
repeated for all the remaining thermocouples used in the laboratory. The remaining
calibration curves can be found in Appendix F.
8.2 Pressure Tran sduc ers Cal ibrat ion
The pressure transducers were calibrated using a Druck DPI 605 pressure calibrator.
The DPI 605 is a portable equipment designed to calibrate transducers and systems with
gauge pressures ranging between - 14.7 psi and 300 psi. To calibrate a pressure
transducer, a Teflon tubing line and a tube fitting were used to couple the transducer to
the calibrator pressure p ort, as shown in Figure 8.3.

8/12/2019 Development of a Design Tool for Modern Gas
http://slidepdf.com/reader/full/development-of-a-design-tool-for-modern-gas 299/380
269
Figure 8.3 Druck DP I 605 pressure calibrator
To generate pressure or vacuum using the calibrator the volume adjuster was set to
approximately halfway. After a short stabilizing period (~ 10 seconds), the DPI pressure
display was zeroed. The instrument (DPI 605) w as then set to either generate pressure or
vacuum. After the zeroing process was completed, the vent valve was closed and by
manually operating the hand pump, the approximate required pressure was achieved.
Using the volume adjuster, the pressure sensed by the transducer was then fine-tuned.
With the system stabilized, a set of pressure measurements were then acquired using the
Keithley 2700. This process was repeated for the entire pressure transducer range. Upon
having completed the transducer calibration, the pressure or vacuum built up in the

8/12/2019 Development of a Design Tool for Modern Gas
http://slidepdf.com/reader/full/development-of-a-design-tool-for-modern-gas 300/380
270
system was released by opening the vent valve. The Teflon line was finally decoupled
from the transducer which was then linked back to the sensing port.
The transducers used in the fuel delivery system had a higher pressure range when
compared to the DPI 605. Thus, the limit pressure for the calibration of these transducers
was set by the maximum operating pressure of the DPI 605 which was 300 psig. The
possible measurement inaccuracy at pressures higher than 300 psig was deemed
acceptable since the scope of the transducers used in the fuel delivery system was that of
monitoring rather than accurately measuring performance.
Figure 8.4 shows calibration curves for the PX243A-1 pressure transducer. This
particular pressure transducer was used, having the air delivery system in the atmospheric
set-up configuration, to measure the gauge static pressure upstream of the microturbine
combustor. As can be seen from the figure, 12 pressure points were used to calibrate the
transducer. Furthermore, to m onitor the performance of the transducer over time, multiple
calibration tests were performed. In particular, Figure 8.4 shows that after almost 10
months of usage the transducer performance was still acceptable. The coefficients given
by the most recent trendline were those used in the LabView program.

8/12/2019 Development of a Design Tool for Modern Gas
http://slidepdf.com/reader/full/development-of-a-design-tool-for-modern-gas 301/380
271
2.5
@ 2'33a» 1-5ees
l
« 0.53SB 0
v> -0.5eo
s -1Q
•g -1 -5s
O -2
-2.5 8 ^
yf
y=1 .0048x-3 .5572
R 2 = l
yf
y
j/P
/y
/ ' 1*
y = 0.9975x - 3.5502R 2 = l
O Air Transducer PX243A-1-LP (Nov 1,2006)
X Air Transducer PX243A-1-LP (July 27, 2007)
-
0 0.5 1 1.5 2 2.5 3 3.5 4 4.5 5Keithley 2700 Reading (V)
Figure 8.4 PX243A-1 pressure transducer calibration curves
5.5 6.5
8.3 Pre ssur e Pro bes Ca librat ion
The Kiel probe performance w as also investigated to ensure that the claimed yaw and
pitch insensitivities were actually achieved. A probe calibration apparatus (Mahallati,
2003) available at Carleton University was used to carry out this investigation. Figure 8.5
shows the apparatus schematic and the Kiel probe being mo unted dow nstream of the inlet
nozzle. The variation in the pitch and yaw turntable angles translated into angle changes
in the probe pitch and yaw, while maintaining unchanged the Kiel probe head absolute
position (i.e., position of Kiel probe head with respect to inlet nozzle).

8/12/2019 Development of a Design Tool for Modern Gas
http://slidepdf.com/reader/full/development-of-a-design-tool-for-modern-gas 302/380
272
Figure 8.5 Kiel probe calibration rig (Adapted from Mahallati, 2003)
Figure 8.6 shows the pitch traverse results. As can be seen, the claimed pitch
insensitivity to ang les up to ± 55° was confirmed (see Appendix F for ya w results).
.*—v
</—•
(3• v H
JSuo
Uu3tfl
m
PeTSo
H
1.20
1.00
0.80
0.60
0.40
0.20
0.00
/
/ Hfl
mm-60 -40 -20 0 20 40 60
Pitch Angle (deg)
Figure 8.6 Effect of Kiel probe pitch angle on total pressure coefficient

8/12/2019 Development of a Design Tool for Modern Gas
http://slidepdf.com/reader/full/development-of-a-design-tool-for-modern-gas 303/380
273
Where the total pressure coefficient was calculated using the following formula and
the sensor locations can be seen in Figure 8.7 (M ahallati, 2003).
P -PCP p -p
(8.1)
cl
Probe
Po
Figure 8.7 Calibration rig sensor location (Adapted from Mahallati, 2003)
An attempt to calibrate the pitot rake using the calibration app aratus mentioned above
was also conducted. However, the rake could not fit within the apparatus and therefore
calibration could not be conducted. The rake readings errors, due to effects of viscosity
and wall proximity, were, thus, estimated using work carried out by MacMillan (Figure
8.8) and reported in Ower and Pankhurst (1977). Particularly, using curve A, a 0 .1 %
correction factor was applied to the readings taken using the pitot rake.

8/12/2019 Development of a Design Tool for Modern Gas
http://slidepdf.com/reader/full/development-of-a-design-tool-for-modern-gas 304/380
274
Figure 8.8 Viscosity and wall proximity correction for pitot tubes (Ower and
Pankhurst, 1977)
8.4 Orifice Ca libration
Evaluation of the orifice plate metering performance was also undertaken. The scope
of this evaluation was to understand if the manufacturing process used to produce the
orifice plate and the wall taps had been successful. The test was performed by inserting a
metering bellmouth at the blower inlet (Figure 8.9) and then by com paring the flow rates
measured by both methods. The orifice plate and wall taps manufacturing process was
deemed successful and the maximum error was found to be 2%.

8/12/2019 Development of a Design Tool for Modern Gas
http://slidepdf.com/reader/full/development-of-a-design-tool-for-modern-gas 305/380

8/12/2019 Development of a Design Tool for Modern Gas
http://slidepdf.com/reader/full/development-of-a-design-tool-for-modern-gas 306/380
276
8.5.1 W all Tap Averag ing
As previously mentioned, to gain a better estimate of static pressures each sensing
location was instrumented with four wall taps, circumferentially spaced at 90° intervals.
However, to reduce instrumentation costs, the number of pressure transducers used to
measure the static pressures was minimized by introducing averaging manifolds.
However, before this averaging process could be carried out, the static pressure
measurements of each tap were ensured to be within 1% of each other. This guaranteed
that the averaged static pressures were then meaningful measurem ents.
Figure 8.10 Performance assessment of metering bellmouth wall taps
An example of this type of shakedown test is shown in Figure 8.10 where the
metering bellmouth wall taps were under investigation. With the bellmouth properly
installed and the blower operating at steady state, a set of static pressure measurements,
using a PX243A transducer and the Keithley 2700 DAQ, were taken for each wall tap
present on the bellmouth. The results were then plotted to see if the readings were within
1% of each other (Figure 8.11). The success of the tests permitted the use of manifolds to
average the static pressures sensed by the set of wall taps. This allowed therefore, to use
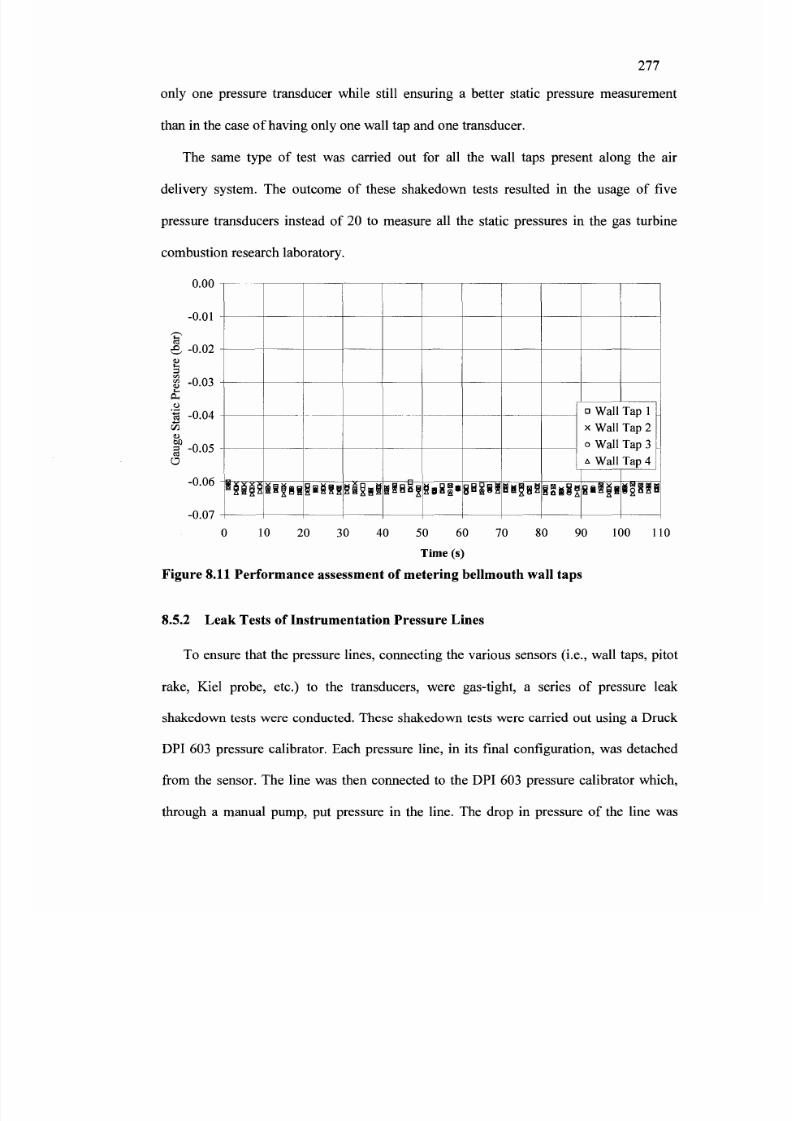
8/12/2019 Development of a Design Tool for Modern Gas
http://slidepdf.com/reader/full/development-of-a-design-tool-for-modern-gas 307/380
277
only one pressure transducer while still ensuring a better static pressure measurement
than in the case of having only one w all tap and one transducer.
The same type of test was carried out for all the wall taps present along the air
delivery system. The outcome of these shakedown tests resulted in the usage of five
pressure transducers instead of 20 to measure all the static pressures in the gas turbine
combustion research laboratory.
\J.\J\J
o1OJ ft ftljg -U.UJ
euo-5 ft r\A3 -KJ.Vt
OBri ft ft<
ft ft&
-u.uo
-0.07 -
Hm g |B g i g g g S l § g l g l 8 § | 9 e 8 » gagsi aaggS l g g § g
n W all Tap 1
x W all Tap 2
o Wall Tap 3
A Wall Tap 4
g a l | l mn
0 10 20 30 40 50 60 70 80 90 100 110
Time (s)
Figure 8.11 Performance assessment of metering bellmouth wall taps
8.5.2 Leak Tests of Instrumentation Pressure Lines
To ensure that the pressure lines, connecting the various sensors (i.e., wall taps, pitot
rake, Kiel probe, etc.) to the transducers, were gas-tight, a series of pressure leak
shakedown tests were conducted. These shakedown tests were carried out using a Druck
DPI 603 pressure calibrator. Each pressure line, in its final configuration, was detached
from the sensor. The line was then connected to the DPI 603 pressure calibrator which,
through a manual pump, put pressure in the line. The drop in pressure of the line was

8/12/2019 Development of a Design Tool for Modern Gas
http://slidepdf.com/reader/full/development-of-a-design-tool-for-modern-gas 308/380
278
monitored over a span of t ime (Figure 8 .12) . More specif ical ly , the leak tes ts were
conducted by pressuriz ing the l ines to a gauge pressure of 6 .9 bar (100 psig) and
monitor ing the pressure drop over 3 minutes . I f a pressure drop was detected, the l ine
junctions were invest igated using Snoop, a l iquid leak detector produced by Swagelok.
Snoop w as applied on the external surfaces of the jo ints and a leak wad detected if
bubble s were formed. The leaky jo int(s) wa s then addressed and the proble m corrected.
The leak tes ts were repeated unti l no pressure drop or minim al leak ( less than 0 .0035 bar;
0.05 psi) was recorded in the line under investigation.
Of a l l the tes ts conducted, the m ost problem atic one w as that of the s ta t ic tap S 3 0 B 0 1 .
A gauge pressure drop of 0 .18 bar (2 .6 psig) per minute was recorded on th is part icular
sensor l ine (Figure 8 .12) . Through many tests , the problem was identif ied to be a
defect ive gasket in the Scanivalve pressure scanner . Replacement of the gasket reduced
the pressure drop to 0 .0017 bar (0 .025 psig) per minute which was deemed acceptable .
7.0
6.0
5.06 X 1
S -
Vi -s< * >< * >a >u
O H
I
4.0
3.0
2.0
1.0
0.0
" • — • — 1 ?~*—•• — • — <
• — • «
-•- Leak Test S30B01 Oct 3, 2006
-*- Leak Test S30B01 Oct 12, 2006
0 25 50 75 100 125 150 175 200 225 250 275 300
Time (s)Figure 8 .12 Pressure leak test for S30B01 pressure l ine

8/12/2019 Development of a Design Tool for Modern Gas
http://slidepdf.com/reader/full/development-of-a-design-tool-for-modern-gas 309/380
279
After having completed the pressure leak tests, the pressure lines were then
reconnected to their respective pressure sensing ports or pitot tubes.
8.5.3 Air Delivery System Pressure Leak Tests
With the pressure lines reinstalled, the whole air delivery system w as pressurized to a
gauge pressure of approximately 6.9 bar (100 psig). The scope of the test was to inspect
the whole air delivery system for gas leaks. Particular attention was given to the welds,
used to join the various pipe segments together, to mounting structures, used for the
instrumentation (i.e., wall taps welds, Kiel probe traverse mechanism, etc.) and to pipe
end mating surfaces.
The test was carried out by pressurizing the air delivery system starting at the bleed
pipe and ending at the exhaust stack. As can be seen in Figure 8.13, a pressure regulator
was installed at the inlet of the bleed pipe so that compressed air could be safely
introduced into the sealed air delivery system. T o seal the air delivery system, a plate was
inserted and fastened between the mating surfaces of two pipes just upstream of the
exhaust stack (Figure 8.14). With the air delivery system pressurized, a careful visual
inspection, using Snoop, was conducted. All the pipe welds and instrumentation
mounting systems were deemed gas-tight. Minor leaks were found between pipe mating
surfaces. These problematic leaks were addressed by replacing the existing gaskets with
new and improved ones.

8/12/2019 Development of a Design Tool for Modern Gas
http://slidepdf.com/reader/full/development-of-a-design-tool-for-modern-gas 310/380
280
-—.
^ML.
^^^B
\ ir Dolivew^^v
^ s i t - i n
/
M^H'<?-;-'.~'h iBS
PressureRegulator
Figure 8.13 Pressure leak test for air delivery system; pressure regulator d etails
^ j l II -
Sealing Plate
n=rj=o=
//////// ////////
Figure 8.14 Pressure leak test for air delivery system; sealing p late details
8.5.4 Air Delivery System Shakedow n Tests
The next set of shakedown tests were conducted with the air delivery system in the
atmospheric configuration. In these tests the blower was used as a source of air flow so
that the instrumentation, data acquisition system and LabView programs could be
investigated and problem s could be addressed.

8/12/2019 Development of a Design Tool for Modern Gas
http://slidepdf.com/reader/full/development-of-a-design-tool-for-modern-gas 311/380

8/12/2019 Development of a Design Tool for Modern Gas
http://slidepdf.com/reader/full/development-of-a-design-tool-for-modern-gas 312/380

8/12/2019 Development of a Design Tool for Modern Gas
http://slidepdf.com/reader/full/development-of-a-design-tool-for-modern-gas 313/380
283
• 10 min ute stabilization time
• Open butterfly valve
• Acquire data
• Close butterfly valve
• Blower shut-down
From the experimental results (Figure 8.15), the conclusion was that test conditions
could be duplicated. However, when comparing the experimental results (C d =0.595)
with results given by the empirical correlation (Equation (4.93) solved using test
conditions; Cd = 0.625) a 4.8% maxim um error was calculated. T herefore, it was
concluded that the pitot rake should be calibrated so that the percentage correction to
measured velocity can be better estimated.
0.65 -.
U.O
^ U . J J
i i , U . J
cee 1
3*. «•->
U A 1 C
is4> n 1 r
HU . l
U.UD
0
0 1 2 3 4 5 6 7 8 9 10111213 1415 161 71 819 20 212 22 3 2425 26 272 8293 0
Test Number
Figure 8.15 Repeatability tests

8/12/2019 Development of a Design Tool for Modern Gas
http://slidepdf.com/reader/full/development-of-a-design-tool-for-modern-gas 314/380
284
8.5.6 Fuel Delivery System Shaked own Tests
The fuel delivery system was extensively tested using water. Once confidence in the
system was obtained, further tests using diesel fuel were conducted. The scope of the
shakedown tests using water was to evaluate the performance of the components making
up the fuel delivery system. The scope of the tests performed using diesel fuel was to
gain further knowledge on the performance of the fuel nozzles and to confirm the
accurate calibration of the purchased FT B 502 low flow rate meter.
The results of the many shakedown tests carried out using water showed that the fuel
delivery system was satisfactory. In particular, the fuel delivery system could be operated
remotely and its performance was found to be very reliable even under emergency
situations.
The tests also showed that the liquid flow rate could be accurately metered using the
fractional flow co ntrol valve and that the pressure regulator permitted gauge pressures of
up to 32.5 bar (471 psig) at the nozzle tip to b e reached.
The AS CO 8223 G02 7 on/off solenoid valve was carefully inv estigated since this was
the component that would stop the fuel from entering the combustor in case of an
emergency. As described before, the valve was electrically connected to a pressure switch
sensing the air delivery system operating pressure. In case of sudden pressure loss in the
air delivery system, the on/off solenoid valve was de-energized and fuel was stopped
from flowing into the combustor. This type of scenario was simulated by coupling the
pressure switch to the Druck 605 calibrator. The air delivery operating pressure sensed by
the switch was simulated by the Druck 605 with which the sudden loss of pressure was
achieved by opening the vent valve. The investigation of the fuel delivery response to the

8/12/2019 Development of a Design Tool for Modern Gas
http://slidepdf.com/reader/full/development-of-a-design-tool-for-modern-gas 315/380

8/12/2019 Development of a Design Tool for Modern Gas
http://slidepdf.com/reader/full/development-of-a-design-tool-for-modern-gas 316/380
286
0.35
0.3
J 0.25
£ 0.2
£ 0.15
e30.1
0.05
0
^^m
• i — — ^
«"*^_^_
• Test Data Before We lding (PJ12)• Test Data After We lding (PJ12)
— BETE Curve (PJ12)
0 10 25 30 355 20
AP (bar gauge)
Figure 8.16 Effect of differential pressure across PJ12 nozzle on water flow rate
With confidence gained in the fuel delivery system, diesel was then used to further
investigate fuel nozzle performance and to evaluate the working condition of the newly
purchased FTB 502 low flow rate meter.
The series of shakedown tests using diesel fuel showed a large discrepancy between
the mass flow rates measured by the author, using the bucket, scale and stop watch
method, and the mass flow rates measured by the FTB 502 and acquired by the Keithley
2700 Figure 8.17. Since the installation of the flow meter followed gu idelines given by
the company (Omega Engineering) it was concluded that the flow meter had to be
recalibrated. To continue with the laboratory shakedown tests, the decision to measure
the fuel m ass flow rate by creating a Lab View subroutine rather than using the FTB 502
meter was m ade. The LabV iew subroutine calculated the diesel fuel mass flow rate using
the empirical correlation (Figure 8.17) obtained from the nozzle shakedown tests.

8/12/2019 Development of a Design Tool for Modern Gas
http://slidepdf.com/reader/full/development-of-a-design-tool-for-modern-gas 317/380
287
'cT
£i ^
<i)
°?Pi
£ou*Vcrt<D
Q
0.4
0.35
0.3
0.25
0 7
0.15
0.1
0.05
0
V = -0.00012x2 + 0.01398x + 0.05423
R 2 = 1 .0
• Test Data (PJ12)
-* -FTB502
0 10 25 305 20AP (bar gauge)
Figure 8.17 Effect of differential pressure across PJ12 nozzle on diesel flow rate
35
8.5.7 Allison 250-C20B Shakedow n Tests
A series of shakedown tests were conducted on the Allison 250-C20B to evaluate its
performance after having changed the engine configuration from the original turboshaft
design to the modified APU design. In these shakedown tests the bleed duct was not
installed on the engine so that unforeseen problems could be minimize and focus could be
strictly given to the change in engine configuration. The primary objectives of the
shakedown tests were to prove the effectiveness of the major engine modification, to
ensure that the modified engine was still operating within vibration limits and to fine tune
a start-up/shut-down procedure compiled by the author (Appendix G ).
A series of three tests were condu cted using the following sequence:
• Allison 250-C20B start-up
• 2 minute dwell time at idle

8/12/2019 Development of a Design Tool for Modern Gas
http://slidepdf.com/reader/full/development-of-a-design-tool-for-modern-gas 318/380
288
• Increase, at 5% intervals, the engine operating point from idle to 100%
N i, where Ni is the rotational speed of the gas generator
• Decrease the engine operating point from 100% Ni to idle
• 2 minute dwell time at idle
• Allison 250-C20B shut-down
The series of tests conducted were deemed successful. The monitored rotational speed
of the power turbine (N2) was found to be 0% which indicated that the power turbine
shaft was not rotating, thus signifying that the engine modification was successful.
The vibrations of the Allison 250-C20B were recorded throughout the engine
operating range and were found within the maximum allowed limits. The maximum
average engine accelerations occurred when the engine was operating between 90% and
100% of the maxim um gas generator rotational speed (Nj). At these operating points, the
maximum average accelerations recorded was 4.8 g (manufacturer limit 19 g; Allison
Engine Company, 1999).

8/12/2019 Development of a Design Tool for Modern Gas
http://slidepdf.com/reader/full/development-of-a-design-tool-for-modern-gas 319/380
289
/"••s
•3a©
• p «
2M
"«o« c
5
4.5
4
3.5
3
2.5
2
1.5
1
0.5
0
0 20 40 60 80 100
Engine Rotational Speed (N1% RPM)
Figure 8.18 Effect of gas generator rotational speed on Allison 250-C 20B vibrations
As a result of the conducted shakedow n tests, changes to the Allison 250-C 20B start
up/shut-down operating procedure were made (Appendix G). An example of the changes
made w as to include overlooked details, such as to manually spin the compressor before
start-up to ensure free rotation of the turbomachinery.
8.5.8 Bleed Shak edown Tests
After having conducted the above m entioned tests, which increased confidence in the
new APU configuration of the Allison 250-C20B, a series of shakedown tests were
performed to analyze the engine performance as air was bled downstream of the engine
compressor. Therefore, the test objectives w ere to analyze the performance of the engine
in the bleed configuration, to verify that the orifice sizing was adequate and to measure
the amount of air that could be safely bled from the engine before the EGT limit was
exceeded.

8/12/2019 Development of a Design Tool for Modern Gas
http://slidepdf.com/reader/full/development-of-a-design-tool-for-modern-gas 320/380
290
These shakedown tests unfortunately revealed an unforeseen problem that, due to
time constraints, will have to be addressed in the future. T wo bleed shakedown tests w ere
carried out. During these tests, compressed air was successfully bled from the engine, but
only for a time span of 2 minutes (Figure 8.19). The unforeseen problem was the rapid
rise in air temperature in the Gas Turbine Room due to the Allison 250-C 20B 's oversized
exhaust manifolds (Figure 8.20). The high test cell temperature not only decreases the gas
turbine performance, due to the decrease in air density, but could also lead to a greater
problem like the activation of the fire detection system. Especially, since the exhausts
manifolds are in close proximity to the fire detection system. The cold water sprayed by
the sprinklers and the hot engine would then lead to thermal gradients of such high
magnitudes that, in the worst-case scenario, could m ake the engine inoperab le.
0.25
en
0.2
0.15
S o.i
30.05
0
From Start-up to 90% N ,
No B leed
Engine @ 90 % N ,
Bleed
•
From 90% N j
to Idle
No B leed
•• «•*
»
i
0 50 100 150 200 250
Testing Time (s)
Figure 8.19 Allison 250-C20B bleed shakedown test
300 350 400 450

8/12/2019 Development of a Design Tool for Modern Gas
http://slidepdf.com/reader/full/development-of-a-design-tool-for-modern-gas 321/380
291
350
54 300
•—
o.&<a
HSoo
a
a
250
200
150
100
50
From Start-up to 90% Ni
No Bleed
Engine @ 90% N ,
Bleed
From 90% N
to IdleNo Bleed
0
0 50 100 150 200 250 300 350 400 450
Testing Time (s)
Figure 8.20 Effect of testing time on Gas Turbine R oom temperature
During the first shakedown test, bleeding air from the engine caused the EGT to be
pushed close to its limit (1083 K; Allison Engine Company, 1999) (Figure 8.21). The
large surface area of the exhausts manifolds, which were sized to accommodate gas
turbine engines up to 1 MW power output, radiated a large amount of heat to the
surrounding air. In fact, the Gas Turbine Room temperature rose from 308.7 K to 324.6 K
(35.6°C to 51.5°C) in 2 minutes (Figure 8.20). Because of this, the amount of air bled
kgfrom the engine was qu ickly reduced to 0 —— and the Allison 250 -C20 B eng ine wa s
s
brought down to idle. After a 2 minutes dwell time at idle the test was terminated by
shutting down the engine.

8/12/2019 Development of a Design Tool for Modern Gas
http://slidepdf.com/reader/full/development-of-a-design-tool-for-modern-gas 322/380
1000
292
~*fy ^•
From Start-up to 90% Nj
No Bleed
9 0% N
Bleed
•
•••
*•
From 90% N, _
to Idle
No Bleed
0 50 100 150 200 250 300 350 400 45C
g
maue
G-t-»
3
E
900
800
700
600
500
400
300
200
100
Testins Time (s)Figure 8.21 Effect of testing time on gas turbine exhaust temperature
To solve this unforeseen problem in a timely fashion, the exhaust manifolds were
wrapped with vitreous aluminosilicate refractory ceramic paper. This m aterial, which had
been previously used to make gaskets for the pipe mating surfaces of the air delivery
system, was readily available from Hydro Silica Gaskets and has very good insulation
properties. Furthermore, the 6.4 mm paper could be easily cut and molded around the
Allison 250-C20B exhaust manifolds. Once the exhaust manifolds were insulated testing
was resumed.
Unfortunately, the second bleed test did not prove to be any more successful. The
heat transfer between the exhausts and the surrounding air was reduced, however, the gas
analyzer present in the test cell was set off by the smoke produced by the ceramic paper
as result of the high temperatures to wh ich it was exposed.
From the outcomes of the tests, a better, but more timely, solution is needed before
further testing can be resumed. The problem encountered could be easily solved with

8/12/2019 Development of a Design Tool for Modern Gas
http://slidepdf.com/reader/full/development-of-a-design-tool-for-modern-gas 323/380
293
proper exhaust manifolds insulation. By applying ceramic coatings on both the inner and
outer surfaces of the exhaust manifolds, the amount of heat transferred to the
surroundings could be greatly reduced. If, however, the coating application is not
sufficient, the use of custom made high tem perature blankets, such as the ones produced
by companies like Worbo Incorporated (Peterborough, Canada) or Superior Energies
Incorporated (Groves, USA), could further minimize or even eliminate the heat transfer
to the surroundings. Because of time constraints and long lead times for applying ceramic
coatings and/or high temperature blankets, the above solutions had to be regarded as
recommendations for future work.

8/12/2019 Development of a Design Tool for Modern Gas
http://slidepdf.com/reader/full/development-of-a-design-tool-for-modern-gas 324/380
9 CONCLU SI ONS AND RECO MM ENDA TI ONS
The following conclusions and recommendations are based on the research work
which has been reported in the previous chapters. Specifically, with respect to the
objectives outlined in Section 1.3, as well as the results discussed in Chapters 5 and 8 the
following conclusions and recomm endations can be drawn.
9.1 Conclusions
A design methodology, based on empirical and semi-empirical correlations, was
developed to preliminary design conventional and lean premixed combustors which use
either liquid or gaseous fuels. The use of this methodology is a starting point for any
future design refining processes whether through using computer models, like CFD or
CMR, or through experimentation.
Using the developed design methodology, a lean premixed, prevaporized
microturbine combustor was designed and then manufactured. E ven though the small size
of the combustor created some fabrication difficulties, the final product was successfully
completed through careful selection of manufacturing tech niques.
A gas turbine combustion research laboratory w as also designed and con structed. T he
commissioned gas turbine combustion research laboratory was demonstrated to be
functional through hundreds of hours of shakedown tests. In general, the research
laboratory w as designed so that tests independent from combustor op erating points could
be carried out in an atmospheric environment, thus allowing development costs to be
minimized. High pressure combustion tests could be carried out using compressed air
which is bled from an Allison 250-C20B gas turbine engine.
294

8/12/2019 Development of a Design Tool for Modern Gas
http://slidepdf.com/reader/full/development-of-a-design-tool-for-modern-gas 325/380
295
The following conclusions can be drawn for the constructed gas turbine combustion
research laboratory:
• An Allison 250-C20B gas turbine engine wa s successfully modified from its
original turboshaft design to an APU configuration through the removal of the
power turbine.
• The Allison 250-C20B modification resulted in the elimination of a hydraulic
dynamometer and its operator. Therefore, reducing future testing costs.
• The Allison 250-C20B gas turbine engine was equipped with additional
instrumentation for better monitoring purposes.
• Through a fail-safe m echanism the Allison 250-C20B could automatically
return to its idle operating condition in case of loss of control.
• Com pressed air was successfully bled downstream of the Allison 250-C20B
compressor. However, the engine exhaust manifolds will have to be properly
insulated before any prolonged testing times can be carried out.
• An air delivery system was successfully designed and constructed. It could
also be remotely operated and monitored under high and low pressure testing
conditions.
• The air delivery system and microtu rbine combu stor were successfully
instrumented so that the combustor performance can be evaluated in the
future.
• A liquid fuel delivery system wa s successfully designed and constructed . It
could also be remotely operated and m onitored.

8/12/2019 Development of a Design Tool for Modern Gas
http://slidepdf.com/reader/full/development-of-a-design-tool-for-modern-gas 326/380
296
• The fuel delivery system reliability and respon se to possib le emergency
scenarios was extensively investigated and deem ed m ore than acceptable.
• An operating station was successfully designed and constructed. The
operating station allowed controlling the air and fuel delivery systems from a
safe and remote environment.
In conclusion, the developed gas turbine combustion research laboratory has the
potential to be a valuable tool for gas turbine combustion research. The careful selection
of the materials used in the gas turbine combustion research laboratory also allows
alternative fuels combustion research to be possible. Furthermore, the modular design of
the laboratory not only allows it to be easily adapted to future combustor designs, but also
permits it to test gas turbine hot section componen t m aterials and coa tings.
9.2 Recommendations
As a result of the work conducted in this thesis, the main recom mendations are:
• The developed design methodology should be regularly updated to include
new empirical and semi-empirical correlations resulting from innovative
research.
• The insulation of the Allison 250-C20B exhaust manifolds should be
addressed before any more bleed tests are attempted.
• Mo re bleed tests are needed to better evaluate the performance of the Alliso n
250-C20B and the air delivery system.
• The pitot rake should be calibrated.

8/12/2019 Development of a Design Tool for Modern Gas
http://slidepdf.com/reader/full/development-of-a-design-tool-for-modern-gas 327/380
297
• The performance of FTB 502 low flow rate meter, purchased from Om ega
Engineering, should be further investigated and possibly sent back to the
company for recalibration.
• The time needed to acquire all the data produced by the gas turbine
combustion research laboratory could be further reduced by using a recently
received DSA3217 Scanivalve pressure module. This pressure module, which
can measure up to 18 pressures, could be used in combination with the
Keithley 2700. This, however, would require modifying the LabView
programs to reflect the changes.
• A remotely controlled traverse mechanism should be designed and
constructed for both the Kiel probe and the thermocouple measuring the
microturbine com bustor outlet gas temperatures.
• The first combustion tests should be very conservative and done to assess the
structural performance of the air delivery system and its instrumentation.
Furthermore, these tests should give information on the effects of the radiative
heat on the Combustion Room temperature. Corrective measures should be
taken if needed.
• Tests should be conducted to assess the performan ce of the develope d and
constructed microturbine combustor.

8/12/2019 Development of a Design Tool for Modern Gas
http://slidepdf.com/reader/full/development-of-a-design-tool-for-modern-gas 328/380
10 REFERENCES
Abramovich, G.N., 1962. T heory of T urbulent Jets. Cambridge, MA : MIT Press
Allaire, D., 2006. A Physics-Based E missions M odel for Aircraft Gas TurbineCombustors. M .Sc. Thesis, Massachusetts Institute of Technology, Cam bridge, USA .
Allison Engine Company, 1999. Model 250-C20, -C20B, -C20F, -C20J, -C20W C20SOperation and Maintenance Manual Publication No. 10W2. Sixth Edition, ThirdRevision.
Allison Engine Company, 1999. Model 250-C20, -C20B, -C20F, -C20J, -C20W C20SEngine Illustrated Parts Catalogue Publication No. 10W4. Thirteenth Edition, SecondRevision.
Anderson, J.D., 1995. Computational Fluid Dynamics the Basics with Application. NewYork: McGraw-Hill.
Anonymous, 2008. Helicopter Flight Information. Accessed: February 7, 2008.http://helicopterflight.net/engine 1 jpg
ASME B31.3, 2002. Process Piping ASME Code for Pressure Piping, B31. New York:ASME.
Assanis, D.N., Filipi, Z.S., Fiveland, S.B., Symiris, M., 2003. A Predictive Ignition DelayCorrelation Under Steady-State and Transient Operation of a Direct Injection Diesel
Engine. Transaction of the ASME, 125 (April), 450-457
AWS A2.4-98, 1998. Standard Symbols for We lding, Brazing, and N onde structiveExamination. Miami, Fl: AW S.
AWS C5.5-80, 1980. Recomm ende d Practices for Gas Tungsten Arc We lding. Miami,Fl: AWS.
AWS D14.6, 2005. Spec ification for We lding of Rotating Elem ents o f Equipme nt. Miami,Fl: AWS.
Baker, R.C., 2003. Introductory Guide to Flow Measurement, (ASME Edition). NewYork: ASME Press.
Ballal, D.R., Lefebvre, A.H., 1972. A Proposed Method for Calculating F ilm-Coole WallTemperatures in Gas Turbine Combustion Chambers. ASME Paper 72-WA/HT-24
Ballal, D.R., Lefebvre, A.H., 1981. Some Fundamental Aspects of Flame Stabilization.Pages 48.1-48.8 of: Fifth International Symposium on Airbreathing Engines.
298

8/12/2019 Development of a Design Tool for Modern Gas
http://slidepdf.com/reader/full/development-of-a-design-tool-for-modern-gas 329/380
299
Beer, J.M., Chigier, N.A ., 1983. Combustion Aerodynamics. Malabar, Fl: Krieger
BET E, 2007. Accessed: January 1 1, 2007. PJ - Smallest Physical Size, ImpingementFog, Atomizing, http://www.bete.com/products/pj.html
Bhadeshia, H.K.D.H., Honeycombe, R.W.K., 2006. Steel - Microstructure andProperties. Third Edition. Oxford, UK: Butterworth - Heinemann.
Blevins, R.D., 1984. Applied Fluid Dynamics Handbook. New York: Van NostrandReinhold Company.
Boyce, M.P., 2006. Gas Turbine Engineering Handbook. Third Edition. Burlington, MA:Gulf Professional Publishing.
Campbell, F.C. 2006. Manufa cturing T echnology for Aerospace Structural Mate rials.
San Diego, CA: Elsevier S cience and Technology Books.
Cengel, Y.A., 1997. Introduction to Thermodynamics and Heat Transfer. New York:McGraw-Hill
Charest, M.R.J., 2005. Design Methodology for a Lean Premixed Prev aporized CanCombustor. M .Sc. Thesis, Carleton University, Ottawa, Canada.
Chok, N.N., 2003. CFD Simulation of a Gas Turbine Combustor. M.Sc. Thesis, CarletonUniversity, Ottawa, Canada.
Cumpsty, N., 2003. Jet Propulsion.
Second Edition. Cambridge, UK: CambridgeUniversity Press.
Derr, W.S., Mellor, A.M., 1990. Recent Developments. Chapter 5 of: Mellor, A.M. (ed),Design of Modern Turbine Combustors. N ew Y ork: Academic Press.
Davis, J.R., (ed), 2000. Nickel, Cobalt, and Their Alloys. Materials Park, OH: ASMInternational.
Dodds, W.J., and Bahr, D.W., 1990. Combustion System Design. Chapter 4 of: Mellor,A.M. (ed), Design of Modern Turbine Combustors. New York: Academic Press.
Elkotb, M.M., 1982. Fuel Atomization for Spray Modeling. Progress in Energy andCombustion Science, 8 (1), 61-91
FLUENT Inc., 1998. Fluent 5 Docum entation. 10 Cavendish Court, Lebanon, NH 03766
Fox, R.W., McDonald, A.T., 1994. Introduction to Fluid Mechanics. Second Edition.New York: John Wiley & Sons, Inc.

8/12/2019 Development of a Design Tool for Modern Gas
http://slidepdf.com/reader/full/development-of-a-design-tool-for-modern-gas 330/380
300
Fox, R.O., 2003. Com putational Mode ls for Turbule nt Reacting Flows. Cambridge, UK:Cambridge U niversity Press
Freeman, B.C., 1965. Discharge Coefficients of Combustion Chamber Dilution Holes.M.Sc. T hesis, College of Aeron autics, Cranfield, England
Gauthier, J.E.D., 2005. Gas Turbine Combustion. Carleton University, Ottawa. LectureNotes for MECH 5400
Gauthier, J.E.D., Bardon, M.F., Rao, V.K., 1996. General Flame Propagation Model forFuel Droplet, Particle and Vapour Mixtures in Air. Journal of the Institute of Energy,69 (June), 59-67.
Gauthier, J.E.D., 2005. Gas Turbines. Carleton University, Ottawa. Lecture Notes for
MECH 5402.
Gauthier, J.E.D., 2007. Gas Turbine Combustion. Carleton University, Ottawa. LectureNotes for MECH 5400
Gulder, O.L., 1986. Flame Tem perature Estimation of Conventional and F uture Fuel Jets.Transaction oftheASME, 108, 376-380
Gunstone, B., (ed), 2004. The Cambridge Aerospace Dictionary. Cambridge, UK:
Cambridge U niversity Press.
Haas, D.W., 1996. The Instrumentation Design and Control of a T63-A-700 Gas TurbineEngine. M .Sc. Thesis, Naval P ostgraduate Schoo l, Monterey, California.
Hallett, W.L.H., 2003. Combustion in Diffusion Systems. University of Ottawa, Ottawa,Lecture Notes for MCG 5192.
Hansen, G.A., Douglass, R.W., Zardecki, A., 2005. Mesh Enhancem ent-Selected EllipticMe thods Foundation and Applications. London: Imperial College Press
Hewitt, G.F., Vassilicos, J.C., 2005. Prediction of Turbulent Flow. Cambridge, UK:Cambridge U niversity P ress
Jamesbury, 2003. Series 815 ANSI Class 150 and Series 830 ANSI Class 300 Wafer-Sphere® High performance Butterfly Valves. Shrewsbury, Ma: Metso Automation.
Jiang, L.Y., Campbell, I., 2005. Turbulence Modeling in a Modern Combustor. ASMEPaper GT2005-68403

8/12/2019 Development of a Design Tool for Modern Gas
http://slidepdf.com/reader/full/development-of-a-design-tool-for-modern-gas 331/380
301
Jiang, L.Y., Campbell, I., 2007. Reynolds Analog in Combustor Modeling. ASME PaperGT2007-27017
Kaddah, K.S., 1964. Discharge C oefficients and Jet De flection Angles for Combu storLiner Air Entry Holes. M . Sc. Thesis, College of Aeronautics, Cranfield, England
Kee, R. J., Rupley, F. M., Miller, J. A., Coltrin, M. E., Grcar, J. F., M eeks , E., Moffat, H.K., Lutz, A. E., Dixon-Lewis, G., Sm ooke, M. D ., Warnatz, J., Evan s, G. H., Larson R.S., Mitchell, R. E., Petzold, L. R., Reynolds, W . C , Caracotsios, M., Stewart, W. E.,Glarborg, P., Wan g, C , M cLellan, C. L., Adigun, O., Houf, W . G., Chou, C. P ., Miller,S. F., Ho, P., Young, P . D., Young, D. J., Hodgson, D. W ., Petrova, M. V.,Puduppakkam, K. V., 2006. Chemkin Release 4.1, San Diego, CA: Reaction Design.
Kilik, E., 1976. The Influence ofSwirler Design Parameters on the Aerodynamics of theDownstream Recirculation Region. Ph .D. Thesis, School of Mechanical Engineering,Cranfield Institute of Technology.
Klein, A., 1995. Characteristics of Combustor Diffusers. Progress in Aerospace Science ,31(3), 171-271.
Kolanowsky, B. F., 2004. Guide to Microturbines. Lilburn, GA: Fairmont Press Inc.
Kretschmer, D. 2000. Le Foyer de la Turbine a Gaz. Laval University, Quebec City.Lecture Notes for GMC-65435.
Kurzke, J., 200 5. GasTurb 10. Max Feldbaurer W eg 5, 85221, Dachau, Germany
LAN L, 2005. Process Piping Guide. Accessed: October 11, 2005 .http://library.lanl.gov/infores/stand/
Lefebvre, A.H. 1999. Gas Turbine Combustion. Second Edition. London: Taylor &Francis.
Mahallati, A., 2003. Aerodynamics of a Low-Pressure Turbine Airfoil Under Steady andPeriodically Unsteady Conditions. Ph.D. Thesis, Carleton University, Ottawa, Canada.
Matthews, C , 2005. ASME E ngineer's Data Book. Second Edition. New York: ASMEPress.
Mattingly, J.D., Heiser, W.H., Pratt, D.T. 2002. Aircraft Engine Design. Second Edition.Reston, VA: AIAA Education Series
Mellor, A.M., (ed), 1990. Design of Modern Turbine Combustors. London: AcademicPress

8/12/2019 Development of a Design Tool for Modern Gas
http://slidepdf.com/reader/full/development-of-a-design-tool-for-modern-gas 332/380
302
Mongia, H.C., 2003. Data Reduction Analysis (DRA) fir Emissions and Lean BlowoutPart 1: Mostly Empirical Analysis (ME A). AIAA Paper 2003-0822
Murphy, CM., 2004. Design and Construction of a Gas Turbine Combustor Test Rig forAlternative Fuel Testing. M.Sc. Thesis, Carleton University, Ottawa, Canada.
Nayyar, M.L., 2000. Piping Handbook. New York: McGraw-Hill
Nukiyama, S., Tanasawa, Y., 1939. Experiments on the Atomization of Liquids in anAirstream. T ransaction of the ASME , 5, 68-75
Olikara, C , Borm an, G.L., 1975. A Comp uter Program for Calculating Properties ofEquilibrium Combustion Products with Some Applications to I. C. Engines.SAE Paper 750468
Omega Engineering, 2004. The Temperature Measurement Handbook and Encyclopedia.
Volume MMV
Omega Engineering, 2000. The Pressure, Strain and Force Handbook and Encyclopedia.Volume MM.
Ower, E., Pankhurst R.C., 1977. The Me asurement of Air Flow. Fifth edition. New York:Pergamon Press.
Peters, J.E., Hammond, D.C., 1990. Combustion System Design. Chapter 1 of: Mellor,A.M. (ed), Introduction to Combustion for Gas T urbines. New York: Academic Press.
Poeshl, G., Runhkamp, W., Pfost, H., 1994. Combustion with Low Pollutant Emissionsof Liquid Fuels in Gas Turbines by Premixing and Prevaporization. ASME Paper 94-GT-443
Poinsot, T., Veynante, D., 2001. Theoretical and Numerical Combustion. Philadelphia:R.T. Edwards, Inc.
Ranz, W.E., Marshall, W.R., 1952. Evaporation from Drops. Parts I & II. ChemicalEngineering Program, 48, 141-146; 173-180.
Reed, R.C., 2006. The Superalloys Fundamentals and Applications. Cambridge, UK:Cambridge U niversity P ress
Rizk, N.K., Chin, J.S., Marshall, A.W., Razdan, M.K., 2002. Prediction of NOxFormation Under Combined Droplet and Partially Premixed Reaction of DiffusionFlame Combustors. Journal of Enginee ring for Gas T urbines and Powe r, 124 (July),31-38.

8/12/2019 Development of a Design Tool for Modern Gas
http://slidepdf.com/reader/full/development-of-a-design-tool-for-modern-gas 333/380
303
Rolls-Royce pic, 1996. T he Jet Engine. Fifth Edition. Derby: The Technical P ublicationsDepartment Rolls-Royce pic.
Rolls-Royce pic, 2004. Model 250. Accessed: December 11 , 2007.http://www .rolls-royce.com/civil_aerospace/products/regional/model250/description.jsp
Rosin, P., Rammler, E., 1933. The Laws Governing the Fineness of Powder Coal.Journal of Institute of Fuel, 7 (31), 29-36
Russo, C , M ori, G., Parente, J., 2007. Micro Gas Turbine Com bustor Em issionsEvaluation Using the Chemical Reactor Modelling Approach. ASME Paper GT2007-27687.
Saravanamuttoo, H.I.H., (ed), 1990. Recommended Practices for Measurement of GasPath Pressures and Temperatures for Performance Assessment of Aircraft TurbineEngines and Components. AGARD Advisory Report No. 245
Saravanamuttoo, H.I.H., Rogers, G.F.C., Cohen, H. 2001. Gas Turbine Theory. FifthEdition. New Y ork: Prentice Hall.
Sawyer, J.W., (ed), 1985. Sawyer's Gas Turbine Engineering Handbook. Third Edition.Norwalk, CT: Turbomachinery International Publications.
Schneider, E., Sadiki, A., Maltsev, A., Janicka, J., 2007. Numerical Study of thePrecessing Vortex Core in a Confined Partially Premixed Swirl Combustion System.ASME Paper GT2007-27272.
Smith, P., Zappe R. W., 200 4. Valve Selection Handbook - Engineering Fundamentals forSele cting the Right V alve Design for Eve ry Flow Application. Fifth Edition. New York:Gulf Professional Publishing.
Spincraft, 2007. What is metal spinning? Accessed: December 10, 2007.www.spincraft.net/metalspin.htm
Swagelok, 2003. Tubing Data. Miami: Swagelok Company
Taylor, J.R., 1978. Experime ntal Clean Com bustor Program - Phase III, TurbulenceMeasurement Addendum. NASA CR-135422
Tsague, L., Tatieste, T.T., Ngundam, J., Tsogo, J., 2007. Prediction of Emissions inTurbojet Engines Exhausts: Relationship between Nitrogen Oxides Emission Index(EINOX) and the Operational Param eters. Aerospace Science and T echnology, 11 (2007),459-463.
Tschaetsch, H., 2006. Metal Forming Practice Processes - Machines - Tools. New York:Springer

8/12/2019 Development of a Design Tool for Modern Gas
http://slidepdf.com/reader/full/development-of-a-design-tool-for-modern-gas 334/380
304
Turns, S.R., 2000. An Introduction to Combustion: Concepts and Applications. Second
Edition. New York: McGraw-Hill.
United Sensors, 2005. Kiel Probes General Information. Accessed: May 10, 2005
http://www.unitedsensorcorp.com/kiel.html
Wanner Engineering, 2002. Instruction Manual Installation - Operation Parts - ServiceModels: C-62-A; C-62-D. Minneapolis: W anner Engineering, Inc.
Weman, K., 2003. We lding Process Handbook. New York: CRC Press.
W hite, F.M., 1999. Fluid M echanics. Fourth Edition. New York: McGraw-Hill.
Winterfeld, G., Eickhoff, H.E., Depooter, K., 1990. Combustion System Design. Chapter3 of: Mellor, A.M. (ed), De sign of Modern Turbine Combustors. New York: Academic
Press.

8/12/2019 Development of a Design Tool for Modern Gas
http://slidepdf.com/reader/full/development-of-a-design-tool-for-modern-gas 335/380
A P P E N D IX A : E X A M P L E O F M I C R O T U R B I N E C O M B U S T O RT E C H N I C A L D R A W I N G

8/12/2019 Development of a Design Tool for Modern Gas
http://slidepdf.com/reader/full/development-of-a-design-tool-for-modern-gas 336/380
o

8/12/2019 Development of a Design Tool for Modern Gas
http://slidepdf.com/reader/full/development-of-a-design-tool-for-modern-gas 337/380
307
APPENDI X B : MA TERI ALS PRO PER TI ES

8/12/2019 Development of a Design Tool for Modern Gas
http://slidepdf.com/reader/full/development-of-a-design-tool-for-modern-gas 338/380
Hastelloy X
TYPICAL PHYSICAL PROPERTIES
T e m p e r a t u r e ,
D e n s i t y 7 2
M e l t i n g R a n g e 2 3 0 0 - 2 4 7 0
Electr ica l R esist ivi ty 72
»F B r i t i s h U n i t s
0.297 l b / i n 3
46.6 microhm- in .
(712 ohms per cir. mll-ft.)
T e m p e r a t u r e ,
2 2
1 2 6 0 - 1 3 5 5
22
°C M e t r i c U n i t s
8 .22 g / cm 3
1.18 microhm-cm
Thermal Conduct ivi ty 70
200
500
1100
1300
1500
1700
Room
200
400
600
800
1000
1200
1400
1600
1800
63 Btu- in. / f t .3 hr.-°F
76 Btu- in. / f t .2 hr.-°F
98 Btu- in. / f t .2 h r . - T
144 Btu- in. / f t .2 hr .-"F
159 Btu- in. / f t .2 hr.-°F
174 Btu- in. / f t .2 hr.-°F
189 Btu- in. / f t .2 hr.-°F
0.116 Btu/lb.-°F
0.117 Btu/ lb.-0F
0.118 Btu / lb . - 'F
0.119 Btu/lb.-°F
0.123 Btu/ lb.-°F
0 .130 B tu / l b . - T
0.139 Btu/ib.-°F
0.151 Btu/ib.-°F
0.167 Btu/lb.-°F
0.186 Btu/lb.-°F
21
93
200
593
704
816
927
Room
93
204
316
427
538
649
760
871
982
9.1 W/m-K
11.0 W/m-K
14.1 W/m-K
20.8 W/m-K
22.9 W/m-K
25.1 W/m-K
27.2 W/m-K
486 J/Kg-K
490 J/Kg-K
494 J/Kg-K
498 J/Kg-K
515 J/Kg-K
544 J/Kg-K
582 J/Kg-K
632 J/Kg-K
699 J/Kg-K
799 J/Kg-K
Specific Heat
2000 0.205 B tu / ib . - 'F 1093 858 J /Kg-K
Mea n Coeff ic ient of
Therm a l Expa ns ion
79-200
79-1000
79-1200
79-1350
79-1500
79-1650
79-1800
7.7 m icro inches/ in .
8 .4 micro inches/ in .
8 .6 micro inches/ in .
8 .8 micro inches/ in .
8 .9 micro inches/ in .
9 .1 micro inches/ in .
9 .2 micro inches/ in .
.°F
-°F
-°F
-°F
-°F
•°F
.°F
26-93
26-538
26-649
26-732
26-816
26-899
26-982
13.9 10-6m/m-°C
15.1 10-6m/m- ',C
15.5 10 6 m / m - X
15.8 10-em/m-°C
16.0 10 e m/m-°C
16.4 10-6m/m-°C
16.6 10-6m/m-°C
Poisson's
Ratio
-108
72
0.328
0.320
-78
22
0.328
0.320
M a gnet ic Room
Permeabi l i ty
1.002 at 200 oersteds (15,900 A/m)

8/12/2019 Development of a Design Tool for Modern Gas
http://slidepdf.com/reader/full/development-of-a-design-tool-for-modern-gas 339/380
Stainless Steel 316L
( 1 3 7 9 )
( 1 2 4 1 )
1 6 0
( 1 1 0 3 )
( 9 6 5 ) _
1 2 0
m1 0 0
( 6 0 9 )
( 5 5 2 )
H H )
4 0
( 2 7 6 )
2 0
( 1 3 8 )
—
—
—
—
—
— J
—
—
<»
<
v
^.. %
*»
l o n g a t i o n
—
—
—
—
—
—
—
—
—
—
40 £
20
3 0 46 50C o l d R e d u c t i o n
7 0 80
Physical Properties
Density, 0.29 lbs/in3
7.99 g/cm3
Electrical Resistivity, microhm-in (microhm-cm)
68°F(20°C)-29.4(74)
Specific Heat, BTU/lb/°F (kJ/kg«K)
32 - 212°F (O-1O0°C) - 0.12 (0.50)
Thermal Conductivity, BTU/hr/ft2/ft/0F (W/m«
at212°F(100°C)- 9.4(16.2)
at 932°F(500°C)- 12.4(21.4)
Mean Coefficient of Thermal Expansion,
in/irv'
0
F(|Jm/m • K)3 2 - 212 aF(0-100 cC}- 8.9 x1 0 6 (16.0)
3 2 - 6O0°F(0-315cC)-9.0x10«(16.2)
32 - 1000°F (0 - 538°C) - 9.7 x 10* (17.5)
32 - 1200°F (0 - 649°C) -10.3 x 1 06 (18.5)
32-1500°F(0-871°C)-11.1x10 s (19.9)
K)
Modulus of Elasticity, ksi (MPa)28.0x 10³(193x 103) in tension
11.2 x 10³ (77x103) in torsion
Magnetic Permeability, H = 200 Oersteds
Annealed - 1.02 max.
Me lting Range, °F (°C) - 2500 - 2550 ( 1 3 7 1 -1399)

8/12/2019 Development of a Design Tool for Modern Gas
http://slidepdf.com/reader/full/development-of-a-design-tool-for-modern-gas 340/380
APPENDI X C : BETE PJ MOD EL I NFORM ATI ON
Smallest ^Physical Size
DESIGN FEATURES
• High energy efficiency
• One-piece, compact construction
• No whirl vanes or internal parts
• 1/8" or 1/4" male connection• 100-mesh screen, 10 micron paper fil
ter or polypropylene filter optional
SPRAY CHARACTERISTICS
• F inest fog of any direct pressure nozzle• Produces high percentage of droplets
under 50 microns
Spray p attern: Cone-shaped FogSpray angle: 90°. For best 90° patternoperate nozzle at or above 4 barFlow rates: 0.043 to 5.34 l/min
M e t a l
-r.ovnwor D-Fog Pattern PJ with po lypropylene Alter

8/12/2019 Development of a Design Tool for Modern Gas
http://slidepdf.com/reader/full/development-of-a-design-tool-for-modern-gas 341/380
FowReaDm
o
Im
n
m
9SaA
e 18o14PpSz
B
N
18
O 14
N
e
N
mb
P P P P P
S
P P P P P
KF
o
00
Q0S
00
00
00
01S
02
02
04
0S
LT
P
MN
©B
2
3
5
1
2
3
5
7
b
b
b
b
b
b
b
b
00
00
00
00
00
01
0Q
O0S
01
01
01
02
00
00
01
01
02
02
03
00
01
01
02
02
03
04
01
01
01
02
03
04
05
07
02
02
03
04
06
08
10
12
03
03
05
07
10
12
16
19
04
05
06
09
13
16
20
24
05
07
09
12
18
22
29
34
09O
11
14
20
28
34
45
53
A
o
A
o
A
o
S
a
O
c
G
D
Hg
Da
m
(m
Hm
01
2
1
02
2
1
02
2
1
03
2
1
03
2
1
0S
3
1
06
4
2
07
4
2
08
5
2
10
6
3
Pp
Sz
18
14
Dm
m
A
B
1
1
11
2
6
12
Wt
CM
a7
FowR
e
run
=KVbQ

8/12/2019 Development of a Design Tool for Modern Gas
http://slidepdf.com/reader/full/development-of-a-design-tool-for-modern-gas 342/380
C
eo
U
v
sy
A
c
o
0
P
a
2
b
W
ae
19 8 7 6 4
-3-2 1 0
N
mb
Ds
b
o
iO
O
OOOOOOO
*_
•co
^
«Tooq^
•
-C
T
'"
•~
Do
Szepm
2 2 1
0
V
um
Ds
b
o
I
1
fN
o
^
cD
^
^
o
^
T
LOc
N
-
N
eDo
e
Sz
aenMco
A
c
oE
n
n
D
me
E
mae
Do
Sz
Inom
o
1 1 1 w
8 6 4 2 0
S
a
Ae
Ds
b
o
1
1
1
1
t
C
C
'N
0O0
^S
T
OcO^
h
<U
O-N
qqqqT:T-
Ni
Q
T;
»N^
T
:h-;
cj
O
OOOOOOOn_*g
£
(OT
TC
C
^
'Do
m^
18 6 4 2
0
C
m
av
%V
um
r~
:
//
/
in
n
n
m
n n
c
c><Nto
o3r
L
}
-
o
-
O
O
O
O
O
O
O
O
T
T
OJ
CDT
TC
M
C
Do
Sze
m
s=1
1c
01
mn
D
=
D
5
D
1
DV
9=
s
c
a
om
c
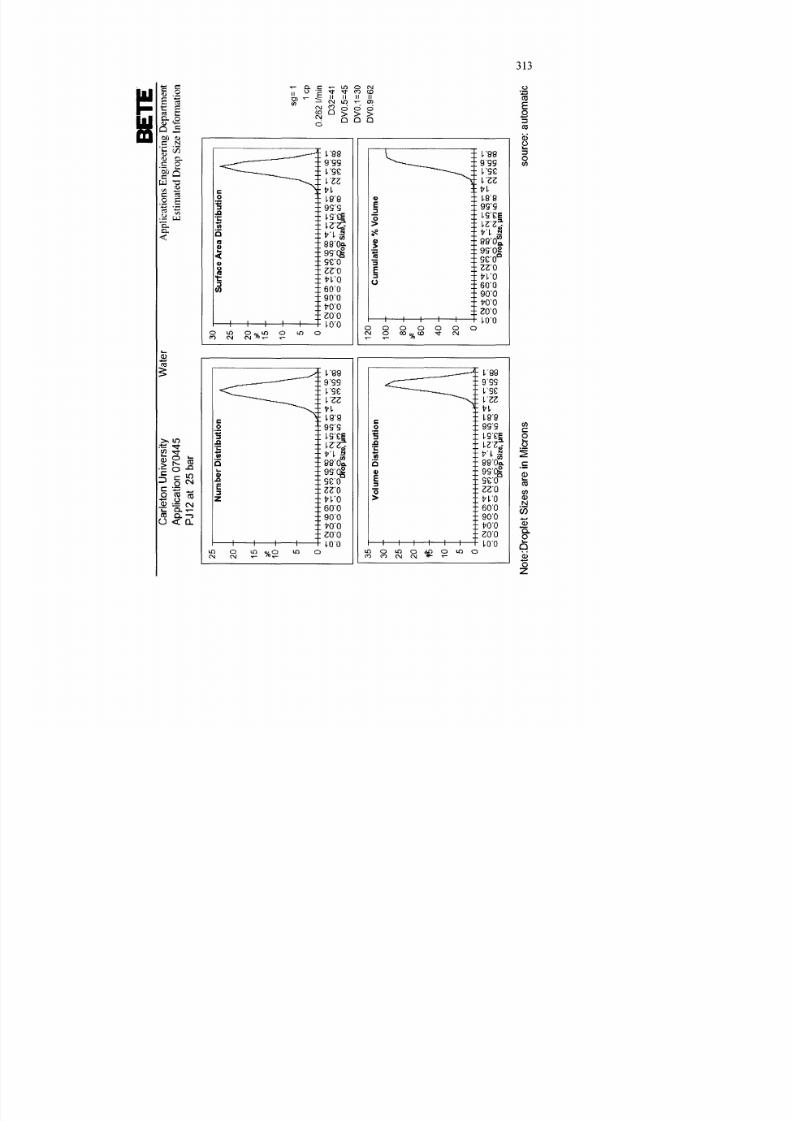
8/12/2019 Development of a Design Tool for Modern Gas
http://slidepdf.com/reader/full/development-of-a-design-tool-for-modern-gas 343/380
C
eo
U
v
sy
A
c
o
0
P
2
b
Wa
e
r
CM*®0
NB(DICt--
>'-^
--<B
p
qppq^C
c
1
o
^CM o
q0
o
ooooooOr
o
C
c
1
a
Do
Sz
pm
C
1
W
0
C
C
C
0
T
C
S-DC
C
O
OC
--<C
«
C^
o
Nr
o
Nin
n
T
^
o
o
d
o
o
o
d
d
d
C
U
C
O
Do
Sz
m
N
eD
o
e
Sz
ae
nMco
AcoEnnDm
EmeDoSznomo
2 2
-
1
-
1
-5-
0-
S
a
Ae
Ds
b
o
, A
•
\
//
\
1
m
1
TCM<
C
5
CMO
O3
TC
<
T<Q
p
Mc
o
MLDtn
g
do
dod
dod
o
o
sg
LO c
CN c
mc
W
s^
Cc
1 18 6 4 2
+0
C
m
av
%V
um
I
1
1
-
CM
C
CM 1
C
C
^ i
rS
-
p
Mc
NL
o
0
^
o
o
dddodd
o_
d
C
c
LOo
C
Do
Sz
m
s
=1c
02
mn
D
=
D
5
DV
1=
D
9
s
c
a
om
c

8/12/2019 Development of a Design Tool for Modern Gas
http://slidepdf.com/reader/full/development-of-a-design-tool-for-modern-gas 344/380
C
eo
U
v
sy
A
c
o
0
P
a
2
b
Des
=00
Nm
A
c
o
E
n
n
D
m
E
me
Do
Sz
Inom
o
i 9 8 7 6 4 3 2 1 n
N
mb
D
s
b
o
/~
j
\
/
\
;
/
\
/
\
/
\
/
\
(MromN
o
dL
Ns
T
^^CM^T
^^D
o
^
Nj
N.T
c
C^
5
^
o'dc
ddoddx
U
CN
i
T
C
T~
D
o
S
z
pm
2 1 -
5 0
V
umeD
s
b
o
n / /
I
HT
O
O
O
O
O
O
C
c
TVT
c
^
i--
n
Do
Sz
M
S
a
A
e
D
s
b
o
1
—
1 1 w
-8 6 4 2 0
1
1
1
1
+
o
£
n
-To
mcN Tp
^
cM'
^
cNe
OO
OO
T-T-CM
^N^-OO
lCl
^^j
jSi
1
C
mua
v
V
ume
1
+
8 a 6 4 20
1
1
1
1
1
1
1
HH
T
1
1
1
c
c
n
c
OT
OC
-s
h
s
MtaT
h
^cM'q
O
qO
q^rN
^Si
cO
ffl
O
^^ gj
j^N
T
-
O
O
O
O
O
O
O
O
Q
T
—
T
O
Do
Sz
pm
•C
T
s
09
5
02
mn
DD
5
D
O12
D
O98
N
eDo
eSz
aenMco
s
c
a
om
c

8/12/2019 Development of a Design Tool for Modern Gas
http://slidepdf.com/reader/full/development-of-a-design-tool-for-modern-gas 345/380
C
eo
U
v
sy
A
c
o
0
P
2
b
D
e
s
=00
Nm
AcoEnnDm
EmeDoSznomo
i-M"c
^
o
T
<-o
N
T
<
M'*T
qqqqO
'rcNjnio<»'
J
qN05^
N
j(£j<(
>
o
ododoo
o
ddv
o
o
T
C
«O
LO
Do
Sz
M
3 3 2 2 1 5 0
VumeDsbo
111
d
odQd<Q
dSc
c
c
LO
T
C
co
D
o
Sz
pm
ooqooT-N
f
m
cD
^M
i
N
j
^rv
igj^o)
sT
m
qqqqqT-
N
coinai^tN
i
piv^^
pj^^cs
o
d
d
d
d
d
d
ca
O
C
C
O
T
CJC
W
D
o
Sz
pm
s
09
5c
02
mn
D3
D5
D1
D9
N
e
D
o
e
Sz
aenMico
s
c
a
oma
c

8/12/2019 Development of a Design Tool for Modern Gas
http://slidepdf.com/reader/full/development-of-a-design-tool-for-modern-gas 346/380
APPEN DIX D : STAINLESS
nominal pipe s i ze outs ide
d i a m e t e r
in
22.37560 .325
2 /2
2.87573 .025
3
3.5
88.9
314
4
101.6
4
4.5
114.3
5
5.563
141 .300
6
6.525
165 .735
sehedu
a
"_•'
4 0
80
"_"
4 0
80
*'_"
4 0
80
"_"
4 0
80
"-"
4 0
80
"_"
4 0
80
"_"
40
80
b
"_"
Std
X S
"_"
Std
X S
"_"
Std
X S
"_"
Std
X S
"_"
Std
X S
"_"
Std
X S
"_"
Std
X S
e
c
10S
40S
80S
10S
40S
80S
10S
40S
80S
10S
40S
80S
10S
40S
80S
10S
40S
80S
10S
40S
80S
wal l th ick-ness
in
m m
0.1543 .9120.218
5.5370.343
8.7120.12
3 .0480.203
5.1560.276
7.0100.12
3 .0480.216
5.486
0.3
7.620
0.188
4.775
0.226
5.740
0.318
8.077
0.12
3 .048
0.237
6.020
0.337
8.560
0.134
3 .404
0.258
6.553
0.3759.5250.219
5.563
0.28
7.112
0.432
10 .973
ins ide diameter
in
m m
2.06752 .502
1.939
49 .2511 6 8 9
42.9012.635
66 .9292.469
62 .7132.323
59 .0043.26
82 .8043.068
77 .927
2.9
73 .660
4J 24
104 .750
3.548
90 .1193.364
85 .446
4.26
108 .204
4.026
102 .260
3.826
97 .180
5.295
134 .493
6.047
153 .594
4.8?3122 .250
6.187
157 .1506.065
154 .051
5.761
146 .329
316

8/12/2019 Development of a Design Tool for Modern Gas
http://slidepdf.com/reader/full/development-of-a-design-tool-for-modern-gas 347/380
APPENDIX E : PIPING GUIDE ASME B31.3
317
L A N L . Engineering Standards Manual OST220-03-01-ESM Chapter 6, Mechanical
Section D20 App A, ASME B31.3 Piping Guide - Appendix A Rev. 1,6/9/04
| Piping Specification 211 Date: November 29, 2004 Revision: 0 Page 1 of 1
DESIGN PARAMETERS
P-Spee
Design Pressure (psig)
Design Temperature pF)
Minimum Tem perature (°F)
Minimum Test Pressure (psig)
Maximum Test Pressure (psig)
PS-211(A,B)
600
300
-425
900
480
500
-428
835
445
800
-425
900
405
900
-426
860
260
1000
-426
585
125
1150
•425
355
35
1400
-425
340
935
Calculat ion Reference:
Code of Reference:
Fluid Service:
Material:
Pressure Rating:
External Pressure Rating:
00-00-CALC-M-Q004-RO
B31.3-2O02
Normal
Stainless Steel (316L)
600 psi
ISpsi
GENERAL NOTES
Refer to General Notes 1-12, 16, 19.
ALLOWABLE PIPE MATERIALS
Component
Piping
Size
% - 1 2
Rating
Schedule Tables
Standard
ASMEB36.19
Material
ASTMA312
Material Grade
TP316L
Additional Requirements
Seamless
REQUIRED SCHEDULES FOR NON-THREADED PIPE
p-
Spec
A
B
Corrosion
Allowance
0.00
0.03
Pipe Size
Schedule
Schedule
'A
10S
10S
14
10S
10S
%
10S
10S
1
10S
10S
1'/»
ios
10S
2
10S
10S
2 ' / .
10s
10S
3
103
40S
4
10S
40S
6
40S
40S
8
40S
40S
10
40S
40S
12
40S
40S
REQUIRED SCHEDULES FO R THREADED PIPE
p-Spec
A
B
Corrosion
Allowance
0.00
0.03
Pipe Size
Schedule
Schedule
'A
40S
80S
V
40S
SOS
%
40S
SOS
1
40S
SOS
114
40S
SOS
2
40S
80S
214
40S
SOS
3
40S
80S
4
40S
80S
6
40S
SOS
FITTINGS
Component
Threaded Fittings
Socket-V\feld FittingsSuttweld Fittings
Sutiweld Fittings
Size
% - 4
y«-2V4-12
J4-12
Rating
2000#
3000#Schedule Tables
Schedule Tables
Standard
ASMEB16.11
ASMEB18.11ASME B16.9
ASME B 16.28
Material
ASTMA182
ASTMA182ASTMA403
ASTMA403
Material Grade
F316/F316L
F316LWP316L
WP316L
Additional Requirements
Only for fit up to threaded com ponents
FLANGES
Component
Socket-Weld Flange
Threaded Flanges
Wetdneck Flange
Slip-on Flange
Blind Rang e
Backup Flange
Size
V t - 2
V4-6
14-12
y » - i 2
>4-12
% - 1 2
Rating
See note 19
See note 19
See note 19
See note 19
See note 19
See note 19
Standard
ASME B16.5
ASME B16.5
ASME B16.5
ASME B16.5
ASME B16.5
ASME B16.5
Material
ASTMA1S2
ASTMA182
ASTM A182
ASTM A182
ASTM A182
ASTMA105
Material Grade
See note 19
See note 19
See note 19
See note 19
See note 19
N/A
Additional Requirements
M E C H A N I C A L F A S T E N E R S
Component
Fasteners
Nuts
Size
Vi-V,
y,-y.
Standard
ASME B18.2.1
ASME B18.2.2
Material
ASTM A193
ASTM A194
Material Grade
B8 C I. 2-HH
8F-HH
Additional Requirements
Limited to 100 0T, See General Note 10.
Limited to 1000»F

8/12/2019 Development of a Design Tool for Modern Gas
http://slidepdf.com/reader/full/development-of-a-design-tool-for-modern-gas 348/380
APPENDIX F : INSTRUMENT CALIBRATION CURVES
318

8/12/2019 Development of a Design Tool for Modern Gas
http://slidepdf.com/reader/full/development-of-a-design-tool-for-modern-gas 349/380
0 c e<D
*H
3X X <D
*H
PH
0
0s
•3o
Q m ol
H a ,
* eQ
1
090
80
70
60
50
40
30
20
10
00
^
©#
^
^
•P
X
1fo
Bow
*
^
-
y=19
0
R2=
0
00
10
20
30
40
Khe2Rdn(V
50
60

8/12/2019 Development of a Design Tool for Modern Gas
http://slidepdf.com/reader/full/development-of-a-design-tool-for-modern-gas 350/380
320
•PXA1L
;5X II
ON P H
ON
oII> .
u^<N
o<N
• O
1—1o1—1
IT)
ooo
IT)
ooT — 1
i nT —1
o<N
UO
CS
(Sisd) S m pca y 3.H1SS3JJ gQ9 W Q *p njQ

8/12/2019 Development of a Design Tool for Modern Gas
http://slidepdf.com/reader/full/development-of-a-design-tool-for-modern-gas 351/380
321
i nv©'
qMD
mm°
©i n
i n
^ '
qxt-'
i nco
qCO
i nCN
qCN
/—^
>
WD=P N
T *C3O
tfoof S
>%0>
^ ^
-c* *F- <
Va
i n
i n
o
(Sisd) oinp^a^j dj nss djj C()9 JJ Q j p n j Q

8/12/2019 Development of a Design Tool for Modern Gas
http://slidepdf.com/reader/full/development-of-a-design-tool-for-modern-gas 352/380
0 0 0 0 0 0 0 0 0
k>
•Varan12AAfoLE
y=0317
R=0
0010203040506070809010
Kthey2Radn m

8/12/2019 Development of a Design Tool for Modern Gas
http://slidepdf.com/reader/full/development-of-a-design-tool-for-modern-gas 353/380
323
^B$T2 ** I
I -
•2BD-0
oLE
CNoo
£ IIi—1 (N
q pi(N
II
>
q
o
qCN
qo
q q q
q
qCN
a
OO
o(N
<D
O©
qCN
qo
( 0 3 H ui )
gl l ip E ^J 9J11SS9JJ ^l lU 9J 9J J] a £ 09 IdQ ^PXUQ

8/12/2019 Development of a Design Tool for Modern Gas
http://slidepdf.com/reader/full/development-of-a-design-tool-for-modern-gas 354/380
324
p^6
©
o
co
©
>
a• r-H
03
P 4OO
N
>
0)
o©
o©
©
O^
OOO
O
rovd
p»ri
o^ t
pCO
p<N
p©
( 0 3 H in)
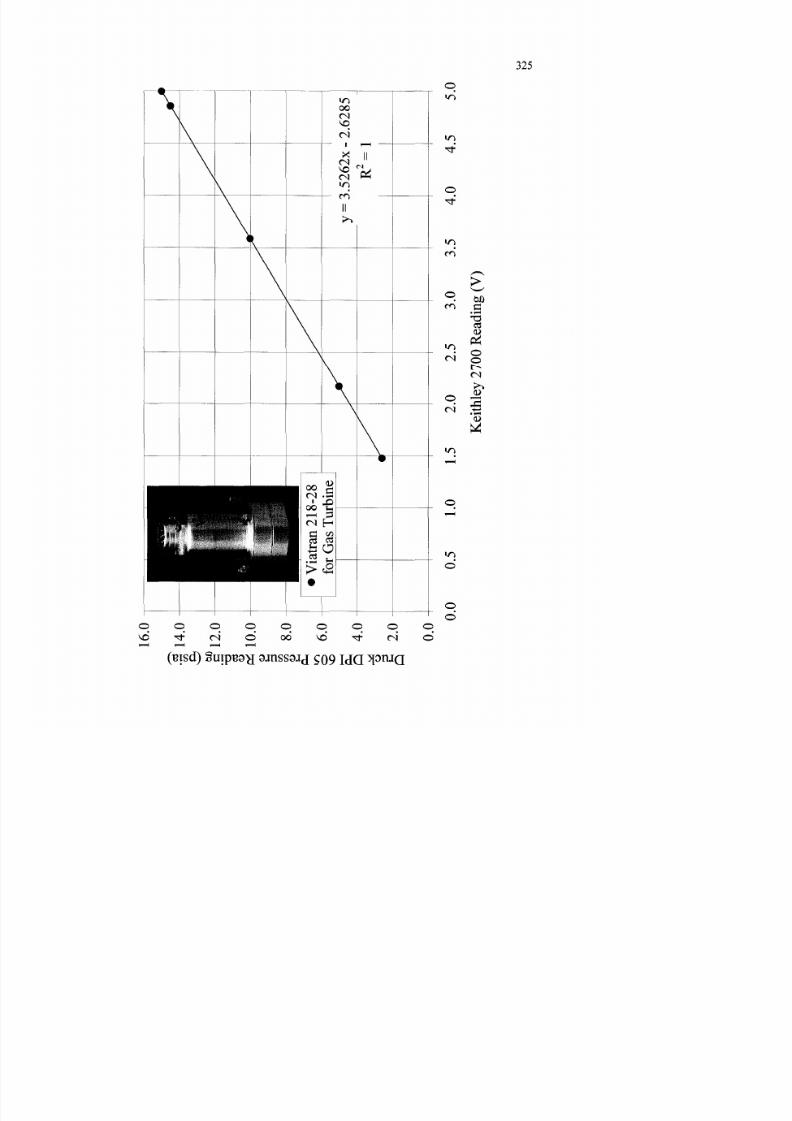
8/12/2019 Development of a Design Tool for Modern Gas
http://slidepdf.com/reader/full/development-of-a-design-tool-for-modern-gas 355/380
0 0 0 0 0 0 0 0 0
.f
^^^M
^
B
.AJH^
H
H^H
^
s^
•Va
an2
2
forG
T
rbn
y=35
26
R=l
00
05
10
15
20
25
30
35
K
hey2
R
dn
(V
40
45
50

8/12/2019 Development of a Design Tool for Modern Gas
http://slidepdf.com/reader/full/development-of-a-design-tool-for-modern-gas 356/380
25 20 15 10 05 00 05 10 15 20 251>PXAGfoGTbn
y=0934
R=
00051015202530354045
Khey2Rdn V
50556065
s

8/12/2019 Development of a Design Tool for Modern Gas
http://slidepdf.com/reader/full/development-of-a-design-tool-for-modern-gas 357/380
327
p
<r
r
>P1
HH
H
t
<
>
914
y=21
II
X
o
Oir>
o
m
o
>
c• 1—1
<D
O
o(N
OO
oo
o oo00
o o o oi n
o om o o
oo"
(§TSd) §U IpB 9^ 9JH SS9JJ £0 9 I d Q ^ p tU Q

8/12/2019 Development of a Design Tool for Modern Gas
http://slidepdf.com/reader/full/development-of-a-design-tool-for-modern-gas 358/380
DPR
o©
t
o
oo
f
p
U
4©
©
oo
o©
t
oO
o
a
o
1N
C
c
3
J
•PX2A 2HP

8/12/2019 Development of a Design Tool for Modern Gas
http://slidepdf.com/reader/full/development-of-a-design-tool-for-modern-gas 359/380
•14
C C
VID ^ o o
1
0
9
0
8
0
7
0
6
0
5
0
4
0
g
3
0
2
0
Q
1
000
~
^
^
•PX
A
3H
o
o^
R2=
00
10
20
30
40
K
hey2
R
dn
(V
50
60

8/12/2019 Development of a Design Tool for Modern Gas
http://slidepdf.com/reader/full/development-of-a-design-tool-for-modern-gas 360/380
1
0
9
0
8
0
7
0
6
0
5
0
4
0
o «
3
0
2
0
1
000
•PX
A
4H
,7
Of
Q/O
y—zU.J4
^
R2=
00
10
20
30
40
K
hey2
R
dn
(V
5
0
60
o

8/12/2019 Development of a Design Tool for Modern Gas
http://slidepdf.com/reader/full/development-of-a-design-tool-for-modern-gas 361/380
331
p
O
O
m
o
>
OO
o<N
O
©
O
ooO N
O00
O O oi n
o oCO
o©
©o©
(§isd) Smpea^i ajn ssa jj £09 IQd ^ptUQ

8/12/2019 Development of a Design Tool for Modern Gas
http://slidepdf.com/reader/full/development-of-a-design-tool-for-modern-gas 362/380
s O 0 S l
o G <Df ino^ hH Q
PM o B
Q
1
0
9
0
8
0
7
0
6
0
5
0
4
0
3
0
2
0
1
000
v
1& •
•PX
A
6H
,—oo
y
ZU.Z
A-Z
U.UI
R2
=l
00
10
20
30
40
K
hey2
R
dn
(V
5
0
60

8/12/2019 Development of a Design Tool for Modern Gas
http://slidepdf.com/reader/full/development-of-a-design-tool-for-modern-gas 363/380
a•
—
i
a L>
& a x <D
P IT o h—I
P Q s -2
000
0
5
10
15
20
25
30
35
K
hey2
R
dn
(V
40
45
50

8/12/2019 Development of a Design Tool for Modern Gas
http://slidepdf.com/reader/full/development-of-a-design-tool-for-modern-gas 364/380
3
000
05
10
15
K
hey2
R
dn
(V
20
25
4

8/12/2019 Development of a Design Tool for Modern Gas
http://slidepdf.com/reader/full/development-of-a-design-tool-for-modern-gas 365/380
3
0
'S j
2
0
a 1
2
0
P o G <DSH
O I—
I
P Q
o =5 S Q
0
1
0
5
000
00
05
10
15
20
K
hey2
R
dn
(V
25
30
35

8/12/2019 Development of a Design Tool for Modern Gas
http://slidepdf.com/reader/full/development-of-a-design-tool-for-modern-gas 366/380
3
0
G•
Hc 0 c <U
P *H c to <D
P in oV
P Q s 2
0
2
0
1
0
1
0
5
000
^
^
mp
•PX
A
4F
>/=
5 R =
1
1
1
00
05
10
15
20
K
hey2
R
dn
(V
25
30
35
U)0

8/12/2019 Development of a Design Tool for Modern Gas
http://slidepdf.com/reader/full/development-of-a-design-tool-for-modern-gas 367/380
3
0
U
2
0
a•
H
1
2
0
1
0
=3
CIT ^
1
0
I—
I
P Q
5
000
00
1
6
1
3
05
10
15
20
K
hey2
R
dn
(V
25
30
35
<

8/12/2019 Development of a Design Tool for Modern Gas
http://slidepdf.com/reader/full/development-of-a-design-tool-for-modern-gas 368/380
338
in
en
oco
mCN
o .gCN T3
034
OO
CN
+->• T — I
0
in
o
oo
ooCO
oinCN
OOCN
O
in
oo
o©in
o©
(§isd) §mpB 9^ ajn ssa jj go9 IdQ sptUQ

8/12/2019 Development of a Design Tool for Modern Gas
http://slidepdf.com/reader/full/development-of-a-design-tool-for-modern-gas 369/380
339
/
*
<D
•neTmoo
CD
02 + •«-
X II
09I I
>
1
\
\
o
o
oCNr-H
ooo
-
oooo
o©^o
o
o
^.^
u
<uSH
3-*-J
c3* H
uO H
a0)
H4>
ouCJo
<uf S
o o oCN
oo
©©00
o o ©o©
oCN
©
©
oCN
oCN
(Do) amato l 3-331 13

8/12/2019 Development of a Design Tool for Modern Gas
http://slidepdf.com/reader/full/development-of-a-design-tool-for-modern-gas 370/380
5
0
4
0
4
0
Q
^
3
0
< u 1
3
0
s 4 S
2
0
H <?
2
0
j
1
0
1
0
5
000
i< fc*
•EG
T
moo
e
y=1008
00
5
0
1
0
1
0
2
0
2
0
3
0
3
0
4
0
4
0
5
0
T
mo
eT
mp
aue(C
o

8/12/2019 Development of a Design Tool for Modern Gas
http://slidepdf.com/reader/full/development-of-a-design-tool-for-modern-gas 371/380
5
0
4
0
4
0
Q
^
3
0
1
3
0
u g
2
0
H <
2
0
-J U
0
1
0
5
000
I
1
\
•R
k
T
moo
e
y=10
04
R2 =
1
00
5
0
1
0
1
0
2
0
2
0
3
0
3
0
4
0
4
0
5
0
T
mo
eT
mp
aue(C
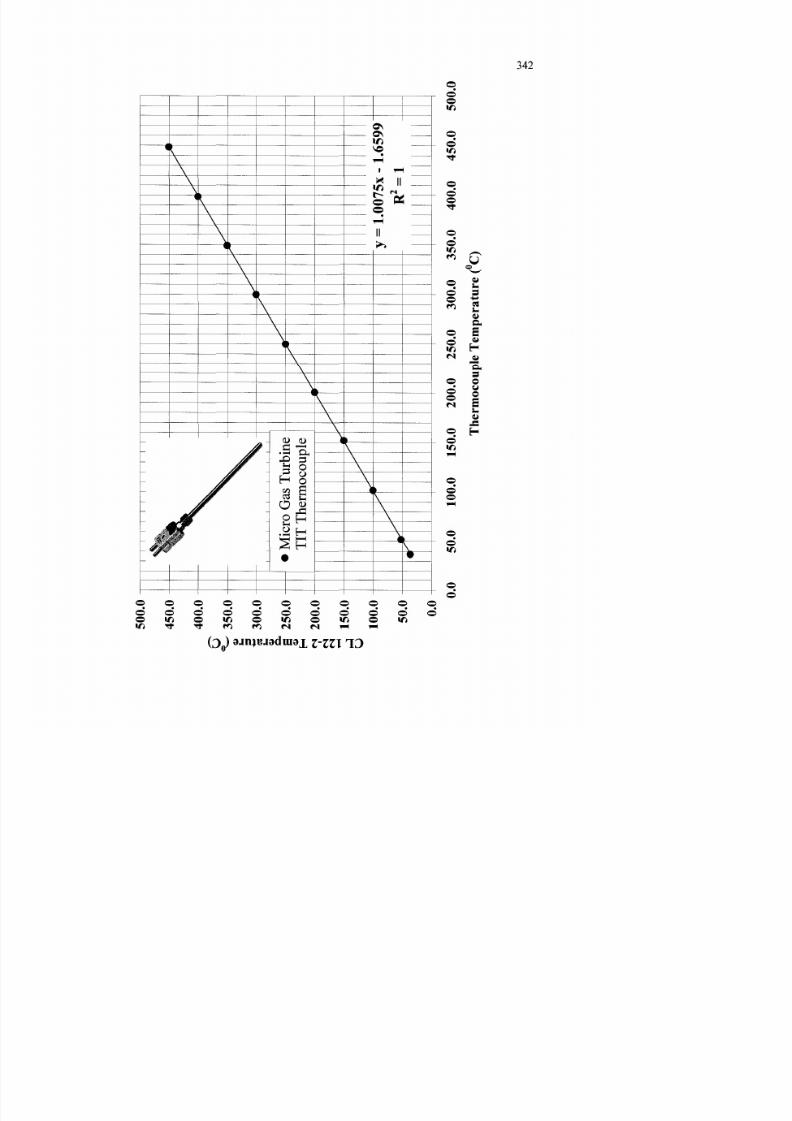
8/12/2019 Development of a Design Tool for Modern Gas
http://slidepdf.com/reader/full/development-of-a-design-tool-for-modern-gas 372/380
5
0
4
0
4
0
^
3
0
s 1
3
0
u g 2
0
H <?
2
0
1
0
1
0
5
000
"V
\
1
1
1
1
I
1
1
1
1
1
I
-•M
icoG
T
bn
T
TT
moo
e
y=10
16
R =
1
00
5
0
1
0
1
0
2
0
2
0
3
0
3
0
4
0
4
0
5
0
T
mo
eT
mp
aue(C

8/12/2019 Development of a Design Tool for Modern Gas
http://slidepdf.com/reader/full/development-of-a-design-tool-for-modern-gas 373/380
o
343
VD
O
O
t>0
O
• i-H
PH
Oi
O
o
o oo
ooo©
o
©
o
©
o<N
o
oo
(d3) ;u9iogj903 amssaij JB;OX

8/12/2019 Development of a Design Tool for Modern Gas
http://slidepdf.com/reader/full/development-of-a-design-tool-for-modern-gas 374/380
12
10
OH
M 08
oCM
^
06
M
ia £
4
O H02
00
S^^B^^K
JE
J
H J
-
*
KePo
P
ch
-
*
E
rap
aedD
a
•6
-4
-2
0
P
chA
e(dg
2
4
6

8/12/2019 Development of a Design Tool for Modern Gas
http://slidepdf.com/reader/full/development-of-a-design-tool-for-modern-gas 375/380
345
•MeenBmoh
•^
_ ^ ^ 4 •
p
o
p
o
2 a
0)
3
0-
oo
V£>
p
p
O
o
=
s .
ft*
oo
oo
ooo
oooo
oo
o oo o
o©
(PVLOS) W H ^<>M

8/12/2019 Development of a Design Tool for Modern Gas
http://slidepdf.com/reader/full/development-of-a-design-tool-for-modern-gas 376/380
APPEN DIX G : ALL ISON 250-C20B LIM ITS AND O PER AT INGP R O C E D U R E
Engine Ratings
Design Speed Gas Producer 100% (50,970 rpm)
Maximum measured gas temperature (TOT) 810 °C (1490 °F)
Maximu m oil consumption 0.05 US gallons/hr or 1 qt in 5 hours
Performance Ratings
Rating
Takeoff (5 min)
Normal Cruise
Ground Idle
Estimated GasProducer (rpm)
53,000
51,200
33,000
Fuel Flow(lb/hr)
273
273
70
Measured Gas Temp.
(°C)810
738
372 - 468
Engine Speed
If any of the following limits are exceeded send designated engine components torepair/overhaul. RECORD EXT ENT OF OV ERSPEED IN LOG BOOK.
Ni (Gas Producer)LIMIT
105% - max. continuous
1 0 5 - 1 0 6 % - - 1 5 s ec m ax
10 5-1 06 % --o ve r 15 sec
Over 106% ~ NOT ALLOWED
COMPONENTNone
None
Turbine and Compressor
Turbine and Compressor
346

8/12/2019 Development of a Design Tool for Modern Gas
http://slidepdf.com/reader/full/development-of-a-design-tool-for-modern-gas 377/380
347
Engine Temperature
WARNING: HOT STARTS OR AFTERFIRES AFTER SHUTDOWN WILL CAUSETURBINE BLADE AND WHEEL DAMAGE, WHICH CAN RESULT INENGINE FAILURE.
Measured Gas Temperature Limits (TOT) - 250-C20B
Temperature Range C O Time Maintenance Action
STEADY STATE
810
738
Takeoff (5 min)
Normal cruise and below
If time or temp erature
exceeded inspect turbine
None
DURING STARTING AND SHUTDOWN
Up to 8108 1 0 - 9 2 7
927 - 999
Over 999
No limit10 sec m ax
Not Allowed
Not A llowed
NoneInspect Turbine
Inspect TurbineRemov e turbine for heavymaintenance or overhaul
DURING POWER TRANSIENT
Up to 779
7 7 9 - 8 1 0
8 1 0 - 8 4 3
8 1 0 - 8 4 3
8 1 0 - 8 4 3843 - 927
Over 927
No limit
Until stabilized (5 min max)
0 - 6 sec
6 - 1 2 s e c
Over 12 secNot allowed
Not Allowed
None
None
None
Max of 3 occurrences per
life of each turbine wheelInspect Turbine
Remov e turbine for heavymaintenance or overhaul
Oil Pressure and Temperature
94.2% Nl speed and above
78.5 to 94.2% N l speed
Below 78.5% Nl speed
During Start
Minimum Temperature
Maximum Temperature
1 1 5 - 130psig
9 0 - 1 3 0 p s i g
5 0 - 1 3 0 p s i g
a positive indication must be obtained
when 59% (idle is reached)- 4 0 ° C
107 °C

8/12/2019 Development of a Design Tool for Modern Gas
http://slidepdf.com/reader/full/development-of-a-design-tool-for-modern-gas 378/380
348
Pre-Start-up Inspections
> Before operating engine, open test cell air inlet
> Before operating engine, check test cell for foreign objects
> Before operating engine , check the engine air inlet for foreign objects
> Before operating engine, manu ally spin com pressor to ensure free rotation
> Before operating engine, check oil level
> Before operating engine, check fuel level
> Before operating engine, check throttle operating range and response
> Before operating engine, turn on oil cooler
> Before operating engine, perform m anua l start (no ignition) from w ithin test cell
to ensure proper working order of engine
> Before operating engine, remove exhaust cap
Operating Procedures
The following p rocedure is applicable to either the CE CO or the Bendix control system
STARTING MODE
a) Position the throttle at FUEL O FF
b) Turn on switches required to provide fuel to the engine
CAUTION: DURING A START THE THROTTLE MUST N EVER BEADVANCED OUT OF THE FUEL OFF POSITION UNTIL AFTERTHE STARTER AND IGNITION EXCITER HAVE BEENENERGIZED AND THE DESIRED CRANCKING SPEED HASBEEN ATTAINED. TO DO SO MIGHT RESULT IN AN EXPLO SIVELIGHTOFF OR AN OVERTEMPERATURE START.
AN ENGINE FIRE (WITH THE RESULTANT FLAME EMAN ATINGFROM THE TAILPIPE) CAN OCCUR DURING START IF THECOMBUSTION CHAMBER BECOMES OVERLOADED WITHFUEL BEFORE IGNITION TAKES PLACE. TO EXTIGUISH THEFIRE, CONTINUE TO MOTOR THE ENGINE USING THESTARTER WITH THE THROTTLE FULLY CLOSED AND THEMAIN FUEL SWITCH O FF.

8/12/2019 Development of a Design Tool for Modern Gas
http://slidepdf.com/reader/full/development-of-a-design-tool-for-modern-gas 379/380
349
MONITOR OIL PRESSURE DURING START. DAMAGE TOROTOR BEARINGS CAN RESULT IF A POSITIVE INDICATIONOF OIL PRESSURE IS NOT OBTAINED BY THE TIME THE IDLESPEED IS REACHED.
c) Residual TO T should be no more than 150 °C when lightoff is attempted.(Residual TOT can be easily reduced to or below 150 °C by m otoring engine w iththe starter.)
d) Energize the starter mo tor and ignition exciter.e) As Ni rpm accelerates through 12 - 15 % Ni, m ove the throttle to the IDLE detent
to begin fuel flow.
NO TE : Do not wait for Ni peak out. Introduce fuel immediately upon reachingdesired Ni speed. Delay in moving the throttle to idle detent maydiminish battery capacity early in the start cycle.
CAUTION: A START SHOULD NOT BE A TTEMPETED AT Ni SPEEDSBELOW 12%. STARTING AT Ni SPEEDS LESS THAN 12%INCREASES THE POSSIBILITY OF EXCEEDING ENGINETEMPERATURE LIMITS.
FOR ENGINE INCORPORATING LOW ENERGY EXCITERS,OPERATING TIME LIMITS ARE AS FOLLOWS: 2 MINUTES ON, 3MINUTES OFF; 2 MINUTES ON, 23 MIUTES OFF. HIGH ENERG YIGNITION EXCITERS ARE QUALIFIED FOR CONTINUOS DUTYOPERATION. HOWEVER, USE OF THE IGNITION SYSTEM ON A
CONTINUOS BASIS IS NOT RECCOMENDED BACAUSE OFDEGRADATION OF THE SPARK IGNITER.
f) De-en ergize the starter and ignition when 58% Ni speed is reached. The start iscompleted when a stabilized Ni speed of 59 - 65% is reached. Com pletion of thestart normally occurs 25 to 60 seconds after starter engagement. A positiveindication of oil pressure must be obtained by this point in the start. If it is not,shut down the engine and check to be sure that oil is available at the power andaccessory gearbox inlet. Mon itor the measured gas temperature; do not exceedlimits given in above table.
If the start is aborted turn the throttle to FUEL OFF and motor the engine for 10
seconds without ignition
RESTART
a) Emergency Restart:
When immediate power restoration is required, make an emergency restart byenergizing the starter within 10 seconds after power loss occurs.

8/12/2019 Development of a Design Tool for Modern Gas
http://slidepdf.com/reader/full/development-of-a-design-tool-for-modern-gas 380/380
350
NO TE : Ni will not decrease below minimum starting speed within 10 secondsbecause of rotational inertia plus possible ram effect. The throttle can beleft in the open position since fuel flow during the start will be on thenormal acceleration schedule.
CAUTION: DUE TO THERMAL CHANGES WITHIN THE TURBINE, THA GASPRODUCER SECTION OF THE ENGINE MAY LOCK UP AFTERAN "INFLIGHT" SHUTDOWN. THIS IS A TEMPORARYCONDITION WHICH EXISTS AFTER THE ENGINE HAS BEENSHUT DOWN FOR APPROXIMATELY ONE MINUTE ANDWHICH MAY CONTINUE FOR UP TO TEN MINUTESFOLLOWING THE SHUTDOWN. THEREFORE, EXCEPT DURINGAN EMERGENCY, AIR START SHOULD NOT BE ATTEMPTEDDURING THE TIME PERIOD BETWEEN ONE MINUTE AFTERSHUTDOWN AND TEN MINUTES AFTER SHUTDOWN .
b) Norm al Restart:
Make normal restart as follows:
a. W ith the throttle in FUEL OF F, energize the starter and ignition exciter.b. At the desired Ni speed position the throttle in the full open position. Use
the following guide to determine desired Ni starting speed versus outsideair temperature.
1 5 % N i r p m a b o v e 7 ° C13 % Ni rpm m inus 18 to plus 7 °C12% Ni rpm below m inus 18 °C
c. De-energize the starter at 58% Ni speed.
ENGINE STOPPING
WARNING: OVERTEMPERATURE STARTS OR AFTERFIRES AFTERSHUTDOWN WILL CAUSE CRACK IN THE TURBINE FIRST-STAGEWHEEL RIM. THESE CRACKS CAN EVENTUALLY CAUSE A
SECTION OF THE WHEEL TO BREAK OFF, CAUSING TURBINEIMBALANCE AND ENGINE FAILURE.