development of a low-cost eye screening tool for early
TRANSCRIPT

Rochester Institute of Technology Rochester Institute of Technology
RIT Scholar Works RIT Scholar Works
Theses
4-8-2021
Development of a Low-Cost Eye Screening Tool for Early Development of a Low-Cost Eye Screening Tool for Early
Detection of Diabetic Retinopathy using Deep Neural Network Detection of Diabetic Retinopathy using Deep Neural Network
David Mwanguo Mwasikira [email protected]
Follow this and additional works at: https://scholarworks.rit.edu/theses
Recommended Citation Recommended Citation Mwasikira, David Mwanguo, "Development of a Low-Cost Eye Screening Tool for Early Detection of Diabetic Retinopathy using Deep Neural Network" (2021). Thesis. Rochester Institute of Technology. Accessed from
This Master's Project is brought to you for free and open access by RIT Scholar Works. It has been accepted for inclusion in Theses by an authorized administrator of RIT Scholar Works. For more information, please contact [email protected].
i
RIT
Development of a Low-Cost Eye Screening Tool for Early Detection of Diabetic Retinopathy using Deep Neural
Network
by
David Mwanguo Mwasikira
A Capstone Submitted in Partial Fulfilment of the Requirements for the Degree
of Master of Science in Professional Studies:
Data Analytics
Department of Graduate Programs & Research
Rochester Institute of Technology RIT-Dubai
April 8th 2021

i
RIT
Master of Science in Professional Studies: Data Analytics
Graduate Capstone Approval
Student Name: David Mwanguo Mwasikira Graduate Capstone Title:
Development of a Low-Cost Eye Screening Tool for Early Detection of Diabetic Retinopathy using Deep Neural Network
Graduate Capstone Committee: Name: Dr. Sanjay Modak Date: 8th April, 2021 Chair of committee
Name: Dr. Ehsan Warriach Date: 8th April, 2021 Member of committee

ii
Acknowledgments I will forever be grateful to my Professors who have immensely contributed to my success in my
journey through RIT. I specifically thank Dr. Ehsan Warriach who guided me through this project
together with Dr. Sanjay Modak who relentlessly sought to keep us on track throughout this
Capstone Project and course implementation.
The knowledge and experiences gained at RIT will always be treasured and will continue to
enrich my life in my career. RIT is a memorable university of choice with programs and facilities
that develop the individual as a whole. The RIT library proved very reliable with friendly
management I cannot forget.
The student community has been fantastic, diverse in culture yet so friendly and
accommodating in every way. We had constructive discussions with great collaboration. It has
been memorable.
Finally, I cannot forget my family who stood by me during these times and supported me both
in good times and through difficult times. The year 2020 emerged with new challenges when
the whole world was tested by a pandemic, Covid-19, and whole economies ground to a halt.
Yet we are emerging victorious, thanks to the almighty, the giver and sustainer of life.

iii
Abstract
It has been said that technology used in the lab does not directly transfer to what is done in
healthcare. Research on the use of Artificial Intelligence (AI) in the diagnosis of Diabetic
Retinopathy (DR) has seen tremendous growth over the last couple of years but it is also true
not much of that knowledge has been transferred into practice to benefit patients in need.
One reason is that it’s a new frontier with untested technologies and one that is evolving too
fast. Also, the Real Healthcare situation can be very complicated presenting itself with
numerous challenges starting with strict regulations to variability in populations. A solution that
is implementable needs to address all these concerns including ethics, standards, and any
security concerns.
It is also important to note that, the current state of AI is specialized to only narrow applications
and may not scale when presented with problems of varied nature. A case in point is a patient
having DR may be suffering from other ailments such as Glaucoma or cataracts.
DR has been a leading cause of blindness for millions of people worldwide, hard to detect when
it’s treatable and therefore early eye screening is the solution. In this Capstone project, we seek
to integrate Artificial Intelligence with other technologies to deliver a low-cost diagnosis to
Diabetic Retinopathy at the same time trying to overcome previous impediments to the
implementation of mass eye screening.
Keywords: Diabetic Retinopathy, Artificial Intelligence, Computer Vision, Image Classification
and Auto-detection, Convolutional Neural Networks

iv
Table of Contents
ACKNOWLEDGMENTS ............................................................................................................................................ ii
ABSTRACT ............................................................................................................................................................ .III
GLOSSARY OF TERMS ........................................................................................................................................... .III
CHAPTER 1 ............................................................................................................................................................. 1
1.1 BACKGROUND ........................................................................................................................................... 1
1.2 STATEMENT OF PROBLEM ......................................................................................................................... 2
1.3 PROJECT GOALS......................................................................................................................................... 3
1.4 METHODOLOGY ........................................................................................................................................ 3
1.5 LIMITATIONS OF THE STUDY ................................................................................................................... 16
CHAPTER 2 – LITERATURE REVIEW ....................................................................................................................... 17
CHAPTER 3- PROJECT DESCRIPTION ..................................................................................................................... 29
3.1 ....................................................................................................................................................................... 29
CHAPTER 4- PROJECT ANALYSIS ........................................................................................................................... 35
4.1 ....................................................................................................................................................................... 35
CHAPTER 5 CONCLUSION ..................................................................................................................................... 52
5.1 CONCLUSION ........................................................................................................................................... 52
5.2 RECOMMENDATIONS .............................................................................................................................. 53
5.3 FUTURE WORK ........................................................................................................................................ 54
BIBLIOGRAPHY ..................................................................................................................................................... 55
APPENDIX .......................................................................................................................................................... 558

v
Appendix
1. Source Code for Web App in Flask (At end of Report)

vi
Glossary of Terms
Term Description Accuracy A metric used to measure model performance in terms of
how correctly it predicts data points or image features against the ground truth.
AI API
Artificial Intelligence; reference to the simulation of human intelligence in machines enabled by computer programs Application Programming Interface
APTOS Asia Pacific Tele-Ophthalmology Society
Binary Classification The act of classifying elements of a set into two groups
CNN Convolutional Neural Network
Cohen kappa Score A statistical measure used to measure the reliability of two metrics rating the same feature and identifies how frequently the raters are in agreement.
Confusion Matrix An N x N matrix used for evaluating the performance of a classification algorithm
CRISP-DM Cross-Industry Standard Process for Data Mining; A methodology in Data Mining field
Diabetic Retinopathy
An eye condition caused by diabetes complication that affects the blood vessels of the light-sensitive tissues (retina) which can lead to total blindness
diagnosis Identification of the nature of the disease through examination of the symptoms
DR Diabetic Retinopathy
EfficientNET A pre-trained model supplied by Google Team

vii
Term Description
Epoch A period of time
EyePACS A license-free Web Application system for communicating and archiving eye-related patient information which comprises images and diagnostic data. Link: http://www.eyepacs.com/
Full Stack Data Science
An end to end process in Data Science meant to deliver impactful improvement to business
Glaucoma An eye condition of increased blood pressure within the eyeball results in gradual loss of sight
GPU Graphical Processing Unit; especially design processors for graphics rendering
GUI Graphical User Interface; Enables humans to interact with computers in a friendly environment
Hyper Parameter Tuning
Also referred to as Hyper Parameter Optimization is the skill for choosing the optimal parameters for a machine learning algorithm
IDE Integrated Development Environment; a very resourceful coding environment for writing computer programs, test and debug in an efficient manner
Image Data Generator
A class used in Image data augmentation used to transform image data by applying various techniques to process images
Kaggle An online data science environment that is used for competitions and practicing of Data Science technologies
Keras
A Deep Learning API is written in python and running on top of the TensorFlow platform.

viii
Term Description
Metrics Evaluation measures used to check the quality of models
ML Machine Learning
Multiclass Classification
A classification of more than two features in a dataset.
MVP
Minimum Viable Product
Non-Proliferative DR
Diabetic Retinopathy without the growth of new blood vessels
OpenCV Open Source Computer Vision Library aimed at real-time computer vision
Ophthalmologist An Expert Doctor in the study and treatment of eye disorders and diseases.
PoC Proof of Concept
Pre-Trained Models A technique used in Transfer Learning to reduce the time and cost of training new models by using already trained similar models.
Proliferative DR A more severe type of DR where damaged blood vessels in the retina close off resulting in new abnormal ones growing and may leak out into the eye.
QWK Quadratic Weighted Kappa; same as Cohen kappa score
SOTA State of the Art
TensorFlow Is an end-to-end ecosystem for Machine Learning with tools, libraries, and community resources.
Test data
A set of observations used to evaluate the performance of an algorithm using metrics.

ix
Term Description
Train data A set of observations used to train an algorithm
Validation Accuracy The accuracy obtained from using the validation dataset
Validation data A sample of data held back for use during hyperparameter tuning.
VGG16 Very Deep Convolutional Networks for Large Scale Recognition
Web App Is a web application or program accessed through a web browser.

1
Chapter 1 1.1 Background
Context
Diabetic Retinopathy is the fastest-growing cause of blindness for Diabetics every year. Over
285 Million people at risk globally while Diabetic Retinopathy (DR) Screening requires very
specialized Medical Personnel who are in short supply. The nature of DR is largely
asymptomatic and can go largely undetected until in the late stages. If detected early, it’s
treatable (Stewart, 2017). The process of DR diagnosis is laborious, hard to scale, and at the
same time utilizing at most bulky and expensive equipment out of reach for most medical
facilities (Bandello, Zarbin, Lattanzio, & Zucchiatti, 2014).
Research in the use of Artificial Intelligence for Diabetic Retinopathy diagnosis from digital
fundus images has over the last 10 years seen remarkable improvement benefiting from
advances in image classification technologies. From accuracies as low as 80% to the now normal
figures of >96%, (Salamat, Missen, & Rashid, 2019) AI image classification of DR fundus images
now rivals accuracies of a highly specialized ophthalmologist or even better.
However, these advances have not equally translated to benefit the medical field and as IDX
Founder and CEO (Google, Verily using AI to screen for diabetic retinopathy in India _
Healthcare IT News, n.d.) Said, "Technology used in a lab does not directly transfer to what we
do in healthcare." There are several reasons why this is the case. To replicate a truly natural
environment in which technology development should take place would be very costly and
time-consuming.
Proof of concept is desired before further implementations can be adopted. For DR diagnosis
using AI, this has happened and what remains is technology transfer to benefit the consumer.
This capstone project is designed to address the various challenges limiting forward movement
and intended to deliver a low-cost solution for DR diagnosis to the masses.

2
Value
Automating diagnosis for Diabetic Retinopathy would serve to compensate for the huge
shortage of DR eye specialists by shortening the time taken to diagnose a patient to near real-
time. This would free up valuable time for Ophthalmologists’ to allow focus on treatment rather
than diagnosis.
Using a modified Smartphone AI-enabled or adaptable devices as suggested by (Rajalakshmi,
Subashini, Anjana, & Mohan, 2018) and (Cuadros & Bresnick, 2017), coupled with advanced
images processing and classification algorithms running on either a Web App or Desktop
environment, would enable clinicians to screen more persons on a large scale.
This eventually will result in reduced screening costs and allow for wider mass screening
campaigns. Through these open campaigns many unknown cases can be identified at very early
stages and treatment can be prescribed by a Medical Doctor.
1.2 Statement of problem
1) To study how Deep Learning and Neural Networks can be used to aid in the diagnosis
of Diabetic Retinopathy among screened patients to ensure affected people start
treatment in time?
2) Optimization of current smart imaging device technologies for use in fundus image
capture is crucial in providing quality images for use in AI diagnosis of DR. In this
proposal, the alternative low cost and scalable approach are analyzed for their
feasibility, and steps for effective implementation are suggested.

3
1.3 Project goals Every person who is diabetic is at risk of either partial or permanent blindness due to Diabetic
Retinopathy. A complication in diabetic patients that is according to medical doctors completely
treatable if diagnosed early.
The real challenge is in the numbers, and getting diagnosed early has become a tall order for
the over 300 million people at risk worldwide. Apart from the diagnostic process being
laborious and expensive, there aren’t enough expert doctors who have shown consistency in
delivering desired accurate results.
Even for repeat diagnostic cases, research has shown that the experts agree with themselves
only 70% of the time. If this diagnostic process could be made cheaper through automation, it
would free up the very precious time spent by Doctors in diagnosis that would rather focus on
treatment.
That is why in this project, we propose the use of AI in automating the diagnosis through an
easier and cheaper setup process which will shorten the process to enable mass screening and
therefore early detection of DR paving the way for early treatment too.
1.4 Methodology
Methodological Approach
We use the CRoss Industry Standard Process for Data Mining (CRISP-DM) methodology, an
industry-standard in data processing that ensures a strategic approach to achieving business
objectives.
CRISP-DM describes the data science life cycle in six phases shown here:
1. The Business understanding phase – Identify what the business needs
2. The Data understanding Phase – Involves data cleaning and engineering
3. The Data preparation phase – Convert data in readiness for modeling phase
4. Modeling – Build a model that solves the business problem
5. Evaluation – Check if model built meets the business objectives outlined above
6. Deployment – Make your model available to users to interact with.

4
A schematic representation of the CRISP-DM Guideline
STAGE 1 – BUSINESS UNDERSTANDING - SETTING OF OBJECTIVES
Understanding business objectives helps in focusing on answering the right questions as we seek to create a system for mass screening to detect diabetic retinopathy.
To build a model that provides a solution to business problems,
We outline the desired outputs by;
1. Setting objectives
2. Preparing a project plan
3. Defining the Business success criteria – Success is measured by the number of persons
identified and put on medication for DR.
Setting of Objectives: Initial Assessment
During the initial literature review and fact-finding mission, all required resources are
determined, constraints mapped and assumptions that will affect our data analysis. This will be
factored in during the goal setting and project planning.

5
1. Required Resources – These include:
Personnel (Experts in required fields identified including domain and data areas)
Eye Image Data set
Hardware Tools - Computing power for image processing
Software required
2. Specifications, assumptions, and constraints –
Project Requirements
- Accounting for Data privacy by removing sensitive data
- Project to provide high reliability on results by minimizing false negatives
Constraints – Limitations as listed in Section 1.5 Project Assumptions
- The main assumption on the image dataset is that the only abnormalities on the
image provided are a result of diabetic retinopathy. The truth is; there many
other ailments that can coexist together one being glaucoma,
- The second assumption being that, an arbitrary standard of quality of images
taken will be observed during image capture to minimize inconsistencies
- It is also assumed that the review by expert doctors and their diagnosis is a true
and reliable representation of actual cases.
3. Project Risks and contingencies – The major risk that might delay the project is the
Covid-19 pandemic that caused most industries to shut down and our learning
institution to move to online delivery of instructions. Online delivery of learning
contingency bridged the gap and enabled the continuation of our project.
4. Terminologies Used – A glossary of terminology is provided
5. Costs and benefits – This is given under the topic Value Section 1.1

6
What operations to be carried out under Data mining
We provide a twofold objective to ensure the business objective is met in the most efficient
way possible:
1. Business success criteria – To ensure mass screening of persons who may be affected by
DR.
2. Data mining success criteria – The project technical terms aim to reliably detect DR with
the highest possible True Positives (TP) value in real-time.
Prepare project plan
A detailed project plan has been included in the report.
1. Project plan – A comprehensive plan is provided under Appendix Table 2: Project Gantt
Chart which lists tasks for execution during the lifecycle of the project and resources
required.
2. Initial assessment of tools and techniques – The data mining tool we choose is Keras
and TensorFlow because it that supports various methods for different stages of the
data mining process and modeling.
Jupyter Notebook environment is used for ease of testing.
Others include Pandas and Numpy, Matplotlib for feature engineering and visualization

7
STAGE 2 – DATA UNDERSTANDING
Our main source comes from the Aravind Eye Hospital, India. The image dataset contains
images from multiple sources by technicians in the field and diagnosed by expert eye physicians
who categorized them on a scale of 0 being no DR to 4 representing proliferative stage.
Source: https://www.kaggle.com/c/aptos2019-blindness-detection/data?select=train.csv
Size 9.52 GB, 512 x 512 pixel images in ‘.png’ with 3,662 unique images in train / test image
folders and their target labels in train.csv / test.csv files
In our analysis, we first run a smaller modified dataset for quick result and decision making
before committing resources to larger datasets for verification.
The APTOS Dataset was collected by technicians traveling to rural areas to capture eye images
referred to as fundus. These images were then reviewed by expert Doctors and the diagnosis
provided by them. To minimize errors and mislabeling, peer review for all images was repeated
and an agreement was reached for edge case labeling.
Describing the data
Data description report – The main image data set contains resized 3,662 records of eye
fundus images at 224 x 224 pixels in “.png” format, in a group of folders, one containing
the train.csv file which has two fields; a unique alphanumeric “id_code” and a numeric
“diagnosis” column with values 0, 1, 2, 3 and 4.
Four other folders contain fundus images with corresponding alphanumeric labels. Each
folder represents one of the five classes or categories namely;
0 Stands for the No_DR category
1 Stands for Mild
2 Stands for Moderate
3 Stands for Severe
4 Stands for proliferative_DR
The second image Dataset (APTOS2019-blindness-image-detection-dataset) contains
35,108 records with 4 attributes. The images are full color 512 x512 pixel in .png format
8
contained in the images folder while a “train.csv” folder contains the alphanumeric
“id_code” and “diagnosis” column showing the category for each image.
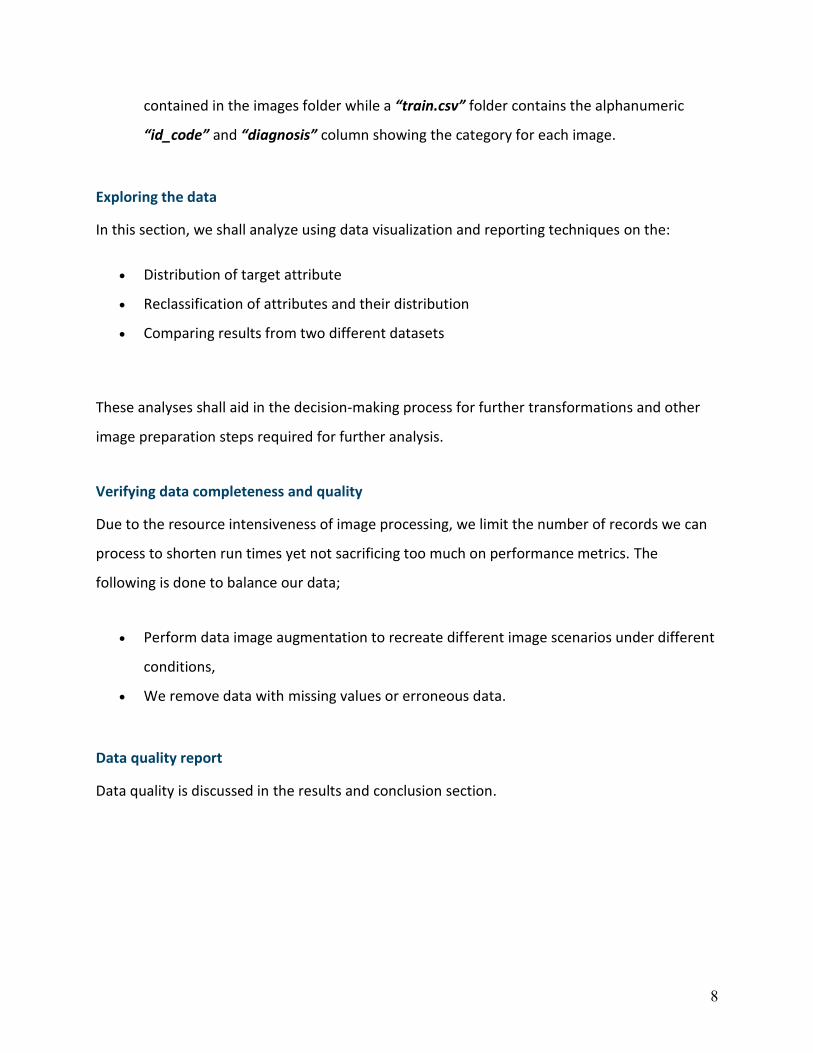
Exploring the data
In this section, we shall analyze using data visualization and reporting techniques on the:
Distribution of target attribute
Reclassification of attributes and their distribution
Comparing results from two different datasets
These analyses shall aid in the decision-making process for further transformations and other
image preparation steps required for further analysis.
Verifying data completeness and quality
Due to the resource intensiveness of image processing, we limit the number of records we can
process to shorten run times yet not sacrificing too much on performance metrics. The
following is done to balance our data;
Perform data image augmentation to recreate different image scenarios under different
conditions,
We remove data with missing values or erroneous data.
Data quality report
Data quality is discussed in the results and conclusion section.
9
STAGE 3 – DATA PREPARATION
Selecting the subset of data used for Analysis
Being highly constrained on compute resources, my project analysis shall be partly on the
Google Cloud and partly on a local machine. This is to ensure the reproducibility of results for
those who have no continued access to cloud resources.
The smaller image dataset has been optimized to run on any moderately sized laptop or
desktop environment.
Cleaning your data
A discussion on data cleaning and subsequent preprocessing is discussed in detail during each
process explaining the rationale of the decision taken and how it impacts performance.
Construct required data
To help with a more generalized analysis, we introduce new fields that give a different view in analysis.
Derived attributes – For Binary classification, we generate a new attribute named
“Binary_type”.
Generated records – during the merger of different categories, new fields are
generated.
Integrate data
Several methods are used to achieve varying objectives.
Merged data – Merging image folders, then shuffling the records is done to introduce
randomness in data.
Aggregations – Aggregations of records into classes give a distribution graph for all
categories.
10
STAGE 4 – MODELLING
Select modeling technique
Recent technological advancements in computer vision have now made it possible to harness
the huge compute power of large establishments like Google and IBM through what has now
become known as Transfer Learning.
“Transfer Learning” gives us the ability to use a pre-existing model trained on a huge dataset to
train our model. These large datasets have been vetted to meet an acceptable level of quality
to guarantee the reliability of results. The main advantage of using a pre-trained model is the
reduced cost of training new deep learning models.
Under Image Classification we have the following list of Pre-Trained Models:
1. Pre-trained model VGG-16
2. The ResNet50 series
3. Inceptionv3 models
4. EfficientNet B0 – B7
The suitability of these pre-trained modeling techniques is examined here as follows:
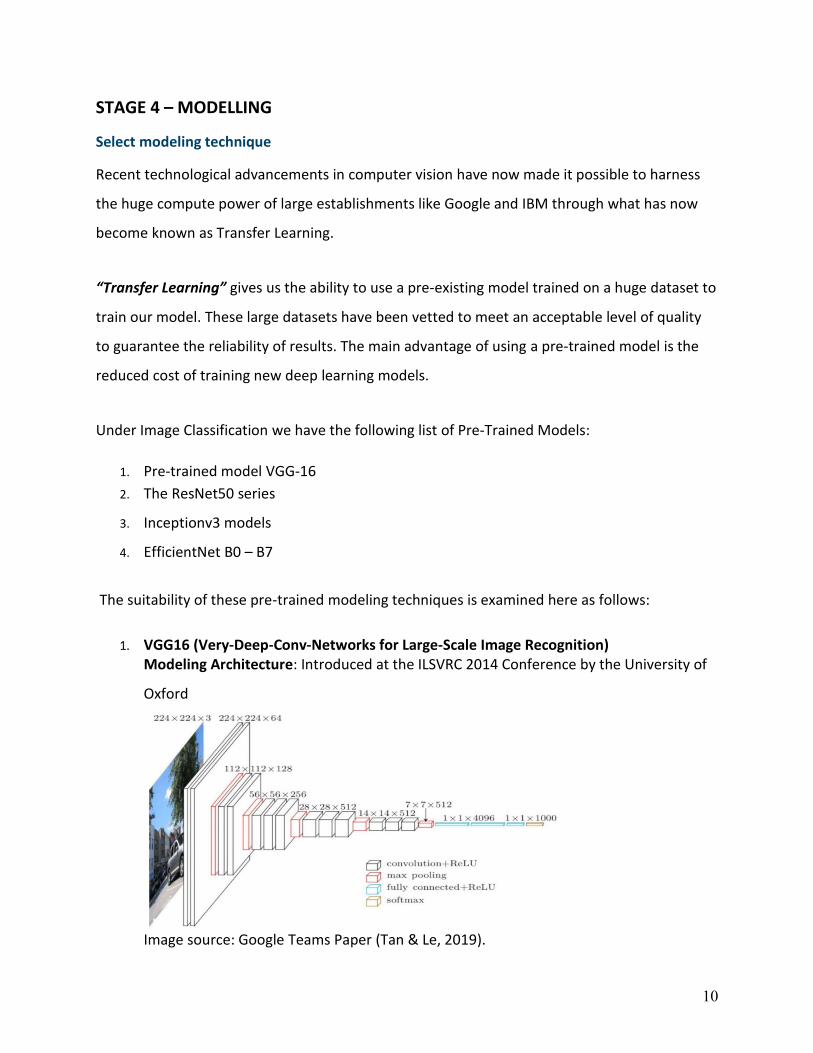
1. VGG16 (Very-Deep-Conv-Networks for Large-Scale Image Recognition) Modeling Architecture: Introduced at the ILSVRC 2014 Conference by the University of
Oxford
Image source: Google Teams Paper (Tan & Le, 2019).

11
Layers represented by
- 13 Convolutional Layers
- 5 Pooling Layers, and
- 3 Dense Layers,
Which adds to 138 billion parameters for this VGG6 model. This resulted in a slow
model.
Below is a representation of the same figure.
Modeling assumptions – here, it is assumed, there is enough compute power required for the model (Tan & Le, 2019).
2. InceptionV1 –V3 Modeling Architecture Originated from Google in 2014 and managed to reduce the number of parameters to 7
million in its first version, V1 thereby becoming faster than VGG16.
Introduced batch normalization, more factorization, and RMSProp Optimizer which
further provided some improvement in error rate dropping to 4.2%
Assumptions – Still required high compute power.

12
3. ResNet50 Modeling Architecture. Was a better model as it tried to solve the Vanishing Gradient Descent problem. There
are many variants of the ResNet family of models, the latest being the ResNet152. A
table showing this family of models by layers is shown below:
Modeling Assumptions.
- Dataset is balanced
4. EfficientNet Modeling Architecture.
Authored by a team from Google in 2019, EfficientNet uses a scaling technique known
as Compound Scaling (Tan & Le, 2019).

13
This resulted in smaller, more efficient models with the best in industry performance.
The EfficientNet family of models runs from the initial B0 to the more powerful B7
model which requires more resources but still achieving higher performance than
previous models.
Modeling assumptions
- The Dataset is balanced. However, for an imbalanced dataset, image
augmentation is used to generate new images by a transformation of
existing images
- No missing values allowed,
- A class attribute must be numeric.
This graph shows how the EfficientNet family of models stack up against previous models
Source: (Tan & Le, 2019) EfficientNet: Rethinking Model Scaling for Convolutional Neural Networks

14
A comparison data table is provided showing the number of parameters and response times for
each model discussed above.
Pre-Trained Model Selection
We select the EfficientNETB3, a more advanced model than the B0 yet not compute-intensive than the B7 iteration but offering satisfactory results.
Generate test design
We use the confusion matrix to determine how well our model fits the test data.
Build model
The CNN model is provided under the Project description phase.
Parameter settings
Models
Model descriptions
Assess model
We compare the two models we have built according to their accuracies, validation accuracy, and response times.
Model assessment – As provided under the section on results
Revised parameter settings – As provided under the section on hyperparameter tuning.

15
STAGE 5 – EVALUATION
Evaluate your results
Here we test models in the real application for image capture and prediction in real-time. Time
and budget constraints variations are measured to gauge project success. We also investigate
how far the original business objectives have been realized.
Assessment of data mining outcomes – Summarizes assessment results in terms of
business success criteria, including a final statement regarding whether the project
already meets the initial business objectives.
Approved models – Models with the best performance are integrated for production.
Review process
A review is planned to look into plans for the project in line with objective improvement. See
section on future work.
Determine next steps
The success of previous steps determines how fast we move to the deployment phase. A plan is
prepared of timelines and possible scenarios evaluated for risk management.
List of possible actions prepared
Action Plan & Decision to live rollout made
STAGE 6 – DEPLOYMENT
This phase is not implemented in this project and has been left out for future work.
Plan deployment
Plan monitoring and maintenance
Produce final report
Review project and Documentation

16
1.5 Limitations of the Study
Large Dataset size
The original dataset size is ~80 GB, had to analyze it on a standard laptop. As such, on
the cloud platform, Kaggle was used to develop the results. Even on these platforms,
detailed analysis with GPU acceleration takes 3 to 6 hours of runtime before results can
be viewed.
It is important to note though Visualization and Exploratory Data Analysis can be
parallelized to utilize multiple cores, most Machine Learning Algorithms and Deep
Neural Networks are by design run on a single core.
High Variability in Uploaded Images
Due to the high number of inputs that affect image quality, it is hard to get a definite
image quality. From image input device parameter settings to storage formats, lighting
conditions, and other eye conditions that introduce effects to our images.
Variability in input file quality makes it nearly impossible to have nearly 100% accuracy
on image classification for any given new inputs being taken in real life. The file may
have different id code formats, or vary in size, may have been taken under different
lighting conditions among other variations.
Testing Without Fundus Image Camera
The initial plan of implementation required a specialized Fundus Image Camera that
captures the inner eye with high contrast. Due to constraints that played out as a result
of the Covid19 Pandemic, the full user integration is phased to a later implementation.
Another limitation is lab testing of technologies and reality in healthcare centers. When
patients have multiple eye diseases, the trained algorithms no longer provide the
effectiveness exhibited during training and testing of the provided dataset.
17
Chapter 2 – Literature Review
The Big Picture: Overview of Diabetic Retinopathy
Health statistics show of the 285 million diabetic persons, (Bourne et al., 2016) a third show
signs of DR, and one-sixth of these diabetic people have vision-threatening DR. WHO statistics
also confirm this and have estimated by 2025, (Chisha, Terefe, Assefa, & Lakew, 2017) with the
current trend, the numbers can only double.
In his article published in 2019, Peter H. Scanlon (Scanlon, 2019) states that Diabetic
Retinopathy is still a problem for the working class in 2019, and Screening and early treatment,
with good blood pressure and glycaemic control, are effective in preventing visual loss.
According to World Health Organization estimates in 2005, DR was responsible for 4.8% of the
37 million cases of blindness across the globe and was estimated to grow ten times by 2025.
Statistics from a paper published in 2015 entitled, “Epidemiology of diabetic retinopathy,
diabetic macular edema, and related vision loss” by Ryan Lee et al showed of the 285 million
people (Bourne et al., 2016) and (Lee, Wong, & Sabanayagam, 2015) with Diabetes Mellitus,
one third had signs of Diabetic Retinopathy; from whom a third would end up with vision-
threatening DR.
All persons suffering from Diabetes are at risk of DR. According to a paper published in the
Epidemiology / Health Services Research journal (Joanne W. Y. & Sophie L. R. et. al Global
Prevalence and Major Risk Factors of Diabetic Retinopathy, 2012), the type-I patient had a very
low risk of contacting DR while Type-II had a one in every five newly diagnosed cases.
Risks increased over time with almost all Type-I diabetic patients contacting DR after 15 years
since the first diagnosis of diabetes. Type-II however showed a different trend with one-third
progressing to DR over the same period.
18
Diabetic Retinopathy falls into two main classes: non-proliferative and proliferative. The early
stages known as Non-proliferative diabetic retinopathy (NPDR) are characterized by mild or
nonexistent symptoms.
Over time, too much sugar in a diabetes patient’s blood can lead to the blockage of the tiny
blood vessels that nourish the retina, cutting off its blood supply. As a result, the eye attempts
to grow new blood vessels. But these new blood vessels don't develop properly and can leak
easily and eventually result in what is known in the medical field as "dot-and-blot"
hemorrhages because of their appearance.
DR is treatable if discovered early, but the main problem is its asymptomatic characteristic
(Chisha et al., 2017), (Safi, Safi, Hafezi-Moghadam, & Ahmadieh, 2018) and therefore can go
undetected through its early stages. One solution is the mass screening of all diabetic patients
for early detection. However this approach cannot scale due to 1) shortage of required highly
specialized ophthalmologists, 2) fundus imaging equipment is very expensive and most
healthcare centers cannot afford it, 3) Diagnosis of DR is a laborious process.
National screening programs for DR such as the Amsterdam 5 year campaign and 2002 - 2003 in
Scotland, Wales, England, and Northern Ireland, all using digital photography has proven very
successful. A recent study in these regions showed a reduction in DR referrals to specialists
which had reduced by 47 and 49% respectively. This is a remarkable improvement and forms
the basis of our study that making screening easily available will yield positive results.
Diabetic Retinopathy: Prevalence and Associated Factors
Diabetic retinopathy (DR) is a Medical condition that results from complications in patients with
Diabetes which affects the eyes. It's caused by damage to the blood vessels of the light-
sensitive tissue at the back of the eye (retina) (Scanlon, 2019).
In a study conducted on a select sample to determine the prevalence of Diabetic Retinopathy
by joint researchers from Arbaminch College of Health Sciences, Mekelle University, and

19
Wolaita Sodo University, in conjunction with the Ministry of Health at Arbaminch General
Hospital in Ethiopia; results returned a 13% (Chisha et al., 2017) prevalence.
Diabetic Retinopathy has been a leading cause of visual impairment for persons with diabetes
accounting for approximately one-third of patients with diabetes mellitus out of which a third
would have vision-threatening diabetic retinopathy which includes diabetic macular edema
(DME), severe non-proliferative diabetic retinopathy (NPDR), or proliferative diabetic
retinopathy (PDR) (Bandello et al., 2014)
Although scientifically and medically proven that, strict hypometabolic and effective blood
pressure control could substantially reduce vision loss, diabetic macular edema and
proliferative diabetic retinopathy potentially remain sight-threatening complications. The
advantage lies in at what stage the diagnosis is made.
It has been shown that 90% of cases can be prevented through early detection and treatment.
Medically trained physicians conduct screening of eye images trying to identify the type and
number of lesions as micro-aneurysms, hemorrhages, and exudates, symptomatic of DR (de la
Torre, Valls, & Puig, 2019).
To create consistency in identification/diagnosis, delivery, and communication of results among people caring for DR patients, the American Academy of Ophthalmology recommended a consistent international clinical classification system for DR (Wilkinson et al., 2003).
Source: Proposed Int’l Clinical DR and Diabetic Macular Edema Disease Severity Scales (Wilkinson et al., 2003)

20
In summary, these classifications are now referred to as: 1. No DR 2. Mild NPDR {Low-Risk DR} 3. Moderate NPDR 4. Severe NPDR 5. PDR
One major challenge is the ability to see and correctly identify features or aspects of the disease
in images taken bearing if training of physicians and their equipment allows. The how and when
the image is taken are also part of this enigma. The physician may also have eye complications
which may inadvertently introduce errors in results.
It should be noted that accurate diagnosis requires domain-intensive knowledge and continual
daily practice on the part of the expert physician (Leeza & Farooq, 2019) (Tufail et al., 2016).
The American Academy of Ophthalmology (AAO) carried out an exercise to determine if
Automated DR Image Assessment Systems (ARIAS) may replace human graders and provide
clinically effective and cost-effective detection of DR.
Ophthalmology Volume 124, Number 3, March 2017
Note: Decision tree used by AAO comparing manual practice versus current trials assisted by Automated Retinal Image Analysis System (Tufail et al., 2016) In their analysis, the results were promising with sufficient specificity to make Retmarker and EyeArt cost-effective alternatives to manual grading alone (Tufail et al., 2016).
{High Risk}
KEY
D = Disease absent classification by Automated System
D+ = Disease present classification by Automated System
TF = Technical failure
R0 = No Retinopathy; M0 = No Maculopathy;
R1 = Background Retinopathy;
U = Un-gradable Images; M1 = Maculopathy;
R2 = Pre-proliferative Retinopathy; R3 = Proliferative
Retinopathy
21
Clinical Strategies and Management of DR In their book, “Clinical Strategies in the management of Diabetic Retinopathy, A step-by-step
Guide for Ophthalmologists 2nd Ed.”, the authors outline a detailed practical approach to guide
clinicians in the management of diabetic retinopathy starting with diagnosis, decision-making,
and treatment (Bandello et al., 2014).
The author continues to point out the complex nature of DR and with the emergency of new
technologies, decision making becoming even more complex in a time constraint environment.
Eye treatment has moved from traditional treatment methods applying disease stabilization
using laser photocoagulation to recently introduced diagnostic imaging techniques.
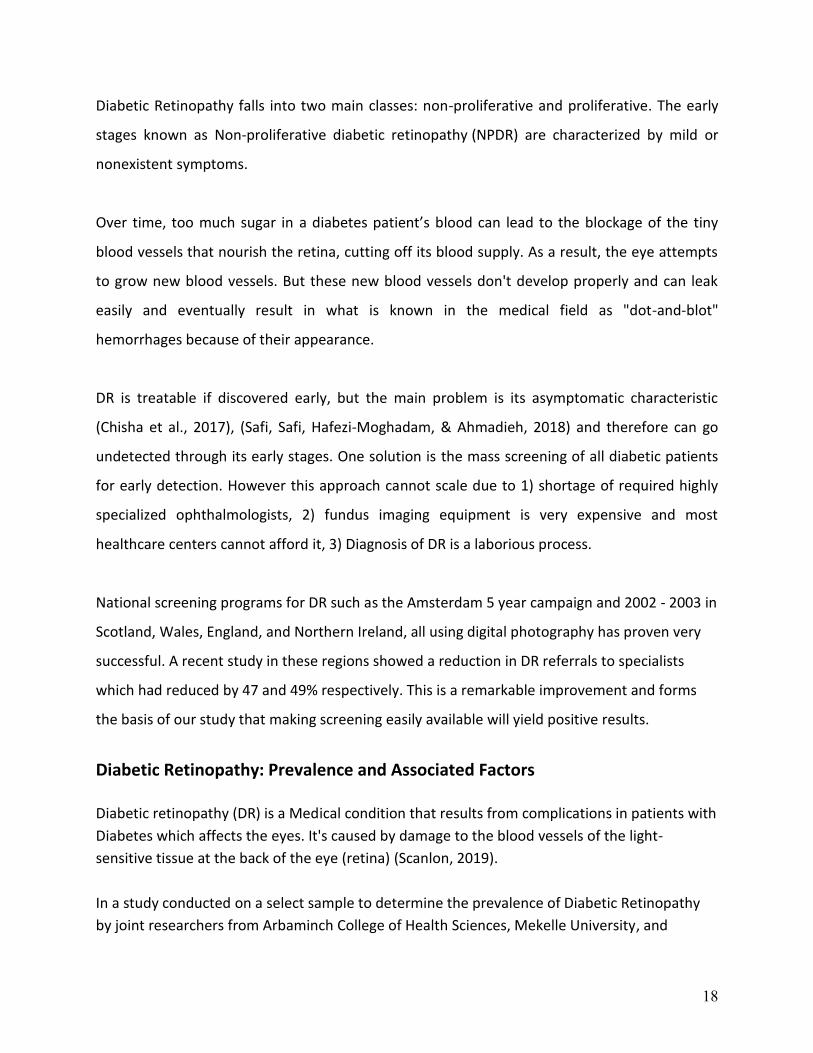
Current imaging techniques include optical coherence tomography angiography and ultra-wide
field angiography utilizing specialized built-in analytical equipment with the installed software.
The downsides of the equipment are bulky, expensive, and not portable restricting their use to
high-end medical facilities. The process itself is laborious and engaging requiring several man-
hours along the chain for any single patient, limiting the number of persons who can be
screened for any given time.
It, therefore, discourages a proactive approach to persons seeking routine examination for
checkups. One when one is suffering from any eye illness will therefore visit health care
facilities when they exhibit serious illness and often undergo late invasive treatment leading to
poor prognosis and higher medical bills.

22
Initial Machine Learning / AI Methods In their paper, “Detection of the severity level of diabetic retinopathy using Bag of features model”, (Leeza & Farooq, 2019) analyzes the performance and use of several Algorithms based on previous research. Support Vector Machines (SVM), K-Nearest Neighbor (KNN) and Naïve Bayes (NB) classifiers have been used to detect abnormalities (especially exudates, pixels of vessels, and red lesions) within the fundus images with success identifying up to three levels of DR with 97% accuracy. Nadeem et al (Salamat et al., 2019) analyzed a total of 77 algorithms for automated detection and grading of the Diabetic Retinopathy algorithm. Accuracy ranged from 0.82 to 0.99 (Xu, Feng, & Mi, 2017) and (Raja & Balaji, 2019). A comparison of eye images showing effects of DR on image Normal Eye Image A labeled Eye Image showing effects of DR
Machine learning algorithms can distinguish the inherent features in an image and based on prior labeling or image tagging, learn features to be able to classify unseen images to the model. Accurate tagging and labeling of known cases to build an inventory of images for use in machine learning and deep neural networks is a crucial step in the setup of Automated Systems. A lot of work has gone into this field providing huge databases of images for researchers to work on. Good examples include publicly available databases DIARETDB, STARE, DIARETDBO, and MESSIDOR for experimental purposes where researchers achieved 87.61% mean accuracy (Leeza & Farooq, 2019).

23
Modern research has adopted a five-category classification as proposed by the American Academy of Ophthalmology and this classification has continued to guide future research. Below images show tagging of images based on the severity from a) No DR to 5) Proliferative DR.
No-DR Mild NPDR Moderate NPDR Severe NPDR PDR Source: Eye Fundus images in increasing order of severity levels of DR (Leeza & Farooq, 2019)
The nature of DR combined with recent development in computer technology provides a way
to use image classification in the diagnosis of the disease. Color fundus images can be used to
diagnose DR (Acharya et al., 2017) with high accuracies depending on the quality of the
database and can reduce the workload of clinicians by 50%
A team from Sichuan University, China (Wei Zhang et al., 2019) developed a High-quality
labeled dataset of DR medical images on which novel and tested algorithms have been
developed with good results.
Confusion Matrix comparison for SVM versus ANN
Classification of DR using SVM Classification of DR using ANN
Source: (Leeza & Farooq, 2019) A heat map of True Positives, True Negatives, False Positives, and False Negatives

24
Initial results showed Support Vector Machine Algorithms were performing better than
Artificial Neural Networks
Early Detection of DR using Deep CNN Convolution Neural Networks (CNN) is a deep neural network highly specialized for image
recognition, analysis, and classification and has exhibited abilities rivaling those of trained
medical experts. With applications in breast cancer, lung cancer, and skin cancer classification,
the CNN algorithm has proven a good candidate for Diabetic Retinopathy too.
A CNN Neural network belongs to the feed-forward Artificial Neural Network (ANN) category
and is built using multiple layers of small neurons. It consists of a single convolutional layer +
max-pooling layer (or multiples of convolutional layer + max-pooling layer in alternate
sequence), filters, and finally a fully connected layer. The whole network is optimized using
forward or back propagations and stochastic gradient descent.
The fundamentals of CNN depend on three actions; receiving input (image), processing input, and generating output (image classification) in what is referred to as forwarding propagation. All three steps are represented as layers in a neural network. A layer consists of nodes or neurons that receive and channel individual features from the original image feeding into the network. Forward Propagation The image is fed into the input layer in a numerical matrix format which allows for mathematical operations to be carried out. The numerical values denote the intensity of pixels in the image.

25
The processing step which is normally referred to as the hidden layer applies some mathematical functions using randomly initialized parameters to transform the matrix. These initial parameters include weights, biases, and filters. Finally, the process outputs the image representation. Backward Propagation The output representation is then compared to the initial input and any variation is counted as an error. This error is fed back to the process layers and the model tries to update the parameters in a way that improves subsequent predictions using the gradient descent technique. Feeding the error back to correct and fine-tune model parameters is known as backpropagation.
Source: https://hackernoon.com/the-full-story-behind-convolutional-neural-networks-and-the-math-behind-it-2j4fk3zu2
The whole process mathematically is divided into two operations:
1. Linear Transformation (Applying Weights, Biases, Filters) and 2. Non-Linear Transformation (Sigmoid or ReLU function for Binary Classification)
Control Parameters To fine-tune our CNN model, there are parameters that we can modify depending on output to improve model performance. These include:
1. Activation Functions 2. Learning Epochs and Optimizers 3. L1 or L2 Regularizations 4. Dropouts 5. Early Stopping
26
Verily using AI to screen for DR In 2019, Google partnered with its sister company Verily to develop an AI algorithm for use in the detection of DR. The model was approved by the European Regulators for use in a real-world situation to screen DR. The model is now in use and was deployed at Aravind Eye Hospital Madurai, India. Its performance has been hailed to rival that of medical experts and therefore lessening the load to an already overwhelmed team.
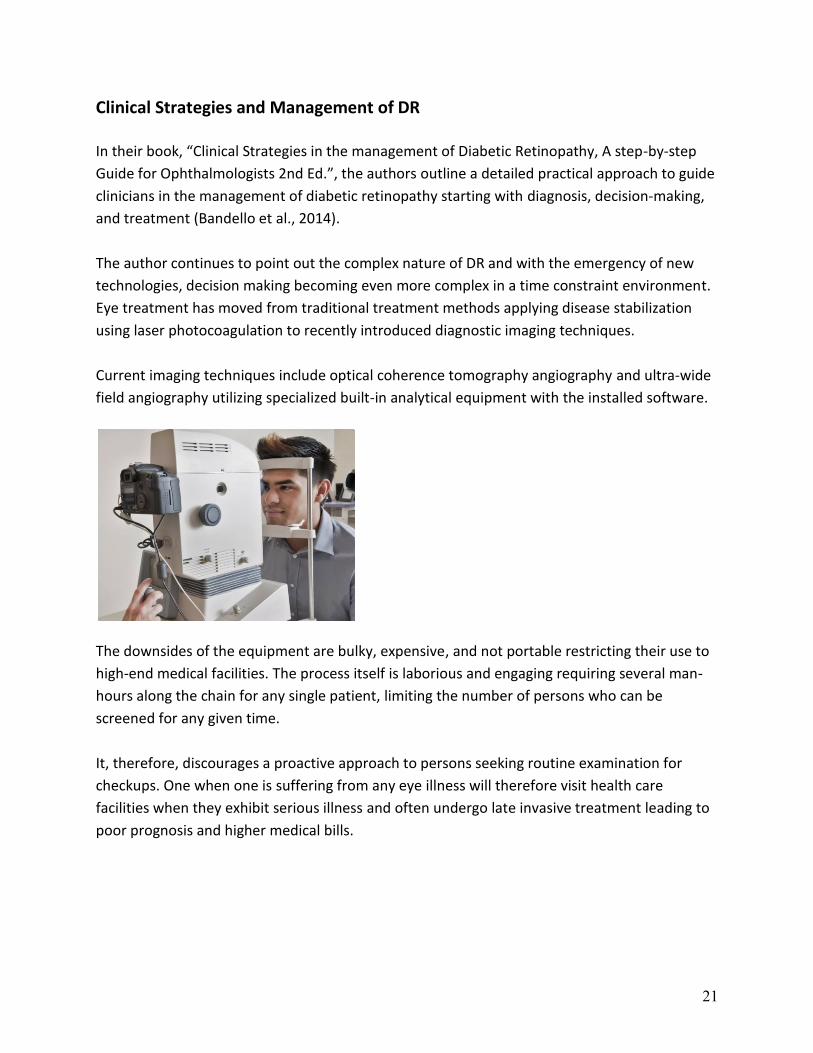
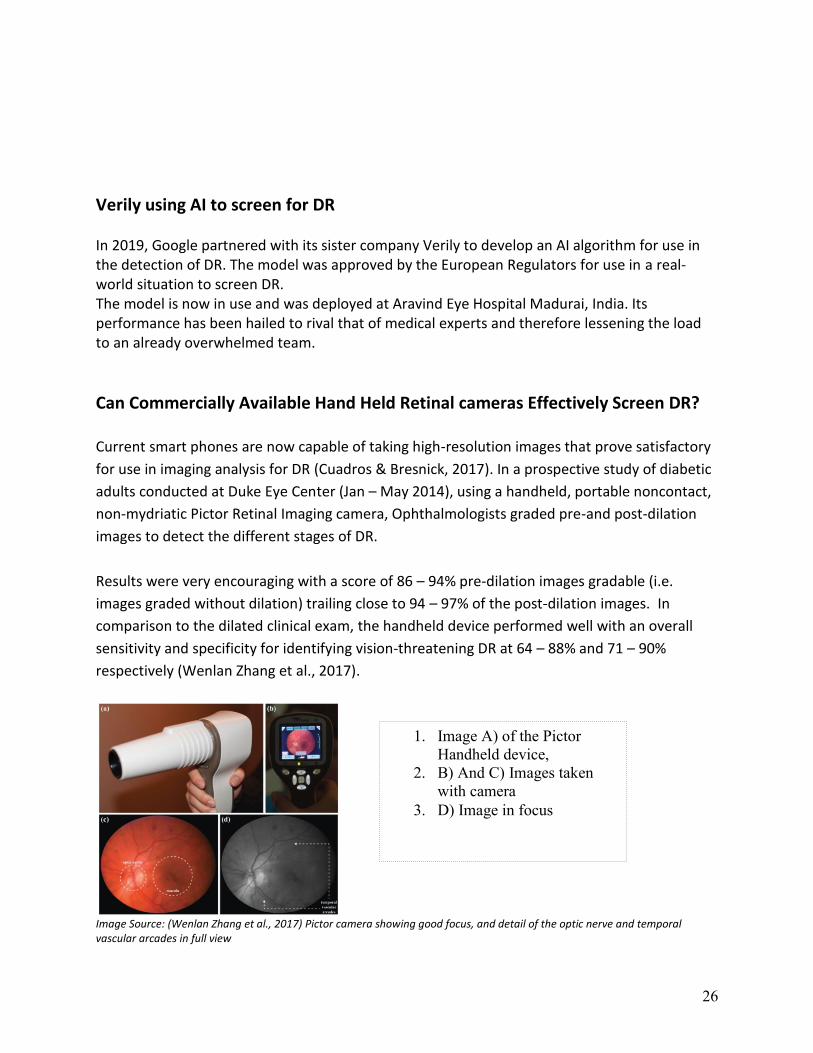
Can Commercially Available Hand Held Retinal cameras Effectively Screen DR? Current smart phones are now capable of taking high-resolution images that prove satisfactory
for use in imaging analysis for DR (Cuadros & Bresnick, 2017). In a prospective study of diabetic
adults conducted at Duke Eye Center (Jan – May 2014), using a handheld, portable noncontact,
non-mydriatic Pictor Retinal Imaging camera, Ophthalmologists graded pre-and post-dilation
images to detect the different stages of DR.
Results were very encouraging with a score of 86 – 94% pre-dilation images gradable (i.e.
images graded without dilation) trailing close to 94 – 97% of the post-dilation images. In
comparison to the dilated clinical exam, the handheld device performed well with an overall
sensitivity and specificity for identifying vision-threatening DR at 64 – 88% and 71 – 90%
respectively (Wenlan Zhang et al., 2017).
Image Source: (Wenlan Zhang et al., 2017) Pictor camera showing good focus, and detail of the optic nerve and temporal vascular arcades in full view
1. Image A) of the Pictor
Handheld device,
2. B) And C) Images taken
with camera
3. D) Image in focus

27
Newer versions of the Pictor series of Retinal Imaging cameras from Volk manufacturer (Volk review _ iPhone Fundus Camera - Ophthalmic Cameras - Products, n.d.) offer better performance (https://www.volk.com/products/pictor-plus-fundus-camera) A good example though may prove costly for rural remote areas, the Pictor Plus from Volk. Volk Optical Pictor Plus Fundus Camera Sample Images were taken with Pictor Plus
camera
A low-cost option is the “Volk InView”, Attachment designed to be used with high-end Smartphones The Volk Optical InView Additional Attachment for Full Kit
We couldn’t find any review of the Volk InView attachment in use with any mobile smartphone to report, so this remains an option to be tested for usability among many other factors. (Cuadros & Bresnick, 2017) also note the increase in adoption of telemedicine-based diabetic retinopathy screening (TMDRS) in parts of Chennai, India where primary health care providers photograph their patients using digital retinal cameras from their remote rural areas and images transmitted remotely to eye specialists who in turn review and return a diagnosis. Most of these devices are low-cost low-end cameras and therefore without doubt limitations abound. From image quality to validation of handheld devices and standardization of operations. Retinal image quality standards defined by the AAO in the Early Treatment Diabetic Retinopathy Study (ETDRS), for stereoscopic color fundus photographs, outline seven standard fields of specification for cameras.

28
Defined under three general categories namely 1) Optical properties (pupil size requirements, the retinal field of view/depth of focus, illumination, light scattering, optical artifacts) 2) Image file properties (image file type and size, resolution, and color depth) and 3) User properties (computer user interface, information system interface, alignment, and ergonomics) (Cuadros & Bresnick, 2017) The first study to the best of my knowledge to assess the use of AI in smartphones to capture fundus images for use in detection of DR appears in a paper published in the journal of “The Royal College of Ophthalmologists” (Rajalakshmi et al., 2018)
Concerns Raised from Previous Research
A paper presented (de la Torre et al., 2019) on diabetic retinopathy deep learning interpretable
classifier highlighted a very important aspect of any disease diagnosis. The physician should be
in a position to explain his or her findings and have solid evidence for a course of action taken
in administering treatment.
Most deep neural networks fail in this as they are not fully developed to expose the rational in
which humans can understand. The paper showed proof of concept in segmenting levels of
severity and even assigning a score for each level.
To aid the ophthalmologist in the diagnosis of DR, they recommend, making models explainable
by generating visual maps on which it has based its classification.
Other recommendations worth noting raise concern on standardization of grading of DR, (Leeza
& Farooq, 2019), and testing of new AI methods using Local Convergence Indexing features
(Dashtbozorg, Zhang, Huang, & Romeny, 2018).

29
Chapter 3- Project Description
3.1 Project Overview The project's main objective is to carry out mass screening to enable easy detection of Diabetic
Retinopathy. We implement a supervised image classification solution using CNN Algorithm.
This is represented by the schematic given below for a quick understanding of the system
required to achieve said goals.
3.2 Project Requirements To achieve our goal, we need a system that delivers real-time results after the image is taken.
From the above schematic, we derive the following basic requirements:
- A Flask Web App to provide the user interface for image capture
- A Machine learning Model built with TensorFlow and Keras
- A Database to store images, models, and user data
- A Web Server to serve pages to users
- A Mobile or Desktop device for user interaction

30
The tools we use to build our project include:
Environment and tools
1. Scikit-learn – For Modeling and Extraction of Performance Metrics
2. Tensorflow / Keras – For Modeling Deep Neural Networks
3. Pandas – For Data Manipulation and Analysis
4. Numpy – For Numerical processing of images in array format
5. Matplotlib – For plotting graphs and images
6. OpenCV – for Image Processing (Uses Numpy library)
7. Python / Flask – Web Development Programming language
8. Jupyter Notebook IDE
9. PyCharm IDE – for writing web development scripts
10. EfficientNetB3 – Pre-trained model weights
11. Kaggle / Google Cloud Platforms – to handle large datasets over 34 GB
3.3 Project Build Step We follow a seamless process in setting up our system with the following steps:
Step 1: Project Planning Phase In this phase we layout all the requirements and project objectives including justification and
benefits that will result in its implementation. We also identify and establish any ethical issues
or laws governing personal information such as the GDPR and other national laws on privacy
and distribution of information.
The outcomes include:
- A project Plan with timelines
- Business Objectives
- Identification of Constraints and limitations

31
Step 2: Current Technology Developments Reviewed It is clear from our literature review that current technological advancements now are well
capable of conveying real-time analysis in an end-to-end data pipeline using streaming data.
Several research papers have from time to time demonstrated the feasibility of using Deep
neural Networks in predicting DR without fully implementing what is known as full-stack data
science problem-solving.
We, therefore, take a deep dive into setting up a system that fully implements a full-stack
solution to achieving real-time analysis for DR cases. There are numerous proposals on how to
implement a model-friendly user interface without the much-hyped overheads of a software
engineering company.
Our options available include Flask or Django which are Python libraries for building the
backend fronted by Tkinter for GUI web applications. For mobile apps, Flutter on Android or IOS
devices is ideal as a quick and fast implementation.
Step 3: Building a Deep Neural Network We have chosen the State of Art technology (SOTA), EfficientNet pre-trained model as our
starting point and build a robust model.
Data Preparation
Image preprocessing is done to prepare images for analysis. Several steps are carried out to
achieve this. We start by;
Resizing images so that all images are of the same size
Second, we manage image resolution:- by improving the resolution or introducing noise
Transformation actions include:- translation, rotation and scaling should be applied so
that the images captured are present in all angles
We also check the number of images per class to determine how classes are distributed
and whether it is necessary to redistribute them.

32
Data Modeling
Data Split is done to ensure that there is a proper distribution of images for the training,
validation, and test datasets. We use neural networks for image classification and recognition
specifically the Convolutional Neural Network architecture which is best suited for images as
they work with matrices.
CNN's architecture operates using layers that are valuable for mathematical operations. These
layers include;
a) Convolution layer,
b) Pooling layer,
c) Batch Normalization layer,
d) Activation Functions and
e) Fully Connected layers
Step 4: Build a Full Stack Web App
Designing the GUI (User Interface)
The model provided in the previous step becomes our input into the user interface stage. We design a web application using Flask as backend and GUI developed using Tkinter.

33
Web App Project Structure
Our project is set up as follows:
1. Predict_dr.py — Contains ML code to predict DR when images are uploaded on App.
2. Upload.js — Contains JavaScript that receive the uploaded image through GUI,
Integrated with python through AJAX calls which run python script runs our model,
and returns a value.
3. views.py — We use the views module that call functions and display the html.
4. HTML/CSS — Contains the HTML template and CSS styling displaying input forms for
data / image entry
Step 5: Project Integration
1. Study available low-cost Hand Held Imaging Devices for suitability in generating fundus
images meeting required standards. One handicap that has always stood in the way of
implementing developed Lab AI is the means to avail ready for analysis images into the
pipeline.
Images captured need to be carefully prepared, resized, scaled-down, rotated, labeled
among other tasks for them to be fed into the algorithm for classification.
If this hurdle can be overcome, we are one step closer to real-time screening with
results matching a highly skilled specialist.
2. Integrate the User Interface and Modeling
We use Flask to integrate our web app and Tensorflow library which uses the model weights for making the right kind of prediction on the input image.
A user interface becomes the link on which users log in to perform their image classification on the model and obtain results in real-time.

34
Step 6: Project Evaluation and Deployment
1. Workflow Validation by specialized Ophthalmologist trained on DR and Testing for
accuracy, consistency, and standardization.
Field trials need to be arranged to test the technology for all real-world situations
before a full evaluation can be carried out.
A complete project Setup is shown here

35
Chapter 4- Project Analysis
4.1 Image Dataset & Libraries used
Data Source We use the APTOS 2019 Blindness Detection dataset from Aravind Eye Hospital Foundation
Source: https://www.kaggle.com/c/aptos2019-blindness-detection/data?select=train.csv
Size 9.52 GB, 512 x 512 pixel images in ‘.png’ with 3,662 unique images in train / test image
folders and their target labels in train.csv / test.csv files
This APTOS 2019 Blindness Detection dataset has been resized to 224 x 224-pixel image size
and a Gaussian Filter applied on images with remarkable size reduction to 432.7 MB. It is
available at https://www.kaggle.com/sovitrath/diabetic-retinopathy-224x224-gaussian-filtered
Another dataset that we ran on the cloud utilizing the Kaggle Cloud resources was the original
EyePacs dataset available at https://www.kaggle.com/c/diabetic-retinopathy-detection
It’s an 82.23 GB dataset with a total of 88,702 records (35,126 training images and 53,702
testing images). We did discontinue the Kaggle runs due to dataset size and GPU time
limitations.
Libraries Used The programming language used is Python and the main libraries are Scikit Learn, Keras, Tensor
Flow, and of course Numpy package. For visualization, we used the Matplotlib library among
others mentioned later.
For building a web application interface we used Flask and Bootstrap 4 to create a user-friendly
interaction with the app.
36
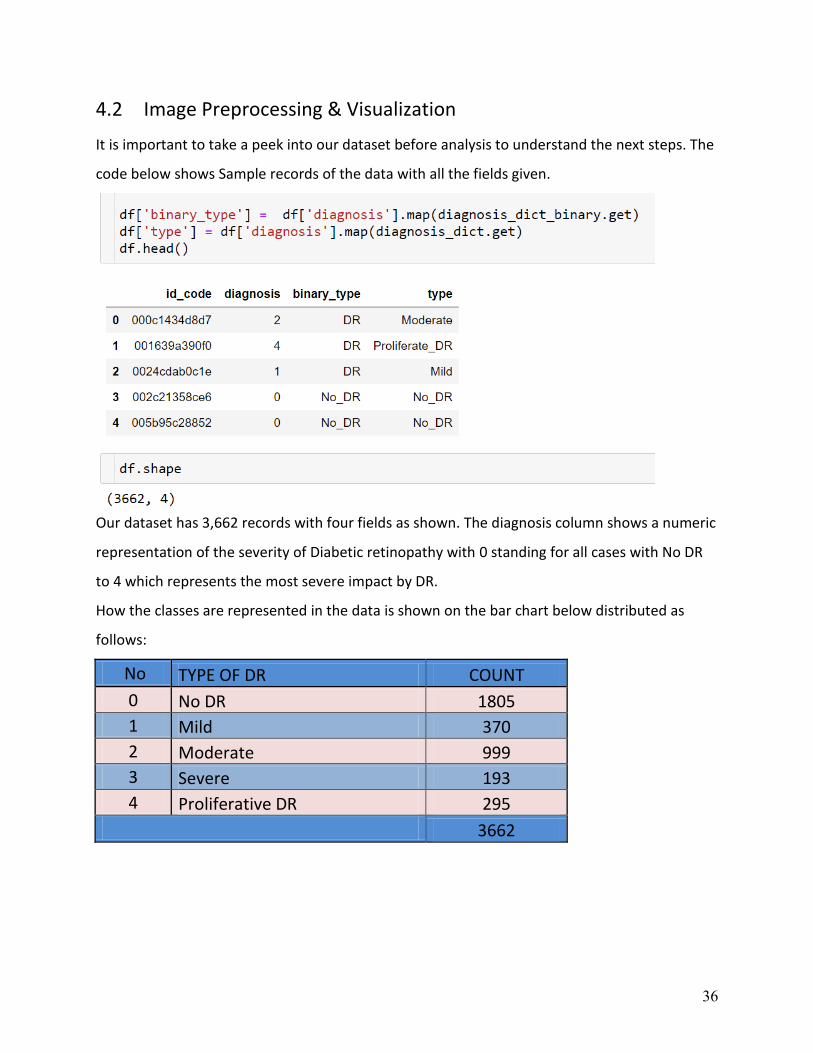
4.2 Image Preprocessing & Visualization
It is important to take a peek into our dataset before analysis to understand the next steps. The
code below shows Sample records of the data with all the fields given.
Our dataset has 3,662 records with four fields as shown. The diagnosis column shows a numeric
representation of the severity of Diabetic retinopathy with 0 standing for all cases with No DR
to 4 which represents the most severe impact by DR.
How the classes are represented in the data is shown on the bar chart below distributed as
follows:
No TYPE OF DR COUNT
0 No DR 1805
1 Mild 370
2 Moderate 999
3 Severe 193
4 Proliferative DR 295
3662

37
Graphical Distribution of Image Classes in Dataset
Imbalanced Data: In computer vision, the input to the model is a tensor representation of the pixels present in the image, therefore traditional methods and packages like SMOTE are not effective. We have about three options for a solution to imbalance:
1) Modify “class_weights” argument in model.fit() where we can make the model learn more from minority class, or
2) Reduce the size of the majority class through un-sampling, or 3) Write a function that generates more image data for the minority class and lastly 4) Accept the imbalance (from documentation, we see deep learning can cope with this as
long as we provide more data) The first two options are likely to distort our data and subsequently the results. Option three is more viable but requires a lot of trials to see which implementation of transformations adds value. Option (4) is implemented in Keras through the ImageDataGenerator method. Although this only grows our dataset and does not try to balance out the classes, it, however, provides enough features for the deep neural network to learn in an environment similar to real-world scenarios and still provides satisfactory results. We, therefore, use the ImageDataGenerator() function in Keras to generate new images from existing ones which in turn provide more images for analysis.

38
224 x 224 pixels: Image Size from our dataset
Sample Images in Color with labels given between 0 – 4 rating on the severity scale
39
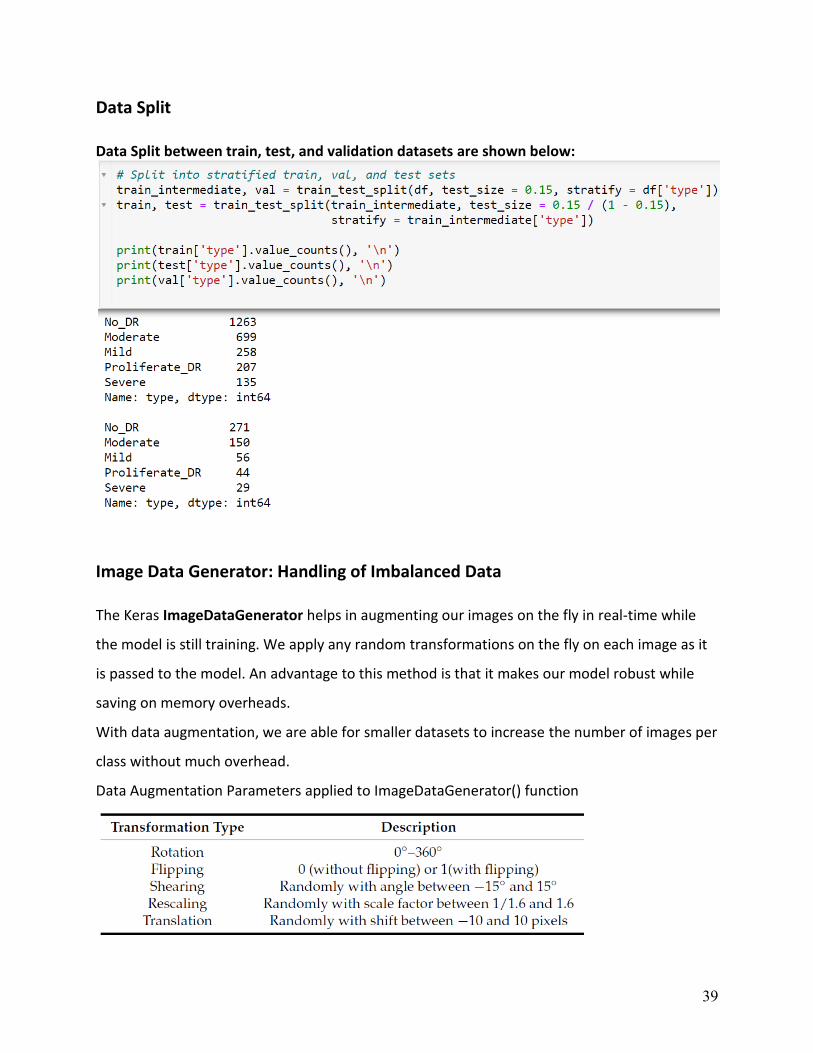
Data Split Data Split between train, test, and validation datasets are shown below:
Image Data Generator: Handling of Imbalanced Data The Keras ImageDataGenerator helps in augmenting our images on the fly in real-time while
the model is still training. We apply any random transformations on the fly on each image as it
is passed to the model. An advantage to this method is that it makes our model robust while
saving on memory overheads.
With data augmentation, we are able for smaller datasets to increase the number of images per
class without much overhead.
Data Augmentation Parameters applied to ImageDataGenerator() function

40
Image data augmentation is carried out to transform our data in preparation for our model to
learn and extract features.
Original Image Additional Image Created after Transformation
Through augmentation, we can achieve better performance with fewer data.
We use the Flow_from_directory() method that allows us to read images directly from the
directory path and augment them while the neural network model is learning on the training
data.
The Flow_from_directory() method works with images of different classes placed in different
folders but are within the parent folder:
Below is the code for execution

41
4.3 Modeling
Binary Classification of DR
Before we dive to the extend DR has affected an eye image, It is first important to understand
whether or not it has been affected. For this, we use a technique referred to as binary
classification. Irrespective of the extent of damage by DR, those images which show signs of DR
are labeled as “DR”, while those without labeled “No_DR”.
Observation Our two-class data classification appears balanced, which should be good for our Deep Neural Network.
CNN Model Architecture
Our model has three Convolutional layers and two fully connected layers. We then compile and
finally train it using the model .fit() method
Before we train the model using the model.fit() method, we compile it. During the compilation
stage, we optimize the learning rate, lr = 0.00001, and set the loss function to
BinaryCrossentropy and performance metric as “acc” = accuracy.
Training parameters include; the number of epochs = 12, and validation data = val_batches

42
A CNN Model
Results from running the above code

43
A graphical representation for the number of epochs ran plotted using Matplotlib library
We observe the relation between training and validation dataset after epoch 7, the validation
accuracy has improved above 86% while training accuracy is above 93%. Both plateau after
epoch 10.
When we evaluate against the test batches, we also obtain an impressive accuracy of 93% and
loss of 0.1812 which can reliably be translated that our model is robust enough to be used for
prediction.

44
Confusion Matrix Binary Classification

45
Multiclass Classification with EfficientNETB3 Sample of 5 Images for each category
Installing EfficientNET Pre-Trained Model To use the pre-trained EfficientNetB3 model weights, we install it using Python package Installer known as pip.
!pip install -U efficientnet
Then import it as follows and consequently used it as shown in the code below:
import efficientnet.keras as efn

46
We then build our Model Using EfficientNETB3
To execute, we call the build_model() as shown below.

47
Analysis Using Efficient NET

48
4.4 Hyper Parameter Tuning Load Weights
Split Dataset on an 80 / 20 ratio
Using the Quadratic Weighted Kappa Score From the above analysis, we record a Kappa value of 0.83 which well represents a well-
performing model. A weighted Kappa metric is used to calculate the amount of similarity
between predictions and actual values.
A Kappa score of 1.0 means both the prediction and actual values are equal. The closer the
value is to 1 the better. Generally, a Kappa score greater than 0.6 is considered to be a really
good score.
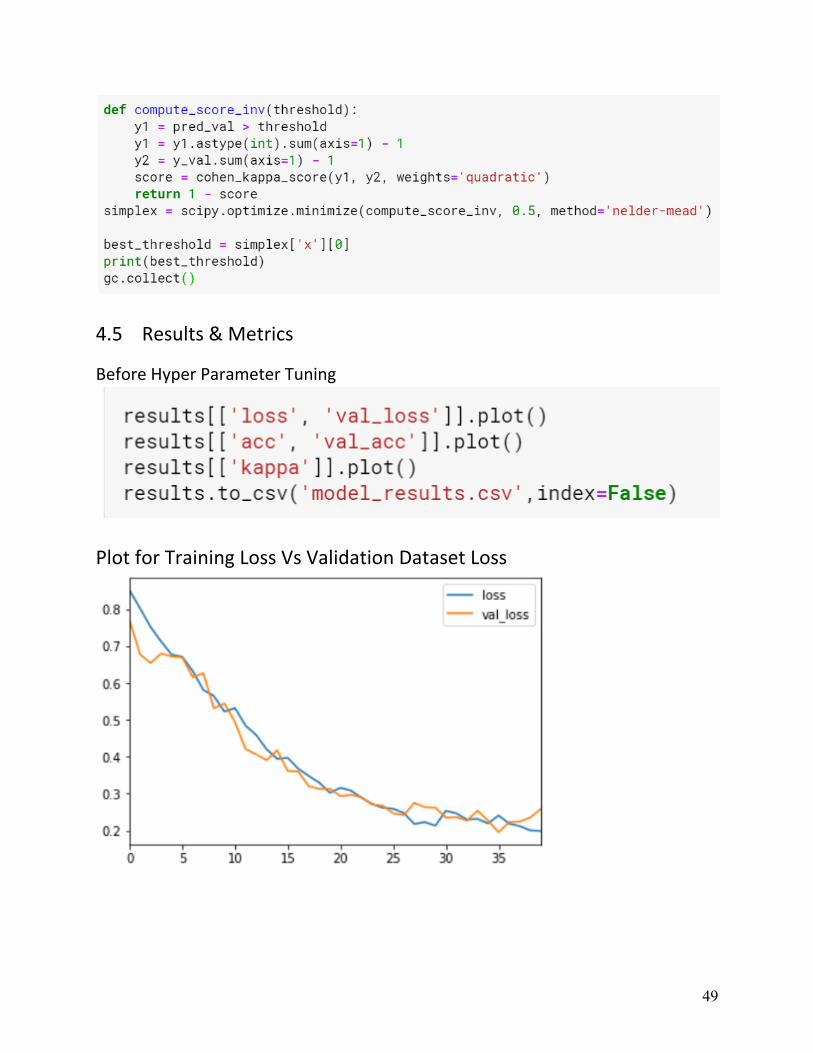
To calculate the best threshold for our model, we create a function and define parameters in it
before calling it.
49
4.5 Results & Metrics
Before Hyper Parameter Tuning
Plot for Training Loss Vs Validation Dataset Loss
50
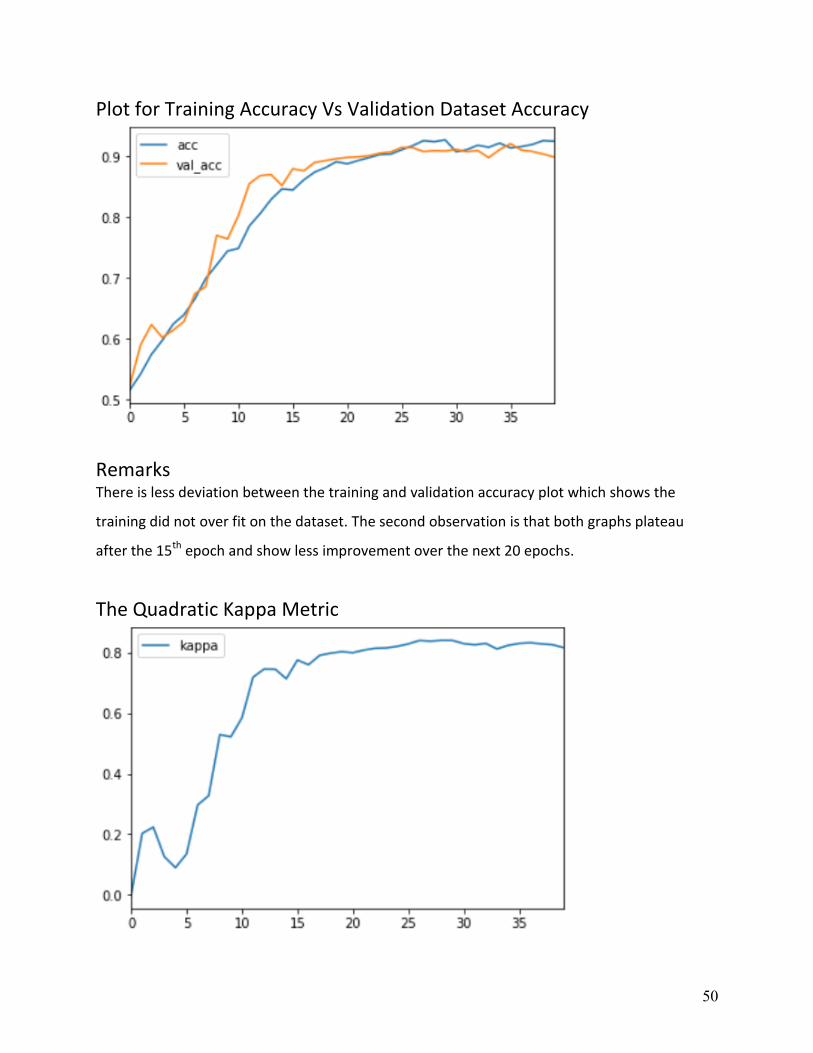
Plot for Training Accuracy Vs Validation Dataset Accuracy
Remarks There is less deviation between the training and validation accuracy plot which shows the
training did not over fit on the dataset. The second observation is that both graphs plateau
after the 15th epoch and show less improvement over the next 20 epochs.
The Quadratic Kappa Metric
51
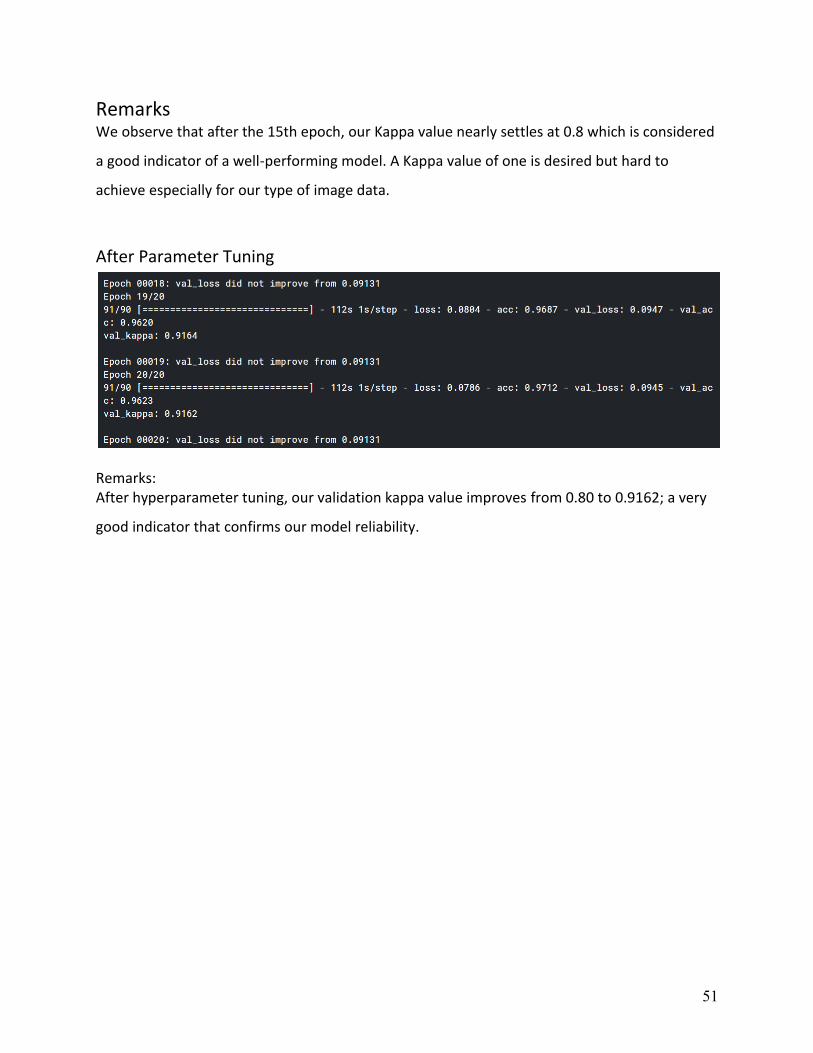
Remarks We observe that after the 15th epoch, our Kappa value nearly settles at 0.8 which is considered
a good indicator of a well-performing model. A Kappa value of one is desired but hard to
achieve especially for our type of image data.
After Parameter Tuning
Remarks: After hyperparameter tuning, our validation kappa value improves from 0.80 to 0.9162; a very
good indicator that confirms our model reliability.
52
Chapter 5 Conclusion
5.1 Conclusion Our model delivers performance as expected with a Training Accuracy of 96% versus Validation
Accuracy of 94%, with a loss of 0.1812 and a kappa value of 0.91. We leveraged on Transfer
Learning, using pre-trained model EfficientNetB3 which significantly improved our model
performance with low cost of execution completing in less than 3 hours.
For our web App integration, we can load images and perform predictions with a click of a
button to deliver the results. We managed to set up a functional proof of concept User
Interface using Flask and Tkinter.
To achieve a fully functional, secure platform for Diabetic Retinopathy mass screening, we need
to make our web app scalable, secure, and easily available to many users, and flexible enough
to be adapted to multiple devices.
The next step remains to complete the Mobile App to create a seamless operating
environment.

53
5.2 Recommendations After completing the design and implementation of our model, several lessons can be derived for future improvement of such end-to-end projects. We recommend the following:
- Use of pre-trained models to reduce the cost of running models on slow and outdated hardware,
- It is advisable to start with a Web App than a Mobile App for Proof of Concept, then move
to Mobile App,
- It is important to figure out and plan for robust image capture and image processing that
converts your captured images to a format that can easily be consumed for real-time
prediction. The operations include reducing the image size to recommended 224 x 224-
pixel size, transform your images using Gaussian blur to remove color channels,
- Another problem that is expected during real-time DR prediction will occur when an
image has more than a disease infection. Our model has not been trained on multiple
disease detection and therefore it is not known how our model will behave.
It is desirable to create an efficient data pipeline for image capture and DR detection using
state-of-the-art technology. This is expected to reduce running overheads while providing
better efficiencies and reliability.

54
5.3 Future Work The project implementation is partially complete but functional as proof of concept (PoC). The
next steps include a full implementation of all laid out requirements and testing before
deployment.
A summary of future work is detailed here:
- Development of Mobile App fully integrated with our trained model
- Work on reducing model installation file size while maintaining model performance to
improve loading times,
- Identify more versatile and easily available fundus image cameras for use together with
our system
- Develop a robust data pipeline for image dataset to lessen the development to PoC
cycle of researchers
More work needs to be done in developing Full Stack Data Science solutions and reduce the red
tape associated with large teams seeking to test ML concepts.
55
Bibliography (APA format)
Acharya, U. R., Mookiah, M. R. K., Koh, J. E. W., Tan, J. H., Bhandary, S. V., Rao, A. K., … Laude, A. (2017). Automated diabetic macular edema (DME) grading system using DWT, DCT Features, and maculopathy index. Computers in Biology and Medicine, 84(February), 59–68. https://doi.org/10.1016/j.compbiomed.2017.03.016
Bandello, F., Zarbin, M. A., Lattanzio, R., & Zucchiatti, I. (2014). Clinical Strategies in the Management of Diabetic Retinopathy. In Clinical Strategies in the Management of Diabetic Retinopathy. https://doi.org/10.1007/978-3-642-54503-0
Bourne, R. R. A., Taylor, H. R., Flaxman, S. R., Keeffe, J., Leasher, J., Naidoo, K., … Jonas, J. B. (2016). Number of people blind or visually impaired by glaucoma worldwide and in world regions 1990 - 2010: A meta-analysis. PLoS ONE, 11(10), 1–17. https://doi.org/10.1371/journal.pone.0162229
Chisha, Y., Terefe, W., Assefa, H., & Lakew, S. (2017). Prevalence and factors associated with diabetic retinopathy among diabetic patients at Arbaminch General Hospital, Ethiopia: Cross-sectional study. PLoS ONE, 12(3), 1–10. https://doi.org/10.1371/journal.pone.0171987
Cuadros, J., & Bresnick, G. (2017). Can Commercially Available Handheld Retinal Cameras Effectively Screen Diabetic Retinopathy? Journal of Diabetes Science and Technology, 11(1), 135–137. https://doi.org/10.1177/1932296816682033
Dashtbozorg, B., Zhang, J., Huang, F., & Romeny, B. M. T. H. (2018). Retinal Microaneurysms Detection Using Local Convergence Index Features. IEEE Transactions on Image Processing, 27(7), 3300–3315. https://doi.org/10.1109/TIP.2018.2815345
de la Torre, J., Valls, A., & Puig, D. (2019). A deep learning interpretable classifier for diabetic retinopathy disease grading. Neurocomputing, (). https://doi.org/10.1016/j.neucom.2018.07.102
Diabetic Retinopathy (resized) _ Kaggle. (n.d.).
EyePACS. (n.d.).
Global Prevalence and Major Risk Factors of Diabetic Retinopathy. (2012). 35. https://doi.org/10.2337/dc11-1909
Google, Verily using AI to screen for diabetic retinopathy in India _ Healthcare IT News. (n.d.).
Lee, R., Wong, T. Y., & Sabanayagam, C. (2015). Epidemiology of diabetic retinopathy, diabetic macular edema, and related vision loss. Eye and Vision, 2(1), 1–25. https://doi.org/10.1186/s40662-015-0026-2
Leeza, M., & Farooq, H. (2019). Detection of the severity level of diabetic retinopathy using Bag of features model. IET Computer Vision, 13(5), 523–530. https://doi.org/10.1049/iet-cvi.2018.5263

56
Raja, C., & Balaji, L. (2019). An Automatic Detection of Blood Vessel In Retinal Images Using Convolution Neural Network for Diabetic Retinopathy Detection. Pattern Recognition and Image Analysis, 29(3), 533–545. https://doi.org/10.1134/S1054661819030180
Rajalakshmi, R., Subashini, R., Anjana, R. M., & Mohan, V. (2018). Automated diabetic retinopathy detection in smartphone-based fundus photography using artificial intelligence. Eye (Basingstoke), 32(6), 1138–1144. https://doi.org/10.1038/s41433-018-0064-9
Safi, H., Safi, S., Hafezi-Moghadam, A., & Ahmadieh, H. (2018, September 1). Early detection of diabetic retinopathy. Survey of Ophthalmology, Vol. 63, pp. 601–608. https://doi.org/10.1016/j.survophthal.2018.04.003
Salamat, N., Missen, M. M. S., & Rashid, A. (2019, June 1). Diabetic retinopathy techniques in retinal images: A review. Artificial Intelligence in Medicine, Vol. 97, pp. 168–188. https://doi.org/10.1016/j.artmed.2018.10.009
Scanlon, P. H. (2019). Diabetic retinopathy. Medicine (United Kingdom), 47(2), 77–85. https://doi.org/10.1016/j.mpmed.2018.11.013
Stewart, M. W. (2017). Diabetic Retinopathy: Current Pharmacologic Treatment and Emerging Strategies. In Diabetic Retinopathy: Current Pharmacologic Treatment and Emerging Strategies. https://doi.org/10.1007/9789811035098
Tan, M., & Le, Q. V. (2019). EfficientNet : Rethinking Model Scaling for Convolutional Neural Networks.
Tufail, A., Rudisill, C., Egan, C., Kapetanakis, V. V, Salas-vega, S., Owen, C. G., … Rudnicka, A. R. (2016). Automated Diabetic Retinopathy Image Assessment Software Diagnostic Accuracy and Cost-Effectiveness Compared with Human Graders. Ophthalmology, 124(3), 343–351. https://doi.org/10.1016/j.ophtha.2016.11.014
Volk iNview _ iPhone Fundus Camera - Ophthalmic Cameras - Products. (n.d.).
Wilkinson, C. P., Ferris, F. L., Klein, R. E., Lee, P. P., Agardh, C. D., Davis, M., … Project, R. (2003). Proposed International Clinical Diabetic Retinopathy and Diabetic Macular Edema Disease Severity Scales. 6420(03), 1677–1682. https://doi.org/10.1016/S0161-6420(03)00475-5
Xu, K., Feng, D., & Mi, H. (2017). Deep convolutional neural network-based early automated detection of diabetic retinopathy using fundus image. Molecules, 22(12). https://doi.org/10.3390/molecules22122054
Zhang, Wei, Zhong, J., Yang, S., Gao, Z., Hu, J., Chen, Y., & Yi, Z. (2019). Automated identification and grading system of diabetic retinopathy using deep neural networks. Knowledge-Based Systems, 175, 12–25. https://doi.org/10.1016/j.knosys.2019.03.016
Zhang, Wenlan, Nicholas, P., Schuman, S. G., Allingham, M. J., Faridi, A., Suthar, T., … Prakalapakorn, S. G. (2017). Screening for Diabetic Retinopathy Using a Portable, Noncontact, Nonmydriatic Handheld Retinal Camera. https://doi.org/10.1177/1932296816658902

57
Appendix
Image Classification Deployment with Flask
A Django / Flask App Structure

58
Creating the Flask Web Application Image Upload (homepage.html) File

59

60

61
Upload.js File

62
Style.css File
63
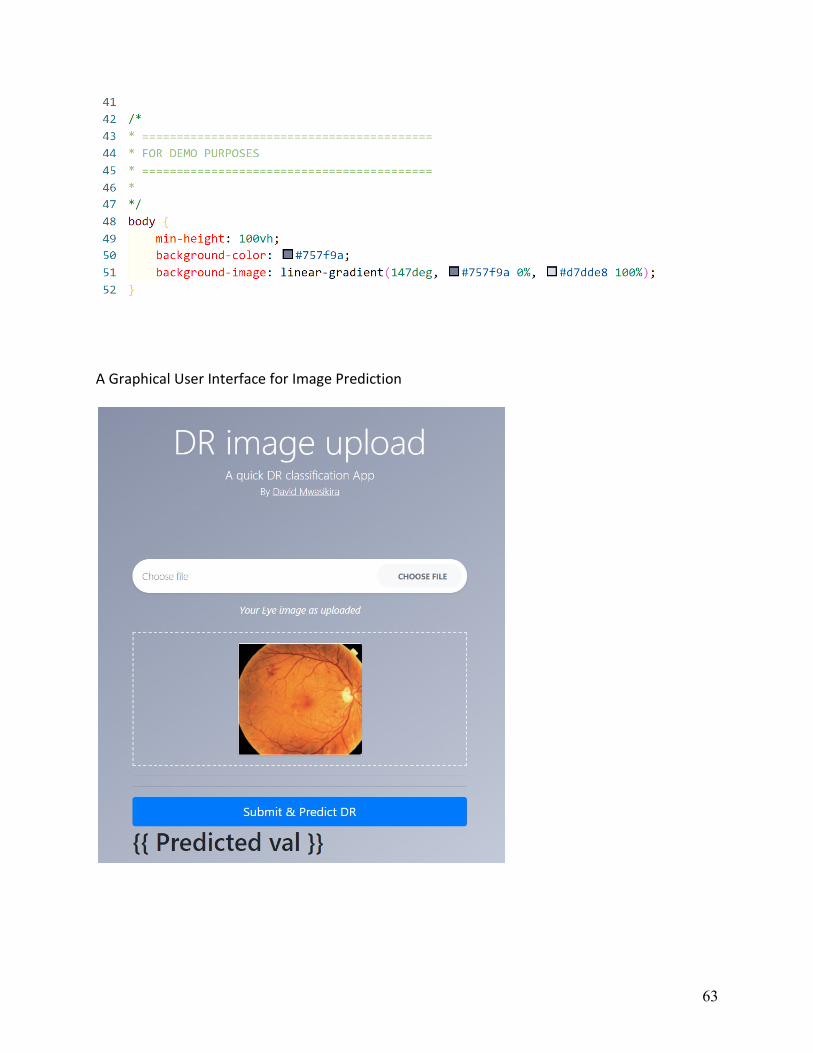
A Graphical User Interface for Image Prediction

64
Install Django /Flask, Keras & TensorFlow
Note: Keras uses the Numpy python library for image processing into an array.
Settings.py File

65
Model Loading / Classification in “predict_dr.py” file Predict_dr.py

66
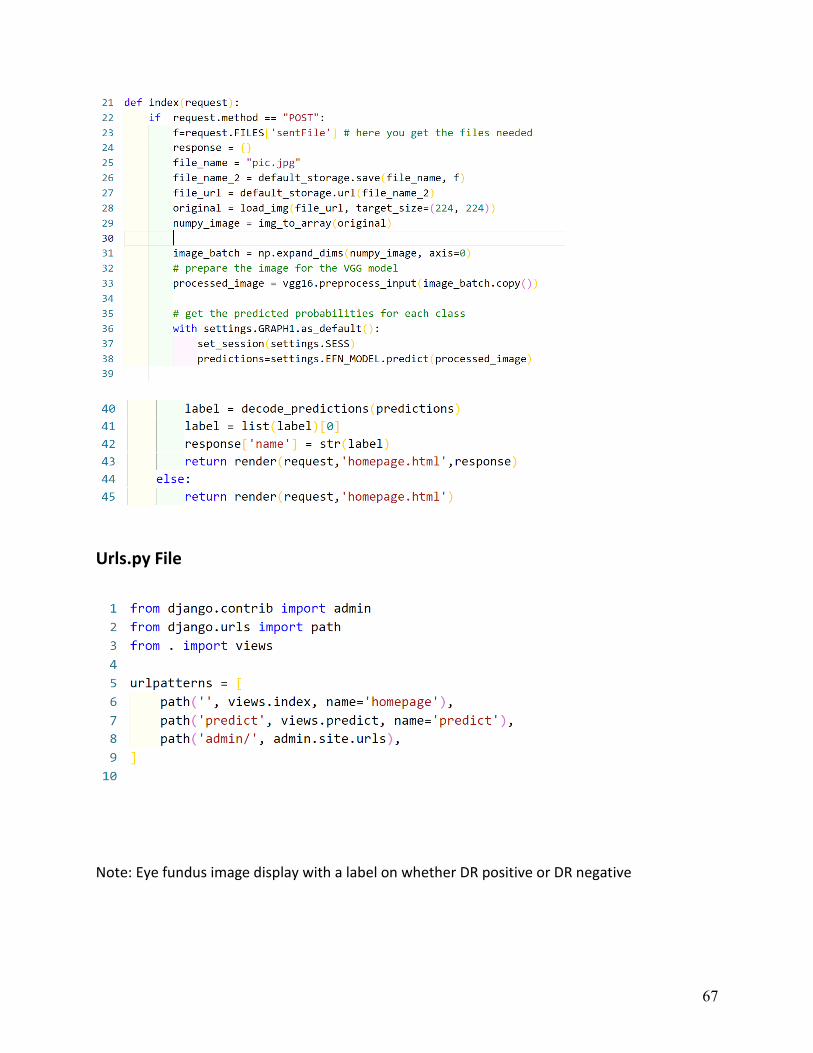
Results Display with “views.py” file
67
Urls.py File
Note: Eye fundus image display with a label on whether DR positive or DR negative