development of a management tool to support optimization...
TRANSCRIPT

International Mine Water Association Annual Conference 2012
McCullough, Lund and Wyse (Editors) | 115
Development of a management tool to support optimization of the beneficial reuse of associated or produced water in eastern Australia
Ryan T. Jakubowski1, Nathan W. Haws2, David A. Ellerbroek3, John Murtagh4, and David Macfarlane5
1MWH, United States, [email protected] 2MWH, United States, [email protected] 3MWH, United States, [email protected] 4Lansci Management, Australia, [email protected] 5Santos GLNG Sustainability, Australia, [email protected]
Abstract This paper presents an infiltration and salinity transport model (ISTM) that was developed to support optimization of the beneficial use of coal seam gas (CSG) water, after treatment and blending, to irrigate forage crops in eastern Australia. The ISTM was used to evaluate the fate and transport of the irrigation water as it migrates through the shallow soils and bedrock vadose zone toward the saturated zone beneath three agricultural plots with different soil types. The model simulation results were used to manage irrigation activities in a manner that can maximize water use in the readily available soil water capacity range for these agroecosystems without detrimental impacts to plant growth or surface water/groundwater resources. First, a practical irrigation and rainfall, systems driven hydrogeochemical conceptual model, is presented to identify processes that are likely to govern infiltration from the land surface, root water uptake, and solute transport into and potentially through the unsaturated zone and potentially to the saturated zone. Second, a numerical model is parameterized to represent the primary processes hypothesized to affect water and salinity movement in the unsaturated zone. Third, a series of simulations are conducted to identify the key parameters and processes governing the potential movement of water and salt through the root zone and into the bedrock vadose zone. The results of the ISTM model simulations can be used to develop the most appropriate model approaches for sustainably managing the large volume of associated/produced water while providing a net economic benefit to local communities.
Keywords coal seam gas (coal bed methane), associated water (produced water), infiltration, salt transport, sodic soils, beneficial use
Introduction In eastern Queensland, coal seam gas (CSG) well fields are being permitted to facilitate the development of Australia’s abundant (unconventional) natural gas resources. As a byproduct of CSG production, significant volumes of CSG water that have varying levels of sodicity and salinity, dominated by sodium, bicarbonate, and significant chloride, will be produced. The Queensland CSG industry expects to produce an average 95 to 98 gigaliters (GL) of CSG water per year. Santos GLNG expects to produce 340 GL of CSG water at its Queensland operations and provide up to 240 GL of treated/blended CSG water (with an expected mean electrical conductivity of 940 to 990 microsiemens per centimeter) and up to 70 GL high-quality reverse osmosis permeate for managed aquifer recharge. To sustainably
International Mine Water Association Annual Conference 2012
116 | McCullough, Lund and Wyse (Editors)
manage the large volume of CSG water (formerly known as associated or produced water), CSG water can be treated, blended, and would supplement pastoral/agricultural production provided that it does not negatively impact forest, pasture, or annual/perennial crop production, or exceed surface water/groundwater quality and irrigated system irrigation water quality and irrigated soil system regulatory conditions and standards as defined in a general or specific beneficial use approval (BUA). The data that informs this paper is derived from the industry’s first specific CSG water irrigation BUA issued by the Queensland Environmental Protection Agency (EPA)1
Santos GLNG irrigation management procedures focus on actively irrigated zones or microsites surrounded by non-irrigated buffers of dryland pasture and deep rooted tree vegetation. Ensuring optimum nutrition, width, organic matter, and freedom from compaction, complementary rooting depths of buffer species are essential to buffer runon and shallow sub-surface lateral soil water movement receptivity. The irrigated zone plus the non-irrigated buffer forms the irrigation management unit within a micro-catchment. Regulatory compliance with respect to an irrigation system impacting runoff quantity and salinity is assessed at the micro-catchment and sub-catchment levels. The purpose of this paper is to present an infiltration and salinity transport model (ISTM) that was developed to evaluate the fate and transport of treated/blended CSG water that is applied as irrigation as it migrates through the soils and bedrock vadose zone toward the saturated zone. The primary objective of the model was to evaluate whether irrigation activities can be managed to maximize water use without detrimental impacts to plant growth or surface water/groundwater resources. To illustrate key processes and parameters affecting water and salinity movement, we present model results for three contrasting agricultural plots: the first site has a low infiltration capacity (LIC), the second site has a moderate infiltration capacity (MIC), and the third site has a high infiltration capacity (HIC). The LIC, MIC, and HIC sites were based on three soil types using data provided by Santos GLNG consultant MWH, which has conducted irrigation system feasibility studies on the Santos properties Springwater and Waddy Brae during 2010 as part of the 2,400 hectare (ha) Fairview Irrigation Project which involves 1,300 ha Chinchilla White Gum forest plantations and 1,100 ha of perennial pastures including non-irrigated buffers. The hydraulic properties of the material layers at these sites were based on surrogate soils since site-specific measurements were lacking, and the depth to the base of the vadose zone and water table was based on interpolation of a detailed assessment of eight stratigraphic cores to the Precipice Sandstone Aquifer
. Water used as irrigation supply will be treated and blended with other water sources to produce an electrical conductivity (EC) of about 3.5 decisiemens per meter (dS/m) or less (3,500 microsiemens per centimeter) and a sodium adsorption ratio (SAR) of about 27 or less to meet current regulatory limits imposed by the Queensland Department of Environment and Resource Management.
1The sequence of Queensland Government environmental regulatory administering authorities since EPA has been the Department of Environment and Resource Management then the Department of Environment and Heritage Protection.

International Mine Water Association Annual Conference 2012
McCullough, Lund and Wyse (Editors) | 117
covering the Fairview Irrigation Project plateau areas and surrounding dryland grazing and remnant vegetation areas.
Conceptual Model Inputs of water and salinity to the subsurface are derived from CSG irrigation water and precipitation. As irrigation (I) and precipitation (P) enter the soil surface, water can infiltrate or be removed as zonal or microsite runoff (R) if the application/precipitation rate exceeds the infiltration capacity of the soil. Within the root zone, plants uptake pore water via transpiration (ET), thereby reducing downward drainage (D). Water uptake by roots also concentrates salts within the soil profile. Water and salt movement within the root zone is anticipated to occur predominantly in the vertical direction because horizontal gradients are small and flow within the root zone is primarily driven by gravity and transpiration. Moreover, the potential for significant lateral movement at the base of the root zone or within the bedrock vadose zone is not supported by subsurface hydrogeological investigations for the LIC, MIC, and HIC sites (URS 2010). Therefore, the conceptual model considers one-dimensional vertical flow and transport: percolation that migrates past the terminal rooting depth will flow downward under gravity and recharge the bedrock. The conceptual model is supported by 3.5 years of Sentek capacitance probe monitoring of water and salinity movement at other instrumented locations, which has identified predominately downward movement of water, and occasionally upward movement, at night when ET is insignificant. For these irrigated agroecosystems, a limited amount of D has occurred in response to precipitation events.
Irrigation managers seeking to maximize the beneficial utilization of CSG water need to ensure that applications limit salt concentrations within significant proportions of the root zone such that water use potential is not restricted. The selection of salinity tolerant species, already in use in local agriculture plots, can restrict osmotic stress in the agroecosystem irrigated with blended/treated CSG water. For median climatic conditions, roughly 65% to 70% of the annual precipitation occurs between October and April when median soil moisture deficits and irrigation potential are greatest. In contrast, there are fewer irrigation opportunities between May and August when median soil moisture deficits are less and the potential for deep drainage can be high due to reductions in ET. For a given agroecosystem irrigated with blended/treated CSG water that contains component soils and crop species with characteristics rooting architecture, in addition to distinct pre-irrigation native salinity profiles, the dominant factors affecting percolation and leaching of native and introduced salts within the soil are: (i) potential root water uptake which is controlled by the potential transpiration rate and differences in root depth and root distribution; (ii) actual root water uptake which is predominately controlled by the readily available water capacity for the current root volume, and by salinity in the root zone when conditions arise in which osmotic stress factors restrict water uptake by plants for the salt tolerant species; and (iii) percolation of water and soluble salts through structurally and hydraulically diverse horizons of the soil root zone and underlying regolith.

International Mine Water Association Annual Conference 2012
118 | McCullough, Lund and Wyse (Editors)
Methodology Program Selection, Domain & Grid Spacing. The finite element computer code HYDRUS-1D (Simunek et al. 2008) was used to simulate water flow and salt transport within the subsurface. HYDRUS was selected because it is capable of simulating the dominant processes affecting infiltration and salinity transport for variably saturated conditions in an agricultural setting (e.g. Gonclaves et al. 2006). Furthermore, in a scoping study completed for the Australian National Program for Sustainable Irrigation, Raine et al. (2005) noted that HYDRUS is increasingly becoming a standard tool for modelling variably saturated flow in porous media and for use in predicting water flow, root water uptake processes, and solute transport for precision irrigation systems, while also acknowledging the mismatch between the data requirements for complex simulation models and the data that are easily available from soil surveys and routine soil analyses. While other numerical models could have been selected, HYDRUS was chosen for this study because it has been used successfully in simulating irrigation effects at other agroecosystems (Simunek and Suarez 1997, Gonclaves et al. 2006, Ramos et al. 2011).
HYDRUS solves the Richards’ Equation for transient water flow and the Advection-Dispersion Equation for solute transport for heterogeneous soil profiles. The three agricultural sites and corresponding model domains varied in thickness and material layering based on site-specific profiles tabulated by Lansci (2011a,b) that were established through test pitting completed by SSM (2011) and MWH (2011). As shown in Figure 1, the LIC site was modeled without including the bedrock beneath the root zone (decoupled model) and with the bedrock layer extending to the water table (coupled model). The MIC and HIC sites were modeled with a domain that coupled the root zone with a thin bedrock zone. Node spacing varied from a minimum of 1 millimeter (mm) at the soil surface to a maximum of 10 mm deeper in the model domain.
Figure 1 Conceptual model of the water budget, material layering, and material
thicknesses for the three agricultural plots (not to scale).
Irrigation, Vegetation & Root Water Uptake. The irrigation schedule and salinity of the irrigation water specified in the model was based on operator input. The LIC model simulations allocated between 1 and 4 megaliters per hectare per year (ML/ha/yr) for 5 years. The EC of precipitation was equal to 0.01 dS/m based on
P & I
Soil 1: 0.5 m
HICSite
Soil 2: 0.5 mSoil 3: 1.1 m
Bedrock: 0.1 m
Soil 1: 0.5 m
MICSite
Soil 2: 0.5 mSoil 3: 0.56 m
Bedrock: 0.1 m
Soil 1: 0.22 m
Decoupled Model
Soil 2: 0.22 mSoil 3: 0.22 m
Bedrock: 78.8 m
Soil 4: 0.22 m
Soil 5: 0.32 m
ET
D
RLICSite
CoupledModel

International Mine Water Association Annual Conference 2012
McCullough, Lund and Wyse (Editors) | 119
data presented by Biggs (2006), while the EC of irrigation water was equal to 2.8 dS/m. The MIC and HIC model simulations allocated between 3 and 4 ML/ha/yr from years 0 and 5 and from years 7 to 13 with no irrigation between years 6 and 7. The EC of irrigation water was equal to either 3.4 dS/m (years 0 through 5) or 2.3 dS/m (years 7 through 13).
A uniform irrigation depth was applied to the soil surface when a soil deficit threshold was reached providing that no precipitation occurred on the same day, the soil had not been irrigated in the two previous days, and the annual irrigation allocation had not been met: these criteria were established to minimize the potential for irrigation to impact zonal or microsite runoff. No allowance was permitted for imminent (future) significant rainfall, but in practice irrigation can be deferred to further minimize the potential of irrigated agroecosystems impacting zonal or microsite and micro-catchment runoff through real-time integration of soil moisture deficit data and forecasted weather conditions. For the LIC site, 10 mm of irrigation was applied when the soil deficit exceed 25 mm; and for the MIC/HIC sites, 25 mm of irrigation was applied when the soil deficit exceeded 35 mm. Irrigation water was applied directly to the soil surface at 100% efficiency, which assumes the use of solid set sprinklers or center pivot irrigation and no storage of water within the canopy. In commercial reality, irrigation efficiencies of 85% generally are assumed. At the surface, water was allowed to pond to a maximum depth of 5 mm before zonal or microsite was initiated. Irrigation applications began October 1 of each year and continued until the annual irrigation allocation was exhausted. In a median climatic year, irrigation allocations were exhausted by winter.
The simulations were conducted for plots vegetated with Buffel Grass (Cenchrus ciliaris) and Leucaena (Leucaena leucocephala). The percent vegetative cover was equal to 100% and the maximum rooting depth for Buffel Grass and Leucaena (0.9 and 2 m, respectively) was based on literature values for these species in similar edaphic environments; however, in deeper soil profiles, well-established Buffel Grass has been recorded to reach 1.3 m and Leucaena between 5 and 6 m. In some instances, simulated root distributions for some soil profiles were constrained by the presence of bedrock. The root distribution had a maximum density at 0.3 m and then decreased nonlinearly with depth.
A reduction in root water uptake due to salinity stress was based on an additive approach and simulated by converting the EC of pore water within the root zone (ECpw) to an equivalent osmotic head, based on a conversion factor suggested by Maas (1990). The osmotic head is then added to the pressure head to obtain an effective soil water pressure head, which is then used within the root water uptake reduction model to simulate stressed conditions and reduced evapotranspirative fluxes. Water stress was defined using the Feddes function (Feddes et al. 1978) assuming non-compensated conditions. As a simplification, both species were assumed to have the same root water uptake stress response function. Root growth or decay as a function of water or salinity stress was not modelled, and the root density distribution and depths were kept constant in time. Agricultural salinity thresholds are generally expressed as the EC of a saturated paste extract (ECe), and literature based thresholds for Buffel Grass and Leucaena are 5.5 and

International Mine Water Association Annual Conference 2012
120 | McCullough, Lund and Wyse (Editors)
4.5 dS/m, respectively. Generally, ECpw at field capacity can be assumed to equal a concentration that is a factor of two higher than ECe (Tanji and Kielen 2002). Simulated values of ECpw are compared to the threshold values to determine whether crop production could be significantly affected.
Initial & Boundary Conditions. Initial conditions within the subsurface were established by running a pre-irrigation simulation. Baseline salinity in the soil profiles were either given a small value based on measured values or assumed to equal zero. An atmospheric boundary condition was applied to the upper boundary of the model to simulate I, P, and potential evapotranspiration (PET). A unit gradient boundary condition was applied to the lower model boundary for the MIC, HIC, and LIC decoupled model, and a zero pressure head condition, corresponding to the water table surface, was applied to the lower boundary of the LIC coupled model. The P dataset included daily measurements from a 71-year daily record compiled from the Australian Bureau of Meteorology and concatenated by Lansci (2011a, b). The mean annual amount of P is approximately 610 mm. The mean wet season P (October through April) is approximately 469 mm while the mean dry season P (July through September) is approximately 72 mm. The daily PET dataset was based on mean pan evaporation measured at the Brigalow Research Station. Pan evaporation rates were adjusted to calculate an effective PET rate by applying various pan, cropping, wintering, and aerodynamic coefficients compiled by Lansci (2011a,b). The mean annual amount of PET during irrigation was equal to approximately 1,309 mm for Leucaena and 1,185 mm for Buffel Grass (Lansci 2011a,b), while the mean annual amount of PET post-irrigation was equal to approximately 1,113 mm for Leucaena and 1,007 mm for Buffel Grass.
Material Properties. The parameters used to describe the water retention and hydraulic conductivity functions include the residual water content (θr), saturated water content (θs), saturated hydraulic conductivity in the vertical direction (Ks), and the empirical fitting parameters (n, α, and l) for the van Genuchten-Mualem functions. The parameter values implemented in the numerical models were based on pedotransfer functions that were constrained by typical field capacity and wilting point water contents for these soils (Lansci 2011a,b). For the soil layers, θr varied between 0.04 and 0.017, θs varied between 0.17 and 0.46, α varied between 0.81 and 2.67 m-1, and n varied between 1.26 and 1.46. The value for l was equal to 0.5. For the bedrock, the values for θr, θs, α, n, and l were equal to 0.06, 0.175, 0.27 m-1, 1.51, and -3.4 (Golder 2011). The Ks of the soil layers varied between 1 and 45 millimeters per day (mm/d) for the LIC site, 15 and 120 mm/d for the MIC site, and was 120 mm/d for the HIC site. The Ks of the bedrock was equal to 432 mm/d for the LIC site and either 1 or 432 mm/d for the MIC/HIC sites depending on the scenario. For the LIC and HIC sites the potential effects of pore water salinity/sodicity on the soil hydraulic conductivities were not simulated as a first-step simplification. However, for the MIC site, as explained below, the impact of permeability reductions from irrigating with highly saline/sodic water on the hydraulic conductivity was evaluated to test the validity of these simplifications. To support generalized solute (EC) and major ion transport (Ca, Mg, Na, K, Alkalinity, Cl, SO4) hydrodynamic dispersion was modelled with a diffusion

International Mine Water Association Annual Conference 2012
McCullough, Lund and Wyse (Editors) | 121
coefficient equal to 7x10⁻⁵ square meters per day (m2/d) and a dispersivity equal to 0.16 m.
Sensitivity Analyses. Sensitivity analyses were completed as a phased approach. The first phase consisted of parameterization for the LIC site to evaluate many of the soil, plant, and climatic parameters (Table 1).
Table 1. Rational for parameter value adjustments incorporated into the sensitivity analysis for the LIC site.
Parameter Effect Rationale
Internal System Parameters
Saturated hydraulic conductivity
Controls the infiltration rate and the rate at which water can flow through the soil profile (Ks).
The high Ks value (90 mm/d) is ~2.5 times higher than the base Ks for Layers 1 and 2. Therefore, Ks values were increased and decreased by 2.5 times.
Saturated hydraulic conductivity (layer 4)
Controls water flow into the bedrock and root zone salt leaching potential (Ks).
Layer 4 has the lowest Ks value. The Ks in Layer 4 is tested by matching it to the Layer 3 Ks value.
Volumetric water content (VWC) at field capacity (FC)
Influences the soil-water characteristic functions (α,n).
The VWC at FC was adjusted ~10% by changing the values of α and n so that the soil water characteristic functions matched the new FC.
Pressure head range for root water uptake near saturation
Controls the ability of plants to uptake water when soils are near saturation (P0,Popt).
Base values equal to those given for wheat. Adjusted value for P0 to value given for pasture. Adjusted value for Popt to be intermediate.
Pressure head range for optimal root water uptake at the potential rate
Controls the range of soil tension at which roots can uptake water at the maximum rate (h2L,h2H).
Base values equal to those given for grass. The high value equal to those for alfalfa and the low value equal to those for turfgrass.
External System Controls (Boundary Conditions)
Precipitation Controls the amount of water that can enter the soil (P).
The 5-year period producing the mean deep drainage, from a long-term simulation, represented the base case during the irrigation period. The 5-year period producing the 90th and 10th percentile deep drainage represented upper and lower bounds.
Potential evapotranspiration
Defines the potential amount of root water uptake (PET).
Base values were increased and decreased by 10% to evaluate affects because of the uncertainty in the estimated values.
These simulations were completed to determine a range of outcomes for use in evaluating water and salinity transport into the bedrock vadose zone. With one

International Mine Water Association Annual Conference 2012
122 | McCullough, Lund and Wyse (Editors)
exception, all LIC model simulations used the effective pressure head in the root water uptake reduction function by incorporating the influence from osmotic potentials (salt stress). Additionally for the LIC site, the sensitivity of coupling the root and bedrock vadose zones was simulated to assess effects from artificially imposing a boundary condition at the soil/bedrock interface (fig. 1). The second phase consisted of parameterization for the MIC/HIC sites to evaluate the effects of using the effective pressure head in the root water uptake reduction function (salinity stress) and the Ks values for the bedrock for these more permeable soils. The following simulation sets were run for this analysis: (i) including the effects of salinity stress on root water uptake and neglecting these effects and (ii) bedrock Ks values of 1 mm/d and 432 mm/d. The third phase consisted of parameterization for the MIC site to evaluate potential affects from irrigating with highly saline/sodic water on the hydraulic conductivity for the soils. The results of these sensitivity analyses can be used to bracket potential risk regarding the proposed irrigation schemes.
Major Ion Transport. Water and salt that enters the soil surface are transported conservatively through the soil profile for the simulations that only considered generalized solute transport (EC) in HYDRUS. But, as explained previously, a subset of the model simulations and sensitivity analyses completed for the MIC site were structured to evaluate impacts to the water balance as a result of simulating major ion (Ca, Mg, Na, K, Alkalinity, Cl, and SO4) and reactive transport (ion exchange) processes in UNSATCHEM. Generally speaking, the accumulation of monovalent cations, such as sodium and potassium, or the use of high-quality (low ionic strength) water, often leads to clay dispersion or swelling. These processes can significantly affect the hydraulic properties, including reducing the hydraulic conductivity (infiltration capacity) and soil water retention as a result of swelling and clay dispersion. These processes were modeled using the major ion chemistry module UNSATCHEM included within HYDRUS. In UNSATCHEM, reductions in hydraulic conductivity of the material layers are computed through scaling functions that account for spatiotemporal variations in subsurface pH, SAR, and total salt concentration (C0) assuming a diffuse double layer based on a generalized clay-swelling model (Simunek and Suarez 1997). The scaling functions were based on experimental work completed on illitic soils in California (McNeal 1968, Suarez et al. 1984), and the model assumes a weight fraction of montmorillonite equal to 0.1, which may not be suitable for the Australian grey kurosol soils for the MIC site. Also, hydraulic effects from the clay-swelling model were derived from data representing saturated conditions, and the same reduction factors are used for unsaturated conditions. While this approach is useful as a qualitative estimate, interpolation to the entire range of pressure heads from saturated conditions has not been verified empirically.
For these scenarios, the initial pore water concentrations were estimated to represent dilute aqueous solutions for the various material layers. The concentrations for Ca, Mg, Na, K, and Cl were generally based on data presented in Ramos et al. (2011) since site-specific data were lacking, while concentrations for SO4 were assumed to be minimal and concentrations for Alkalinity were meant to reproduce subsurface trends in pore water pH. Analyte concentrations for precipitation were based on data presented in Biggs et al. (2006) while analyte

International Mine Water Association Annual Conference 2012
McCullough, Lund and Wyse (Editors) | 123
concentrations for the irrigation water were based on operator input and charge balance constraints. Overall, the irrigation water had Ca, Na, Alkalinity, and SO4 around 3.6, 34.1, 4.1, and 22.4 millimole of charge per liter (mmol(c)/L), respectively, a pH of 6.1 or 6.6, and a SAR around 25 mmol(c)0.5/L0.5. The initial adsorbed concentrations for Ca, Mg, Na, and K were based on measurements reported by SSM (2011) for these soils, resulting in a cation exchange capacity (CEC) that ranged between 64 and 174 millimole of charge per kilogram (mmol(c)/kg). The exchangeable sodium percentage (ESP) ranged between 4 and 28%. Initial concentrations of minerals such as calcite and gypsum in the material layers were assumed to equal zero since site-specific data were lacking, but were allowed to precipitate based on equilibrium constraints. Aqueous complexation reactions were based on mass action equations, while ion exchange reactions were described by the Gapon equation. Gapon selectivity coefficients were based on data presented by Ramos et al. (2011). Finally, the dry bulk density of the material layers was assumed to equal 2,000 kilograms per cubic meter (kg/m3) based on data presented by SSM (2011); while the soil density appears to be too high for these soils the value was not changed as a simplification and because the calculated porosity (~25%) is comparable to the upper end of the saturated water content derived from the pedotransfer functions for the MIC site (24%).
The production of carbon dioxide gas (CO2(g)) from root biomass, and CO2(g)
transport, was ignored as a first step simplification because the production terms are strongly dependent on temperature (i.e. low production values in winter and large production values in summer) which necessitate simulating heat transport. The production of CO2(g) would act to lower pore water pH, such that excluding gas production could act to overestimate the reduction in K because at a pH greater than or equal to 6.83 the mineral surface charge becomes more negative. At a pH less than 6.83 there is no reduction in K based on the swelling model incorporated into UNSATCHEM.
Results LIC Site. The results of the root zone sensitivity analysis for the LIC site are shown in Figure 2, while the results of the model domain sensitivity analysis are shown in Figure 3. The model simulations for the LIC site under Leucaena (2 ML/ha/yr) are the most sensitive to the Ks of the soils, especially for the soil layer with the lowest hydraulic conductivity (fig. 2). Within the soil profile, the fourth model layer had the lowest hydraulic conductivity, about one order of magnitude lower than the other soil layers, and therefore significantly restricted water flow into the bedrock vadose zone and salt leaching potential within the root zone. Therefore, these observations demonstrate that a low permeability layer within the soils can control water and salt transport within the entire root zone. The root zone salinity concentrations also show sensitivity to the rate of P and PET as salts are flushed from the root zone in wet years and concentrated in the root zone during dry years; but for the LIC site, the Ks value of the soil exerted the primary control on salt accumulation. Similar trends were also observed under Buffel Grass (results not plotted). Overall, the amount of deep drainage and root zone salinity are the least sensitive to the Feddes function parameters that define the pressure head range for root water uptake near saturation (results not plotted) and the pressure

International Mine Water Association Annual Conference 2012
124 | McCullough, Lund and Wyse (Editors)
head range for optimal uptake at the potential rate. For these low permeable soils, the results show little sensitivity to the exclusion of salt stress.
The results of the sensitivity analysis illustrate an inverse relationship between water flow and mean salinity concentrations within the root zone: increased deep drainage generally corresponds to decreased salinity concentrations (fig. 2); however, large increases in deep drainage do not necessarily correspond to large decreases in the mean root zone salt concentrations. For example, an increase in the Ks for the fourth model layer increased the 5-year mean deep drainage about tenfold to 22 mm/yr, but only decreased mean salt concentrations in the root zone from the base case scenario by about 15% (1.2 dS/m). The differences in mean salt concentrations within the root zone become more pronounced when averaged over long timeframes: the simulated 5-yr mean bottom flux and root zone salinity were 2.1 mm/yr and 9.7 dS/m, while the 10-yr mean values were 3.1 mm/yr and 8.3 dS/m, respectively.
Figure 2 Sensitivity of the simulated mean deep drainage rate into the bedrock (left) and mean root zone salinity (right) for the LIC site under Leucaena (2 ML/ha/yr)
relative to the base case simulation. The results of the sensitivity analysis for the coupled and decoupled models for the LIC site under Buffel Grass (2 ML/ha/yr) illustrate the influence from artificially imposing a boundary condition at the soil/bedrock interface (fig. 3). After 10 years the mean root zone salinity is about 7.5 and 6 dS/m for the decoupled and coupled models, respectively. After 17 years, continued infiltration of precipitation subsequently leaches accumulated salts, thereby reducing the mean root zone salinity to about 6 and 4 dS/m for the decoupled and coupled models. A more pronounced difference is observed for the mean salinity entering the bedrock at 1.2 m as noted by the approximate 30% decrease (4.5 dS/m) in maximum salt concentrations that were simulated using the coupled model.
-5
0
5
10
15
20
25
KsHigh(All)
KsLow(All)
KsHigh(4)
FCHigh
FCLow
H2h,H2lHigh
H2h,H2lLow
PETHigh
PETLow
PHigh
PLow
NoSalt
Stress
Cha
nge
from
Bas
e Fl
ux (
mm
/yr)
5-yr Mean Bottom Flux10-yr Mean Bottom Flux
-3
-2
-1
0
1
2
3
KsHigh(All)
KsLow(All)
KsHigh(4)
FCHigh
FCLow
H2h,H2lHigh
H2h,H2lLow
PETHigh
PETLow
PHigh
PLow
NoSalt
Stress
Cha
nge
from
Bas
e C
once
ntra
tion
(dS/
m)
5-yr Mean ECpw10-yr Mean ECpw

International Mine Water Association Annual Conference 2012
McCullough, Lund and Wyse (Editors) | 125
Figure 3 Sensitivity of the simulated mean root zone salinity (left) and mean deep drainage salinity (right) between the coupled and decoupled modes for the LIC site
base case scenario under Buffel Grass (2 ML/ha/yr).
The decoupled model predicts a slightly lower deep drainage flux than the coupled model because the unit gradient lower boundary condition incorporated at the bottom of the root zone in the decoupled model does not accurately mimic the time variant hydraulic gradient that occurs between the two systems. This sensitivity occurs because of the potential for transient pressure gradients to arise at the interface between the root and bedrock vadose zones, such that hydraulic gradients in the coupled system can exceed those that occur when a unit gradient (free drainage) lower boundary condition is applied.
A typical practice is to apply a unit gradient condition at the bottom boundary of a soil profile. Such a condition is most valid for a uniform soil profile that extends far below the bottom boundary of the model. When bedrock or other changes in soil type exists below the root zone, the unit gradient boundary condition is inappropriate and could underpredict or overpredict the amount of the deep drainage depending on the material properties. For the LIC site, the bedrock Ks value was not changed as part of the sensitivity analysis, but in actuality the value is likely spatially heterogeneous within the subsurface; if the bedrock Ks value was lower, and closer to the soil Ks above the regolith, it is anticipated that the influence from modeling the agroecosystem as a decoupled system would be less. This observation demonstrates the importance of obtaining site-specific Ks values in the soils and shallow regolith below the terminal root zone at various depths throughout the agricultural plots.
For the conditions modeled, suitable irrigation rates of treated/blended CSG water were identified to equal 2 ML/ha/yr for the LIC site in order to produce salt concentrations within the majority of the root zone that do not exceed vegetation salinity thresholds. Simulations assuming a decoupled system produced slightly lower deep drainage rates and higher deep drainage salinity in addition to higher root zone salinities post-irrigation for the LIC site. The simulations also indicated that precipitation events during or shortly after irrigation can cause a significantly increase in deep drainage and salt flushing such that the total drainage and salt
0
5
10
15
0 15 30 45 60 75
Ele
ctri
cal C
ondu
ctiv
ity (d
S/m
)
Year
Decoupled Root Zone Model
Coupled Root & Bedrock Zone Model
0
5
10
15
0 15 30 45 60 75
Ele
ctri
cal C
ondu
ctiv
ity (d
S/m
)
Year
Decoupled Root Zone Model
Coupled Root & Bedrock Zone Model
International Mine Water Association Annual Conference 2012
126 | McCullough, Lund and Wyse (Editors)
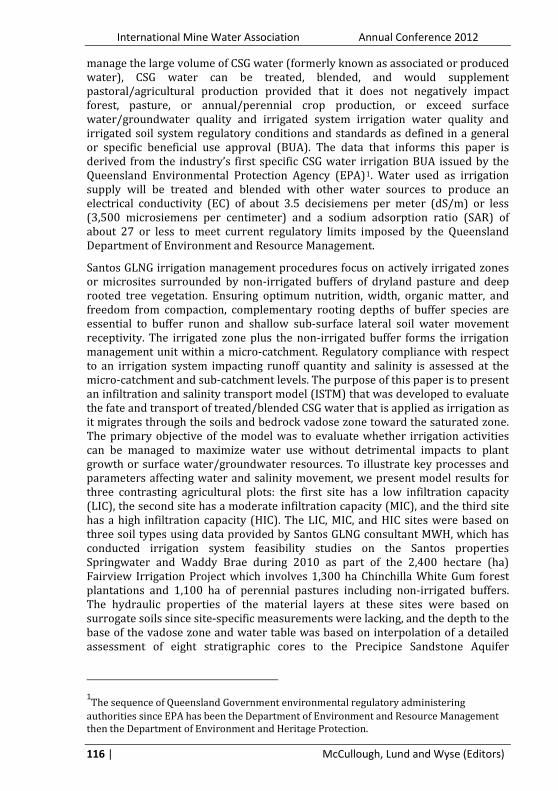
loading into the bedrock is dominated by a few events and is low or zero at other times (results not plotted).
MIC & HIC Sites. The results of the sensitivity analysis for the MIC/HIC sites are shown in Figures 4 and 5 for generalized solute transport (HYDRUS), while the results of the sensitivity analysis for the MIC site is shown in Figure 6 for major ion solute transport (UNSATCHEM). The results of the simulations for the MIC/HIC sites show that drainage is influenced by both the inclusion of salinity stress and by the Ks of the bedrock beneath the root zone. The inclusion of salinity stress tends to increase deep drainage; thus, for more permeable soils, models that neglect the effects of salinity stress will tend to underpredict percolation below the root zone (fig. 4). The simulated mean root zone salinity (fig. 5) and the mean deep drainage salinity (not plotted) are also sensitive to both the inclusion of salinity stress and the Ks value of the bedrock. The sensitivity to the inclusion of salinity stress is greater for the HIC site, while the salinity within deep drainage is more sensitive to the differences in the bedrock Ks for the MIC site (results not plotted).
The observation that the amount of deep drainage and deep drainage salinity at both sites show sensitivity to the bedrock Ks value further illustrates that the root zone profile should be decoupled from the underlying bedrock with caution. Disparity between the MIC and HIC sites suggest that other factors, besides the change in the most limiting Ks value, are controlling the observed response, and that the importance of obtaining site-specific Ks values in the soils and shallow regolith at various depths throughout the agricultural plots cannot be overstated.
Figure 4 Sensitivity of the simulated cumulative amount of deep drainage into bedrock to
the inclusion of salinity stress and the bedrock Ks for the MIC (left) and HIC (right) sites under Leucaena (4 ML/ha/yr).
0
200
400
600
800
1000
1200
1400
1600
1800
2000
0 1 2 3 4 5 6 7 8 9 10 11 12 13
Cum
ulat
ive
Dee
p D
rain
age
(mm
)
Year
HIC (High Ks)HIC (High Ks, No Salt Stress)HIC (Low Ks)HIC (Low Ks, No Salt Stress)
0
200
400
600
800
1000
1200
1400
1600
1800
2000
0 1 2 3 4 5 6 7 8 9 10 11 12 13
Cum
ulat
ive
Dee
p D
rain
age
(mm
)
Year
MIC (High Ks)MIC (High Ks, Not Salt Stress)MIC (Low Ks)MIC (Low Ks, No Salt Stress)

International Mine Water Association Annual Conference 2012
McCullough, Lund and Wyse (Editors) | 127
Figure 5 Sensitivity of the simulated mean root zone salinity to the inclusion of salinity
stress and the bedrock Ks for the MIC (left) and HIC (right) sites under Leucaena (4 ML/ha/yr).
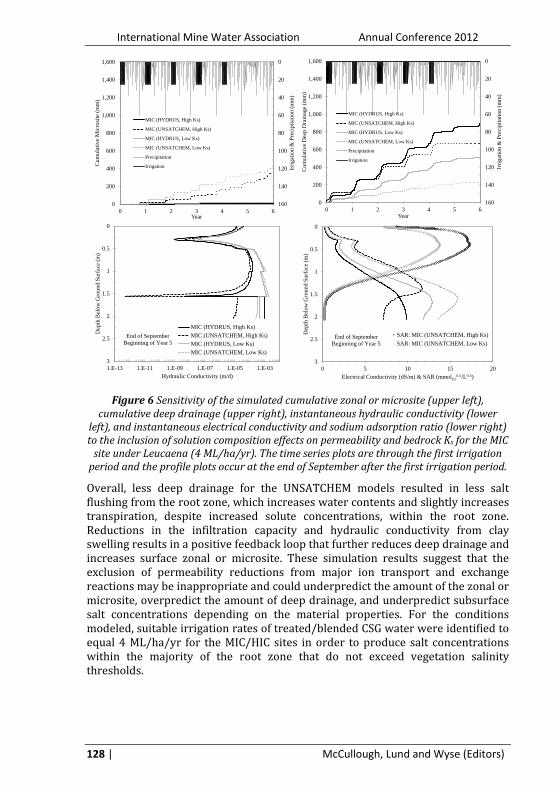
The simulated cumulative amount of zonal or microsite and deep drainage are sensitive to the inclusion of permeability reductions from the transport of major ions and cation exchange reactions (fig 6) and less sensitive to the value of the bedrock Ks. Simulations using UNSATCHEM resulted in much higher zonal or microsite, moderately lower deep drainage, and slightly higher transpiration rates compared to the simulations using HYDRUS.
For the UNSATCHEM simulations, the majority of the zonal or microsite occurs after the cessation of annual irrigation activities in response to a 60 mm precipitation event during July. These results suggest that the Ks of the first material layer is reduced by at least a factor of two (from 120 mm/d to less than 60 mm/d) in order for zonal or microsite to be produced. However, for the low bedrock Ks scenario, there are a handful of zonal or microsite events that occur during irrigation. These events could be attributed to the difference in shallow subsurface water contents caused by the low bedrock Ks or solution chemistry, which affects the infiltration capacity at the soil surface. In actuality, monitoring of the soil water deficit within the shallow subsurface would act to eliminate surface zonal or microsite during irrigation. Why some zonal or microsite occurs during irrigation for the low bedrock Ks scenario, and not for the high bedrock Ks scenario, warrants further analysis. After five years, cumulative deep drainage rates in the UNSATCHEM simulations with the low and high bedrock Ks values were approximately 0.5 and 0.8 times the values computed when using HYDRUS, respectively. The mean crop yield after five years, computed as the ratio of the daily actual and potential transpiration rates, was slightly higher for the simulations using UNSATCHEM because of the slightly lower rate of deep drainage; although the absolute differences were only approximately 2%. These differences in the water balance appear to be controlled by subsurface variations in pore water chemistry and resultant changes to the hydraulic conductivity.
0
5
10
15
20
0 1 2 3 4 5 6 7 8 9 10 11 12 13
Elec
trica
l Con
duct
ivity
(dS/
m)
Year
HIC (High Ks)HIC (High Ks, No Salt Stress)HIC (Low Ks)HIC (Low Ks, No Salt Stress)
0
5
10
15
20
0 1 2 3 4 5 6 7 8 9 10 11 12 13
Elec
trica
l Con
duct
ivity
(dS/
m)
Year
MIC (High Ks)MIC (High Ks, No Salt Stress)MIC (Low Ks)MIC (Low Ks, No Salt Stress)
International Mine Water Association Annual Conference 2012
128 | McCullough, Lund and Wyse (Editors)
Figure 6 Sensitivity of the simulated cumulative zonal or microsite (upper left),
cumulative deep drainage (upper right), instantaneous hydraulic conductivity (lower left), and instantaneous electrical conductivity and sodium adsorption ratio (lower right) to the inclusion of solution composition effects on permeability and bedrock Ks for the MIC
site under Leucaena (4 ML/ha/yr). The time series plots are through the first irrigation period and the profile plots occur at the end of September after the first irrigation period.
Overall, less deep drainage for the UNSATCHEM models resulted in less salt flushing from the root zone, which increases water contents and slightly increases transpiration, despite increased solute concentrations, within the root zone. Reductions in the infiltration capacity and hydraulic conductivity from clay swelling results in a positive feedback loop that further reduces deep drainage and increases surface zonal or microsite. These simulation results suggest that the exclusion of permeability reductions from major ion transport and exchange reactions may be inappropriate and could underpredict the amount of the zonal or microsite, overpredict the amount of deep drainage, and underpredict subsurface salt concentrations depending on the material properties. For the conditions modeled, suitable irrigation rates of treated/blended CSG water were identified to equal 4 ML/ha/yr for the MIC/HIC sites in order to produce salt concentrations within the majority of the root zone that do not exceed vegetation salinity thresholds.
0
0.5
1
1.5
2
2.5
31.E-13 1.E-11 1.E-09 1.E-07 1.E-05 1.E-03
Dep
th B
elow
Gro
und
Surf
ace
(m)
Hydraulic Conductivity (m/d)
MIC (HYDRUS, High Ks)MIC (UNSATCHEM, High Ks)MIC (HYDRUS, Low Ks)MIC (UNSATCHEM, Low Ks)
End of SeptemberBeginning of Year 5
0
0.5
1
1.5
2
2.5
30 5 10 15 20
Dep
th B
elow
Gro
und
Surf
ace
(m)
Electrical Conductivity (dS/m) & SAR (mmol(c)0.5/L0.5)
SAR: MIC (UNSATCHEM, High Ks)SAR: MIC (UNSATCHEM, Low Ks)
End of SeptemberBeginning of Year 5
0
20
40
60
80
100
120
140
1600
200
400
600
800
1,000
1,200
1,400
1,600
0 1 2 3 4 5 6
Irrig
atio
n &
Pre
cipi
tatio
n (m
m)
Cum
ulat
ive
Mic
rosi
te (m
m)
Year
MIC (HYDRUS, High Ks)
MIC (UNSATCHEM, High Ks)
MIC (HYDRUS, Low Ks)
MIC (UNSATCHEM, Low Ks)
Precipitation
Irrigation
0
20
40
60
80
100
120
140
1600
200
400
600
800
1,000
1,200
1,400
1,600
0 1 2 3 4 5 6
Irrig
atio
n &
Pre
cipi
tatio
n (m
m)
Cum
ulat
ive
Dee
p D
rain
age
(mm
)
Year
MIC (HYDRUS, High Ks)
MIC (UNSATCHEM, High Ks)
MIC (HYDRUS, Low Ks)
MIC (UNSATCHEM, Low Ks)
Precipitation
Irrigation

International Mine Water Association Annual Conference 2012
McCullough, Lund and Wyse (Editors) | 129
Conclusions These simulations demonstrate that, for the scenarios modeled, the root and bedrock vadose zones act as a coupled system and should be modeled as such to avoid artificial effects created by imposing a boundary condition at the interface. While it is conceivable that other alternative scenarios could be responsible for controlling the effects observed, the modeled scenarios as parameterized suggest that applying a unit gradient boundary condition at the base of the soils should be exercised with caution. Disparities may result because the hydraulic gradient between the soil horizon and bedrock regolith may exceed those conditions in which free drainage is assumed to control deep drainage; furthermore, sensitivity analyses of internal system parameters for the soil layers indicated that the presence of low-permeability layers within the profile fundamentally control the transport of water and salt within the entire root zone. This observation demonstrates the importance of obtaining site-specific Ks values in the soils and shallow regolith at various depths throughout the agricultural plots.
The inclusion of salt stress, and resultant effects on root water uptake, suggest that these processes could significantly affect transient variations of subsurface salinity profiles and salt leaching. Because these transient variations are key components of the vadose zone response due to variations in water application, root water uptake, and climatic parameters, additional evaluation should be completed to verify and assess the importance of simulating salinity effects on root water uptake as part of the root water uptake response function. Potential feedback processes that were produced from simulating solution composition effects and ion exchange reactions on the hydraulic conductivity and infiltration capacity of the root zone and shallow bedrock suggest that these processes may exhibit a first order control on the resultant water balance for soils with a moderate infiltration capacity. Calibration of these processes to field-measurements for MIC sites and other soil types is warranted to verify the presumed importance of these processes, and suitability of the generalized clay-swelling model incorporated into UNSATCHEM.
Overall, the simulations suggest that irrigation application can be managed so that surface zonal or microsite of treated/blended CSG irrigation water does not occur, and that the development of saturated conditions within the soils during irrigation is minimized. The results simulated with the ISTM indicate that irrigation activities can be managed to maximize water use without unacceptable reductions in plant growth or micro-catchment non-compliant flows to surface water/groundwater, as suggested by Raine (2012). The ISTM provides operators with an interactive management tool to optimize agricultural production, offset environmental impacts, and provide a net economic benefit to local communities.
Acknowledgements The authors would like to thank Santos for permission to publish this work. Scott Fidler from Golder and Bob Reid, Greg Hocking, and Stuart Macnish from MWH are obliged for their valuable insight while formulating the hydrologic conceptual model. We would also like to thank Jirka Simunek for his efforts in providing feedback regarding refinement of the conceptual model and parameterization of the numerical models.

International Mine Water Association Annual Conference 2012
130 | McCullough, Lund and Wyse (Editors)
References Biggs AJW (2006) Rainfall salt accessions in the Queensland Murray-Darling Basin.
Australian J of Soil Research 44:637—645 Feddes RA, Kowalik PJ, Zaradyn H (1978) Simulation of Field Water Use and Crop Yield. John
Wiley & Sons, New York, New York, 188 pp Golder (2011) Modelling of Deep Drainage at IR7. Technical memorandum prepared for
Santos Ltd, June 2011 Goncalves MC, Simunek J, Ramos TB, Martins JC, Neves MJ, Pires FP (2006) Multicomponent
solute transport in soil lysimeters irrigated with waters of different quality. Water Resour Res 42, W08401: doi:10.1029/2005WR004802
Lansci Management (2011a) Waddy Brae Irrigation Project Water and Salinity Modelling. Report prepared for Santos Ltd and MWH Pty Ltd, May 2011
Lansci Management (2011b) Springwater IR7 Irrigation Project Water and Salinity Modelling. Report prepared for Santos Ltd and MWH Pty Ltd, July 2011
MWH (2011) Santos IR7 Irrigation Development Soils and Irrigation Options. Report prepared for Santos Ltd, May 2011
McNeal BL (1968) Prediction of the effect of mixed-salt solutions on soil hydraulic conductivity. Soil Sci. Soc. Amer. Proc. 32:190—193
Maas EV (1990) Crop salt tolerance. In: KK Tanji (ed.), Agricultural salinity assessment and management, ASCE Manuals and Reports on Engineering Practice, No 71:262—304
Raine S (2012) Using treated CSG water for irrigation in the Surat Basin: opportunity or threat? Queensland Mining and Energy Bulletin, Autumn:36—39
Raine SR, Meyer WS, Rassam DW, Hutson JL, Cook FJ (2005) Soil-water and salt movement associated with precision irrigation systems - Research Investment Opportunities. Final report to the National Program for Sustainable Irrigation, Cooperative Research Centre for Irrigation Futures (CRCIF), No 3.13/1, March 2005
Ramos TB, Simunek J, Gonclaves MC, Martins JC, Prazeres A, Castanheira NL, Pereira LS (2011) Field evaluation of a multicomponent solute transport model in soils irrigated with saline waters. J Hydrology 407:129—144
SSM (2011) Evaluation of Suitability of Land on Waddy Brae for a Chinchilla White Gum Plantation Irrigated with CSG Water. Report prepared for Santos Ltd, February 2011
Simunek J, Suarez DL (1997) Sodic soil reclamation using multicomponent transport modelling. J of Irrigation and Drainage Engineering 123(5):367—376
Simunek J, van Genuchten MTh, Sejna M (2008) Development and Applications of the HYDRUS and STANMOD Software Packages and Related Codes. Vadose Zone J 7:587—600
Suarez DL, Rhoades JD, Lavado R, Grieve CM (1984) Effect of pH on saturated hydraulic conductivity and soil dispersion. Soil Sci Soc Am J 48:50—55
Tanji KK, Kielen NC (2002) Agricultural drainage water management in arid and semi-arid areas. FAO Irrigation and Drainage Paper 61
URS (2010) 2009 Fairview Coring and Bore Installation. Report prepared for Santos Ltd, June 2010