development of a motivational tool used for cancer...
TRANSCRIPT
IT 15 032
Examensarbete 30 hpJune 2015
Development of a motivational tool used for cancer patients to increase their physical activity with focus on front-end
Faris Michael Halteh
Masterprogram i datavetenskapMaster Programme in Computer Science

Teknisk- naturvetenskaplig fakultet UTH-enheten Besöksadress: Ångströmlaboratoriet Lägerhyddsvägen 1 Hus 4, Plan 0 Postadress: Box 536 751 21 Uppsala Telefon: 018 – 471 30 03 Telefax: 018 – 471 30 00 Hemsida: http://www.teknat.uu.se/student
Abstract
Faris Michael Halteh
Tryckt av: Reprocentralen ITCIT 15 032Examinator: Justin PearsonÄmnesgranskare: Edith NgaiHandledare: Håkan MacLean
Development of a motivational tool used for cancer patients to increase their physical activity with focus on front-end
Cancer patients who undergo chemotherapy and other treatments tend to become weary, depressed and will inevitably lose a great amount of muscle mass due to said treatments and decreased activity levels. Consequently, extensive research was done on how physical activity can combat the adverse effects of these treatments. Physical activity is not only safe and doable for cancer patients, but it can also increase their quality of life, their physical performance and reduce the duration of hospitalisation.
As a result, the Center for Technology in Medicine and Health (CTMH) wanted to tackle this problem by developing a motivational tool that uses a sensor to retrieve measurements about the patient’s movement levels. Retrieved data then gets processed on an Android application to provide instant personalised feedback about the progress of the patient in a visual format. This tool illustrates the potential for an application to motivate cancer patients to reach a moderate physical activity level by quantifying their movements.
This thesis is focused on a comparison study to compare wearable devices that can measure the patient’s activeness, in addition to the design and development of a graphical user interface (GUI) for this tool.
Acknowledgments
I would like to express my acknowledgement and appreciation for the great and out-standing team at the Centre for Technology in Medicine and Health (CTMH) thatI was working with during the development of this motivational tool. Without theirguidance, uplifting spirit and ongoing help, this thesis project would not have beenpossible.
I would also like to thank the physiotherapist Nina Nissander who helped us talkto patients throughout the development. I am very grateful for all the patients stayingat the haematology department in Karolinska Institute’s hospital who were willing totake the time to talk to us, give us feedback about the product and participate in allthe testing sessions that have been conducted.
I am also indebted and grateful to Edith Ngai for her interest in the project andfor being a great reviewer, giving instant feedback and guidance throughout the way.
Last but not least, I would like to thank God for giving me the ability to completethis project. And I can’t forget to give my special gratitude to my family and friends,who have always been supportive and loving.

Contents
I Project Introduction
1 Introduction 11.1 Background . . . . . . . . . . . . . . . . . . . . . . . . . . . . . . . . 11.2 Internet of Things . . . . . . . . . . . . . . . . . . . . . . . . . . . . . 21.3 Aim of the Study . . . . . . . . . . . . . . . . . . . . . . . . . . . . . 21.4 Software Development Tools and Technology . . . . . . . . . . . . . . 3
1.4.1 The Android Application . . . . . . . . . . . . . . . . . . . . . 31.4.2 Design and Prototyping Softwares . . . . . . . . . . . . . . . . 41.4.3 Libraries . . . . . . . . . . . . . . . . . . . . . . . . . . . . . . 5
2 Problem Elaboration 62.1 User Group . . . . . . . . . . . . . . . . . . . . . . . . . . . . . . . . 62.2 User Study at Karolinska Hospital . . . . . . . . . . . . . . . . . . . . 6
2.2.1 Background . . . . . . . . . . . . . . . . . . . . . . . . . . . . 72.2.2 Problems . . . . . . . . . . . . . . . . . . . . . . . . . . . . . 82.2.3 Other Information . . . . . . . . . . . . . . . . . . . . . . . . 82.2.4 Design Solutions . . . . . . . . . . . . . . . . . . . . . . . . . 92.2.5 Personas . . . . . . . . . . . . . . . . . . . . . . . . . . . . . . 92.2.6 Design Considerations . . . . . . . . . . . . . . . . . . . . . . 9
2.3 Research Questions . . . . . . . . . . . . . . . . . . . . . . . . . . . . 102.4 Contributions . . . . . . . . . . . . . . . . . . . . . . . . . . . . . . . 112.5 Delimitations . . . . . . . . . . . . . . . . . . . . . . . . . . . . . . . 11
3 Methodology 123.1 Research method . . . . . . . . . . . . . . . . . . . . . . . . . . . . . 123.2 Guidelines . . . . . . . . . . . . . . . . . . . . . . . . . . . . . . . . . 123.3 Evaluation . . . . . . . . . . . . . . . . . . . . . . . . . . . . . . . . . 14
3.4 Data Acquisition . . . . . . . . . . . . . . . . . . . . . . . . . . . . . 153.5 Design and development methodology . . . . . . . . . . . . . . . . . . 15
II Literature Review and Background Study 18
4 Literature Review 194.1 Chemotherapy . . . . . . . . . . . . . . . . . . . . . . . . . . . . . . . 19
4.1.1 Goals of Chemotherapy . . . . . . . . . . . . . . . . . . . . . . 204.1.2 Common Side Effects of Chemotherapy . . . . . . . . . . . . . 20
4.2 Effects of physical activity on cancer patients . . . . . . . . . . . . . 214.3 Motivational Tools that increase Physical Activity . . . . . . . . . . . 22
4.3.1 Pedometers . . . . . . . . . . . . . . . . . . . . . . . . . . . . 234.3.2 Motivational Interviewing . . . . . . . . . . . . . . . . . . . . 24
4.4 Physical Activity Recognition . . . . . . . . . . . . . . . . . . . . . . 254.4.1 Methods and Techniques . . . . . . . . . . . . . . . . . . . . . 26
5 Mobile Health Solutions 285.1 Mayo Clinic myCare . . . . . . . . . . . . . . . . . . . . . . . . . . . 285.2 ZephyrLIFE Hospital - Wearable Patient Monitoring System . . . . . 315.3 Welfare Denmark’s Virtual Rehabilitation . . . . . . . . . . . . . . . 315.4 Chapter Conclusion . . . . . . . . . . . . . . . . . . . . . . . . . . . . 32
6 Wearable Devices 336.1 Device Requirements . . . . . . . . . . . . . . . . . . . . . . . . . . . 336.2 Devices . . . . . . . . . . . . . . . . . . . . . . . . . . . . . . . . . . 346.3 Comparison Summary Table . . . . . . . . . . . . . . . . . . . . . . . 38
6.3.1 Conclusion . . . . . . . . . . . . . . . . . . . . . . . . . . . . . 38
III Application Design and Development 40
7 Application Design 417.1 Design challenges . . . . . . . . . . . . . . . . . . . . . . . . . . . . . 417.2 Prototyping . . . . . . . . . . . . . . . . . . . . . . . . . . . . . . . . 42
7.2.1 Usability Testing . . . . . . . . . . . . . . . . . . . . . . . . . 437.2.2 Design Iteration 1 . . . . . . . . . . . . . . . . . . . . . . . . . 43
7.2.3 Design Iteration 2 . . . . . . . . . . . . . . . . . . . . . . . . . 467.2.4 Design Iteration 3 . . . . . . . . . . . . . . . . . . . . . . . . . 497.2.5 Design Iteration 4 . . . . . . . . . . . . . . . . . . . . . . . . . 51
8 Application Implementation 558.1 Implementation challenges and risks . . . . . . . . . . . . . . . . . . . 558.2 Requirements . . . . . . . . . . . . . . . . . . . . . . . . . . . . . . . 56
8.2.1 Design requirements . . . . . . . . . . . . . . . . . . . . . . . 568.2.2 Functional requirements . . . . . . . . . . . . . . . . . . . . . 578.2.3 Non-functional requirements . . . . . . . . . . . . . . . . . . . 59
8.3 Application view models . . . . . . . . . . . . . . . . . . . . . . . . . 608.3.1 Physical view . . . . . . . . . . . . . . . . . . . . . . . . . . . 608.3.2 Logical view . . . . . . . . . . . . . . . . . . . . . . . . . . . . 61
8.4 Internet of Things . . . . . . . . . . . . . . . . . . . . . . . . . . . . . 618.4.1 Retrieving Data from the Sensor . . . . . . . . . . . . . . . . . 62
8.5 Machine Learning Algorithm . . . . . . . . . . . . . . . . . . . . . . . 628.5.1 Support Vector Machine (SVM) . . . . . . . . . . . . . . . . . 62
8.6 Database . . . . . . . . . . . . . . . . . . . . . . . . . . . . . . . . . . 638.6.1 NoSQL Database . . . . . . . . . . . . . . . . . . . . . . . . . 638.6.2 Couchbase Lite . . . . . . . . . . . . . . . . . . . . . . . . . . 658.6.3 Implementation Iteration 1 . . . . . . . . . . . . . . . . . . . . 668.6.4 Implementation Iteration 2 . . . . . . . . . . . . . . . . . . . . 68
IV Results 69
9 Results 709.1 GUI and functionality . . . . . . . . . . . . . . . . . . . . . . . . . . 70
10 Evaluation and Conclusion 7410.1 Methodology . . . . . . . . . . . . . . . . . . . . . . . . . . . . . . . 7410.2 Design principles . . . . . . . . . . . . . . . . . . . . . . . . . . . . . 76
10.2.1 Jakob Nielson’s 10 usability heuristics . . . . . . . . . . . . . . 7610.3 Strengths and weaknesses . . . . . . . . . . . . . . . . . . . . . . . . 7810.4 Answering research questions . . . . . . . . . . . . . . . . . . . . . . 7910.5 Reflections . . . . . . . . . . . . . . . . . . . . . . . . . . . . . . . . . 80

10.6 Future Work . . . . . . . . . . . . . . . . . . . . . . . . . . . . . . . . 8110.7 Conclusion . . . . . . . . . . . . . . . . . . . . . . . . . . . . . . . . . 84
V Appendices 85
A Personas 86
B Tables 91
C Interfaces 96C.1 Design Iteration 1 . . . . . . . . . . . . . . . . . . . . . . . . . . . . . 96C.2 Design iteration 2 . . . . . . . . . . . . . . . . . . . . . . . . . . . . . 98C.3 Design iteration 3 . . . . . . . . . . . . . . . . . . . . . . . . . . . . . 99C.4 Design iteration 4 . . . . . . . . . . . . . . . . . . . . . . . . . . . . . 99C.5 Implementation Iteration 1 . . . . . . . . . . . . . . . . . . . . . . . . 102
Bibliography 103
List of Figures
3-1 Workflow of the Usability Design and Software Development followedin this project . . . . . . . . . . . . . . . . . . . . . . . . . . . . . . . 17
4-1 5A’s Motivational Interviewing approach . . . . . . . . . . . . . . . . 254-2 An accelerometer with standardised axes . . . . . . . . . . . . . . . . 27
5-1 A screenshot of Mayo myCare program’s patient view . . . . . . . . . 295-2 Population view of patients . . . . . . . . . . . . . . . . . . . . . . . 305-3 Comprehensive patient monitoring by ZephyrLIFE Hospital . . . . . 32
6-1 Pebble . . . . . . . . . . . . . . . . . . . . . . . . . . . . . . . . . . . 38
8-1 Physical view diagram . . . . . . . . . . . . . . . . . . . . . . . . . . 608-2 Sequence diagram . . . . . . . . . . . . . . . . . . . . . . . . . . . . . 618-3 Interface created for training the machine algorithm . . . . . . . . . . 648-4 Primitive design of the interface used for training the support vector
machine used in this project . . . . . . . . . . . . . . . . . . . . . . . 64
9-1 Daily view showing the patients’ current progress . . . . . . . . . . . 719-2 Setting the patient’s goal for today . . . . . . . . . . . . . . . . . . . 729-3 Pain and mood levels . . . . . . . . . . . . . . . . . . . . . . . . . . . 73
C-1 Daily View: the first screen that appears . . . . . . . . . . . . . . . . 96C-2 History View . . . . . . . . . . . . . . . . . . . . . . . . . . . . . . . 97C-3 Mood/Pain input . . . . . . . . . . . . . . . . . . . . . . . . . . . . . 97C-4 Daily View . . . . . . . . . . . . . . . . . . . . . . . . . . . . . . . . 98C-5 Mood/Pain input . . . . . . . . . . . . . . . . . . . . . . . . . . . . . 98C-6 Daily View . . . . . . . . . . . . . . . . . . . . . . . . . . . . . . . . 99C-7 Concept 1 . . . . . . . . . . . . . . . . . . . . . . . . . . . . . . . . . 99

C-8 Concept 2 . . . . . . . . . . . . . . . . . . . . . . . . . . . . . . . . . 100C-9 Concept 3 . . . . . . . . . . . . . . . . . . . . . . . . . . . . . . . . . 100C-10 Concept 4 . . . . . . . . . . . . . . . . . . . . . . . . . . . . . . . . . 101C-11 Daily view showing the patients’ current progress . . . . . . . . . . . 102C-12 Setting the patient’s goal for today . . . . . . . . . . . . . . . . . . . 102
List of Tables
3.1 Design science research evaluation methods suggested by Henver [21] 14
7.1 Task Completion Analysis . . . . . . . . . . . . . . . . . . . . . . . . 457.2 Task Completion Analysis . . . . . . . . . . . . . . . . . . . . . . . . 477.3 Concept Preference . . . . . . . . . . . . . . . . . . . . . . . . . . . . 537.4 Sensor Location Preference . . . . . . . . . . . . . . . . . . . . . . . . 53
8.1 Design Requirements . . . . . . . . . . . . . . . . . . . . . . . . . . . 568.2 Functional Requirements . . . . . . . . . . . . . . . . . . . . . . . . . 588.3 Non-functional Requirements . . . . . . . . . . . . . . . . . . . . . . 598.4 Results from Interviewing Patients . . . . . . . . . . . . . . . . . . . 67
10.1 Questions and answers from patients after the the one-day testing.Patients were asked to answer a number between 1-5 (1 being theworst and 5 being the best) . . . . . . . . . . . . . . . . . . . . . . . 75
A.1 Patient 1 . . . . . . . . . . . . . . . . . . . . . . . . . . . . . . . . . . 87A.2 Patient 2 . . . . . . . . . . . . . . . . . . . . . . . . . . . . . . . . . . 87A.3 Patient 3 . . . . . . . . . . . . . . . . . . . . . . . . . . . . . . . . . . 88A.4 Patient 4 . . . . . . . . . . . . . . . . . . . . . . . . . . . . . . . . . . 89A.5 Medical Doctor . . . . . . . . . . . . . . . . . . . . . . . . . . . . . . 90A.6 Physiotherapist . . . . . . . . . . . . . . . . . . . . . . . . . . . . . . 90
B.1 Comparison of Wearable Devices . . . . . . . . . . . . . . . . . . . . 92
Preface
This master thesis project was carried at the Centre for Technology in Medicine andHealth, CTMH. The supervisor at CTMH who provided guidance to this thesis wasHåkan Maclean. CTMH is a cooperation between The Royal Institute of Technol-ogy (KTH), Karolinska Institutet (KI) and Stockholm County Council (SLL). Thiscooperation’s vision is to help develop the Stockholm region as a world-class medicaltechnology centre. "As a portal, CTMH creates venues and activities that stimulateand develop exchanges between industry, academia and health care in the boundariesbetween technology and health, research and application" [11].
This project was developed in a team with four other team members who hadseparate roles in the project. All interviews, usability testing sessions and user studieswere performed at Karolinska University hospital in Huddinge, Sweden.

Part I
Project Introduction
Chapter 1
Introduction
This chapter introduces the problem and gives a brief overview of the aim of thisresearch. This is followed by the tools and technology used in this project.
1.1 Background
Although the road of surviving cancer is not an easy one, physical activity can rad-ically ameliorate this road and help patients overcome this unfortunate period intheir lives. Patients who get treated for blood cancer (leukaemia) undergo strenuouschemotherapy treatment regimens that often leave them weary and tired, experiencingphysical and psychological stress [50, p. 321].
Chemotherapy and stem cell transplantation can have pernicious effect on pa-tients’ quality of life. Several psychological, physical and psycho-social problems occurbefore, during and after the treatment. These problems include emotional problemscaused by distress, lack of physical activity, immunological changes and many more[50, p. 321]. Other symptoms including fatigue and impairment of physical perfor-mance are also quite common among cancer patients [13, p. 3390].
Nevertheless, numerous studies have revealed that physical exercise such as aero-bic exercise is not only safe and feasible during cancer treatment, but it can also resultin significant benefits for patients undergoing chemotherapy and stem cell transplan-tation. In a study that was conducted to investigate the effect of physical activity onpatients receiving stem cell transplantation in Germany, aerobic exercise programswere introduced. The study revealed that exercise interventions have resulted in sig-nificant positive impact on the patient’s quality of life, physical performance and
1
fatigue status. In addition, another observation that was mentioned in this study isthat immune cells were recurring faster for patients who followed the exercise pro-grams [50, p. 321]. In another study that was aimed to prevent the loss of physicalperformance for cancer patients by introducing an exercise program consisting ofbiking, it was found that aerobic exercise can be safely performed directly after high-dose chemotherapy. Moreover, the hospitalisation period was shorter for the groupof patients who received training in this study [13, p. 3394].
Although physical exercise can significantly increase cancer patients’ wellbeing andquality of life, physiotherapists and doctors find it difficult to motivate patients to beactive by walking, cycling or doing aerobic exercises instead of being immobilised inhospital rooms. Thus, this presents a tremendous problem for both staff and patients[41].
1.2 Internet of Things
Internet of Things (IoT) is a concept that is currently changing the world. Accord-ing to the U.S. National Intelligence Council, Internet of Things (IoT) is defined as"the general idea of things, especially everyday objects, that are readable, recognis-able, locatable, addressable, and/or controllable via the Internet, irrespective of thecommunication means" [10].
One example of IoT that has been changing the world of health and fitness in recentyears is activity tracking using sensors, an industry known as "The Quantified Self".This gives people the capability of tracking their own activity levels using sensors andIoT technology, with a general goal of increasing their fitness and becoming healthier.With this technology, people set goals and aim to achieve them. The unique thingabout this industry that makes it quite effective in motivating people to be more activeis that these tools turn fitness and health into a game. With each goal achieved, theuser gets a sense of reward for being more active, which will in turn result in a betterhealth [42, p. 232].
1.3 Aim of the Study
Since numerous studies claim and prove that physical activity has the capability ofincreasing the wellness and quality of life of cancer patients, the goal of this project
2
was to design and develop a new motivational tool that would encourage and motivatepatients to increase their physical activity using the Internet of Things.
The haematology department at Karolinska Institutet’s Hospital treats cancer pa-tients with chemotherapy treatment programmes that often leave them tired, phys-ically impaired, weary and more vulnerable to infections. For this reason, the goalof this investigation was to develop a highly usable motivational tool in the form ofa software that would give patients instant feedback on the their activity levels inorder to motivate them to increase their physical activity, which will in turn improvetheir well-being and reduce the hospitalisation period. This tool uses the Internetof Things, by utilising a sensor that retrieves raw data from patients using a lowpower built-in accelerometer and an android tablet. The data retrieved gets sent toan android tablet that is situated on the bedside of each patient. The data is thenprocessed on the tablet to identify and recognise what activity is being performedby the patient using a machine learning algorithm. Finally, the activity levels getdemonstrated in visual format on the android tablet to show patients, doctors andphysiotherapists the patient’s activity levels.
1.4 Software Development Tools and Technology
Several softwares were used to design and develop the prototypes that were tested onpatients.
1.4.1 The Android Application
The tools used for the development of the motivational tool are described below.
• Android StudioThe Android application was built using Android Studio with a minimum APIof 19 (Android 4.4) as the application was built with an aim of supportingBluetooth Low Energy which was introduced as a built-in platform support inAndroid 4.3. Android studio is considered the official Integrated DevelopmentEnvironment (IDE) for the development of Android applications [15].
• Android SDKAndroid Software Development Kit (SDK) is the SDK necessary to develop
3
applications for the Android platform. It includes an emulator, debugger, doc-umentation, sample code and libraries that are required to build Android ap-plications [12].
• JavaJava is an object-oriented programming language that was first released by Mi-crosystems in 1995. Java is the programming language used to develop Androidapplications, and therefore it was used to develop the Android application forthis research.
• GitGit is a powerful tool used as a version control system. Since this applicationwas developed with other team members, it was a perfect tool for collaborativesoftware development with useful features such as working on several branches,rolling back to earlier versions of the code, code history, among others. Thisproject’s repository is hosted at BitBucket, a git code management tool.
• Lenovo Yoga Tablet 2This Android tablet was used for testing the software on patients. Lenovo YogaTablet 2 has a stand that allows the tablet to rigidly stand on a table, whichwas beneficial for this project as the final product was expected to be locatedon a table next to the patient.
1.4.2 Design and Prototyping Softwares
The tools used for designing the prototypes that were tested on patients (discussedin Section 7.2) and graphics incorporated in the interface are described below.
• Balsamiq MockupsThis software is a wire-framing tool that was used in this project for creatingmockups of the interface of the application easily and quickly.
• Adobe IllustratorAdobe Illustrator was used for designing parts of the interface (both the mockupand the real one) that required graphics and vectors such as icons and charts.
• Apple KeynoteApple Keynote was used to add interactivity to the mockup screens by adding
4

hyperlinks between different screens, allowing users to play around with themockup and give feedback.
• InvisionInvision was also used to add interactivity to the mockup screens to have a non-linear presentation of the interface. This tool allows the user to add hotspotsto the static screens to make them more interactive with transitions and ani-mations.
1.4.3 Libraries
• PebbleKit AndroidThe PebbleKit Android is a Java library that is included in the Pebble SDK.The application uses classes and methods in this library to connect to andcommunicate with the Pebble device.
• MPAndroidChartThis library is a chart library for android that provides support for creating barcharts, line charts, pie charts and more. The interface of this project has twocharts (bar and pie) that were created using this library.
• EncogThis library is a machine learning framework that was used for the supportvector machine (SVM) used in this project to recognise the patient’s physicalactivities.
• Couchbase Lite AndroidThis library is a lightweight NoSQL database engine that was used for thedatabase implemented for this software.
5
Chapter 2
Problem Elaboration
This chapter introduces the user study that was conducted at Karolinska UniversityHospital to get a better understanding of the problem that this thesis aims to tackleand the prospective users of the systems. In addition, based on the user study anddesign solutions, we present a number of research questions and set the limit of thisthesis.
2.1 User Group
This project was targeted to be used for a scientific study that will be conducted bythe Center for Technology in Medicine and Health (CTMH) after fully developingthe prototype. The study will mainly include cancer patients who are undergoingtreatment. Thus, prospective users are not expected to have a high level of interactionwith the product. In addition, prospective users have a wide range of computerliteracy, hence the application has to be adapted for this matter.
2.2 User Study at Karolinska Hospital
Before the design and the development of the application, it was necessary to conducta user study in the beginning phases of the project to get a profound understandingof prospective users, their goals, limitations and abilities. This study was conductedto identify the needs of this product and to know how things operate and functionwithout the introduction of the motivational tool being built in this project. Theuser study was documented and data was collected using observations and interviews
6

with prospective users such as patients, doctors and physiotherapists at KarolinskaInstitutet’s Hospital in Huddinge.
2.2.1 Background
The conducted observations and interviews were evaluated to get qualitative infor-mation about the environment that will host the product developed in this research.The main objective of conducting this user study was to trigger the initial planningof the project and get a better overview of prospective patients who might be usingthe motivational tool. The main department in which the study was performed inwas the Haematology department that consists of patients undergoing chemotherapytreatment and stem cell transplantations.
The study focused on several primary areas: user background, user capabilities,traditional ways used by the physiotherapists to motivate the patients to move, pa-tients’ conditions and common problems that are faced by patients, doctors andphysiotherapists.
The department’s physiotherapist and her colleagues ensure that each patient inthe department gets information about the recommended exercises that would helpthe patients’ immune system and sustain their physical strength during the treatmenttime. The exercises for each patient varies depending on the patient’s capabilities. Todetermine the patient’s ability to exercise, a lot of factors are taken into consideration.Patient’s condition, temperature, mood, age and blood samples are examples of suchfactors. Some patients are quarantined and are obliged to stay in their rooms for longperiods during the day due to vulnerability to infections and diseases; consequently,it is vital that they exercise whilst being in a stationary location. The main aim ofexercising in this department is to avoid losing muscle mass during the treatmenttime. In addition, the physiotherapist mentioned that "exercising is highly positivefor patients who are receiving stem cells transplants as it can increase the bloodcirculation which leads to a faster treatment". Patients are also advised to walkoutside if they are capable. Moreover, it is recommended for the patients to situpright to reduce the likelihood of lung infections and pneumonia. Patients who areadmitted to the department could be undergoing chemotherapy, having stem cellstransplants or admitted due to occurring complications after treatment.
Patients are visited by the physiotherapists on an average of 2 to 3 times per week.The physiotherapist spends approximately 20 minutes with each patient to help her
7

or him exercise and informs the patient about the importance of physical activity andwhat exercises she or he needs to perform to get better. Patients are highly advisedto exercise unless they are suffering from infections, fevers, low platelet count or lowhaemoglobin levels. During the user study, we have observed the physiotherapist withfour different patients who were undergoing different treatments for different types ofcancer.
The condition of the patient is dependent upon several factors including: age,stage in the treatment, type of treatment, physical activity, motivation and painlevels. One patient had no motivation to perform any physical activity due to herstatus. She felt too tired to perform any activity.
The physiotherapist showed us different aids that can be used to exercise, includingrubber bands, dumbbells, bicycles, weight lifting straps, stress balls and balanceboards.
2.2.2 Problems
The physiotherapist in this department finds it difficult to evaluate if the patientshave performed the exercises and movements that they were asked to do. A commonproblem in such situations is that patients might not give the correct informationto the physiotherapist, leading to inaccurate results while evaluating the effect ofphysical activity on the physical performance and well being of cancer patients.
Another problem that could be an issue is that not all patients are capable ofperforming physical activities, thus the goals for each patient have to be specific andpersonalised to what each patient is capable of doing.
2.2.3 Other Information
After observing patients that are undergoing different stages of treatment, it wasconcluded that the patient’s mood and motivation to exercise is highly influencedby the stage of treatment in which the patient is going through. The patient whowas just admitted to the haematology department was quite motivated and active,walking around the hospital to maintain his health. On the other hand, two of theobserved patients were too tired to perform any physical activity.
8
2.2.4 Design Solutions
This part describes the design for the motivational tool that is aimed to motivatepatients to increase their physical activities and help physiotherapists and doctorsknow more about the patient’s activities. The main focus of the application is toincrease the patients’ motivation to move and exercise, as according to recent studiesmentioned in this report, exercise during cancer treatment is not only possible andsafe, but also increases the well being of the patients, increases their immunity andreduces the admitted time at the hospital. This application will read data fromthe sensors and then present the patients’ basic activity levels in a visual format.Physiotherapists will also be able to set specific goals on the application in cooperationwith the patient. Another feature that this application will have is to track the moodand the pain level of the patient with a value scale that the patient selects from.To evaluate the overall performance of patients and how well they have done in aparticular day, the concept of Activity Points was created and tested on patients.Activity points are simple numbers that keep track of how much each patient moves.The more they move, the more they earn.
2.2.5 Personas
After conducting interviews and observations at the hospital, a few personas werecreated in order to get a better picture of the prospective users who might be usingthe developed product.
Patients that were involved ranged from patients who were about to start theirtreatment to patients who were in their later stages of the treatment (See Appendix Afor personas). In general, most patients were significantly tired and lacked motivationto exercise. The physiotherapist has to explain the importance of physical activitybefore, during and after the treatment time. They all shared a common goal, which isto get better and healthier as soon as possible. The personas were constructed basedon information from four patients, a medical doctor and a physiotherapist.
2.2.6 Design Considerations
The majority of patients at the haematology department are quite weary and tireddue to the treatment. One design consideration that was taken into considerationwas that patients are not expected to be able to make a lot of interactions with the
9

application, thus it was vital to create a simple application that does not requireany mental effort. In addition, physiotherapists and doctors usually do not have alot of free time and therefore it was important to have an application that shows anoverview of the patient’s progress in a fast efficient way.
Another thing that was revealed during the user study was that in certain cases,patients might not be able to use the application; hence we had to consider that theusers of this application could range from patients, physiotherapists, doctors, nurses,relatives to friends who are interested in knowing more about the physical activity,performance and progress of the patients.
Due to limited time and budget, the first version of the application was developedto give a visual representation of the following quantified activities:
• Active
• Inactive
• Standing
• Sitting
2.3 Research Questions
The following research questions will be addressed in this thesis:
1. What are the existing wearable devices that encompass built-in sensors thatcan be used in a hospital setting to retrieve data such as body movements andheart rate from patients?
2. What are the current available motivational tools that motivate patients tomove more?
3. How will the activity levels of each patient be represented on the tablet tomotivate patients?
4. How usable is this application for physiotherapists, doctors and patients?
10
2.4 Contributions
The first contribution of this thesis project was to examine available wearable devicesthat can retrieve body movements and interview hospital staff to get their recommen-dations about the chosen device. Several requirements were set to help us choose aproper wearable device that can be used in a hospital setting without interfering withthe patient’s care.
The second contribution was the design and development of an Android applica-tion that helps cancer patients to increase their physical activity levels. The designand development have been done in a user-centric way close to patients and hospitalstaff. After every design iteration, we have conducted usability testing and interviewsto ensure that patients are able to understand our product and help design a betterinterface. The resulting application presented in Chapter 9 has been tested on sixpatients for one day as a part of the evaluation discussed in Chapter 10. Althoughthe application is considered a proof-of-concept only, it has gained high acceptancein the haematology clinic which opens doors for further development and research inthis domain.
2.5 Delimitations
It was quite difficult to engage prospective users in the design and development stagedue to their health conditions. Each usability testing / interview was conductedwith an average of three patients, which might not have been enough. Thus, thesesessions could be more accurate and collect more constructive qualitative feedback ifa minimum of five participants were involved in every session.
Another delimitation of this project is that due to limited time and resources, wehad to use a wearable device that already exists in the market for collecting patients’measurements. However, these devices are often equipped with a number of extrasensors that are not needed for this project. Thus, for a future iteration of thissystem, it seems more appropriate to design and develop a new wearable solutionthat is specifically created to meet the requirements of this project.
11
Chapter 3
Methodology
This thesis project has been created with the design science research methodology,which has helped structuring the work throughout the way. An agile prototypingmethodology has been used for the design and development of the prototype. Thischapter describes the general implementation, methodology, research, design and de-velopment of the motivational tool on Android platform.
3.1 Research method
Design science research has been chosen for this thesis project as it was found thatit suits well for our project. This research is defined as an innovative design whichinvolves creating an innovative artifact to solve a real-world problem [21, p. 9]. Designscience research can be conducted in a number of ways, but for this project, we havechosen to use Alan Henver’s guidelines which provides "an understanding of how toconduct, evaluate, and present design science research" [21, p. 12].
3.2 Guidelines
The following design science framework written by Alan Henver [21] has been used.These guidelines are used to describe the research process for this project.
1. Design as an artifact: research must provide a viable artifact.
• The final outcome of this thesis project is an Android application that isaimed to help patients be more motivated to increase their physical activitylevels through quantification.
12

2. Problem relevance: develop solutions to important and relevant business prob-lems.
• Cancer patients are susceptible to high levels of inactivity, which can behighly dangerous and results in long durations of hospitalisation, whichare costly in Sweden.
3. Design evaluation: the artifact must be demonstrated by good evaluation meth-ods.
• The design has been continuously evaluated by patients, doctors and phys-iotherapists who are the potential users of this software using observations,interviews and usability testing. Henver et al’s design science evaluationframework has been used to evaluate the resulting application.
4. Research contributions: effective design-science research must provide clear andverifiable contributions in the areas of the designed artifact.
• The contribution will be a prototype application with a minimal interfaceand interaction that shows patients their physical activity levels. Theresulting prototype is aimed to be used for a scientific study that will beconducted to evaluate the effect of quantifying patients’ activity levels ontheir quality of life and how it can reduce the hospitalisation period.
5. Research rigour: research relies upon the application of rigorous methods in boththe construction and evaluation of the artifact.
• Similar applications already available in the market have been researchedto learn and build on their work. The prototype has been created basedon iterative testing with patients, interviews and observations.
6. Design as a search process: utilise available means to reach desired ends whilesatisfying laws in the problem environment.
• An agile prototyping pattern has been used while developing the software.
7. Communication of research: Research must be presented efficiently both to tech-nology and management oriented audiences
13
• In addition to the application’s resulting design, this thesis is used to de-scribe the research to both technology-oriented and management-orientedaudiences.
3.3 Evaluation
Evaluation is a crucial part of the research process [21]. Evaluating a software canbe performed in various different ways, such as usability testing, security testing,performance testing and more [25]. But since this thesis was more involved in thedesign and development of the front-end part of the software, usability testing andinterviews with patients were performed throughout the project. In the end of thedevelopment, the application was tested (as discussed in Chapter 10) for one day withsix patients to evaluate the application’s potential, the application’s usability and thepatients’ acceptance and impression of the system.
Henver et al’s design science framework suggests several evaluation methods thatcan be used to evaluate a design artifact [21]. For this project, the following methodslisted in table 3.1 were used to evaluate the artifact developed (discussed in Section10).
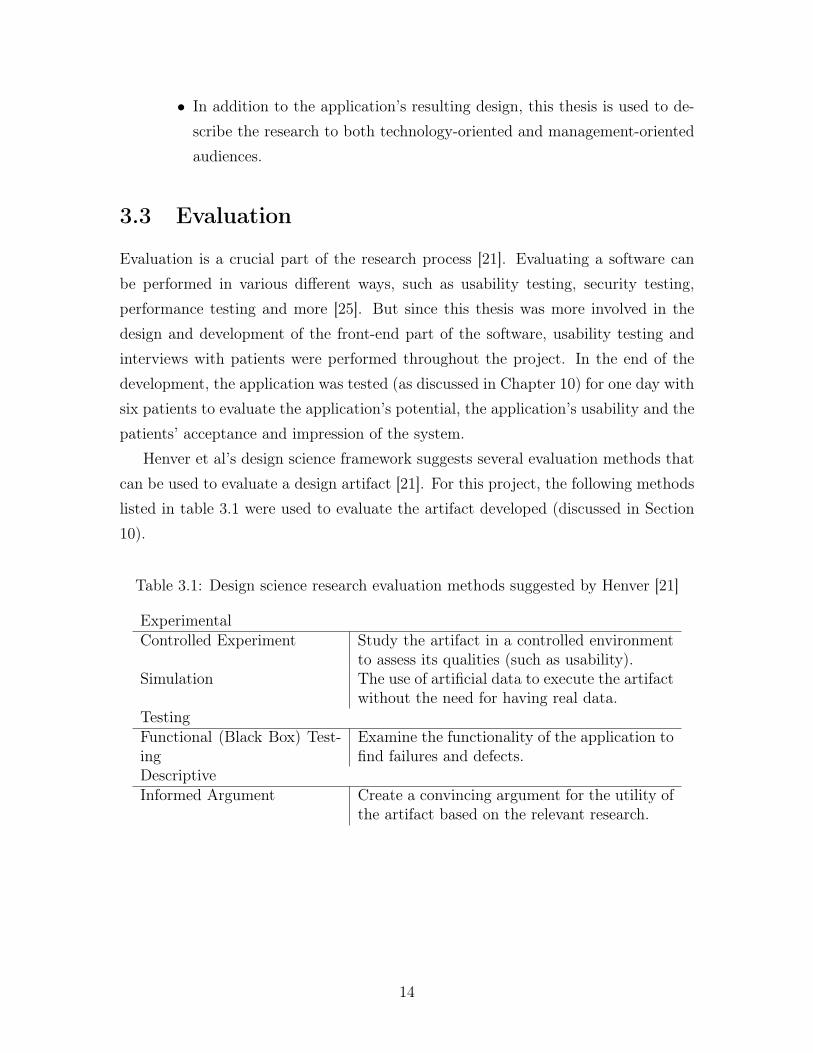
Table 3.1: Design science research evaluation methods suggested by Henver [21]
ExperimentalControlled Experiment Study the artifact in a controlled environment
to assess its qualities (such as usability).Simulation The use of artificial data to execute the artifact
without the need for having real data.TestingFunctional (Black Box) Test-ing
Examine the functionality of the application tofind failures and defects.
DescriptiveInformed Argument Create a convincing argument for the utility of
the artifact based on the relevant research.
14
3.4 Data Acquisition
This project was mainly based on collecting qualitative data from hospital staff andpatients.
• PatientsPatients being treated at the haematology clinic at Karolinska University Hos-pital for cancer were selected to participate in interviews, observations andusability testing. Getting constant qualitative feedback from them during theproject was highly beneficial as they directly match the targeted user groupwho is expected to be using the resulting motivational tool.
• Hospital Staff
– Martin Jädersten is medical doctor who works 50% as a haematologist atKarolinska University Hospital. He has helped us throughout the projectby giving us his feedback about the system and how to build a motivationalsoftware that can be implemented in the clinic.
– Nina Nissander is a physiotherapist who works at the haematology clinic.She has also helped us build the product by getting her qualitative feed-back after every design iteration. In addition, she helped us in findingpatients who are capable of being interviewed and participate in the us-ability testing.
3.5 Design and development methodology
In contrast to the waterfall model which follows a linear sequential manner for softwaredevelopment, the software development followed for the development of this projectwas performed in an iterative agile manner. This methodology was chosen to ensureusability and ease of use.
There were many issues that were taken into consideration while designing theinterface, as the product was being developed for a certain group of patients whowere not be expected to make an effort whilst using the tool.
The core workflow of the design and development pattern followed in this projectis represented in Figure 3-1. The pattern followed is inspired by the core workflow ofthe usability design discipline explained in an article that attempts to bridge the gaps
15
between software development and Human-Computer Interaction (HCI) [18, p. 125].The reason behind choosing this discipline was to increase usability and make surethat users, which in our case are patients fully fathom and grasp the user interface ofthe application without squinting one eye.
In order to accommodate for the needs of the users and know more about theirneeds, user engagement was incorporated throughout the project. The prototypingprocess began with designing a mockup of the application. Usability testing was thenperformed on the first iteration to evaluate the application’s usability. After gettingqualitative feedback from patients, a second iteration was designed and so on. Thedigital mock-ups were done in four iterations. We used several prototyping tools suchas Adobe Illustrator1, Balsamiq Mockups2, InVision3 and Apple Keynote4 to designthe mockups and make them interactive. Each iteration was followed by usabilitytesting or interviews with patients to evaluate the design and brainstorm conceptsthat were criticised in the evaluation as represented in Figure 3-1.
The transition from digital design mockups to implementation occurred when thefeedback from patients assured that the digital design is good enough. The twoimplementation iterations are discussed in Chapter 8.
1Adobe Illustrator - www.adobe.com/se/products/illustrator.html
2Balsamiq Mockups - https://balsamiq.com/products/mockups/
3InVision - www.invisionapp.com/
4Apple Keynote - https://www.apple.com/se/mac/keynote/
16
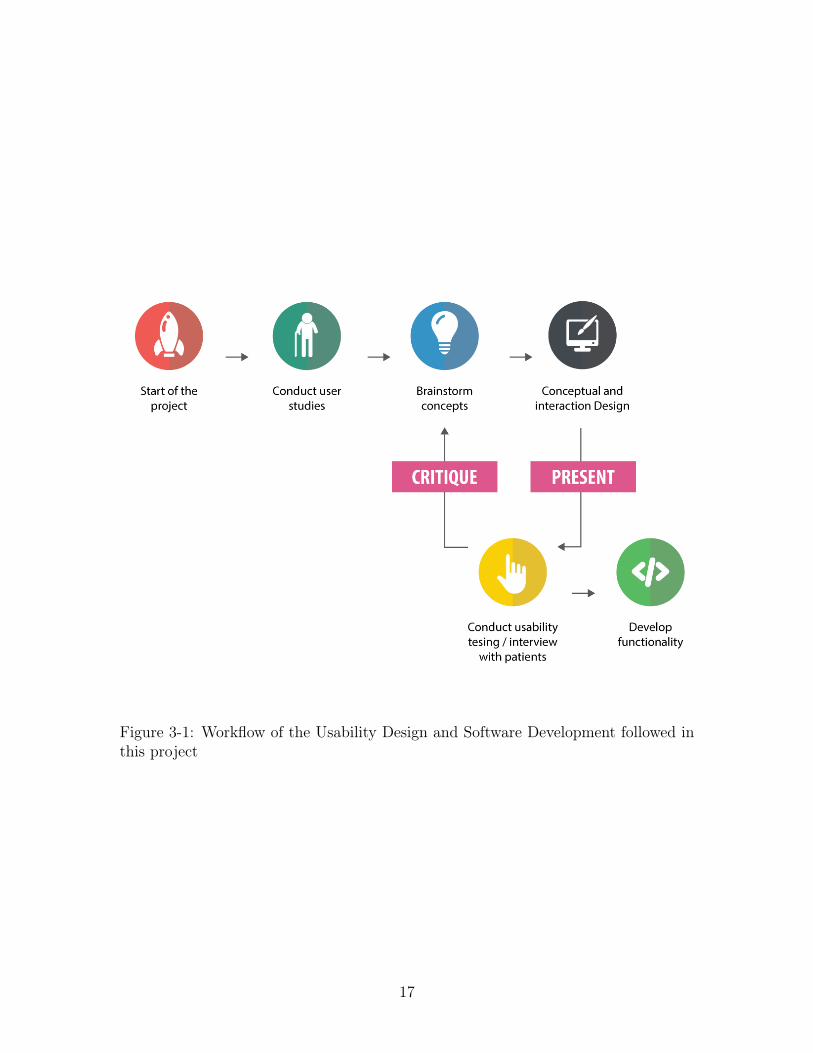
Figure 3-1: Workflow of the Usability Design and Software Development followed inthis project
17

Part II
Literature Review and Background
Study
18
Chapter 4
Literature Review
This chapter describes topics that are relevant to the knowledge base of this project.It was important to get a better understanding of the environment in which thisapplication will be implemented in. As a result, this chapter starts by describingchemotherapy, its side effects and then discusses the positive effects of physical ac-tivity for cancer patients. This is then followed by a brief overview of the currentmotivational tools used to increase patients’ physical activity levels. The chapter thenends with a discussion of how physical activity recognition can be performed.
4.1 Chemotherapy
This section aims to give a brief description of chemotherapy, its goals and the sideeffects accompanied with this treatment. As previously mentioned in Chapter 1,cancer treatment including chemotherapy and stem cell transplantation can have asignificant negative impact on the patient’s quality of life due to numerous reasons.The effects occur before, during and after the treatment. Chemotherapy is definedas the use of chemicals for the destruction of cancer cells, preventing them fromdividing and growing rapidly [40, p. 1]. What makes this type of treatment differentfrom other treatments is that it is usually used as a systematic treatment, meaningthat the drugs go through the whole body to reach the location of cancer cells. Theproblem with these drugs that destroy cancer cells is that they cannot differentiatebetween normal tissues (that are reproducing to replace worn-out normal cells) andcancer cells. Which as a result could damage and destroy normal cells in the processas a side effect [40, p. 3].
19
4.1.1 Goals of Chemotherapy
The three goals of a chemotherapy treatment are:
• Cure: the main goal of using chemotherapy treatment is to cure cancer in a wayso that cancer cells get utterly destroyed without returning back. Nevertheless,most doctors argue that chemotherapy should be described as a treatment witha curative intent, instead of being a treatment that cures due to the lack ofguarantees that ensure the effectiveness of this treatment for fully "curing"cancer [40, p. 4].
• Control: in some situations, being cured from cancer and destroying all cancercells from the body might not be possible, and thus the goal of chemotherapywould be to control the disease; stop cancer cells from growing and proliferating[40, p. 4].
• Palliation: this term refers to reducing or easing cancer symptoms. This goalaims to enhance the patient’s quality of life without having the capability oftreating the disease [7].
4.1.2 Common Side Effects of Chemotherapy
The side effects resulting from chemotherapy can vary from one patient to the other,as some might have a few or no side effects, while others might experience a few.Some of the common side effects are described below.
• FatigueOne of the most frequent and common side effects of chemotherapy affectingup to 70% of cancer patients is fatigue and tiredness. This symptom occurswhen the body is trying to repair its damaged cells. Since chemotherapy doesnot differentiate between cancer cells and healthy cells, healthy cells get de-stroyed during the treatment resulting in tiredness [14]. On the other hand,aerobic exercise can significantly reduce fatigue in cancer patients undergoingchemotherapy, more details about the importance of exercise for cancer patientsis discussed in Section 4.2. It is note worthy to mention that this symptom canbe caused by several other factors other than chemotherapy such as the canceritself, emotions, pain, lack of sleep, medications and lack of physical activitythat all contribute to this side effect [40].
20

• Quality of LifeAccording to World Health Organisation, Quality of Life (QoL) is defined asthe assessment of the general well-being of an individual based on an evaluationof the positive and negative parts of life [48]. Cancer greatly influences cancerpatients’ QoF [22] and increases the risk of developing depression. Mixed emo-tions of fear, anxiety and depression can overwhelm patients before, during andafter chemotherapy [33].
• NeutropeniaNeutropenia is defined as the presence of a low number of white blood cellswhich could result from receiving chemotherapy treatment. White blood cellsform a vital part of our immune system, thus having a low number of these cellsincreases the susceptibility to infections [33].
• Loss of Muscle Mass and weightOne cause of weight and muscle mass loss is the cancer itself. The tumourmass craves more energy which forces the body to be in a catabolic state, astate in which the body consumes more than its nutritional reserves, resultingin cachexia (loss of weight, weakness and fatigue). Moreover, chemotherapyaffects the gastrointestinal system which leads to various symptoms such asnausea, vomiting, diarrhoea and ineffective digestion, which all result in muscleand weight loss. In addition, fatigue reduces patients’ ability to exercise; hence,patients are more likely to be inactive and immobilised contributing to muscleloss [40].
4.2 Effects of physical activity on cancer patients
Physical activity is highly significant and beneficial for our systems, as it has numer-ous benefits such as strengthening our immune systems [50], reducing the risk forcardiovascular diseases and some types of cancers and improving our mental healthand mood [16]. As a result, recent research has been investigating the effect of exercisefor patients with severe diseases such as cancer.
In an interview conducted with a haematologist who currently works in the haema-tology department in Karolinska Hospital in 2015, doctor Martin Jädersten empha-sised about the importance of physical activity during the treatment time at the
21

hospital. He stated that physical activity can have a great impact on a patient’shealth and well being, as it decreases the risk of infection, reduces pressure ulcersand thrombosis (clotting of the blood in a part of the circulatory system), preservesmuscle mass and improves the general well being.
According to a number of studies, it has been found that physical activity duringcancer treatment has no harmful effect at all if the exercise was performed in mod-eration. In fact, a research shows that cancer patients who exercised on a regularbasis were less fatigue, which is one of the primary side effects of cancer treatment[13]. This is just one of the many advantages that physical activity brings duringcancer treatment. Another study found a significant benefit from exercise interven-tions on patients, stating that patients who received training during and after theirtreatment have shown a compelling increase in their Quality of Life which increasestheir physical performance [50]. In addition, since immobilisation and chemotherapyamong other factors affect the patients’ muscle mass, physical activity before, duringand after treatment can help maintain and increase muscle mass [43].
A significant study that assessed the effect of aerobic exercise on the physicalperformance of patients after high-dose chemotherapy reveals that patients who weregiven training during their hospitalisation period had 27% greater physical perfor-mance than those who were not given any training at their discharge [13].
Patients are highly susceptible to being inactive and immobilised during theirtreatment due to a number of factors. High levels of inactivity can be detrimental asit decreases the muscle strength by 5% per day [37], accelerates bone loss, increasesthe risk for thrombosis and increases the risk of pressure ulcers by 17% [13].
With all these studies that confirm the importance and safety of physical activityduring treatment, we can ask the question: Why aren’t all patients well-informedabout the importance of exercise? And how come inactivity is still an issue amonghospitalised cancer patients?
4.3 Motivational Tools that increase Physical Activ-
ity
Motivating cancer patients to exercise and move can be an intricate issue for phys-iotherapists, doctors and even patients’ relatives. With the emerging studies thatconfirm the positive impact that physical activity has on cancer patients [50], moti-
22

vating patients to exercise became a high priority for clinics.In the interview that was mentioned in Section 4.2, Dr. Martin Jädersten ex-
plained the challenges that doctors and physiotherapists face when they try to mo-tivate patients to move more and do more exercises. He also discussed the lack ofsufficient information about the patient’s physical activity levels which makes it diffi-cult to evaluate or measure how much each patient moves. The physiotherapist whoalso works at Karolinska Hospital stated in a different interview: "As a physiothera-pist, I cannot measure if patients perform the exercises and activities that I tell themto do." This clearly portrays the gap that exists between patients and staff.
The current traditional approach of motivating cancer patients to exercise andfollow exercise programs is done by physiotherapists. This approach of motivationrelies heavily on advice-giving and convincing that results in patient resistance [38].
This challenge has triggered clinics and researchers to try to find a successful wayof motivating patients to increase their physical activity. As a result, many studieshave been conducted to find the best way of motivating patients to move and exercise.
4.3.1 Pedometers
A pedometer is a digital device that keeps track of the number of steps taken by aperson. This device measures physical activity using a combination of a sensor andsoftware to track the number of steps made [39, p. 2]. With a 5% error margin [46],pedometers are considered reasonably accurate for measuring physical activity. Thesestep counting devices have been becoming increasingly popular as a measuring deviceand a motivational tool.
The reason that explains why pedometers can be an effective motivational toolthat motivates people to move is because these devices can continuously collect thecurrent activity being performed, give instant feedback on the person’s activity levels(how far a person is from achieving her / his activity goal), and be a reminder tostay active [39, p. 5]. Moreover, with the addition of a software, pedometers cankeep record of previous achievements which may be a motivational factor triggeringa cancer patient to achieve a higher level of fitness [35].
In a systematic review that attempted to evaluate the association of pedometer usewith an increased physical activity, it was found that these small insignificant deviceshave tremendously increased the physical activity of participants by an average of2491 steps per day [3]. This study revealed that the main predictor for the observed
23

increase in the physical activity of patients was having a daily goal that motivatedparticipants to achieve it (10000 steps per day). The results of this study are notsurprising, as when people get their physical activity levels quantified, they will beable to see much they have achieved, the fluctuations in their progress and how farthey are from reaching their goals. This helps people know themselves better andincreases their motivation to be fit and accomplish their daily fitness goals with anelement of fun.
4.3.2 Motivational Interviewing
The traditional approach of motivating patients to comply with an exercise programis done through direct persuasion and giving guidance and advice; nevertheless, theproblem that accompanies this approach is patient resistance that often involves ig-noring and interrupting the advisor or physiotherapist [38, p. 166]. This issue hasresulted in the development of an alternative method of approach called MotivationalInterviewing. Motivational interviewing is defined as a "directive, client-centeredcounselling style for eliciting behaviour change by helping clients to explore and re-solve ambivalence" [20]. This approach is more described as collaborative instead ofbeing authoritative, making it more successful than the traditional approach.
It is not uncommon for patients to neglect what they are advised to do by thedoctors or physiotherapists. Despite knowing the significance of physical activityfor their health, many patients tend to continue their treatment without showing anycompliance. Motivational Interviewing aims to tackle the patients’ lack of compliancein a different way that has shown a great success in numerous studies [38].
In a journal article that was written about motivating patients to move (2005),Nancy Huang [31] argues that motivating patients to increase their physical activityis achievable using an intervention that adopts the 5A’s Motivational Interviewingapproach during the consultation. This framework demonstrated in Figure 4-1 startsby Asking patients about their current behaviour to identify the need for increasingphysical activity. It is followed by Assessing patients’ current activity levels using atool such as a simple form that asks the patient about her or his activities. This partof the motivational interviewing that involves evaluating the performance of patientscan be radically enhanced if there was a tool that could accurately measure howactive patients are and how well are they doing. In order to increase the motivation forchange, this framework’s third stage is Advising patients which is done by linking the
24
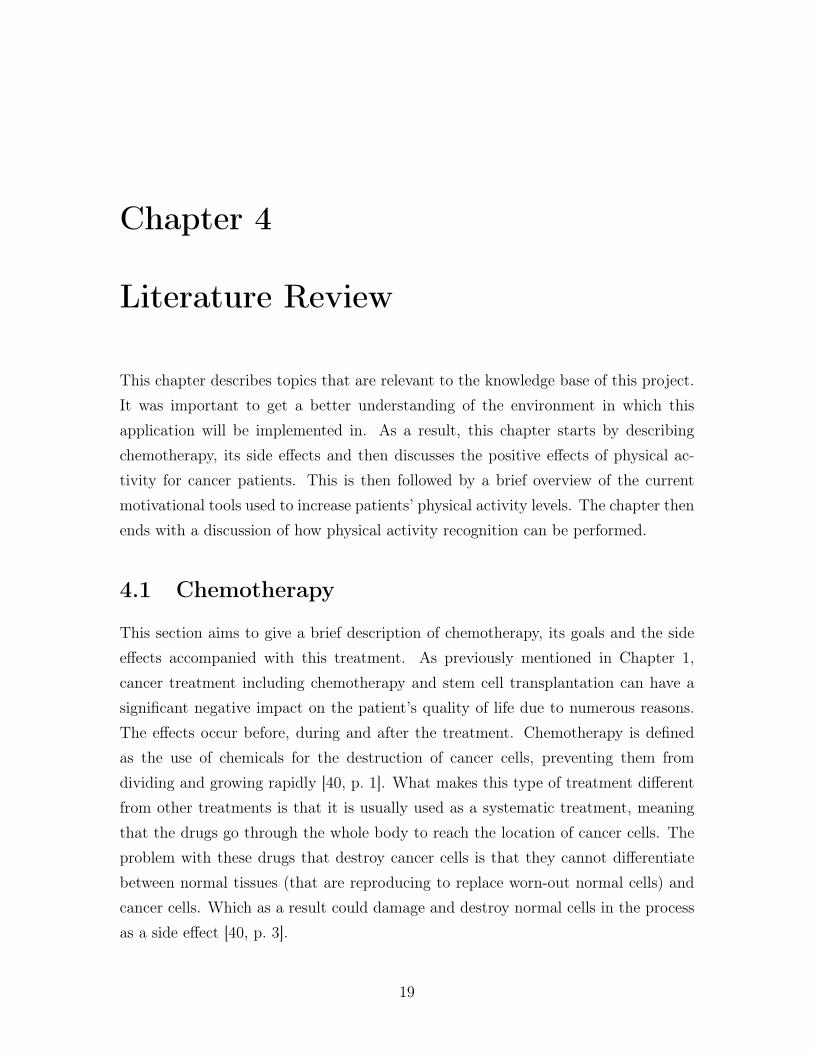
importance of physical activity on the patient’s life. This is done by giving feedbackabout the patient’s activity levels at that time. From here, Assisting comes nextwhich involves suggesting additional resources and options that could help patientsachieve their physical activity goals. The last stage is Arranging a follow-up thatwould keep that patient motivated[5, p. 2].
Figure 4-1: 5A’s Motivational Interviewing approach
4.4 Physical Activity Recognition
According to the World Health Organisation, physical activity is defined as "anybodily movement produced by skeletal muscles that requires energy expenditure"[34]. During a typical day, we perform a variety of activities. Whether it’s walking,running, sleeping, eating or cycling, activities require energy for them to be carriedout [2]. Activities can be classified in a number of ways including energy expenditure,frequency, time and intensity level.
Activity recognition is used to identify the action being performed by a personor an object using observations. In recent years, a great amount of research hasbeen conducted to find new ways of performing activity recognition. This type ofrecognition can be utilised in a variety of places and scenarios. More than ever,activity recognition has gained high importance in the medical industry, specially forelderly patients [2]. More over, preventive healthcare, which is the prevention of non-communicable disease is described as a vital application domain for human activityrecognition [16].
Identifying another person’s activity can be an easy task for humans to perform;on the other hand, it can be quite intricate for computers to do the same thing in anautomated way. Automatic recognition of physical activities aims to identify activities
25
that are being performed by humans [2]. There are a number of techniques that havebeen studied to perform automated physical activity recognition.
4.4.1 Methods and Techniques
One of the most common techniques used for activity recognition is cameras. Themain advantage of using this technique is that users are not required to wear anydevice; nevertheless, this technique can be problematic due to a number of reasons.One problem is that this technique is dependent on light and ambient conditions.Another drawback is that there are some privacy concerns, as people might not feelcomfortable being recorded during their day. Moreover, cameras require physicalinstallation which could be expensive and infeasible in some situations.
In addition to cameras, a widely accepted technique that is also used for activityrecognition is wearable electronics such as watches or bracelets that encompass tech-nology capable of retrieving information that can be utilised to identify the person’sphysical activities.
Here are some of the sensors that are commonly used in activity recognition:
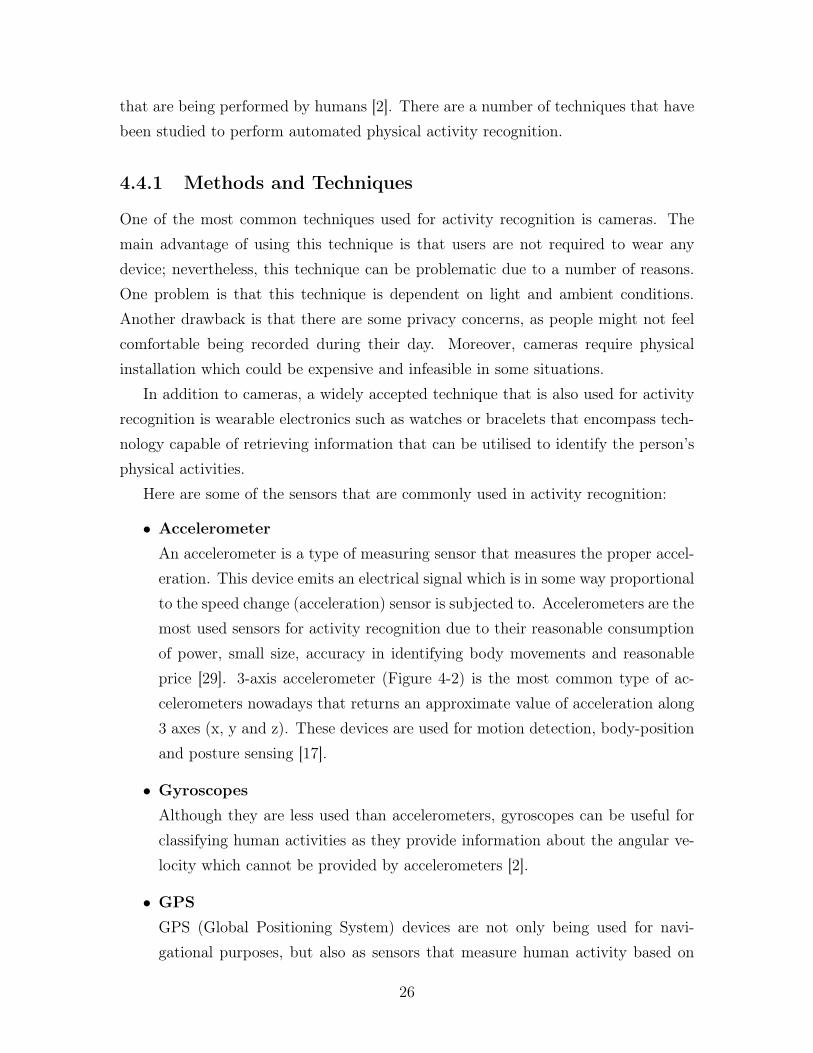
• AccelerometerAn accelerometer is a type of measuring sensor that measures the proper accel-eration. This device emits an electrical signal which is in some way proportionalto the speed change (acceleration) sensor is subjected to. Accelerometers are themost used sensors for activity recognition due to their reasonable consumptionof power, small size, accuracy in identifying body movements and reasonableprice [29]. 3-axis accelerometer (Figure 4-2) is the most common type of ac-celerometers nowadays that returns an approximate value of acceleration along3 axes (x, y and z). These devices are used for motion detection, body-positionand posture sensing [17].
• GyroscopesAlthough they are less used than accelerometers, gyroscopes can be useful forclassifying human activities as they provide information about the angular ve-locity which cannot be provided by accelerometers [2].
• GPSGPS (Global Positioning System) devices are not only being used for navi-gational purposes, but also as sensors that measure human activity based on
26
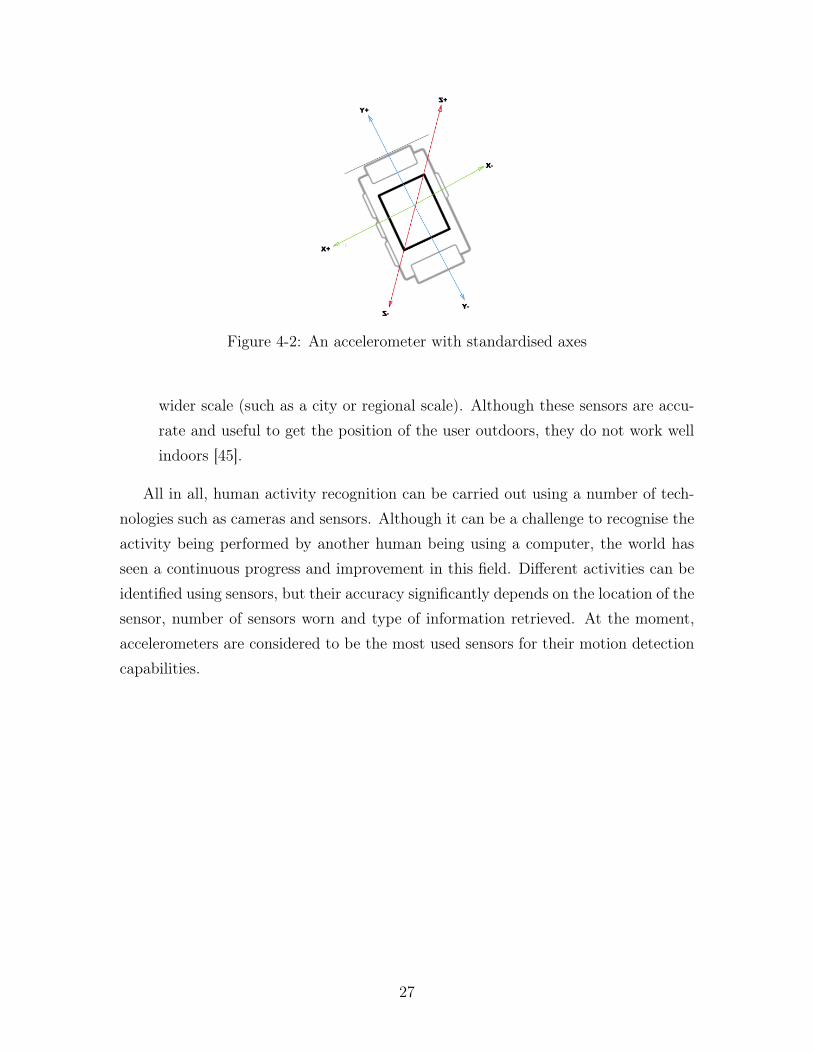
Figure 4-2: An accelerometer with standardised axes
wider scale (such as a city or regional scale). Although these sensors are accu-rate and useful to get the position of the user outdoors, they do not work wellindoors [45].
All in all, human activity recognition can be carried out using a number of tech-nologies such as cameras and sensors. Although it can be a challenge to recognise theactivity being performed by another human being using a computer, the world hasseen a continuous progress and improvement in this field. Different activities can beidentified using sensors, but their accuracy significantly depends on the location of thesensor, number of sensors worn and type of information retrieved. At the moment,accelerometers are considered to be the most used sensors for their motion detectioncapabilities.
27

Chapter 5
Mobile Health Solutions
This chapter describes some of the tools that have been developed with a similaraim to the one taken in this project, which involves helping patients get better andreducing costs for hospitals and patients. Numerous mobile health solutions have beenon the rise in the past years, specially with the prevalence of light-weight inexpensivewearable sensors [26]. Mobile health solutions can significantly help the movement ofinformation between patients and health care providers and give a better overview ofhow the patient is feeling. These solutions also actively increase patient participation,giving an opportunity for patients to feel more involved in their own treatment.
5.1 Mayo Clinic myCare
Mayo Clinic myCare program uses an iPad tablet to supply patients with compre-hensive information about their treatment [9]. This program is created to guide andsupport recovery. The main aim of this application is to help cardiac surgery pa-tients and their relatives engage in the pre and post-surgery process. It gives detailedinformation about the patient’s expected plan of stay and plan of day. Moreover,it provides comprehensive educational content, giving patients and their relatives abetter overview of what they need to know before and after surgery to help themrecover and manage their pain more efficiently. Also, this product has a "To Do" listthat gives the patient a set of tasks that she or he has to do, such as a movementassessment or breathing exercises all of which are set to help patients feel better andmore engaged. Pain self-assessment gives patients the capability to enter how they arefeeling using a Visual Analog Scale (VAS). This helps patients manage their pain and
28

keep it under control to do what is required to help them recover faster [8]. Patientscan still use the application even when they have been discharged from the hospital.
Figure 5-1: A screenshot of Mayo myCare program’s patient view
The data retrieved by the tablet get sent to a server in the cloud to let nurses andphysicians caring for the patients access patients’ information. Figure 5-2 shows apopulation patient dashboard which shows all patients involved in the program. Thecare providers can also view a dashboard for a specific patient as well [9].
After developing the application, Mayo Clinic wanted to evaluate the results andbenefits achieved from using the application. In 2012, a total of 134 patients par-ticipated in the study and the results suggested that this program can help reducehospitalisation time, decrease cost of care and enhance patients’ ability to be moreindependent after being discharged from the hospital [9]. A year later, Mayo Clinichas decided to utilise FitBit technology with their MyCare app program to track themobility of the patient and show the results on the tablet, which is similar to what
29
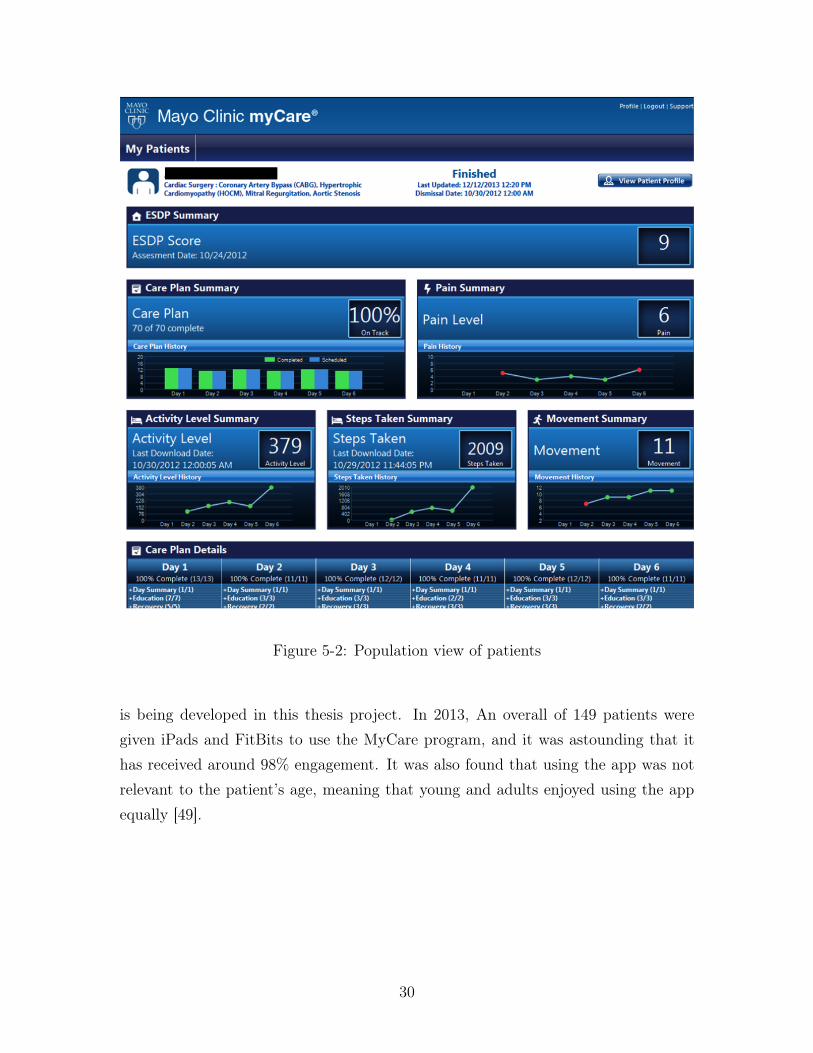
Figure 5-2: Population view of patients
is being developed in this thesis project. In 2013, An overall of 149 patients weregiven iPads and FitBits to use the MyCare program, and it was astounding that ithas received around 98% engagement. It was also found that using the app was notrelevant to the patient’s age, meaning that young and adults enjoyed using the appequally [49].
30

5.2 ZephyrLIFE Hospital - Wearable Patient Moni-
toring System
ZephyrLIFE Hospital is a wearable patient monitoring system for patients staying atthe hospital. This system makes use of a wireless BioPatch, a patch worn on the pa-tient’s chest that send signals to ZephyrLIFE monitoring system using a mesh radio.The system measures vital signals including heart rate, respiration, blood pressure,activity minutes, posture, body temperature and more. As shown in Figure 5-3, thissystem combines vital signals sent using a mesh radio and secure wireless commu-nications to provide patient monitoring through a central monitoring system. Thissystem is designed to facilitate remote patient monitoring in an easy and simple way.First, the BioPatch applied on patients retrieves vital signals that get transmitted toZephyrLife Central Monitoring Station using a secure connection initiated by a MeshRadio. The hospital staff then get access to the data using the ZephyrLife CentralMonitoring Station. This monitoring station is made to provide a secure terminal inwhich hospital staff can monitor patients’ health at all times.
Despite the efficiency in centralising patients’ data in one system, the wirelessdevice (BioPatch) applied on patients have a battery life of only 24 hours. As aresult, this device requires frequent charging, which causes some troublesome forpatients and staff as these devices have to be taken away and put on charge, and thenput back on patients once they run out of battery. On the other hand, the device ismade to be easily disinfected by normal cleaning agents, and this feature is highlyimportant for devices used in a hospital environment [51].
5.3 Welfare Denmark’s Virtual Rehabilitation
Welfare Denmark’s Virtual Rehabilitation is the world’s most advanced virtual re-habilitation system in the health care industry. This system can be described as atool that assists physiotherapists and patients by providing efficient rehabilitation topatients right in their homes. This training-system is based on a combination of aMicrosoft Kinect-sensor that detects the body’s movements and training programsset by physiotherapists. The training programs can be accessed from the patient’shome. The patient accesses the training program that was set by the physiother-apists, resulting in an easy and manageable way for therapist to have full control.
31
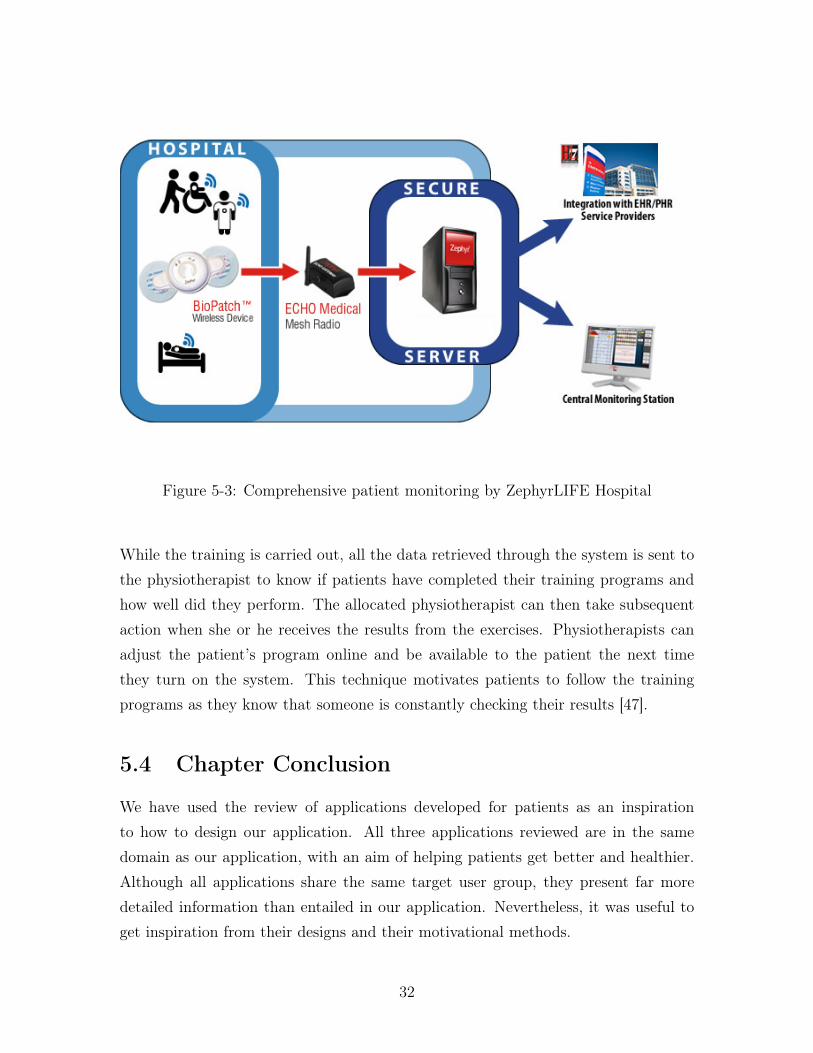
Figure 5-3: Comprehensive patient monitoring by ZephyrLIFE Hospital
While the training is carried out, all the data retrieved through the system is sent tothe physiotherapist to know if patients have completed their training programs andhow well did they perform. The allocated physiotherapist can then take subsequentaction when she or he receives the results from the exercises. Physiotherapists canadjust the patient’s program online and be available to the patient the next timethey turn on the system. This technique motivates patients to follow the trainingprograms as they know that someone is constantly checking their results [47].
5.4 Chapter Conclusion
We have used the review of applications developed for patients as an inspirationto how to design our application. All three applications reviewed are in the samedomain as our application, with an aim of helping patients get better and healthier.Although all applications share the same target user group, they present far moredetailed information than entailed in our application. Nevertheless, it was useful toget inspiration from their designs and their motivational methods.
32

Chapter 6
Wearable Devices
IoT has been thriving rapidly in the past years due to the availability of low-costsensors that are available in the market with various kinds of functionality [42, p. 219].Numerous devices and solutions currently available in the market include sensors thatare able to retrieve a vast amount of data that help quantify users. Such devices canretrieve movements using an accelerometer, heart rate using an ECG, temperature,moisture and location via a GPS and many more measurements.
6.1 Device Requirements
While studying the numerous wearable devices that are available in the market, sev-eral factors were taken into consideration. The chosen wearable solution had to com-ply with the following requirements for this project as the target users were patients.Some of these requirements were added as a recommendation from the hospital staffat Karolinska Hospital.
• The wearable solution should be based on an open platform that allows openaccess to the data retrieved by the sensor; hence an open SDK is needed.
• The wearable solution must encompass an accelerometer and/or gyroscope tocapture the body’s movement.
• The wearable solution should provide a wearable solution that can be easilyworn by patients without any discomfort.
• The wearable solution should be water resistant to make it possible for thedevice to move between patients without spreading any contamination, thus it
33

is highly vital that the device can be disinfected using a sanitiser in a fast, safeand simple way. The device should be able to be worn while showering.
• The wearable solution should not interfere with taking care of patients. Theplacement of the device should be adequate without causing any sort of inter-ference to normal practices performed in the hospital.
• The wearable solution should be fully automatic and work without any user in-teraction. Patients are not expected to be interacting with the sensor; thereforethe sensor should be able to work and connect to the tablet without any humaninteraction.
• The wearable solution should have a long battery life. A minimum battery lifeof five days is adequate for this research project, as having to charge the devicefrequently might interfere with the patient’s comfort.
• The wearable solution must be accompanied with low-energy Bluetooth 4.0technology to reduce battery consumption.
6.2 Devices
This section examines the wearable devices currently available in the market basedon several factors including the sensors embedded in the device, performance, bat-tery life, availability, water-resistance, compatible operating systems, placement andconnectivity. This analysis was conducted to find an adequate wearable device thatcan be used for this project.
Fitbit Surge
Fitbit Surge, released in the last quarter of 2014, is one of the latest editions to Fitbit’swearable fitness devices. What makes it different from previous Fitbit editions is thatthis device encompasses GPS tracking, in addition to continuous heart rate monitoring[24, p. 104]. What makes this device suitable for this project is that it has a built-in accelerometer and a long lasting battery life that lasts more than 7 days, whichis quite impressive in comparison to other wearable fitness devices. Nevertheless,the problem with this wearable device is that raw data collected via the built-inaccelerometer cannot be retrieved as the API merely allows access to Fitbit user’s
34
data and not raw accelerometer data making it impossible to access raw data withoutbeing processed through Fitbit’s application. In addition, the surge is accompaniedwith a screen that allows user interaction, thus this is another reason that makes itinadequate for this project as one of the requirements for the chosen device is that itshould be used without any user interaction.Sensors: 3D accelerometer, vibration motor, GPS, gyroscope, altimeter, ambient lightsensor, compass and heart-rate sensorOS Compatibility: Android and iOSConnectivity: Bluetooth 4.0Battery Life: 7+ daysRaw Access: not accessibleDisinfection method: can be cleaned with a soapless cleanser
Fitbit Charge HR
Fitbit Charge Heart Rate is very similar to Surge except that it has a smaller OLEDscreen. It was also released with the Surge in the end of 2014. Fitbit Charge HRlasts for a shorter period than its sister device (Surge) with only 5 days of batterylife. Despite being a good choice for this project for the data that it can retrieve,Fitbit Charge HR does not allow developers to access unprocessed raw data retrievedthrough the built-in sensors in the device, hence it cannot be used for this project [2].Sensors: 3D accelerometer, altimeter, vibration motor and optical heart-rate sensorOS Compatibility: Android and iOSConnectivity: Bluetooth 4.0Battery Life: 5 daysRaw Access: not accessibleDisinfection method: can be cleaned with a soapless cleanser
Microsoft Band
Although Microsoft band is equipped with 10 different sensors that can track thebody’s movement, heart rate, sleep quality and UV exposure, the wearable devicethat’s compatible with Android, iOS, Windows Phone, Mac OS X and Windows hasa battery life of only 48 hours [2]. The short battery life makes this device unsuitable
35
for a hospital setting, as the aim of this project is to use a sensor that has a longlasting battery life to reduce the frequency of removing the device off the patient forcharging.Sensors: 3D accelerometer, thermometer, ambient light, UV sensor, microphone andoptical heart-rate sensorOS Compatibility: Android, iOS, Mac OSX, Windows and Windows PhoneConnectivity: USB and Bluetooth 4.0Battery Life: 48 hoursRaw Access: not accessibleDisinfection method: instructions on Microsoft’s website state that the device can becleaned using a screen wipe, soft cloth, and a cotton swab after being dipped in water.
Olive
Olive is a wearable device that aims to help people manage and reduce their stresslevels. This device uses data retrieved from its built-in sensors to learn the person’slifestyle pattern, and thus making the experience more personalised [28]. Despitehaving a minimum interface that makes its industrial design great for our solution,Olive does not have an open API that developers can use to build their products. Inaddition, the first estimated shipping date for delivery is in November 2015 which isafter the duration of this project.Sensors: 3D accelerometer, optical pulse sensor, ambient light sensor, touch surfaceand skin conductance sensorOS Compatibility: iOS and AndroidConnectivity: Bluetooth 4.0Battery Life: unknownRaw Access: not accessibleDisinfection method: can be cleaned using a soft cloth dipped in water.
Nike+ FuelBand SE
Nike+ FuelBand is a dominant market product [19] that is considered to be an activitytracker worn on the wrist. This device measures the number of steps made per dayusing a 3D accelerometer. What makes this device special and unique in comparison
36

to its competitors is that it has a concept of "Fuels" which represents a score thatkeeps track of how much each user moves. The more you move, the more fuel pointsyou earn. The main aim of using a wearable device in our project is to utilise itssensors, and although an accelerometer would be great for activity recognition, Nike+Fuelband’s API allows developers to handle activity services (such as retrieving listof activities, retrieving GPS data and adding activities) but without the ability toaccess the raw data collected by the built-in 3D accelerometer [30].Sensors: 3D accelerometer and light sensorOS Compatibility: Android, iOSConnectivity: USB and Bluetooth 4.0Battery Life: up to 4 daysRaw Access: not accessibleDisinfection method: can be disinfected by rubbing the device with a cloth dipped inalcohol.
Pebble
Pebble smart watch is a waterproof cheap smart watch that has a long-lasting batterythat can last up-to 7 days. Ranked as one of the best watches for the money, Pebbleconnects to an iPhone or Android via Bluetooth. In addition, this watch encompassessensors that recognise one’s activities. What makes this activity tracker better thanothers for our project is that it provides open access to the collected data, which meansthat all measurements retrieved by the Pebble’s accelerometer can be accessed. Thismakes this device suit well for this project.Sensors: 3D accelerometer, compass and light sensorOS Compatibility: Android, iOSConnectivity: Bluetooth 4.0Battery Life: up to 7 daysRaw Access: open platformDisinfection method: can be disinfected with a cleaning cloth moistened with water,alcohol or a mild detergent.
37

6.3 Comparison Summary Table
In Table B, a comparison summary of the analysed wearable solutions is shown tobriefly summarise the features and capabilities of each device. The comparison isbased on a number of features including the placement of the wearable device, sen-sors embedded in the device, battery life, charging time, memory, user interaction,disinfection method, water-resistance, compatibility with Android and if the deviceallows developers to access to the raw data.
6.3.1 Conclusion
Although the emerging use of wearable technology and the rise of an age of smartwatches have resulted in numerous devices to be available in the market; however,most of these devices do not allow developers to access the raw data retrieved by thebuilt-in sensors encompassed by the device, which was one of the main requirementswhilst choosing a device.
Figure 6-1: Pebble
After performing a comprehensive comparisonbetween a vast number of wearable solutions avail-able in the market, the Pebble watch has beenchosen to be used for this project due to a numberof reasons. In addition to having a 3D accelerometerthat can retrieve measurements of the user’s move-ments, Pebble Watch is a lightweight device thatwas found to be one of the best wearable devicesfor this project. The detachable rubber bands at-tached to the watch were very useful for testing thedevice on patients, as the bands were removed andthe device was put on the patient’s chest instead of the wrist in order to detect abroader range of activities. This device is android compatible; PebbleKit Androidlibrary was added to the project to connect the Android application to the pebblewatch. Regarding its connectivity, this device is connected via Bluetooth 4.0 which isconsidered to be a low energy technology which reduces the battery consumption [42,p. 220]. Since the product is aimed to be applied in clinics in hospitals, thus it was ofhigh importance for the device to have a long lasting battery to reduce the hassle offrequent charging of this device, and Pebble watch definitely wins over its competi-
38

tors when it comes to battery life by offering a weeklong battery life. Moreover, itwas necessary to find a device that could be disinfected easily and can be worn whileshowering, and with water resistance up to 50 meters, Pebble watch can definitely bea great product for this purpose.
In order to test the adequacy of this device for this project, one of the team mem-bers has attached the Pebble on her chest with a medical patch for five consecutivedays without showing any problems while showering, exercising, sleeping and doingnormal daily activities.
Moreover, testing the device while sending accelerometer data to the tablet washighly important to evaluate if we can use this system for long periods of time. Itwas found that the device’s battery is capable of continuously sending data to thetablet for 5 - 6 days. The Pebble’s capacity of saving the captured data without beingconnected to a tablet was also evaluated as well. The Pebble is capable of saving 3hours of data logging without a connection; otherwise, the device starts erasing theoldest measurements to make space for new ones.
39

Part III
Application Design and Development
40
Chapter 7
Application Design
This chapter introduces the challenges that have been encountered while designingthe motivational tool and then discuss the design iterations.
7.1 Design challenges
This section gives a brief overview of the risks and challenges that have been facedwhile designing the interface and during the usability testing sessions.
User experience
As previously discussed in Section 3.5, it was highly important to focus on the usabil-ity of the motivational tool as the target users are patients who are being treated forcancer at the hospital. And thus, we had to involve patients throughout the projectto ensure that they can effectively understand and interact with our application. Wehad to give patients an overview of their activity levels in a lucid way that wouldmotivate them to move more without getting in the way of their treatment. Mostpatients being treated for cancer feel fatigue and tired, and thus this issue had to betaken into consideration while designing this system. Although user-engagement isconsidered to consume a great amount of time and effort; however, it was exceedinglyimportant to work in a user-centred way.
41

Iterations
The adequate number of iterations set for the design and the development of theapplication was not known from the start. But as we moved from one iteration tothe next one, the interface’s usability increased. After four iterations of the digitaldesign of the application, the interface was usable enough to be implemented. Thisis when we chose to switch from the digital design to the implementation.
Usability testing sessions
With the help of the physiotherapist who works at the haematology clinic in Karolin-ska Hospital, Nina Nissander, we were able to conduct usability testing with prospec-tive users who were chosen from the list of patients currently present in the clinic.Each individual session lasted about half an hour. During each session, patients weregiven a brief overview of the purpose of the application and the test session. Pa-tients were then asked to perform a series of tasks. In addition, each session capturedpatients’ opinion and feedback regarding this motivational tool.
Selection of test users
The users who were selected for the usability testing were patients getting treatedfor cancer at the haematology clinic in Karolinska Hospital. Since not all patientswere healthy enough to be interviewed or involved in the study, the physiotherapistassisted us in finding patients who are well enough to be involved.
Language barrier
The users who were interviewed and selected for the usability testing were all Swedish,and hence the language that was used for the application, interviews and usabilitytesting was Swedish. Nevertheless, with the help of the accompanied doctor(s) andphysiotherapist(s), this issue was handled.
7.2 Prototyping
This section describes the prototyping process that was followed during this project.This includes designing digital mockups of the application and testing them on users
42

to get their feedback which was constructive to every iteration.
7.2.1 Usability Testing
Usability testing is defined as "evaluating a product or service by testing it with rep-resentative users" [44]. For a product or a service to be usable, it has to be effective,adaptable, accessible, efficient, useful without causing any frustration. Having a us-able product means that the user can easily understand the product and can navigatethrough it without any hindrance or confusion [36, p. 4].
The main aim of the motivational tool created in this project was to motivatecancer patients to increase their physical activity by giving instant feedback of theirphysical activity levels. As a result, usability of the product was of high importance toensure that patients are able to understand what the product is portraying. Accord-ing to Handbook of Usability Testing (2011), Jeffrey Rubin and Dana Chisnell arguethat the best practice for conducting an effective usability testing involves creatinga solid test plan prior to the usability testing [36, p. 66]. The second stage involvesrecruiting participants, followed by conducting the usability testing with the partic-ipants involved. The final stage is to document the findings of the usability testingand analyse the results. The usability testing in this project has been performed inthe same way suggested in the book. The first usability testing was conducted afterthe design of the initial concept mentioned in the introduction.
The following part discusses the internal design cycles that were performed whiledeveloping the software.
7.2.2 Design Iteration 1
After conducting the user study at the hospital, a first mockup was designed tovisualise the patients’ activity levels. To evaluate the usability of the initial digitaldesign of the interface, a usability testing was conducted on the 19th of February, 2015with assistance from Dr. Johan Hedevåg and physiotherapist Nina Nissander. In thisinterface, shown in Section C.1 in the Appendix, users are able to track their activitiesusing vertical bar charts. Users are also able to check their history that shows a linediagram summarising their activity levels in the previous days and enter their painand mood levels. A concept of "Activity Points" was created for this interface to keeptrack of the patients’ progress in one number. This number is calculated depending
43

on the weight of each activity and the time spent on it. Physiotherapists are able toset goals in terms of "Activity Points" for each patient.
Usability Testing Summary
The purpose of the usability test was to assess the usability of the user interface, thepresented information and information flow. A total of 3 patients were involved in theusability test to ensure stable results. In general, all patients found the applicationeasy to use, clear, and straightforward; however, the test identified some problemsincluding:
• Misinterpretation of the "How are you doing" button due to the scale imagebehind it.
• Misunderstanding of the icon that resembles the activity "sitting up". A patientassumed that it represents waking up instead.
• Misunderstanding the icon that resembles the activity "lying down", a patientthought that it might resemble sleeping which caused some confusion.
• It was rather difficult to understand what "earlier results" meant in the moodpage, as the word earlier can be vague.
• Misunderstanding the titles due to their location below the charts / activities.
• Misunderstanding the general definition of the concept of activity points.
• Confusion about the term "Spara" which is the submit button in the moodpage.
Evaluation Tasks
Test participants were asked to complete the following tasks:
1. Check your history.
2. Check yesterday’s daily overview.
3. Fill in how you’re feeling.
4. Compare your performance between yesterday and today.
44

Results
Table 7.1: Task Completion Analysis
Patient Task 1 Task 2 Task 3 Task 4 Patient success rate1 100%2 75%3 50%Success 3 3 1 2 avg: 75%Task Completion Rates 100% 100% 33.30% 66.70% -
All participants successfully completed the first two tasks (check your history andcheck yesterday’s daily overview). Only one of them (33.3%) was able to completetask 3 (navigate to the mood/pain page) probable due to the confusion caused by thescale behind the button. Two of the participants (66.7%) were able to complete task4 (compare your performance between yesterday and today).
Task Ratings
1. Check your historyAll participants agreed that navigating to the history page is easy, regardless oftheir computer literacy.
2. Check yesterday’s daily overviewThe left navigation button was easy to find on the daily overview page, andthus caused no confusion for the patient to check yesterday’s daily overview.
3. Fill in how you’re feelingOnly one patient was able to complete this task without any confusion. Theother two patients thought that the "hur mår du?" button is a scale that can bemoved up and down. Hence, instead of pressing on the button, they attemptedmoving this fixed button vertically, which did not result in any change.
4. Compare your performance between yesterday and todayOne of the patients did not fully fathom what activity points are, and hence tookhim more time to understand the difference between his performance yesterdayand today.
45
Recommended Changes
The following recommendations were set to be analysed and worked upon to enhancethe overall intuitiveness and ease of use of the application before conducting a secondusability testing session.
• Remove the scale behind the "hur mår du?" button to make it clear that thisbutton is clickable without confusion.
• Put the titles on top of the charts instead of the bottom part.
• Add labels for each icon explaining each activity.
• Improve the icon that represents sitting up.
• Have a better explanation for Active Points
• Add a last input timestamp for the gauge charts that show what mood or painhas been previously entered.
7.2.3 Design Iteration 2
The interface for this iteration was designed after performing the recommendedchanges of the first usability testing and can be found in Section C.2. To evalu-ate its usability, usability testing was conducted on the 25th of February, 2015 withassistance from Dr. Johan Hedevåg and physiotherapist Nina Nissander. To addressthe problem with patients having difficulties entering their pain and mood levels, weadded an avatar with a button that asks the patient about their current status.
Usability Testing Summary
The purpose of this usability test was to assess the usability of the user interface afterdoing the recommended changes that were instructed in the first usability testing. Atotal of 3 patients were involved in the usability test to ensure stable results. Thetest has identified some problems including:
• Misinterpretation of the "How are you doing" button due to the figure.
• It was a bit difficult to compare between current and earlier entries in the mood/ pain page.
46
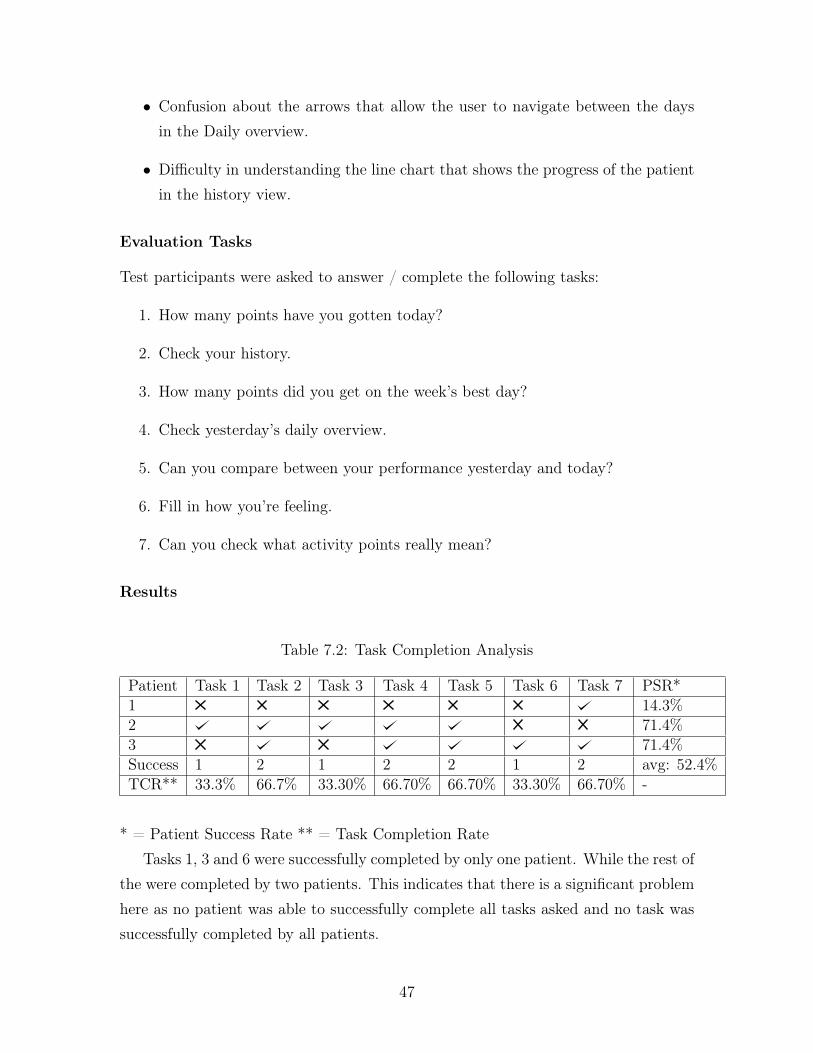
• Confusion about the arrows that allow the user to navigate between the daysin the Daily overview.
• Difficulty in understanding the line chart that shows the progress of the patientin the history view.
Evaluation Tasks
Test participants were asked to answer / complete the following tasks:
1. How many points have you gotten today?
2. Check your history.
3. How many points did you get on the week’s best day?
4. Check yesterday’s daily overview.
5. Can you compare between your performance yesterday and today?
6. Fill in how you’re feeling.
7. Can you check what activity points really mean?
Results
Table 7.2: Task Completion Analysis
Patient Task 1 Task 2 Task 3 Task 4 Task 5 Task 6 Task 7 PSR*1 14.3%2 71.4%3 71.4%Success 1 2 1 2 2 1 2 avg: 52.4%TCR** 33.3% 66.7% 33.30% 66.70% 66.70% 33.30% 66.70% -
* = Patient Success Rate ** = Task Completion RateTasks 1, 3 and 6 were successfully completed by only one patient. While the rest of
the were completed by two patients. This indicates that there is a significant problemhere as no patient was able to successfully complete all tasks asked and no task wassuccessfully completed by all patients.
47

Task Ratings
1. How many points have you gotten today?Only one participant was able to locate the number of points achieved today,this might be due to the location of the text that indicates the number of pointsachieved, as it’s located underneath the chart. Patients were not able to locatethe text due to its location and size.
2. Check your history.Two patients were able to locate the history button easily. some patients wereable to understand the changes that have been occurring with their activitiesfrom the line chart. However, it might be more understandable to have a chartthat shows the correlation between these activities in a better way. One patientdid not understand that she was on the history page, despite having that tabhighlighted.
3. How many points did you get on the week’s best day?Only one patient was able to locate the "week’s best day" and understand howmany points have been obtained on that day. However, it might have beenconfusing to have the number of points achieved inside the chart, which is notthe same for the daily page.
4. Check yesterday’s daily overview.Two out of the three patients were able to easily navigate to yesterday’s dailyoverview. Perhaps we could have "Previous day" and "Next day" to indicatewhat these arrows resemble to make it easier for users to navigate between days.
5. Can you compare between your performance yesterday and today?Two out of the three patients were able to easily compare their performancebetween today and the day before. They used the bars and the circular progressbar that represents the completed active points as a factor for comparison.
6. Fill in how you’re feeling.One of the patients had no idea how to fill this in. She said "I don’t know".The other two patients were eventually able to locate the button that lets youfill in your information, but it was not intuitive. One patient pressed the figureinstead of the button at first. Another one pressed the bubble. It was hard
48
for patients to compare their current status with the previously entered mood/ status. And this indicates another problem with the design.
7. Can you check what active points really mean?It was generally easy for patients to understand that the question mark wouldlet them know more information about what activity points really mean. Onepatient clicked on the circular chart instead of the question mark. They hadtrouble hitting the question mark and missed it when they tried to push it.
Recommended Changes
The following recommendations were analysed after the second iteration.
• Change the location and increase the size of the activity points achieved today,as it was not obvious for the patients.
• Line chart in the history page should be easier to understand.
• A clear line between history and best day to show that they are separate
• Think about the consistency between the activity points chart, as the one inthe daily page represents the percentage achieved in the middle, whereas theone in the history page shows the number of points achieved. Thus, these twocharts should be more consistent in order to increase the intuitiveness of theapplication.
• Add "Next day" and "Previous day" next to the arrows that allow the user tonavigate between days in the daily overview page.
• "How are you feeling" button should be changed so that it’s easy to understandto motivate patients to enter their current pain and mood levels.
• Add Hours/Minutes/Time axis on the column chart in the daily overview pageto help users understand what the chart is representing.
7.2.4 Design Iteration 3
After following some of the recommended changes proposed in the previous usabilitytesting, we have designed a new design for the third iteration to address the capturedproblems. Interviews with patients were conducted to evaluate this interface on the
49
5th of March, 2015 with two members of the team. The interface created in thisiteration can be found in Section C.3. The interface for this session was reducedto a daily view that solely shows the patient’s progress on that specific day in thatspecific time without other functions that were previously included in previous testsand interviews. The reason behind this decision was to increase the simplicity ofthe application and reduce the interaction needed between the user and the system.Six patients were asked for their opinion about the application as a whole and thefunctionalities that it entails. In addition, they were also asked for their opinion abouthaving a sensor applied on them.
Questions
Patients were asked the following questions in each interview:
• What do you understand from the user interface?
• What do you think of having the estimated number of days left for being dis-charged shown on the screen?
• Would you use this product to help you move more?
• What would motivate you to move more?
• How do you feel about having a sensor on your body to get quantified informa-tion about your physical activity?
Summary of patient interviews
The interviews with the patients have identified some observations including:
• Misinterpretation of the icon that resembles sitting, as it currently shows aperson sitting on the side of the bed, which might be interpreted as movingupwards or sitting on the bed. Thus, this icon should be changed into somethingclearer.
• After showing patients three different charts (bar, stacked and pie) that repre-sent their activity levels, it was found that the vertical bar chart was the easiestto understand. As a result, it was decided at this point to use vertical bar chart.
50

• Some patients loved the idea of having the estimated number of days left forthem to be discharged shown on the screen. However, this might cause somecomplications if the number was inaccurate, as it could raise the patients’ ex-pectations and then cause some disappointment if the number was wrong.
• One of the patients talked about the need for setting goals that would motivatepatients to work towards achieving them, as solely quantifying their data mightnot be sufficient enough to motivate them.
• The pebble was not a problem for any of the patients, and it was easy to disinfectwhile trying it on different patients.
• Most patients showed interest in using these tools to help them get motivatedto increase their physical activity.
7.2.5 Design Iteration 4
In previous iterations, activity points were used as a concept to motivate patients toincrease their physical activity. However, in this iteration, we developed four differentconcepts that resemble the progress of patients in terms of points. Interviews withpatients were conducted to evaluate this iteration and receive more feedback frompatients about the application. Screen shots of the interface used for this iterationcan be found in Section C.4.
Questions
Patients were asked the following questions in each interview:
• What is your preferred location of the sensor? Chest or on your wrist?
• Which concept is the easiest to understand and could stimulate you to increaseyour physical activity.
• What do you understand from the activity bar chart?
Concepts
Four concepts were tested on patients to get their feedback. The interfaces of theseconcepts can be found in appendix C.
51
• Concept 1 (Figure C-7): Activity points resembled by a gradient circular progressbar that contains the percentage of the completed goal.Observations:
– Most patients found the percentage of activity points achieved in that dayeasy to understand after being informed about how the activity pointsconcept works.
– Some patients found this concept to be clear, but rather boring in com-parison the the last two concepts that make activity points more exciting.
– Patients were able to grasp that the more active you are, the more activitypoints you get.
• Concept 2 (Figure C-8): Activity points resembled by a circular progress barthat is divided into segments that represent different activities with differentcolours.Observations:
– Most patients were able to understand this circular chart easily.
– Patients were able to recognize that the circular progress chart is segmentedinto separate activities.
• Concept 3 (Figure C-9): Activity points resembled by a game where the playerhas to go from point A to point B.Observations:
– Patients gave a positive feedback of having a game-like concept that wouldmotivate the patients to achieve their daily goals in a more exciting manner.
– Patients were able to understand that the more active they are, the morepoints they gain and thus the player will move towards the goal.
• Concept 4 (Figure C-10): Same concept as concept 3 with an opponent aimedat stimulating the patient to compete with himself / herself.Observations:
– Two of the three patients that were interviewed loved this concept themost.
52

– Competing with oneself retrieved a better feedback than competing withother patients.
Summary of Concepts
Table 7.3: Concept Preference
Concept 1 Concept 2 Concept 3 Concept 41 2
Concept 2 was liked the most by only one patient who felt that numbers makethings easier to understand the concept of activity points. On the other hand, concept4 was well-received by the two other patients.
Nina Nissander, the physiotherapist at the haematology department gave us somefeedback about the concepts:
• Concept 2 is easy to understand as it resembles the percentage of activity pointsachieved by each activity; however, other colours are advised to be used.
• Concept 3 might be more suitable for younger patients.
• Concept 4 might not be suitable in situations where the patient is severely sick,as having an opponent constantly defeating the patient might not be a suitablemotivator for the patient.
Location of the Sensor
Table 7.4: Sensor Location Preference
- Wrist-band sensor Chest sensorPatient 1Patient 2Patient 3
Note: One of the patients had skin allergy, which could be a common problemwith the patients who are overwhelmed the devices attached to them.
53
Conclusion
Concept 4 was the most well-received concept among all concepts shown to users,but due to limited time, we were not able to implement this concept. A futureversion of the application could allow the user to select the most preferred way ofrepresenting activity points. Regarding the location of the sensor, the most optimumsolution for this issue is to give patients the freedom to choose the location that theyprefer without interfering with the effectiveness of the algorithm that detects patients’physical activities. On the other hand, for this project, we have chosen to put thesensor on the patient’s chest.
54

Chapter 8
Application Implementation
This chapter introduces the challenges that have been encountered while implement-ing the motivational tool. In addition, the design, functional and non-functional re-quirements of the application are then listed. Finally, the application’s view modelsare presented.
8.1 Implementation challenges and risks
During the implementation of any software, there are many challenges and risks thatshould be considered in order to identify any shortcomings of the resulted application.This section addresses the challenges and risks that were taken into consideration inthis project.
Technical expertise
Due to a limited experience in developing Android applications, technical challengesexisted in the implementation phase. The risk here was that a considerable amountof time could be spent on getting accustomed to Android development and findingAndroid libraries needed for this project.
Requirements change
Since agile methodology was chosen for the application design and development, achange in the requirements and the design of the application is always expected atany stage. As a result, we have conducted four design iterations prior to the imple-
55
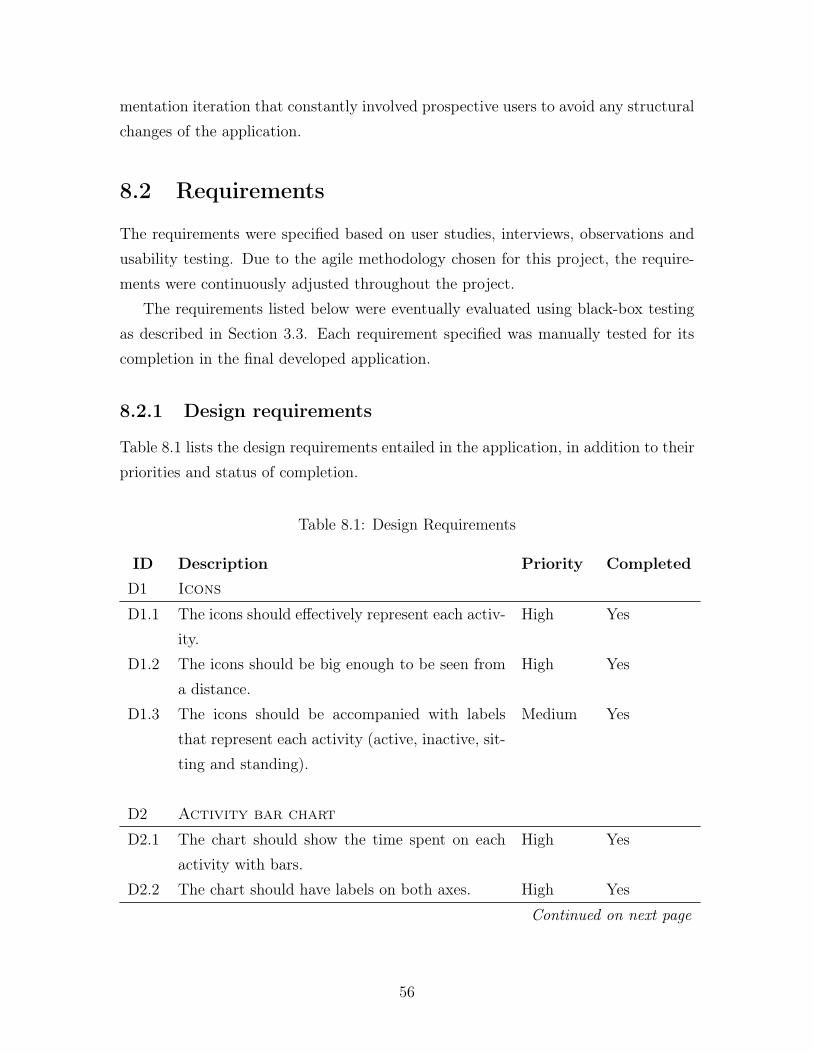
mentation iteration that constantly involved prospective users to avoid any structuralchanges of the application.
8.2 Requirements
The requirements were specified based on user studies, interviews, observations andusability testing. Due to the agile methodology chosen for this project, the require-ments were continuously adjusted throughout the project.
The requirements listed below were eventually evaluated using black-box testingas described in Section 3.3. Each requirement specified was manually tested for itscompletion in the final developed application.
8.2.1 Design requirements
Table 8.1 lists the design requirements entailed in the application, in addition to theirpriorities and status of completion.
Table 8.1: Design Requirements
ID Description Priority CompletedD1 Icons
D1.1 The icons should effectively represent each activ-ity.
High Yes
D1.2 The icons should be big enough to be seen froma distance.
High Yes
D1.3 The icons should be accompanied with labelsthat represent each activity (active, inactive, sit-ting and standing).
Medium Yes
D2 Activity bar chart
D2.1 The chart should show the time spent on eachactivity with bars.
High Yes
D2.2 The chart should have labels on both axes. High YesContinued on next page
56
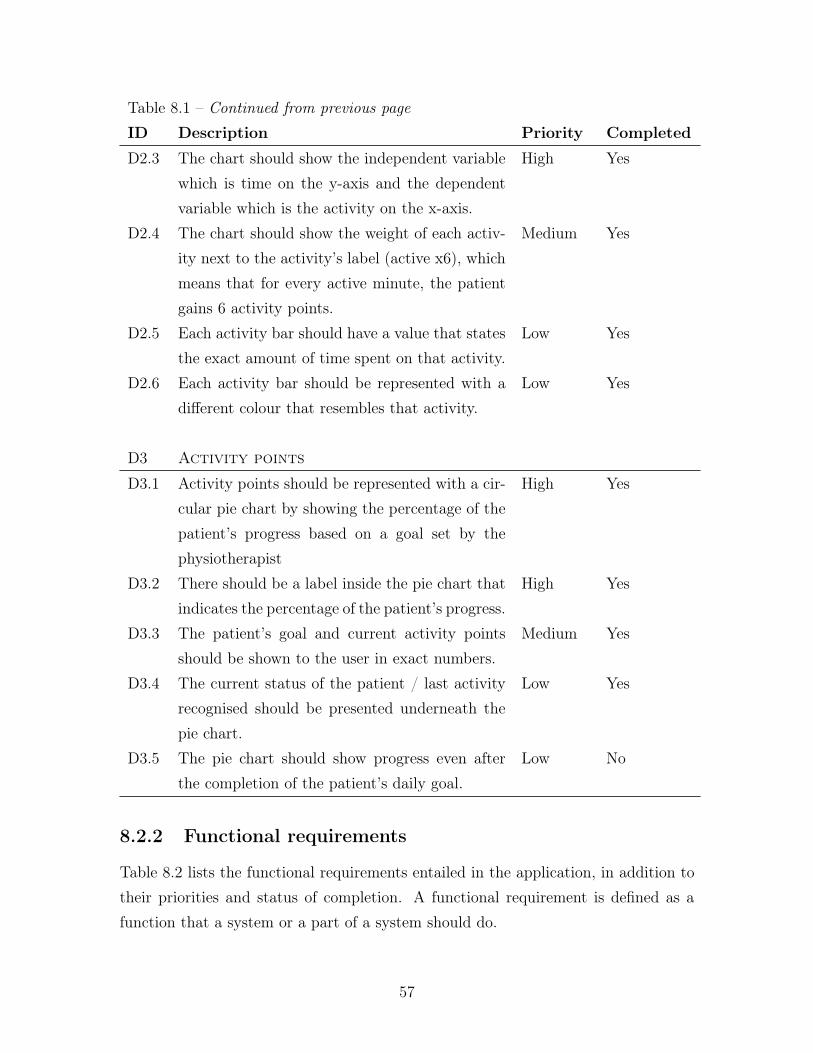
Table 8.1 – Continued from previous pageID Description Priority CompletedD2.3 The chart should show the independent variable
which is time on the y-axis and the dependentvariable which is the activity on the x-axis.
High Yes
D2.4 The chart should show the weight of each activ-ity next to the activity’s label (active x6), whichmeans that for every active minute, the patientgains 6 activity points.
Medium Yes
D2.5 Each activity bar should have a value that statesthe exact amount of time spent on that activity.
Low Yes
D2.6 Each activity bar should be represented with adifferent colour that resembles that activity.
Low Yes
D3 Activity points
D3.1 Activity points should be represented with a cir-cular pie chart by showing the percentage of thepatient’s progress based on a goal set by thephysiotherapist
High Yes
D3.2 There should be a label inside the pie chart thatindicates the percentage of the patient’s progress.
High Yes
D3.3 The patient’s goal and current activity pointsshould be shown to the user in exact numbers.
Medium Yes
D3.4 The current status of the patient / last activityrecognised should be presented underneath thepie chart.
Low Yes
D3.5 The pie chart should show progress even afterthe completion of the patient’s daily goal.
Low No
8.2.2 Functional requirements
Table 8.2 lists the functional requirements entailed in the application, in addition totheir priorities and status of completion. A functional requirement is defined as afunction that a system or a part of a system should do.
57
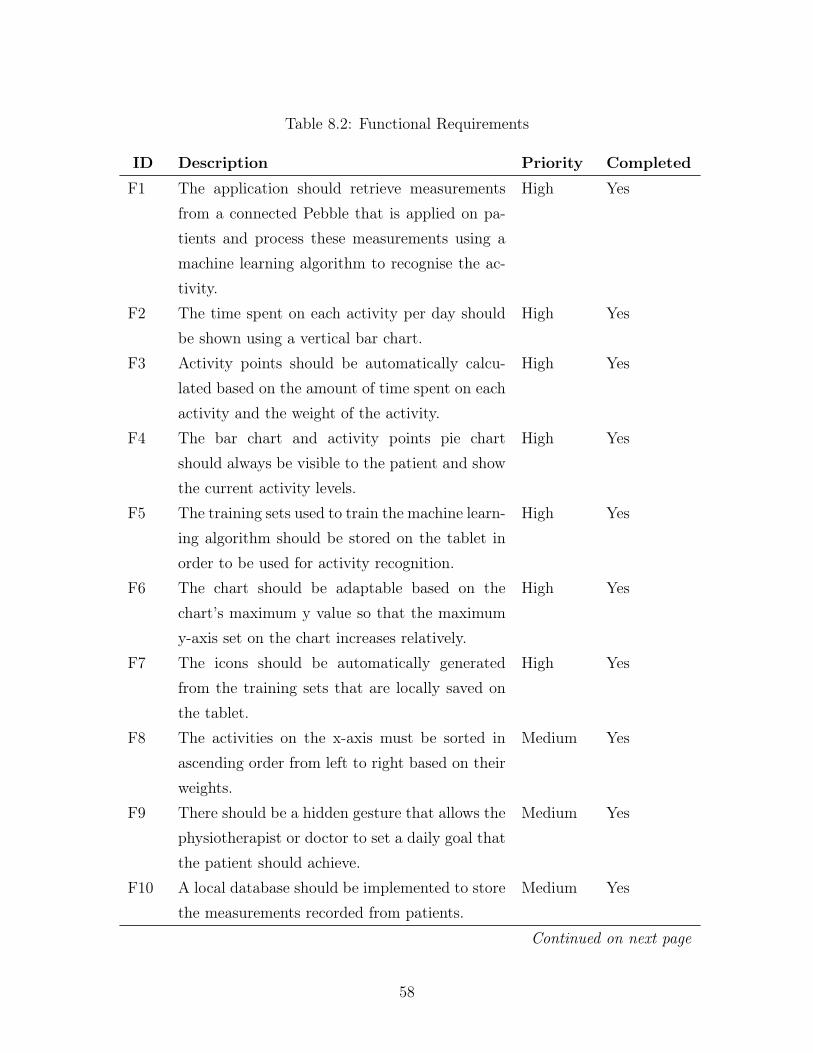
Table 8.2: Functional Requirements
ID Description Priority CompletedF1 The application should retrieve measurements
from a connected Pebble that is applied on pa-tients and process these measurements using amachine learning algorithm to recognise the ac-tivity.
High Yes
F2 The time spent on each activity per day shouldbe shown using a vertical bar chart.
High Yes
F3 Activity points should be automatically calcu-lated based on the amount of time spent on eachactivity and the weight of the activity.
High Yes
F4 The bar chart and activity points pie chartshould always be visible to the patient and showthe current activity levels.
High Yes
F5 The training sets used to train the machine learn-ing algorithm should be stored on the tablet inorder to be used for activity recognition.
High Yes
F6 The chart should be adaptable based on thechart’s maximum y value so that the maximumy-axis set on the chart increases relatively.
High Yes
F7 The icons should be automatically generatedfrom the training sets that are locally saved onthe tablet.
High Yes
F8 The activities on the x-axis must be sorted inascending order from left to right based on theirweights.
Medium Yes
F9 There should be a hidden gesture that allows thephysiotherapist or doctor to set a daily goal thatthe patient should achieve.
Medium Yes
F10 A local database should be implemented to storethe measurements recorded from patients.
Medium Yes
Continued on next page
58
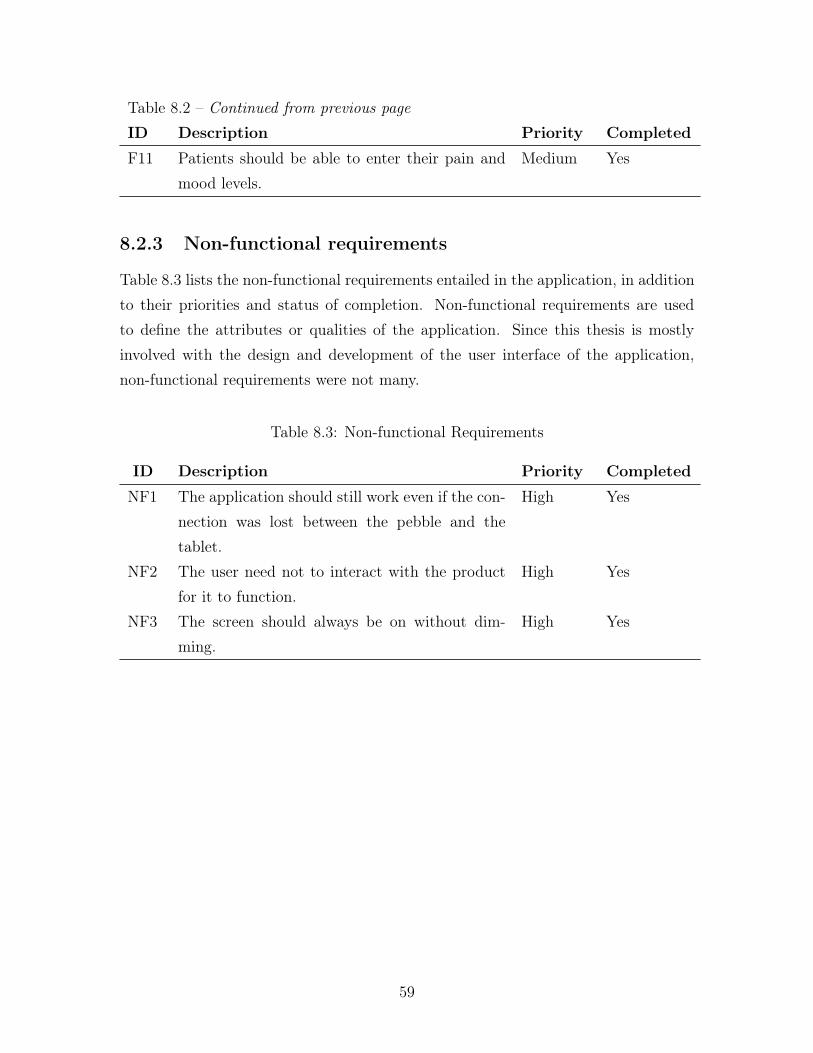
Table 8.2 – Continued from previous pageID Description Priority CompletedF11 Patients should be able to enter their pain and
mood levels.Medium Yes
8.2.3 Non-functional requirements
Table 8.3 lists the non-functional requirements entailed in the application, in additionto their priorities and status of completion. Non-functional requirements are usedto define the attributes or qualities of the application. Since this thesis is mostlyinvolved with the design and development of the user interface of the application,non-functional requirements were not many.
Table 8.3: Non-functional Requirements
ID Description Priority CompletedNF1 The application should still work even if the con-
nection was lost between the pebble and thetablet.
High Yes
NF2 The user need not to interact with the productfor it to function.
High Yes
NF3 The screen should always be on without dim-ming.
High Yes
59

8.3 Application view models
8.3.1 Physical view
The physical view presented in Figure 8-1 simply shows the basic concept of themotivational tool and how prospective users will be able to retrieve visualised feedbackof the patient’s physical activity levels. The sensor retrieves measurements of thepatient’s movements and then sends them to the application to be processed using aBluetooth network. The android application then processes the data upon retrievalto recognise the activity using a machine algorithm, and then shows the progress ina visual format with a bar chart showing how much time was spent on each activity.These results then get converted to activity points. The user will track the patient’sprogress in accordance to the preset daily goal.
Figure 8-1: Physical view diagram
60
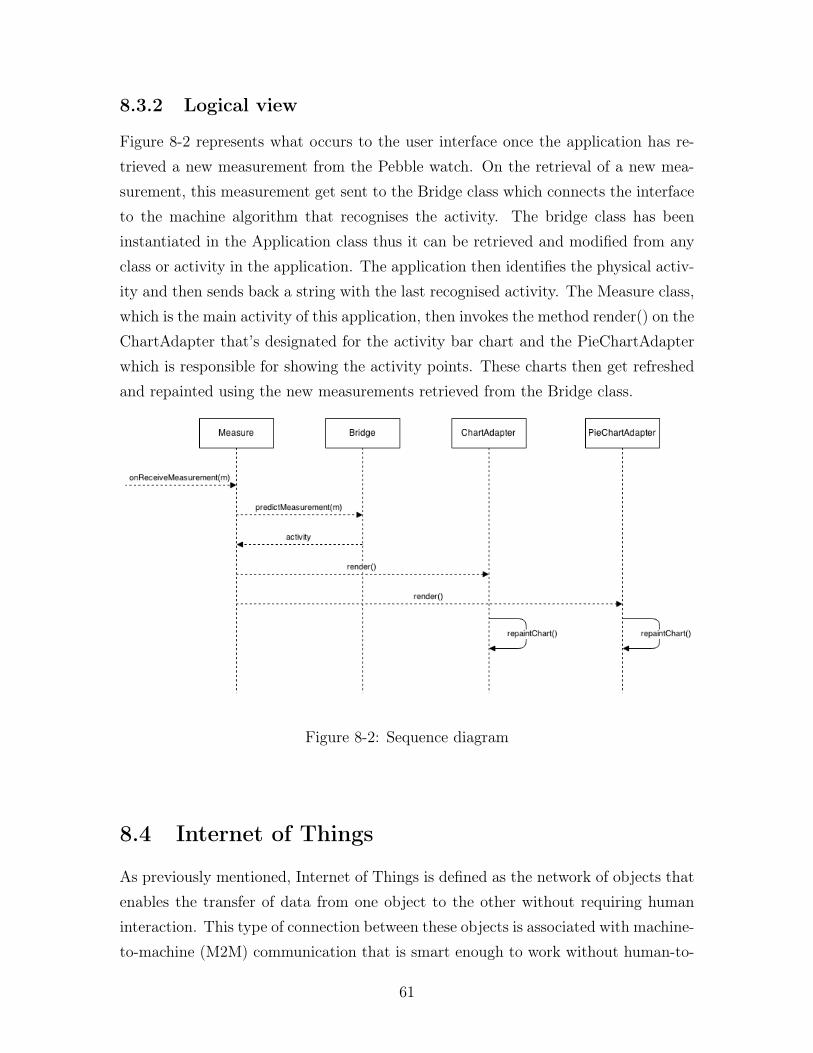
8.3.2 Logical view
Figure 8-2 represents what occurs to the user interface once the application has re-trieved a new measurement from the Pebble watch. On the retrieval of a new mea-surement, this measurement get sent to the Bridge class which connects the interfaceto the machine algorithm that recognises the activity. The bridge class has beeninstantiated in the Application class thus it can be retrieved and modified from anyclass or activity in the application. The application then identifies the physical activ-ity and then sends back a string with the last recognised activity. The Measure class,which is the main activity of this application, then invokes the method render() on theChartAdapter that’s designated for the activity bar chart and the PieChartAdapterwhich is responsible for showing the activity points. These charts then get refreshedand repainted using the new measurements retrieved from the Bridge class.
Figure 8-2: Sequence diagram
8.4 Internet of Things
As previously mentioned, Internet of Things is defined as the network of objects thatenables the transfer of data from one object to the other without requiring humaninteraction. This type of connection between these objects is associated with machine-to-machine (M2M) communication that is smart enough to work without human-to-
61
human or human-to-computer interaction. This project was developed with IoT’sconcept in mind in order to build a system that allows the automatic retrieval of rawaccelerometer data retrieved from the sensor applied on patients using an androidtablet that has already established a connection with that specific sensor.
8.4.1 Retrieving Data from the Sensor
As previously mentioned in Chapter 6, the Pebble watch was chosen for this projectdue to its open SDK, water resistance feature and long lasting battery. In order tosend acceleration measurements from the Pebble to the Android application, one ofthe team members of this project has developed a program written in C and uploadedit to the watch. This program was used to send acceleration data in batches everyminute to reduce the battery consumption.
8.5 Machine Learning Algorithm
Machine learning is defined as the "implementation of computer software that canlearn autonomously" [23]. Another team member used machine learning algorithmsin this project in order to identify the movements performed by the patients. Theclassification of data has been tested with four different machine learning algorithms(discriminant analysis, K-nearest neighbour, Naive Bayes and Support Vector Ma-chine) in order to identify which one should be used for this project. After doing acomparison among these machine learning algorithms, support vector machine gavethe best results, and hence it was used for this project.
8.5.1 Support Vector Machine (SVM)
Support vector machines have been used for pattern classification, which entails clas-sifying a certain object into one of the given categories, also known as classes [1].They are supervised learning models that recognise patterns and analyse data. Thereason behind using these supervised learning models was to recognise the activitythat was performed by the patient. Thus, in the beginning parts of the project, wetrained the algorithm by recording patients while standing, sitting, being active andinactive. Each activity is represented by a set of training examples. Given a setof training examples, each linked to one of the four categories used in this project
62
(standing, sitting, active and inactive), a support vector machine training algorithmbuilds a model that designates new data into one of the preset categories. As a result,when new data has been retrieved from the sensor, it gets processed and then mappedinto a space that belongs to a certain category (e.g. active).
8.6 Database
The main incentive of having a database for our motivational tool was to be able tostore data recorded from patients in an organised way.
In the beginning phases of the development of our product, we locally saved thetraining examples mentioned in the previous section by storing the measurementsretrieved from the pebble’s accelerometer as .CSV files. During the developmentprocess, a "training" interface was created to allow the addition and storage of datacollected from the accelerometer to train the support vector machine by adding moredata sets. Through this interface shown in Figure 8-3, the user was able to createnew training sets, record her or his movements and then save them into a folder onthe tablet’s local disk.
As shown in Figure 8-4, once a connection has been established with the sensor(pebble), the user is able to create a new set with the activity that she or he wants torecord (such as walking, standing, jumping.. etc). Pressing the button "record" onthe application will enable the android application to retrieve data from the sensor.Data logging receiver then gets instantiated to start logging data from the pebble.The measurements received at this point keep getting added to a local array. Oncethe save set button is pressed, the newly recorded measurements get written to a.CSV file saved in the tablet’s local storage inside a folder with the name of the set.
The final evaluation of the motivational tool discussed in Section 10.1 requireda functioning database to locally store the patients’ measurements on the Androidtablet. Consequently, a NoSQL database has been implemented by another teammember to handle the patient’s data.
8.6.1 NoSQL Database
The use of NoSQL databases has been rapidly increasing in recent years due to manyreasons. Instead of storing data in relational table schemes such as SQL (StructuredQuery Language), NoSQL (Not only SQL) databases are created in a way that allows
63

Figure 8-3: Interface created for training the machine algorithm
Figure 8-4: Primitive design of the interface used for training the support vectormachine used in this project
64
the addition of data without a predefined schema. Thus, this advantage makes thistype of database very adequate for applications that are created with an agile ap-proach, as any changes to the structure of the database such as adding a new column,does not affect the existing stored data, making it easy to do changes to the projectthroughout the development without the need for creating a whole new structure forthe database [4, p. 1].
The reason behind the adoption of a NoSQL database instead of a relationaldatabase for this project was because of the agile iterative approach that was appliedin the development. The requirements of the project kept changing throughout theway as with the end of each sprint, usability testing and interviews with prospectiveusers including patients were conducted that resulted in changes in the requirementsand the demands of the product and the design of the system. For a system thatis being developed in a user-centric approach, the system is expected to go throughiterative changes rather than developing in a waterfall approach that is not quiteadaptable to the users’ needs. In addition, the created motivational tool had to bescalable and allow a large number of users to use the product at the same time forfuture versions of the product. Moreover, performance of accessing the databasewas also another factor that was taken into consideration while deciding on whichdatabase to use; the speed of accessing data (throughput) in a NoSQL database isfaster than an SQL database [6].
8.6.2 Couchbase Lite
According to Getting Started with Couchbase Server (2013), Couchbase Server is de-fined as "a distributed, document-based database that is part of the NoSQL databasemovement [4, p. 1]". This server is a NoSQL distributed database that provides highperformance with an unstructured model of data that allows flexibility in the datastructure.
Couchbase Lite, a mobile version of Couchbase database has been used for thedatabase of the application. This database is deployed as a document database,which makes storing and retrieving data very simple, efficient and fast. In addition, astructure need not to be created prior to storing data. Another reason for using thisdatabase for our project is because of its elasticity. Due to the changing demands ofthe software, elasticity in the data structure of the database is needed to allow forexpansion.
65
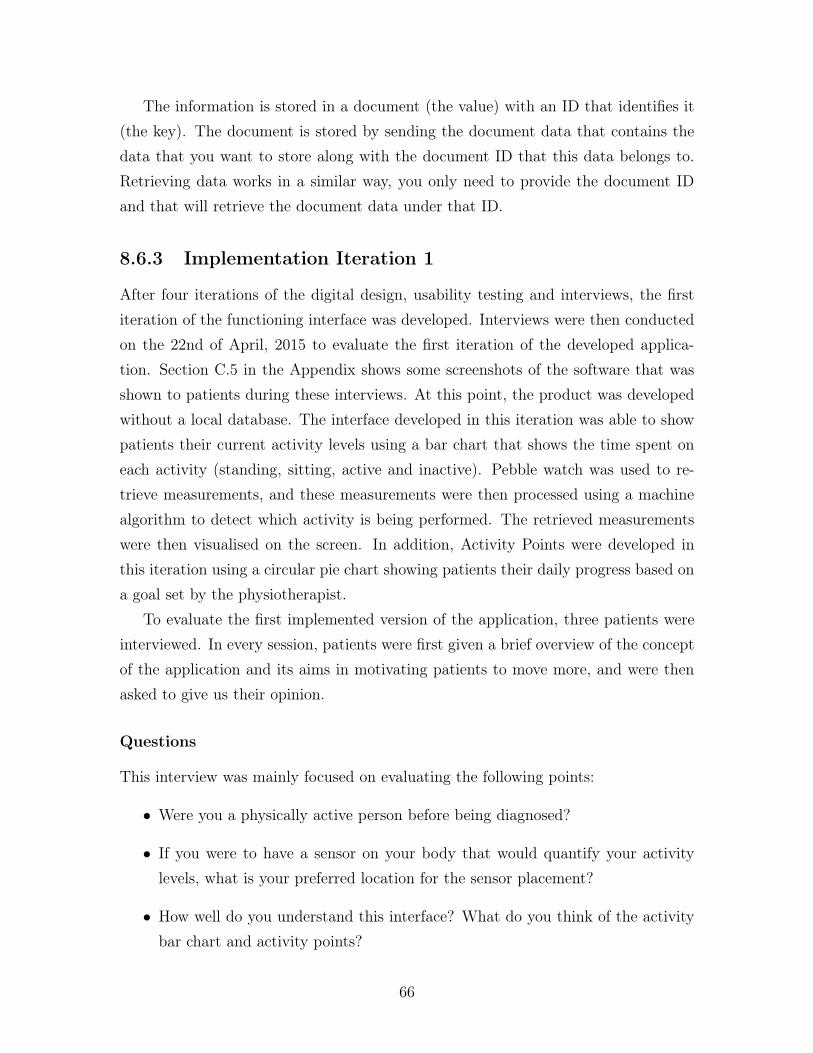
The information is stored in a document (the value) with an ID that identifies it(the key). The document is stored by sending the document data that contains thedata that you want to store along with the document ID that this data belongs to.Retrieving data works in a similar way, you only need to provide the document IDand that will retrieve the document data under that ID.
8.6.3 Implementation Iteration 1
After four iterations of the digital design, usability testing and interviews, the firstiteration of the functioning interface was developed. Interviews were then conductedon the 22nd of April, 2015 to evaluate the first iteration of the developed applica-tion. Section C.5 in the Appendix shows some screenshots of the software that wasshown to patients during these interviews. At this point, the product was developedwithout a local database. The interface developed in this iteration was able to showpatients their current activity levels using a bar chart that shows the time spent oneach activity (standing, sitting, active and inactive). Pebble watch was used to re-trieve measurements, and these measurements were then processed using a machinealgorithm to detect which activity is being performed. The retrieved measurementswere then visualised on the screen. In addition, Activity Points were developed inthis iteration using a circular pie chart showing patients their daily progress based ona goal set by the physiotherapist.
To evaluate the first implemented version of the application, three patients wereinterviewed. In every session, patients were first given a brief overview of the conceptof the application and its aims in motivating patients to move more, and were thenasked to give us their opinion.
Questions
This interview was mainly focused on evaluating the following points:
• Were you a physically active person before being diagnosed?
• If you were to have a sensor on your body that would quantify your activitylevels, what is your preferred location for the sensor placement?
• How well do you understand this interface? What do you think of the activitybar chart and activity points?
66

Results
Table 8.4: Results from Interviewing Patients
Patient no. Patient 1 Patient 2 Patient 3DOB 1948 1958 1954Gender Female Male MalePrevious activ-ity levels
Used to work out afew times per week.Used to dance aswell.
Active at his job butdoesn’t work out
was not a per-son who regularlytrains, but used tocycle and run a lot
Preferred loca-tion of sensor
Her first preferredchoice was puttingit on the ankle.Her main problemwas having red spotscaused by her sensi-tive skin
Okay with havingit on his chest andarm, but thoughtthat having it on theleg might be difficultas it is out of reach
Not chest because ofthe discomfort, heliked having it onthe arm
Activity Points Understood the con-cepts but thoughtm means meter andnot minutes
He did not like theconcept as he likesto move on his ownwithout anyonetelling him
Got confused aboutthe m on the chart(did not know if itrefers to minutes ormeters)
What makesyou moremotivated
To get better To get better andget discharged ear-lier
Some com-ments
She got happy aboutthe idea as she oftensits and lies downwhile watching tv
Did not like the con-cept as a whole.
Had a problem withstem cell transplan-tation. Has sorehands, back and legsso it’s hard for himto move
67
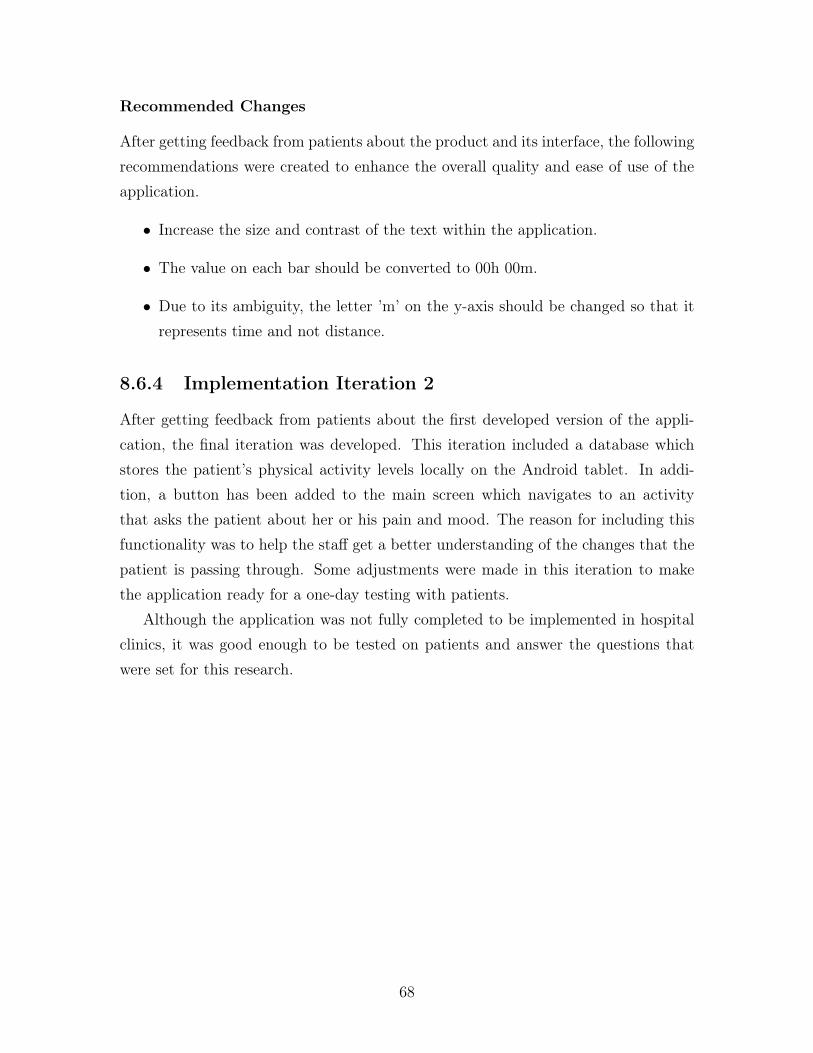
Recommended Changes
After getting feedback from patients about the product and its interface, the followingrecommendations were created to enhance the overall quality and ease of use of theapplication.
• Increase the size and contrast of the text within the application.
• The value on each bar should be converted to 00h 00m.
• Due to its ambiguity, the letter ’m’ on the y-axis should be changed so that itrepresents time and not distance.
8.6.4 Implementation Iteration 2
After getting feedback from patients about the first developed version of the appli-cation, the final iteration was developed. This iteration included a database whichstores the patient’s physical activity levels locally on the Android tablet. In addi-tion, a button has been added to the main screen which navigates to an activitythat asks the patient about her or his pain and mood. The reason for including thisfunctionality was to help the staff get a better understanding of the changes that thepatient is passing through. Some adjustments were made in this iteration to makethe application ready for a one-day testing with patients.
Although the application was not fully completed to be implemented in hospitalclinics, it was good enough to be tested on patients and answer the questions thatwere set for this research.
68

Part IV
Results
69

Chapter 9
Results
CTMH wanted to develop a motivational tool that is targeted to help patients movemore by showing them quantified information about their physical activity levels.Based on interviews, observations and user studies, an initial concept of the applica-tion was created, which resulted in the development of the final application discussedbelow. The major result of this thesis project was the design and development of theGUI of the application in a user-centric way. The final prototype of this project wasintended to be utilised in a study that will be conducted at the haematology clinic atKarolinska University hospital.
9.1 GUI and functionality
The main purpose of this application is to give a brief overview of the patients’ activitylevels in order to serve as a motivating factor for patients to increase their physicalactivity levels and provide valuable information that can help physiotherapists anddoctors know their patients in a better way. Figure C-12 provides the resultinginterface that was tested on patients during a one-hour testing. The evaluation ofthis test is discussed in the next chapter. The GUI is previewed in full screen in orderto restrict the user from navigating away from the application, and the tablet is setto be located on a holder attached to the patient’s table.
Activity Bar Chart
To cover the requirement that entails showing patients their activity levels in a lucidway, we have decided to add a vertical bar chart that provides information about the
70

Figure 9-1: Daily view showing the patients’ current progress
time spent on each activity. Once the data retrieved from the pebble gets processedthrough the machine learning algorithm and the activity gets recognised, the chartupdates its view with the new data. The y-axis represents time, which is consideredthe dependent variable which represents the output. Whereas the x-axis representseach activity with three items: the icon that represents this activity, the name ofthe activity, and the weight that it holds. The weight of each activity is a numberthat depicts its value. For instance, Figure C-12 shows that being Active (aktiv inSwedish) has a weight of 6, which means that for every minute you are active, yougain 6 activity points. These weights were based on the importance of each activity.The colour of each activity’s bar was carefully chosen based on the activity’s value andmeaning. For example, aktiv is characterised with a green colour which signifies life,nature and hope. Moreover, blue has been chosen for the standing activity (Stående)due to its symbolisation of stability.
Activity Points
As previously discussed in earlier chapters, in order to evaluate the overall perfor-mance of the patient, the concept of activity points was introduced. Activity points
71
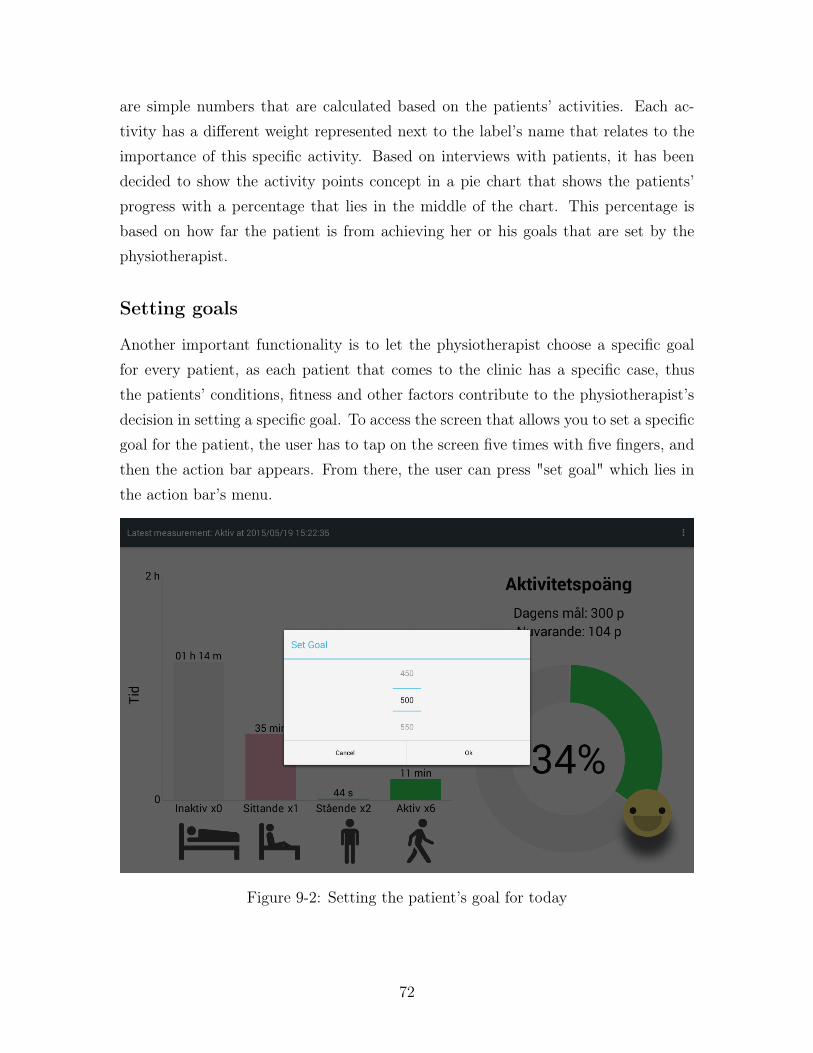
are simple numbers that are calculated based on the patients’ activities. Each ac-tivity has a different weight represented next to the label’s name that relates to theimportance of this specific activity. Based on interviews with patients, it has beendecided to show the activity points concept in a pie chart that shows the patients’progress with a percentage that lies in the middle of the chart. This percentage isbased on how far the patient is from achieving her or his goals that are set by thephysiotherapist.
Setting goals
Another important functionality is to let the physiotherapist choose a specific goalfor every patient, as each patient that comes to the clinic has a specific case, thusthe patients’ conditions, fitness and other factors contribute to the physiotherapist’sdecision in setting a specific goal. To access the screen that allows you to set a specificgoal for the patient, the user has to tap on the screen five times with five fingers, andthen the action bar appears. From there, the user can press "set goal" which lies inthe action bar’s menu.
Figure 9-2: Setting the patient’s goal for today
72

Pain and mood level
An important feature which was added to improve the staff’s knowledge of patientswas this screen that asks the patient to enter her or his pain and mood level. Thisscreen can be accessed by tapping the smiley button which lies on the bottom right ofthe screen. The first question asks about the patient’s pain intensity using a VisualAnalog Scale (VAS). The second question asks about the patient’s mood. This willhelp indicate the correlation between the patient’s activity levels and her or his painand mood levels.
Figure 9-3: Pain and mood levels
73

Chapter 10
Evaluation and Conclusion
This chapter concludes the project with an evaluation of the resulting application anda conclusion that summarises this thesis. Based on the evaluation criteria mentionedin the introduction, the research and development methodology is evaluated in thebeginning of this chapter. This is then followed by the strengths and weaknesses ofthe project and answers to the research questions. Finally, further work is providedand the project ends with a conclusion that summarises this report.
10.1 Methodology
As previously discussed in Section 3.1, design science research was chosen as theresearch methodology for this project as it fitted well with the project’s requirements.The research is evaluated with the following methods introduced in Section 3.3.
Experimental - Controlled
To assess the qualities, potential, usability and acceptance of the application in the pa-tients’ hospital rooms, we have conducted a one-day testing with six patients stayingat the haematology department at Karolinska Hospital in a controlled environment.After being introduced to the concept of the application and its purpose, patientswho participated in this experiment were asked to wear the Pebble watch (with de-tached bands) on their chest for 8 hours. The Pebble was attached to the patient’schest using special patches that were made for sensitive skin. The final version ofthe application was installed on the Android tablet which was attached to a tablenext to the patient’s bed using a tablet holder. Five out of six patients were able to
74
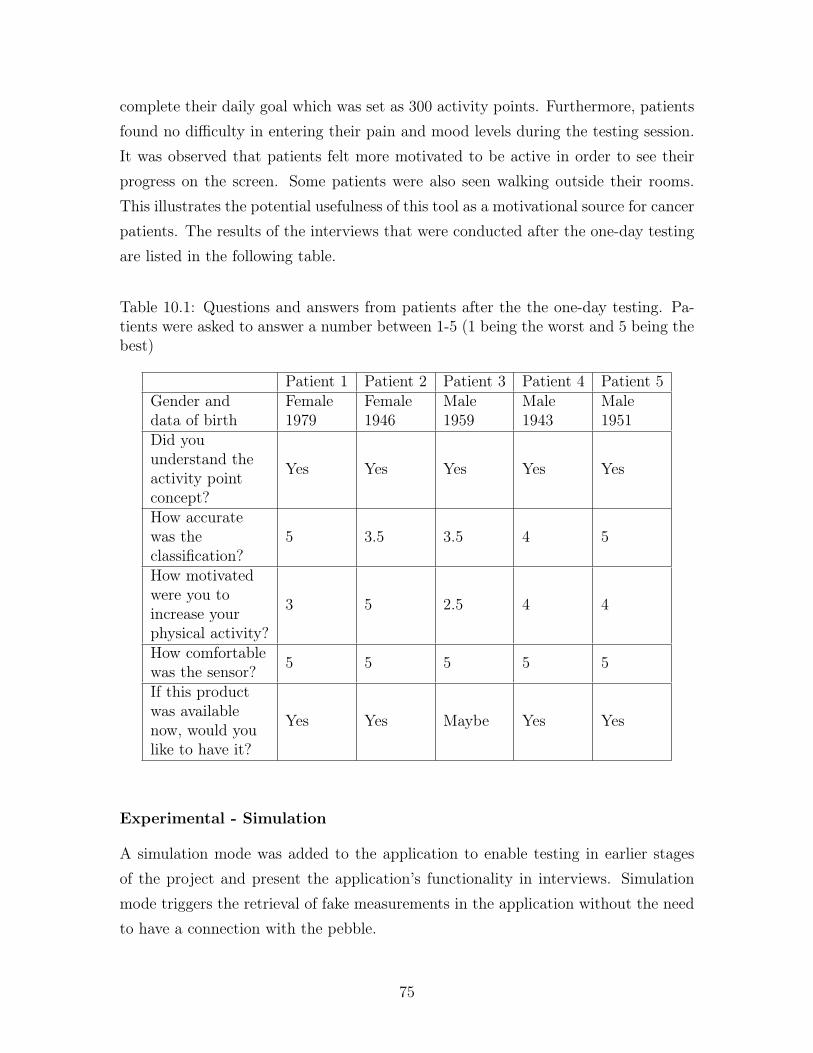
complete their daily goal which was set as 300 activity points. Furthermore, patientsfound no difficulty in entering their pain and mood levels during the testing session.It was observed that patients felt more motivated to be active in order to see theirprogress on the screen. Some patients were also seen walking outside their rooms.This illustrates the potential usefulness of this tool as a motivational source for cancerpatients. The results of the interviews that were conducted after the one-day testingare listed in the following table.
Table 10.1: Questions and answers from patients after the the one-day testing. Pa-tients were asked to answer a number between 1-5 (1 being the worst and 5 being thebest)
Patient 1 Patient 2 Patient 3 Patient 4 Patient 5Gender anddata of birth
Female1979
Female1946
Male1959
Male1943
Male1951
Did youunderstand theactivity pointconcept?
Yes Yes Yes Yes Yes
How accuratewas theclassification?
5 3.5 3.5 4 5
How motivatedwere you toincrease yourphysical activity?
3 5 2.5 4 4
How comfortablewas the sensor? 5 5 5 5 5
If this productwas availablenow, would youlike to have it?
Yes Yes Maybe Yes Yes
Experimental - Simulation
A simulation mode was added to the application to enable testing in earlier stagesof the project and present the application’s functionality in interviews. Simulationmode triggers the retrieval of fake measurements in the application without the needto have a connection with the pebble.
75
Testing - Functional Black Box Testing
The functionality of the application was tested using black box testing to verify if therequirements of this project were accomplished or not. The results of this testing canbe found in Section 8.2.
Descriptive - Informed Argument
The artifact’s utility has been assessed based on the research conducted in this paperthat created a need for having a motivational tool that can help patients increasetheir physical activity to make them healthier and reduce their hospitalisation time.Chapter 1 describes the motivation for having such a device at hospital clinics, andChapter 5 is dedicated to discuss similar tools used to help treating patients. Inaddition, Chapter 7 explains the iterations and the design decisions. What also addsto the argument is patients’ and staff’s positive response towards the applicationbased on usability testing, interviews and observations.
10.2 Design principles
This section describes how the following design principles were used while designingand developing the application.
10.2.1 Jakob Nielson’s 10 usability heuristics
1. Visibility of system statusTo keep the user informed about what is going on, the screen showing the pa-tient’s activities gets updated whenever the android application receives mea-surements from the pebble. This results in appropriate feedback within a rea-sonable amount of time. The application that was installed on the pebble wasset to send the data in batches every 1 minute.
2. Match between system and the real worldThe icons that represent each activity were designed in such a way to relate tothe actual activity in the real world. For instance, the "sitting" activity wasrepresented by an icon of a person sitting on a chair. Using usability testing,we strived to ensure that users are still able to understand the icons withoutreading the labels.
76
3. User control and freedomThe final product of this project did not involve a lot of interaction with patientsand thus this was not an issue. It is noteworthy to mention that it was vital tomake sure that the patient is not able to close the application. This was solvedby adding a software that makes our application fully immersive on the screenwithout showing a status bar or a navigation bar.
4. Consistency and standardsThere were no noticeable consistency and standards problems in the design.
5. Error preventionThere was a minimum need for having error prevention due to the lack of fullinteraction between the user and the application, hence this was not considereda major issue while evaluating the application’s usability.
6. Recognition rather than recallThe user’s memory load is quite minimum with the interface chosen for thisapplication as the information provided can be visible at all times, without theneed to remember information from one part of the system to another. Nev-ertheless, this usability guideline should be carefully taken into considerationonce other screens are added to the application.
7. Flexibility and efficiency of useDue to the lack of interactions between patients and the application, havingaccelerators that would allow users to tailor frequent actions was unnecessary.
8. Aesthetic and minimalist designAll information provided by the interface contains information that are relevantto the function that this application serves.
9. Help users recognise, diagnose, and recover from errorsIf the pebble stops sending measurements to the tablet, the user is not wellinformed with the current version of the application. However, this problemcan be tackled by providing a notification that informs the user that the tabletis not receiving any data from the pebble due to a certain error.
10. Help and documentationDocumentation was not necessary for this application due to its self-explanatory
77
features. The physiotherapist, who was responsible for setting each patient’sgoal was given verbal information about how the application functions.
10.3 Strengths and weaknesses
Strengths
The main strength of this thesis project is the Android application that illustrates theimportance of having a motivational tool that can motivate patients to move moreby showing instant feedback on their activities. We were not able to find a similarmotivational tool in the market or an application that detects patients’ activities inthe way that this application does, which makes this application unique. Anotherstrength is the user-centred development that this project has gone through to ensurehaving a usable application that can be easily understood by users. The user studyhelped us in understanding the prospective users and developing something that caneasily be used in such an environment. Moreover, all qualitative and quantitativefeedback gained from observations, usability testing and interviews contributed inthe development of this application. In addition, the potential of this application wasproven by the positive feedback gained by patients, physiotherapists and doctors atthe haematology clinic. This application can be further developed to be implementedin patients’ rooms to increase their motivation and help them get better in a shorterperiod of time, which would be cost-effective for public hospitals and have a greatimpact on patients’ quality of life.
Weaknesses
Due to limited time and resources, a preexisting wearable device that was available inthe market was chosen to be used for retrieving data from the built-in accelerometer.The main purpose of having an accelerometer in this project was to retrieve XYZmeasurements and process them to recognise the activity performed by the patient.Current wearable devices often have more sensors than just an accelerometer, thus itis highly advisable to design and develop a brand new wearable device that encom-passes a sensor with an open platform that provides open access to the retrieved data.Moreover, it was quite difficult to engage prospective users in the design and develop-ment stage. Each usability testing session was conducted with an average of three to
78

four participants, which might not have been enough. Thus, these sessions could bemore accurate and collect more constructive qualitative feedback if a minimum of fiveparticipants were involved in every conducted test. Finding patients who were willingto participate in usability testing and interviews was difficult as cancer patients areoften tired and weary. In addition, the final application of this project was consideredto be only a proof-of-concept and was not ready to be fully implemented in hospitalrooms. Further development and improvement to the product can help make thisproduct sellable to hospitals.
10.4 Answering research questions
1. What are the existing wearable devices that encompass built-in sensors that canbe used in a hospital setting to retrieve data such as body movements and heartrate from patients?This question has been answered by going through a number of wearable devicesthat have built-in sensors discussed in Chapter 6. A criteria presented in Section8.3 has been created to evaluate each device to make sure that the chosen devicecan be tested and used in hospitals for the long run without interfering withthe patients’ care. We have eventually chosen to use the Pebble watch for thisproject due to its water resistance features and its open platform, thus we wereable to retrieve measurements from the built-in accelerometer using a bluetoothconnection. The pebble was tested while being strapped on the patient’s chestwithout the arm bands.
2. What are the current available motivational tools that motivate patients to movemore?The reviewed applications have given us an inspiration to how to develop anapplication that can involve patients in their treatments. Also, traditional moti-vational methods were investigated by questioning doctors and physiotherapistsabout the current way of motivating cancer patients to follow the exercises pro-vided by the physiotherapists. Furthermore, the current motivational tools,digital and nondigital, also helped us in the development of this tool.
3. How will the activity levels of each patient be represented on the tablet to moti-vate patients?
79
In this project, it was highly important to focus on the usability of the applica-tion and make sure that all patients are able to understand its purpose withoutany effort. A number of design iterations were conducted to make that possible.This methodology was inspired by Jakob Nielson’s statement: "it is virtuallyimpossible to design a user interface that has no usability problems from thestart" [32]. Steady refinements of the user interface were done based on usertesting, interviews, observations and other evaluation methods to find a properway to present the patients’ activity levels on the tablet. This methodologyresulted in having an application that shows patients the time spent on eachactivity using a bar chart on the left part of the screen and a circular progresschart that depicts the progress of each patient for that specific day. The reasonbehind adding a concept of "Activity Points" was to give patients a goal thatthey can strive to achieve everyday. The final one-day testing suggested thatpatients get rewarded and felt happier when they reached the goals that wereset for them.
4. How usable is this application for physiotherapists, doctors and patients?In order to test the application’s usability with prospective users, we have con-ducted several usability testing sessions and interviews with patients which re-sulted in several refinements of the interface to increase its usability as previ-ously discussed. Moreover, we wanted to know the reaction of patients and theclinic for having such a system for patients who are willing to be involved insuch a project. Through interviews, observations and usability testing, it hasbeen proven that the clinic showed excitement and involvement about using thisapplication as a daily practice. The one-day testing session has shown that thisapplication has a great potential in this domain. Not only does it help patientsbe more motivated to be active, but it also gives a better overview of the pa-tients’ performance and abilities to staff members (specially physiotherapists),which helps them understand and evaluate patients in an improved way.
10.5 Reflections
This section describes the reflections upon some elements that were experienced dur-ing the project.
80
Iterations
A single attempt to design an interface is virtually impossible, and thus we havedecided to conduct as many iterations as possible within the limited time that wehad. Four design iterations were conducted in this project. And then when theproduct was ready to be developed, we decided to switch from digital designs to actualimplementation of the product. After two implementation iterations, we performedthe one-day testing session to evaluate the final prototype and its use. Although weaimed to make the application more complete for the final prototype, we managed toimplement the software enough to answer our research questions.
Future potential of this prototype
The main aim of this thesis project was to design and develop a prototype thatquantifies the patients’ activities and represent them in a visual way. The responsefrom the clinic and patients were mostly positive during the interviews, usabilitytesting, and the final one-day testing session. We believe that the biggest contributionof this application is that we proved the potential of having such a system implementedin patients’ rooms. This certainly proves a great potential for proceeding with thedevelopment of this prototype so that it can be placed in hospital rooms to improvepatients’ quality of life and help staff members evaluate their patients in a better way.
10.6 Future Work
This section describes the recommendations for future development and research.
Future Study at a clinic
In order to confirm the ability of this motivational tool to motivate cancer patientsto increase their physical activity levels, a study is going to be conducted at thehaematology clinic at Karolinska University Hospital in Huddinge, Sweden. Thecurrent suggested study design plan is to conduct a crossover study with patientswho are expected to stay at the hospital for 22-28 days. According to Study Designand Statistical Analysis: A Practical Guide for Clinicians, a crossover study is when"subjects are randomised to one group and then switched to the other group at aspecified time" [27, p. 18]. This way two groups of patients are needed to participate
81
in the study. One group of patients would receive the solution (a sensor and a tabletwith the motivational tool installed) for a specified amount of time, whereas the othergroup does not. After a specified time, these groups will switch so that the group thatdid not get exposed to the solution gets exposed, and the solution will be taken awayfrom the group that had the solution. By studying an adequate number of patients,it might be feasible to answer a new research question: "Can a motivational tool thatquantifies patients’ movements motivate patients to increase their physical activity?".
Database
Allowing the staff to get access to patients’ activity levels is highly important forthe next version of this motivational tool. Nevertheless, due to limited time andresources, this was not achievable in this project. Creating a centralised systemthat allows physiotherapists and doctors to get an overview of the performance ofall patients using a web interface (with cloud storage instead of local storage) wouldcertainly help the staff know patients in a better way, and the physiotherapist will beable to evaluate all patients at once.
Moreover, the software built for this study was developed as a single project andwas not integrated with the centralised database that has patients’ records. As aresult, it would be a better solution if the software was rebuilt to combine patients’records with the data retrieved using this application.
Explore and integrate other IoT devices
• The Pebble Watch was used in this project due to a number of factors discussedin earlier chapters, but exploring other devices or even creating a standalonesensor that has an accelerometer can be more useful and cost-effective for thisproject.
• The addition of a Kinect Camera could allow for a better recognition of thebody’s movements and thus could increase the accuracy of this product andrecognise more type of activities.
• Having more than one sensor on the patient increases the number of measure-ments retrieved and therefore there is a chance of enhancing the accuracy ofphysical activity recognition. As a result, a research to confirm the effective-ness of adding additional sensor(s) could be performed.
82
New Features
• Adding a feature that would allow physiotherapists to add specific exerciseprograms for patients to let physiotherapists know if patients have actuallyperformed the exercises they were supposed to do.
• Allowing patients to navigate between different days to see the changes in theirperformance.
• Adding a history view that shows the patient an overview of their performanceduring the past week.
Eye Tracking
In order to evaluate the use of the application and patients’ interests, it could bebeneficial to evaluate how much time each patient spends using the application. Thiscan be achieved using an eye tracking function that detects if the patient is lookingat the screen or not. This can be implemented using OpenCV library for Android.
Localization / Internationalization
The current version of the motivational tool displays all information in Swedish onlyas it was implemented to be tested on patients at Karolinska Institutet’s hospital thatmostly has Swedish patients; nevertheless, making it available in any language wouldincrease the range of users who can use this tool.
Education
It would be useful to inform patients about the importance of exercise and physicalactivity and how it can change their lives on the app. Consequently, personalisededucation according to the diagnosed case could be useful for a future iteration of theproduct.
83
10.7 Conclusion
The purpose of this research project was to design and develop an interface for asystem that will quantify patients’ daily activity levels, which will in turn motivatethem to exercise more frequently. A literature review was conducted about existingtechnologies that are able to retrieve data used for activity recognition, and thePebble watch was chosen to be used for this project due to its open platform andwater resistance feature.
By testing the developed prototype through iterations on Android tablets in hospi-tal rooms, we have illustrated the potential of developing a complete system that canbe implemented in hospital rooms to help patients be more motivated to be physicallyactive, which counteracts the body’s breakdown resulting in a shorter hospitalisationperiod.
One of our test users who was being treated at the hospital for Leukaemia saidthat this type of program would be perfect for her to combat her illness and be ableto run in the Boston marathon one day. This was one of the factors that helpedconfirm the potential of our application in terms of motivating patients to becomehealthier. Nevertheless, despite the promising motivational tool that was created forthis project, the project’s limitations raised the need for conducting a scientific studyto assess the prototype’s capability of increasing patients’ physical activity levels afterfurther development of the system.
84

Part V
Appendices
85

Appendix A
Personas
86

Table A.1: Patient 1
Gender maleAge 50’sComputer Literacy highDescription Patient 1 has not gotten any physical therapy prior to our
visit. The physiologist briefly explained to him what the treat-ment entails and gave him some advice about the exercisesthat he will need to do in order to overcome the negative re-sults of the treatment (such as getting tired and weary). Thephysiologist encouraged him to be exercising for at least 30minutes per day and walk as much as possible if he’s capa-ble of doing so. Nevertheless, the physiotherapist warned himabout exercising with low haemoglobin levels as this will in-crease the likelihood of bleeding. The patient was in goodshape and positive about the exercise plan that he will needto perform during the treatment.
Goals Stay healthy and keep exercising even after getting thechemotherapy treatment, feel better as soon as possible andget out of the hospital as early as possible.
Table A.2: Patient 2
Gender femaleAge 70’sComputer Literacy lowDescription Patient 2 was extremely weak and was going through a lot
of pain. She was also vulnerable to infections. Her plateletslevels were very low, and she has been suffering from bleedingsthe previous day. Also, her haemoglobin levels were very low.
Goals Avoid the physiologist to avoid doing any exercise and feelbetter as soon as possible in order to get out of the hospital.
87

Table A.3: Patient 3
Gender maleAge 20’sComputer Literacy highDescription Patient 3 is diagnosed with lymphoma and is going to be
treated with stem cell transplantation. He is an outdoor pa-tient as his treatment hasn’t yet started. The main goal ofhis therapy is to strengthen his muscles around his neck, spineand arms to be in a better shape for the upcoming treatmentand avoid bone fractures. His training is 3 times a week.
Goals Be in a better shape before his treatment and stay healthyafter the treatment.
88
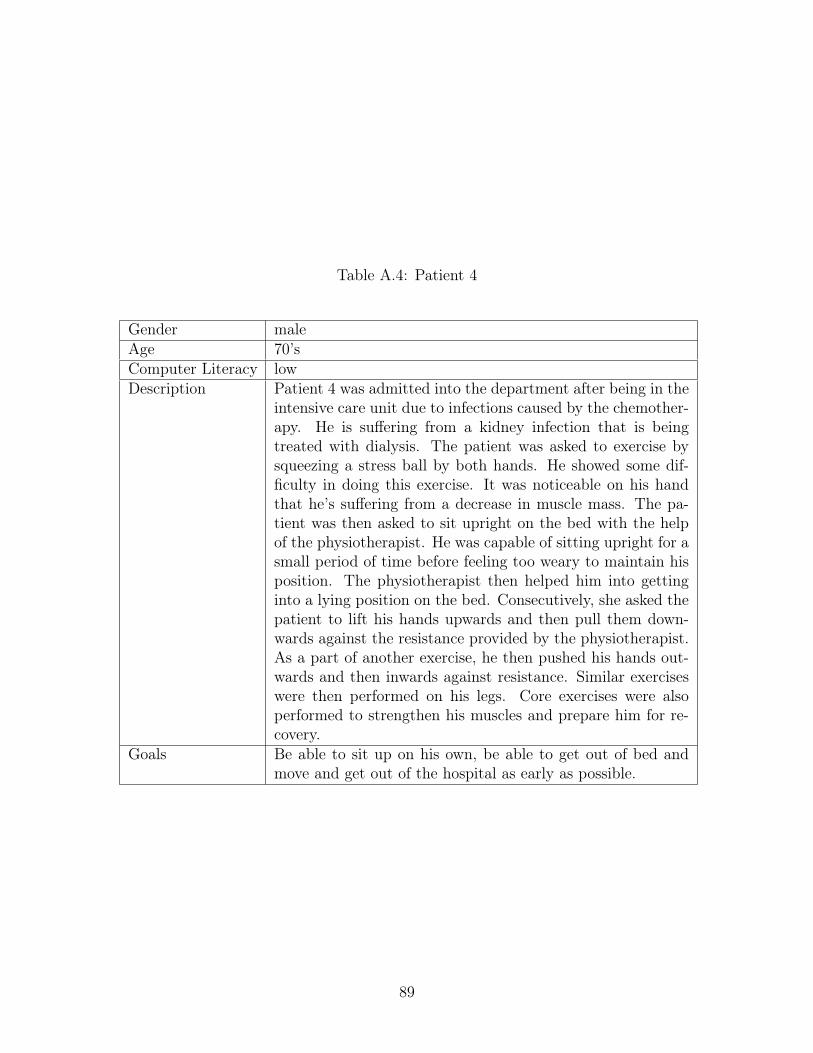
Table A.4: Patient 4
Gender maleAge 70’sComputer Literacy lowDescription Patient 4 was admitted into the department after being in the
intensive care unit due to infections caused by the chemother-apy. He is suffering from a kidney infection that is beingtreated with dialysis. The patient was asked to exercise bysqueezing a stress ball by both hands. He showed some dif-ficulty in doing this exercise. It was noticeable on his handthat he’s suffering from a decrease in muscle mass. The pa-tient was then asked to sit upright on the bed with the helpof the physiotherapist. He was capable of sitting upright for asmall period of time before feeling too weary to maintain hisposition. The physiotherapist then helped him into gettinginto a lying position on the bed. Consecutively, she asked thepatient to lift his hands upwards and then pull them down-wards against the resistance provided by the physiotherapist.As a part of another exercise, he then pushed his hands out-wards and then inwards against resistance. Similar exerciseswere then performed on his legs. Core exercises were alsoperformed to strengthen his muscles and prepare him for re-covery.
Goals Be able to sit up on his own, be able to get out of bed andmove and get out of the hospital as early as possible.
89

Table A.5: Medical Doctor
Gender maleAge 40’sComputer Literacy highDescription The medical doctor who works at the haematology clinic is in-
terested in knowing in how the patient is feeling before, duringand after the treatment. He goes on rounds and checks pa-tients everyday. Every morning, each doctor talks about thepatients that she or his is responsible for with other doctors.
Goals Help patients feel better so that they would be able to endurethe treatment and get better, be able to evaluate the patient’spain level and know more about the patient’s physical activitylevel.
Table A.6: Physiotherapist
Gender femaleAge 40’sComputer Literacy mediumDescription The physiotherapist is interested in knowing how patients are
doing. It’s the physiotherapist’s role to ensure that patients’stay physically healthy during their stay at the hospital.
Goals Motivate the patient to exercise.Give patients exercise programs that they could follow.Evaluate if the patients are performing the activities that theyare supposed to do to get better.Help patients during some exercises and movements.
90

Appendix B
Tables
91
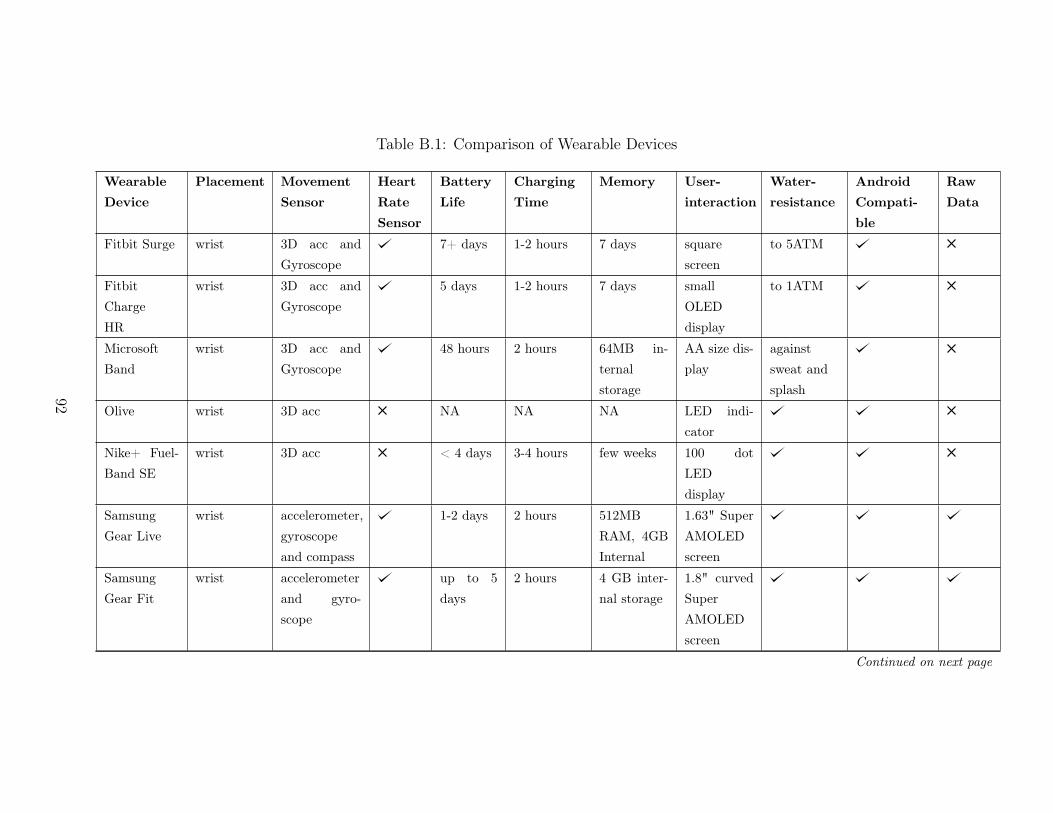
Table B.1: Comparison of Wearable Devices
Wearable
Device
Placement Movement
Sensor
Heart
Rate
Sensor
Battery
Life
Charging
Time
Memory User-
interaction
Water-
resistance
Android
Compati-
ble
Raw
Data
Fitbit Surge wrist 3D acc andGyroscope
7+ days 1-2 hours 7 days squarescreen
to 5ATM
FitbitChargeHR
wrist 3D acc andGyroscope
5 days 1-2 hours 7 days smallOLEDdisplay
to 1ATM
MicrosoftBand
wrist 3D acc andGyroscope
48 hours 2 hours 64MB in-ternalstorage
AA size dis-play
againstsweat andsplash
Olive wrist 3D acc NA NA NA LED indi-cator
Nike+ Fuel-Band SE
wrist 3D acc < 4 days 3-4 hours few weeks 100 dotLEDdisplay
SamsungGear Live
wrist accelerometer,gyroscopeand compass
1-2 days 2 hours 512MBRAM, 4GBInternal
1.63" SuperAMOLEDscreen
SamsungGear Fit
wrist accelerometerand gyro-scope
up to 5days
2 hours 4 GB inter-nal storage
1.8" curvedSuperAMOLEDscreen
Continued on next page
92
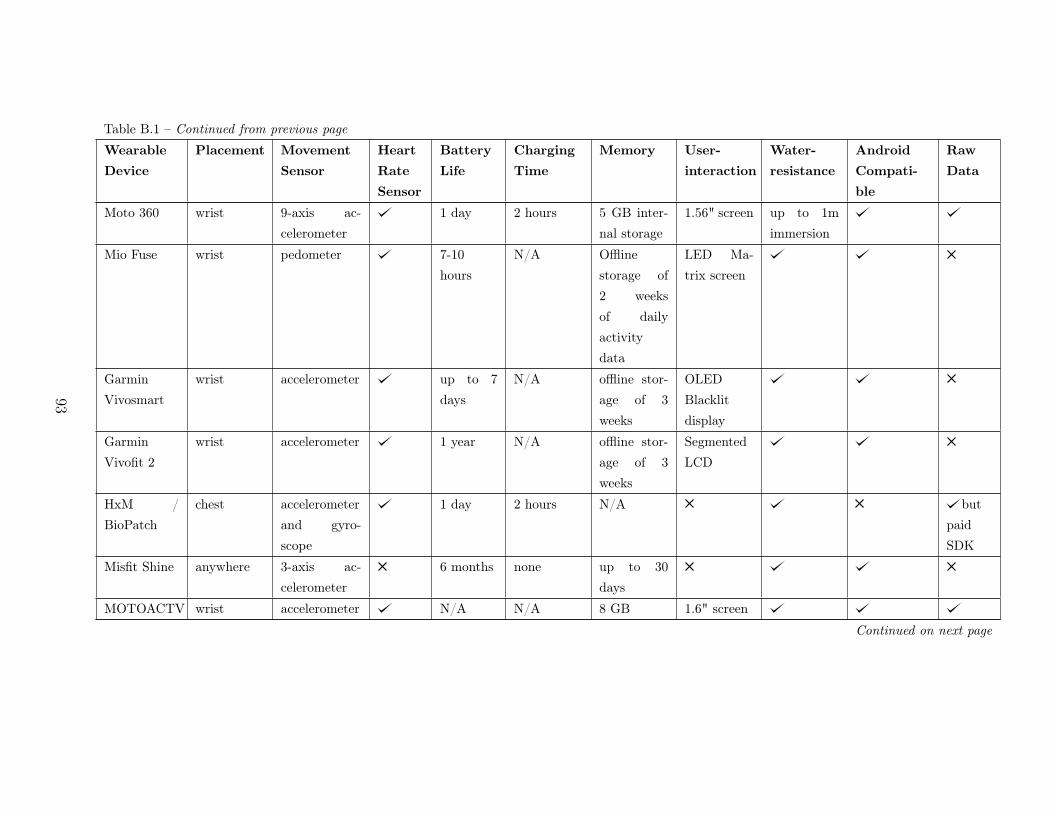
Table B.1 – Continued from previous pageWearable
Device
Placement Movement
Sensor
Heart
Rate
Sensor
Battery
Life
Charging
Time
Memory User-
interaction
Water-
resistance
Android
Compati-
ble
Raw
Data
Moto 360 wrist 9-axis ac-celerometer
1 day 2 hours 5 GB inter-nal storage
1.56" screen up to 1mimmersion
Mio Fuse wrist pedometer 7-10hours
N/A Offlinestorage of2 weeksof dailyactivitydata
LED Ma-trix screen
GarminVivosmart
wrist accelerometer up to 7days
N/A offline stor-age of 3weeks
OLEDBlacklitdisplay
GarminVivofit 2
wrist accelerometer 1 year N/A offline stor-age of 3weeks
SegmentedLCD
HxM /BioPatch
chest accelerometerand gyro-scope
1 day 2 hours N/A butpaidSDK
Misfit Shine anywhere 3-axis ac-celerometer
6 months none up to 30days
MOTOACTV wrist accelerometer N/A N/A 8 GB 1.6" screenContinued on next page
93
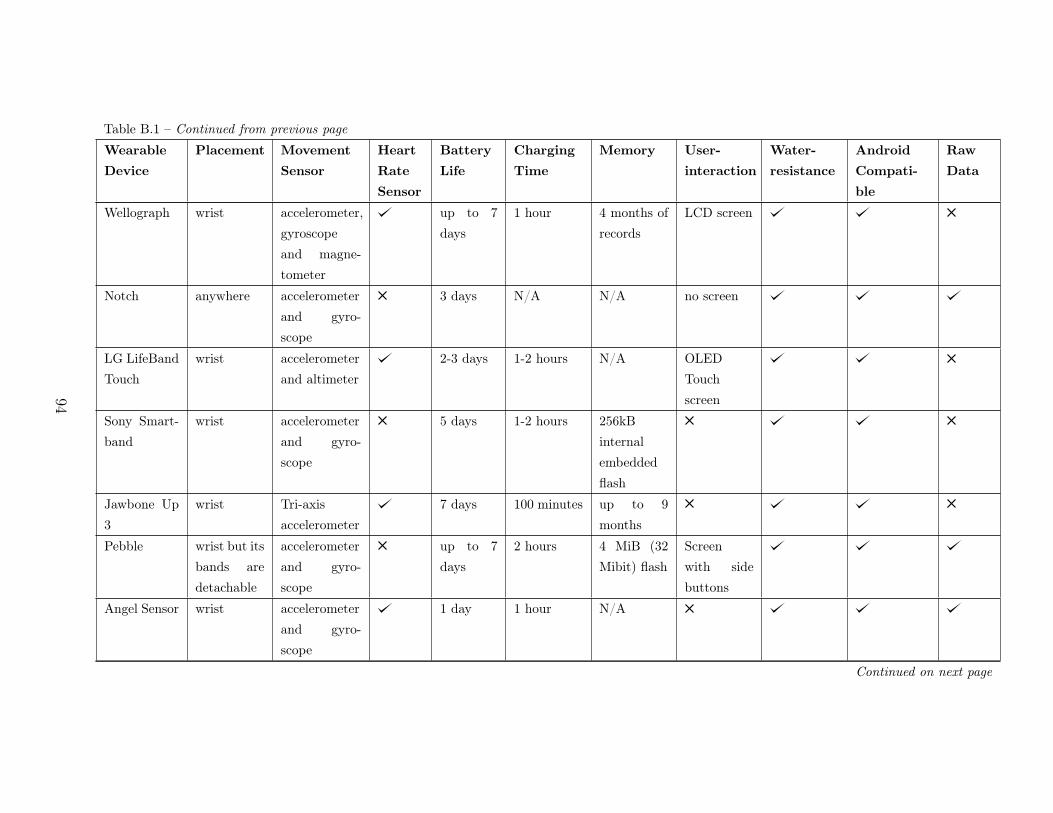
Table B.1 – Continued from previous pageWearable
Device
Placement Movement
Sensor
Heart
Rate
Sensor
Battery
Life
Charging
Time
Memory User-
interaction
Water-
resistance
Android
Compati-
ble
Raw
Data
Wellograph wrist accelerometer,gyroscopeand magne-tometer
up to 7days
1 hour 4 months ofrecords
LCD screen
Notch anywhere accelerometerand gyro-scope
3 days N/A N/A no screen
LG LifeBandTouch
wrist accelerometerand altimeter
2-3 days 1-2 hours N/A OLEDTouchscreen
Sony Smart-band
wrist accelerometerand gyro-scope
5 days 1-2 hours 256kBinternalembeddedflash
Jawbone Up3
wrist Tri-axisaccelerometer
7 days 100 minutes up to 9months
Pebble wrist but itsbands aredetachable
accelerometerand gyro-scope
up to 7days
2 hours 4 MiB (32Mibit) flash
Screenwith sidebuttons
Angel Sensor wrist accelerometerand gyro-scope
1 day 1 hour N/A
Continued on next page
94

Table B.1 – Continued from previous pageWearable
Device
Placement Movement
Sensor
Heart
Rate
Sensor
Battery
Life
Charging
Time
Memory User-
interaction
Water-
resistance
Android
Compati-
ble
Raw
Data
Metaware anywhere accelerometer varies varies 256 kB flashGeneActiv wrist accelerometer N/A N/A 0.5Gb of
raw dataZwear anywhere accelerometer N/A N/A N/AHexoskin body accelerometer 14 hours N/A N/AWithingsPulse ox
anywhere accelerometer 10-12days
1-2 hours N/A touchscreen
Lumo Lift around thewaist
accelerometerand gyro-scope
5-6 days N/A 32mb offlash mem-ory
Lifetrak zoneC410
wrist pedometer one year no charging 7 day mem-ory
side but-tons
95
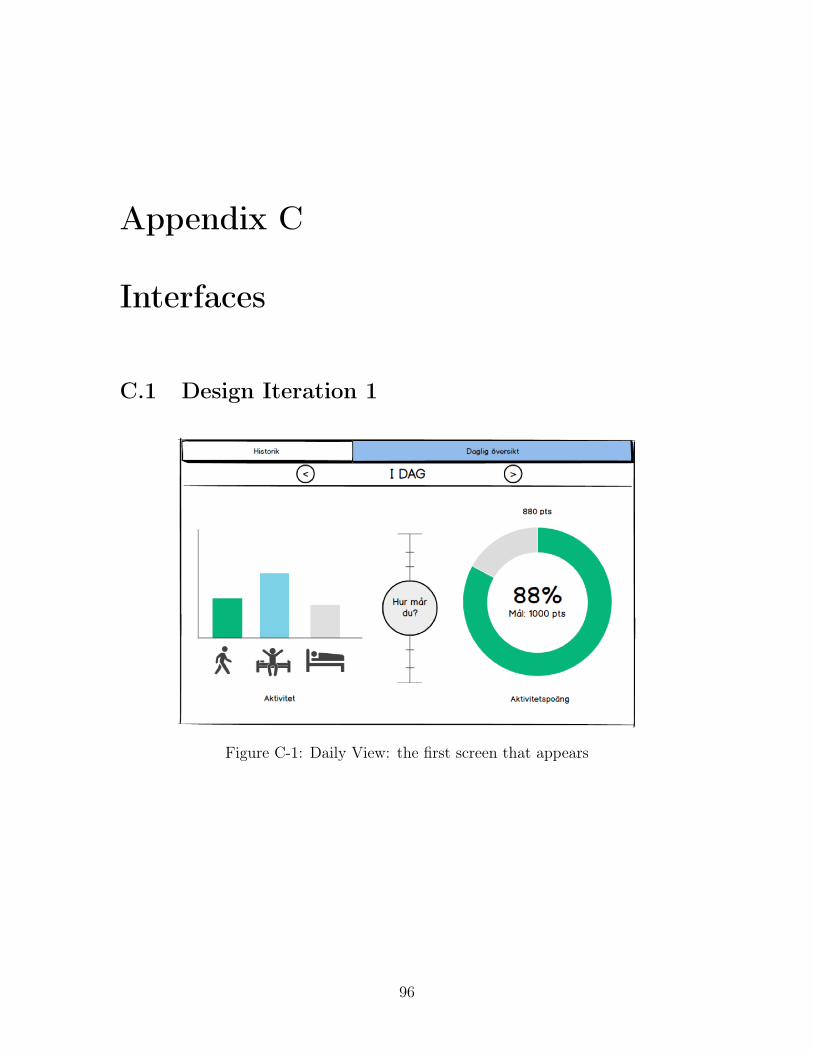
Appendix C
Interfaces
C.1 Design Iteration 1
Figure C-1: Daily View: the first screen that appears
96
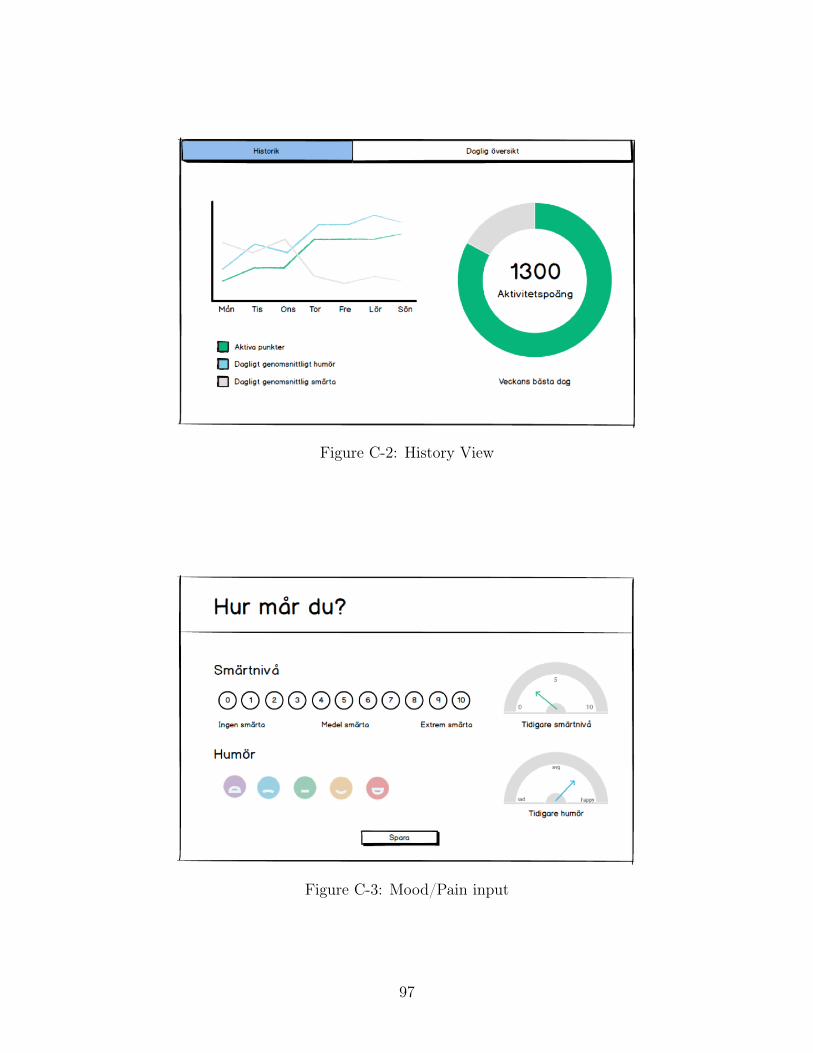
Figure C-2: History View
Figure C-3: Mood/Pain input
97
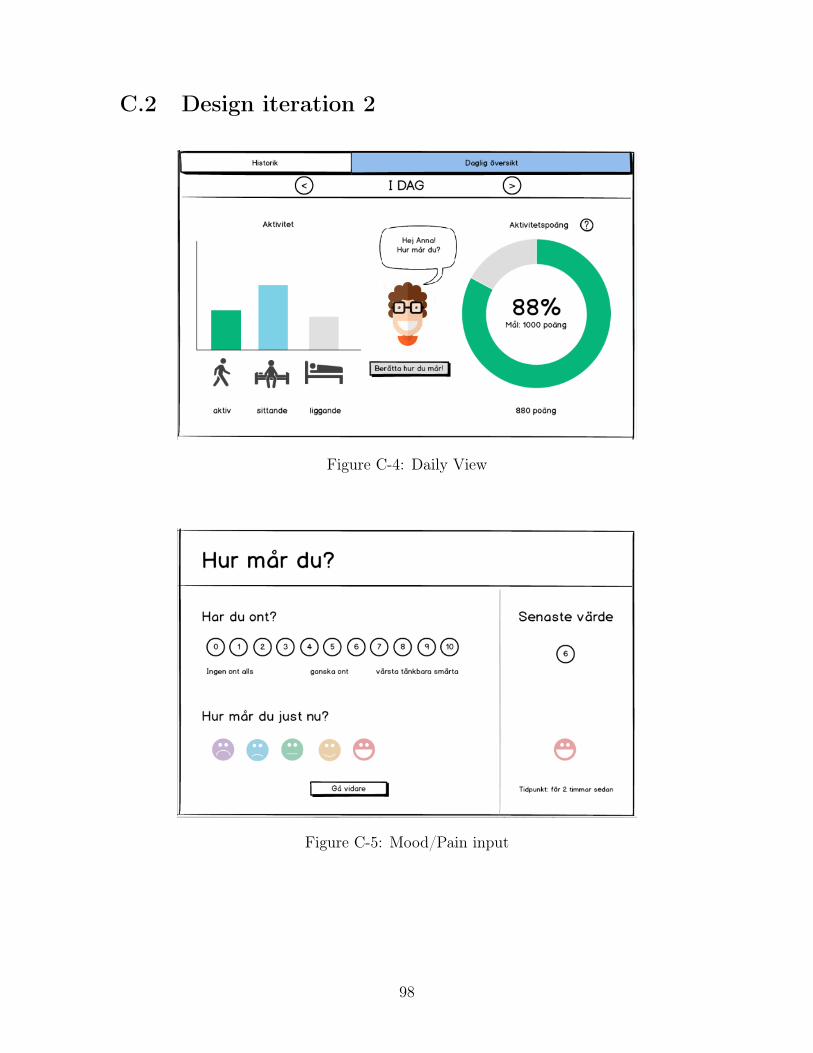
C.2 Design iteration 2
Figure C-4: Daily View
Figure C-5: Mood/Pain input
98

C.3 Design iteration 3
Figure C-6: Daily View
C.4 Design iteration 4
Figure C-7: Concept 1
99
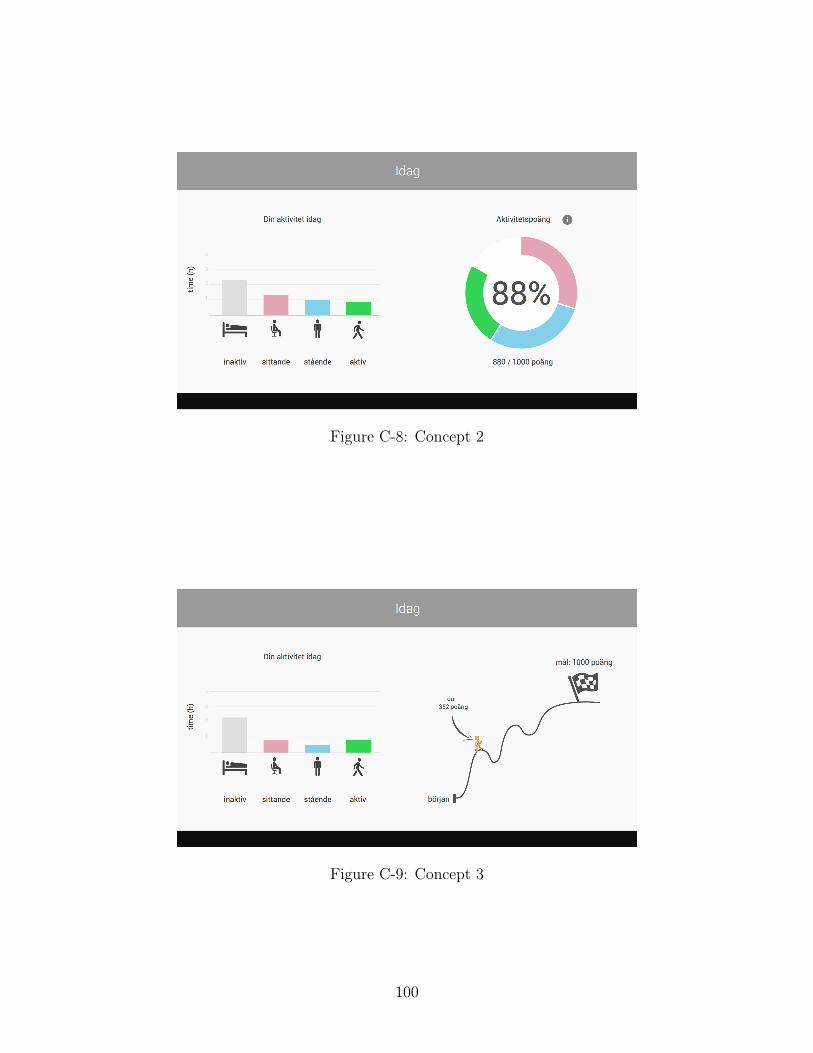
Figure C-8: Concept 2
Figure C-9: Concept 3
100
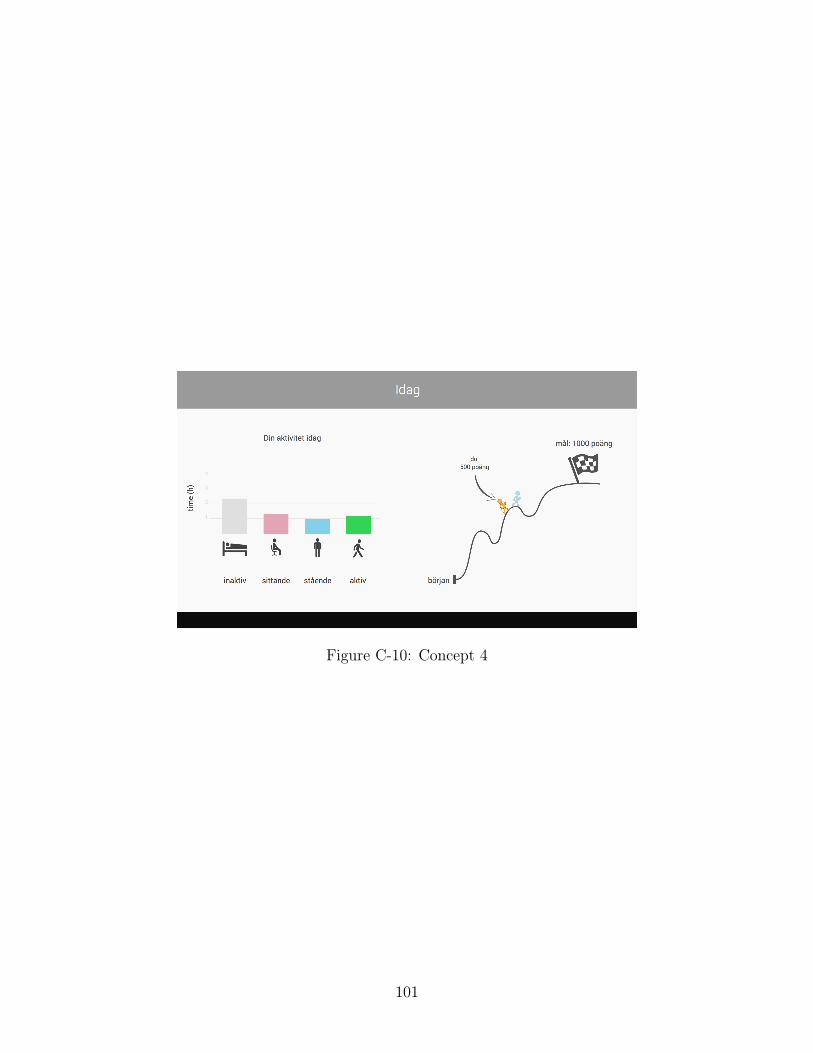
Figure C-10: Concept 4
101
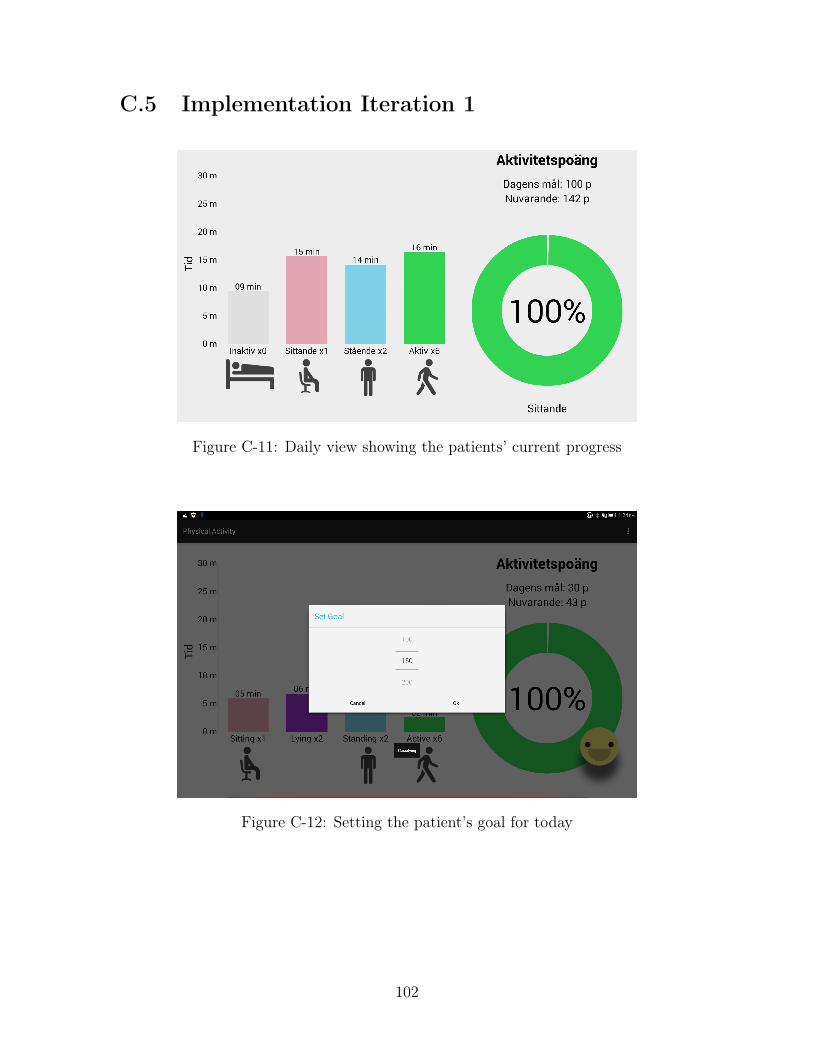
C.5 Implementation Iteration 1
Figure C-11: Daily view showing the patients’ current progress
Figure C-12: Setting the patient’s goal for today
102

Bibliography
[1] AvShigeo Abe. Support Vector Machines for Pattern Classification. SpringerScience & Business Media, 2010.
[2] Gonzalo Bailador del Pozo. State of the Art -Wearable Sensors. Technical report,2014.
[3] Dena M Bravata, Crystal Smith-Spangler, Vandana Sundaram, Allison L Gien-ger, Nancy Lin, Robyn Lewis, Christopher D Stave, Ingram Olkin, and John RSirard. Using pedometers to increase physical activity and improve health: asystematic review. JAMA : the journal of the American Medical Association,298(19):2296–2304, 2007. ISSN 1538-3598. doi: 10.1001/jama.298.19.2296.
[4] MC Brown. Getting Started with Couchbase Server. O’Reilly Media, 2013. ISBN978-1449331061.
[5] Jennifer K Carroll, Kevin Fiscella, Ronald M Epstein, Mechelle R Sanders, andGeoffrey C Williams. A 5A’s communication intervention to promote physicalactivity in underserved populations, 2012. ISSN 1472-6963.
[6] Rick Cattell. Scalable SQL and NoSQL data stores. ACM SIGMOD Record, 39(4):12, 2011. ISSN 01635808. doi: 10.1145/1978915.1978919.
[7] Chemotherapy.com. Chemotherapy Treatment Goals, 2012. URL http://www.chemotherapy.com/new_to_chemo/what_is_chemo/goals/.
[8] David J Cook. Mayo Clinic myCare, 2013.
[9] David J Cook, Jeffrey E. Thompson, Joseph A. Dearani, and Sharon K. Prinsen.How Mayo Clinic Is Using iPads to Empower Patients, 2014. URL https://hbr.org/2014/02/how-mayo-clinic-is-using-ipads-to-empower-patients.
[10] THE NATIONAL INTELLIGENCE COUNCIL, NIC NIC, and SRI Con-sulting Business Intelligence. Disruptive Civil Technologies Six Tech-nologies With Potential Impacts on US Interests Out to 2025. InNational Intelligence Council, number April, page 48, 2008. URLhttp://scholar.google.com/scholar?hl=en&btnG=Search&q=intitle:Disruptive+Civil+Technologies+Six+Technologies+With+Potential+Impacts+on+\protect\T1\textbraceleftUS\protect\T1\textbraceright+Interests+Out+to+2025#1.
103
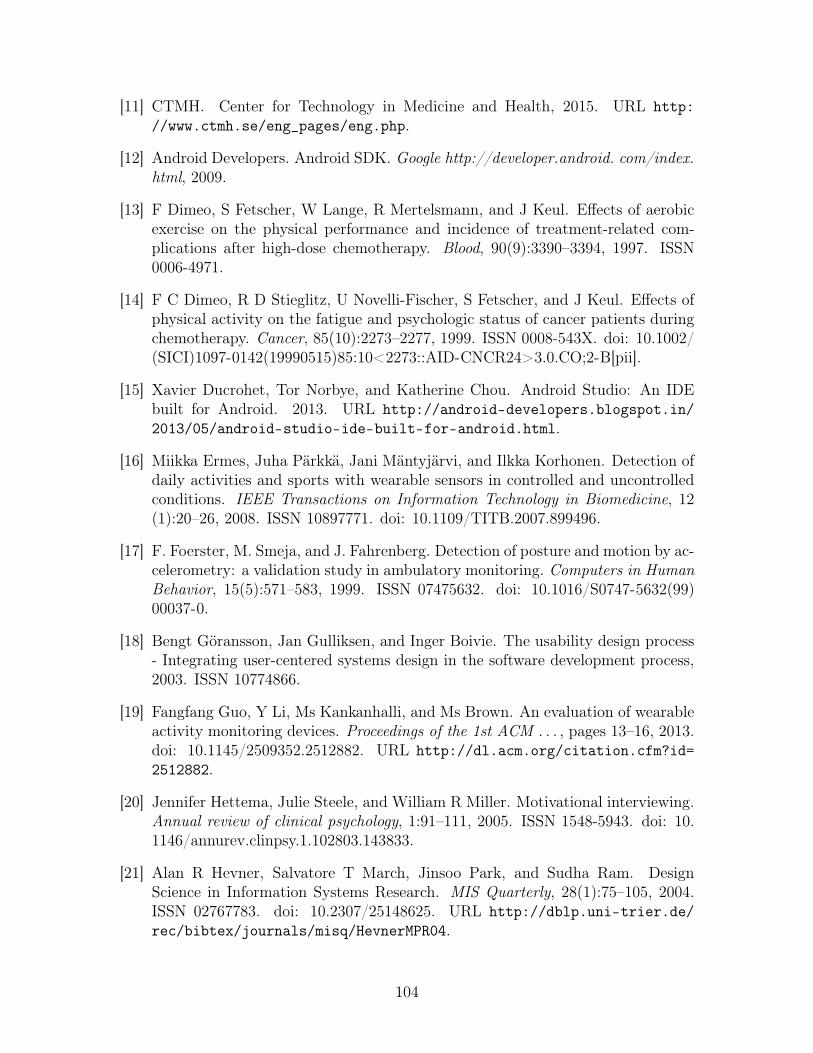
[11] CTMH. Center for Technology in Medicine and Health, 2015. URL http://www.ctmh.se/eng_pages/eng.php.
[12] Android Developers. Android SDK. Google http://developer.android. com/index.html, 2009.
[13] F Dimeo, S Fetscher, W Lange, R Mertelsmann, and J Keul. Effects of aerobicexercise on the physical performance and incidence of treatment-related com-plications after high-dose chemotherapy. Blood, 90(9):3390–3394, 1997. ISSN0006-4971.
[14] F C Dimeo, R D Stieglitz, U Novelli-Fischer, S Fetscher, and J Keul. Effects ofphysical activity on the fatigue and psychologic status of cancer patients duringchemotherapy. Cancer, 85(10):2273–2277, 1999. ISSN 0008-543X. doi: 10.1002/(SICI)1097-0142(19990515)85:10<2273::AID-CNCR24>3.0.CO;2-B[pii].
[15] Xavier Ducrohet, Tor Norbye, and Katherine Chou. Android Studio: An IDEbuilt for Android. 2013. URL http://android-developers.blogspot.in/2013/05/android-studio-ide-built-for-android.html.
[16] Miikka Ermes, Juha Pärkkä, Jani Mäntyjärvi, and Ilkka Korhonen. Detection ofdaily activities and sports with wearable sensors in controlled and uncontrolledconditions. IEEE Transactions on Information Technology in Biomedicine, 12(1):20–26, 2008. ISSN 10897771. doi: 10.1109/TITB.2007.899496.
[17] F. Foerster, M. Smeja, and J. Fahrenberg. Detection of posture and motion by ac-celerometry: a validation study in ambulatory monitoring. Computers in HumanBehavior, 15(5):571–583, 1999. ISSN 07475632. doi: 10.1016/S0747-5632(99)00037-0.
[18] Bengt Göransson, Jan Gulliksen, and Inger Boivie. The usability design process- Integrating user-centered systems design in the software development process,2003. ISSN 10774866.
[19] Fangfang Guo, Y Li, Ms Kankanhalli, and Ms Brown. An evaluation of wearableactivity monitoring devices. Proceedings of the 1st ACM . . . , pages 13–16, 2013.doi: 10.1145/2509352.2512882. URL http://dl.acm.org/citation.cfm?id=2512882.
[20] Jennifer Hettema, Julie Steele, and William R Miller. Motivational interviewing.Annual review of clinical psychology, 1:91–111, 2005. ISSN 1548-5943. doi: 10.1146/annurev.clinpsy.1.102803.143833.
[21] Alan R Hevner, Salvatore T March, Jinsoo Park, and Sudha Ram. DesignScience in Information Systems Research. MIS Quarterly, 28(1):75–105, 2004.ISSN 02767783. doi: 10.2307/25148625. URL http://dblp.uni-trier.de/rec/bibtex/journals/misq/HevnerMPR04.
104
[22] M S Heydarnejad, Dehkordi a Hassanpour, and Dehkordi K Solati. Fac-tors affecting quality of life in cancer patients undergoing chemother-apy. African health sciences, 11(2):266–70, 2011. ISSN 1729-0503. URLhttp://www.pubmedcentral.nih.gov/articlerender.fcgi?artid=3158510&tool=pmcentrez&rendertype=abstract.
[23] William L. Hosch. Machine Learning, 2014. URL http://global.britannica.com/EBchecked/topic/1116194/machine-learning.
[24] IEEE. The Wearable Revolution. Computer Graphics and Applications, IEEE,35(March):103–104, 2015.
[25] Istqb. Standard glossary of terms used in Software Testing. (July):1–50,2014. URL http://www.istqb.org/downloads/glossary-current.pdf$\delimiter"026E30F$nhttp://www.istqb.org/downloads/syllabi/CTAL_Syllabus_V_2007.pdf$\delimiter"026E30F$nhttp://www.istqb.org/downloads/syllabi/SyllabusFoundation.pdf.
[26] Val Jones, Aart van Halteren, Ing Widya, Nikolai Dokovsky, George Koprinkov,Richard Bults, Dimitri Konstantas, and Rainer Herzog. Mobihealth: MobileHealth Services Based on Body Area Networks. In M-Health, pages 219–236.2006. ISBN 978-0-387-26558-2, 978-0-387-26559-9. doi: 10.1007/0-387-26559-7\_16. URL http://link.springer.com/chapter/10.1007/0-387-26559-7_16.
[27] Mitchell H. Katz. Study Design and Statistical Analysis: A Practical Guide forClinicians. Cambridge University Press, 2006. ISBN 0521826756.
[28] Olive Labs. Olive : A Wearable to Manage Stress, 2014. URL https://www.indiegogo.com/projects/olive-a-wearable-to-manage-stress.
[29] Merryn J Mathie, Adelle C F Coster, Nigel H Lovell, and Branko G Celler. Ac-celerometry: providing an integrated, practical method for long-term, ambula-tory monitoring of human movement. Physiological measurement, 25(2):R1–R20,2004. ISSN 0967-3334. doi: 10.1088/0967-3334/25/2/R01.
[30] Kal Benjamin Mcdowd. Life IS a Sport : How the Nike + FuelBand Gets ItRight & Represents the Evolution of Design for Wearables.
[31] Huang Nancy. Motivating patients to move. Australian Family Physician, 34(6):413–417, 2005. ISSN 0016867X.
[32] J. Nielsen. Iterative User Interface Design. IEEE Computer, 26(11):32–41, 1993.URL http://www.useit.com/papers/iterative_design/.
[33] Christian Nordqvist. What is chemotherapy? What are the side effects ofchemotherapy?, 2014. URL http://www.medicalnewstoday.com/articles/158401.php.
105

[34] physicalactivity. Physical Activity, 2015. URL http://www.who.int/topics/physical_activity/en/.
[35] Gunjan Rastogi. How to Motivate a Person with Can-cer to Exercise, 2012. URL http://www.onlymyhealth.com/how-motivate-person-cancer-exercise-1346399099.
[36] Jeffrey Rubin and Dana Chisnell. Handbook of Usability Testing: How to Plan,Design, and Conduct Effective Tests. Number 2. Wiley Publishing, 2 edition,2011. ISBN 9780470185483.
[37] sarcopenia. Sarcopenia (Muscle Loss With Aging): Symptoms,Causes, and Treatments. URL http://www.webmd.com/healthy-aging/sarcopenia-with-aging.
[38] Robert Scales and Joseph H Miller. Motivational techniques for improving com-pliance with an exercise program: skills for primary care clinicians. Currentsports medicine reports, 2(3):166–172, 2003. ISSN 1537-890X.
[39] Human Services and Thomas Jefferson. Taking Steps Toward Increased PhysicalActivity :. President’s Council on Physical Fitness and Sports, (17):1–8, 2002.
[40] American Cancer Society. What is chemotherapy ? How chemotherapy works.American Cancer Society, pages 1–29, 2013. URL www.cancer.org.
[41] Elizabeth E. Stewart and Chester Fox. Encouraging patients to change unhealthybehaviors with motivational interviewing. Family Practice Management, 18(3):21–25, 2011. ISSN 10695648.
[42] Melanie Swan. Sensor Mania! The Internet of Things, Wearable Computing,Objective Metrics, and the Quantified Self 2.0. Journal of Sensor and ActuatorNetworks, 1(3):217–253, 2012. ISSN 2224-2708. doi: 10.3390/jsan1030217. URLhttp://www.mdpi.com/2224-2708/1/3/217/htm.
[43] Ewa a. Szymlek-Gay, Rosalina Richards, and Richard Egan. Physical activityamong cancer survivors: a literature review. The New Zealand medical journal,124(1337):77–89, 2011. ISSN 11758716.
[44] Usability.gov. Usability Testing, 2015. URL http://www.usability.gov/how-to-and-tools/methods/usability-testing.html.
[45] Stefan van der Spek, Jeroen van Schaick, Peter de Bois, and Remco de Haan.Sensing Human Activity: GPS Tracking, 2009. ISSN 1424-8220.
[46] Susan Vincent and Cara L. Sidman. Determining Measurement Error inDigital Pedometers. Measurement in Physical Education and Exercise Sci-ence, 7(1):19–24, 2003. doi: 10.1207/S15327841MPEE0701\_2SusanD.Vincent\&CaraL.Sidman.
106
[47] welfaredenmark. Welfare Denmark: Technologies for a better life, 2013. URLhttp://www.welfaredenmark.dk/dk/loesninger/.
[48] WHOQOL. The World Health Organization Quality of Life Assessment(WHOQOL): development and general psychometric properties. Social sci-ence & medicine (1982), 46(12):1569–85, 1998. ISSN 0277-9536. doi: 10.1016/S0277-9536(98)00009-4. URL http://www.ncbi.nlm.nih.gov/pubmed/9672396.
[49] Katie Wike. Mayo Clinic iPad App Utilizing FitBit Tech-nology, 2013. URL http://www.healthitoutcomes.com/doc/mayo-clinic-ipad-app-utilizing-fitbit-technology-0001.
[50] J Wiskemann and G Huber. Physical exercise as adjuvant therapy for patientsundergoing hematopoietic stem cell transplantation. Bone marrow transplanta-tion, 41(4):321–329, 2008. ISSN 0268-3369. doi: 10.1038/sj.bmt.1705917.
[51] zephyr. ZephyrLife - Hospital, 2013. URL http://zephyranywhere.com/healthcare/zephyrlife-hospital/.
107