development of a new australian defence force fresh food ... · provisioning scale (supman...
TRANSCRIPT

Development of a new Australian Defence Force Fresh Food Provisioning Scale (SUPMAN 4/NAVSUPMAN 5 Review)
¹Angela Malberg and Chris Forbes-Ewan
Human Protection and Performance Division
Defence Science and Technology Organisation
¹Queensland Health
DSTO-TR-2412
ABSTRACT ADF members are fed according to the entitlements stipulated in SUPMAN 4 and NAVSUPMAN 5. The entitlements are aimed at meeting the 'worst case' situation, the nutritional requirements of young, active, males. Because not all ADF members are equally active, and females generally have lower nutritional requirements than males, there is the potential for more food to be made available than is needed. DSTO was requested to devise ration scales that more efficiently satisfy the demonstrated nutritional requirements of ADF members. The results of doubly-labelled water studies to determine the energy expenditures of ADF members were used to devise Military Recommended Dietary Intakes (MRDIs) applicable to four sub-groups of ADF members—adult males, adult females, adolescent males and adolescent females—also taking into account five levels of physical activity. An adaptation of a program used to assess the draft Nutrient Reference Values (NRVs) for Australia and New Zealand was then used to determine food entitlements to meet the MRDIs. The revised ration scales provide 12.5, 14.5, 16.5, 19.5 and 25 MJ per person per day respectively for five activity categories (denoted Level 1 to 5, respectively). The basic scale meets the energy requirement for troops working at Level 1, and the micronutrient requirements of troops working at Level 1, 2, 3 and 4. Additional food is provided in the form of 1-MJ food modules which can be issued as Morning Tea, Afternoon Tea and/or Supper. The new ration scales will ensure that troops are fed according to their nutritional requirements. This has the potential to reduce wastage and to impact positively on nutritional status of ADF members, including reduced levels of overweight/obesity, together with the flexibility to allow caterers to better meet the nutritional requirements of the group of defence personnel being fed.
RELEASE LIMITATION
Approved for public release

Published by Human Protection and Performance Division DSTO Defence Science and Technology Organisation 506 Lorimer St Fishermans Bend, Victoria 3207 Australia Telephone: (03) 9626 7000 Fax: (03) 9626 7999 © Commonwealth of Australia 2010 AR-014-764 May 2010 APPROVED FOR PUBLIC RELEASE
Development of a new Australian Defence Force Fresh Food Provisioning Scale (SUPMAN 4/NAVSUPMAN 5 Review)
Executive Summary The intake of adequate energy and nutrients plays a fundamental role in ensuring that ADF personnel are operationally ready. Rationing systems (including freshly cooked food or ‘fresh feeding’) that promote a high level of nutritional status before, during and after operations or training are essential to ensure that ADF performance is optimal and sustained. This document reports on the revision and consolidation of The Australian Defence Force Ration Scale (ADFRS) SUPMAN 4, the catering manual used by Army and RAAF, and NAVSUPMAN 5, used by RAN. This revision was conducted under Task VCDF 07/082 in response to a request from Joint Logistics Command’s Defence Catering Policy Cell. The request for revision and consolidation of these documents resulted from:
i. The publication in 2006 by the National Health and Medical Research Council (NHMRC) of Nutrient Reference Values (NRVs) for Australia and New Zealand;
ii. Recommendations for Military NRVs (MNRVs) in light of the new NRVs for Australia and New Zealand in a recent DSTO Technical Report titled Australian Defence Force Nutritional Requirements in the 21st Century (Version 1); and
iii. Revision of the Core Food Groups and Australian Guide to Healthy Eating (revisions that are being undertaken as a result of the publication of the NRVs).
DSTO has contributed funding to the NHMRC project to update Australia’s Core Food Groups and the Australian Guide to Healthy Eating. Both apply to the general (i.e. civilian) population and need revision following the publication of the NRVs. The contractors involved in this NHMRC project are working as consultants with DSTO to ensure that the ADF Fresh Food Scale (FFS) forms the basis for the provision of a nutritionally adequate food supply for ADF personnel. A major challenge for this task was to incorporate flexibility within the new FFS to allow the provision of increasing energy and nutrient requirements for five levels of ADF operational activity—Level 1 (‘relatively sedentary’) to Level 5 (‘extremely strenuous’). The main features of the draft FFS are:
• It remains close to the existing SUPMAN 4 and NAVSUPMAN 5, but has been updated in light of recent publications detailing the nutritional requirements for the general Australian population, and taking into consideration the specific requirements of military personnel.
• The basic tables of the draft FFS were developed to provide food to meet the energy and macronutrient requirements of ADF personnel working at Level 1 Activity Category and the micronutrient requirements of ADF personnel working
at Level 4 Activity Category. In this way the majority of ADF personnel will be provided adequate micronutrients for all but the highest activity category (Level 5) by the basic catering provided at all sites. As activity category increases, additional energy and macronutrients can be provided without having to allow particularly for the provision of additional micronutrients.
• Modelling conducted by the NHMRC Core Food Group (CGF) contractors established the required amounts of food in each food group per week to ensure a nutritionally adequate base diet providing 12.5 MJ of energy (Level 1).
• As energy requirements increase with activity category levels, the draft FFS provides additional energy in 1-MJ modules for consumption at appropriate times and in forms which promote consumption.
• Definitions are included of what constitutes each feeding opportunity: Breakfast, Lunch/Dinner, and Refreshment Modules.
• The new FFS provides ‘extra’ foods (e.g. ice-cream), that have traditionally been included in the ADFRS in small amounts in the base Level 1 diet and through the use of modules of additional energy as requirements increase with activity levels.
• The introduction of a weekly scale to replace the previous daily scale allows caterers flexibility to increase the variety of food provided from day-to-day.
Education of caterers will be an important aspect of the introduction of the new FFS. It is strongly recommended that information about the use of the FFS be provided with the tables. As a minimum, definition of what constitutes the various meals, snacks and suppers should accompany the tables. Advice about menu planning using a weekly rather than daily scale is recommended.

Authors
Angela Malberg Queensland Health Angela Malberg has qualifications in Nutrition, Dietetics and Agribusiness Management from Deakin University and Monash University. She has many years experience working in the field of Public Health Nutrition. Major projects have included: managing the development of the Australian Guide to Healthy Eating and associated resources for the Commonwealth Dept of Human Services and Health; researching a product labeling and description system with David McKinna et al for the Meat Research Corporation that informed the development of Meat Standards Australia (MSA); managing three Nutrition Advisory Services for Nutrition Australia Queensland; and managing the regional and rural phase of the TLC Diabetes Research Project for University of Queensland’s Centre for Online Health. Following a short-term contract with DSTO to assist in development of a fresh feeding scale for the ADF, Angela now manages nutrition services across three Public Health Units for Southern Regional Services in Queensland Health. Her work focuses on the public health nutrition outcome areas of Food Supply and Supportive Environments for Healthy Eating.
____________________ ________________________________________________
Chris Forbes-Ewan Human Protection and Performance Division Chris graduated from the Australian National University with BSc (Hons) in 1972. He has 35 years experience in food science, nutrition and exercise physiology, including extensive research into food acceptability, food intake, energy expenditure and physical performance enhancement of ADF members. For ten years Chris was the Australian National Leader of an international defence technical panel under The Technical Cooperation Program (TTCP). This panel conducted collaborative and cooperative research into performance enhancement for special and conventional military operations. Currently Chris is continuing his research into aids to military performance and nutritional promotion of health and military fitness. From 2006 until 2008 he was Assistant Site Manager of DSTO-Scottsdale. From 2007 until 2009 Chris was the Australian member of a NATO Research Technical Group that developed common nutritional standards for ration packs.
____________________ ________________________________________________

Contents
1. INTRODUCTION .....................................................................................................................1
2. BACKGROUND........................................................................................................................2
3. DEVELOPMENT OF A DRAFT FRESH FOOD SCALE..................................................4
4. COMPARISON OF DRAFT FRESH FOOD SCALE WITH ADFRS ............................6
5. USING THE DRAFT FRESH FOOD SCALE......................................................................7 5.1 Use of Draft Fresh Food Scale for Development of Basic (Level 1) Menus.......7 5.2 Planning menus for higher energy level operations/Levels 2–5 Catering .........7
5.2.1 Practical implementation of 1-MJ modules..............................................9
6. CONCLUSIONS & RECOMMENDATIONS ..................................................................11
7. ACKNOWLEDGEMENTS....................................................................................................11
8. REFERENCES...........................................................................................................................12
APPENDIX A: NUTRITION CRITERIA FOR FRESH FOOD AVAILABILITY..... 13
APPENDIX B: FINAL REPORT TO DSTO ON DIETS CONFORMING TO MILITARY NUTRIENT STANDARDS AT ENERGY LEVELS RANGING FROM 12.5 TO 25 MJ ......................................................... 15
APPENDIX C: DRAFT FRESH FOOD SCALE .............................................................. 43
DSTO-TR-2412
1
1. Introduction
Nutritional status is a critical determinant of physical and cognitive performance, and immune status. The intake of adequate energy and nutrients plays a fundamental role in ensuring that ADF personnel are operationally ready. Therefore, rationing systems that provide a nutritionally adequate food supply are essential to ensure that ADF performance is optimal. Ration packs that will sustain troops during short-term, high-intensity operations (e.g. up to 72 hours) and support long-term, low-intensity operations (lasting many weeks) in the heat, cold, and (perhaps) at altitude are necessary components of ADF rationing systems. Equally important is the need for ration scales that promote a high level of nutritional status before, during and after operations or training when rationing is with freshly-cooked food (‘fresh feeding’). The Defence Catering Policy Cell, within Joint Logistics Command, has requested a significant revision and consolidation of two key policy documents—The Australian Defence Force Ration Scale (ADFRS) SUPMAN 4 and NAVSUPMAN 5—reference documents used by the ADF and Defence-contracted caterers for provision of meals in-barracks, during training and on operational deployments, and also for provision of combat ration packs. Currently, soldiers’ entitlements to freshly cooked food are specified in the Australian Defence Force Ration Scales and Scales of Issue (ADFRS) published as SUPMAN 4 (Department of Defence, 2008a). In contrast, RAAF and RAN do not feed according to scales of entitlement. NAVSUPMAN 5 (Department of Defence, 2008b) provides guidance to Navy caterers on appropriate quantities of foods and appropriate menus, but does not stipulate food entitlements. Rather, Navy victualling is accounted for according to financial entitlements. Similarly, RAAF rationing is guided by SUPMAN 4, but accounting for food usage is ‘dollar based’. SUPMAN 4 and NAVSUPMAN 5 are reviewed regularly by the Defence Catering Working Group. SUPMAN 4 states that:
… in all environments … personnel should be fed to the best possible standard, using fresh rations wherever possible, and tailored to meet the nutritional requirement of the activity being supported.
SUPMAN 4 acknowledges that:
During operations, the range of items may need considerable amendment depending on availability, transport and other factors which must be recognised when the feeding plan is developed.
Feeding soldiers in barracks involves implementing the full entitlements to food as specified in SUPMAN 4. Accounting for food usage involves determining the quantities of foods that were permitted to be drawn based on the actual level of attendance (as opposed to ration strength, i.e. the number who are entitled to be fed).
DSTO-TR-2412
2
SUPMAN 4 also states that:
In a non-operational environment, Combat Ration Packs (CRP), non-perishables and canned equivalent items may be issued for turnover of stocks. CRP will also be issued for training and exercise purposes, to meet an emergency, or when conditions preclude the use of fresh food or canned equivalents.
2. Background
The request for revision and consolidation of SUPMAN 4 and NAVSUPMAN 5 resulted from:
i. The publication in 2006 by the National Health and Medical Research Council (NHMRC) of Nutrient Reference Values (NRVs) for Australia and New Zealand;
ii. Recommendations for Military NRVs (MNRVs) in light of the new NRVs for Australia and New Zealand in a recent DSTO Technical Report titled Australian Defence Force Nutritional Requirements in the 21st Century (Version 1); and
iii. Revision of the Core Food Groups and Australian Guide to Healthy Eating (revisions that are being undertaken as a result of the publication of the NRVs).
Prior to 2006, NHMRC nutritional recommendations addressed only Recommended Dietary Intakes (RDI). This was reflected in the form of Recommended Military Dietary Intakes (RMDI) in an internal (i.e. unpublished) DSTO report by Forbes-Ewan (2002). However, the NHMRC (2006) NRV include not only RDI, but also Estimated Average Requirements (EAR) and Adequate Intakes (AI) for a wide range of nutrients, an Acceptable Macronutrient Distribution Range (AMDR), and Suggested Dietary Targets (SDT) for a small range of nutrients thought to be particularly relevant to health. Furthermore, many of the 2006 RDI differ substantially from previous recommendations. Consequently, the report by Forbes-Ewan (2002) was revised to take into account the revised RDI and the development of additional NRV (particularly the EAR, AI, and AMDR). The revised report (Forbes-Ewan, 2009) provides a basis for determining the nutritional adequacy of food provided to ADF personnel in all training and operational situations. The nutritional requirements of four distinct population groups within the ADF are identified: Adult Males; Adult Females; Adolescent Males; and Adolescent Females. Five levels of energy requirement are identified, based on the range of physical workloads of training and operational activities performed by ADF personnel. These range from Level 1—applicable to personnel performing relatively sedentary activities—up to Level 5, applicable to adult male ADF members attempting the Special Air Service Regiment selection course and other comparable activities. (The highest level of physical activity for the other three population sub-groups is Level 4.) The report by Forbes-Ewan (2009) also contains revised RMDI and renames them as Military Recommended Dietary Intakes (MRDI) to distinguish them from the unpublished RMDI. It is anticipated that the MRDI will be officially adopted as the basis for determining nutritional requirements.

DSTO-TR-2412
3
Values are also recommended for military–specific EAR (denoted MEAR) for the same group of vitamins and minerals for which there are military-specific MRDI1. Forbes-Ewan (2009) provides two tables of recommended nutritional criteria for fresh feeding for a mixed ADF population. One table is based on MRDI and the other on MEAR/AI respectively (Appendix A). DSTO has contributed funding to the NHMRC project to update Australia’s Core Food Groups and the Australian Guide to Healthy Eating, both of which apply to the general (i.e. civilian) population and need revision following the publication of the NRV. The contractors involved in this NHMRC project are working as consultants with DSTO to ensure that the ADF Fresh Food Scale forms the basis for the provision of a nutritionally adequate food supply for ADF personnel. The above-mentioned tables were used to inform the modelling process described below. As previously discussed, NAVSUPMAN 5 (Navy) and SUPMAN 4 (Army and Air Force) provide the scales of issue, or guidance on food availability for ADF fresh feeding for training and operations in barracks, at sea and on deployment. These documents provide a food scale (or guide) for foods to meet daily nutritional requirements of ADF personnel. It should be noted that the current basic scale of SUPMAN 4 is intended to be a maximum scale, meeting the needs of all ADF members other than Special Forces troops (who are entitled to supplementary food in addition to the food provided by the basic scale). SUPMAN 4 does not take into account the work rates of groups of personnel engaged in specific forms of training or on particular operations, as identified by Forbes-Ewan (2009). By meeting the needs of troops engaged in very vigorous work, the basic scale makes more food available than is needed by those troops who do not have arduous occupations. This has implications in terms of the potential for food wastage and also with respect to overweight/obesity in the ADF. However, although the basic scale in SUPMAN 4 is intended to be a maximum scale, recent studies (Probert et al. 2005; Forbes-Ewan et al. 2008) have suggested that some training situations may involve energy expenditures at levels marginally greater than those provided for by the current basic scale. Developing a basis of food provisioning which addresses the specific nutritional needs of each ADF training or operational situation would ensure that all ADF personnel are effectively and efficiently provided with the appropriate nutrition to allow optimal military performance. NAVSUPMAN 5 and SUPMAN 4 have been used as the basis of issue for ADF catering for many years. Any changes to the structure and content of these scales will require careful change management and education to ensure that ADF personnel receive the nutrients they require to maintain peak health and fitness, thereby maximising their ability to complete their military tasks.
1 The MRDI for most nutrients is the RDI as published by the NHMRC (2006). If there is no RDI for a particular nutrient, the MRDI is taken to be the AI, with the exceptions of thiamin, riboflavin, niacin, vitamin B6 and sodium. Military-specific MRDI have been devised for these nutrients, as described by Forbes-Ewan (2009).

DSTO-TR-2412
4
3. Development of a Draft Fresh Food Scale
A major challenge for this task was to incorporate flexibility within the new Fresh Food Scales to allow the provision of increasing energy and nutrient requirements with the five levels of operational activity. The tables of the draft Fresh Food Scale were developed so as to provide food to meet the energy and macronutrient requirements of ADF personnel working at a Level 1 Activity Category and the worst case micronutrient requirements of ADF personnel working at an Activity Category Level 4. In this way the majority of ADF personnel will be provided adequate micronutrients for all but the highest activity category (Level 5) of requirements in basic catering provision at all sites. As activity category increases, additional energy and macronutrients can be provided with little concern for providing additional micronutrients. However, a note of caution here applies to additional protein and sodium, as discussed in section 5.1 below. Diet modelling was conducted by the NHMRC Core Food Group (CGF) consultants so that the scale remained as close to the existing SUPMAN 4 and NAVSUPMAN 5 as possible, whilst ensuring that the new scale is consistent with current nutritional science. The diet modelling conducted by the consultants to the NHMRC Core Food Groups Project is shown in Appendix B. Initial modelling was conducted to provide food group distributions for diets providing 12.5 MJ and 14.5 MJ. The modelling was refined to investigate the viability of providing a base diet with additional food to meet increasing nutrient requirements at higher activity categories. The Core Food Group Consultants provided several models for consideration. Diet A was selected because it provided the distribution of Food Group servings most similar to those provided by SUPMAN 4 and NAVSUPMAN 5. Following a teleconference with the Consultants, this diet model was further revised to reduce protein contribution to energy to below 22.1%, replace two serves of polyunsaturated fats with two serves of nuts/seeds, and revise the dairy serves to include high, medium and lower fat categories. Diet A, Revision Diet 1 modelling met nearly all of the nutritional criteria recommended by Forbes-Ewan (2009). Notably 100% of 7-day ‘real’ diets provided greater than the MEARs/AIs, percent energy from protein (21.1%) was slightly higher than the desired 20%, and sodium (2210 mg) was close to the upper recommended level of 2300 mg. Modelling established the required amounts of food in each food group per week to ensure a nutritionally adequate base diet providing 12.5 MJ of energy (Level 1). These foods did not include some ‘extras’ (e.g. ice-cream) that have traditionally been included in the ADFRS. The decision was made to include two standard serves of ‘extra’ foods per day in the Level 1 diet. This base or Level 1 diet consisting of Diet A, Revision Diet 1 plus two extras serves was then modelled by the consultants to the NHMRC Core Food Groups Project and forms the basis of Level 1 catering for the Fresh Food Scale. The food groups identified in Diet A, Revision Diet 1 Plus were expanded into tables of nutritionally equivalent foods that form the basis of the new Serials 1-7.

DSTO-TR-2412
5
Quantities outlined in the modelling process related to edible portions of food ‘as eaten’. Allowance was made for:
Shrinkage (loss of weight) during processing where this occurs, e.g. where meat or fish is cooked. Williams et al. (2006) suggested a shrinkage rate of 28.6% when meat is cooked. This percentage was applied also to fish and shellfish in the absence of other references.
Catering wastage (food produced but not consumed) of 15% across all serials; this consists mainly of servery and plate waste, as recommended by Forbes-Ewan (2009).
In order that the FFS accommodate increasing energy requirements at higher activity levels a system of 1-MJ add-ons was developed and modelled. The Modules were defined so that the addition of extra energy to the base Level 1 diet is done in such a way that the macronutrient composition of the FFS at each activity level is consistent with the recommendation for macronutrient distribution outlined by Forbes-Ewan (2009). The report on the modelling process (Appendix B) by the consultants to the NHMRC Core Food Groups Project shows that the recommendations for Levels 2-5 catering using the Level 1 diet, plus recommended distribution of addition modules of energy result in diets at all five levels that are consistent with the nutritional criteria recommended by Forbes-Ewan (2009). An eighth serial was added to the FFS. Foods and culinary adjuncts like tea, coffee and other flavourings used in minimal amounts were assigned to Serial 8 without recommendations on order quantities. These items are valuable adjuncts to food variety, however it is recommended that guidance is provided to caterers regarding the contribution to salt intake that some of these items can make. The draft FFS tables were produced as worksheets within an MS Excel document from tables developed from the nutritional analysis program FoodWorks (Xyris, Brisbane). The use of such a program allows ready reference to the FFS serial to ensure the nutritionally equivalent amount of food is selected for menu planning. Appendix C shows the draft Fresh Food Scale. The draft FFS allows caterers to consistently provide appropriate quantities and types of food for all ADF personnel. At the basic activity category (Level 1) the scale will provide adequate micronutrients for personnel working at all but the highest activity category (i.e. up to Level 4). As energy requirements increase with activity category levels, extra modules of food can be provided at appropriate times and in forms which promote consumption, and hence increase the likelihood that troops will meet their increased energy and macronutrient needs. For personnel working at activity category Level 5 modules of food need to be added in recommended quantities to ensure they provide not just extra energy but also meet all the MNRVs. Modelling shows that the extra micronutrient needs at Level 5 are met by the draft Fresh Food Scale. The introduction of a weekly scale to replace the previous daily scale allows caterers flexibility to increase the variety of food provided from day-to-day. Recommended definitions of meals and suggested distribution of modules of extra energy between meals and at supper are included.

DSTO-TR-2412
6
4. Comparison of Draft Fresh Food Scale with ADFRS
A summary comparison of serial equivalents from the Fresh Food Scale with the ADFRS (SUPMAN 4) is provided in Table 1. Table 1: Comparison of serial equivalents between Fresh Food Scale and SUPMAN 4
SUPMAN 4 (FFS) Serial Equivalents Draft Fresh Food Scale SUPMAN 4 1. Milk (Milk and Alternatives) 860 mL 750 mL 2. Meat (Meat and Alternatives) 308 g 400 g 3. Egg 1 no. 1 no. 4. Bacon Nil 30 g 5. Potato (Starchy Vegetable) 345 g 400 g 6. Fruit and Vegetables & 14. Fruit Juice (Fruit) (Vegetables)
520 g 510 g
450 g + 90 mL
450 g 7. Bread (Bread and Cereals) 460 g 550 g 8. Butter (Unsaturated Fats, Nuts and Seeds) 50 g 65 g 9. Jam Assorted 32 g 10. Sugar 80 g 13. Beverages 9 g 15. to 26. Culinary Adjuncts
FFS includes Serial 7 ‘extras foods’. Culinary Adjuncts
reclassified to include flavourings, herbs, tea,
coffee etc only. various
(Energy Modules) 1-MJ equivalents include food from various food
serials and adjuncts.
Nil
The draft Fresh Food Scale provides slightly more Milk, Dairy and Alternatives, Fruit and Vegetables and slightly less Starchy Vegetables, and Breads and Cereals than SUPMAN 4. The Butter serial has been replaced with Unsaturated Fats, Nuts and Seeds, and has been slightly reduced in quantity. Serials 9, 10 and 13 have been moved into Serial 7 ‘extra foods’ together with some reclassified foods such as ice-cream and butter. The Meat and Alternatives (including Bacon) serial has been reduced from 430 g to 308 g. The Eggs serial remains the same. Note that the draft Fresh Food Scale tables show 9 eggs per week, however, the additional two eggs have been added to the Meat and Alternatives group for ease of comparison.

DSTO-TR-2412
7
5. Using the Draft Fresh Food Scale
Education of caterers will be an important aspect of the introduction of the new FFS. It is strongly recommended that information about the use of the FFS be provided with the tables. As a minimum, definition of what constitutes the various meals, snacks and suppers should accompany the tables. Advice about menu planning using a weekly rather than daily scale is recommended. 5.1 Use of Draft Fresh Food Scale for Development of Basic (Level 1) Menus
A weekly scale allows for flexibility of distribution of quantities of each serial. For example, a caterer has the option to provide one egg per day per person OR two eggs three times per week, and to use the three remaining eggs for cooking custards and desserts OR two eggs three times per week at breakfast, two eggs as main meal dish and one egg for cooking custards or desserts, etc. In another example meat, fish, white meat, legume serves can be provided as one large serve per day OR as one three quarter size serve and one quarter size serve OR as two small serves. How the weekly scale of issue is distributed across a menu is at the Caterer’s discretion within some limits. Currently catering contracts usually require that a six week cyclic menu be provided, with definitions of meals. The definitions and requirements contained in catering contracts need to be reviewed to ensure that they are contributing positively to the provision of nutritionally adequate catering for ADF personnel. The following table outlines recommended definitions of meals. 5.2 Planning menus for higher energy level operations/Levels 2–5 Catering
Forbes-Ewan (2009) identifies energy requirements increasing from 12.5 MJ (for mixed ADF populations working at Level 1) to 25 MJ for male adult ADF members working at Level 5. The structure of the draft Fresh Food Scale makes allowance for increased energy requirements of personnel via the addition of modules of energy. The FFS provides adequate energy, macro and micronutrients for ADF personnel working at level 1 physical activity category. Additional modules of energy are required to meet nutritional requirements as activity levels increase. These modules A, B, C, D and E each provide 1 MJ of energy and are defined in the FFS (Appendix C). Module F corresponds to darker green and other vegetables with minimal energy value. The FFS encourages the use of these foods to increase the variety of food provided at higher catering levels.

DSTO-TR-2412
8
Table 1: Recommended Definition of Meals
Breakfast will consist of either:
Hot Breakfast 2 eggs plus half meat serve (~60 g bacon) plus 2 serves (~150 g) cooked vegetables and/or legumes 2 toast, 2 fruit serves (fresh or juice) and 1 dairy (milk or yogurt) OR Continental Breakfast Hot or cold vegetable or fruit muffins, pancakes, crumpets, toast etc. Large serve hot or cold cereal, porridge, muesli, breakfast flakes Stewed or fresh fruit, fruit juice, milk or yogurt
Lunch and Dinner will consist of either:
Salad/Sandwich Bar 2 x cereal/pasta/rice salads plus 2 x serves of starchy vegetables as potato salad/baked potato/potato dish 3 x other vegetable/legume salads Selection of non-dressed salad vegetables including lettuce tomato beetroot cucumber corn etc. Selection of meats/fish/dips/nuts/cheeses/felafal (or other high quality vegetarian protein source) Selection of breads/bagels/wraps/pizza-breads/pita-breads etc. OR Hot Main Meal Choice from one grill OR roast, two wet dishes, one vegetarian dish (with high quality vegetarian protein source) 1 x low fat vegetable based pasta or rice dish always available in addition to hot dish 2 x serves starchy vegetable plus 2-3 serves orange, green and other vegetables Selection of dinner rolls/sliced bread etc PLUS Soup, Rice and Pasta Bar Selection of soup of the day, plain pasta or rice always available with choice of two low fat vegetable sauces PLUS Dessert Selection of fresh fruit or fruit salad, fruit based dessert, milk based dessert, cereal based dessert
The structure of the modules of extra energy needs to be planned carefully because the contribution of protein and sodium to the basic diet are already at the upper level of requirements. Hence modules of additional energy have been allocated to ensure nutrient composition of the diet remains optimal. The FFS (Appendix C) details the number of modules to be provided in addition to Level 1 catering to provide sufficient food to meet nutrient requirements at higher activity levels. It is difficult to meet energy requirements at such high levels within the limitation of three meals per day. Therefore, the FFS provides additional energy in 1-MJ modules. Table 2 of the FFS (Appendix C) recommends the distribution of additional modules of energy with increasing activity levels over Morning Tea (MT) and/or Afternoon Tea (AT) and Supper. In a mess where the opportunities to purchase food away from the barracks is limited or unavailable then it is recommended that the provision of additional food at supper time is mandatory.

DSTO-TR-2412
9
Table 2: Recommended Distribution of additional modules of energy with increasing activity levels
Catering Level 1 2 3 4 5
Basic FFS Serials 1 to 8
Yes Yes Yes Yes Yes
Module A Nil 1 MJ @ MT
and/or Supper
2 MJ @ MT and/or Supper
2 MJ @ MT and/or Supper
2 MJ @ MT and/or Supper
4 MJ @ MT and/or Supper
2 MJ @ MT and/or Supper
+ 2 MJ as desired
Module B Nil Nil Nil 2 MJ @ MT
and/or Supper
2 MJ @ AT
4 MJ @ MT and AT
and Supper
2 MJ @ AT + 2 MJ as desired
Module C Nil 1 MJ @ MT
and/or Supper
1 MJ @ MT and/or Supper
1 MJ @ MT and/or Supper
1 MJ @ MT and/or Supper
2 MJ @ MT and/or Supper
2 MJ @ MT and/or Supper
Module D Nil Nil 1 MJ @ MT
and/or Supper
1 MJ @ MT and/or Supper
1 MJ @ MT and/or Supper
2 MJ @ MT and/or Supper
2 MJ @ MT and/or Supper
Module E Nil Nil Nil 1 MJ @ MT
and/or Supper
1 MJ @ MT and/or Supper
1 MJ @ MT and/or Supper
1 MJ @ MT and/or Supper
Module F1 As
desired As desired As desired As desired As desired
Total MJ Requirement
12.5 14.5 16.5 19.5 25
Total MJ Available2
13.62 15.62 17.62 20.72 26.82
Note 1: Additional energy provided by this serial is likely to be small. Note 2: Reference to nutritional profiles modelled by the CFG contractors Oct/Nov 2009 5.2.1 Practical implementation of 1-MJ modules
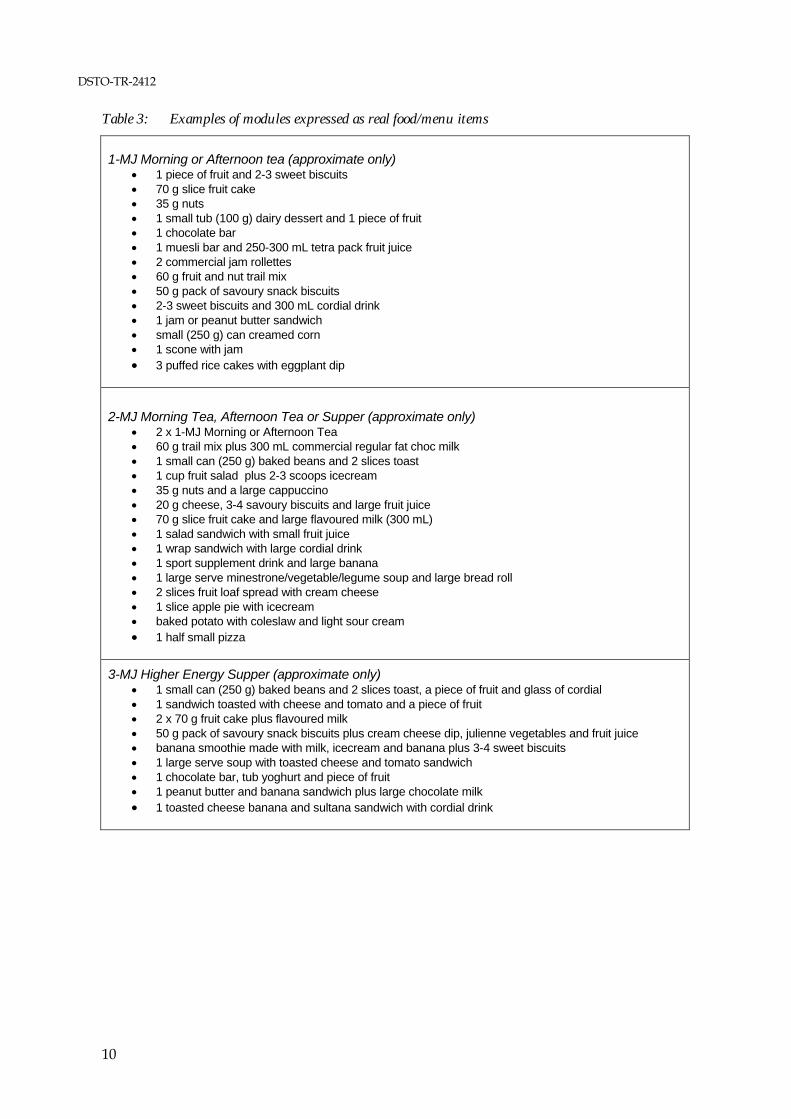
It is recognised that the implementation of additional food breaks in the form of time allocated to morning tea and afternoon tea may not be practical for many ADF messes. It is envisaged that the extra energy required by personnel will be provided as discrete ‘takeaway style’ snacks for morning tea and afternoon tea, and possibly for supper. It may suit some messes to provide a second breakfast opportunity rather than morning tea or afternoon tea depending on the training/operations requirements of the barracks. Where there is a larger population of personnel requiring additional energy at supper time, it is envisaged that some sort of takeaway or self-catered area can be provided. Examples of simple snacks are shown in Table 3. Many can be safely stored without refrigeration and may be suitable for distribution where hot-box feeding is needed.
DSTO-TR-2412
10
Table 3: Examples of modules expressed as real food/menu items
1-MJ Morning or Afternoon tea (approximate only)
1 piece of fruit and 2-3 sweet biscuits 70 g slice fruit cake 35 g nuts 1 small tub (100 g) dairy dessert and 1 piece of fruit 1 chocolate bar 1 muesli bar and 250-300 mL tetra pack fruit juice 2 commercial jam rollettes 60 g fruit and nut trail mix 50 g pack of savoury snack biscuits 2-3 sweet biscuits and 300 mL cordial drink 1 jam or peanut butter sandwich small (250 g) can creamed corn 1 scone with jam 3 puffed rice cakes with eggplant dip
2-MJ Morning Tea, Afternoon Tea or Supper (approximate only) 2 x 1-MJ Morning or Afternoon Tea 60 g trail mix plus 300 mL commercial regular fat choc milk 1 small can (250 g) baked beans and 2 slices toast 1 cup fruit salad plus 2-3 scoops icecream 35 g nuts and a large cappuccino 20 g cheese, 3-4 savoury biscuits and large fruit juice 70 g slice fruit cake and large flavoured milk (300 mL) 1 salad sandwich with small fruit juice 1 wrap sandwich with large cordial drink 1 sport supplement drink and large banana 1 large serve minestrone/vegetable/legume soup and large bread roll 2 slices fruit loaf spread with cream cheese 1 slice apple pie with icecream baked potato with coleslaw and light sour cream 1 half small pizza
3-MJ Higher Energy Supper (approximate only) 1 small can (250 g) baked beans and 2 slices toast, a piece of fruit and glass of cordial 1 sandwich toasted with cheese and tomato and a piece of fruit 2 x 70 g fruit cake plus flavoured milk 50 g pack of savoury snack biscuits plus cream cheese dip, julienne vegetables and fruit juice banana smoothie made with milk, icecream and banana plus 3-4 sweet biscuits 1 large serve soup with toasted cheese and tomato sandwich 1 chocolate bar, tub yoghurt and piece of fruit 1 peanut butter and banana sandwich plus large chocolate milk 1 toasted cheese banana and sultana sandwich with cordial drink

DSTO-TR-2412
11
6. Conclusions & Recommendations
The recommendations in the DSTO Report titled Australian Defence Force Nutritional Requirements in the 21st Century (Version 1) and the modelling performed on behalf of DSTO by the NHMRC CFG contractors provide the most appropriate nutritional foundation for the draft FFS. The model used for the draft FFS described above is the most flexible and appropriate for ADF fresh food provision. Education of caterers will be an important aspect of the introduction of the new FFS. It is strongly recommended that information about the use of the FFS be provided with the tables shown in Appendix C. As a minimum, definition of what constitutes the various meals, snacks and suppers should accompany the tables. Advice about menu planning using a weekly rather than daily scale is recommended. The FFS needs to be accompanied by information, education materials and resources to support the change management process. To achieve this, it is suggested that the Defence Catering Policy Cell should: Include tables for use in Navy and RAAF messing environments; Include definitions for the provision of hot-boxed meals; Investigate further the most appropriate structure for in-flight catering tables; Structure tables in the most suitable form for use by caterers in menu planning; Provide supporting information in the form of background research papers to investigate
the practical implementation of the draft FFS including issues such as user friendliness, the most appropriate format for presentation of the scale, the impact of Catering Contract requirements and definitions;
Provide supporting information in the form of education materials for caterers and ADF personnel to support the change management process and implementation of the FFS.
7. Acknowledgements
The authors wish to thank the consultants to the NHMRC Core Food Groups Project for all their assistance in the draft modelling of food groupings for the new ADF Fresh Food Scale: Dietitians Association of Australia Project Manager: Annette Byron, and Professor Katrine Baghurst, Assoc Professor Peter Baghurst, Professor Lynne Cobiac, Dr Anthea Magarey.

DSTO-TR-2412
12
8. References
Department of Defence (2008a). Australian Defence Force Ration Scales and Scales of Issue (SUPMAN 4), Edition 6, AL4. Joint Material Agency, Joint Logistic Command, Defence Publishing Service, Department of Defence, Canberra. Defence Intranet URL: http://defweb.cbr.defence.gov.au/home/documents/data/DEFPUBS/DEPTMAN/SUPMAN4/FRONT.pdf
Department of Defence (2008b). ABR 5562 (NAVSUPMAN 5) Royal Australian Navy Catering
Services Manual., Volume 1 – Rations Management and Accounting, Edition 4, AL1. Directorate of Naval Professional Requirements, Defence Publishing Service, Department of Defence, Canberra. Defence Intranet URL:
http://defweb.cbr.defence.gov.au/home/documents/navy/abr5562v1.htm Forbes-Ewan CH. (2002). ADF Nutrient Requirements in the 21st Century. Internal Report. DSTO-
Scottsdale CBRN Defence Centre Platform Sciences Laboratory, Defence Science and Technology Organisation.
Forbes-Ewan C, Probert B, Booth C Coad R. (2008). Assessment of Adequacy of Rationing during
Infantry Initial Employment Training DSTO-TR-2181. Human Protection and Performance Division, Defence Science and Technology Organisation.
Forbes-Ewan CH (2009). Australian Defence Force Nutritional Requirements in the 21st Century
(Version 1). DSTO-GD-0578, Human Protection and Performance Division, Defence Science and Technology Organisation.
NHMRC (2006). Nutrient Reference Values for Australia and New Zealand Including Recommended
Dietary Intakes. National Health and Medical Research Council. Department of Health and Ageing. Commonwealth of Australia. Print ISBN 1 864962 43 7. URL:
http://www.nhmrc.gov.au/publications/synopses/n35syn.htm Skiller B, Booth C, Coad R, Forbes-Ewan C. (2005). Assessment of Nutritional Status and
Fatigue among Army Recruits during the Army Common Recruit Training Course: Part A: Catering Services and Diet. DSTO-TR-1736. CBRN Defence Centre, Defence Science and Technology Organisation
Williams PG, Droulez V, Levy G, Stobaus T. (2006). Composition of Australian red meat 2002. 1. Gross composition, Food Australia, 58(4), 2006, 173-181.

DSTO-TR-2412
13
Appendix A: Nutrition Criteria for Fresh Food Availability
Table 1: Recommended Nutritional Criteria for Fresh Food Availability – Mixed ADF Populations, based on MRDI/AI (Table 10a of Forbes-Ewan, 2009)
Activity Category 1 2 3 4 Energy (MJ) 12.5 14.5 16.5 19.5 Protein (g) 110-147 119-162 126-174 138-195 Saturated + trans fat (g) ≤ 34 ≤ 39 ≤ 45 ≤ 53 Carbohydrate (g) 391-430 471-517 557-608 682-743 Dietary Fibre (g) 30 30 30 30 Vitamin A (μg) 900 900 900 900 Vitamin C (mg) 45 45 45 45 Vitamin E (mg) 10 10 10 10 Thiamin (mg 1.3 1.5 1.7 2.0 Riboflavin (mg) 1.9 2.2 2.5 2.9 Niacin (mg) 20 23 26 31 VitaminB6 (mg) 2.2 2.4 2.5 2.8 Vitamin B12 (μg) 2.4 2.4 2.4 2.4 Folate (μg) 400 400 400 400 Pantothenic Acid (mg) 6.0 6.0 6.0 6.0 Biotin (mg) 30 30 30 30 Choline (mg) 550 550 550 550 Vitamin D (μg) 5.0 5.0 5.0 5.0 Vitamin K (μg) 70 70 70 70 Calcium (mg) 1300 1300 1300 1300 Chromium (μg) 35 35 35 35 Copper (μg) 1.7 1.7 1.7 1.7 Iodine (μg) 150 150 150 150 Iron (mg) 18 18 18 18 Magnesium (mg) 410 410 410 410 Manganese (μg) 5.5 5.5 5.5 5.5 Molybdenum (μg) 45 45 45 45 Phosphorus (mg) 1250 1250 1250 1250 Potassium (mg) 3800 3800 3800 3800 Selenium (μg) 70 70 70 70 Sodium (mg) 920–2300 920–2500 920–2750 920–3000 Zinc (mg) 14 14 14 14
The MRDI or AI shown in this table is the one that applies to the ‘worst case’ ADF population for each nutrient. As examples, the criterion for energy is the MRDI for adolescent males, while the criterion for iron is the MRDI for adult females. For protein and carbohydrate the estimated requirements are expressed as acceptable ranges. For each micronutrient the NHMRC (2006) RDI (or AI if there is no RDI) applies, with the exceptions of thiamin, riboflavin, niacin, vitamin B6 and sodium, for which the MRDI apply. For Saturated + trans fat the criterion is <10% of total energy, in accordance with the recommendation of the NHMRC (2006). Note: This table does not include an allowance for unavoidable food discards. An appropriate allowance for this is considered to be 15% when the efficiency of the mess is not known.

DSTO-TR-2412
14
Table 2: Recommended Nutritional Criteria for Fresh Food Availability – Mixed ADF Populations, based on EAR/MEAR/AI (Table 10b of Forbes-Ewan, 2009)
Activity Category 1 2 3 4 5 Energy (MJ) 12.5 14.5 16.5 19.5 25 Protein (g) 110-147 119-162 126-174 138-195 162-235 Saturated + trans fat (g) ≤ 34 ≤ 39 ≤ 45 ≤ 53 ≤ 68 Carbohydrate (g) 391-430 471-517 557-608 682-743 906-984 Dietary Fibre (g) 30 30 30 30 30 Vitamin A (μg) 630 630 630 630 630 Vitamin C (mg) 30 30 30 30 30 Vitamin E (mg) 10 10 10 10 10 Thiamin (mg 0.9 1.1 1.2 1.4 1.8 Riboflavin (mg) 1.3 1.5 1.8 2.0 2.7 Niacin (mg) 14 16 18 22 28 VitaminB6 (mg) 1.5 1.7 1.8 2.0 2.2 Vitamin B12 (μg) 2 2 2 2 2 Folate (μg) 330 330 330 330 330 Pantothenic Acid (mg) 6 6 6 6 6 Biotin (mg) 30 30 30 30 30 Choline (mg) 550 550 550 550 550 Vitamin D (μg) 5 5 5 5 5 Vitamin K (μg) 70 70 70 70 70 Calcium (mg) 1050 1050 1050 1050 1050 Chromium (μg) 35 35 35 35 35 Copper (μg) 1.7 1.7 1.7 1.7 1.7 Iodine (μg) 100 100 100 100 100 Iron (mg) 8 8 8 8 8 Magnesium (mg) 340 340 340 340 340 Manganese (μg) 5.5 5.5 5.5 5.5 5.5 Molybdenum (μg) 34 34 34 34 34 Phosphorus (mg) 1055 1055 1055 1055 1055 Potassium (mg) 3800 3800 3800 3800 3800 Selenium (μg) 60 60 60 60 60 Sodium (mg) 920–2300 920–2500 920–2750 920–3000 920–3200 Zinc (mg) 12 12 12 12 12
The estimated requirement shown in this table is the one that applies to the ‘worst case’ ADF population for each nutrient. As examples, the criterion for energy is the average estimated energy requirement for adolescent male ADF members, while the criterion for iron is the EAR for adult females. For protein and carbohydrate the estimated requirements are expressed as acceptable ranges. For each micronutrient the NHMRC (2006) EAR (or AI if there is no EAR) applies, with the exceptions of thiamin, riboflavin, niacin, vitamin B6 and sodium for which the MEAR applies. For Saturated + trans fat the criterion is <10% of total energy, in accordance with the recommendatios of the NHMRC (2006). Note: This table does not include an allowance for unavoidable food discards. An appropriate allowance for this is considered to be 15% when the efficiency of the mess is not known.

DSTO-TR-2412
15
Appendix B: Final Report to DSTO on diets conforming to Military Nutrient Standards at energy levels ranging
from 12.5 to 25 MJ
Katrine Baghurst and Peter Baghurst on behalf of the
Consultants* to the NHMRC Core Food Group project
* The NHMRC Core Food Groups Project was managed by the Dietitians Association of Australia with consultants, Professor Katrine Baghurst, Associate
Professor Peter Baghurst, Professor Lynne Cobiac and Dr Anthea Magarey
November 2009

DSTO-TR-2412
16
PART 1 Initial analyses Introduction As part of the revision of the NHMRC Core Food Groups (CFG) and Australian Guide to Healthy Eating (AGHE) recommendations, DSTO provided funding to extend the analysis to include the higher energy requirements of Military Personnel and the new Military EAR/RDI/AIs (MEARs, MRDIs, MAIs) for mixed ADF populations (Tables 1 and 2). These included both upper and lower limits for protein and carbohydrate at each energy level as well as an upper limit for saturated plus trans fat. The B Vitamin MEARs/RDIs also increase with energy levels. This report outlines the analyses undertaken in discussion with DSTO. Method Diets were designed using a similar process as that outlined for the CFG/AGHE update in the First Draft Report to NHMRC provided to DSTO except that as the lowest energy level required by DSTO was 12.5 MJ, this energy level, rather than ‘minimal energy’, formed the base or Foundation diet for this group of people. After discussions with DSTO, two energy levels 12.5 MJ and 14.5 MJ were modelled and then a series of potential 1 MJ add-ons were developed to increase energy levels up to 25 MJ whilst remaining within protein and carbohydrate limits for each energy level. Again, after discussions with DSTO the B vitamin MEAR/MRDIs for the 25-MJ diet were used when designing diets for all energy levels, so the add-on approach could be used efficiently. The diets were initially designed using composite foods representing each food group and then the resulting pattern was tested using simulated 7 day diets with real foods to ensure that these food patterns still attained the MEARs and AIs when tested with a variety of ’real’ foods whilst remaining within the protein, carbohydrate and saturated fat limits. Aiming the initial modelling with composites at the MRDI level is necessary to ensure compliance with MEAR as foods can vary widely in their nutrient profiles even within food categories. There were some limitations on which nutrients could be assessed as the Australian food data base used for the CFG/AGHE project (AUSNUT07) is limited in the nutrients it contains. Some additional data from the UK/USA was included for Vitamin B6 and Vitamin B12 but we could not assess adequacy of pantothenic acid, biotin, choline, chromium, copper, molybdenum or manganese. In the initial analyses for 12.5 and 14.5 MJ, after discussions with DSTO, no allowance was made for what are commonly called ‘extra’ foods such as alcohol, confectionary, cakes, biscuits etc. The full energy requirement was modelled with the basic food groups: cereals, fruits, vegetables, meat and alternatives, milks and alternatives and fats and oils. Subsequently, some allowance was made for these and some additional ‘extras’ options were also included within the suggested 1 MJ add-ons for attaining the higher energy levels.

DSTO-TR-2412
17
Serve sizes The dietary patterns are expressed in terms of serves of food groups or subgroups per week. The size of the serves for the different food types within food groups are shown in Table 3. Generally speaking, the food serve sizes used for both the CFG/AGHE and this analysis which are similar to those in the current AGHE but the serve size of cereals was reduced to a 40 g bread equivalent rather than 60 g. The AGHE used 60 g because breads at that time were approximately 30 g a slice and they decided to use two slices of bread as the serve. This has received some criticism from end users, so the serve size equivalence was changed to approximately one thick bread slice which currently is closer to 38–40 g than the 30 g of some years ago. Thus, a recommendation for eight serves of cereal/day in the AGHE if eaten as bread would equate to 480 g of bread, which equates to 12 ‘serves’/day with the smaller new serve size of 40 g (or 84 ‘serves’ a week). Amounts for other cereals were adjusted accordingly. The meat serve in the AGHE was given as a range of 65–100 g cooked weight. In this analysis we used a single point serve size of 80 g cooked weight. Milks (250 mL), fruits (about 150 g) and vegetable (75 g) serve sizes remain similar to those used for the AGHE. The modelling both with the composites and the 7-day ‘real’ foods is done on the basis of the current food patterns in the community so the analysis involves using a factor which assumes about the same proportional use of foods from within food groups as currently occurs in the community (i.e. a certain level of breads versus breakfast cereal versus rice, pasta etc, or a certain ratio of fish to poultry, to eggs etc). The proportions used in modelling based on the National Nutrition Survey of 1995 for young men and young women for the various food groups are shown in Table 6. Initial analyses were done with these proportions. (Subsequent discussions with DSTO led to us developing a special mix of cereals for the final analyses that was more closely aligned with that normally used in this population). Please note that the nutrient database uses nutrient figures for foods ‘as eaten’ i.e. cooked, peeled, reconstituted with water, as relevant. Thus the values for meats are weights for lean or semi-trimmed meats after cooking, not raw weights; weights for fruits and vegetables are without peel, cores, stalks etc; values for cereals such as rice and pasta are cooked weight not dried. For catering purposes these weights will need adjustment. Initial analysis results Tables 4 and 5 show the initial analyses of dietary patterns to achieve the MEARs within protein/ carbohydrate and saturated fat levels for energy levels of 12.5 and 14.5 MJ. In Tables 4 and 5 the headings have the following meanings: Daily intake – the average content of the 100 7-day diets for that nutrient Minimum – the lowest mean level of that nutrient from any of the simulated 7-day Diets (i.e. none of the 7-day diet averaged less than this level)

DSTO-TR-2412
18
Maximum – the highest mean level of that nutrient in any of the 7 day diets Met MEAR/MAI – the number of 7-day diets out of 100 that met the MEAR/MAI Met MRDI/MAI – the number of 7-day diets out of 100 that met the MRDI/MAI The three rows below the nutrient list show the average percentage energy from fat, protein and carbohydrate from all 7-day diets. The Food lists at the base of the page show the weekly number of serves of the various food groups (i.e. for Dark Green Vegetables, an N servings of ‘7’ means seven serves per week or one/day at 75 g/serve). Diets were analysed on a weekly basis to give flexibility. It is not generally necessary to have exactly the same pattern of intake each day (e.g. there may be more green vegetables one day and somewhat less or none the next day). With the high energy and carbohydrate requirements, for the 12.5-MJ diet the recommended serves of cereal foods (16/day, half wholemeal—equivalent to about 10 or 11 AGHE serves) and starchy vegetables (5/day, about two large potatoes)—were quite high. The diets also included, on average, one 75-g serve per day of green leafy vegetables, one of orange vegetables, one of legumes/beans and one other vegetable. The diet also included three serves of fruit/day (can include fruit juice as one serve); a handful of nuts three times a week and some polyunsaturated margarine. The recommended red meat serve (beef/lamb/veal) was three serves per week at 80 g cooked weight with other meat group alternatives (pork, fish poultry, eggs, legumes/nuts) once a day (some of this, about two or three serves, could be additional red meat). Dairy serves included just under three serves a day with half the serves being lower fat milks and yoghurts and the rest cheeses or full fat milks, yoghurts, custards. For the 14.5-MJ diet, as the MEARs had been met, the only change was to include additional cereal serves which increased the energy whilst keeping the protein and carbohydrate levels within range. For the 1-MJ add-ons proposed at this stage, foods were needed that are generally high in carbohydrate and not too high in protein and saturated fat. Foods which fall in this category found on the database include some cereal foods including popcorn and muesli bars, starchy vegetables, fruits, sweetened dairy products such as yoghurts, custards and ice-creams, sweet biscuits and sweetened soft drinks and sugar-based confectionary (see Table 7). Most of these foods had, on average, less than 10–12 g protein/MJ and 30–60 g of carbohydrate/MJ, whilst being low in saturated fat. For the 16.5-MJ diet a combination of two of these add-ons were needed on top of the 14.5-MJ pattern; for the 19.5-MJ diet an additional 5-MJ of add-ons; and for 25-MJ diet an additional 10.5-MJ of add-ons.
DSTO-TR-2412
19
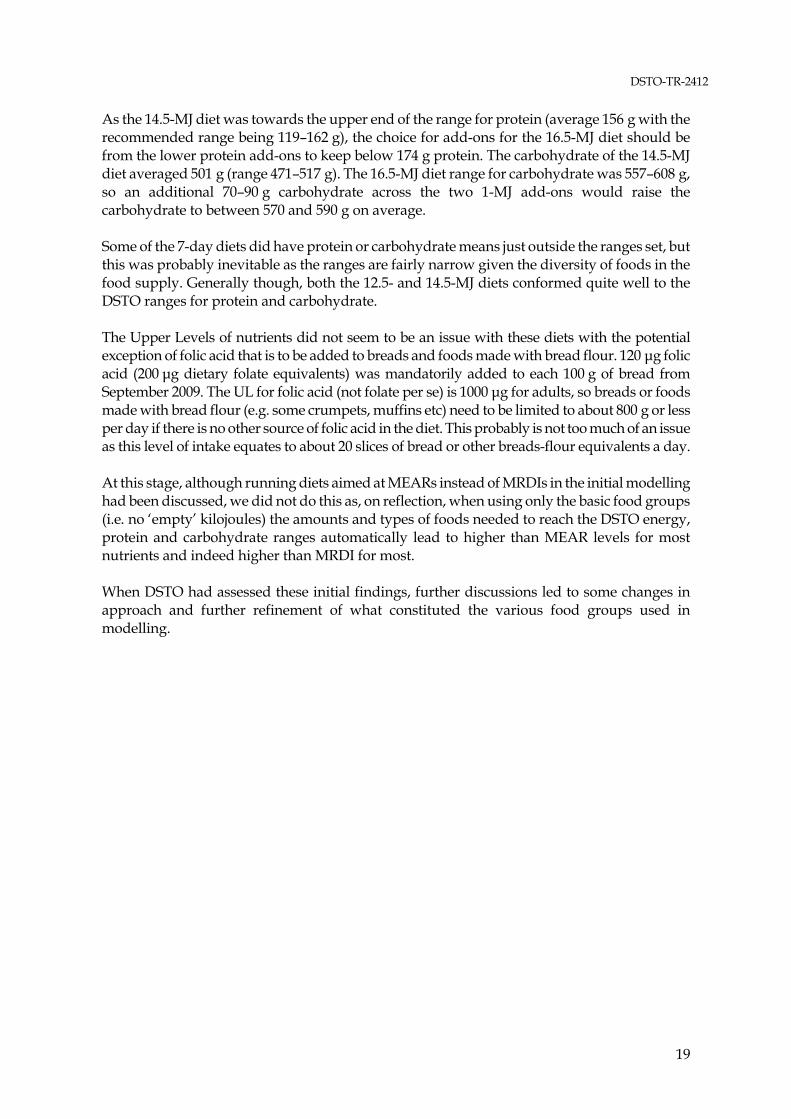
As the 14.5-MJ diet was towards the upper end of the range for protein (average 156 g with the recommended range being 119–162 g), the choice for add-ons for the 16.5-MJ diet should be from the lower protein add-ons to keep below 174 g protein. The carbohydrate of the 14.5-MJ diet averaged 501 g (range 471–517 g). The 16.5-MJ diet range for carbohydrate was 557–608 g, so an additional 70–90 g carbohydrate across the two 1-MJ add-ons would raise the carbohydrate to between 570 and 590 g on average. Some of the 7-day diets did have protein or carbohydrate means just outside the ranges set, but this was probably inevitable as the ranges are fairly narrow given the diversity of foods in the food supply. Generally though, both the 12.5- and 14.5-MJ diets conformed quite well to the DSTO ranges for protein and carbohydrate. The Upper Levels of nutrients did not seem to be an issue with these diets with the potential exception of folic acid that is to be added to breads and foods made with bread flour. 120 μg folic acid (200 μg dietary folate equivalents) was mandatorily added to each 100 g of bread from September 2009. The UL for folic acid (not folate per se) is 1000 μg for adults, so breads or foods made with bread flour (e.g. some crumpets, muffins etc) need to be limited to about 800 g or less per day if there is no other source of folic acid in the diet. This probably is not too much of an issue as this level of intake equates to about 20 slices of bread or other breads-flour equivalents a day. At this stage, although running diets aimed at MEARs instead of MRDIs in the initial modelling had been discussed, we did not do this as, on reflection, when using only the basic food groups (i.e. no ‘empty’ kilojoules) the amounts and types of foods needed to reach the DSTO energy, protein and carbohydrate ranges automatically lead to higher than MEAR levels for most nutrients and indeed higher than MRDI for most. When DSTO had assessed these initial findings, further discussions led to some changes in approach and further refinement of what constituted the various food groups used in modelling.

DSTO-TR-2412
20
Table 1: Recommended Nutritional Criteria for Fresh Food Availability – Mixed ADF Populations (based on MEAR/AI)
Activity Category 1 2 3 4 5 Energy (MJ) 12.5 14.5 16.5 19.5 25 Protein (g) 110-147 119-162 126-174 138-195 162-235 Saturated + trans fat (g) ≤ 34 ≤ 39 ≤ 45 ≤ 53 ≤ 68 Carbohydrate (g) 390-430 471-517 557-608 682-743 906-984 Dietary Fibre (g) 30 30 30 30 30 Vitamin A (μg) 630 630 630 630 630 Vitamin C (mg) 30 30 30 30 30 Vitamin E (mg) 10 10 10 10 10 Thiamin (mg 0.9 1.1 1.2 1.4 1.8 Riboflavin (mg) 1.3 1.5 1.8 2.0 2.7 Niacin (mg) 14 16 18 22 28 VitaminB6 (mg) 1.5 1.7 1.8 2.0 2.2 Vitamin B12 (μg) 2 2 2 2 2 Folate (μg) 330 330 330 330 330 Pantothenic Acid (mg) 6 6 6 6 6 Biotin (mg) 30 30 30 30 30 Choline (mg) 550 550 550 550 550 Vitamin D (μg) 5 5 5 5 5 Vitamin K (μg) 70 70 70 70 70 Calcium (mg) 1050 1050 1050 1050 1050 Chromium (μg) 35 35 35 35 35 Copper (μg) 1.7 1.7 1.7 1.7 1.7 Iodine (μg) 100 100 100 100 100 Iron (mg) 8 8 8 8 8 Magnesium (mg) 340 340 340 340 340 Manganese (μg) 5.5 5.5 5.5 5.5 5.5 Molybdenum (μg) 34 34 34 34 34 Phosphorus (mg) 1055 1055 1055 1055 1055 Potassium (mg) 3800 3800 3800 3800 3800 Selenium (μg) 60 60 60 60 60 Sodium (mg) 2300–4600 2300–4600 2300–4600 2300–4600 2300–4600 Zinc (mg) 12 12 12 12 12
The estimated requirement shown in this table is the one that applies to the ‘worst case’ ADF population for each nutrient. As examples, the criterion for energy is the RMDI for adolescent males, while the criterion for iron is the MEAR for adult females. For protein and carbohydrate the estimated requirements are expressed as acceptable ranges (see Table 4). For each micronutrient the NHMRC (2006) EAR (or AI if there is no EAR) applies, with the exceptions of thiamin, riboflavin, niacin, vitamin B6 and sodium (see section 6.2.1.3). For Saturated + trans fat the criterion is <10% of total energy. Note: This table does not include an allowance for unavoidable food discards. An appropriate allowance for this is considered to be 15% when the efficiency of the mess is not known (see section 6.2.1.1). Therefore, when using these tables to set entitlements to fresh feeding, the above nutrient values should all be multiplied by the appropriate factor (if the approximate efficiency of the mess is known), or by 1.15 if the efficiency is unknown.
DSTO-TR-2412
21
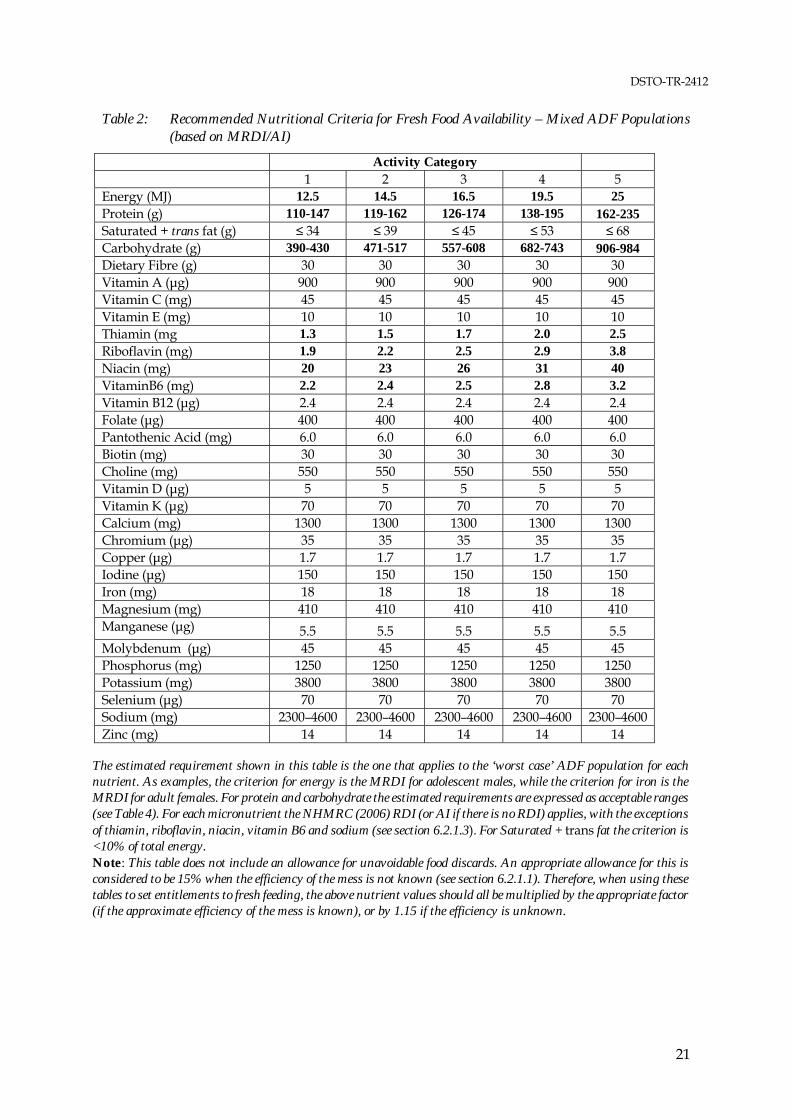
Table 2: Recommended Nutritional Criteria for Fresh Food Availability – Mixed ADF Populations (based on MRDI/AI)
Activity Category 1 2 3 4 5 Energy (MJ) 12.5 14.5 16.5 19.5 25 Protein (g) 110-147 119-162 126-174 138-195 162-235 Saturated + trans fat (g) ≤ 34 ≤ 39 ≤ 45 ≤ 53 ≤ 68 Carbohydrate (g) 390-430 471-517 557-608 682-743 906-984 Dietary Fibre (g) 30 30 30 30 30 Vitamin A (μg) 900 900 900 900 900 Vitamin C (mg) 45 45 45 45 45 Vitamin E (mg) 10 10 10 10 10 Thiamin (mg 1.3 1.5 1.7 2.0 2.5 Riboflavin (mg) 1.9 2.2 2.5 2.9 3.8 Niacin (mg) 20 23 26 31 40 VitaminB6 (mg) 2.2 2.4 2.5 2.8 3.2 Vitamin B12 (μg) 2.4 2.4 2.4 2.4 2.4 Folate (μg) 400 400 400 400 400 Pantothenic Acid (mg) 6.0 6.0 6.0 6.0 6.0 Biotin (mg) 30 30 30 30 30 Choline (mg) 550 550 550 550 550 Vitamin D (μg) 5 5 5 5 5 Vitamin K (μg) 70 70 70 70 70 Calcium (mg) 1300 1300 1300 1300 1300 Chromium (μg) 35 35 35 35 35 Copper (μg) 1.7 1.7 1.7 1.7 1.7 Iodine (μg) 150 150 150 150 150 Iron (mg) 18 18 18 18 18 Magnesium (mg) 410 410 410 410 410 Manganese (μg) 5.5 5.5 5.5 5.5 5.5 Molybdenum (μg) 45 45 45 45 45 Phosphorus (mg) 1250 1250 1250 1250 1250 Potassium (mg) 3800 3800 3800 3800 3800 Selenium (μg) 70 70 70 70 70 Sodium (mg) 2300–4600 2300–4600 2300–4600 2300–4600 2300–4600 Zinc (mg) 14 14 14 14 14
The estimated requirement shown in this table is the one that applies to the ‘worst case’ ADF population for each nutrient. As examples, the criterion for energy is the MRDI for adolescent males, while the criterion for iron is the MRDI for adult females. For protein and carbohydrate the estimated requirements are expressed as acceptable ranges (see Table 4). For each micronutrient the NHMRC (2006) RDI (or AI if there is no RDI) applies, with the exceptions of thiamin, riboflavin, niacin, vitamin B6 and sodium (see section 6.2.1.3). For Saturated + trans fat the criterion is <10% of total energy. Note: This table does not include an allowance for unavoidable food discards. An appropriate allowance for this is considered to be 15% when the efficiency of the mess is not known (see section 6.2.1.1). Therefore, when using these tables to set entitlements to fresh feeding, the above nutrient values should all be multiplied by the appropriate factor (if the approximate efficiency of the mess is known), or by 1.15 if the efficiency is unknown.

DSTO-TR-2412
22
Table 3: Equivalences within groups for serve sizes (as eaten)
A. Meats and alternatives equivalences Serve size (g/ml) Legumes as meat alt 200 Nuts/seeds as meat alt 30 Eggs 90 Beef, veal lean 80 Mince low fat 80 Lamb 80 Pork 80 Other meats (rabbit, kangaroo etc) 80 Poultry 80 Hi-LComega fish 80 Medium LComega fish 120 Lower LComega fish 120 Shellfish 150 B. Milk, yoghurt and cheese equivalences Cheeses 40 Condensed milks 60 Milks and fortified soy milks 250 Evaporated milk 120 Yoghurts 200 C. Refined cereals equivalences Breads/rolls 40 Cracker biscuits 25 Crumpet/muffin white 40 Breakfast cereals processed 30 Scones 40 White rice 120 Noodles 120 Pasta refined 120 Wholegrain cereals Breads/rolls 40 Wholegrain crackers 25 Fruit breads 40 Crumpet/muffin wg 40 Breakfast cereals wg 30 Muesli wholegrain 30 Oats/porridge 180 Brans/germ 30 Other grains lower starch 120 Other grains higher starch 120 Brown Rice 120 Pasta wholemeal 120

DSTO-TR-2412
23
D. Fruit and vegetables equivalences Serve size (g/mL) Dried semi-dried fruit 30 Pome fruit small apple/pear 150 Stone; medium peach, 2 plums 150 Banana one small 100 Berries 10 large straw or raspberries 180 Tropical; 1 slice pineapp, 1 cup mango, ¾ fruit 150 Grapes 30 seedless 120 Oranges and mandarins 1 large 180 Melons ¼ cantaloupe; 1/20 watermelon 200 Other fruit 150 Fruit juice orange/apple 200 Other fruit juice 200 All vegetables
75

DSTO-TR-2412
24
Table 4: 12.5-MJ diet—100 simulated 7-day diets
Daily intake minimum maximum met MEAR/AI met MRDI/AI Energy 12265.0 11947.8 12779.1 100 100 Protein 144.9 134.3 153.4 100 100 Fat 71.1 63.5 77.0 100 100 SatFat.total 22.6 20.3 25.1 100 100 MUFA.total 23.8 20.3 29.4 100 100 PUFA.total 18.6 15.2 25.0 100 100 Cholesterol 304.1 172.6 464.0 100 100 Carbohydrate 392.5 370.1 421.7 100 100 Sugars.total 117.3 105.2 128.9 100 100 Starch 273.2 253.4 291.9 100 100 Dietary fibre 65.2 59.9 71.1 100 100* Thiamin 3.1 2.6 3.4 100 100 Riboflavin 3.1 2.8 3.6 100 0 Niacin 80.3 74.1 88.7 100 100 Vitamin B6 3.1 2.4 4.1 100 31 Vitamin B12 6.4 4.2 25.9 100 100 Folate 1220.6 1065.8 1382.4 100 100 Biotin 69.1 58.3 83.7 100 100 Vitamin A 1410.6 1123.3 1831.1 100 100 Vitamin C 218.3 157.4 342.3 100 100 Vitamin D 5.2 4.5 7.1 74 74* Vitamin E 10.9 8.2 15.7 68 68* Calcium 1378.4 1266.1 1477.1 100 98 Phosphorus 2586.9 2495.3 2684.0 100 100 Zinc 19.7 18.5 21.2 100 100 Iron 23.9 21.7 26.3 100 100 Magnesium 683.3 643.9 740.8 100 100 Iodine 199.5 168.6 227.2 100 100 Selenium 136.4 113.2 159.6 100 100 Sodium 2696.4 2377.9 3183.7 100 100* Potassium 6490.1 6228.8 6811.5 100 100* Percent energy from fat 21.4 Percent energy from protein 20.1 Percent energy from carbohydrate 51.2 FoodGroups Number of servings/week "DarkGreenVeg" "7" "OrangeVeg" "7" "StarchyVeg" "35" "OtherVeg" "7" "Legumes" "14" "NutsSeeds" "4" "TotalFruit" "21" "RedMeats" "4" "AllOtherMeatsEggsLegs" "10" "LoFatDairy" "10" "MidFatDairy" "5" "HiFatDairy" "5" "PolyUnsatFat" "7" "WholegrainCereals" "49" "RefinedCereals" "28"

DSTO-TR-2412
25
Table 5: 14.5-MJ diet—100 7-day diets
Daily intake minimum maximum met MEAR/AI met MRDI/AI Energy 14385.4 13868.7 14817.9 100 100 Protein 156.0 146.6 162.9 100 100 Fat 71.5 63.1 78.5 100 100 SatFat.total 22.3 20.4 24.3 100 100 MUFA.total 23.9 20.4 27.6 100 100 PUFA.total 19.3 16.1 23.1 100 100 Cholesterol 250.7 141.3 449.5 100 100 Carbohydrate 501.6 470.6 523.7 100 100 Sugars.total 122.4 112.2 133.9 100 100 Starch 377.2 348.2 404.4 100 100 Dietary fibre 72.9 68.8 78.0 100 100* Thiamin 3.7 3.2 4.1 100 100 Riboflavin 3.3 2.9 3.9 100 1 Niacin 89.9 82.5 95.8 100 100 Vitamin B6 3.4 2.7 5.0 100 57 Vitamin B12 7.7 4.4 26.5 100 100 Folate 1552.5 1374.3 1734.6 100 100 Vitamin A 1420.0 1140.5 1783.2 100 100 Vitamin C 216.7 158.6 319.8 100 100 Vitamin D 5.1 4.4 6.3 57 57* Vitamin E 10.7 7.9 13.5 68 68* Calcium 1489.1 1392.9 1586.3 100 100 Phosphorus 2789.3 2676.9 2908.9 100 100 Zinc 21.1 19.6 22.3 100 100 Iron 27.3 25.1 29.7 100 100 Magnesium 755.1 718.7 799.9 100 100 Iodine 234.0 211.1 267.4 100 100 Selenium 151.4 134.3 170.5 100 100 Sodium 3325.3 2923.4 3745.4 100 100* Potassium 6689.0 6283.6 7035.6 100 100* Percent energy from fat 18.4 * AI thus DI should approx AI only Percent energy from protein 18.4 Percent energy from carbohydrate 55.8 FoodGroups Number of servings/week "DarkGreenVeg" "7" "OrangeVeg" "7" "StarchyVeg" "35" "OtherVeg" "7" "Legumes" "14" "NutsSeeds" "4" "TotalFruit" "21" "RedMeats" "3" "AllOtherMeatsEggsLegs" "8" "LoFatDairy" "10" "MidFatDairy" "5" "HiFatDairy" "5" "PolyUnsatFat" "7" "WholegrainCereals" "56" "RefinedCereals" "56"
DSTO-TR-2412
26
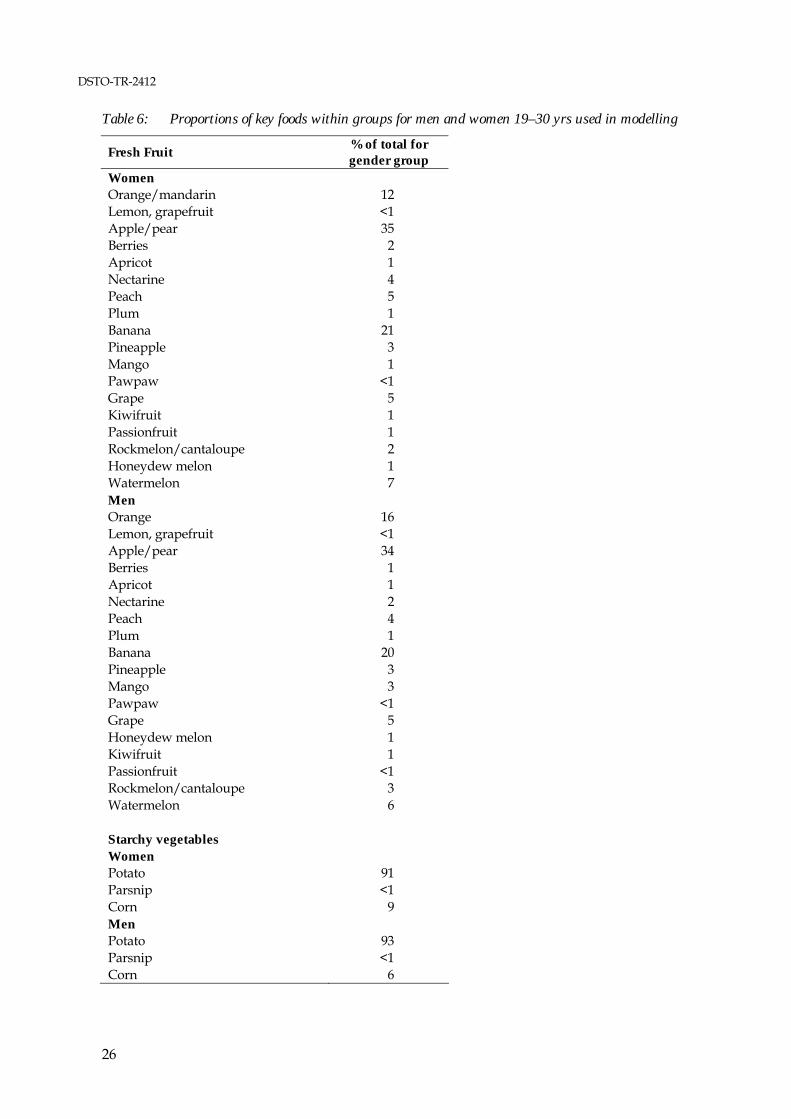
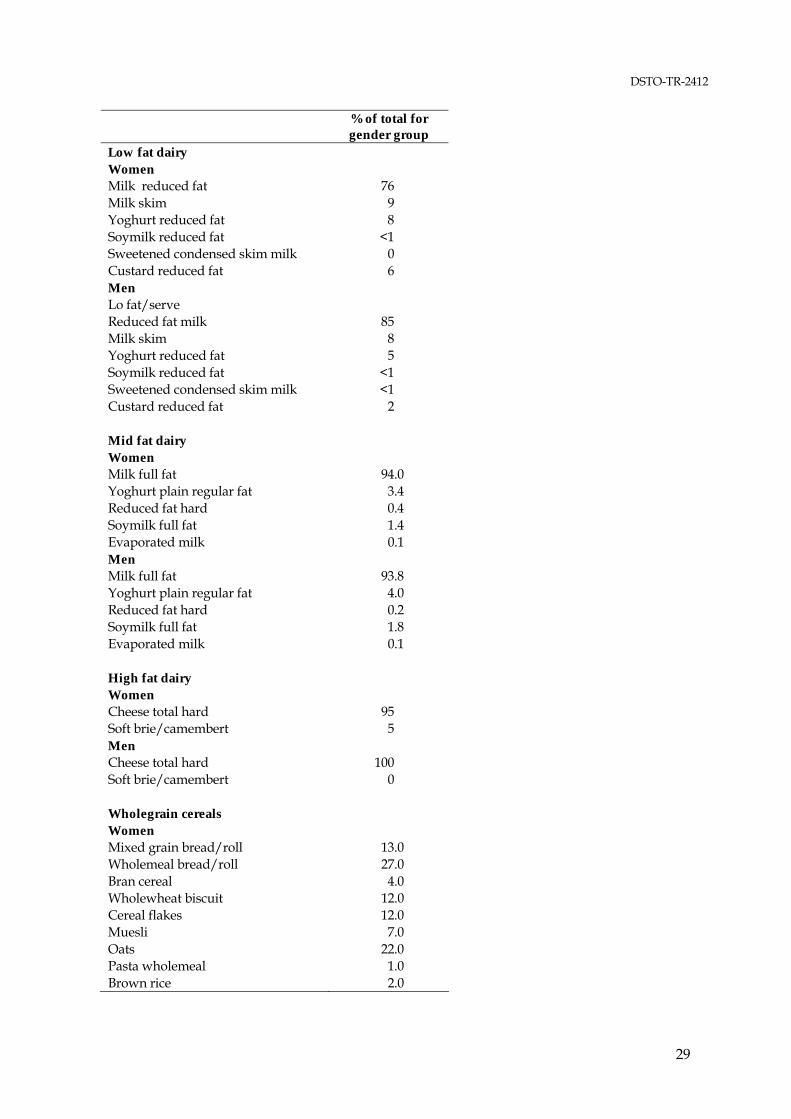
Table 6: Proportions of key foods within groups for men and women 19–30 yrs used in modelling
Fresh Fruit % of total for gender group
Women Orange/mandarin 12 Lemon, grapefruit <1 Apple/pear 35 Berries 2 Apricot 1 Nectarine 4 Peach 5 Plum 1 Banana 21 Pineapple 3 Mango 1 Pawpaw <1 Grape 5 Kiwifruit 1 Passionfruit 1 Rockmelon/cantaloupe 2 Honeydew melon 1 Watermelon 7 Men Orange 16 Lemon, grapefruit <1 Apple/pear 34 Berries 1 Apricot 1 Nectarine 2 Peach 4 Plum 1 Banana 20 Pineapple 3 Mango 3 Pawpaw <1 Grape 5 Honeydew melon 1 Kiwifruit 1 Passionfruit <1 Rockmelon/cantaloupe 3 Watermelon 6 Starchy vegetables Women Potato 91 Parsnip <1 Corn 9 Men Potato 93 Parsnip <1 Corn 6

DSTO-TR-2412
27
Darker green vegetables % of total for gender group
Women Broccoli 21 Brussels sproutg 3 Cabbage 9 Silverbeet <1 Spinach 4 Pea 21 Alfalfa sprout 1 Asparagus 3 Snowpea 3 Capsicum 11 Lettuce 25 Leek 1 Men Broccoli 21 Brussels sproutg 3 Cabbage 9 Silverbeet <1 Spinach 4 Pea 21 Alfalfa sprout 1 Asparagus 3 Snowpea 3 Capsicum 11 Lettuce 25 Leek 1 Orange vegetables Women Carrot 64 Pumpkin 35 Sweet potato 1 Men Carrot 64 Pumpkin 34 Sweet potato 2 Other vegetables Women Swede <1 Turnip <1 Bean sprout 1 Celery 2 Beetroot 3 Cauliflower 8 Tomato 42 Squash 2

DSTO-TR-2412
28
% of total for gender group
Zucchini 6 Avocado 4 Cucumber 8 Eggplant <1 Mushroom 7 Onion 9 Bean, green 7 Men Swede <1 Turnip <1 Bean sprout <1 Celery 3 Beetroot 3 Cauliflower 5 Tomato 46 Squash 1 Zucchini 5 Avocado 3 Cucumber 4 Eggplant 1 Mushroom 6 Onion 13 Bean, green 9 Meats and alternatives Women beef/veal 31.9 lamb 7 pork 4.2 chicken, turkey, duck 32.1 eggs 7.6 hi omega fish 2.4 mid omega fish 2.4 lo omega fish 4.9 seafood 3.5 Legumes 2.3 Total seeds & nuts 1.7 Men beef/veal 32.2 lamb 8.5 pork 4.6 chicken, turkey, duck 26.9 egg 7.8 hi omega fish 3.7 med omega fish 3.7 lo omega fish 7.5 seafood 2.5 Legumes 1.2 Total seeds & nuts 1.2
DSTO-TR-2412
29
% of total for gender group
Low fat dairy Women Milk reduced fat 76 Milk skim 9 Yoghurt reduced fat 8 Soymilk reduced fat <1 Sweetened condensed skim milk 0 Custard reduced fat 6 Men Lo fat/serve Reduced fat milk 85 Milk skim 8 Yoghurt reduced fat 5 Soymilk reduced fat <1 Sweetened condensed skim milk <1 Custard reduced fat 2 Mid fat dairy Women Milk full fat 94.0 Yoghurt plain regular fat 3.4 Reduced fat hard 0.4 Soymilk full fat 1.4 Evaporated milk 0.1 Men Milk full fat 93.8 Yoghurt plain regular fat 4.0 Reduced fat hard 0.2 Soymilk full fat 1.8 Evaporated milk 0.1 High fat dairy Women Cheese total hard 95 Soft brie/camembert 5 Men Cheese total hard 100 Soft brie/camembert 0 Wholegrain cereals Women Mixed grain bread/roll 13.0 Wholemeal bread/roll 27.0 Bran cereal 4.0 Wholewheat biscuit 12.0 Cereal flakes 12.0 Muesli 7.0 Oats 22.0 Pasta wholemeal 1.0 Brown rice 2.0
DSTO-TR-2412
30
% of total for gender group
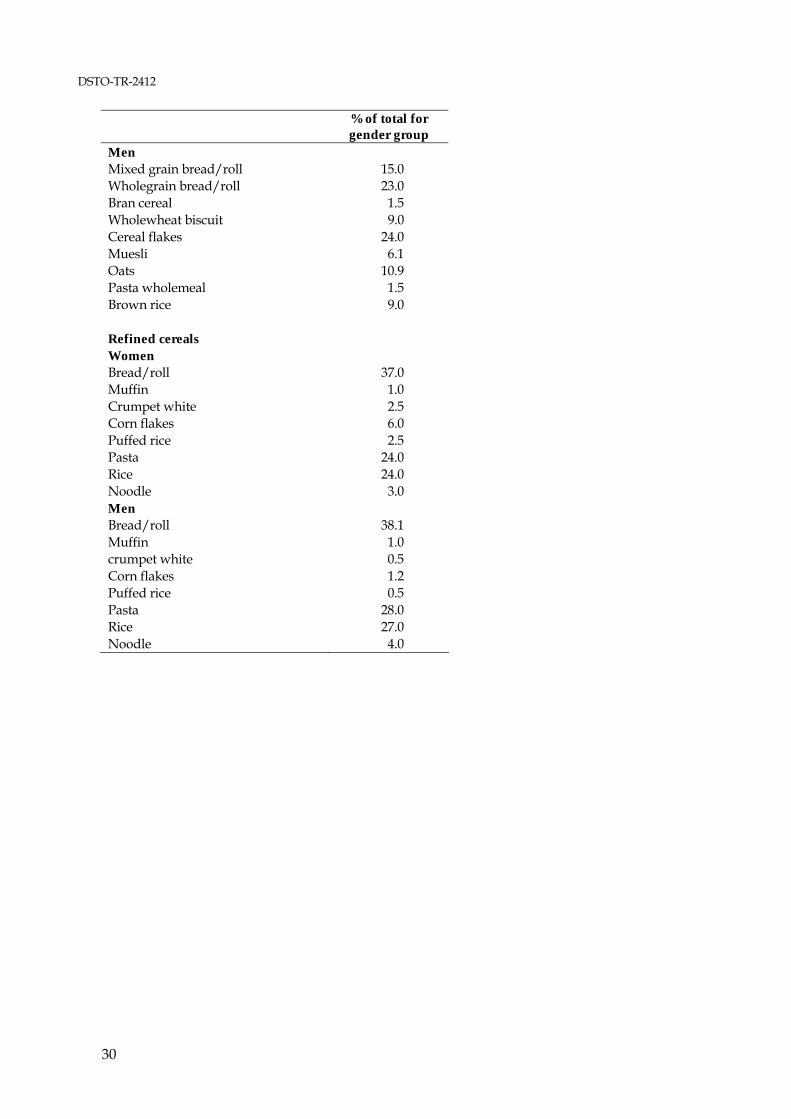
Men Mixed grain bread/roll 15.0 Wholegrain bread/roll 23.0 Bran cereal 1.5 Wholewheat biscuit 9.0 Cereal flakes 24.0 Muesli 6.1 Oats 10.9 Pasta wholemeal 1.5 Brown rice 9.0 Refined cereals Women Bread/roll 37.0 Muffin 1.0 Crumpet white 2.5 Corn flakes 6.0 Puffed rice 2.5 Pasta 24.0 Rice 24.0 Noodle 3.0 Men Bread/roll 38.1 Muffin 1.0 crumpet white 0.5 Corn flakes 1.2 Puffed rice 0.5 Pasta 28.0 Rice 27.0 Noodle 4.0

DSTO-TR-2412
31
Table 7: Some examples of possible 1-MJ add-ons from the AUSNUT07 database showing protein, carbohydrate and saturated fat content per megajoule
Nutrient per MJ (rounded)
Amount per MJ (g/mL)
Protein Saturated
Fat Carbohydrate Wholegrain cereal 8 3 45 100 Wholegrain Bread 12 0.3 39 110 Wholegrain Breakfast cereal 4 1.2 58 60 Brown rice 6 3 63 160 Oats 6 0.6 38 360 Refined cereal serve 7 3 42 120 White bread 10 3 45 100 Sweetened breakfast cereal 10 0.2 40 60 Rice 4 0 52 200 Instant noodles 5 6 27 130 Pasta 8 0.2 55 170 Starchy vegetable 9 1 44 300 Muffin - fruit 10 0.4 50 100 Fruit (esp banana) 4 0.1 50 400 Reduced fat custard 12 2 46 100 Frozen yoghurt (150g) 7 5 39 150 Fruit yoghurt regular fat 12 6 27 250 Ice cream regular 5 10 26 120 Sweetened condensed skim milk 10 0.2 60 100 Muesli bar 8 1.2 36 70 Popcorn 5 7 25 50 Soft drink /cordials/sugar confectionery/fruit leather/jams 0 0 62 750 Sweet biscuits 3 6 32 60

DSTO-TR-2412
32
Part 2 Final analyses after discussions with DSTO
With the initial analyses to hand, the following suggestions were made by DSTO to further refine the analyses and more closely align it with current practice. 1. Suggestions from DSTO re food patterns to be modelled for the 12.5-MJ diet Model the 12.5-MJ diet with the 19.5-MJ RMDIs and MEARs.
SUPMAN 4 currently provides at least four serves of meat and alternatives a day. DSTO requested the inclusion of 2-4 serves of meat/alternatives per day (including two eggs 3-4 times per week). The DSTO analysis modelled legumes as vegetables and suggested two serves per day. Because the meat/alternatives group has little in the way of legumes then this should be also be retained.
Include at least three dairy serves.
Include at least 4-5 starchy vegetable serves.
Include at least six other vegetables (two each of Dark Green Vegetables, Orange Vegetables and Other Vegetables).
Include at least three fruit.
Include at least 10 bread/rice/pasta, (including two serves of rice every day and two serves of pasta every day) (subsequently called DSTO cereals group).
Include 1-3 extras from the high carbohydrate (high sugar) and high carbohydrate /high fat groups (‘high carbohydrate’ extras include foods such as jams, jellies as well as sugar-based confectionary, soft drinks, cordial etc; ‘high carbohydrate /fat’ extras includes items such as cakes, biscuits, buns, sweet muffins, pastries, chocolate and chocolate bars). The nutrient profile for these groups was compiled by combining the nutrient profiles of all relevant items from the food data base.
Include nuts and seeds/unsaturated oils etc as required.
Process followed A number of diets were again modelled. Three of the key models produced at this stage are shown below and were further discussed with DSTO. Diet A. Initial model In line with DSTO suggestions, the initial model tested had: 10 bread/rice/pasta serves with two serves per day as rice,two serves as pasta, one serve as
breakfast cereal and five serves as bread 3 dairy serves a day, one as cheese and two as low/reduced fat milks/yoghurts 3 fruit serves 3 meats/alternatives per day with at least four serves per week as eggs (serve is two eggs),
two/week fish and the rest as meats
DSTO-TR-2412
33
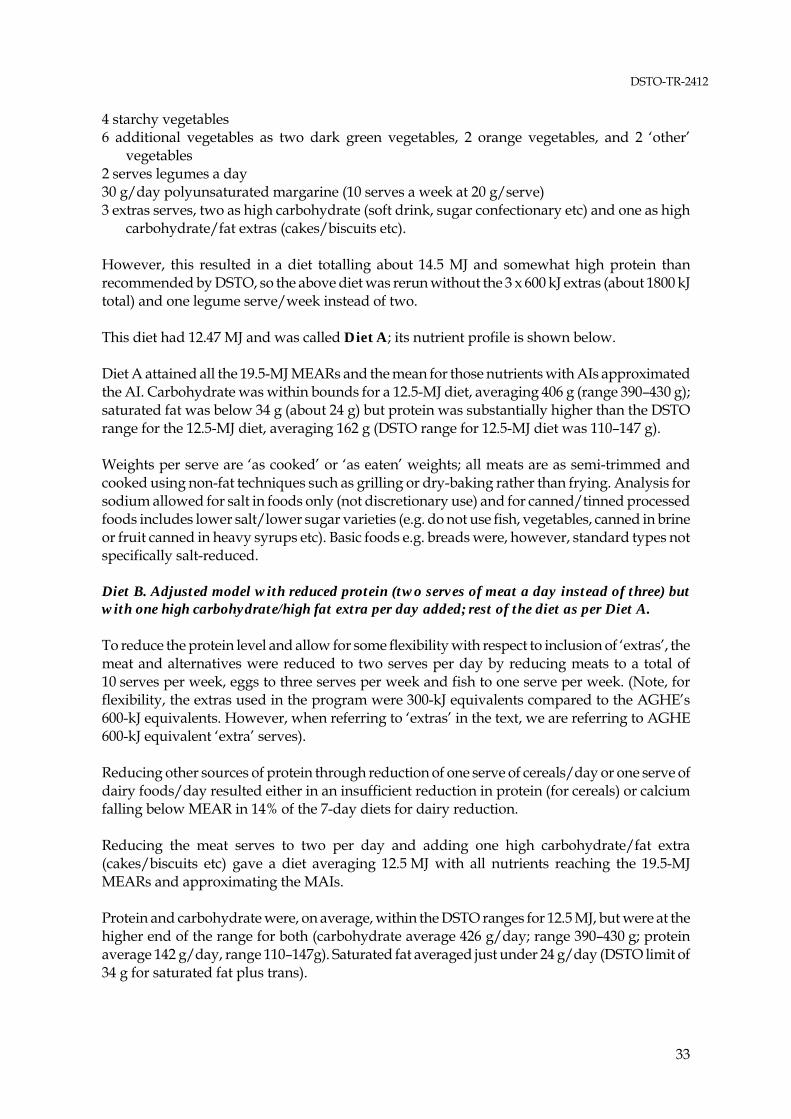
4 starchy vegetables 6 additional vegetables as two dark green vegetables, 2 orange vegetables, and 2 ‘other’
vegetables 2 serves legumes a day 30 g/day polyunsaturated margarine (10 serves a week at 20 g/serve) 3 extras serves, two as high carbohydrate (soft drink, sugar confectionary etc) and one as high
carbohydrate/fat extras (cakes/biscuits etc). However, this resulted in a diet totalling about 14.5 MJ and somewhat high protein than recommended by DSTO, so the above diet was rerun without the 3 x 600 kJ extras (about 1800 kJ total) and one legume serve/week instead of two. This diet had 12.47 MJ and was called Diet A; its nutrient profile is shown below. Diet A attained all the 19.5-MJ MEARs and the mean for those nutrients with AIs approximated the AI. Carbohydrate was within bounds for a 12.5-MJ diet, averaging 406 g (range 390–430 g); saturated fat was below 34 g (about 24 g) but protein was substantially higher than the DSTO range for the 12.5-MJ diet, averaging 162 g (DSTO range for 12.5-MJ diet was 110–147 g). Weights per serve are ‘as cooked’ or ‘as eaten’ weights; all meats are as semi-trimmed and cooked using non-fat techniques such as grilling or dry-baking rather than frying. Analysis for sodium allowed for salt in foods only (not discretionary use) and for canned/tinned processed foods includes lower salt/lower sugar varieties (e.g. do not use fish, vegetables, canned in brine or fruit canned in heavy syrups etc). Basic foods e.g. breads were, however, standard types not specifically salt-reduced. Diet B. Adjusted model with reduced protein (two serves of meat a day instead of three) but with one high carbohydrate/high fat extra per day added; rest of the diet as per Diet A. To reduce the protein level and allow for some flexibility with respect to inclusion of ‘extras’, the meat and alternatives were reduced to two serves per day by reducing meats to a total of 10 serves per week, eggs to three serves per week and fish to one serve per week. (Note, for flexibility, the extras used in the program were 300-kJ equivalents compared to the AGHE’s 600-kJ equivalents. However, when referring to ‘extras’ in the text, we are referring to AGHE 600-kJ equivalent ‘extra’ serves). Reducing other sources of protein through reduction of one serve of cereals/day or one serve of dairy foods/day resulted either in an insufficient reduction in protein (for cereals) or calcium falling below MEAR in 14% of the 7-day diets for dairy reduction. Reducing the meat serves to two per day and adding one high carbohydrate/fat extra (cakes/biscuits etc) gave a diet averaging 12.5 MJ with all nutrients reaching the 19.5-MJ MEARs and approximating the MAIs. Protein and carbohydrate were, on average, within the DSTO ranges for 12.5 MJ, but were at the higher end of the range for both (carbohydrate average 426 g/day; range 390–430 g; protein average 142 g/day, range 110–147g). Saturated fat averaged just under 24 g/day (DSTO limit of 34 g for saturated fat plus trans).

DSTO-TR-2412
34
Diet C. Diet with an additional extra serve (total 2/day) replacing a cereal serve. To allow for even more flexibility re ‘extras’, Diet C was devised. This was as per Diet B except the cereals were reduced by one serve to nine serves/day and an additional high carbohydrate/high fat ‘extra’ was added/day (note: at this stage, we did not use a high carbohydrate extra to replace the cereal serve as the carbohydrate was already at the upper end of the DSTO range). Diet C provided 12.5 MJ, attained the 19.5-MJ MEARs/MAI standards, and had protein of 141 g/day on average (only slightly lower than Diet B, presumably milk/cereal protein in cakes/biscuits almost equated protein from bread/rice/pasta at relative contributions set by DSTO). Carbohydrate 419 g (about 7 g less than Diet B) and saturated fat 27.5 g about 3–4 g higher than Diet B but still within the limits set by DSTO. This diet with nine serves of cereals and two high fat/carbohydrate extras per day would therefore be an alternative way to achieve MEAR/MAIs and protein, carbohydrate, saturated fat standards. Final agreed 12.5-MJ diet In discussions with DSTO, it was decided that Diet A was the preferred option of those modelled thus far but some further refinements were trialled (see Revisions to Diet A) to finalise the recommendations with Diet A1 being the DSTO preferred option. This had slightly reduced protein compared to the original Diet A obtained by reducing legume serves from seven to three per week; polyunsaturated margarine was reduced from 10 to eight serves and replaced by two serves of nuts and seeds per week. Dairy serves were changed to seven per week from each of the high-, medium- and low-fat categories rather than 7 high-fat and 14 low-fat. It was agreed that a 13.5-MJ base diet could then be devised with the addition of one high carbohydrate extra and one high fat/high carbohydrate extra to Diet 1A to which further 1-MJ modules of various composition could be added to increase energy up to 25 MJ. Five modules were constructed which could be used in different amounts and combinations to increase the energy content of the diet whilst keeping the balance of protein, fats and carbohydrates within limits and these were called Modules A, B C, D, E. Module A was composed of equal amounts of the high carbohydrate extras and the high carbohydrate (sugar) /high fat extras Module B was all high carbohydrate (sugar) extras Module C was a 1:1:1 combination of the composite vegetables, fruit and cereals groups Module D was a 1:1:1 combination of the low-fat dairy, legumes and the combined ‘extras’ groups Module E was a 1:1:1:1 combination of high-fat dairy, medium-fat dairy, eggs and nuts/seeds groups

DSTO-TR-2412
35
Diet A. A 12.5-MJ diet attaining 19.5-MJ MEARs with 10 cereals, 3 meats but no extras (note: protein higher than DSTO range) Food Groups N servings per week "DarkGreenVeg" "14" "OrangeVeg" "14" "StarchyVeg" "28" "OtherVeg" "14" "Legumes" "7" "TotalFruit" "21" "RedMeats" "7" "Pork/Chicken" "8" "Eggs" "4" "Fish" "2" "LoFatDairy" "14" "HiFatDairy" "7" "PolyUnsatFat" "10" "Cereals" "70" Daily intake minimum maximum met MEAR/AI met MRDI/AI Energy 12467.0 12004.2 12915.7 Protein 161.9 156.1 166.8 100 100 Fat 65.1 59.3 70.7 SatFat.total 23.8 21.5 25.7 MUFA.total 20.2 18.1 23.2 PUFA.total 15.0 14.1 16.2 Cholesterol 488.3 456.1 539.9 Carbohydrate 406.1 384.4 427.7 Sugars.total 108.5 98.2 120.5 Starch 295.6 274.8 320.0 Dietary fibre 50.8 47.3 55.8 *AI Thiamin 2.1 1.8 2.5 100 66 Riboflavin 2.4 2.3 2.6 100 0 Niacin 75.6 70.9 80.3 100 100 Vitamin B6 2.9 2.3 3.8 100 62 Vitamin B12 6.8 6.0 7.7 100 100 Folate 991.5 832.1 1114.0 100 100 Vitamin A 2342.4 1825.6 2757.3 100 100 Vitamin C 259.9 175.0 364.2 100 100 Vitamin D 6.6 5.7 7.7 * AI Vitamin E 9.8 8.4 11.4 * AI Calcium 1336.7 1258.1 1473.0 100 84 Phosphorus 2356.3 2246.8 2445.7 100 100 Zinc 19.1 17.8 20.6 100 100 Iron 16.9 15.5 18.2 100 1 Magnesium 490.3 460.5 517.3 100 100 Iodine 200.5 186.5 222.3 100 100 Selenium 164.0 140.1 182.2 100 100 Sodium 2401.5 2095.2 2748.5 *AI Potassium 6088.7 5799.0 6356.8 *AI Percent energy from fat 19.3 Percent energy from protein 22.1 Percent energy from carbohydrate 52.1

DSTO-TR-2412
36
Diet B – same as Diet A except – 2 meats instead of 3 – and one 600-kJ high fat/high carbohydrate extra added ( protein and carbohydrate within limits but on the high side).
Food Groups N servings/week "DarkGreenVeg" "14" "OrangeVeg" "14" "StarchyVeg" "28" "OtherVeg" "14" "Legumes" "7" "TotalFruit" "21" "RedMeats" "5" "Pork/chicken)" "5" "Eggs" "3" "Fish" "1" "LoFatDairy" "14" "HiFatDairy" "7" "PolyUnsatFat" "10" "Cereals" "70" "HiFatHi Extras" "14" (equiv to 1/day of AGHE 600kj extras) Daily intake minimum maximum met MEAR/AI met MRDI/AI Energy 12475.1 12065.4 12996.9 Protein 141.9 137.5 147.2 100 100 Fat 65.4 61.3 73.3 SatFat.total 24.6 22.8 26.9 MUFA.total 20.0 18.0 24.1 PUFA.total 15.0 13.7 16.5 Cholesterol 376.7 347.5 411.2 Carbohydrate 426.2 395.2 450.4 Sugars.total 118.3 107.3 127.2 Starch 305.8 281.6 330.7 Dietary fibre 51.6 46.5 57.9 *AI Thiamin 2.1 1.8 2.4 100 64 Riboflavin 2.4 2.2 2.7 100 0 Niacin 66.9 60.7 72.6 100 100 Vitamin B6 2.8 2.2 3.9 100 47 Vitamin B12 5.7 4.8 6.4 100 100 Folate 988.2 824.0 1173.0 100 100 Vitamin A 2386.6 1967.5 2753.0 100 100 Vitamin C 256.3 163.8 370.5 100 100 Vitamin D 6.2 5.5 6.9 *AI Vitamin E 9.4 7.7 11. *AI Calcium 1346.9 1200.4 1432.6 100 89 Phosphorus 2195.6 2100.6 2292.8 100 100 Zinc 17.0 15.9 18.1 100 100 Iron 16.2 15.1 17.7 100 0 Magnesium 478.6 450.9 512.8 100 100 Iodine 198.1 179.3 215.7 100 100 Selenium 143.4 126.6 159.7 100 100 Sodium 2385.8 2101.4 2698.1 *AI Potassium 5902.7 5605.0 6226.4 *AI Percent energy from fat 19.4 Percent energy from protein 19.3 Percent energy from carbohydrate 54.7

DSTO-TR-2412
37
DIET C Same as Diet B but with 9 cereals and 2 high fat/high carbohydrate extras (within protein, carbohydrate and fat ranges as well as MEAR/MAI standards) Food Groups N servings/week "DarkGreenVeg" "14" "OrangeVeg" "14" "StarchyVeg" "28" "OtherVeg" "14" "Legumes" "7" "TotalFruit" "21" "RedMeats" "5" "Pork/Chicken" "5" "Eggs" "3" "Fish" "1" "LoFatDairy" "14" "HiFatDairy" "7" "PolyUnsatFat" "10" "RefinedCereals" "63" "HiFatHiSugarExtras" "28" (equiv to 2/day AGHE extras) Daily intake minimum maximum met MEAR/AI met MRDI/AI Energy 12536.8 12066.6 12988.4 Protein 141.0 135.1 146.8 100 100 Fat 71.2 64.6 77.9 SatFat.total 27.5 24.7 30.5 MUFA.total 21.9 19.6 25.0 PUFA.total 15.5 14.4 16.9 Cholesterol 392.3 364.9 425.7 Carbohydrate 419.2 396.6 447.3 Sugars.total 127.4 117.7 137.7 Starch 289.7 267.8 319.3 Dietary fibre 50.6 47.2 55.7 *AI Thiamin 2.0 1.8 2.3 100 64 Riboflavin 2.4 2.3 2.7 100 0 Niacin 65.5 61.8 69.5 100 100 Vitamin B6 2.8 2.2 3.9 100 53 Vitamin B12 5.7 4.8 6.3 100 100 Folate 934.1 798.0 1084.4 100 100 Vitamin A 2412.6 2030.5 2803.0 100 100 Vitamin C 254.4 183.4 417.5 100 100 Vitamin D 6.3 5.7 7.1 *AI Vitamin E 9.9 8.2 11.5 *AI Calcium 1371.4 1273.5 1451.8 100 95 Phosphorus 2203.8 2111.4 2304.7 100 100 Zinc 16.8 15.5 17.7 100 100 Iron 16.0 14.9 17.4 100 0 Magnesium 475.6 448.2 514.1 100 100 Iodine 196.7 175.5 212.3 100 100 Selenium 139.6 118.5 161.0 100 100 Sodium 2350.3 2062.6 2899.8 *AI Potassium 5936.5 5594.1 6290.7 *AI Percent energy from fat 21.0 Percent energy from protein 19.1 Percent energy from carbohydrate 53.5

DSTO-TR-2412
38
REVISIONS TO DIET A. REVISION DIET 1. To reduce protein, legumes were reduced from seven to three serves per week (tried five, not much effect) and pork/chicken from eight to seven serves/week. Polyunsaturated margarine was reduced from 10 to eight serves and replaced by two serves of nuts/seeds per week (30 g/serve). Dairy serves were changed to seven per week from each of the high, medium and lower fat categories from seven high-fat and 14 low-fat. Outcomes: protein was reduced about 6 g from about 162 g to approx 156 g/day AllFoodGroups Nservings "DarkGreenVeg" "14" "OrangeVeg" "14" "StarchyVeg" "28" "OtherVeg" "14" "Legumes" "3" "NutsSeeds" "2" "TotalFruit" "21" "RedMeats" "7" "Pork/chicken" "7" "Eggs" "4" "Fish" "2" "LoFatDairy" "7" "MidFatDairy" "7" "HiFatDairy" "7" "PolyUnsatFat" "8" "DSTO Cereals" "70" Daily intake minimum maximum met MEAR/AI met MRDI/AI Energy 12534.8 12241.9 12839.2 Protein 155.9 148.0 161.7 100 100 Fat 70.4 66.2 75.0 SatFat.total 26.8 25.0 28.6 MUFA.total 22.4 19.9 24.9 PUFA.total 14.7 13.2 17.1 Cholesterol 496.9 459.7 536.5 Carbohydrate 405.9 389.3 424.0 Sugars.total 108.7 98.8 123.1 Starch 295.3 279.8 319.4 Dietary fibre 48.6 45.3 55.4 Thiamin 2.0 1.6 2.4 100 47 Riboflavin 2.5 2.2 2.7 100 0 Niacin 74.2 69.1 79.8 100 100 Vitamin B6 2.9 2.2 3.8 100 59 Vitamin B12 7.8 6.7 8.9 100 100 Folate 953.3 800.6 1129.2 100 100 Vitamin A 2432.0 1967.8 2950.6 100 100 Vitamin C 248.9 174.5 332.3 100 100 Vitamin D 6.7 5.7 8.0 Vitamin E 10.0 8.2 12. Calcium 1256.8 1149.5 1386.5 100 9 Phosphorus 2293.7 2191.3 2388.7 100 100 Zinc 18.8 17.2 20.2 100 100 Iron 16.4 15.2 17.7 100 0 Magnesium 484.8 460.7 516.4 100 100 Iodine 211.6 192.7 231.0 100 100 Selenium 161.0 140.4 180.7 100 100 Sodium 2209.8 1937.2 2506.7 Potassium 5945.2 5665.0 6206.7 Percent energy from protein, fat and carbohydrate = 21.1, 20.8 and 51.8
respectively

DSTO-TR-2412
39
REVISION DIET 2. As above, but to further reduce protein, high fat dairy serves were reduced from seven per week to five per week; to compensate for energy loss, one serve of polyunsaturated margarine was restored from the original Diet A to a total of nine per week (if add more nuts/seeds increase protein again). Outcome: Protein further reduced by about 2.5 g. AllFoodGroups N servings "DarkGreenVeg" "14" "OrangeVeg" "14" "StarchyVeg" "28" "OtherVeg" "14" "Legumes" "3" "NutsSeeds" "2" "TotalFruit" "21" "RedMeats" "7" "Pork/chicken" "7" "Eggs" "4" "Fish" "2" "LoFatDairy" "7" "MidFatDairy" "7" "HiFatDairy" "5" "PolyUnsatFat" "9" "DSTO Cereals" "70" Daily intake minimum maximum met MEAR/AI met MRDI/AI Energy 12421.0 11877.4 12779.8 Protein 153.5 147.6 158.3 100 100 Fat 69.4 65.0 74.9 SatFat.total 25.1 22.8 26.8 MUFA.total 22.4 19.7 25.9 PUFA.total 15.5 13.8 18.1 Cholesterol 488.1 450.6 535.6 Carbohydrate 403.9 378.6 422.8 Sugars.total 107.7 97.9 117.5 Starch 294.1 273.2 313.6 Dietary fibre 48.5 44.6 54.0 Thiamin 2.0 1.8 2.3 100 49 Riboflavin 2.4 2.2 2.6 100 0 Niacin 73.5 68.9 77.7 100 100 Vitamin B6 2.9 2.1 3.9 100 60 Vitamin B12 7.5 6.5 8.6 100 100 Folate 950.2 807.3 1086.8 100 100 Vitamin A 2408.8 1940.7 2868.5 100 100 Vitamin C 248.0 168.9 365.5 100 100 Vitamin D 6.6 5.7 7.6 Vitamin E 10.0 7.8 12. Calcium 1188.6 1110.2 1300.2 100 1 Phosphorus 2248.1 2164.5 2342.2 100 100 Zinc 18.6 17.3 19.8 100 100 Iron 16.4 15.3 18.0 100 1 Magnesium 482.1 447.8 513.3 100 100 Iodine 208.5 186.9 224.3 100 100 Selenium 159.7 141.9 181.2 100 100 Sodium 2144.2 1915.7 2451.0 Potassium 5928.4 5589.4 6228.8 Percent energy from fat 20.7 Percent energy from protein 21.0 Percent energy from carbohydrate 52.0

DSTO-TR-2412
40
REVISION DIET 3. As above for Revision 2 but reduced pork/chicken one more serve to 6 serves/week; restored polyunsaturated margarine to original 10 serves/week. Protein reduced to 150 g but protein % not changed much as again slightly lower energy. “Meats and alts” at three per day (21/week) if we count 3x75 g legumes as a one serve meat alts and two nuts/seeds as one serve meat alts Outcome: protein down to 150 g/day. AllFoodGroups Nservings "DarkGreenVeg" "14" "OrangeVeg" "14" "StarchyVeg" "28" "OtherVeg" "14" "Legumes" "3" "NutsSeeds" "2" "TotalFruit" "21" "RedMeats" "7" "Pork/chicken" "6" "Eggs" "4" "Fish" "2" "LoFatDairy" "7" "MidFatDairy" "7" "HiFatDairy" "5" "PolyUnsatFat" "10" "WholegrainCereals" "0" "DSTO Cereals" "70" Daily intake minimum maximum met MEAR/AI met MRDI/AI Energy 12410.6 11970.1 12884.0 Protein 150.3 144.4 155.6 100 100 Fat 70.2 65.8 75.1 SatFat.total 25.2 23.4 27.1 MUFA.total 22.5 19.5 25.4 PUFA.total 16.1 14.5 18.7 Cholesterol 471.6 433.1 507.0 Carbohydrate 404.7 377.5 428.3 Sugars.total 107.9 99.5 122.4 Starch 294.8 269.5 314.7 Dietary fibre 48.7 43.8 53.4 Thiamin 2.0 1.6 2.3 100 43 Riboflavin 2.4 2.1 2.6 100 0 Niacin 72.0 66.7 77.9 100 100 Vitamin B6 2.9 2.3 4.0 100 56 Vitamin B12 7.5 6.6 8.4 100 100 Folate 952.6 780.1 1144.6 100 100 Vitamin A 2407.9 2078.3 2820.6 100 100 Vitamin C 257.8 188.7 353.1 100 100 Vitamin D 6.9 6.0 8.1 Vitamin E 10.1 8.5 13. Calcium 1188.6 1092.8 1285.4 100 0 Phosphorus 2218.9 2149.4 2310.9 100 100 Zinc 18.4 16.9 19.6 100 100 Iron 16.3 15.3 17.6 100 0 Magnesium 479.8 451.4 509.9 100 100 Iodine 208.5 191.3 233.6 100 100 Selenium 157.6 133.5 174.4 100 100 Sodium 2148.4 1860.9 2451.5 Potassium 5889.6
5518.5 6180.0 100 100 Percent energy from fat 20.7 Percent energy from protein 20.6 Percent energy from carbohydrate 52.2

DSTO-TR-2412
41
REVISION – 14,500 kJ. As per revision 3 but with four extras/day of 500-600 kJ (note as diet 3 was a bit lower than 12.5 MJ, three extras gave a mean just under 14.2 MJ – could add some other basic 300-kJ food component if you want to use just three extras/day) AllFoodGroups N servings /week "DarkGreenVeg" "14" "OrangeVeg" "14" "StarchyVeg" "28" "OtherVeg" "14" "Legumes" "3" "NutsSeeds" "2" "TotalFruit" "21" "RedMeats" "7" "Pork/chicken" "6" "Eggs" "4" "Fish" "2" "LoFatDairy" "7" "MidFatDairy" "7" "HiFatDairy" "5" "PolyUnsatFat" "10" "DSTO Cereals" "70" "HiSugarExtras" "28" "HiFatHiSugarExtras" "28" Daily intake minimum maximum met MEAR/AI met MRDI/AI Energy 14627.3 14244.3 15099.4 Protein 155.7 150.6 161.3 100 100 Fat 82.4 77.5 87.6 SatFat.total 31.1 28.6 34.0 MUFA.total 26.6 23.7 29.7 PUFA.total 17.5 15.8 19.8 Cholesterol 505.0 466.7 546.6 Carbohydrate 506.5 479.9 530.1 Sugars.total 192.9 182.6 205.4 Starch 311.7 291.5 334.1 Dietary fibre 49.8 45.8 55.7 Thiamin 2.1 1.8 2.4 100 83 Riboflavin 2.6 2.4 2.8 100 0 Niacin 74.0 69.3 77.9 100 100 Vitamin B6 3.2 2.4 4.1 100 86 Vitamin B12 7.4 6.4 8.2 100 100 Folate 957.2 816.6 1145.4 100 100 Vitamin A 2502.8 2063.9 2871.1 100 100 Vitamin C 248.5 180.4 340.7 100 100 Vitamin D 7.2 6.2 8.5 Vitamin E 10.6 8.7 14.0 Calcium 1268.6 1180.1 1379.7 100 21 Phosphorus 2311.6 2219.5 2410.6 100 100 Zinc 18.6 16.7 19.7 100 100 Iron 17.0 16.0 18.4 100 9 Magnesium 503.8 475.1 538.6 100 100 Iodine 232.9 209.9 250.4 100 100 Selenium 166.1 146.9 188.6 100 100 Sodium 2397.6 2095.1 2679.3 72 72 Potassium 6043.0 5725.0 6460.1 100 100 Percent energy from fat 20.9 Percent energy from protein 18.1 Percent energy from carbohydrate 55.4

DSTO-TR-2412
42
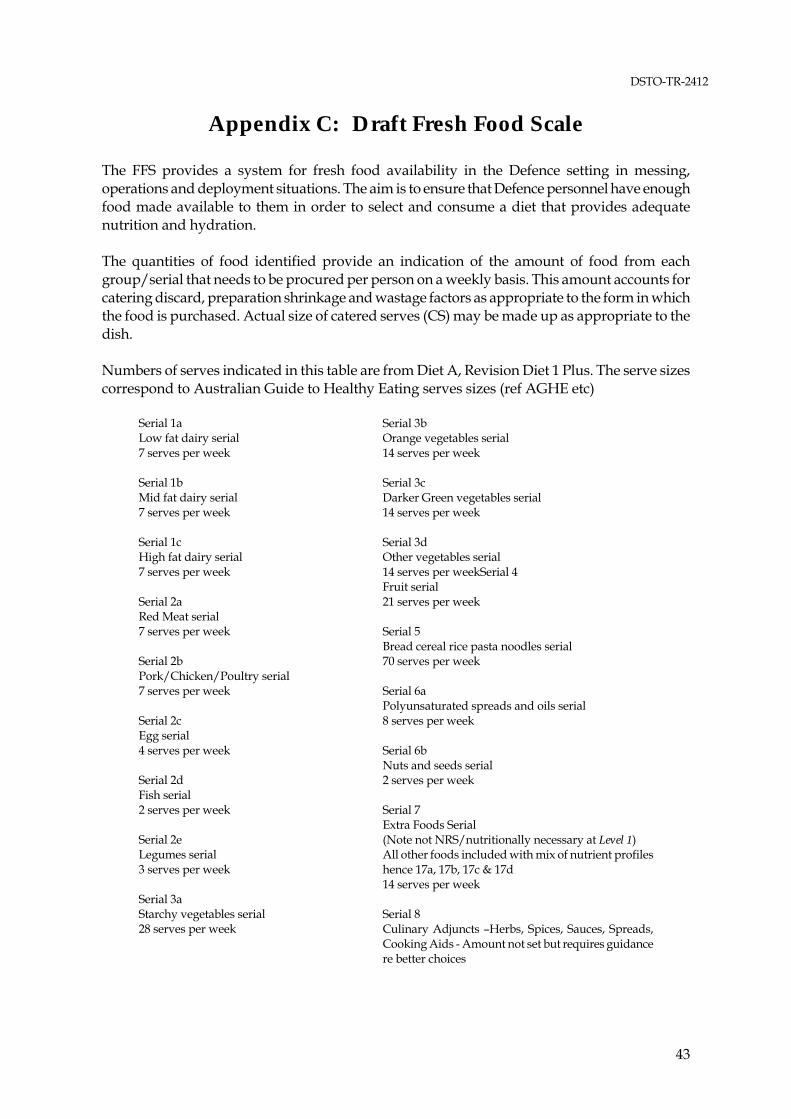
DSTO-TR-2412
43
Appendix C: Draft Fresh Food Scale
The FFS provides a system for fresh food availability in the Defence setting in messing, operations and deployment situations. The aim is to ensure that Defence personnel have enough food made available to them in order to select and consume a diet that provides adequate nutrition and hydration. The quantities of food identified provide an indication of the amount of food from each group/serial that needs to be procured per person on a weekly basis. This amount accounts for catering discard, preparation shrinkage and wastage factors as appropriate to the form in which the food is purchased. Actual size of catered serves (CS) may be made up as appropriate to the dish. Numbers of serves indicated in this table are from Diet A, Revision Diet 1 Plus. The serve sizes correspond to Australian Guide to Healthy Eating serves sizes (ref AGHE etc)
Serial 1a Low fat dairy serial 7 serves per week Serial 1b Mid fat dairy serial 7 serves per week Serial 1c High fat dairy serial 7 serves per week Serial 2a Red Meat serial 7 serves per week Serial 2b Pork/Chicken/Poultry serial 7 serves per week Serial 2c Egg serial 4 serves per week Serial 2d Fish serial 2 serves per week Serial 2e Legumes serial 3 serves per week Serial 3a Starchy vegetables serial 28 serves per week
Serial 3b Orange vegetables serial 14 serves per week Serial 3c Darker Green vegetables serial 14 serves per week Serial 3d Other vegetables serial 14 serves per weekSerial 4 Fruit serial 21 serves per week Serial 5 Bread cereal rice pasta noodles serial 70 serves per week Serial 6a Polyunsaturated spreads and oils serial 8 serves per week Serial 6b Nuts and seeds serial 2 serves per week Serial 7 Extra Foods Serial (Note not NRS/nutritionally necessary at Level 1) All other foods included with mix of nutrient profiles hence 17a, 17b, 17c & 17d 14 serves per week Serial 8 Culinary Adjuncts –Herbs, Spices, Sauces, Spreads, Cooking Aids - Amount not set but requires guidance re better choices
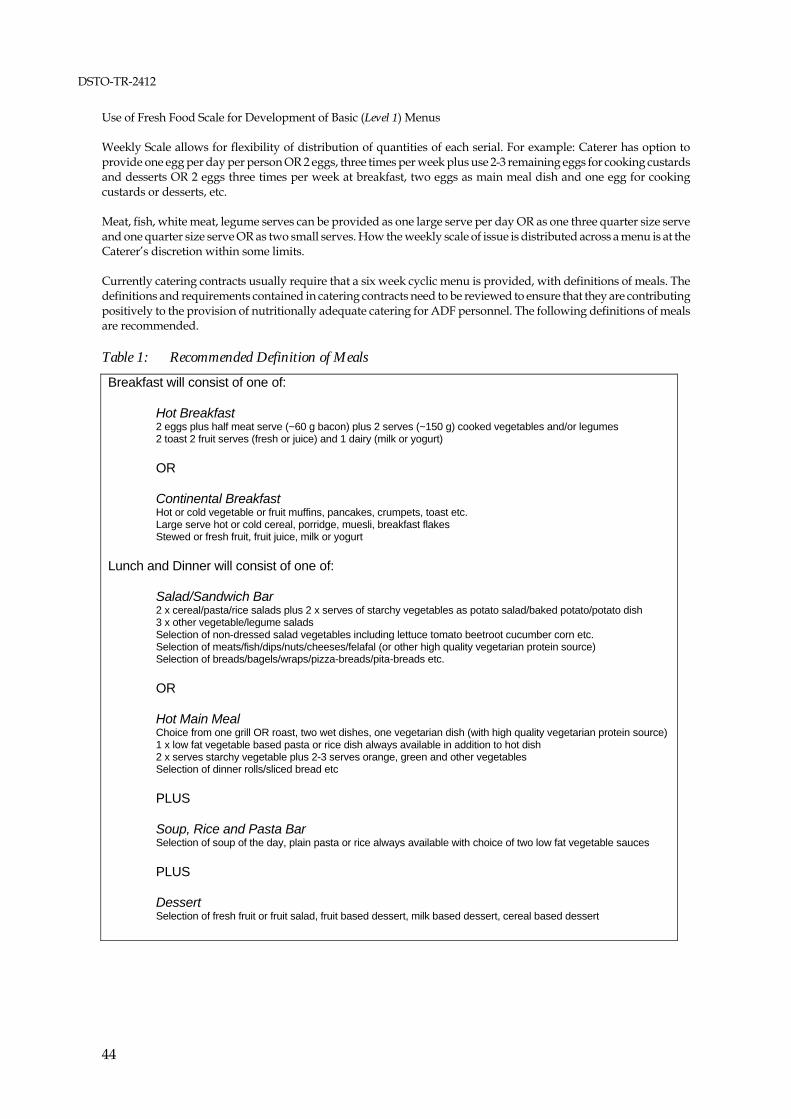
DSTO-TR-2412
44
Use of Fresh Food Scale for Development of Basic (Level 1) Menus Weekly Scale allows for flexibility of distribution of quantities of each serial. For example: Caterer has option to provide one egg per day per person OR 2 eggs, three times per week plus use 2-3 remaining eggs for cooking custards and desserts OR 2 eggs three times per week at breakfast, two eggs as main meal dish and one egg for cooking custards or desserts, etc. Meat, fish, white meat, legume serves can be provided as one large serve per day OR as one three quarter size serve and one quarter size serve OR as two small serves. How the weekly scale of issue is distributed across a menu is at the Caterer’s discretion within some limits. Currently catering contracts usually require that a six week cyclic menu is provided, with definitions of meals. The definitions and requirements contained in catering contracts need to be reviewed to ensure that they are contributing positively to the provision of nutritionally adequate catering for ADF personnel. The following definitions of meals are recommended. Table 1: Recommended Definition of Meals
Breakfast will consist of one of:
Hot Breakfast 2 eggs plus half meat serve (~60 g bacon) plus 2 serves (~150 g) cooked vegetables and/or legumes 2 toast 2 fruit serves (fresh or juice) and 1 dairy (milk or yogurt) OR Continental Breakfast Hot or cold vegetable or fruit muffins, pancakes, crumpets, toast etc. Large serve hot or cold cereal, porridge, muesli, breakfast flakes Stewed or fresh fruit, fruit juice, milk or yogurt
Lunch and Dinner will consist of one of:
Salad/Sandwich Bar 2 x cereal/pasta/rice salads plus 2 x serves of starchy vegetables as potato salad/baked potato/potato dish 3 x other vegetable/legume salads Selection of non-dressed salad vegetables including lettuce tomato beetroot cucumber corn etc. Selection of meats/fish/dips/nuts/cheeses/felafal (or other high quality vegetarian protein source) Selection of breads/bagels/wraps/pizza-breads/pita-breads etc. OR Hot Main Meal Choice from one grill OR roast, two wet dishes, one vegetarian dish (with high quality vegetarian protein source) 1 x low fat vegetable based pasta or rice dish always available in addition to hot dish 2 x serves starchy vegetable plus 2-3 serves orange, green and other vegetables Selection of dinner rolls/sliced bread etc PLUS Soup, Rice and Pasta Bar Selection of soup of the day, plain pasta or rice always available with choice of two low fat vegetable sauces PLUS Dessert Selection of fresh fruit or fruit salad, fruit based dessert, milk based dessert, cereal based dessert

DSTO-TR-2412
45
Levesl 2–5 Catering The FFS provides adequate energy, macro and micronutrients for ADF personnel working at Level 1 physical activity category. Additional modules of Energy are required to meet nutritional requirements as activity levels increase. These modules each provide 1 MJ of energy and are defined below. Module A Sufficient number of serves from serial 7a and/or 7b (Extras general and Extras high carbohydrate) to provide 1 MJ Module B Sufficient number of serves from serial 7b (Extras high carbohydrate) to provide 1 MJ Module C Sufficient number of serves from serials 3a, 3b, 4 and 5 (Starchy & Orange Vegetables, Fruit, Bread, Cereals Rice Pasta Noodles) to provide 1 MJ Module D Sufficient number of serves from serials 1a, 2e and 7c (Low Fat Dairy, Legumes, Extras Milks and supplements) to provide 1 MJ Module E Sufficient number of serves from serials 1b, 1c, 2c and 6b (Mid & High Fat Dairy, Eggs and Nuts) to provide 1 MJ Module F Corresponds to Serials 3c and 3d (darker green and other vegetables) Use as desired to increase the variety of food provided at higher catering levels. There are NO LIMITS on the amount of food that may be provided from Serial 3c and 3d. Use should be encouraged. Level 2 Level 1 Catering plus 1 x Module A and 1 x Module C and Module F foods included as desired. Distributed as 1-MJ unit at MT and 1-MJ unit at Supper. Level 3 Level 1 Catering plus 2 x Module A and 1 x Module C and 1 x Module D and Module F foods included as desired. Distributed as 2-MJ unit at MT and a 2-MJ unit at Supper. Level 4 Level 1 Catering plus 2 x Module A and 2 x Module B and 1 x Module C and 1 x Module D and 1x Module E and Module F foods included as desired. Distributed as 2-MJ unit at MT, 2-MJ at AT and a 3-MJ unit at Supper. Or distributed as 4-MJ unit at MT and 3-MJ unit at supper Level 5 Level 1 Catering plus 4 x Module A and 4 x Module B and 2 x Module C and 2 x Module D and 1x Module E and Module F foods included as desired. Distributed as 4-MJ unit at MT, 2-MJ at AT and a 3-MJ unit at Supper plus 4 MJ (possibly mixture of Module B and Module D drinks) distributed as desired.

DSTO-TR-2412
46
Table 2: Recommended Distribution of additional modules of energy with increasing activity levels
Catering Level 1 2 3 4 5
Basic FFS Serials 1 to 8
Yes Yes Yes Yes Yes
Module A Nil 1 MJ @ MT
and/or Supper
2 MJ @ MT and/or Supper
2 MJ @ MT and/or Supper
2 MJ @ MT and/or Supper
4 MJ @ MT and/or Supper
2 MJ @ MT and/or Supper
+ 2 MJ as desired
Module B Nil Nil Nil 2 MJ @ MT
and/or Supper
2 MJ @ AT
4 MJ @ MT and AT
and Supper
2 MJ @ AT + 2 MJ as desired
Module C Nil 1 MJ @ MT
and/or Supper
1 MJ @ MT and/or Supper
1 MJ @ MT and/or Supper
1 MJ @ MT and/or Supper
2 MJ @ MT and/or Supper
2 MJ @ MT and/or Supper
Module D Nil Nil 1 MJ @ MT
and/or Supper
1 MJ @ MT and/or Supper
1 MJ @ MT and/or Supper
2 MJ @ MT and/or Supper
2 MJ @ MT and/or Supper
Module E Nil Nil Nil 1 MJ @ MT
and/or Supper
1 MJ @ MT and/or Supper
1 MJ @ MT and/or Supper
1 MJ @ MT and/or Supper
Module F1 As
desired As desired As desired As desired As desired
Total MJ Requirement
12.5 14.5 16.5 19.5 25
Total MJ Available2
13.62 15.62 17.62 20.72 26.82
Note 1: Additional energy provided by this serial is likely to be small. Note 2: Reference to nutritional profiles modelled by the CFG contractors Oct/Nov 2009 Definitions of Serials and Modules Definitions and serve sizes for items in Serials 1-8 below coincide with the Core Food Group (CFG) definitions of the National Health and Medical Research Council. The composition of the modules wasdetermined so that the addition of extra energy to the base Level 1 diet is done in such a way that the macronutrient composition of the FFS at each activity level is consistent with the recommendation for macronutrient distribution outlined by Forbes-Ewan (2009). Modelled amounts are for food as eaten. For FFS, wastage/catering discard factors have been added to ensure food provision will result in the consumption of “food-as-eaten” quantities. Nutrient profiles are based on “food-as-eaten” serve sizes. These definitions are approximations only of nutrient composition. Serial 1a Low-fat dairy serial Serve size equivalence is 250 mL low-fat milk; 200 g low-fat yoghurt; 120 g low-fat evaporated milk; 30 g low-fat milk powder. Approximate Average Nutrient Composition per serve: 330 mg calcium; 533 kJ; 9.8 g protein; 1.8 g fat; 1.1 g saturated fat; 17.9 g carbohydrate Serial 1b Mid-fat dairy serial Serial includes regular fat milks and yoghurts, regular fat soft cheeses and reduced fat hard cheeses. Serve size equivalence is 250 mL regular fat milk; 200 g regular-fat yoghurt; 120 g regular-fat evaporated milk; 120 g soft curd cheeses; 60 g semi-soft low-fat cheeses; 40 g reduced-fat hard cheeses; 30 g full-fat milk powder; Approximate Average Nutrient Composition per serve: 301 mg calcium; 780 kJ; 10.8 g protein; 10.3 g fat; 6.4 g saturated fat; 13.6 g (0.04 g to55.6 g) carbohydrate

DSTO-TR-2412
47
Serial 1c High-fat dairy serial Serial includes regular fat semi-soft cheeses and regular-fat hard cheeses. Serve size equivalence is 60 g semi-soft cheese; 40 g fat hard cheeses; Approximate Average Nutrient Composition per serve: 297 mg calcium; 695 kJ; 10.9 g protein; 13.7 g fat; 8.3 g saturated fat; 0.14 g carbohydrate Serial 2a Red Meat serial Serial includes beef, lamb and veal, corned red meat and offal. Given offal not generally eaten frequently, it is not included in profile. Corned meat may contribute to high sodium intake so also excluded from profile. Both these foods are included in equivalence lists. Serve size equivalence is 80 g red meat “as eaten”. Approximate Average Nutrient Composition per serve: 2.7 mg iron; 638 kJ; 22.6 g protein; 6.7g fat; 3.1g saturated fat; 0.25g carbohydrate Serial 2b Pork/Chicken/Poultry serial Serial includes pork, chicken, poultry, bacon, ham and other processed meats like salami. Given offal not eaten frequently, it is not included in profile. Bacon, ham and other processed meats may contribute to high sodium intake but consumed on regular basis so included in this nutrient profile. Salami is very high fat and eaten less frequently so excluded. All these foods are included in equivalence lists. Serve size equivalence is 80 g pork/chicken/poultry “as eaten”. Approximate Average Nutrient Composition per serve: 1 mg iron; 611 kJ; 19.9 g protein; 7.1 g fat; 2.5 g saturated fat; 0.57 g carbohydrate Serial 2c Egg serial Serial includes whole egg and equivalent frozen whole egg. Serve size equivalence is 90 g whole egg “as eaten” i.e. no shell. Approximate Average Nutrient Composition per serve: 1.4 mg iron; 536 kJ; 11.5 g protein; 9.1 g fat; 2.8 g saturated fat; 0.28 g carbohydrate Serial 2d Fish serial Serial includes fish and shellfish (tripe was included because profile closer to fish but removed). Serve size equivalence is 120 g fish, 150 g shellfish “as eaten”. Approximate Average Nutrient Composition per serve: 1.55 mg iron; 606 kJ; 28.4 g protein; 3.2 g fat; 0.96 g saturated fat; 0.16 g carbohydrate Serial 2e Legumes serial Serial includes legumes and legume products including vegetarian meat substitutes and soy based products. Serve size equivalence is 75 g “as eaten”. Approximate Average Nutrient Composition per serve: 1.35 mg iron; 407 kJ; 8.3 g protein; 3.1 g fat; 0.52 g saturated fat; 7.7 g carbohydrate; 3.5 g fibre Serial 3a Starchy vegetables serial Serial includes fresh, frozen, canned, and dried potato, white sweet potato, parsnip, corn and cornmeal. Note that dry potato powder and canned starchy vegetables add to sodium. Serve size equivalence is 75 g fresh, frozen, canned or 15 dry potato or raw cornmeal. Approximate Average Nutrient Composition per serve: 9.8 mg vitamin C; 235 kJ; 1.5g protein; 0.23 g fat; 11.2 g carbohydrate; 1.6 g fibre

DSTO-TR-2412
48
Serial 3b Orange vegetables serial Serial includes fresh, frozen, canned, and juiced carrots, orange sweet potato, pumpkin and red capsicum. Note that canned carrots vegetables add to sodium. Serve size equivalence is 75 g fresh, frozen or canned orange vegetables or 75 mL juice. Approximate Average Nutrient Composition per serve: 9.8 mg vitamin C; 148 kJ; 1.1 g protein; 0.1 g fat; 6.7 g carbohydrate; 1.5 g fibre Serial 3c Darker Green vegetables serial Serial includes fresh, frozen and canned darker green vegetables. Serve size equivalence is 75 g fresh, frozen or canned darker green vegetable. Approximate Average Nutrient Composition per serve: 24.3 mg vitamin C; 118 kJ; 2.2 g protein; 0.5 g fat; 2.6 g carbohydrate; 2.4 g fibre Serial 3d Other vegetables serial Serial includes diversity of fresh, frozen, juiced and canned vegetables including avocado. Serve size equivalence is 75 g fresh, frozen, juiced or canned vegetable. Approximate Average Nutrient Composition per serve: 10.1 mg vitamin C; 89 kJ; 1.3 g protein; 0.24 g fat; 2.8 g carbohydrate; 1.6 g fibre Serial 4 Fruit serial Serial includes diversity of fresh, frozen, juiced, dried and canned fruit. Serve size equivalence: 30 g dried fruit, 100 g banana, 120 g grapes, 150 g pome/stone/tropical/other fruit, 180 g berries/citrus, 200 g melon, 200 mL juices. Approximate Average Nutrient Composition per serve: 33.9 mg vitamin C; 319 kJ; 1.3 g protein; 0.2 g fat; 15.6 g carbohydrate; 3.1 g fibre Serial 5 Bread cereal rice pasta noodles serial Serial includes diversity of bread, cooked and raw cereal, crackers/low fat savoury biscuits, breakfast cereals, pastas, noodles and rice. Serve size equivalence: 25 g cracker biscuits; 30 g breakfast and other dry cereals; 40 g bread/scones/crumpets/ English muffins and dry pasta/noodles; 120 g cooked cereals/pasta/noodles; 180 g cooked porridge/congee. Approximate Average Nutrient Composition per serve: 488 kJ; 3.3 g protein; 1.4 g fat; 21.5 g carbohydrate; 2 g fibre Serial 6a Polyunsaturated spreads and oils serial Serve size equivalence is 30 g/mL Approximate Average Nutrient Composition per serve: 893 kJ; 0.07 g protein; 24 g fat; 3.9 g saturated fat; 0.1 g carbohydrate; Serial 6b Nuts and seeds serial Serial includes nuts and nut spreads, seeds and seed spreads. Serve size equivalence is 30 g/mL Approximate Average Nutrient Composition per serve: 1.2 mg iron; 792 kJ; 5.8 g protein; 17.4 g fat; 2.1 g saturated fat; 1.8 g carbohydrate; 2.8 g fibre Serial 7 Culinary Adjuncts/SRA –Extras Serial includes extra foods as described by CFG and in current AGHE as equivalent to serve size that provides 600 kJ. Includes mixture of all other food not included in serials above like other fats and oils, cake, biscuits, icecream, sports drinks, cordials, nutritional supplement drinks, junk food etc. Serve size equivalence is amount that provides approximately 500 to 600 kJ No of serves per week is from whole of Serial 7 not each subgroup, i.e. 1200 kJ per day maximum.

DSTO-TR-2412
49
In order to simplify Module descriptions Serial 7 is divided into sub-groups: Serial 7a Extras General Serve Average ~ 600 kJ; 2.2 g protein; 6 g fat; 3.3 g saturated fat; 19 g carbohydrate Serial 7b Extras High carbohydrate Serve Average ~ 600 kJ; 0.4 g protein; 0.2 g fat; 0.1 g saturated fat; 37 g carbohydrate Serial 7c Extras Milks and supplements Serve Average ~ 600 kJ; 8 g protein; 2.8 g fat; 1.8 g saturated fat; 22 g carbohydrate Serial 7d Extras fats and Oils Serve Average ~ 600 kJ; 0.2 g protein; 17 g fat; 8.6 g saturated fat; 0.3 g carbohydrate Serial 8 Culinary Adjuncts-Herbs, Spices, Sauces, Spreads, Cooking Aids Serial includes condiments and cooking aids many being important for adding variety to meals and beverages. Tea and coffee for instance are included in this serial. They are provided as a list with no limits on ordering except for budgetary constraints. Some products may contain high levels of sodium and should be limited to very small amounts. Modules of extra energy definitions Module A Sufficient number of serves from serial 7a and/or 7b (Extras general and Extras high carbohydrate) to provide 1 MJ 1 MJ average 7a + 7b ~ 2.2 g protein, 5.2 g fat, 47 g carbohydrate Module B Sufficient number of serves from serial 7b (Extras high carbohydrate) to provide 1 MJ 1 MJ 7b ~ 0.7 g protein, 0.3 g fat, 62 g carbohydrate Module C Sufficient number of serves from serials 3a, 3b, 4 and 5 (Starchy & Orange Vegetables, Fruit, Bread, Cereals Rice Pasta Noodles) to provide 1MJ 1 MJ average S3a + S3b + S4 + S5 ~ 6.2g protein, 1.4 g fat, 46 g carbohydrate Module D Sufficient number of serves from serials 1a, 2e and 7c (Low Fat Dairy, Legumes, Extras Milks and supplements) to provide 1 MJ 1 MJ average S1a + S2e + S7c ~ 13 g protein, 4.7 g fat, 37 g carbohydrate Module E Sufficient number of serves from serials 1b, 1c, 2c and 6b (Mid & High Fat Dairy, Eggs and Nuts) to provide 1 MJ 1 MJ average S1b + S1c + S2c + S6b ~ 16 g protein, 18 g fat, 4.3 g carbohydrate Module F Corresponds to Serials 3c and 3d (darker green and other vegetables) Use as desired to increase the variety of food provided at higher catering levels. NO LIMITS because want to encourage use. 1 MJ average S3c + S3d = large volume of vegetables 1 MJ ~ 16 g protein, 3.5 g fat, 26 g carbohydrate, 19 g fibre

DSTO-TR-2412
50
Fresh Food Scale
Serial basic and alternative items Weekly Scale mL/g 1 milk and milk products and alternatives 1a low fat dairy Fluid Milk or Ca Fortified Soy Beverage - Reduced Fat/Skim/Nonfat 2000 Milk Powder Dry - Non Fat/Skim 240 Yoghurt, Fruit or Plain or Cultured Buttermilk- Reduced Fat/Skim/Low Fat 1600 Milk, Evaporated, Undiluted – Reduced Fat/Skim/NonFat 1000 Custard, made on reduced or non fat milk/reduced fat commercial 2000
1b mid fat dairy Fluid Milk or Ca Fortified Soy Beverage – Whole/Full Fat (4%) 2000 Milk Powder Dry - Whole/Full Fat 240 Yoghurt, Fruit or Plain – Whole/Full Fat 1600 Milk, Evaporated, Undiluted – Whole/Full Fat 1000 Custard, made on whole or full fat milk/full fat commercial 2000
Cheese Hard or Processed– 25% Fat Reduced –e.g. cheddar, gouda, tasty, mozzarella 320
Cheese Soft/White–e.g. neufchatel, bocconcini, 800 Cheese Curd–e.g. ricotta 1000
1c high fat dairy Cheese Very Hard – e.g. parmesan, romano 240 Cheese Hard – e.g. cheddar, gouda, tasty, mozzarella, smoked 320 Cheese Soft –e.g. havarti, brie, camembert, bluevein 480 Cheese Soy 480 Cheese Feta – Low Salt 640
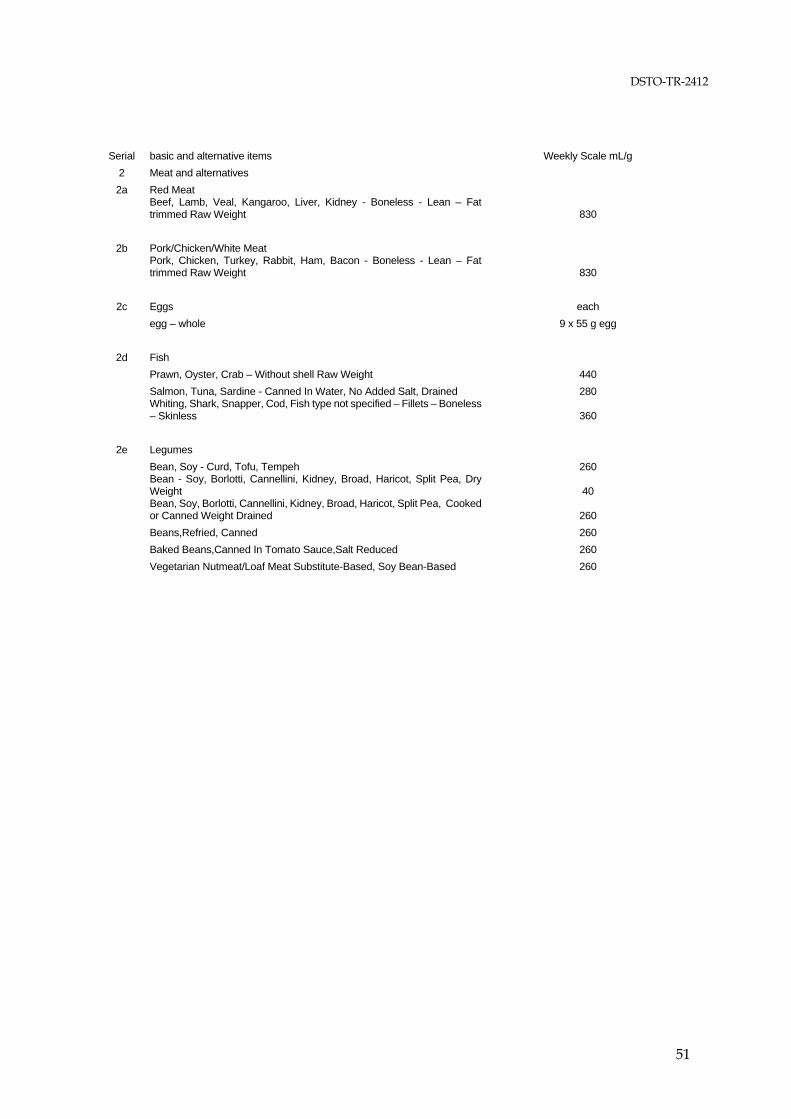
DSTO-TR-2412
51
Serial basic and alternative items Weekly Scale mL/g 2 Meat and alternatives 2a Red Meat
Beef, Lamb, Veal, Kangaroo, Liver, Kidney - Boneless - Lean – Fat trimmed Raw Weight 830
2b Pork/Chicken/White Meat
Pork, Chicken, Turkey, Rabbit, Ham, Bacon - Boneless - Lean – Fat trimmed Raw Weight 830
2c Eggs each egg – whole 9 x 55 g egg
2d Fish Prawn, Oyster, Crab – Without shell Raw Weight 440 Salmon, Tuna, Sardine - Canned In Water, No Added Salt, Drained 280
Whiting, Shark, Snapper, Cod, Fish type not specified – Fillets – Boneless – Skinless 360
2e Legumes Bean, Soy - Curd, Tofu, Tempeh 260
Bean - Soy, Borlotti, Cannellini, Kidney, Broad, Haricot, Split Pea, Dry Weight 40
Bean, Soy, Borlotti, Cannellini, Kidney, Broad, Haricot, Split Pea, Cooked or Canned Weight Drained 260
Beans,Refried, Canned 260 Baked Beans,Canned In Tomato Sauce,Salt Reduced 260 Vegetarian Nutmeat/Loaf Meat Substitute-Based, Soy Bean-Based 260

DSTO-TR-2412
52
Serial basic and alternative items Weekly Scale mL/g 3 Vegetables 3a starchy vegetables Potato, Sweet Potato, Parsnip - Without Skin, Ready to use, Raw/Frozen 2400 Potato, White Sweet Potato, Parsnip - Clean Unpeeled prior to prep 3000 Potato, Canned, Drained 2400 Corn off the cob Raw/Frozen Canned, Drained 2400 Corn, Cream Style, Canned 2400 Cornmeal, Cooked With Water 2400 Potato, Instant Mashed, Dry Powder 480 Cornmeal, Raw 480
3b orange vegetables
Carrot, Pumpkin, Orange Sweet Potato, Red Capsicum - Raw/Frozen, Canned Drained, Without Skin, Ready to use 1200
Carrot, Pumpkin, Orange Sweet Potato, Red Capsicum - Clean Unpeeled prior to prep 1500
Carrot Juice, 1200
3c darker green vegetables
Broccoli, Brussels Sprout, Chinese Cabbage, Red Cabbage, Green Cabbage, Silverbeet, Spinach, Green Peas, Sprouts, Asparagus, Snowpea, Green Capsicum, Lettuce, Leek – Raw, Cooked, Frozen, Canned & Drained, Ready to use 1200
3d other vegetables
Swede, Turnip Bean Sprout Celery Beetroot Cauliflower Cucumber Eggplant Green Bean, Butter bean, Mushroom Onion, Shallot, Spring Onion, Squash Zucchini – Raw, Cooked, Frozen, Canned & Drained, Ready to use 1200
Juice, Celery, Beetroot, Mixed vegetable, Tomato 1200 Avocado, Raw 1200 Tomato,Sun Dried 240 Onion,Dehydrated 240 Tomato Paste,No Added Salt 400

DSTO-TR-2412
53
Serial basic and alternative items Weekly Scale mL/g 4 Fruit Fruit, Dried, Raw 725 Fruit, Canned, Drained 3600
Fruit, Stone, Pomme, Tropical e.g. mango, paw paw, pineapple, Raw, Peeled ready to eat 3600
Fruit juice 3600 Banana, Common, Raw, Peeled, Ready to eat 2400 Berry ,Raw, Frozen, Canned & Drained 4350 Passionfruit, Pulp, Raw Canned 2400 Grape, Black Green, Raw – Ready to eat 2900 Fruit Citrus Raw, Canned & Drained, Peeled and ready to eat 4350 Fruit, Melon, Raw Peeled ready to eat 4800
Serial basic and alternative items Weekly Scale mL/g 5 Bread cereal rice pasta noodles
Bread, White, Wholemeal, Fruit, Mixed Grain, Naan, Pizza Base, Pumpernickel, Rye, Sour Dough, Souvlaki, Crumpet, English Muffin, Bagel, Scone, - Roll, Slice, Flat etc 3200
Breakfast Cereal, Whole Wheat, Bran, Corn, Rice Biscuit, Flake, Puffed, Untoasted Muesli, 2400
Oats, Semolina, Polenta, Raw or Instant, Uncooked, Dry 2400 Porridge Semolina, Cooked, 9700 Rice, White, Brown, Raw 4000 Rice, White Brown, Cooked, No Added Salt 9700 Pasta, Noodle, Regular, Wholemeal, White, Gluten free, Egg, Asian, Dry 4000
Pasta, Noodle, Regular, Wholemeal, White, Gluten free, Egg, Asian, Cooked & Drained, No Added Salt 9700
Rice Cake,Puffed 25 Biscuit, Cracker Savoury, Crispbread, Wholemeal, Rice Commercial 25
Flour, Wheat, White, Wholemeal, Arrowroot, Cornflour, Rice, Plain Self-Raising, Dry Scone Mix 30
Grains, Barley, Millet, Couscous Dry Raw 50 Grains, Barley, Millet, Couscous Cooked, No added salt 120 6 Polyunsaturated Fats and Nuts 6a Polyunsaturated fats and oils Oil,Polyunsaturated,Blended 280 Margarine,Polyunsaturated,Reduced Salt 280
6b Nuts and seeds
Brazil Nut Cashew Almond Macadamia Hazelnut Peanut Walnut Unsalted, Raw, Dry Roasted, Shelled ready to eat 70
Tahini, Sesame Butter 70 Peanut Butter, , No Added Sugar 70 Seed, Pumpkin, Sesame Sunflower Kernel, Raw Unsalted 70

DSTO-TR-2412
54
Serial basic and alternative items (needs more work) Weekly Scale mL/g 7 Extra Foods Weekly Scale applies to group as total 7a Extras – general Ice Cream and ice confections 1400 Biscuit,Plain,Sweet, 420 Chocolate,Milk,Dark,With/Without Nut/Fruit/Fillings,Chocolate bars 385 Biscuit,Fancy Sweet 385 Biscuit,Savoury, 385 Cake,Iced, 490 Cake,Fruit,Rich 490
7b Extras - High carbohydrate OR Sports Drink,Ready-To-Drink,All Flavours 3500 Cordial base,citrus fruit juice high(>40%),regular 1050 Boiled Lolly, Confectionery sugar/nougat/jelly 700 Topping,Chocolate 700 Jam,Fruit spreads 840 Honey,All Types 700 Sugar,Brown, Raw, White 560 Jelly Crystals,All Flavours 560 Sports Drink Base,All Flavours 560
7c Extras - Milks and supplements OR Ready to Drink RTD [Oral Supplement] 1540 Beverage Flavour Mix,Unfort,W/Milk Solids&Sugar,Choc 560 Sports Supplement Powder,High Ptn&Energy,Chocolate 560 Milk, Flavours,Commercial 2450 Milk,Sweetened Condensed,Skim Undiluted 700
7d Extras - Fats and Oils OR Cream,Pure( Fat>35%) 490 Butter,Reduced/No Salt 280 Oil,other or Mayonnaise 280

DSTO-TR-2412
55
Serial basic and alternative items 8 Culinary Adjuncts - Herbs, Spices, Sauces Spreads, Cooking aids
Provided as list or SRA sheet with no particular limits on ordering except for
budget constraints Baking Powder Yeast,Compressed Pepper,Black/White Curry Powder/ other spices Vinegar Custard Powder,Dry Sauce,Tomato,Barbeque, Chili, Bottled,No Added Salt Gravy Powder,Salt Reduced,Dry Mix Garlic,Raw/ other herbs Gelatine,Dry Pickle,Mustard,Sweet, Chutney,Fruit Flour,Arrowroot Junket,All Flavours,From Tablet,With Added Milk Vegemite [Yeast extract] Tea,black,brewed from leaf/teabags,regular Coffee,instant,regular,dry powder Cocoa, powdered

Page classification: UNCLASSIFIED
DEFENCE SCIENCE AND TECHNOLOGY ORGANISATION
DOCUMENT CONTROL DATA 1. PRIVACY MARKING/CAVEAT (OF DOCUMENT)
2. TITLE Development of a new Australian Defence Force Fresh Food Provisioning Scale (SUPMAN 4/NAVSUPMAN 5 Review)
3. SECURITY CLASSIFICATION (FOR UNCLASSIFIED REPORTS THAT ARE LIMITED RELEASE USE (L) NEXT TO DOCUMENT CLASSIFICATION) Document (U) Title (U) Abstract (U)
4. AUTHOR(S) Angela Malberg and Chris Forbes-Ewan
5. CORPORATE AUTHOR DSTO Defence Science and Technology Organisation 506 Lorimer St Fishermans Bend Victoria 3207 Australia
6a. DSTO NUMBER DSTO-TR-2412
6b. AR NUMBER AR-014-764
6c. TYPE OF REPORT Technical Report
7. DOCUMENT DATE May 2010
8. FILE NUMBER 2010/1011062
9. TASK NUMBER 07/082
10. TASK SPONSOR CJLOG
11. NO. OF PAGES 55
12. NO. OF REFERENCES 8
13. URL on the World Wide Web http://www.dsto.defence.gov.au/corporate/reports/DSTO-TR-2412.pdf
14. RELEASE AUTHORITY Chief, Human Protection and Performance Division
15. SECONDARY RELEASE STATEMENT OF THIS DOCUMENT
Approved for public release OVERSEAS ENQUIRIES OUTSIDE STATED LIMITATIONS SHOULD BE REFERRED THROUGH DOCUMENT EXCHANGE, PO BOX 1500, EDINBURGH, SA 5111 16. DELIBERATE ANNOUNCEMENT No Limitations 17. CITATION IN OTHER DOCUMENTS Yes 18. DSTO RESEARCH LIBRARY THESAURUS http://web-vic.dsto.defence.gov.au/workareas/library/resources/dsto_thesaurus.shtml Military rations, nutrition, nutritional requirements, food 19. ABSTRACT ADF members are fed according to the entitlements stipulated in SUPMAN 4 and NAVSUPMAN 5. The entitlements are aimed at meeting the 'worst case' situation, the nutritional requirements of young, active, males. Because not all ADF members are equally active, and females generally have lower nutritional requirements than males, there is the potential for more food to be made available than is needed. DSTO was requested to devise ration scales that more efficiently satisfy the demonstrated nutritional requirements of ADF members. The results of doubly-labelled water studies to determine the energy expenditures of ADF members were used to devise Military Recommended Dietary Intakes (MRDIs) applicable to four sub-groups of ADF members-adult males, adult females, adolescent males and adolescent females-also taking into account five levels of physical activity. An adaptation of a program used to assess the draft Nutrient Reference Values (NRVs) for Australia and New Zealand was then used to determine food entitlements to meet the MRDIs. The revised ration scales provide 12.5, 14.5, 16.5, 19.5 and 25 MJ per person per day respectively for five activity categories (denoted Level 1 to 5, respectively). The basic scale meets the energy requirement for troops working at Level 1, and the micronutrient requirements of troops working at Level 1, 2, 3 and 4. Additional food is provided in the form of 1-MJ food modules which can be issued as Morning Tea, Afternoon Tea and/or Supper. The new ration scales will ensure that troops are fed according to their nutritional requirements. This has the potential to reduce wastage and to impact positively on nutritional status of ADF members, including reduced levels of overweight/obesity, together with the flexibility to allow caterers to better meet the nutritional requirements of the group of defence personnel being fed.
Page classification: UNCLASSIFIED