development of a part criticality index in inventory ... of a part criticality index in inventory...
TRANSCRIPT
1
Development of a Part Criticality Index in Inventory
Management
Clint Saidy1, Liudas Panavas
2, Ramy Harik
3, Abdel-Moez Bayoumi
4, Joseph Khoury
5
1Department of Mechanical Engineering, College of Engineering and Computing, University of
South Carolina, Columbia, South Carolina, USA
2Department of Mechanical Engineering, College of Engineering and Computing, University of
South Carolina, Columbia, South Carolina, USA
3Department of Mechanical Engineering, College of Engineering and Computing, University of
South Carolina, Columbia, South Carolina, USA
4Department of Mechanical Engineering, College of Engineering and Computing, University of
South Carolina, Columbia, South Carolina, USA
5Methode Electronics Middle East S.A.L
Mega Mall, Lower Level, Damascus Road, Furn El Chebbak, Beirut, Lebanon
Abstract. Due to uncertainties in demand, some parts might go out of
stock during the manufacturing process leading to backorders if an out-
of-stock part is critical. In order to reduce additional cost it is important
to optimize restocking processes. To do so, the concept of Part Criticality
is used to rank and prioritize parts involved in the production of different
products. In this paper, we develop an algorithm to get the Compound
Global Index which represents the part criticality.
Keywords. Supply Chain, Inventory Control, Uncertainty, Criticality.
1 Introduction
As businesses grow in size, inventory management analysis is becoming more
important to increase efficiency and profits by reducing backorders and surpluses. Part of
this change is a result of limited in house production of parts and a focus on final

2
assembly, which creates a need to evaluate part criticality in the supply chain. The two
fundamental problems that arise from a poor supply chain are a large backlog and surplus.
The percentage of items backordered and the number of backorder days are important
measures of the quality of a company's customer service and the effectiveness of its
inventory management. On the other hand, if the business has an inventory surplus it will
incur costs to store, track and insure inventory. Therefore, creating an inventory
management system that ranks part criticality based on their creation of backorders and
surpluses can create significant financial and customer service improvements for a
business.
Two common inventory-management strategies are the just-in-time (JIT)
method, where companies plan to receive items as they are needed rather than maintaining
high inventory levels, and materials requirement planning (MRP), which schedules
material deliveries based on sales forecasts. JIT means that manufacturers and retailers
keep only what they need to produce and sell products in inventory, which reduces storage
and insurance costs, as well as the cost of liquidating or discarding unused, unwanted
inventory. To balance this style of inventory management, manufacturers and retailers
must work together to monitor the availability of resources on the manufacturer’s end and
consumer demand on the retailer’s. The MRP inventory management method is sales-
forecast dependent. This means that manufacturers must have accurate sales records to
enable accurate planning of inventory needs and to communicate those needs with
materials suppliers in a timely manner. These methods are geared towards supply chain
management and are concerned with when certain products are to be ordered but do not
incorporate in what order and whether they should be ordered. Overall, these methods
view all parts as having equal importance and miss the part criticality tier that helps
account for imperfections and differentiation between different parts that affect production
time.
To achieve a balance between efficient customer service and low inventory cost,
an optimization model should be set in place that finds a part that is most critical amongst
the bills of material. Companies cannot spread their recourses equally amongst all the
products and inventory management. By defining the most important parts companies will
be able to more efficiently delegate their resources. In order to do this, an algorithm will
be created using different components of existing part criticality models found through a
literature review. Then the part criticality index will be generated in order to target critical
parts on the inventory floor and will be simulated through randomly generated number
tests. Finally, the system will be placed in a real world application to test its effectiveness.
2 Literature Review
As business and production facilities grow in size and complexity, inventory and
supply chain management have grown increasingly important to gain an upper edge.
Today’s environment is no longer brand vs brand but instead involves entire supply chains

3
[4]. A large part of this supply chain is material requirement planning and safety stock
decisions. With the cost of holding inventory as high as 40% of the inventory value, it is
important to maintain the optimal amount [8].
Modeling and determining the optimal amount of inventory depends on several
factors. Depending on the company size, either a single or a multi-echelon system should
be put in place. If the model represents a single entity, such as a warehouse, a single
echelon model is used. Multi-echelon, composed of many single-echelon systems, models
are used most often due to current companies size [3]. Finally, event occurrences can be
assigned numbers, deterministic or stochastic, when creating inventory models. All these
variables create a variety of inventory management policies.
The first part criticality inventory system investigated is the spare parts theory,
which involves the assignment of criticality to the parts that make up the manufacturing
equipment. Due to the high uncertainty of the requirement of the spare parts and small
amount of suppliers, spare parts are inherently difficult to manage. This generally causes a
large amount of overstocking [7]. In order to deal with these issues, spare parts are
generally put into categories in order help create proper stocking. Drekker began this by
allowing equipment criticality to determine the stock of spare parts by assigning each
piece of equipment a status of either “critical and non-critical” [2].
In order to determine the optimal order quantity and reorder point for aircraft
spare parts, Aisyati et al. [1] used a continuous review model. The suggested model
resulted in smaller total cost compared with existing policy. An ABC classification system
was used to categorize the parts based on their dollar contribution. Focus was on class A
and B which commonly known as important classes. The result from the research
indicates that the continuous review policy gives a significant amount of saving compared
to the pre-existing policy. Finally, in order to expand on the ABC model, Stoll [9] used a
three dimensional approach allowing for the predictability of demand and importance of
the part to be calculated in. The spare part inventory theories lay the groundwork for
determining the criticality of different parts of a production facility.
Another way to examine the importance of a part is to investigate the intricate
web of the interactions among the units of related systems. One of the most successful
recent approaches to capturing the fundamental features of the structure and dynamics of
complex systems has been the investigation of the networks associated with the units
(nodes) together with their relations (edges). Mones et al. [6] developed an approach and
proposed a measure capable of capturing the essential features of the structure and the
degree of hierarchy in a complex network. The measure introduced is based on a
generalization of the m-reach centrality, which is first extending to directed/partially
directed graphs. Then, a global reaching centrality (GRC) was defined, which is the
difference between the maximum and the average value of the generalized reach

4
centralities over the network. Results for real networks show that the hierarchy measure is
related to the controllability of the given system.
Fig. 1. Diagram illustrating the process of visualizing an ensemble of networks.(Mones et al., 2012)
Manzini et al [5] uses the method of nodes and edges to create a system to deal
with manufacturing-to-order and assembly-to-order processes. Since each product is
unique there is no large part inventory to pick from. To formalize the utilization of the
part in the production, Manzini lets the source node be when the part is introduced and the
sink node be the milestone before the production operation requiring the component. Then
to evaluate the criticality of the part, Manzini finds the overlap of the probability that the
component is needed in the production operation and the probability that component has
not arrived. An overlap of these provides a risk that determines the criticality of the part.
The system of edges and nodes works well in production lines because of the step-by-step
nature of manufacturing facilities.
3 Defining the Part Criticality Index
The solution employed in this paper focuses on the idea on part Criticality in
Inventory Management. This idea stems from:

5
The spare parts inventory management technique where equipment spare
parts are assigned a value due to their criticalness to the production line [2].
The system of nodes and edges Mones et al. put forward to describe the
fundamental features and hierarchies of a structure and dynamics of complex
systems [6].
Fig. 2. Typical Product
Combining these two systems gave a unique approach to determining the part
criticality. The spare parts inventory management system introduced the concept of
backlogs and order demand to part criticality while the system of nodes and edges allowed
for the complex system of a product and production line to be simplified and quantified.
The system of nodes and edges can be applied to a production line if the nodes
are looked at as parts and edges being the assembly links. If a part is out of stock, this cuts
off connections not allowing the production to flow through the map to the final assembly.
The most critical parts of a product then become the parts with the most connections due
to their ability to cut off more of the production line and are therefore given preference in
stocking systems. The spare part inventory technique was used to rank the product
criticality by including the demand and backlog. This way the most important part could
be found by combining the most important parts and products of a production line. This
will helps envision the bigger supply chain later in order tackle criticality not only on the
factory floor but by reaching suppliers and enhancing the cooperation between all the
supply chain entities. A general approach for the creation of each factor in the
methodology is listed below followed by a more detailed approach.
6
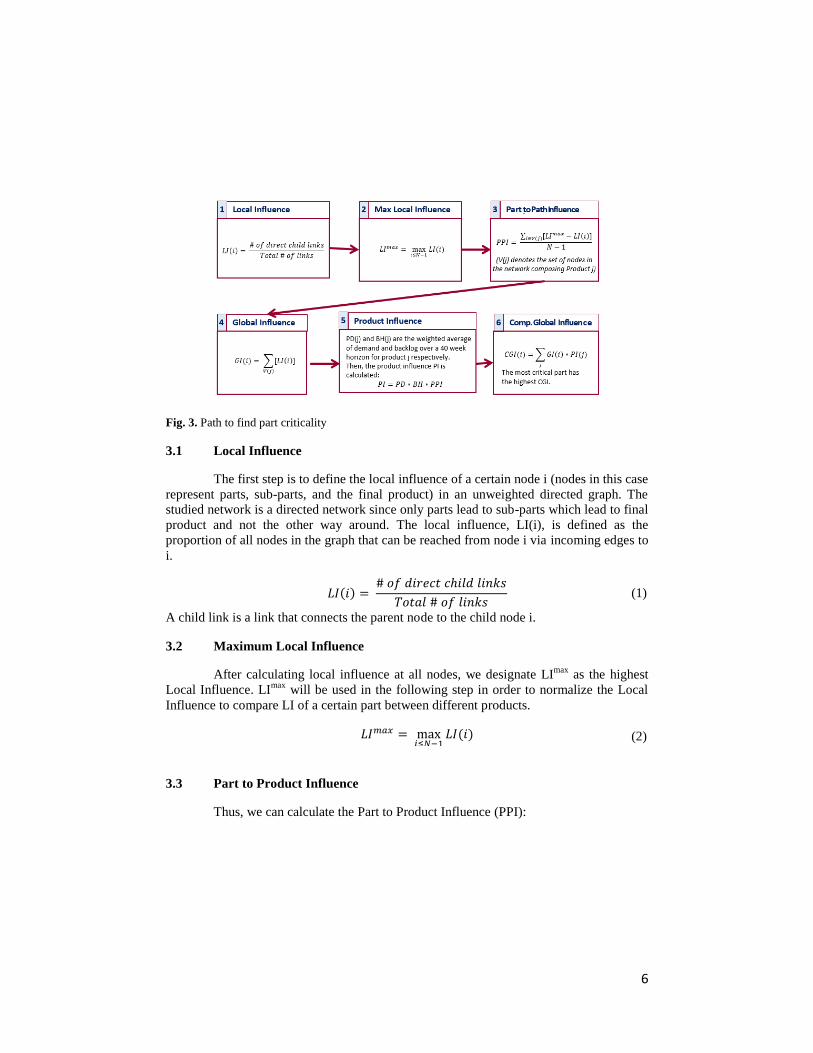
Fig. 3. Path to find part criticality
3.1 Local Influence
The first step is to define the local influence of a certain node i (nodes in this case
represent parts, sub-parts, and the final product) in an unweighted directed graph. The
studied network is a directed network since only parts lead to sub-parts which lead to final
product and not the other way around. The local influence, LI(i), is defined as the
proportion of all nodes in the graph that can be reached from node i via incoming edges to
i.
𝐿𝐼(𝑖) = # 𝑜𝑓 𝑑𝑖𝑟𝑒𝑐𝑡 𝑐ℎ𝑖𝑙𝑑 𝑙𝑖𝑛𝑘𝑠
𝑇𝑜𝑡𝑎𝑙 # 𝑜𝑓 𝑙𝑖𝑛𝑘𝑠 (1)
A child link is a link that connects the parent node to the child node i.
3.2 Maximum Local Influence
After calculating local influence at all nodes, we designate LImax
as the highest
Local Influence. LImax
will be used in the following step in order to normalize the Local
Influence to compare LI of a certain part between different products.
𝐿𝐼𝑚𝑎𝑥 = max𝑖≤𝑁−1
𝐿𝐼(𝑖) (2)
3.3 Part to Product Influence
Thus, we can calculate the Part to Product Influence (PPI):

7
𝑃𝑃𝐼 = ∑ [𝐿𝐼𝑚𝑎𝑥 − 𝐿𝐼(𝑖)]𝑖∈𝑉(𝑗)
𝑁 − 1 (3)
Note that V(j) denotes the set of nodes in the network composing Product j.
Calculating the PPI allows us compare the influence of the parts on different products.
3.4 Global Influence
The Global Influence of a Part in a Product can be calculated as follows:
𝐺𝐼(𝑖) = ∑[𝐿𝐼(𝑖)]
𝑉(𝑗)
(4)
In other words GI(i) represents the weight of each part in a product, bigger GI(i)
shows that part i is a major component of the product.
3.5 Product Influence and Backlog History
Calculate Product Influence and Backlog History of each product. This is an
important criterion to relate each product to the larger picture of the entire production
facility.
a. PD(j) is the weighted average of Demand over a 40 week horizon for
product j.
b. BH(j) is the weighted average backlog over a 40 week horizon for
product j.
c. Calculate the product Index PI which is the product of PPI, PD, and BH.
3.6 Compound Global Index
The last step is to find the Compound Global Index (CGI) that represents the part
criticality among all products. The CGI brings together the most important parts and
products to find the most critical parts to the production line. To calculate CGI for each
part, we use the following equation representing the sum-product of parts Global
Influence in each product and the Product Influence:
𝐶𝐺𝐼(𝑖) = ∑ 𝐺𝐼(𝑖) ∗ 𝑃𝐼(𝑗)
𝑗
(5)
The higher the parts CGI the more critical it is.
4 Inventory Model
4.1 Products
8
Six fictional products where created in order to apply the above-mentioned
algorithm. Each product consists of a set of parts, subsets, and sets. Note that subsets are
subassemblies of parts, and sets are subassemblies of parts and subsets. Creating multiple
products helps create a more realistic representation of a large final assembly production
facility.
4.2 Supply and Demand
In this model, both supply and demand are set as constant stochastic variables.
The distribution used is the uniform distribution. Furthermore, a finite planning horizon of
40 weeks is used.
4.3 Inventory and Backlog
In order to perform accurate long run simulations a model was created to help us
simulate a realistic scenario where inventory is not scrapped from period to another and
unmet demand is met in the upcoming periods. In create this model inventory from one
period to another is kept and unmet demand from one period to another is backlogged.
Inventory, I(n), and shortage, S(n), for a typical period n is calculated as follows:
𝐼(𝑛) = 𝐼(𝑛 − 1) + 𝑀𝑎𝑥[ 𝑄(𝑛) − 𝐷(𝑛), 0 ] 𝐼(0) = 0
(6)
𝑆(𝑛) = 𝑆(𝑛 − 1) + 𝑀𝑎𝑥[ 𝐷(𝑛) − 𝑄(𝑛), 0 ] 𝑆(0) = 0
(7)
Note that D(n) and Q(n) represent Demand and Supply during a period n respectively.
5 Discussion of Results
5.1 Primitive Model
A first model was developed with the following assumptions: surplus inventory
from one term to another is scrapped and backlog is not allowed, i.e., unmet demand
during a certain period is disregarded in the next period. For this model, all random
simulation led to same result, the same part was found to be critical. But, this model is not
logical since inventory can be kept from one period to another and unmet demand is
usually met in the upcoming periods. Hence, a more realistic model was developed in
order to take into consideration surplus inventory and backlog. The integration of these
parameters was already discussed in section 3.3.
5.2 Short Run Results

9
After embedding surplus inventory and backlog in the model, short run
simulation were run based on a 40-week horizon, and then long run results were
calculated. The long run results were based on a series of 10 short runs.
Many short run simulations were run, and every time a different part was found to be
critical. This randomization was boosted by the introduction of the 2 assumptions
discussed above. 5 runs are documented in the table below. For the first run, part N was
the most critical, for the second and fourth run, part D was the most critical, and followed
by part A. And for the third and fifth runs, Part A was the most critical followed by part
D. this can be explained by the probabilistic distributions used to represent both supply
and demand and their involvement in the calculation of the Product Index PI (section 3.5).
The short run simulations did not provide definitive results so the long-term model was
though of and put in place to see if a more consistent results could be obtained.
Table 1. Global Compound Index Calculation
Part Run 1 Run 2 Run 3 Run 4 Run 5 Long Run
Set 1 0.00377075 0.01551306 0.00278513 0.01262664 0.00974517 0.00762882
Set 2 0.01476691 0.00870292 0.00638843 0.01012183 0.01360051 0.01741808
Set 6 0.0147669 0.0004902 0.00369514 0 0.01181458 0.00638000
Set 7 0.0147669 0.0004902 0.00369514 0 0.01181458 0.00638000
Subset1 0.0037707 0.0155130 0.00547842 0.01473918 0.01065167 0.01095505
A 0.0336402 0.0340810 0.02179057 0.03309916 0.03720555 0.04400146
B 0.0037707 0.0237257 0.00278513 0.02063593 0.01062458 0.01534066
D 0.0223084 0.0479417 0.01465198 0.04549695 0.03487678 0.04371381
E 0.0037707 0.0155130 0.00547842 0.01473918 0.01065167 0.01095505
F 0.0076533 0.0314087 0.00763605 0.02532956 0.01957679 0.01576854
G 0.0147669 0.0087029 0.00908172 0.01223438 0.01450702 0.02074432
H 0.0148787 0.0090855 0.00845421 0.01019812 0.01368696 0.01792899
J 0.0147669 0.0087029 0.00369514 0.00800929 0.01269400 0.01409185
L 0.0148787 0.0008728 0.00576092 7.63E-05 0.01190104 0.00689090
M 0.0334164 0.0168612 0.00954791 0.0105903 0.0325542 0.01757349
N 0.0443007 0.0014706 0.01108543 0 0.03544376 0.019140008
O 0.0223084 0.03151636 0.00387883 0.02102819 0.02949191 0.01498517
5.3 Long Run Results
In order to develop the long run results, ten short run simulations were run and a
weighted average of the CGI for every part was calculated. This procedure was repeated
three times, and the same part was found to be critical. This shows that regardless of the
variations on the short term, on the long term, the same part will be critical. Table 1 shows
that the most critical part on the long run is A followed by the part D. The long run
10
simulation amortized the effect of the stochastic distribution of the demand and supply
leading to one part being critical on the long run.
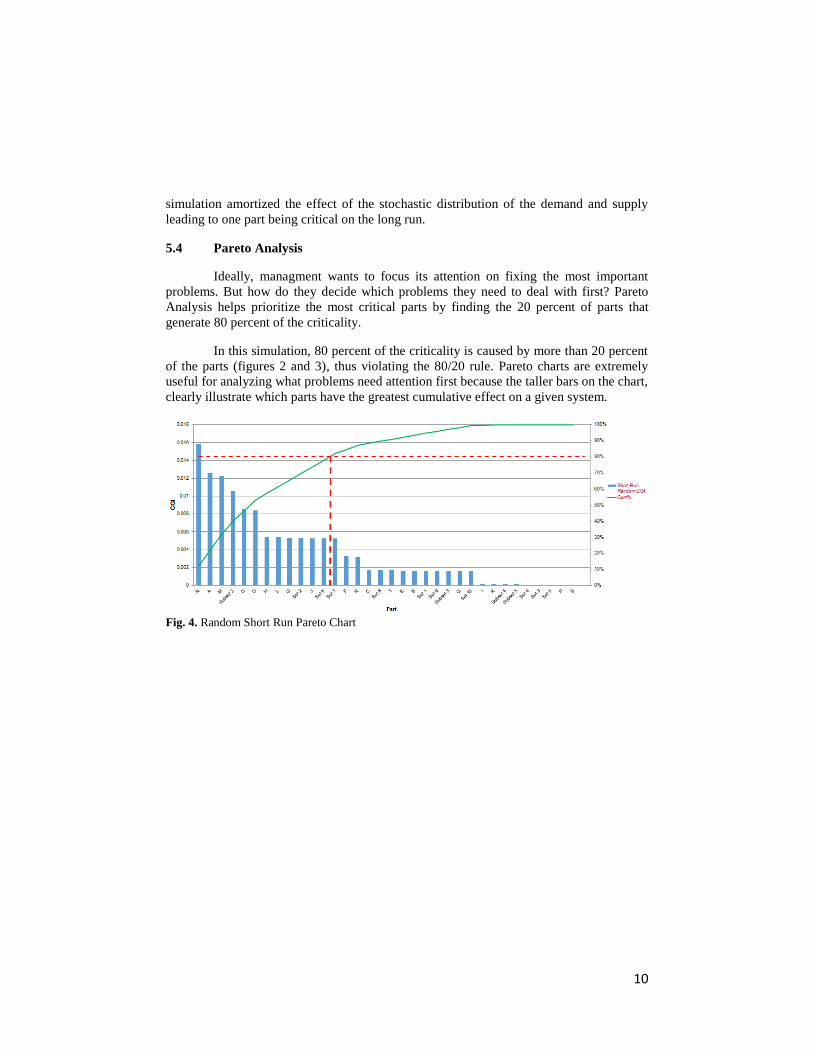
5.4 Pareto Analysis
Ideally, managment wants to focus its attention on fixing the most important
problems. But how do they decide which problems they need to deal with first? Pareto
Analysis helps prioritize the most critical parts by finding the 20 percent of parts that
generate 80 percent of the criticality.
In this simulation, 80 percent of the criticality is caused by more than 20 percent
of the parts (figures 2 and 3), thus violating the 80/20 rule. Pareto charts are extremely
useful for analyzing what problems need attention first because the taller bars on the chart,
clearly illustrate which parts have the greatest cumulative effect on a given system.
Fig. 4. Random Short Run Pareto Chart

11
Fig. 5. Long Run Pareto Chart
6 Industry Significance
Our next step is to create a program that optimizes inventory management by
identifying the criticality of parts to a company’s production. The program will allow a
company to insert data from their production line and the most important parts will then
be determined using a part criticality algorithm. These parts will then be given priority in
the pre-existing inventory management system.
The long-term goal for this project will be to create a wiki-like database for local
manufacturers that can create parts used in the aerospace industry. Many large companies
such as Boeing outsource many of the parts that go into their planes first from outside the
USA and second from outside of South Carolina. Therefore, if a part is defective there are
long shipping times and delays that may occur. Determining both the criticality of the
parts used on the assembly line and the parts in the products delivered could help reduce
these issues because local manufacturers could be identified in order to get the part
quickly. This would be a part of the actions taken in order to help engage local suppliers
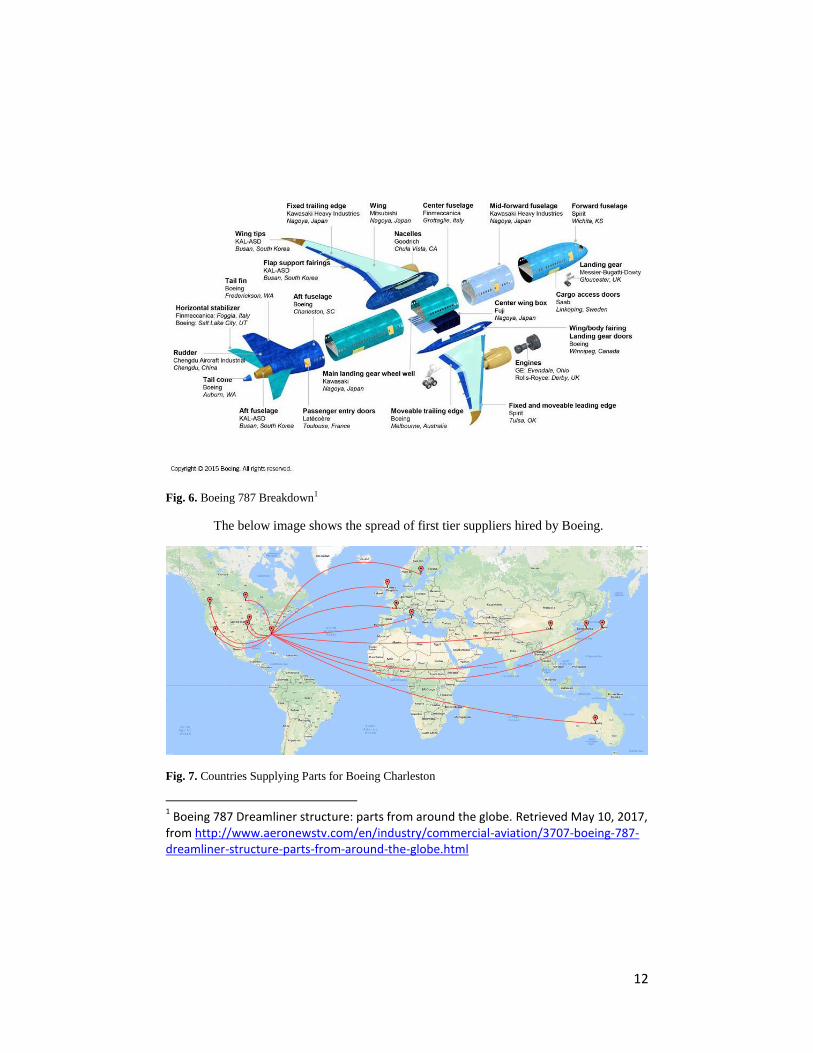
in the advancement of the aerospace market in South Carolina. The figure below shows
the breakdown of the Boeing 787 airplane along with the origin of each part.
The figure below shows the breakdown and origin of major parts of the Boeing
787 manufactured in Charleston, SC.
12
Fig. 6. Boeing 787 Breakdown1
The below image shows the spread of first tier suppliers hired by Boeing.
Fig. 7. Countries Supplying Parts for Boeing Charleston
1 Boeing 787 Dreamliner structure: parts from around the globe. Retrieved May 10, 2017,
from http://www.aeronewstv.com/en/industry/commercial-aviation/3707-boeing-787-dreamliner-structure-parts-from-around-the-globe.html

13
Figure 6 shows the available aerospace related companies in South Carolina.
These companies can be beneficial for Boeing since they are close to the plant in
Charleston leading to easier cooperation and less variability.
Fig. 8. Potential Aerospace Suppliers in South Carolina2
Our goal is to create a multi-echelon cooperative supply chain network within
South Carolina in order to increase the involvement of local aerospace related companies
in the manufacturing of the Dreamliner and hence decreasing the criticality among the
parts since suppliers will be more within reach.
7 Conclusion
In this paper, we determined the Part Criticality defined as Compound Global
Index. This index defined part criticality by utilizing the interdependence of different parts
as well as backorder and surplus quantities. A set of simple products having common
parts was employed in order to validate the algorithm. Results showed that on the short
term, criticality might vary form one term to another. This is mainly caused by the
2 South Carolina Department of Commerce

14
variability of demand and supply. Furthermore, this criticality was affected by the
inventory policy set in place for this simulation.
A further step would be to simulate other inventory policies in order to study
their effect on the part criticality. As for the long run results, it was realized that one part
was the most critical. This short run/long run differentiation helps the management have a
plan to tackle parts that are critical on the short term as well as creating long term
improvement policies to decrease the long term part criticality.
8 References
1. Aisyati, A., Jauhari, W. A., Rosyidi, C. N. (2013). Determination Inventory
Level for Aircraft Spare Parts Using Continuous Review Model. International
Journal of Business Research and Management (IJBRM), Volume (4) : Issue (1) :
2013.
2. Dekker, R., Kleijn, M., & Rooij, P. D. (1998). A spare parts stocking policy
based on equipment criticality. International Journal of Production Economics,
56-57, 69-77. doi:10.1016/s0925-5273(97)00050-9
3. Hausman, W. H., & Erkip, N. K. (1994). Multi-Echelon vs. Single-Echelon
Inventory Control Policies for Low-Demand Items. Management Science, 40(5),
597-602. doi:10.1287/mnsc.40.5.597
4. Lambert, D. M., & Cooper, M. C. (2000). Issues in Supply Chain Management.
Industrial Marketing Management, 29(1), 65-83. doi:10.1016/s0019-
8501(99)00113-3
5. Manzini, M., & Urgo, M. (2015). Critical Components Evaluation in
Manufacturing-To-Order Processes. Procedia CIRP, 37, 146-151.
doi:10.1016/j.procir.2015.08.046
6. Mones, E., Vicsek, L., & Vicsek, T. (2012). Hierarchy Measure for Complex
Networks. PLoS ONE, 7(3). doi:10.1371/journal.pone.0033799
7. Roda, I., Macchi, M., Fumagalli, L., & Viveros, P. (2014). A review of multi-
criteria classification of spare parts. Journal of Manufacturing Technology
Management, 25(4), 528-549. doi:10.1108/jmtm-04-2013-0038
8. Sandvig, C. and Reistad, A. (2000), “Safety stock decision support tool”,
Production and Inventory Management Journal, Vol. 41 No. 4, pp. 7-10
9. Stoll, J., Kopf, R., Schneider, J., & Lanza, G. (2015). Criticality analysis of spare
parts management: a multi-criteria classification regarding a cross-plant central
warehouse strategy. Production Engineering, 9(2), 225-235. doi:10.1007/s11740-
015-0602-2