development of a photo-fenton catalyst supported on ...pvf) film surface was functionalized by...
TRANSCRIPT
POUR L'OBTENTION DU GRADE DE DOCTEUR ÈS SCIENCES
acceptée sur proposition du jury:
Dr C. Wandrey, présidente du juryDr C. Pulgarin, directeur de thèse
Dr S. Hug, rapporteur Prof. T. Kohn, rapporteur Dr S. Malato, rapporteur
Development of a Photo-Fenton Catalyst Supported on Modified Polymer Films. Preparation, Characterization
and Implication for Water Decontamination by Solar Photocatalysis
THÈSE NO 4701 (2010)
ÉCOLE POLYTECHNIQUE FÉDÉRALE DE LAUSANNE
PRÉSENTÉE LE 28 MAI 2010
À LA FACULTÉ SCIENCES DE BASE
GROUPE DE GÉNIE ÉLECTROCHIMIQUE
PROGRAMME DOCTORAL EN CHIMIE ET GÉNIE CHIMIQUE
Suisse2010
PAR
Félicien MAZILLE

L’imagination est plus importante que le savoir. Albert Einstein

ACKNOWLEDGEMENTS
Je souhaiterais remercier chaleureusement tous ceux qui m’ont soutenu, directement ou
indirectement, pendant ce travail de thèse. Je ne pourrais peut être pas les mentionner tous mais
j’espère n’oublier personne ayant contribué activement à l’accomplissement de ce travail. Je
tiens particulièrement à exprimer ma gratitude aux personnes suivantes :
A César pour m’avoir fait confiance et m’avoir soutenu et encouragé au cours de ces années
enrichissantes.
Aux rapporteurs, Prof. Tamar Kohn, Dr. Stephan Hug, Dr Sixto Malato, ainsi qu’à la présidente
du jury Dr. Christine Wandrey pour avoir accepté de lire et d’évaluer cette thèse.
A mes amis et collègues Thomas Schoettl, Adrien Rollux, Dorothee Spuhler, Anna Serra qui
m’ont beaucoup aidé entre autre pour la partie expérimentale de ce travail.
Aux membres du groupe, entre autres Alejandro Moncayo, Ricardo Torres, Julian Rengifo,
Fabiola Mendez, et bien sur mon collègue et ami de longue date, Nikola Castillo, pour leur
collaboration scientifique ou technique et pour les moments partagés.
A Joël Kocher et John Kiwi, pour avoir relu et corrigé ce manuscrit, à Nicolas Xanthopoulos,
Pierre-Yves Pfirter et Robin Humphry-Baker pour leur aide lors de la caractérisation des
surfaces.
Aux participants du projet Européen comme Wolfgang Gernac, Sixto Malato, Anna Zapata,
Carla Sitori, Antonio Lopez et Giuseppe Mascolo pour leur collaboration.
A mes amis Jeroun, Momo, Samos, Ouiloum, Jojo, les filles des Olières et du pays de la Filière
et mes amis latinos et autres amis de Lausanne et d’ailleurs pour les bons moments de détente
passés ensemble et pour tout ce qu’ils m’ont apporté.
Finalement à mes parents Claire et Richard, toute ma famille, et bien sur ma femme Monica pour
leur soutient dans les moments difficiles, leur guidance, leur amour continu.
i

ii
SUMMARY
The work presented in this thesis is a part of the European project INNOWATECH. The global
objective of this project was to provide effective technological solutions for the treatment of
industrial wastewater, to propose new concepts in wastewater treatment with potential benefits
for the protection of the environment. In particular photo-assisted Fenton oxidation was
investigated. It is a promising technology to decontaminate industrial wastewater as it makes use
of the natural energy that provides the sun, abundant chemicals (iron ions and hydrogen
peroxide) and does not produce toxic waste. Apart from short detour about homogenous photo-
Fenton reaction (chapter 2) where the influence of pollutant physico-chemical properties on
reactivity is studied, this thesis focuses on photo-Fenton treatment using a new solid catalysis.
The immobilization of iron oxide on a suitable support is a strategy proposed to overcome the
practical limitation related to homogeneous photo-Fenton treatment (i.e. the limited operational
pH range and the problems caused by the separation of catalyst from the effluent). The
preparation and the surface characterization of new photo-Fenton catalysts based on iron oxide
supported on modified polymer films is described in chapters 3 and 4. The photocatalytic
activities of prepared materials were evaluated mainly toward organic pollutant degradation both
at laboratory (chapter 3-5) and at pilot (chapter 6) scales.
In detail, chapter 2 focuses on the effect of contaminant physico-chemical properties on the
reactivity via photo-assisted Fenton catalysis. Several para-substituted phenols were used in
order to cover a wide range of electronics effects. Many physico-chemical descriptors were
correlated with the initial Fenton and photo-Fenton degradation rates (r0). Electronic descriptors
such as calculated zero point energy (Ezero) and energy of the highest occupied orbital were
found to be the most adequate to predict Fenton and photo-assisted Fenton reactivity.
The preparation of iron oxide-coated polymer films is described in chapter 3. Polyvinyl fluoride
(PVF) film surface was functionalized by different methods, either by Vacuum-UV radiation,
radio-frequency plasma, photo-Fenton oxidation or TiO2 photocatalysis. These pre-treatments
were performed to increase iron oxide adhesion to polymer surface. Afterward the functionalized
polymers films were immersed in an aqueous solution for the deposition of iron oxide layer by
hydrolysis of FeCl3. The catalytic activities of resulting materials were compared during
iii

hydroquinone degradation in presence of H2O2 and under simulated solar light illumination. The
most efficient and stable catalyst obtained was prepared by means of TiO2 photocatalytic
functionalization of polymers followed by iron oxide coating (leading to so called Pf-TiO2-Fe
oxide), therefore this preparation procedure was selected in chapters 4-6.
Chapter 4 focuses on the study of the mechanisms involved during the preparation and use of Pf-
TiO2-Fe oxide. In particular, the modifications induced by TiO2 photocatalysis on polymer
surface such as oxygen group formation and deposition of TiO2 particles were characterized by
x-ray photoelectron spectroscopy (XPS), scanning electron microscopy (SEM), and UV-visible
spectrophotometry. The photocatalytic activity of Pf-TiO2-Fe oxide in presence of H2O2 and
under simulated solar light radiation was evaluated toward HQ degradation. The occurrence of
important synergistic effects between TiO2 and iron oxide was discussed. Finally, the effect of
preparation parameters on photocatalytic activity of Pf-TiO2-Fe oxide/H2O2/light system was
determined allowing the optimization of preparation procedure. Hence highly efficient
photocatalysts for hydroquinone degradation and E. Coli inactivation were obtained.
The degradation of hydroquinone and nalidixic acid (NA) mediated the system Pf-TiO2-Fe
oxide/H2O2/light was examined (chapter 5). The contribution of homogeneous photo-Fenton
oxidation in the degradation process was determined and the mechanisms involved in iron
leaching are discussed. Besides, the effect of operational parameters on degradation rates was
assessed. The rates are independent on initial pH and NaCl presence but were enhanced by
increasing temperature. Long-term stability of Pf-TiO2-Fe oxide was evaluated by repetitive
nalidixic acid degradation runs.
The adaptation of Pf-TiO2-Fe oxide to pilot scale in a compound parabolic collector (CPC) solar
photoreactor is described in chapter 6: solar photocatalytic degradation of phenol, nalidixic acid,
mixture of pesticides, and another of emerging contaminants, in water was investigated. The
influences of operational pH and pollutant structure on the degradation rates were evaluated. It
was found that compounds with chelating moieties (or carboxylic acids) were the most quickly
removed by Pf-TiO2-Fe oxide/H2O2/light and allowed the photo-Fenton catalyst to be efficient at
higher pH values.
iv
Keywords: Structure reactivity relationship, heterogeneous photo-Fenton, polymer surface modifications, solar water decontamination, solar material preparation, TiO2 photocatalysis, TiO2/iron oxide synergy.
RESUME Le travail présenté dans cette thèse fait partie du projet Européen INNOWATECH. L’objectif
global de ce projet a été de fournir des solutions technologiques efficaces pour le traitement des
eaux usées industrielles, de proposer de nouveaux concepts dans le domaine du traitement des
eaux usées avec des bénéfices potentiels pour la protection de l’environnement. L’oxydation par
la réaction Fenton photo-assistée (photo-Fenton) a été étudiée en particulier. Il s’agit une
technologie prometteuse pour décontaminer les eaux usées industrielles car elle utilise l’énergie
naturelle offerte par le soleil, des produits chimiques abondants (des ions fer et de l’eau
oxygénée) et ne produit pas de déchets toxiques. Mis à part un court détour au sujet de la
réaction photo-Fenton homogène (chapitre 2), où l’influence des propriétés physico-chimiques
des polluants sur la réactivité a été étudiée, cette thèse se concentre sur le traitement photo-
Fenton utilisant un nouveau catalyseur solide. L’immobilisation d’oxyde de fer sur un support
est une stratégie proposée pour surmonter les limitations pratiques liées au traitement photo-
Fenton homogène (i.e. le domaine de pH limité où la réaction est efficace et les problèmes
induits par la séparation du catalyseur de l’effluent). La préparation et la caractérisation d’un
nouveau catalyseur constitué d’oxyde de fer déposé sur des films polymériques modifiés est
décrit aux Chapitre 3 et 4. L’activité photocatalytique des matériaux préparés a été évaluée
principalement en dégradant des polluants organiques à l’échelle du laboratoire (chapitre 3-5)
mais aussi à plus grande échelle (chapitre 6).
Plus précisément le chapitre 2 traite de l’influence des propriétés physico-chimiques des
polluants sur leur réactivité lors du traitement photo-Fenton. Plusieurs phénols para-substitués
ont été utilisés pour couvrir une large gamme d’effets électroniques. De nombreux paramètres
physico-chimiques ont été corrélés avec les vitesses de dégradation initiales lors des traitements
Fenton et photo-Fenton. Les paramètres électroniques tels que l’énergie du point zéro, l’énergie
de la plus haute orbitale occupée ont été les plus adéquats pour prédire la réactivité Fenton et
photo-Fenton.
La préparation de polymères couverts d’oxyde de fer est décrite au chapitre 3. Des films de
polyvinyle fluorure ont été fonctionnalisés par différentes méthodes : par irradiation ultraviolette
du vide ; plasma ; oxydation photo-Fenton ; photocatalyse utilisant TiO2. Ces prétraitements ont
v
été effectués pour favoriser l’adhésion d’oxyde de fer sur la surface des polymères. Pour la
déposition d’oxyde de fer, les films polymériques fonctionnalisés ont été immergés dans une
solution aqueuse où s’est déroulée l’hydrolyse du FeCl3. Les activités catalytiques des matériaux
préparés ont été comparées pendant la dégradation de l’hydroquinone en présence d’eau
oxygénée et sous illumination solaire simulée. Les matériaux les plus efficaces et les plus stables
ont été obtenus en fonctionnalisant des polymères par photocatalyse au TiO2 puis en y déposant
l’oxyde de fer (conduisant au matériau appelé Pf-TiO2-Fe oxyde). Par conséquent cette procédure
de préparation a été sélectionnée pour les chapitres 4-6.
Le chapitre 4 se concentre sur l’étude des mécanismes impliqués lors de la préparation du Pf-
TiO2-Fe oxyde. En particulier, les modifications induites à la surface des polymères lors du
traitement photocatalytique au TiO2, telles que la formation de groupes oxygénés et la déposition
de particules de TiO2, ont été caractérisées par spectroscopie photoélectronique à rayonnements
X (XPS), par microscopie électronique à balayage (SEM), et par spectrophotométrie UV-visible.
L’activité catalytique du Pf-TiO2-Fe oxyde a été évaluée en dégradant de l’hydroquinone en
présence d’eau oxygénée et sous illumination solaire simulée. L’occurrence d’effets synergiques
importants entre le TiO2 et l’oxyde de fer a été étudiée. Finalement l’influence des paramètres de
préparation sur l’activité photocatalytique du système Pf-TiO2-Fe oxyde/H2O2/lumière a été
déterminée ce qui a permis d’optimiser la procédure de préparation. Ainsi des catalyseurs
efficaces pour dégrader l’hydroquinone et inactiver E. Coli ont été obtenus.
La dégradation de l’acide nalidixique et de l’hydroquinone par le système Pf-TiO2-Fe
oxyde/H2O2/lumière a été examinée (chapitre 5). La contribution de la réaction photo-Fenton
homogène dans le procédé de dégradation a été déterminée et les mécanismes impliqués lors de
la dissolution des ions fer ont été discutés. Par ailleurs, l’effet des paramètres de réaction sur les
vitesses de dégradation ont été évalués. Il a été observé que la vitesse de dégradation est
indépendante du pH initial et de la présence de NaCl mais augmente avec la température. La
stabilité du Pf-TiO2-Fe oxyde a été évaluée en répétant des dégradations d’acide nalidixique.
Au chapitre 6 est décrite l’utilisation du Pf-TiO2-Fe oxyde à plus grande échelle dans des photo-
réacteurs paraboliques pour la dégradation photocatalytique solaire de phénol, d’acide
nalidixique, un mélange de pesticides et un autre mélange de polluants émergents. L’influence
du pH et de la structure des polluants sur les vitesses de dégradation a été étudiée. Il a été
observé que les polluants contenant des groupes chélates (ou des acides carboxyliques) ont été
vi

plus rapidement éliminés et ont permis au catalyseur d’être plus efficace a des valeurs de pH
élevées.
Mots clefs: Relation structure réactivité, photo-Fenton hétérogène, modifications de la surface des polymères, décontamination de l’eau avec le soleil, préparation de matériaux avec le soleil, photocatalyse au TiO2, synergie TiO2/oxyde de fer.
vii

viii
TABLE OF CONTENTS
ACKNOWLEDGEMENTS i
SUMMARY iii
RESUME v
TABLE OF CONTENTS ix
LIST OF SYMBOLS xv
LIST OF FIGURES ixx
LIST OF TABLES xxv
1. INTRODUCTION 1
1.1. Overview 1
1.2. Background 3
1.2.1. Advanced Oxidation Processes (AOP) 3
1.2.2. Semiconductor photocatalysis 4
1.2.2.1. Semiconductors properties 4
1.2.2.2. TiO2 photocatalysis 6
1.2.3. Homogeneous photo-Fenton 9
1.2.3.1. Aquatic iron chemistry 9
1.2.3.2. Fenton chemistry 10
1.2.3.3. Fenton reaction in presence of inorganic and organic substances 11
1.2.3.4. Photo-assisted Fenton reaction 15
1.2.4. Photo-Fenton reaction using iron from solid source 17
1.2.4.1. Fenton reaction with iron oxides 17
ix
1.2.4.2. Iron oxide photocatalysis 18
1.2.4.3. Photo-Fenton reaction using iron from oxides 18
1.2.4.4. Photo-Fenton reaction with iron from other solid sources 20
1.2.4.5. Photo-Fenton reaction using designed heterogeneous catalyst. 21
1.3. Objectives 24
1.4. Studied water contaminants 24
1.4.1. Substituted phenols 24
1.4.2. Model contaminants 25
1.4.3. Real pollutants 25
1.5. References 28
2. PHYSICO-CHEMICAL PROPERTIES AND PHOTOREACTIVITY
RELATIONSHIP IN PHOTOASSISTED FENTON SYSTEM 37
2.1. Introduction 37
2.2. Experimental 38
2.2.1. Chemicals 38
2.2.2. Photoreactor and irradiation procedures 39
2.2.3. Analysis of the irradiated solutions 40
2.3. Results and discussions 41
2.3.1. Preliminary experiments 41
2.3.1.1. Selection of Fenton reactant concentration 41
2.3.1.2. UV-visible spectrum measurements 42
2.3.1.3. Photolysis experiments 42
2.3.1.4. Fenton degradation of para-substituted phenols 43
2.3.2. Photo-Fenton experiments 45
2.3.3. Quantitative structure reactivity relationship 47
2.3.3.1. QSRR for Fenton degradation 48
2.3.3.2. QSRR for photo-Fenton degradation 49
2.3.4. Evaluation of biodegradability of photo-Fenton treated solution 49
2.4. Conclusions 51
2.5. References 51
x
3. SYNTHESIS OF IRON OXIDE COATED FUNCTIONALIZED POLYMERS :
EFFECT OF SURFACE TREATMENT ON PHOTOCATALYTIC ACTIVITY 55

3.1. Introduction 55
3.1.1. Radiative treatments of polymer surfaces
3.1.1.1. Plasma treatments 56
3.1.1.2. Vacuum UV (V-UV) treatments 57
3.1.2. Photocatalytic treatments of polymer surfaces 58
3.2. Material and method 59
3.2.1. Chemicals 59
3.2.2. Photocatalyst preparation 59
3.2.2.1. Functionalization with radio frequency Plasma (RF-P) 60
3.2.2.2. Functionalization with V-UV 60
3.2.2.3. Functionalization with photo-Fenton 60
3.2.2.4. Functionalization with TiO2 photocatalysis 61
3.2.3. Photoreactor and irradiation procedure 61
3.2.4. Analysis if the irradiated solutions 62
3.2.5. Catalyst characterization by UV-visible spectrophotometry 62
3.3. Results and discussions 63
3.3.1. Effect of functionalization on photocatalytic activity of PVFf-Fe oxide 63
3.3.2. Effect of functionalization on long-term stability of PVFf-Fe oxide 66
3.4. Conclusions 68
3.5. References 69
4. TiO2 AND IRON OXIDE COATED POLYMERS: CHARACTERIZATION,
OPTIMISATION, SYNERGITIC PHOTO-ACTIVITY. 71
4.1. Introduction 71
4.2. Experimental 72
4.2.1. Chemicals 72
4.2.2. Photocatalyst preparation 72
4.2.3. Photoreactor and irradiation procedure 73
4.2.4. Analysis of the irradiated solutions 73
4.2.5. Bacterial strain and growth media 73
xi
4.2.6. Photocatalyst characterization 75
4.2.6.1. X-ray photoelectron spectroscopy (XPS) 75

4.2.6.2. Scanning electron spectroscopy (SEM) 76
4.2.6.3. UV-Visible Spectrophotometry 77
4.3. Results and discussions 77
4.3.1. PVFf-TiO2-Fe oxide characterization 77
4.3.1.1. XPS study of the influence of pH on TiO2 photocatalytic surface
functionalization-deposition (PSFD) treatment of polyvinyl fluoride film 77
4.3.1.2. XPS studies of iron species and overall atomic profile of the PVFf-TiO2-Fe
oxide photocatalyst 81
4.3.1.3. Scanning electron microscopy (SEM) 83
4.3.1.4. UV-Visible absorbance study 84
4.3.2. Photocatalytic activity 85
4.3.3. Synergistic effects 89
4.3.4. Optimization: effect of preparation parameters on the activity of catalysts
92
4.3.4.1. Effect of polymer film nature 92
4.3.4.2. Effect of the pH during TiO2 PSFD treatment 94
4.3.4.3. Effect of TiO2 concentration used for the TiO2 PSFD treatment 95
4.3.4.4. Effect of iron oxide coating conditions 96
4.3.4.5. Effect of preparation on Bacterial inactivation 97
4.4. Conclusions 99
4.5. References 100
5. TiO2 AND IRON OXIDE COATED POLYMERS: INFLUENCE OF REACTION
PARAMETERS ON PHOTOCATALYTIC ACTIVITY , LONG-TERM STABILITY
103
5.1. Introduction 103
5.2. Experimental 104
5.2.1. Chemicals 104
5.2.2. Photocatalyst preparation 104
5.2.3. Photoreactor and irradiation procedure 104
xii
5.2.4. Analysis of the irradiated solutions 105
5.2.5. Photocatalyst characterization. 105
5.3. Results and discussions 105
5.3.1. Photocatalytic activity toward hydroquinone and nalidixic acid degradation
105
5.3.2. Iron leaching and homogeneous photocatalytic contribution 107
5.3.3. Initial activation of PVFf-TiO2-Fe oxide photocatalyst 109
5.3.4. Correlations between surface modifications and activation processes 110
5.3.4.1. X-ray photoelectron spectroscopy (XPS) analysis of PVFf-TiO2-Fe oxide
110
5.3.4.2. Secondary electron microscopy (SEM) 112
5.3.4.3. Discussion about initial activation of PVFf-TiO2-Fe oxide and increase of
synergistic effects 113
5.3.5. Effect of reaction conditions on photocatalytic activity 113
5.3.5.1. Effect of pH 113
5.3.5.2. Effect of temperature 115
5.3.5.3. Effect of NaCl 117
5.3.6. Long term Stability of PVFf-TiO2-Fe oxide 118
5.3.7. Reversible iron dissolution 119
5.4. Conclusions 120
5.5. References 121
6. SCALE UP: FIELD SOLAR DEGRADATION OF PESTICIDES AND EMERGING
WATER CONTAMINANTS 123
6.1. Introduction 123
6.1.1. Solar resource 113
6.1.2. Solar collector technology 125
6.1.2.1. Concentrating collectors 125
6.1.2.2. Non concentrating collectors 126
6.1.2.3. Compound parabolic collectors (CPC) 126
6.2. Experimental 128
6.2.1. Chemicals 128
xiii
6.2.2. Photocatalyst preparation 129
6.2.3. Photo-reactor and irradiation procedure 129

6.2.4. Analysis of the irradiated solutions 130
6.2.5. Photocatalyst characterization 131
6.3. Results and discussions 131
6.3.1. Photocatalytic degradation of single compounds 131
6.3.2. Photocatalytic degradation of compound mixtures 134
6.3.2.1. Pesticide mixture 134
6.3.2.2. Emerging contaminants mixture 136
6.3.3. Long-term stability 138
6.4. Conclusions 141
6.5. References 142
7. CONCLUSIONS AND PERSPECTIVES. 145
APPENDICES
I -Electronic descriptors (EHOMO, E1/2, σ, EZERO) as a function of initial rates of
degradation (rF0) for the Fenton reaction and linear fittings (p-Cl excluded) 151
II- Electronic descriptors (EHOMO, E1/2, σ, EZERO) as a function of initial rates of
degradation (rpf0) for the photo-Fenton reaction and linear fittings (p-Cl and p-
CHO excluded) 152
CURRICULUM VITAE 153
xiv
LIST OF SYMBOLS
A Electron acceptor
AA Aliphatic acid
AOP Advanced oxidation processes
BE [eV] Binding energy
BOD [mg/L] Biological oxygen demand
C Correction factor
c [m/s] Speed of light
CB Conduction band
CFU Colony forming units
CPC Compound parabolic collectors
CPS Counts per second
D Electron donor
DOC [mg/L] Dissolved organic carbon
e-cb Conduction band electron
Ebg [eV] Band gap energy
EHOMO [eV] Energy of the highest occupied molecular orbital
ESCA Electronic spectroscopy for chemical analysis
E1/2 [V] Experimental half wave potential
Ezero [eV] Calculated zero point corrected energy
[Fe]d [mg/L] Dissolved iron concentration
HQ Hydroquinone
HPLC High performance liquid chromatography
h Planck constant
ht Homogeneous percentage
h+vb Valence band hole
xv
k Rate constants
K Acidity constant
Kow 1-octanol/water partition coefficient
L Mono- and dicarboxylic acids
LB Luria-bertani
λ [nm] Wavelength
λmax [nm] Experimental maximal absorption wavelength
ν [Hz] Frequency
NHE [V] Normal hydrogen electrode
PCA Plate count agar
P-FO Photo-Fenton oxidation
p-H Phenol
p-NO2 4-nitrphenol
p-Cl 4-chlorophenol
P-CHO 4-hydroxybenzaldehyde
p-OCH3 4-methoxyphenol
p-OH 4-hydroxyphenol
P Polymer film
Pf Functionalized polymer film
P-Fe oxide Iron oxide coated polymer film
PfTiO2-Fe oxide Iron oxide and titanium oxide supported on Pf
PE Polyethylene
PET Polyethylene terephtalate
PTC Parabolic-trough concentrators
PSA Plataforma solar de Almeria
PSFD Photocatalytic surface functionalization deposition
PVF Polyvinyl fluoride
pKa Acidity constant
QSRR Quantitative structure-reactivity relationships
R Organic compound
R0 [μmol/min] Initial rate of degradation
xvi
Rads Adsorbed organic compound
RF-P Radiofrequency plasma
S Synergistic factor
σ Hammett constants
SDT Self degradation test
SEM Scanning electron microscopy
t30W [min] Normalized illumination time
Ti-PC TiO2 photocatalysis
TOC [mg/L] Total organic carbon
UV Ultra-violet
VB Valence band
VUV Vacuum ultraviolet
XPS X-ray photoelectron spectroscopy
xvii

xviii

LIST OF FIGURES
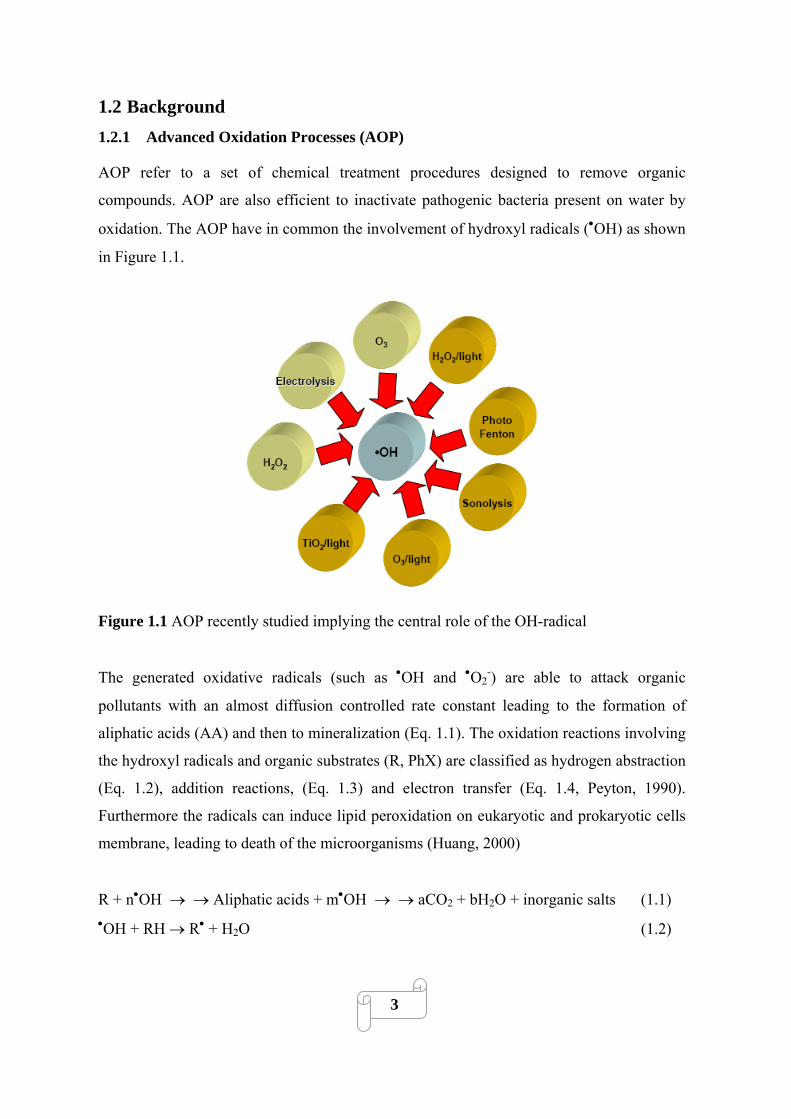
Figure 1.1 AOP recently studied implying the central role of the OH-radical…………………...3
Figure1.2 Fate of electrons and holes within a spherical particle of semiconductor in the
presence of an electron acceptor (A) and donor (D), (Ollis, 1993)……………………………….5
Figure 1.3 TiO2 semiconductor photocatalysis process: scheme showing some photochemical
and photophysical events that might be taking place on an irradiated semiconductor particle.......7
Figure 1.4 Ferric ion species present in aquesous solution at different pH at a concentration of
20 mg/L, calculated with equilibrium constants (Flynn, 1984), T = 20 °C……………………...10
Figure 1.5 Para-substituted phenols (X = NO2, Cl, H, CHO, H, OCH3, OH)…………………..25
Figure 1.7 Chemical structure of nalidixic acid……………………………………………..…..26
Figure 1.8 Chemical structure and name of the pesticides studied………...………..…….…….26
Figure 1.9 Names, structures and properties of emergent organic pollutants chosen for pilot scale
study……………………………………………………………………………………………...27
Figure 2.1 Transversal cut and characteristics of the photo-reactor…………………………….39
Figure 2.2 Photocatalytic setup: (1) tanks; (2) peristaltic pump; (3) photo-reactors; (4) solar
simulator…………………………………………………………………………………………40
Figure 2.3 Substance (unfilled symbols) and TOC (filled symbols) removal during photo-Fenton
degradation of phenol (1.8 mM) for different Fe2+ concentrations (- - : 10 mg/L; - - : 3 mg/L;-
▲- : 1 mg/L) in presence of H2O2 (15 mM). ……………………………………………………41
Figure 2.4 Evolution of para-substituted phenols concentration during photolysis in presence of
Fe2+ (3 mg/L) at pH = 3…………………………………………………………….……………42
Figure 2.5 Evolution of p-Cl concentration during degradation in presence of Fe2+ (3 mg/L) at
pH = 3 under: (a) irradiation; (b) dark conditions. ……………………………………………...43
xix
Figure 2.6 Evolution of para-substituted phenols concentration during Fenton degradation in
presence of Fe2+ (3 mg/L) at pH = 3 with H2O2 (i) 1.8 mM; (ii) 7.2 mM…………….…………44
Figure 2.7 Evolution of para-substituted phenols concentration, during photo-Fenton
degradation in presence of Fe2+ (3 mg/L) at pH = 3 with H2O2 7.2 mM..……………………….45
Figure 2.8 TOC removal during para-substituted phenols photo Fenton degradation in presence
of Fe2+ at pH = 3 with H2O2 15 mM for (i) six carbon constituted compounds; (ii) seven carbon
constituted compounds…………………………………………………………………………..46
Figure 3.1 Scheme of catalyst preparation strategy (not to the scale)…………………………..59
Figure 3.2 Transversal cut and characteristics of the photo-reactor…………………………….61
Figure 3.3. Evolution of (i) HQ concentration, (ii) TOC and (iii) [Fe]d during degradation of
0.18 mM of HQ at initial pH 5.7, in presence of 1.6 mM H2O2, 75 cm2 of catalyst under solar
simulation (light): (o) photolysis; (a) PVF-Fe-oxide; (b) PVFV-UV-Fe-oxide and PVFP-FO-Fe
oxide*; (c) PVFRF-P-Fe oxide; (d) PVFTi-PC-Fe-oxide. The traces represent an average over three
runs. *Due to similar result obtained for PVFV-UV-Fe-oxide and PVFP-FO-Fe oxide trace (b)
represent the results relative to these two catalysts……………………………………………...63
Figure 3.4. UV-vis absorption spectrum of (a) PVF-Fe oxide, PVFV-UV-Fe oxide, PVFP-FO-Fe
oxide; (b) PVFRF-P-Fe oxide; (c) PVFTi-PC-Fe oxide……………………………………………..65
Figure 3.5 TOC removal during repetitive HQ photocatalytic degradations by (i) PVF-Fe oxide,
(ii) PVFV-UV-Fe oxide, (iii) PVFRF-P-Fe oxide and (iv) PVFTi-PC-Fe oxide (experimental
conditions: 0.18 mM of HQ, solar simulation, initial pH 5.7, H2O2 1.6 mM)…………………...67
Figure 4.1 X-ray photoelectron spectra of: (i) C (1s); (ii) O (1s); (iii) F (1s) core level
photoelectron spectra of (a) PVF; (b) PVF after a TiO2-PSFD treatment at pH 11; (c) PVF after a
TiO2 PSFD treatment at pH 3; (d) PVFf-TiO2-Fe-oxide (TiO2 PSFD treatment at pH 3)……….78
Figure 4.2 X-ray photoelectron spectra of Ti (2p) in (a) PVF after a TiO2 PSFD treatment at pH
3; (b) PVF after a TiO2 PSFD treatment at pH 11……………………………………………….80
xx

Figure 4.3 Mechanistic proposition for TiO2 photocatalytic surface functionalization-deposition
as a function of pH……………………………………………………………………………….80
Figure 4.4 Fe (2p) core level photoelectron spectra of PVFf-TiO2-Fe oxide……………………81
Figure 4.5 Depth profile of PVFf-TiO2-Fe oxide (PSFD treatment at pH 3)……………………82
Figure 4.6 Scanning electron microscopic images of: (a) PVF; (b) PVFf-TiO2 prepared at pH 5
(external side); (c) PVFf-TiO2 prepared at pH 5 (internal side); (d)-(e) PVFf-TiO2-Fe oxide
prepared at pH 5………………………………………………………………………………….84
Figure 4.7 UV-Visible absorption spectrum of: (a) PVFf-TiO2; (b) PVF-Fe oxide; (c) PVFf-
TiO2-Fe oxide; and (insert) photography of the three materials…………………………………85
Figure 4.8 Degradation of 0.18 mM of HQ, initial pH: 5.7, 75 cm2 of heterogeneous
photocatalyst 1.6 mM H2O2 under solar simulation: (a) bare light/dark adsorption; (b) PVF-
TiO2/light; (c) PVFf-TiO2-Fe oxide/light; (d) PVFf-TiO2/H2O2/light; (e) PVFf-TiO2-Fe-
oxide/H2O2; (f) PVF-Fe oxide/H2O2/light; (g) PVFf-TiO2-Fe oxide/H2O2/light. The traces
represent an average of three consecutive runs using the same photocatalysts (first run not
included)........................................................................................................................................86
Figure 4.9 TOC removal of 0.18 mM of HQ, initial pH: 5.7, 75 cm2 of heterogeneous
photocatalyst 1.6 mM H2O2 under solar simulation: (a) PVFf-TiO2-Fe oxide/H2O2; (b) Fe2+ (0.3
mg/L)/H2O2/light; (c) PVF-Fe oxide/H2O2/light; (d) PVFf-TiO2-Fe oxide/H2O2/light. The traces
represent an average of three consecutive runs using the same photocatalysts (first run not
included)…………………………………………………………………………………………87
Figure 4.10 Schematic representation of possible synergistic photocatalytic action in the system
PVFf-TiO2-Fe oxide/H2O2/light: (i) under visible light irradiation and (ii) under ultraviolet light
irradiation………………………………………………………………………………………...91
Figure 4.11 Structure of polymer substrate used: from left to right polyethylene terephtalate
(PET), polyethylene (PE) and polyvinyl fluoride (PVF)………………………………………...92
Figure 4.12 Evolution of (i) TOC, (ii) HQ concentration and (iii) [Fe]d during degradation of
0.18 mM of HQ at initial pH 5.7, in presence of 1.6 mM H2O2, 75 cm2 of catalyst (PEf-TiO2-Fe
oxide, PVFf-TiO2-Fe oxide, PETf-TiO2-Fe oxide) under solar simulation for different polymeric
substrates. The traces represent an average over three runs……………………………………..93
xxi

Figure 4.13 TOC removal of 0.18 mM of HQ, initial pH: 5.7, 75 cm2 of heterogeneous
photocatalyst 1.6 mM H2O2 under solar simulation: (a) PVF-Fe-oxide/H2O2/light; (b) PVFf-
TiO2–Fe oxide (PSFD treatment at pH 11)/H2O2/light; (c) PVFf-TiO2 Fe oxide (PSFD treatment
at pH 3)/H2O2/light………………………………………………………………………………95
Figure 4.14 Effect of TiO2 concentration (used for previous PSFD treatment of PVF) on HQ
mineralization (of 0.18 mM HQ, initial pH = 5.7, PVFf-TiO2-Fe oxide 75 cm2, H2O2 1.6 mM
under solar simulation): (a) first; (b) second consecutive HQ degradation……………………...96
Figure 4.15 Photography of PETbf-TiO2-Fe oxide used in this study…………………………...97
Figure 4.16 Inactivation of E. coli on PET bottle reactors (experimental conditions presented in
Table 4.3)………………………………………………………………………………………...98
Figure 5.1 Degradation of 0.18 mM of HQ, initial pH 5.7, 30 °C, 1.6 mM H2O2, 75 cm2 of
heterogeneous photocatalyst under solar simulation (a) TOC removal by 0.3 mg/L
Fe2+/H2O2/light; (b) TOC removal by PVF-Fe oxide/H2O2/light; (c) TOC removal by PVFf-TiO2-
Fe oxide/H2O2/light; (d) HQ degradation by PVFf-TiO2-Fe oxide/H2O2/light. The traces
represent an average over 3 runs………………………………………………………………..106
Figure 5.2 Degradation of 0.18 mM of NA, initial pH 6.5, 30 °C, 3.2 mM H2O2, 75 cm2 of PVFf-
TiO2-Fe oxide under solar simulation (a) TOC removal by 0.3 mg/L Fe2+/H2O2/light; (b) TOC
removal by PVFf-TiO2-Fe oxide/H2O2/light; (c) NA degradation by PVFf-TiO2-Fe
oxide/H2O2/light. The traces represent average over 3 runs……………………………………106
Figure 5.3 Evolution of dissolved iron concentration during degradation of 0.18 mM of
pollutant, Initial pH 5.7, 30 °C, 75 cm2 of heterogeneous photocatalyst under solar simulation (a)
HQ, PVF-Fe oxide/H2O2(1.6 mM)/light; (b) HQ, PVFf-TiO2-Fe oxide/H2O2(1.6 mM)/light; (c)
NA, PVFf-TiO2-Fe oxide/H2O2(3.2 mM)/light. The traces represent average dissolved iron over
3 runs……………………………………………………………………………………………107
Figure 5.4 Evolution of (i) normalized TOC concentration and (ii) Dissolved iron concentration
during the two first photocatalytic mineralization of HQ: (a) first; (b) second run (experimental
conditions: 0.18 mM HQ, initial pH 5.7, 30 °C, 1.6 mM H2O2, 75 cm2 of heterogeneous
photocatalyst under solar simulation)…………………………………………………………..109
xxii
Figure 5.5 F(1s) photoelectron spectra of (a) PVFf-TiO2-Fe oxide as prepared (b) PVFf-TiO2-Fe
oxide after three runs…………………………………………………………...………………111
Figure 5.6 Scanning electron microscopic images of PVFf-TiO2-Fe oxide (i)-(ii) before and (iii)-
(iv) after three runs……………………………………………………………………………..112
Figure 5.7 Variation of (i) HQ and TOC normalized concentrations (ii) pH and (iii) [Fe]d during
degradation of 0.18 mM of HQ, 1.6 mM H2O2, 30 °C, 75 cm2 of PVFf-TiO2 Fe oxide under solar
simulation and at different initial pHs.(a) 3.4, (b) 5.8, (c) 7.1…………………………….……114
Figure 5.8 Variation of (i) HQ and TOC normalized concentrations and (ii) dissolved iron
concentration during degradation of 0.18 mM of HQ, 1.6 mM H2O2, initial pH 5.7, 75 cm2 of
PVFf-TiO2-Fe-oxide under solar simulation and at different temperatures: (a) 55 °C, (b) 40 °C,
(c) 30 °C……………………………………………………...…………………………………116
Figure 5.9 Variation of HQ and TOC normalized concentrations during degradation of 0.18 mM
NA by (i) 75 cm2 of PVFf-TiO2-Fe oxide, (ii) 2 mg/L Fe2+: TOC removal (a) in presence and (b)
without NaCl; NA degradation (c) in presence and (d) without NaCl. (experimental conditions at
initial pH 6.5, 30 °C, 3.2 mM H2O2, 0.86 M NaCl under solar simulation)……………………118
Figure 5.10 Repetitive NA degradation (experimental conditions: 0.18 mM NA, 30 °C, solar
simulation, initial pH = 6.5, PVFf-TiO2-Fe oxide 75 cm2, H2O2 3.2 mM)……………..………119
Figure 6.1 solar radiation spectrums from 0.2 to 4.5 μm………………………………………124
Figure 6.2 Air mass and solar components…………………………………………………….125
Figure 6.3. CPCs: Collector design and radiation geometry profiles………………………….127
Figure 6.4 Picture of PVFf-TiO2-Fe oxide films in the CPC photoreactor…………………….130
Figure 6.5. DOC and pH during phenol degradation (0.7 mM phenol, 6.2 mM H2O2) (i) first and
(ii) second set of experiments, (iii) DOC and pH during nalidixic acid degradation (0.13 mM
nalidixic acid 3.1 mM H2O2), and (iv) evolution of H2O2 consumption. The degradations were
mediated by PVFf-TiO2-Fe oxide under solar light…………………………………………….133
xxiii
Figure 6.6 Normalized pesticide concentrations (i), DOC (ii) during degradation mediated by
PVFf-TiO2-Fe oxide in presence of 3.1 mM H2O2 (constant) under sunlight (DOC0 = 50
mg/L)…………………..………………………………………………..……………………...134
Figure 6.7 Emerging contaminant concentrations during first (i)-(iii) and second (iv)-(vi)
consecutive degradation tests mediated by PVFf-TiO2-Fe oxide under solar light and in presence
of 3.1 mM (constant) H2O2……………………………………………………………………..137
Figure 6.8 Appearance of PVFf-TiO2-Fe oxide after 20 days of experiments: (i) effect of light on
changes in appearance; (ii) Almost undamaged piece; (iii) severely damaged piece…….……139
Figure 6.9 Fe (2p) core level photoelectron spectrum of as-prepared catalyst (PVFf-TiO2-Fe
oxide), and pieces of catalysts (a-e) after 20 days of experiments……………………..………139
Figure 6.10 Schematic changes occurring on PVFf-TiO2 Fe oxide surface after use (not to
scale)………………………………………………………………………...………………….141
xxiv
LIST OF TABLES
Table 2.1 Physico-chemical descriptors from literature and measured initial rate constants…...47
Table 2.2 Correlation coefficients (R2) obtained after linear regression in the plots of initial rates
of degradation versus different descriptors (represented in appendices)……………………...…48
Table 2.3 Homolytic dissociation energy of different bonds of the para-substituted phenols….49
Table 2.4 BOD5 (mg/L) and ratio between (DBO5) and (TOC) before and after photo-Fenton
treatment…………………………………………………………………………………………50
Table 4.1 Atomic composition of original polymer surface (PVF), TiO2 PSFD treated polymer
(PVFf-TiO2) at pH 3 and 11 (only principal constituents)……………………………….………79
Table 4.2 Initial HQ degradation rates relative to different photo-assisted processes………..…90
Table 4.3 Experimental conditions and observed rate constants for the bacterial inactivation tests
in PET bottle reactors under simulated solar radiation…………………………………………..98
Table 5.1 Homogeneous percentage relative to different processes and times (Values calculated
from Figures 1-3)……………………………………………………………………………….108
Table 5.2 Composition of PVFf-TiO2-Fe oxide surface (atomic percent) as prepared and after
three runs………………………………………………………………………………………..110
Table 6.1 Initial degradation rates with PVFf-TiO2-Fe oxide /H2O2/light and zero order rate with
Fe3+/H2O2/light (in μg/(L min)) for each compound in the pesticide mixture………………….135
Table 6.2 Composition of original polymer surface (PVF), as-prepared catalyst (PVFf-TiO2-Fe
oxide), and pieces of catalysts (a-e) after 20 days of experiments……………………………..140
xxv

xxvi
1- INTRODUCTION
1.1 Overview
Water, this essential element for life, is abundant on earth (estimated volume of about 1.4 x
109 km3), however, 97.5% is salt water. Of the remaining 2.5% that is fresh water, 70% is
frozen in the polar icecaps; the rest is mainly present as soil moisture or in inaccessible
subterranean aquifers. Only less than 1% of the world’s fresh water resources are readily
available for human use; and this resource is very unevenly distributed (UNEP, 2003).
Besides, the available fresh water is not always clean as it may contain natural toxic
impurities (arsenic, fluoride, nitrate, bacteria) or be contaminated by human activities
(pesticides, gasoline, solvents, and pharmaceuticals, waste from septic systems…).
Due to the lack of safe drinking water sources, every year millions of people, most of them
children, die from diseases associated with inadequate water supply, sanitation, and
hygiene. Every day thousands of children die because of dirty water; diseases transmitted
through water or human excrement is one of the main cause of death among children
worldwide (UN, 2005). Hence appropriate sanitation and water treatment systems have to
be provided urgently to save lives.
The huge problem of water microbial contamination is completed by growing concerns
related to the water cycle which focuses on water pollution caused by industrial,
agricultural or other human activities, and the whole range of its impact on human health
and ecosystems balance. Hence the actual increasing of worldwide pollution of the fresh
water supply by thousands of industrial chemical compounds is also severe. Although most
of these compounds are present at low concentrations, many of them are toxic, particularly
when present as components of complex mixtures (Schwarzenbach, 2006). Among them,
millions of tons of pesticides, which are highly toxic and bio-recalcitrant compounds, are
used each year in agriculture. Other water pollutants such as pharmaceuticals, hormones,
surfactants, synthetic musks etc. are more and more present in water which can lead to
1

bacterial resistance or sterility, among others. The degradation of bio-recalcitrant
compounds before or after they are spread by adequate water treatment technologies is
consequently an important issue.
The incapacity of conventional wastewater treatment methods to efficiently remove bio-
recalcitrant pollutants evidences that new efficient treatment systems are needed. Advanced
Oxidation Processes (AOP) are modern chemical methods for the treatment of waters
containing non-biodegradable/toxic substances and to decontaminate drinking water
(Legrini, 1993; Bahnemann, 1994; Herrera Melián, 2000; Rincon, 2001). With classical
water treatment techniques such as flocculation, precipitation, adsorption on granular
activated carbon, air stripping, reverse osmosis or combustion, pollutants are only
transferred from one phase to another. AOP destroy the organic pollutants producing water,
carbon dioxide and inorganic salts as end products.
For water disinfection in sunny countries, the application of solar-based AOP could
constitutes an alternative to conventional chlorination process, like HClO water
disinfection, which leads to the generation of toxic chlorinated byproducts in the presence
of natural organic matter.
The work presented in this thesis is a part of the European project INNOWATECH
(innovative and integrated technologies for the treatment of industrial wastewater). The
global objective of this project was to provide effective technological solutions for the
treatment of industrial wastewater, to propose new concepts, processes and technologies in
wastewater treatment. This should benefits for the quality of effluents, energy and
operational costs saving, and protect the environment.
This thesis focuses on homogeneous and heterogeneous photo-Fenton process as well as
TiO2 photocatalysis for the treatment of water pollutants. These solar driven AOPs were
used both to prepare photocatalysts absorbing the solar radiation and to degrade organic
pollutants and inactivate bacteria.
2
1.2 Background 1.2.1 Advanced Oxidation Processes (AOP)
AOP refer to a set of chemical treatment procedures designed to remove organic
compounds. AOP are also efficient to inactivate pathogenic bacteria present on water by
oxidation. The AOP have in common the involvement of hydroxyl radicals (•OH) as shown
in Figure 1.1.
Figure 1.1 AOP recently studied implying the central role of the OH-radical
The generated oxidative radicals (such as •OH and •O2-) are able to attack organic
pollutants with an almost diffusion controlled rate constant leading to the formation of
aliphatic acids (AA) and then to mineralization (Eq. 1.1). The oxidation reactions involving
the hydroxyl radicals and organic substrates (R, PhX) are classified as hydrogen abstraction
(Eq. 1.2), addition reactions, (Eq. 1.3) and electron transfer (Eq. 1.4, Peyton, 1990).
Furthermore the radicals can induce lipid peroxidation on eukaryotic and prokaryotic cells
membrane, leading to death of the microorganisms (Huang, 2000)
R + n•OH → → Aliphatic acids + m•OH → → aCO2 + bH2O + inorganic salts (1.1) •OH + RH → R• + H2O (1.2)
3
•OH + PhX → HOPhX• + H2O (1.3) •OH + RH → RH•+ + OH− (1.4)
Recently the trend is to combine different AOP and determine the presence of synergistic
effects. Among others, the combination of TiO2 photocatalysis with photo-Fenton (Bouras
et al. 2008), or sonolysis with ozonation (He, 2009) have been recently reported.
In the present work, the combination of photo-Fenton and TiO2 photocatalysis supported on
polymer substrates and the resulting synergistic effects are studied.
1.2.2 Semiconductor photocatalysis
1.2.2.1 Semiconductor properties
The electrons in semiconductors have an important feature: they do not have discrete
energy levels; they present bands with continuous energy. Electronic structure of solid
materials can be described in terms of electrons whose energy levels are so close that they
can form a continuum of energy bands.
Semiconductors (e.g., TiO2, ZnO, Fe2O3, CdS, ZnS, etc.) can act as sensitizers for light-
induced redox processes due to their electronic structure, which is characterized by a filled
valence band (VB) and an empty conduction band (CB). The two bands are separated by an
energy gap particular to each semiconductor referred to as the band gap (Ebg). When the
semiconductor is illuminated with light (hυ) of greater energy than that of the band gap, an
electron is promoted from the VB to the CB, thus leaving a positive hole in the valence
band as illustrated in Figure 1-2.
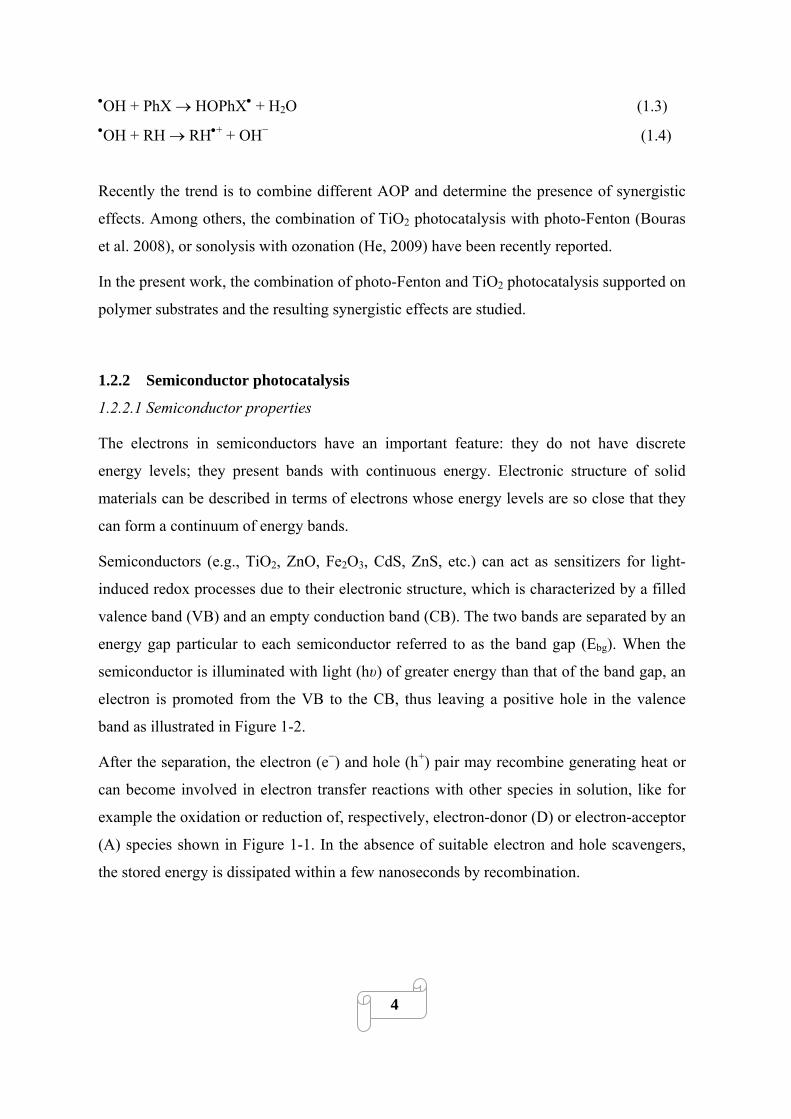
After the separation, the electron (e−) and hole (h+) pair may recombine generating heat or
can become involved in electron transfer reactions with other species in solution, like for
example the oxidation or reduction of, respectively, electron-donor (D) or electron-acceptor
(A) species shown in Figure 1-1. In the absence of suitable electron and hole scavengers,
the stored energy is dissipated within a few nanoseconds by recombination.
4
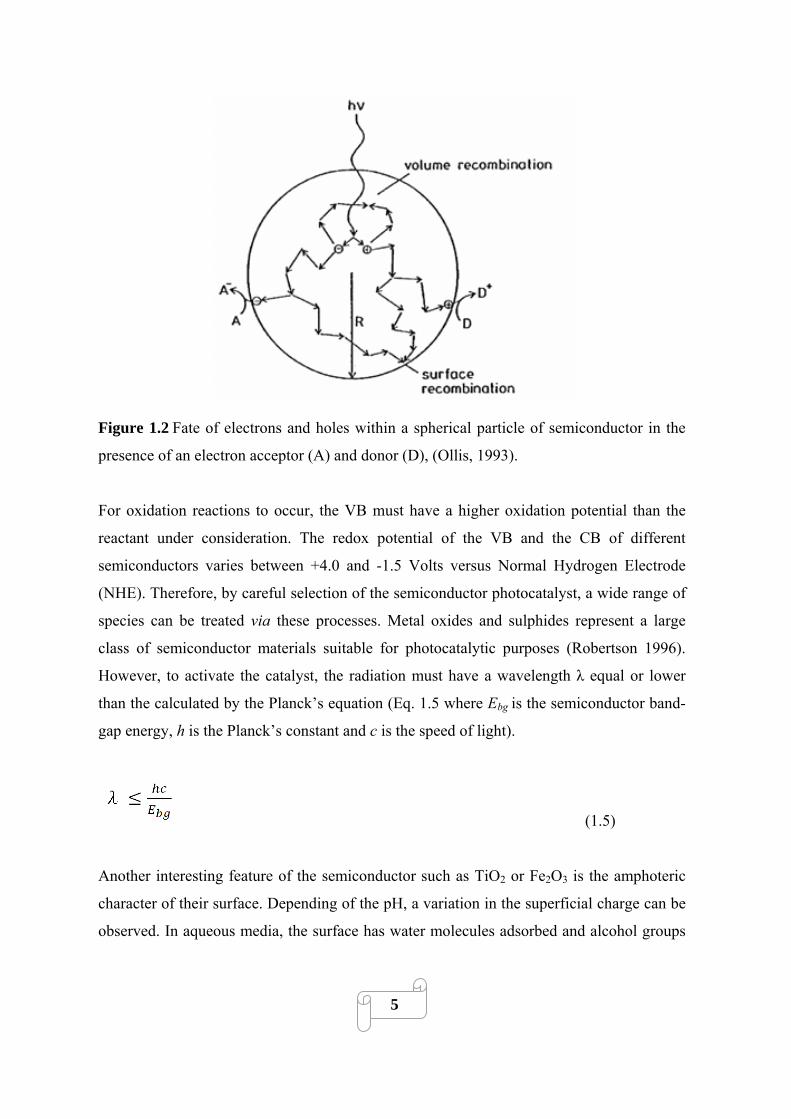
Figure 1.2 Fate of electrons and holes within a spherical particle of semiconductor in the
presence of an electron acceptor (A) and donor (D), (Ollis, 1993).
For oxidation reactions to occur, the VB must have a higher oxidation potential than the
reactant under consideration. The redox potential of the VB and the CB of different
semiconductors varies between +4.0 and -1.5 Volts versus Normal Hydrogen Electrode
(NHE). Therefore, by careful selection of the semiconductor photocatalyst, a wide range of
species can be treated via these processes. Metal oxides and sulphides represent a large
class of semiconductor materials suitable for photocatalytic purposes (Robertson 1996).
However, to activate the catalyst, the radiation must have a wavelength λ equal or lower
than the calculated by the Planck’s equation (Eq. 1.5 where Ebg is the semiconductor band-
gap energy, h is the Planck’s constant and c is the speed of light).
(1.5)
Another interesting feature of the semiconductor such as TiO2 or Fe2O3 is the amphoteric
character of their surface. Depending of the pH, a variation in the superficial charge can be
observed. In aqueous media, the surface has water molecules adsorbed and alcohol groups
5
M-OH giving the amphoteric character to TiO2 and Fe2O3. The points charge zero (pHpzc)
on TiO2 (anatase or rutile) and Fe2O3 are around 6-7. This means that at pH below this
value, the M-OH groups will be protonated, charging positively the surface and allowing
the adsorption of negatively charged molecules or surfaces. In contrast, beyond pHpzc, the
alcohol groups will be deprotonated, charging negatively the surface and allowing the
adsorption of positively charged species.
1.2.2.2 TiO2 photocatalysis
Among the numerous known semiconductors, titanium dioxide, TiO2, has proven to be the
most suitable for widespread environmental applications. Titanium dioxide is abundant,
chemically inert, stable to photo- and chemical corrosion; inexpensive and relatively non-
toxic. The toxicity of TiO2 under the form of nanoparticles is currently under study (IARC,
2006; Ramsden, 2009). Furthermore TiO2 is of special interest since it can use natural
(solar) UV radiation. Indeed TiO2 has an appropriate energetic separation between its
valence and conduction bands, which can be surpassed by the energy of a UV solar photon.
The TiO2 VB and CB energies are respectively +3.1 and -0.1 volts, thus its band gap
energy is 3.2 eV, and therefore absorbs in the near UV light (λ<387 nm).
TiO2 is used for many applications. It is the most widely used white pigment because of its
brightness and very high refractive index. Approximately 4 million tons of TiO2 are
consumed annually worldwide. TiO2 pigments are employed in paints, coatings, plastics,
papers, foods (E171), medicines, cosmetics, toothpastes, tatoo…
It exists in three crystalline forms: anatase, rutile, and brookite. Anatase and rutile are the
most common forms, and anatase is the most effective in wastewater treatment (Mills,
1997).
The commercially available, titanium dioxide Degussa P25 has become a standard
photocatalyst in environmental applications (Hoffmann, 1995; Mills, 1997; Litter 1999). It
is produced through high-temperature (greater than 1200°C) flame hydrolysis of TiCl4, in
the presence of hydrogen and oxygen. The TiO2 is then treated with steam to remove HCl,
which is also produced as by product. The end product is 99.5% pure TiO2 (anatase:rutile
ratio, 75:25), is non-porous, and in the form of rounded edges cubic particles. The P25 TiO2
6
powder has a surface area of 56 m2 g-1, and an average particle diameter of 25-35 nm. It is
important to notice that 90% of the material does not exist as isolated particles, but rather as
irreducible complex primary aggregates, of approximately 0.1 μm in diameter. The VB and
CB positions for Degussa P-25 have been calculated as +2.9 and -0.3 V, respectively, at
pH=0 (Martin, 1994).
To date, the widely accepted theory is that hydroxyl radical (OH•) is the main oxidizing
specie responsible for photo-oxidation of the majority of the studied organic compounds
(Legrini et al. 1993). Indeed, after absorption of near ultraviolet radiation at λ<387 nm,
electron/hole pairs (Eq. 1.6) separated between the CB and VB are generated, as shown in
Figure 1-3.
TiO2 + hυ → TiO2 (e− + h+) (1.6)
Figure 1.3 TiO2 semiconductor photocatalysis process: scheme showing some
photochemical and photophysical events that might be taking place on an irradiated
semiconductor particle
7

The different events that take place once the UV light has been absorbed by TiO2 particles
and the subsequent electrons (e−CB) and holes (h+VB) have been generated and partially
separated, are summarized in Equations 1.7 to 1.14 and in Figure 1-3. Three oxidation
reactions have been experimentally investigated: electron transfer from adsorbed organic
(Eq. 1.7), H2O (Eq. 1.8), and OH− (Eq. 1.9) adsorbed on the catalyst surface. Reactions 1.8
and 1.9 appear to be of great importance in oxidative degradation processes, most probably
due to the high concentration of OH− and H2O adsorbed on the TiO2 surface.
TiO2 (h+) + Rad → TiO2 + Rad•+ (1.7)
TiO2 (h+) + H2O → TiO2 + •OH + H+ (1.8)
TiO2 (h+) + OH− → TiO2 + •OH (1.9)
To avoid recombination, an electron acceptor must be present. Molecular oxygen is
generally the acceptor species in an electron transfer reaction with the photocatalyst CB
(Eq. 1.10). Superoxide anion or its protonated form can dismute (Eq. 1.12-1.13) to yield
hydrogen peroxide or peroxide anion (Ishibashi, 1998; Nosaka, 2002).
TiO2 (e−) + O2 → TiO2 + O2•− (1.10)
O2•− + H+ → HO2
• (1.11)
2 HO2• → H2O2
+ O2 (1.12)
O2•− + HO2
• + H+ → H2O2 + O2 (1.13)
It has also been shown that hydrogen peroxide addition considerably enhances the
photodegradation rate, most probably via reaction 1.14, or by surface-catalysed dismutation
of H2O2 (Wolfrum, 1994; Pichat, 1995).
TiO2 (e−) + H2O2 → TiO2 + OH• + OH− (1.14)
8
1.2.3 Homogeneous photo-Fenton
1.2.3.1 Aquatic iron chemistry
Behind oxygen, silicon and aluminium, iron is the fourth most abundant element in the
earth’s crust. It occurs in oxidation states from –II to +VI with coordination numbers of 3
to 8 (Hawker, 1994). Desert sands, dust and ash make iron omnipresent in the environment
and practically all natural water contains iron at least in traces. In clouds, fog, lakes and
rivers the iron concentration is around 10-5M (Faust, 1990). Iron is as well a vital element
for life present in the whole biosphere.
In aqueous solution the most abundant iron species have an oxidation number of +II
(ferrous iron) and +III (ferric iron). Other iron species are highly unstable. Dissolved
ferrous and ferric iron species are present in octahedral complexes with six ligands in
water. Iron is complexed by water and hydroxyl ligands provided that no other complexing
substances are present. How many of these ligands are hydroxyl ions, depends on the
solution’s pH, which influences directly the acid/base equilibrium of the aqua-complex.
Ferric iron is the more critical iron species in the photo-Fenton process, because its
hydroxides precipitate at lower pH than those of ferrous iron. Consequently, only the
acid/base equilibrium for the ferric iron aqua-complex is discussed here.
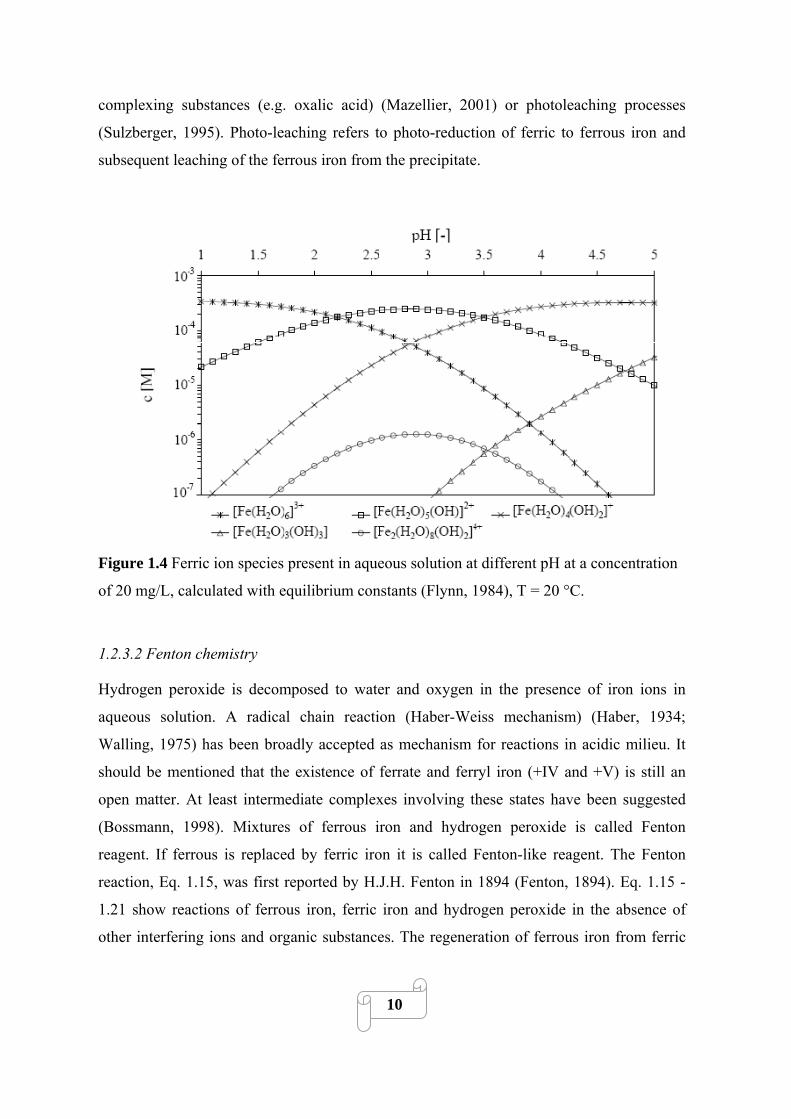
Figure 1.4 shows the equilibrium concentrations of the most important ferric iron aqua-
complexes in the absence of further complexing substances at different pH for a ferric iron
concentration of 20 mg/L. It is clear that between pH 2.5 and 3 [Fe(H2O)5(OH)]2+ is the
dominant species.
Because of the low solubility product of ferric iron hydroxide (KS (Fe(OH)3) ≈ 10-37),
precipitation starts at pH 2.5-3.5 depending on the iron concentration and the temperature.
The precipitation process starts with the formation of dimers and oligomeres, which at
continuation gradually polymerize further and lose water until forming finally insoluble
iron hydroxides (e.g. goethite or hematite). This aging process is slow and can take up to a
hundred days (Flynn, 1984). The resulting precipitate is of red brown colour and with no
defined stoichiometry. It contains water and has a strong cationic character, thus co-
precipitating anions but also organic substances. The precipitate is difficult to re-dissolve
through acidification (insoluble above pH ≈ 1-1.5), but it can be re-dissolved by
9
complexing substances (e.g. oxalic acid) (Mazellier, 2001) or photoleaching processes
(Sulzberger, 1995). Photo-leaching refers to photo-reduction of ferric to ferrous iron and
subsequent leaching of the ferrous iron from the precipitate.
Figure 1.4 Ferric ion species present in aqueous solution at different pH at a concentration
of 20 mg/L, calculated with equilibrium constants (Flynn, 1984), T = 20 °C.
1.2.3.2 Fenton chemistry
Hydrogen peroxide is decomposed to water and oxygen in the presence of iron ions in
aqueous solution. A radical chain reaction (Haber-Weiss mechanism) (Haber, 1934;
Walling, 1975) has been broadly accepted as mechanism for reactions in acidic milieu. It
should be mentioned that the existence of ferrate and ferryl iron (+IV and +V) is still an
open matter. At least intermediate complexes involving these states have been suggested
(Bossmann, 1998). Mixtures of ferrous iron and hydrogen peroxide is called Fenton
reagent. If ferrous is replaced by ferric iron it is called Fenton-like reagent. The Fenton
reaction, Eq. 1.15, was first reported by H.J.H. Fenton in 1894 (Fenton, 1894). Eq. 1.15 -
1.21 show reactions of ferrous iron, ferric iron and hydrogen peroxide in the absence of
other interfering ions and organic substances. The regeneration of ferrous iron from ferric
10

11
iron by Eq. 1.18-1.20, is the rate limiting step in the catalytic iron cycle, if iron is added in
small amounts. The listed rate and equilibrium constants for Eq. 1.15-1.24 were reported by
Sychev et al., (Sychev, 1995).
Fe2+ + H2O2 → Fe3+ +OH− + •OH k = 53 – 76 M-1 s-1 (1.15)
Fe2+ + •OH→Fe3+ +OH− k = 2.6 – 5.8·108 M-1 s-1 (1.16)
Fe2+ + HO2• → Fe3+ + OH− k = 0.75 – 1.5·106 M-1 s-1 (1.17)
Fe 3+ + H2O2 → Fe2+ + HO2• + H+ k = 1 – 2·10-2 M-1 s-1 (1.18)
Fe3+ + HO2• → Fe2+ +O2 + H+ k = 0.33 – 2.1·106 M-1 s-1 (1.19)
Fe3+ +O2• → Fe2 + O2 k = 0.05 – 1.9·109 M-1 s-1 (1.20)
•OH + H2O2 → H2O + HO2• k = 1.7 – 4.5·107 M-1 s-1 (1.21)
Furthermore, radical-radical reactions have to be taken into account.
2 •OH →H2O2 k = 5 – 8 109 M-1
s-1 (1.22)
2 HO2• →H2O2 + O2 k = 0.8 – 2.2 106
M-1 s-1 (1.23)
HO2• + OH•→H2O + O2 k = 1.4 1010
M-1 s-1
(1.24)
Finally, the following acid/base equilibriums have to be regarded (Gallard, 1999):
H2O2 HO2+ K = 2.63 10-12 M (1.25) − + H
Fe3+ + H2O2 [Fe(HO2)]2+ + H+ K = 3.1 10-3 M (1.26)
[Fe(OH)]2+ + H2O2 [Fe(OH)(HO2)]+ + H+ K = 2 10-4 M (1.27)
HO2 O2•− + H+ K = 3.55 10-5 M (1.28) •
•OH O•− H+ K = 1.02 10-12 M (1.29) +
HO2• +H+ H2O2
•+ K = 3.16– 3.98 10-12 M (1.30)
1.2.3.3 Fenton reaction in presence of inorganic and organic substances
If organic substances (quenchers, scavengers or pollutants) are present in the system Fe2+/
Fe3+/ H2O2, they react in many ways with the generated hydroxyl radicals. Yet, in all cases
the oxidative attack is electrophilic and the rate constants are close to the diffusion-
controlled limit. As discussed point 1.2.1, the reactions between OH radicals and organic
substrates are:
• Hydrogen abstraction from aliphatic carbon atoms, Eq. 1.2
• Electrophilic addition to double bonds or aromatic rings, Eq. 1.3.
• Electron transfer reactions, Eq. 1.4.
The generated organic radicals continue reacting prolonging the chain reaction. Depending
on the oxidation-reduction potential of the organic radical generated, reactions Eq. 1.31 -
1.34 can take place. The organic peroxide generated in reaction Eq. 1.34 can further react
with ferrous iron similar to the Fenton reaction, 1.35 (Huyser, 1983). Of special interest is
the reaction with dissolved oxygen (Dorfman-mechanism), Eq. 1.36 and 1.37 (Von
Sonntag, 1997), because the peroxyl radical can regenerate hydrogen peroxide by reaction
1.23 and thereby contribute to reduce the consumption of oxidant in wastewater treatment
by Fenton and photo-Fenton method.
R• + Fe3+→ R+ + Fe2+ (1.31)
R• + Fe2+ → R− + Fe3+ (1.32)
R• + R•→ R-R (1.33)
R• + HO2• → RO2H (1.34)
Fe2+ + RO2H → Fe3+ + OH− + •OR (1.35)
R• + O2→ RO2• (1.36)
RO2• + H2O → ROH + HO2
• (1.37)
In the case of aromatic pollutants the ring system usually is hydroxylated before it is broken
up during the oxidation process. Substances containing quinone and hydroquinone
structures are typical intermediate degradation products, e.g. produced by reactions
equivalent to Eq. 1.38 and 1.39. These are especially worth mentioning because they
provide an alternative, quicker pathway for ferrous iron regeneration through Eq. 1.40 and
1.41 accelerating thereby the process. Resulting benzoquinone structures can also be
reduced as in Eq. 1.42. Thereby, each molecule can reduce several ferric iron ions in a
12
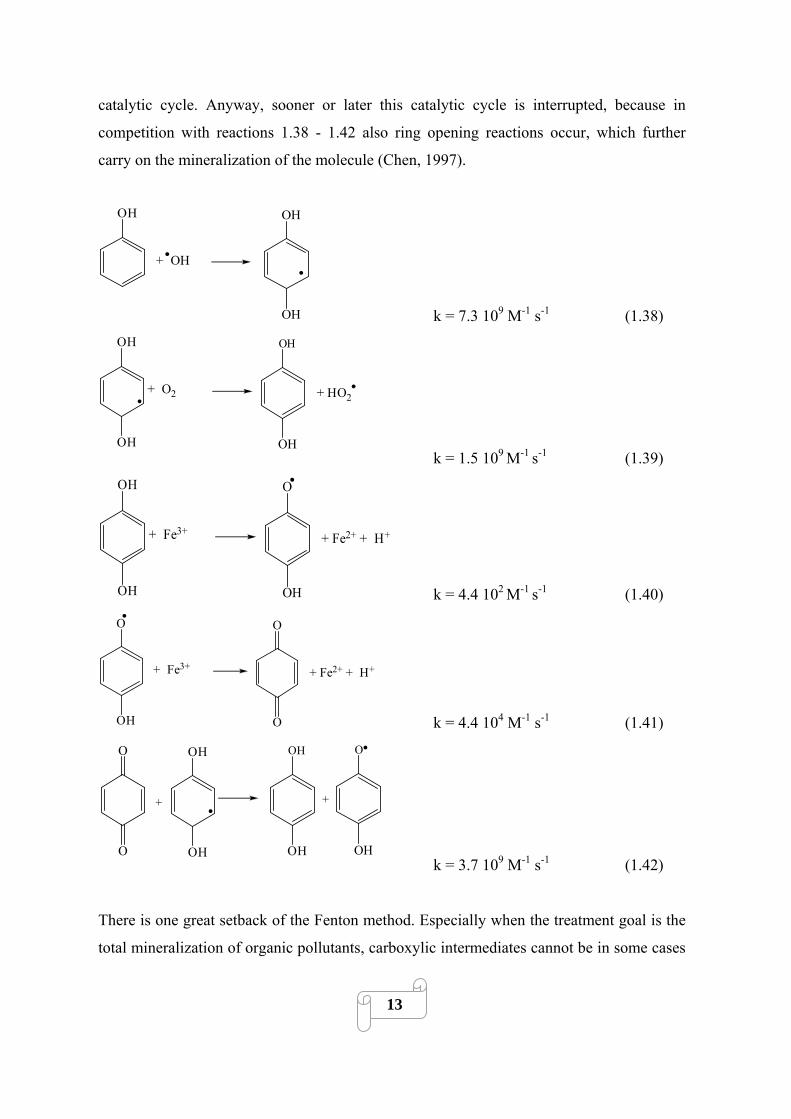
catalytic cycle. Anyway, sooner or later this catalytic cycle is interrupted, because in
competition with reactions 1.38 - 1.42 also ring opening reactions occur, which further
carry on the mineralization of the molecule (Chen, 1997).
OH
+ OH
OH
OH k = 7.3 109 M-1 s-1 (1.38) OH
+ O2
OH
OH
+ HO2
OH k = 1.5 109
M-1 s-1 (1.39)
OH
+ Fe3+
O
OH
+ Fe2+ + H+
OH k = 4.4 102 M-1
s-1 (1.40)
O
+ Fe3+
O
O
+ Fe2+ + H+
OH k = 4.4 104 M-1 s-1 (1.41)
OH OH
OHOH
O
O
+
O
OH
+
k = 3.7 109 M-1 s-1 (1.42)
There is one great setback of the Fenton method. Especially when the treatment goal is the
total mineralization of organic pollutants, carboxylic intermediates cannot be in some cases
13

further degraded. Carboxylic and dicarboxylic acids are known to form stable iron
complexes, which inhibit the reaction with peroxide (Kavitha, 2004). Hence, the catalytic
iron cycle reaches a standstill before total mineralization is accomplished, in the dark, Eq.
1.43.
Fe3+ + nL → [FeLn ]x+ → no further reaction (1.43)
L: Mono- and dicarboxylic acids
Due to the high oxidation potential of the hydroxyl radical, it can also react with inorganic
ions present in the solution. Several authors have described the strong negative effect of the
presence of carbonate and phosphate in the Fenton reaction, while the effect of other ions
such as chloride or sulfate is not so strong (Lipczynska-Kochany, 1995; Pignatello, 1992;
Kiwi, 2000; De Laat, 2004; Marciel, 2004). Phosphate has a double detrimental effect; first,
it precipitates iron and second, it scavenges hydroxyl radicals. Carbonate ions can scavenge
hydroxyl radicals. The resulting carbonate radicals are particularly ineffective in the
degradation of organic matter (Von Sonntag, 1997).
De Laat and co-workers (De Laat, 2004) recently presented a review of the additional
reactions and equilibriums of importance in the presence of significant amounts of chloride
and sulfate. Both anions can form complexes with ferric and ferrous iron. They can thereby
hinder reactions or also open completely new reaction pathways for the decomposition of
hydrogen peroxide in the presence of dissolved iron. Also, hydroxyl radicals generated can
react with these ions, creating chlorine radicals and sulfate radicals as shown in Eq. 1.44-
1.47.
•OH + Cl− → [ClOH]•− k = 4.3 109 M-1 s-1 (1.44)
[ClOH]•− + H+ → [ΗClOH]• k = 3.0 1010 M-1 s-1 (1.45)
[ΗClOH]• + Cl− → Cl2•− + H2O k = 8.0 109 M-1 s-1 (1.46)
OH• + HSO4− → H2O + SO4
•− k = 3.5 105 M-1 s-1 (1.47)
De Laat and co-workers further calculate, that below pH = 4 practically all hydroxyl
radicals end up in chlorine radicals (calculations done for 100 mM NaCl solution). In the
14
presence of sulfate the conversion of hydroxyl radicals is considerable at acidic pH as well.
Yet, it should be mentioned that these calculations were performed for solutions without
any other scavenging substances (e.g. organic pollutants). There are two negative effects;
first, the chlorine and sulfate radicals are potentially weaker oxidants and the overall
process efficiency becomes diminished and second, chlorine radicals can electrophilically
add themselves to double bonds similar to hydroxyl radicals and generate undesired
chlorinated intermediate reaction products, such as detected by Kiwi and co-workers (Kiwi,
2000).
1.2.3.4 Photo-assisted Fenton reaction
Irradiation with light up to 580 nm leads to photo-reduction of dissolved ferric iron to
ferrous iron (Bauer, 1999). The primary step is a ligand-to-metal charge-transfer (LMCT)
reaction. Subsequently, intermediate complexes dissociate as shown in reaction Eq. 1.48
(Zepp, 1992). The ligand can be any Lewis base able to form a complex with ferric iron
(OH−, H2O, HO2−, Cl−, R-COO−, R-OH, R-NH2 etc.). Depending on the reacting ligand, the
product may be a hydroxyl radical such as in Eq. 1.49 and 1.50 or another radical derivated
from the ligand. The direct oxidation of an organic ligand is possible as well as shown for
carboxylic acids in Eq. 1.51. The omnipresence of iron makes the photo-Fenton reaction an
important factor for the self-purification capacity of lakes, rivers (Sulzberger, 1995) and
atmospheric water droplets (Faust, 1990).
[Fe3+L] + hν → [Fe3+L]* → Fe2+ + L• (1.48)
[Fe(H2O)]3+ + hν → Fe2+ + •OH + H+ (1.49)
[Fe(OH)]2+ + hν → Fe2+ + •OH (1.50)
[Fe(OOC−R)]2+ + hν → Fe2+ + CO2 + R• (1.51)
Depending on the ligand the ferric iron complex has different light absorption properties
and reaction 1.48 takes place with different quantum yields and also at different
wavelengths. Consequently, the pH plays a crucial role in the efficiency of the photo-
Fenton reaction, because it strongly influences which complexes are formed (e.g. see
15
Figure 1.4). Thus, pH 2.8 was frequently postulated as an optimum pH for photo-Fenton
treatment (Pignatello, 1992; Safarzadeh-Amiri, 1996a), because at this pH, precipitation
does not take place yet and the dominant iron species in solution is [Fe(OH)]2+, the most
photoactive ferric iron – water complex. In fact, as shown in its general form in Eq. (1.48),
ferric iron can form complexes with many substances and undergo photo-reduction. Of
special importance are carboxylic acids because they are frequent intermediate products in
an oxidative treatment. Such ferric iron – carboxylate complexes can have much higher
quantum yields than ferric iron – water complexes. It is therefore a typical observation that
a reaction shows an initial lag phase, until intermediates are formed, which can regenerate
more efficiently ferrous iron from ferric iron accelerating the process. This can either
happen through a photochemical pathway, Eq. 1.51, a thermal pathway, e.g. Eq. 1.38-1.42,
or a combination of both.
The addition of oxalate has been proposed to overcome the initial lag phase (Nogueira,
2005; Safarzadeh-Amiri, 1996b). Thereby, the wastewater throughput in a photo-Fenton
plant can be raised, but these gains have to be compared to the increased reagent cost due to
the addition of oxalate, because oxalate is not acting as a catalyst, as it is as well consumed
during this photochemical reaction. Other chelating agents have been proposed as well with
the additional aim of working at neutral pH (Sun, 1992).
Fe(C2O4)33− + hν → Fe2+ + 2C2O4
2− + C2O4•− (1.52)
Fe3+ + C2O4•− → 2CO2 + Fe2+ (1.53)
Finally, another photochemical reaction should be mentioned, which is the photo-reduction
of quinones to semiquinones, Eq. (1.54) (Ononye, 1986). By this reaction intermediate
quinonic reaction products can be reduced and can further contribute to accelerate the
reduction of ferric iron by Eq. (1.41). As a side product even a hydroxyl radical is
generated.
16

OO
O OH
+ H2O + hv + OH
(1.54)
1.2.4 photo-Fenton reaction using iron from solid sources
1.2.4.1 Fenton reaction with iron oxides
Work in the field of soils decontamination has shown the potential of iron oxides (goethite,
hematite, ferrihydrite, etc.) to perform Fenton reactions for the degradation of chlorinated
organic compounds (Tyre, 1991, Watts, 1993; Kong, 1998, Lu, 2000; Teel, 2001). Goethite
was found to be more efficient than hematite in heterogeneous Fenton process (Watts,
1993; Huang, 2001).
To date, the role of Fe3+ and Fe2+ and their ability to promote the production of free-radical •OH are not totally understood. Reported data indicate that H2O2 initiates a chain reaction
that leads to the formation of •O2H, by contact with Fe3+ sites available on the surface of
goethite particles dispersed in aqueous solution (Al-Hayek, 1990; Guimaraes, 2008) Fe3+ is
converted to Fe2+ on the solid surface. New reaction sites are then formed and allow H2O2
to generate •OH radicals. The Fe3+ sites are recovered via oxidation of Fe2+ in the cyclic
mechanism (Eq 1.55-1.56 where =Fe(II/III) represent the Fe(II/III) species at solid surface).
=Fe(III) + H2O2 → =Fe(II) + HO2• + H+ (1.55)
=Fe(II) + H2O2 → =Fe(III) + •OH + OH+ (1.56)
It was shown that the presence of Fe2+ sites (intrinsically on oxides such as magnetite
(Kong, 1998); or generated on goethite by thermal treatment under H2 atmosphere
(Guimaraes, 2008)) on iron oxide surface enhanced the Fenton degradation of organic
compounds with support the latter mechanistic proposition.
17

1.2.4.2 Iron oxide photocatalysis
For thirty years, hematite (Fe2O3) colloids are known to photocatalyse the electrolysis of
water (Khung, 1977) or the oxidation of cyanide and sulfide (Franck, 1977). The
photocatalytic oxidation of organic compounds such as carboxylic acids acid (Hermann,
1983, Litter, 1994), dioxin (Pellizzetti, 1988) or phenols (Chatterjee, 1994; Pulgarin, 1995;
Pal, 1998; Mazellier, 2000; Bandara, 2001; Valenzuela, 2002; Bakardjieva, 2007,
Karunakaran, 2008, Dindar, 2009) mediated by iron oxides (such as hematite or goethite) in
aqueous solution and under visible light irradiation was reported more recently. Possible
mechanisms involved in iron oxide photocatalysis (Graetzel, 1985; Mazellier, 2000
Karunakaran, 2008; Du, 2008) are presented in Eq. 1.57-1.61:
Fe oxide + hν → Fe oxide (e− + h+) (1.57)
Fe oxide (h+) + R-Xads + h+ → Fe oxide + R-Xads•+ (1.58)
Fe oxide (e−) + O2 → Fe oxide + O2•− (1.59)
=Fe(III)+ Fe oxide (h+) → =Fe(II) (1.60)
=Fe(II) + A → =Fe(III) + A•− (1.61)
Hematite was found to present a lower efficiency than TiO2 in photocatalytic degradation
of organic compound (Kormann, 1989; Litter, 1994, Bandara, 2001, Valenzuela, 2002,
Dindar, 2009). Besides iron oxides were found to dissolve under irradiation via photo-
reductive dissolution (Walte, 1984), particularly at acidic pH in the presence of chlorine
(Graetzel, 1985) or organic ligands (Litter, 1988) (More detail about the mechanisms
involved in photo-reductive dissolution will be discussed latter). Due to these reasons, iron
oxides were considered less suitable than TiO2 as semiconductor photocatalyst.
1.2.4.3 Photo-Fenton reaction using iron from oxides.
A promising alternative was proposed: Iron oxides could be used as a heterogeneous
catalyst in the presence of hydrogen peroxide and under light irradiation leading to
heterogeneous photo-Fenton reactions. Such system combines semiconductors
photocatalytic character to the Fenton and photo-assisted Fenton oxidation in a single
18
material. Different iron oxides were compared and iron oxyhydroxides (Ferrhydrite,
goethite) were found to be more efficient than hematite in organics degradation (He, 2002;
Du 2008). The application of goethite as solid photo-Fenton catalyst has shown to be
efficient in the degradation and mineralization of organic compounds under solar
irradiation (Mazellier, 2001; Ortiz de la Plata, 2008, Xu, 2009).
The mechanism occurring in photo-Fenton reaction with oxides seems quite complex
involving semiconductor photocatalysis (Eq. 1.57-1.61) in the presence of H2O2 and
Fenton reaction using iron from oxides (Eq. 1.55-1.56). In addition, heterogeneous photo-
Fenton reactions (Eq. 1.62, 1.65, 1.68) on oxide are linked with iron photodissolution
(Mazellier, 2001; Lu, 2002).
=Fe(III)L + hv → =Fe(II)+ L•+ (1.62)
(L: complexing agent or polycarboxylic acid)
Iron leaching from oxides to solution is well documented (Sulzberger, 1995, Voelker,
1997). The leaching process can be described as follow (Eq. 1.63-1.68): (i) carboxylate
ligands (like aliphatic acids (AA) produced by organic pollutant degradation (Eq. 1.63) can
form surface Fe(III)-carboxylate complexes (Eq. 1.64); (ii) These complexes are thought to
participate in ligand to metal charge transfer reactions (Eq. 1.65). For dissolution to take
place, the Fe(II) sites formed at the surface of the Fe(III) oxide must detach (Eq. 1.66). In
presence of oxidant, the surface Fe(II) sites may be re-oxidized before they leave the
catalyst surface (Eq. 1.67).
Organics + iron oxide + H2O2 + hν →→→ AA (1.63)
=Fe(III)OH + HC2 4- =Fe(III)C2O4 +H2O (1.64) O
=Fe(III)C2O4+ hν =Fe(III)C2O4*→ =Fe(II) + CO2 + CO2
- (1.65)
=Fe(II) → Fe2+ + = (1.66)
=Fe(II) + Ox → =Fe(III) + Red (1.67)
19
Recently Sherman (Sherman, 2005) reported that leaching of iron species from the iron
oxide surface to the aqueous solution is also possible via photo-reduction of bounded aqua-
complexes (Eq. 1.68).
2=Fe(III)(H2O) + hν 2=Fe(II)(H2O)+→ 2 Fe2+ + H2O2 +2H+ (1.68)
Thus the surface photo-Fenton reaction can lead to intermediates mineralization (or H2O2
generation) and concomitant Fe2+ dissolution. When dissolved iron concentration is high
enough (i.e. > 0.1 mg/L), homogeneous Fenton and photo-Fenton reactions described
points 1.2.3.2 and 1.2.3.4 shall also play a role in the degradation processes mediated by
iron oxides. This homogeneous contribution can be seen as beneficial or detrimental
depending on the final values of dissolved iron concentrations allowed by sanitary
authorities in water and drinking waters.
1.2.4.4 Photo-Fenton reaction with iron from other solid sources.
The use of zero valent iron in Fenton heterogeneous catalyst is another interesting
possibility which has shown growing concern (Liao, 2004; Kusic, 2006; Prousek, 2007;
Gomathi Devi, 2009; Kusic, 2010). In this process zero valent iron is used as a source of
Fe2+ generated in the presence of hydrogen peroxide as shown Eq. 1.69 where Ox is
hydrogen peroxide or oxygen.
Fe0 + Ox → Fe2+ + Ox2- (1.69)
Once the Fenton reagent is present in solution, homogeneous photo-Fenton oxidation is
responsible of organics degradation.
Mixed oxides such as Fe-TiO2 (Tryba, 2006), Fe0/FeOOH/Fe2O3 (Nie, 2007) Fe-Ce oxide
(Zhang, 2007), CuOx-FeOOH (Nie, 2009), Fe2V4O13 (Zhang, 2009) were also proposed as
heterogeneous photo-Fenton catalysts. These materials were found to show high
efficiencies in organic pollutant degradation, under visible light irradiation and presence of
20

H2O2. The occurrence of synergistic effects between iron oxide and the other oxides was
found to be responsible of the high degradation rates measured. A proposition of
mechanism for the synergistic effect in the Fe oxide-TiO2/H2O2 system is detailed in
chapter 4.
1.2.4.5 photo-Fenton reaction using designed heterogeneous catalyst.
Investigators have explored the use of iron species (ions, (mixed) oxides or complexes)
immobilized on a solid support as a strategy to avoid sludge formation and to expand the
effective pH range of the Fenton reaction. Some success in this regard has been achieved,
notably with iron-exchanged Nafion membranes (Maletzky, 1999), iron-modified clays
(Feng, 2003, De Leon, 2008) and with different iron modified supports such as silica fabric
(Bozzi, 2004), Al2O3 (Muthuvel, 2007), zeolites (Rios-Enriquez, 2004), resins (Lv, 2005),
cotton (Tryba, 2008) among others. The advantage of a suitable heterogeneous catalyst is
its separability from the waste stream. Unless the catalyst provides a steady-state source of
iron in solution (which was found to always occur to different extent with dissolved iron
concentration between 0.1 and 10 mg/L) for the homogeneous reaction, a fundamental
disadvantage is that dissolved target molecules must diffuse to the catalyst surface to reach
active oxidant sites before they are degraded.
Nafion is a perfluorinated oxyalkyl polymer with sulfonate groups capable of binding
cations. Ferric-exchanged Nafion membrane is claimed to be an effective photo-Fenton
catalyst (Maletzky 1999; Dhananjeyan, 2001). Activity under simulated solar irradiation
correlates with the presence of Fe(III) species such as iron aqua ions or dimmers
electrostatically associated with sulfonate groups. Fe-Nafion membranes appear to be
effective up to at least operational pH 5. Although it was possible to achieve mineralization
of 2,4-dichlorophenol at higher initial pH (up to 11), the pH (unbuffered) always drifted
quickly to a value below 5 (Sabhi, 2001). The detailed mechanism concerning the role of
surface reactions and of adsorption/desorption of iron ions and reactants in Fe–Nafion
systems is unclear at this time. Fernandez et al (Fernandez, 1999) showed that Nafion-
bound Fe(III) is photo-reduced to Fe(II), which subsequently undergoes the Fenton reaction
(as in Eq 1.55-1.56). Whether H2O2 reacts with surface-bound or desorbed Fe(II) species is
uncertain. Dissolved methanol inhibited orange II discoloration, which suggests that HO· is
21
generated in solution, or at least desorbs before it reacts. If H2O2 reacts in solution then the
Fe(III) product must re-adsorb faster than it precipitates, since membranes retain activity
over several cycles without sludge production (Sabhi and Kiwi, 2001; Dhananjeyan et al.,
2001). The question of the involvement of dissolved Fe(III) species in these systems is still
unanswered. Some disadvantages of Nafion membrane for practical application is their
high cost and that these membranes are not totally inert. Fluorinated radicals where
founded in Nafion solutions exposed to ROS produced by photo-Fenton reaction
(Bosnjakovic, 2007).
Feng et al. obtained encouraging results in the degradation of dyes mediated by composites
in the presence H2O2 and light. The nanocomposite materials composed of crystallites of
Fe2O3 and clays (laponite (Feng, 2003) or bentonite (Feng 2004) were more efficient than
bare FeOOH or Fe2O3 suspensions in photo-Fenton dye degradation. The catalysts leach
iron into solution, up to 3 mg/L during the runs, however, the catalyst efficiency did not
decline much in repeated runs. The catalyst efficiency was maximal at initial pH 3 (Feng,
2006). The amount of leached iron was diminished (0.5 mg/L) by immobilizing an iron
modified bentonite film on the inner surface of a photo-reactor (Feng, 2005) however the
degradation rates were also diminished if compared with suspensions. The homogeneous
photo-Fenton tests performed with the same amount of dissolve iron (3mg/L) have shown
the significant contribution of dissolved iron ions in the process mediated by iron modified
clays (Feng, 2003).
The performance of a Fe3+-exchanged zeolite Y (Rios-Enriquez, 2004; Noorjahan, 2008)
and Fe-ZM5 zeolite (Kasiri, 2008), as a heterogeneous photo-Fenton catalyst, was tested on
degradation of organic compounds. Although some leaching of Fe3+ was observed, it
amounted to only few percent of the total iron present in the zeolites, (0.3-2 mg/L in
solution), and was thought not to play a major role in the reaction.
The use of novel structured inorganic silica fabrics loaded with Fe ions (Fe-EGF) by
exchange-impregnation as a heterogeneous photocatalyst was an alternative approach
proposed to degrade organic compounds (Bozzi, 2004) or deactivate bacteria (Moncayo
2008). Evidence was provided that the degradation of oxalates on the Fe–silica fabric was
22

due to Fe ions leaching into the solution that were re-adsorbed onto the silica fabric when
compounds were mineralized.
Ferric species were also immobilized on different types of ionic exchange resins, and used
as a heterogeneous catalyst for degradation of cationic and anionic dye pollutants under
visible light (λ > 450 nm) irradiation in the presence of H2O2. Whereas the cationic dyes are
efficiently photodegraded on a cationic resin exchanged Fe(III) catalyst, the anionic dye is
preferably photodegraded on an anionic resin supported catalyst (Lv, 2005).
A common characteristic of designed heterogeneous catalyst for photo-Fenton reaction is
that the optimal pH is generally 3, coinciding with the most efficient dissolution of iron
ions. These material are however efficient in a heterogeneous reaction at higher pH values
and leaching is minimized under these conditions. The importance of homogeneous photo-
Fenton contribution to the overall process depends on the kind of catalyst, experimental
conditions and target contaminant and is difficult to determine with accuracy. In fact, the
dissolved iron concentration is time dependent and the optical properties of photo-reactor
change in absence of heterogeneous catalyst. An interesting phenomenon was observed for
most of proposed catalysts, the leached iron ions are found to re-adsorb on catalyst surface
allowing to maintain a good catalyst stability in repeated runs.
It can be assumed that an ideal supporting material for iron species as photocatalyst would
have the following attributes: (a) to be transparent to UV and visible radiations; (b) to favor
strong surface chemical-physical binding with the iron particles without affecting their
reactivity; (c) to have a high specific surface area; (d) to have good adsorption capability
for the organic compounds to be degraded; (e) to be in a physical configuration which
favors the ultimate liquid-solid phase separation; (f) to allow a reactor design that facilitates
the mass transfer processes; and (g) to be chemically inert.
From the coating point of view, the ideal situation is given by two basic conditions: a good
adherence catalyst/support, and no degradation of the catalyst activity by the attachment
process. The first condition is essential, since the support/catalyst junction should resist to
the strain derived from particle to particle and particle-fluid mechanical interactions in the
reactor environment, in order to avoid detachment of catalyst particles from the support
(Pozzo et al. 1997). Moreover, the light penetration length in the solid-liquid medium is
23
another important parameter, which depends on catalyst charge and support transparency to
radiation. Hence polymer films were selected as supports in this work because these
materials can be transparent and chemically inert.
1.3 Objectives
This research work contributes to the study and development of new kind of heterogeneous
photo-Fenton photocatalysts active under solar light, for the degradation of bio-recalcitrant
organic substances and for the inactivation of bacteria present in aqueous media.
Understanding of the processes involved catalyst preparation and studying the effect of
some parameters influencing the reactivity of homogeneous and heterogeneous photo-
Fenton processes are the objectives of this thesis. More specific objectives are:
• To assess the influence of physicochemical properties of the pollutant on photo-
reactivity for homogeneous photo-Fenton system (chapter 2).
• To compare different surface modification methods for the preparation of supported
photo-Fenton catalyst on polymer substrates (chapter 3).
• To characterize the most efficient materials and understand the mechanisms
involved in the preparation processes (chapter 4).
• To study the ability of supported photocatalyst to degrade organic pollutant
degradation and inactivate bacteria (chapter 4).
• To assess the influence of process parameters such as solution temperature or salt
content (chapter 5).
• To performed a scale up and test the photocatalyst at field scale under natural solar
light in compound parabolic collector (CPC) photo-reactors for the degradation of
real pollutants. (chapter 6).
1.4 Studied water contaminants
1.4.1 Substituted phenols
Phenolic compounds are a significant threat to the environment and are common dilute
contaminants found in ground and surface water. Figure 1.5 shows the para-substituted
24
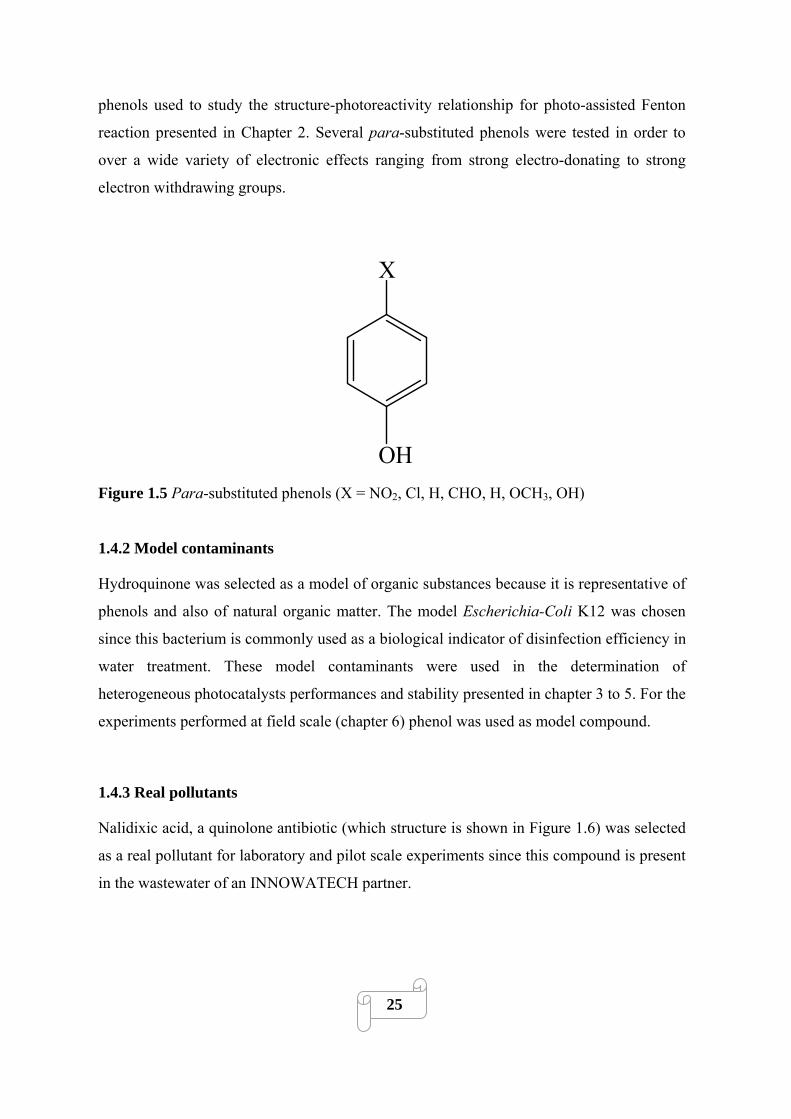
phenols used to study the structure-photoreactivity relationship for photo-assisted Fenton
reaction presented in Chapter 2. Several para-substituted phenols were tested in order to
over a wide variety of electronic effects ranging from strong electro-donating to strong
electron withdrawing groups.
X
OH
Figure 1.5 Para-substituted phenols (X = NO2, Cl, H, CHO, H, OCH3, OH)
1.4.2 Model contaminants
Hydroquinone was selected as a model of organic substances because it is representative of
phenols and also of natural organic matter. The model Escherichia-Coli K12 was chosen
since this bacterium is commonly used as a biological indicator of disinfection efficiency in
water treatment. These model contaminants were used in the determination of
heterogeneous photocatalysts performances and stability presented in chapter 3 to 5. For the
experiments performed at field scale (chapter 6) phenol was used as model compound.
1.4.3 Real pollutants
Nalidixic acid, a quinolone antibiotic (which structure is shown in Figure 1.6) was selected
as a real pollutant for laboratory and pilot scale experiments since this compound is present
in the wastewater of an INNOWATECH partner.
25
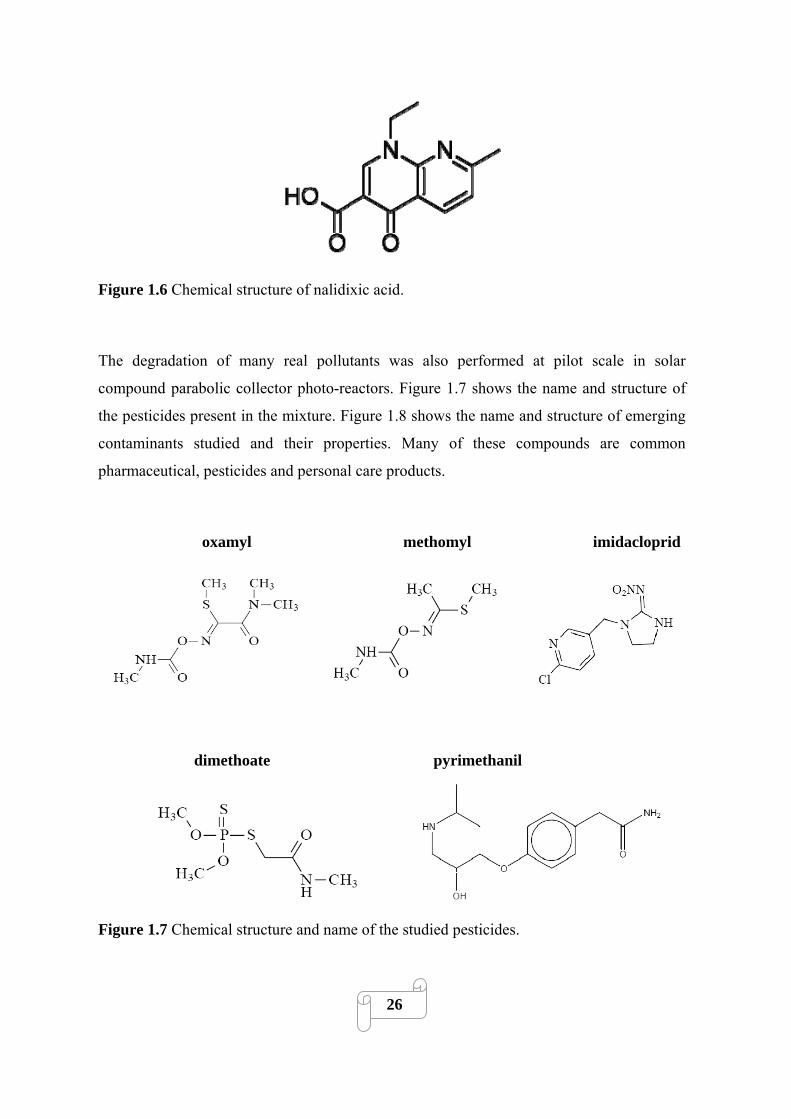
Figure 1.6 Chemical structure of nalidixic acid.
The degradation of many real pollutants was also performed at pilot scale in solar
compound parabolic collector photo-reactors. Figure 1.7 shows the name and structure of
the pesticides present in the mixture. Figure 1.8 shows the name and structure of emerging
contaminants studied and their properties. Many of these compounds are common
pharmaceutical, pesticides and personal care products.
oxamyl methomyl imidacloprid
dimethoate pyrimethanil
Figure 1.7 Chemical structure and name of the studied pesticides.
26

atenolol acetaminophen
(beta-blocker) (analgesic/antipyretic)
metoprolol caffeine antipyrine
(beta-blocker) (stimulant) (analgesic)
sulfamethoxazole flumequine ketorolac
(Bacteriostatic antibiotic) (broadspectrum antibiotic) (anti-inflammatory)
27

atrazine isoproturon hydroxybiphenyl
(herbicide) (phenylurea herbicide) (biocide)
diclofenac progesterone triclosan
(anti-inflammatory) (hormone) (antibacterial/ fungal agent)
Figure 1.8 Names, structures and properties of emergent organic pollutants chosen for pilot
scale study.
1.5 References
Al-Hayek N., Dore M. (1990) Oxidation of phenols in water by hydrogen peroxide on alumine supported iron. Water Research 24: 973-982.
Bahnemann D.C.J., Fox M.A., Pelizzetti E., Pichat P., Serpone N. (1994) Photocatalytic Treatment of Waters. Boca Raton, Lewis Publishiers.
Bakardjieva S., Stengl V., Subrt J., Houskova V., Kalenda P. (2007) Photocatalytic efficiency of iron oxides: Degradation of 4-chlorophenol. Journal of Physics and Chemistry of Solids 68: 721-724.
Bandara J., Mielczarski J.A., Lopez A., Kiwi J. (2001) 2. Sensitized degradation of chlorophenols on iron oxides induced by visible light comparison with titanium oxide. Applied Catalysis B: Environmental 34: 321-333.
Bauer R., Waldner G., Fallmann H., Hager S., Klare M., Krutzler T., Malato S., Maletzky P. (1999) The photo-Fenton reaction and the TiO2/UV process for wastewater treatment – novel developments. Catalysis Today, 53: 131-144.
28
Bosnjakovic A., Kadirov M.K., Schlick S. (2007) Using ESR spectroscopy to study radical intermediates in proton-exchange membranes exposed to oxygen radicals. Research on Chemical Intermediates 33: 677-687.
Bossmann S H., Oliveros E., Göb S., Siegwart S., Dahlen E.P., Payawan L. Jr., Straub M., Worner M., Braun A.M. (1998) New evidence against hydroxyl radicals as reactive intermediates in the thermal and photochemically enhanced Fenton reactions. Journal of Physical Chemistry 102: 5542-5550.
Bouras P., Lianos P. (2008) Synergy effect in the combined photodegradation of an azo dye by titanium dioxide photocatalysis and photo-fenton oxidation. Catalysis Letters 123: 220-225.
Bozzi A., Yuranova T., Mielczarski J., Lopez A., Kiwi J. (2002) Abatement of oxalates catalyzed by Fe-silica structured surfaces via cyclic carboxylate intermediates in photo-Fenton reactions. Chemical Communications 19: 2202-2203.
Chatterjee S., Sarkar S., Bhattacharyya S.N.(1994) Photodegradation of phenol by visible light in the presence of colloidal Fe2O3. Journal of Photochemistry and Photobiology, A: Chemistry 81: 199-203.
Chen R., Pignatello J.J. (1997) Role of quinone intermediates as electron shuttles in Fenton and photoassisted Fenton oxidations of aromatic compounds. Environmental Science and Technology 31: 2399–2406.
De Laat J., Truong Le G., Legube B. (2004) A comparative study of the effects of chloride, sulfate and nitrate ions on the rates of decomposition of H2O2 and organic compounds by Fe(II)/H2O2 and Fe(III)/H2O2. Chemosphere 55: 715-723.
De León M.A., Castiglioni J., Bussi J., Sergio M. (2008) Catalytic activity of an iron-pillared montmorillonitic clay mineral in heterogeneous photo-Fenton process. Catalysis Today 133-135: 600-605.
Dhananjeyan M.R., Kiwi J., Albers P., Enea O. (2001) Photo-assisted immobilized Fenton degradation up to pH 8 of azo dye orange II mediated by Fe3+/Nafion/glass fibers. Helvetica Chimica Acta 84: 3433-3445.
Dindar B., Seven O. (2009) Photodegradation of 2,4-Dichlorophenoxy acetic acid on TiO2 ZnO and Fe2O3 by sunlight. Asian Journal of Chemistry 21: 2270-2282.
Du W., Xu Y., Wang Y. (2008) Photoinduced degradation of orange II on different iron (Hydr)oxides in aqueous suspension: Rate enhancement on addition of hydrogen peroxide, silver nitrate, and sodium fluoride. Langmuir 24: 175-181
Faust B., Hoigné J. (1990) Photolysis of hydroxy-complexes as sources of OH• radicals in clouds, fog and rain. Atmospheric Environment-Part A General Topics 24A: 79-89.
Feng J., Hu X., Yue P.L. (2003) A novel laponite clay-based Fe nanocomposite and its photo-catalytic activity in photo-assisted degradation of orange II. Chemical Engineering Science 58: 679-685.
Feng J., Hu X., Po L.Y. (2004) Discoloration and mineralization of Orange II using different heterogeneous catalysts containing Fe: A comparative study. Environmental Science and Technology 38: 5773-5778.
Feng J., Hu X., Yue P.L. (2005) Discoloration and mineralization of Orange II by using a bentonite clay-based Fe nanocomposite film as a heterogeneous photo-Fenton catalyst. Water Research 39: 89-96.
29
Feng J., Hu X., Yue P.L. (2006) Effect of initial solution pH on the degradation of Orange II using clay-based Fe nanocomposites as heterogeneous photo-Fenton catalyst. Water Research 40: 641-646.
Fenton H.J.H. (1894). Oxidation of tartaric acid in presence of iron. Journal of the Chemical Society, Transactions 65: 899-910.
Fernandez J., Bandara J., Lopez A., Buffat P., Kiwi, J. (1999) Photoassisted Fenton degradation of nonbiodegradable azo dye (orange II) in Fe-free solutions mediated by cation transfer membranes. Langmuir 15: 185–192.
Flynn C.M. Jr. (1984). Hydrolysis of inorganic iron(III) salts. Chemical Review 84: 31-41. Frank S.N., Bard A.J. (1977) Heterogeneous photocatalytic oxidation of cyanide and sulfite
in aqueous solutions at semiconductor powders. Journal of Physical Chemistry 81: 1484-1488.
Gallard H., De Laat J., Legube B. (1999) Spectrophotometric study of the formation of iron(III)–hydroperoxy complexes in homogeneous aqueous solution. Water Research 33: 2929-2936.
Gomathi Devi, L., Girish Kumar, S., Mohan Reddy, K., Munikrishnappa, C. (2009) Photo degradation of Methyl Orange an azo dye by Advanced Fenton Process using zero valent metallic iron: Influence of various reaction parameters and its degradation mechanism. Journal of Hazardous Materials 164: 459-467.
Grätzel M., Kiwi J., Morrison C.L., Davidson R.S., Tseung A.C.C. (1985) Visible-light-induced photodissolution of α-Fe2O3 powder in the presence of chloride anions. Journal of the Chemical Society, Faraday Transactions 1: Physical Chemistry in Condensed Phases 81: 1883-1890.
Guimarães I.R., Oliveira L.C.A., Queiroz P.F., Ramalho T.C., Pereira M., Fabris J.D., Ardisson J.D. (2008) Modified goethites as catalyst for oxidation of quinoline: Evidence of heterogeneous Fenton process. Applied Catalysis A: General 347: 89-93.
Haber F., Weiss J. (1934) The catalytic decomposition of hydrogen peroxide by iron salts. Proceedings of the Royal Society A, London 147: 332-351.
Hawker P.N., Twigg M.V. (1994). Iron: inorganic & coordination chemistry. In: King, P.B. (Ed.). Encyclopedia of Inorganic Chemistry. Wiley, Chichester, 1698-1725.
He J., Tao X., Ma W., Zhao J. (2002) Heterogeneous photo-Fenton degradation of an azo dye in aqueous H2O2/iron oxide dispersions at neutral pHs. Chemical Letters 1: 86-87.
He, Z., Zhu, R., Xu, X., Song, S., Chen, J., Xia, M. (2009) Ozonation combined with sonolysis for degradation and detoxification of m-nitrotoluene in aqueous solution. Industrial and Engineering Chemistry Research 48: 5578-5583.
Herrera Melián J.A., Doña Rodríguez J.M., Viera Suárez A., Tello Rendón E., Valdés Do Campo C., Arana J., Pérez Peña J. (2000) The photocatalytic disinfection of urban waste waters. Chemosphere 41: 323-327.
Herrmann J. M. (1999) Heterogeneous photo-catalysis: fundamentals and applications to the removal of various types of aqueous pollutants. Catalysis Today 53: 115-129.
Hoffmann M.R., Martin S.T., Choi W., Bahnemann D.W. (1995) Environmental applications of semiconductor photocatalysis. Chemical Reviews 95: 69-96.
Huang H.-H., Lu M.-C., Chen J.-N. (2001) Catalytic decomposition of hydrogen peroxide and 2-chlorophenol with iron oxides. Water Research 35: 2291-2299.
30

Huang Z., Maness P.C., Blake D.M., Wolfrum E.J., Smolinski S.L., Jacoby W.A. (2000) Bactericidal mode of titanium dioxide photocatalysis. Journal of Photochemistry and Photobiology A: Chemistry 130: 163-170.
Huyser S., Hawkins G.W. (1983) Ferrous ion catalyzed oxidations of 2-propanol with peroxyacetic acid. Journal of Organic Chemistry 48: 1705-1708.
IARC. (2006) Titanium dioxide Group 2B, Monographs on the evaluation of carcinogenic risks to humans, International Agency for Research on Cancer, World Health Organization, Lyon, vol. 9.
Ishibashi K-I., Nosaka Y., Hashimoto K., Fujishima A. (1998) Time-dependent behavior of active oxygen species formed on photoirradiated TiO2 films in air. Journal of Physical Chemistry B 102: 2117-2120.
Karunakaran C., Dhanalakshmi R. (2008) Semiconductor-catalyzed degradation of phenols with sunlight. Solar Energy Materials and Solar Cells 92: 1315-1321.
Kasiri M.B., Aleboyeh H., Aleboyeh A. (2008) Degradation of Acid Blue 74 using Fe-ZSM5 zeolite as a heterogeneous photo-Fenton catalyst. Applied Catalysis B: Environmental 84: 9-15.
Kavitha V., Palanivelu K. (2004) The role of ferrous ion in Fenton and photo-Fenton processes for the degradation of phenol. Chemosphere 55: 1235-1243.
Kiwi J., Lopez A. and Nadtochenko V. (2000) Mechanism and kinetics of the OH radical intervention during Fenton oxidation in the presence of a significant amount of radical scavenger (Cl-). Environmental Science and Technology 34: 2162-2168.
Kong S.-H., Watts R.J., Choi J.-H. (1998) Treatment of petroleum-contaminated soils using iron mineral catalyzed hydrogen peroxide. Chemosphere 37: 1473-1482.
Kormann C., Bahnemann D.W., Hoffmann M.R. (1989) Environmental photochemistry: Is iron oxide (hematite) an active photocatalyst? A comparative study: α-Fe2O3, ZnO, TiO2. Journal of Photochemistry and Photobiology, A: Chemistry 48: 161-169.
Kung H.H., Jarrett H.S., Sleight A.W., Ferretti A.(1977) Semiconducting oxide anodes in photoassisted electrolysis of water. Journal of Applied Physics 48: 2463-2469.
Kusić H., Koprivanac N., Bozić A.L., Selanec I. (2006) Photo-assisted Fenton type processes for the degradation of phenol: A kinetic study. Journal of Hazardous Materials 36: 632-644.
Kusic H., Koprivanac N., Horvat S., Bakija S., Bozic A.L. (2010) Modeling dye degradation kinetic using dark- and photo-Fenton type processes. Chemical Engineering Journal 155: 144-154.
Legrini O.O.E., Braun E.M. (1993) Photochemical processes for water-treatment. Chemical Reviews 93: 671-698.
Liao C.-H., Wantawin C., Lu M.-C., Huang C.-I. (2004) Fe0-based system as innovative technology for degrading trichloromethane: Redox removal characteristics. Environmental Science and Pollution Research 11: 254-259.
Lipczynska-Kochany E., Sprah G., Harms S. (1995) Influence of some groundwater and surface waters constituents on the degradation of 4-chlorophenol by the Fenton reaction. Chemosphere 30: 9-20.
Litter M.I., Blesa M.A.(1988) Photodissolution of iron oxides. I. Maghemite in EDTA solutions. Journal of Colloid And Interface Science 125: 679-687.
31
Litter M.I., Navío J.A. (1994) Comparison of the photocatalytic efficiency of TiO2, iron oxides and mixed Ti(IV)Fe(III) oxides: photodegradation of oligocarboxylic acids. Journal of Photochemistry and Photobiology, A: Chemistry 84: 183-193.
Litter M. I. (1999). Heterogeneous photocatalysis: Transition metal ions in photocatalytic systems. Applied Catalysis B: Environmental 23: 89-114.
Lu M.-C. (2000) Oxidation of chlorophenols with hydrogen peroxide in the presence of goethite. Chemosphere 40:125-130.
Lv X., Xu Y., Lv K., Zhang G. (2005) Photo-assisted degradation of anionic and cationic dyes over iron(III)-loaded resin in the presence of hydrogen peroxide. Journal of Photochemistry and Photobiology A: Chemistry 173: 121-127.
Maciel R., Sant’Anna G.L. and Dezotti M. (2004). Phenol removal from high salinity effluents using Fenton's reagent and photo-Fenton reactions. Chemosphere 57: 711-719.
Maletzky P., Bauer R., Lahnsteiner J., Pouresmael B. (1999) Immobilisation of iron ions on Nafion® and its applicability to the Photo-Fenton method. Chemosphere 38: 2315-2325.
Martin S., Herrmann H., Hoffmann M. (1994). Time-resolved microwave conductivity, Part 2. Quantum sized TiO2 and the effect of adsorbates and light intensity on charge-carrier dynamics. Journal of Chemical Society Faraday Transcription 90: 3323-3330.
Mazellier P., Bolte M. (2000) Heterogeneous light-induced transformation of 2,6-dimethylphenol in aqueous suspensions containing goethite. Journal of Photochemistry and Photobiology A: Chemistry 132: 129-135.
Mazellier P., Sulzberger B. (2001) Diuron degradation in irradiated, heterogeneous iron/oxalate systems: The rate-determining step. Environmental Science and Technology 35: 3314-3320.
Mills A., Le Hunte S. (1997) An overview of semiconductor photocatalysis. Journal of Photochemistry and Photobiology A: Chemistry 108: 1-35.
Muthuvel I., Swaminathan M. (2007) Photoassisted Fenton mineralisation of Acid Violet 7 by heterogeneous Fe(III)-Al2O3 catalyst. Catalysis Communications 8: 981-986.
Nie Y., Hu C., Qu J., Zhou L., Hu X. (2007) Photoassisted degradation of azodyes over FeOxH 2x-3/Fe0 in the presence of H2O2 at neutral pH values. Environmental Science and Technology 41: 4715-4719.
Nie Y., Hu C., Qu J., Zhao X. (2009) Photoassisted degradation of endocrine disruptors over CuOx-FeOOH with H2O2 at neutral pH. Applied Catalysis B: Environmental 87: 30-36.
Noorjahan M., Durga Kumari V., Subrahmanyam M., Panda L.(2005) Immobilized Fe(III)-HY: An efficient and stable photo-Fenton catalyst. Applied Catalysis B: Environmental 57: 291-298.
Nosaka Y., Nakamura M., Hirakawa T. (2002) Behavior of superoxide radicals formed on TiO2 powder photocatalysts studied by a chemiluminescent probe method. Physical Chemistry Chemical Physics 4: 1088-1092.
Ollis D.F., Al-Ekabi H. (1993). Photocatalytic Purification and Treatment of Water and Air. D. F. (Eds). Amsterdam, Elsevier.
32

Ononye A.I.,. McIntosh A.R, Bolton J.R. (1986) Mechanism of the photochemistry of p-benzoquinone in aqueous solutions. 1. Spin trapping and flash photolysis electron paramagnetic resonance studies. Journal of Physical Chemistry, 90: 6266-6270.
Ortiz de la Plata G.B., Alfano O.M., Cassano A.E. (2008), Optical properties of goethite catalyst for heterogeneous photo-Fenton reactions. Comparison with a titanium dioxide catalyst. Chemical Engineering Journal 137: 396-410.
Pal B., Sharon M.(1998) Photocatalytic degradation of salicylic acid by colloidal Fe2O3 particles. Journal of Chemical Technology and Biotechnology 73: 269-273.
Pelizzetti E., Borgarello M., Minero C., Pramauro E., Borgarello E., Serpone N. (1988) Photocatalytic degradation of polychlorinated dioxins and polychlorinated biphenyls in aqueous suspensions of semiconductors irradiated with simulated solar light. Chemosphere 17: 499-510.
Peyton G. R. (1990) Oxidative treatment methods for removal of organic compounds from drinking water supplies. Chelsea MI, Lewis Publishers.
Pichat P., Guillard C., Amalric L., Renard A.-C., Plaidy O. (1995). Assessment of the importance of the role of H2O2 and O2o- in the photocatalytic degradation of 1,2- dimethoxybenzene. Solar Energy Materials and Solar Cells 38: 391-399.
Pignatello J.J. (1992). Dark and Photoassisted Fe3+-Catalyzed Degradation of Chlorophenoxy Herbicides by Hydrogen Peroxide. Environmental Science and Technology 26: 944-951.
Pignatello J.J., Oliveros E., MacKay A. (2006) Advanced oxidation processes for organic contaminant destruction based on the fenton reaction and related chemistry. Critical Reviews in Environmental Science and Technology 36:1-84.
Pozzo R.L., Baltanas M.A., Cassano A.E. (1997) Supported titanium oxide as photocatalyst in water decontamination: State of the art. Catalysis Today 39: 219-231.
Pulgarin C., Kiwi J. (1995) Iron oxide-mediated degradation, photodegradation, and biodegradation of aminophenols. Langmuir 11: 519-526.
Prousek J., Palacková E., Priesolová S., Marková L., Alevová A. (2007), Fenton- and Fenton-like AOPs for wastewater treatment: From laboratory-to-plant-scale application. Separation Science and Technology 42:1505-1520.
Ramsden C.S., Smith T.J., Shaw B.J., Handy R.D. (2009) Dietary exposure to titanium dioxide nanoparticles in rainbow trout, (Oncorhynchus mykiss): No effect on growth, but subtle biochemical disturbances in the brain. Ecotoxicology 18: 939-951.
Rincón A.G., Pulgarin C., Adler N., Peringer, P. (2001) Interaction between E. coli inactivation and DBP-precursors - dihydroxybenzene isomers - in the photocatalytic process of drinking-water disinfection with TiO2. Journal of Photochemistry and Photobiology A: Chemistry 139: 233-241.
Rios-Enriquez M., Shahin N., Durán-De-Bazúa C., Lang J., Oliveros E., Bossmann S.H., Braun A.M. (2004) Optimization of the heterogeneous Fenton-oxidation of the model pollutant 2,4-xylidine using the optimal experimental design methodology. Solar Energy 77: 491-501.
Robertson P.K.J. (1996). Semiconductor photocatalysis: An environmentally acceptable alternative production technique and effluent treatment process. Journal of Cleaner Production 4: 203-212.
Sabhi S., Kiwi J. (2001) Degradation of 2,4-dichlorophenol by immobilized iron catalysts, Water Research. 35: 1994–2002.
33

Safarzadeh-Amiri A., Bolton J.R., Cater S.R. (1996a). The use of iron in Advanced Oxidation Processes. Journal of Advanced Oxidation Technology 1: 18-26.
Safarzadeh-Amiri A., Bolton J.R. and Carter S.R. (1996b). Ferrioxalate-mediated solar degradation of organic contaminants in water. Solar Energy 56: 439-444.
Schwarzenbach R. P., Escher B. I., Fenner K., Hofstetter T. B., Johnson C. A., Von Gunten U., Wehrli B. (2006) The challenge of micropollutants in aquatic systems. Science 313: 1072-1077.
Sherman D.M. (2005) Electronic structures of iron(III) and manganese(IV) (hydr)oxide minerals: Thermodynamics of photochemical reductive dissolution in aquatic environments. Geochimica et Cosmochimica Acta 69: 3249-3255.
Sulzberger B., Laubscher H. (1995) Photoredox reactions at the surface of iron(III)(hydr-) oxides. Marine chemistry 50: 103-115.
Sun Y., Pignatello J.J. (1992). Chemical treatment of pesticide wastes. Evaluation of Fe(III) chelates for catalytic hydrogen peroxide oxidation of 2,4-D at circumneutral pH. Journal of Agricultural and Food Chemistry 40: 322-327.
Sychev A.Y., Isaak V.G. (1995). Iron compounds and the mechanisms of the homogeneous catalysis of the activation of O2 and H2O2 and of the oxidation of organic substrates. Russian Chemical Review 64: 1105-1129.
Teel A.L., Warberg C.R., Atkinson D.A., Watts R.J. (2001) Comparison of mineral and soluble iron Fenton's catalysts for the treatment of trichloroethylene. Water Research 35: 977-984.
Tryba B., Morawski A.W., Inagaki M., Toyoda M. (2006) The kinetics of phenol decomposition under UV irradiation with and without H2O2 on TiO2, Fe-TiO2 and Fe-C-TiO2 photocatalysts. Applied Catalysis B: Environmental 63: 215-221.
Tryba B. (2008) Immobilization of TiO2 and Fe-C-TiO2 photocatalysts on the cotton material for application in a flow photocatalytic reactor for decomposition of phenol in water. Journal of Hazardous Materials 151: 623-627.
Tyre B.W., Watts R.J., Miller G.C., Tyre B.W., Watts R.J., Miller G.C. (1991) Treatment of four biorefractory contaminants in soils using catalyzed hydrogen peroxide. Journal of Environmental Quality 20: 832-838.
UN (2005) http://www.un.org/waterforlifedecade/background.html UNEP (2002) Global environment outlook 3. Nairobi, Kenya. Valenzuela M.A., Bosch P., Jiménez-Becerrill J., Quiroz O., Páez A.I. (2002) Preparation,
characterization and photocatalytic activity of ZnO, Fe2O3 and ZnFe2O4. Journal of Photochemistry and Photobiology A: Chemistry 148:177-182
Voelker B.M., Morel F.M.M., Sulzberger B. (1997) Iron redox cycling in surface waters: Effects of humic substances and light. Environmental Science and Technology 31: 1004-1011
von Sonntag C., Dowideit P., Fang X., Mertens R., Pan X., Schuchmann M. N. and Schuchmann H.-P. (1997). The fate of peroxyl radicals in aqueous solution. Water Science and Technology 35: 9-15.
Walling C. (1975). Fenton’s reagent revisited. Accounts of Chemical Research 8: 125-131. Walte T.D., Morel F.M.M. (1984) Photoreductive dissolution of colloidal iron oxides in
natural waters. Environmental Science and Techcnology 18: 860-868.
34

Watts R.J., Udell M.D., Monsen R.M. (1993) Use of iron minerals in optimizing the peroxide treatment of contaminated soils Water. Environment Research 65: 839-844.
Wolfrum E. J., Ollis D.F. (1994). Hydrogen peroxide in heterogeneous photocatalysis., in Aquatic and Surface Photochemistry. G. R. Helz, R. G. Zepp and D. G. Crosby, (Eds). Boca Raton, Lewis Publishiers. 451-463.
Xu M.-J., Wang Q.-S., Hu C.-X. (2009) Treatment of wastepaper pulp wastewater by heterogeneous photo-Fenton process. Harbin Gongye Daxue Xuebao/Journal of Harbin Institute of Technology 41:142-148.
Yaping Z., Jiangyong H. (2008) Photo-Fenton degradation of 17β-estradiol in presence of α-FeOOHR and H2O2. Applied Catalysis B: Environmental 78: 250-258.
Zepp R.G., Faust B.C., Hoigné J. (1992). Hydroxyl radical formation in aqueous reactions (pH 3-8) of iron(II) with hydrogen peroxide: The photo-Fenton reaction. Environmental Science And Technology 26: 313-319.
Zhang Y., Dou X., Liu J., Yang M., Zhang L., Kamagata Y. (2007) Decolorization of reactive brilliant red X-3B by heterogeneous photo-Fenton reaction using an Fe-Ce bimetal catalyst. Catalysis Today 126: 387-393.
Zhang Y.-Y., He C., Deng J.-H., Tu Y.-T., Liu J.-K., Xiong Y. (2009) Photo-Fenton-like catalytic activity of nano-lamellar Fe2V4O13 in the degradation of organic pollutants. Research on Chemical Intermediates 1-11.
Zhang Q., Jiang W.-F., Wang H.-L., Chen M.-D. (2010) Oxidative degradation of dinitro butyl phenol (DNBP) utilizing hydrogen peroxide and solar light over a Al2O3-supported Fe(III)-5-sulfosalicylic acid (ssal) catalyst. Journal of Hazardous Materials 176: 1058-1064.
35

36
2- PHYSICO-CHEMICAL PROPERTIES AND
PHOTOREACTIVITY RELATIONSHIP IN
HOMOGENEOUS PHOTO-FENTON SYSTEM
2.1 Introduction
The photocatalytic degradation rate of different compounds depends on various parameters,
such as temperature, pH, initial concentration of the pollutant, Fe2+ and H2O2
concentrations, light intensity, and chemical nature (structure) of the reactants. The
photochemical degradation of phenol and its derivates using TiO2 photocatalysis (Serpone,
1997; Chun, 2000; Arana, 2001; Villasenor, 2002; Colon, 2003; Sobczynski, 2004; Vione,
2005; Colon, 2006) or photo-Fenton oxidation (Herrera, 1998; Arana, 2001; Goi, 2002;
Gernac, 2003; Kavitha, 2004; Kusic, 2006) has been reported during the last decade. The
catalytic degradation is affected by the number of substitutents, their electronic nature and
their position in the aromatic ring (Tseng, 1991; D’Oliviera, 1993; O’Shea, 1994; Amalric
1996; Assabane, 2000; Torres, 2002; Parra, 2003; Lapertot, 2006; Karunakaran, 2006;
Palmisano, 2007). In particular, quantitative structure-reactivity relationships (QSRR)
during the degradation of para-substituted phenols for TiO2 photocatalysis (Parra, 2003)
and electrocatalytic oxidation (Torres, 2002) have been reported. The results have shown
correlation between molecular structure and the kinetic parameters showing that p-halogen-
phenols react in a different way than their non-halogenated analogues. A recent study
predicted the oxidation positions in the benzene ring using frontier electron density theory
to describe the reactivity (Byung-Dae, 2001). In photo-Fenton processes, only few reports
are available on nitrophenol degradation (Kiwi, 1994; Kavitha, 2005), cyclic organic water
contaminant (Ruppert, 1993) and for polychlorinated dibenzo-p-dioxins (Sun, 2008).
However, no systematic correlation of molecular structure and degradation kinetics was
performed.
37

In this chapter, the Hammett constants (σ), 1-octanol/water partition coefficient (Kow),
calculated energy of the highest occupied molecular orbital (EHOMO), zero point energy
(EZERO) and experimental half-wave potential (E1/2) were correlated with the experimental
initial rates of degradation calculated with Eq. 2.1.
r S S (2.1)
Hammett constants (σ) describe the effect different substituent induced on the electronic
density of the aromatic ring. σ directly relates the ionization potential and the susceptibility
of a molecule to undergo electrophilic attack. The energy of the highest occupied molecular
orbital (EHOMO) is a useful parameter to model radical reactions and was calculated by
Aptula et al (Aptula, 2002). Kow represents the molecular hydrophobicity of a given
compound. A high value of Kow (>1000) means that the molecule has a great affinity for
organic solvents but not for water. Some studies have correlated Kow with the molecular
biological properties. The half wave potential (E1/2) corresponds to the oxidation of phenols
to phenoxyl radicals via Eq. 2.2. The zero point energies were calculated by Gross et al
(Gross, 2001). The absorption peaks were measured by UV-visible spectrophotometry.
PhOH PhO• H e (2.2)
The biodegradability of substituted phenols solutions depends on electronic effects, on their
transport ability through the bacteria membranes and on the toxic effect of a given
substituent. In this chapter, the biodegradability of para-substituted phenol solutions
degraded by a photo-Fenton process was determined to see how the nature of the
substituent affects the biodegradability of the generated degradation intermediate.
2.2 Experimental
2.2.1 Chemicals
The used organic compounds: phenol (p-H), 4-nitrophenol (p-NO2), 4-chlorophenol (p-Cl),
4-hydroxybenzaldehyde (p-CHO), 4-hydroxyphenol (p-OH) and iron sulfate (II)
38
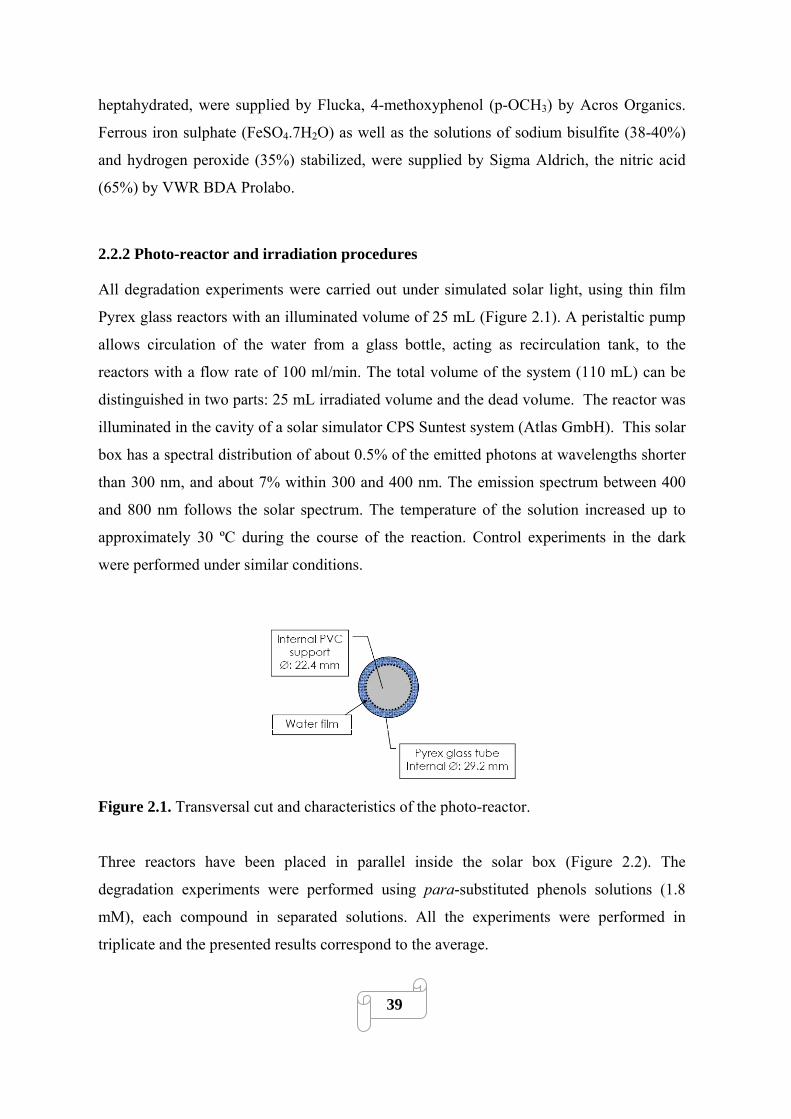
heptahydrated, were supplied by Flucka, 4-methoxyphenol (p-OCH3) by Acros Organics.
Ferrous iron sulphate (FeSO4.7H2O) as well as the solutions of sodium bisulfite (38-40%)
and hydrogen peroxide (35%) stabilized, were supplied by Sigma Aldrich, the nitric acid
(65%) by VWR BDA Prolabo.
2.2.2 Photo-reactor and irradiation procedures
All degradation experiments were carried out under simulated solar light, using thin film
Pyrex glass reactors with an illuminated volume of 25 mL (Figure 2.1). A peristaltic pump
allows circulation of the water from a glass bottle, acting as recirculation tank, to the
reactors with a flow rate of 100 ml/min. The total volume of the system (110 mL) can be
distinguished in two parts: 25 mL irradiated volume and the dead volume. The reactor was
illuminated in the cavity of a solar simulator CPS Suntest system (Atlas GmbH). This solar
box has a spectral distribution of about 0.5% of the emitted photons at wavelengths shorter
than 300 nm, and about 7% within 300 and 400 nm. The emission spectrum between 400
and 800 nm follows the solar spectrum. The temperature of the solution increased up to
approximately 30 ºC during the course of the reaction. Control experiments in the dark
were performed under similar conditions.
Figure 2.1. Transversal cut and characteristics of the photo-reactor.
Three reactors have been placed in parallel inside the solar box (Figure 2.2). The
degradation experiments were performed using para-substituted phenols solutions (1.8
mM), each compound in separated solutions. All the experiments were performed in
triplicate and the presented results correspond to the average.
39
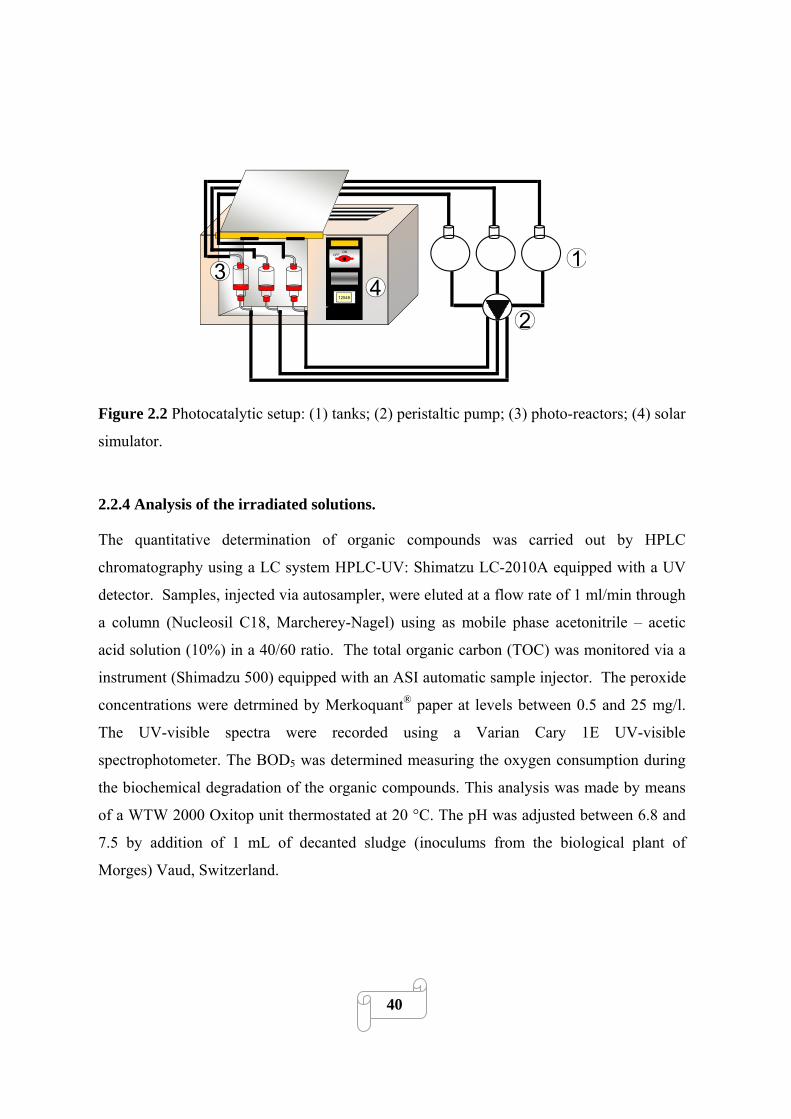
ONOFF
12548
1
2
34
Figure 2.2 Photocatalytic setup: (1) tanks; (2) peristaltic pump; (3) photo-reactors; (4) solar
simulator.
2.2.4 Analysis of the irradiated solutions.
The quantitative determination of organic compounds was carried out by HPLC
chromatography using a LC system HPLC-UV: Shimatzu LC-2010A equipped with a UV
detector. Samples, injected via autosampler, were eluted at a flow rate of 1 ml/min through
a column (Nucleosil C18, Marcherey-Nagel) using as mobile phase acetonitrile – acetic
acid solution (10%) in a 40/60 ratio. The total organic carbon (TOC) was monitored via a
instrument (Shimadzu 500) equipped with an ASI automatic sample injector. The peroxide
concentrations were detrmined by Merkoquant® paper at levels between 0.5 and 25 mg/l.
The UV-visible spectra were recorded using a Varian Cary 1E UV-visible
spectrophotometer. The BOD5 was determined measuring the oxygen consumption during
the biochemical degradation of the organic compounds. This analysis was made by means
of a WTW 2000 Oxitop unit thermostated at 20 °C. The pH was adjusted between 6.8 and
7.5 by addition of 1 mL of decanted sludge (inoculums from the biological plant of
Morges) Vaud, Switzerland.
40

2.3 Results and Discussion
2.3.1 Preliminary experiments
2.3.1.1 Selection of Fenton reagent concentration
The concentration of the Fenton reagents (Fe2+/H2O2) during pollutant degradation has to
be chosen carefully, to be able to observe the slight differences caused by the different
substituents. In the case of photo-Fenton degradation of 2 mM phenol, optimal
concentrations are [Fe2+]= 45 mg/L and [H2O2]= 30 mM (Kavitha, 2004).
0
0.2
0.4
0.6
0.8
1
0 60 120 180Time (min)
[TO
C],
[p-H
](C
/C0)
Figure 2.3 Substance (unfilled symbols) and TOC (filled symbols) removal during photo-
Fenton degradation of phenol (1.8 mM) for different Fe2+ concentrations (- - : 10 mg/L; -
- : 3 mg/L;-▲- : 1 mg/L) in presence of H2O2 (15 mM).
Figure 2.3 presents the evolution of phenol and TOC concentrations during photo-Fenton
oxidation for different Fe2+ concentrations (1, 3 and 10 mg/L) in the presence of H2O2 (15
mM). Figure 2.3 shows that total phenol degradation is achieved in three hours and that the
initial degradation rate depends on iron concentration leading to 10, 50 and 80% abatement
within 15 min. for 1, 3 and 10 mg/L, respectively. Figure 2.3 shows as well that the
mineralization process is dependent on [Fe2+], with 20, 60, 95% TOC removal for [Fe2+] =
1, 3 and 10 mg/L, respectively. For the intermediate concentration of 3 mg/L, the
41
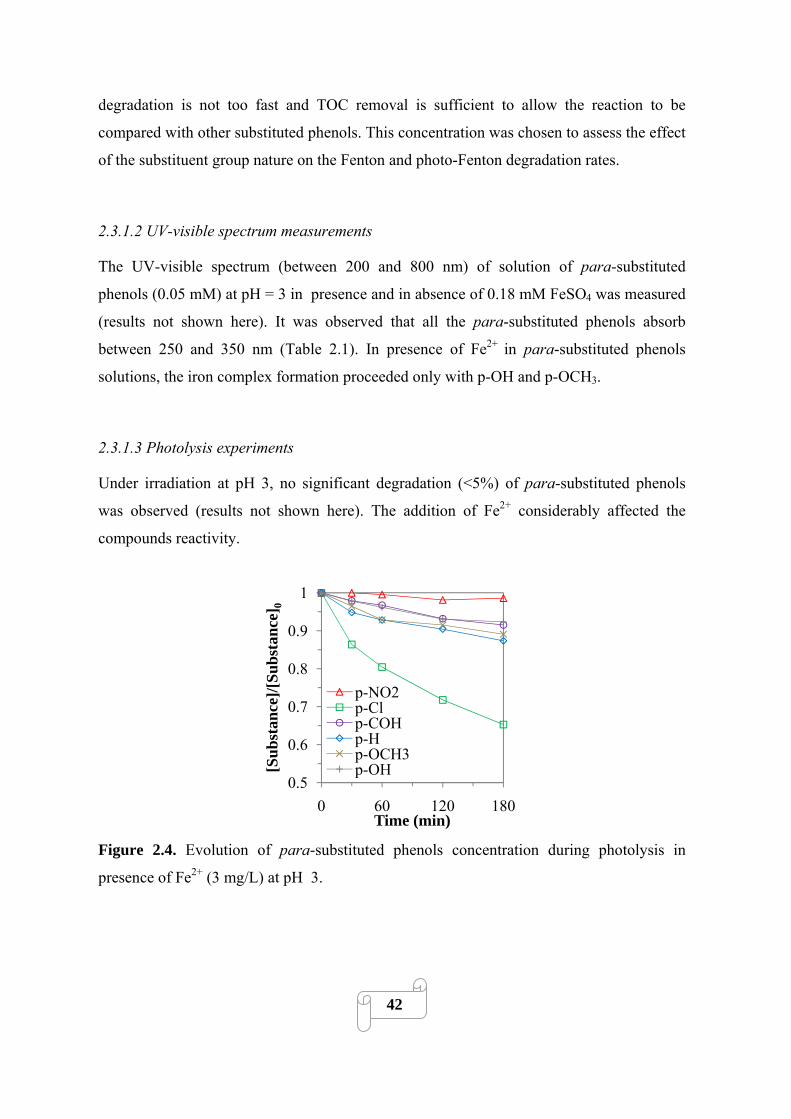
degradation is not too fast and TOC removal is sufficient to allow the reaction to be
compared with other substituted phenols. This concentration was chosen to assess the effect
of the substituent group nature on the Fenton and photo-Fenton degradation rates.
2.3.1.2 UV-visible spectrum measurements
The UV-visible spectrum (between 200 and 800 nm) of solution of para-substituted
phenols (0.05 mM) at pH = 3 in presence and in absence of 0.18 mM FeSO4 was measured
(results not shown here). It was observed that all the para-substituted phenols absorb
between 250 and 350 nm (Table 2.1). In presence of Fe2+ in para-substituted phenols
solutions, the iron complex formation proceeded only with p-OH and p-OCH3.
2.3.1.3 Photolysis experiments
Under irradiation at pH 3, no significant degradation (<5%) of para-substituted phenols
was observed (results not shown here). The addition of Fe2+ considerably affected the
compounds reactivity.
0.5
0.6
0.7
0.8
0.9
1
0 60 120 180
[Sub
stan
ce]/[
Subs
tanc
e]0
Time (min)
p-NO2p-Clp-COHp-Hp-OCH3p-OH
Figure 2.4. Evolution of para-substituted phenols concentration during photolysis in
presence of Fe2+ (3 mg/L) at pH 3.
42
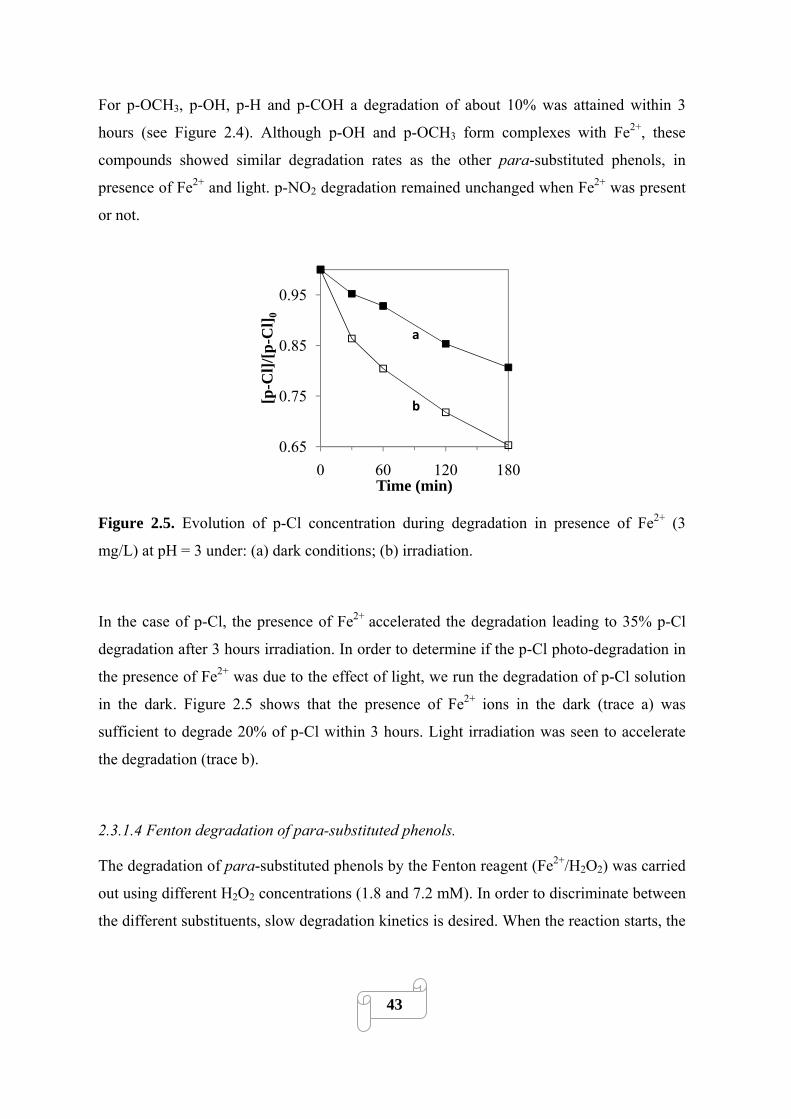
For p-OCH3, p-OH, p-H and p-COH a degradation of about 10% was attained within 3
hours (see Figure 2.4). Although p-OH and p-OCH3 form complexes with Fe2+, these
compounds showed similar degradation rates as the other para-substituted phenols, in
presence of Fe2+ and light. p-NO2 degradation remained unchanged when Fe2+ was present
or not.
0.65
0.75
0.85
0.95
0 60 120 180
[p-C
l]/[p
-Cl] 0
Time (min)
a
b
Figure 2.5. Evolution of p-Cl concentration during degradation in presence of Fe2+ (3
mg/L) at pH = 3 under: (a) dark conditions; (b) irradiation.
In the case of p-Cl, the presence of Fe2+ accelerated the degradation leading to 35% p-Cl
degradation after 3 hours irradiation. In order to determine if the p-Cl photo-degradation in
the presence of Fe2+ was due to the effect of light, we run the degradation of p-Cl solution
in the dark. Figure 2.5 shows that the presence of Fe2+ ions in the dark (trace a) was
sufficient to degrade 20% of p-Cl within 3 hours. Light irradiation was seen to accelerate
the degradation (trace b).
2.3.1.4 Fenton degradation of para-substituted phenols.
The degradation of para-substituted phenols by the Fenton reagent (Fe2+/H2O2) was carried
out using different H2O2 concentrations (1.8 and 7.2 mM). In order to discriminate between
the different substituents, slow degradation kinetics is desired. When the reaction starts, the
43

44
solution becomes orange-brown within few minutes. Figure 2.6 (i) shows the para-
substituted phenols degradation versus time for an initial H2O2 concentration of 1.8 mM.
From this result, it was found that for the electron-donating substitutents (i.e. -H, -OCH3
and -OH), the Fenton degradation process stops after 30 min treatment (with about 40, 50
and 30% degradation respectively) even if H2O2 was not totally consumed. The p-OH, p-
OCH3, p-H and/or their degradation intermediates form stable complexes with iron. This
complex formation induces an inhibition of initial compounds degradation since the iron
ions were not available for a subsequent degradation. However, the degradation of
intermediates continues and the production of polymers (tannins Arana, 2001) might occur
as well, since no residual H2O2 was detected at the end of the treatment.
Figure 2.6. Evolution of para-substituted phenols concentration during Fenton degradation
in presence of Fe2+ (3 mg/L) at pH = 3 with H2O2 (i) 1.8 mM; (ii) 7.2 mM.
For the electron-withdrawing substituents, (i.e. -COH and-NO2), the inhibition was not
observed since the degradation continues until the H2O2 was totally consumed. The
remaining H2O2 concentration was zero and 0.03 mM for p-CHO and p-NO2 respectively.
In the case of p-Cl, H2O2 final concentration was observed to be still high (>0.8 mM)
despites the fast p-Cl degradation. Consequently these results suggest that p-Cl reacts via a
different pathway than other para-substituted phenols.
0
0.2
0.4
0.6
0.8
1
0 60 120 180
[Sub
stan
ce]/[
Subs
tanc
e]0
Time (min)
p-NO2 p-Cl
p-COH p-H
p-OCH3 p-OH
(i)
0
0.2
0.4
0.6
0.8
1
0 30 60 90 12
[Sub
stan
ce]/[
Subs
tanc
e]0
Time (min)0
p-NO2p-Clp-COHp-Hp-OCH3p-OH
(ii)

45
Figure 2.6 (ii) shows the para-substituted phenols degradation versus time for an initial
H2O2 concentration of 7.2 mM. Under these conditions (closer to the optimal Fenton
concentration), almost total degradation was achieved after 2 hours for all the compounds
and the reaction inhibition was not observed.
2.3.2 Photo-Fenton experiments
Figure 2.7 depicts the evolution of the para-substituted phenol concentrations versus time
for homogeneous photo-Fenton reaction with H2O2 7.2 mM. The results show that, except
for p-NO2, the degradation was fast reaching 80-90% in 15 min treatment. p-NO2 was
slowly degraded by TiO2 (Parra, 2003) and is highly bio-recalcitrant. The degradation of p-
Cl was the fastest among the tested para-substituted phenols in analogy with Fenton
oxidation (point 2.3.1.4). The compounds p-OCH3, p-COH, p-OH have similar degradation
rates confirming the low selectivity of photo-Fenton reaction. The substances degradation
is faster as shown in Figure 2.7 than in Figure 2.6, confirming the light enhancement of the
Fenton rates.
Figure 2.7 Evolution of para-substituted phenols concentration, during photo-Fenton
degradation in presence of Fe2+ (3 mg/L) at pH = 3 with H2O2 7.2 mM.
0
0.2
0.4
0.6
0.8
1
0 10 20 3
[Sub
stan
ce]/[
Subs
tanc
e]0
Time (min)0
p-NO2p-Clp-COHp-Hp-OCH3p-OH

The TOC evolution during the treatment was followed next. From Figure 2.8(i), for the 6-C
compounds differences were observed in the initial degradation stages but the overall
mineralization was similar, independently of the substituent nature. The differences
between these compounds were within experimental error (2-3%). These observations
confirm a low selectivity of photo-Fenton oxidation during mineralization. The fact that p-
Cl degrades fast (point 2.3.1) did not distinguish p-Cl from the other para-substituted
phenols in the mineralization process. For the compounds containing seven carbons,
significant differences were observed between p-CHO and p-OCH3 (Figure 2.8(ii)). The
mineralization process was faster for p-CHO than for p-OCH3 because the aliphatic carbon
had an oxidation state of + I against zero for p-OCH3.
0.2
0.4
0.6
0.8
1
0 60 120 180
[TO
C]/[
TOC
] 0
Time (min)
p-NO2p-Clp-Hp-OH
(i)
0.2
0.4
0.6
0.8
1
0 60 120 180
[TO
C]/[
TOC
] 0
Time (min)
p-COHp-OCH3
(ii)
Figure 2.8. TOC removal during para-substituted phenols photo-Fenton degradation in
presence of Fe2+ at pH = 3 with H2O2 15 mM for (i) six carbon constituted compounds; (ii)
seven carbon constituted compounds.
The Eq. 2.3 suggests how the initial mineralization is accelerated in the case of p-CHO.
After a first radical attack on the carbon positioned out of the ring, a complex formation
may follow and a LMCT liberates a CO2 molecule. For the p-OCH3 more steps are needed
to attain the same result.
46

OH
+ 2 OH
O
-H2O
OH
O OH
+ Fe(III)Complexes Hydroquinone
CO2
LMTC
(2.3)
2.3.3 Quantitative structure reactivity relationship
Table 2.1 Physico-chemical descriptors from literature and measured initial rate constants.
X σa Kowb EHOMOc E1/2d Ezeroe λmaxf pKag rF0h rPF0h
NO2 0.81 70.8 -10.07 1.17 4.28 316 7.65 0.046 0.070
Cl 0.28 309 -9.12 0.90 3.1 280 9.43 0.131 0.266
CHO 0.22 27.5 -9.49 n.d. n.d. 284 7.62 0.073 0.201
H 0 30.2 -9.11 0.88 3.25 268 9.99 0.088 0.152
OCH3 -0.28 37.2 -8.65 0.65 2.35 275 10.20 0.122 0.204
OH -0.38 3.9 -8.72 0.42 2.36 288 9.91 0.127 0.195
a Hammett constants (σ) Parra, 2003 b 1-octanol/water partition coefficient (Kow) Aptula, 2002 c Calculated energy of the highest occupied molecular orbital in eV Aptula, 2002 d Experimental half wave potential (E1/2) in V, Hauser, 1998 e Calculated zero point corrected energies (Ezero) in eV, Gross, 2001 f Experimental maximal absorption wavelength (λmax) in nm g Acidity constants (pKa), Aptula, 2002 h Experimental initial degradation rate constants for Fenton (rF
0) and photo-Fenton (rPF0)
reactions in mM/min
47

2.3.3.1 QSRR for Fenton degradation
The relative initial rate of degradation (rF0) for para-substituted phenols and their
corresponding descriptors are shown in Table 2.1. Linear regressions were performed
plotting the initial Fenton rates (rF0) as a function of descriptors (results not shown). The
correlation coefficients (R2) are stated in Table 2.2. The p-Cl was excluded in this
correlation due to its atypical reactivity (points 2.3.1and 2.3.2).
Table 2.2 Correlation coefficients (R2) obtained after linear regression in the plots of initial
rates of degradation versus different descriptors (presented in appendices).
σ Kow EHOMO E1/2 Ezero pKa
Fenton degradationa 0.949 0.711 0.961 0.977 0.995 0.723
Photo-Fenton degradationb 0.975 0.679 0.996 0.847 0.986 0.662 a p-Cl excluded b p-Cl, p-CHO excluded
The plots of the electronic descriptors (EHOMO, E1/2, σ, EZERO) as a function of rF0 show
correlations with R2 = 0.961, 0.977, 0.949, 0.995, respectively. EHOMO and EZERO are
calculated descriptors corresponding to the molecule electronic energy. The degradations
were initially faster for molecules having low EHOMO and EZERO. σ describes the effect
induced by a given substituent on the electronic character of the aromatic ring. It was
observed that the lower the Hammett constant, the faster the degradation process due to the
electrophilic nature of hydroxyl radical. E1/2 describes the oxidation of phenols to phenoxyl
radicals via Eq. 2.2. The fact that the degradation kinetics was related to E1/2 suggests that
electophilic attack on the ring and on the alcohol group occurs. The plots for logKow, pKa,
as a function of r0 show a poor correlation.
The behavior of p-Cl is different from its analogues reacting faster than predicted by the
model. This p-Cl deviation was reported by Parra, 2003, for TiO2 photocatalytic treatment
and by Torres, 2002, for electrochemical oxidation, possibly due to the low C-Cl
dissociation energy (Table 2.3) and the high electronegativity of Cl.
48

2.3.3.2 QSRR for photo-Fenton degradation
The initial rate of photo-Fenton degradation (rPF0) for the different studied para-substituted
phenols and their corresponding descriptors are represented in Table 2.1. These descriptors
were used to establish a correlation with the initial degradation rates. Linear regressions
were performed plotting initial Fenton rates (rpF0) as a function of descriptors (results not
shown) and the correlation coefficients (R2) are represented in Table 2.2. Although the
plots of EHOMO, E1/2, σ, EZERO versus r0 showed a poor correlation (results not shown),
when p-Cl is evaluated separately and p-COH is not taken in account, a good correlation
(R2 = 0.996, 0.846, 0.975, 0.985, respectively) was observed. E1/2 was a good descriptor in
Fenton reaction but fails in the photo-Fenton system. Thus the reaction Eq. 2.2 probably
plays a less significant role in photo-Fenton process. The other electronic parameters
described well the reactivity when excluding p-CHO (that reacted in a “regular way” in
Fenton treatment). Kow and pKa were found to poorly correlate with rPF0. The deviation
observed for p-Cl is justified by previous observations (part 2.3.1, 2.3.2); for p-COH the
presence of a weak bond (Table 2.3) and the proposed mechanism in Eq. 2.3 might explain
this deviation.
Table 2.3 Homolytic dissociation energy of different bonds of the para-substituted
phenols.
Compound Weakest bond Homolytic dissociation energy (kJ/mol)
p-Cl C6H5-Cl 394
p-COH C6H5CO-H 377
Other p-Xs C6H5-H 460
2.3.4 Evolution of biodegradability of photo-Fenton treated solutions
To couple the photo-Fenton process with a biological treatment, it is important to know the
biodegradability of the solutions after the Fenton treatment (Bandara, 1997). The amount of
oxygen consumed in 5 days by aerobic microorganisms (BOD5) was measured to determine
if the substituent nature induced significant changes in the biodegradability of the treated
49
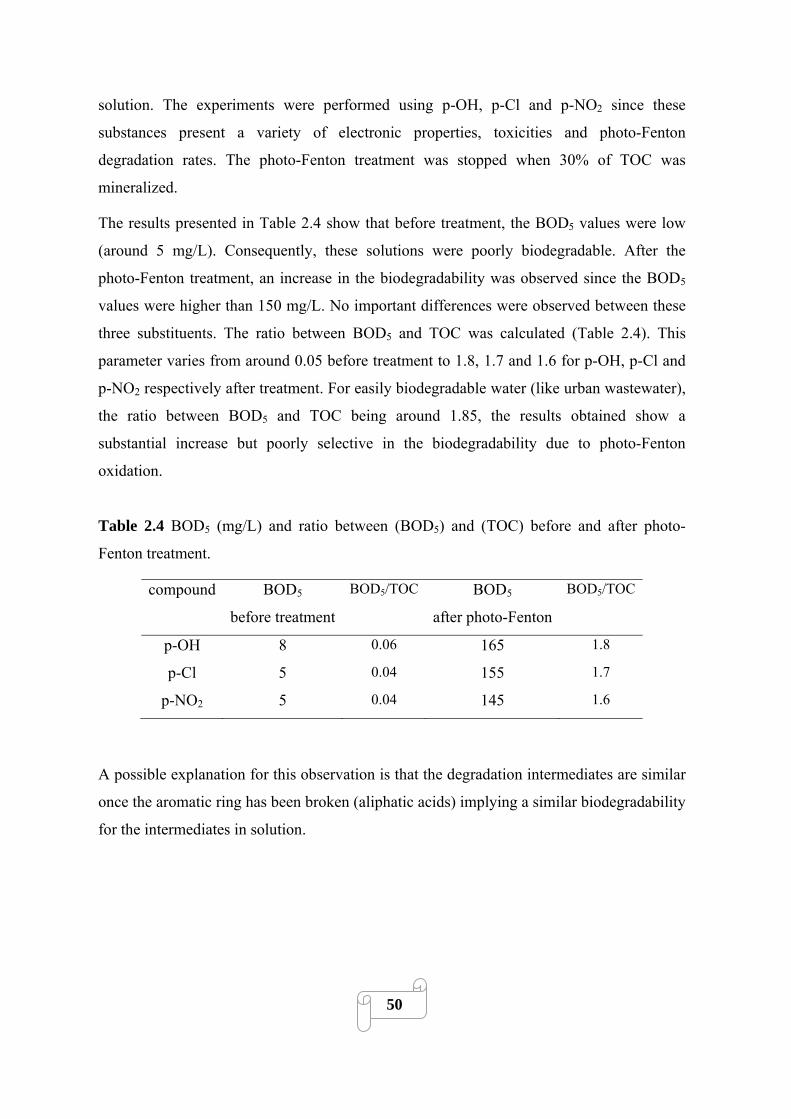
solution. The experiments were performed using p-OH, p-Cl and p-NO2 since these
substances present a variety of electronic properties, toxicities and photo-Fenton
degradation rates. The photo-Fenton treatment was stopped when 30% of TOC was
mineralized.
The results presented in Table 2.4 show that before treatment, the BOD5 values were low
(around 5 mg/L). Consequently, these solutions were poorly biodegradable. After the
photo-Fenton treatment, an increase in the biodegradability was observed since the BOD5
values were higher than 150 mg/L. No important differences were observed between these
three substituents. The ratio between BOD5 and TOC was calculated (Table 2.4). This
parameter varies from around 0.05 before treatment to 1.8, 1.7 and 1.6 for p-OH, p-Cl and
p-NO2 respectively after treatment. For easily biodegradable water (like urban wastewater),
the ratio between BOD5 and TOC being around 1.85, the results obtained show a
substantial increase but poorly selective in the biodegradability due to photo-Fenton
oxidation.
Table 2.4 BOD5 (mg/L) and ratio between (BOD5) and (TOC) before and after photo-
Fenton treatment.
compound BOD5
before treatment
BOD5/TOC BOD5 after photo-Fenton
BOD5/TOC
p-OH 8 0.06 165 1.8
p-Cl 5 0.04 155 1.7
p-NO2 5 0.04 145 1.6
A possible explanation for this observation is that the degradation intermediates are similar
once the aromatic ring has been broken (aliphatic acids) implying a similar biodegradability
for the intermediates in solution.
50
2.4. Conclusions
Para-substituted phenol reactivity is a function of the electronic effects induced by the
substituents. The Fenton and photo-Fenton degradation is faster when the electronic density
of the aromatic ring is high favoring electrophilic radical attack on the ring. The
degradation rates are higher when half wave potential is low. These results suggest
different reactions occurring at different positions on the molecule on the aromatic ring,
alcohol function, or on the substituent. The electronic descriptors (experimental and
calculated) fit well with the kinetic parameters particularly with the Fenton rates (excluding
p-Cl) but also with the photo-Fenton degradation rates (excluding p-Cl and p-CHO). The
photo-Fenton rates can be non-linearly correlated with electronic descriptors especially
when the reaction occurs rapidly at the substituents for p-CHO or p-Cl. This is possibly due
to the presence of weak bonds. The increase in biodegradability induced by photo-Fenton
treatment was significant but poorly selective regarding specific substituents. This is
probably due to the similarity of the degradation kinetics of the intermediates.
2.5 References
Amalric L., Guillard C., Blanc-Brude E., Pichat P. (1996) Correlation between the photocatalytic degradability over TiO2 in water of meta and para substituted methoxybenzenes and their electron density, hydrophobicity and polarizability properties. Water Research 30: 1137-1142.
Aptula A.O., Netzeva T.I., Valkova I.V., Cronin M.T.D., Schultz T.W., Khune R., Schurmann G. (2002) Multivariate discrimination between modes of toxic action of phenols. Quantitative Structure-Activity Relationship 21: 12-22.
Arana J., Tello Rendon E., Dona Rodrıguez J. M., Herrera Melian J.A., Gonzalez Dıaz O., Perez Pena J. (2001a) High concentrated phenol and 1,2-propylene glycol water solutions treatment by photocatalysis: Catalyst recovery and re-use. Applied Catalysis B: Environmental 30: 1-10.
Araña J., Tello-Rendón E., Doña-Rodríguez J.M., Valdés Do Campo C. (2001b) Highly concentrated phenolic wastewater treatment by heterogeneous and homogeneous photocatalysis: Mechanism study by FTIR-ATR. Water Science and Technology 44: 229-236.
Assabane A., Ait Ichou Y., Tahiri H., Guillard C., Herrmann J.-M. (2000) Photocatalytic degradation of polycarboxylic benzoic acids in UV-irradiated aqueous suspensions of titania. Identification of intermediates and reaction pathway of the photomineralization of trimellitic acid (1,2,4-benzene tricarboxylic acid). Applied Catalysis B: Environmental 24: 71-87.
51
Bandara J., Pulgarin C., Peringer P., (1997) Chemical (photo-activated) coupled biological homogeneous degradation of p-nitro-o-toluene-sulfonic acid in a flow reactor. Journal of photochemistry and photobiology A: Chemical 111: 253-263.
Byung-Dae L., Mamoru I., Masaaki H. (2001) Prediction of Fenton oxidation positions in polycyclic aromatic hydrocarbons by Frontier electron density Prediction of Fenton oxidation positions in polycyclic aromatic hydrocarbons by Frontier electron density. Chemosphere 42: 431-435.
Chun H., Yizhong W., Hongxiao T. (2000) Destruction of phenol aqueous solution by photocatalysis or direct photolysis. Chemosphere 41: 1205–1209.
Colon G., Hidalgo M.C., Navıo J. A. (2003) Photocatalytic behaviour of sulphated TiO2 for phenol degradation. Applied Catalysis B: Environmental 45: 39–50.
Colón G., Sánchez-España J.M., Hidalgo M.C., Navío J.A. (2006) Effect of TiO2 acidic pre-treatment on the photocatalytic properties for phenol degradation. Journal of Photochemistry and Photobiology A: Chemical 179: 20-27.
D'Oliveira J.–C., Guillard C., Maillard C., Pichat P. (1993) Photocatalytic destruction of hazardous chlorine- or nitrogen-containing aromatics in water. Journal of Environmental Science and Health A: Environmental Science and Engineering 28: 941-962.
Gernjak W., Krutzler T., Glaser A., Malato S., Caceres J., Bauer R., Fernández-Alba A.R. (2003) Photo-Fenton treatment of water containing natural phenolic pollutants. Chemosphere 50:71-78.
Goi A., Trapido M. (2002) Hydrogen peroxide photolysis, Fenton reagent and photo-Fenton for the degradation of nitrophenols: A comparative study. Chemosphere 46: 913-922.
Gross K.C., Seybold P.G. (2001) Substituent Effects on the Physical Properties and pKa of Phenol. International Journal of Quantum Chemistry 85: 569–579.
Hauser M.J.B., Olsen L.F. (1998) The role of naturally occurring phenols in inducing oscillations in the peroxidase-oxidase reaction. Biochemistry 37: 2458-2469.
Herrera F., Pulgarin C., Nadtochenko V., Kiwi J. (1998) Accelerated photo-oxidation of concentrated p-coumaric acid in homogeneous solution. Mechanistic studies, intermediates and precursors formed in the dark. Applied Catalysis B: Environmental 17: 141-156.
Karunakaran C., Dhanalakshmi R. (2006) Substituent Effect on Nano TiO2- and ZnO-Catalyzed Phenol Photodegradation Rates. International Journal of Chemical Kinetics 41: 275-283.
Kavitha V., Palanivelu K. (2004) The role of ferrous ion in Fenton and photo-Fenton processes for the degradation of phenol. Chemosphere 55: 1235-1243.
Kavitha V., Palanivelu K. (2005) Degradation of nitrophenols by Fenton and photo-Fenton processes. Journal of Photochemistry and Photobiology A: Chemical 170 83-95.
Kiwi J., Pulgarin C., Peringer P. (1994) Effect of Fenton and photo-Fenton reactions on the degradation and biodegradability of 2 and 4-nitrophenols in water treatment. Applied Catalysis B: Environmental 3: 335-350.
Kusić H., Koprivanac N., Bozić A.L., Selanec. Journal of Hazardous Materials 136: 632-644.
52
Lapertot M., Pichat P., Parra S., Guillard C., Pulgarin C. (2006) Photocatalytic degradation of p-halophenols in TiO2 aqueous suspensions: Halogen effect on removal rate, aromatic intermediates and toxicity variations. Journal of Environmental Science and Health A: Environmental Science and Engineering 41: 1009-1025.
O'Shea K.E., Cardona C., (1994) Hammett study on the TiO2-catalyzed photooxidation of para-substituted phenols. A kinetic and mechanistic analysis. Journal of Organic Chemistry 59: 5005-5009.
Parra S., Olivero J., Pacheco L., Pulgarin C. (2003) Structural properties and photoreactivity relationships of substituted phenols in TiO2 suspensions. Applied Catalysis B: Environmental 43: 293-301.
Palmisano G., Addamo M., Augugliaro V., Caronna T., Di Paola A., García López E., Loddo V., Marci G., Palmisano L., Schiavello M. (2007) Selectivity of hydroxyl radical in the partial oxidation of aromatic compounds in heterogeneous photocatalysis. Catalysis Today 122: 118-127.
Ruppert G., Bauer R., Heisler G., Novalic S. (1993) Mineralization of cyclic organic water contaminants by the Photo-Fenton reaction influence of structure and substituents, Chemosphere 27: 1339-1347.
Serpone N. (1997) Relative photonic efficiencies and quantum yields in heterogeneous photocatalysis. Journal of Photochemistry and Photobiology A: Chemical 104: 1–12.
Sobczynski A., Duczmal L., Zmudzinski W. (2004) Phenol destruction by photocatalysis on TiO2: An attempt to solve the reaction mechanism. Journal of Molecular Catalysis A: Chemical 213: 225–230.
Sun X., Sun T., Zhang Q. (2008) Degradation mechanism of PCDDs initiated by OH radical in Photo-Fenton oxidation technology: Quantum chemistry and quantitative structure-activity relationship, W. Wang. Science of the total environment 402: 123-129.
Torres R.A., Torres W., Peringer P., Pulgarin C. (2002) Electrochemical degradation of p-substituted phenols of industrial interest on Pt electrodes. Attempt of a structure-reactivity relationship assessment. Chemosphere 50: 97-104.
Tseng J.M., Huang C.P. (1991) Removal of chlorophenols from water by photocatalytic oxidation. Water Science and Technology 23: 377-387.
Villasenor J., Reyes P., Pecchi G. (2002) Catalytic and photocatalytic ozonation of phenol on MnO2 supported catalysts. Catalysis Today 76: 121–131.
Vione D., Minero C., Maurino V., Carlotti M.E., Picatonott M.E.T., Pelizzetti E. (2005) Degradation of phenol and benzoic acid in the presence of a TiO2-based heterogeneous photocatalyst. Applied Catalysis B: Environmental 58: 79-88.
53

54

3- SYNTHESIS OF IRON OXIDE COATED
FUNCTIONALIZED POLYMER FILMS:
EFFECT OF SURFACE TREATMENT ON
PHOTOCATALYTIC ACTIVITY.
3.1. Introduction
Polymer films were used as supports for the deposition of iron oxides due to the wide range
of applications possible with such materials. Among others, catalysts active under solar or
UV light (such as self-cleaning surfaces or heterogeneous catalysts for water detoxification
and disinfection, etc.) are attractive materials. However, the use of polymer films as
substrate is a challenge as it induces several practical drawbacks that have to be overtaken:
(i) commercial polymer films surfaces are slick and intrinsically not very adhesionable
(Mittal, 1996), limiting iron oxide crystal nucleation and its adhesion to the substrate; (ii)
polymer films are destroyed under high temperature and are slowly degraded under solar
irradiation which prevents from the proceeding of high temperature thermal treatment in
preparation procedure. Although commercial available polymers have surface roughness,
electron donor groups, relatively high melting points and a high stability under solar light,
many commonly used polymers films such as polyethylene (PE), polyethylene terephtalate
(PET) or fluorinated polymers etc. do not show such properties. Since those polymer films
are widely used in packaging, bottles, coatings, etc., they can be recycled as photocatalyst
supports, but a functionalization of their surface may be required.
The functionalization of polymer surfaces is recognized as a valuable tool to improve their
adhesion properties. Surface functional groups like hydroxyl, ketone and carboxylic acids
are introduced to adjust the surface free energy. Furthermore these groups are used to
increase hydrogen binding and to create chemical bonds between the substrate and the
55

species to be deposited. Besides surface morphology changes are occurring increasing the
surface roughness. During the modification, weak boundary layers and surface
contaminants are removed. All these factors improve the adhesion properties of polymer
surfaces.
The conventional methods for surface modification are mechanical and wet-chemical
methods to produce either chemical or morphological changes in the surface. However,
these processes have inherent problems of uniformity and reproducibility for plating
products. Furthermore, they result in undesirable environmental pollution due to the
aggressive acidic solutions such as chromic, sulfuric or potassium-permanganate solutions
required to modify the surface of the polymer materials.
Alternative surface modification techniques include treatments by flame, corona, plasmas,
photons, electron beams, ion beams, X-rays, γ-rays, reactive oxygen species (ROS).
In this chapter, radiative functionalization techniques (oxygen radio frequency plasma (RF-
P), vacuum ultraviolet (VUV) and photocatalytic techniques (TiO2 photocatalysis (Ti-PC
and photo-Fenton oxidation (PF-O)) are used to functionalize polymer surfaces in order to
improve iron oxide adhesion.
3.1.1 Radiative treatments of polymer surfaces
3.1.1.1 Plasma treatment
Plasma describes the state of partially ionized gas and sometimes referred as the fourth
state of matter. Plasmas are generated by applying either high temperature or strong electric
or magnetic field to a gas.
The plasmas used for polymer functionalization are produced by applying an electric field
to a gas. The free electrons in this discharge are accelerated by the electric field and collide
with neutral gas molecules or atoms. Due to these metastables collisions, positive ions,
electrons and free radicals are generated (Terlingen, 2008).
Plasma treatment is one of the most versatile surface treatment techniques. Different types
of gases such as argon, oxygen, nitrogen, fluorine, carbon dioxide, and water can produce
the unique surface properties required by various applications. For example, oxygen-
56
plasma treatment can increase the surface energy of polymers, whereas fluorine-plasma
treatment can decrease the surface energy and improve the chemical inertness. Cross-
linking at a polymer surface can be introduced by an inert-gas plasma. Modification by
plasma treatment is usually confined to the top several hundred Ångströms and does not
affect the bulk properties. The main disadvantage of this technique is that it requires a
vacuum system, which increases the cost of operation.
Oxygen and oxygen-containing plasmas are most commonly employed to modify polymer
surfaces. It is well known that an oxygen plasma can react with a wide range of polymers to
produce a variety of oxygen functional groups, including C-O, C=O, O-C=O, C-O-O, and
CO3 at the surface. In an oxygen plasma, two processes occur simultaneously: etching of
the polymer surface through the reactions of atomic oxygen with the surface carbon atoms,
giving volatile reaction products; and the formation of oxygen functional groups at the
polymer surface through the reactions between the active species from the plasma and the
surface atoms. (Chan, 1996).
3.1.1.2 Vacuum UV (V-UV) treatments
The VUV spectral region corresponds to light with wavelengths, λ, in the range from 200
nm (approximate threshold of light absorption in air) to about 1 nm (Samson et al 1987).
Light with these wavelengths is present in the solar radiation spectrum above the terrestrial
atmosphere and in radiation from gas discharge plasmas.
Most of the polymers strongly absorb the V-UV radiation. V-UV photons selectively excite
electrons to high levels called Rydberg states (Vasilets, 2004) located near the threshold of
ionization. In contrast to UV radiation, the energy of V-UV photons is high enough to
cause the dissociation of various chemical bonds in polymer molecules including C-C, C-
H, C-O, C-F and produce radicals. The recombination of radicals formed by V-UV
photolysis leads to the formation of crosslinks. The detachment of hydrogen molecules H2
induced by V-UV photolysis is responsible of the formation of double bonds in polymer
matrix (Skurat, 2003). In presence of air or other gases, radicals may react with gas
molecules as well as with activated species such as excited molecules, atoms, and radicals
produced by V-UV gas photolysis in the reaction chamber. These reactions result in the
57

formation of specific groups on the polymer surface and provide selective functionalization
of the polymers (Vasilets, 1994). The V-UV irradiation modifies a surface polymer layer
without deterioration of the bulk mechanical properties.
Recently, plasma and V-UV treatments have been applied to polymers for medical
applications or to prepare antibacterial material. These surface modifications enhance the
adhesions of biomolecules (Vasilets, 2006), metals (Charbonnier, 2003; Yuranova, 2003)
or oxides (Mejia, 2009) on polymer surfaces. However, methods using plasma or V-UV
have the disadvantage of requiring vacuum conditions, electrical power, and the large
investment costs for commercialization. These limitations have increased the demand for
the development of new, efficient, and dependable processes.
3.1.3 Phototocatalytic treatments of polymer surface
Due to the mild conditions required (atmospheric pressure, ambient temperature, water as
solvent) and the possibility of using sunlight as the source of irradiation, the photocatalytic
processes constitute attractive methods to functionalize polymer surfaces. Photo-Fenton
and TiO2 photocatalysis are based on the generation of ROS able to oxidize most of the
organic compounds.
The functionalization of polymers surfaces by means of TiO2 photocatalysis was recently
proposed (Kim, 2006; Kim, 2007). This treatment was found to produce functional groups
such as carboxylic acid or hydroxide on polymer surface and to improve the adhesion of a
metallic layer. Photo-Fenton was not used yet to modify polymer surfaces to our
knowledge. However, Fenton and photo-Fenton processes were applied to produce
hydroxide and carboxylic acid groups on carbon nanotubes (Fan 2007, Escobar 2009) and
diamond nanoparticles (Martín, 2009) surfaces.
This chapter is directed toward the fixation and photocatalytic performance of iron oxide on
polyvinyl fluoride (PVF) films previously functionalized by different methods. The main
objective is to compare the catalytic activity and stability of photocatalysts as a function of
preparation procedure (different functionalization methods) toward hydroquinone
degradation.
58

3.2. Materials and Method
3.2.1 Chemicals
Hydroquinone, NaOH, HNO3, FeCl3 anhydrous, FeSO4.7H2O, ferrozine, hydroxylamine
hydrochloride, acetate buffer (pH = 4.65) were Fluka p.a. reagents (Buchs, Switzerland)
and used as received. Hydrogen peroxide (35%) was supplied by Merck AG (Darmstadt,
Germany). TiO2 P25 powder (anastase to rutile ratio between 70:30 and 80:20) was
supplied by Degussa. The polyvinyl fluoride (PVF) films were 72 μm thick and were
supplied by Goodfellow (Cambridge Ltd. United Kingdom).
3.2.2 Photocatalyst preparation
Figure 3.1 Scheme of catalyst preparation strategy (not to the scale).
Photoactive iron oxide was deposited on commercial polymer film substrates following the
strategy presented in Figure 3.1. Before use, the films were washed in a diethyl ether:
ethanol (1:1) mixture and in MilliQ water in order to eliminate surface contaminants. Then
polymer films surfaces were functionalized by different methods described in the next
paragraphs. Finally to immobilize iron oxide, functionalized polymer films (Pf) were
immersed in a solution of FeCl3 (anhydrous) 5 g/L and heated under stirring at 80 °C
during one hour. Optionally, the composite material was heated in an oven at 100 °C for
59

one hour. The final films showed a brownish iron oxide coat probably constituted by
akaganeite (β-FeOOH.Cln) that will be characterized in chapter 4, by X-ray photoelectron
spectroscopy (XPS).
3.2.2.1. Functionalization with radio frequency plasma (RF-P)
The polymers films were treated in a plasma cavity (Harricks Corp, 13.56 MHz, power 100
W), at a pressure of 1.0 mbar. The gas used for the plasma generation was air. The
functionalization process occurs in the topmost layers and increases with longer treatment
time, but remains constant with treatment time > 30 min (Yuranova, 2003). For this reason
the latter time has been chosen for RF-P treatment. A previous report (Golub, 1989)
presented a detail electron spectroscopy for chemical analysis (ESCA) study of the effect of
oxygen RF-P treatment on PVF surface which was shown to produce C=O, fluorine loss
and a slight loss of carbon atoms (by etching).
3.2.2.2. Functionalization with V-UV
The polymer film surface was also functionalized by V-UV irradiation using the 185 nm (6
W) line from a 25 W (254 + 185 nm) low pressure mercury lamp (Ebra Corp, Tokyo,
Japan). The lamp was a synthetic silica tube. The polymer film was attached around the
lamp tube. The gas used was air (0.8 mbar) and the treatment time was 30 minutes
(condition selected from (Yuranova, 2003)). A detail investigation on the effect of V-UV
radiation on PVF films was reported recently (Everett, 2006). It was found that with short
treatment times (i.e. < 24 hours) the main effect induced by this treatment was a washing of
surface contamination a decrease of fluorine surface concentration and an increase of
carbon surface concentration.
3.2.2.3 Functionalization with photo-Fenton oxidation (P-FO)
The polymer films were attached on a cylindrical steal support and immersed in solutions
of Fe2+ (50 mg/L) containing H2O2 (30 mM) at pH 3. The batch reactor was irradiated in a
solar simulator CPS Suntest system (ATLAS). The polymer surface undergoes the photo-
Fenton functionalization during two hours under magnetic stirring.
60
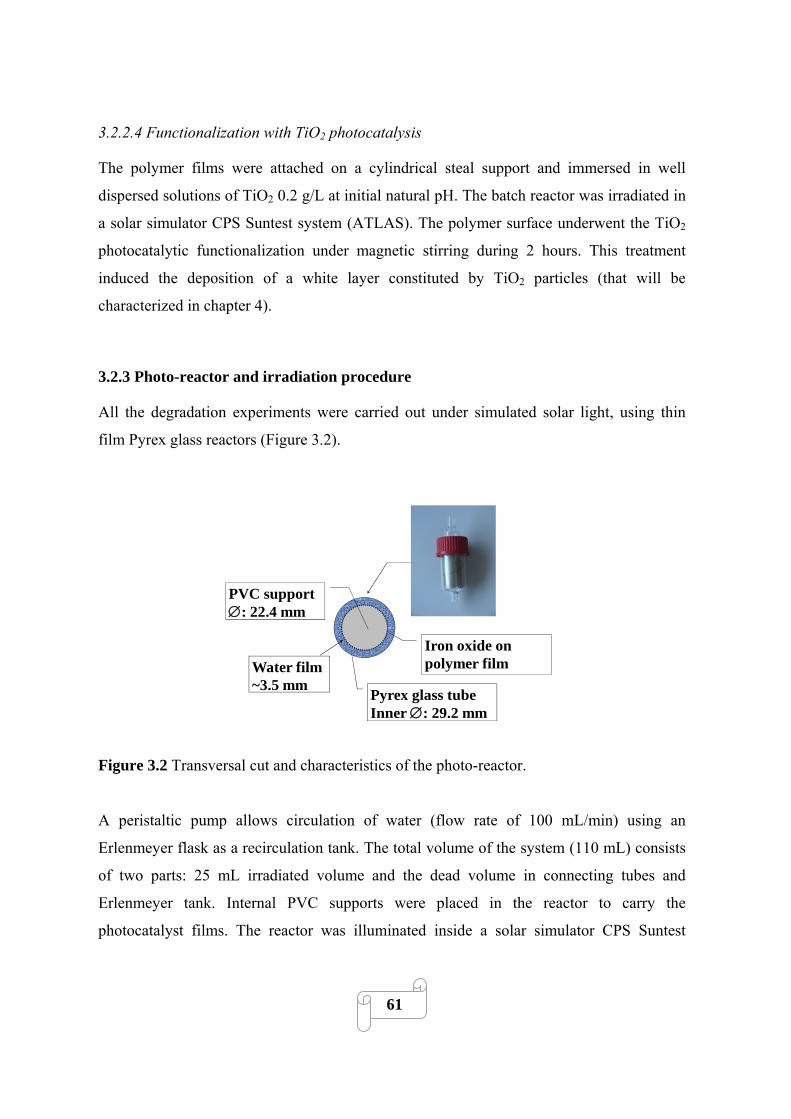
3.2.2.4 Functionalization with TiO2 photocatalysis
The polymer films were attached on a cylindrical steal support and immersed in well
dispersed solutions of TiO2 0.2 g/L at initial natural pH. The batch reactor was irradiated in
a solar simulator CPS Suntest system (ATLAS). The polymer surface underwent the TiO2
photocatalytic functionalization under magnetic stirring during 2 hours. This treatment
induced the deposition of a white layer constituted by TiO2 particles (that will be
characterized in chapter 4).
3.2.3 Photo-reactor and irradiation procedure
All the degradation experiments were carried out under simulated solar light, using thin
film Pyrex glass reactors (Figure 3.2).
PVC support ∅: 22.4 mm
Pyrex glass tubeInner ∅: 29.2 mm
Water film~3.5 mm
Iron oxide on polymer film
Figure 3.2 Transversal cut and characteristics of the photo-reactor.
A peristaltic pump allows circulation of water (flow rate of 100 mL/min) using an
Erlenmeyer flask as a recirculation tank. The total volume of the system (110 mL) consists
of two parts: 25 mL irradiated volume and the dead volume in connecting tubes and
Erlenmeyer tank. Internal PVC supports were placed in the reactor to carry the
photocatalyst films. The reactor was illuminated inside a solar simulator CPS Suntest
61

system (Atlas GmbH the details characteristics are reported point 2.2.2). The irradiation
experiments were started at room temperature (20 ºC) and progressively the temperature
increased up to approximately 30 ºC. Three reactors were placed in parallel inside the solar
box. The degradation experiments were performed using solutions containing HQ (0.18
mM) and H2O2 (1.6 mM).
3.2.4 Analysis of the irradiated solutions
The quantitative determination of organic compounds was carried out by HPLC
chromatography using a LC system HPLC-UV Shimadzu LC-2010A equipped with a UV
detector. Samples, injected via an auto-sampler, were eluted at a flow rate of 1 mL/min
through a column (Nucleosil C18 Marcherey Nagel) and using as mobile phase HPLC
grade acetonitrile–acetic acid solution (10%) in a 40% - 60%. The total organic carbon
(TOC) was monitored via an ASI automatic sample injector (Shimadzu 500). The peroxide
concentrations were assessed by Merkoquant® paper at levels between 0.5 and 25 mg/L.
The total iron concentration in the irradiated solutions was measured by complexation with
Ferrozine® (Aldrich 16.060-1) in the presence of hydroxylamine hydrochloride and acetate
buffer (pH=4.65) (Gibbs, 1979).
3.2.5 Catalyst characterization by UV-visible spectrophotometry
Conventional UV-Visible spectrophotometry is carried out in transmission mode with
samples that allow the light beam to pass straight through without being diverted by
refraction or spread out by scattering. Since the prepared materials let the light pass, but
scatter the beam as it passes through, they were analyzed by placing them in front of the
sphere and gathering the transmitted light as it emerges from the sample.
An integrating sphere is a type of Diffuse Reflectance Accessory. Diffuse reflectance refers
to light being reflected off a matte surface – an effect that is sometimes referred to as
Lambertian behavior.
The UV-Visible spectra of different photocatalysts were recorded on a Varian Cary 5
equipped with an integration sphere.
62

3.3 Results and discussions
3.3.1. Effect of functionalization on photocatalytic activity of PVFf-Fe oxide
0
0.2
0.4
0.6
0.8
1
0 60 120 180
[HQ
]/[H
Q] 0
Time (min)
o
abcd
(i)
0
0.2
0.4
0.6
0.8
1
0 60 120 180
[TO
C]/[
TOC
] 0
Time (min)
abcd
(ii)
0
0.2
0.4
0.6
0 60 120 180
[Fe]
d(m
g/L
)
Time (min)
abcd
(iii)
Figure 3.3. Evolution of (i) HQ concentration, (ii) TOC and (iii) [Fe]d during degradation
of 0.18 mM of HQ at initial pH 5.7, in presence of 1.6 mM H2O2, 75 cm2 of catalyst under
solar simulation (light): (o) photolysis; (a) PVF-Fe-oxide; (b) PVFV-UV-Fe-oxide and PVFP-
FO-Fe oxide*; (c) PVFRF-P-Fe oxide; (d) PVFTi-PC-Fe-oxide. The traces represent an average
63
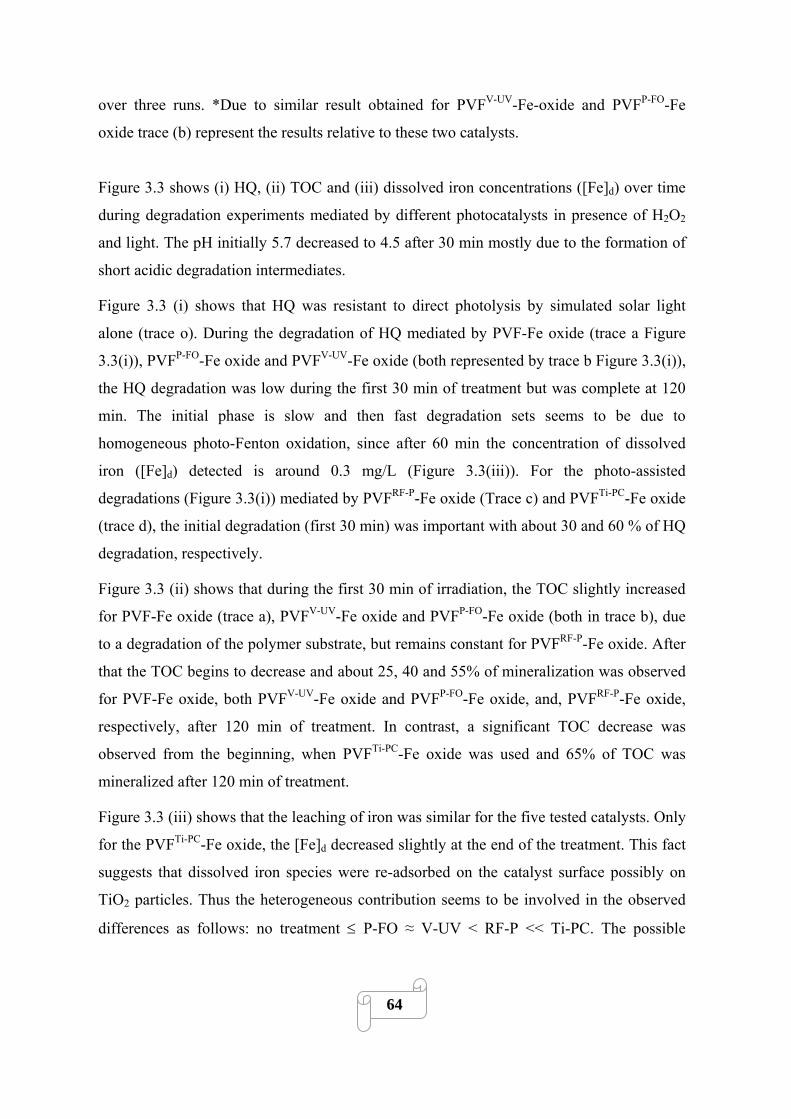
over three runs. *Due to similar result obtained for PVFV-UV-Fe-oxide and PVFP-FO-Fe
oxide trace (b) represent the results relative to these two catalysts.
Figure 3.3 shows (i) HQ, (ii) TOC and (iii) dissolved iron concentrations ([Fe]d) over time
during degradation experiments mediated by different photocatalysts in presence of H2O2
and light. The pH initially 5.7 decreased to 4.5 after 30 min mostly due to the formation of
short acidic degradation intermediates.
Figure 3.3 (i) shows that HQ was resistant to direct photolysis by simulated solar light
alone (trace o). During the degradation of HQ mediated by PVF-Fe oxide (trace a Figure
3.3(i)), PVFP-FO-Fe oxide and PVFV-UV-Fe oxide (both represented by trace b Figure 3.3(i)),
the HQ degradation was low during the first 30 min of treatment but was complete at 120
min. The initial phase is slow and then fast degradation sets seems to be due to
homogeneous photo-Fenton oxidation, since after 60 min the concentration of dissolved
iron ([Fe]d) detected is around 0.3 mg/L (Figure 3.3(iii)). For the photo-assisted
degradations (Figure 3.3(i)) mediated by PVFRF-P-Fe oxide (Trace c) and PVFTi-PC-Fe oxide
(trace d), the initial degradation (first 30 min) was important with about 30 and 60 % of HQ
degradation, respectively.
Figure 3.3 (ii) shows that during the first 30 min of irradiation, the TOC slightly increased
for PVF-Fe oxide (trace a), PVFV-UV-Fe oxide and PVFP-FO-Fe oxide (both in trace b), due
to a degradation of the polymer substrate, but remains constant for PVFRF-P-Fe oxide. After
that the TOC begins to decrease and about 25, 40 and 55% of mineralization was observed
for PVF-Fe oxide, both PVFV-UV-Fe oxide and PVFP-FO-Fe oxide, and, PVFRF-P-Fe oxide,
respectively, after 120 min of treatment. In contrast, a significant TOC decrease was
observed from the beginning, when PVFTi-PC-Fe oxide was used and 65% of TOC was
mineralized after 120 min of treatment.
Figure 3.3 (iii) shows that the leaching of iron was similar for the five tested catalysts. Only
for the PVFTi-PC-Fe oxide, the [Fe]d decreased slightly at the end of the treatment. This fact
suggests that dissolved iron species were re-adsorbed on the catalyst surface possibly on
TiO2 particles. Thus the heterogeneous contribution seems to be involved in the observed
differences as follows: no treatment ≤ P-FO ≈ V-UV < RF-P << Ti-PC. The possible
64
heterogeneous reactions involved in the degradation and mineralization of HQ are Fenton
and photo-Fenton oxidation (Eq. 1.55-1.56, 1.62-1.68) and iron oxide photocatalysis (Eq.
1.57-1.61). In the case of catalyst prepared by Ti-PC, TiO2 photocatalysis (Eq. 1.6-1.12)
may also contribute to the processes as TiO2 particles were deposited on polymer surface.
Besides synergistic effects between Fenton and semiconductor (iron oxide and/or TiO2)
photocatalysis are likely to occur which will be discussed in more details in chapter 4.
00.20.40.60.8
11.21.4
360 420 480 540 600
Abs
orba
nce
Wavelength (nm)
c
b
a
Figure 3.4. UV-vis absorption spectrum of (a) PVF-Fe oxide, PVFV-UV-Fe oxide, PVFP-FO-
Fe oxide; (b) PVFRF-P-Fe oxide; (c) PVFTi-PC-Fe oxide.
Figure 3.4 shows the UV-Vis absorption spectrum of several photocatalysts between 360
and 700 nm before their first use. The absorbance of PVF film in this region was negligible.
The spectra of PVF-Fe oxide, PVFV-UV-Fe oxide and PVFP-FO-Fe oxide were similar and
are thus represented by trace a. In contrast, PVFRF-P-Fe oxide (trace b), and more markedly
PVFTi-PC-Fe oxide (trace c) spectra show that the absorption was higher. The iron oxide on
the polymer surface is responsible for the absorption of light. Hence the absorbance can be
correlated with the thickness of iron oxide coating. These results show that RF-P and Ti-PC
treatments favor iron oxide nucleation and/or deposition on the functionalized film. On the
contrary, P-FO and V-UV treatments did not improve significantly iron oxide deposition on
polymers if compared to not treated ones.
65

66
Several causes could explain the beneficial effects induced by the functionalization of PVF
surface: (i) a chemical functionalization where oxygen surface functionalities increase the
surface polarity; (ii) the modification of polymer surface morphology induced by RF-P
(etching) and by Ti-PC (deposition of particles); and (iii) the additional photocatalytic
activity induced by the deposition of TiO2 particles. The fact that V-UV and P-FO pre-
treatments did not increase the photocatalytic activity of as prepared material (and by
extension iron oxide deposition) can be explained by: (i) Short V-UV treatment does not
allow the production of polar groups on polymer surface and thus will not enhance iron
oxide deposition; (ii) P-FO treatment may produce polar groups susceptible to bind iron
oxide particles, however iron aquacomplexes might immediately bind with these freshly
formed polar moieties during the pre-treatment process.
3.3.2. Effect of functionalization on long-term stability of PVFf-Fe oxide
The long term stability of several photocatalysts was tested repeating photo-Fenton HQ
degradations experiments and applying a self-degradation test (SDT) that involved
irradiation of the photocatalysts in absence of dissolved organic substance but in presence
of H2O2. SDT simulates highly reactive conditions and aims to assess if the polymer
substrate as well as overall photocatalytic activity are altered by radicals produced in
absence of any organic compounds.
00.20.40.60.8
1
0 3 6 9 12 15 18 21 24 2
[TO
C]/[
TOC
] 0
Time (hours)
Self degradation test
1 2 3 4 5 6 7 8 9
7
(i)
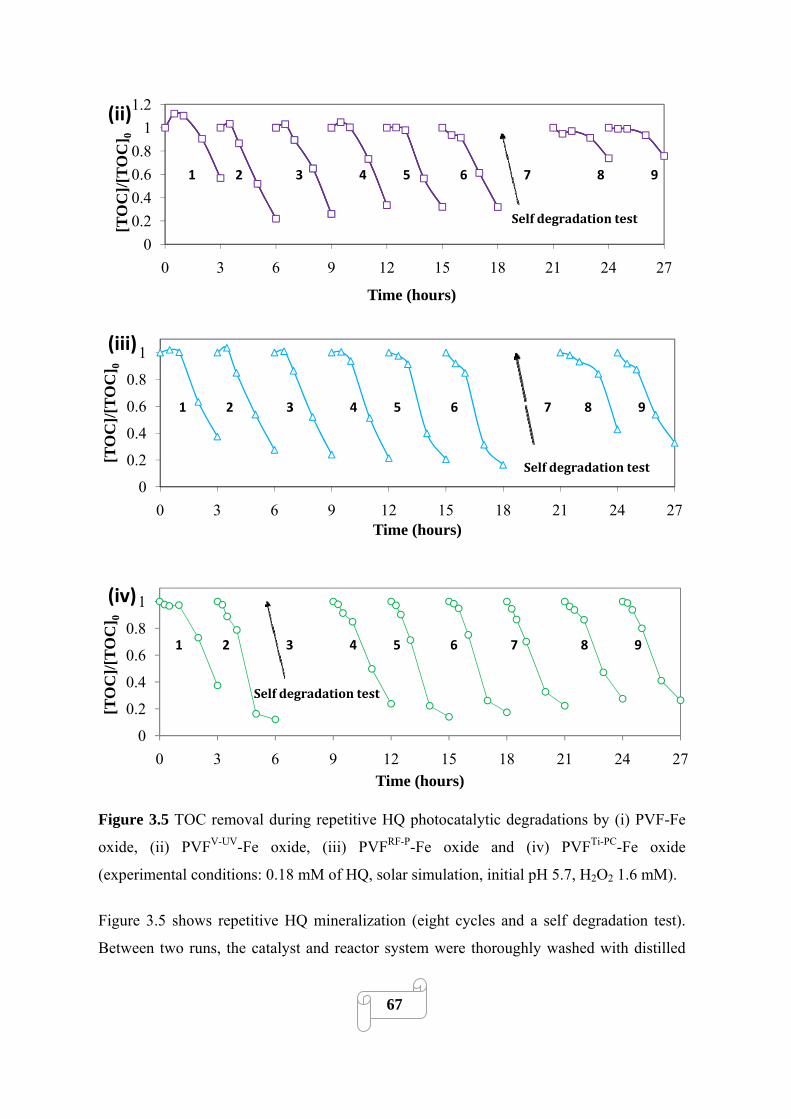
67
Figure 3.5 TOC removal during repetitive HQ photocatalytic degradations by (i) PVF-Fe
oxide, (ii) PVFV-UV-Fe oxide, (iii) PVFRF-P-Fe oxide and (iv) PVFTi-PC-Fe oxide
(experimental conditions: 0.18 mM of HQ, solar simulation, initial pH 5.7, H2O2 1.6 mM).
Figure 3.5 shows repetitive HQ mineralization (eight cycles and a self degradation test).
Between two runs, the catalyst and reactor system were thoroughly washed with distilled
00.20.40.60.8
11.2
0 3 6 9 12 15 18 21 24
[TO
C]/[
TOC
] 0
Time (hours)
Self degradation test
27
(ii)
1 2 3 4 5 6 7 8 9
0
0.2
0.4
0.6
0.8
1
0 3 6 9 12 15 18 21 24 27
[TO
C]/[
TOC
] 0
Time (hours)
Self degradation test
(iii)
1 2 3 4 5 6 7 8 9
0
0.2
0.4
0.6
0.8
1
0 3 6 9 12 15 18 21 24 2
[TO
C]/[
TOC
] 0
Time (hours)
Self degradation test
7
(iv)
1 2 3 4 5 6 7 8 9

water. In Figure 3.5 (i) and (ii) (corresponding to PVF-Fe oxide and PVFV-UV-Fe oxide,
respectively) the photocatalytic activity remained constant during five cycles with about 60
and 70% TOC removal after 3 hours of treatment. The SDT (after 18h) induced an
important and irreversible loss of 50% of photocatalytic activity (runs 8-9). For the PVFRF-
P-Fe oxide presented in Figure 3.5 (iii), irreversible catalytic activity loss of about 25% was
observed after the SDT. In contrast, Figure 3.5 (iv) shows that for the PVFTi-PC-Fe oxide,
the catalytic activity was recovered after the SDT (runs 4-5) and then decreases slowly as
shown by trace h. This recovery can be due to the presence of a thicker iron oxide shell
(Figure 3.4) and/or to a more solid binding of iron oxide particles to the polymer surface in
the case of PVFTi-PC-Fe oxide than for the other catalysts.
These results show that the V-UV functionalization was not beneficial in term of final
photocatalyst activity and long-term stability. In contrast, RF-P and Ti-PC functionalized
materials shows higher stability and catalytic activity than not functionalized ones. Thus the
formation of polar oxygen functionality on polymer surface as well as the increase of
roughness allows the solid binding of iron oxide particles leading to stable photocatalysts.
Besides for Ti-PC functionalization the presence of significant amount of TiO2 particles on
polymer surface could stabilize the photocatalyst acting as charge trap.
Because the Ti-PC functionalization led to the photocatalyst with the highest HQ
degradation rates and long-term stability, this method was studied in the following
chapters.
3.5 Conclusions
Iron oxide coated functionalized polymer films are suitable materials to degrade and
mineralize hydroquinone under simulated solar irradiation. During the process relatively
low amount (e.g. 0.3-0.5 mg/L) of leached iron was detected in solution.
To implement a functionalization of polymer surface is an efficient strategy to improve the
attraction between iron oxide and polymer film supports. As a result, a higher amount of
iron oxide is immobilized on the catalyst surface leading to more efficient photocatalysts.
Besides functionalization process such as Ti-PC can concomitantly lead to the deposition of
68

additional active specie (TiO2 particles). RF-P and more markedly Ti-PC treatments were
useful to improve material photocatalytic activity. The prepared materials studied here were
stable toward repetitive hydroquinone degradation, nevertheless only RF-P and Ti-PC
functionalization led to catalysts keeping activity after a self degradation test.
3.6 References
Chan C., Ko -M., T. -M, Hiraoka H. (1996) Polymer surface modification by plasmas and photons. Surface Science Reports 24: 1-54.
Charbonnier M., Romand M. (2003) Polymer pretreatments for enhanced adhesion of metals deposited by the electroless process. International Journal of Adhesion and Adhesives 23: 277-2853.
Escobar M., Goyanes S., Corcuera M.A., Eceiza A., Mondragon I., Rubiolo G.H., Candal R.J. (2009) Purification and functionalization of carbon nanotubes by classical and advanced oxidation processes. Journal of Nanoscience and Nanotechnology 9: 6228-6233.
Everett M.L., Hoflund G.B. (2006) Chemical alteration of poly(vinyl fluoride) Tedlar® induced by exposure to vacuum ultraviolet radiation Applied Surface Science 252: 3789-3798.
Fan C., Li W., Li X., Zhao S., Zhang L., Mo Y., Cheng R. (2007) Efficient photo-assisted Fenton oxidation treatment of multi-walled carbon nanotubes. Chinese Science Bulletin 52: 2054-2062.
Gibbs M.M., (1979) A simple method for the rapid determination of iron in natural waters. Water Research 13: 295-297.
Golub M.A., Wydeven T., Cormia R.D. (1989) ESCA study of several fluorocarbon polymers exposed to atomic oxygen in low Earth orbit or within or downstream from a radio-frequency oxygen plasma. Polymer 30: 1571-1575.
Kim G.G., Kang J.A., Kim J.H., Kim S.J., Lee N.H., Kim S.J. (2006) Metallization of polymer through a novel surface modification applying a photocatalytic reaction. Surface and Coating Technology 201:3761–3766.
Kim G.G., Kang J.A., Kim J.H., Lee K.-y., Kim S.J., Kim S.-J. (2007) Photocatalytic pretreatment of acrylonitrile-butadiene-styrene polymer for electroless plating. Scripta Materialia 56: 349-351.
Martín R., Heydorn P.C., Alvaro M., Garcia H. (2009) General strategy for high-density covalent functionalization of diamond nanoparticles using Fenton chemistry. Chemistry of Materials 21: 4505-4514.
Mejía M.I., Marín J.M., Restrepo G., Pulgarín C., Mielczarski E., Mielczarski J., Arroyo Y., Lavanchy J.-C., Kiwi J. (2009), Self-cleaning modified TiO2-cotton pretreated by UVC-light (185 nm) and RF-plasma in vacuum and also under atmospheric pressure. Applied Catalysis B: Environmental 91:481–488.
Mittal K.L., (1996) Polymer Surface Modification: Relevance to Adhesion. VSP Utrecht, The Nederland.
Samson J.A.R. (1967) Techniques of Vacuum Ultraviolet Spectroscopy, Wiley, New York.
69

Skurat V. (2003) Vacuum ultraviolet photochemistry of polymers. Nuclear Instruments and Methods in Physics Research, Section B: Beam Interactions with Materials and Atoms 208: 27-34.
Terlingen J.G.A. (2008). Introduction of functional groups at polymer surfaces by glow discharge techniques. Functionalization of Polymer Surfaces: Chapter 2. Europlasma Technical Paper p 29.
Vasilets VN, Yuranova TI, Ponomarev AN. (1994) The changes of structure and wettability of siloxane polymers under vacuum ultraviolet action. Journal of Photopolymer Science and Technology 7:309 –314.
Vasilets V.N., Kuznetsov A.V., Sevastianov V.I. (2004) Vacuum ultraviolet treatment of polyethylene to change surface properties and characteristics of protein adsorption. Journal of Biomedical Materials Research - Part A 69: 428-435.
Vasilets V.N., Kuznetsov A.V., Sevast'yanov V.I. (2006) Regulation of the biological properties of medical polymer materials with the use of a gas-discharge plasma and vacuum ultraviolet radiation. High Energy Chemistry 40: 79-85.
Yuranova T., Rincon A.G., Bozzi A., S. Parra S., C. Pulgarin, C. P. Albers P., J. Kiwi J. (2003) Antibacterial textiles prepared by RF-plasma and vacuum-UV mediated deposition of silver. Journal of Photochemistry and Photobiology A: Chemical 161: 27–34.
70
4- TiO2 AND IRON OXIDE COATED POLYMER
FILMS: CHARACTERIZATION,
OPTIMISATION AND SYNERGITIC PHOTO-
ACTIVITY
4.1 Introduction
The preparation of catalysts containing iron oxide and TiO2 is an attractive option since
these materials could be bi-functional (i.e. combining TiO2 and iron oxide properties Zhou,
2008) and because synergistic effects are likely to occur. Some recent studies described
Fe2O3-TiO2 coatings on glass (Celik, 2006) and activated carbon fiber (Zhang, 2008b).
Synergistic effects refer to the phenomena when the degradation rate of combined system is
greater than the sum of its parts. These non-additive effects have recently been observed for
the combination of suspended TiO2 mediated photocatalysis with high frequency
ultrasound (Torres, 2008), with ozonization (Zou, 2008) and when combining supported
TiO2 with homogeneous photo-Fenton oxidation (Bouras, 2008).
This chapter presents a detailed investigation of an innovative method to bind TiO2 and
iron oxide on polymer film. The procedure to bind TiO2 on polymers employs solar light,
low temperature, needs short preparation time in aqueous solution and generates C=O, C-
OH, COOH groups on the polymer surface by TiO2 photocatalysis (Kim, 2006). The
photocatalysts are characterized by scanning electron microcopy (SEM), X-ray
photoelectron spectroscopy (XPS) and UV-visible spectroscopy.
The objective of this chapter is to evaluate the photocatalytic performance of TiO2 and iron
oxide coated functionalized polymer films (Pf-TiO2-Fe oxide) toward the degradation of
hydroquinone (HQ), and inactivation of E. Coli.
71
4.2 Experimental
4.2.1 Chemicals
Hydroquinone, NaOH, HNO3, FeCl3 anhydrous, FeSO4.7H2O, ferrozine, hydroxylamine
hydrochloride, acetate buffer (pH = 4.65) were Flucka p.a. reagent and used as receive.
Hydrogen peroxide (35%) was supplied by Merck AG (Darmstadt, Germany) TiO2 P25
powder (anastase to rutile ratio between 70:30 and 80:20) was supplied by Degussa. The
polyvinyl fluoride (PVF), polyethylene (PE) and polyethylene terephtalate (PET) films
were 72 μm thick and supplied by Goodfellow (Cambridge Ltd. United Kingdom). The
PET bottles (Polypropylene cover, 100 mL, diameter: 4.8 cm, heigth: 9.5 cm) were
supplied by Reactolab SA, (Servion, Switzerland). Solutions were prepared with Millipore
water (18.2 MΩ.cm at 25 ºC).
4.2.2 Photocatalyst preparation
Photoactive TiO2 and/or iron oxide were deposited on commercial polymer films as
polymeric substrate. Before use, the polymer films were washed in diethyl ether ethanol
(1:1) mixture and in MilliQ water in order to eliminate surface contaminants. Three
different preparation methods have been used:
(1) The first preparation method consisted in the application of a single TiO2 photocatalytic
surface functionalization-deposition (PSFD) treatment: the clean polymer substrates (PVF,
PE or PET) were attached around a cylindrical steel support and immersed in a photo-
reactor containing well dispersed suspensions of TiO2 (0.2-1.7 g/L) at different pH (3,
natural, 7, 11). The photo-reactor was irradiated in a CPS Suntest system (ATLAS GmbH)
during two hours under magnetic stirring. Steel support was dimensioned to maintain the
PVF film close to the surface of the photo-reactor. This treatment leaded to the
immobilization of TiO2 particles on the functionalized polymer surface (Pf-TiO2). The
possible nature of polymer-TiO2 bonding is proposed in point 4.3.1.1.
(2) In the second preparation method, the iron oxide was immobilized on polymer
substrates. Commercial polymer films were immersed in a 5 g/L solution of FeCl3 and
heated under stirring at 70, 80 or 90 °C during one hour. Optionally, the composite material
72
was heated in an oven at 100 °C for one hour. The final film showed an iron oxide coat (P-
Fe oxide).
(3) The third preparation method consisted in applying a TiO2 PSFD treatment followed by
iron oxide coating as described in method (1) and (2) to immobilize the TiO2 and iron oxide
on the polymer film leading to Pf-TiO2-Fe oxide.
For the bacteria inactivation tests, the photoactive TiO2 and iron oxide were deposited on
commercial PET bottles (100 mL) in a similar way like described previously. Briefly, clean
PET bottles were filled up with a 60 mL dispersed suspension of TiO2 (1g/L). The bottles
were then irradiated in a CPS Suntest system for 2.5 hours under magnetic stirring. The
functionalized bottles were then emptied, rinsed with miliQ water and filled up with 60mL
of a FeCl3 solution (5 g/L) to carry out forced hydrolysis at 60 °C during 1.5 hours. Heating
at 95 °C during half an hour in an oven was performed to anneal TiO2 and iron oxide
particles on the PET surface.
4.2.3 Photo-reactor and irradiation procedure
The photo-reactor and irradiation procedure used for organic compounds degradation is
described in detail point 3.2.3.
For bacterial inactivation, experiments were carried out in PET bottles reactors placed in
parallel inside the solar box. PET bottles were used both as reactor and photocatalyst
substrate. The temperatures during the experiments were always below 38 °C then thermal
inactivation of micro-organisms can be excluded.
4.2.4 Analysis of the irradiated solutions
The methods are described in detail in point 3.2.4.
4.2.5 Bacterial strain and growth media
Bacterial strains. The E. coli strain K-12 (MG1655) was used for all the disinfection
experiments and supplied by DSMZ (German Collection for Microorganisms and Cell
73
cultures, Darmstadt, Germany). E. coli K-12 is a non-pathogenic and close to the wild-type
Eschecheria coli, typical indicator bacteria for enteric pathogens.
Sample preparation. Strain samples were stored in cryo-vials containing 20% glycerol at -
20 °C. Bacterial pre-cultures were prepared for each experimental series by streaking out a
loopfull from the strain sample onto Plate Count Agar (PCA) and subsequent incubation of
these plates for 24 hours at 37 °C (Heraeus incubator B 5060 EK-CO2, Heraeus
Instruments, Hanau, Germany). From the growing colonies, one was re-plated on a separate
PCA and incubated again for 24 hours at 37 °C.
Luria-Bertani (LB) broth (10 g BactoTM Trypton, 5 g Yeast extract, 10 g NaCl per liter) was
prepared for each experimental series by suspension in MilliQ and heat-sterilization by
autoclave (121 °C, 20 min, VST 500A, LS SECFROID, Blanc Labo, Lonay, Switzerland).
To prepare the bacterial pellet for the photo-inactivation experiments, one colony was
picked from the pre-cultures and loop-inoculated into a 50 mL sterile PE Eppendorf flask
containing 5 mL of LB broth. The flask was then incubated at 37 °C and 180 rpm in a
shaker incubator (Minitron AI 71, IN- 3 FORS AG, Bottmingen, Switzerland). After 8
hours, the cells were diluted (1% v/v) in a 250 mL Erlenmeyer flask containing 25 mL of
pre-warmed LB broth and incubated at 37 °C for 15 hours in Heraeus Incubator until
stationary physiological phase was reached. Bacterial growth and stationary phase was
monitored by the optical density at 600 nm. Cells were harvested during stationary growth
phase by centrifugation (15 minutes at 5000 x g (RCF) and 4 °C) in a universal centrifuge
(HERMLE Z 323 K, Renggli Laboratory Systems, Renens, Switzerland). The bacterial
pellet was re-suspended and washed for 10 minutes in the centrifuge.
Washing was repeated twice and the bacterial pellet was re-suspended to the initial volume.
This procedure resulted in a bacterial pellet containing 1.5 108 CFU/mL. Washing and re-
suspension was done either in heat sterilized MilliQ water or in a nutritional solution
containing BactoTMTrypton. At the beginning of each experiment the reactors containing
the bacterial suspension were placed in the solar simulator in the dark under magnetic
stirring for at least one hour in order to let bacteria adapt themselves to the new matrix and
to allow die-off of the most stress sensitive species. After stabilization of the population,
H2O2 was added before turning on the lamp.
74
Plating. Colony forming units (CFU) were monitored by pour plating on PCA. At each data
point 1 mL of sample was withdrawn. Exceeding H2O2 was neutralized with catalase,
aliquots were diluted in 10% steps and poor plated on PCA. Plates were incubated for 24
hours at 37 °C and CFU were counted manually.
4.2.6 Photocatalyst characterization
4.2.6.1 X-ray photoelectron spectroscopy (XPS)
X-ray photoelectron-Spectroscopy is a non-destructive technique that can be used to
analyze the surface chemistry of a material (Moulder 1996). It provides elemental analysis
and the chemical and electronic state of the elements. XPS spectra are obtained by
irradiating a material with a beam of X-rays while simultaneously measuring the kinetic
energy (KE) and the number of electrons that escape from the top 1 to 10 nm of the
material being analyzed.
Because the energy of a particular X-ray wavelength equals a known quantity, we can
determine the electron binding energy (BE) of each emitted electrons according to:
Ebinding = Ephoton – Ekinetic - φ
Where Ebinding is the energy of the emitted electron, Ephoton is the energy of the X-ray
photons; Ekinetic is the energy of the emitted electron as measured by the instrument and φ is
the work function of the spectrometer. A typical XPS spectrum is a plot of a number of
electrons detected as a function of their binding energy. Each element produces a
characteristic set of XPS peaks at defined binding energy values; thus it is possible to detect
each element on the surface or the top layers of the material. These characteristic peaks
correspond to the electron configuration of the electrons within the atoms e.g. 1s, 2s, 2p, 3s
etc. The number of electrons in each peak is related to the amount of the element within the
irradiated area (volume). To generate atomic percentage values, each raw XPS signal must
be normalized over all the elements detected.
It is important to note that XPS detects only the electrons that have actually escaped into
the vacuum of the instrument from the top 10 to 12 nm of the material. The deeper photo-
75
emitted electrons, which were generated as the X-rays penetrated 1-5 μm of the material,
are either recaptured or trapped in various excited states within the material.
X-ray photoelectron spectroscopy data were collected by Axis Ultra system (Kratos
analytical, Manchester, UK) under ultra-high vacuum condition (<10-8 Torr), using a
monochromatic Al Kα X-ray source (1486.6 eV) at the laboratory of Chemical Metallurgy
at EPFL. The source power was maintained at 150 W (10 mA, 15 kV). The emitted
photoelectrons were sampled from a square area of 750*350 μm2. The gold (Au 4f7/2) and
copper (Cu 2p3/2) lines at 84.0 and 932.6 eV respectively, were used for calibration, and the
adventitious carbon 1s peak at 285 eV was used as an internal standard to compensate for
charging effects.
4.2.6.2 Scanning electron microscopy (SEM)
The scanning electron microscope images the sample surface by scanning it with a high-
energy beam of electrons. The electrons interact with the atoms that make up the sample
producing signals that contain information about the sample's surface topography,
composition and other properties such as electrical conductivity.
The types of signals produced by SEM include among others secondary electrons, back-
scattered electrons, characteristic X-rays, specimen current and transmitted electrons.
The signals result from interactions of the electron beam with atoms at or near the surface
of the sample. In the most common or standard detection mode (secondary electron
imaging) the SEM can produce very high-resolution images of a sample surface, revealing
details about less than 1 to 5 nm in size. Due to the very narrow electron beam, SEM
micrographs have a large depth of field yielding a characteristic three-dimensional
appearance useful for understanding the surface structure of a sample. Characteristic X-rays
are emitted when the electron beam removes an inner shell electron from the sample,
causing a higher energy electron to fill the shell and release energy. These characteristic X-
rays are used to identify the composition and measure the abundance of elements in the
sample.
76
The surface morphology of the catalysts were investigated using a scanning electron
microscope (Phillips XL30 SFEG) equipped with X-ray detector.
4.2.6.3 UV-Visible spetrophotometry
This technique and the characteristics of the apparatus used were described in point 3.2.5.
4.3 Results
4.3.1 Photocatalyst characterization
The XPS spectroscopy allows determining surface composition of the thin outermost
surface layers. It also allows obtaining the elemental depth profile. XPS measurements
were performed on PVFf-TiO2 and PVFf-TiO2-Fe oxide prepared under different pH
condition. An energy shift to lower binding energies (BE) of about 3 eV was observed due
to the low conductivity of the samples. In the present study, the corrected BEs are reported.
4.3.1.1 XPS study of the influence of pH on TiO2 photocatalytic surface functionalization-
deposition (PSFD) treatment of polyvinyl fluoride film
Different PVFf-TiO2 and PVFf-TiO2-Fe oxide samples have been produced by
functionalization at various pHs. Figure 4.1(i) presents the C (1s) carbon peaks at each
preparation step. For the non-modified PVF film (trace a), there are two peaks: the higher
peak centered at BE = 284.6 eV corresponding to (CH2)n groups, the second centered at BE
= 286.6 eV corresponding to C-F bond. The F/C atomic ratio for the PVF was 0.46, which
is less than the theoretical stoichiometric value of 0.5 (Table 4.1). This slight difference can
be attributed to hydrocarbon contamination and the presence of surface oxygen. After the
TiO2 PSFD treatment of PVF at pH 11, (trace b), the XPS spectrum changes with the
appearance of C (1s) peaks at a BE of 287.2 and 289 eV corresponding to the formation of
C=O bond of ketones and carboxylic acids respectively. This observation confirms that the
TiO2 PSFD treatment induces the formation of oxygen functional groups in agreement with
a recent study (Kim, 2006). After TiO2 PSFD treatment at pH 3 (trace c), the XPS spectrum
77

was similar to the trace b excepting that the carboxylic acid peak at 289 eV is not visible
and that the ratio C-H/C=O is considerably lower, indicating a larger formation of oxygen-
based groups at the Tedlar® surface at acidic pH.
0
2
4
6
8
10
281286291
CPS
(/10
4 )
Binding energy (eV)
d
c
b
a
*1/4
(i)
0
1
2
3
4
5
527531535
CPS
(/10
4 )
Binding energy (eV)
d
c
b
a
*2
*2
(ii)
0
2
4
6
8
10
12
682686690
CPS
(/10
4 )
Binding energy (eV)
d
c
b
a
*1/2
(iii)
Figure 4.1 X-ray photoelectron spectra of: (i) C (1s); (ii) O (1s); (iii) F (1s) core level
photoelectron spectra of (a) PVF; (b) PVF after a TiO2-PSFD treatment at pH 11; (c) PVF
after a TiO2 PSFD treatment at pH 3; (d) PVFf-TiO2-Fe-oxide (TiO2 PSFD treatment at pH
3).
Figure 4.1(ii) shows the evolution of PVF surface oxygen peak O (1s) for different
preparation steps. In trace a, the O (1s) peak is centered at BE = 533.7 eV corresponding to
the oxygen contained in hydrocarbon contamination on the polymeric surface. After a TiO2
PSFD treatment at pH 11, (trace b) the O (1s) peak is shifted to 532 eV, corresponding to
the formation of C=O and COOH groups on the PVF surface. Trace b shows as well a
small peak at 529.4 eV which corresponds to the oxygen in TiO2 suggesting the presence of
traces of this oxide on PVF surface. After a TiO2 PSFD treatment at pH 3 (trace c), a
significant O (1s) peak appears at BE = 529.4 eV corresponding to the oxygen of the TiO2
78
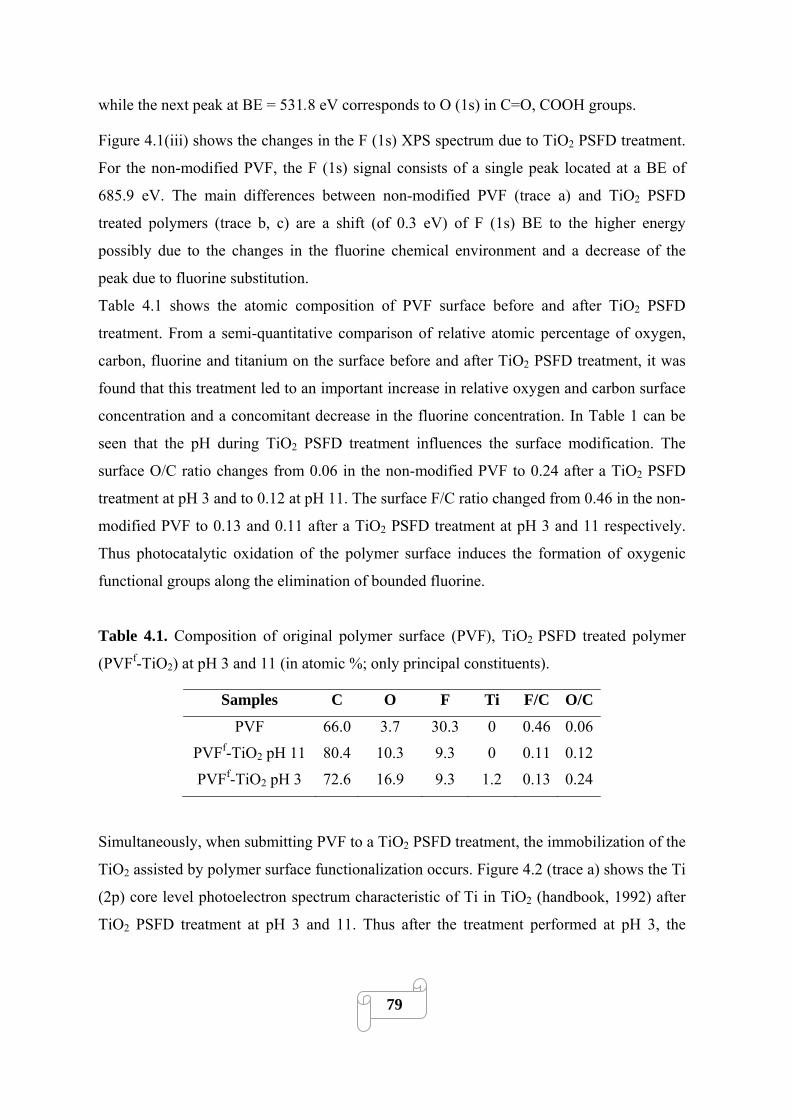
while the next peak at BE = 531.8 eV corresponds to O (1s) in C=O, COOH groups.
Figure 4.1(iii) shows the changes in the F (1s) XPS spectrum due to TiO2 PSFD treatment.
For the non-modified PVF, the F (1s) signal consists of a single peak located at a BE of
685.9 eV. The main differences between non-modified PVF (trace a) and TiO2 PSFD
treated polymers (trace b, c) are a shift (of 0.3 eV) of F (1s) BE to the higher energy
possibly due to the changes in the fluorine chemical environment and a decrease of the
peak due to fluorine substitution.
Table 4.1 shows the atomic composition of PVF surface before and after TiO2 PSFD
treatment. From a semi-quantitative comparison of relative atomic percentage of oxygen,
carbon, fluorine and titanium on the surface before and after TiO2 PSFD treatment, it was
found that this treatment led to an important increase in relative oxygen and carbon surface
concentration and a concomitant decrease in the fluorine concentration. In Table 1 can be
seen that the pH during TiO2 PSFD treatment influences the surface modification. The
surface O/C ratio changes from 0.06 in the non-modified PVF to 0.24 after a TiO2 PSFD
treatment at pH 3 and to 0.12 at pH 11. The surface F/C ratio changed from 0.46 in the non-
modified PVF to 0.13 and 0.11 after a TiO2 PSFD treatment at pH 3 and 11 respectively.
Thus photocatalytic oxidation of the polymer surface induces the formation of oxygenic
functional groups along the elimination of bounded fluorine.
Table 4.1. Composition of original polymer surface (PVF), TiO2 PSFD treated polymer
(PVFf-TiO2) at pH 3 and 11 (in atomic %; only principal constituents).
Samples C O F Ti F/C O/C
PVF 66.0 3.7 30.3 0 0.46 0.06
PVFf-TiO2 pH 11 80.4 10.3 9.3 0 0.11 0.12
PVFf-TiO2 pH 3 72.6 16.9 9.3 1.2 0.13 0.24
Simultaneously, when submitting PVF to a TiO2 PSFD treatment, the immobilization of the
TiO2 assisted by polymer surface functionalization occurs. Figure 4.2 (trace a) shows the Ti
(2p) core level photoelectron spectrum characteristic of Ti in TiO2 (handbook, 1992) after
TiO2 PSFD treatment at pH 3 and 11. Thus after the treatment performed at pH 3, the
79
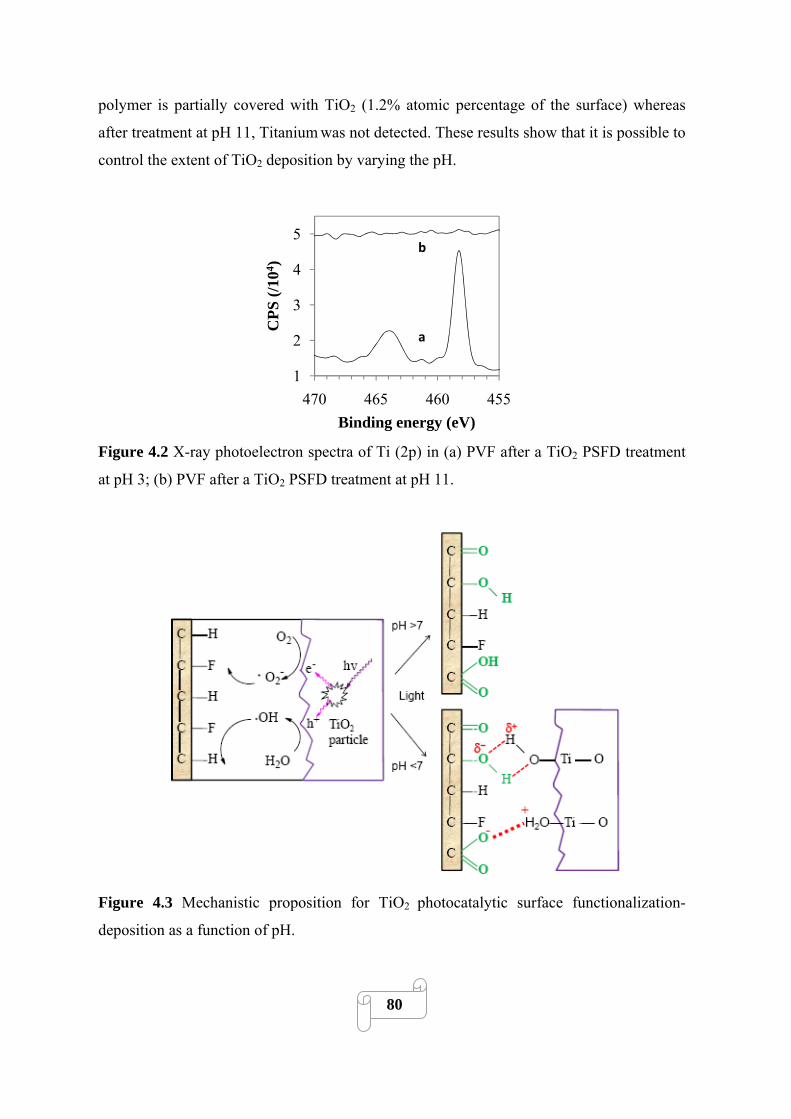
polymer is partially covered with TiO2 (1.2% atomic percentage of the surface) whereas
after treatment at pH 11, Titanium was not detected. These results show that it is possible to
control the extent of TiO2 deposition by varying the pH.
1
2
3
4
5
455460465470
CPS
(/10
4 )
Binding energy (eV)
b
a
Figure 4.2 X-ray photoelectron spectra of Ti (2p) in (a) PVF after a TiO2 PSFD treatment
at pH 3; (b) PVF after a TiO2 PSFD treatment at pH 11.
Figure 4.3 Mechanistic proposition for TiO2 photocatalytic surface functionalization-
deposition as a function of pH.
80

The simultaneous photocatalytic functionalization of PVF surface and a deposition of TiO2
are illustrated in Figure 4.3. As a matter of fact, under irradiation in aqueous TiO2
suspension in equilibrium with air, PVF film suffers photocatalytic attacks leading to C=O,
COOH groups and to the elimination of fluorine. When the pH of the aqueous solution is
acidic, (i) The polymer surface is negatively charged since the TiO2 PSFD treatment
induced the formation of functional groups like COO- and (ii) The superficial charge of
TiO2 P25 is positive since its isoelectric point is near to 7. Consequently an electrostatic
attraction binds the TiO2 particles to the polymer surface.
4.3.1.2 XPS studies of iron species and overall atomic profile of the PVFf-TiO2-Fe oxide
photocatalyst
The deposition of iron oxide on PVFf-TiO2 surfaces was described under point 4.2.2. The
determination of the chemical nature of the iron coating was investigated by XPS.
In Figure 4.4, the iron peak was located at a BE of 711 eV which is characteristic of Fe3+
ions in akaganeite (Deliyanni, 2006). Nevertheless, the XPS results are not sufficient to
determine with accuracy the nature of iron oxide present at polymer surface. However,
various reports confirm this hypothesis, as the thermal hydrolysis of FeCl3 solutions leads
mainly to the formation of akaganeite (Music, 2003).
0
1
2
3
4
705715725735
CPS
(/10
4 )
Binding energy (eV)
Figure 4.4. Fe (2p) core level photoelectron spectrum of PVFf-TiO2-Fe oxide.
81
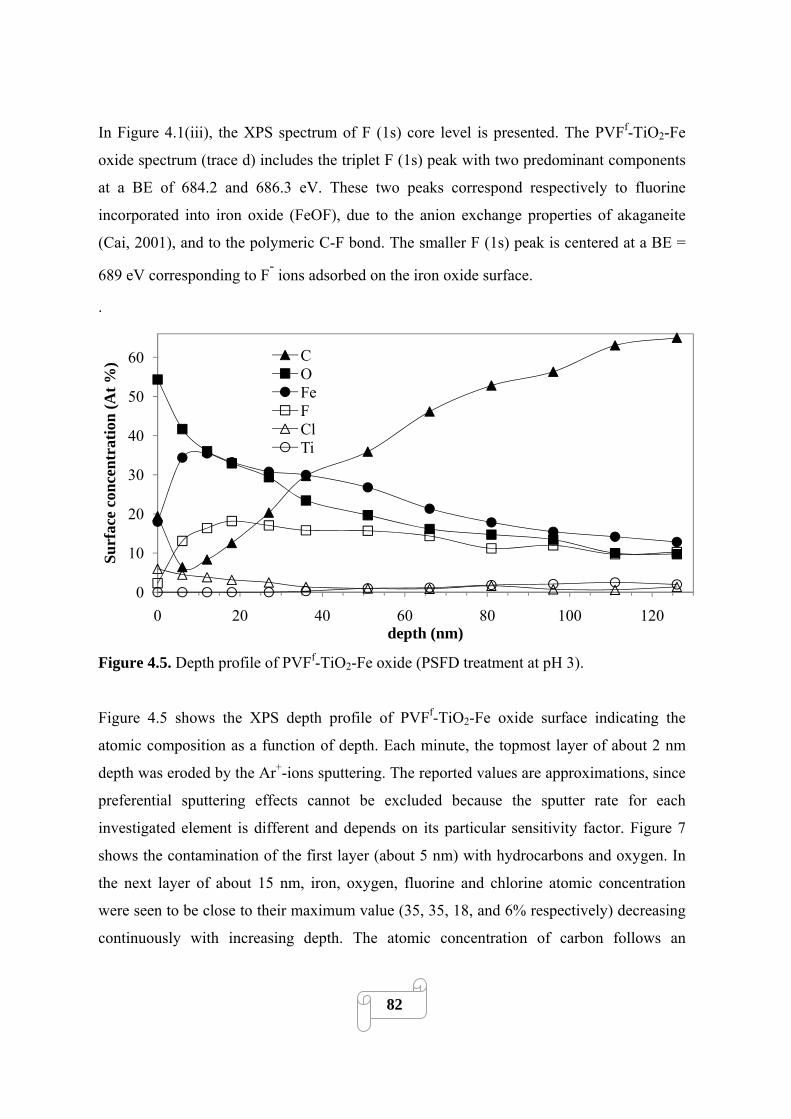
In Figure 4.1(iii), the XPS spectrum of F (1s) core level is presented. The PVFf-TiO2-Fe
oxide spectrum (trace d) includes the triplet F (1s) peak with two predominant components
at a BE of 684.2 and 686.3 eV. These two peaks correspond respectively to fluorine
incorporated into iron oxide (FeOF), due to the anion exchange properties of akaganeite
(Cai, 2001), and to the polymeric C-F bond. The smaller F (1s) peak is centered at a BE =
689 eV corresponding to F- ions adsorbed on the iron oxide surface.
.
0
10
20
30
40
50
60
0 20 40 60 80 100 120
Surf
ace
conc
entr
atio
n (A
t %)
depth (nm)
COFeFClTi
Figure 4.5. Depth profile of PVFf-TiO2-Fe oxide (PSFD treatment at pH 3).
Figure 4.5 shows the XPS depth profile of PVFf-TiO2-Fe oxide surface indicating the
atomic composition as a function of depth. Each minute, the topmost layer of about 2 nm
depth was eroded by the Ar+-ions sputtering. The reported values are approximations, since
preferential sputtering effects cannot be excluded because the sputter rate for each
investigated element is different and depends on its particular sensitivity factor. Figure 7
shows the contamination of the first layer (about 5 nm) with hydrocarbons and oxygen. In
the next layer of about 15 nm, iron, oxygen, fluorine and chlorine atomic concentration
were seen to be close to their maximum value (35, 35, 18, and 6% respectively) decreasing
continuously with increasing depth. The atomic concentration of carbon follows an
82

opposite tendency i.e. has its minimum value (10%) between 5 and 20 nm and then
increases. Atomic concentration of Ti is zero until ~35 nm and then increases to reach a
maximum value of 2.5% at ~100 nm. This result indicates that TiO2 particles are located
close enough to the surface of the catalyst to play a role in the degradation processes
particularly if the photocatalyst has been reused several times and the iron oxide coat has
been partially dissolved allowing the TiO2 to diffuse to the surface. An XPS study of
PVFfTiO2-Fe oxide surface changes after reuse will be presented in chapter 5.
4.3.1.3 Scanning electron microscopy (SEM)
Figure 4.6 shows the SEM micrograph of polymer surface before and after the sequential
TiO2 PSFD and iron oxide coating.
The non-modified PVF surface, Figure 4.6a, is predominantly smooth. After a TiO2 PSFD
treatment at pH 5, aggregated TiO2 particles cover a significant part of the surface exposed
to the light irradiation (Figure 4.6b) and to a lesser degree in the back side (Figure 4.6c).
This TiO2 coating seems to increase the surface roughness favoring subsequent iron oxide
nucleation around the TiO2 particles. TiO2 decrease the interfacial energy which is a
limiting factor for the crystallization of iron oxide (Greer, 2006). Figure 4.6d shows the
PVFf-TiO2-Fe oxide catalyst surface loaded with iron oxide aggregates of about 1 μm.
These aggregates are composed of nanoparticles of approximately 50 nm, which seem to
cover the polymer surface (Figure 4.6e).
b a
b
83
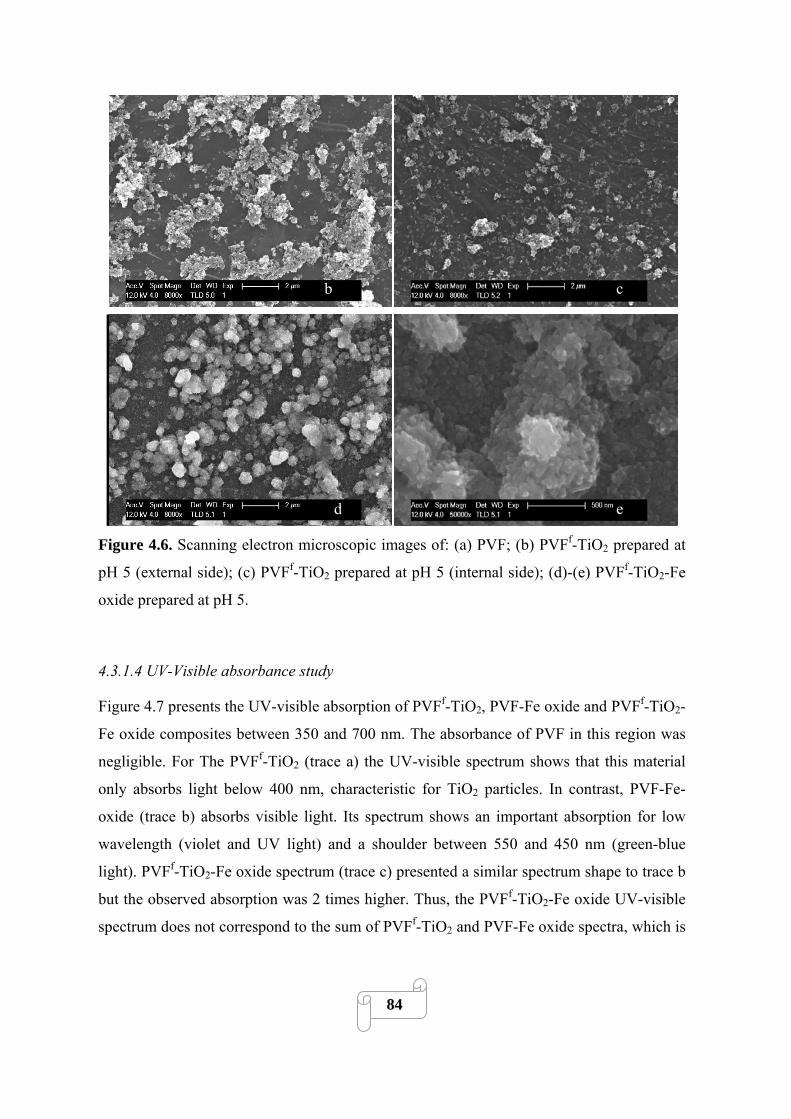
b c
d e
Figure 4.6. Scanning electron microscopic images of: (a) PVF; (b) PVFf-TiO2 prepared at
pH 5 (external side); (c) PVFf-TiO2 prepared at pH 5 (internal side); (d)-(e) PVFf-TiO2-Fe
oxide prepared at pH 5.
4.3.1.4 UV-Visible absorbance study
Figure 4.7 presents the UV-visible absorption of PVFf-TiO2, PVF-Fe oxide and PVFf-TiO2-
Fe oxide composites between 350 and 700 nm. The absorbance of PVF in this region was
negligible. For The PVFf-TiO2 (trace a) the UV-visible spectrum shows that this material
only absorbs light below 400 nm, characteristic for TiO2 particles. In contrast, PVF-Fe-
oxide (trace b) absorbs visible light. Its spectrum shows an important absorption for low
wavelength (violet and UV light) and a shoulder between 550 and 450 nm (green-blue
light). PVFf-TiO2-Fe oxide spectrum (trace c) presented a similar spectrum shape to trace b
but the observed absorption was 2 times higher. Thus, the PVFf-TiO2-Fe oxide UV-visible
spectrum does not correspond to the sum of PVFf-TiO2 and PVF-Fe oxide spectra, which is
84
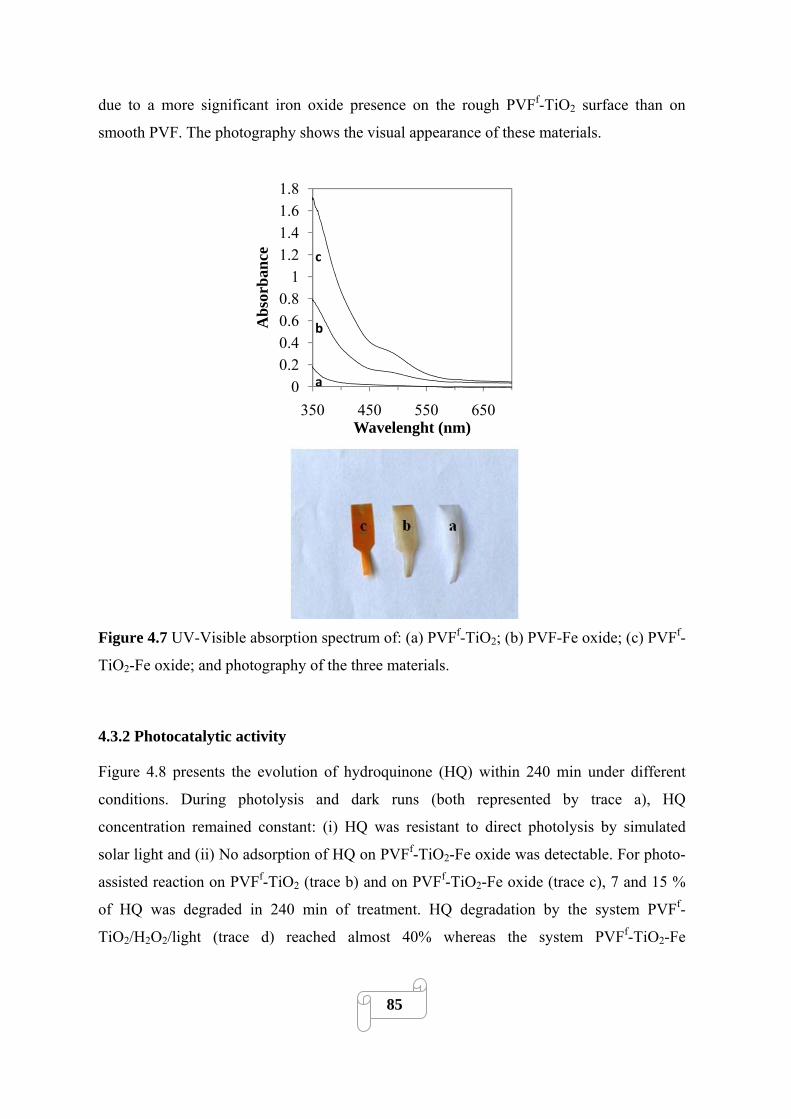
due to a more significant iron oxide presence on the rough PVFf-TiO2 surface than on
smooth PVF. The photography shows the visual appearance of these materials.
00.20.40.60.8
11.21.41.61.8
350 450 550 650
Abs
orba
nce
Wavelenght (nm)
c
b
a
Figure 4.7 UV-Visible absorption spectrum of: (a) PVFf-TiO2; (b) PVF-Fe oxide; (c) PVFf-
TiO2-Fe oxide; and photography of the three materials.
4.3.2 Photocatalytic activity
Figure 4.8 presents the evolution of hydroquinone (HQ) within 240 min under different
conditions. During photolysis and dark runs (both represented by trace a), HQ
concentration remained constant: (i) HQ was resistant to direct photolysis by simulated
solar light and (ii) No adsorption of HQ on PVFf-TiO2-Fe oxide was detectable. For photo-
assisted reaction on PVFf-TiO2 (trace b) and on PVFf-TiO2-Fe oxide (trace c), 7 and 15 %
of HQ was degraded in 240 min of treatment. HQ degradation by the system PVFf-
TiO2/H2O2/light (trace d) reached almost 40% whereas the system PVFf-TiO2-Fe
85
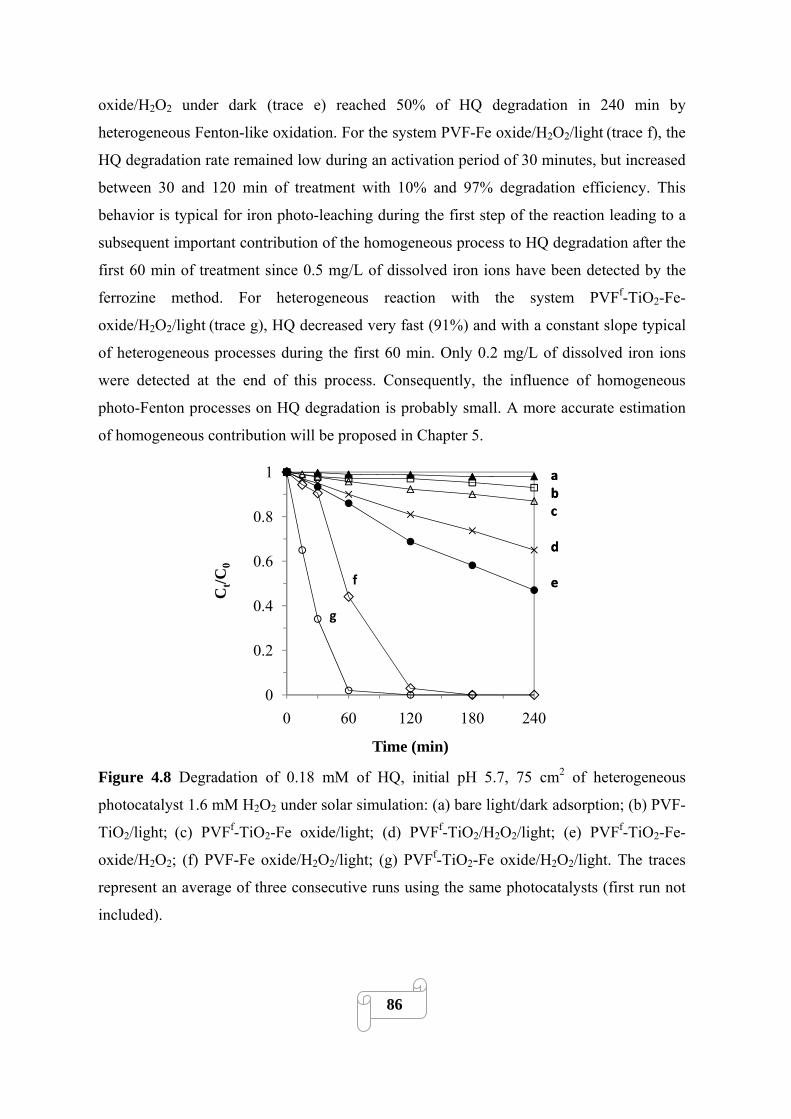
oxide/H2O2 under dark (trace e) reached 50% of HQ degradation in 240 min by
heterogeneous Fenton-like oxidation. For the system PVF-Fe oxide/H2O2/light (trace f), the
HQ degradation rate remained low during an activation period of 30 minutes, but increased
between 30 and 120 min of treatment with 10% and 97% degradation efficiency. This
behavior is typical for iron photo-leaching during the first step of the reaction leading to a
subsequent important contribution of the homogeneous process to HQ degradation after the
first 60 min of treatment since 0.5 mg/L of dissolved iron ions have been detected by the
ferrozine method. For heterogeneous reaction with the system PVFf-TiO2-Fe-
oxide/H2O2/light (trace g), HQ decreased very fast (91%) and with a constant slope typical
of heterogeneous processes during the first 60 min. Only 0.2 mg/L of dissolved iron ions
were detected at the end of this process. Consequently, the influence of homogeneous
photo-Fenton processes on HQ degradation is probably small. A more accurate estimation
of homogeneous contribution will be proposed in Chapter 5.
0
0.2
0.4
0.6
0.8
1
0 60 120 180 240
Ct/C
0
Time (min)
abc
d
ef
g
abc
d
e
Figure 4.8 Degradation of 0.18 mM of HQ, initial pH 5.7, 75 cm2 of heterogeneous
photocatalyst 1.6 mM H2O2 under solar simulation: (a) bare light/dark adsorption; (b) PVF-
TiO2/light; (c) PVFf-TiO2-Fe oxide/light; (d) PVFf-TiO2/H2O2/light; (e) PVFf-TiO2-Fe-
oxide/H2O2; (f) PVF-Fe oxide/H2O2/light; (g) PVFf-TiO2-Fe oxide/H2O2/light. The traces
represent an average of three consecutive runs using the same photocatalysts (first run not
included).
86
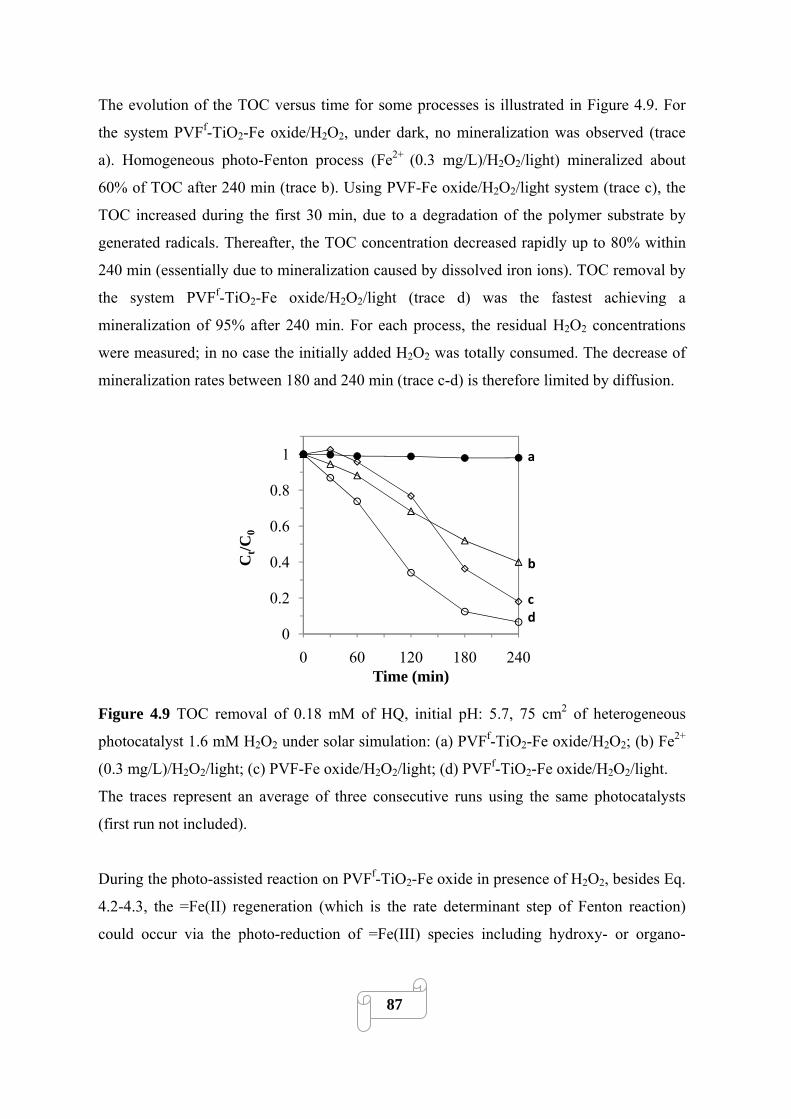
The evolution of the TOC versus time for some processes is illustrated in Figure 4.9. For
the system PVFf-TiO2-Fe oxide/H2O2, under dark, no mineralization was observed (trace
a). Homogeneous photo-Fenton process (Fe2+ (0.3 mg/L)/H2O2/light) mineralized about
60% of TOC after 240 min (trace b). Using PVF-Fe oxide/H2O2/light system (trace c), the
TOC increased during the first 30 min, due to a degradation of the polymer substrate by
generated radicals. Thereafter, the TOC concentration decreased rapidly up to 80% within
240 min (essentially due to mineralization caused by dissolved iron ions). TOC removal by
the system PVFf-TiO2-Fe oxide/H2O2/light (trace d) was the fastest achieving a
mineralization of 95% after 240 min. For each process, the residual H2O2 concentrations
were measured; in no case the initially added H2O2 was totally consumed. The decrease of
mineralization rates between 180 and 240 min (trace c-d) is therefore limited by diffusion.
0
0.2
0.4
0.6
0.8
1
0 60 120 180 240
Ct/C
0
Time (min)
a
b
cd
Figure 4.9 TOC removal of 0.18 mM of HQ, initial pH: 5.7, 75 cm2 of heterogeneous
photocatalyst 1.6 mM H2O2 under solar simulation: (a) PVFf-TiO2-Fe oxide/H2O2; (b) Fe2+
(0.3 mg/L)/H2O2/light; (c) PVF-Fe oxide/H2O2/light; (d) PVFf-TiO2-Fe oxide/H2O2/light.
The traces represent an average of three consecutive runs using the same photocatalysts
(first run not included).
During the photo-assisted reaction on PVFf-TiO2-Fe oxide in presence of H2O2, besides Eq.
4.2-4.3, the =Fe(II) regeneration (which is the rate determinant step of Fenton reaction)
could occur via the photo-reduction of =Fe(III) species including hydroxy- or organo-
87
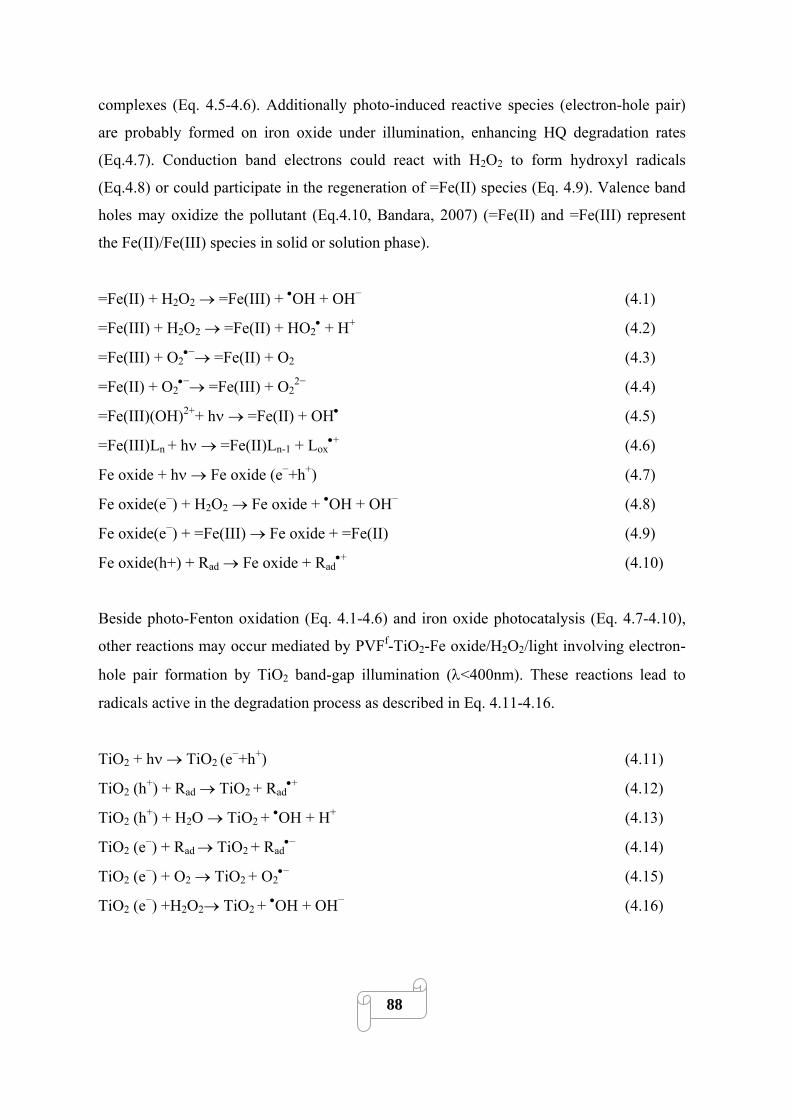
complexes (Eq. 4.5-4.6). Additionally photo-induced reactive species (electron-hole pair)
are probably formed on iron oxide under illumination, enhancing HQ degradation rates
(Eq.4.7). Conduction band electrons could react with H2O2 to form hydroxyl radicals
(Eq.4.8) or could participate in the regeneration of =Fe(II) species (Eq. 4.9). Valence band
holes may oxidize the pollutant (Eq.4.10, Bandara, 2007) (=Fe(II) and =Fe(III) represent
the Fe(II)/Fe(III) species in solid or solution phase).
=Fe(II) + H2O2 → =Fe(III) + •OH + OH− (4.1)
=Fe(III) + H2O2 → =Fe(II) + HO2• + H+ (4.2)
=Fe(III) + O2•−→ =Fe(II) + O2 (4.3)
=Fe(II) + O2•−→ =Fe(III) + O2
2− (4.4)
=Fe(III)(OH)2++ hν → =Fe(II) + OH• (4.5)
=Fe(III)Ln + hν → =Fe(II)Ln-1 + Lox•+ (4.6)
Fe oxide + hν → Fe oxide (e−+h+) (4.7)
Fe oxide(e−) + H2O2 → Fe oxide + •OH + OH− (4.8)
Fe oxide(e−) + =Fe(III) → Fe oxide + =Fe(II) (4.9)
Fe oxide(h+) + Rad → Fe oxide + Rad•+ (4.10)
Beside photo-Fenton oxidation (Eq. 4.1-4.6) and iron oxide photocatalysis (Eq. 4.7-4.10),
other reactions may occur mediated by PVFf-TiO2-Fe oxide/H2O2/light involving electron-
hole pair formation by TiO2 band-gap illumination (λ<400nm). These reactions lead to
radicals active in the degradation process as described in Eq. 4.11-4.16.
TiO2 + hν → TiO2 (e−+h+) (4.11)
TiO2 (h+) + Rad → TiO2 + Rad•+ (4.12)
TiO2 (h+) + H2O → TiO2 + •OH + H+ (4.13)
TiO2 (e−) + Rad → TiO2 + Rad•− (4.14)
TiO2 (e−) + O2 → TiO2 + O2•− (4.15)
TiO2 (e−) +H2O2→ TiO2 + •OH + OH− (4.16)
88

Furthermore, synergistic effects are likely to occur between TiO2, iron oxide, dissolved iron
ions and functionalized polymer surface, accelerating HQ degradation in presence of H2O2
as the electron acceptor.
4.3.3 Synergistic effects
Synergistic effects can be quantified by the synergistic factor S defined in Eq. 4.17, where
R0 represents the initial rate of degradation for a given process (Eq. 4.18).
S = R0(AB)/(R0(A)+R0(B)) (4.17)
R0 = ([HQ]0-[HQ]30)/30 (4.18)
In the system PVFf-TiO2-Fe oxide/H2O2/light, the overall process is a combination of
polymer supported TiO2 and iron oxide photocatalysis associated with heterogeneous and
homogeneous photo-Fenton oxidation. The exact assessment of synergistic effects in this
system is not easy due to the difficulty to prepare PVF-Fe oxide and PVFf-TiO2-Fe oxide
samples with the same iron oxide load. An approximated synergistic factor can be
estimated assuming that (1) The photocatalyst UV-visible extinction coefficients between
450-550 nm (Figure 4.7) are proportional to the amount of iron oxide present on the PVF
surface and (2) The photocatalytic activity of PVF-Fe oxide increases linearly with the
amount of immobilized iron oxide.
The initial HQ degradation rates (R0) have been calculated during the first 30 minutes for
different photo-assisted processes (Eq. 4.18) from the decay curve b, d, e, f, g in Figure 4.8
and are represented in Table 4.2.
These rates are representative for the heterogeneous reactions since a low amount of iron is
dissolved (<0.1 mg/L) at the beginning of the process. The rate R0 corresponding to a
virtual PVF-Fe oxide containing the same amount of iron oxide as a PVFf-TiO2-Fe oxide
was estimated according to assumptions (1) and (2). A correction factor C, defined in Eq.
4.19 as the integrated absorbance of PVFf-TiO2-Fe oxide (trace c) over the integrated
absorbance of PVF-Fe oxide (trace b) from 450 to 550 nm (where the TiO2 absorbance is
insignificant), was calculated from Figure 4.7.
89

C =450∫ 550 [A(PVFf-TiO2-Fe oxide)/A(PVF-Fe oxide)] dλ = 2.2 (4.19)
Multiplying R0(PVF-Fe oxide/H2O2/light) by C we can estimate R0(PVF-Fe
oxide/H2O2/light)VIRTUAL corresponding to the degradation rate relative to a PVF-Fe oxide
with an iron oxide load as PVFf-TiO2-Fe oxide (Eq. 4.20):
R0(PVF-Fe oxide/H2O2/light)VIRTUAL = C* R0(PVF-Fe oxide/H2O2/light) (4.20)
Replacing R0(A), R0(B) and R0(AB) in Eq. 4.17 by the values of R0(PVFf-TiO2/H2O2/light),
R0(PVF-Fe oxide/H2O2/light)VIRTUAL and R0(PVFf-TiO2-Fe oxide/H2O2/light) (from Table
4.2) respectively, the synergistic factor S can be calculated. A value of S≈2.5 was obtained,
meaning that the rate relative to the combined processes is 2.5 times faster than the sum of
rates relative to the separated processes. Compared to previous studies (Torres, 2008, Zou,
2008, Bouras, 2008), this result suggests the presence of a significant synergistic effect in
the system PVFf-TiO2-Fe oxide/H2O2/light.
Table 4.2. Initial HQ degradation rates relative to different photo-assisted processes.
Photo-Process R0(μmol/min)
H2O2 0.14
PVFf-TiO2 0.08
(PVFf-TiO2)/H2O2 0.29a
(PVF-Fe oxide)/H2O2 0.57b
(PVF-Fe oxide)Virtualc/H2O2 1.3d
(PVFf-TiO2-Fe oxide)/H2O2 4.0e a Value calculated from decay curve d of Figure 4.8. b Value calculated from decay curve f of Figure 4.8. c Virtual photocatalyst containing the same amount of iron oxide as PVFf-TiO2-Fe oxide. d Rate estimated from a and from Eq. 19-20 and Figure 4.7. e Value calculated from decay curve g of Figure 4.8.
90
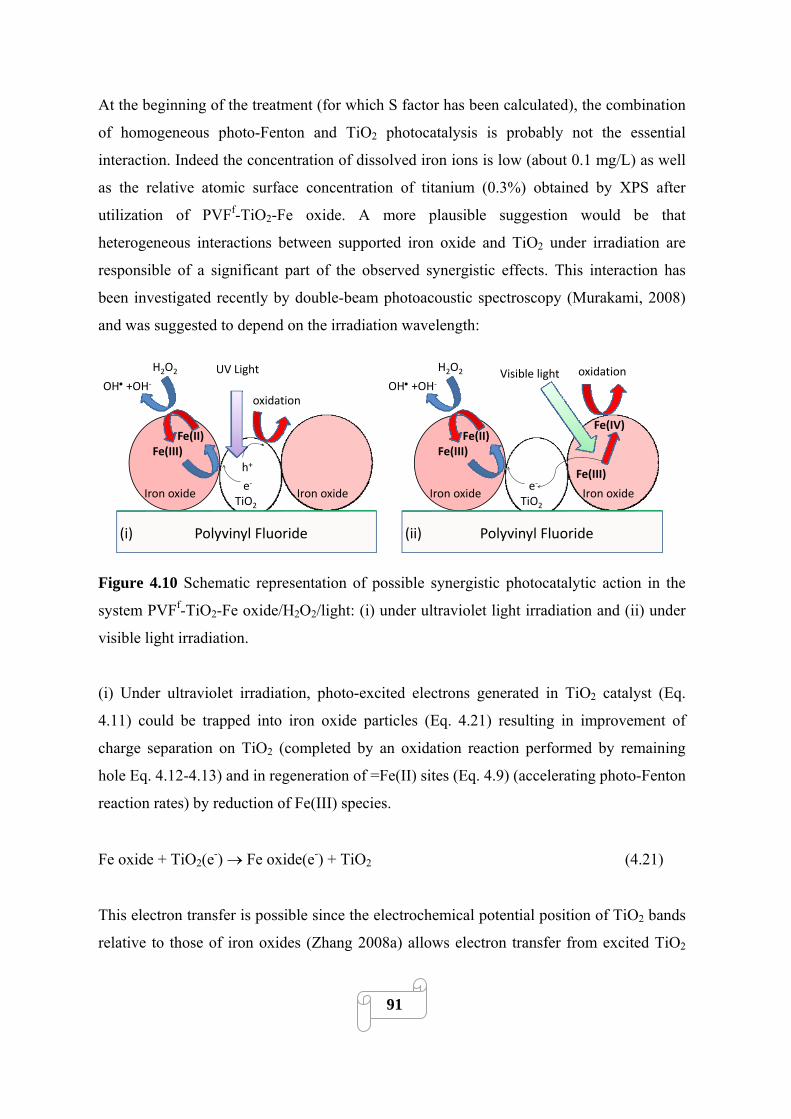
At the beginning of the treatment (for which S factor has been calculated), the combination
of homogeneous photo-Fenton and TiO2 photocatalysis is probably not the essential
interaction. Indeed the concentration of dissolved iron ions is low (about 0.1 mg/L) as well
as the relative atomic surface concentration of titanium (0.3%) obtained by XPS after
utilization of PVFf-TiO2-Fe oxide. A more plausible suggestion would be that
heterogeneous interactions between supported iron oxide and TiO2 under irradiation are
responsible of a significant part of the observed synergistic effects. This interaction has
been investigated recently by double-beam photoacoustic spectroscopy (Murakami, 2008)
and was suggested to depend on the irradiation wavelength:
TiO2Iron oxideIron oxide
(i) Polyvinyl Fluoride
e‐
Fe(III)
H2O2
OH• +OH‐
Fe(II)
h+
oxidation
UV Light
TiO2Iron oxideIron oxide
(ii) Polyvinyl Fluoride
e‐
Fe(III)
H2O2
OH• +OH‐
Fe(II)
oxidationVisible light
Fe(III)
Fe(IV)
Figure 4.10 Schematic representation of possible synergistic photocatalytic action in the
system PVFf-TiO2-Fe oxide/H2O2/light: (i) under ultraviolet light irradiation and (ii) under
visible light irradiation.
(i) Under ultraviolet irradiation, photo-excited electrons generated in TiO2 catalyst (Eq.
4.11) could be trapped into iron oxide particles (Eq. 4.21) resulting in improvement of
charge separation on TiO2 (completed by an oxidation reaction performed by remaining
hole Eq. 4.12-4.13) and in regeneration of =Fe(II) sites (Eq. 4.9) (accelerating photo-Fenton
reaction rates) by reduction of Fe(III) species.
Fe oxide + TiO2(e-) → Fe oxide(e-) + TiO2 (4.21)
This electron transfer is possible since the electrochemical potential position of TiO2 bands
relative to those of iron oxides (Zhang 2008a) allows electron transfer from excited TiO2
91
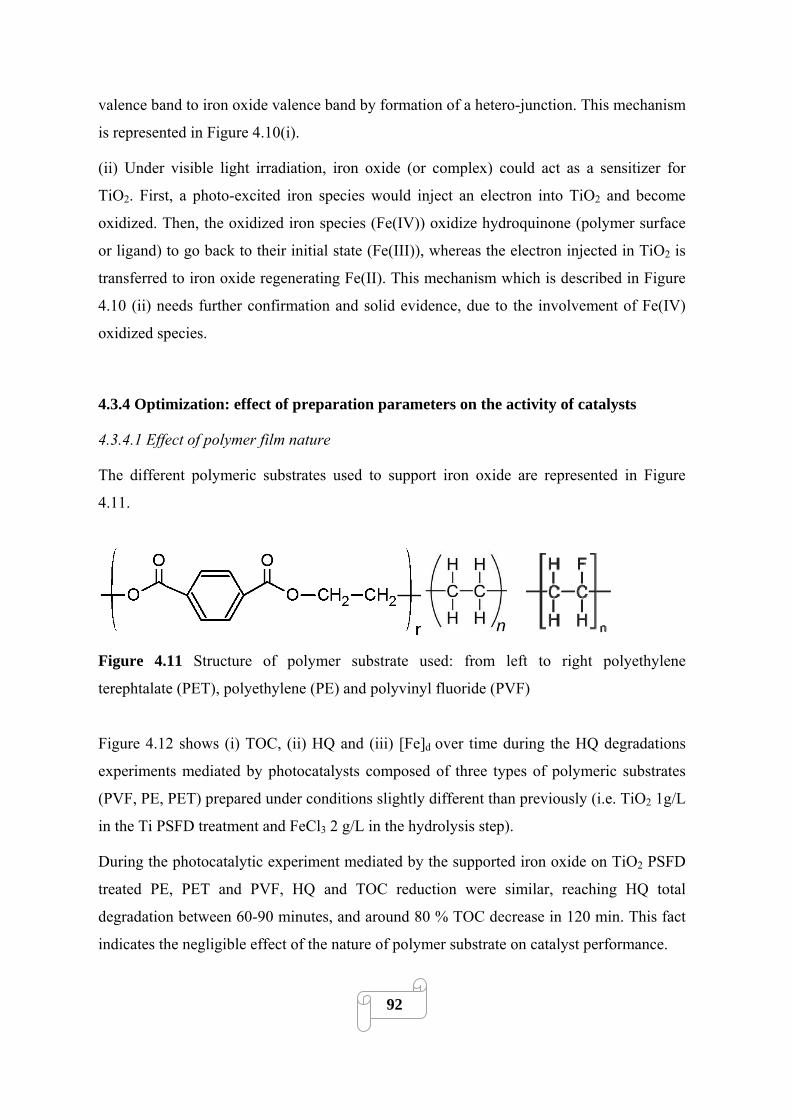
valence band to iron oxide valence band by formation of a hetero-junction. This mechanism
is represented in Figure 4.10(i).
(ii) Under visible light irradiation, iron oxide (or complex) could act as a sensitizer for
TiO2. First, a photo-excited iron species would inject an electron into TiO2 and become
oxidized. Then, the oxidized iron species (Fe(IV)) oxidize hydroquinone (polymer surface
or ligand) to go back to their initial state (Fe(III)), whereas the electron injected in TiO2 is
transferred to iron oxide regenerating Fe(II). This mechanism which is described in Figure
4.10 (ii) needs further confirmation and solid evidence, due to the involvement of Fe(IV)
oxidized species.
4.3.4 Optimization: effect of preparation parameters on the activity of catalysts
4.3.4.1 Effect of polymer film nature
The different polymeric substrates used to support iron oxide are represented in Figure
4.11.
Figure 4.11 Structure of polymer substrate used: from left to right polyethylene
terephtalate (PET), polyethylene (PE) and polyvinyl fluoride (PVF)
Figure 4.12 shows (i) TOC, (ii) HQ and (iii) [Fe]d over time during the HQ degradations
experiments mediated by photocatalysts composed of three types of polymeric substrates
(PVF, PE, PET) prepared under conditions slightly different than previously (i.e. TiO2 1g/L
in the Ti PSFD treatment and FeCl3 2 g/L in the hydrolysis step).
During the photocatalytic experiment mediated by the supported iron oxide on TiO2 PSFD
treated PE, PET and PVF, HQ and TOC reduction were similar, reaching HQ total
degradation between 60-90 minutes, and around 80 % TOC decrease in 120 min. This fact
indicates the negligible effect of the nature of polymer substrate on catalyst performance.
92
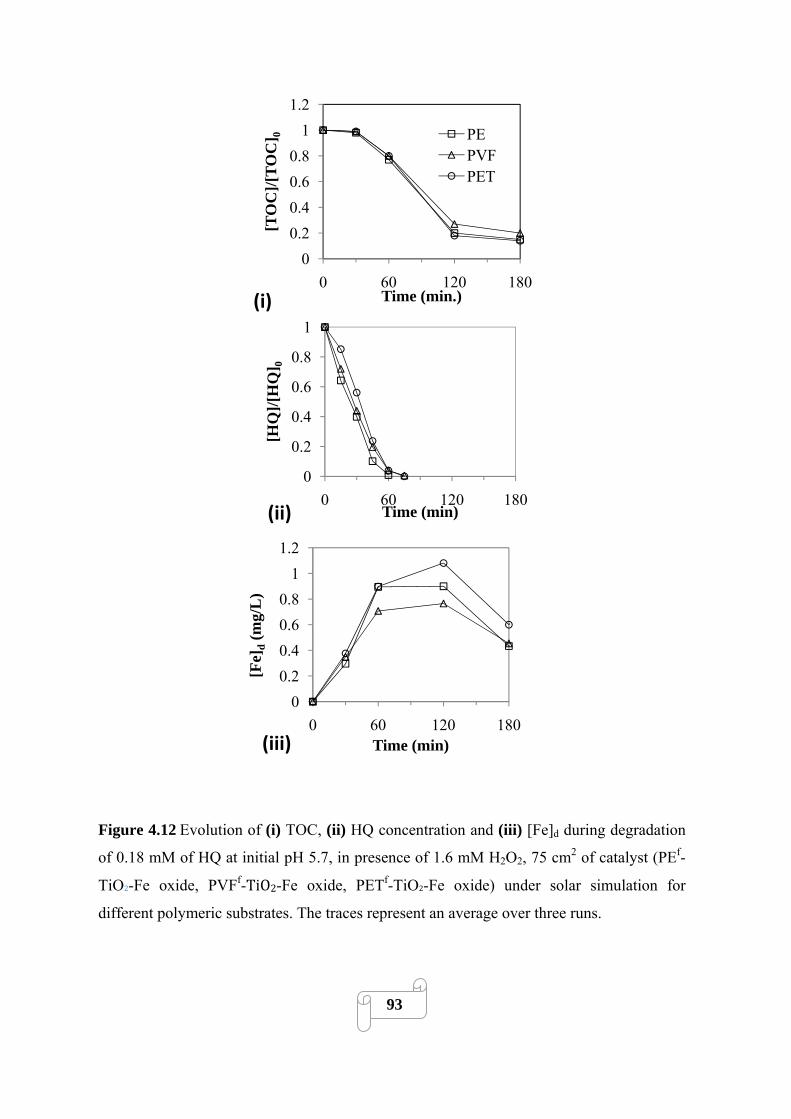
00.20.40.60.8
11.2
0 60 120 180[T
OC
]/[TO
C] 0
Time (min.)
PEPVFPET
(i)
0
0.2
0.4
0.6
0.8
1
0 60 120 180
[HQ
]/[H
Q] 0
Time (min)(ii)
00.20.40.60.8
11.2
0 60 120 180
[Fe]
d(m
g/L
)
Time (min)(iii)
Figure 4.12 Evolution of (i) TOC, (ii) HQ concentration and (iii) [Fe]d during degradation
of 0.18 mM of HQ at initial pH 5.7, in presence of 1.6 mM H2O2, 75 cm2 of catalyst (PEf-
TiO2-Fe oxide, PVFf-TiO2-Fe oxide, PETf-TiO2-Fe oxide) under solar simulation for
different polymeric substrates. The traces represent an average over three runs.
93
In contrast, Figure 4.12 (iii) shows that the amount of leached iron ions was dependant on
the polymer nature with a maximum around 1.1, 0.9 and 0.7 mg/L after 120 min of
treatment for PET, PVF and PE, respectively. A larger iron leaching could be linked to
larger iron oxides quantities adsorbed on the substrate and, by extension, to the
achievement of more surface functionalization in the pre-treatment, and to the own nature
of the substrate (higher polarized surface).
The latter results suggest that different polymer substrate can be used depending on the
application required. PET bottles could be used as catalyst support for drinking water
production by modified solar water disinfection (SODIS). SODIS is a low cost method for
treating microbial contaminated drinking water in transparent plastic bottles (Sommer,
1997). Nevertheless this method presents some disadvantages such as temperature
dependency and re-growth of microorganism. The application of supported photo-Fenton
could solve the SODIS limitations and lead to the simultaneous disinfection and
degradation of xenobiotics and natural organic matter. The inactivation of E. coli in
modified PET bottles is discussed section 4.3.4.5.
4.3.4.2 Effect of the pH during TiO2 PSFD treatment
The initial pH of the aqueous medium during the TiO2 PSFD treatment determines the
amount of oxygenated groups formed and the superficial charge of TiO2 nanoparticles. The
extent of TiO2 photo-deposition depends on the pH as well (Table 4.1). At acidic pH, the
TiO2 being positively charged can be stably deposited on electronegative oxygenated
groups on the polymer surface. At basic pH, the TiO2 and polymer are both negatively
charged and the interaction is repulsive, limiting the polymer functionalization and the TiO2
deposition. Consequently, since iron oxide crystallization is favored by TiO2 presence, less
iron oxide is deposited on its surface leading to a less efficient PVFf-TiO2-Fe oxide
photocatalyst. HQ mineralization rates by PVFf-TiO2-Fe oxide/H2O2/light decrease as the
pH for TiO2 PSFD treatment increased with 73, 68 and 46% of HQ mineralized after 120
minutes for pH 3, 7 and 11 respectively. Figure 4.13 represents TOC removal by different
photocatalyst during HQ degradation in presence of H2O2 under light. The disparity
between PVF-Fe-oxide (trace a) and PVFf-TiO2-Fe oxide prepared at pH 11 and 3 (trace b-
94
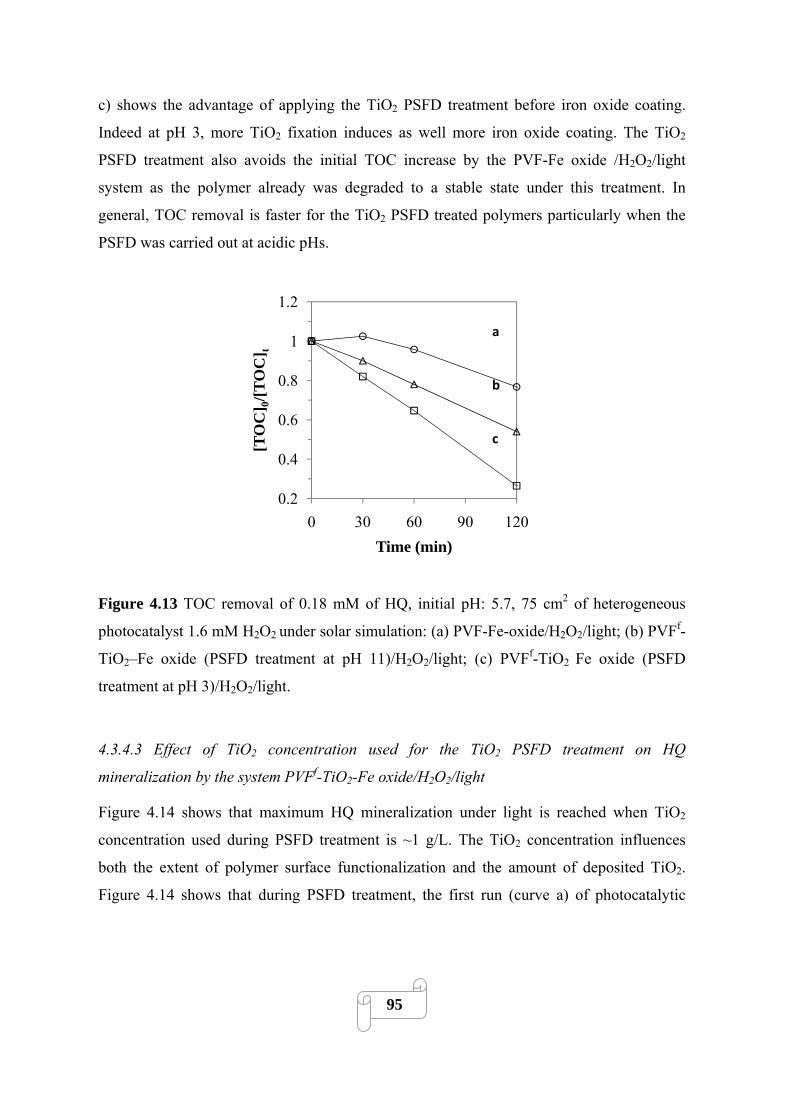
c) shows the advantage of applying the TiO2 PSFD treatment before iron oxide coating.
Indeed at pH 3, more TiO2 fixation induces as well more iron oxide coating. The TiO2
PSFD treatment also avoids the initial TOC increase by the PVF-Fe oxide /H2O2/light
system as the polymer already was degraded to a stable state under this treatment. In
general, TOC removal is faster for the TiO2 PSFD treated polymers particularly when the
PSFD was carried out at acidic pHs.
0.2
0.4
0.6
0.8
1
1.2
0 30 60 90 120
[TO
C] 0
/[TO
C] t
Time (min)
a
b
c
Figure 4.13 TOC removal of 0.18 mM of HQ, initial pH: 5.7, 75 cm2 of heterogeneous
photocatalyst 1.6 mM H2O2 under solar simulation: (a) PVF-Fe-oxide/H2O2/light; (b) PVFf-
TiO2–Fe oxide (PSFD treatment at pH 11)/H2O2/light; (c) PVFf-TiO2 Fe oxide (PSFD
treatment at pH 3)/H2O2/light.
4.3.4.3 Effect of TiO2 concentration used for the TiO2 PSFD treatment on HQ
mineralization by the system PVFf-TiO2-Fe oxide/H2O2/light
Figure 4.14 shows that maximum HQ mineralization under light is reached when TiO2
concentration used during PSFD treatment is ~1 g/L. The TiO2 concentration influences
both the extent of polymer surface functionalization and the amount of deposited TiO2.
Figure 4.14 shows that during PSFD treatment, the first run (curve a) of photocatalytic
95
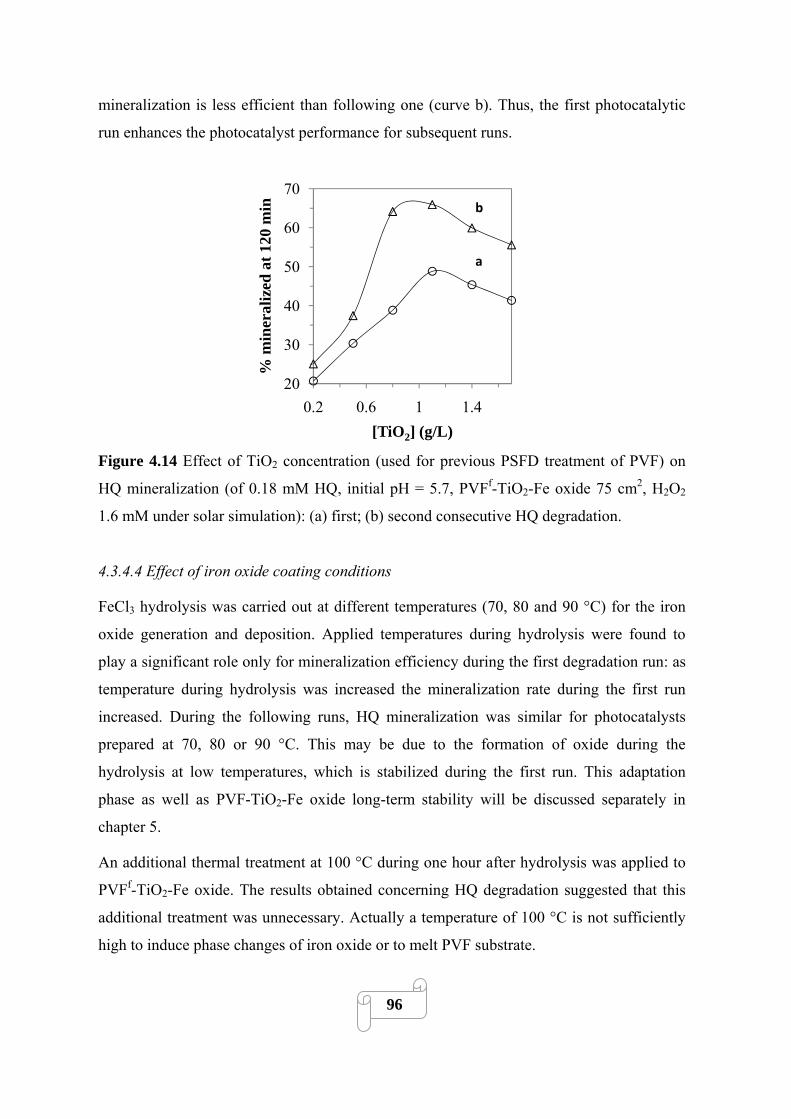
mineralization is less efficient than following one (curve b). Thus, the first photocatalytic
run enhances the photocatalyst performance for subsequent runs.
20
30
40
50
60
70
0.2 0.6 1 1.4
% m
iner
aliz
ed a
t 120
min
[TiO2] (g/L)
b
a
Figure 4.14 Effect of TiO2 concentration (used for previous PSFD treatment of PVF) on
HQ mineralization (of 0.18 mM HQ, initial pH = 5.7, PVFf-TiO2-Fe oxide 75 cm2, H2O2
1.6 mM under solar simulation): (a) first; (b) second consecutive HQ degradation.
4.3.4.4 Effect of iron oxide coating conditions
FeCl3 hydrolysis was carried out at different temperatures (70, 80 and 90 °C) for the iron
oxide generation and deposition. Applied temperatures during hydrolysis were found to
play a significant role only for mineralization efficiency during the first degradation run: as
temperature during hydrolysis was increased the mineralization rate during the first run
increased. During the following runs, HQ mineralization was similar for photocatalysts
prepared at 70, 80 or 90 °C. This may be due to the formation of oxide during the
hydrolysis at low temperatures, which is stabilized during the first run. This adaptation
phase as well as PVF-TiO2-Fe oxide long-term stability will be discussed separately in
chapter 5.
An additional thermal treatment at 100 °C during one hour after hydrolysis was applied to
PVFf-TiO2-Fe oxide. The results obtained concerning HQ degradation suggested that this
additional treatment was unnecessary. Actually a temperature of 100 °C is not sufficiently
high to induce phase changes of iron oxide or to melt PVF substrate.
96

4.3.4.5 Effect of preparation on Bacterial inactivation
The ability of PET-TiO2-Fe oxide to inactivate the indicator bacteria E. coli in presence of
H2O2 and light was investigated in batch reactor. However, this material was found to
constitute a light filter to the incoming light, protecting bacteria suspension from direct
radiation. The protective effect was not observed in the case of HQ degradation because the
reactor setup was different (the internal opaque PVC support make the photochemical
reaction possible only between internal surface of Pyrex reactor and the surface of
photocatalyst films) and because in contrast with E Coli, HQ is resistant to photolysis.
Then PET bottles (PETb) were used as catalyst support and their bottom were
functionalized and coated with iron oxide (to let the light pass through the suspension)
leading to PETbf-TiO2 Fe oxide (see Figure 4.15).
Figure 4.15 Photography of PETbf-TiO2-Fe oxide used in this study
The inactivation of E. coli suspended in pure water under simulated solar light was
measured in PETb reactor in presence of Fe3+ and H2O2. Simultaneously, inactivation
mediated by PETb-TiO2-Fe oxide in presence of H2O2 and the photolytic inactivation were
measured. Figure 4.15 shows first order exponential fittings (lines) calculated in Matlab (Nt
=N0ekobs*t). Table 4.3 shows the composition of the suspension matrices, the experimental
conditions for the different systems and observed inactivation rates (kobs (min-1)).
97
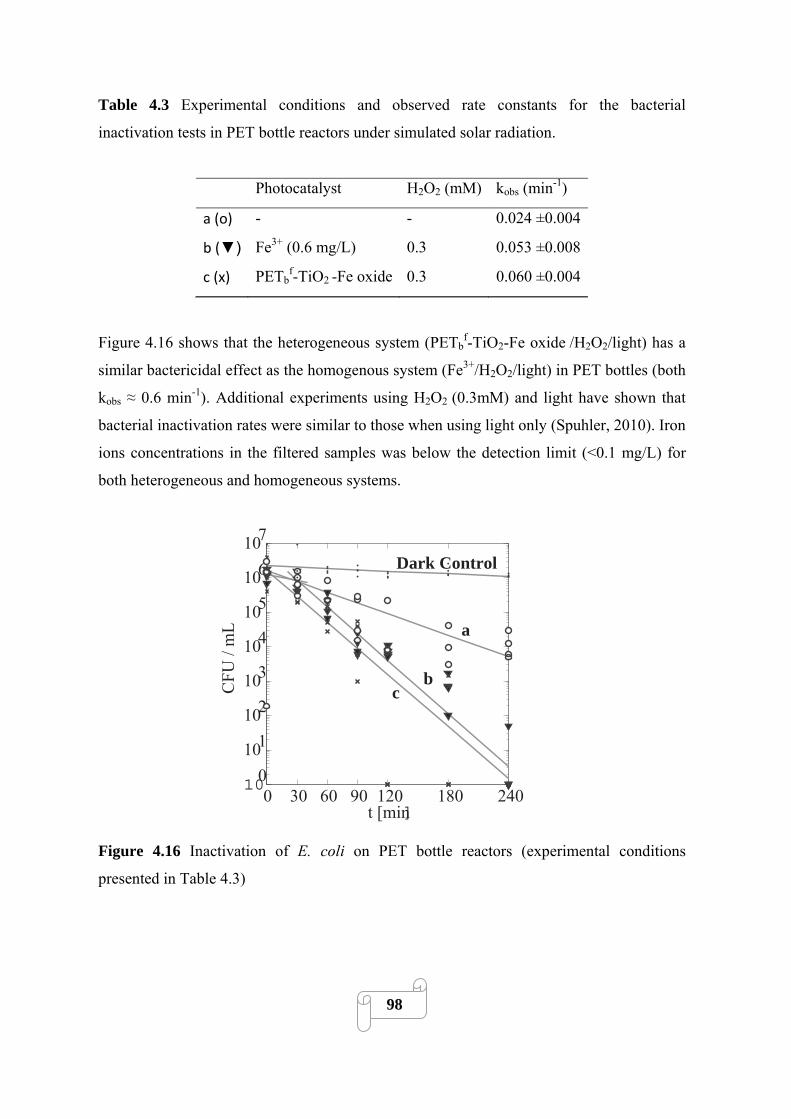
Table 4.3 Experimental conditions and observed rate constants for the bacterial
inactivation tests in PET bottle reactors under simulated solar radiation.
Photocatalyst H2O2 (mM) kobs (min-1)
a (o) - - 0.024 ±0.004
b (▼) Fe3+ (0.6 mg/L) 0.3 0.053 ±0.008
c (x) PETbf-TiO2 -Fe oxide 0.3 0.060 ±0.004
Figure 4.16 shows that the heterogeneous system (PETbf-TiO2-Fe oxide /H2O2/light) has a
similar bactericidal effect as the homogenous system (Fe3+/H2O2/light) in PET bottles (both
kobs ≈ 0.6 min-1). Additional experiments using H2O2 (0.3mM) and light have shown that
bacterial inactivation rates were similar to those when using light only (Spuhler, 2010). Iron
ions concentrations in the filtered samples was below the detection limit (<0.1 mg/L) for
both heterogeneous and homogeneous systems.
0 30 60 90 120 180 240100101102103104105106107
bc
a
Dark Control
t [min]
CFU
/ m
L
Figure 4.16 Inactivation of E. coli on PET bottle reactors (experimental conditions
presented in Table 4.3)
98
Different explanations can justify the absence of detectable dissolved iron when using PET
bottles: (i) the inactivation may takes place on bottle surface (on iron or titanium oxide for
heterogeneous system, and eventually iron complexes adsorbed on bottle surface for
homogeneous system); (ii) the dissolved iron species may also be adsorbed on bacteria
surface or even enter the intracellular medium and this contact could significantly
contribute to the effective photo-inactivation (Spuhler, 2010).
4.4 Conclusions
• This work presents an innovative and simple way to prepare a highly photoactive catalyst
combining TiO2 and iron oxide fixed on PVF films.
• The surface characterization of photocatalyst shows that the PSFD treatment induced
simultaneous surface functionalization involving oxygen-surface species formation and
deposition of TiO2 on carboxylic groups due to an electrostatic attraction.
• The TiO2 deposition occurred preferentially when pH ≤ 7 and the activity of
photocatalysts increased with acidity during PSFD treatment.
• The TiO2 and iron oxide on PVF was an efficient material toward HQ degradation and
mineralization under light in presence of H2O2, at ambient temperature and neutral initial
pH.
• Synergistic effects between TiO2 and iron oxide for the system PVFf-TiO2-Fe
oxide/H2O2/light were found to be significant and a synergistic factor S around 2.5 was
estimated. These synergistic effects were assigned to the regeneration of =Fe(II) which is
the rate-limiting step in Fenton processes.
• PVF, PE or PET supports led to catalysts showing similar photoactivity ruling out the
possibility that the polymer nature influences significantly the catalyst efficiency.
• PET bottle employed as reactors and catalysts support (PETbTi-PC-Fe oxide) was an
efficient heterogeneous photocatalyst to inactivate bacteria and no dissolved iron ions were
detected in the filtered solution opening perspectives for SODIS applications.
99
4.5 References Bandara J., Klehm U., Kiwi J. (2007) Raschig rings-Fe2O3 composite photocatalyst
activate in the degradation of 4-chlorophenol and Orange II under daylight irradiation. Applied Catalysis B: Environmental 76: 73-81.
Bouras P., Lianos P. (2008) Synergy effect in the combined photodegradation of an azo dye by titanium dioxide photocatalysis and photo-fenton oxidation. Catalysis Letters 123: 220-22.
Cai J., Liu J., Gao Z., Navrotsky A., Suib S.L. (2001) Synthesis and anion exchange of tunnel structure akaganeite. Chemistry of Materials 13: 4595-4602.
Celik E., Yildiz A.Y., Ak Azem N.F., Tanoglu M., Toparli M., Emrullahoglu O.F., Ozdemir I. (2006) Preparation and characterization of Fe2O3-TiO2 thin films on glass substrate for photocatalytic applications. Materials Science and Engineering B: Solid-State Materials for Advanced Technology 129: 193-199.
Deliyanni E.A., Nalbandian L., Matis K.A. (2006) Adsorptive removal of arsenites by a nanocrystalline hybrid surfactant-akaganeite sorbent. Journal of Colloid and Interface Science 302: 458-466.
Greer A.L., Quested T.E. (2006) Heterogeneous grain initiation in solidification. Philosophical Magazine 86: 3665-3680.
Handbook of X-ray photoelectron spectroscopy, Perkin Elmer Corporation (1992) 72-73. Kim G.G., Kang J.A., Kim J.H., Kim S.J., Lee N.H., Kim S.J. (2006) Metallization of
polymer through a novel surface modification applying a photocatalytic reaction. Surface and Coating Technology 201:3761–3766.
Moulder J.F., Stickle W.F., Sobol P.E., Bomben K.D. (1992) Handbook of X-ray photoelectron spectroscopy, Physical Electronics.
Murakami N., Chiyoya T., Tsubota T., Ohno T. (2008) Switching redox site of photocatalytic reaction on titanium(IV) oxide particles modified with transition-metal ion controlled by irradiation wavelength. Applied Catalysis A: General 348: 148-152.
Musić, S., Krehula, S., Popović, S., Skoko, Z. (2003) Some factors influencing forced hydrolysis of FeCl3 solutions. Materials Letters 57: 1096-1102.
Sommer B., Mariño A., Solarte Y., Salas M. L., Dierolf C., Valiente C., Mora D., Rechsteiner R., Setter P., Wirojanagud W., Ajarmeh H., Al-Hassan A., Wegelin M., (1997) SODIS - An emerging water treatment process, Journal of Water Supply: Research and Technology-AQUA. 46:127–137.
Spuhler D., Rengifo-Herrera J.A., Pulgarin C. (2010) The effect of Fe2+, Fe3+, H2O2 and the photo-Fenton reagent at near neutral pH on the Solar Disinfection (SODIS) at low temperatures of Water containing E. coli K12. Applied catalysis B: Environmental doi: 10.1016/j.apcatb.2010.02.010.
Torres R.A., Nieto J.I., Combet E., Pétrier C., Pulgarin C. (2008) Influence of TiO2 concentration on the synergistic effect between photocatalysis and high-frequency ultrasound for organic pollutant mineralization in water. Applied Catalysis B: Environmental 80: 168-175.
Zhang W., Chen Y., Yu S., Chen S., Yin Y. (2008a) Preparation and antibacterial behavior of Fe3+-doped nanostructured TiO2 thin films Thin Solid Films 516: 4690-4694.
Zhang X., Lei L., (2008b) Preparation of photocatalytic Fe2O3-TiO2 coatings in one step by metal organic chemical vapor deposition. Applied Surface Science 254: 2406-2412.
100

Zhou W., Fu H., Pan K., Tian C., Qu Y., Lu P., Sun C.-C. (2008) Mesoporous TiO2/α-Fe2O3: bifunctional composites for effective elimination of arsenite contamination through simultaneous photocatalytic oxidation and adsorption. Journal of Physical Chemistry C 112: 19584-19589.
Zou L., Zhu B. (2008) The synergistic effect of ozonation and photocatalysis on color removal from reused water. Journal of Photochemistry and Photobiology A: Chemistry 196: 24-32.
101

102
5- TiO2 AND IRON OXIDE COATED POLYMER
FILMS: INFLUENCE OF REACTION
PARAMETERS ON PHOTOCATALYTIC
ACTIVITY, LONG-TERM STABILITY
5.1 Introduction
The aimed characteristics for supported TiO2-Fe oxide as heterogeneous photocatalysts are:
(i) low leaching out of photoactive species from support surface during operation; (ii)
adequate degradation rates at neutral pH and under solar illumination; (iii) resistance of
support to oxidation by radicals in solution; (iv) catalyst showing long-term stability and
(v) catalyst manufacture should be sustainable from the environmental and economical
point of view.
Some recent studies described TiO2-Fe oxide photocatalysts (Zhang, 2008; Akhavan,
2009). However, the effect of pH, temperature on rates has not been reported. In the case of
supported heterogeneous photo-Fenton systems (Yuranova, 2004; Gumy, 2005; Song,
2006; Bandara, 2007; Moncayo, 2008), degradation rates are generally strongly pH-
dependant with highest performance at pH 3 and lower as we move to neutral initial pH. In
these systems, the degradation rates increase as the temperature increases (Ramirez, 2007).
The effect of NaCl content on rates is also an important issue because of the utilization of
sea water in some industrial processes.
The dissolution of iron ions is a common phenomenon during heterogeneous photo-Fenton
oxidation. In the presence of ligands (aliphatic acids, humic acids…) and light, particularly
under acidic conditions, iron is released by photo-reductive dissolution increasing the
contribution of homogeneous photo-Fenton reaction (Sulzberger, 1995; Voelker, 1997).
103
In this chapter, hydroquinone (HQ) has been selected as a model substance whereas
nalidixic acid (NA) was used because it is an antibiotic present in a real saline
pharmaceutical wastewater. The objectives are: (i) to examine the performance of PVFf-
TiO2-Fe oxide in the degradation of HQ and NA under different reaction conditions (pH,
temperature, NaCl content), (ii) correlate the photo-activity enhancement to the surfaces
modifications (iii) to test the long term stability of the catalyst.
5.2 Experimental
5.2.1 Chemicals
Hydroquinone (C6H6O2), nalidixic acid (C12H12N2O3), NaOH, NaCl, HNO3, FeSO4.7H2O,
ferrozine, hydroxylamine hydrochloride, acetate buffer (pH = 4.65) were Fluka p.a.
reagents (Buchs, Switzerland) and used as received. Hydrogen peroxide (35% by weight)
was supplied by Merck AG (Darmstadt, Germany) and TiO2 P25 (anastase to rutile weight
ratio between 70:30 and 80:20) by Degussa.
5.2.2 Photocatalyst preparation
The photocatalyst used in this chapter is the optimized PVFf-TiO2-Fe oxide. Briefly, a TiO2
PSFD treatment of 2 hours was applied to PVF film using aqueous TiO2 suspensions (1
g/L) at natural initial pH (≈ 5) and under simulated sunlight irradiation leading to PVFf-
TiO2; The films were afterward immersed in an aqueous solution of FeCl3 (5 g/L) and
heated at 80 °C under stirring for one hour. Then the resulting materials were dried in an
oven at 100 °C during one hour.
5.2.3 Photo-reactor and irradiation procedure
The photo-reactor and irradiation procedure used for organic compounds degradation is
described in detail points 2.2.2 and 3.2.3.
104
5.2.4 Analysis of the irradiated solutions
The quantitative determination of nalidixic acid was carried out by HPLC chromatography
using a LC system HPLC-UV: Shimatzu LC-2010A equipped with a UV detector. Samples
were injected via an auto-sampler. Samples of the treated NA solution were eluted at a flow
rate of 1 mL/min through a column (nucleosil C8 HPLC) and using as mobile phase HPLC
grade acetonitrile–formic acid solution (25 mM) in a 50%-50%.
The pH values were measured with a pH electrode SenTixH WPW connected to a pH 330i
WTW device. The methods used for TOC, HQ, H2O2, dissolved iron quantification were
described in detail point 3.2.4.
The analyses were performed as fast as possible after sampling in order to minimize the
effect of dark Fenton reaction.
5.2.5 Photocatalyst characterization
The Characteristics of XPS and SEM apparatus are specified in point 4.2.6.
5.3 Results and discussions
5.3.1 Photocatalytic activity toward hydroquinone and nalidixic acid degradation
Figure 5.1 present the evolution of HQ and TOC concentrations within 240 min under
different conditions. Trace a shows that HQ mineralization induced by the homogeneous
photo-Fenton oxidation (Fe2+(0.3 mg/L)/H2O2/light) reached around 60%. For the system
PVF-Fe oxide/H2O2/light (trace b), the TOC concentration increased during the first 30
minutes, due to PVF degradation by generated radicals, and thereafter rapidly decreased to
reach 80% of mineralization after 240 min. For the system PVFf-TiO2-Fe oxide/H2O2/light
(trace c), the TOC removal was faster, reaching a mineralization of 95% and the half-life
time was about 20 minutes (trace d) for HQ under these conditions. A comparison between
trace b and trace c in Figure 5.1 shows the beneficial effect induced by the TiO2 PSFD
treatment. These results shows that the presence of a TiO2 layer between functionalized
polymer surface and iron oxide layer prevents from the degradation and dissolution
105
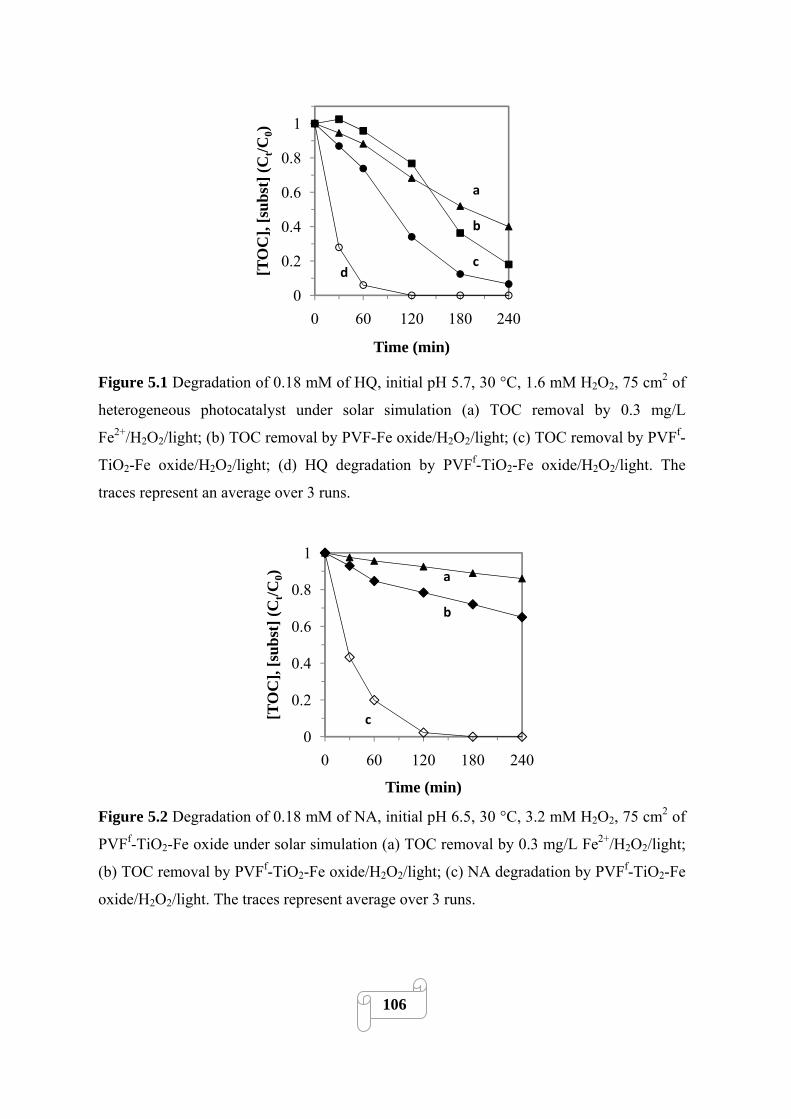
0
0.2
0.4
0.6
0.8
1
0 60 120 180 240
[TO
C],
[sub
st] (
Ct/C
0)
Time (min)
a
b
cd
Figure 5.1 Degradation of 0.18 mM of HQ, initial pH 5.7, 30 °C, 1.6 mM H2O2, 75 cm2 of
heterogeneous photocatalyst under solar simulation (a) TOC removal by 0.3 mg/L
Fe2+/H2O2/light; (b) TOC removal by PVF-Fe oxide/H2O2/light; (c) TOC removal by PVFf-
TiO2-Fe oxide/H2O2/light; (d) HQ degradation by PVFf-TiO2-Fe oxide/H2O2/light. The
traces represent an average over 3 runs.
0
0.2
0.4
0.6
0.8
1
0 60 120 180 240
[TO
C],
[sub
st] (
Ct/C
0)
Time (min)
a
b
c
Figure 5.2 Degradation of 0.18 mM of NA, initial pH 6.5, 30 °C, 3.2 mM H2O2, 75 cm2 of
PVFf-TiO2-Fe oxide under solar simulation (a) TOC removal by 0.3 mg/L Fe2+/H2O2/light;
(b) TOC removal by PVFf-TiO2-Fe oxide/H2O2/light; (c) NA degradation by PVFf-TiO2-Fe
oxide/H2O2/light. The traces represent average over 3 runs.
106
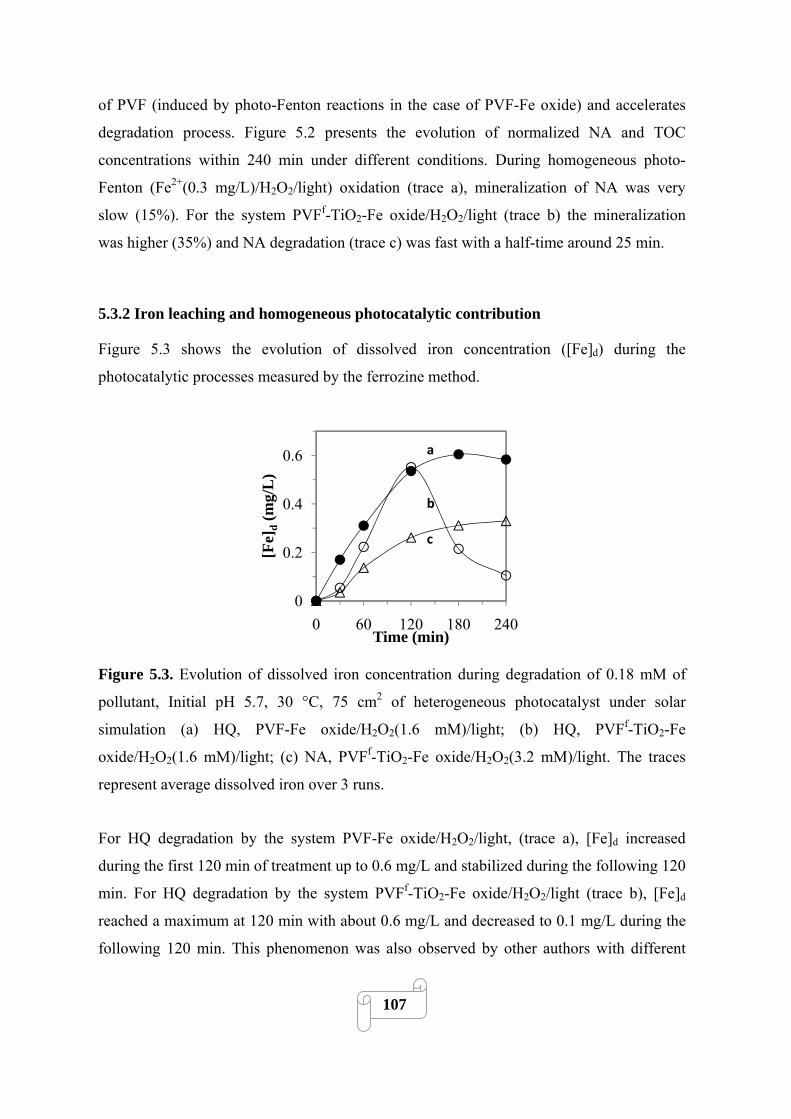
of PVF (induced by photo-Fenton reactions in the case of PVF-Fe oxide) and accelerates
degradation process. Figure 5.2 presents the evolution of normalized NA and TOC
concentrations within 240 min under different conditions. During homogeneous photo-
Fenton (Fe2+(0.3 mg/L)/H2O2/light) oxidation (trace a), mineralization of NA was very
slow (15%). For the system PVFf-TiO2-Fe oxide/H2O2/light (trace b) the mineralization
was higher (35%) and NA degradation (trace c) was fast with a half-time around 25 min.
5.3.2 Iron leaching and homogeneous photocatalytic contribution
Figure 5.3 shows the evolution of dissolved iron concentration ([Fe]d) during the
photocatalytic processes measured by the ferrozine method.
0
0.2
0.4
0.6
0 60 120 180 240
[Fe]
d(m
g/L
)
Time (min)
a
b
c
Figure 5.3. Evolution of dissolved iron concentration during degradation of 0.18 mM of
pollutant, Initial pH 5.7, 30 °C, 75 cm2 of heterogeneous photocatalyst under solar
simulation (a) HQ, PVF-Fe oxide/H2O2(1.6 mM)/light; (b) HQ, PVFf-TiO2-Fe
oxide/H2O2(1.6 mM)/light; (c) NA, PVFf-TiO2-Fe oxide/H2O2(3.2 mM)/light. The traces
represent average dissolved iron over 3 runs.
For HQ degradation by the system PVF-Fe oxide/H2O2/light, (trace a), [Fe]d increased
during the first 120 min of treatment up to 0.6 mg/L and stabilized during the following 120
min. For HQ degradation by the system PVFf-TiO2-Fe oxide/H2O2/light (trace b), [Fe]d
reached a maximum at 120 min with about 0.6 mg/L and decreased to 0.1 mg/L during the
following 120 min. This phenomenon was also observed by other authors with different
107

heterogeneous photocatalysts containing iron (Bozzi, 2002; Feng, 2004). In the case of NA
photocatalytic degradation by the system PVFf-TiO2-Fe oxide/H2O2/light, [Fe]d increased
during the first 120 min of treatment up to 0.3 mg/L (trace c).
When evaluating a catalyst based on iron oxide in presence of H2O2, it is essential to know
the amount of leached soluble iron species into the aqueous solution during photocatalytic
operation and to estimate the relative contribution of homogeneous photo-Fenton reaction
to the overall degradation process.
For this purpose, average dissolved iron concentration ([Fe]dav, Eq. 5.1), TOC removal
(Δ[TOC]t = [TOC]0-[TOC]t), ratio r (Eq. 5.2) and homogeneous percentage ht (Eq. 5.3)
were calculated for different photocatalytic processes and times.
[Fe]dav = 0∫t[Fe]d dt/t (5.1)
r = Δ[TOC]t/[Fe]dav (5.2)
ht = 100*rhomo/rhetero (5.3)
Table 5.1 Homogeneous percentage relative to different processes and times (Values
calculated from Figures 5.1-5.3).
Photo-Fenton processes h60 h120 h240
PVF-Fe oxide HQ 100 100 100
PVFf-TiO2-Fe oxide HQ
PVFf-TiO2-Fe oxide NA
20
5
39
16
53
29
Table 5.1 shows that for the system PVF-Fe-oxide/H2O2/light, h60, h120 and h240 are 100 %.
Thus HQ mineralization by this system seems only due to homogeneous photo-Fenton
oxidation. For HQ mineralization by the system PVFf-TiO2-Fe oxide/H2O2/light, h60, h120
and h240 were about 20, 39, and 53 % respectively whereas for NA, h60, h120 and h240 were
about 8, 16, and 29 % respectively. This result suggests that the homogeneous contribution
is significant particularly for HQ when the whole time is taken into account. However,
108

heterogeneous process is responsible for a major part of the mineralization process at the
beginning of the treatment and for NA.
5.3.3 Initial activation of PVFf-TiO2-Fe oxide photocatalyst
Figure 5.4(i) shows the TOC removal during HQ degradation by the system PVFf-TiO2-Fe
oxide/H2O2/light during the first two catalytic operations. During the first run (trace a), the
TOC increased (until 30 min) due to degradation of the PVF inducing dissolution of
0
0.2
0.4
0.6
0.8
1
0 60 120 180 240
[TO
C] t/
[TO
C] 0
Time (min)
a
b
(i)
0
0.2
0.4
0.6
0.8
0 60 120 180 240
[Fe]
d (m
g/L
)
Time (min)
a
b
(ii)
Figure 5.4 Evolution of (i) normalized TOC concentration and (ii) Dissolved iron
concentration during the two first photocatalytic mineralization of HQ: (a) first; (b) second
run (experimental conditions: 0.18 mM HQ, initial pH 5.7, 30 °C, 1.6 mM H2O2, 75 cm2 of
heterogeneous photocatalyst under solar simulation).
109

organic compounds and finishing polymer surface functionalization. After 240 min of
treatment, the TOC removal reached 85%. In the second run (trace b), the TOC decreased
from the beginning of the treatment reaching a removal of 95% after 240 min.
Figure 5.4(ii) shows the evolution of dissolved iron characteristic for the two first HQ
degradations as a function of time. For the first run, [Fe]d reaches a maximum of 0.6 mg/L
after 120 min of treatment and then stabilizes around 0.5 mg/L whereas for the second run,
[Fe]d reaches a maximum of 0.6 mg/L after 120 min of treatment and then decreases
rapidly until a value of 0.1 mg/L after 240 min. These differences in the extent iron
leaching can be attributed to the washing of loosely bounded iron during the first run.
Additionally the functionalization of polymer surface (oxygen groups formation) leads to
the formation of vacant sites where iron species are likely to form complexes at the end of
the second run. Figure 5.4(ii) (trace b) shows a singular pulse shape illustrating the re-
adsorption of dissolved iron is much faster compare to other heterogeneous catalysts
containing iron species (Bozzi, 2002; Feng, 2004).
5.3.4 Correlations between surface modifications and activation processes
5.3.4.1 X-ray photoelectron spectroscopy (XPS) analysis of PVFf-TiO2-Fe oxide
In all the spectra there was an energy shift to lower binding energies (BE) of about 3 eV,
which occurred due to the low conductivity of the samples. In the present study, the
corrected BEs are given.
Table 5.2 Composition of PVFf-TiO2-Fe oxide surface (atomic percent) as prepared and
after three runs.
Samples C O F Cl Ti Fe Fe/C Fe/Ti Fe/Cl
PVFf-TiO2-Fe oxide 22.7 46.0 2.0 6.4 0 23.8 1.05 - 3.72
PVFf-TiO2-Fe oxide after use 35.1 45.1 1.5 1.7 0.3 16.8 0.47 56 9.88
The differences in the chemical composition of PVFf-TiO2-Fe oxide surface before and
after three photocatalytic runs were investigated by XPS. Fe (2p) photoelectron spectrum
110

was not significantly changed due to use (results not shown). Table 5.2 shows the variation
of surface atomic composition induced by PVFf-TiO2-Fe oxide utilization. Before use, a
relatively high amount of iron (23.8%) was found. The presence of important surface
atomic concentration of chloride (6.4 %) suggests that the nature of oxide was probably
akaganeite (β-FeOOH.Cln). XPS results shows as well that oxygen, fluorine, chlorine and
iron relative surface concentrations decrease after the degradation runs but the
concentration of carbon increases. The drastic Fe/C ratio fall from 1.05 to 0.47 on PVFf-
TiO2-Fe oxide composite after utilization can be allocated to erosion of the surface induced
by the washing or photo-leaching of iron species and to physical or chemical adsorption of
organic compounds. The depletion of fluorine concentration can be explained by the
degradation of the polymer surface during irradiation whereas the depletion of chlorine
concentration can be allocated to anion exchange properties of akaganeite. Akaganeite is
tunnel structured containing interstitial Cl- that can be substituted by other small anions like
F-, OH- (Cai, 2001).
9101112131415
682685688691
CPS
(/10
4 )
Binding energy (eV)
b
a
Figure 5.5 F(1s) photoelectron spectra of (a) PVFf-TiO2-Fe oxide as prepared (b) PVFf-
TiO2-Fe oxide after three runs.
In Figure 5.5, the photoelectron spectrum of F (1s) core level of PVFf-TiO2-Fe oxide is
represented. Before utilization (trace a), the F (1s) peak is triple with two predominant
components at BEs of 684.2 and 686.3 eV, corresponding to fluorine incorporated into iron
oxide (FeOF) due to the anion exchange properties of akaganeite, and to polymeric C-F
bond, respectively. The small third F (1s) peak centered at a BE = 689 eV corresponds to F-
111
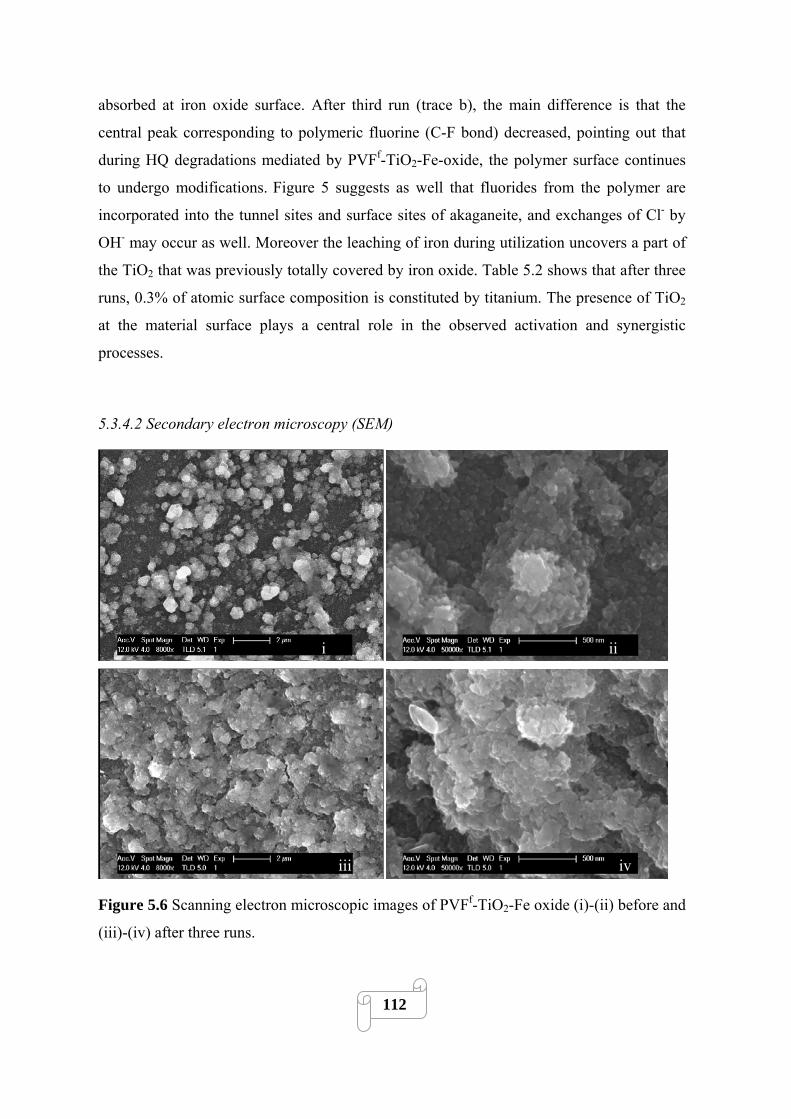
absorbed at iron oxide surface. After third run (trace b), the main difference is that the
central peak corresponding to polymeric fluorine (C-F bond) decreased, pointing out that
during HQ degradations mediated by PVFf-TiO2-Fe-oxide, the polymer surface continues
to undergo modifications. Figure 5 suggests as well that fluorides from the polymer are
incorporated into the tunnel sites and surface sites of akaganeite, and exchanges of Cl- by
OH- may occur as well. Moreover the leaching of iron during utilization uncovers a part of
the TiO2 that was previously totally covered by iron oxide. Table 5.2 shows that after three
runs, 0.3% of atomic surface composition is constituted by titanium. The presence of TiO2
at the material surface plays a central role in the observed activation and synergistic
processes.
5.3.4.2 Secondary electron microscopy (SEM)
i ii
i
iii iv
Figure 5.6 Scanning electron microscopic images of PVFf-TiO2-Fe oxide (i)-(ii) before and
(iii)-(iv) after three runs.
112
Figure 5.6 shows the catalyst surface morphology before and after utilization. In Figure
5.6(i) the PVFf-TiO2-Fe oxide surface with iron oxide aggregates of about 1 μm are shown.
These aggregates are composed of nanoparticles of approximately 50 nm, which seem to
cover the polymer surface (Figure 5.6(ii)). After the third run (Figure 5.6(iii)-(iv)) the
surface seems more layer-structured and contains less relief than the as prepared catalyst
pointing out the erosion of the surface during utilization.
5.3.4.3 Discussion about initial activation of PVFf-TiO2-Fe oxide and increase of
synergistic effects b
The enhancement of PVFf-TiO2-Fe oxide photo-activity after use, presented in Figure 5.4,
can be assigned to different phenomena occurring on material surface: (i) continuation of
the functionalization of the polymer surface and decreasing of Fe/C ratio during first run
may favor substance adsorption, iron re-adsorption and polymer substrate stabilization
which increase the photocatalyst performances; (ii) leaving of chlorine from PVFf-TiO2-Fe-
oxide surface (Table 5.2) cause porous tunnel-like structure into the photocatalytic material
and induce exchange with others anions (like OH-, F-) which might affect positively the
catalyst activity; (iii) TiO2 particles are exposed to the light after the first runs due to
irreversible iron oxide dissolution. Thus TiO2 is likely to contribute to the photocatalytic
degradation processes. Besides photo-Fenton oxidation, radical generation and pollutant
degradation are induced by photocatalysis occurring both at iron oxide and TiO2 surfaces as
well as by synergistic effects of TiO2 and iron oxide. More details about these mechanisms
were discussed in point 4.3.3.
5.3.5 Effect of reaction conditions on photocatalytic activity
5.3.5.1 Effect of pH
Even though the system PVFf-TiO2-Fe oxide/H2O2/light exhibited high photocatalytic
activity for the degradation and mineralization of 0.18 mM HQ at natural initial pH, it is
relevant to explore its activity at other initial pHs. The experiments were performed at
initial pH 7.1, 5.7, 3.4 and they were not controlled during the experiment. The influence of
113
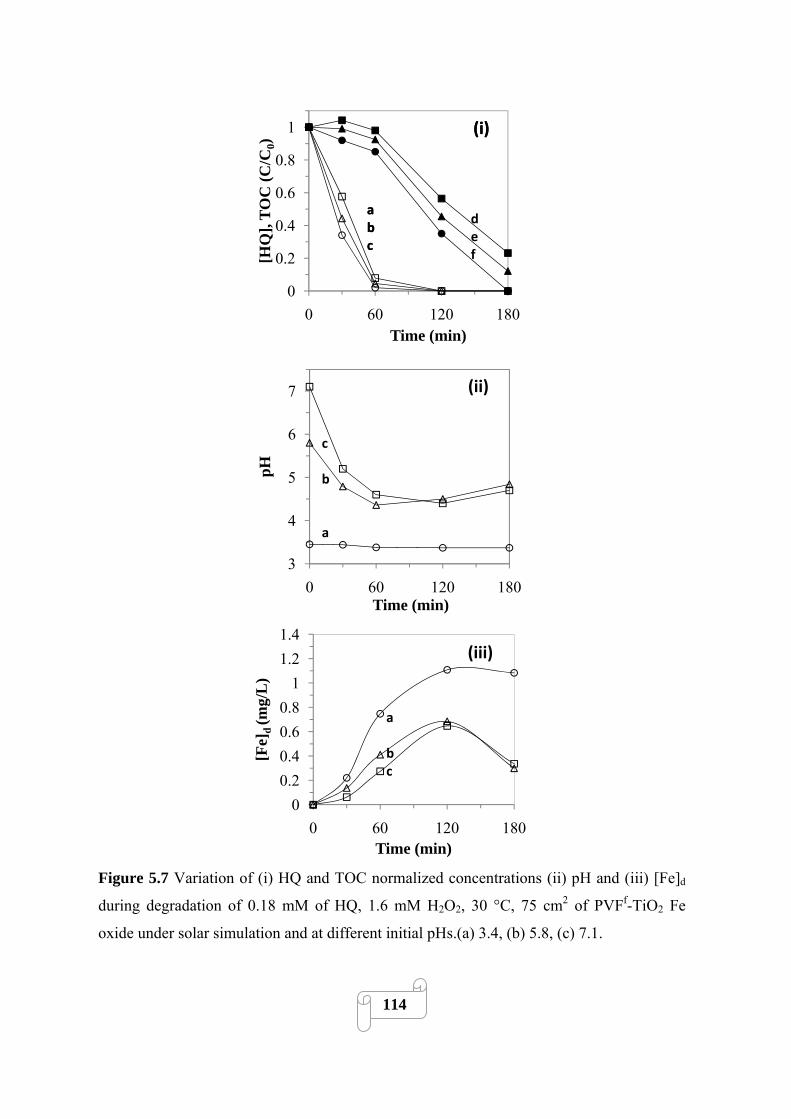
0
0.2
0.4
0.6
0.8
1
0 60 120 180
[HQ
], TO
C (C
/C0)
Time (min)
(i)
abc
(i)
abc
def
3
4
5
6
7
0 60 120 180
pH
Time (min)
c
b
a
(ii)
00.20.40.60.8
11.21.4
0 60 120 180
[Fe]
d (m
g/L
)
Time (min)
a
bc
(iii)
Figure 5.7 Variation of (i) HQ and TOC normalized concentrations (ii) pH and (iii) [Fe]d
during degradation of 0.18 mM of HQ, 1.6 mM H2O2, 30 °C, 75 cm2 of PVFf-TiO2 Fe
oxide under solar simulation and at different initial pHs.(a) 3.4, (b) 5.8, (c) 7.1.
114

initial pH on HQ degradation and mineralization by PVFf-TiO2-Fe-oxide/H2O2/light is
shown in Figure 5.7(i). Total HQ abatement was rapidly observed in the studied initial pH
range (trace a, b, c). Figure 5.7(i) shows that the initial (first 30 min) pH value did not
affect substantially the degradation rates. The initial degradation (30 min) and
mineralization (120 min) rates were increased only 1.5-fold varying initial pH from 7.1 to
3.4.
Figure 5.7(ii) illustrates the pH evolution during the process. While at initial pH of 3.4, this
value remained nearly constant (trace a), for initial pH 5.7 and 7.1, the pH decreased during
the process to reach a minimum value around 4.5 at 120 min (trace b, c). Then after, pH
slightly increased probably due to the mineralization of aliphatic acid intermediates
generated during the first step of HQ photocatalytic degradation.
The [Fe]d measured during the processes (Figure 5.7(iii)) increased as the pH becomes
more acidic. A final [Fe]d of 1.1, 0.3 and 0.3 mg/L for initial pHs of 3.4, 5.8, 7.1
respectively was measured (Figure 8) corresponding to an augmentation of 3.5-fold as the
pH decreases.
The results shown in Figure 5.7 (traces c) suggest that it may exist a pH interval where iron
dissolution is minimal and photo-activity is high since 40% of HQ was degraded at pH
between 5 and 7 with less than 0.1 mg/L of dissolved iron. Further experiments using pH
regulation are required in order to confirm this hypothesis.
The relative independence of degradation rates from the initial pH can be assigned to
several phenomena: (i) for PVFf-TiO2-Fe oxide/H2O2/light system, semiconductor
photocatalysis and synergistic action of TiO2 and iron oxide participate in observed HQ
abatement; (ii) the reaction pH decreased to a value beside 5 after 30 min.
5.3.5.2 Effect of temperature
The results obtained for HQ degradation by the system PVFf-TiO2-Fe oxide/H2O2/light at
three different temperatures (30, 40, 55 °C) are presented in Figure 5.8(i). The reaction
rates increase when temperature increases due to the exponential dependency of the kinetic
constant with the reaction temperature (Arrhenius). The activation energy was calculated
using pseudo first order rates (k1) and plotting ln(k1) versus of 1/T. The slope multiplied by
115
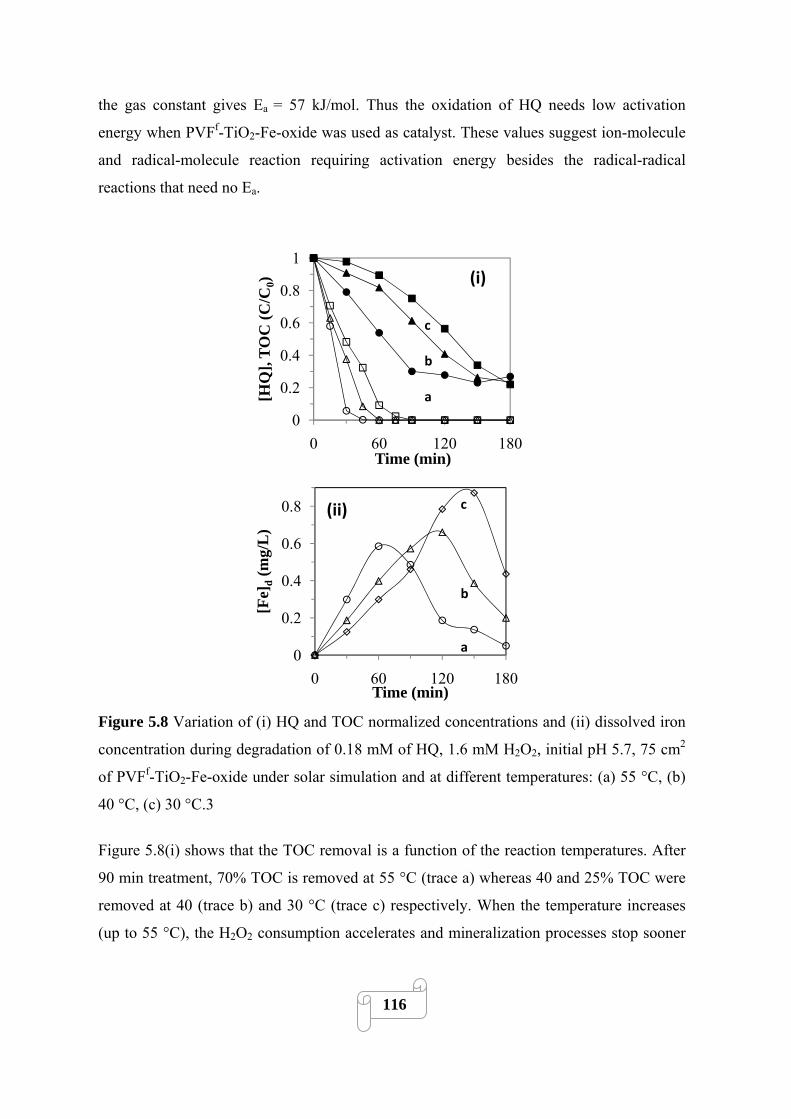
the gas constant gives Ea = 57 kJ/mol. Thus the oxidation of HQ needs low activation
energy when PVFf-TiO2-Fe-oxide was used as catalyst. These values suggest ion-molecule
and radical-molecule reaction requiring activation energy besides the radical-radical
reactions that need no Ea.
0
0.2
0.4
0.6
0.8
1
0 60 120 180
[HQ
], TO
C (C
/C0)
Time (min)
(i)
c
b
a
0
0.2
0.4
0.6
0.8
0 60 120 180
[Fe]
d(m
g/L
)
Time (min)
c
b
a
(ii)
Figure 5.8 Variation of (i) HQ and TOC normalized concentrations and (ii) dissolved iron
concentration during degradation of 0.18 mM of HQ, 1.6 mM H2O2, initial pH 5.7, 75 cm2
of PVFf-TiO2-Fe-oxide under solar simulation and at different temperatures: (a) 55 °C, (b)
40 °C, (c) 30 °C.3
Figure 5.8(i) shows that the TOC removal is a function of the reaction temperatures. After
90 min treatment, 70% TOC is removed at 55 °C (trace a) whereas 40 and 25% TOC were
removed at 40 (trace b) and 30 °C (trace c) respectively. When the temperature increases
(up to 55 °C), the H2O2 consumption accelerates and mineralization processes stop sooner
116

than at a lower temperature. Thus for the trace a in Figure 5.8(i), the TOC abatement is
slowed and stopped by a total H2O2 consumption after 90 min of treatment.
The degradation and initial mineralization (first 60 min in Figure 5.8(i)) rates increased 6
and 5-fold respectively when temperature increased from 30 to 55 °C. This is valuable as
solar light can be used to activate this process since it is usually accompanied by a
significant increase in the temperature of the bulk reactor. Although one could expect that
an increase of temperature might increase extent of leaching, it was not the case with the
PVFf-TiO2-Fe oxide composite as shown in Figure 5.8(ii). Iron leaching initial (first 30
min) rates were accelerated by the temperature of the treatment but the maximal
concentration of dissolved iron was inversely proportional to temperature with a [Fe]d
around 0.6, 0.7 and 0.9 mg/L for 55 (trace a), 40 (trace b) and 30 °C (trace c) respectively.
5.3.6.3 Effect of NaCl.
The effect induced by the addition of NaCl (5 g/L) on NA degradation and mineralization
mediated by the systems PVFf-TiO2-Fe oxide/H2O2/light (i) and Fe2+(2 mg/L)/H2O2/light
(ii) is illustrated in Figure 5.9. The salt adjunction was detrimental for the mineralization
process of both homogeneous and heterogeneous systems. The initial mineralization rate
(first 60 min) was around 2 times lower in presence (trace a) than in absence (trace b) of
salt. For NA degradation in absence of salt, the rate relative to homogeneous system (trace
d Figure 5.9(ii)) was 3 times higher than those of heterogeneous system (trace d Figure
9(i)). However, in presence of salt (traces c), the rates observed were similar for
homogeneous and heterogeneous systems.
This comparison suggests that the heterogeneous system is advantageous for the treatment
of saline wastewater since the degradation process is slightly faster in presence of salt. It is
known that the inhibitory effect of Cl− on Fenton reaction is due to the scavenging of •OH
by this ion (Pignatello, 2006). Thus for PVFf-TiO2-Fe oxide/H2O2/light system: (i)
mineralization process seems largely controlled by photo-Fenton reaction initially induced
by •OH attacks and then by charge transfers occurring on iron oxide surface or dissolved
complexes with intermediates; (ii) degradation process is heterogeneous and involves
charge transfers from catalyst surface to pollutant rather than the participation of •OH.
117
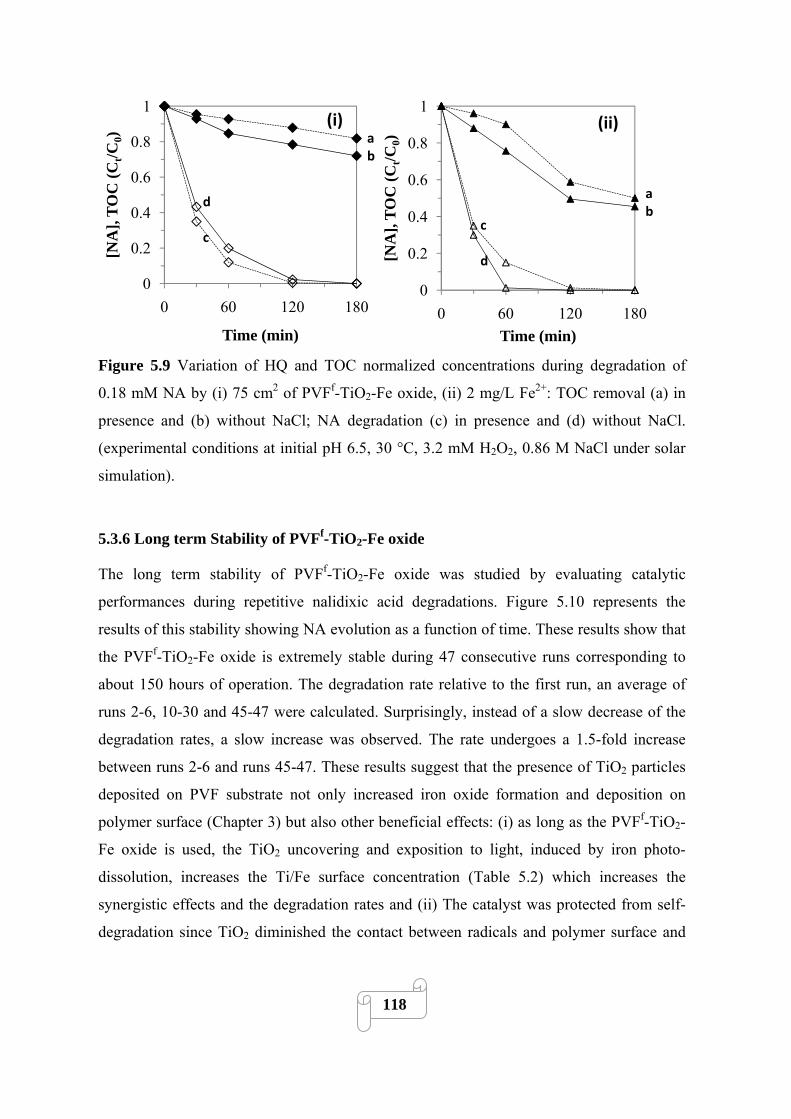
0
0.2
0.4
0.6
0.8
1
0 60 120 180
[NA
], TO
C (C
t/C0)
Time (min)
ab
d
c
(i)
0
0.2
0.4
0.6
0.8
1
0 60 120 180
[NA
], TO
C (C
t/C0)
Time (min)
ab
c
d
(ii)
Figure 5.9 Variation of HQ and TOC normalized concentrations during degradation of
0.18 mM NA by (i) 75 cm2 of PVFf-TiO2-Fe oxide, (ii) 2 mg/L Fe2+: TOC removal (a) in
presence and (b) without NaCl; NA degradation (c) in presence and (d) without NaCl.
(experimental conditions at initial pH 6.5, 30 °C, 3.2 mM H2O2, 0.86 M NaCl under solar
simulation).
5.3.6 Long term Stability of PVFf-TiO2-Fe oxide
The long term stability of PVFf-TiO2-Fe oxide was studied by evaluating catalytic
performances during repetitive nalidixic acid degradations. Figure 5.10 represents the
results of this stability showing NA evolution as a function of time. These results show that
the PVFf-TiO2-Fe oxide is extremely stable during 47 consecutive runs corresponding to
about 150 hours of operation. The degradation rate relative to the first run, an average of
runs 2-6, 10-30 and 45-47 were calculated. Surprisingly, instead of a slow decrease of the
degradation rates, a slow increase was observed. The rate undergoes a 1.5-fold increase
between runs 2-6 and runs 45-47. These results suggest that the presence of TiO2 particles
deposited on PVF substrate not only increased iron oxide formation and deposition on
polymer surface (Chapter 3) but also other beneficial effects: (i) as long as the PVFf-TiO2-
Fe oxide is used, the TiO2 uncovering and exposition to light, induced by iron photo-
dissolution, increases the Ti/Fe surface concentration (Table 5.2) which increases the
synergistic effects and the degradation rates and (ii) The catalyst was protected from self-
degradation since TiO2 diminished the contact between radicals and polymer surface and
118
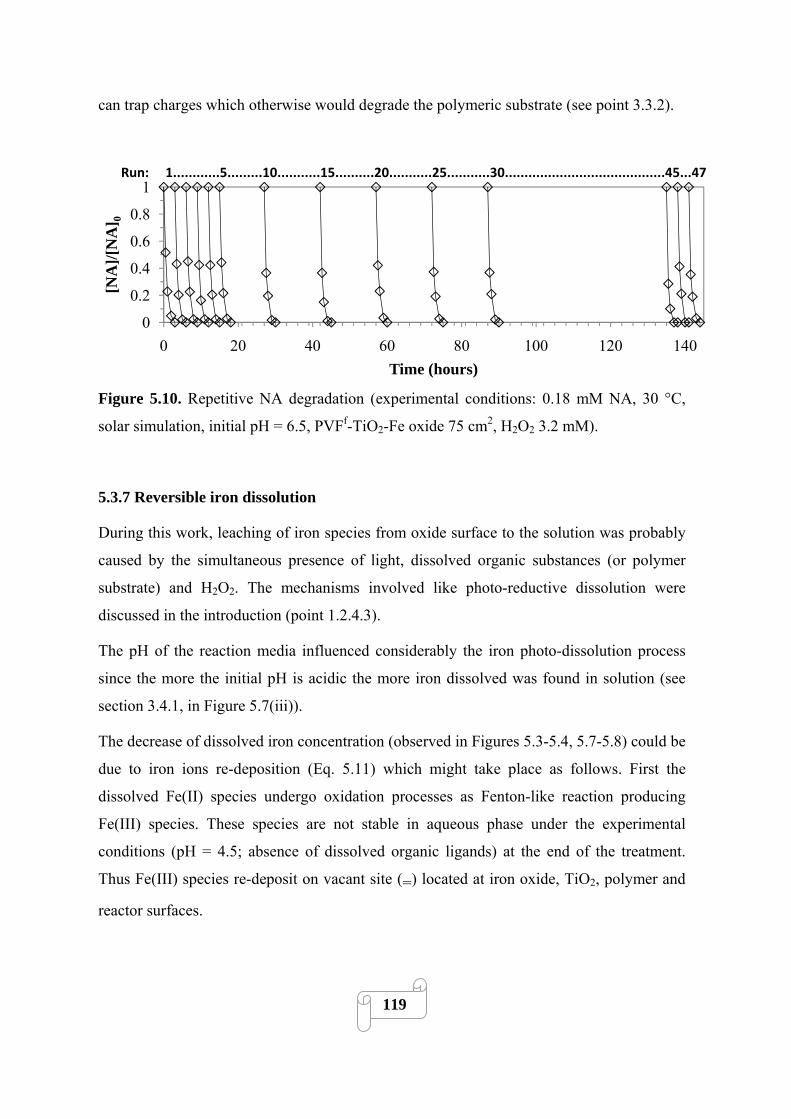
can trap charges which otherwise would degrade the polymeric substrate (see point 3.3.2).
0
0.2
0.4
0.6
0.8
1
0 20 40 60 80 100 120 140
[NA
]/[N
A] 0
Time (hours)
Run: 1............5.........10...........15..........20...........25...........30.........................................45...47
Figure 5.10. Repetitive NA degradation (experimental conditions: 0.18 mM NA, 30 °C,
solar simulation, initial pH = 6.5, PVFf-TiO2-Fe oxide 75 cm2, H2O2 3.2 mM).
5.3.7 Reversible iron dissolution
During this work, leaching of iron species from oxide surface to the solution was probably
caused by the simultaneous presence of light, dissolved organic substances (or polymer
substrate) and H2O2. The mechanisms involved like photo-reductive dissolution were
discussed in the introduction (point 1.2.4.3).
The pH of the reaction media influenced considerably the iron photo-dissolution process
since the more the initial pH is acidic the more iron dissolved was found in solution (see
section 3.4.1, in Figure 5.7(iii)).
The decrease of dissolved iron concentration (observed in Figures 5.3-5.4, 5.7-5.8) could be
due to iron ions re-deposition (Eq. 5.11) which might take place as follows. First the
dissolved Fe(II) species undergo oxidation processes as Fenton-like reaction producing
Fe(III) species. These species are not stable in aqueous phase under the experimental
conditions (pH = 4.5; absence of dissolved organic ligands) at the end of the treatment.
Thus Fe(III) species re-deposit on vacant site (=) located at iron oxide, TiO2, polymer and
reactor surfaces.
119
Fe3+ + = → =Fe(III) (5.11)
The observed phenomena of dissolved iron concentration depletion could have important
theoretical and practical implications and may allow new alternatives for dissolved iron
removal in homogeneous photo-Fenton processes.
5.4 Conclusions
The aimed characteristics for supported TiO2-Fe oxide as heterogeneous photocatalysts
have been reached when using PVFf-TiO2-Fe oxide/H2O2/light system:
•The photo-dissolution of iron ions and their relative homogeneous contribution to HQ and
NA initial mineralization was low. Besides, the re-deposition of dissolved species on the
photocatalyst was observed.
•HQ and NA photo-assisted degradation rates were high and mostly independent of initial
pH and NaCl presence but increased with temperature.
•The film substrate was resistant to self-degradation by generated radicals.
•The photocatalytic activity was highly stable toward repetitive pollutant degradation and it
was even slightly increasing after 150 hours operation.
•The preparation method proposed is sustainable as it used solar light, water as solvent and
low temperatures.
The presence of TiO2 particles on photocatalyst surface was found to engender three
principal beneficial effects: (1) the iron oxide deposition was higher on TiO2 coated PVF
surfaces than in commercial PVF; (2) the initial and long term activations were assigned to
the uncovering of TiO2 due to irreversible iron dissolution which increased its exposition to
light and consequently its synergistic contribution to the overall photocatalytic degradation
process; (3) the resistance to self-degradation was assigned to TiO2 which may acts as a
charge trap and diminish the contact between active iron species and polymer surface.
120

5.6 References
Akhavan O., Azimirad R. (2009) Photocatalytic property of Fe2O3 nanograin chains coated by TiO2 nanolayer in visible light irradiation. Applied Catalysis A: General 369:77-82.
Bandara J., Klehm U., Kiwi J. (2007) Raschig rings-Fe2O3 composite photocatalyst activate in the degradation of 4-chlorophenol and Orange II under daylight irradiation. Applied Catalysis B: Environmental 76: 73-81.
Bozzi A., Yuranova T., Mielczarski J., Lopez A., Kiwi J. (2002) Abatement of oxalates catalyzed by Fe-silica structured surfaces via cyclic carboxylate intermediates in photo-Fenton reactions. Chemical Communications 19: 2202-2203.
Cai J., Liu J., Gao Z., Navrotsky A., Suib S.L. (2001) Synthesis and anion exchange of tunnel structure akaganeite. Chemistry of Materials 13: 4595-4602.
Feng J., Hu X., Po L.Y. (2004) Discoloration and mineralization of Orange II using different heterogeneous catalysts containing Fe: A comparative study. Environmental Science and Technology 38: 5773-5778.
Gumy D., Fernández-Ibáñez P., Malato S., Pulgarin C., Enea O., Kiwi J. (2005) Supported Fe/C and Fe/Nafion/C catalysts for the photo-Fenton degradation of Orange II under solar irradiation. Catalysis Today 101: 375-382.
Moncayo-Lasso A., Torres-Palma R.A., Kiwi J., Benítez N., Pulgarin C. (2008) Bacterial inactivation and organic oxidation via immobilized photo-Fenton reagent on structured silica surfaces. Applied Catalysis B: Environmental 84: 577-583.
Pignatello J.J., Oliveros E., MacKay A.(2006) Advanced oxidation processes for organic contaminant destruction based on the fenton reaction and related chemistry. Critical Reviews in Environmental Science and Technology 36:1-84.
Ramirez J.H., Costa C.A., Madeira L.M., Mata G., Vicente M.A., Rojas-Cervantes M.L., López-Peinado A.J., Martín-Aranda R.M. (2007) Fenton-like oxidation of Orange II solutions using heterogeneous catalysts based on saponite clay. Applied Catalysis B: Environmental 71: 44-56.
Song W., Cheng M., Ma J., Ma W., Chen C., Zhao J. (2006) Decomposition of hydrogen peroxide driven by photochemical cycling of iron species in clay Environmental Science and Technology 40: 4782-4787.
Sulzberger B., Laubscher H. (1995) Photoredox reactions at the surface of iron(III)(hydr-) oxides. Marine chemistry 50: 103-115.
Voelker B.M., Morel F.M.M., Sulzberger B. (1997) Iron redox cycling in surface waters: Effects of humic substances and light. Environmental Science and Technology 31: 1004-1011.
Yuranova T., Enea O., Mielczarski E., Mielczarski J., Albers P., Kiwi J. (2004) Fenton immobilized photo-assisted catalysis through a Fe/C structured fabric. Applied Catalysis B: Environmental 49: 39-50.
Zhang X., Lei L., (2008) Preparation of photocatalytic Fe2O3-TiO2 coatings in one step by metal organic chemical vapor deposition. Applied Surface Science 254: 2406-2412.
121

122
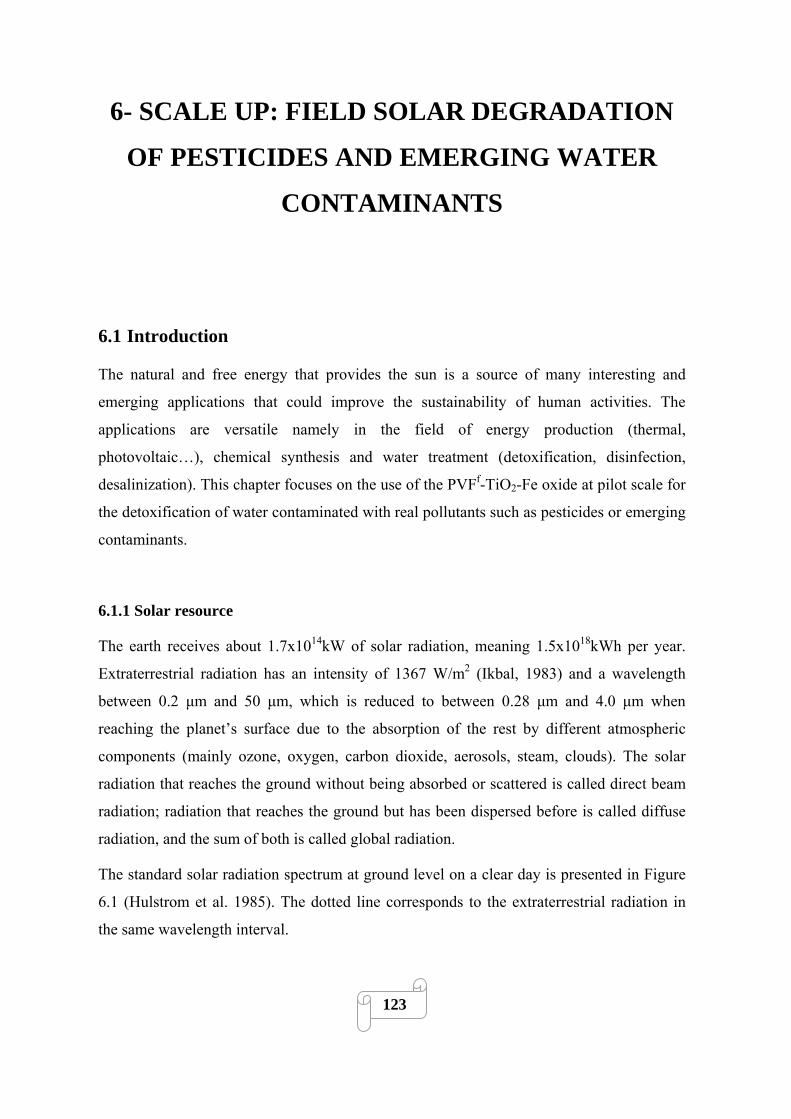
6- SCALE UP: FIELD SOLAR DEGRADATION
OF PESTICIDES AND EMERGING WATER
CONTAMINANTS
6.1 Introduction
The natural and free energy that provides the sun is a source of many interesting and
emerging applications that could improve the sustainability of human activities. The
applications are versatile namely in the field of energy production (thermal,
photovoltaic…), chemical synthesis and water treatment (detoxification, disinfection,
desalinization). This chapter focuses on the use of the PVFf-TiO2-Fe oxide at pilot scale for
the detoxification of water contaminated with real pollutants such as pesticides or emerging
contaminants.
6.1.1 Solar resource
The earth receives about 1.7x10¹⁴kW of solar radiation, meaning 1.5x10¹⁸kWh per year.
Extraterrestrial radiation has an intensity of 1367 W/m2 (Ikbal, 1983) and a wavelength
between 0.2 μm and 50 μm, which is reduced to between 0.28 μm and 4.0 μm when
reaching the planet’s surface due to the absorption of the rest by different atmospheric
components (mainly ozone, oxygen, carbon dioxide, aerosols, steam, clouds). The solar
radiation that reaches the ground without being absorbed or scattered is called direct beam
radiation; radiation that reaches the ground but has been dispersed before is called diffuse
radiation, and the sum of both is called global radiation.
The standard solar radiation spectrum at ground level on a clear day is presented in Figure
6.1 (Hulstrom et al. 1985). The dotted line corresponds to the extraterrestrial radiation in
the same wavelength interval.
123
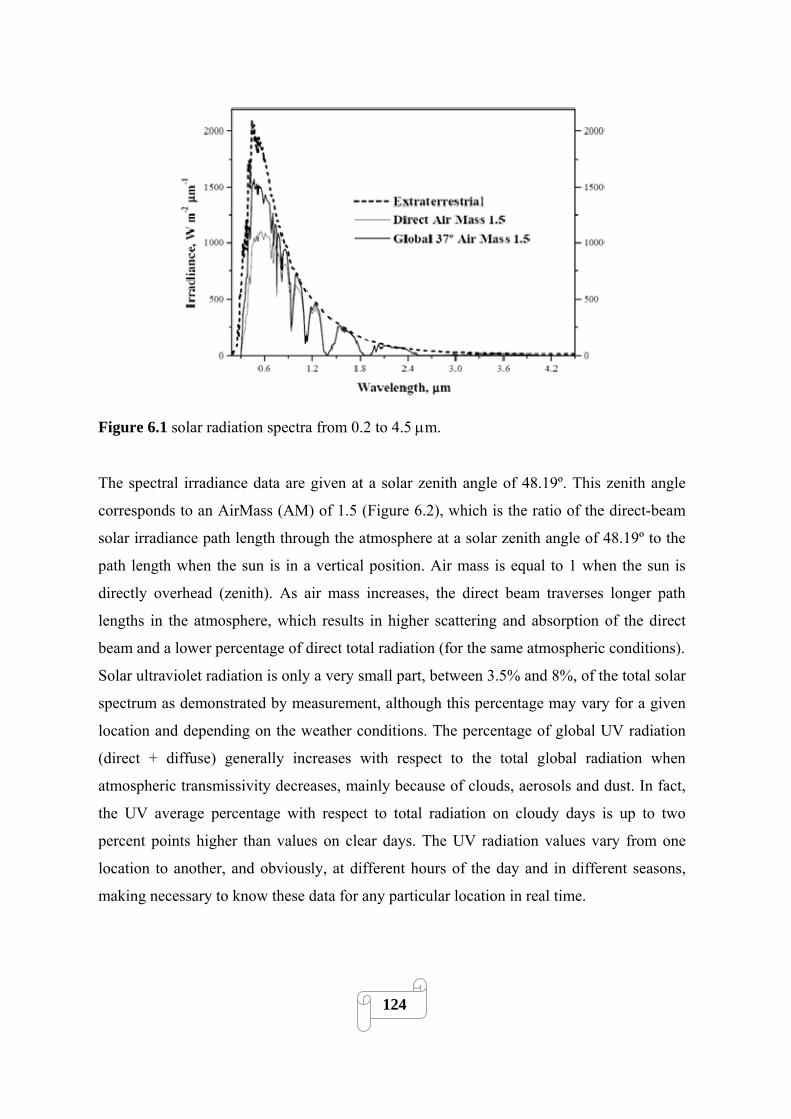
Figure 6.1 solar radiation spectra from 0.2 to 4.5 μm.
The spectral irradiance data are given at a solar zenith angle of 48.19º. This zenith angle
corresponds to an AirMass (AM) of 1.5 (Figure 6.2), which is the ratio of the direct-beam
solar irradiance path length through the atmosphere at a solar zenith angle of 48.19º to the
path length when the sun is in a vertical position. Air mass is equal to 1 when the sun is
directly overhead (zenith). As air mass increases, the direct beam traverses longer path
lengths in the atmosphere, which results in higher scattering and absorption of the direct
beam and a lower percentage of direct total radiation (for the same atmospheric conditions).
Solar ultraviolet radiation is only a very small part, between 3.5% and 8%, of the total solar
spectrum as demonstrated by measurement, although this percentage may vary for a given
location and depending on the weather conditions. The percentage of global UV radiation
(direct + diffuse) generally increases with respect to the total global radiation when
atmospheric transmissivity decreases, mainly because of clouds, aerosols and dust. In fact,
the UV average percentage with respect to total radiation on cloudy days is up to two
percent points higher than values on clear days. The UV radiation values vary from one
location to another, and obviously, at different hours of the day and in different seasons,
making necessary to know these data for any particular location in real time.
124
Figure 6.2 Air mass and solar components.
6.1.2 Solar collector technology
6.1.2.1 Concentrating collectors
The first solar photo-reactor designed for photochemical applications were based on line
focus parabolic-trough concentrators (PTC). In this type of concentrators an absorber tube
is placed in the focus of a parabolic reflector. The reflector redirects radiation parallel to the
axis of the parable towards the absorber tube in the focus. Consequently, this type of
concentrator has to track the sun and can use only parallel direct beam radiation. One-axis
and two-axis tracking systems can be used for this purpose. Advantages of concentrating
solar collectors:
- They can be easily set-up and scaled-up due to the simple engineering concepts
involved (tubular plug-flow photo-reactor with turbulent flow conditions).
- Turbulent flow ensures good mass-transfer and maintains TiO2 particles in
suspension in case of TiO2 slurry photocatalysis.
- The photo-reactors are closed systems. Therefore, no vaporization of volatile
compounds takes place.
125
Disadvantages of concentrating solar collectors:
- Due to their geometry they can use only direct beam radiation, which makes them
practically useless, when the sky is clouded.
- They also are rather expensive systems due to the necessary sun tracking system
(investment and maintenance costs because of moving parts).
6.1.2.2 Non concentrating collectors
The elevated prices of PTCs have encouraged the search for cheaper reactor concepts with
non-concentrating geometry. Different types of non-concentrating solar reactors such as
Free-falling film, (Wyness, 1994) or Pressurized flat plate (Well, 1997) were proposed.
A major advantage is that they do not only harvest direct beam but also diffuse radiation.
Consequently, they can as well be operated under cloudy sky conditions. One problem
common to non-concentrating collectors is mass transfer problems caused by laminar flow
in non-concentrating systems. So, although non-concentrating collectors potentially present
several important advantages, their scale-up can be difficult due to reasons such as high
pressure drop, inhomogeneous flow conditions etc.
6.1.2.3 Compound parabolic collectors (CPC)
CPC are an interesting cross between PTCs and non-concentrating collectors without their
respective disadvantages. CPC are static collectors with a reflective surface formed by two
connected parabolic mirrors with an absorber tube in the focus and have been found to
provide the most efficient light-harvesting optics for low concentrating systems
(Muschaweck, 2000). They have no tracking system and the design permits the solar rays
to be reflected onto the absorber tube attaining a low concentration factor.
The concentration factor is defined as the ratio of the collector aperture to the absorber tube
perimeter and is usually between 1 and 1.5 depending on the type of application. Thanks to
the reflector design, almost all the radiation (not only direct, but also diffuse) incident at the
CPC aperture area can be collected and is available for the process in the reactor. The light
126

reflected by the CPC is distributed around the back of the tubular photo-reactor (see Figure
6.3).
Figure 6.3. CPC: Collector design and radiation geometry profiles.
Advantages of CPC:
- Wastewater can be circulated under turbulent flow conditions. They can be easily
up scaled due to the simple engineering concepts involved.
- Excellent performance of CPC collectors in solar photochemical and photocatalytic
applications.
The photochemical reactor must contain the working fluid, including the catalyst or the
sensitizer, and must transmit solar UV-light efficiently with minimal pressure drop across
the system. It must also provide a good mass transfer from the fluid stream to an
illuminated photocatalyst. Adequate flow distribution inside the reactor must be ensured.
Reactor material must be inert to chemicals and resistant to high or low pH. The choice of
materials that are both transparent to UV light and resistant to its destructive effects is
limited to quartz glass, fluoropolymers and borosilicate glass. Low-iron-content
borosilicate glass has good transmissive properties in the solar range to about 285 nm, is
cheaper than the others and therefore, seems to be the most adequate (Ajona, 2000). The
ideal reflective surface for solar photochemical applications must be highly UV-reflective,
weather-resistant to guarantee long lifetime and reasonably priced. The currently available
materials that best fit these requirements are electropolished anodised aluminium and
organic plastic films with an aluminium coating (Ajona, 2000).
127

In this chapter, the photocatalytic performances of PVFf-TiO2-Fe oxide are evaluated at
pilot-scale in CPC reactors, for different wastewaters. The photocatalytic degradation of
phenol, nalidixic acid, a mixture of pesticide another of emerging contaminants were
mediated by PVFf-TiO2-Fe oxide in water allowing the assessment of the new photocatalyst
efficiency for real pollutants, under more realistic conditions.
6.2. Experimental
6.2.1 Chemicals
P.A. reagent phenol (C0 = 0.7 mM) and nalidixic acid (C0 = 0.13 mM) were supplied by
Panreac and Fluka, respectively. Pesticide mixtures were prepared from commercial
formulations of Vydate (10%, w/v oxamyl), Metomur, (20%, w/v methomyl), Couraze
(20%, w/v imidacloprid), Ditimur-40 (40%, w/v dimethoate) and Scala (40%, w/v
pyrimethanil). The mixture contained 20% of each commercial formulation and had an
original TOC of 50 mg L-1. The amounts of active ingredients in the mixture were
21 mg L-1 of oxamyl, 5.1 mg L-1 of methomyl, 5 mg L-1 of imidacloprid, 8 mg L-1 of
dimethoate, and 13.5 mg L-1 of pyrimethanil. Analytical standards (>98%) for
chromatographic analysis were purchased from Sigma-Aldrich. The emerging contaminants
were atenolol, metroprolol, sulfamethoxazole, flumequine, ketorolac and diclofenac,
acetaminophen and progesterone p.a. reagents from Sigma-Aldrich. Antipyrine, caffeine,
hydroxybiphenyl and triclosan were Fluka p.a. reagents; atrazine and isoproturon were p.a.
reagents from Riedel-De-Haën. The mixture contained a 100 μg L-1 concentration of each
emerging contaminants. The structures of all the organic compounds used were shown in
Figure 1.7-1.9 NaOH, HNO3, FeCl3.6H2O were Fluka p.a. reagents (Buchs, Switzerland)
and used as received. TiO2 P25 (anastase to rutile ratio between 70:30 and 80:20) was
supplied by Degussa. The polyvinyl fluoride (PVF) films were 72μm thick and were
supplied by Goodfellow (Cambridge Ltd. United Kingdom). Distilled water used in the
pilot plant was supplied by the plataforma solar de Almería (PSA) distillation plant
(conductivity<10 microScm-1, Cl- = 0.2-0.3 mg/L, NO3-<0.2 mg/L, organic carbon
<0.5 mg/L). The experiments were performed using reagent-grade hydrogen peroxide (30%
w/v).
128
6.2.2 Photocatalyst preparation
The detailed preparation procedure has been described in chapter 4. In this study, optimized
material was prepared: a 3-hour TiO2 PSFD treatment was applied to PVF film using
aqueous TiO2 P25 suspensions (1 g/L) at natural pH (≈ 5) and under simulated sunlight
irradiation. For the deposition of an iron oxide coat, PVFf-TiO2 was immersed in an
aqueous solution of FeCl3 (5 g/L) and heated at 80°C while stirring for one hour. The
resulting materials were dried in an oven at 120 °C for one hour.
6.2.3 Photo-reactor and irradiation procedure
The solar degradation experiments were performed under natural sunlight in a pilot plant
installed at the Plataforma Solar de Almeria in Spain, consisting of compound parabolic
collectors (CPC), a reservoir tank, a recirculation pump and connecting tubing. The
configuration of this pilot plant was adapted for these experiments to insert the PVFf-TiO2-
Fe oxide photocatalyst in the CPC glass tubes. Solar ultraviolet radiation (UV) was
measured by a global UV radiometer (KIPP&ZONEN, model CUV 3) mounted on a
platform 37°-tilted (the same as the CPC). With Eq. (6.1), combination of the data from
several days’ experiments and their comparison with other photocatalytic experiments is
possible (Malato, 2003).
11,30,30 ;30 −− −=ΔΔ+= nnn
T
innwnw ttt
VVUVttt
(6.1)
where tn is the experimental time for each sample, UV is the average solar ultraviolet
radiation measured during Δtn, and t30W is a “normalized illumination time”. In this case,
time refers to a constant solar UV power of 30 W m-2 (typical solar UV power on a
perfectly sunny day around noon). VT is the total volume of the water loaded in the pilot
plant (8.5 L), Vi is the total irradiated volume (1.8 L). The flow rate was 4.5 L/min. The
operation temperature of the pilot plant was around 35 (+/- 5) ºC.
Several PVFf-TiO2-Fe oxide films (26 x 12 cm) were inserted concentrically inside two
CPC tubes (1.8 L) in the pilot plant and were used for all the following experiments (Figure
6.4). Before experiments started, the CPC reactor was covered to prevent any
129
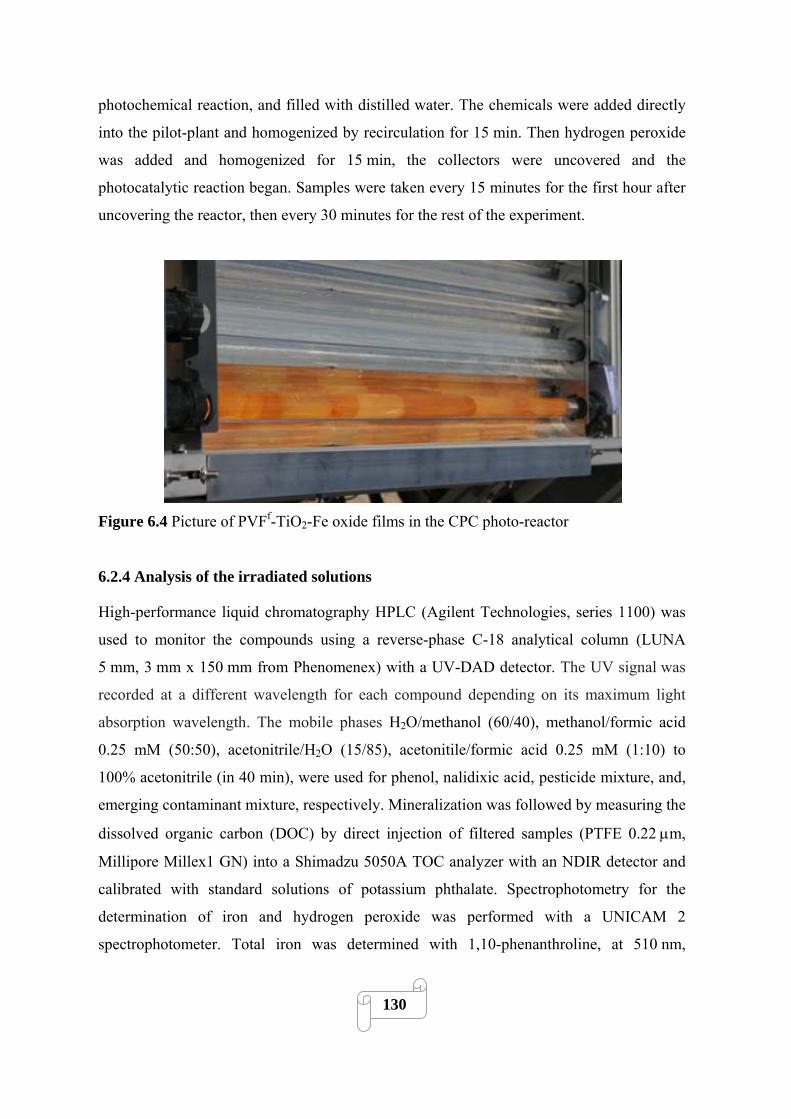
photochemical reaction, and filled with distilled water. The chemicals were added directly
into the pilot-plant and homogenized by recirculation for 15 min. Then hydrogen peroxide
was added and homogenized for 15 min, the collectors were uncovered and the
photocatalytic reaction began. Samples were taken every 15 minutes for the first hour after
uncovering the reactor, then every 30 minutes for the rest of the experiment.
Figure 6.4 Picture of PVFf-TiO2-Fe oxide films in the CPC photo-reactor
6.2.4 Analysis of the irradiated solutions
High-performance liquid chromatography HPLC (Agilent Technologies, series 1100) was
used to monitor the compounds using a reverse-phase C-18 analytical column (LUNA
5 mm, 3 mm x 150 mm from Phenomenex) with a UV-DAD detector. The UV signal was
recorded at a different wavelength for each compound depending on its maximum light
absorption wavelength. The mobile phases H2O/methanol (60/40), methanol/formic acid
0.25 mM (50:50), acetonitrile/H2O (15/85), acetonitile/formic acid 0.25 mM (1:10) to
100% acetonitrile (in 40 min), were used for phenol, nalidixic acid, pesticide mixture, and,
emerging contaminant mixture, respectively. Mineralization was followed by measuring the
dissolved organic carbon (DOC) by direct injection of filtered samples (PTFE 0.22 μm,
Millipore Millex1 GN) into a Shimadzu 5050A TOC analyzer with an NDIR detector and
calibrated with standard solutions of potassium phthalate. Spectrophotometry for the
determination of iron and hydrogen peroxide was performed with a UNICAM 2
spectrophotometer. Total iron was determined with 1,10-phenanthroline, at 510 nm,
130
following ISO 6332, hydrogen peroxide was analyzed using ammonium metavanadate, at
450 nm. The peroxide concentrations are calculated from absorption measurements by a
ratio found by Nogueira et al. (Nogueira, 2005).
6.2.5. Photocatalyst characterization
The characteristics of the XPS apparatus are specified in point 4.2.6.
6.3. Results and discussion
Experiments were performed on consecutive days separated by a dark period of 17 hours.
The illumination time (t30W) included in the discussion was calculated by Eq. 6.1, which
takes this into consideration. The same PVFf-TiO2-Fe oxide photocatalyst films were used
for all the consecutive experiments included in this chapter.
6.3.1 Photocatalytic degradation of single compounds
Figure 6.5(i) shows phenol concentration, DOC and pH over t30W [min] during the first
degradation experiments mediated by PVFf-TiO2-Fe oxide/H2O2/light. Only one of two
replications is shown, as there was no significant difference between the two consecutive
runs. Figure 6.5(i) shows that the phenol concentration remained almost constant during the
first 30 min of treatment and then decreased rapidly until the end of the treatment (60 min).
During phenol degradation, pH fell from 6.5-5 from 0 to 25 min to 5-4 after 25 min due to
the formation of carboxylic acids. Iron leaching from the catalyst to the solution took place
likely by iron oxide photo-reductive dissolution (Borer, 2009). Dissolved iron
concentration was always below 0.2 mg/L, suggesting that phenol degradation is mainly
induced by a heterogeneous reaction at the catalyst surface although a significant
participation of dissolved iron ions in a homogeneous photo-Fenton reaction cannot be
totally excluded (dissolved iron concentration is not reported in any of the following
experiments, because the quantities of iron ions detected were always below the method
detection limit (< 0.2 mg/L)).
131
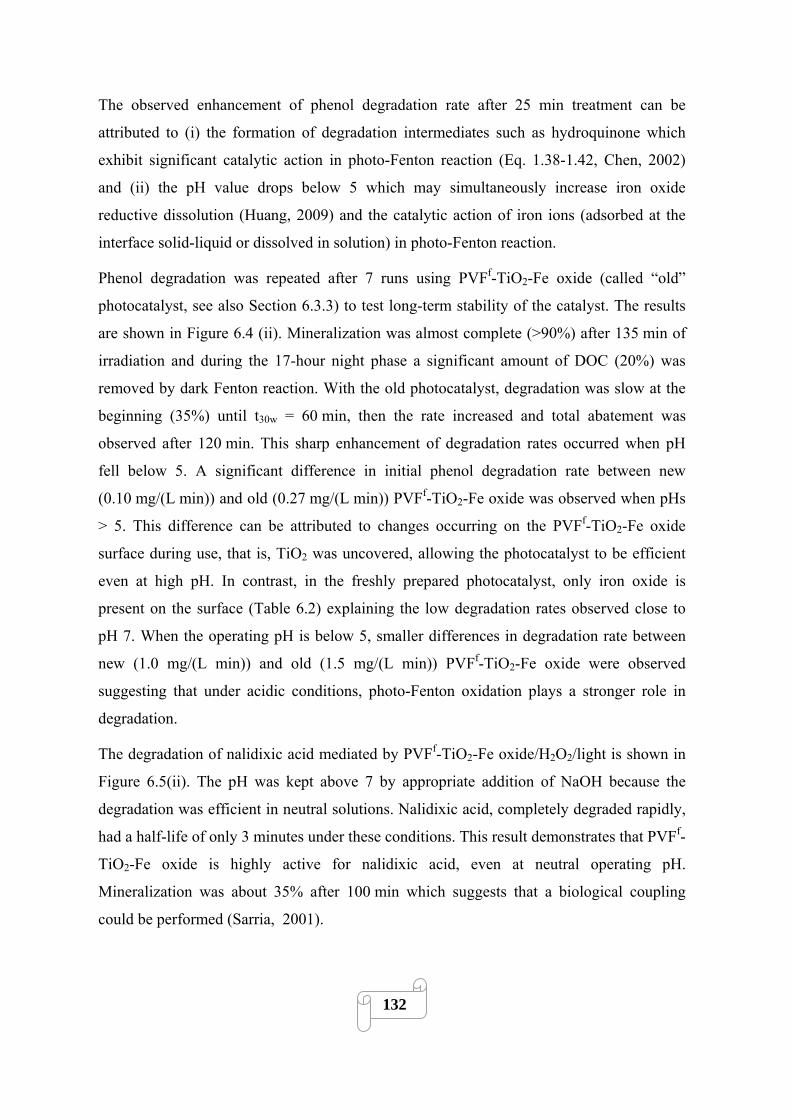
The observed enhancement of phenol degradation rate after 25 min treatment can be
attributed to (i) the formation of degradation intermediates such as hydroquinone which
exhibit significant catalytic action in photo-Fenton reaction (Eq. 1.38-1.42, Chen, 2002)
and (ii) the pH value drops below 5 which may simultaneously increase iron oxide
reductive dissolution (Huang, 2009) and the catalytic action of iron ions (adsorbed at the
interface solid-liquid or dissolved in solution) in photo-Fenton reaction.
Phenol degradation was repeated after 7 runs using PVFf-TiO2-Fe oxide (called “old”
photocatalyst, see also Section 6.3.3) to test long-term stability of the catalyst. The results
are shown in Figure 6.4 (ii). Mineralization was almost complete (>90%) after 135 min of
irradiation and during the 17-hour night phase a significant amount of DOC (20%) was
removed by dark Fenton reaction. With the old photocatalyst, degradation was slow at the
beginning (35%) until t30w = 60 min, then the rate increased and total abatement was
observed after 120 min. This sharp enhancement of degradation rates occurred when pH
fell below 5. A significant difference in initial phenol degradation rate between new
(0.10 mg/(L min)) and old (0.27 mg/(L min)) PVFf-TiO2-Fe oxide was observed when pHs
> 5. This difference can be attributed to changes occurring on the PVFf-TiO2-Fe oxide
surface during use, that is, TiO2 was uncovered, allowing the photocatalyst to be efficient
even at high pH. In contrast, in the freshly prepared photocatalyst, only iron oxide is
present on the surface (Table 6.2) explaining the low degradation rates observed close to
pH 7. When the operating pH is below 5, smaller differences in degradation rate between
new (1.0 mg/(L min)) and old (1.5 mg/(L min)) PVFf-TiO2-Fe oxide were observed
suggesting that under acidic conditions, photo-Fenton oxidation plays a stronger role in
degradation.
The degradation of nalidixic acid mediated by PVFf-TiO2-Fe oxide/H2O2/light is shown in
Figure 6.5(ii). The pH was kept above 7 by appropriate addition of NaOH because the
degradation was efficient in neutral solutions. Nalidixic acid, completely degraded rapidly,
had a half-life of only 3 minutes under these conditions. This result demonstrates that PVFf-
TiO2-Fe oxide is highly active for nalidixic acid, even at neutral operating pH.
Mineralization was about 35% after 100 min which suggests that a biological coupling
could be performed (Sarria, 2001).
132
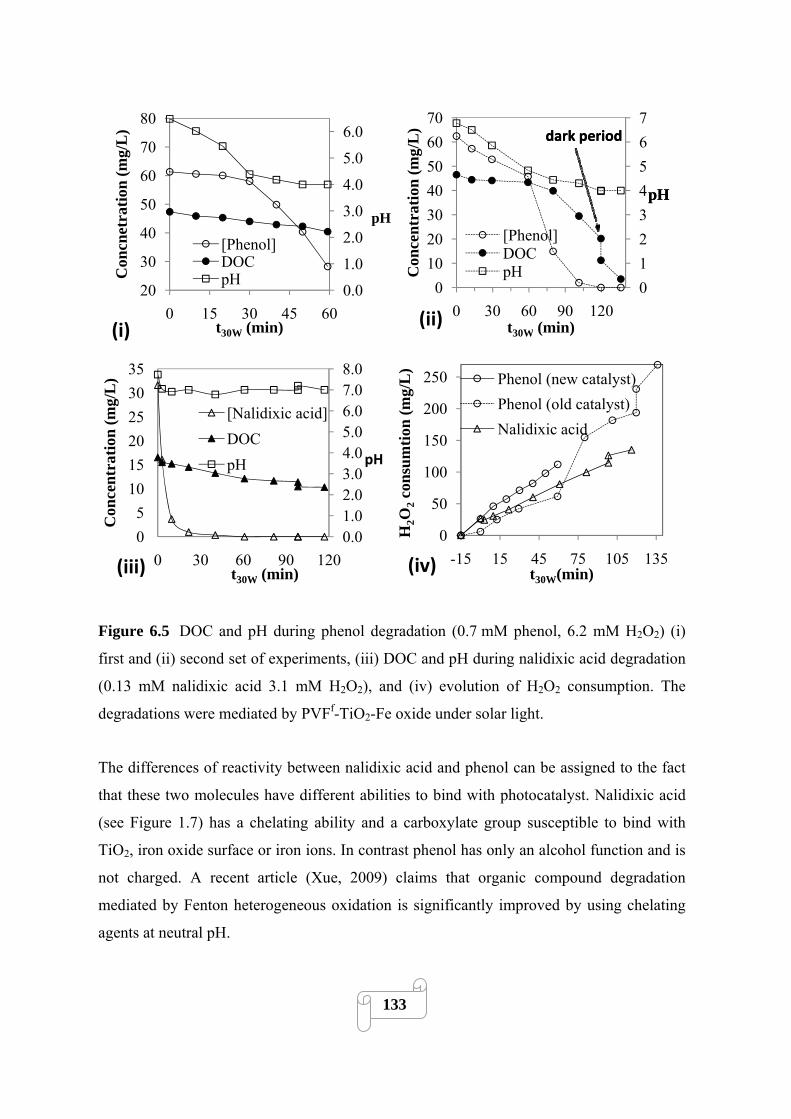
0.0
1.0
2.0
3.0
4.0
5.0
6.0
20
30
40
50
60
70
80
0 15 30 45 60
Con
cnet
ratio
n (m
g/L
)
t30W (min)
[Phenol]DOCpH
pH
(i)
01234567
010203040506070
0 30 60 90 120
Con
cent
ratio
n (m
g/L
)
t30W (min)
[Phenol]DOCpH
pH
dark period
pH
dark period
(ii)
0.01.02.03.04.05.06.07.08.0
05
101520253035
0 30 60 90 120
Con
cent
ratio
n (m
g/L
)
t30W (min)
[Nalidixic acid]DOCpH pH
(iii)
0
50
100
150
200
250
-15 15 45 75 105 135
H2O
2co
nsum
tion
(mg/
L)
t30W(min)
Phenol (new catalyst)Phenol (old catalyst)Nalidixic acid
(iv)
Figure 6.5 DOC and pH during phenol degradation (0.7 mM phenol, 6.2 mM H2O2) (i)
first and (ii) second set of experiments, (iii) DOC and pH during nalidixic acid degradation
(0.13 mM nalidixic acid 3.1 mM H2O2), and (iv) evolution of H2O2 consumption. The
degradations were mediated by PVFf-TiO2-Fe oxide under solar light.
The differences of reactivity between nalidixic acid and phenol can be assigned to the fact
that these two molecules have different abilities to bind with photocatalyst. Nalidixic acid
(see Figure 1.7) has a chelating ability and a carboxylate group susceptible to bind with
TiO2, iron oxide surface or iron ions. In contrast phenol has only an alcohol function and is
not charged. A recent article (Xue, 2009) claims that organic compound degradation
mediated by Fenton heterogeneous oxidation is significantly improved by using chelating
agents at neutral pH.
133
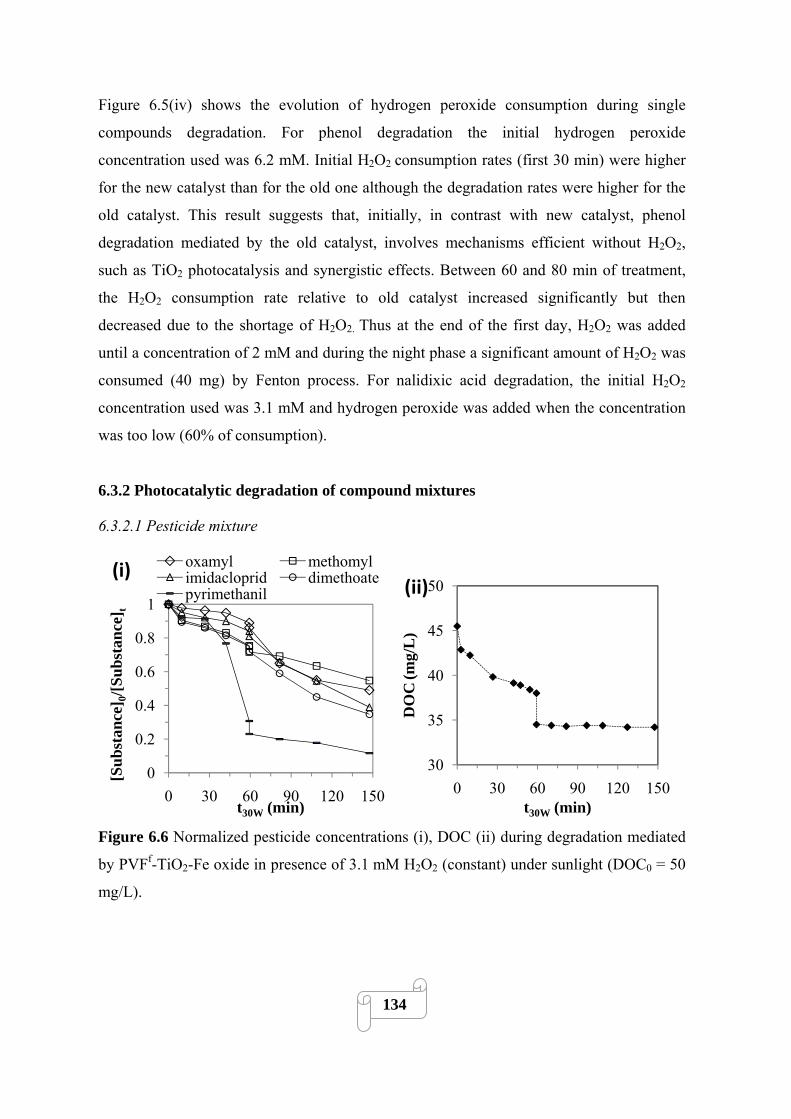
Figure 6.5(iv) shows the evolution of hydrogen peroxide consumption during single
compounds degradation. For phenol degradation the initial hydrogen peroxide
concentration used was 6.2 mM. Initial H2O2 consumption rates (first 30 min) were higher
for the new catalyst than for the old one although the degradation rates were higher for the
old catalyst. This result suggests that, initially, in contrast with new catalyst, phenol
degradation mediated by the old catalyst, involves mechanisms efficient without H2O2,
such as TiO2 photocatalysis and synergistic effects. Between 60 and 80 min of treatment,
the H2O2 consumption rate relative to old catalyst increased significantly but then
decreased due to the shortage of H2O2. Thus at the end of the first day, H2O2 was added
until a concentration of 2 mM and during the night phase a significant amount of H2O2 was
consumed (40 mg) by Fenton process. For nalidixic acid degradation, the initial H2O2
concentration used was 3.1 mM and hydrogen peroxide was added when the concentration
was too low (60% of consumption).
6.3.2 Photocatalytic degradation of compound mixtures
6.3.2.1 Pesticide mixture
0
0.2
0.4
0.6
0.8
1
0 30 60 90 120 150
[Sub
stan
ce] 0
/[Sub
stan
ce] t
t30W (min)
oxamyl methomylimidacloprid dimethoatepyrimethanil
(i)
30
35
40
45
50
0 30 60 90 120 150
DO
C(m
g/L
)
t30W (min)
(ii)
Figure 6.6 Normalized pesticide concentrations (i), DOC (ii) during degradation mediated
by PVFf-TiO2-Fe oxide in presence of 3.1 mM H2O2 (constant) under sunlight (DOC0 = 50
mg/L).
134
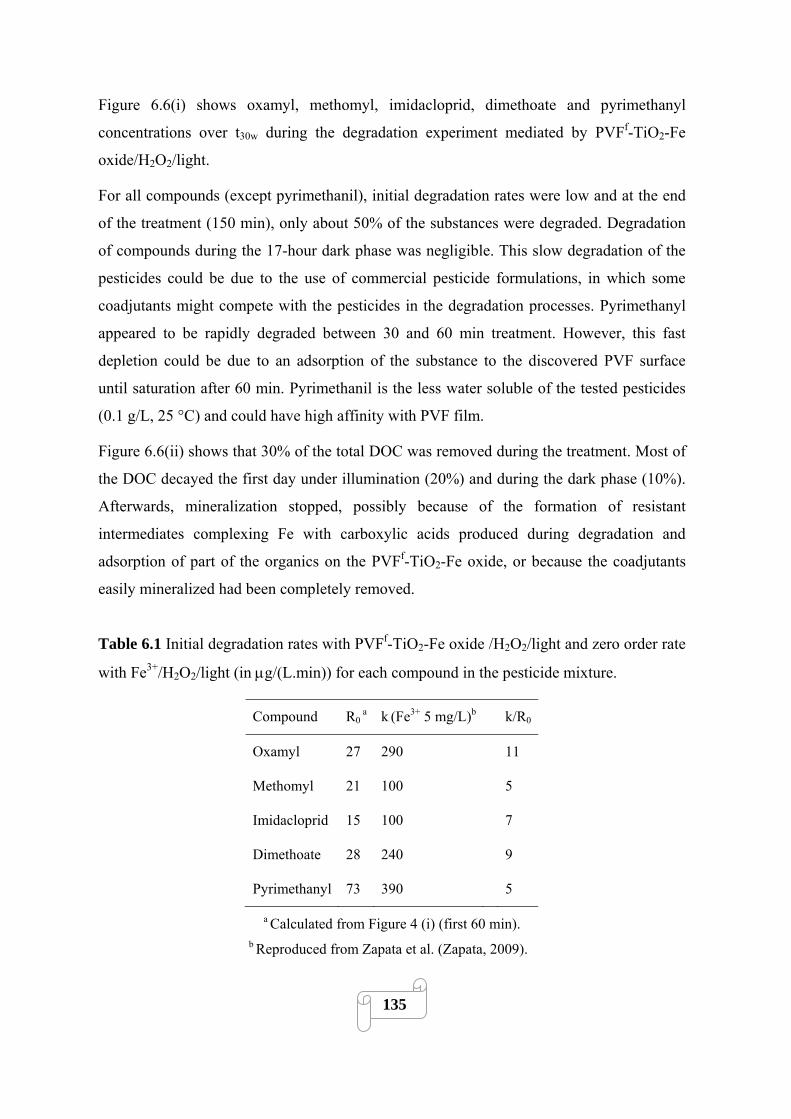
Figure 6.6(i) shows oxamyl, methomyl, imidacloprid, dimethoate and pyrimethanyl
concentrations over t30w during the degradation experiment mediated by PVFf-TiO2-Fe
oxide/H2O2/light.
For all compounds (except pyrimethanil), initial degradation rates were low and at the end
of the treatment (150 min), only about 50% of the substances were degraded. Degradation
of compounds during the 17-hour dark phase was negligible. This slow degradation of the
pesticides could be due to the use of commercial pesticide formulations, in which some
coadjutants might compete with the pesticides in the degradation processes. Pyrimethanyl
appeared to be rapidly degraded between 30 and 60 min treatment. However, this fast
depletion could be due to an adsorption of the substance to the discovered PVF surface
until saturation after 60 min. Pyrimethanil is the less water soluble of the tested pesticides
(0.1 g/L, 25 °C) and could have high affinity with PVF film.
Figure 6.6(ii) shows that 30% of the total DOC was removed during the treatment. Most of
the DOC decayed the first day under illumination (20%) and during the dark phase (10%).
Afterwards, mineralization stopped, possibly because of the formation of resistant
intermediates complexing Fe with carboxylic acids produced during degradation and
adsorption of part of the organics on the PVFf-TiO2-Fe oxide, or because the coadjutants
easily mineralized had been completely removed.
Table 6.1 Initial degradation rates with PVFf-TiO2-Fe oxide /H2O2/light and zero order rate
with Fe3+/H2O2/light (in μg/(L.min)) for each compound in the pesticide mixture.
Compound R0 a k (Fe3+ 5 mg/L)b k/R0
Oxamyl 27 290 11
Methomyl 21 100 5
Imidacloprid 15 100 7
Dimethoate 28 240 9
Pyrimethanyl 73 390 5
a Calculated from Figure 4 (i) (first 60 min). b Reproduced from Zapata et al. (Zapata, 2009).
135
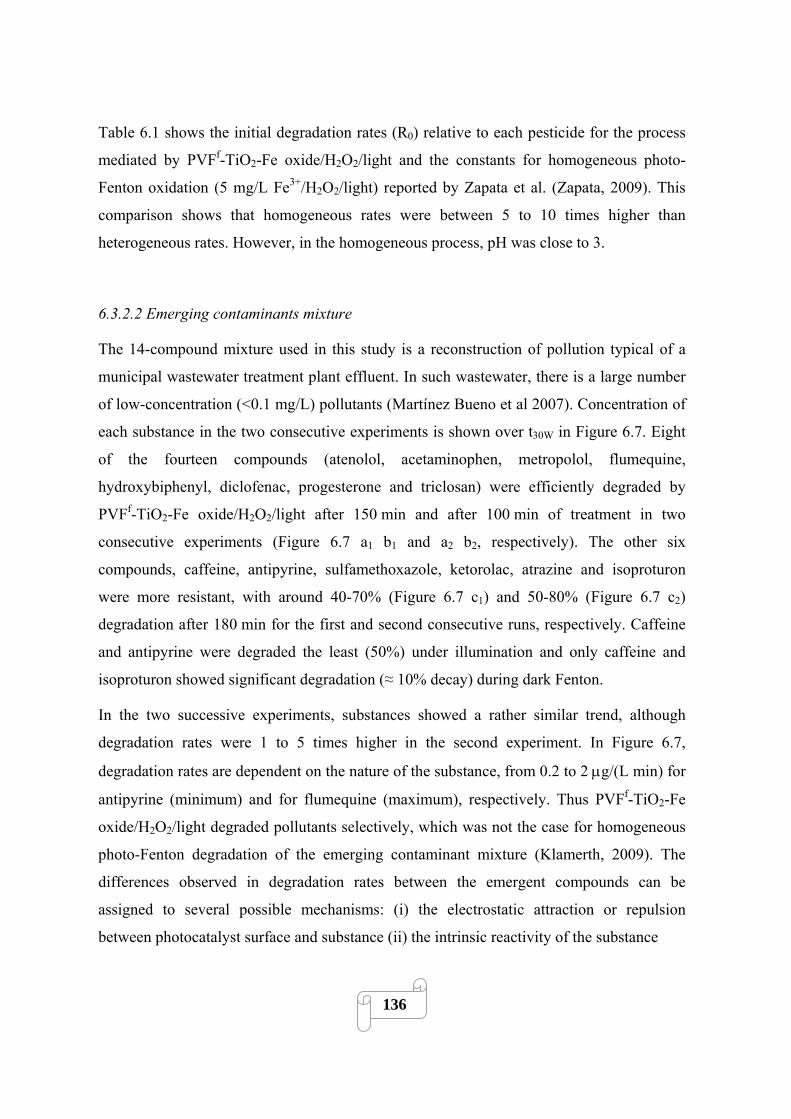
Table 6.1 shows the initial degradation rates (R0) relative to each pesticide for the process
mediated by PVFf-TiO2-Fe oxide/H2O2/light and the constants for homogeneous photo-
Fenton oxidation (5 mg/L Fe3+/H2O2/light) reported by Zapata et al. (Zapata, 2009). This
comparison shows that homogeneous rates were between 5 to 10 times higher than
heterogeneous rates. However, in the homogeneous process, pH was close to 3.
6.3.2.2 Emerging contaminants mixture
The 14-compound mixture used in this study is a reconstruction of pollution typical of a
municipal wastewater treatment plant effluent. In such wastewater, there is a large number
of low-concentration (<0.1 mg/L) pollutants (Martínez Bueno et al 2007). Concentration of
each substance in the two consecutive experiments is shown over t30W in Figure 6.7. Eight
of the fourteen compounds (atenolol, acetaminophen, metropolol, flumequine,
hydroxybiphenyl, diclofenac, progesterone and triclosan) were efficiently degraded by
PVFf-TiO2-Fe oxide/H2O2/light after 150 min and after 100 min of treatment in two
consecutive experiments (Figure 6.7 a1 b1 and a2 b2, respectively). The other six
compounds, caffeine, antipyrine, sulfamethoxazole, ketorolac, atrazine and isoproturon
were more resistant, with around 40-70% (Figure 6.7 c1) and 50-80% (Figure 6.7 c2)
degradation after 180 min for the first and second consecutive runs, respectively. Caffeine
and antipyrine were degraded the least (50%) under illumination and only caffeine and
isoproturon showed significant degradation (≈ 10% decay) during dark Fenton.
In the two successive experiments, substances showed a rather similar trend, although
degradation rates were 1 to 5 times higher in the second experiment. In Figure 6.7,
degradation rates are dependent on the nature of the substance, from 0.2 to 2 μg/(L min) for
antipyrine (minimum) and for flumequine (maximum), respectively. Thus PVFf-TiO2-Fe
oxide/H2O2/light degraded pollutants selectively, which was not the case for homogeneous
photo-Fenton degradation of the emerging contaminant mixture (Klamerth, 2009). The
differences observed in degradation rates between the emergent compounds can be
assigned to several possible mechanisms: (i) the electrostatic attraction or repulsion
between photocatalyst surface and substance (ii) the intrinsic reactivity of the substance
136

0
0.02
0.04
0.06
0.08
0.1
0 60 120 180
Con
cent
ratio
n (m
g/L
)
t30W (min)
atenololmetoprololhydroxybiphenylprogesterone
a1
0
0.02
0.04
0.06
0.08
0.1
0 60 120 180
Con
cent
ratio
n (m
g/L
)
t30W (min)
a2
0
0.02
0.04
0.06
0.08
0.1
0.12
0 60 120 180
Con
cent
ratio
n (m
g/L
)
t30W (min)
acetaminophenflumequinediclofenactriclosan
b1
0
0.02
0.04
0.06
0.08
0.1
0 60 120 180
Con
cent
ratio
n (m
g/L
)
t30W (min)
b2
0
0.02
0.04
0.06
0.08
0.1
0 60 120 180
Con
cent
ratio
n (m
g/L
)
t30W (min)
caffeineantipyrinesulfamethoxazoleketorolacatrazineisoproturon
c1
0
0.02
0.04
0.06
0.08
0.1
0 60 120 180
Con
cent
ratio
n (m
g /L
)
t30W (min)
c2
Figure 6.7 Emerging contaminant concentrations during first (a1-c1) and second (a2-c2)
consecutive degradation tests mediated by PVFf-TiO2-Fe oxide under solar light and in
presence of 3.1 mM (constant) H2O2.
137

(presence of weak bonds or electron donor groups, possibility to form complex with iron
surface species). Figure 1.9 shows the chemical structure of the different compounds: some
of the more recalcitrant compounds, namely, caffeine (pKa 10), ketorolac (pKa 10.3),
contain tertiary amine which are protonated and thus positively charged under the pH of
experiments (<7). The presence of this positive charge and/or the absence of negative or
complexing group (such as carboxylic acid or chelating agent), possibly induced repulsion
or weak attraction between the substance and the catalyst surface leading to a slow
degradation. In contrast, atenolol, metoprolol (although positively charged under
experimental condition, pKa 9.6, 9.7, respectively) and triclosan contain a chelating group,
flumequin and diclofenac contain a carboxylic acid function and are halogenated (weak
bonds). Thus the results suggest that reactivity is controlled by the presence of Fe(III)
complexant moieties (carboxylic acid, chelate) rather by the electrostatic
attraction/repulsion mechanism. In contrast, in the case of homogeneous photo-Fenton
structure reactivity relationships (Chapter 2), the substances able to form complexes with
iron were not removed faster which highlights the intrinsic differences between
homogeneous and heterogeneous systems. However, a systematic study under more
controlled conditions is required to draw a definitive conclusion on the structure reactivity
relationship for heterogeneous photo-Fenton systems.
6.3.3 Long-term stability and photocatalyst activation
PVFf-TiO2-Fe oxide films were active in the photo-assisted degradation of pollutants in
solution for 20 days under exposure to sunlight without any observable loss of efficiency.
As described in section 6.3.1 for phenol degradation, the rates were even higher after
having used PVFf-TiO2-Fe oxide for 7 runs. A similar trend was observed in compound
mixtures with higher rates in the second consecutive run (Figure 6.7 a2 b2 c2)) than in the
first (Figure 6.7 a1 b1 c1) which confirm the finding of chapter 5 where a similar trend
during repetitive nalidixic acid degradation runs was observed. Although a slight increase
in photocatalyst activity was observed, the appearance of the PVF-TiO2-Fe oxide film
changed considerably
138
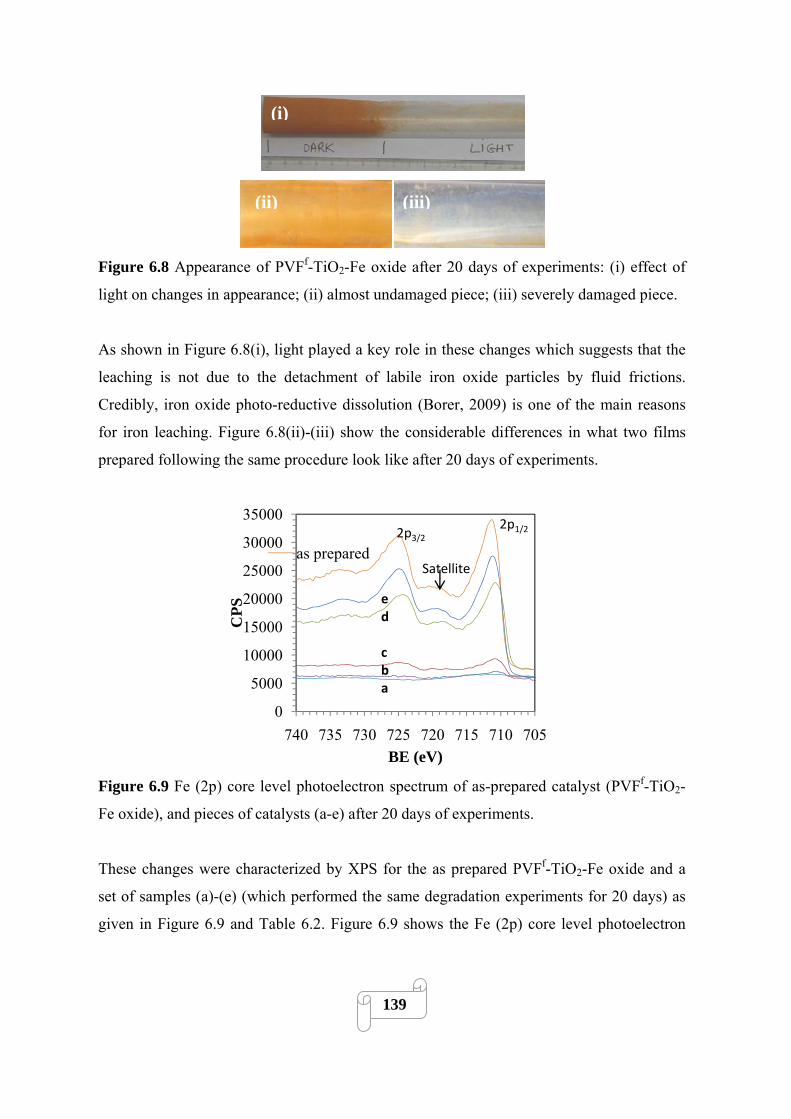
(i) (i)
(ii) (iii)
Figure 6.8 Appearance of PVFf-TiO2-Fe oxide after 20 days of experiments: (i) effect of
light on changes in appearance; (ii) almost undamaged piece; (iii) severely damaged piece.
As shown in Figure 6.8(i), light played a key role in these changes which suggests that the
leaching is not due to the detachment of labile iron oxide particles by fluid frictions.
Credibly, iron oxide photo-reductive dissolution (Borer, 2009) is one of the main reasons
for iron leaching. Figure 6.8(ii)-(iii) show the considerable differences in what two films
prepared following the same procedure look like after 20 days of experiments.
0
5000
10000
15000
20000
25000
30000
35000
705710715720725730735740
CPS
BE (eV)
as prepared2p3/2
2p1/2
Satellite
ed
cba
Figure 6.9 Fe (2p) core level photoelectron spectrum of as-prepared catalyst (PVFf-TiO2-
Fe oxide), and pieces of catalysts (a-e) after 20 days of experiments.
These changes were characterized by XPS for the as prepared PVFf-TiO2-Fe oxide and a
set of samples (a)-(e) (which performed the same degradation experiments for 20 days) as
given in Figure 6.9 and Table 6.2. Figure 6.9 shows the Fe (2p) core level photoelectron
139
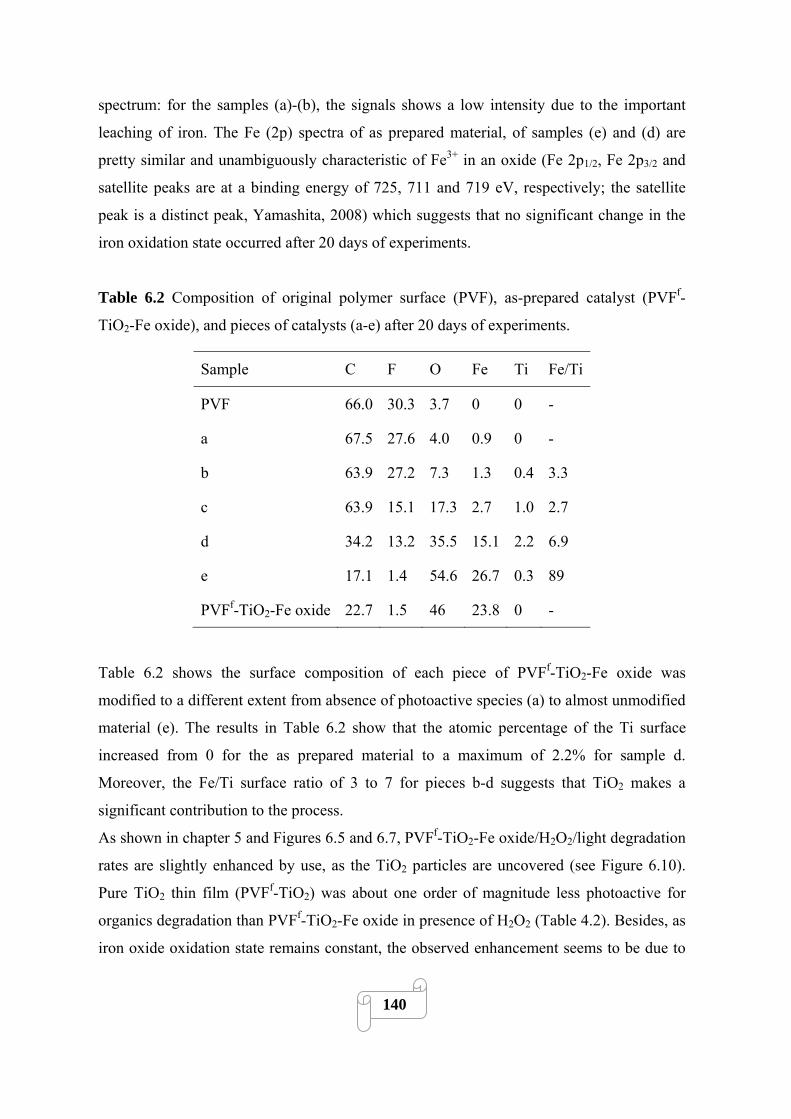
spectrum: for the samples (a)-(b), the signals shows a low intensity due to the important
leaching of iron. The Fe (2p) spectra of as prepared material, of samples (e) and (d) are
pretty similar and unambiguously characteristic of Fe3+ in an oxide (Fe 2p1/2, Fe 2p3/2 and
satellite peaks are at a binding energy of 725, 711 and 719 eV, respectively; the satellite
peak is a distinct peak, Yamashita, 2008) which suggests that no significant change in the
iron oxidation state occurred after 20 days of experiments.
Table 6.2 Composition of original polymer surface (PVF), as-prepared catalyst (PVFf-
TiO2-Fe oxide), and pieces of catalysts (a-e) after 20 days of experiments.
Sample C F O Fe Ti Fe/Ti
PVF 66.0 30.3 3.7 0 0 -
a 67.5 27.6 4.0 0.9 0 -
b 63.9 27.2 7.3 1.3 0.4 3.3
c 63.9 15.1 17.3 2.7 1.0 2.7
d 34.2 13.2 35.5 15.1 2.2 6.9
e 17.1 1.4 54.6 26.7 0.3 89
PVFf-TiO2-Fe oxide 22.7 1.5 46 23.8 0 -
Table 6.2 shows the surface composition of each piece of PVFf-TiO2-Fe oxide was
modified to a different extent from absence of photoactive species (a) to almost unmodified
material (e). The results in Table 6.2 show that the atomic percentage of the Ti surface
increased from 0 for the as prepared material to a maximum of 2.2% for sample d.
Moreover, the Fe/Ti surface ratio of 3 to 7 for pieces b-d suggests that TiO2 makes a
significant contribution to the process.
As shown in chapter 5 and Figures 6.5 and 6.7, PVFf-TiO2-Fe oxide/H2O2/light degradation
rates are slightly enhanced by use, as the TiO2 particles are uncovered (see Figure 6.10).
Pure TiO2 thin film (PVFf-TiO2) was about one order of magnitude less photoactive for
organics degradation than PVFf-TiO2-Fe oxide in presence of H2O2 (Table 4.2). Besides, as
iron oxide oxidation state remains constant, the observed enhancement seems to be due to
140
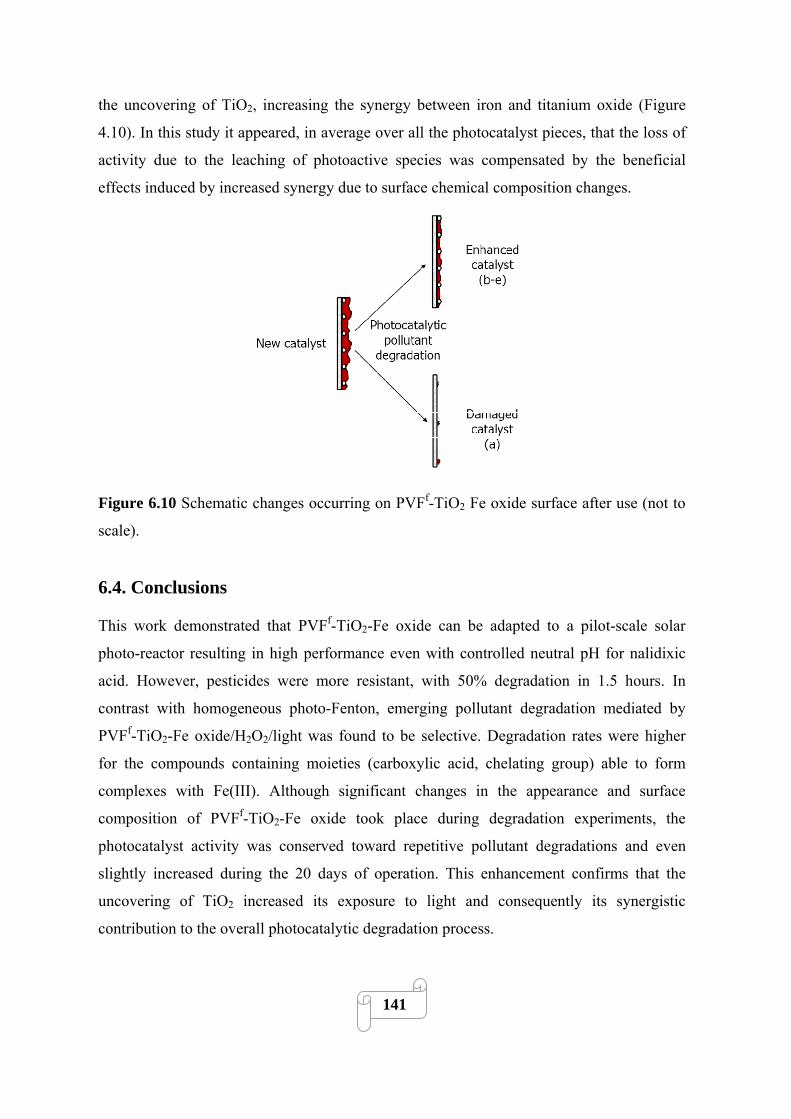
the uncovering of TiO2, increasing the synergy between iron and titanium oxide (Figure
4.10). In this study it appeared, in average over all the photocatalyst pieces, that the loss of
activity due to the leaching of photoactive species was compensated by the beneficial
effects induced by increased synergy due to surface chemical composition changes.
Figure 6.10 Schematic changes occurring on PVFf-TiO2 Fe oxide surface after use (not to
scale).
6.4. Conclusions
This work demonstrated that PVFf-TiO2-Fe oxide can be adapted to a pilot-scale solar
photo-reactor resulting in high performance even with controlled neutral pH for nalidixic
acid. However, pesticides were more resistant, with 50% degradation in 1.5 hours. In
contrast with homogeneous photo-Fenton, emerging pollutant degradation mediated by
PVFf-TiO2-Fe oxide/H2O2/light was found to be selective. Degradation rates were higher
for the compounds containing moieties (carboxylic acid, chelating group) able to form
complexes with Fe(III). Although significant changes in the appearance and surface
composition of PVFf-TiO2-Fe oxide took place during degradation experiments, the
photocatalyst activity was conserved toward repetitive pollutant degradations and even
slightly increased during the 20 days of operation. This enhancement confirms that the
uncovering of TiO2 increased its exposure to light and consequently its synergistic
contribution to the overall photocatalytic degradation process.
141
6.5 References
Ajona J.I. and Vidal A. (2000) The use of CPC collectors for detoxification of contaminated water: design, construction and preliminary results. Solar Energy 68: 109-120.
Borer P., Sulzberger B., Hug S.J., Kraemer S.M., Kretzschmar R. (2009) Photoreductive dissolution of iron(III) (Hydr)oxides in the absence and presence of organic ligands: Experimental studies and kinetic modeling. Environmental Science and Technology 43: 1864-1870.
Chen F., He J., Zhao J., Yu J.C. (2002) Photo-Fenton degradation of malachite green catalyzed by aromatic compounds under visible light irradiation. New Journal of Chemistry 26: 336-341.
Dalrymple O.K., Yeh D.H., Trotz M.A. (2007) Removing pharmaceuticals and endoctrine-disrupting compounds from wastewater by photocatalysis. Journal of Chemical Technology and Biotechnology 82: 121-134.
Feng J., Hu X., Yue P. L., Qiao S. (2009) Photo Fenton degradation of high concentration Orange II (2mM) using catalysis containing Fe: A comparative study. Separation and Purification Technology 67: 213–217.
Gumy D., Fernandez-Ibanez P., Malato S., Pulgarin C., Enea O., Kiwi J. (2005) Supported Fe/C and Fe/Nafion/C catalysts for the photo-Fenton degradation of Orange II under solar irradiation. Catalysis Today, 101: 375-382.
Hosseini S.N., Borghei S.M., Vossoughi M., Taghavinia N. (2007) Immobilization of TiO2 on perlite granules for photocatalytic degradation of phenol. Applied Catalysis B: Environmental 74: 53–62.
Huang, C.-P., Chen, C.-R., Huang, Y.-F., Lu, Y.-W., Huang, Y.-H. (2009) Reductive dissolution and oxidative catalysis of an immobilized iron oxide in the presence of catechol and phenol. Journal of Molecular Catalysis A: Chemical 304: 121-127.
Iqbal M. (1983). An Introduction to Solar Radiation. Academic Press, Oxford. Klamerth N., Miranda N., Malato S., Agüera A., Fernández-Alba A. R,. Maldonado M.I
and. Coronado J. M. (2009) Degradation of emerging contaminants at low concentration in MWTPs effluents with mild solar photo-Fenton and TiO2. Catalysis Today 144: 124–130.
Klavarioti M., Mantzavinos D., Kassinos D. (2009) Removal of residual pharmaceuticals from aqueous systems by advanced oxidation processes. Environment International 35: 402-417.
Malato S., Blanco J., Vidal A., Alarcón D., Maldonado M. I., Cáceres J., Gernjak W. (2003) Applied studies in solar photocatalytic detoxification: an overview. Solar Energy 75:329.
Malato S. (2008) Removal of emerging contaminants in waste-water trteatment: Removal by photo-catalytic processes. Handbook of Environmental Chemistry, Volume 5: Water Pollution 5 S2: 177-197.
Martínez Bueno M. J., Agüera A., Gómez M. J., Hernando M. D., García-Reyes J. F., Fernández-Alba A.R. (2007) Application of liquid chromatography/quadrupole-linear ion trap mass spectrometry and time-of-flight mass spectrometry to the determination of pharmaceuticals and related contaminants in wastewater. Analytical Chemistry 79: 9372-9384.
142

Méndez-Arriaga F., Maldonado M. I., Gimenez J., Esplugas S., Malato S. (2009) Abatement of ibuprofen by solar photocatalysis process: Enhancement and scale up. Catalysis Today 144: 112–116.
Murakami N., Chiyoya T., Tsubota T., Ohno T. (2008) Switching redox site of photocatalytic reaction on titanium(IV) oxide particles modified with transition-metal ion controlled by irradiation wavelenght. Applied Catalysis A, Chemical 348: 148–152.
Muschaweck J., Spirkl W., Timinger A., Benz N., Dörfler M., Gut M. and Kose E. (2000) Optimized reflectors for non-tracking solar collectors with tubular absorbers. Solar Energy 68: 151-159.
Muthuvel I., Swaminathan M. (2008) Highly solar active Fe(III) immobilized alumina for the degradation of Acid Violet 7. Solar Energy Materials and Solar Cells 92 (8), 857–863.
Nogueira R. F. P., Oliviera M. C., Paterlini W. C. (2005) Simple and fast spectrophotometric determination of H2O2 in photo-Fenton reactions using metavanadate. Talanta 66: 86.
Parra S., Stanca S. E., Guasaquillo I., Thampi K. R. (2004) Photocatalytic degradation of atrazine suspended and supported TiO2. Applied Catalysis B, Environmental 51: 107–116.
Pulgarin C., Peringer P., Albers P., Kiwi J. (1995) Effect of Fe ZSM-5 zeolite on the photochemical and biochemical degradation of 4-chlorophenol. Journal of Molecular Catalysis A, Chemical 95: 61-74.
Sarria, V., Parra, S., Invernizzi, M., Péringer, P., Pulgarin, C. (2001) Photochemical-biological treatment of a real industrial biorecalcitrant wastewater containing 5-amino-6-methyl-2-benzimidazolone. Water Science and Technology 44: 93-101.
Schwarzenbach R. P., Escher B. I., Fenner K., Hofstetter T. B., Johnson C. A., Von Gunten U., Wehrli B. (2006) The challenge of micropollutants in aquatic systems. Science 313 (5790), 1072-1077.
Tryba B. (2008) Immobilization of TiO2 and Fe-C-TiO2 photocatalysis on the cotton material for application in a flow photocatalytic reactor for decomposition of phenol in water. Journal of Hazardous Material 151 (2-3), 623–627.
Well M., Dillert R.H.G., Bahnemann D.W., Benz V.W. and Mueller, M.A. (1997) A novel nonconcentrating reactor for solar water detoxification. Journal of Solar Energy Engineering, Transactions of ASME 119: 114-119.
Wyness P., Klausner J.F. and Goswami D.Y. (1994). Performance of Nonconcentrating Solar Photocatalytic Oxidation Reactors, Part I: Flat-Plate Configuration. Journal of Solar Energy Engineering, Transactions of ASME 116: 2-7.
Xue X., Hanna K., Despas C., Wu F., Deng N. (2009) Effect of chelating agent on the oxidation rate of PCP in the magnetite/H2O2 system at neutral pH. Journal of Molecular Catalysis A, Chemical 311: 29–35.
Yamashita T., Hayes P. (2008) Analysis of XPS spectra of Fe2+ and Fe3+ ions in oxide materials. Applied Surface Science 254: 2441–2449
Zapata A., Velegraki T., Sanchez-Perez J. A., Mantzavinos D., Maldonado M. I., Malato S., (2009) Solar photo-Fenton treatment of pesticides in water: Effect of iron concentration on degradation and assessment of ecotoxicity and biodegradbility. Applied Catalysis B, Environmental 88: 448-454
143

144

7 GENERAL CONCLUSIONS AND
PERSPECTIVES
The strategy consisting in the deposition of iron oxide on modified polymer films surface to
prepare supported photo-Fenton catalyst, for solar water decontamination, was presented as
a good alternative to minimise iron dissolution (and consequent sludge formation) and to
extend the operational pH range of the photo-Fenton process. However, the efficiency of
the new process depends on the particular type of wastewater and experimental conditions.
Hence the eventual benefit induced by the proposed supported catalyst, if compared with
homogeneous photo-Fenton or other processes, has to be determined for each particular
case. The development of this new photocatalyst involved an optimisation of preparation
procedure by the evaluation of the materials photocatalytic activity using model
contaminants; the surface characterization of most efficient materials (by XPS, SEM etc.),
the study of the influence of reaction conditions (pH, salt content etc.) on degradation rates
and the field scale application of the most efficient materials (for real contaminants
degradation) under direct sunlight using parabolic collectors. More fundamental aspects
such as the study of the influence of organic contaminants structure on reactivity for
homogeneous (and supported) photo-Fenton reaction and the proposition of mechanisms
that could be involved in material preparation and contaminants degradation were also
investigated.
The relationship between various physico-chemical parameters and photo-reactivity in
homogeneous photo-Fenton system was investigated. Para-substituted phenol reactivity
was found to be a function of the electronic effects induced by the substituents. The
homogenous Fenton and photo-Fenton degradation was faster when the electronic density
of the aromatic ring is high, favoring electrophilic radical attack on the ring. The
degradation rates were higher when half wave potential (relative to Eq. 2.2) is low. These
results suggest different reactions occurring at different positions on the molecule on the
145
aromatic ring, alcohol function, or on the substituent. Generally, the electronic descriptors
fitted well with the kinetic parameters, particularly with the Fenton rates but also with the
photo-Fenton degradation rates. However, the photo-Fenton rates can be non-linearly
correlated with electronic descriptors especially when the reaction occurs rapidly at the
substituents (e.g. for 4-chlorophenol) which is possibly due to the presence of a weak bond.
Homogeneous photo-Fenton process exhibits generally low selectivity in the degradation
and mineralization of most of organic compounds and the experimental conditions were
adapted to observe the slight differences between para-substituted phenols. In contrast, in
the case of contaminant degradation mediated by supported photo-Fenton reaction (chapter
6), the reactivity was found to be significantly dependant of substance structure with higher
rates for the compounds containing functional groups (such as carboxylic acids or chelate
groups) allowing the formation of iron complexes and/or adsorption on catalyst surface.
A new way to prepare supported photo-Fenton catalyst on commercial PVF films by a
sequential procedure consisting in functionalizing polymer films (by plasma, vacuum-UV
or photocatalytic treatments) and performing a subsequent iron oxide coating by forced
hydrolysis of FeCl3 was proposed. It was found that iron oxide-coated functionalized
polymer films are suitable materials to degrade and mineralize hydroquinone under
simulated solar irradiation in presence of hydrogen peroxide. The UV visible absorption
measurements have shown that implementing an initial functionalization of the polymer
surface can be an efficient strategy to improve the attraction between iron oxide and
polymer film supports. As a result, a higher amount of iron oxide was immobilized on
catalyst surface leading to more efficient photocatalysts. Besides TiO2 photocatalysis, when
performed as polymer surface functionalization technique, was found to lead to the
deposition of additional active specie (TiO2 particles). Among the functionalization
methods evaluated, only radio frequency plasma and more markedly TiO2 photocatalytic
treatments were useful to improve material photocatalytic activity and long-term stability.
Furthermore the latter functionalization method is sustainable as it uses solar light, water as
solvent, low temperatures and ambient pressure.
The effect of TiO2 photocatalytic surface functionalization and deposition treatment
(PSFD) on PVF surface chemical composition and morphology was studied in more detail.
XPS measurements have shown that this innovative modification method induced the
146
formation of oxygen functional groups (C-OH, COOH etc.) and the elimination of fluorine
on the PVF surface. Besides, XPS and SEM analysis have shown that the TiO2 PSFD lead
to the deposition of aggregated TiO2 particles on PVF increasing its surface roughness. It
was possible to control the extent of TiO2 deposition by varying the pH, which suggested
that the TiO2 particles were bound to functionalized PVF by an electrostatic interaction.
The nature of the iron oxide coat was also investigated by XPS and is probably constituted
by akaganeite (β-FeOOH).
The photocatalytic activity study using hydroquinone as model contaminants has shown
that significant synergistic effects occurred between TiO2 and iron oxide for the system
PVFf-TiO2-Fe oxide/H2O2/light. These synergistic effects were assigned to different
mechanisms leading to =Fe(II) regeneration which is the rate-limiting step in Fenton
processes. PVF, PE or PET supports led to catalysts showing similar photoactivity ruling
out the possibility that the polymer nature influence significantly the catalyst efficiency.
PET bottle employed as reactors and catalysts support (PETb-TiO2-Fe oxide) was an
efficient heterogeneous photocatalyst to inactivate bacteria and no dissolved iron ions were
detected in the filtered solution opening perspectives for SODIS applications.
The reactivity of PVFf-TiO2-Fe oxide/H2O2/light system was investigated, the contribution
of dissolved iron and the influence of reaction parameters were assessed as well as long
term stability. It was found that the photo-dissolution of iron ions and their relative
homogeneous photo-Fenton contribution to HQ and NA initial mineralization was low but
significant. Besides, most of dissolved iron ions were re-deposited on the photocatalyst at
the end of the treatment. The rates of organic compounds photo-assisted degradation were
high and mostly independent of initial pH and NaCl presence but increased with
temperature. The photocatalytic activity was highly stable toward repetitive nalidixic acid
degradations as no decrease in the degradation rates were observed during 45 consecutive
runs of tree hours.
The presence of TiO2 particles on the photocatalyst surface, induced by the TiO2 PSFD
treatment, was found to engender three principal beneficial effects: (1) the iron oxide
deposition was higher on TiO2 coated PVF surfaces than in commercial PVF as TiO2
particles acted as iron oxide nucleation initiator; (2) the initial and long term photo-activity
147
increase were assigned to the uncovering of TiO2 due to irreversible iron dissolution which
increased its exposition to light and consequently its synergistic contribution to the overall
photocatalytic degradation process; (3) the resistance to self-degradation was assigned to
TiO2 which may act as a charge trap and diminish the contact between active iron species
and polymer surface.
Finally PVFf-TiO2-Fe oxide was successfully adapted to a pilot-scale parabolic solar photo-
reactor showing good performances in aromatic organic compounds degradation, even at
controlled neutral pH in the case of nalidixic acid. However, other compounds such as
pesticides were more resistant. In contrast with homogeneous photo-Fenton, emerging
pollutant degradation mediated by PVFf-TiO2-Fe oxide/H2O2/light was found to be
selective. Degradation rates were higher for the compounds containing moieties (carboxylic
acid, chelating group) that can be adsorbed to catalyst surface and/or form complexes with
Fe(III). Although significant changes in the appearance and surface composition of PVFf-
TiO2-Fe oxide took place during degradation experiments, the photocatalyst activity was
conserved toward repetitive pollutant degradations and even slightly increasing during the
20 days of operation. This enhancement confirmed that the uncovering of TiO2 increased
its exposure to light and consequently its synergistic contribution to the overall
photocatalytic degradation process.
Perspectives
The perspectives opened by this work are wide and it would be difficult to enumerate all of
them. However, some of the issues that would need further investigations are:
• Additional studies with TiO2 and iron oxide coated polymer films could be carried out to
determine the optimal Fe/Ti surface ratio. In this work this surface ratio was between 3
and 90 but a value inferior to 1 could be optimal. In this sense the development of iron
oxide coated-TiO2 supports is an interesting alternative to be developed.
• The mechanisms involved in the synergistic effects could be studied in more details by
quantum calculations or by advanced spectroscopic techniques (time resolved
spectroscopy, paramagnetic electronic resonance etc.)
148
• The use of a different iron oxide coat (magnetite, green rust, goethite, ferrhydrite etc.)
may drive to a higher photocatalytic activity or could decrease iron dissolution.
• An additional thin TiO2 coat could be deposited on the surface of P-TiO2-Fe oxide
(leading to an iron oxide sandwiched between two TiO2 coats) aiming to suppress iron
photo-dissolution.
• Other semiconductors than TiO2 (like Fe2O3, ZnO, etc.) could modify polymer surfaces
(and eventually be deposited) under adequate irradiation conditions.
• The preparation procedure proposed could be applied to other supports based on carbon
such as organic membranes, activated carbon, carbon fibers or nanotubes, cellulose etc.
• The activity of TiO2 and iron oxide coated PET bottles in presence of H2O2 for the solar
disinfection of water could be investigated in more details using different biological
indicators (virus, more resistant bacteria etc.) and real contaminated waters.
• The TiO2 PSFD could be performed to different polymers to increase their bio-
compatibility, their adhesive properties, or could be a way to prepare self-cleaning
surfaces. On the other hand, TiO2 photocatalysis could be used to mineralize polymer
waste.
149

150
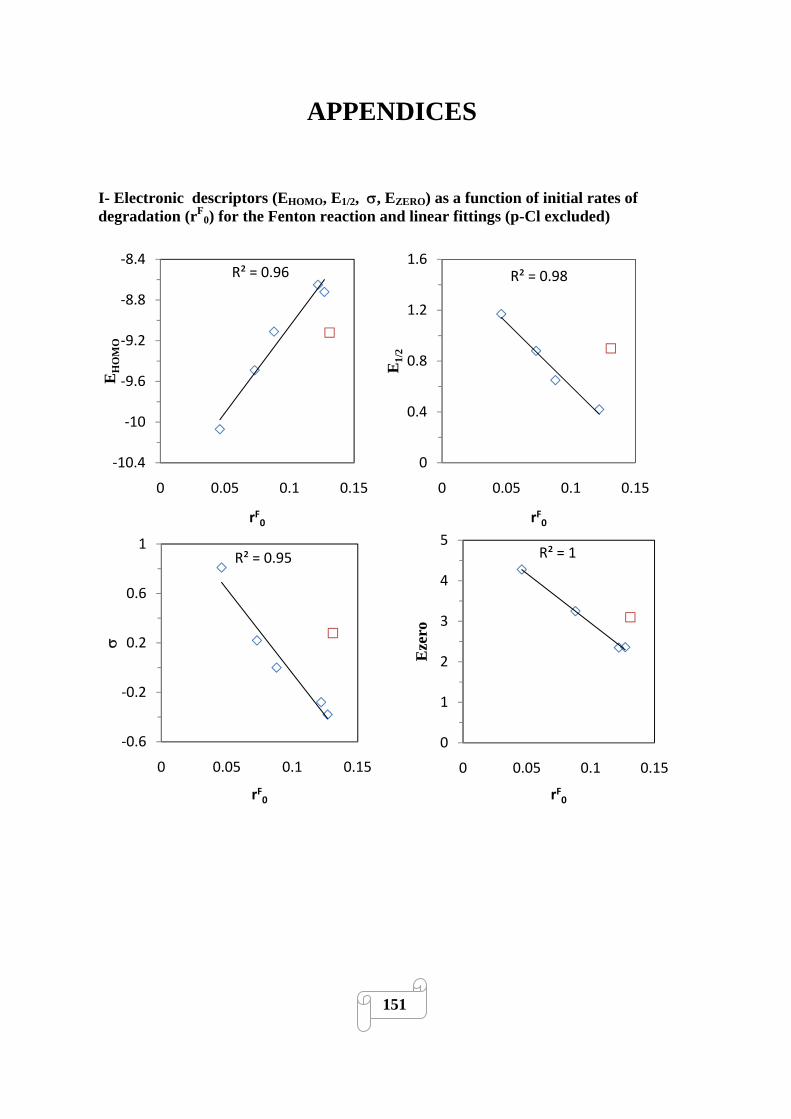
APPENDICES
I- Electronic descriptors (EHOMO, E1/2, σ, EZERO) as a function of initial rates of degradation (rF
0) for the Fenton reaction and linear fittings (p-Cl excluded)
R² = 0.96
‐10.4
‐10
‐9.6
‐9.2
‐8.8
‐8.4
0 0.05 0.1 0.15
EH
OM
O
rF0
R² = 0.98
0
0.4
0.8
1.2
1.6
0 0.05 0.1 0.15
E1/
2
rF0
R² = 0.95
‐0.6
‐0.2
0.2
0.6
1
0 0.05 0.1 0.15
σ
rF0
R² = 1
0
1
2
3
4
5
0 0.05 0.1 0.15
Eze
ro
rF0
151

II- Electronic descriptors (EHOMO, E1/2, σ, EZERO) as a function of initial rates of degradation (rpf0) for the photo-Fenton reaction and linear fittings (p-Cl and p-CHO excluded)
R² = 1
‐10.4
‐10
‐9.6
‐9.2
‐8.8
‐8.4
0 0.1 0.2 0.3
EH
OM
O
rF0
R² = 0.85
0
0.4
0.8
1.2
1.6
0 0.1 0.2 0.3
E1/
2
rF0
R² = 0.98
‐0.6
‐0.2
0.2
0.6
1
0 0.1 0.2 0.3
σ
rF0
R² = 0.99
0
1
2
3
4
5
0 0.1 0.2 0.3
Eze
ro
rF0
152

CURICULUM VITAE
Félicien MAZILLE Chemin de Charmettes, 7
1003 Lausanne Telephone: 021 311 60 69
Mobile: 078 739 41 98 E-mail: [email protected]
Education: 2006 Swiss Institute of Technology Lausanne Switzerland M. Sc. in Molecular and Biological Chemistry 2000 Lycée Charles Baudelaire Cran Gevrier France Baccalaureat Scientific Employment: 2004-2006 Swiss Institute of Technology Lausanne Switzerland Assistant: general chemistry exercises. 2004-2005 Swiss Institute of Technology Lausanne Switzerland
Laboratory of Photonics and Interfaces (EPFL-LPI) Research work: Stability and performance of new ionic liquids based dye sensitized solar cells.
2005-2006 Swiss institute of technology Lausanne Switzerland
Laboratory Environmental Biotechnology (EPFL-LBE) Master work: Effect of a helio-photocatalytic treatment on pollutants of industrial interest
2006 Valle State University (Univalle) Cali Colombia Group of Advanced Oxidation Processes (GAOX)
Research work: Photocatalysis for removing the herbicide Ametryn in water, and photocatalysis as an alternative to chlorination for drinking water production.
153
2007-2010 Swiss Institute of Technology Lausanne Switzerland
Laboratory of electrochemical engineering (EPFL-GGEC) Assistant in Chemical Engineering PhD thesis about heterogeneous photo-Fenton catalysis Participant of European project (INNOWATECH).
Skills: Languages: French: mother tongue English: good knowledge Spanish: good knowledge Knowledge and experience in:
- Material science: nanomaterials innovative preparation, polymer surface modification, surface characterization (XPS, SEM…).
- Industrial wastewater treatment : photocatalytic methods - Analysis of water: chromatography (HLPC, GC-MS…), spectrophotometry,
biodegradability (BOD5), dissolved carbon (TOC, DOC) etc. - Energy production: dye sensitized solar cells. - Teaching, writing scientific papers, oral presentations, fund finding, research
projects. Personal Details: Date of birth: 7th august 1982 Nationality: Swiss, French Gender: Male Publications:
1. F. Mazille, Z. Fei, D. Kuang, D. Zhao, S.M. Zakeeruddin, M. Gratzel, P.J. Dyson. Influence of ionic liquids bearing functional groups in dye-sensitized solar cells. Inorganic Chemistry 45 (2006) 1585-90.
2. F. Mazille, T. Schoettl, C. Pulgarin,
Synergistic effect of TiO2 and iron oxide supported on fluorocarbon films. Part 1: Effect of preparation parameters on photocatalytic degradation of organic pollutant at neutral pH.
154
155
Applied Catalysis B: Environmental 89 (2009) 635–644.
3. F. Mazille, A. Lopez, C. Pulgarin, Synergistic effect of TiO2 and iron oxide supported on fluorocarbon films. Part 2: Long term stability and influence of reaction parameters on photoactivated degradation of pollutants. Applied Catalysis B: Environmental 90 (2009) 321-329.
4. F. Mazille, T. Schoettl, A. Lopez, C. Pulgarin
Physico-chemical properties and photo-reactivity relationship for para-substituted phenols in photo-assisted Fenton system. Journal of Photochemistry and Photobiology A: Chemistry 210 (2010) 193-199
5. F. Mazille, T. Schoettl, N.Klamerth, S. Malato, C. Pulgarin. Field solar degradation of pesticides and emerging water contaminants mediated by polymer films containing titanium and iron oxide with synergistic heterogeneous photocatalytic activity at neutral pH. Water Research 44 (2010) 3029-3038.
6. F. Mazille, A. Moncayo-Lasso, D. Spuhler, A. Serra, J. Peral, N.L Benítez, C. Pulgarin. Comparative evaluation of polymer surface functionalization techniques before iron oxide deposition. Activity of the iron oxide-coated polymer films in the photo-assisted degradation of organic pollutants and inactivation of bacteria. Chemical Engineering Journal 160 (2010) 176-184.
International conferences:
1. Participation in the conference SILAPAO (simposio latinoamericano de procesos avanzados de oxidacion) Cali (Colombia) November 2006
2. F. Mazille, T. Schoettl, C. Pulgarin, “Innovative and highly synergistic action of titanium and iron oxides coated on polymer previously modified by TiO2 photocatalysis” Poster communication in “SPEA 5 (5th European conference Solar chemistry and Photocatalysis: Environmental Applications)” Palermo (Italy) PP3.39, 4-8 October 2008 .
3. F. Mazille, T. Schoettl, C. Pulgarin, “Innovative and highly synergistic action of titanium and iron oxides coated on functionalized polymer films” Oral communication. SILAPAO (simposio latinoamericano de procesos avanzados de oxidacion) Medellin (Colombia) p.120-136, 24-26 November 2008.
4. Participation and presentation in the european project INNOWATECH group
meeting in Almeria, Zürich, Aachen, Bari and Gent. Between 2007 and 2010.