development of a serological assay for chikungunya...
TRANSCRIPT
DEVELOPMENT OF A SEROLOGICAL
ASSAY FOR CHIKUNGUNYA VIRUS
NISHAKANTHI A/P GOPALAN
Institute Of Biological Sciences University of Malaya
Kuala Lumpur
A research report submitted to the Institute of Biological Sciences, University of Malaya, in partial fulfillment of the requirements for the degree of Master of
Biotechnology.
2008/2009
DEVELOPMENT OF A SEROLOGICAL ASSAY FOR
CHIKUNGUNYA VIRUS
NISHAKANTHI A/P GOPALAN
INSTITUTE OF BIOLOGICAL SCIENCES FACULTY OF SCIENCE
UNIVERSITY OF MALAYA KUALA LUMPUR
2008/2009
TABLE OF CONTENTS
Page
ACKNOWLEDGEMENT i
LIST OF FIGURES ii
LIST OF TABLES iv
LIST OF ABBREVIATIONS vi
1.0 ABSTRACT 1
2.0 INTRODUCTION
2.1 Chikungunya outbreak case statistics 5
2.2 Virology of Chikungunya virus
8
2.2.1 Genomic structure of Chikungunya virus 10
2.3 Clinical manifestations of Chikungunya 12
2.4 Laboratory diagnosis of Chikungunya infection 13
2.4.1 Virus isolation 14
2.4.2 Polymerase chain reaction (PCR) 14
2.4.3 Serological techniques 15
2.4.4 Comparison between PCR, ELISA and
neutralization 19
2.5 Objectives 22
3.0 MATERIALS AND METHODS
3.1 Bagan Panchor serum samples 23
3.2 Virus isolate 24
3.3 Cell culture 24
3.4 Virus propagation 24
3.5 Virus harvesting 25
3.6 Confirmation of CHIKV infection
3.6.1 Microscopic observation 26
3.6.2 Immunofluorescence staining 26
3.6.3 Reverse transcriptase polymerase chain reaction
RT-PCR
(a) RNA Extraction of CHIKV-infected Vero cells 27
(b) RT-PCR 28
3.6.4 Western Blot
3.6.4.1 Sodium Dodecyl Sulphate Polyacrylamide
Gel (SDS-PAGE)
29
3.6.4.2 Semi-dry Transfer 30
3.6.4.3 Immunodetection 30
3.7 CHIKV culture and titration 32
3.8 Quantitating extracted protein
3.8.1 Preparation of cell lysate 33
3.8.2 Protein assay 34
3.8.3 Coomassie blue staining 34
3.9 Neutralization test 34
3.10 Enzyme linked immunosorbent assay 35
3.11 Calculation of cut-off value for ELISA 36
3.12 Calculation of sensitivity, specificity, positive predictive
value, negative predictive value and concordance 39
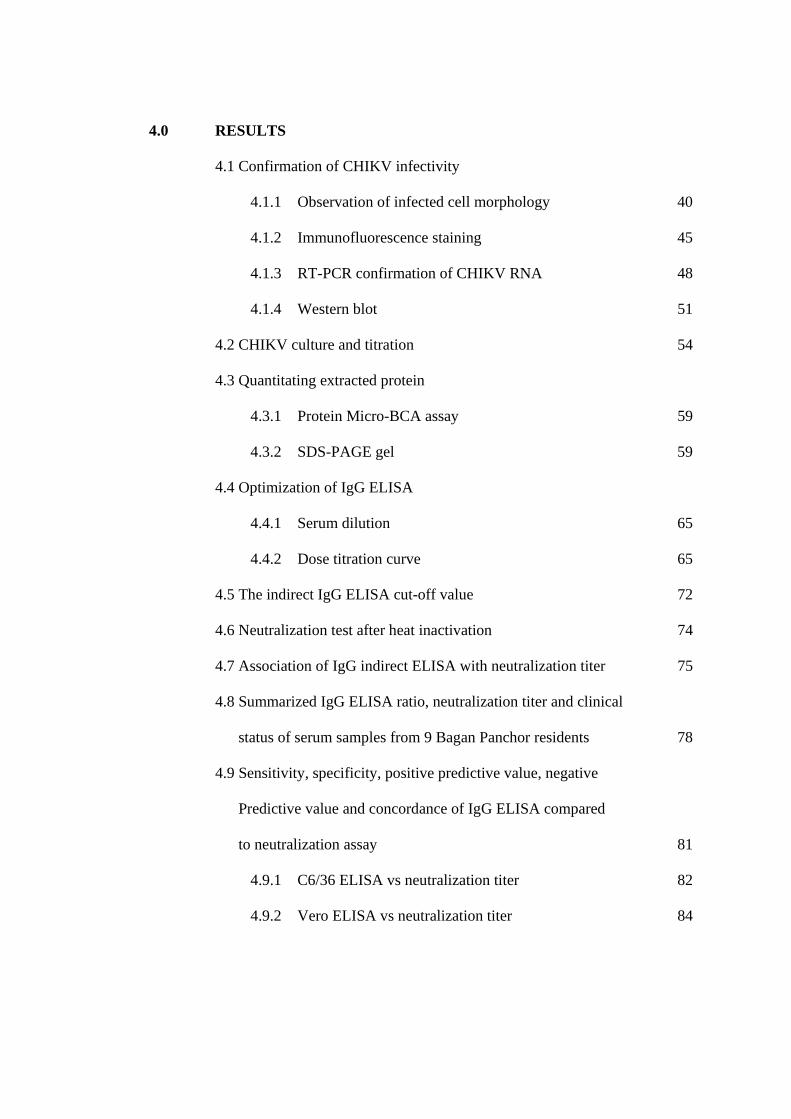
4.0 RESULTS
4.1 Confirmation of CHIKV infectivity
4.1.1 Observation of infected cell morphology 40
4.1.2 Immunofluorescence staining 45
4.1.3 RT-PCR confirmation of CHIKV RNA 48
4.1.4 Western blot 51
4.2 CHIKV culture and titration 54
4.3 Quantitating extracted protein
4.3.1 Protein Micro-BCA assay 59
4.3.2 SDS-PAGE gel 59
4.4 Optimization of IgG ELISA
4.4.1 Serum dilution 65
4.4.2 Dose titration curve 65
4.5 The indirect IgG ELISA cut-off value 72
4.6 Neutralization test after heat inactivation 74
4.7 Association of IgG indirect ELISA with neutralization titer 75
4.8 Summarized IgG ELISA ratio, neutralization titer and clinical
status of serum samples from 9 Bagan Panchor residents 78
4.9 Sensitivity, specificity, positive predictive value, negative
Predictive value and concordance of IgG ELISA compared
to neutralization assay 81
4.9.1 C6/36 ELISA vs neutralization titer 82
4.9.2 Vero ELISA vs neutralization titer 84
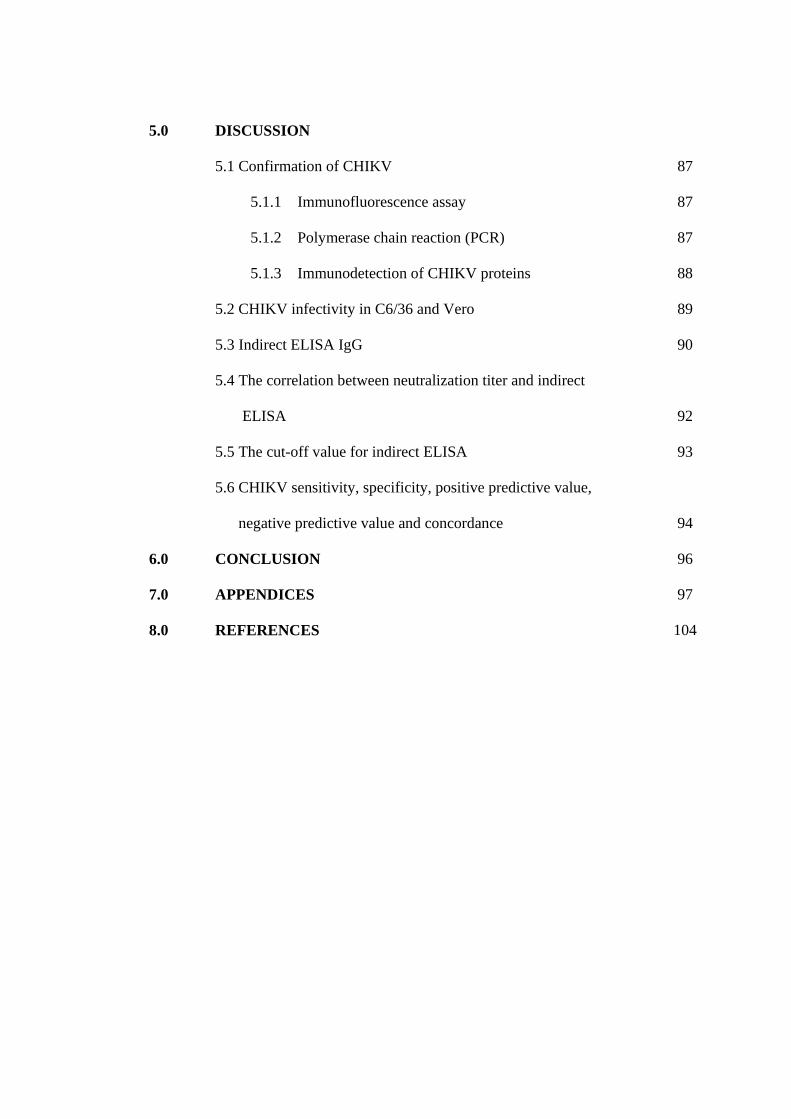
5.0 DISCUSSION
5.1 Confirmation of CHIKV 87
5.1.1 Immunofluorescence assay 87
5.1.2 Polymerase chain reaction (PCR) 87
5.1.3 Immunodetection of CHIKV proteins 88
5.2 CHIKV infectivity in C6/36 and Vero 89
5.3 Indirect ELISA IgG 90
5.4 The correlation between neutralization titer and indirect
ELISA 92
5.5 The cut-off value for indirect ELISA 93
5.6 CHIKV sensitivity, specificity, positive predictive value,
negative predictive value and concordance 94
6.0 CONCLUSION 96
7.0 APPENDICES 97
8.0 REFERENCES 104
i
ACKNOWLEDGEMENT
I would like to show my utmost appreciation to all those who have made this research
project a dream come true. First of all allow me to express my deepest gratitude to
Associate Professor Dr. Jamal I-Ching Sam and Dr Chan Yoke Fun, my supervisors who
offered me an opportunity to research about Chikungunya virus. I would also like to thank
my co-supervisor Professor Dr. Sazaly Abu Bakar. I am extremely in debt for their
patience with me and for all the support and guidance they have offered me effortlessly,
and for that I thank them dearly.
I would also like to express my appreciation for all the SAB lab members for their patience
with me and also for all the helping hands that they never fail to lend. Apart from that, I
would also like to thank the UMMC virology diagnostic laboratory staff namely, Miss
Hooi, Miss Cheng Lan, Miss Amalina and many others for their countless assistance.
There are a few very special people who have also stood by me throughout the entire
research project offering support and helping hands such as Chan Shie Yien and Loong
Shih Keng.
Last but not least I would like to thank my family for their constant understanding and
support, which have pulled me up many times when I was down.
ii
LIST OF FIGURES
Page
Figure 1 Reported Chikungunya cases in 2008 and 2009 5
Figure 2 Cases tested for CHIKV in UMMC 6
Figure 3 Reported CHIKV cases in Bagan Panchor, 2006 7
Figure 4 Aedes albopictus 8
Figure 5 Aedes aegypti 9
Figure 6 Cutaway view of the mosquito showing steps in the
replication and transmission of an arbovirus
9
Figure 7 Alphavirus genome and its products 11
Figure 8 Laboratory diagnosis of Chikungunya 13
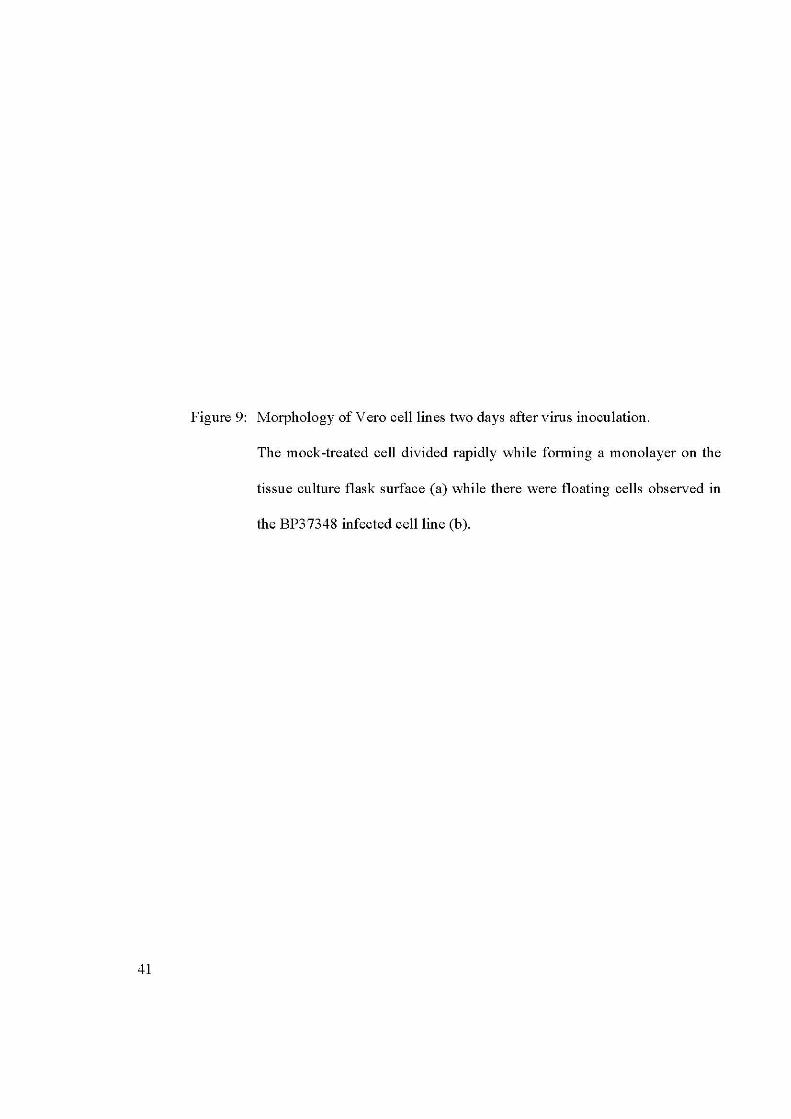
Figure 9 Morphology of Vero cell lines two days after virus
inoculation
42
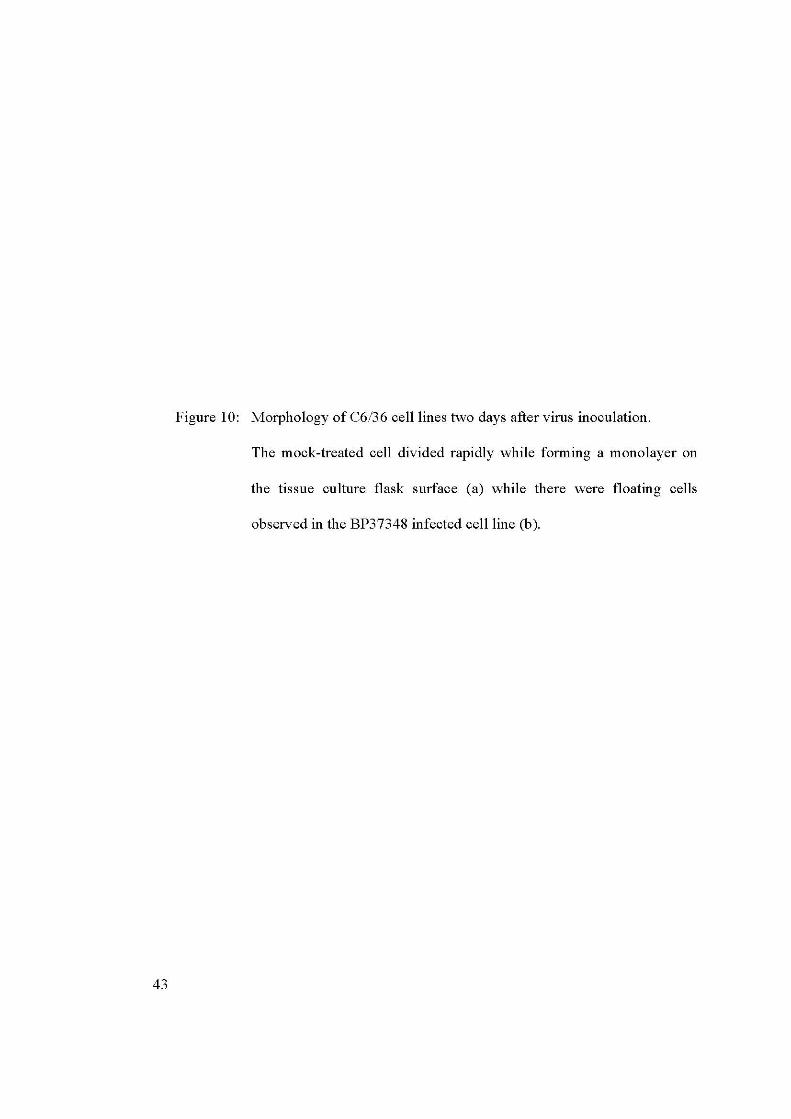
Figure 10 Morphology of C6/36 cell lines three days after virus
inoculation
44
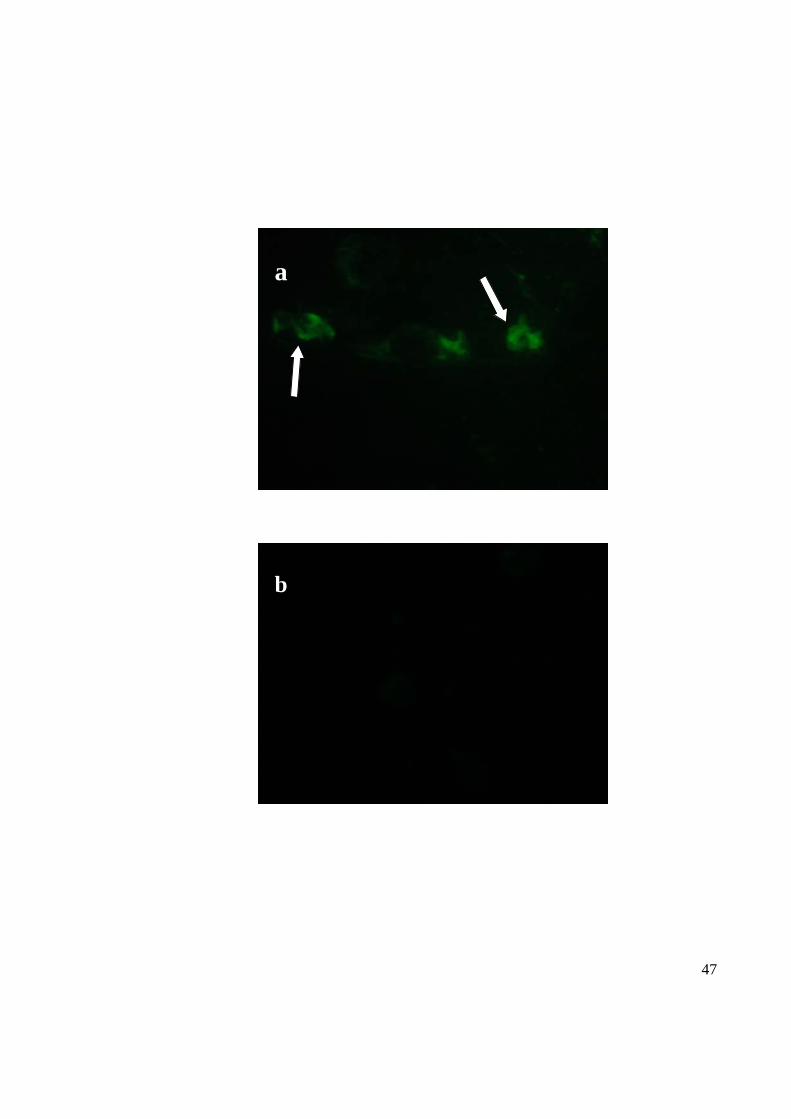
Figure 11 Confirmation of CHIKV infectivity in Vero cells
using immunofluorescence staining
47
Figure 12 Confirmation of CHIKV virus from the RNA
extracted from CHIKV virus-infected cells
50
iii
Page
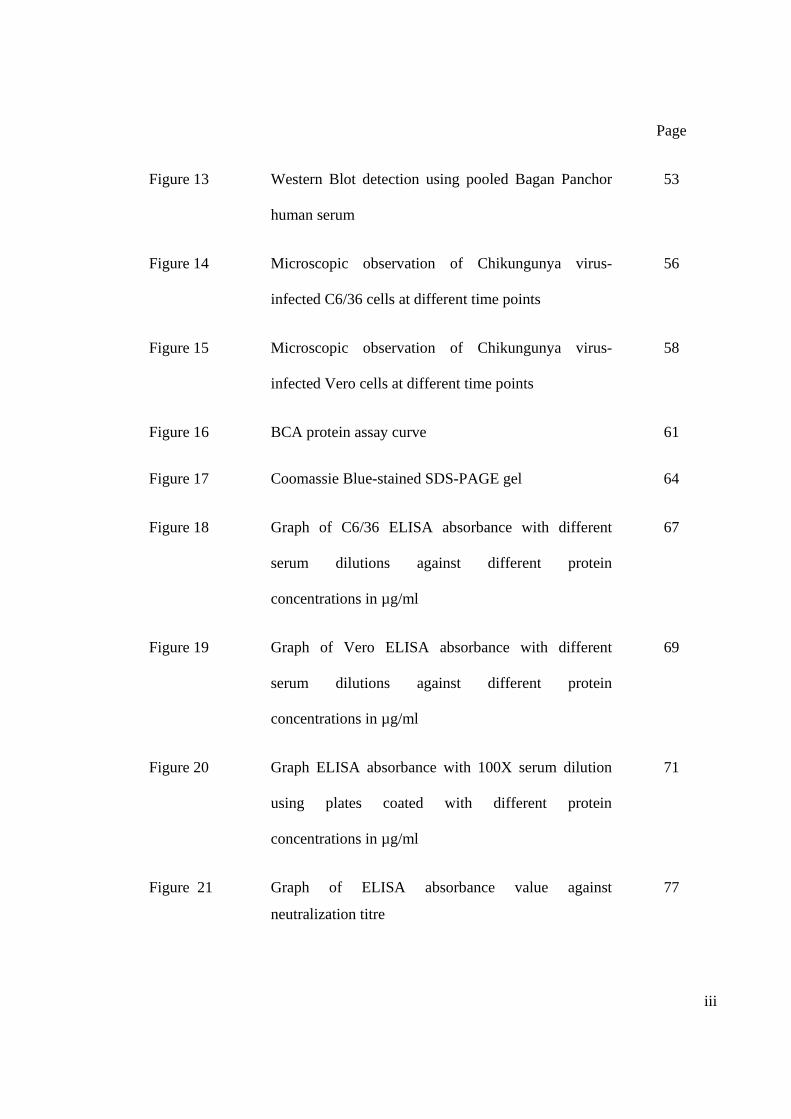
Figure 13 Western Blot detection using pooled Bagan Panchor
human serum
53
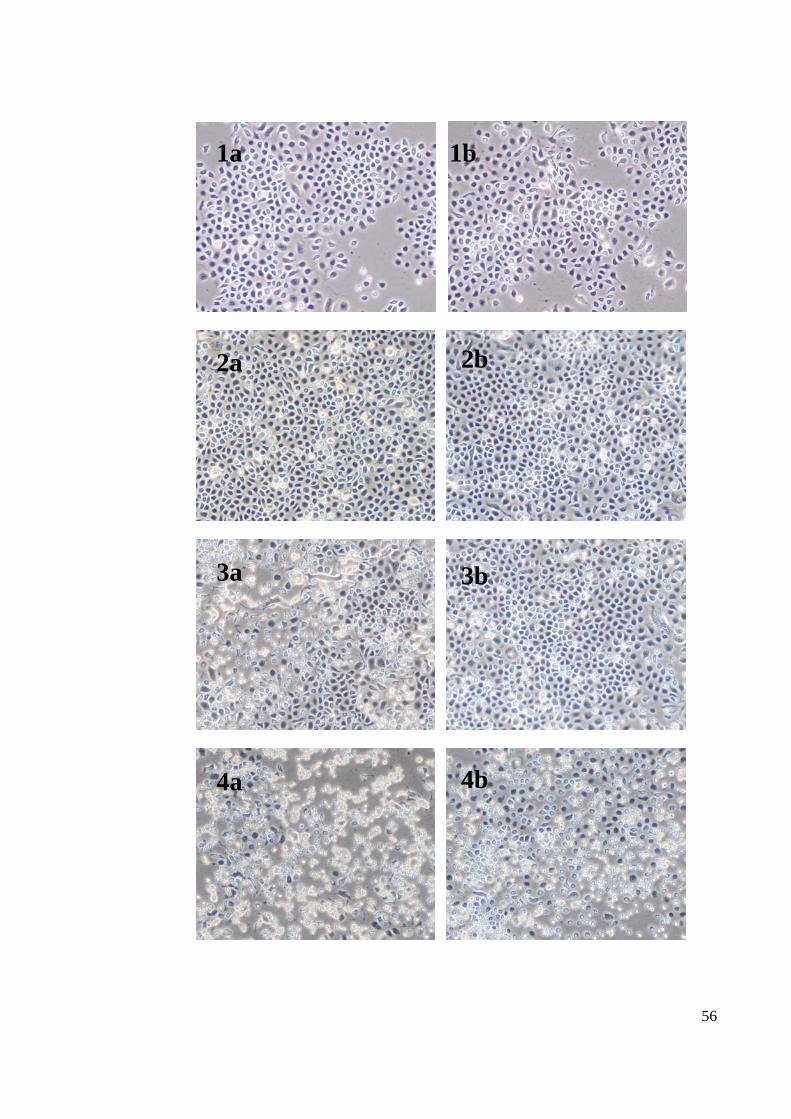
Figure 14 Microscopic observation of Chikungunya virus-
infected C6/36 cells at different time points
56
Figure 15 Microscopic observation of Chikungunya virus-
infected Vero cells at different time points
58
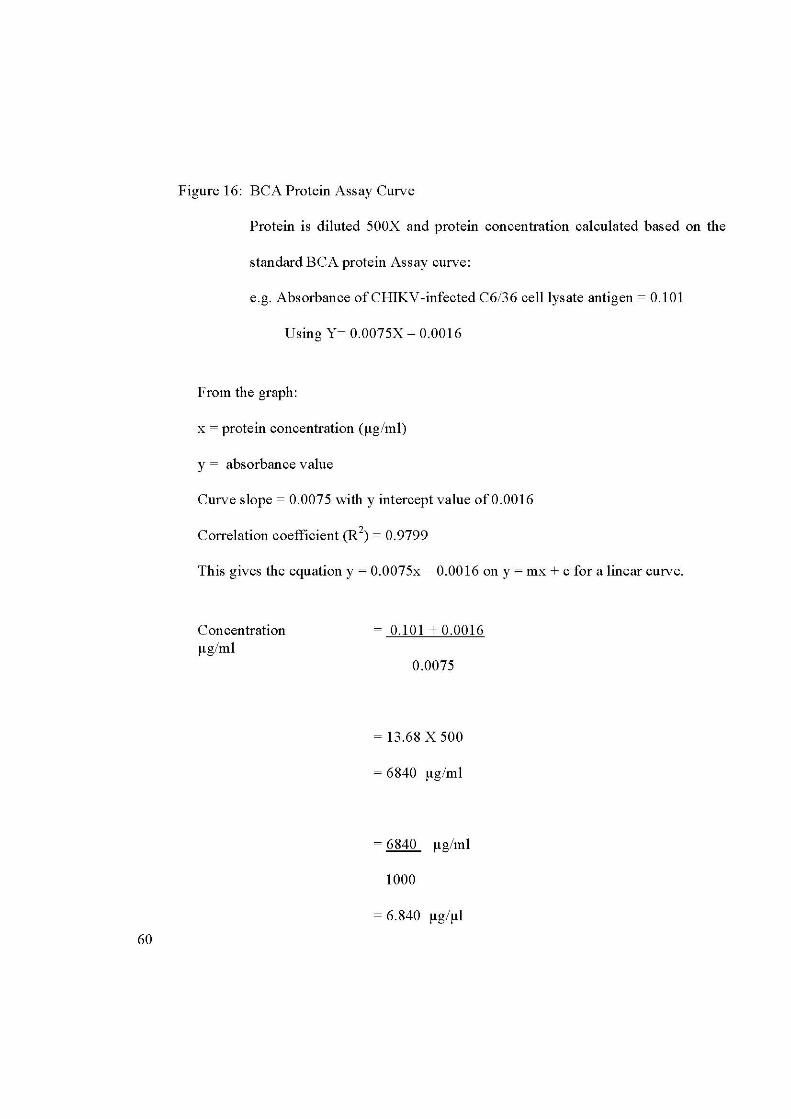
Figure 16 BCA protein assay curve 61
Figure 17 Coomassie Blue-stained SDS-PAGE gel 64
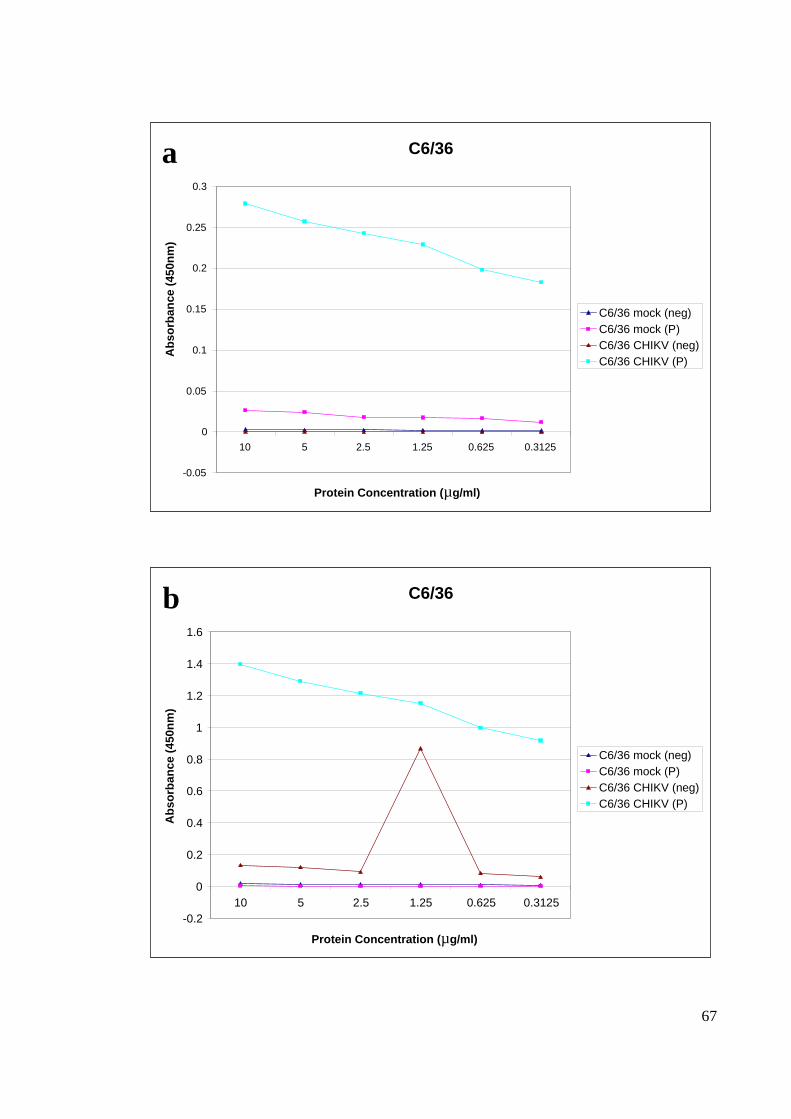
Figure 18 Graph of C6/36 ELISA absorbance with different
serum dilutions against different protein
concentrations in µg/ml
67
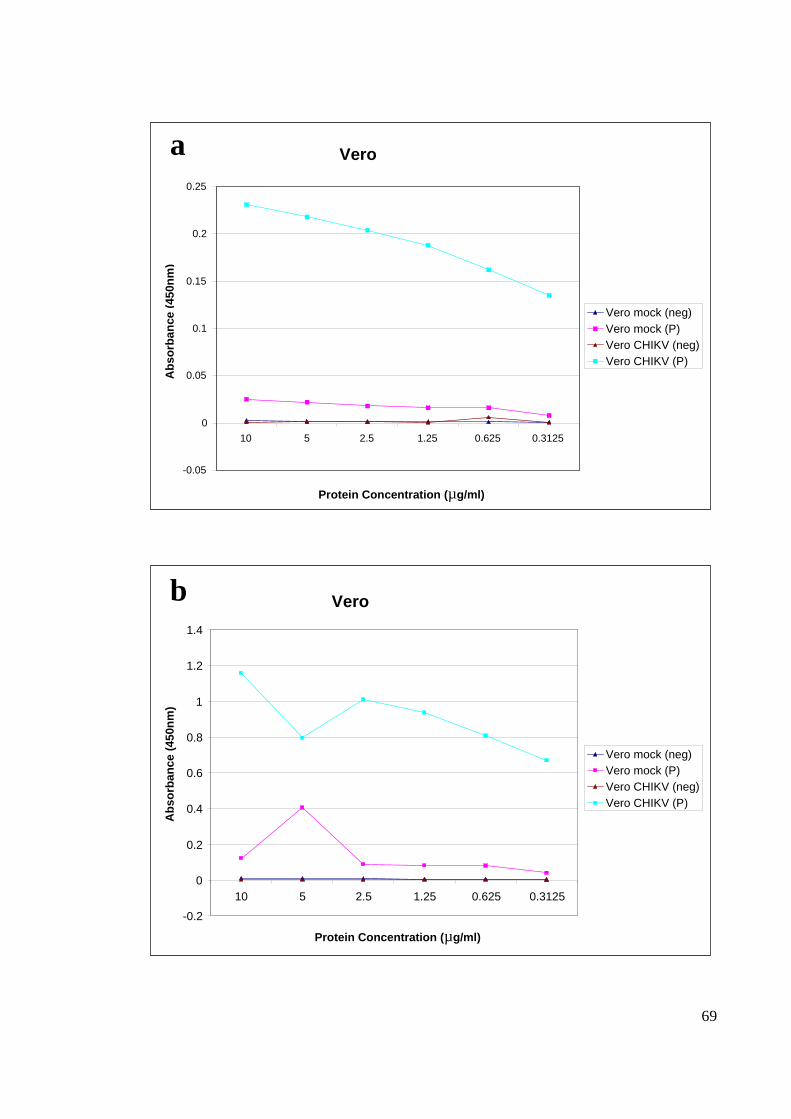
Figure 19 Graph of Vero ELISA absorbance with different
serum dilutions against different protein
concentrations in µg/ml
69
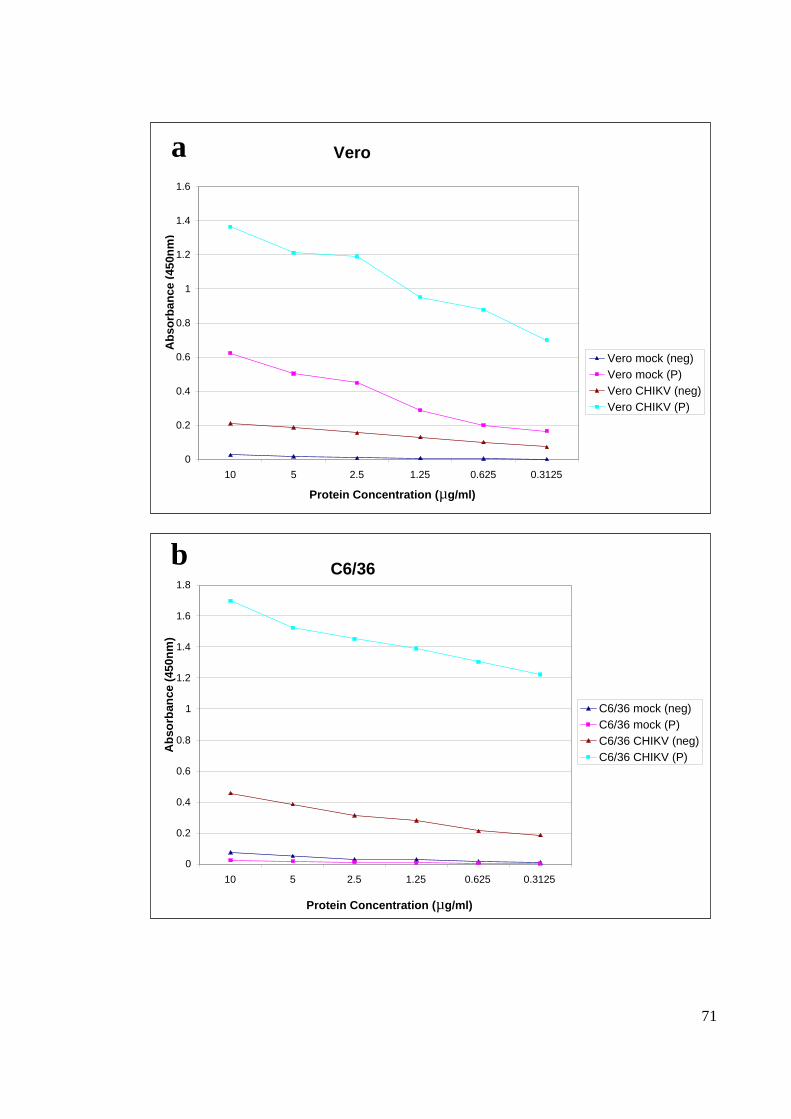
Figure 20 Graph ELISA absorbance with 100X serum dilution
using plates coated with different protein
concentrations in µg/ml
71
Figure 21 Graph of ELISA absorbance value against
neutralization titre
77
iv
LIST OF TABLES
Page
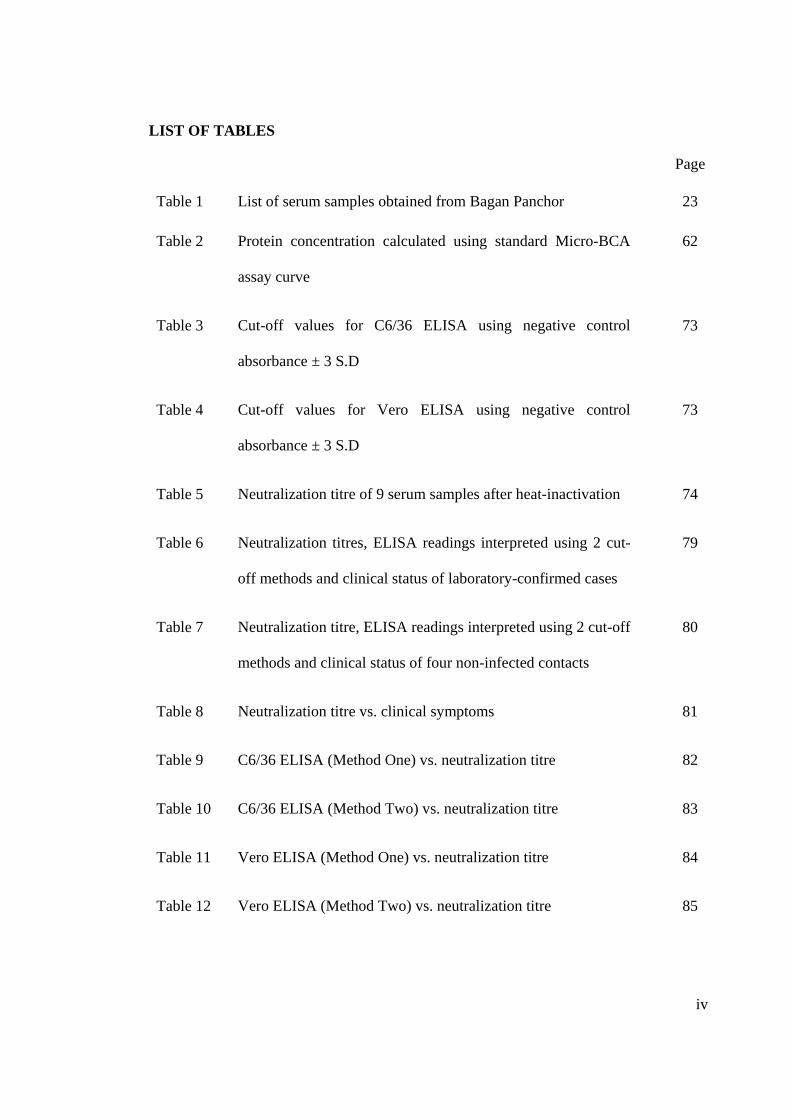
Table 1 List of serum samples obtained from Bagan Panchor 23
Table 2 Protein concentration calculated using standard Micro-BCA
assay curve
62
Table 3 Cut-off values for C6/36 ELISA using negative control
absorbance ± 3 S.D
73
Table 4 Cut-off values for Vero ELISA using negative control
absorbance ± 3 S.D
73
Table 5 Neutralization titre of 9 serum samples after heat-inactivation 74
Table 6 Neutralization titres, ELISA readings interpreted using 2 cut-
off methods and clinical status of laboratory-confirmed cases
79
Table 7 Neutralization titre, ELISA readings interpreted using 2 cut-off
methods and clinical status of four non-infected contacts
80
Table 8 Neutralization titre vs. clinical symptoms 81
Table 9 C6/36 ELISA (Method One) vs. neutralization titre 82
Table 10 C6/36 ELISA (Method Two) vs. neutralization titre 83
Table 11 Vero ELISA (Method One) vs. neutralization titre 84
Table 12 Vero ELISA (Method Two) vs. neutralization titre 85
v
Page
Table 13 Summary of sensitivity, specificity, positive predictive value,
negative predictive value and concordance rates of clinical
symptoms, Vero and C6/36 ELISA using both cut-off methods
against neutralization assay as the gold standard.
86
vi
ABBREVIATIONS BSA bovine serum albumin
CHAPS 3-([3-cholamidopropyl]dimethylammonio)-1-propanesulfonate
CHIKV Chikungunya virus
CPE Cytopathic effect
C6/36 Aedes albopictus mosquito gut cells
C6/36 CHIKV CHIKV-infected C6/36 cells lysate antigen
C6/36 ELISA ELISA using CHIKV-infected C6/36 cells lysate antigen
C6/36 Mock Mock-infected C6/36 cells lysate antigen
DAB 3,3’-Diaminobenzidine
EDTA Ethylene diamine tetracetic acid
ELISA Enzyme-linked immunosorbent assay
EMEM Eagle’s minimum essential medium
FBS Foetal bovine serum
FITC Fluorescein isothiocyanate
HRP Horseradish peroxidase
IF Immunofluorescence assay
IgG Immunoglobulin G
IgM Immunoglobulin M
LD Lethal dose
NEAA Non-essential amino acid
NPV Negative predictive value
nsP Non-structural protein
OD Optical density
vii
OPD o-phenyl amine
ORF Open reading frame
PBS Phosphate buffer saline
PCR Polymerase chain reaction
PPV Positive predictive value
RNA Ribonucleic acid
RT-PCR Reverse-transcriptase polymerase chain reaction
SD Standard deviation
SDS-PAGE Sodium dodecyl sulphate polyacrylamide gel
TCID Tissue culture infecting dose
UMMC University Malaya Medical Center
Vero African green monkey kidney cells
Vero CHIKV CHIKV-infected Vero cells lysate antigen
Vero ELISA ELISA using CHIKV-infected Vero cells lysate antigen
Vero Mock Mock-infected Vero cells lysate antigen
1
1.0 ABSTRACT Chikungunya virus (CHIKV) is a RNA virus that belongs to the Alphavirus genus of the
family Togaviridae. It is transmitted by Aedes albopictus and Aedes aegypti, and causes
clinical symptoms like fever with acute fever, skin rash and athralgia which mimics
dengue fever. With current outbreaks of CHIKV in Malaysia, it is essential to develop a
serological assay as a tool for laboratory diagnosis and seroprevalence study. An IgG
indirect ELISA was developed and used to validate nine samples collected from Bagan
Panchor residents one year after an outbreak occurred in 2006. A variety of factors like
varying cell culture types (C6/36 and Vero) to prepare the virus lysate antigen, different
serum dilutions and the cut-off value determination methods were studied to optimize an
IgG indirect ELISA assay. Neutralization assay was used as the gold standard. The IgG
indirect ELISA using CHIKV-infected Vero cell lysate antigen performed better
compared to CHIKV-infected C6/36 cell lysate antigen. The developed assay had a
sensitivity of 100%, poor specificity of 25%, positive predictive value of 62.5%, negative
predictive value of 100%, and concordance of 66.7%, compared to neutralization. The
poor specificity and non-specific background readings are likely due to the crude total
cell lysate used in the assay. Western blot identified the capsid protein as the
immunogenic protein, which maybe used as a CHIKV recombinant antigen for further
development of a more specific ELISA assay.
2
2.0 INTRODUCTION Chikungunya (CHIKV) is an infectious viral disease transmitted by Aedes mosquitoes.
First isolated from the serum of febrile humans in Tanganyika (Tanzania) in 1953, the
word “Chikungunya”, which is used for both the virus and the disease means “to walk bent
over” in the African dialect Makonde, reflecting the severe joint pains that are an element
of the disease (Pialoux et al., 2007). Since then, CHIKV has caused many well-reported
outbreaks and epidemics in both African and Asian countries, namely India, Indonesia,
Malaysia and Thailand involving millions of people (Powers and Logue, 2007).
CHIKV disease epidemics are distinguished by sporadic outbreaks with disappearance
which may last from a few years to a few decades (Mohan, 2006). Since the first recorded
CHIKV epidemic, which occurred in Tanzania in 1952-1953, human CHIKV infection has
been documented in Asia with an outbreak in Bangkok in 1958, which was followed by
outbreaks in countries such as Burma, Thailand, Cambodia, Vietnam, India, Sri Lanka and
the Philippines. CHIKV also occurred in many parts of Africa. In India, the virus was first
isolated in Calcutta in 1963 with many other reports soon after. Between the years 2001-
2003 a re-emergence of CHIKV outbreak in Indonesia was documented almost 20 years
after the first documented case between 1950s to the 1960s (Sourisseau et al., 2007). It was
observed that in both Africa and Asia, the re-emergence was erratic with intervals of 7-8
years to 20 years between consecutive epidemics (Schuffenecker et al., 2006).
CHIKV caused a large outbreak in the Indian Ocean starting at the end of 2004. It is
presumed that the CHIKV epidemic in the Indian Ocean region started first in Kenya,
before it reached Comoros between January and March 2005 with more than 5000 reported

3
cases. Then CHIKV spread to other islands namely Seychelles in March 2005, followed by
Mauritius. Finally in March till April 2005 CHIKV reached Réunion Island with a
population of 760,000 and about 266,000 cases had been diagnosed (Schuffenecker et al.,
2006). CHIKV then spread to India where, since December 2005 it is estimated that more
than 1,400,000 cases have occurred (Pialoux et al., 2007). By the beginning of 2007, the
contagion was on the decline in La Réunion and Seychelles but it seems to have been
reported to be continuing in areas of India. Strict mosquito-control actions in 2006
ameliorated the epidemics on the Indian Ocean islands, but the spread of the same strain of
CHIKV to India confirms that the virus is not easy to contain (Panning et al., 2009).
Four known outbreaks have occurred in Malaysia, the first was between December 1998
and February 1999 when more than 51 people in Port Klang were infected with CHIKV
(Lam et al., 2001). CHIKV recently re-emerged in Malaysia after seven years of non
detection. From March through April 2006, a second outbreak of CHIKV infection was
reported in Bagan Panchor, an isolated coastal town in Perak, in which at least 200
villagers were infected with no deaths reported. Genomic sequences of the recovered
isolates of the second outbreak were highly similar to those of the previous 1998 outbreak
in Port Klang (AbuBakar et al., 2007).
The clinical manifestations of the two previous outbreaks are considered classical. These
two outbreaks were due to CHIKV virus of Asian genotype. There were also reports of a
third outbreak in Ipoh between December 2006 and January 2007. The third outbreak
however involved two areas of the suburb of Ipoh City within the Kinta district, whereby
around thirty seven people were affected in the main outbreak area, and another two
4
patients were affected in the secondary outbreak area. Based on the molecular study
conducted, it was confirmed that the CHIKV that caused the Kinta outbreak was of the
Central or East African genotype, which occurred for the first time in Malaysia (Noridah et
al., 2007). A fourth outbreak was reported in Johor in April 2008 with almost 2000 cases.
CHIKV outbreak then eventually spread to different parts of Peninsula Malaysia with
effected areas such as Melaka, Selangor, Perak and Pahang involving over 8920 cases to
date (Malaysia Ministry of Health, 2009; Sam et al., 2009). The number of reported cases
declined in 2009 but persisting outbreaks continuing in several states.
5
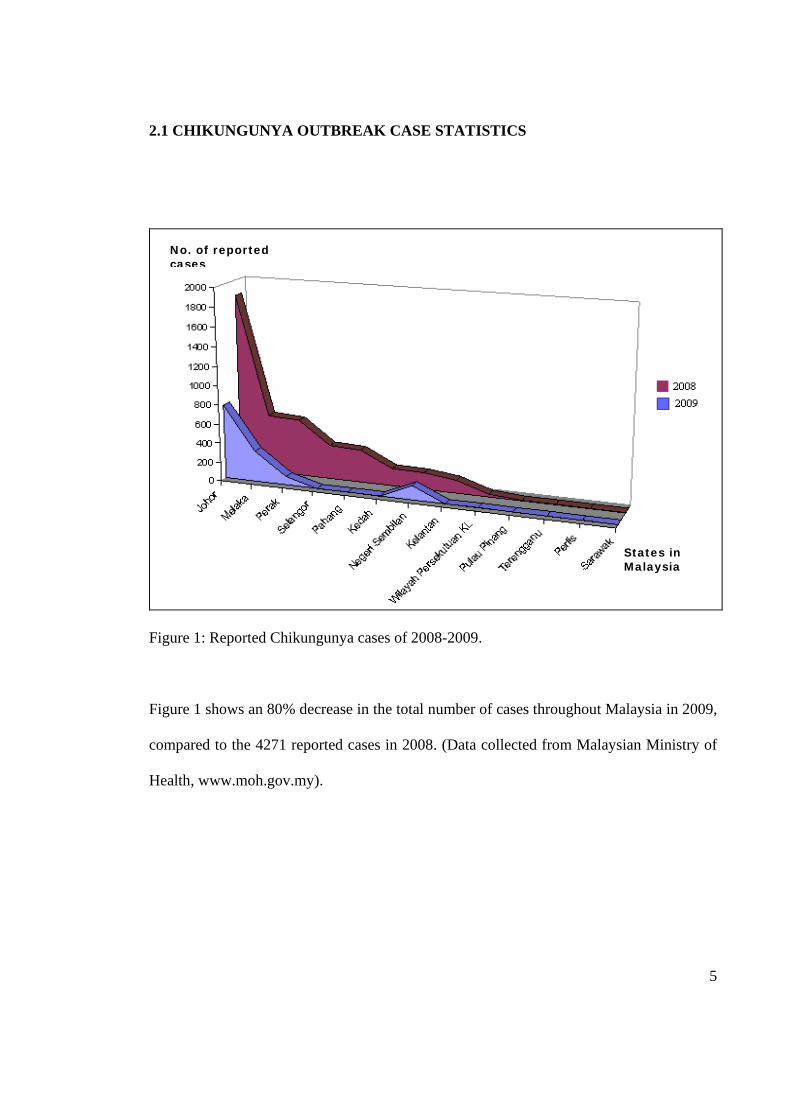
2.1 CHIKUNGUNYA OUTBREAK CASE STATISTICS
Figure 1: Reported Chikungunya cases of 2008-2009.
Figure 1 shows an 80% decrease in the total number of cases throughout Malaysia in 2009,
compared to the 4271 reported cases in 2008. (Data collected from Malaysian Ministry of
Health, www.moh.gov.my).
No. of reported cases
States in Malaysia
6
0
5
10
15
20
25
30
35
40
Hosp TAR (1999) RUKA (1999) Sporadic Cases(1999-2004)
BP (2006)
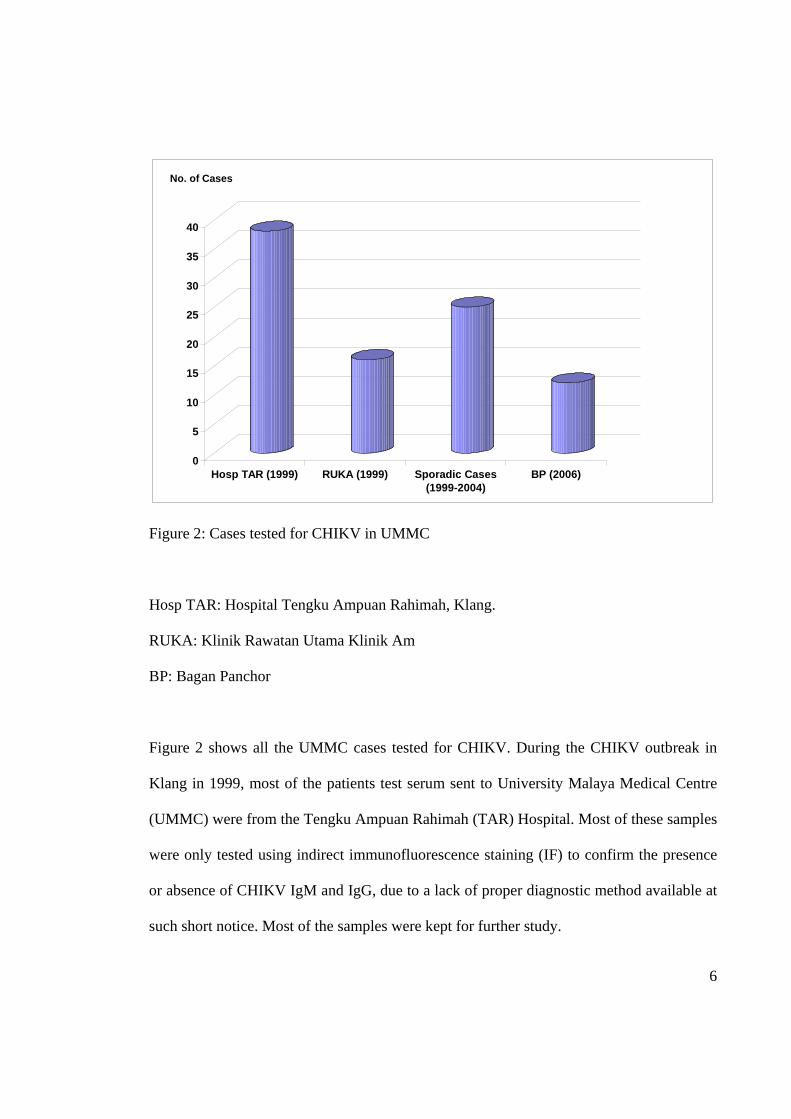
Figure 2: Cases tested for CHIKV in UMMC
Hosp TAR: Hospital Tengku Ampuan Rahimah, Klang.
RUKA: Klinik Rawatan Utama Klinik Am
BP: Bagan Panchor
Figure 2 shows all the UMMC cases tested for CHIKV. During the CHIKV outbreak in
Klang in 1999, most of the patients test serum sent to University Malaya Medical Centre
(UMMC) were from the Tengku Ampuan Rahimah (TAR) Hospital. Most of these samples
were only tested using indirect immunofluorescence staining (IF) to confirm the presence
or absence of CHIKV IgM and IgG, due to a lack of proper diagnostic method available at
such short notice. Most of the samples were kept for further study.
No. of Cases
7
Apart from the samples sent from TAR Hospital in Klang, samples sent in 1999 also
included samples obtained from patients from Rawatan Utama Klinik Am or also known as
Primary Care Clinic in UMMC. There were also some sporadic cases seen between 2000
and 2004 involving patients seen at UMMC and local private hospitals. However it is still
uncertain as to how and why CHIKV has the ability to disappear and then re-emerge some
time later. During the 2006 outbreak in Bagan Panchor about 10 serum samples were sent
to UMMC by the Perak state health authorities for further analysis.
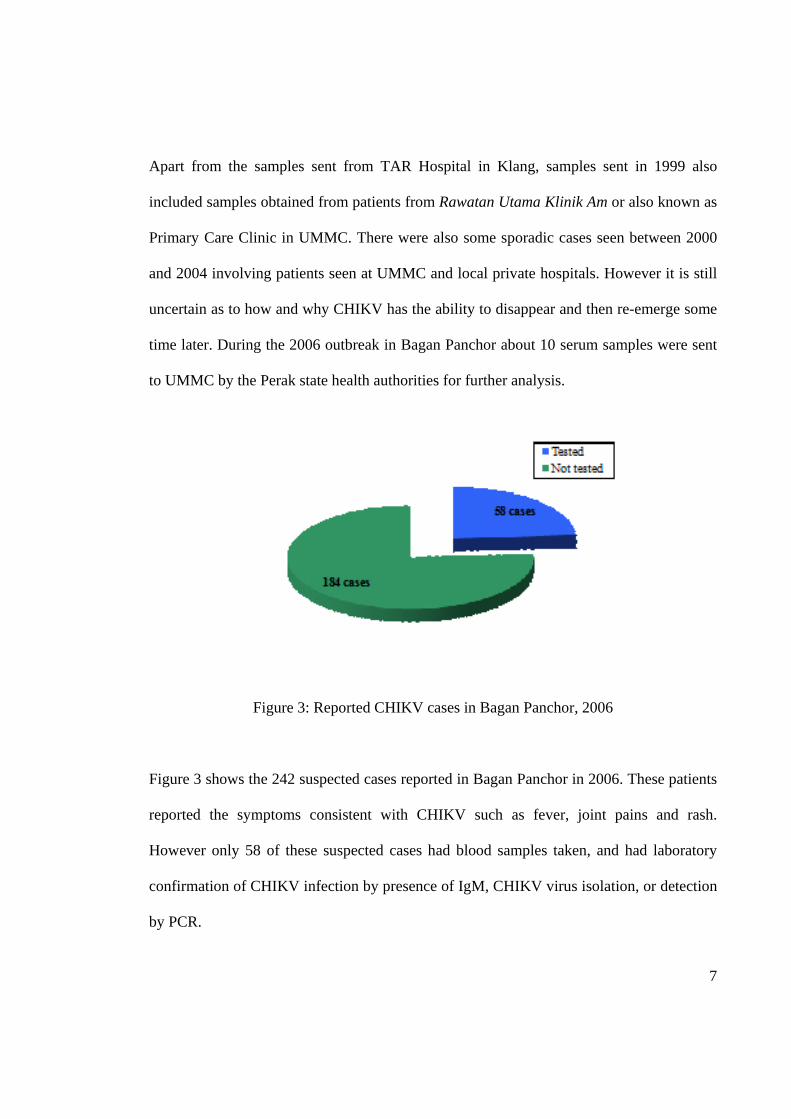
Figure 3: Reported CHIKV cases in Bagan Panchor, 2006
Figure 3 shows the 242 suspected cases reported in Bagan Panchor in 2006. These patients
reported the symptoms consistent with CHIKV such as fever, joint pains and rash.
However only 58 of these suspected cases had blood samples taken, and had laboratory
confirmation of CHIKV infection by presence of IgM, CHIKV virus isolation, or detection
by PCR.
8
2.2 VIROLOGY OF CHIKUNGUNYA VIRUS
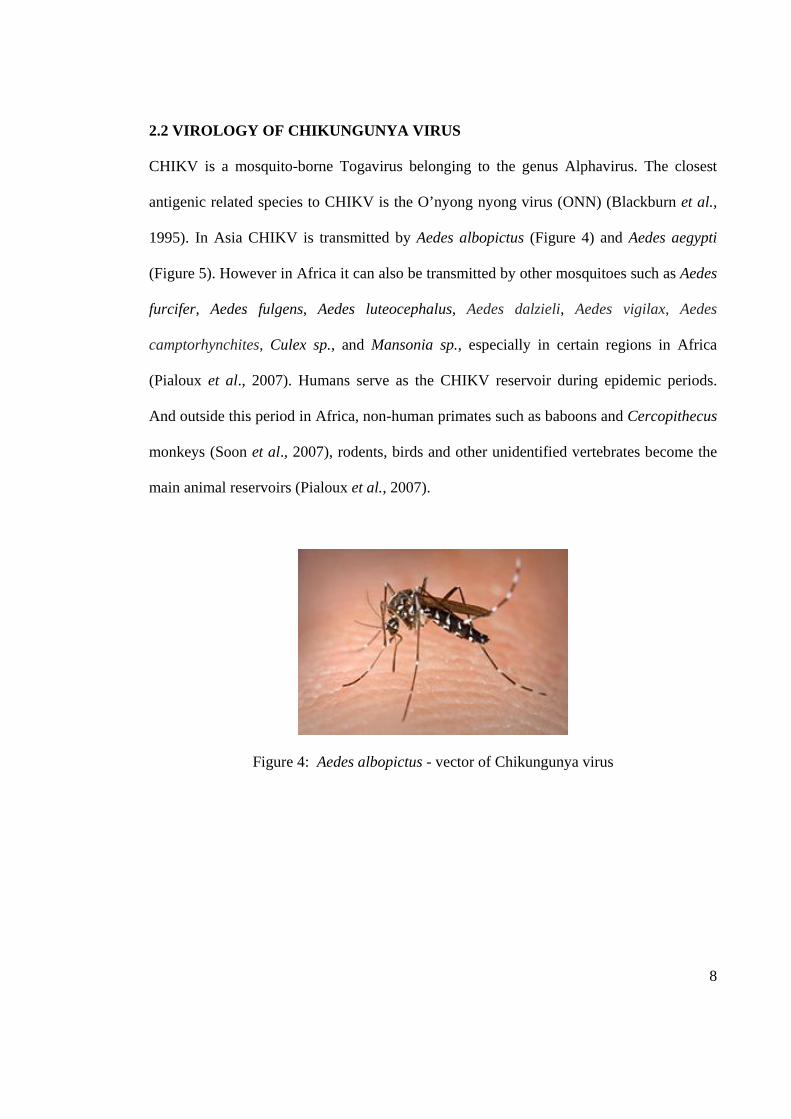
CHIKV is a mosquito-borne Togavirus belonging to the genus Alphavirus. The closest
antigenic related species to CHIKV is the O’nyong nyong virus (ONN) (Blackburn et al.,
1995). In Asia CHIKV is transmitted by Aedes albopictus (Figure 4) and Aedes aegypti
(Figure 5). However in Africa it can also be transmitted by other mosquitoes such as Aedes
furcifer, Aedes fulgens, Aedes luteocephalus, Aedes dalzieli, Aedes vigilax, Aedes
camptorhynchites, Culex sp., and Mansonia sp., especially in certain regions in Africa
(Pialoux et al., 2007). Humans serve as the CHIKV reservoir during epidemic periods.
And outside this period in Africa, non-human primates such as baboons and Cercopithecus
monkeys (Soon et al., 2007), rodents, birds and other unidentified vertebrates become the
main animal reservoirs (Pialoux et al., 2007).
Figure 4: Aedes albopictus - vector of Chikungunya virus
9
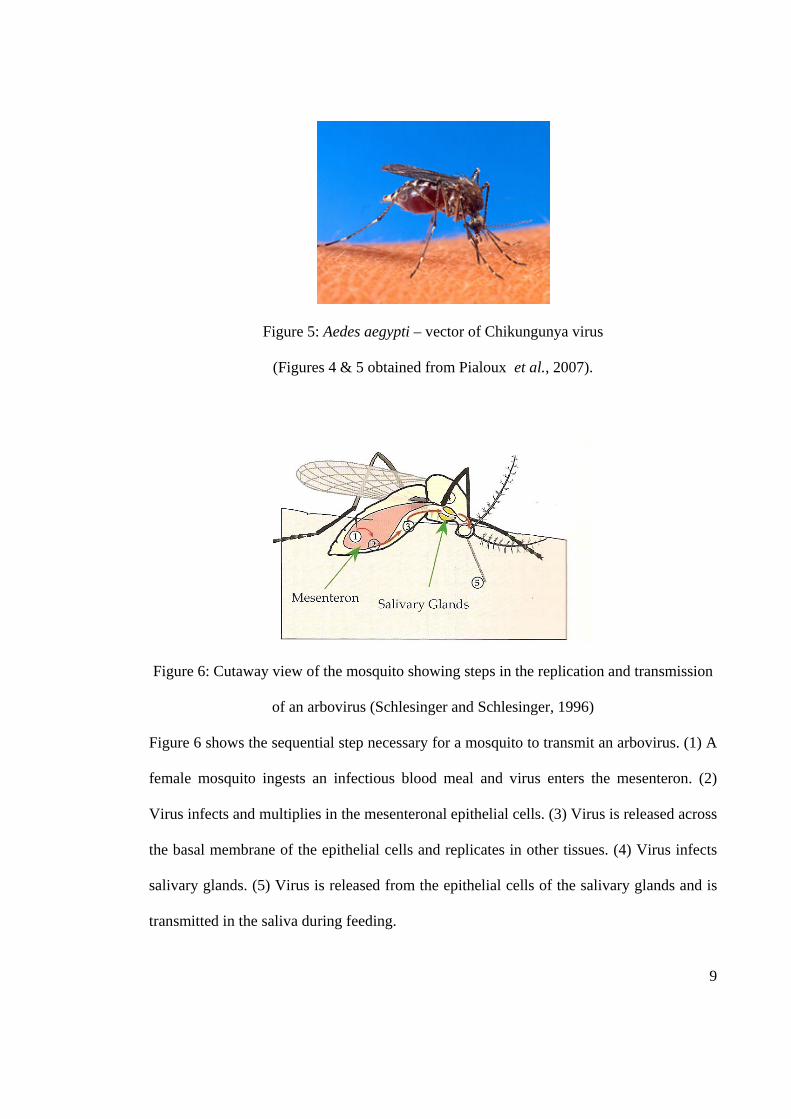
Figure 5: Aedes aegypti – vector of Chikungunya virus
(Figures 4 & 5 obtained from Pialoux et al., 2007).
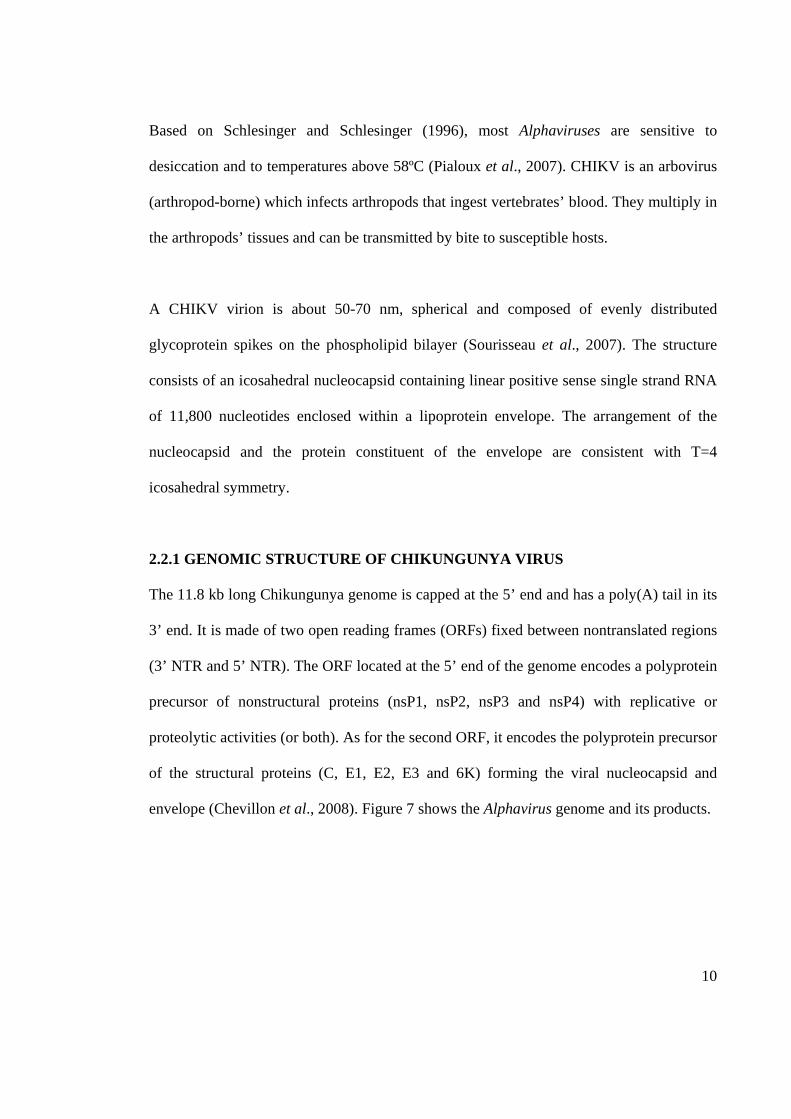
Figure 6: Cutaway view of the mosquito showing steps in the replication and transmission
of an arbovirus (Schlesinger and Schlesinger, 1996)
Figure 6 shows the sequential step necessary for a mosquito to transmit an arbovirus. (1) A
female mosquito ingests an infectious blood meal and virus enters the mesenteron. (2)
Virus infects and multiplies in the mesenteronal epithelial cells. (3) Virus is released across
the basal membrane of the epithelial cells and replicates in other tissues. (4) Virus infects
salivary glands. (5) Virus is released from the epithelial cells of the salivary glands and is
transmitted in the saliva during feeding.
10
Based on Schlesinger and Schlesinger (1996), most Alphaviruses are sensitive to
desiccation and to temperatures above 58ºC (Pialoux et al., 2007). CHIKV is an arbovirus
(arthropod-borne) which infects arthropods that ingest vertebrates’ blood. They multiply in
the arthropods’ tissues and can be transmitted by bite to susceptible hosts.
A CHIKV virion is about 50-70 nm, spherical and composed of evenly distributed
glycoprotein spikes on the phospholipid bilayer (Sourisseau et al., 2007). The structure
consists of an icosahedral nucleocapsid containing linear positive sense single strand RNA
of 11,800 nucleotides enclosed within a lipoprotein envelope. The arrangement of the
nucleocapsid and the protein constituent of the envelope are consistent with T=4
icosahedral symmetry.
2.2.1 GENOMIC STRUCTURE OF CHIKUNGUNYA VIRUS
The 11.8 kb long Chikungunya genome is capped at the 5’ end and has a poly(A) tail in its
3’ end. It is made of two open reading frames (ORFs) fixed between nontranslated regions
(3’ NTR and 5’ NTR). The ORF located at the 5’ end of the genome encodes a polyprotein
precursor of nonstructural proteins (nsP1, nsP2, nsP3 and nsP4) with replicative or
proteolytic activities (or both). As for the second ORF, it encodes the polyprotein precursor
of the structural proteins (C, E1, E2, E3 and 6K) forming the viral nucleocapsid and
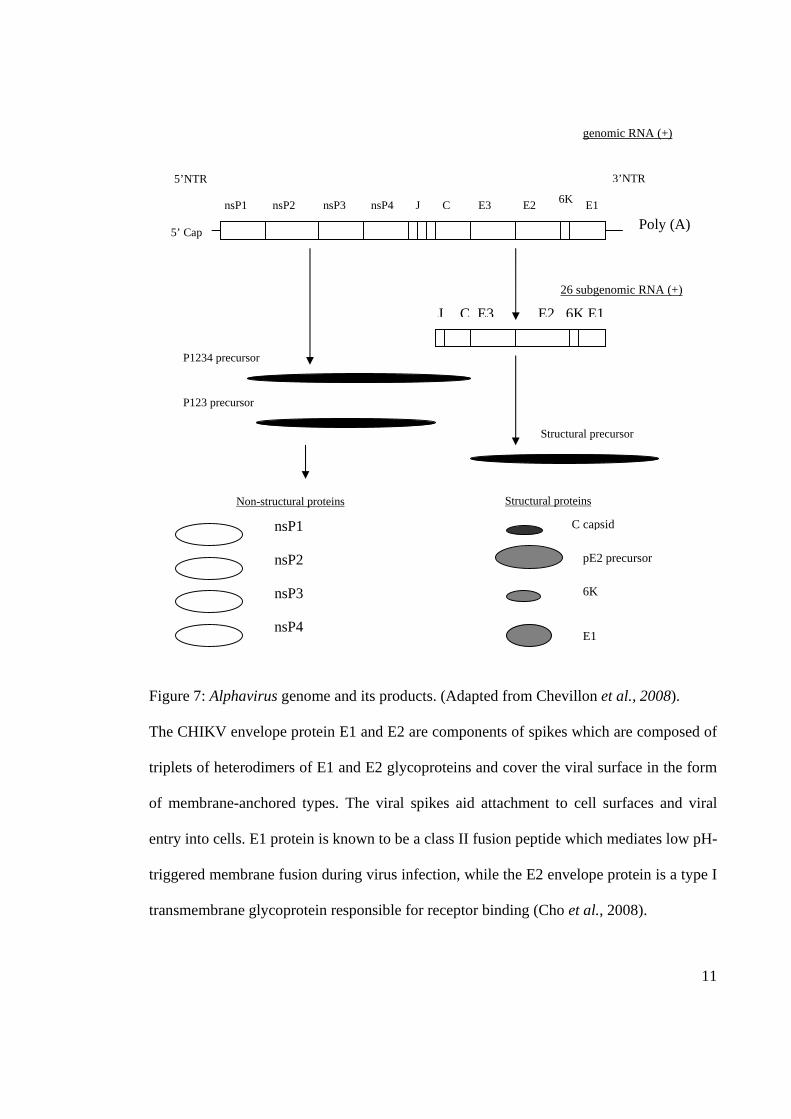
envelope (Chevillon et al., 2008). Figure 7 shows the Alphavirus genome and its products.
11
Figure 7: Alphavirus genome and its products. (Adapted from Chevillon et al., 2008).
The CHIKV envelope protein E1 and E2 are components of spikes which are composed of
triplets of heterodimers of E1 and E2 glycoproteins and cover the viral surface in the form
of membrane-anchored types. The viral spikes aid attachment to cell surfaces and viral
entry into cells. E1 protein is known to be a class II fusion peptide which mediates low pH-
triggered membrane fusion during virus infection, while the E2 envelope protein is a type I
transmembrane glycoprotein responsible for receptor binding (Cho et al., 2008).
nsP1 nsP2 nsP3 nsP4 J C E3 E2 6K E1
5’ Cap
5’NTR 3’NTR
P1234 precursor
P123 precursor Structural precursor
Structural proteins
Poly (A)
genomic RNA (+)
26 subgenomic RNA (+)
J C E3 E2 6K E1
C capsid
pE2 precursor
6K
E1
Non-structural proteins
nsP4
nsP2
nsP3
nsP1
12
2.3 CLINICAL MANIFESTATIONS OF CHIKV
CHIKV is serologically and genetically closely related to O’nyong nyong, Igbo Ora and to
some extent Mayaro and Ross River viruses, all of which are associated with acute
epidemic polyarthalgia (Lanciotti et al., 2007).
Following a bite from an infectious mosquito, there is an incubation period lasting 2-4 days
on average (Pialoux et al., 2007). CHIKV causes an abrupt onset of fever, headache,
nausea, vomiting, myalgia, skin rash, incapacitating arthralgia and occasional frank
arthritis. The articular symptoms resolve within days to a few weeks, but in some severe
cases joint pain and stiffness can last for months (Porter et al., 2004).
The clinical symptoms of CHIKV infection often imitate those of dengue fever, and since
CHIKV virus is present in the regions where dengue virus is endemic, it is possible that
many cases of CHIKV infection have been misdiagnosed as dengue and that CHIKV
infection could be much more common than reported (Powers et al., 2000).
CHIKV also results in complications including respiratory failure, cardiovascular
decompensation, meningoencephalitis, severe acute hepatitis and kidney failure. More than
half (53%) of serious cases involved patients above 65 years of age and more than one
third (35%) died due to CHIKV (Renault et al., 2007).
13
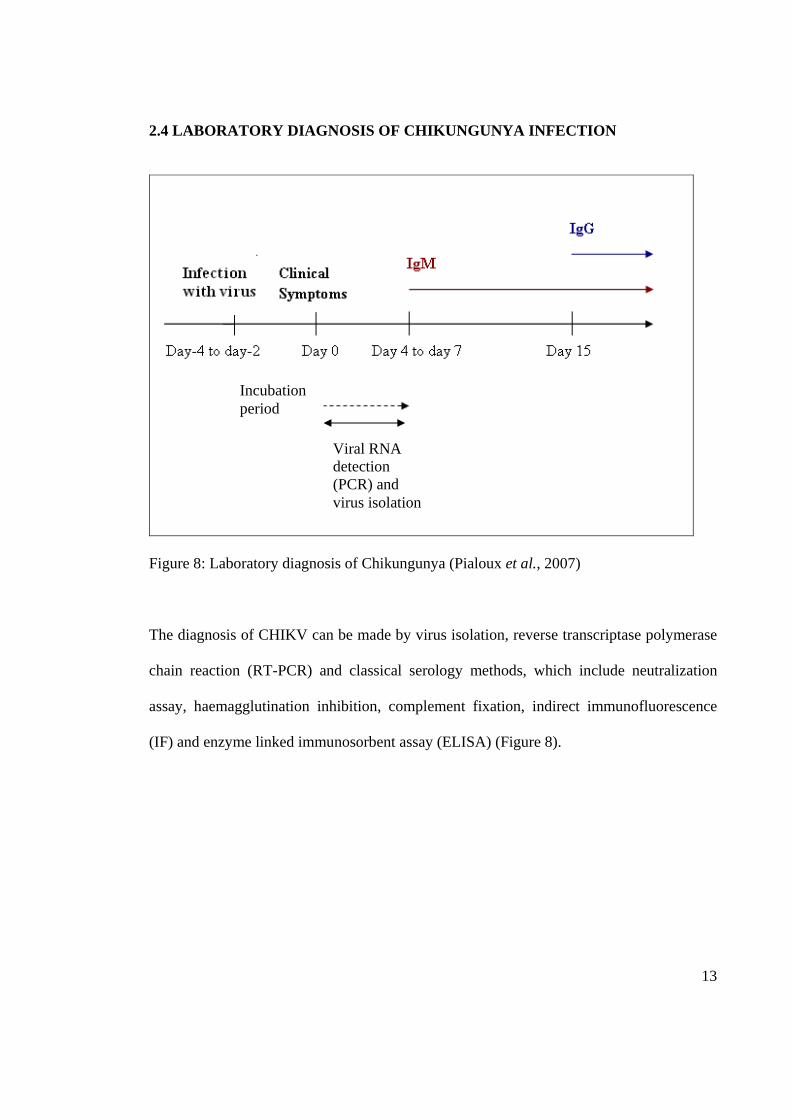
2.4 LABORATORY DIAGNOSIS OF CHIKUNGUNYA INFECTION
Figure 8: Laboratory diagnosis of Chikungunya (Pialoux et al., 2007)
The diagnosis of CHIKV can be made by virus isolation, reverse transcriptase polymerase
chain reaction (RT-PCR) and classical serology methods, which include neutralization
assay, haemagglutination inhibition, complement fixation, indirect immunofluorescence
(IF) and enzyme linked immunosorbent assay (ELISA) (Figure 8).
Viral RNA detection (PCR) and virus isolation
Incubation period
14
2.4.1 VIRUS ISOLATION
Considered the gold standard for diagnosis, CHIKV virus isolation is based on inoculation
of mosquito cell cultures, mosquitoes, mammalian cell cultures or mice. Commonly used
cell lines for isolating CHIKV include Vero (African green monkey kidney cells) and
C6/36 (Aedes albopictus mosquito gut cells). Successful cell culture results in cytopathic
effect (CPE). CPE is the morphological or the degenerative changes host cells go through
due to the growth of infecting virus. This may not be visible until three to four days of
incubation, and further passaging may be required. Nevertheless cell culture is still an
important method to harvest CHIKV virus for further study. Identification of CHIKV virus
can then be confirmed by indirect IF with specific antisera, or by PCR, but IF is more
subjective (Panning et al., 2009).
2.4.2 POLYMERASE CHAIN REACTION
Polymerase chain reaction (PCR) is used widely in molecular biology. After extraction
and purification, a DNA polymerase is used to amplify a piece of DNA using in vitro
enzymatic replication. The original DNA molecule or molecules are replicated by the DNA
polymerase enzyme thus doubling the number of DNA molecules copied. Then each of the
copied molecules will replicate in a second cycle of replication resulting in four times the
number of the original molecule. This continual cycle of replication is known as a “chain
reaction” in which the original DNA molecule is exponentially amplified. However to
amplify, isolate and identify a known sequence of RNA, reverse transcriptase is required to
generate the complementary cDNA strand from the RNA sample. Reverse transcriptase
PCR or RT-PCR is widely used in many different applications such as expression
profiling, expression of genes or to identify the sequences of an RNA transcript. Being a
15
single stranded RNA virus, CHIKV RNA is amplified to construct cDNA for further
analysis (Powers et al., 2000). The PCR products were analyzed by performing gel
electrophoresis with ethidium bromide-stained agarose gel.
Although CHIKV virus analysis based on virus isolation is considered as the gold
standard, it requires time and sensitivity and depends on many factors such as quality of
maintenance of cell culture. RT-PCR is the most sensitive technique for mRNA detection
and quantification (Rohani et al., 2005).
2.4.3 SEROLOGICAL TECHNIQUES
Serology is the scientific method of study involving the use of blood serum mainly.
However there are studies involving the use of other bodily fluids such as semen or saliva.
It is utilized as means of diagnostic identification or detection of the presence of antibodies
in response to other foreign proteins or one’s own proteins. There are a few known
serological techniques most frequently used such as enzyme linked immunosorbent assay
(ELISA), haemagglutination, precipitation, complement-fixation and immunofluorescence
assay. A classic serological algorithm involves testing acute and convalescent serum
specimens for immunoglobulin M (IgM) and IgG antibody, followed by a neutralization
test. Virus isolation and RT-PCR are commonly used with early acute-phase specimens
(before day 7) before appearance of IgM (Lanciotti et al., 2007).

16
(a) ENZYME LINKED IMMUNOSORBENT ASSAY
Enzyme linked immunosorbent assay (ELISA) is an immunological technique for the
detection of the presence of an antibody or antigen in a sample. There are a few different
types of ELISA such as indirect ELISA, sandwich ELISA and competitive ELISA, the
choice of which depends on the aims of the assay. In indirect ELISA for CHIKV
antibodies, CHIKV antigen is coated onto a surface of a microtitre plate, followed by
addition of the serum to be tested. A secondary anti-human antibody bound to an enzyme
is then added, which will allow binding with the presence of the right antibody. When a
substrate is added, the linked enzyme catalyses detectable colour change, allowing the
measurement of the primary antibodies using an ELISA microplate reader.
Many serological tests like indirect IF assay, plaque reduction neutralization test,
hemagglutination-inhibition test and complement fixation test are technically demanding,
making them complicated to apply reproducibly and are often poor measures of early
antibody IgM. Furthermore, performing these tests might take several days and requires
paired serum samples or live cell culture. Virus isolation is hardly ever a viable option
even in epidemic situations, due to inadequately timed specimens and large numbers of
specimens (Martin et al., 2000). IgM capture enzymed linked immunosorbent assay
(MAC-ELISA) was designed to detect IgM antibody, which is a valuable tool for quick
diagnosis of acute viral infection. It appears early in infection and rises rapidly in the
disease course and is usually less virus cross-reactive than IgG. Indirect ELISA however
is a very sensitive, reliable, and widely-used method for identifying the presence of IgG
antibodies of many infectious diseases that are present long after an infection, making it
easier to work with.
17
(b) INDIRECT IMMUNOFLUORESCENCE ASSAY
IF is a technique, commonly used to visualize the subcellular distribution of biomolecules
of interest. It is the labeling of antibodies with fluorescent dyes. The immunofluorescent-
labelled tissue or cultures are then analyzed using a fluorescence microscope or a confocal
microscope. Although IF is useful for serological diagnosis of many viruses and bacteria,
this method is cumbersome, laborious, subjective and requires a trained microscopist
equipped with an expensive microscope (Lao et al., 2004).
(c) NEUTRALIZATION ASSAY
Neutralization of a virus is defined as the loss of infectivity through reaction of the virus
with specific antibody. Virus and serum are mixed under suitable conditions and then
inoculated into cell culture, eggs or animals depending on the virus. The presence of non-
neutralized virus may be detected by reactions such as CPE,
haemadsorption/haemagglutination, plaque formation or as disease in animals. The loss of
infectivity is bought about by interference by the bound antibody with any one of the steps
leading to the release of the viral genome into the host cells (Wu et al., 2004). There are
two types of neutralization which are reversible neutralization and stable neutralization.
Reversible neutralization is when the process can be reversed by diluting the antibody-
antigen mixture within a short time of the formation of the antibody-antigen complexes. It
is thought that reversible neutralization is due to the interference with attachment of virions
to the cellular receptors which requires the saturation of the surface of the virus with
antibodies. Stable neutralization is when the antibody-antigen complexes become more
stable with time and it is irreversible by dilution.
18
Stable neutralization has a different mechanism to that of reversible neutralization. It has
been shown that neutralized virus can attach and that already attached virions can be
neutralized. The number of antibody molecules required for stable neutralization is
considerably smaller than that of reversible neutralization. Kinetic evidence shows that
even a single antibody molecule can neutralize a virion. Such neutralization is generally
produced by antibody molecules that establish contact with 2 antigenic sites on different
monomers of a virion, greatly increasing the stability of the complexes. An example of
stable neutralization is the neutralization of polioviruses, whereby, the attachment of the
antibody to the viral capsid stabilizes the capsid and inhibits the uncoating and release of
viral nucleic acid (Hanon and Mayhew, 1970).
Viral evolution must tend to select for mutations that change the antigenic determinants
involved in neutralization. In contrast, other antigenic sites would tend to remain
unchanged because mutations affecting them would not be selected for and could even be
detrimental. Because of its high immunological specificity, the neutralization test is often
the standard against which the specificity of the other serological techniques is evaluated.
To proceed with the neutralization protocol, known components that are to be used must be
standardized. To identify a virus isolate, a known pre-titred antiserum is used. Conversely,
to measure the antibody response of an individual to a virus, a known pre-titred virus is
used. To titrate a known virus, serial tenfold dilutions of the isolate are prepared and
inoculated into a susceptible host system such as cell culture or animal. The virus endpoint
titre is the reciprocal of the highest dilution of virus that infects 50% of the host system eg.
50% of cell cultures develop CPE, or 50% of animals develop disease. This endpoint
19
dilution contains one 50% tissue culture infecting dose (TCID50) or one 50% lethal dose
(LD50) of virus per unit volume. The concentration of virus generally used in the
neutralization test is 100 TCID50 or 100 LD50 per unit volume (Hanon and Mayhew, 1970).
The antiserum is titrated in the neutralization test against its homologous virus. Serial
twofold dilutions of serum are prepared and mixed with an equal volume containing
100TCID50 of virus. The virus and serum mixtures are incubated for 1 hour at 37°C. The
time and temperature for incubation varies with different viruses. The mixtures are then
inoculated into a susceptible host system. The endpoint titration contains one antibody unit
and is the reciprocal of the highest dilution of the antiserum protecting against the virus.
Generally 20 antibody units of antiserum are used in the neutralization tests (Wu et al.,
2004).
2.4.4 COMPARISON BETWEEN PCR, ELISA AND NEUTRALIZATION ASSAY
RT-PCR is the most sensitive for detection of CHIKV during the initial viraemic phase,
which is between day zero to day seven (Rohani et al., 2005; Pialoux et al., 2007). PCR is
less useful in the later stages, due to the patient’s antibody production and clearance of
viraemia. PCR is also an expensive method to work with especially as a rapid and regular
technique, since the equipment used such as the thermal cycler and gel electrophoresis
system are expensive. Viral culture is also less useful outside the viraemic phase, as the
presence of antibody prevents the virus isolation. Culture is also labour-intensive and
technically demanding.
20
IgM antibodies are detectable after about 4-5 days and persist for up to three months. IgG
antibodies are detectable in convalescent sera and persist for years. Thus it is easier to
retrospectively identify infected patients from known outbreaks even from the earlier 1999
Klang outbreak to the current 2006 Bagan Panchor outbreak, which is not possible with
PCR or isolation methods. ELISA is rapid and sensitive (after the viraemic phase), and can
be introduced as an in–house diagnostic method to detect CHIKV IgM or IgG. Apart from
this ELISA is a method that is relatively easily conducted even with large numbers of
samples. ELISA can be automated and is not subjective unlike certain methods like
indirect IF (Wu et al., 2004).
Neutralization test is also used to measure the antibody response of an individual to a
CHIKV virus. Because of its high immunologic specificity, the neutralization test is often
the standard against which other serologic procedures are evaluated. As neutralization is
technically difficult, it is not used as a routine diagnostic method.
The main reason neutralization assay was chosen as a gold standard was due to its ability
to detect biologically active antibodies. It is the most specific method for detection of
virus-specific neutralizing antibodies. Before beginning the neutralization assay, it is
important to determine the effect of a single variable of interest within the particular
system, a scientific control is used to minimize the unintended influence of other variables
on the same system. Therefore, positive controls confirm that the procedure is effective,
thus minimizing false negatives, and negative controls confirm that the procedure is not
observing an unrelated effect, thus minimizing false positives. Therefore Bagan Panchor
patients’ sera which was IF negative were pooled and used as the negative control, while
21
the CHIKV confirmed patients’ sera was used as positive control. Pearson's correlation is
used to find a correlation between at least two continuous variables. The value for a
Pearson's can fall between 0 (no correlation) and 1 (perfect correlation). Other factors such
as group size will determine if the correlation is significant. Generally, correlations above
0.8 are considered good. The correlation between the neutralization assay titres and ELISA
optical density readings was measured and recorded.
22
2.5 OBJECTIVES
The main objective of this research is to develop a serological assay to detect IgG
antibodies against CHIKV.
Specific aims:
1. To examine the kinetics of CHIKV propagation at different time points in
different cell lines.
2. To perform neutralization assay for use as gold standard for CHIKV IgG indirect
ELISA.
3. To develop a serological ELISA assay to detect IgG antibodies against CHIKV.
23
3.0 MATERIALS AND METHODS
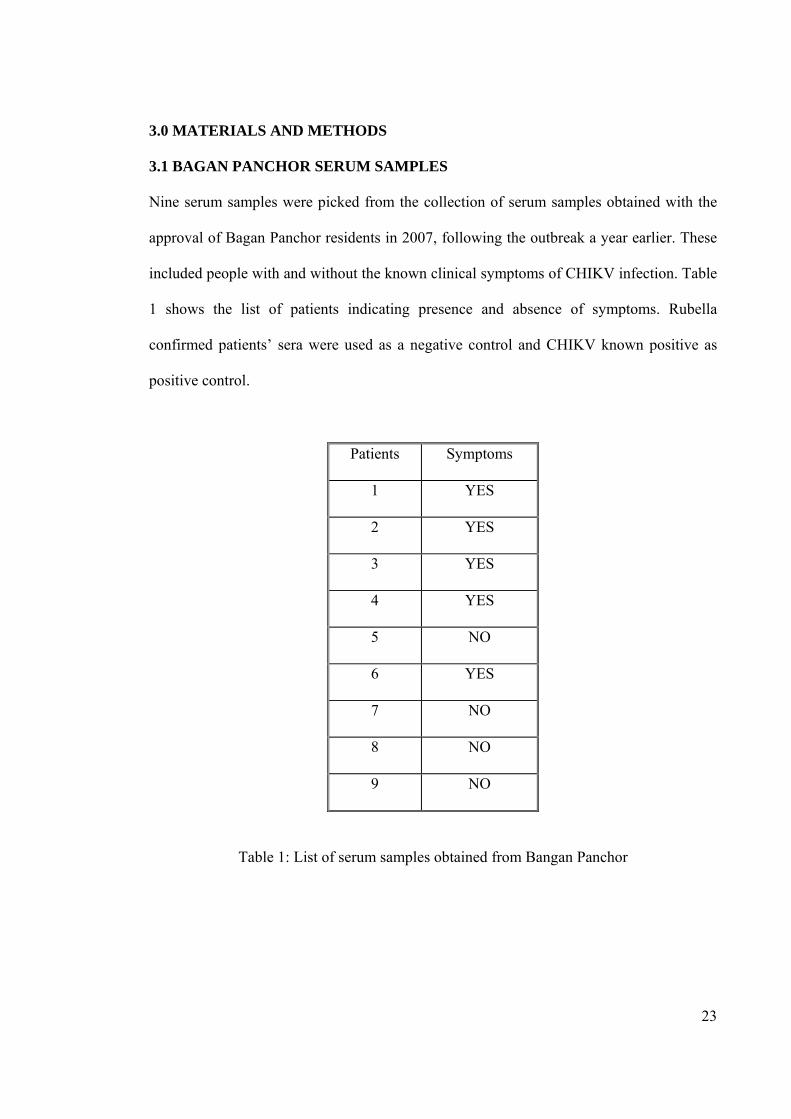
3.1 BAGAN PANCHOR SERUM SAMPLES
Nine serum samples were picked from the collection of serum samples obtained with the
approval of Bagan Panchor residents in 2007, following the outbreak a year earlier. These
included people with and without the known clinical symptoms of CHIKV infection. Table
1 shows the list of patients indicating presence and absence of symptoms. Rubella
confirmed patients’ sera were used as a negative control and CHIKV known positive as
positive control.
Patients Symptoms
1 YES
2 YES
3 YES
4 YES
5 NO
6 YES
7 NO
8 NO
9 NO
Table 1: List of serum samples obtained from Bangan Panchor
24
3.2 VIRUS ISOLATE
The virus isolate chosen for the present study (MY/0306/BP37348) was from the Bagan
Panchor outbreak in 2006, and was provided by University of Malaya Medical Center
(UMMC) Diagnostic Virology Laboratory. It has been subcultured more than 20 times.
3.3 CELL CULTURE
Vero (African green monkey kidney) cells and C6/36 (Aedes albopictus mosquito) cells
were used for the propagation of the CHIKV. These cells were grown in monolayers in 75
cm2 tissue culture flasks (Corning, USA) with 1X Eagle’s Minimum Essential Medium
(EMEM, from Flowlab, Australia) supplemented with 10% heat inactivated foetal bovine
serum (FBS, from Flowlab, Australia). The Vero cells were incubated at 37˚C in a 5% CO2
incubator, and C6/36 cells were incubated at 28˚C in a 5% CO2 incubator. These cells were
monitored on a daily basis for healthy growth.
3.4 VIRUS PROPAGATION
Healthy Vero and C6/36 cells growth were maintained up to 70% confluence in 75 cm2
tissue culture flasks before inoculation of the CHIKV. As the initial step, the medium in
the tissue culture flask was discarded before inoculation of the virus. 50μl of CHIKV viral
stock were used as the inoculum for each 75 cm2 tissue culture flask. This was followed by
gently rocking of the tissue culture flask for one hour. After an hour, the virus inoculum
was removed and 10 ml of maintenance medium (2% FBS, 1X EMEM) was added into
each of the infected flasks. These flasks of infected Vero cells and C6/36 cells were later
incubated at their respective incubating temperatures and carefully monitored daily for
CPE before considered ready for harvest. The harvesting time points are at 0 hour, 24
hours, 48 hours, and 72 hours.
25
3.5 VIRUS HARVESTING
Once there was 70-80% CPE in the Vero and C6/36 cells, CHIKV was harvested by
centrifuging the virus suspension at 40,000 x g for 30 minutes to remove the cell debris.
Once centrifuged, the virus supernatant was sterile filtered using 0.20 µm syringe filter,
and then used as virus inoculum for other procedures.
As a control, mock-infected cells for both Vero and C6/36 cells were prepared by replacing
the viral inoculum with equal volume of maintenance medium. These mock-infected cells
were incubated at their respective temperatures and processed together with the infected
cells.
26
3.6 CONFIRMATION OF CHIKV INFECTION
3.6.1 MICROSCOPIC OBSERVATION
CHIKV infected Vero and C6/36 cells were observed regularly using an inverted
microscope (Nikon, Japan) for their CPE. Pictures were taken on a daily basis to compare
between infected and uninfected cells and their distribution of infectivity in relation to
incubation day.
3.6.2 IMMUNOFLUORESCENCE STAINING
As a confirmatory assay to detect the presence of CHIKV infection IF staining and reverse
transcriptase polymerase chain reaction (PCR) were performed. The Vero and C6/36 cells,
CHIKV-infected and mock-infected, were harvested once there was 70-80% CPE. These
cell suspensions were washed with phosphate buffer saline (PBS) three times before being
coated onto a glass slide precoated with poly-L-lysine. These slides were air-dried for
several minutes then fixed with acetone for 15 minutes and kept in 4˚C for later use.
Using a known CHIKV IgG-positive patient serum as primary antibody, presence of
CHIKV antigen was detected. The serum was diluted 1:400 in PBS and 10 μl of the
diluted serum were added onto each coated well. These slides were then incubated in a
moist chamber at 37˚C for 30 minutes. The slides were then washed with PBS for 10
minutes several times. Subsequently the slides were incubated with 10μl of rabbit
polyclonal anti-human IgG conjugated with fluorescein isothiocyanate (FITC) at 37˚C in a
moist chamber for 30 minutes. These slides were then washed with PBS for 10 minutes
several times, followed by a wash in milli-Q water for 10 minutes. The slides were then
air-dried and observed under an UV microscope (Zeiss, Germany).
27
3.6.3 REVERSE TRANSCRIPTASE POLYMERASE CHAIN REACTION (RT-
PCR)
3.6.3 (a) RNA EXTRACTION OF CHIKV-INFECTED VERO CELLS
The CHIKV-infected cells were harvested once 70-80% CPE was reached. Cells were
scraped and the cell suspension was transferred into a 15ml Falcon tube which was then
centrifuged at 800 x g for 10 minutes. The cell pellet was then lysed with 1 ml of TRI
REAGENT (Molecular Research Center Inc., USA)
It was then homogenized in the TRI REAGENT by 5 minutes incubation at room
temperature. 200 µl chloroform was then added into each tube and mixed vigorously. The
mixture was further incubated at room temperature for 15 minutes followed by 15 minutes
centrifugation at 4˚C, at 12000 x g.
The aqueous phase was transferred into a fresh 1.5ml microcentrifuge tube. RQ1 RNase
free DNase (5U/ml TRI REAGENT) was added, mixed and incubated at 37˚C for 30
minutes. The total RNA was then precipitated at room temperature for 10 minutes by
adding 500μl isopropanol. Then the mixture was centrifuged 12000 x g at 4˚C for 10
minutes. The supernatant was discarded and the pellet was washed by mixing the pellet
with ice cold 75% ethanol. The tube was later centrifuged 7500 x g at 4˚C for 5 minutes.
The supernatant was discarded and the pellet was dissolved in nuclease free water. The
extracted total RNA was then incubated at 60˚C for 10 minutes to remove the secondary
structures of RNA. The extracted RNA was kept in -80˚C until use.
28
3.6.3 (b) RT-PCR
Specific primers targeting the nsP1 region (Hasebe et al,. 2002; Schuffenecker et al., 2006)
were utilized for the PCR reaction to confirm the presence of CHIKV RNA in the
extracted total RNA. The RT-PCR was carried out using the Access RT-PCR system
(Promega Corporation, USA) following the manufacturer’s protocol. The reverse
transcription was carried out at 45˚C for 45 minutes followed by 94˚C for 2 minutes for
inactivation of reverse transcriptase and RNA. It then went through 30 cycles of
denaturation at 94˚C for 30 seconds, annealing at 55˚C for 1 minute and extension at 72˚C
for 2 minutes. Then finally the elongation step was carried out at 72˚C for 7 minutes. This
protocol was based on work by Hasebe et al. (2002). The PCR product was then loaded
into 1.5% agarose gel for electrophoresis at 80V for an hour. The gel was then stained
with ethidium bromide (ETBr) and visualized using a digital gel documentation system
(Bio-Rad, Hercules, USA).
29
3.6.4 WESTERN BLOT
3.6.4.1 SODIUM DODECYL SULPHATE POLYACRYLAMIDE GEL (SDS-PAGE)
To proceed with the SDS-PAGE protocol, the Mini-Protean Tetra Cell (Bio-Rad, China)
was cleaned with methanol and tightly assembled to ensure no leakage. A 10% separating
polyacrylamide gel suspension was prepared according to the protocol, which was
carefully mixed and pipetted gently into the casting set. Once at the proper level a layer of
water was introduced to enhance the polymerization of the gel. After polymerization, the
water was discarded, then a layer of 4% stacking polyacrylamide gel was pipetted and
followed by gently securing the comb in place. While waiting for the stacking gel to
polymerize, the samples to be tested were mixed in a 2:1 ratio with the loading dye (SDS
buffer) and boiled for 10 minutes to denature the protein. After complete polymerization,
the comb was gently removed, then the 30µg of the boiled samples and 10 µl of protein
marker were introduced into respective wells. Broad range marker (New England Biolabs,
USA) was utilized for the Coomassie blue staining while prestained marker (New England
Biolabs, USA) was utilized for the Western Blotting. This protein electrophoresis was run
in tank buffer in a gel tray at 160V for one hour.
30
3.6.4.2 SEMI-DRY TRANSFER
The electrophoresed polyacrylamide gel was soaked in the chilled cathode buffer for 20
minutes. The Hybond-P polyvinylidene fluoride membrane was cut to the desired size then
soaked in 100% methanol for 10 seconds. The membrane was washed in water for 5
minutes, then equilibrated in anode buffer (II) for 20 minutes. The filter papers (Bio-Rad,
USA) were also prewetted in chilled cathode buffer, anode buffer (I) and anode buffer (II).
Once ready, the Trans-Blot Semi Dry Transfer Cell (Bio-Rad, USA) was assembled. The
SDS-PAGE gel was stacked in between the filter papers together with the membrane, and
preceded with transfer was carried out using 10V for one hour. After the transfer the
membrane was trimmed to a proper size and marked for better identification. The
transferred membrane was stored at 2-8˚C.
3.6.4.3 IMMUNODETECTION
The blotted membrane was pre-wet in 100% methanol then washed with water for 5
minutes. 5% skimmed milk in 0.1% Tween 20 (Merck, Germany) was added to the
membrane and incubated for one hour at room temperature. It was then washed with PBS
Tween 20 for 5 minutes. Subsequently, the membrane was probed with 100X diluted
serum from seropositive patients which was further diluted in 5% skimmed milk by
incubation for one hour on a shaker. Later, excess serum was washed and bound antibody
was detected by incubation with 1000X diluted rabbit anti-human IgG horseradish
peroxidase (Dako, Sytomation, Denmark) in 5% skimmed milk for an hour.
After that, the secondary antibody conjugated with HRP was added to the membrane and
further incubated for an hour. After further washing, metal enhanced DAB substrate
working solution (Thermo Scientific, USA) was applied according to manufacturer’s
31
instructions and incubated for 5-15 minutes for the colorimetric reaction that produces dark
brown precipitate when horseradish peroxidase enzyme reacts with cobalt chloride and
nickel chloride.
This was followed by a rinse and wash with water for 10 minutes at least three times. Once
completed, metal enhanced DAB substrate was added to the membrane, which was
incubated for 5-15 minutes. The membrane was then twice washed in PBS Tween 20 for
10 minutes. The washed membrane was then blotted dry and viewed for presence of bands,
and could be kept in 2-8 ˚C for several months.
32
3.7 CHIKV CULTURE AND TITRATION
Vero and C6/36 cells with 70% confluence in 75 cm2 tissue culture flasks were observed
under the microscope daily for optimum CPE of 70%. The optimum CHIKV harvest was
obtained at day 3 for C6/36 cells and day 2 for Vero cells. The C6/36 and Vero flasks for
their respective time points were then incubated and frozen. When all samples were
obtained, the flasks were thawed and centrifuged at 40,000 x g for 30 minutes to remove
cell debris. The supernatant was then used as the inoculum for virus titration.
CHIKV assay titration was carried out to quantify the concentration of virus stock
harvested. A 96 well microplate (Falcon, Australia) was seeded with 104 C6/36 and Vero
cells in 100 µl of inoculum in each cell. The cells were grown overnight in a humidified
incubator at 37°C with 5% CO2. Ten-fold serial dilution of the harvested CHIKV was
added to the plate. Mock-infected C6/36 and Vero cells were inoculated with serum free
media used as control. The microplate was shaken for one hour, then the residue discarded
and EMEM with 2% FBS were added for maintenance. The cells were observed for seven
days to determine determining the highest dilution of the virus suspension which produced
100% CPE.
33
3.8 QUANTITATING EXTRACTED PROTEIN
3.8.1. PREPARATION OF CELL LYSATE
Vero and C6/36 cells with 70% confluence in 75 cm2 tissue culture flasks were inoculated
with 50 μl CHIKV. Based on the daily observance for optimum CPE of 70%, these
infected flasks were then harvested on day two for Vero cells and day three for C6/36 cells
by gently scraping the cells off the tissue culture flasks. Anti-protease was added to the cell
suspension, before centrifuging at 800 x g for 10 minutes. The pellet was then resuspended
in PBS, then centrifuged again at 800 x g for another 10 minutes. This step was repeated
several times before finally resuspending the pellet with R2 lysis buffer containing
detergent 3-([3-cholamidopropyl]dimethylammonio)-1-propanesulfonate (CHAPS) (Bio-
Rad, USA). To prevent degradation the mixture was continually kept on ice and
rotationally vortexed while maintaining the temperature. After vortexing, the mixture was
spun down to wash off the suspension, then kept in 4˚C and gently rocked overnight. The
overnight rocked suspension was then centrifuged at 40,000 x g for 30 minutes. Once
centrifuged, the liquid suspension was removed gently then mixed with glycerol (final
10%) and kept in -80˚C for later use.
34
3.8.2. PROTEIN ASSAY
Protein BCA assay kit (Pierce, USA) was used to prepare a protein standard curve.
Different concentrations of albumin were prepared using the albumin from the kit. These
different concentrations were then pipetted into the 96 well U-bottom microtiter plate,
followed by adding working reagent, which is a mixture of Reagents A, B and C. The
prepared plates were then covered with foil and incubated in a moist chamber at 37˚C for
two hours. After two hours the optical density (OD) was measured at or near 562 nm on a
plate reader. Then a standard curve was plotted based on the OD, and the protein
concentration obtained from the CHIKV culture was measured.
3.8.3 COOMASSIE BLUE STAINING
Once the electrophoresis is complete, the SDS-PAGE gel was then removed from its
chamber and placed into Coomassie Blue G-250 staining solution. The gel was then
immersed in the solution for one hour on a shaker or overnight. Once stained, the gel was
further destained for 10-15 minutes with destaining I (40% methanol, 7% acetic acid). The
gel was finally washed and destained with milliQ water overnight until it was cleared.
3.9 NEUTRALIZATION TEST
About 1 x 10⁴ Vero cells were seeded onto 96 well flat bottom tissue culture plate in 10%
FBS 1X EMEM. CHIKV stock titer (10-4) was diluted 10,000 X. Two-fold serial dilutions
of patients’ serum were prepared. These patients’ serum have been heated at 56°C for 30
minutes to inactivate complement that may inhibit the neutralization test. The mixture was
then incubated for one hour at 37˚C. After an hour the medium from the overnight seeded
plate with 70-80% confluent cells was discarded, then 100 μl of the virus-serum mixture
was added. As controls, CHIKV mixed with a patient’s serum known to be negative for
35
anti-CHIKV antibodies, CHIKV without serum, and non-inoculated cells were also
prepared. The infected plate was incubated at 37˚C in 5% CO2 and observed for a
minimum of five days for CPE.
3.10 ENZYME LINKED IMMUNOSORBENT ASSAY (ELISA)
Once the protein concentration was measured, it was then used as an antigen to coat the
ELISA 96 well U-bottom plate. For optimal optimization, the antigen was prepared based
on a few different concentrations, 0.312 μg, 0.625 μg, 1.25 μg, 2.5 μg , 5 μg and 10 μg.
These coated plates were kept at 4˚C overnight before use. As an initial step, the excess
antigen was removed by washing with PBS mixed with 0.05% Tween 20 three times. Once
complete, the plate was blocked by adding a blocking buffer (3% bovine serum albumin
mixed with 0.05% PBS Tween 20 and incubated for one hour at room temperature. The
buffer was then removed and the plate was washed three times. The known positive and
negative patients’ serum samples were pooled for a more precise measurement, and were
then diluted to 100 and 1000 times respectively and incubated for two hours at 37˚C. After
two hours, the plates were again washed three times with PBS Tween 20.
Next, 100 μl of 6000X diluted rabbit anti-human antibody (IgG) conjugated with Horse
Radish Peroxidase (HRP) was added to each of the wells and incubated for two hours at
37˚C. This was followed by washing the plates with PBS Tween 20 three times before
adding 100 μl of O-phenyl amine (OPD) substrate as a colour substance, and incubating
for 30 minutes. 1.5N Sulphuric acid (H2SO4) was then added to each of the wells to stop
the process, and then the absorbance values for each of the wells were read using the
ELISA microplate reader at 410 nm, with a reference of 630 nm. The antigen concentration
giving the optimal absorbance value was used for the subsequent ELISA.
36
3.11 CALCULATION OF CUT-OFF VALUES FOR ELISA
Two methods were used to calculate the cut-off values for ELISA. The first method used
negative control absorbance ± 3 standard deviations (SD) (Laras et al., 2005; Porter et al.,
2004). A sample is deemed negative when the optical density (OD) ratio is less than three
SD below the negative control. A sample is deemed positive when the OD ratio is greater
than three SD above the negative control. A sample is borderline when the OD ratio lies
within ± 3 SD of negative control. These results were expressed as an OD ratio of serum
OD over negative control OD value. Using this method the cut-off value for both CHIKV-
infected C6/36 cell lysate (C6/36 ELISA) and CHIKV-infected Vero cell lysate (Vero
ELISA) were calculated. In the second method, the cut-off value was determined based on
the ratio of OD of serum sample over negative control OD value. With this, any serum
samples with ratios > 2 were considered positive, and < 2 were considered negative
(Johnson et al., 2000).
37
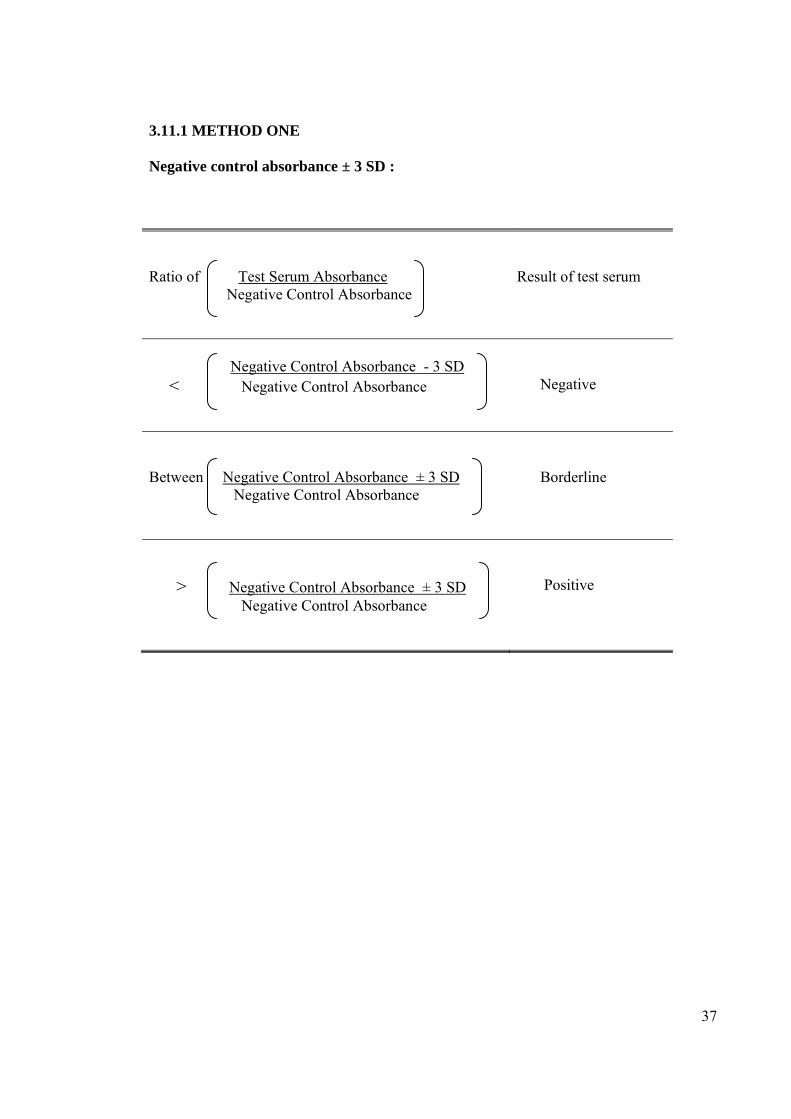
3.11.1 METHOD ONE
Negative control absorbance ± 3 SD :
Ratio of Test Serum Absorbance Negative Control Absorbance
Result of test serum
Negative Control Absorbance - 3 SD < Negative Control Absorbance
Negative
Between Negative Control Absorbance ± 3 SD Negative Control Absorbance
Borderline
> Negative Control Absorbance ± 3 SD Negative Control Absorbance
Positive
38
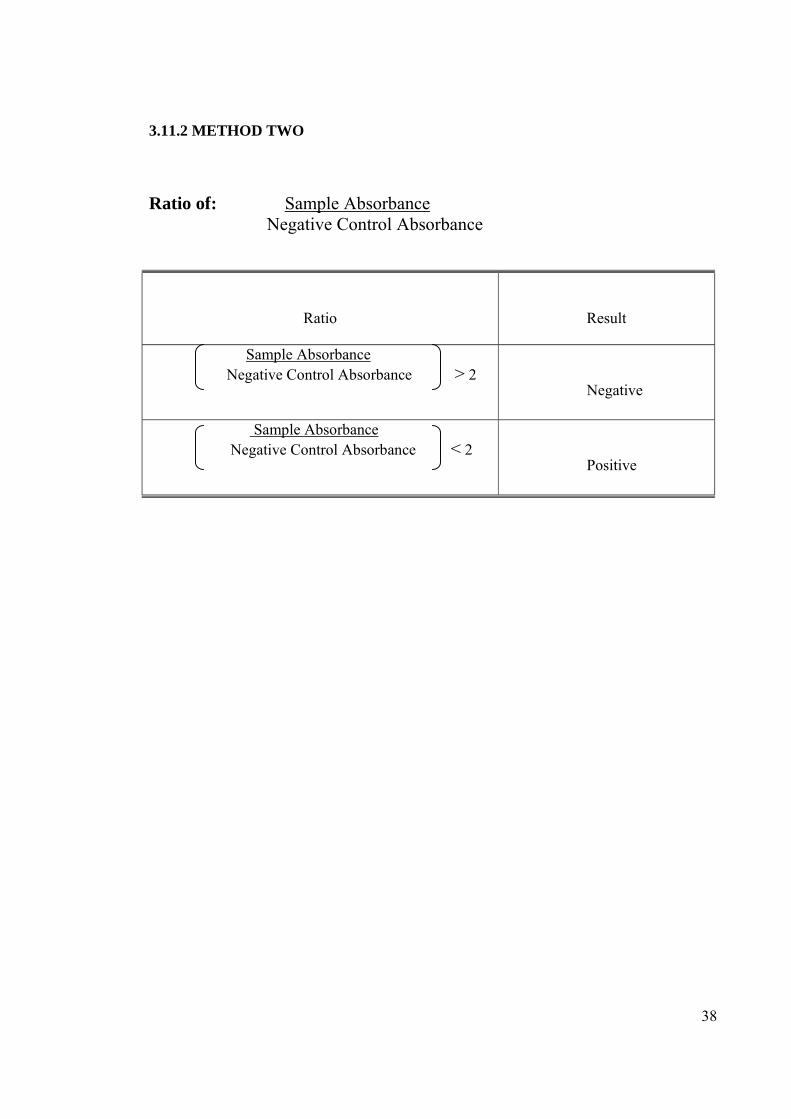
3.11.2 METHOD TWO
Ratio of: Sample Absorbance Negative Control Absorbance
Ratio
Result
Sample Absorbance Negative Control Absorbance > 2
Negative
Sample Absorbance Negative Control Absorbance < 2
Positive
39
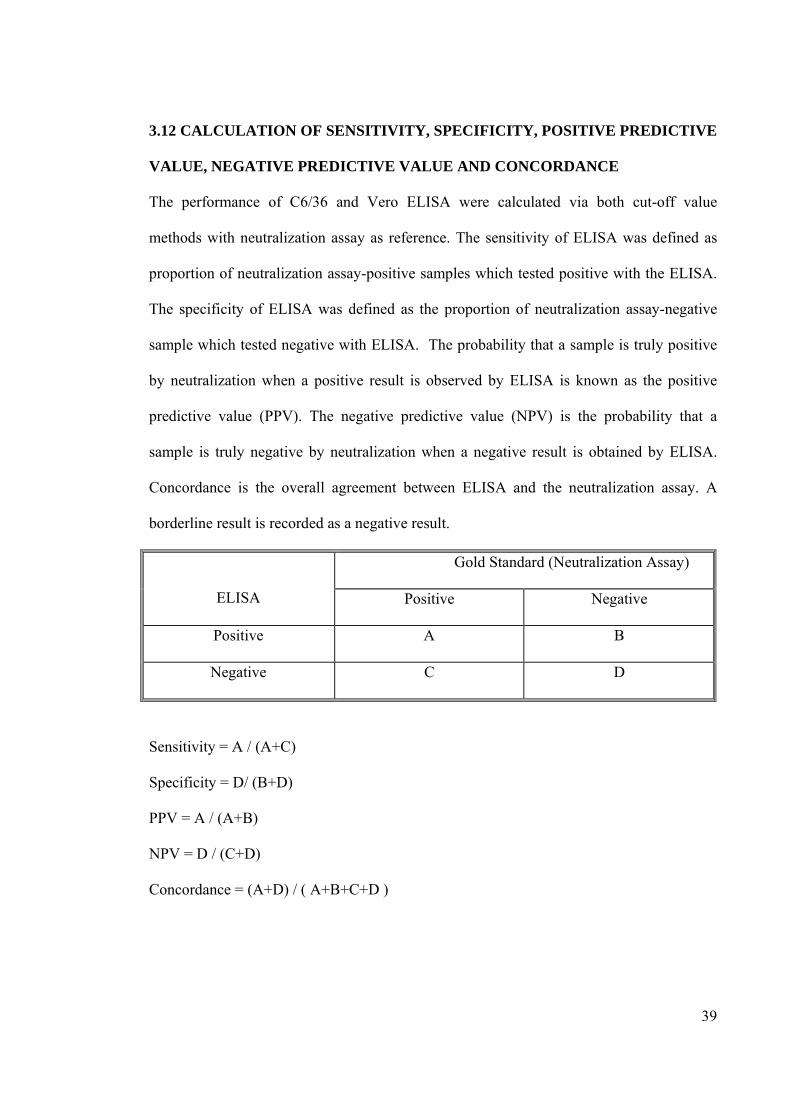
3.12 CALCULATION OF SENSITIVITY, SPECIFICITY, POSITIVE PREDICTIVE
VALUE, NEGATIVE PREDICTIVE VALUE AND CONCORDANCE
The performance of C6/36 and Vero ELISA were calculated via both cut-off value
methods with neutralization assay as reference. The sensitivity of ELISA was defined as
proportion of neutralization assay-positive samples which tested positive with the ELISA.
The specificity of ELISA was defined as the proportion of neutralization assay-negative
sample which tested negative with ELISA. The probability that a sample is truly positive
by neutralization when a positive result is observed by ELISA is known as the positive
predictive value (PPV). The negative predictive value (NPV) is the probability that a
sample is truly negative by neutralization when a negative result is obtained by ELISA.
Concordance is the overall agreement between ELISA and the neutralization assay. A
borderline result is recorded as a negative result.
ELISA
Gold Standard (Neutralization Assay)
Positive Negative
Positive A B
Negative C D
Sensitivity = A / (A+C)
Specificity = D/ (B+D)
PPV = A / (A+B)
NPV = D / (C+D)
Concordance = (A+D) / ( A+B+C+D )
40
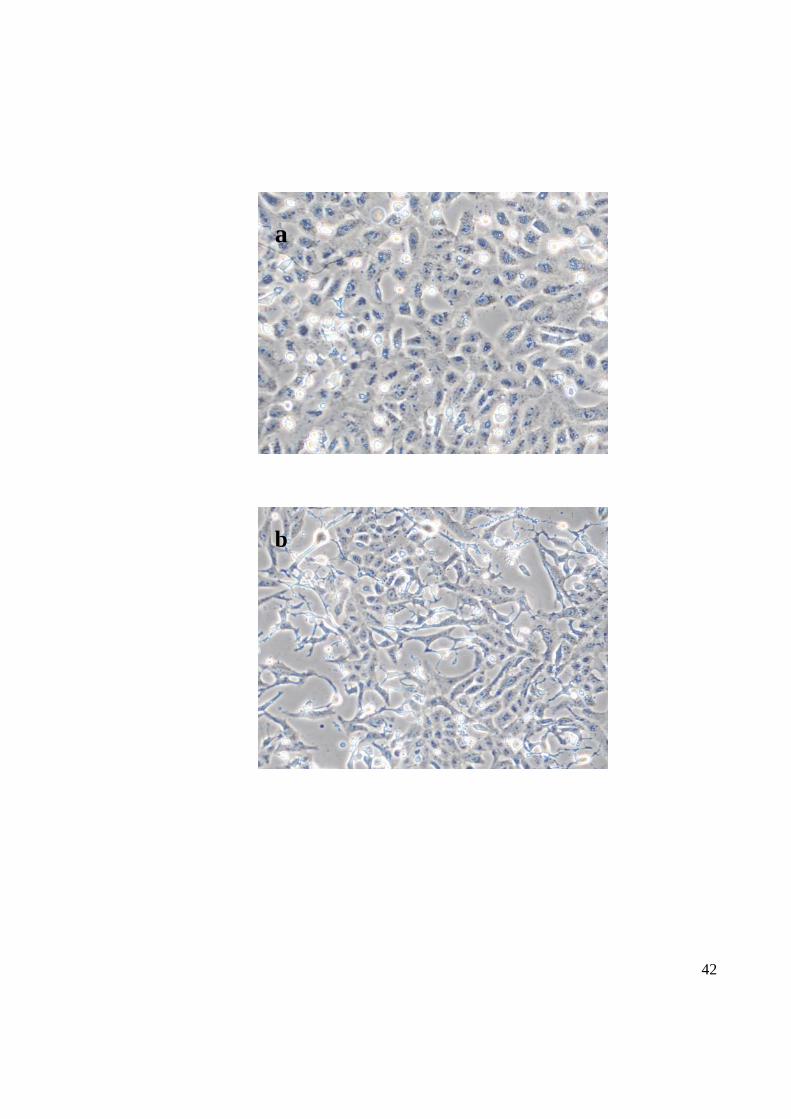
4.0 RESULTS 4.1 CONFIRMATION OF INFECTIVITY
4.1.1 OBSERVATION OF INFECTED CELL MORPHOLOGY
Two cell lines C6/36 and Vero were used to study the infectivity of CHIKV. Based on the
coverage of the flask by the C6/36 cells infected with CHIKV resulted in more than 70%
CPE three days after inoculation while the flask covered by Vero cells resulted in about
70% only two days after inoculation. The infected cells in tissue culture flasks were
observed under microscope to appear as round floating cells with a distinct red colour
compared to the healthy Vero (Figure 9) or C6/36 (Figure 10) cells. However all the mock-
infected cells appeared as a monolayer of intact epithelial cells.
42
a
b
44
a
b
45
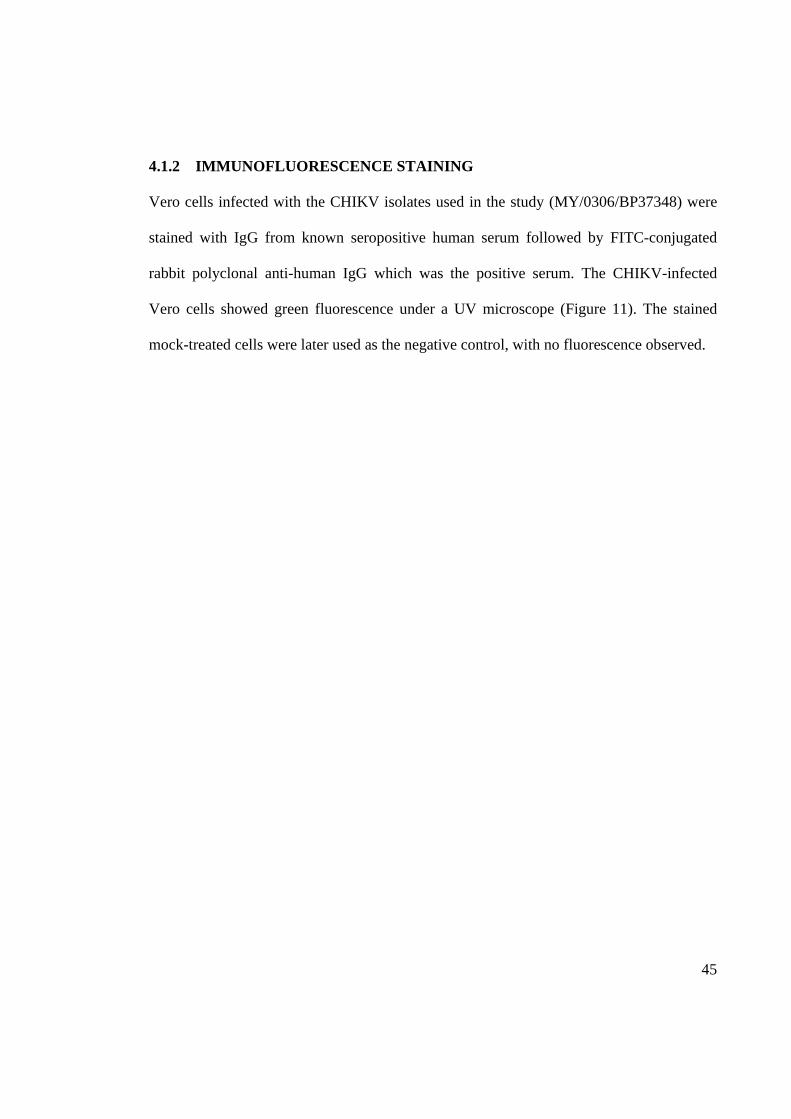
4.1.2 IMMUNOFLUORESCENCE STAINING
Vero cells infected with the CHIKV isolates used in the study (MY/0306/BP37348) were
stained with IgG from known seropositive human serum followed by FITC-conjugated
rabbit polyclonal anti-human IgG which was the positive serum. The CHIKV-infected
Vero cells showed green fluorescence under a UV microscope (Figure 11). The stained
mock-treated cells were later used as the negative control, with no fluorescence observed.
47
a
b
48
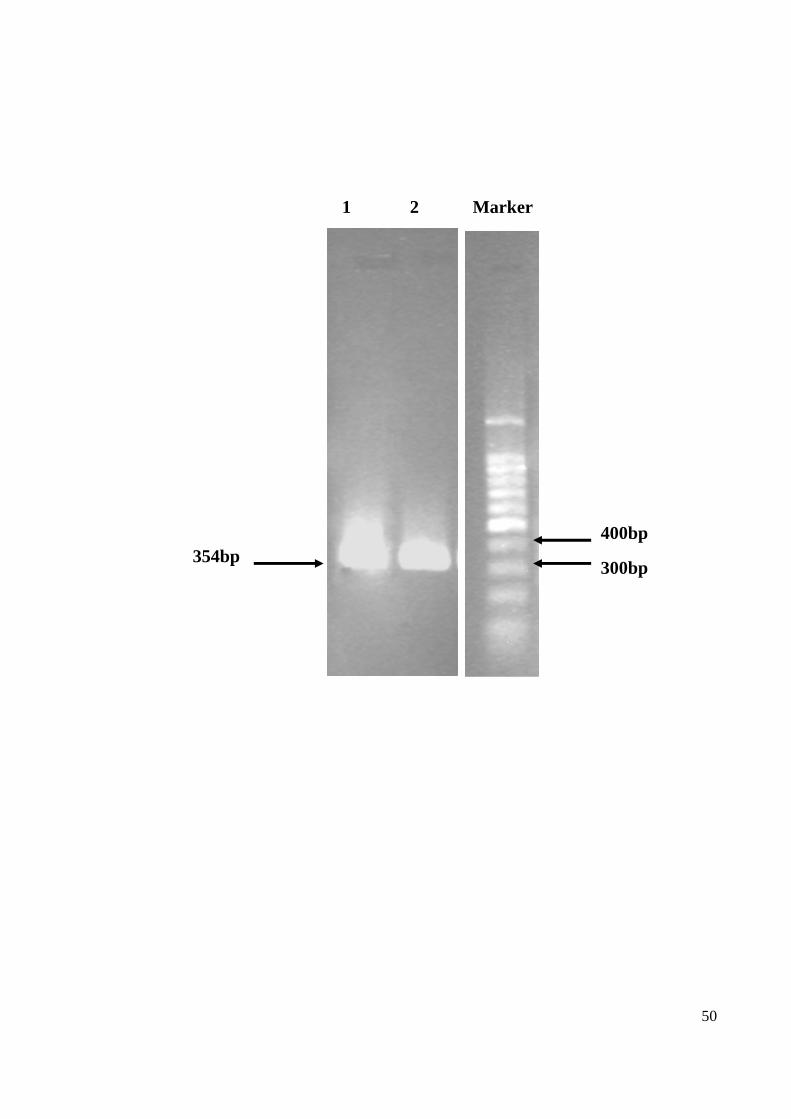
4.1.3 RT-PCR confirmation of CHIKV RNA
The RNA extracted from CHIKV-infected Vero cells were used as a template for the RT-
PCR confirmatory test. The nsP1-S primers specifically targeted and amplified the nsP1
region within the viral genome was used. The CHIKV RNA presence was confirmed in the
RNA sample extracted from the isolate used in this study (BP37438). The RT-PCR
products were electrophoresed on 1% agarose gel and stained with ethidium bromide
(Figure 12).
50
400bp
300bp
1 2 Marker
354bp
51
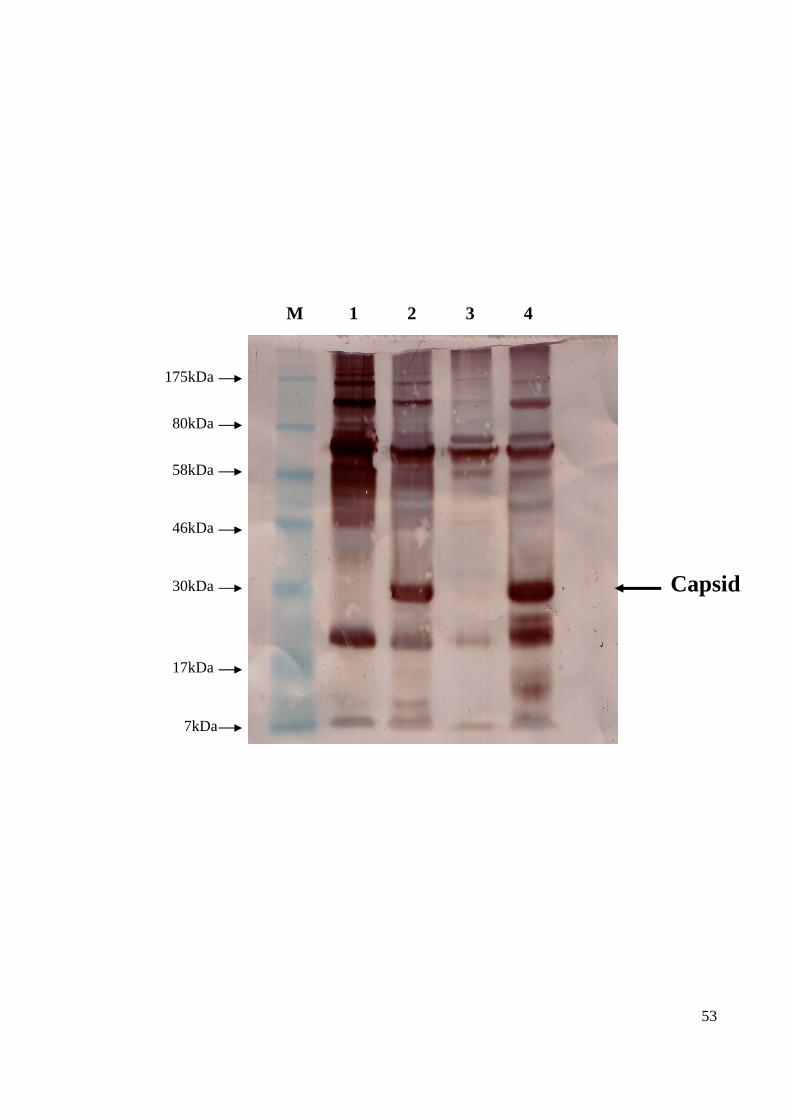
4.1.4 WESTERN BLOT
Early CHIKV Western Blot analysis had recognized a few regions of viral protein that
were deemed to be immunogenic. The 52kDa E1 envelope glycoprotein, the 62kDa
precursor for the envelope protein E1, and the capsid C protein of 36kDa were determined
as the viral proteins which caused antigenic response (Sourisseau et al., 2007). Using the
Bagan Panchor known positive pooled serum samples, Western blot analysis only
managed to distinguish the capsid protein of approximately 30kDa region, which is closest
to the expected 36kDa (Figure 13). For both the mock and infected cell lysate antigen, the
presence of non-specific bands were seen at the 52kDa and 62kDa immunogenic band
regions.
53
M 1 2 3 4
Capsid 30kDa
17kDa
46kDa
7kDa
58kDa
80kDa
175kDa
54
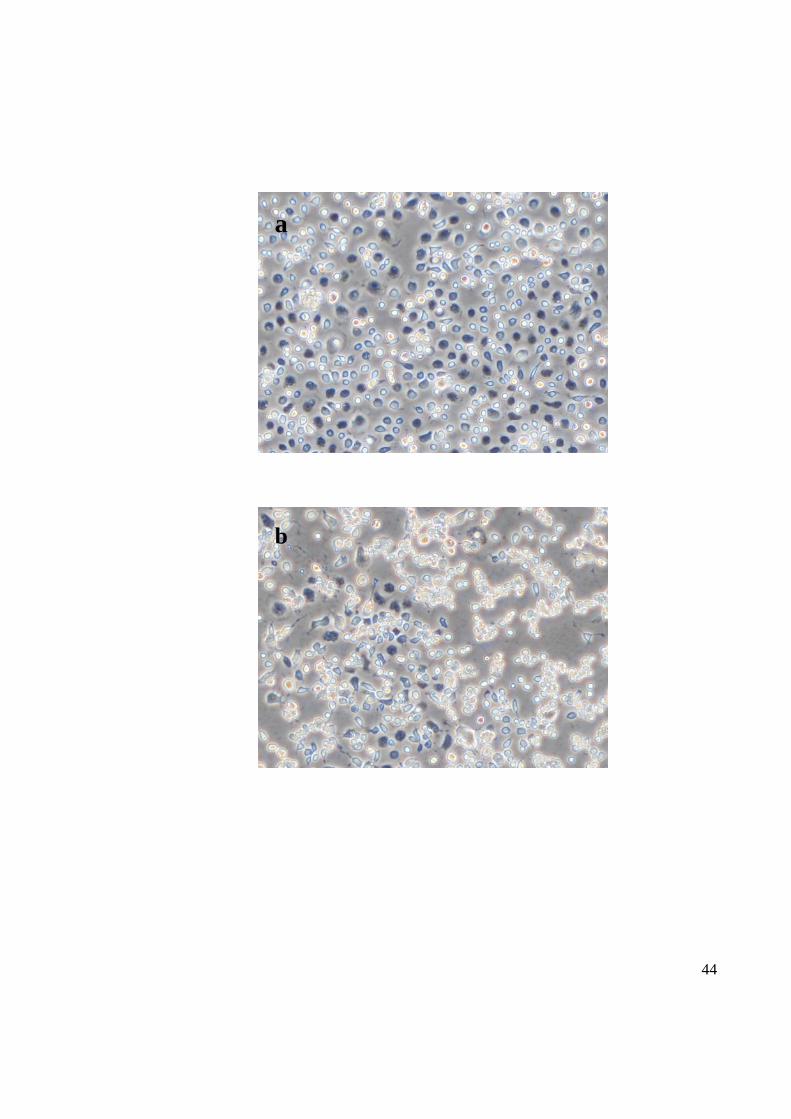
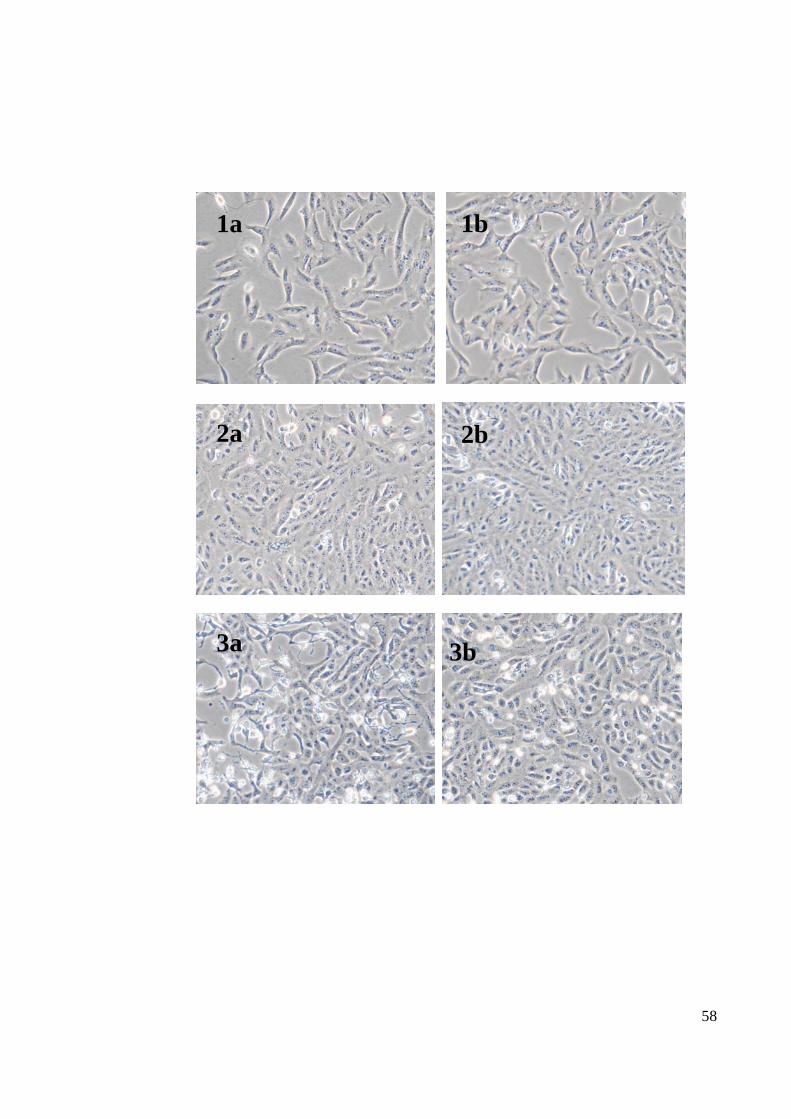
4.2 CHIKV CULTURE AND TITRATION
Two infected cell lines, C6/36 and Vero were observed daily to determine the optimum
incubation time for harvesting virus. The C6/36-infected cells gave 70% CPE after the
third day of inoculation (Figure 14), while the Vero-infected cells resulted in 70% CPE
within two days of inoculation (Figure 15). For each cell line the CPE increased as each
day progressed until it reached maximum CPE with most cells dead or floating. Therefore
the optimum CHIKV harvest was obtained at at day 3 for C6/36 cells and day 2 for Vero
cells. The end point titration value which caused 100% CPE was 10-4 for C6/36 cells and
10-5 for Vero cells.
56
1a 1b
2a 2b
3a 3b
4a 4b
58
1a 1b
2a 2b
3a 3b
59
4.3 QUANTITATING EXTRACTED PROTEIN
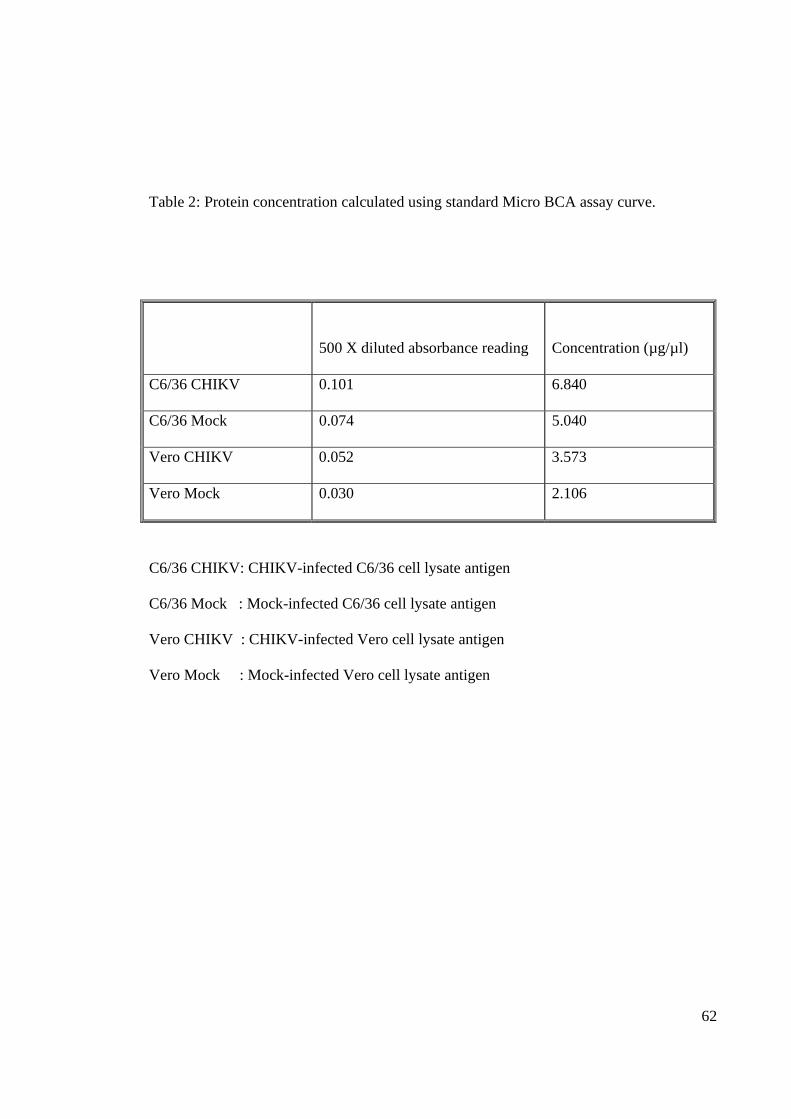
4.3.1 PROTEIN MICRO-BCA ASSAY
The cell lysate containing viral antigen extracted from CHIKV infected C6/36 and
CHIKV-infected Vero cells were quantitated using micro BCA protein assay kit (Pierce,
USA). Concurrently while harvesting the viral antigen protein, mock protein consisting of
uninfected tissue culture for both C6/36 and Vero cells were also harvested. The
concentrations for the extracted protein were calculated based on the curve of BCA protein
assay (Figure 16) using the absorbance reading obtained (Table 1).
4.3.2 SDS-PAGE GEL
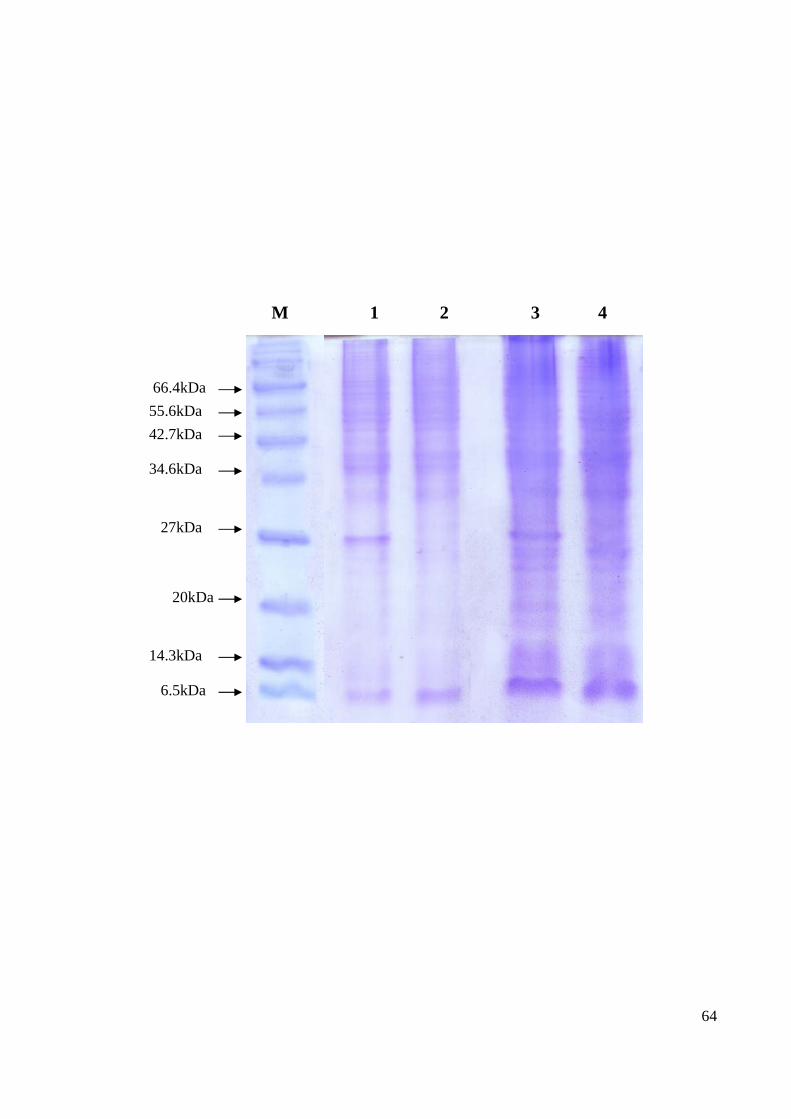
The quantitation was further validated via the Coomassie Blue method (Figure 17) as
compared to the C6/36 mock and infected protein (lanes 3 and 4 of Figure 17). Many
bands were observed in all the samples. However, no distinct band differences were
observed between the samples (Figure 17).
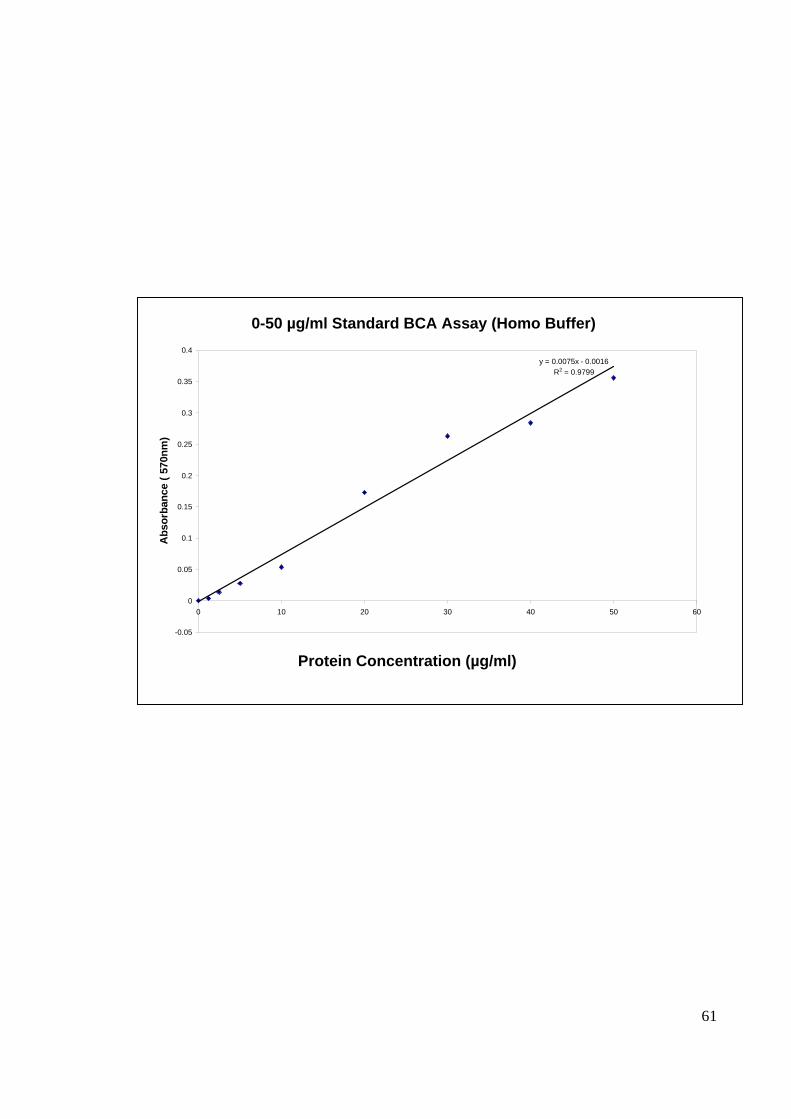
61
y = 0.0075x - 0.0016R2 = 0.9799
-0.05
0
0.05
0.1
0.15
0.2
0.25
0.3
0.35
0.4
0 10 20 30 40 50 60
Abs
orba
nce
( 570
nm)
0-50 µg/ml Standard BCA Assay (Homo Buffer)
Protein Concentration (µg/ml)
62
Table 2: Protein concentration calculated using standard Micro BCA assay curve.
500 X diluted absorbance reading
Concentration (µg/µl)
C6/36 CHIKV 0.101 6.840
C6/36 Mock 0.074 5.040
Vero CHIKV 0.052 3.573
Vero Mock 0.030 2.106
C6/36 CHIKV: CHIKV-infected C6/36 cell lysate antigen
C6/36 Mock : Mock-infected C6/36 cell lysate antigen
Vero CHIKV : CHIKV-infected Vero cell lysate antigen
Vero Mock : Mock-infected Vero cell lysate antigen
64
M 1 2 3 4
34.6kDa
27kDa
42.7kDa 55.6kDa 66.4kDa
20kDa
14.3kDa
6.5kDa
65
4.4 OPTIMIZATION OF IgG ELISA
4.4.1 SERUM DILUTION
Two pooled of positive and negative (Rubella confirmed patient) serums were used for
optimization. For the ELISA optimization, two different serum dilutions 100X and 500X
were tested. The former resulted in much higher absorbance value of 1 to 1.4 for C6/36
(Figure 18) and 0.8 to 1.2 for Vero (Figure 19) compared to the later which resulted with
only 0.2 to 0.3 for C6/36 cells and 0.1 to 0.25 for Vero cells. Based on Figure 18 and
Figure 19, 500X diluted serum resulted in a very low absorbance reading, 100X serum
dilutions was chosen for the subsequent experiments for the current study.
4.4.2 DOSE TRITRATION CURVE
The dose titration for plate coating was conducted with a range of protein concentration
which was measured with 100X serum dilution. From the dose titration curve, it is clear
that 10 µg/µl , 5 µg/µl and 2.5 µg/µl gave relatively good absorbance results, and with that
2.5 µg/µl were chosen as the optimal concentration for ELISA plate coating (Figure 20).
67
C6/36
-0.05
0
0.05
0.1
0.15
0.2
0.25
0.3
10 5 2.5 1.25 0.625 0.3125
Abs
orba
nce
(450
nm)
C6/36 mock (neg)C6/36 mock (P)C6/36 CHIKV (neg)C6/36 CHIKV (P)
a
C6/36
-0.2
0
0.2
0.4
0.6
0.8
1
1.2
1.4
1.6
10 5 2.5 1.25 0.625 0.3125
Protein Concentration (µg/ml)
Abs
orba
nce
(450
nm)
C6/36 mock (neg)C6/36 mock (P)C6/36 CHIKV (neg)C6/36 CHIKV (P)
b
Protein Concentration (µg/ml)
69
Vero
-0.05
0
0.05
0.1
0.15
0.2
0.25
10 5 2.5 1.25 0.625 0.3125
Protein Concentration (µg/ml)
Abs
orba
nce
(450
nm)
Vero mock (neg)Vero mock (P)Vero CHIKV (neg)Vero CHIKV (P)
Vero
-0.2
0
0.2
0.4
0.6
0.8
1
1.2
1.4
10 5 2.5 1.25 0.625 0.3125
Protein Concentration (µg/ml)
Abs
orba
nce
(450
nm)
Vero mock (neg)Vero mock (P)Vero CHIKV (neg)Vero CHIKV (P)
b
a
71
Vero
0
0.2
0.4
0.6
0.8
1
1.2
1.4
1.6
10 5 2.5 1.25 0.625 0.3125 Protein Concentration (µg/ml)
Abs
orba
nce
(450
nm)
Vero mock (neg)Vero mock (P)Vero CHIKV (neg)Vero CHIKV (P)
a
C6/36
0
0.2
0.4
0.6
0.8
1
1.2
1.4
1.6
1.8
10 5 2.5 1.25 0.625 0.3125
Protein Concentration (µg/ml)
C6/36 mock (neg)C6/36 mock (P)C6/36 CHIKV (neg)C6/36 CHIKV (P)
Abs
orba
nce
(450
nm)
b

72
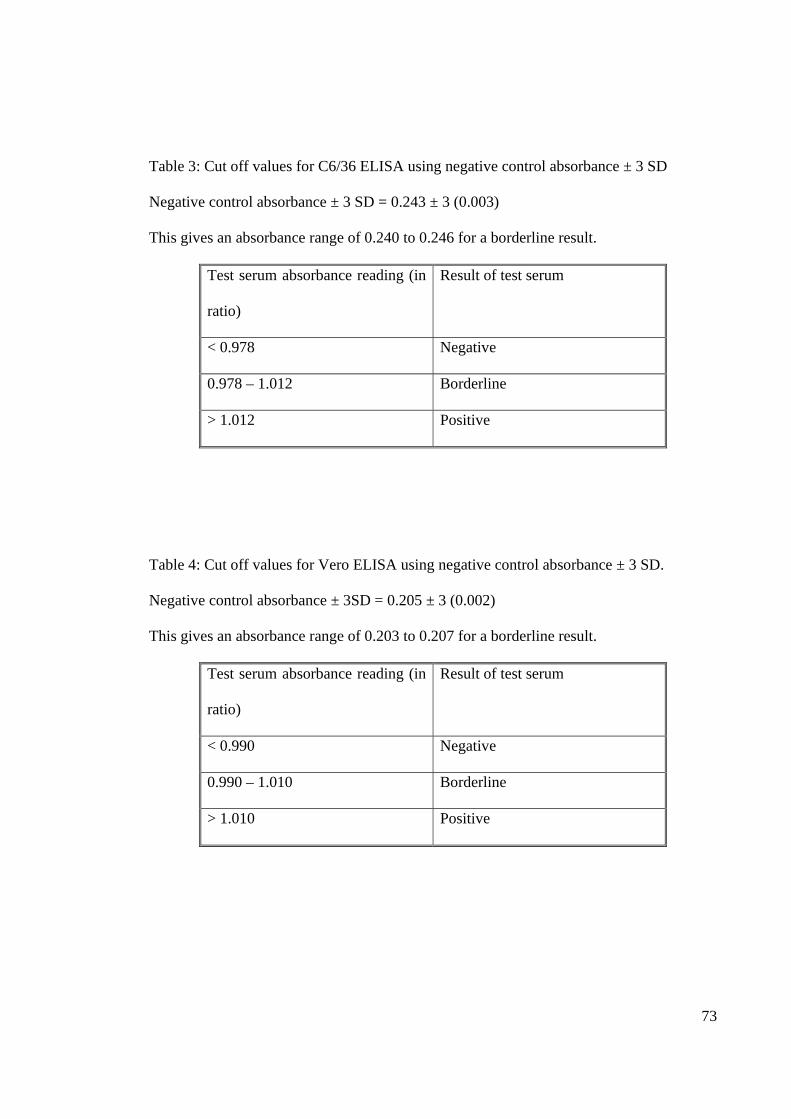
4.5 THE INDIRECT IgG ELISA CUT-OFF VALUE
The cut-off value was calculated and determined for ELISA using two methods. Method
one was using the negative control absorbance ± 3 standard deviation (SD) (Laras et al.,
2005; Porter et al., 2004). The absorbance result was expressed and interpreted in ratio
form of OD of serum sample over negative control optical density (OD) value. For the
ELISA using the CHIKV-infected C6/36 viral antigen (‘C6/36 ELISA’), a sample was
considered positive if the OD ratio value was greater than 1.012. A sample was considered
negative if the OD ratio was less than 0.978. It was considered as borderline, if the OD
ratio lay between 0.978 and 1.012 (Table 2). In ELISA using CHIKV-infected Vero viral
antigen (‘Vero ELISA’), a sample was considered positive if the OD ratio value is greater
than 1.010. However it is considered negative if the OD ratio is less than 0.990. A sample
was considered borderline between 0.990 and 1.010 (Table 3).
In the second method, the cut-off value was determined based on the ratio of OD of serum
sample over negative control OD value. Any serum sample with the ratio greater than 2
was considered positive and any ratio less than 2 was considered negative (Johnson et al.,
2000).
73
Table 3: Cut off values for C6/36 ELISA using negative control absorbance ± 3 SD
Negative control absorbance ± 3 SD = 0.243 ± 3 (0.003)
This gives an absorbance range of 0.240 to 0.246 for a borderline result.
Test serum absorbance reading (in
ratio)
Result of test serum
< 0.978 Negative
0.978 – 1.012 Borderline
> 1.012 Positive
Table 4: Cut off values for Vero ELISA using negative control absorbance ± 3 SD.
Negative control absorbance ± 3SD = 0.205 ± 3 (0.002)
This gives an absorbance range of 0.203 to 0.207 for a borderline result.
Test serum absorbance reading (in
ratio)
Result of test serum
< 0.990 Negative
0.990 – 1.010 Borderline
> 1.010 Positive
74
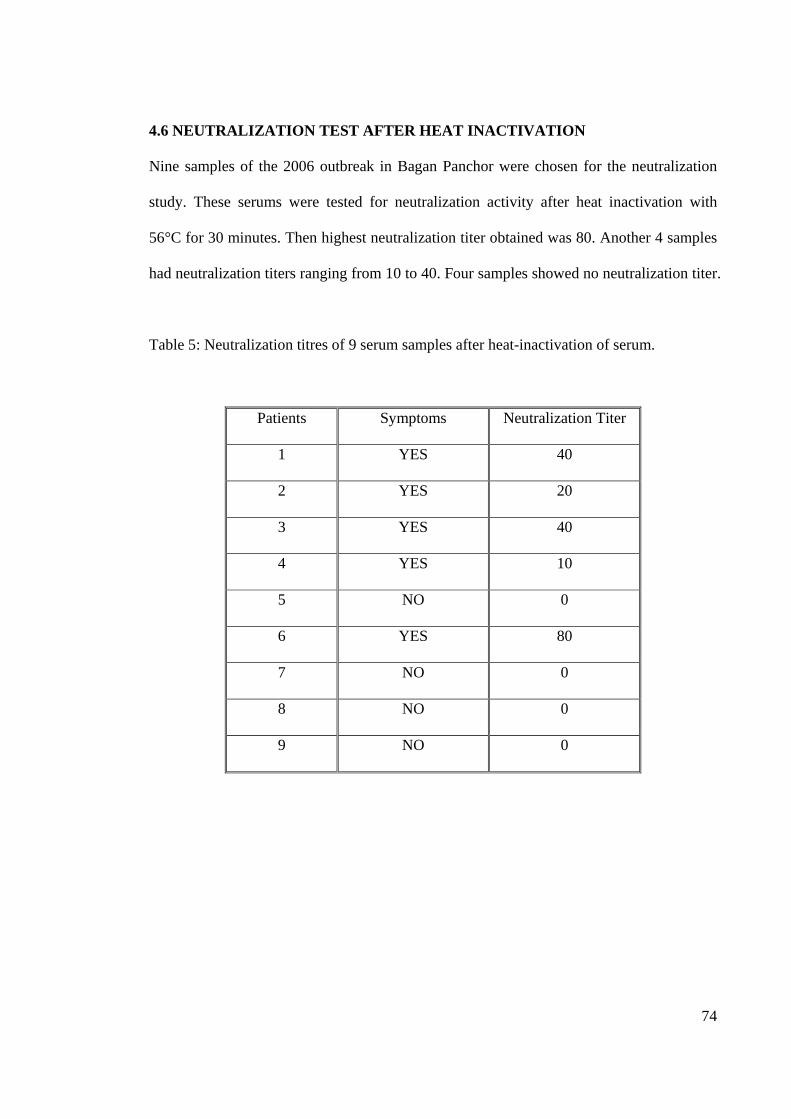
4.6 NEUTRALIZATION TEST AFTER HEAT INACTIVATION
Nine samples of the 2006 outbreak in Bagan Panchor were chosen for the neutralization
study. These serums were tested for neutralization activity after heat inactivation with
56°C for 30 minutes. Then highest neutralization titer obtained was 80. Another 4 samples
had neutralization titers ranging from 10 to 40. Four samples showed no neutralization titer.
Table 5: Neutralization titres of 9 serum samples after heat-inactivation of serum.
Patients Symptoms Neutralization Titer
1 YES 40
2 YES 20
3 YES 40
4 YES 10
5 NO 0
6 YES 80
7 NO 0
8 NO 0
9 NO 0
75
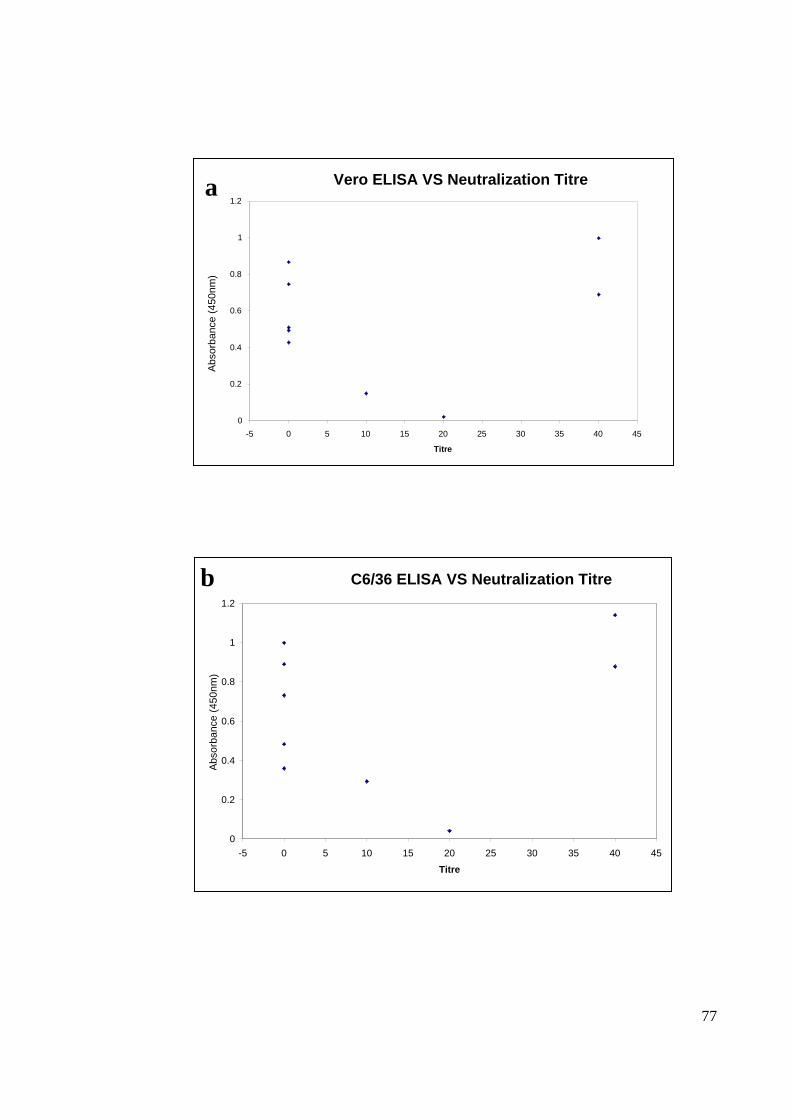
4.7 ASSOCIATION OF IgG INDIRECT ELISA WITH NEUTRALIZATION TITER
The C6/36 and Vero ELISA absorbance reading for the nine Bagan Panchor serum
samples were compared with their respective neutralization titre (Figure 21). The
associations of the values were calculated using Pearson correlation. Both Vero and C6/36
ELISA absorbance readings exhibited low correlation value with neutralization titre. Vero
ELISA showed a correlation value of r=0.216 with a p-value of value of 0.22 while C6/36
ELISA showed a correlation of r=0.264 with a p-value of 0.27.
77
Vero ELISA VS Neutralization Titre
0
0.2
0.4
0.6
0.8
1
1.2
-5 0 5 10 15 20 25 30 35 40 45 Titre
Abso
rban
ce (4
50nm
)
C6/36 ELISA VS Neutralization Titre
0
0.2
0.4
0.6
0.8
1
1.2
-5 0 5 10 15 20 25 30 35 40 45
Titre
Abso
rban
ce (4
50nm
)
a
b
78
4.8 SUMMARIZED IgG ELISA RATIO, NEUTRALIZATION TITER AND
CLINICAL STATUS OF SERUM SAMPLES FROM 9 BAGAN PANCHOR
RESIDENTS
The neutralization titres, ELISA reading (expressed as ratio of sample OD value over
negative control OD value), ELISA results interpreted using the two cut-off methods, and
clinical status for 5 laboratory-confirmed cases and 4 non-infected contacts were
summarized (Tables 5 and 6). ELISA results which are highlighted in red are results
discordant with neutralization titre, the gold standard.
Using cut-off method 1 all 5 laboratory-confirmed cases were detected by C6/36 ELISA
and Vero ELISA (Table 5). Four cases were listed as ‘uninfected contacts’ who had no
observation of clinical symptoms or neutralization titer. However, both Vero ELISA and
C6/36 ELISA gave positive results for at least 75% of the samples. These false-positives
could only mean that ELISA absorbance reading were a result of background reading and
non-specific binding of antigens.
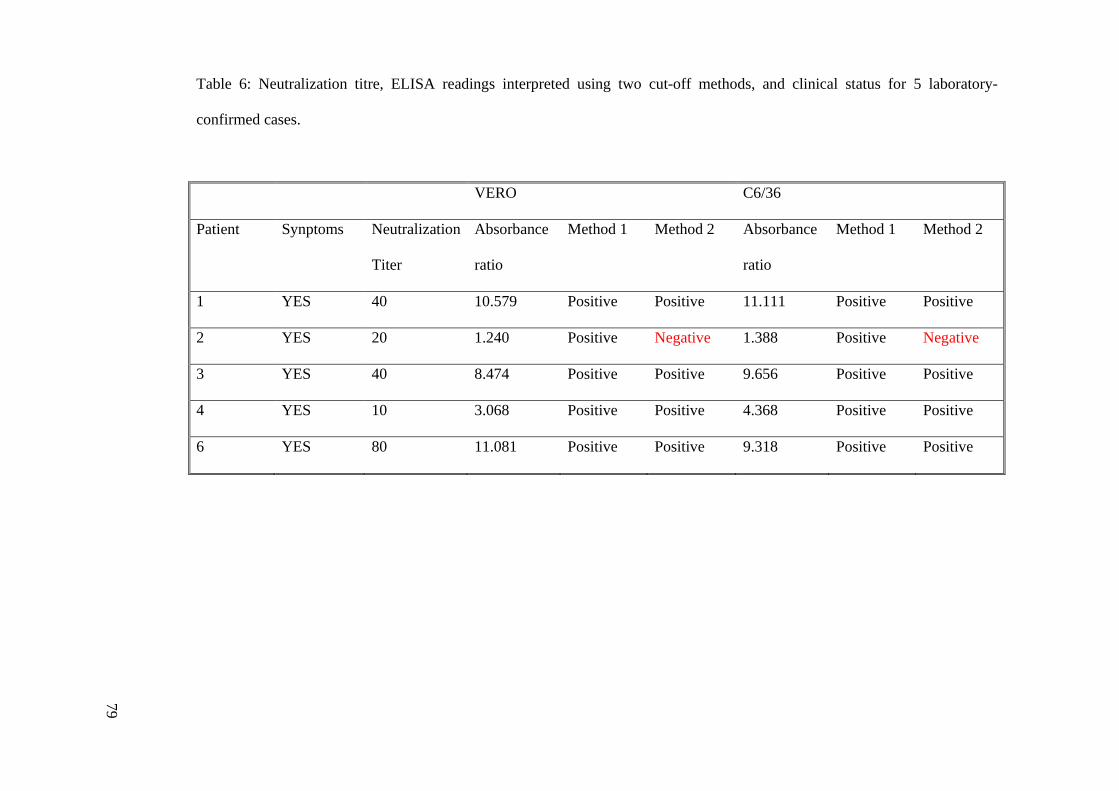
Table 6: Neutralization titre, ELISA readings interpreted using two cut-off methods, and clinical status for 5 laboratory-
confirmed cases.
VERO C6/36
Patient Synptoms Neutralization
Titer
Absorbance
ratio
Method 1 Method 2 Absorbance
ratio
Method 1 Method 2
1 YES 40 10.579 Positive Positive 11.111 Positive Positive
2 YES 20 1.240 Positive Negative 1.388 Positive Negative
3 YES 40 8.474 Positive Positive 9.656 Positive Positive
4 YES 10 3.068 Positive Positive 4.368 Positive Positive
6 YES 80 11.081 Positive Positive 9.318 Positive Positive
79
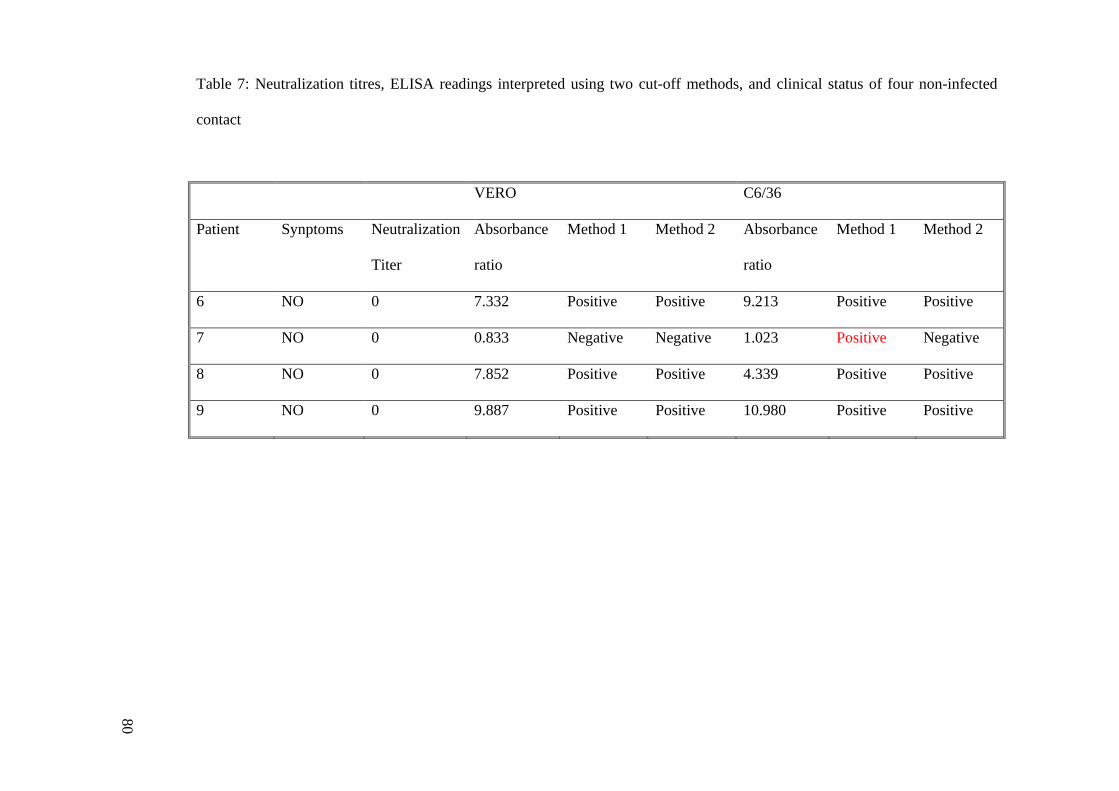
Table 7: Neutralization titres, ELISA readings interpreted using two cut-off methods, and clinical status of four non-infected
contact
VERO C6/36
Patient Synptoms Neutralization
Titer
Absorbance
ratio
Method 1 Method 2 Absorbance
ratio
Method 1 Method 2
6 NO 0 7.332 Positive Positive 9.213 Positive Positive
7 NO 0 0.833 Negative Negative 1.023 Positive Negative
8 NO 0 7.852 Positive Positive 4.339 Positive Positive
9 NO 0 9.887 Positive Positive 10.980 Positive Positive
80
81
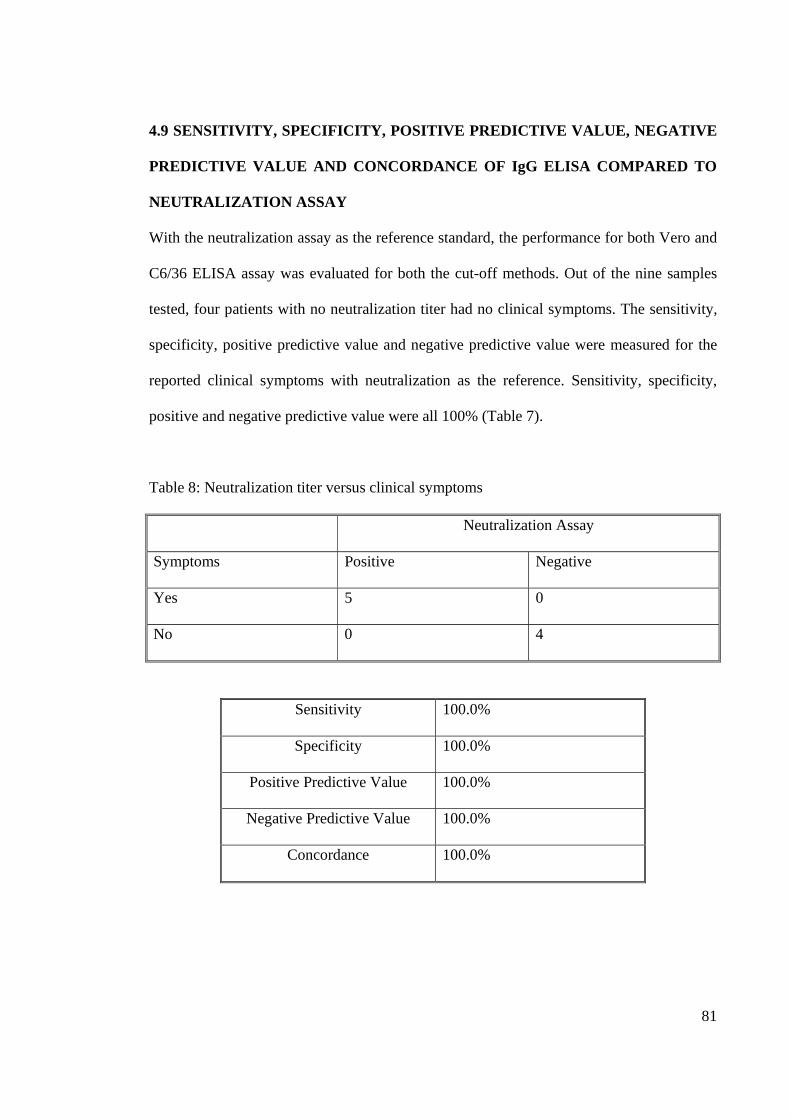
4.9 SENSITIVITY, SPECIFICITY, POSITIVE PREDICTIVE VALUE, NEGATIVE
PREDICTIVE VALUE AND CONCORDANCE OF IgG ELISA COMPARED TO
NEUTRALIZATION ASSAY
With the neutralization assay as the reference standard, the performance for both Vero and
C6/36 ELISA assay was evaluated for both the cut-off methods. Out of the nine samples
tested, four patients with no neutralization titer had no clinical symptoms. The sensitivity,
specificity, positive predictive value and negative predictive value were measured for the
reported clinical symptoms with neutralization as the reference. Sensitivity, specificity,
positive and negative predictive value were all 100% (Table 7).
Table 8: Neutralization titer versus clinical symptoms
Neutralization Assay
Symptoms Positive Negative
Yes 5 0
No 0 4
Sensitivity 100.0%
Specificity 100.0%
Positive Predictive Value 100.0%
Negative Predictive Value 100.0%
Concordance 100.0%
82
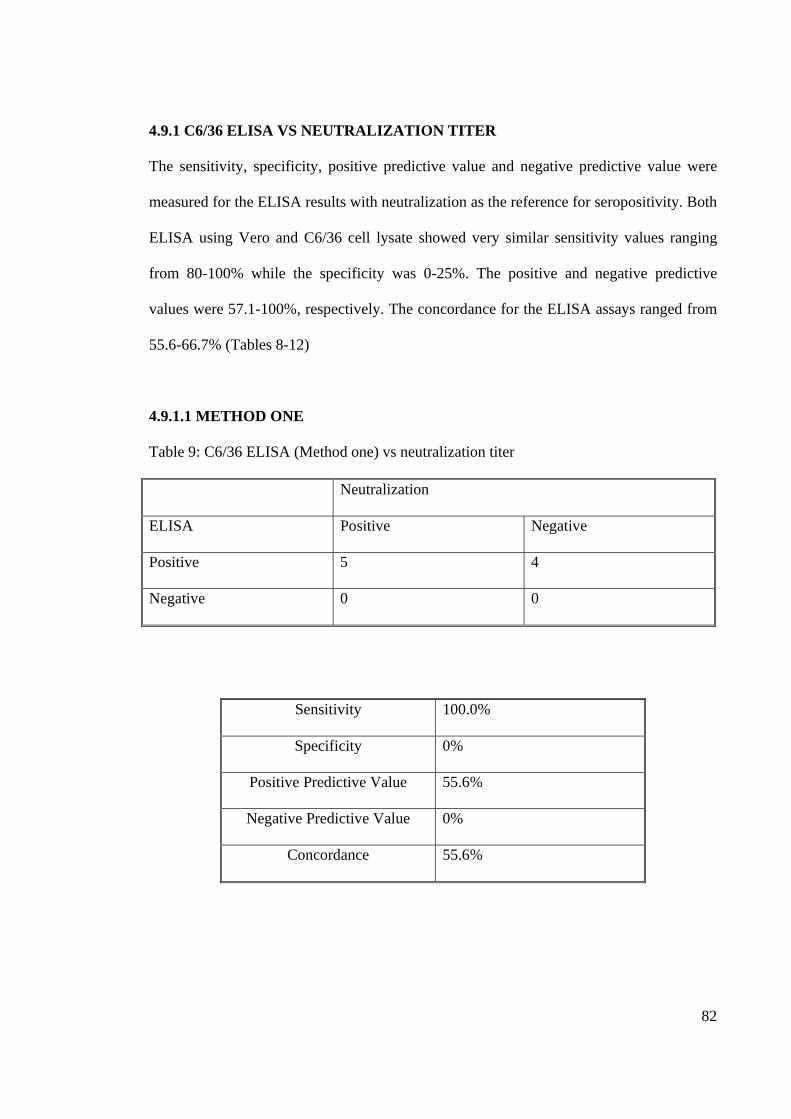
4.9.1 C6/36 ELISA VS NEUTRALIZATION TITER
The sensitivity, specificity, positive predictive value and negative predictive value were
measured for the ELISA results with neutralization as the reference for seropositivity. Both
ELISA using Vero and C6/36 cell lysate showed very similar sensitivity values ranging
from 80-100% while the specificity was 0-25%. The positive and negative predictive
values were 57.1-100%, respectively. The concordance for the ELISA assays ranged from
55.6-66.7% (Tables 8-12)
4.9.1.1 METHOD ONE
Table 9: C6/36 ELISA (Method one) vs neutralization titer
Neutralization
ELISA Positive Negative
Positive 5 4
Negative 0 0
Sensitivity 100.0%
Specificity 0%
Positive Predictive Value 55.6%
Negative Predictive Value 0%
Concordance 55.6%
83
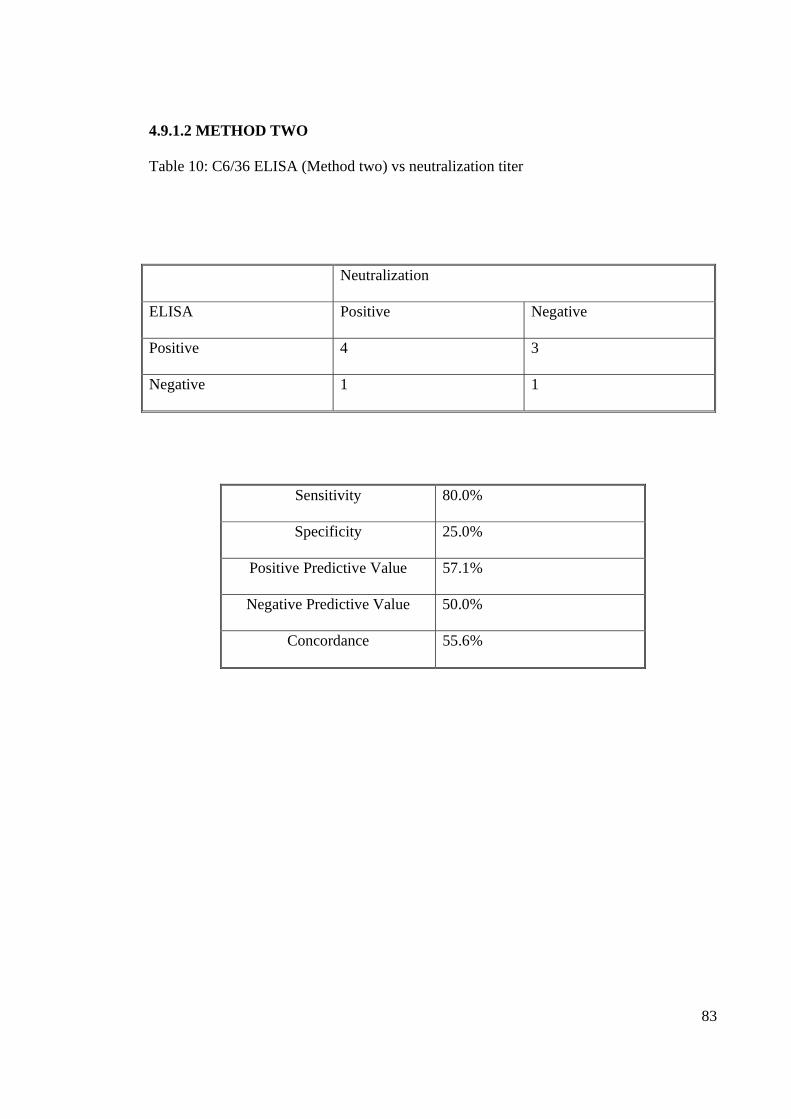
4.9.1.2 METHOD TWO
Table 10: C6/36 ELISA (Method two) vs neutralization titer
Neutralization
ELISA Positive Negative
Positive 4 3
Negative 1 1
Sensitivity 80.0%
Specificity 25.0%
Positive Predictive Value 57.1%
Negative Predictive Value 50.0%
Concordance 55.6%
84
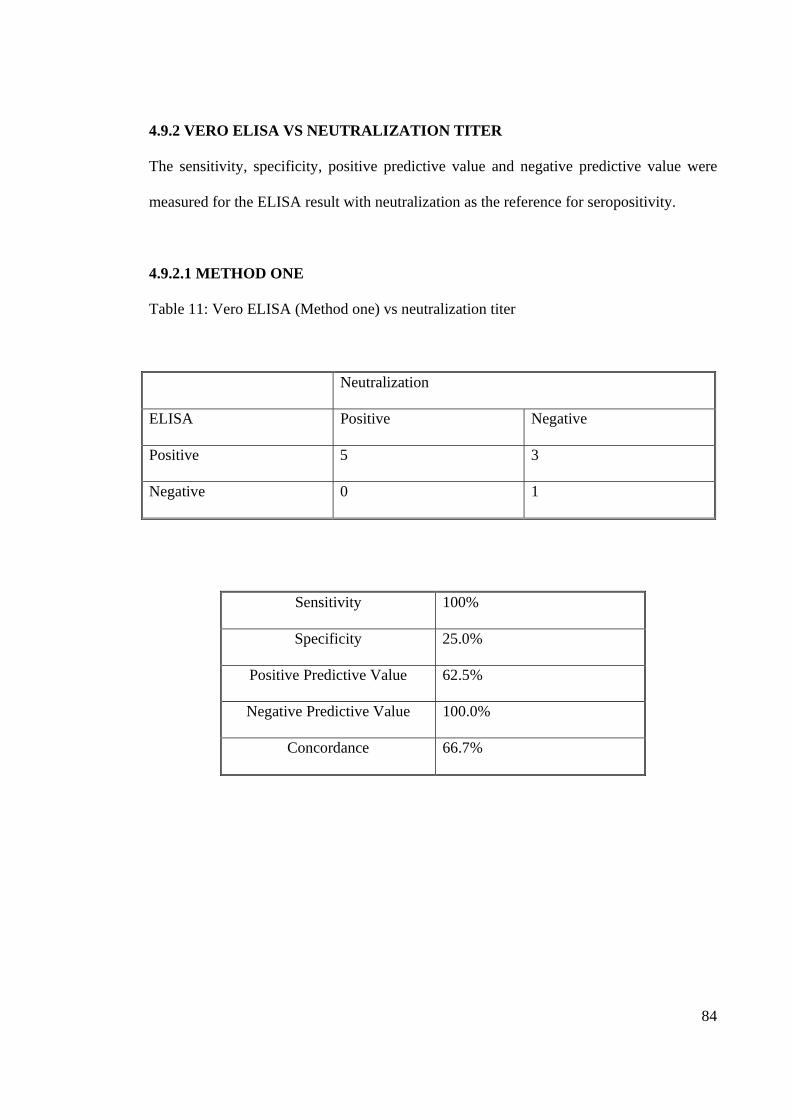
4.9.2 VERO ELISA VS NEUTRALIZATION TITER
The sensitivity, specificity, positive predictive value and negative predictive value were
measured for the ELISA result with neutralization as the reference for seropositivity.
4.9.2.1 METHOD ONE
Table 11: Vero ELISA (Method one) vs neutralization titer
Neutralization
ELISA Positive Negative
Positive 5 3
Negative 0 1
Sensitivity 100%
Specificity 25.0%
Positive Predictive Value 62.5%
Negative Predictive Value 100.0%
Concordance 66.7%
85
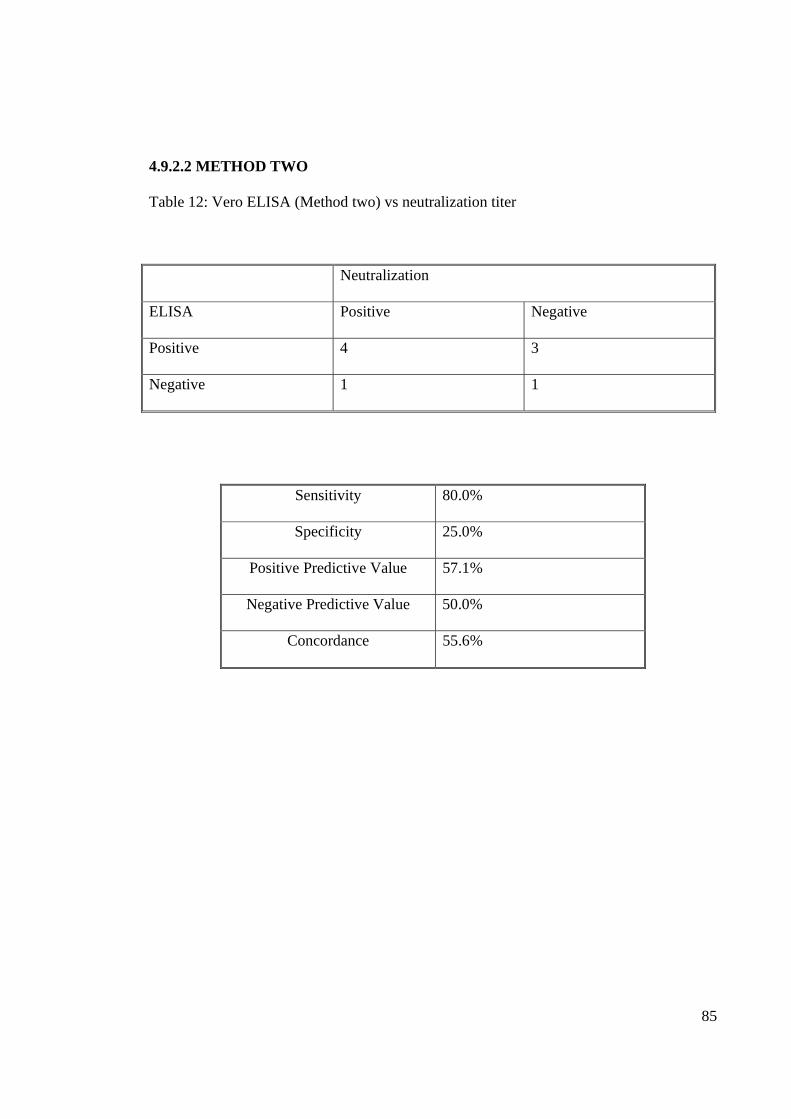
4.9.2.2 METHOD TWO
Table 12: Vero ELISA (Method two) vs neutralization titer
Neutralization
ELISA Positive Negative
Positive 4 3
Negative 1 1
Sensitivity 80.0%
Specificity 25.0%
Positive Predictive Value 57.1%
Negative Predictive Value 50.0%
Concordance 55.6%
86
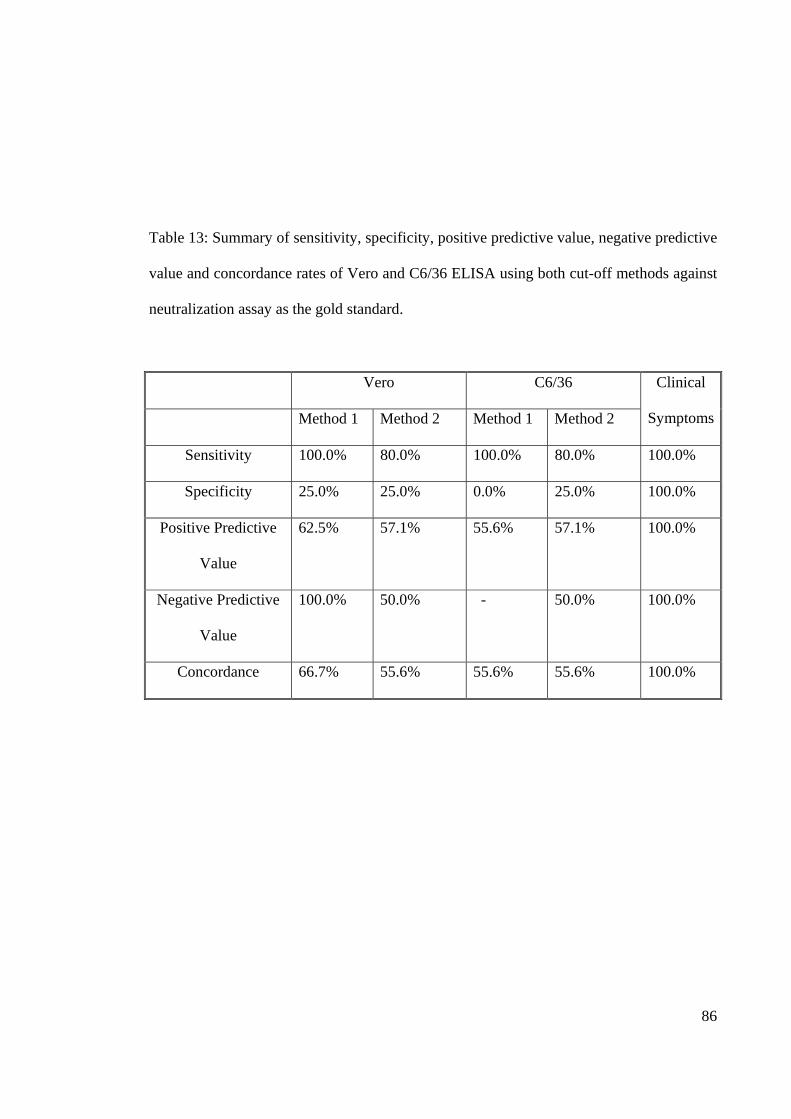
Table 13: Summary of sensitivity, specificity, positive predictive value, negative predictive
value and concordance rates of Vero and C6/36 ELISA using both cut-off methods against
neutralization assay as the gold standard.
Vero C6/36 Clinical
Symptoms Method 1 Method 2 Method 1 Method 2
Sensitivity 100.0% 80.0% 100.0% 80.0% 100.0%
Specificity 25.0% 25.0% 0.0% 25.0% 100.0%
Positive Predictive
Value
62.5% 57.1% 55.6% 57.1% 100.0%
Negative Predictive
Value
100.0% 50.0% - 50.0% 100.0%
Concordance 66.7% 55.6% 55.6% 55.6% 100.0%
87
5.0 DISCUSSION
5.1 CONFIRMATION OF CHIKV
5.1.1 IMMUNOFLUORESCENCE ASSAY
Immunofluorescence assay (IF) in the current study was used to detect presence of CHIKV
in cell cultures. The Vero and C6/36 cells which were grown and infected with the Bagan
Panchor isolate BP37348, were tested for the presence of CHIKV using seropositive
patients’ sera collected from Bagan Panchor residents. Based on the indirect IF method, the
immunoglobulin G (IgG) which are present in the positive patients’ sera would react with
the secondary anti-human antibodies conjugated with FITC to give a fluorescent effect.
However the negative patients’ sera would not exhibit such an effect due to absence of the
antibody (AbuBakar et al., 2007). The mock-infected Vero and C6/36 cells were also
tested as negative controls using both positive and negative patients’ sera in which they did
not give any fluorescent effect.
5.1.2. POLYMERASE CHAIN REACTION (PCR)
With the CHIKV RNA extracted either directly from the patients sera or from infected cell
cultures, nucleic acid amplification was performed with 3 pairs of primers designed
specifically for the non-structural protein 1 (nsP1) (AbuBakar et al., 2007). Following
agarose electrophoresis, the correct sized 354bp DNA was obtained from the positive pools
after amplification, confirming the presence of CHIKV infection.
88
5.1.3 IMMUNODETECTION OF CHIKV PROTEINS
The expression of the proteins were observed and analyzed using SDS-PAGE which was
stained with Coomassie Blue. Banding patterns (Figure 17) observed showed the lanes
with the presence of CHIKV viral lysate harvested from both Vero and C6/36 managed to
exhibit a viral capsid protein of approximately 30-46kDa which is the closest to the
expected CHIKV capsid protein of 36kDa (Sourisseau et al., 2007). A similar band was
not detected in the mock infected cells in lanes 1 and 3 for both cells, which confirms that
the corresponding protein band belongs to the CHIKV. The present analysis revealed the
presence of CHIK-specific protein band of approximately 30-46 kDa. Based on the size,
this protein is likely to be the 36 kD capsid protein reported previously (Shimizu et al.,
1984).
Based on an earlier study, it has been reported that the Western blotting of CHIKV
seropositive serum samples managed to detect 43.3% of capsid protein while 50% detected
the E2 protein region and only 13% managed to detect the E1 region from the viral lysate
mixture (Kowalzik et al., 2008). Some studies only managed to detect the structural
protein E2 and capsid for CHIKV positive serum sample (Deshmane and Banerjee, 1983).
This may be explained by the fact that CHIKV envelope protein E1 is hidden within the
viral structure which reduces the likelihood of E1 exposure to host immune system (Cho et
al., 2008). More likely, the differing detection of proteins between studies may reflect
different methods of extracting protein lysate.
89
5.2 CHIKV INFECTIVITY IN C6/36 AND VERO CELLS
There are a few commonly used cells to propagate CHIKV such as BEAS (bronchial
epithelial cell), MRC5 (primary lung fibroblasts), C6/36 (Aedes albopictus, mosquito cells)
and Vero (African green monkey kidney cell) (Sourisseau et al., 2007;Powers et al., 2000;
Hasebe et al., 2002; Shuffenecker et al., 2006; AbuBakar et al., 2007). All these cells were
susceptible to infection and allowed viral production. Being the only known vector species
transmitting CHIKV, C6/36 cells was chosen for this study together with Vero cells being
the animal reservoir known for the CHIKV sylvatic transmission cycle in Africa. The virus
infectivity observed on the cells exhibited the replication pattern of CHIKV. Vero cells
revealed much higher sensitivity to CHIKV infection with fast and vital CPE display in
several studies (Cunningham et al., 1975) and increased binding efficiency towards the
host receptor compared to C6/36 cells (invertebrates) (Sourisseau et al., 2007). The
difference between the invertebrate and vertebrate cells infection has been observed
repeatedly among alphaviruses and expected to occur for CHIKV nonetheless. As
individual host, vertebrate’s immune system usually clears infections within days whereas
an invertebrate supports lifelong infection. Alphavirus replication usually results in host
cell apoptosis in vertebrates as in CHIKV in some human cells but not in invertebrates
(Chevillon et al., 2008). The present study further proved the theory with much less
significant CPE in C6/36 infected cells even after four days of inoculation compared to
CHIKV-infected Vero cells which projected substantial CPE with just two days of
inoculation (Figure 9 and 10).
90
5.3 INDIRECT ELISA IgG
Immunoglobulin G (IgG) is detectable in convalescent samples about 7-10 days after onset
of symptoms and persists for years (Pialoux et al., 2007). Anti-arboviral IgG may be
detected in patients using the ELISA format in which the inactivated antigen is applied as a
direct coating onto plate. Non-specific background reaction maybe minimized with the use
of ELISA capture method. The disadvantage of anti-IgG capture method is a lack of
sensitivity since the anti-human IgG captures all IgG present in a serum sample which
would cause competition from non-specific IgG (Johnson et al., 2000).
With the application of monoclonal antibodies, the background due to extraneous
antibodies is eliminated, resulting in less frequent nonspecific reaction and further remove
false-positive reaction caused by rheumatoid factor and less competition between antibody-
antigen binding (Martin et al., 2000). However, due to time constraint, an in-house ELISA
was designed to detect anti-CHIKV IgG antibodies from serum samples using CHIKV cell
lysates.
ELISA is highly sensitive to conditions, and with slight changes in pH, incubation time,
temperature and reagent concentrations, ELISA absorbance reading can be affected. In the
current study, the serum dilution and antigen concentration for plate coating were
optimized. The patients sera were diluted 100X and 500X while antigen concentrations
used were 0.3125 µg, 0.625 µg, 1.25 µg, 2.5 µg, 5µg and 10µg.
The ELISA readings for CHIKV antigens prepared using C6/36 and Vero cells were
compared using sera diluted 100 and 500 times, in which the 100X dilution was chosen as
the optimal serum dilution (Figure 18 and 19). The 500X dilution however was too dilute
91
to measure as the absorbance reading was low, which was difficult to eliminate
background readings. Identifying optimum serum dilution is crucial to retain standard
absorbance measurement while eliminate the phenomenon known as the prozone effect,
which is associated with the binding efficacy of antibodies and viral antigens. The lack of
binding to antigen at high concentration of antibodies due to excess antibodies present
resulting in the formation of complexes that hinder binding has been reported (Johnson et
al., 2000)
For ELISA plate coating, achieving an optimal concentration of antigen is crucial as too
little antigen will cause the ELISA to be less sensitive to identify low level of antibodies,
while too much of antigen will give background reading. Thus the dose titration graph
illustrates that the use of antigen concentrations of 10µg, 5 µg and 2.5 µg produces good
performance (Figure 20). With factors like cost and reagent wastage, the antigen
concentration 2.5 µg was chosen as the optimum concentration to coat the ELISA
microtitre plate.
C6/36 and Vero mock protein in ELISA resulted in no specific binding towards the
positive serum, in which the absorbance reading acquired for the serum binding towards
mock protein was low with no significant variation between the mock proteins
concentrations measured. However in the CHIKV-infected cells 6/36 and Vero cells lysate
resulted in a dose dependent effect, in which the absorbance was improved with increasing
protein concentration that further demonstrated serum binding to CHIKV antigen
specifically in the indirect IgG ELISA assay.
92
5.4 THE CORRELATION BETWEEN NEUTRALIZATION TITER AND
INDIRECT ELISA
Close linear correlation between neutralization assay and ELISA is crucial to develop a
quantitative ELISA to measure antibody titre responses. Linear correlation is less critical
for most commonly used diagnostic IgG ELISAs, which are quantitative assays which give
positive, equivocal or negative results. In the current study, the IgG indirect ELISA was
developed as a qualitative assay to examine seroprevalence and restrospective diagnosis.
Correlation between neutralization and IgG indirect ELISA assays for the nine serum
samples were measured using Pearson’s correlation. Both Vero and C6/36 IgG indirect
ELISA exhibited a weak correlation with neutralization assay titres.
The correlation study showed some serum samples with higher neutralization titre but with
lower ELISA absorbance value. The crude viral lysate used as antigen in the ELISA assay
could be a factor for the inconsistency of the result. There is also a lack of sensitivity of
ELISA assay to measure serum samples with higher antibody concentration, which
exhibits prozone effect due to improper use of serum dilution for the assay (Johnson et al.,
2000). Factors like auto-immune antibodies and multiple non-neutralizing antibodies
present within the serum samples displayed low neutralization titres but higher ELISA
absorbance readings, due to non-specific binding with crude viral lysate antigen (Johnson
et al., 2000).
93
5.5 THE CUT-OFF VALUE FOR INDIRECT ELISA
Cut-off values are important in ELISA assays, as they allow distinction between positive
and negative results, as determined by the gold standard (in this case neutralization). It is
essential to identify the appropriate cut-off value to eliminate non-specific cross-reaction
(Akerstedt, 2002).
Cut-off values in the current study were calculated using two methods. In the first method,
negative absorbance ± 3 SD was taken as the intermediate range, with absorbance values
above this range considered positive, and values below this range taken as negative. The
positive and negative cut-offs were converted into ratio of absorbance of test serum versus
absorbance of negative control values (Laras et al., 2005).
The cut-off value determined using the second method was based on the ratio of
absorbance of test serum against absorbance of negative control, in which the serum
samples with a ratio greater than two were considered positive, and those with a ratio less
than two were considered negative (Johnson et al., 2000). Based on the present study,
method one was chosen over method two because it yielded greater sensitivity.
94
5.6 CHIKV SENSITIVITY, POSITIVE PREDICTIVE VALUE, NEGATIVE
PREDICTIVE VALUE AND CONCORDANCE
Nine patients’ serum samples with clinical data were tested to calculate the sensitivity,
positive predictive value, negative predictive value and concordance for both the Vero and
C6/36 ELISA measured with two cut-off methods against the gold standard, the
neutralization assay. The serum samples were collected from residents of Bagan Panchor
in 2007, some of who were related to CHIKV confirmed patients and some without any
confirmation based on the 2006 outbreak. Presence of clinical symptoms had only 50%
sensitivity as a diagnostic method for CHIKV infection (Pialoux et al., 2007). The
presence of other possible causes of fever in some patients, for example dengue, explained
the low positive predictive value of 80%. A negative value of 25% suggested the
possibility of primary asymptomatic case or patients without proper recollection of
previous symptoms. A previous study conducted in two separate areas in Indonesia also
confirmed that the ratio of symptomatic to asymptomatic with CHIKV infection was 1.2:1
and 1.3:1 (Porter et al., 2004).
For both Vero and C6/36 ELISA, and with both cut-off methods used, resulted in very low
(0-25%) specificity, indicating high false positivity rates. This data could be explained by
the high background reading in ELISA, which could be the result of poor quality of crude
viral lysate antigen used. Hence for future studies, pure viral antigens will be more
beneficial.
In the current study, sensitivity was the primary concern because the IgG ELISA assay was
originally proposed to employ as a screening assay. The higher the affinity of antibodies,
the more sensitive the assay. Presence of background signals from the assay could also
95
result in poor sensitivity (Andreotti et al., 2003). Specificity and sensitivity have an inverse
relationship and adjustment of cut-off method can be performed to boost the specificity
and sensitivity rates to fit in with the aim of the study (Cuzzubbo et al., 1999).
Concordance values of 55.7% for C6/36 ELISA and 66.7% for Vero ELISA based on
method one and concordance value of 55.6% for both C6/36 and Vero ELISA measured
based on method two. Thus concordance rates were marginally better using method one.
Based on the data collected, Vero ELISA gave more accurate result compared to C6/36
ELISA. Vero ELISA using the first cut-off method of negative control ± 3 SD gave the
best performance, although specificity was still poor at 25% and as a result PPV was also
low (57.1%). Low PPV means, that the ELISA assay might not be able to distinguish
clearly samples which are truly positive that from negative ones, which could be a result of
small number of samples that were tested against.
Time was the main constraint preventing further improvement of the low sensitivity and
specificity of IgG ELISA. However, for future work, this indirect ELISA could be
enhanced with the usage of a much better purified viral protein extraction to reduce
contaminants that may give background readings. The assay should be further developed
with more positive and negative patient sera. Developing an ELISA capture assay which is
capable of detecting low levels of antibodies present in patients’ serum can also enhance
specificity and sensitivity. ELISA capture assay can be further improved by using
recombinant protein of the CHIKV viral protein and anti-CHIKV monoclonal antibodies
that could result in higher specificity with reduced non-specific binding compared to
indirect ELISA.
96
6.0 CONCLUSION
The in-house indirect IgG ELISA designed was an appropriate technique as a qualitative
detection tool. Although the use of Vero ELISA was more sensitive, overall specificity
rates were low, meaning that further optimization is required before this assay may be
considered acceptable for use.
To improve specificity, future work could focus on the development of an ELISA capture
assay, using monoclonal anti-CHIKV antibodies. The serum samples obtained from Bagan
Panchor outbreak exhibited a detectable immunological response against the 32kDa viral
capsid protein. Therefore, the capsid protein would be possible candidate as a recombinant
protein for use in the assay, which would offer much higher specificity with less cross-
reactivity. A large amount of serum samples should have been tested to further validate the
assay instead of using a small number. The ELISA assay should be tested for cross-
reactivity against other vector-borne viruses such as dengue. Development of monoclonal
or polyclonal antibodies for the ELISA detection would improve the specificity as well as
the sensitivity of the method. And this can further enhance the development of ELISA
capture method which is much preferred over indirect ELISA. The application of
recombinant CHIKV antigen would also offer more specificity with less cross-reactivity.
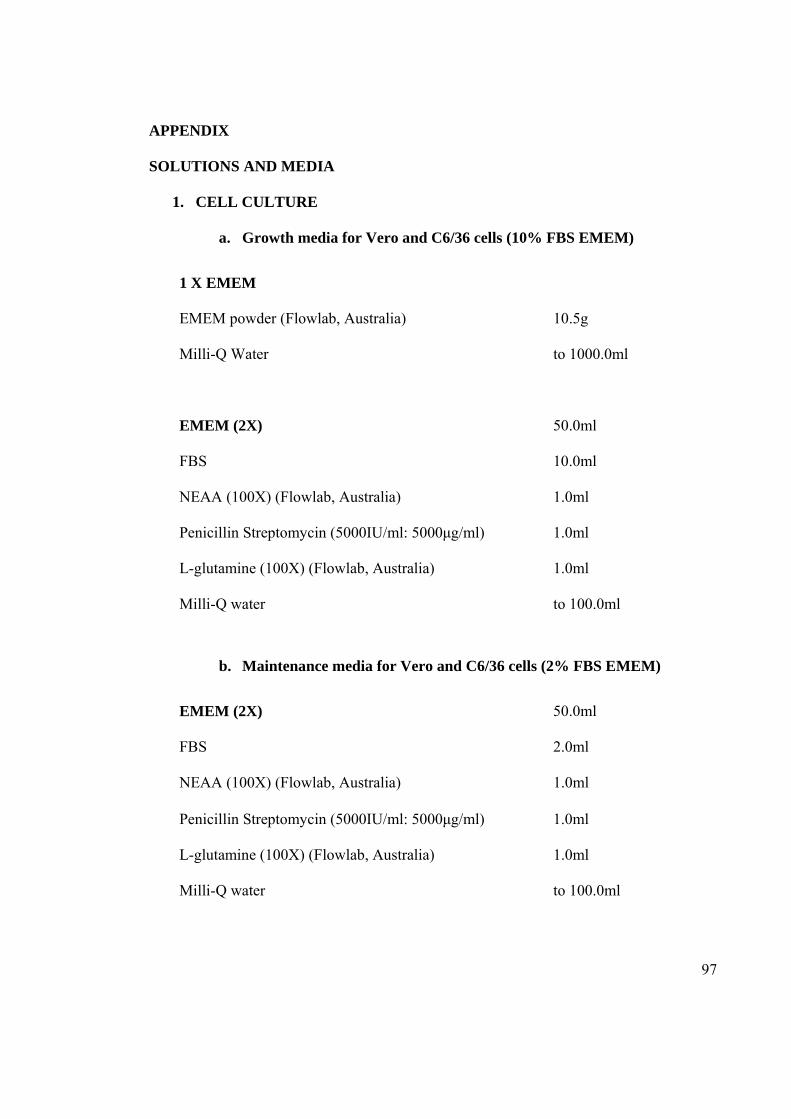
97
APPENDIX
SOLUTIONS AND MEDIA
1. CELL CULTURE
a. Growth media for Vero and C6/36 cells (10% FBS EMEM)
b. Maintenance media for Vero and C6/36 cells (2% FBS EMEM)
1 X EMEM
EMEM powder (Flowlab, Australia) 10.5g
Milli-Q Water to 1000.0ml
EMEM (2X) 50.0ml
FBS 10.0ml
NEAA (100X) (Flowlab, Australia) 1.0ml
Penicillin Streptomycin (5000IU/ml: 5000μg/ml) 1.0ml
L-glutamine (100X) (Flowlab, Australia) 1.0ml
Milli-Q water to 100.0ml
EMEM (2X) 50.0ml
FBS 2.0ml
NEAA (100X) (Flowlab, Australia) 1.0ml
Penicillin Streptomycin (5000IU/ml: 5000μg/ml) 1.0ml
L-glutamine (100X) (Flowlab, Australia) 1.0ml
Milli-Q water to 100.0ml
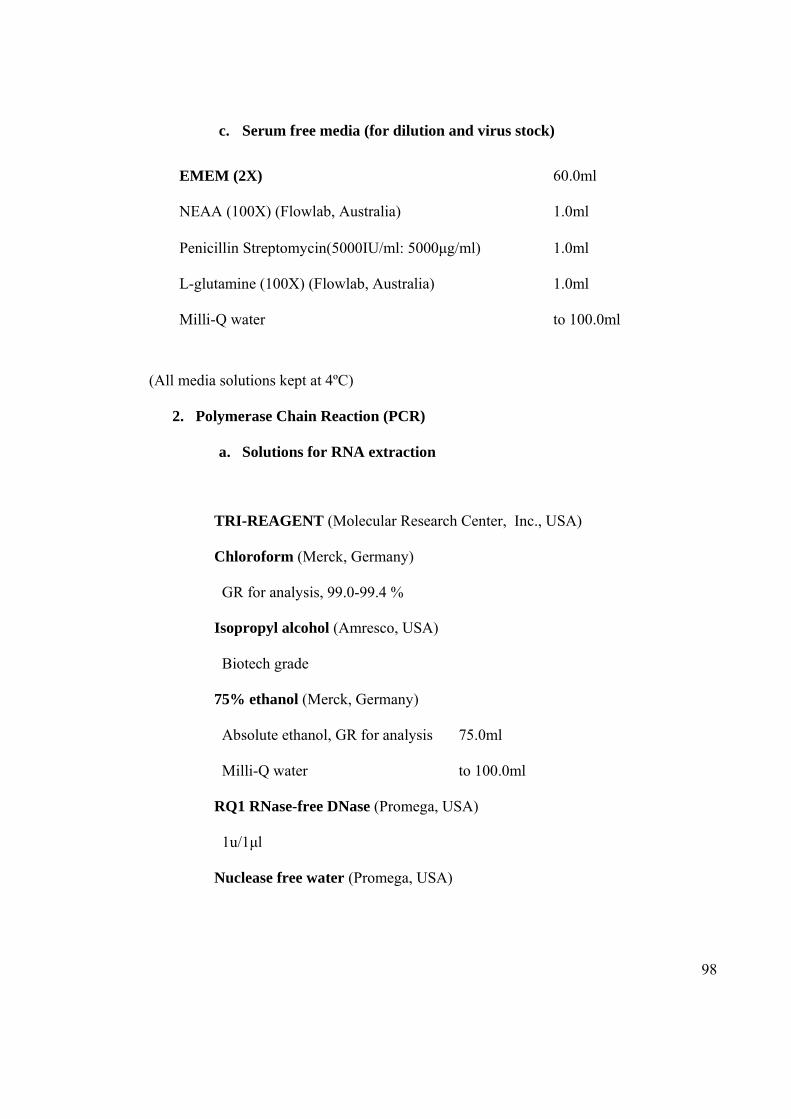
98
c. Serum free media (for dilution and virus stock)
(All media solutions kept at 4ºC)
2. Polymerase Chain Reaction (PCR)
a. Solutions for RNA extraction
TRI-REAGENT (Molecular Research Center, Inc., USA)
Chloroform (Merck, Germany)
GR for analysis, 99.0-99.4 %
Isopropyl alcohol (Amresco, USA)
Biotech grade
75% ethanol (Merck, Germany)
Absolute ethanol, GR for analysis 75.0ml
Milli-Q water to 100.0ml
RQ1 RNase-free DNase (Promega, USA)
1u/1μl
Nuclease free water (Promega, USA)
EMEM (2X) 60.0ml
NEAA (100X) (Flowlab, Australia) 1.0ml
Penicillin Streptomycin(5000IU/ml: 5000μg/ml) 1.0ml
L-glutamine (100X) (Flowlab, Australia) 1.0ml
Milli-Q water to 100.0ml
99
b. Solutions for agarose gel electrophoresis
0.5 X TAE buffer
10 X TAE buffer 50ml
RO water to 1000.0ml
Ethidium bromide (10mg/ml)
Ehtidium bromide 100.0g
RO water to 10.0ml
Loading dye (Promega, USA)
DNA ladder 100bp (Promega, USA)
3. ELISA
a. 10X Phosphate buffer saline (PBS) pH 7.5
(pH titrated to pH 7.5. Autoclaved for 20 minutes at 121ºC. Kept at room
temperature. Fresh 1X PBS was prepared by diluting with autoclaved mili-Q water
when required. Solution kept at 4ºC)
Na2HPO4, 8mM (Merck,Germany) 114g
KH2PO4, 1.5mM (Merck, Germany) 2.0g
NaCl, 0.14M (Merck, Germany) 80.0g
KCl, 2.7 mM (Merck,Germany) 2.0g
Milli-Q water to 1 L
100
b. Homogenization buffer
(Solution autoclaved for 20 minutes at 121ºC. Kept at 4ºC.)
c. Carbonate bicarbonate buffer (0.05M, pH 9.6)
(pH titrated to pH 9.6. Autoclaved for 20 minutes at 121ºC. Kept at 4ºC)
4. WESTERN BLOT
a. SDS-PAGE 10% separating gel
Tris-HCl, pH 7.5, 2M (invitrogen, USA) 5.0 ml
KCl, 1.5M (Merck, Germany) 100.0ml
MgCl2, 0.2M (Merck, Germany) 10.0ml
CaCl2, 0.2M (Merck,Germany) 10.0ml
Milli-Q water to 1 L
Sodium carbonate anhydrous (Sigma,USA) 0.53g
Sodium hydrogen carbonate (Sigma,USA) 0.42g
Milli-Q water 100.0ml
1.5M Tris-HCl, pH 8.8 (Invitrogen, USA) 4.0ml
10% SDS (Bio-Rad,USA) 160.0µl
Milli-Q water 6.36ml
30% Bis/acrylamide (GE Healthcare, USA) 5.34ml
10% Ammonium Persulphate 160.0µl
TEMED (Invitrogen, USA) 12.0µl
101
b. SDS-PAGE 4% stacking gel
c. 3X SDS buffer
(Kept at -20ºC)
d. 10X Tank buffer
0.5MTris-HCl; pH 8.8 (Invitrogen, USA) 1.25ml
10% SDS (Bio-Rad,USA) 50.0µl
Mili-Q water 2.98ml
30% Bis/acrylamide (GE Healthcare, USA) 0.67ml
10% Ammonium Persulphate 40.0µl
TEMED (Invitrogen,USA) 3.0µl
Tris-HCl, 0.5M, pH 6.8 (Invitrogen, USA) 3.75ml
SDS (Bio-Rad,USA) 0.6g
100% Glycerol (GE Healthcare, USA) 3.0ml
0.1% Bromophenol blue (Bio-Rad, Sweden) 3.0ml
Dithiothreitol (GE Healthcare, USA) 0.465g
Milli-Q water to 100.0ml
Tris-base (Invitrogen, USA) 30.0g
Glycine (Sigma,USA) 144.0g
Mili-Q water to 1 L
102
(Autoclaved for 20 minutes at 121°C then 10g SDS added. Kept at room
temperature. Fresh 1X tank buffer prepared by diluting with autoclaved mili-Q
water.
e. 10X Anode buffer I (0.3M Tris-base, 10% methanol, pH 10.4)
(pH titrated to pH 10.4. Autoclaved for 20 minutes at 121ºC. Kept at 4ºC. Fresh 1X
Anode buffer I prepared by diluting with mili-Q water and added with methanol
when needed. Solution kept at 4ºC)
f. 10X Anode buffer II (25 mM Tris, 10% methanol, pH 10.4)
(pH titrated to pH 10.4. Autoclaved for 20 minutes at 121ºC. Kept at 4ºC. Fresh 1X
Anode buffer II prepared by diluting with mili-Q water and added with methanol
when needed. Solution kept at 4ºC)
g. 10X Cathode buffer
3M Tris-base (Invitrogen, USA) 181.71g
Milli-Q water to 500.0ml
Tris-base (Invitrogen, USA) 15.14g
Milli-Q water to 500.0ml
Tris-base (Invitrogen, USA) 15.14g
Glycine (Sigma, USA) 15.01g
Milli-Q water to 500.0ml
103
(pH titrated to pH 10.4. Autoclaved for 20 minutes at 121ºC. Kept at 4ºC. Fresh 1X
Cathode buffer prepared by diluting with mili-Q water and added with methanol
when needed. Solution kept at 4ºC)
h. Coomassie blue stain
(Solution kept at room temperature)
Coomassie blue G250 (Bio-Rad, USA) 0.25g
Methanol (Merck, Germany) 400.0ml
Acetic Acid (Merck, Germany) 70.0ml
Milli-Q water to 1 L
104
REFERENCES
1. AbuBakar S, Sam IC, Wong PF, MatRahim N, Hooi PS, Roslan N. Reemergence of
endemic Chikungunya, Malaysia. Emerg Infect Dis 2007; 13: 147-149.
2. Akerstedt J. An indirect ELISA for detection of Encephalitozoon cuniculi infection in
farmed blue foxes (Alopex lagopus). Acta Vet Scand 2002; 43: 211-220.
3. Andreotti PE, Ludwig GV, Peruski AH, Tuite JJ, Morse SS, Peruski LF. Immunoassay
of infectious agents. BioTechniques Euro Edition 2003; 35: 850-859.
4. Blackburn NK, Besselaar TG and Gibson G. Antigenic relationship between
Chikungunya virus strains and O’nyong-nyong virus using monoclonal antibodies.
Res Virol 1995; 146: 69-73.
5. Chevillon C, Briant L, Renaud F, Devaux C. The Chikungunya threat:an ecological
and evolutionary perspective. Trends Microbiol 2007; 16: 80-88.
6. Cho B, Kim J, Cho JE, Jeon BY, Park S. Expression of the capsid protein of
Chikungunya virus in a baculovirus for serodiagnosis of Chikungunya disease. J Virol
Methods 2008; 49(5); 828-835.
7. Cunningham A, Buckley SM, Casals J, Webb SR. Isolation of chikungunya virus
contaminating an Aedes albopictus cell line. J Gen Virol 1975; 27: 97-100.
105
8. Cuzzubo AJ, Vaughn DW, Nisalak A, Solomon T, Kalayanarooj S, Aasov J, Dung
NM, Devine PL. Comparison of PanBio dengue duo enzyme-linked immunosorbent
assay (ELISA) and MRL dengue fever virus immunoglobulin M capture ELISA for
diagnosis of dengue virus infection in Southeast Asia. Clin Diagn Lab Immunol. 1999;
6: 705-712.
9. Deshmane S and Banerjee K. Analysis of alphavirus polypeptides by two dimensional
polyacrylamide gel electrophoresis. J Biosci 1983; 5: 189-201.
10. Hanon N and Mayhew CJ. Multiple assessment and serum neutralization of arbovirus
mixtures. Applied Microbiol 1970; 20: 653-654.
11. Hasebe F, Parquet MC, Pandey BD, Mathenge EG, Morita K, Balasubramaniam V,
Saat Z, Yusop A, Sinniah M, Natkunam S, Igarashi A. Combined detection and
genotyping of Chikungunya virus by a specific reverse transcription-polymerase chain
reaction. J Med Virol 2002; 67: 370-374.
12. Johnson AJ MD, Karabatsos N, Roehrig JT. Detection of anti-arboviral
immunoglobulin G by using a monoclonal antibody-based capture enzyme-linked
immunosorbent assay. J Clin Microbiol 2000; 38: 1827-1831.
13. Kowalzik S, Xuan NV, Weissbrich B, Scheiner B, Schied T, Drosren C, Muller A,
Stich A, Rethwilm A, Bodem J. Characterisation of a chikungunya virus from a
German patient returning from Mauritius and development of a serological test. Med
Microbiol Immunol 2008; 197: 381-386.

106
14. Lam SK, Chua KB, Hooi PS, Rahimah MA, Kumari S, Tharmaratnam M, Chuah SK,
Smith DW, Sampson IA. Chikungunya infection--an emerging disease in Malaysia.
Southeast Asian J Trop Med Public Health 2001; 32: 447-451.
15. Lanciotti RS, Kosoy OL, Laven JJ, Panella AJ, Velez JO, Lambert AJ and Campbell
GL. Chikungunya virus in US travelers returning from India, 2006. Emerg Infect Dis
2007; 13: 764-767.
16. Laras K, Sukri NC, Larasati RP, Bangs MJ, Kosim R,Djauzi, Wandra T, Master J,
Kosasih H, Hartati S, Beckett C, Sedyaningsih ER, Beecham HJ, Corwin AL.
Tracking the re-emergence of epidemic chikungunya virus in Indonesia. Trans R Soc
Trop Med Hyg 2005; 99: 128-141.
17. Lao CC, Adelson ME, Mordechai E,Raphaelli I, Tilton RC. Serological diagnosis of
human babesiosis by IgG enzyme-linked immunosorbent assay. Current Microbiol
2004; 49: 385-389.
18. Malaysia Ministry of Health. Current situation of dengue and Chikungunya in
Malaysia for week 14, 2009(5-11 April 2009) (2009 Apr 14) [cited 2009 Apr 17].
19. Martin DA, Muth DA, Brown T, Johnson AJ, Karabatsos N, Roehrig JT.
Standardization of immunoglobulin M capture enzyme-linked immunosorbent assay
for routine diagnosis of arboviral infections. J Clin Microbiol 2000; 38: 1823-1826.
20. Mohan A. Chikungunya fever: clinical manifestations & management. Indian J Med
Res 2006; 124: 471-474.
107
21. Noridah O, Paranthaman V, Nayar SK, Masliza M, Ranjit K, Norizah I, Chem YK,
Mustafa M, Kumarasamy V, Chua KB. Outbreak of chikungunya due to virus of
Central/East African genotype in Malaysia. Med J Malaysia 2007; 62: 323-328.
22. Panning M, Charrel RN, Mantke OD, Landt O, Niedrig M, Drosten C. Coordinated
implementation of Chikungunya virus reverse transcription–PCR. Emerg Infect Dis
2009; 15: 469-471.
23. Pialoux G, Gauzere BA, Jaureguiberry S, Strobel M. Chikungunya, an epidemic
arbovirosis. Lancet Infect Dis 2007; 7: 319-327.
24. Porter KR, Tan R, Istary Y, Suharyono W, Sutaryo, Widjaja S, Ma’Roef C,
Listiyaningsih E, Kosasih H, Hueston L, McArdle J, Juffrie M. A serological study of
Chikungunya virus transmission in Yogyakarta, Indonesia: evidence for first outbreak
since 1982. Southeast Asian J Trop Med Public Health 2004; 35: 408-415.
25. Powers AM, Brault AC, Tesh RB and Weaver SC. Re-emergence of Chikungunya and
O’nyong-nyong viruses: evidence for distinct geographical lineage and distant
evolutionary relationship. J Gen Virol 2000; 81: 471-479.
26. Powers AM, Logue CH. Changing patterns of chikungunya virus: re-emergence of a
zoonotic arbovirus. J Gen Virol 2007; 88: 2363-2377.
27. Renault P, Solet JL, Sissoko D, Balleydier E, Larrieu S, Filleul L, Lassalle C, Thiria J,
Rachou E, Valk HD, Ilef D, Ledrans M, Quatresous I, Quenel P, Pierre V. A major
epidemic of Chikununya virus infection on Reunion Island, France, 2005-2006. Am J
Trop Med Hyg 2007; 77: 727-731.
108
28. Rohani A, Yulfi H, Zamree I, Lee HL. Rapid detection of chikungunya virus in
laboratory infected Aedes aegypti by reverse-transcriptase-polymerase chain reaction
(RT-PCR). Trop Biomed 2005; 22: 149-154.
29. Sam IC, Chan YF, Chan SY, Loong SK, Chin HK, Hooi PS, Ganeshwrie R and
AbuBakar Sazaly. Chikungunya virus of Asian and Central / East African genotypes
in Malaysia. J Clin Virol 2009;46: 180-183.
30. Schlesinger, S., and Schlesinger, M. (1996) Alphaviruses. In Fields' Virology (Fields,
B. N., ed) , pp. 825-841, Lippincott-Raven, Philadelphia.
31. Schuffenecker I, Iteman I, Michault A, Murri S, Frangeul L, Vaney MC, Lavenir R,
Pardigon N, Reynes JM, Pettinelli F, Biscornet L, Diancourt L, Michel S, Duquerroy
S, Guigon G, Frenkiel MP, Brehin AC, Cubito N, Despres P, Kunst F, Rey FA, Zeller
H, Briss S. Genome microevolution of chikungunya viruses causing the Indian Ocean
outbreak. PLoS Med 2006; 3: e263.
32. Simizu B, Yamamoto K, Hashimoto K, Ogata T. Structural proteins of chikungunya
virus. J Virol 1984; 51: 254-258.
33. Sissoko D, MoendanzeA, Malvy D, Giry C, Ezzedine K, Louis J. Seroprevalence and
risk factors of Chikungunya virus infection in Mayotte, Indian Ocean, 2005-2006: A
population-based survey. PLoS ONE 2008; 3: e3066.
34. Soon YY, Junaidi I, Kumarasamy V, Chem YK, Juliana R and Chua KB.
Chikungunya virus of central/east African genotype detected in Malaysia. Med J
Malaysia 2007; 62: 214-217.
109
35. Sourisseau M, Schilte C, Casartelli N, Touillet C, Guivel-Benhassine F, Rudnicka D,
Sol-Foulon N, Le Roux K, Prevost MC, Fsihi H, Frenkiel MP, Blanchet F, Afonso
PV, Ceccaldi PE, Ozden S, Gessain A, Schuffenecker I, Vershasselt B, Zamborlini A,
Saib A, Rey F, Arenzana-Seisdedos F, Despres P, Michault A, Albert ML, Schwartz
O. Characterization of reemerging chikungunya virus. PLoS Pathog 2007; 2: e89.
36. Wu HS, Chiu SC, Tseng SC, Lin SF, Lin JH, Hsu YF, Wang MC, Lin TL, Yang WZ,
Ferng TL, Huang KH, Hsu LC, Lee LL, Yang JY, Chen HY, Su SP, Yang SY, Lin
TH, Su IJ. Serologic and molecular biologic methods for SARS-associated
coronavirus infection, Taiwan. Emerg Infect Dis 2004; 10: 304-310.