development of a simplified plasma opening switch using an inverse pinch as a plasma source
TRANSCRIPT

DSWA-TR-98-71
DEVELOPMENT OF A SIMPLIFIED PLASMA OPENING
SWITCH USING AN INVERSE PINCH AS A PLASMA
SOURCE
Approved for public release; distribution is unlimited.
September 2000
Prepared for: Defense Threat Reduction Agency 45045 Aviation Drive Dulles, VA 20166-7517
DNA 001-95-C-0014
John J. Moschella, et. al.
Prepared by: HY-Tech Research Corporation 104 Centre Court
RadforcLVA 24141
20010308 042

DESTRUCTION NOTICE:
Destroy this report when it is no longer needed. Do not return to sender.
PLEASE NOTIFY THE DEFENSE THREAT REDUC- TION AGENCY, ATTN: ADM, 45045 AVIATION DRIVE, DULLES, VA 20166-7517, IF YOUR ADDRESS IS INCORRECT, IF YOU WISH IT DELETED FROM THE DISTRIBUTION LIST, OR IF THE ADDRESSEE IS NO LONGER EMPLOYED BY YOUR ORGANIZATION.
i

DISTRIBUTION LIST UPDATE
This mailer is provided to enable DTRA to maintain current distribution lists for reports. We would
appreciate vou providing the requested information.1
□ Add the individual listed to your distribution list.
Q Delete the cited organization/individual.
□ Change of address.
Note: Please return the mailing label from the document so that any additions, changes, corrections or deletions can be made easily. For distribution cancellation or more information call DTRA/ADM (703) 325-1036.
NAME:
ORGANIZATION:
OLD ADDRESS NEW ADDRESS
TELEPHONE NUMBER: ( )
DTRA PUBLICATION NUMBERffiTLE CHANGES/DELETIONS/ADDITIONS, etc.) (Attach Sheet If mom Space Is Required)
DTRA or other GOVERNMENT CONTRACT NUMBER:
CERTIFICATION of NEED-TO-KNOW BY GOVERNMENT SPONSOR (if other than DTRA):
SPONSORING ORGANIZATION:
CONTRACTING OFFICER or REPRESENTATIVE:
SIGNATURE:

DEFENSE THREAT REDUCTION AGENCY ATTN: ADM 45045 AVIATION DRIVE DULLES, VA 20156-7517
DEFENSE THREAT REDUCTION AGENCY ATTN: ADM 6801 TELEGRAPH ROAD ALEXANDRIA, VA 22310-3398
J

REPORT DOCUMENTATION PAGE Form Approved
OUBNo 0704-Om
DCM503 ""*""**™'0n<*"*"**""****** """*"*D*"***"«■ ** ,2M ***»■VA»»"»2. •**>•» Otao(Manjg«m<t«f Budg«P*»™«* Red«*»Propel(0704-0188) WasNngion
1 AGENCY USE ONLY (Lea« blank) 2 REPORT DATE 980807
4 TITLE AND SUBTITLE
3 REPORT TYPE AND DATES COVERED Technical 950221-980730
Development of a Simplified Plasma Opening Switch Using an Inverse Pinch as a Plasma Source
6 AUTHOR(S)
John J. Moschella, Edward J. Yadlowsky, and Robert C. Hazelton
7 PERFORMING ORGANIZATION NAME(S) AND ADDRESS(ES)
HY-Tech Research Corporation 104 Centre Court Radford, VA 24141
9 SPONSORING/MONITORING AGENCY NAME(S) AND ADDRESS(ES)
Defense Threat Reduction Agency 45045 Aviation Drive Dulles, VA 20166-7517
NSSS/Schneider
11 SUPPLEMENTARY NOTES
5 FUNDING NUMBERS
C-DNA001-95-C-0014
PE - 4662
PR-AB
TA-IE
WU - DH60854
8 PERFORMING ORGANIZATION REPORT NUMBER»
10 SPONSORING/MONITORING AGENCY REPORT NUMBER
DSWA-TR-98-71
This work is sponsored by the Defense Threat Reduction Agency under RDT&E RMC code B 4622 D AB IE 8010 A AF 25904D.
12a DISTRIBUTION/AVAILABILITY STATEMENT
Approved for public release; distribution is unlimited.
12b DISTRIBUTION CODE
13 ABSTRACT {Maximum 200 words) ~ "—"
The design, development, and testing of the "inverse pinch" plasma source for plasma opening switches is described. This source relies on the breakdown of a gas to form a plasma in an arrangement that is the inverse of a gas puff z-pinch. The plasma produced by the IP is best described as an expanding plasma ring and it has been designed to work with switches that have an IT product greater than 1 MA-us. As a result, when using this source with a cylindrical POS, a single device mounted inside the center conductor is required as the ejected plasma matches the symmetry of the transmission line. The plasma produced by the IP was characterized on a test bed using framing photography, magnetic pick-up loops, spectroscopy, as well as single and dual beam heterodyne interferometry in various configurations. The results from field testing on the Hawk cylindrical POS with a shorted load is also reported. The POS experiments with a short circuit load indicated superior performance using a hydrogen plasma with strong dependence on the initial conditions. The data also implies that the conduction phase of the POS is influenced by secondary plasma formation from electrode surfaces. Further experimentation using the IP with H2 gas is planned.
14 SUBJECT TERMS
Inverse Pinch POS Plasma Source
17 SECURITY CLASSIFICATION OF REPORT
UNCI.ASSII-IF.I)
18 SECURITY CLASSIFICATION OF THIS PAGE
UNCl.ASSIFIHD
19 SECURITY CLASSIFICATION OF ABSTRACT
UNCLASSH'IKI)
NSN 7540-01-280-5500 Standard Form 298 (Rev 2-89)
15 NUMBER OF PAGES 74
16 PRICE CODE
20 LIMITATION OF ABSTRACT
SAR
Standard Form 298 (Rev 2-89) Presented by ANSI Sla 239 18 796 102
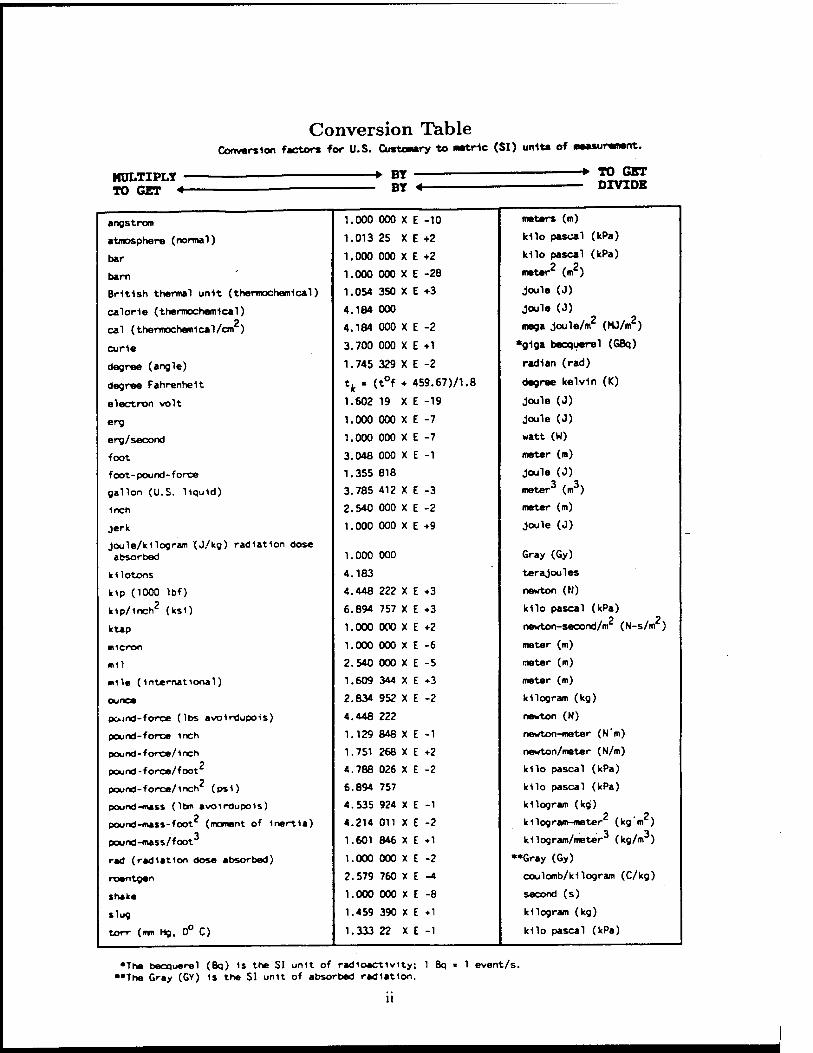
Conversion Table Conversion factor« for U.S. Customary to «»trie (SI) units of «»asurement.
MULTIPLY - TO GET «-
-► BY — BY «-
TO GET DIVIDE
angstrom
atmosphere (normal)
bar
1.000 000 X E -10
1.013 25 X E +2
1.000 000 X E +2
meters (m)
kilo pascal (kPa)
kilo pascal (kPa)
barn 1.000 000 X E -28 meter2 (m2)
British thermal unit (thermochemlcal) 1.054 350 X E +3 Joule (J)
calorie (thermochemlcal) 2
cal (thermochemlcal/cm )
curie
4.184 000
4.184 000 X E -2
3.700 000 X E +1
Joule (J)
mega Joule/m2 (KJ/m2)
*g1ga becquerel (GBq)
degree (angle) 1.745 329 X E -2 radian (rad)
degree Fahrenheit tk . (t°f + 459.67)/1.8 degree kelvln (K)
electron volt 1.602 19 X E -19 Joule (J)
erg 1.000 000 X E -7 Joule (J)
erg/second 1.000 000 X E -7 watt (W)
foot 3.048 000 X E -1 meter (m)
foot-pound-force 1.355 818 Joule (J)
gallon (U.S. liquid) 3.785 412 X E -3 meter3 (m3)
inch 2.540 000 X E -2 meter (m)
Jerk 1.000 000 X E +9 Joule (J)
Joule/kilogram (J/kg) radiation dose absorbed 1.000 000 Gray (Gy)
kilotons 4.183 terajoules
kip (1000 lbf) 4.448 222 X E +3 newton (N)
kip/inch2 (ksi) 6.894 757 X E +3 kilo pascal (kPa)
ktap 1.000 000 X E +2 newton-second/m (N-s/m )
micron 1.000 000 X E -6 meter (m)
mil 2.540 000 X E -5 meter (m)
mile (international) 1.609 344 X E +3 meter (m)
ounce 2.834 952 X E -2 kilogram (kg)
pojnd-force (lbs avoirdupois) 4.448 222 newton (N)
pound-force Inch 1.129 848 X E -1 newton-meter (N'm)
pound-force/1nch 1.751 268 X E +2 newton/meter (N/m) 2
pound -force/foot 4.788 026 X E -2 kilo pascal (kPa) 2
pound-force/inch (psi) 6.894 757 kilo pascal (kPa)
pound-mass (1bm avoirdupois) 4.535 924 X E -1 kilogram (kg)
pound-mass-foot (moment of inertia) 4.214 011 X E -2 kilogram-meter (kg'm )
pound-mass/foot 1.601 846 X E «1 kilogram/meter (kg/m )
rad (radiation dose absorbed) 1.000 000 X E -2 "Gray (Gy)
roentgen 2.579 760 X E -4 coulomb/kilogram (C/kg)
shake 1.000 000 X E -8 second (s)
slug 1.459 390 X E ♦! kilogram (kg)
torr (mm Hg, 0° C) 1.333 22 X E -1 kilo pascal (kPa)
•The becquerel (Bq) is the SI unit of radioactivity; 1 Bq « 1 event/s. ••The Gray (GY) 1s the SI unit of absorbed radiation.
11

Table of Contents
Section Page
Cohversion Table ü
Figures yi
Tables vii
1 Executive Summary 1
2 Introduction 3
3 Overview of Inverse Pinch Operation 5
4 Design of the Inverse Pinch 9
4.1 The Gas Delivery System 9
4.2 Electrode and Cable Feed Design 11
4.3 Evolution of the Inverse Pinch 11
5 Diagnostics for the Inverse Pinch 15
5.1 Rogowski Current Monitor 15
5.2 Visible Light Framing Camera 15
5.3 Magnetic Pick-Up Loops 16
5.4 Time Resolved Heterodyne Interferometer 18
5.5 Two Wavelength Interferometry 22
5.6 Spectroscopic Measurements 23
6 Experimental Measurements 24
6.1 Neutral Gas Measurements 24
6.2 Measurements on the Expanding Plasma Shell 25
6.2.1 Visible Light Framing Photography 27
6.2.2 Magnetic Pick-up Loops 27
6.2.3 Chordal Line-of-Sight Interferometry 29
6.3 Measurements on the Exhaust Plasma 29
in

Table of Contents (Continued)
Section Page 6.3.1 Exhaust Measurements Using Heterodyne Interferometry 31
6.3.2 Snowplow Model for the IP 35
6.4 Measurements in a POS-like Configuration 39
6.4.1 The Axial Distribution of Plasma in a POS Gap 40
6.4.2 Plasma Radial Distribution 45
6.4.3 Plasma Azimuthal Symmetry 47
6.4.4 Spectroscopic Measurements on the H Plasma 47
6.4.5 Plasma Reproducibility - 52
6.4.6 Mass Density Control 52
7 Results of POS Experiments on Hawk 54
7.1 Hardware and Diagnostics 54
7.2 POS Shots Using the IP 55
7.2.1 Density Evolution: Conduction Phase for IP/H2 Shots 59
7.2.2 Density Evolution: Opening Phase for IP/H2 Shots 61
7.2.3 Density Evolution: IP/Ar Shots 62
7.2.4 Scaling of POS Current 63
7.2.5 Comments on IP/Air and IP/Ne Shots 64
8 Conclusions 66
Appendix
Bibliography 68
Distribution List 70
IV

Figures
Figure PaSe
1 Configuration of the IP inside Hawk 4
2 Scaled drawing of the inverse pinch 5
3 Operational mechanism of the IP 6
4 Current vs. time for an IP discharge 7
5 Detail of the General Valve series 9 gas valve 10
6 An early version of the inverse pinch with 20 cm diameter electrode plates . 12
7 Circuit schematic of puff valve pulser 13
8 Experimental set up of the high-speed framing camera 16
9 Configurations used for B-dot loops 17
10 Schematic of the He-Ne interferometer 19
11 Schematic of the two channel He-Ne interferometer 20
12 Various configurations used for interferometry 21
13 Schematic of the spectroscopic apparatus 22
14 Interferometer beam positions used for neutral gas measurements 25
15 H2 density vs. radius from neutral gas measurements 26
16 H2 mass/length vs. time from neutral gas measurements 27
17 Visible light frame photos of the expanding plasma shell 28
18 Results from the magnetic pick-up loop array on the expanding plasma ... 30
19 Chordal line-of-sight interferometry signals on the expanding plasma 31
20 Abel inverted density profiles of the expanding plasma for various gases ... 32
21 Plasma position and velocity as determined via chordal interferometry .... 33
22 Plasma density as a function of time for the IP discharge 34
23 Illustration of a ID snowplow 35
24 Electrical circuit for the inverse pinch 36
25 Neutral gas distribution used for the snowplow calculation 37

Figures (Continued)
Figure Page 26 Results of the ID snowplow calculation 38
27 The IP mounted in a "mocked-up" POS 41
28 Laser beam positions used to measure the axial distribution 41
29 Plasma axial distribution with a 95% transparent inner boundary ...... 42
30 Results from axially resolved B-dot loops 43
31 Model explaining axial spreading 44
32 The IP with a screened inner boundary 45
33 Relative axial distribution of plasma in a POS gap with a screened inner
boundary (various gases) 46
34 Hydrogen plasma radial distribution in a POS gap at various times 48
35 Results from two channel interferometry with a 30° beam separation 48
36 Hydrogen plasma density in a POS gap vs. puff valve pressure 52
37 Load current traces obtained using the IP and cable guns on Hawk 58
38 Peak POS voltage vs. conduction time for IP/H2 shots on Hawk 58
39 Electron density vs. time from the 8-channel interferometer for an IP/H2 shot
on Hawk 59
40 Electron density vs. radius at various times during an IP/H2 shot on Hawk . 60
41 Electron inventory vs. time during an IP/H2 shot on Hawk 62
42 Conducted current vs. initial electron density for IP data on Hawk with MHD
theory 64
VI

Tables
Table Page
1 Data on exhaust plasma for various gases and predicted ionization level ... 39
2 Identified impurity emission lines observed with the "dirty" IP 49
3 Data of obtainable mass densities in the mocked-up POS geometry 53
4 IP/Hawk shot data 56
vn

Section 1
Executive Summary
The inverse pinch (IP) is a new type of plasma source that has been designed specifically
for cylindrical plasma opening switches. While inverse pinch geometry has been used in
the past for dense plasma focus studies [1] and low inductance closing switches,[2] to our
knowledge this is the first device intended as a plasma source. During the course of this
program, we designed, built, and tested the source at HY-Tech's laboratories and fielded
it on the Hawk POS at the Naval Research Laboratory. The tests on Hawk, using the IP
with H2 gas, were very successful and have stimulated a great deal of interest and further
experiment at ion. When compared to plasma sources most often used for POS research, namely cable
guns and flashboards, the IP is significantly different in a number of ways and represents an
entirely different approach. The most obvious difference is that the IP is a monolithic source,
with symmetry that matches the transmission line, and it must be mounted inside the center
conductor. The more traditional scheme requires numerous sources that are arranged around
the outer conductor. The IP mounting scheme reverses the directed velocity of the plasma,
and shifts the dominant impurity source from the inner to the outer conductor. The IP is
also a gas source, where the other sources are surface discharge sources. This is potential
advantage because the plasma species can be varied by changing the type of gas, and evidence
from past experiments suggested that lighter ions improved switch characteristics. [3] Another
key difference, that may be the most important, is due to the nature of the IP plasma. We
are referring here to the fact that the plasma ejected from the IP is best characterized as
an expanding ring with very little plasma in its wake. When the IP was mounted in a
Hawk-like POS configuration, we observed re-strike plasmas that were ejected about 3.5 /zs
after the first plasma ring. This additional plasma was inconsequential on Hawk, as the
entire conduction and opening phase of the POS occurred before this plasma arrived, and if
need be it can always be removed via a crow-barred circuit. The discrete ring nature of the
plasma allowed us control the initial plasma distribution simply by varying the delay time
between the source and the generator. It also enabled us, by going to long delays, to fill the
POS gap uniformly with a plasma that was quasi-static on the time scales of the experiment

(1 (is). This is not possible with other POS sources. As it turned out, it was this uniform,
quasi-static, initial plasma that produced the best results in an opening switch.
While the version of the inverse pinch that was used on Hawk showed great promise,
it needs further investigation before it can be considered a replacement for cable guns or
flashboards. Due to the rather significant engineering effort that must be undertaken to use
the IP with a diode load, a short circuit load was used for the initial experiments on Hawk.
A short circuit load develops a relatively small voltage at the switch, and more experiments
are needed to fully investigate this source. As of this writing experiments are starting that
will use the IP on Hawk with an electron beam diode load.
We would also like to add that, the in its present configuration, the IP is hardly optimized.
There are many improvements that can be made. One of these is a structure to prevent build
up of neutral gas in the inter-electrode region of the IP, a so-called gas dump. A successful
re-design of the electrode opposite the puff valve nozzle may lengthen the usable range of
puff valve delays and reduce possible gas contamination in the POS gap. It may also result
in more consistent breakdowns and plasma reproducibility by reducing high gas pressures
on the quartz insulator. A re-design of the puff valve/nozzle system may also improve the
source. This system was essentially designed without the aid of computer simulations and
neutral gas measurements. In fact, the neutral gas measurements made at NRL suggest
that the gas shell spreads radially causing significant gas densities on the quartz insulator,
which is undesirable. Finally, a gas pre-ionization would probably result in vastly improved
consistency with regards to plasma production from shot to shot. These improvements,
while outside the scope of this initial program, should be seriously considered if the IP is
successful in future experiments.

Section 2
Introduction
This report describes the design and operation of the inverse pinch (IP) plasma source
and POS experiments conducted on the Hawk generator at NRL. This source was devel-
oped under DSWA contract #DNA001-95-C-0014 and was designed to replace arrays of
flashboards and cables guns commonly used to fill POS gaps. The inverse pinch produces a
radially expanding plasma ring that can be used to fill a POS gap if the IP is place inside the
center conductor of the pulsed power machine. Such a configuration is depicted in Figure 1
that shows the IP inside the Hawk center conductor. This report will describe the general
operation of the IP with emphasis on the characteristics of the plasma that are most impor-
tant to POS applications, and results of the first tests of the source on the Hawk generator.
Therefore, we will report measurements on the plasma properties, and pertinent measure-
ments on the distribution of neutral gas prior to the application of the high-voltage pulse.
These plasma properties will include the mass density, axial distribution, radial distribution,
azimuthal symmetry, and shot-to-shot reproducibility using the IP configured in a POS-like
environment. We will also show POS characteristics from the Hawk experiments. The data
summarized in this report was compiled over approximately a two and one half year period
from 9/95 to 5/98.

Cathode
PuffValve
Anode
Shorted Load
Current Probes
Figure 1. The configuration of the inverse pinch inside the cylindrical plasma opening switch on Hawk. The plasma is ejected radially outward through a semi- transparent inner conductor (cathode). The capacitor bank and spark gap switch were located outside the vacuum system and the load cables (12x RG- 58) were fed through the vacuum inside the cathode.

Section 3
Overview of Inverse Pinch Operation
The version of the IP used to obtain most of the data presented in this report is shown
in Figure 2. A version with slightly reduced electrode dimensions, shown in Figure 1, was
installed on Hawk. The plasma was formed between two concentric brass disks supported
by a 3.0 cm diameter quartz tube. Over the course of the program the diameter of the
electrodes varied from 20 to 9.5 cm, but the diameter of the gas exhaust and quartz insulator
was unchanged throughout. A high voltage pulse was applied across the two disks via the
cable feed section that provided a connection for 12 RG-58 type cables. The cables were
connected to a spark gap switch/capacitor bank assembly that consisted of a single 7.4 //F
capacitor and spark gap switch. The bank was typically charged to 20 kV, and its discharge
was initiated by a trigger pulse from a PT-55.
Nozzle
Puff Valve
Quartz Insulator
/;J/SJ/;J;/.
H
*
Center Stem
Ufa rjr gys^vsF* «ww|( ^gsre ™^m^w.™
&!
/yy/y^.'/'^^^/^^^yy^
5 cm"
ESi F m
zs
Rogowski
:£ I
z2 za
RG-58 Cable
'//////A
SF6 Acrylic Tube Insulating Chamber
IP Electrodes
Figure 2. The version inverse pinch device, with 12.7 cm diameter electrodes, that was used for most of the tests at HY-Tech. The plasma is formed between the two, disc shaped, electrodes and expands radially outward. The SF6 chamber prevents electrical breakdowns along the feed cables in the vacuum.
(a)
(b)
.Plasma Current Flow
etnl Gac:y|f
■JIIIJI jjlipill| , I r \r ,-P-r 5=*
ÜE ''''' > j 7.4 (tF 20 kV
S /S / / J\
c^^>
c
h± zzzz / j j\
HP 7.4 nF 20 kV
(c)
© ©
© © <Wf/yyf^z2
- IF1-1
J J J 1~7~.
>fj ' ■> ->' f *f J
7.4 |lF 20 kV
IjxB
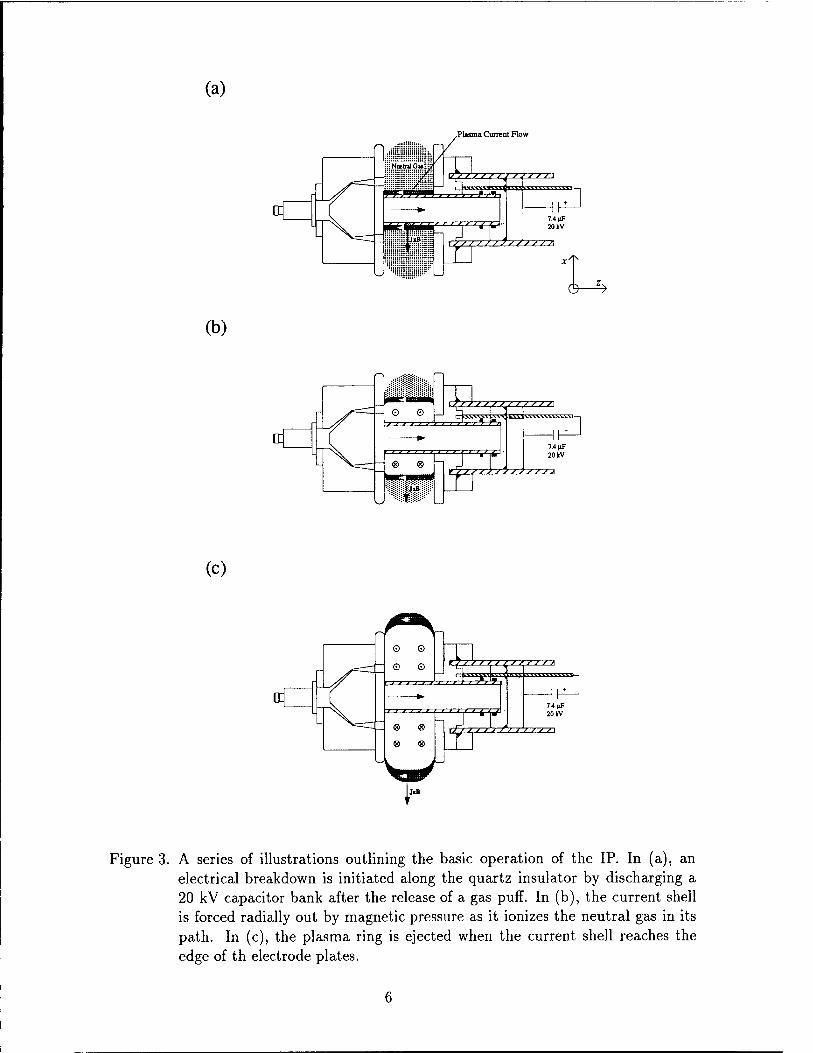
Figure 3. A series of illustrations outlining the basic operation of the IP. In (a), an electrical breakdown is initiated along the quartz insulator by discharging a 20 kV capacitor bank after the release of a gas puff. In (b), the current shell is forced radially out by magnetic pressure as it ionizes the neutral gas in its path. In (c), the plasma ring is ejected when the current shell reaches the edge of th electrode plates.

Approximately 350-700 ßs before the high-voltage spark gap switch was closed, a fast acting
puff valve discharged a volume of gas between the two disks. This delay time was needed to
allow enough gas to enter the inter-electrode region, and its magnitude depended on the type
of gas and pressure behind the valve. A nozzle directed the annular gas puff so it entered the
intra-disk region approximately 1 cm from the surface of the quartz tube via a series of 18
holes in the electrode plate. This hole pattern consisted of 5/16" diameter holes with a bolt
circle diameter of 4.6 cm. When the high voltage was applied, an electrical breakdown in
the gas occurred on the quartz tube creating a plasma in the form of a conducting cylinder.
This process was verified by optical framing photography. Since the current flowing through
the cylinder is returned along a brass center stem inside the quartz insulator, the plasma
is forced radially outward by magnetic pressure. This situation is the exact inverse of a
typical gas puff z-pinch. As the conducting cylinder expands, it ionized the gas forming an
expanding plasma ring as depicted in Figure 3. Typically, this process took 1-2 /xs for the
plasma to be ejected from the IP depending on the type of gas. Heavier gases tended to take
longer to expand due to a larger mass that the puff valve/nozzle system could supply.
o.o 0.5 1.0 1.5 2.0
Time (|is) 2.5
Figure 4. A plot of the current vs. time recorded during an IP discharge. When using H2 gas, plasma is typically ejected ~ 1 //s after the start of current.
The total current flowing through the IP was monitored using an integrated Rogowski
coil positioned inside the cable feed section as shown in Figure 2. Figure 4 shows a typical
current trace that we obtained during a 20 kV discharge. The current peaks at approximately
125 kA in 1.7 fis.

One important aspect of the operation of the IP was that the plasma was emitted as a
discrete ring. This proved to be a very important property because in a POS configuration,
the delay time between the initiation of the plasma source and the generator could be used to
control the initial distribution of plasma, independent of the quantity of plasma. Depending
on the geometrical arrangement of the source, additional breakdowns and plasma formation
during the second half cycle have been observed, particularly in the Hawk geometry. How-
ever, with no confining boundary we never observed "re-strike" plasma. The characteristics
of the expanding plasma ring are somewhat dependent on the type of gas. In general the ring
is 2 cm long immediately after exit and expands radially at a rate of 1-7 cm//js. These results
were obtained from interferometric measurements that will be described in later sections.
An important aspect of the IP in POS geometry is the configuration of center conductor
windows that allow the plasma to enter the POS gap. These need to be designed so the IP
current front is terminated at the windows and does not bow into the POS gap. We found
that bowing of the front into the gap lead to unacceptable axial acceleration of the plasma.
For instance, the center conductor on Hawk was designed with 18 openings supported by
3 mm bars. When the IP current front reaches the windows, the current continues to flow in
the bars while the plasma passes into the inter-electrode region. We tested a similar design
with 8 windows and found the the plasma was axially accelerated. In that case the larger
spacing between the windows allowed the IP current to bow into the POS gap and push the
plasma axially.

Section 4
Design of the Inverse Pinch
This section will describe the design of the inverse pinch including a review of the evolu-
tion of the source up to the final design that was installed on Hawk.
4.1 The Gas Delivery System.
The main function of the pulsed gas valve and nozzle is to introduce a volume of gas
between the disc shaped electrodes. The system designed for the IP, shown in Figure 2, was
able to accomplish this task while meeting these other constraints:
1. The valve/nozzle system introduced a large enough mass to reach plasma densities of
interest.
2. The valve delays could be adjusted, and the rise time of the gas was fast enough, to
maintain vacuum pressure in the remainder of the system with minimal contamination.
3. The valve/nozzle system operated reliably in a pulsed power environment.
Many valve systems have been designed for Z-pinch applications that produce annular gas
puffs as we required for the IP. However, the requirements for these systems are much more
stringent with respect to the spatial distribution of gas, and they typically emit quantities
of gas far in excess of that required for the IP. For the IP we only need a few hundred mT
of gas on average between the electrode plates to produce acceptable quantities of plasma.
We designed the IP valve/nozzle system around the commercially available General Valve
series 9 pulsed gas valve shown in Figure 5.[4] Physically the valve is small, it is slightly less
than 5 cm long and mounts to a flange with a 2.5 cm diameter bolt circle. The valve has
an effective plenum volume of 0.35 cm-3 and an orifice diameter of 0.8 mm. The valve shell
is threaded and is easily unscrewed from the valve body. A series of shims can be used to
adjust the position of the shell with respect to the body, and this allows one to calibrate
the gas output of the valve. It allowed us to optimize the valve operation for high pressure
operation. According to the manufacturer, when the valve is supplied with a 300 volt, 160
Us duration electrical pulse, the orifice was fully opened in 160 [is. During this time the

ARMATURE —
MAIN SPRING
O-RING
V4" O.D. TUBING COMPRESSION FITTING
SHELL
REF 2.10AFrER ASSEMBLY
1£1 NOMINAL
1_..J aUFF-ER SPRING
Figure 5. The series 9 puff valve manufactured by General Valve Inc., NJ.
poppet moves a total of 0.13 mm. Various poppet materials were available, we found that
a PEEK poppet worked best for high pressure applications since it deformed less than the
Teflon poppet. This valve is also inexpensive, reliable (lifetimes in excess of 105 shots), and
the usable range of gas pressures is 50-1000 psig. This enabled us to operate the Hawk
POS with H2 and Ar gas simply by adjusting pressures using 800 and 50 psig for the two
respectively. For the driver we used a 300 volt pulse from a 3.3 fiF capacitor with a 2 tt
resistor in series to limit the current in the 180 mH valve coil.
The nozzle was designed with primary emphasis on providing a duct for the gas to the
inter-electrode region of the IP. This was accomplished while maintaining a gradient in the
gas density so a Paschen minimum close to the quartz insulator resulted. Thus, the exit
holes for the gas were centered 1 cm away form the quartz so the gas density decreased
radially inward from the gas exit holes. This was important because the IP was designed
without gas pre-ionization and must therefore rely on a Paschen breakdown. If the gas
pressure on the quartz insulator becomes too large, then it is likely that electrical discharge
would initiate at a larger radius where the gas density is decreasing. This would result in
an expanding current shell with most of the neutral gas inside the shell, and no chance of
it being incorporating into the snow plowed plasma. In fact, we have observed that as the
puff valve delay is lengthened, and the amount of gas in the inter-electrode region increased,
the plasma production reaches a point where it begins to decrease. This was most likely due
10

to high gas pressures on the quartz insulator at the time the voltage is switched on. This
phenomenon places a practical restriction on the effective range of puff valve delays for a
given gas. However, it should be noted that the requirement of minimal gas contamination
in the POS region was more restrictive in the Hawk geometry. Measurements of the neutral
gas distribution using an ultra-sensitive interferometer at NRL, show that the gas exiting
the nozzle spreads out radially very quickly over the 5 cm gap between the electrode plates.
This indicated that a re-designed nozzle, one that would collimate the gas more effectively
to reduce build-up on the quartz insulator, would probably improve the overall operation of
the IP.
4.2 Electrode and Cable Feed Design.
The inverse pinch electrodes were constructed from brass discs. Brass was chosen because
it is a good electrical conductor and is more resistant to ablation and thermal desorption
than aluminum. The puff valve/nozzle system was mounted to one of these discs that had
series of holes to allow the gas to enter the device (IP anode), while the other had a hole
cut in the center (IP cathode). The quartz insulator and brass center stem were fed through
this hole. Since the center stem was electrically connected to the anode plate, the electrical
connections were made from one side of the device.
The cable feed section is shown in Figure 2. In this section the center conductors of
12 RG-58 type cables were fed through the end flange and electrically connected to the
cathode plate. A small solid brass cylinder was soldered to the end of each center conductor
so it could be fastened to the IP anode using set screws. The braids for these cables were
connected to the anode plate via the end flange and center stem. For this connection we
soldered a slotted brass tube to each braid which was press fit into holes in the end flange.
This allowed us to easily plug and un-plug these connections. The area surrounding the
cathode connections was enclosed with an acrylic tube which was sealed to the end flange
and cathode plate with o-rings. Additional o-rings were placed around the polyethylene on
each of the RG-58 cables and the quartz insulator to form a small, sealed chamber that was
pressurized with 40 psig of SF6. We found that the SF6 chamber allowed us to operate the
IP up to 25 kV without breakdowns.
4.3 Evolution of the Inverse Pinch.
The final design of the inverse pinch evolved over the course of the program. Most of the
data contained in this report will reflect measurements conducted on the version shown in
11

Puff Valve
Quartz Insulator
Electrodes
RG-58 12 ea.
7.4 uF, 20 kV
Figure 6. A scaled drawing of an early IP design that used 20.3 cm diameter electrode plates. The cable feed section is also longer that in later versions.
12

Figure 2. In this section we will briefly summarize the changes made during course of the
program that improved the source. The first incarnation of the IP had 20.3 cm diameter
electrode plates, did not have the sealed SF6 chamber, and the nozzle had a slightly larger
throat dimension than later versions. We quickly discovered that electrical breakdowns were
occurring along the feed cable section which was at that time in vacuum. The sealed SF6
chamber was immediately added and the version shown in Figure 6 resulted. This not only
eliminated the breakdown problem, but for later versions it allowed us to shorten the feed
section and lower the inductance. Subsequent measurements on the plasma density between
the electrode plates showed that, in a typical operating regime, the snowplow front continued
to accumulate plasma up to a radius of about 4-5 cm. As a result we decide to reduce the
diameter of the electrode plates to 5" (6.3 cm radius). This change essentially had no impact
on the operation, but made the device smaller and more practical. During the same time
period, simulations of the gas flow by Hylton Murphy at Maxwell Technologies (using 2DRZ)
on the nozzle showed an unstable behavior that was removed in the simulations by using a
narrower throat. We therefore reduced that nozzle throat size from 0.050" to 0.034" which
resulted in a noticeable more consistent behavior. +
Pneumatic /* switch
Photo Detector
Out
2N3904
S6008L 400V, 8A
SK3466
Figure 7. A circuit schematic for the puff valve driver board. This circuit is an optically triggered capacitive discharge that supplies a 300v, 1.8 A, 200 //s pulse to the
valve.
All of the modifications noted above were made within the first 6-9 months of the pro-
gram. The IP remained essentially unchanged for about 18 months until it became clear
that the device was too large to install on Hawk. A series of changes were then made to meet
the requirements of the Hawk experiments. None of these modifications had a noticeable
impact on the operation of the source from a plasma production standpoint, they were made
13

to accomidate the installation on Hawk. The first change that was made was the reduction
of the outer diameter of the IP to 9.5 cm. This allowed us to install the source inside a
Hawk cathode with a 12.7 cm outer diameter. At this time a new puff valve driver was
developed. We wanted a small, optically triggered, battery powered discharge circuit that
could be mounted in situ if the need arose. As a result, the circuit shown in Figure 7 was
developed. It couples a light signal to a photo-diode that initiates a sequence of electrical
pulses ending in the discharge of a 3.3 uF capacitor through the valve coil. A 4 0 resistor
is in series with the coil to limits the coil current to safe levels. No noticeable change in the
operation of the IP was detected below 600 psig gas pressures. However, for higher pres-
sures, capacitors smaller than 3.3 uF did not open the valve properly. An in situ mounting
system was fabricated for the driver and battery power supply. Although this was not used
on Hawk, it was successfully tested at HY-Tech and remains an option for future use.
14

Section 5
Diagnostics for the Inverse Pinch
This section will describe the diagnostic techniques that were used on the IP plasma to
determine various parameters, and monitor its operation. Most of the important results were
obtained using a time resolved, He-Ne heterodyne interferometer in a number of different
configurations. With this interferometer time dependent electron density information was
obtained. A magnetic pick-up loop array and high-speed optical framing photography was
also used to gain information on the motion of the current front. Measurements were also
conducted at the Naval Research Laboratory, using their ultra-sensitive interferometer, to
measure neutral gas distributions emanating from the puff valve/nozzle system of the IP.
Finally we will also summarize the results of spectroscopic observation conducted on the
hydrogen plasma and the subsequent modeling by Plasma Analyses.
5.1 Rogowski Current Monitor.
A Rogowski coil was constructed to monitor the total current flowing through the IP.
For most of the experiments, this monitor was mounted around the quartz insulator inside
the SF6 chamber as shown in Figure 2. The monitor had approximately 40 turns and its
output was fed into a 1 ms passive integrator. This coil was calibrated by creating a simple
discharge forcing current to flow simultaneously through the IP Rogowski and a factory
calibrated T&M Inc. current transformer. The IP mounted Rogowski had a sensitivity of
225 kA/V. Prior to the Hawk experiments, a new monitor was installed inside the spark gap
switch. This change was made to avoid having a signal cable inside the vacuum chamber.
The new monitor was constructed in a similar fashion and was placed around one of the 12
feed cables so it measured directly 1/12 of the total current.
5.2 Visible Light Framing Camera.
Using a high-speed optical framing camera, the distribution of emitted light was recorded.
Figure 8 shows the system that was used. A Kentech model 55 camera with a single imaging
lens and neutral density filters was set to view the plasma chordally between the electrode
15

Quartz Insulator
Figure 8. A schematic showing the positions of the framing camera and inverse pinch. The framing camera viewed the plasma chordally and was varied in the x- direction.
plates. The image was reduced by a factor of 3 in the process and frame times of 10 ns were
used.
5.3 Magnetic Pick-Up Loops.
An array of magnetic pick-up loops was used to investigate the motion of the current front
in the IP. The probe array consisted of six independent loops whose centers were separated
by 1 cm and were encased inside a 4 mm outer diameter quartz tube. As configured the
loops were 2 mm wide by 4 mm long, with a 6 mm space between each loop. The raw signals
obtained from these types of probes produced signals proportional to the time rate of change
of the magnetic flux through the loop area, i.e rf(B • A)/di, where B is the magnetic field and
A is the area of the loop normal. To obtain a signal proportional to the magnetic field, we
passively integrated the signal from each loop in the screen room and fed the result directly
into an oscilloscope. As a result, the signal we measured was proportional to the strength of
the magnetic field. Two arrangements of the loop array was used, and these are both shown
in Figure 9. The configuration shown in part (a) was used to determine the velocity of the
16

(a)
B-dot Loop Array
q RZZZZZZZ
/ 111111 } 111 t'i /17 n
ZZZZZZZZZZ3 ▼■ ITT^ gegCT mmuwmro
>r r j j p r-p-r ß ß p j j■ p p
tfezz
¥*
///s->////s//\
Outer Boundary
Inner Boundary^
(b)
&-^ B-dot Loop Array
3 (<; o o u u
•i i
IA/1)//,
J^ , * J J * J * \ i * * Si * j**
TT rr 77 *y ■r-r-* f f J J
efezzzzzzzzz
ZZZZ2ZZ3
i i:
-^
Figure 9. Configurations of the magnetic pick-up loop array that were used. The ori- entation in (a) was used to determine the expansion velocity of the current front, and (b) was used to investigate the axial expansion of the plasma with the IP mounted insided a "mocked-up POS."
17

current front between the IP electrodes, and the configuration in part (b) the existence of
axially expanding current fronts.
5.4 Time Resolved Heterodyne Interferometer.
A time resolved heterodyne interferometer system, using a He-Ne laser, was frequently
used to measure the plasma electron density. [5] With this type of interferometry the scene
and reference arms of the interferometer were frequency shifted by 40 MHz using an acousto-
optic modulator, or Bragg cell. Upon reconstruction, the interference pattern was modulated
at 40 MHz, and a single 40 MHz optical detector was used to detect the light. The signal
from the detector was mixed appropriately with the original 40 MHz oscillator to produce
two output signals whose ratio was equal to the tangent of the phase difference introduced
by the plasma. This diagnostic is shown schematically in Figure 10. Using that system, we
were able to achieve a phase resolution of ±1.5° by eliminating sources of noise.
Slight alterations in the set-up shown in Figure 10 were used to meet the specific needs
of a particular measurement. For instance, in cases where spatial resolution was important,
the probe (or scene) beam was focused using a long focal length lens to achieve a 1 mm
spatial resolution. Without such a lens the spatial resolution was approximately 3 mm. In
another case, a two channel interferometer was required to measure the electron density at
two locations simultaneously. For the two channel interferometer, the laser beam was split
into two probe beams and two reference beams with each pair functioning as an independent
interferometer. Two separate detectors and mixing networks were used to measure the phases
from each channel. A schematic of the two channel interferometer is shown in Figure 11.
Figure 12 shows the three most important configurations of the basic interferometer
system that we used. In part (a), the chordal line-of-sight (LOS) configuration is shown. If
we let the axis of the IP define the z-axis of our coordinate system, then this LOS has the laser
beam propagating parallel to the a;-axis at a constant y position. This configuration was most
often used to measure the axial profile of the plasma which could be accomplished by varying
the z position of the laser beam on successive shots. It should be pointed out, that with this
LOS, the average plasma density is not measured because the laser samples different radial
locations during its path. To obtain the actual density from measurements with this LOS,
an Abel inversion must be performed. [6] However, even without an Abel inversion, relative
measurements are possible. In part (b), the axial line-of-sight interferometer is shown. In
this case the beam travels parallel to the z-axis. This LOS was used to measure radial
distributions and radial expansion velocities of the IP plasma. Note that in this case the
laser beam sampled the plasma at a constant radial location. Therefore, averaged plasma
18

Scene Beam
40 MHz I Bandpass
Shift/Split
0 90
Split
r" =-i ^ _J
Mixer Mixer
5 MHz Lowpass
Screen Room Cosine Sine
Figure 10. A schematic of the phase sensitive He-Ne interferometer that was used to perform the electron density measurements. A similar configuration employing 2 optical tables was also used. For each shot, the sine and cosine signals were recorded on an oscilloscope and processed after the shot to determine the
phase as a function of time.
19

Channel 1 Channel 2
Reference Beams
Figure 11. A schematic of the two channel interferometer. The light signals from each channel were fed into detectors located in a shielded room and recorded in exactly the same manner as the single channel interferometer shown in the previous figure.
20

(a) Laser Beam
Expanding Plasma Ring
(b) Laser Beam
"'' > '<jy< HE
^ r J J rl ,
Expanding Plasma Ring
»~
Nozzle
IPVJZID
&—*>
(c) Laser Beam Positions
7Q >;
Expanding Plasma Ring
Figure 12. Various interferometric configurations that were used. Part (a) shows the interferometer viewing the plasma chordally, (b) viewing the plasma axially, and (c) shows the two channel interferometer with the beams separated by angle 9.
21

Outer Boundary v.
Inner Boundary
HI/ / i jkjyi
ffi a
Quartz Vacuum Window
Optical Probe
Figure 13. A schematic showing the apparatus for observing optical spectra from the IP. The probe viewed the gap between the inner and outer boundaries surrounding the IP along an axial line of sight. The position could be varied radially by moving the probe.
densities as a function of radius were obtained directly from the phase signal. In part (c)
the orientation of the two channel interferometer is shown. In this case both beams were set
up to view the plasma axially with each beam the same distance from the 2-axis. For these
measurements the angle between the beams in the x-y plane, 6, could be varied.
5.5 Two Wavelength Interferometry.
We used the ultra-sensitive, two-wavelength interferometer at the Naval Research Lab-
oratory to make measurements on the neutral gas distribution produced by the IP puff
valve/nozzle. We will not include details on this diagnostic as they are published,[7] but it
should be noted that the measurements we conducted were not possible with apparatus at
HY-Tech. Phase shifts due to neutral gas are roughly two orders of magnitude less than
an equivalent number of electrons and require a much more sensitive device given the gas
densities produced by the IP. The interferometer at NRL was approximately 104 times more
sensitive than our heterodyne system. When conducting these measurements we used a
single beam directed chordally and were most interested in the gas distribution between the
electrode plates inside the IP.
22

5.6 Spectroscopic Measurements.
Visible light spectroscopy was performed on IP plasmas in a mock-up POS arrangement
as shown in Figure 13. For these observations we used an optical probe consisting of a
12.5 mm diameter fused silica lens with a 75 mm focal length that was set to collect light
axially. The output of the lens was fed into a 10 m, 100 //m quartz fiber that carried the
light into a spectrometer located in a screened room. The spectrometers used were either
a 3/4 m SPEX or a 1/2 m McPherson with an OMA detector at the output plane. This
probe assembly had a spatial resolution that was approximately 1 mm and its position could
be varied radially. Most of the spectroscopic measurements were gathered using a hydrogen
plasma to help determine the electron temperature and the percentage of neutrals that may
exist in the initial plasma for POS shots.
23

Section 6
Experimental Measurements
In this section we will detail the results of experimental measurements performed on
the IP source. We include results of the neutral gas measurements, measurements on the
expanding plasma shell, the exhaust plasma, and measurements performed in a POS-like
environment. By a POS-like environment we mean a configuration where the IP is placed
inside two co-axial cylinders where the inner cylinder is semi-transparent, as it would be in
a real POS. Illustrations of this arrangement were displayed in the previous section. Most of
the data was taken using H and Ar plasmas since these represent extremes in the available
gases. The electrical breakdown properties of these two gases are also favorable leading
to relatively consistent IP operation. Because of the mass dependence associated with the
conduction phase of a POS, we were interested in IP/H shots with a high pressure gas puff
and relatively large electron densities (600-800 psig, ne > 5 x 1015cm~3). The interesting
operating regime for IP/Ar shots was 50-100 psig and ne ~ 1 x 1015cm~3).
6.1 Neutral Gas Measurements.
Measurements of the neutral gas distribution was performed on the IP without forming
plasma. The purpose of these measurements was to investigate the dynamics of the gas
puff on the time scales of interest. Typically, during operation of the IP, the gas valve was
discharged 350-700 /is before the application of high voltage and current. This delay range
depended on the type of gas, with the longer delays applicable to the heavier gases such as
Ar. For H2 gas, delays in the 350-400 [is range with 600-800 psig puffs were of particular
interest because they were used on the Hawk experiments. The gas distribution under these
conditions was investigated on a test stand at NRL using the ultra-sensitive interferometer.
The IP was arranged so the interferometer beam traversed a chordal line-of-sight through
the inter electrode region of the IP, and the time evolution of the phase at that position
was recorded. Defining z = 0 as the axial position of the IP anode (electrode plate with
puff valve/nozzle), we made measurements at three axial positions while varying the probe
laser beam radially. Figure 14 shows the beam locations during the puffed gas experiments.
A number of observation (3-5) were recorded at each location, averaged, and uncertainties
24
r=4.8 cm
Nozzle Exhaust
r=1.5
• • •• • • •
+//;///;?///////}////SS///y>///S77777\
Beam Positions
Quartz Insulator
z=0 z=4.85
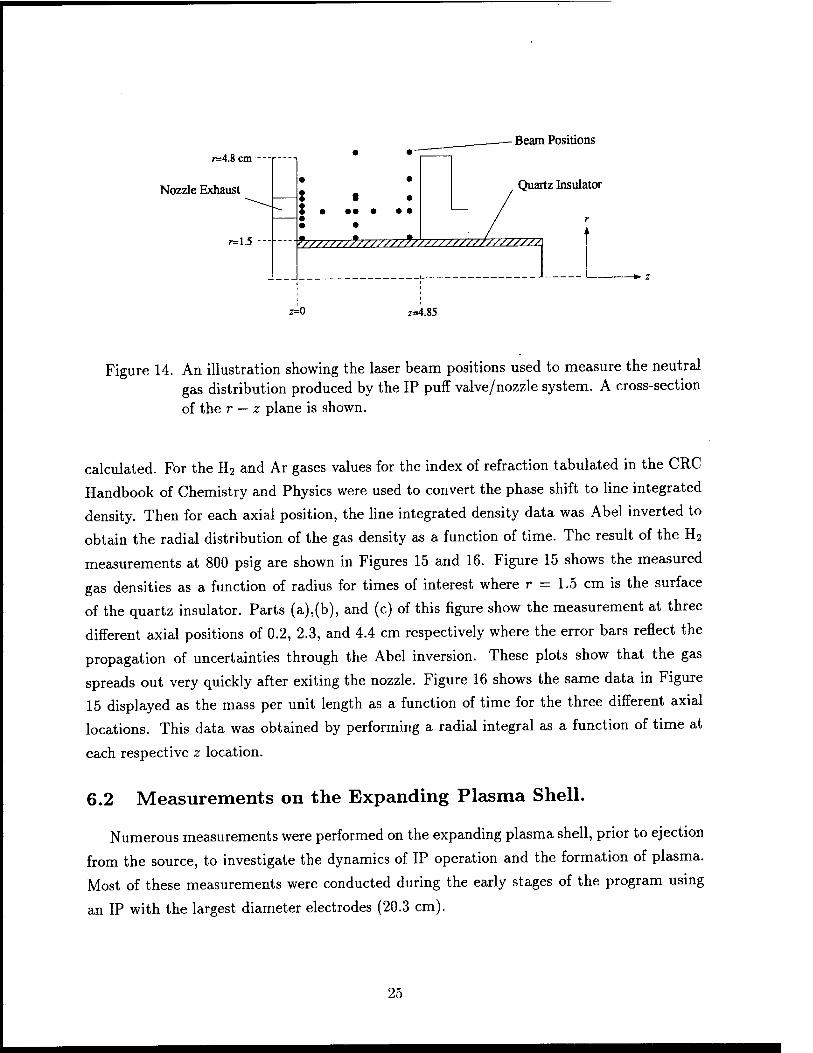
Figure 14. An illustration showing the laser beam positions used to measure the neutral gas distribution produced by the IP puff valve/nozzle system. A cross-section
of the r — z plane is shown.
calculated. For the H2 and Ar gases values for the index of refraction tabulated in the CRC
Handbook of Chemistry and Physics were used to convert the phase shift to line integrated
density. Then for each axial position, the line integrated density data was Abel inverted to
obtain the radial distribution of the gas density as a function of time. The result of the H2
measurements at 800 psig are shown in Figures 15 and 16. Figure 15 shows the measured
gas densities as a function of radius for times of interest where r = 1.5 cm is the surface
of the quartz insulator. Parts (a),(b), and (c) of this figure show the measurement at three
different axial positions of 0.2, 2.3, and 4.4 cm respectively where the error bars reflect the
propagation of uncertainties through the Abel inversion. These plots show that the gas
spreads out very quickly after exiting the nozzle. Figure 16 shows the same data in Figure
15 displayed as the mass per unit length as a function of time for the three different axial
locations. This data was obtained by performing a radial integral as a function of time at
each respective z location.
6.2 Measurements on the Expanding Plasma Shell.
Numerous measurements were performed on the expanding plasma shell, prior to ejection
from the source, to investigate the dynamics of IP operation and the formation of plasma.
Most of these measurements were conducted during the early stages of the program using
an IP with the largest diameter electrodes (20.3 cm).
25

(a) b -0-300(11
-O—325(18 ■
5 -A-350 (is " -V—375(18 .
4 Ink —0—400(18
-•-425(18 -
-•—450(18 ■
3 - -A-475 (18 .
h —V— 500(18 ,
2 -
1 ^^3^a -
t^-USs^^ 0
Radius (cm)
(b) -D— 300 H» -O— 325 H8
-A— 350 fi8
-V— 375 H8
/\ -0— 400 p*
-■— 425 H«
-•—450^8
As'^\ -A— 475 pS
-T— 500*18
+ TF jfc s_
3 4
Radius (cm)
Radius (cm)
Figure 15. The H2 gas density as a function of radius as determined from an Abel in- version is plotted. Each plot shows the density at various times with (a) corresponding to z = 0.2 cm, (b) to z = 2.3 cm, and (c) to z = 4.4 cm. The puff valve pressure was 800 psig and t = 0 is defined when the valve is pulsed.
26

E o
8
7
6 t-
5 -
c 0) Ö) 3 18
-z = 0.2 cm -z = 2.3cm -z = 4.4cm
400
Time (us)
500
Figure 16. The mass per unit length in fig/cm of H2 as a function of time at various z positions in the inter-electrode region of the IP. The puff valve pressure was 800 psig and t = 0 is defined when the valve is pulsed. These values were calculated from the density measurements shown in Figure 15.
6.2.1 Visible Light Framing Photography.
Figure 17 shows a sequence of visible light photos obtained from a framing camera that
viewed the plasma chordally as shown in Figure 8. For the sequence shown in the figure
the IP was operated with H2 gas and the shutter speed of the camera was set to 10 ns.
We observed that early in the discharge light was emitted from the quartz insulator and
propagated radially outward as one would expect. This verifies that the breakdown was
initiated at, or very close to, the quartz insulator. Later in time we can also see that the
luminous front is bowed indicating a drag imparted to the shell by the electrode surface.
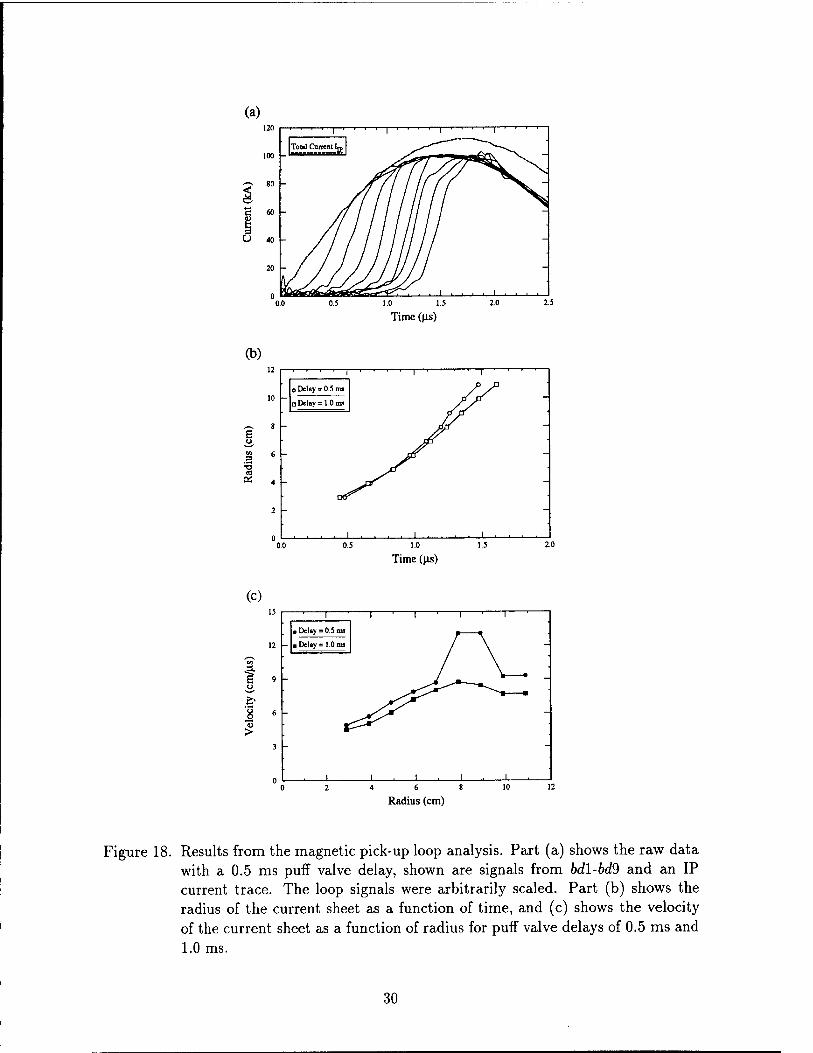
6.2.2 Magnetic Pick-up Loops.
We also inserted a magnetic pick-up loop array as shown in Figure 9(a) to determine the
speed and position of the magnetic front propagating radially outward between the electrode
plates. The array was positioned so it was in the axial center between the IP electrode plates.
Figure 18 shows the data and deduced radial position and velocity from those measurements
27

quartz insulator
t= 50 ns
-► r
quartz insulator
t= 500 ns
quartz insulator
t= 850 ns
► r
Figure 17. A sequence of photos that shows a luminous front propagating radially out- ward. The times are referenced to the start of current flow in the IP and show that the breakdown starts at the quartz insulator. The radial location of the quartz tube is indicated.
28
at two different puff valve delays. Note that the puff valve driver was different than the one
used later on experiments at NRL and HY-Tech. Part (a) is the raw data that shows the
current in the inverse pinch as well as the relative relative strength of the magnetic field as
determined from each probe. The probe locations varied from a radius of 3 to 11 cm for
probes Ml - W9 respectively. One can see that by 0.5 fis into the discharge, the magnetic
piston has passed the location of Ml and has not reached the location of M2. Denning the
half maximum of each probe signal as the location of the current front, the data shown in
part (b) was determined which shows the radial position of the piston as a function of time
keeping in mind that r = 10 cm is the edge of the electrodes. In part (c) the velocity of the
magnetic piston is shown obtained from the time derivative of the plot in part (b).
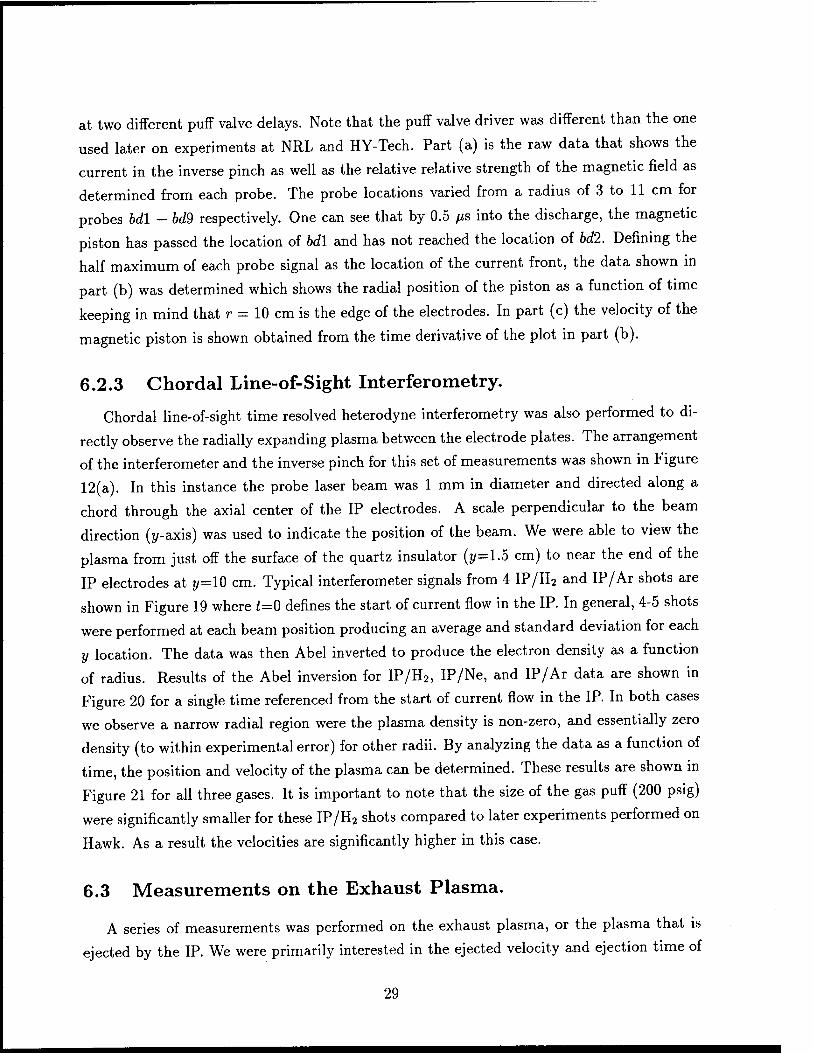
6.2.3 Chordal Line-of-Sight Interferometry.
Chordal line-of-sight time resolved heterodyne interferometry was also performed to di-
rectly observe the radially expanding plasma between the electrode plates. The arrangement
of the interferometer and the inverse pinch for this set of measurements was shown in Figure
12(a). In this instance the probe laser beam was 1 mm in diameter and directed along a
chord through the axial center of the IP electrodes. A scale perpendicular to the beam
direction (y-axis) was used to indicate the position of the beam. We were able to view the
plasma from just off the surface of the quartz insulator (j/=1.5 cm) to near the end of the
IP electrodes at y=l0 cm. Typical interferometer signals from 4 IP/H2 and IP/Ar shots are
shown in Figure 19 where t=0 defines the start of current flow in the IP. In general, 4-5 shots
were performed at each beam position producing an average and standard deviation for each
y location. The data was then Abel inverted to produce the electron density as a function
of radius. Results of the Abel inversion for IP/H2, IP/Ne, and IP/Ar data are shown in
Figure 20 for a single time referenced from the start of current flow in the IP. In both cases
we observe a narrow radial region were the plasma density is non-zero, and essentially zero
density (to within experimental error) for other radii. By analyzing the data as a function of
time, the position and velocity of the plasma can be determined. These results are shown in
Figure 21 for all three gases. It is important to note that the size of the gas puff (200 psig)
were significantly smaller for these IP/H2 shots compared to later experiments performed on
Hawk. As a result the velocities are significantly higher in this case.
6.3 Measurements on the Exhaust Plasma.
A series of measurements was performed on the exhaust plasma, or the plasma that is
ejected by the IP. We were primarily interested in the ejected velocity and ejection time of
29
0.0 0.5 1.0 1.5
Time (|xs) 2.0 2.5
(b)
-o cd
■ • ■ ' 1 ' ' ■■-■'-[- ' ' ' ' 1 ' ' ' '
0 Delay = 0.5 ms — a Deity = 1.0 m
- ST
- JP • if
- rjr
- -
. . . . 1 .... 1 .... 1 .... .. 0.0 1.0
Time (us) 1.5
(c)
t
>
T
m Delay = 0.5 ms
■ Delays 1.0 ms
4 6
Radius (cm) 10 12
Figure 18. Results from the magnetic pick-up loop analysis. Part (a) shows the raw data with a 0.5 ms puff valve delay, shown are signals from bdl-bd9 and an IP current trace. The loop signals were arbitrarily scaled. Part (b) shows the radius of the current sheet as a function of time, and (c) shows the velocity of the current sheet as a function of radius for puff valve delays of 0.5 ms and 1.0 ms.
30

(a)
0.5 1.0
Time (p.s)
(b)
0.5 1.0
Time (|is)
Figure 19. Examples of raw interferometer signals showing the phase shift as a function of time for, (a) four H2 shots and (b) four Ar shots.
the plasma, as well as the general characteristics of the plasma ring. The results were then
compared to a simple ID snowplow model which allowed us to predict the ionization state
of Ar. In this section we will show data that used the IP with 12.7 cm diameter electrode
plates.
6.3.1 Exhaust Measurements Using Heterodyne Interferometry.
Using the interferometric configuration shown in Figure 12(b), where the laser beam is
directed axially, we measured some basic parameters of the ejected plasma from the IP for
H2, Ne, CH4, and Ar gases. A typical interferometer signal using this line-of-sight is shown
in Figure 22. The shape of the signal indicates that the plasma is accurately described as
31

(a)
o
c (S c
O u H
30
25
1 1 1 ■ ■ ■ ' 1 ' '
T 20 - -
r
15 -
10 - \
5 / \
0
. 1 .
1 :1S^-f—$—$—t—1
1.0 2 0 3.0 4.0
Radial Position (cm)
o 0.61 (is
5.0 6.0
(b)
o 'S
c
1 53
3.0 4.0
Radial Position (cm)
(C) 50 ■ ■ ' ' 1 ' ' ' ' 1 ' ' ' ' 1 ' ' ' ' 1 ' ' ' ' 1 ' ' ' '
1
© 40
X \
6 30 *~ 1 \ U h / \ >»
20 / V Cfl C / A
a 10 / \ e ä 1 •—1 L 1 u s 1
II s . 1 U </
.... 1 .... 1 .. . . i.... i.... i.... 2.0 30 4.0
Radial Position (cm)
D 141 \is
Figure 20. Abel inverted density profiles of the plasma shell as determined from the chordal interferometry measurements. Plotted are the electron densities vs. radial position for (a) hydrogen at 0.61 /zs after the discharge began, (b) Ne at 0.82 fis and (c) Ar at 1.41 ^s.
32

(a) 10.0
8.0 -
B o
g "«3 o 0- •a '"§
6.0
4.0
2.0
0.0 ' 0.0 0.5
i i I i i i i I i i i i
1.0 1.5
Time (|i.s)
I-""
■ '■■■■'
2.0
nH2,25kV
.Ne,20kV
♦ Ar,20kV
2.5
(b) 10.0 r'T t i i i i i i T I i i i
«a 80 I
I u
>> 6.0
« <u > 4.0 eg
I'''' I'''' I'
2.0
0O i .... I .... I .... I .... I .... I .. .■ I i i ■ ■ I i i ■ ■ I i i i ' 0.0 1.0 2.0 3.0 4.0 5.0 6.0 7.0 8.0 9.0
Hy 25 kV
Ne, 20 kV
Ar, 20 kV*
Radial Position (cm)
Figure 21. The radial position of the plasma shell as a function of time is shown in part (a) for various gases. The velocity of the plasma shell as a function of radial position is plotted in (b). Note that a different nozzle design was used for the
Ar data.
33

15.0
0.0 1.0 2.0 3.0
Time (|0.s)
Figure 22. The plasma density as a function of time for the case where the IP was oper- ated without a boundary. In this case H2 gas was used with an axial line-of- sight interferometer positioned a few mm from the edge of the IP electrode.
a plasma ring that expands radially. Thus we observe that once the ring has passed by the
laser beam the phase shift becomes very small. By recording data from 4 shots for each gas
at a number of radial positions, we can determine some basic parameters for the exhaust
plasma. We will define the arrival time of the plasma at the laser beam position as, < t >,
by performing the following integral on the recorded phase,
ft(f>(t)dt <t> =
S<KW (i)
where <f>(t) is the measured phase shift as a function of time. Further we can define the
ejection time of the plasma as the value of < t > when the laser beam was positioned just
off the edge of the electrode plates at r=6.35 cm. The average velocity of the plasma ring,
< v >, was determined by calculating < t > for a number of beam positions (4) and fitting
the data to a straight line. We also calculated the total number of ejected electrons, iVe, by
using < v > and integrating the recorded phase as follows,
Ne = (27T7W,.) < v > C j (j>(t)dt, (2)
34

© >x
Plasma Current Flow
Figure 23. An illustration of a ID snowplow.
where rlaser is the radial position of the laser beam and C = 9.72 x 1014cm"2deg-1, converts
the phase shift in degrees to the line integrated electron density. Results of these calculations
for the various gases will be displayed in the next section.
6.3.2 Snowplow Model for the IP.
We completed a calculation that modeled the operation of the IP up to the ejection of
the plasma. This was done using a simple ID snowplow model to describe the motion of
the current front between the IP electrodes. The basic assumption of this model is that
an infinitely thin current front (or shell) is accelerated radially outward by the JxB force
as it sweeps up and ionizes all the neutral gas in its path. At the start of current flow
in the IP, a finite amount of neutral gas is present between the electrodes as a result of a
prior puff valve discharge. Therefore, as the current shell moves radially out and sweeps
the gas, its mass increases in accordance with the initial mass density of neutral gas. The
differential equations that govern the motion of the current shell were numerically integrated
to predict the ejection time and velocity of the plasma using the total mass of the neutral
gas as variable parameter, and assuming an initial distribution for this gas. The calculated
result was then compared to measurements of the ejection time and velocity to determine the
plasma mass. With knowledge of the plasma mass from the simulation, and the total number
of electrons from the experimental measurements, we can predict the average ionization level
of the plasma. Since the ionization level for hydrogen must be +1, the hydrogen case was
used to test the accuracy of this method.
Figure 23 illustrates the snowplow process. The current shell experiences a force directed
35

L0
DMXr
c„
Q L0 = 150 nH
C0 =7.4|iF
Figure 24. The equivalent electrical circuit for the inverse pinch where the pinch is mod- eled as a variable inductor.
radially outward due to J x B. The motion of the shell is therefore described by the following
differential equation,
— (M(r)v) = -, TX. (3)
where v(t) is the radial velocity of the shell, r(t) is the radial position of the shell, I(t) is
the shell current, and M(r) is the mass/length of the shell which is given by the following,
M(r) = fr2icr'p(r')dr' Jr0
(4)
where p(r) is the mass density of the neutral gas and r0 the quartz tube radius. The current
can be obtained from the circuit model shown in Figure 24 where C0 is the bank capacitance,
L0 the fixed inductance, and Lp(r) the variable inductance portion of the inverse pinch. The
inductance of the IP varies with the position of the current shell according to the following
equation,
T I \ VJ, At) 27T r0
(5)
where / is the axial distance between the IP electrodes. The differential equation for the
current is,
£p. + M-)W)] + f 0. (6)
Equations (6.3) and (6.6) form a set of coupled, nonlinear differential equations that
were solved numerically. However, we needed a distribution for the neutral gas to solve
36

c &
I
Radial Position (cm)
Figure 25. The neutral gas density function that was used for the ID snowplow calcula- tion. The calculation was not sensitive to the details of this distribution.
these equations. Figure 25 shows the distribution that we used. It has a constant gas
density from the edge of the quartz tube at 1.5 cm up to the outer nozzle radius at 3.2 cm,
and then an exponential decay. We will also use the following parameters for the calculation,
r0=1.5 cm, Lo=150 nH, and C0=1A /xF. The calculation will be stopped when r=6.35 cm,
which is the edge of the IP electrode plates. At that point, the time (ie. ejection time)
and velocity of the front will be recorded. Calculations were performed while varying the
total mass/length of neutral gas and the results are shown in Figure 26. The mass of the
neutral gas was varied by using a simple multiplicative factor for the gas distribution shown
in Figure 25. Figure 26 shows that the results of the calculation were sensitive to the total
mass of the neutral gas. By trying different neutral gas distributions with the same total
mass we found that the calculation was insensitive to the details of the distribution.
For IP discharges with H, CH4, Ne, and Ar the ejection time, velocity, and total number of
electrons exiting the device were measured using the heterodyne interferometer as previously
described. These results are shown in Table 1. For the hydrogen case we can also calculate
the total mass from the total number of electrons assuming that the plasma is fully ionized.
In Figure 26 we have added a data point that corresponds to the data measured for hydrogen.
For the curve in Figure 26(a) this data point matches extremely well with the calculated
37

3.0
2.5
S 2.0
£ P 1.5 e o
■a % 1.0
w 0.5
0.0 10
r r T -i' i i T"i' r i -i T ■? T i
_^J_ 1 ■ ■ ■ i ■ i I
10"' 10'
Total Mass (kG/m)
( 1—, , ,
•
Calculated Curve
10
10.0
2[_ 8.0
"s o
>> 6.0
I > 4.0 c s 8 2.0 -
0.0
-T " r""1 T ITT
10 • ■ ■■! I
10" 10'
Total Mass (kG/m)
■ ■ ■ i ■ ■ .
Calculated Curve
10'
Figure 26. Results of the ID snowplow calculation. In part (a) the calculated ejection time vs. the total mass per unit length of the neutral gas is plotted. In part (b) the calculated ejection velocity vs. the total mass per unit length of neutral gas is plotted. In each plot a single data point corresponding the the measurements on hydrogen gas is also shown.
38

Table 1. Key experimental and calculated results for the IP with various gases. Listed for each gas are the experimentally measured plasma ejection time (T6), ejec- tion velocity (ve), average number of ejected electrons (Ne), and the predicted number of electrons per molecule (Nm) obtained from the ID snowplow cal-
culation.
Gas Experimental Measurements Calculation
Te (fis) ve (cm/jus) Ne (xl(F) Nm
H, 1.2 6.2 6.3 1.9
CH4 1.8 4.0 6.2 3.8
Ne 2.1 3.9 4.5 2.1
Ar 2.5 3.3 3.3 1.9
result for the ejection time vs. total mass/length, however, it is a rather poor match for the
calculation of the ejected velocity as shown in part (b). This may be due to the fact that
the ejection time is directly obtained from measurements at one location, while the velocity
must be determined from measurements at a number of radial locations and will involve
more error. Using the data for all the gases, we determined the number of electrons per
injected gas molecule, so the total mass matches the snowplow calculation. The last column
in Table 1 shows this result. For hydrogen, the snowplow calculation predicts an ionization
level very close to +1 (ie. two electrons per molecule), while both neon and argon are very
close to +2. The methane result if very interesting as it predicts that only about 4 electrons
are expected per molecule. This implies that some of the methane is not completely broken
down, i.e. some of it would exist as molecular ions such as CH+, CH£, etc. This very simple
ID snowplow model has given us a reasonable estimate of the ejected plasma mass, and
ionization state, by comparing the calculated result to the measured ejection time of the
plasma. The calculation is insensitive to the details of the neutral gas distribution, but very
sensitive to the total mass of the gas between the electrodes.
6.4 Measurements in a POS-like Configuration.
In this section we will summarize the results of measurements that were performed on the
IP using interferometry and magnetic pick-up loops. We will concentrate on those results
that have a direct bearing on the effectiveness of the IP as a plasma source for opening
switches. In each of these cases, the data that we will present was taken with the IP placed
inside a "mocked-up" POS gap. That is we placed the IP inside two concentric cylinders. The
39
outer cylinder consisted of a solid section of aluminum and was 20 cm in diameter, while the
inner cylinder was semi-transparent and 16 cm in diameter. Certain plasma properties, such
as the axial distribution, depended in the details of the inner boundary windows. The gap
between the two cylinders was 1.9 cm while the distance from the edge of the IP electrodes
to the inner cylinder was 1.8 cm. In the axial direction the cylinders were 10 cm long, which
is twice as large as the 5 cm gap between the IP electrodes. A scaled drawing showing the
IP inside the two cylinders is shown in Figure 27. When we mention a "gap" in this report,
we are referring to measurements made in the gap between the inner and outer cylinders. A
subsection is devoted to each of the following measurements:
1. The plasma axial distribution.
2. The plasma radial distribution.
3. The azimuthal symmetry of the plasma.
4. Spectroscopy on the H plasma.
5. The shot-to-shot reproducibility of the plasma fill.
6. The obtainable mass densities in a POS gap.
6.4.1 The Axial Distribution of Plasma in a POS Gap.
The plasma axial distribution in a POS gap is important since one wants the plasma
confined to a discrete region during the conduction phase of the opening switch. Given
that the axial distance between the IP electrodes was 5 cm, it would be desirable if the
plasma was restricted to a similar width in the POS gap for times of interest. To determine
this important relationship we used a single beam interferometer configured in a chordal
LOS mode. The beam was focused through the IP plasma to obtain spatial resolutions of
1 mm, and positioned so it passed through the center of the gap. Two small slots were
cut in the outer cylinder to allow the beam to pass. With this arrangement, the plasma
could be probed from the axial center of the pinch (2=0) outward in one direction. The
boundary configuration was then inverted axially so z values in the other direction could
also be measured for the case of a screened inner boundary. An illustration that shows the
positioning of the laser beam and the IP is shown in Figure 28. Four to five shots were taken
at each axial position and then averaged. By moving the beam to various axial positions, a
relative axial profile could be obtained. Figure 29 shows the results obtained from the set
up in Figure 28. These measurements were performed with hydrogen discharges where the
40

II II
Outer Boundary
Inner Boundary
Nozzle
Figure 27. The IP mounted inside two concentric aluminum cylinders. The outer bound- ary was solid while the inner boundary had four large windows separated by 1/4" bars. Each cylinder was twice as long as the IP electrode separation (10 cm) and the inner and outer gaps were 1.8 and 1.9 cm, respectively.
Outer Boundary
Inner Boundary
&-$
Laser Beam Positions
Figure 28. The laser beam positions that were used to measure the plasma axial distri- bution. Thin slots were cut in the outer boundary to allow the laser to probe
the plasma chordally.
41
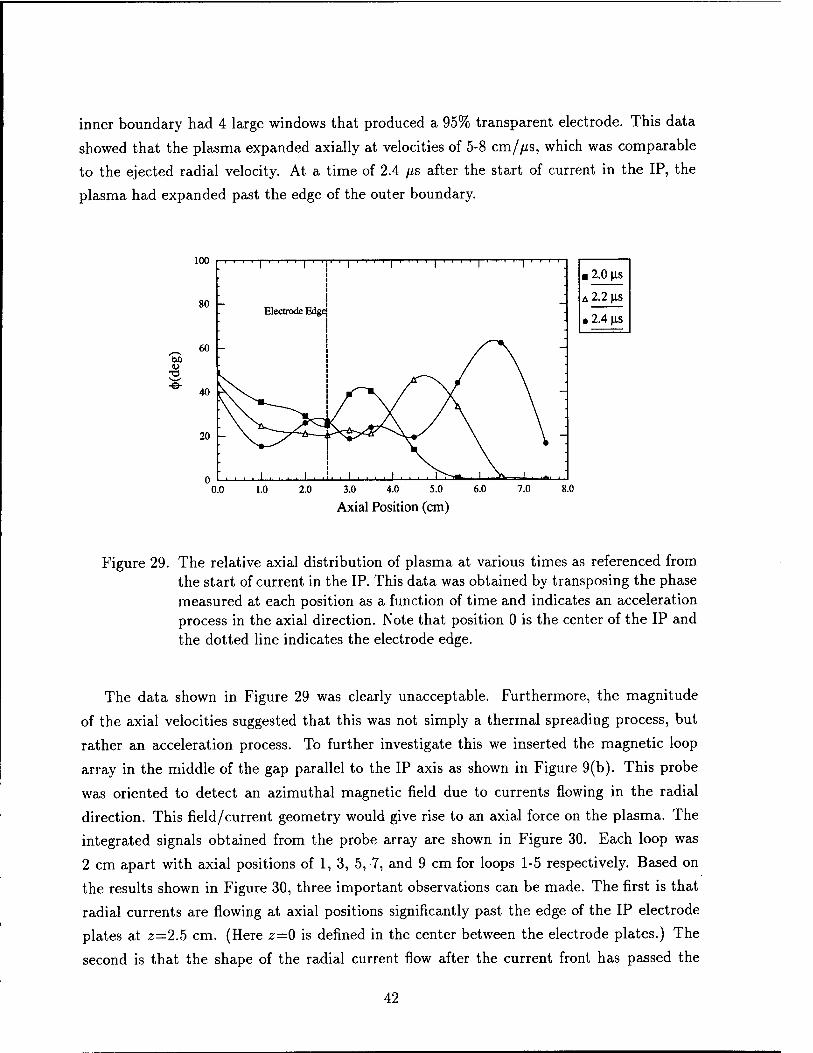
inner boundary had 4 large windows that produced a 95% transparent electrode. This data
showed that the plasma expanded axially at velocities of 5-8 cm/fis, which was comparable
to the ejected radial velocity. At a time of 2.4 ps after the start of current in the IP, the
plasma had expanded past the edge of the outer boundary.
u -o
100 I—i—i—i—i—|—i—r—i—I—I—i—i ■ i i—i—i—I—i—i—I—i—i—i—i—]—I—i—r—i—I—i—i—i—i—r-
80
0.0
Electrode Edge
1.0 2.0 3.0 4.0 5.0
Axial Position (cm)
■ 2.0 \as
A 2.2 \is
• 2.4 ^s
8.0
Figure 29. The relative axial distribution of plasma at various times as referenced from the start of current in the IP. This data was obtained by transposing the phase measured at each position as a function of time and indicates an acceleration process in the axial direction. Note that position 0 is the center of the IP and the dotted line indicates the electrode edge.
The data shown in Figure 29 was clearly unacceptable. Furthermore, the magnitude
of the axial velocities suggested that this was not simply a thermal spreading process, but
rather an acceleration process. To further investigate this we inserted the magnetic loop
array in the middle of the gap parallel to the IP axis as shown in Figure 9(b). This probe
was oriented to detect an azimuthal magnetic field due to currents flowing in the radial
direction. This field/current geometry would give rise to an axial force on the plasma. The
integrated signals obtained from the probe array are shown in Figure 30. Each loop was
2 cm apart with axial positions of 1, 3, 5,7, and 9 cm for loops 1-5 respectively. Based on
the results shown in Figure 30, three important observations can be made. The first is that
radial currents are flowing at axial positions significantly past the edge of the IP electrode
plates at 2=2.5 cm. (Here z=0 is defined in the center between the electrode plates.) The
second is that the shape of the radial current flow after the current front has passed the
42

0.7
0.6
/■—s
% 0.5 s—' "fl &
0.4
00 u 03 >
•3 c« « 0.2
CO
0.1 -
0.0
■I" "i 1 1 ■ ■ ■ i ■i ■ ■ i' . . , .
-
- \ ^v -
■ /Äs . 1 - i
< \ \ ^ \
- 1' I \ \
• I i l t ^vv\ .
1' i j! ' ' // /
1 1
I /
"M AA/v\^A '*pT ■^r ffi /• '' '
/ /
. /. 1. ... i. .. .
0.0
z=l cm
z=3cm
z=5cm
z=7cm
z=9cm
0.5 1.0 1.5 2.0 2.5
Time (|xs) 3.0 3.5 4.0
Figure 30. Results from the B-dot loop array arranged axially. Each loop was arbitrarily scaled by the same factor.
loop, is similar to the total current flowing through the IP. The third is the the velocity of
the current front outside the electrode plates, ie. that determined from loops 3-5, is roughly
the same as the plasma expansion velocity.
These observations support the "spill-over" model shown in Figure 31, that describes
the interaction of the current front and the outer boundary. For early times during the IP
discharge, ie. before the plasma is ejected, the current flows axially between the IP plates
accelerating the plasma radially outward. This phase is shown in part (a) of the figure.
When the current front reaches the radial edge of the IP electrodes it is free to expand into
the gap since the inner boundary is essentially open (except for the four support bars). Part
(b) shows the situation after the current front has hit the solid outer boundary. For times
after this, the current may flow from the IP anode through the plasma to the outer boundary
and then back through the other edge of the plasma to the IP cathode. In this situation the
plasma is accelerated axially via the magnetic field in the POS gap.
To remedy this situation we placed a conducting screen around the inner boundary
and used insulators to block the gap between the inner boundary and the IP as shown
in Figure 32. With this configuration, the IP operates normally until the current front
reaches the screen. At that point the plasma can pass through the screen, but the screen
forms a conducting path that terminates the motion of the current front. Therefore, the
43

(a)
i i-
. Solid Outer Boundary
- Transparent Inner Boundary
i i
6—^ (b)
Current Flow Through Plasma
Figure 31. A model to explain the axial acceleration observed with the interferometry and B-dot probes. For times before plasma ejection, part (a), the IP functions normally. After ejection, part (b), the current front can be distorted such that current can flow from one IP electrode through the plasma to the outer boundary and then back through the plasma to the other IP electrode. In this situation the magnetic field will exert pressure axially expanding the plasma in the gap.
44

Solid Outer Boundary
Screened Inner Boundary
Insulating Spacers
<M>
Figure 32. The IP configured with a screen covering the windows on the inner boundary. Also shown are insulating spacers that support the inner boundary and prevent plasma from expanding in the gap between the IP electrodes and the inner
boundary.
current front never reaches the POS gap. The insulators that block the gap between the
inner boundary and the IP further prevent the current front from expanding axially in that
region. We tested the screened configuration with the axially scanning interferometer beam,
and magnetic loops. The magnetic loops showed that the radial current flow was removed
by the screen, and the bulk of the plasma remained confined to within the dimensions IP
electrode plates for times of interest. Only a very small percentage of the plasma expanded
outside z=2.5. These results (shown in Figure 33) imply a thermal spreading process.
6.4.2 Plasma Radial Distribution.
The plasma radial distribution was measured using the heterodyne interferometer in the
axial LOS configuration. The beam was focused through the plasma region yielding a 1 mm
spatial resolution. A number of shots were taken at various radial positions between the IP
and outer boundary. Figure 34 shows the radial dependence of the electron density for various
times after the start of current for H2 discharges. Qualitatively similar results are obtained
with other plasmas, but on a different time scale. At t=1.6 ps the plasma has entered the gap
and by 3.0 //s it has reached the outer boundary where one observes a significant buildup on
that surface. At later times we observed that the plasma bounced off the outer wall with a
45

Phase Shift vs. Axial Position for H,
T T
-5.0 -4.0 -3.0 -2.0 -1.0 00 1.0 2.0
Axial Position (cm)
• 3.0 \xs
a 3.5 us
♦ 4.0 us
A 4.5 us
5.0
Phase Shift vs. Axial Position for CH.
3 «5
0.
-2.0 -10 0.0 1.0 2.0
Axial Position (cm)
Phase Shift vs. Axial Position for Ar 200
175
1 ' ■ ' 1 ' ' ■ ■ 1 ■ ■ ■ ■ 1' ' ■ ■ 1 ■ ■' • 1 ■ • ■ ' 1 •' ■ ■ 1 ■ ■ " I " "1" "• 4 6.0 us
A 6.75 us 150 • 7.25 us
S 125
2 loo -
1 75
50
25 - V ..1.... 1.... 1.... 1.... 1.. .. i i :
-5.0 -4.0 -3.0 -2.0 -1.0 00 1.0 2.0 3.0 4.0 5.0
Axial Position (cm)
Figure 33. Results from our axial scan measurements. Parts (a),(b), and (c) show results for H2, CH4, and Ar gases respectively at various times referenced to the start of current in the IP. The dotted vertical lines indicate the edges of the IP electrodes.
46

significantly reduced velocity. Note that, since the current continues to flow in the IP across
the screen, the plasma is prevented from re-entering the IP by the magnetic field inside the
IP. As a result we have found that a relatively uniform radial distribution persisted for a
few microseconds. Note that on Hawk the outer boundary (anode) was smaller than the
boundary that was used for these tests (20 vs. 17 cm). As a result the uniform distribution
was reached with shorter delays on Hawk.
6.4.3 Plasma Azimuthal Symmetry.
To investigate the azimuthal symmetry of the plasma, a two channel interferometer was
set up using an axial LOS. With this configuration each channel was positioned at the same
radius with angular separations that varied from 5 to 51°. A series of shots were performed
while monitoring both interferometer channels and varying the angular separation of the two
probe beams. Complete agreement between the two interferometer beams would indicate
perfect symmetry. We observed that while the agreement between the two interferometer
channels was sometimes drastically different for early times, in most cases the agreement
improved after the plasma had bounced off the outer conductor. Figure 35 illustrates this
point. This plot shows the axially averaged electron density as a function of time for two
interferometer beams separated by 30°. Over 100 shots were taken with this type of set
up and the data was analyzed statistically. We concluded that the azimuthal variations
were ±10% with respect to the average for times after the plasma has bounced off the outer
boundary. The larger variation between the two beams observed as the plasma is expanding
radially can be explained if the plasma ring is distorted into an elliptical (or some other)
shape during the expansion phase. After the bounce off the outer boundary at reduced
velocities, the ring is no longer spatially defined and the symmetry improves.
6.4.4 Spectroscopic Measurements on the H Plasma.
Spectroscopic observations were undertaken to help determine the state of the initial
plasma that existed during IP/H2 shots on Hawk. In particular we were interested in the
plasma electron temperature, the existence of impurities, and the percentage of neutral
hydrogen, if any. To gather the data we used the apparatus shown in Figure 13 with quartz
vacuum windows, the McPherson 0.6 m spectrometer, and the OMA detector. We used a
boundary configuration that was identical to that on Hawk. With this optical system the
spectral range accessible was between 2800-5050 Ä. The optical probe was positioned to
view the plasma along an axial line of sight at the radial center of the gap between inner
and outer boundary in the mocked-up Hawk geometry. The spatial resolution of the optical
47

25
20 m
i
E o
2 15 ~ o X ^-^ >> 10 -
... i 1.0 2.0 2.5 3.0
Distance from IP (cm) 3.5
o t=1.6 us
■ t=3.0 us
o t=5.0 us
• t=5.5 us
4.0
Figure 34. A plot of the plasma electron density as a function of radial position for various times referenced from the start of current flow in the IP. The data was taken between the inner and outer boundaries with a 1 mm laser beam.
B o ~©
X
cn C u Q
40
35
30
25
20
15
10
5
0
| " " | " " | ' | " " | " " | " '
0.0 0.5 1.0 1.5 2.0 2.5 3.0 3.5 4.0 4.5 5.0
Time ([is)
Figure 35. Results from two channel interferometry where the beams are separated by 30°.
48

Table 2. Summary of the identified impurity lines during an optical survey with the "dirty" IP source operated with H2 gas.
Species # Lines Center Wavelengths(Ä)
01 2 2972,3947 on 11 3134,3390,3470,3711,3912,3973
4190,4415,4417,4649,4962 Olli 4 2984,3047,3265,3754 CII 3 2746,2837,4267 All 4 3082,3092,3944,3961 Al II 2 3587,3655
system was 2 mm. These experiments were performed after the Hawk experiments at NRL
in early 1998.
Immediately after the Hawk experiments, the IP was visibly dirty with discoloration, as
well as chunks of aluminum, on the quartz insulator and electrode surfaces. This debris had
accumulated during the course of about 50 POS shots with the generator. We wanted to
complete a survey of the optical emission to determine if the debris was being incorporated
into the plasma. We used a 3 [is gate that encompassed the "bounced" plasma and the initial
part of the restrike plasma. This was a qualitative experiment as we had no intentions,
or means readily available, of absolutely calibrating our optical system to determine ion
densities. However, a complete survey in the optical range available to us did show the
presence of 26 impurity lines that could be identified. Most abundant of these were 0 II
lines (11). Table 2 above lists the species and number of lines that were identified during
this survey. After the survey was complete, the IP was cleaned using acetone and abrasives,
and the survey was repeated. With the cleaned IP none of the impurity lines listed in the
table were observed. The spectrum was essentially impurity free with only the H I series
observable.
Following the survey we continued to make measurements with the hope of determin-
ing the plasma electron temperature and the concentration of neutral H in the plasma.
Knowledge of the electron temperature would also allow us to calculate ionization rates of
impurities that may be desorbed from electrode surfaces. The motivation behind this was to
determine if the electron inventory accurately measured the mass of the material in the POS
gap during the experiments on Hawk. If a significant amount of material was in the form
of neutral atoms or molecules, then interferometry could not be relied upon to measure the
injected mass. The only lines available to us, without seeding, were due to the H I spectrum.
49

In particular we measured the Ha (6563 Ä) and H^ (4861 Ä) line profiles using the same
optical system with the McPherson modified so we could observe longer wavelengths. The
OMA detector was used and our gate times were set to coincide with the initial POS plasma
that produced the most interesting results on Hawk (~3.5 ^s after the start of IP current).
Specifically, with reference from the start of current flow in the IP, the gates began around
t = 2.75 fis and lasted for 1.0 to 1.5 /xs. We also operated a single beam interferometer along
the same line of sight (axial) and positioned the interferometer to the same radial position
as the optical probe, but at a different azimuth. We investigated three radial positions, one
near the inner conductor (r = 6.7 cm), one near the outer conductor (r = 8.3 cm), and one
in the center of the gap at r = 7.5 cm. A number of shots were taken with the spectrometer
centered on Ha and Kß for each radial position. On each shot we determined the full width
at half maximum (fwhm) for each line via fitting of the data to a Lorentz function, the
strength of the line as determined by the area of under the line (minus the continuum), and
the average value of the electron density during the gate. The relative calibration for HQ/H/j
was 3.24, that is to get the proper relative ratio of Ha/H^ we need to multiply the raw data
by 3.24. These results were sent to Dr. Y. Maron of Plasma Analyses for interpretation via
a time dependent collisional radiative modeling.
There were a number of interesting results from Dr. Maron's analysis, but at this stage
we must point out a significant limitation of the measurement. We observed the plasma via
an axial line of sight, as a result our optical probe collected light from the plasma edges as
well as the center. Further, we viewed emission from H I, which is likely to be more abundant
at the edges where we would expect lower electron temperatures. Therefore, our results may
emphasize the edge plasma relative to the bulk.
One result of the measurement concerned the width of the H„ line; which we observed
to be significantly wider near the outer wall (r=8.3 cm) compared to other regions in the
gap. The difference in widths was significant (2.4 A vs. 1.7 Ä) and can only be explained
if opacity had broadened Ha near the wall. That would imply a higher concentration of
neutral H in that region, which is a reasonable result from an intuitive standpoint. The
most reasonable explanation for opacity of Ha near the wall is that the excited state (n=2)
is populated via re-combination with slightly higher electron densities than in the center of
the gap. The calculations showed that this is possible with only a modest increase in the
density at the electron temperature of 0.7 eV. Based on our density measurement the Rß
emission should be Stark broadened to about 4.2 A. We did not observe this, in fact we
observed a much narrower line that would imply an electron density of only 0.5xl015 cm-3.
It is possible that this discrepancy is due to the limitation discussed above where our light
50

collection system emphasized the edge plasma.
The most critical analysis revolved around the determination of the electron temperature
(Te) and the number density of neutral hydrogen (n#). The later quantity is of particular
importance because if nH was significant, then interferometry cannot be relied upon to
measure the plasma mass. To get the electron temperature, time dependent collisional-
radiative modeling was performed while keeping the electron density (ne) equal to the proton
density (np) at 3.0 x 1015 cm-3 and varying nH and Te as parameters. Possible solutions
would be cases where the model predicted that ne stayed relatively constant for 1 /is, and the
line ratio of Ha/H/3 is 8. Both of these constraints are results of experimental measurements.
The only electron temperature that produced result within these limitations was Te= 0.7 eV.
The modeling showed that ne decreased by only 4% during 1 (is and the H^/H/j ratio was
within the experimental error. At higher temperatures, such as 1 eV, the density stayed
constant but the Ha/H^ ratio was only 5. At lower temperatures, such as 0.5 eV, the
density dropped by 20% over the 1 /is due to re-combination, which is also not in accordance
with our observations. The analysis also predicted the absolute populations of the excited
states of hydrogen which are: n2 = 3.9 x 10¹¹, n3 = 3.9 x 10¹¹, and n4 = 2.6 x 10¹¹, for an
electron density of 3 x 1015 cm-3.
Given these relatively low electron temperatures, it is impossible to determine the density
of neutral hydrogen (nH) because the excited states of H are determined by re-combination
and not by excitations of neutral hydrogen. The quantity of neutral hydrogen will depend
on the time history prior to our observations. If large quantities of neutral H or molecular
hydrogen (H2)were injected into the gap, then due to the low Te, most of them would remain
as neutrals on a 1 /is time scale. If the converse were true, that little or no neutral material
was injected into the gap, then a significant density of neutral material would not be produced
as evidenced by the time history of the electron density that stays relatively constant.
Another effect of the low Te is that desorbed impurities may not be sufficiently excited to
observe optical emission. Here we must be careful to distinguish between desorbed material
and impurities incorporated into the IP plasma. By the former we refer to molecules that
are knocked off material surfaces (such as the outer boundary) by the plasma. Clearly we
can observe the latter (IP plasma impurities) as evidenced by the results in Table 2 obtained
using a "dirty" IP, but desorbed matter in such a low temperature plasma may be "dark"
and remain neutral until the electrons are heated. Such heating would certainly take place
when the generator current starts in a POS.
51

30.0
25.0 -
S 20.0 O
.tS 15.0 -
g Q c s 13
10.0
Average Density vs. Pressure for Hj @ 4.5 jxs
100 200 300 400 500 600
Puff Valve Pressure (psi)
Figure 36. A plot showing the relationship between the average electron density in the gap and the pressure behind the puff valve. Pressures from 200 to 600 psig were investigated. Note that the POS gap configuration, as well as the puff valve delay, was significantly different from later experiments on Hawk.
6.4.5 Plasma Reproducibility.
An important consideration is the consistency with which the IP can fill a POS gap
with plasma, or the variation from shot to shot. To investigate this issue we performed a
series 10 shot runs while monitoring the electron density with an axial LOS interferometer.
The interferometer beam was positioned in the radial center of the gap. A series of 10 shot
runs were taken using H2 and Ar gases under various conditions. For times after the plasma
distribution has become uniform (4-5 (is for H, 5-6 /is for Ar) an average density was obtained
for the 10 shots. Typically, average deviations were ±10% for both gases. As an example
we found that at 4.5 (is the electron density in the H plasma was 14.4 ±1.3 xlO15 cm-3 and
at 5.0 ^s the electron density in the Ar plasma was 8.1 ±0.9 xlO15 cm-3.
6.4.6 Mass Density Control.
The IP is a versatile device in that the mass density can be controlled at two levels. The
rough, or coarse, control is the type of gas the one uses. This will change the mass density
in large steps by changing the species of ions in the plasma. At the same time a more exact
control is available. By varying the pressure behind the puff valve, which in turn varies the
size of the gas puff, a certain amount of density control is realized. Figure 36 illustrates this
52

Table 3. The estimated average mass densities obtainable using the IP and various
gases. The units are xlO17 mp/cm2.
Pressure H2 CH4 Ne Ar
200 0.32 2.7 6.8 400 0.86 3.5 7.9 9.8 600 1.1 4.2
control. In this case the pressure of the H2 gas puff was varied from 200 to 600 psig while
keeping the puff valve delay constant, and a corresponding increase in the electron density
was observed. Similar relationships have been observed with Ar and CH4 plasmas.
A wide range of mass densities can be reached using the IP with various gases and puff
valve pressures. We have experimented with H2, CH4, Ne, and Ar. All these gases, with
the exception of Ne, operate reasonably consistent with the ability to reproduce plasma
densities to within ±10%. We have not been able to discover a regime where Ne discharges
become as consistent. This may be due to its relatively high first ionization potential at
24 eV. Based on the data that we have, we can estimate the mass densities that each type
of gas can produce. It will be assumed that the average ionization states are Ar+2 and
Ne+2. It is further assumed that the methane molecules are completely broken down so
that 3.8 electrons are produced for each CH4 in accordance with Table 1. Table 3 shows
the line integrated mass densities, in units of xlO17 mp/cm2, that can be achieved based on
our measurements of the electron densities for various gases and puff valve pressures. The
results indicate that a variation of nearly two orders of magnitude has been observed, with
a potential of even higher mass densities using heavier gases such as Xe or Kr.
53

Section 7
Results of POS Experiments on Hawk
In this section we will summarize the POS experiments using the IP as a plasma source.
These experiments took place on the Hawk generator at the Naval Research Lab. The Hawk
machine [8] (720 kA, 1.3 fis quarter period) has been used in the past for numerous POS
experiments with various plasma sources such as flashboards,[9] cable guns,[10] and coaxial
gas plasma guns.[11] Figure 1 shows a scaled drawing of the IP source mounted inside the
generator.
7.1 Hardware and Diagnostics.
Certain hardware modifications were needed for the source and generator before the
experiments could begin. The outer diameter of the IP was reduced from 12.7 to 9.5 cm
and we manufactured a new aluminum center conductor (cathode) for Hawk with an outer
diameter of 12.7 cm. Taking into account the wall thickness of the center conductor (1 cm),
there was a 6 mm gap between the outer edge of the IP and the inner edge of the cathode.
This space was needed to electrically isolate the IP from the generator and feed gas lines
across the IP electrodes inside the cathode. A series of 18 equally spaced apertures in
the center conductor allowed the plasma to enter the inter-electrode region. Each of these
windows was 5 cm long to match the spacing between the IP electrodes. The bars between
each aperture were 0.32 cm thick rendering the cathode 86% transparent. For the outer
conductor (anode) we used an existing electrode with a 17 cm inner diameter. The anode
was solid in the POS gap region to provide a surface for the plasma to bounce off of and
fill the gap. The load was a short circuit located 33 cm downstream from the center of the
switch. Both electrodes were designed so they could be inverted axially which allowed us
to conduct experiments with cable guns, where the plasma sources are arranged around the
outside, using the same electrode geometry.
Machine diagnostics included generator voltage and current probes, and three sets of
anode current probes located 6, 22, and 32 cm downstream from the center of the switch. The
anode current probes, shown in Figure 1, are shielded magnetic pick-up loops. A Rogowski
coil located near the capacitor bank, was used to monitor the IP current. The plasma
54

electron density was measured using an axial line-of-sight, 8 channel, He-Ne heterodyne
interferometer.[5] Each beam sampled the plasma at a different radial position over the
range from r = 6.5 cm to r = 8.5 cm with equally spaced intervals. As a result the
temporal evolution of the radial density profile, as well as the total electron inventory, could
be measured on each shot.
7.2 POS Shots Using the IP.
Experiments were performed using various gases (H2, Ne, Ar, Air) as well as cable guns
for comparison. There were a total of 71 recorded POS shots with the IP. A summary of
each shot indicating the puff valve pressure, puff valve delay, IP delay time, conduction time
Tc, conducted current Ic, peak switch voltage VPOs, and initial electron density are shown
in Table 4. The IP delay time is the time interval between the start of current flow in the IP
and the start of the generator current, the conduction time was defined as the time interval
from the start of the generator current to the time when the load current reaches 10% of
its peak value. In the table we try to indicate the initial electron density. For cases where
a ~ symbol appears in front of a value the density profile was relatively uniform as shown
in Figure 34, and we indicate the average density. In cases where there was a positive or
negative density gradient the > and < symbols denote them respectively, and the density
range is given. In many cases only one channel of interferometry was available (most of the
Ar shots), this is indicated by an asterisk (*) and we give the electron density near the radial
center of the gap.
It is clearly evident that POS shots using H2 gas exhibited significantly higher values of
load dl/dt, but only for those cases where the IP delay time was ~ 3.5 ^s. This delay time
corresponds to the conditions where the radial distribution was uniform and static on 1 //s
time scales. When compared to typical cable gun shots, the IP/H2 POS was very impressive.
These features of the IP/H2 POS are best illustrated in Figures 37 and 38. Figure 37 shows
typical load currents for a cable gun shot, an IP/Ar shot, and an IP/H2 shot with a long
delay time. In each case the conduction times are very close, and we see that the IP/H2
shot transfers current to the load much faster than the other two cases. Figure 38 illustrates
the dependence of the POS voltage on the plasma initial conditions. This plot shows the
voltage at the center of the switch as a function of the conduction time. There are three
types of data points corresponding to three different types of initial radial distributions that
were shown in Figure 34. A curve is also shown that reflect the data obtained using cable
guns. In this plot we can clearly see that only for the uniform initial plasma distribution do
we get voltages that are significantly larger than any other type of shot.
55

Table 4. A log of all the IP shots on Hawk.
Inverse Pinch/Hawk Data
Shot # Gas Pres.
(psig)
Puff Delay
(/xs)
IP Delay
(/is) (ns) Ic (kA)
Vpos (kV)
ne (t = 0) (xlO15 cm"3)
2649 H2 800 400 1.9 899 610 99 > 3.5-5.0
2650 H2 800 400 2.1 920 620 134 > 2.8-5.8
2652 H2 800 400 1.9 932 600 91 > 4.3-6.0
2655 H2 800 400 2.1 950 605 169 > 2.5-4.7
2656 H2 800 400 1.0 800 575 < 2.0-1.0
2657 H2 800 400 1.4 880 610 74 < 7.0-2.0
2658 H2 400 400 1.3 885 585 78 < 3.3-0.5
2659 H2 800 400 1.5 1015 615 60 > 0.0-7.0
2665 H2 600 350 2.2 699 490 174 > 1.0-9.3
2666 H2 600 350 2.2 678 490 177 > 1.5-13.0
2667 H2 600 350 2.2 678 490 231 > 1.4-10.3
2668 H2 600 350 3.7 852 580 321 ~3.7
2669 H2 600 350 3.6 858 575 301 ~4.7
2671 H2 400 350 3.6 814 560 281 ~3.1 2672 H2 200 350 3.6 608 450 182 ~ 1.8 2673 H2 100 350 3.4 463 360 117 ~ 0.74
2674 H2 800 350 3.6 932 595 286 ~5.5
2690 Ar 100 700 4.1 743 515 126 1.1*
2691 Ar 100 700 4.6 844 610 85 ?
2692 Ar 100 700 3.1 710 570 119 2.2*
2693 Ar 100 700 833 575 111 2.7*
2694 Ar 100 700 9.7 969 600 152 2.8*
2695 Ar 100 700 10.7 950 605 111 ?
2696 Ar 100 700 10.7 704 575 157 1.3*
2697 Ar 100 700 11.6 767 590 99 1.5*
2700 Ar 100 700 10.7 887 585 121 0.64*
2701 Ar 100 700 13? 806 550 80 0.67*
2702 Ar 100 700 10.8 1012 625 115 1.7*
2704 Ar 100 700 5.9 683 475 79 1.3*
2705 Ar 200 700 10.8 1214 681 94 ?
2706 Ar 200 700 11? 1205 666 106 3.0*
2707 Ar 200 700 10.7 1190 665 112 3.1*
2708 Ar 50 700 10.7 544 415 80 0* 2709 Ar 50 700 6? 637 475 94 2.4*
2710 Ar 75 700 10.7 832 550 146 1.4*
2713 Ar 75 700 11? 779 555 98 0.34*
2714 Ar 75 700 10.5 690 500 111 0.96*
56

Table 4. A log of all the IP shots on Hawk (Continued).
Inverse Pinch/Hawk Data (continued)
Shot # Gas Pres.
(psig)
Puff Delay {fis)
IP Delay (/xs) (ns)
Ic (kA)
Vpos (kV)
ne (t = 0) (xlO15 cm"3)
2715 Ar 150 700 10.5 1090 630 90 1.8*
2716 Ar 150 700 10.5 1043 625 108 1.8*
2717 Ar 150 700 10.5 1050 625 87 1.7*
2718 Ar 100 700 11? 1034 620 115 > 1.1-3.1
2722 Air 300 500 9.5 1184 660 93 ?
2723 Air 300 500 9.4 639 470 76 > 0-2.3
2724 Air 300 500 9.4 768 530 117 ~ 1.7
2725 Air 300 500 3.8 752 530 166 > 0-3.3
2726 Air 300 400 4.5 1015 610 129 ~ 1.4
2727 Air 300 400 6.0 641 450 114 > 0-2.0
2728 Air 300 400 7.1 636 450 103 > 0.5-2.1
2729 Air 300 400 8.1 660 480 111 > 1.6-3.3
2730 Air 300 400 8.9 684 465 124 ~ 1.4
2731 Air 300 400 10.4 819 535 103 > 0-1.6
2732 Air 300 400 11.3 520 400 81 ?
2733 Air 300 400 9.0 655 495 89 ?
2734 Air 300 400 9.4 520 400 108 ~0.7
2735 Air 300 500 9.0 631 460 107 > 0-1.2
2736 Air 400 400 9.0 656 470 93 ~ 1.0 2739 Ne 250 450 4.7 1009 600 75 0.6-2.5
2740 Ne 250 450 4.2 814 535 87 1.5-3.6
2741 Ne 250 450 3.7 695 490 86 > 1.8-3.0
2742 Ne 250 450 4.7 855 575 53 < 3.4-1.6
2743 Ne 250 450 3.7 753 515 89 > 0.6-2.4
2744 Ne 250 450 3.3 686 480 102 > 0.8-2.1
2745 Ne 250 450 4.1 850 570 106 ~3.2
2746 Ne 250 450 3.5? 779 540 83 ~ 1.8
2747 Ne 300 450 3.8 761 515 102 > 1.6-3.7
2748 Ne 400 450 3.8 660 470 157 > 0.6-1.2
2749 Ne 500 450 3.8 676 480 115 > 0.3-1.3
2750 Ne 600 450 3.8 739 490 151 > 0.1-1.4
2751 Ne 800 450 3.8 802 505 119 > 0.4-1.5
2752 Ne 1000 450 3.7 708 485 143 > 0.5-1.4
2753 H2 600 J 350 3.6 925 600 280 ~3.6
2754 H2 600 375 3.6 953 605 377 ~ 5.1 2756 H2 600 400 3.6 1028 625 217 ~5.2 2757 H2 600 325 3.5 643 465 196 ~ 1.8 2758 H2 600 375 3.7 985 610 264 ~4.7
57

a> 3 Ü
800
600
400
200
'GEN^- S~" /—"
^JS**^ / / s^' ■ ^ J / yS
IP/H2^"^^ \ 1 /
- \ 1 / • 1 l/\
. yn Cable Guns
'_ IP/Ar //
0.6 0.7 0.8 0.9 1.0
Time (|is)
1.1 1.2
Figure 37. Load current traces that were obtained during the POS experiments with the IP on Hawk. A representative generator current waveform and load current waveform using the cable gun source is also shown.
400
350
300
250 O) CO
O 200 > CO O 150
CD » 100
50
i 1 1 r—r-
A
a D AA
1 1 1 1 1 1 r
□
a a
c fl D
a
0
V
A
dn/dr~0
dne/dr<0 dn/dr>0
'- u
Cable Gun Dat a '
AA o\ \
\ 1 J 1 1 L
V
__l i i i 1 1
0.2 0.4 0.6 0.8 1.0
Conduction Time (\is)
1.2
Figure 38. The peak recorded switch voltage vs. the conduction time for IP shots on Hawk using H2 gas. The data is separated according to the initial density gradient in the plasma fill. A curve representing to the cable gun data (open circles) is also shown.
58

"E ü
in
© TO CO
10
8 -
6 -
4 -
r=6.625 cm r=6.875cm r=7.125cm
r=7.375 cm r=7.625 cm
r=7.875 cm
r=8.125 cm
r=8.375 cm
-3.0 -2.5 -2.0 -1.5 -1.0 -0.5 0.0 0.5 1.0 1.5
Time (us)
Figure 39. A plot of the average electron density vs. time obtained during an IP shot on Hawk with H2 gas. In this case we can see that at the start of conduction (t = 0), the density is very nearly uniform.
7.2.1 Density Evolution: Conduction Phase for IP/H2 Shots.
The 8 channel interferometry gave us the ability to observe the density evolution in the
POS gap under the assumption of azimuthal symmetry. The 8 detectors essentially span the
entire radial gap with the exception of approximately 1 mm from each respective surface. The
average electron density was obtained from the interferometer signals by using the nominal
plasma length of 5 cm with a resolution limit of about ±3° or ±5.8 x 1014 cm-3. Figure
39 shows the average electron density as recorded on all eight channels for shot #2754 that
used H2 gas with a 3.6 ps delay. Channel 1 was centered at the smallest radial position near
the cathode(r = 6.625 cm), channel 8 centered near the anode at r = 8.375 cm, and the
center-to-center spacing for each channel was 2.5 mm. In this figure we have defined time
t = 0 at the start of the generator current. There are a number of interesting features in this
data that will be elaborated on in this section. Before the generator starts, at about -2.6 ps,
we observe sharp peaks in the density for each successive channel starting with channel 1
59

0
Cathode
J i_
6.5
t=0.35 |is
start of conduction (t=0)
_l 1 1 L. _1 I l_
7.0 7.5
Radius (cm)
8.0 8.5 i
Anode
(b) 8 r-r
6 -
E
? 4
& 2 > <
Cathode
t=0.9 (is
t=0.98 us
t=1.02 (is
6.5
end of load current rise
7.0 7.5
Radius (cm)
8.5-
Anode
Figure 40. The average electron density vs. radius obtained during an IP shot on Hawk with H2 gas. Part (a) shows early times where an increase in the electron density at all radial locations is observed. Part (b) shows the data later in the conduction phase and during opening were a large radial region shows density levels below the sensitivity limit of the interferometer.
60

and moving radially outward. This signature is the plasma ring expanding radially. When
channel 8 (near the anode) rises off the scale of the figure (-1.6 /zs), it indicates the time when
most of the plasma has stagnated against the anode. Finally near t = 0 the distribution
evens out and becomes uniform as we have discussed in a previous section. Very soon after
the generator current begins (~150 ns) the density is observed to increase on the channels
closest to the cathode, and very soon after a density increase is observed on the channels
nearer the anode. The increase nearer the anode is larger in magnitude. Figure 40(a) shows
the average electron density vs. the radial position at selected times early in the conduction
phase where one can see that the increase was first observed near the cathode and later
at the anode, increasing in magnitude. We must keep in mind that a pure, fully ionized
hydrogen plasma cannot generate additional electrons. It is clear from Figure 40(a), that
the electron inventory had increased forcing us to conclude that ionization of contaminants
or neutral hydrogen had occurred. Another way to look at the data is to calculate the
electron inventory as a function of time. An approximation to the total number of electrons
in the POS gap (JVe) was calculated from the measured phase shift at various radii ((j>{r))
via the following equation:
Y i=8 Ne = 2TTC <f>(r)rdr « 27rCAr5>,-&, (7)
where C is a constant that converts phase shift to line integrated density, Ar is the spacing
between interferometer channels, rt are the center radii of each channel, and fc are the
measured phase shifts at each channel. This sum was calculated as a function of time and
the results are shown in Figure 41 where Ne is in units of xlO17, and the sensitivity limit is
shown as a horizontal line. Two calculations were performed, one that included all 8 channels
and the other that used only the interior six channels. The later calculation emphasizes the
removal of plasma during opening. This plot makes it quite clear that there is a substantial
increase in the total number of electrons (~40%) during the conduction phase.
7.2.2 Density Evolution: Opening Phase for IP/H2 Shots.
During the opening phase we observed a dramatic decrease in the plasma density such
that the values were below the sensitivity limit over a span encompassing the interior 4 to
6 interferometer channels (1-1.5 cm). Such behavior has never been observed on Hawk with
other sources.[12] Figures 40(b) and 41 both display this feature which was common to all
IP/H2 shots with long delays. Not only are the large "gaps" unique, but the density remains
low throughout the entire opening phase for as long as 1 fis after opening begins. The later
61

Figure 41. The total number of electrons measured by the 8-channel interferometer vs. time during an IP shot on Hawk using H2 gas. The dashed line shows the number of electrons calculated from the interior six channels.
feature is best displayed in Figure 41 that contains a curve of Ne as a function of time for
the interior 6 channels.
7.2.3 Density Evolution: IP/Ar Shots.
Unfortunately, only one channel of interferometry was available for most of the IP/Ar
series. This was due to dirty vacuum windows that forced us to reduce to number of channels
so the signal to noise ratio of the laser detector could be increased. There was one shot
(#2718) where all 8 channels were operating. The density evolution is similar to the IP/H2
shots with one notable difference; the initial distribution is not very uniform in comparison
to the hydrogen plasma case. However, we saw a similar increase in the electron inventory
followed by a sharp decrease in the density on most of the 8 channels near opening. It
should be pointed out that for the same electron densities in a hydrogen and argon plasma,
the mass density is approximately a factor of 20 greater for argon. The exact number depends
on the ionization state of argon, but the point is that for any reasonable ionization state the
interferometer is much less sensitive to the mass density for Ar plasmas.
62

7.2.4 Scaling of POS Current.
The relationship between the conducted POS current and the properties of the injected
plasma has been the subject of many publications.[13, 14, 15, 16] It is generally agreed that
the conducted current of switches where the IT product is in the range of 1 MA-fis will obey
MHD scaling. The MHD scaling theory is conceptually simple and is adequately described
by a snowplow model where an ideal snowplow pushes the switch plasma axially via J x B
forces. The end of the conduction phase is defined when the snowplow reaches the end of
the switch length, this is also equivalent to the plasma center of mass being displaced one
half the switch length. According to MHD scaling, the relationship between the conducted
current and the plasma properties is the following:
J'jmdf = IOO^W* (g)
where Ig(t) is the generator current, r the cathode radius, / the axial switch length, M the
ion mass, Z the average ion charge, ne the electron density, and Tc the conduction time. The
conducted current Ic is simply equal to Ig(Tc). This relationship implies that the conduction
is governed by the plasma mass density (MnJZ). For the case of hydrogen we have M/Z -
1, and we would require a higher electron density to conduct the same IT product than a
heavier mass plasma such as Ar, where M/Z might be ~20. Our experiments with the inverse
pinch gave us the opportunity to check the scaling with different species plasmas. Figure
42 is a plot of the conducted current vs. the electron density that includes data compiled
from IP/Ar and IP/H2 shots, along with several calculations based on the MHD theory
for different ratios of M/Z. For the data we only included IP/H2 shots with a long delay
time when the density was approximately uniform. For the Ar data we assume uniformity
(only one channel of interferometry data was available) and pick the shots with a long delay
time (10-11 fis). The Ar data fits reasonable well to a curve with M/Z=20, implying an
average charge state for Ar of +2, which agrees with the ionization state determined from
our snowplow calculation (see Table 6-1). However, the H2 data is not even close to the
curve that would correspond to a pure hydrogen plasma, namely M/Z—l. In fact, the
IP/H2 data fits MHD theory if we assume M/Z=6. One way to explain this under the
guise of MHD theory, would be to account for the extra mass as neutral hydrogen that exists
before the generator current starts. The neutral mass must be ionized during the conduction
phase to contribute to the MHD process. Figure 42 implies that there would have to be 5
times more electrons/protons than what is initially detected at t = 0, and we should see an
increase in the electron inventory by a factor of 5 during the conduction phase. The fact
that we see only a 40% increase in the electron inventory is strong evidence that neutral
63

800 I i i i i i i i i i i i i i i i i i i i i i i i i i
O 200
100 o IP/Ar Data
i •
n,(x1015cm'3)
Figure 42. The conducted current vs. the injected electron density for IP shots on Hawk with Ar and H2 gas. Only the H2 data with uniform initial density distribu- tions are displayed. Also shown are three curves that were calculated from MHD theory for various M/Z ratios indicating that a M/Z = 6 fits the H2
the best.
hydrogen is not contributing significantly to the increased mass. A more likely scenario
is that the plasma desorbs vacuum system impurities, and possibly aluminum, from the
electrode surfaces. These impurity atoms may exist as neutral material at t = 0, and would
even go undetected spectroscopically due to the low electron temperatures (Te = 0.7 eV).[17]
If these impurities were ionized during the conduction phase with an average M/Z=12.5,
then then MHD theory can account for the observed IT product. It seems conceivable that
the ionization of Al and common vacuum system adsorbates (CH4,H20,CO) could produce
a plasma with a mass to charge ratio of 12.5.
7.2.5 Comments on IP/Air and IP/Ne Shots.
A number of POS shots were tried using the inverse pinch with Air (15) and Ne (14).
Using the IP with Air had not been tried before, and there was an uncertainty surrounding
the expected performance of the IP from the standpoint of a plasma source. We did have
some prior experience using Ne and we knew that the IP did not perform well. Ne discharges
64

were plagued by inconsistent breakdowns for all combinations of puff valve delays and pres-
sures that were tried in the past. Despite this, we were motivated by the desire to try an
intermediate mass plasma. We had shown that methane (CH4) worked very nicely using the
IP, but this gas was unavailable at the time. Using Ne and Air we were never able to reach
the level of operation achieved with Ar. An examination of Table 4 shows this to be the
case. Because of the POS results, and the uncertainty surrounding the IP performance as a
plasma source using these gases, most of this data remains unanalyzed.
65
Section 8
Conclusions
In summary, we have successfully designed and tested a plasma source with inverse pinch
geometry. The source derives its plasma from a gas puff and requires a 20 kV, ~125 kA,
1.5 fis quarter period pulse for operation. We have demonstrated reasonably consistent
(±10% for most parameters) operation using H2, CH4, and Ar gas with the IP mounted
in a POS-like geometry. We have verified the IP operates like the inverse of a gas puff z-
pinch using framing photography, magnetic pick-up loops, and interferometry. Furthermore,
we have characterized the fill plasma by measuring it radial and axial distributions and
determined appropriate semi-transparent boundary that prevents current flow in the POS
gap. Near the conclusion of the program we fielded the source on the Hawk POS at NRL
that produced very interesting data. We feel that some discussion of these experiments is
warranted.
The results from the POS experiments on Hawk raise a number of interesting questions
with regard to POS physics issues and show a great deal of promise for improving POS
parameters using a hydrogen plasma. The fact that switch voltages were significantly higher
using hydrogen plasma makes it tempting to conclude that a plasma dominated by low
mass ions will improve the switch characteristics. While this may be true, it is also a gross
simplification because we have found that the state of the initial plasma may play an equally
important role. The shorter delay times, when the plasma distribution was changing on
1 (is time scales, produced results that were essentially indistinguishable from cable guns.
It was only at the longer delays that we saw significant improvement using hydrogen. It
should be emphasized that, because the IP source ejects a discrete plasma ring, changes in
the delay time redistribute the same quantity of plasma in the gap. While the radial density
profiles become uniform for the long delays, other plasma properties, such as the azimuthal
symmetry and radial velocity, may also change significantly. It is therefore unclear which of
these properties is responsible for the improved performance.
The scaling of the conducted current with the injected plasma mass, in particular the
hydrogen data (see Figure 42), raises the issue of secondary plasma formation during the
conduction phase. If a pure, fully ionized, hydrogen plasma is assumed to exist prior to the
66

start of the generator current, then there is not enough mass to account for the observed
conduction according to MHD scaling. However, if the plasma is not fully ionized then the
mass may be significantly higher. The fact that we observed an increase in the electron
inventory by 40% during the conduction phase (Figure 41) indicates that we have ionized
either neutral H or H2 originating from the gas puff, or ionized desorbed material from the
electrode surfaces (aluminum). If these additional electrons produced ions with M/Z=12.5,
then the data would agree with MHD scaling. It is conceivable that an ionized mixture
of common vacuum system adsorbates (H20,CH4,CO) and aluminum can account for this
additional mass. The overall scenario that plasma formed from adsorbates had contributed to
the conduction is not inconsistent with our spectroscopic measurements on the H fill plasma
that showed no impurity emission. The analysis of this data indicated that the electron
temperature was very low in the fill plasma, which introduces the possibility that desorbed
material could exist, but not be sufficiently excited to produce optical emission. Emission
would only be observed when the electrons are heated, say by the generator current.
Perhaps the most significant result with regard to improvements in the POS is the ob-
servation of large areas where the electron density falls below the sensitivity limit of the
interferometer as shown in Figure 40(b). This type of behavior has not been observed with
other plasma sources. [12] If this region evolves into a magnetically insulated vacuum gap,
then we would expect higher voltages/power coupling into diode loads then is presently
achieved in POSs.
The authors would like to acknowledge the help of Ms. Pat Herbert of DSWA for her
efforts to get this program funded, and Dr. Ralph Schneider, also with DSWA, for his
continuing support. We also appreciate the expert technical help by HY-Tech personnel,
specifically Dan Steinberg and Caterina Vidoli. Many of the early design elements of the
IP were a direct result of conversations with Dan, and Caterina was an essential member
of our team, especially during the experiments at NRL. Dr. Hylton Murphy of Maxwell
Technologies assisted us by making useful suggestions in the design of the gas nozzle. Fi-
nally, we would like to thank the entire technical staff at NRL for their support during the
experiments on Hawk. In particular the authors appreciated the enthusiastic response on
the part of Dr. Robert Commisso and Dr. Bruce Weber to the prospect of using the IP on
Hawk. Bruce also deserves special mention for his consultation and efforts in analyzing the
data.
67

Appendix
Bibliography
1 J. Marshall, I. Henins, R. Dike, and J.L. Tuck, "Status Report of the LASL Controlled
Thermonuclear Research Program for 12 Month Period Ending October 31, 1966," (UN-
CLASSIFIED) Rep. # LA-3628 MS, p. 69 (1966).(UNCLASSIFIED)
2 J.H. Lee, S.H. Choi, and K.D. Song, "Design for Megavolt Inverse-Pinch Plasma
Switch," (UNCLASSIFIED) 7th IEEE Pulsed Power Conference, Monterey, CA, June
11-14, 1989, Paper P2-19, p. 717.(UNCLASSIFIED)
3 P.S. Anan'in, V.B. Karpov, Ya.E. Krasik, I.V. Lisitsyn, A.V. Petrov, and
V.G. Tolmacheva,"Investigation of plasma opening switches with pulsed gas
guns,"(UNCLASSIFIED) Sov. Phys. Tech. Phys. 36(8), 894 (1991).(UNCLASSIFIED)
4 General Valve Corporation, Fairfield New Jersey.(UNCLASSIFIED)
5 B.V. Weber, and D.D. Hinshelwood, "He-Ne interferometer for density measurements
in plasma opening switch experiments," (UNCLASSIFIED) Rev. Sei. Instrum. 63(10),
5199 (1992).(UNCLASSIFIED)
6 K. Bockasten, "Transformation of Observed Radiances into Radial Distribution of the
Emission of a Plasma," (UNCLASSIFIED) Opt. Soc. Amer. 51(9), 943 (1961).(UN-
CLASSIFIED)
7 B.V. Weber and S.F. Fulghum, "A high sensitivity two-color interferometer for pulsed
power plasmas," (UNCLASSIFIED) Rev. Sei. Instrum. 68(2), 1227 (1997).(UNCLAS-
SIFIED)
8 R.J. Commisso, P.J. Goodrich, J.M. Grossmann, D.D. Hinshelwood, P.F. Ottinger,
and B.V. Weber,"Characterization of a microsecond-conduction-time plasma opening
switch," (UNCLASSIFIED) Phys. Fluids B 4(7), 2369 (1992).(UNCLASSIFIED)
9 T.J. Renk, "Flashboards as a plasma source for plasma opening switch applications,"
(UNCLASSIFIED) J. Appl. Phys. 65(7), 2652 (1989).(UNCLASSIFIED)
68

10 J.R. Goyer, D. Kortbawi, F.K. childers, and P.S. Sincerny, "Low jitter operation of a
plasma opening switch," (UNCLASSIFIED) J. Appl. Phys. 74(6), 4236 (1993).
11 P.J. Goodrich, R.J. Commisso, J.M. Grossmann, D.D. Hinshelwood, R.A. Riley, S.B.
Swanekamp, and B.V. Weber,"High Power Plasma Opening Switch Operation on
Hawk," (UNCLASSIFIED) in Proceeding of the 10th International Conference on High
Power Particle Beams, Vol. 1, p. 299.(UNCLASSIFIED)
12 B.V. Weber, D.D. Hinshelwood, and R.J. Commisso,"Interferometry of Flashboard
and Cable-Gun Plasma Opening Switches on Hawk," (UNCLASSIFIED) IEEE Trans.
Plasma Sei. 25(2), 189 (1997).(UNCLASSIFIED)
13 W. Rix, D. Parks, J. Shannon, J. Thompson, and E. Waisman,"Operation and Empirical
Modeling of the Plasma Opening Switch," (UNCLASSIFIED) IEEE Trans. Plasma Sei.
19(2), 400 (1991).(UNCLASSIFIED)
14 B.V. Weber, R.J. Commisso, P.J. Goodrich, J.M. Grossmann, D.D. Hinshelwood, P.F.
Ottinger, and S.B. Swanekamp, "Plasma opening switch conduction scaling," (UNCLAS-
SIFIED) Phys. Plasmas 2(10), 3893 (1995).(UNCLASSIFIED)
15 K.V. Chukbar and V.V. Yan'kov, "Evolution of the magnetic field in plasma opening
switches," (UNCLASSIFIED) Sov. Phys. Tech. Phys. 33(11), 1293 (1988). (UNCLAS-
SIFIED)
16 J.R. Goyer, "A Conduction Model for PEOS Operation Incorporating Simplified
Cathode Sheath Effects," (UNCLASSIFIED) IEEE Trans. Plasma Sei. 19(5), 920
(1991).(UNCLASSIFIED)
17 Private communication, Dr. Yitzhak Maron, Plasma Analyses.(UNCLASSIFIED)
69/70

DISTRIBUTION LIST
DEPARTMENT OF DEFENSE
BALLISTIC MISSILE DEFENSE OFFICE 7100 DEFENSE PENTAGON WASHINGTON, D.C. 20301-7100
ATTN: T/SL
DEFENSE ADVANCED RESEARCH PROJECTS AGENCY 3701 NORTH FAIRFAX DRIVE ARLINGTON, VA 22203-1714
ATTN: DED
COMMANDER DEFENSE INFORMATION SYSTEMS AGENCY PACIFIC AREA WHEELER AFB, HI 96854-5000
ATTN: COMMANDER
DEFENSE TECHNICAL INFORMATION CENTER 8725 JOHN J. KINGMAN ROAD, SUITE 0944 FORT BELVOIR, VA 22060-6218
ATTN: DTIC/OCP
DEFENSE THREAT REDUCTION AGENCY 6801 TELEGRAPH ROAD ALEXANDRIA, VA 22310-3398
ATTN: CPF, P. HEBERT ATTN: CPWCT ATTN: CPWP, T. KENNEDY ATTN: CPWT ATTN: NSC ATTN: NSS, J. M. PIERRE ATTN: NSSA, DR G. DAVIS ATTN: NSSA, W. SUMMA ATTN: NSSE, W. J. SCOTT ATTN: NSSS, D. BELL ATTN: NSSS, DR. K. WARE ATTN: NSSS, L PRESSLEY ATTN: NSSS, R. GULLICKSON ATTN: NSSS, R. MAINGER ATTN: PMP ATTN: SWWA
DEFENSE THREAT REDUCTION AGENCY ALBUQUERQUE OPERATIONS 1680 TEXAS STREET, SE KIRTLAND AFB, NM 87117-5669
ATTN ATTN ATTN
CPT-D DR. G. BALADI CPTO CPTO, R. W. SHOUP
PRESIDENT NATIONAL DEFENSE UNIVERSITY FORT LESLEY J. MCNAIR WASHINGTON, DC 20319-6000
ATTN: NWCO
DIRECTOR NET ASSESSMENT OFFICE OF THE SEC OF DEFENSE ROOM 3A930, THE PENTAGON WASHINGTON, DC 20301
ATTN: DOCUMENT CONTROL
DEPARTMENT OF DEFENSE CONTRACTORS
AEROSPACE CORP P. O. BOX 92957 LOS ANGELES, CA 90009
ATTN: LIBRARY ACQUISITION, M1/199 ATTN: M2/241.T. PARK
ALME AND ASSOCIATES ATTN: DOC P. O. BOX 4057 ALEXANDRIA, VA 22303
ATTN: J. F. DAVIS ATTN: S. SEILER, G101
APTEK, INC. 1257 LAKE PLAZA DRIVE COLORADO SPRINGS, CO 80906-3578
ATTN: T. MEAGHER
BERKELEY RSCH ASSOCIATES, INC. P. O. BOX 852 SPRINGFIELD, VA 22150-0852
ATTN: N. PEREIRA
CHARLES STARK DRAPER LAB, INC. 555 TECHNOLOGY SQUARE CAMBRIDGE, MA 02139
ATTN: LIBRARY, MS #74
DEFENSE GROUP, INC P. O. BOX 7522 SANTA MONICA, CA 90406-7522
ATTN: R. POLL
E-SYSTEMS, INC. ECI DIVISION P.O. BOX 12248 ST. PETERSBURG, FL 33733-2248
ATTN: MS 3, TECH INFO CTR
DL-1

HY-TECH RESEARCH CORPORATION 104 CENTRE COURT RADFORD, VA 24141
ATTN ATTN ATTN
E. J. YADLOWSKY J. J. MOSCHELLA R. C. HAZELTON
ITT INDUSTRIES ITT SYSTEMS CORPORATION ATTN: AODTRA/DASIAC 1680 TEXAS STREET, SE KIRTLAND AFB, NM 87117-5669
ATTN: DASIAC ATTN: DASIAC/DARE
ITT SYSTEMS CORPORATION 2560 HUNTINGTON AVENUE ALEXANDRIA, VA 22303
ATTN: C. FORE
JAYCOR 1410 SPRING HILL ROAD, SUITE 300 MCLEAN, VA 22102
ATTN: DR C. P. KNOWLES
JAYCOR P.O. BOX 85154 SAN DIEGO, CA 92186-5154
ATTN: M. TREADAWAY
KTECH CORP. 2201 BUENA VISTA DRIVE, SE, SUITE 400 ALBUQUERQUE, NM 87106-4265
ATTN: F. DAVIES
LOGICON - RDA 2100 WASHINGTON BOULEVARD ARLINGTON, VA 22204-5706
ATTN: E. QUINN ATTN: I. VITKOVITSKY
MISSION RESEARCH CORP. 1720 RANDOLPH ROAD, SE ALBUQUERQUE, NM 87106-4245
ATTN: K. STRUVE
PULSE SCIENCES, INC. 600 MC CORMICK STREET SAN LEANDRO, CA 94577
ATTN ATTN ATTN
I. D. SMITH P. W. SPENCE TECHNICAL LIBRARY
SCIENCE APPLICATIONS INTL. CORP. P.O. BOX 1303 MCLEAN, VA 22102
ATTN: W. CHADSEY
SRI INTERNATIONAL 333 RAVENSWOOD AVENUE MENLO PARK, CA 94025-3434
ATTN: ELECTROMAG SCI LAB TECH LIB
SVERDRUP INC., AEDC 253 1ST STREET ARNOLD AFB, TN 37389-2250
ATTN: L. S. CHRISTENSEN, MS 640
SVERDRUP TECHNOLOGY INC. P. O. BOX 884 TULLAHOMA.TN 37388
ATTN: V. KENYON
TEXAS TECH UNIVERSITY PULSED POWER LAB PHYSICS DEPARTMENT LUBBOCK, TX 79409
ATTN: L. HATFIELD, M/S 1051 ATTN: M. KRISTIANSEN, M/S 3102
DEPARTMENT OF ENERGY
MAXWELL PHYSICS INTL COMPANY 2700 MERCED STREET SAN LEANDRO CA 94577-0599
ATTN ATTN ATTN ATTN ATTN
B. FAILOR C. STALLINGS J. RIORDAN P. SINCERNY S. L. WONG
MAXWELL TECHNOLOGIES 8888 BALBOA AVENUE, BUILDING 1 SAN DIEGO, CA 92123
ATTN ATTN ATTN
J. THOMSON P. COLEMAN W. H. RIX
UNIVERSITY OF CALIFORNIA LAWRENCE LIVERMORE NATIONAL LAB P. O. BOX 808 LIVERMORE, CA 94551-9900
ATTN: L-031.L SUTER ATTN: L-180, G. SIMONSON
LOS ALAMOS NATIONAL LABORATORY P. O. BOX 1663 LOS ALAMOS, NM 87545
ATTN ATTN ATTN ATTN
F-670, C. EKDAHL MS D408 MS H827 MS-J970/R. REINOVSKY
DL-2

HY-TECH RESEARCH CORPORATION 104 CENTRE COURT RADFORD, VA 24141
ATTN ATTN ATTN
E. J. YADLOWSKY J. J. MOSCHELLA R. C. HAZELTON
ITT INDUSTRIES ITT SYSTEMS CORPORATION ATTN: AODTRA/DASIAC 1680 TEXAS STREET, SE KIRTLAND AFB, NM 87117-5669
ATTN: DASIAC ATTN: DAS I AC/DARE
ITT SYSTEMS CORPORATION 2560 HUNTINGTON AVENUE ALEXANDRIA, VA 22303
ATTN: C. FORE
JAYCOR 1410 SPRING HILL ROAD, SUITE 300 MCLEAN, VA 22102
ATTN: DR C. P. KNOWLES
JAYCOR P.O. BOX 85154 SAN DIEGO, CA 92186-5154
ATTN: M. TREADAWAY
KTECH CORP. 2201 BUENA VISTA DRIVE, SE, SUITE 400 ALBUQUERQUE, NM 87106-4265
ATTN: F. DAVIES
LOGICON - RDA 2100 WASHINGTON BOULEVARD ARLINGTON, VA 22204-5706
ATTN: E. QUINN ATTN: I. VITKOVITSKY
MAXWELL PHYSICS INTL COMPANY 2700 MERCED STREET SAN LEANDRO CA 94577-0599
ATTN B. FAILOR ATTN C STALLINGS ATTN J. RIORDAN ATTN P. SINCERNY ATTN S. L. WONG
MAXWELL TECHNOLOGIES 8888 BALBOA AVENUE, BUILDING 1 SAN DIEGO, CA 92123
MISSION RESEARCH CORP. 1720 RANDOLPH ROAD, SE ALBUQUERQUE, NM 87106-4245
ATTN: K. STRUVE
PULSE SCIENCES, INC. 600 MC CORMICK STREET SAN LEANDRO, CA 94577
ATTN: I. D. SMITH ATTN: P. W. SPENCE ATTN: TECHNICAL LIBRARY
SCIENCE APPLICATIONS INTL. CORP P. O. BOX 1303 MCLEAN, VA 22102
ATTN: W. CHADSEY
SRI INTERNATIONAL 333 RAVENSWOOD AVENUE MENLO PARK, CA 94025-3434
ATTN: ELECTROMAG SCI LAB TECH LIB
SVERDRUP INC., AEDC 253 1ST STREET ARNOLD AFB, TN 37389-2250
ATTN: L. S. CHRISTENSEN, MS 640
SVERDRUP TECHNOLOGY INC. P. O. BOX 884 TULLAHOMA.TN 37388
ATTN: V. KENYON
TEXAS TECH UNIVERSITY PULSED POWER LAB PHYSICS DEPARTMENT LUBBOCK, TX 79409
ATTN: L. HATFIELD, M/S 1051 ATTN: M. KRISTIANSEN, M/S 3102
DEPARTMENT OF ENERGY
UNIVERSITY OF CALIFORNIA LAWRENCE LIVERMORE NATIONAL LAB P. O. BOX 808 LIVERMORE, CA 94551-9900
ATTN: L-031.L SUTER ATTN: L-180, G. SIMONSON
LOS ALAMOS NATIONAL LABORATORY P. O. BOX 1663 LOS ALAMOS, NM 87545
ATTN ATTN ATTN
J. THOMSON P. COLEMAN W. H. RIX
ATTN ATTN ATTN ATTN
F-670, C. EKDAHL MS D408 MS H827 MS-J970/R. REINOVSKY
DL-3
SANDIA NATIONAL LABORATORIES ATTN: MAIL SERVICES P. O. BOX 5800 ALBUQUERQUE, NM 87185-0459
ATTN ATTN ATTN ATTN ATTN ATTN ATTN ATTN
C. DEENEY, MS 1194 D.COOK, MS 1190 D. MACDANIEL, MS 1194 M. HEDEMANN, MS 1159 M. KM ATZEN, MS 1187 TECHNICAL LIBRARY, MS 0899 WBALLARD, MS 1179 WBEEZHOLD, MS-1155
SAN ANTONIO AIR LOGISTICS CTR DIRECTORATE OF SPECIAL WEAPONS KELLY AFB, TX 78241-5000
ATTN: ALC/SW, F. CRISTADORO
USAF ROME LABORATORY TECHNICAL LIBRARY, FL2810 CORRIDOR W. SUITE 262, RL/SUL 26 ELECTRONICS PARKWAY, BUILDING 106 GRIFFIS AFB, NY 13441-4514
ATTN: RBCM ATTN: RBCT
U S DEPT OF ENERGY IE-24 1000 INDEPENDENCE AVENUE, SW WASHINGTON, DC 20585
ATTN: D. CRANDALL
U.S. DEPARTMENT OF ENERGY P. O. BOX A GERMANTOWN, MD 20875-0963
ATTN ATTN ATTN
C. B. HILLAND, DP-243 C. KEANE, DP-16 OMA/DP-252, R. GUNDERSON
DEPARTMENT OF THE AIR FORCE
AFIWC/MSO 102 HALL BOULEVARD SUITE 315 SAN ANTONIO, TX 78243-7016
ATTN: TECHNICAL LIBRARY
AIR FORCE FOR STUDIES & ANALYSIS 1570 AIR FORCE PENTAGON WASHINGTON, DC 20330-1570
ATTN: SATI, RM 1D363
DEPARTMENT OF THE ARMY
DEPARTMENT OF THE ARMY DEPUTY CHIEF OF STAFF FOR OPERATIONS AND PLANS PENTAGON WASHINGTON, DC 20310-0460
ATTN: DAMO-ODW
US ARMY RESEARCH LABORATORIES 2800 POWDER MILL ROAD ADELPHI, MD 20783-1197
ATTN ATTN ATTN
TECHNICAL LIBRARY AMSEL-WT-NH/KEHS AMSRL-WT-KEHS
COMMANDER US ARMY SPACE & STRATEGIC DEFENSE COMMAND CSSD-TC-SR P. O. BOX 1500 HUNTSVILLE, AL 35807-3801
ATTN: CSSD-ES-E1, R. CROWSON
AIR FORCE RESEARCH LABORATORY 3550 ABERDEEN AVENUE, SE KIRTLAND AFB, NM 87117-5776
ATTN: PL/WSP, J KIUTTU ATTN: WSP/JDEGNAN
AIR UNIVERSITY LIBRARY 600 CHENNAULT CIRCLE BUILDING 1405, ROOM 160 MAXWELL AFB, AL 36112-6424
ATTN: AUL-LSE
US ARMY THAAD PROJECT OFFICE P.O. BOX 1500 HUNTSVILLE, AL 35807-3801
ATTN: CSSD-WD
COMMANDER US ARMY VULNERABILITY ASSESSMENT LABORATORY WHITE SANDS MISSILE RANGE, NM 88002-5513
ATTN: SLCVA-TAC
ARNOLD ENGINEERING DEVELOPMENT CENTER 1099 AVENUE C ARNOLD AFB, TN 37389-9011
ATTN: K. BRANDON
DL-4

DEPARTMENT OF THE NAVY
COMMANDER NAVAL AIR SYSTEMS COMMAND 47123 BUSE ROAD, #IPT PATUXENT RIVER, MD 20670
ATTN ATTN ATTN
AIR 5161 AIR-5164 AIR-933
DIRECTOR STRATEGIC SYSTEMS PROGRAMS 37224 TRIDENT 1931 JEFFERSON DAVIS HIGHWAY ARLINGTON, VA 22202-5362
ATTN: J. BURTLE ATTN: K. TOBIN
OTHER GOVERNMENT
NAVAL RESEARCH LABORATORY 4555 OVERLOOK AVENUE, SW WASHINGTON, DC 20375-5000
ATTN: CODE 6720, J. DAVIS ATTN: CODE 6770, G. COOPERSTEIN
CENTRAL INTELLIGENCE AGENCY WASHINGTON, DC 20505
ATTN ATTN ATTN
OSWR, J. PINA OSWR/SSD/SWB OSWR/STD/TTB
COMMANDER NAVAL SURFACE WARFARE CENTER DAHLGREN DIVISION 17320 DAHLGREN ROAD DAHLGREN, VA 22448-5000
ATTN: B. DEPARTMENT
OFFICE OF NAVAL INTELLIGENCE 4251 SUITLAND ROAD WASHINGTON, DC 20395-5720
ATTN: DEOO ATTN: LIBRARY
FEDERAL EMERGENCY MANAGEMENT AGENCY 500 C. STREET, SW, SUITE 514 WASHINGTON, D.C. 20472
ATTN: SL-CD-MP
DIRECTOR NATIONAL SECURITY AGENCY FORT GEORGE G. MEADE, MD 20755-6000
ATTN: TECHNICAL LIBRARY
COMMANDER SPACE & NAVAL WARFARE SYSTEMS CMD DEPARTMENT OF THE NAVY 2451 JEFFERSON DAVIS HIGHWAY ARLINGTON, VA 22245
ATTN: PMW-145
DL-5