development of a structural model for tourism destination ... · tourism destination...
TRANSCRIPT
Development of a Structural Model for
Tourism Destination Competitiveness from Stakeholders’ Perspectives
by
Yooshik Yoon
Dissertation submitted to the Faculty of the Virginia Polytechnic Institute and State University
In partial fulfillment of the requirement for the degree of
DOCTOR OF PHILOSOPHY
in
Hospitality and Tourism Management
Approved:
_____________________________ _____________________________ Dr. Muzaffer S. Uysal (Co-Chair) Dr. Joseph S. Chen (Co-Chair)
________________________ _________________________
Dr. Brian Mihalik Dr. John Williams
____________________________
Dr. Susan Hutchinson
September 19, 2002 Blacksburg, Virginia
USA
Key Words: Tourism Destination Competitiveness, Tourism Stakeholders, Tourism Impact, Place Attachment, Environmental Attitude,
Structural Equation Modeling (SEM)
Copyright 2002, Yooshik Yoon
ii
Development of a Structural Model for
Tourism Destination Competitiveness from Stakeholders’ Perspectives
Yooshik Yoon
(ABSTRACT)
This study was conducted to theoretically develop and empirically test a structural
equation model of tourism destination competitiveness from the tourism stakeholders’
perspective. The proposed hypotheses that attempted to identify the structural
relationships among the five constructs in the model were examined through a series of
analyses in LISREL: 1) perceived tourism development impacts, 2) environmental
attitudes, 3) place attachment, 4) development preferences about destination
attractions/resources, and 5) support for destination competitive strategies
The principle guideline of this study was that the support of tourism stakeholders
for tourism planning and development is a key element for the successful operation,
management, and long-term sustainability of tourism destinations. Tourism stakeholders’
solid knowledge and experiences in tourism management and industry, professional
involvement and participation in tourism planning and development, and long-term
community observation and interactions have played an important role in tourism
destination management.
A total of 646 usable questionnaires were collected from randomly selected
tourism stakeholders in the state of Virginia. From the results of hypotheses tests,
tourism stakeholders’ preferences about tourism attractions/ resources development are a
function of perceived tourism development impacts as well as place attachment. The
more stakeholders’ preference for developing tourism attractions/resources, the more
likely they were to support destination competitive strategies such as marketing efforts
and activities, and destination management organizations’ role. An additional finding
that was not hypothesized indicated that tourism stakeholders, who have perceived
benefits from tourism development, particularly in its economic and cultural aspects, are
likely to support enhancement strategies for destination competitiveness. The
implications of these findings can be applied to the enhancement of tourism destination
competitiveness.

iii
ACKNOWLEDGEMENTS
I wish to express my sincere appreciation to the many people who provided
support, direction, and assistance toward the completion of this dissertation. Without their
words of encouragement and contributions, this dissertation research would not have
been finished.
First and foremost, a very special “thank you” should be extended to my
committee co-chairmen, Dr Muzaffer S. Uysal and Dr Joseph S. Chen. Their supports,
guidelines, and instruction were invaluable to the completion of my graduate studies at
Virginia Tech. Their nurturing of my academic and professional development is highly
valued and gratefully acknowledged. Particularly, I would like to thank Dr Uysal for
making his unlimited tourism and research knowledge available to me. I have gained
unequaled inspiration, insights, and knowledge about tourism throughout my discussions
with him. I am also grateful to Dr Chen for his continued support and encouragement
during my graduate studies. His contributions toward sustaining my initiative near the
end of the study are acknowledged.
My sincere expression of gratitude is also extended to my dissertation committee
members for all of their help, suggestions, and comments that have improved the finished
work. First, I would like to thank Dr Brian Mihalik for offering many insights,
suggestions, and recommendations that contributed to this dissertation research.
Especially, I truly appreciate the teaching and research opportunities that he helped to
make possible. I also wish to thank Dr John Williams for his suggestions and
contributions to improve the quality of the dissertation. His kind guidance and
encouragement during my doctoral pursuit is gratefully acknowledged. Being a research
team with him was truly delightful and showed me an example of how to manage
research projects more successfully, and was appreciated. Lastly, a special expression of
thanks to Dr Susan Hutchison for being an outstanding research methods, measurement
theory, and statistics professor and for making her extensive knowledge and experiences
available to me during classes. Her tremendous contributions, comments, and suggestions
for improvements for this doctoral dissertation are highly valued and gratefully
acknowledged.

iv
Lastly, I wish to thank all of the friends, families, and staff at the Dept. of
Hospitality and Tourism Management at Virginia Tech for their help and support for six
and half years of graduate study in Blacksburg, Virginia.
I want to express “many thanks” to my family for their unconditional support and
for believing in me. Particularly, my beloved wife, Eunsil Lee and my daughter, Myoung-
Eun deserve my special thanks and gratitude for their love, support, and patience. I love
you. Finally, I want to share this happy moment with my mother-in-law. Her endless
support and help is highly appreciated.

v
DEDICATION
This dissertation is dedicated to the memory of my mother. I miss you, Mom.
vi
TABLE OF CONTENTS
ABSTRACT ….…………………………………………………… ii
ACKNOWLEDGEMENTS ….…………………………………………………… iii
DEDICATION ….…………………………………………………… v
TABLE OF CONTENTS ….…………………………………………………… vi
LISTS OF APPENDICES ….…………………………………………………… x
LISTS OF TABLE ….…………………………………………………… xi
LISTS OF FIGURES ….…………………………………………………… xii
CHAPTER I. INTRODUCTION Introduction ……….……………………………………………………… 1
Background of the Study ….…………………………………………………… 2
Statement of the Problem ….…………………………………………………… 5
Research Questions .……………………………………………………… 7
Research Hypotheses …………………………………………………….… 8
Objectives of the Study …………….………………………………………… 9
Theoretical Background …………………….………………………………… 9
Structural Model of the Study ………….…………………………………………… 11
Contributions of the Study ………………..……………………………………... 12
Organization of the Study ……………………..………………………………... 13
Functional Definitions of Terms …………….………………………………… 14
CHAPTER II. LITERATURE REVIEW Introduction ………………………………………………………………. 15
Review of Relevant Concepts …………………………………………………. 15
Tourism and its Systematic Approach ..……………………………... 15
Tourism Planning and Development ………………………………. 18
Tourism Planning and its Concepts ………………………………. 19
Goals of Tourism Planning ……………………………………. 20
vii
Components of Tourism Planning ………………………………. 20
Levels and Types of Tourism Planning ………………………….. 21
Approach to Tourism Planning ………………………………. 22
Review of the Theoretical Framework .……………………………………….. 23
Social Exchange Theory ………………………………………………. 23
Tourism Destination Competitiveness ………………………………………. 28
Concepts and Definitions of Destination Competitiveness ………………. 29
Nature and Framework of Destination Competitiveness ..……………... 31
Development of Destination Competitive Strategies ……………………. 32
Tourism Attractions/Resources ………………………………………………. 36
Tourism Development Impacts ………………………………………………. 38
Environmental Attitudes ………………………………………………………. 41
Place Attachment …………………………………………………………….. 44
CHAPTEER III. RESEARCH METHODOLOGY Introduction ………………………………………………………….…… 49
Research Framework …………………………………………………….… 50
Research Hypotheses …………………………………………………….… 52
Statistical Method for the Hypotheses Tests ………………………………………. 53
Measurement Model ………………………………………………. 54
Structural Model ……………………………………………...…………. 55
Evaluation of Structural Equation Modeling ………………………………. 56
Research Design ………………………………………………………………. 59
Study Population ……………....………………………………….. 59
Sampling …………………………………………………………….. 59
Sample Size …………………………………………………………….. 60
Data Collection …………………………………….…………………… 62
Pre-test and Procedures for the Survey Instrument ………………………. 62
Measurement Scales and Instruments ………………………………………….. 63
Exogenous Constructs …………………………………………….… 64
Measurement of Tourism Development Impacts ………………. 64
viii
Measurement of Environmental Attitudes ………………………. 67
Measurement of Place Attachment ………………………………. 70
Mediating Endogenous Construct ………………………………………. 72
Measurement of Development Preferences about
Destination Attractions ……………………………… 72
Ultimate Endogenous Construct ……………………………………... 75
Measurement of Support for Destination Competitive Strategies …. 75
Reliability and Validity of the Measurement Scales ……………………… 77
Summary of the Chapter ………………………………………………. 81
CHAPTER IV. DATA ANALYSIS and RESULTS
Introduction ………..…………………………………………….……………….. 82
Data Collection ..……………………………………………….…………….. 82
Non-Response Bias Test …..………………………………………………….. 84
Profile of Respondents ………………………………………………………. 85
Demographic Characteristics of Tourism Stakeholders (Virginia) ………………. 85
Geographical Distributions of Respondents ………………………………. 88
Preliminary Data Analysis ………………………………………………………. 90
Normality, Skewness, and Kurtosis ………………………………………. 90
Descriptive Analysis of Measurement Scales ………………………………. 91
Results of Tourism Development Impacts ………………………………. 92
Results of Environmental Attitudes ………………………………………. 93
Results of Place Attachment ………………………………………………. 94
Results of Preferences about Tourism Attraction Development ………. 95
Results of Support for Destination Competitive Strategy ………………. 96
Reliability and Validity of Measurement Scales ………………………………. 101
Reliability of Measurement Scales ………………………………………. 101
Validity of Measurement Scales ………………………………………. 102
Measurement Model ………..……………………..………………………. 105
CFA for Tourism Development Impacts ………………………. 107
ix
CFA for Environmental Attitudes ………………………………………. 111
CFA for Place Attachment ………………………………………………. 113
CFA for Preferences about Tourism Attraction Development ………. 117
EFA and CFA for Support for Destination Competitive Strategy ………. 120
EFA for Support for Destination Competitive Strategy .……… 120
CFA for Support for Destination Competitive Strategy ………. 124
Testing The Hypothesized Model ………………………………………………. 125
Overall Measurement Model ………………………………………………. 126
CFA of Overall Measurement Model with the Calibration Sample . 129
CFA of Overall Measurement Model with the Validation Sample . 137
Convergent and Discriminant Validity ………………………………. 141
Structural Equation Modeling (SEM) ………………………………. 144
Initial Theoretical Structural Model ………………………………. 144
Revised Structural Model ………………………………………. 147
Analysis of Hypotheses Testing ………………………………………………. 151
CHAPTER V. CONCLUSION AND DISCUSSION
Introduction ………………………………………………………………. 156
Summary and Discussion of the Research Findings ………………………………. 157
General Findings and Discussion ………………………………………. 157
Findings and Discussion of Research Questions ………………………. 159
Implications of the Research Findings ………………………………………. 163
Limitations and Suggestions for the Future Research ………………………. 166
Concluding Comments ………………………………………………………. 168
REFERENCE ………………………………………………………………. 168
VITA ………………………………………………………………. 220
x
LISTS OF APPENDICES Appendix A Cover Letter ……………………….……………………… 183
Appendix B Survey Instrument ………………………………………………. 185
Appendix C Result of Non-Response Tests by Chi-Square ………………………. 193
Appendix D Normal Distribution of Respondents’ Demographic Characteristics . 194
Appendix E
Appendix E.1 Results of Skewness and Kurtosis for Tourism Development Impacts 195
Appendix E.2 Results of Skewness and Kurtosis for Environmental Attitudes . 196
Appendix E.3 Results of Skewness and Kurtosis for Environmental Attitudes . 197
Appendix E.4 Results of Skewness and Kurtosis for Preferences about
Tourism Attraction Development ……………………………….. 198
Appendix E.5 Results of Skewness and Kurtosis for Support for Destination
Competitive Strategy ……………………………………………….. 199
Appendix F
Appendix F.1 Result of Reliability for Tourism Development Impacts …..…… 200
Appendix F.2 Result of Reliability for Environmental Attitudes .………. 201
Appendix F.3.1 Result of Reliability for Place Attachment (with Item PA7) ... 202
Appendix F.3.2 Result of Reliability for Place Attachment (without Item PA7) .. 203
Appendix F.4 Result of Reliability for Tourism Attraction Development ……….. 204
Appendix F.5 Result of Reliability for Destination Competitive Strategy ……….. 205
Appendix G Output from EFA for Destination Competitive Strategy ……………. 206
xi
LIST OF TABLES Table 3.1 Measurement of tourism development impacts ………………………. 65
Table 3.2 Measurement of environmental attitudes ………………………. 68
Table 3.3 Measurement of place attachment ………………………………. 71
Table 3.4 Measurement of development preferences about destination attractions . 73
Table 3.5 Measurement of destination competitive strategies ………………. 76
Table 3.6 Criterion variables & measurement scales ………………………. 80
Table 4.1 Survey response rate ………………………………………………. 83
Table 4.2 Demographic characteristics of tourism stakeholders (Virginia) ………. 86
Table 4.3 Geographical distributions of respondents ………………………. 89
Table 4.4 Descriptive analysis of tourism development impact items ………. 92
Table 4.5 Descriptive analysis of environmental attitude items ………………. 94
Table 4.6 Descriptive analysis of place attachment items ………………………. 95
Table 4.7 Descriptive analysis of preferences about tourism attraction development items ………………………………………………. 97
Table 4.8 Descriptive analysis of destination competitive strategy items ………. 99
Table 4.9 Top 12 favorable destination competitive strategies ………………. 100
Table 4.10 Summary of the measurement reliability Cronbach’s alpha ………. 101
Table 4.11 The Results of concurrent validity ………………………………. 104
Table 4.12 The results of CFA for tourism development impacts ………………. 110
Table 4.13 The results of CFA for environmental attitudes ………………………. 112
Table 4.14 The results of CFA for place attachment ………………………. 115
Table 4.15 The results of CFA for preferences about tourism attraction development ………………………………………………………. 118
Table 4.16 The results of EFA for destination competitive strategy ………………. 122
Table 4.17 The results of CFA for preferences about tourism attraction development ………………………………………………………. 124
Table 4.18 Five Constructs and 21 observed indicators for the overall measurement model ………………………………………………………. 128
Table 4.19 Parameter estimates for five hypothesized measurement model (n = 322) ……………….…………..…….……………………. 131
xii
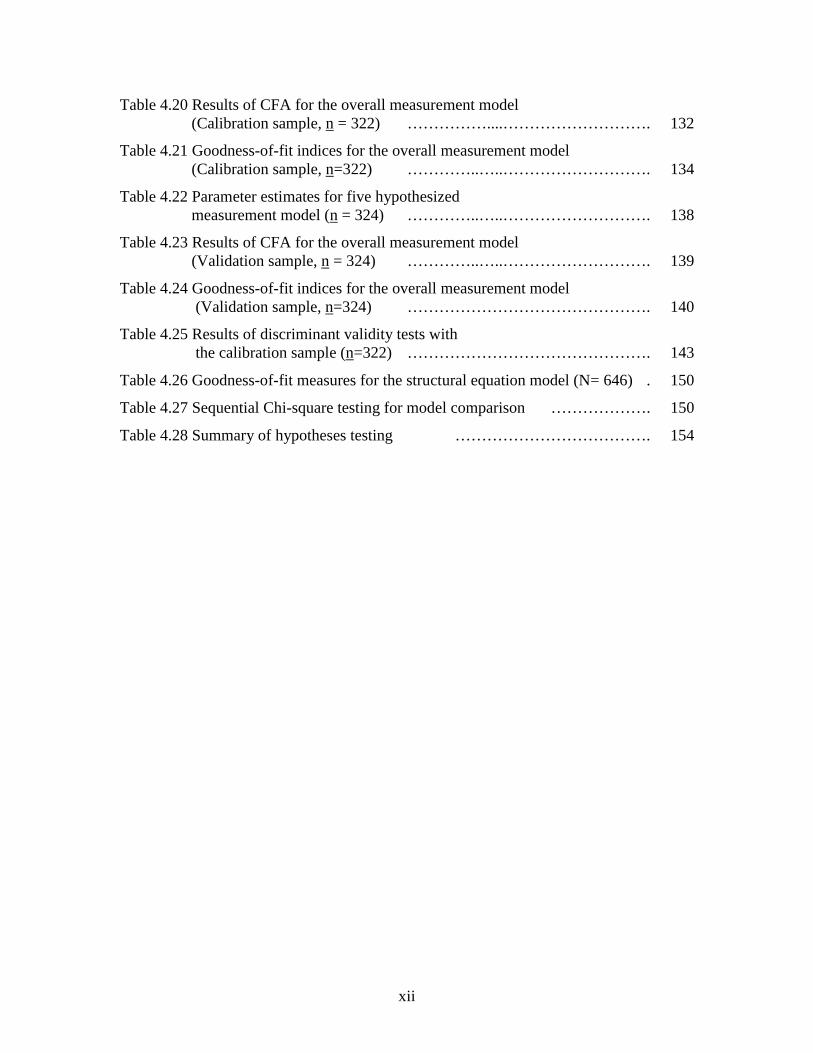
Table 4.20 Results of CFA for the overall measurement model (Calibration sample, n = 322) ……………....………………………. 132
Table 4.21 Goodness-of-fit indices for the overall measurement model (Calibration sample, n=322) …………..…..………………………. 134
Table 4.22 Parameter estimates for five hypothesized measurement model (n = 324) …………..…..………………………. 138
Table 4.23 Results of CFA for the overall measurement model (Validation sample, n = 324) …………..…..………………………. 139
Table 4.24 Goodness-of-fit indices for the overall measurement model (Validation sample, n=324) ………………………………………. 140
Table 4.25 Results of discriminant validity tests with the calibration sample (n=322) ………………………………………. 143
Table 4.26 Goodness-of-fit measures for the structural equation model (N= 646) . 150
Table 4.27 Sequential Chi-square testing for model comparison ………………. 150
Table 4.28 Summary of hypotheses testing ………………………………. 154
xiii
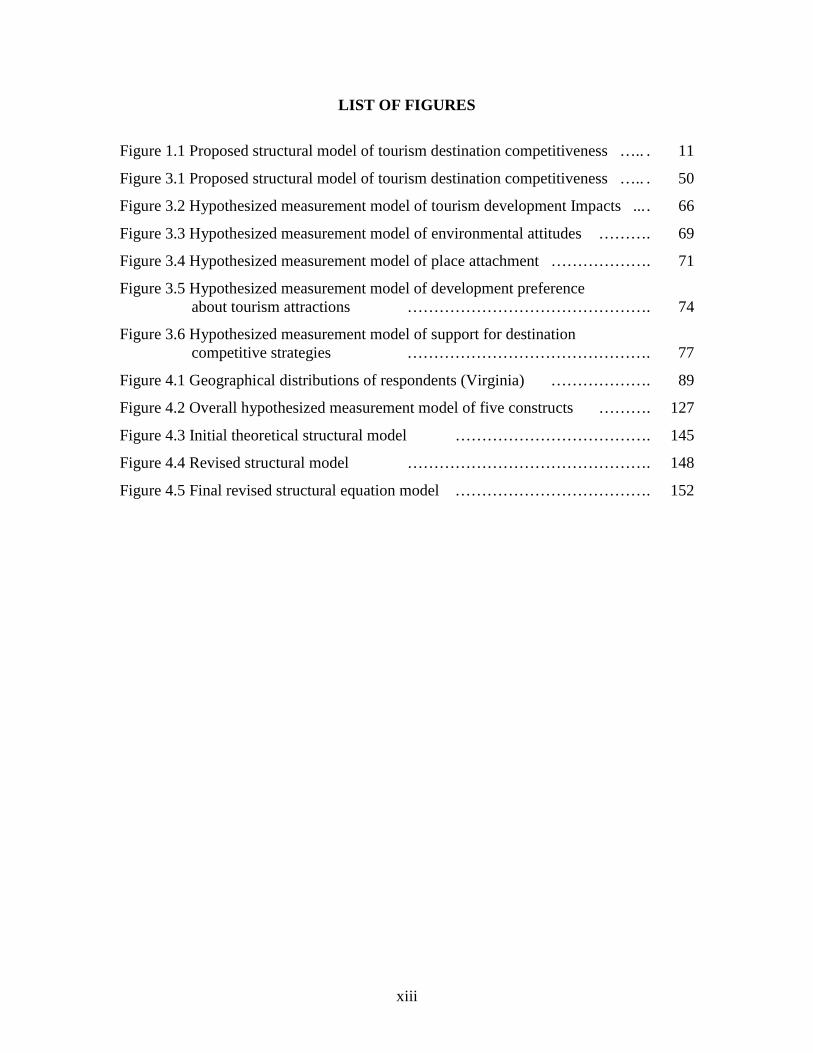
LIST OF FIGURES
Figure 1.1 Proposed structural model of tourism destination competitiveness ….. . 11
Figure 3.1 Proposed structural model of tourism destination competitiveness ….. . 50
Figure 3.2 Hypothesized measurement model of tourism development Impacts ... . 66
Figure 3.3 Hypothesized measurement model of environmental attitudes ………. 69
Figure 3.4 Hypothesized measurement model of place attachment ………………. 71
Figure 3.5 Hypothesized measurement model of development preference about tourism attractions ………………………………………. 74
Figure 3.6 Hypothesized measurement model of support for destination competitive strategies ………………………………………. 77
Figure 4.1 Geographical distributions of respondents (Virginia) ………………. 89
Figure 4.2 Overall hypothesized measurement model of five constructs ………. 127
Figure 4.3 Initial theoretical structural model ………………………………. 145
Figure 4.4 Revised structural model ………………………………………. 148
Figure 4.5 Final revised structural equation model ………………………………. 152

1
CHAPTER I
INTRODUCTION
INTRODUCTION
This study offers an integrated approach to understanding the competitiveness of
tourism destinations, and attempts to extend the theoretical and empirical evidence about
the structural relationships among the following constructs: 1) tourism development
impacts, 2) environmental attitudes, 3) place attachment, 4) development preferences
about destination attractions/resources, and 5) support for enhancement strategies for
destination competitiveness. This study was approached from the perspective of tourism
stakeholders about tourism destination competitiveness. Their perceptions, attitudes and
behaviors in terms of tourism were assessed as critical sources of testing the proposed
structural model in this study.
The scope of this study was tourism destinations and communities in Virginia,
where nature-cultural based and man-made tourism attractions and products are found.
The guiding principle of this study is that destination competitiveness can be improved
by the appropriate matches between tourism attractions/resources and the enhancement
strategies of destination competitiveness supported by tourism stakeholders.
The basic premise of the study is that the support of tourism stakeholders is
essential for the development, successful operation, and long-term sustainability of
tourism. If tourism stakeholders receive benefits from tourism impacts, express positive
environmental attitudes, and perceive a high attachment to their community, they will
prefer tourism development and will support destination competitive strategies. The
support of destination attraction development and destination competitive strategies by
tourism stakeholders can enhance the possibility of successful tourism in a region and
could help to improve destination competitiveness. As a result, tourism destination
communities will receive social and economic benefits from enhanced tourism
destination competitiveness. Tourists and visitors will also receive more benefits from
travel experiences if the tourism destination and attractions are appropriately developed
and promoted.
2
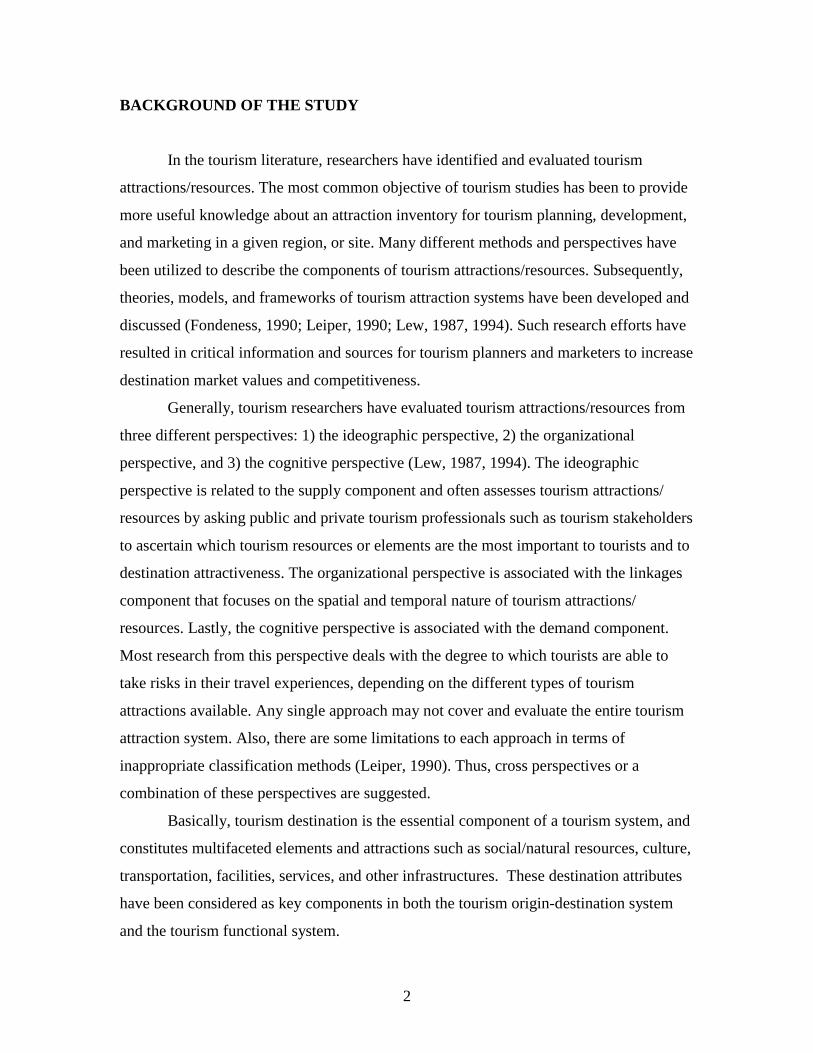
BACKGROUND OF THE STUDY
In the tourism literature, researchers have identified and evaluated tourism
attractions/resources. The most common objective of tourism studies has been to provide
more useful knowledge about an attraction inventory for tourism planning, development,
and marketing in a given region, or site. Many different methods and perspectives have
been utilized to describe the components of tourism attractions/resources. Subsequently,
theories, models, and frameworks of tourism attraction systems have been developed and
discussed (Fondeness, 1990; Leiper, 1990; Lew, 1987, 1994). Such research efforts have
resulted in critical information and sources for tourism planners and marketers to increase
destination market values and competitiveness.
Generally, tourism researchers have evaluated tourism attractions/resources from
three different perspectives: 1) the ideographic perspective, 2) the organizational
perspective, and 3) the cognitive perspective (Lew, 1987, 1994). The ideographic
perspective is related to the supply component and often assesses tourism attractions/
resources by asking public and private tourism professionals such as tourism stakeholders
to ascertain which tourism resources or elements are the most important to tourists and to
destination attractiveness. The organizational perspective is associated with the linkages
component that focuses on the spatial and temporal nature of tourism attractions/
resources. Lastly, the cognitive perspective is associated with the demand component.
Most research from this perspective deals with the degree to which tourists are able to
take risks in their travel experiences, depending on the different types of tourism
attractions available. Any single approach may not cover and evaluate the entire tourism
attraction system. Also, there are some limitations to each approach in terms of
inappropriate classification methods (Leiper, 1990). Thus, cross perspectives or a
combination of these perspectives are suggested.
Basically, tourism destination is the essential component of a tourism system, and
constitutes multifaceted elements and attractions such as social/natural resources, culture,
transportation, facilities, services, and other infrastructures. These destination attributes
have been considered as key components in both the tourism origin-destination system
and the tourism functional system.
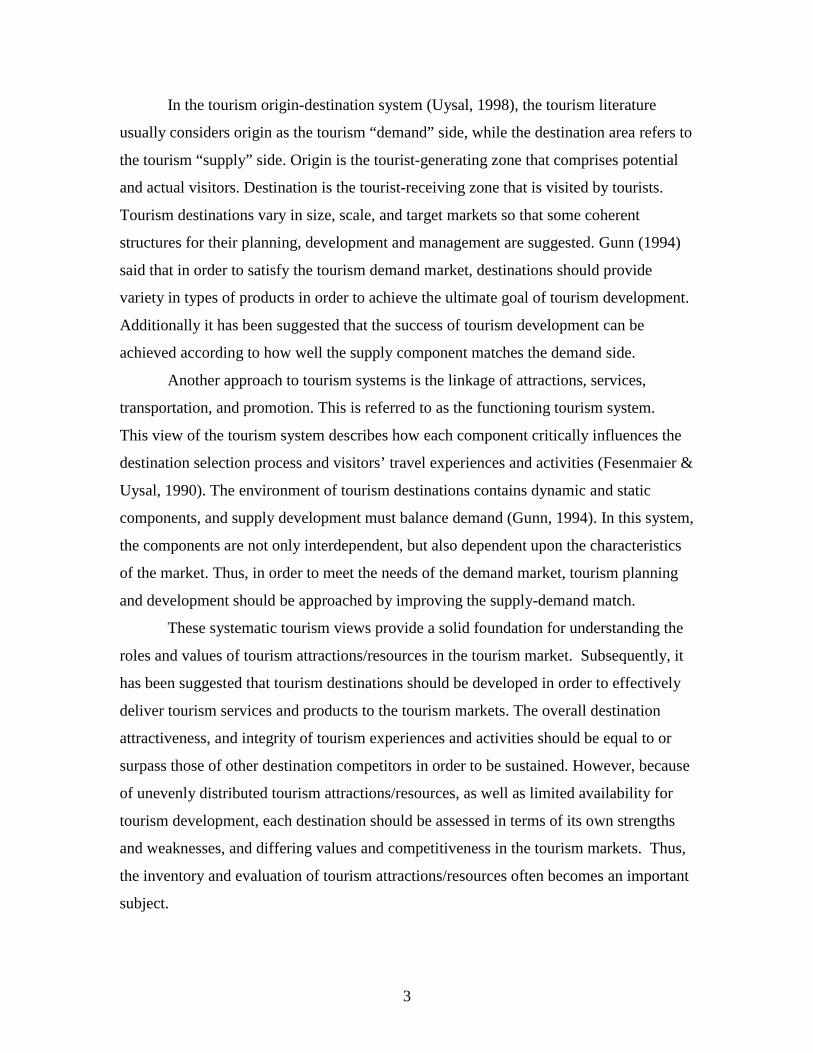
3
In the tourism origin-destination system (Uysal, 1998), the tourism literature
usually considers origin as the tourism “demand” side, while the destination area refers to
the tourism “supply” side. Origin is the tourist-generating zone that comprises potential
and actual visitors. Destination is the tourist-receiving zone that is visited by tourists.
Tourism destinations vary in size, scale, and target markets so that some coherent
structures for their planning, development and management are suggested. Gunn (1994)
said that in order to satisfy the tourism demand market, destinations should provide
variety in types of products in order to achieve the ultimate goal of tourism development.
Additionally it has been suggested that the success of tourism development can be
achieved according to how well the supply component matches the demand side.
Another approach to tourism systems is the linkage of attractions, services,
transportation, and promotion. This is referred to as the functioning tourism system.
This view of the tourism system describes how each component critically influences the
destination selection process and visitors’ travel experiences and activities (Fesenmaier &
Uysal, 1990). The environment of tourism destinations contains dynamic and static
components, and supply development must balance demand (Gunn, 1994). In this system,
the components are not only interdependent, but also dependent upon the characteristics
of the market. Thus, in order to meet the needs of the demand market, tourism planning
and development should be approached by improving the supply-demand match.
These systematic tourism views provide a solid foundation for understanding the
roles and values of tourism attractions/resources in the tourism market. Subsequently, it
has been suggested that tourism destinations should be developed in order to effectively
deliver tourism services and products to the tourism markets. The overall destination
attractiveness, and integrity of tourism experiences and activities should be equal to or
surpass those of other destination competitors in order to be sustained. However, because
of unevenly distributed tourism attractions/resources, as well as limited availability for
tourism development, each destination should be assessed in terms of its own strengths
and weaknesses, and differing values and competitiveness in the tourism markets. Thus,
the inventory and evaluation of tourism attractions/resources often becomes an important
subject.
4
Tourism attractions/resources have been assessed to evaluate their contributions
to destination attractiveness (Ferrario, 1979; Formica, 2000; Gearing, Sward, & Var,
1979; Hu & Ritchie, 1993; Kozak & Rimmington, 1998; Leiper, 1990; Var, Beck, &
Loftus, 1977; Witt & Moutino, 1994; Mitchell, 1979). Often, these analyses have been
done from the tourism demand perspectives. It is believed that the attributes and elements
of tourism destinations are the basic criteria of tourist preferences and are the major
motivators or determinants of travel decision choices (Driscoll, Lawson, & Niven, 1994;
Fodness, 1990; Murphy, Pritchard, & Smith, 2000; Ross, 1994).
Additionally, attractions/resources have been considered as major determinants or
factors in tourism destination competitiveness (Ritchie & Crouch, 1993, 2000; Mihalič
2000). An understanding of the key determinants of market competitiveness is critical to
sustain destination market growth and vitality (Hassan, 2000). The most common
examples of destination attractions/resources are natural/cultural components,
heritage/historical resources, supporting facilities/services, infrastructure, sports/
recreation activities, transportation/accessibility, and cost. It has been suggested that
knowledge of these components of destination attractions/resources is not only basic to
understanding tourism planning, but also is essential for successful tourism development
(Gunn, 1994; Pearce, 1997). Furthermore, maintaining the quality of tourism resources is
important to the competitiveness of most types of tourism destinations (Inkeep, 1991; Go
& Govers, 2000).
An abundance of natural resources, or other attractions possessed by a destination
could give competitive advantage to the destination. The ability of a given region or
country to deploy its resources so as to add value to those resources, is also a comparative
advantage (Crouch & Ritchie, 1999; Go & Govers, 2000; Hassan, 2000; Ritchie &
Crouch, 2001). It should be noted that competitive advantages relate to a destination’s
ability to use tourism resources effectively over the long term, while comparative
advantages constitute the tourism resources available to a destination (Crouch & Ritchie,
1999, p. 143). Specifically, the advantages of tourism destinations are qualifying
determinants of visitation, as well as the fundamental reasons why potential tourists
choose one destination over another.
5
Thus, creating and integrating value-added products to sustain tourism resources
is necessary to maintain or enhance destination competitiveness, given the multiplicity of
tourism destination planning and development efforts. Accordingly, efficient and
effective delivery strategies are required to sustain and enhance destinations’ market
value over time and over other competitors (Hassan, 2000). Depending upon what and
how tourism attractions develop value for tourists, and also how well destination
marketing and promotional programs are managed, tourism destinations will take on a
successful position in the tourism market. And further, successful tourism will provide
destination communities with more social and economic welfare.
STATEMENT OF THE PROBLEM
In recent tourism literature, researchers have introduced concepts and relevant
models about tourism destination competitiveness (Crouch & Ritchie, 1999; Evan &
Johnson, 1995; Hassan, 2000; Kozak, 2001; Ritchie & Crouch, 1993; Thomas & Long,
2000). Most of these studies have focused on how effectively and efficiently destination
competitiveness can be improved to respond to escalating market competition. It has been
also discussed that creating or integrating value-added destination products and services
is a basic step in enhancing tourism attractiveness. Accordingly, understanding the
driving forces of success as well as developing suitable competitive strategies is of
fundamental importance to improve regional or national destination competitiveness.
Particularly, Heath, and Wall (1992) noted that the distinctive quality or
conditions of tourism attractions and resources in a given region provide an
understanding of the strengths and weaknesses of regional tourism resources.
Subsequently, evaluation or identification of a distinctive competence in a specific region
provides a clear foundation and direction for the tourism planning process.
In the tourism-planning context, tourism attractions and resources have been
considered as a function of successful supply factors in achieving destination or
organizations’ objectives. Additionally, tourism attractions such as competitive forces or
resources have been evaluated and categorized in various ways so that supply
6
components can effectively match the diverse tourism market demands (Gunn, 1988;
Inkeeps, 1991; Lew, 1987).
The most common evaluation method of tourism attractiveness is from visitors’ or
tourists’ perspectives. It has been argued that this approach is somewhat limited due to
the short period of visiting time, and a limited knowledge of or familiarity with
attractions existing in a given region (Formica, 2000; Milman & Pizam, 1995). Thus, Liu
(1988) and Formica (2000) suggested that rather than using visitors’ perspectives, the use
of tourism experts such as tourism stakeholders have potential benefits and advantages.
Their solid knowledge and experiences of the entire portfolio of existing tourism
resources and attractions is useful in evaluating destination attractiveness and competitive
resources. The professional planning involvement and experiences, long-term community
observations, and interactions with tourists are also reliable sources of assessing tourism
attractiveness and resources. Particularly, tourism stakeholders’ evaluations can help to
discover community tourism products more appropriately. Thus, the amalgam of tourism
attractions and resources that a community wishes to present to the tourism market can be
identified (Getz, 1987).
However, even though studies on destination communities’ perceptions, attitudes,
and behavior in tourism planning and involvement have been conducted from various
perspectives, the dynamic and complex natures of the factors of destination communities,
especially, tourism stakeholders’ opinions about tourism development preferences and
competitive strategies have not been clearly addressed yet.
Furthermore, although a number of studies have addressed concepts and relevant
models concerning destination competitiveness, no empirical study has developed an
integrative model capable of investigating the destination competitiveness of an area by
examining the structural relationships among tourism stakeholders’ beliefs and attitudes
toward tourism, their development preferences for tourism attractions/resources, and their
support of enhancement strategies for destination competitiveness.
In general, most of the existing tourism studies have been conducted by asking
local indigenous residents about their favorable or unfavorable attitudes toward tourism
planning and development (Doxey, 1975; Dogan, 1989; Perdue, Long, & Allen, 1990;
Yoon, 1998). It can be argued that there are various levels of tourism support within a
7
community. Particularly, tourism stakeholders’ opinions and attitudes about the
influencing factors of the tourism planning decision-making process, including the
perceived tourism development impacts, environmental attitudes, and place attachment,
have not been thoroughly explored, and have become a challenging research issue.
Thus, in successful tourism development and management, it is necessary to
understand tourism stakeholders’ opinions and attitudes toward tourism. Particularly, in a
highly competitive tourism destination market, tourism stakeholders’ preferences and
support for tourism development of destination attractions/resources and enhancement
strategies of destination competitiveness should be understood so that the appropriate
match or combination of tourism attraction/resources and development strategies can be
obtained.
Consequently, given the fact that there is limited empirical research on destination
competitiveness, this study developed and empirically tested a destination
competitiveness model and its relevant components from the perspectives of tourism
stakeholders, so that the information from this study will help tourism planners and
policy-makers to build more competitive tourism destinations.
RESEARCH QUESTIONS
If tourism is to contribute to economic, social, and environmental development
that is sustainable, tourism attractiveness and resources must be nationally or
internationally competitive. Also, if any given tourism destination is more competitive
than other destinations, a better quality of tourism products should be produced and
distributed to the various or given target markets. Accordingly, more benefits and
advantages in terms of travel experiences should be provided to tourists and visitors.
Tourism providers and developers should also receive economic and social benefits from
enhanced tourism destination competitiveness.
This study explores the interplay of specific factors that affect tourism
stakeholders’ development preferences in tourism attractions/resources, as well as their
support of enhancement strategies for destination competitiveness. Particularly, the
following research questions will be addressed in this study.
8
Research Question 1:
Are tourism stakeholders’ development preferences about tourism
attractions/resources affected by:
1) Perceived tourism impacts
2) Environmental attitudes, and/or
3) Perceived place attachment
Research Question 2:
Is there a relationship between tourism stakeholders’ development preferences
about tourism attractions/resources and their support of enhancement strategies for
destination competitiveness?
RESEARCH HYPOTHESES
Based on the research questions, four hypotheses were proposed and a structural
model was tested to determine how tourism stakeholders’ development preferences about
tourism attractions/resources affect their support for destination competitive strategies,
and also how these tourism stakeholders’ development preferences are affected by three
constructs, including perceived tourism impacts, attitude toward environmental concerns,
and perceived place attachment. Thus, the four hypotheses follow:
H1: There is a positive relationship between tourism stakeholders’ perceptions of the
benefits of tourism impacts and preferences about tourism attractions/resources
development.
H2: There is a positive relationship between tourism stakeholders’ environmental
attitudes and preferences about tourism attractions/resources development.
H3: There is a positive relationship between tourism stakeholders’ place attachment and
preferences about tourism attractions/resources development.
H4: There is a positive relationship between tourism stakeholders’ preferences about
tourism attractions/resources development and support for the enhancement
strategies of destination competitiveness.
9
OBJECTIVES OF THE STUDY
The objectives of this study were to develop a theoretical structural model of
tourism destination competitiveness and to empirically test the interplay of relationships
among the following constructs: 1) perceived tourism impacts, 2) attitudes toward
environmental concerns, 3) place attachment, 4) development preferences about
destination attractions/resources, and 5) support of enhancement strategies for destination
competitiveness. From the tourism stakeholders’ perspectives, the study was conducted to
address this objective of the study.
THEORETICAL BACKGROUND
Until now, many tourism researchers have utilized social exchange theory to
explain why and how people react to and support tourism development. (Ap, 1992;
Jurowski, Uysal, & Williams, 1997; Lindberg & Johnson, 1997; Perdue, Long, & Allen,
1990; Yoon, 1999; Yoon, Gursory, & Chen, 2000). Additionally, the empirical findings
from these studies have demonstrated that people will act to maximize the benefits and
minimize the costs in given situations and environments and also, people who perceive
the benefits from tourism to be greater than the costs will be willing to participate in the
exchange, and support tourism development.
Subsequently, the logic and propositions of social exchange theory are generally
acceptable as a theoretical framework for research on people’s reactions to tourism and
its development. Particularly, according to Jurowski et al. (1997), people will become
involved in exchanges if: 1) the resulting rewards are valued, 2) the continued exchange
is likely to produce valued rewards, and 3) perceived costs do not exceed the perceived
rewards (Skidmore, 1975). Thus, the basic principles and assumptions of social exchange
theory will be applied as the conceptual background in this study.
Social exchange theory has its origin in several disciplines, including
anthropology (Levi-Strauss, 1969), economics (Blau, 1968, 1991; Ekeh, 1974),
behavioral psychology (Homans, 1991), and social psychology (Chadwick-Jones, 1976).

10
Accordingly, this theory often has been adapted from one or mixed areas of utilitarian
economics, functional anthropology, and behavioral psychology (Turner, 1974, 1986).
In the utilitarian economics of social exchange theory, people are described as
“rational, and seeking to maximize their material benefits, or utility, from transactions or
exchanges with others in a free and competitive market” (Turner, 1998, p. 249). People
will choose a maximum payoff or benefits (less costs) after reviewing all the available
alternatives and necessary information in a given unit or market. Additionally, people
pursue an exchange of nonmaterial resources such as sentiments, services, and symbols.
From the anthropology perspective, it is recognized that social interaction is
achieved through not only an economic or material exchange, but also a symbolic
exchange in social relationships. Thus, the social dynamics of culture are reflected in this
view of the theory (Turner, 1998). The general assumption of this theory is that people
are rationally seeking to maximize benefits and minimize the costs of social relationships,
and they will choose the most profitable option among alternative actions.
In the psychological behaviorism perspective, exchange theory is based on the
principle that people are reward-seeking organisms pursuing alternatives that will yield
the highest reward and the least punishment (Chadwick-Jones, 1976). Psychological
reward and punishment are reconciled with economic benefits and costs (Ekeh, 1974).
Specifically, psychological rewards (benefits) are defined as exchanged resources that are
pleasurable and gratifying, and punishment in terms of costs has been considered as
negative feelings of deprivation, or forgone opportunities. Accordingly, two social
rewards result from the exchange process, including intrinsic attraction and expression of
social approval or agreement, which are fundamental elements of this theory.
Consequently, among the above three perspectives of exchange theory, the utilitarian
heritage in economic theory as well as psychological behaviorism typically emerge.
Then, this theory becomes a modern exchange theory (Turner, 1998).
The implications of social exchange theory provides guiding assumptions for this
study, in that it is assumed that people (tourism stakeholders) may receive more benefits
(rewards) than costs from tourism. An examination of the interplay of factors given in
this study should yield that tourism stakeholders are likely to participate in an exchange
with tourism and its development if they believe that they are likely to gain benefits

11
without incurring unacceptable costs, and subsequently, such inclinations endorse the
support of tourism development. Thus, they will pursue actions to maximize their assets
(tourism attractions/resources) as well as rationally choose a course of action to obtain
their goals.
STRUCTURAL MODEL OF THE STUDY
This study attempted to develop and empirically test a theoretical model of
tourism destination competitiveness. Drawn from empirical studies and research as well
as concepts and theories, a conceptual structural model is proposed, as shown in Figure
1.1. The structural model in this study describes a logical flow among the constructs by
indicating the directions of the causes and effects of the interplay of factors relating to the
development preferences about tourism attractions/resources and support of destination
competitive strategies.
Figure 1.1 Proposed Structural Model of Tourism Destination Competitiveness
Support for Destination Competitive Strategies
Environmental
Attitudes
Place
Attachment
Tourism Development
Impacts
Development Preferences
About Tourism Attractions
12
The factors or constructs in this structural model include: 1) tourism development
impacts, 2) environmental attitudes, and 3) place attachment. Particularly, the support of
destination competitive strategy is affected both directly and indirectly by the interplay of
these three factors. Additionally, the indirect effect of these factors on destination
competitive strategies will be contingent upon the nature of respondents’ development
preferences about tourism attractions/resources.
As a result, the total effects of preferences about destination competitive strategy
can be the result of both direct and indirect effects. Thus, the structural relationships
among the proposed constructs were investigated as a major focus of this study.
CONTRIBUTIONS OF THE STUDY
The potential contributions of this study can be discussed from both theoretical
and practical standpoints.
Basically, the study contributed to a theoretical enhancement of the current level
of knowledge in the existing literature on tourism destination competitiveness. This was
achieved by empirically testing the structural relationships among tourism stakeholders’
perceptions of the selected factors, preferences about tourism attractions, and destination
competitive strategies.
One expected advantage of an improved understanding of these structural
relationships is that the reactions of tourism stakeholders to tourism development could
be demonstrated. Especially, since little research has focused on tourism destination
competitiveness from the viewpoint of tourism stakeholders, this study could provide
new insights about how tourism destination competitiveness could be improved by
examining the affecting factors such as tourism development impacts, environmental
attitudes, and place attachment.
In terms of its practical contribution, the findings of the study could aid in the
planning and development of destination competitiveness strategies. Since it has been
emphasized that tourism stakeholders’ support and participation are among the most
important factors in the tourism business, this study could provide information about
13
tourism stakeholders’ perceptions and attitudes about tourism development and
destination competitive strategies. Their professional involvement, knowledge, and
practical experiences regarding tourism attraction planning and development must be
reliable sources of developing tourism planning programs and strategies in order to
enhance destination competitiveness.
Finally, this systematic examination of structural relationships among the
constructs could facilitate a clearer understanding of the nature of tourism stakeholders’
reactions to tourism, so that the results could help tourism planners and policy-makers to
develop more appropriate destination products as well as to enhance competitiveness in
tourism markets.
ORGANIZATION OF THE STUDY
This chapter introduces the background of the study, and the research problems
and questions upon which the study is based. The research objectives are defined and
relevant concepts and studies of destination competitiveness are delineated. A
description of the structural model to be tested in this study is presented. Contributions of
the study are discussed. Operational terminologies and concepts for this study are
defined.
Chapter II reviews the literature relevant to tourism destination competitiveness,
and each of the proposed constructs. The theoretical background and previous conceptual
and empirical research findings are discussed. Chapter III presents the research
framework, the research hypotheses to be tested, a detailed discussion of the research
design, the development of the survey instrument, sampling, and procedures of data
analysis. Chapter IV reports the results of the empirical analyses of the proposed
theoretical model that was tested for the hypotheses. Chapter V discusses the findings of
the study; the implications and conclusions of the research are delineated, and future
research suggestions and directions based on this study are presented.
14
FUNCTIONAL DEFINITIONS OF TERMS
Competitiveness: It refers to combining both assets and processes where assets
are inherited (e.g. natural resources) or created (e.g. infrastructures) and processes
transform assets into economic results (Crouch & Ritchie, 1999).
Environmental Attitude: The degree to which people hold beliefs and attitudes
about the relationship between humans and the environment.
Place Attachment: The extent to which individuals value a given place; the
strength of association between individuals and their residential environments, and the
individual’s emotional/symbolic as well as functional feelings about and relationships
with a given place (McAndrew, 1998; Williams & Roggenbuck, 1989; Warzecha &
Lime, 2001).
Tourism Attractions: The various types of tourism products and services that
tourism destinations provide to tourists.
Tourism Destination Competitiveness: The destination’s ability to create and
integrate value-added products that sustain its resources while maintaining market
position relative to competitors (Hassan, 2000).
Tourism Development Impacts: Results from a complex process of interchanges
between tourists, host communities, and destinations (Methieson & Wall, 1982).
Tourism Stakeholders: Persons or groups who can affect or be affected by the
tourism business within a particular market or community and who have interests in the
planning, process(es), delivery, and/or outcomes of the tourism business. The common
examples of tourism stakeholders are as follows: chambers of commerce, tourism
authorities, local tourism agencies, non-government organizations, tourism related
associations and councils, convention and visitors bureau, tourism planning and
development companies, tourism related faculty and professionals, local and state parks,
and visiting and information centers.
15
CHAPTER II
LITERATURE REVIEW
INTRODUCTION
This chapter reviews the literature relevant to the study of tourism destination
competitiveness. First, a review of relevant concepts, including tourism systems, tourism
planning and development, and tourism destination competitiveness are provided, while
discussing the need for this research. The discussion of these concepts serves as the
research background for the research questions and the study’s objective. Then, the next
section provides a review of the theory to be employed in this study -- social exchange
theory. A discussion of the linkage between the theoretical background and the
components of the proposed model in the study is presented. Subsequently, the relevant
fields’ research that pertains to the conceptual model will be discussed. Particularly, this
section is devoted to the development of a theoretical and conceptual model for tourism
destination competitiveness, and addresses the basis for the relationships among the
constructs to be tested in the study.
REVIEW OF RELEVANT CONCEPTS
Tourism and its Systematic Approach
In the tourism literature, a number of systematic approaches have been proposed
to understand tourism components, and their functioning or interactive roles (Gunn, 1988,
1994; Lea, 1988; Leiper, 1979, 1990; McIntosh & Goeldner, 1986; Pearce, 1995; Mill &
Morrison, 1995; Witt & Moutinho, 1994). Generally, the approaches of the origin-
destination tourism system and the functioning tourism system have been applied in
explaining tourism as a system. These can be considered to be a fundamental framework
for understanding tourism. Furthermore, starting from a geographical analysis of tourist
movement and flows, as well as the interactions of components (Leiper, 1979), the
applications of tourism systems have been widely utilized in several fields, including
16
tourism marketing (Formica, 2000; Zaher, 1999), planning and development (Carlsen,
1999; Gunn, 1994), and economics (Uysal, 1998). One of the goals of the systematic
approach used in tourism studies is to develop the best match or combination of supply
and demand components for successful tourism destination development.
In the origin-destination tourism system, tourism consists of two types of region
or components: an origin, which is related to the region or country generating the tourists,
and a destination, which is related to locations visited by tourists, including all those
programs and places that are designed and managed to provide for receiving visitors
(Gunn, 1988, 1994; Witt & Montinho, 1994). Usually, the origin refers to the source of
tourism demand, while the destination represents the tourism supply side that contributes
certain attraction powers to tourists (Uysal, 1998). Most of the marketing functions in
tourism are conducted in the tourists’ generating region, and tourism planning and
development are performed in the destination region.
Pearce (1995) demonstrated the nature of the interaction between the demand and
supply components by proposing three different models of tourism: 1) origin-destination,
2) structural, and 3) the evolution model. Spatial interactions and reciprocity are
important features that support all these models; the notion of spatial hierarchy is also
central to these models. The origin-destination model, for example, assumes that “places
are in varying degrees both origin and destination” (p. 5). The places that generate
tourists could also serve as the destinations. In a structural model, however, the tourist
markets are centered through a local, regional, and national hierarchy, with the
international transfer occurring between the national urban centers in the generating and
receiving countries. The interaction of supply and demand in this structural model is
based on the economic superiority and technological development of the generating
areas. Lastly, the evolution model explains tourists’ movements by focusing on the
perspective of the evolution of tourists’ movements and the development of tourist
structures. The interaction of the demand markets and supply components will change
over time, depending upon tourists’ characteristics and behavior.
Additionally, Formica (2000), who studied assessing destination attractiveness as
a function of demand and supply interaction, proposed that a tourism system emerges
from the tourism resources at destinations. The various combinations and blends of

17
tourism resources that include physical distribution, importance, and value, are important
in determining a destination’s attractiveness power and uniqueness. He also argued that
the components on the supply side should collaborate with marketing travel links such as
travel agencies and tour operators to meet the needs and wants of the demand markets.
On the other hand, Leiper (1979) considered “paths linking generating regions
with the tourist destination region, along with tourists’ travel” as “transit routes” (p.391).
The efficiency and characteristics that influence the quality of access to particular
destinations were emphasized, and accordingly, the influence of the size and direction of
tourist flows were described.
Gunn, (1988) using the functioning tourism system, presents linkages between or
among components, including population (the demand side), information/promotion,
transportation, attractions, and facilities/services (the supply side). Additionally, Gunn
further specifies the influencing factors on the tourism system, such as natural resources,
cultural resources, entrepreneurship, finance, labor, competition, community, government
policies and organization/leadership. Mill and Morrison (1985, 1995) also identify four
major parts of the tourism system, including the market (tourists), travel (transportation),
destination (attractions, facilities, and services), and marketing (information and
promotion), with each component closely connected in sequence with the other.
This functional approach to the tourism system has focused on studying the nature
of tourist systems and travel flows. Particularly, in Gunn’s approach (1988), the
components of information/promotion and transportation could be seen as “linkages” that
enable potential tourists to access their destinations. These linkages also enable tourism
destination businesses to promote tourism products as well as to develop marketing
strategies such as pricing and image that can affect directly the decisions of potential
tourists (Uysal, 1998). The linkages of this system represent the symbolic meaning of the
connection between the needs of tourists and the ability of the destination to fulfill these
needs. Tourist flows and the linkages among the components conceptually explain the
match between the supply side and the demand market. An appropriate match is essential
in developing successful tourism (Gunn, 1994).
In the model, which was called “the elements of demand-supply interactions,”
proposed by Fesenmaier and Uysal (1990, p. 31), the linkages and interactions between
18
the demand and supply sides were also centered in understanding the tourism system.
Along with the disequilibrium concept as the primary motivation for travel, tourists’
expectations about destinations are formed on the basis of advertising and promotional
programs that can influence demand for tourism destinations. Additionally, the quality of
tourists’ experiences is directly affected by the quality of service and facilities provided
by the supply side. The level of tourist satisfaction that tourists express based on their
destination experiences and activities is also dependent upon the ability of the destination
to deliver the type of experiences and activities to the demand markets (Ryan, 1995).
In sum, a systematic approach to tourism research provides a broad insight into
tourism and its phenomena. A better understanding of the interactions and linkages
among tourism demand and tourism supply is essential if tourism destinations and
businesses want to develop competitive products and effectively deliver them to the
tourism market. Furthermore, since this systematic approach has emphasized that
tourism exists according to the availability of tourism attractions/resources, their effective
operations and management, including marketing programs, promotion, and product
development, are of vital importance in the more fiercely competitive market
environments. In the proposed study, based on the systematic approaches to tourism, it is
acknowledged that the interactions and linkages among the components of tourism are
essential for tourism destinations to create and enhance competitiveness.
Tourism Planning and Development
In the tourism planning and development context, tourism is defined as an
interdisciplinary, multi-faceted phenomenon that involves the interrelated components of
tourism products, activities, and services provided by the public and private sectors
(Gunn, 1994; Pearce, 1989, 1995). These tourism components are considered as
fundamental factors in tourism planning and development, and a basic knowledge of
these components is required for successful tourism planning and management (Inkeep,
1991). Consequently, a discussion of comprehensive tourism planning is needed to
provide a basic structure and guidelines for developing more competitive tourism
products and services.

19
Tourism Planning and its Concepts
Planning, in general, is the process of decision-making that relates to the future of
destination regions, attractions, and services (Gunn, 1988; Inkeep, 1991; Mill &
Morrison, 1985). It is a dynamic and vital process of identifying objectives as well as
defining alternative methods and actions to achieve the objectives that are already in
place. Additionally, it includes an evaluation of selected methods and actions (Hudman &
Hawkin, 1989).
Similarly, tourism planning is a process of comprehensive evaluation and analysis
of related issues, including not only the determination of goals, but also the development
of alternative methods and actions to further decision-making. Particularly, Gunn (1988,
p. 22) said that “tourism planning as a concept of viewing the future and dealing with
anticipated consequences is the only way that tourism’s advantages can be obtained.
Tourism planning must be strategic and integrative.” Murphy (1985) also pointed out that
tourism planning should fit within existing systems and should be used in urban and
regional development strategies. In particular, there should be community involvement in
the planning process. Additionally, Mathieson and Wall (1982) suggest that tourism
planning is related to not only the components of tourism, but also the interrelationships
among these components. Planning is a complex process involving a consideration of
diverse economic, social, and environmental structures.
Thus, due to the sophisticated and varied nature of tourism planning and its
processes, it is required of tourism planning to incorporate numerous concepts and
disciplines drawn from different fields. It also needs to conduct a variety of planning
activities such as feasibility studies, product development, promotion, forecasting,
marketing planning, and strategic marketing programs.
In order to have comprehensive tourism planning, all of the existing components
and resources that include tourism attractions, destination management organizations
(DMO), markets, and local related businesses and services within a given region or
destination, should be considered. Since the goals and objectives that tourism addresses
through development depend upon how important and sensitive tourism development is
to the community, such goals should correspond with community or regional planning in
a given destination.
20
Goals of Tourism Planning
In general, the goals of tourism planning and development are based on the fact
that tourism increases economic benefits, improves community infra/superstructure
systems, and enhances the community’s quality of life (Mathieson & Wall, 1982). Getz
(1987) also stated that “tourism planning is a process, based on research and evaluation,
which seeks to optimize the potential contribution of tourism to human welfare and
environmental quality” (Wilkinson, 1997, p. 24). Additionally, the objective of tourism
planning is focused on providing better quality and services of tourism products and
activities for tourists so that it increases the average of length of stay. Thus, through the
development of tourism, the destinations or regions can achieve enhancements in
economic activities, community prosperity, and cultural identity. It is also possible for the
destination to provide a better quality of tourism experiences and activities to tourists so
that the tourism region and community take advantageous positions over competitors.
Consequently, tourism planning in the proposed study can be thought of as a way
of achieving goals, as well as a proactive means of creating competitive and comparative
advantage to destinations by adding value to tourism attractions/resources through
tourism development. Thus, tourism planning and development can contribute to the
competitiveness of tourism destinations.
Components of Tourism Planning
The identification and evaluation of tourism attractions/resources is a foremost
requirement in tourism planning (Gunn, 1994; Inkeep, 1991; Pearce, 1995). Furthermore,
understanding the interrelationships and interactions of the different elements and
components of the tourism supply side is an inevitable step in creating more valuable
destination products (Pearce, 1997). Thus, a thorough consideration and inventory of
knowledge of how the components of tourism planning are integrated is essential to
enhancing tourism destination competitiveness.
According to Inkeep (1991), the components of tourism planning and
development can be classified as tourist attractions and activities, accommodations, other
tourist facilities and services, transportation facilities and services, other infrastructures,
and institutional elements. These components can also be described as “the framework of
21
explaining the total natural and socio-environment from which they derive, the markets
of international and domestic tourists that they serve, and the area residents’ use of the
attractions, facilities and infrastructures” (p. 40).
Additionally, Pearce (1995) emphasized that an analysis and evaluation of two
major components, including destinations’ resources (attractions, accommodations,
transportation, infrastructures, etc), and the existing and potential markets (visitor
statistics, tourist satisfaction, resources mapping and evaluation) are common procedures
in tourism planning. Correlating these components can be referred to as the matching of
tourism supply and demand, and establishes the basic approach to tourism planning. This
matching of tourism supply and demand elements attempts to meet specified goals such
as increasing foreign exchange earnings, generating employment, and minimizing
environmental impacts.
Mill (1990) also explained that tourism planning tends to have certain
components, even though the processes and outcomes of tourism planning vary. Those
components are definitions of needs, assessment of potential, community support, the
legal environment, scheduling, measurement, experiences, and flexibility. Particularly,
Mill stressed that the community’s potential to attract, keep and satisfy tourists should be
identified and assessed. Such an assessment should begin with a determination of the
extent of existing tourism, while including an identification of the areas’ tourism
resources and their quality. Such resources could include man-made resources, natural
resources, infrastructure, transportation, and general resources.
Levels and Types of Tourism Planning
In tourism planning, three different levels – national, regional, and local, have
been commonly identified and explained (WTO, 1980; Pearce, 1989). Inkeep (1991) also
classified four different levels – international, national, regional, and sub-regional. In
these levels, tourism planning can be done separately for a specific unit or area, but
should be executed in such a manner that tourism planning is incorporated as a sector into
the overall development plan and policies (Inkeep, 1991). Additionally, depending upon
the levels or scales of tourism planning, each level could focus on a different degree of

22
specificity. Through understanding these scales, more effective planning for tourism
development can be possible.
Most general types of tourism planning include urban, rural, and coastal (Gunn,
1994; Pearce, 1981, 1989). In urban areas, tourism planning is more complex, compared
to development in other areas. Tourism development should be planned with
consideration for already existing and developed sites. Community residents’ interests
and support are also necessary considerations. In the case of rural areas having tourism
attractions and sites, there are more possibilities for expansion. Local agricultural
tourism products and activities, the natural landscape and environments, and
traditional/cultural heritages are important sources of tourism planning and development.
The coastal area as another general tourism planning site is located in any area of beach,
which is mostly connected with beach resort development. Sun, sand, and sea are the
most important characteristics of this type of site, along with tourist activities being
generally informal and unstructured (Pearce, 1989). However, due to the fragile ecology
of coastal areas, more consideration of environmental protection is required in the
planning process. Planning efforts can also be developed to overcome the seasonality of
coastal areas.
Approach to Tourism Planning
Tourism planning requires certain systematic processes and approaches.
Depending upon the types of planning and the specific forms of application, certain
approaches could be taken, but conceptually, all of the approaches could be applied to
any level and type of tourism planning. Inkeep (1991, p. 29) described several different
approaches to tourism planning. Each approach emphases the concepts of planning as
continuous and incremental, systems-oriented, comprehensive, integrated, involving
environmental and sustainable development, and considering the community approach.
Particularly, systems, comprehensive, and integrated approaches are similar or
related to each other in terms of a view of tourism. Tourism can be seen as an interrelated
system and all aspects of tourism development, including natural, institutional elements,
and environmental and socioeconomic aspects should be considered. The overall plan and
development patterns of an area are integrated in tourism planning and development.

23
In a community approach, which is also frequently applied in tourism planning
and development, the maximum involvement and participation of the local community in
the tourism planning process is sought (Inkeep, 1991). Specifically, two different
perspectives of community participation have been discussed, including the decision-
making process and the benefits of tourism development to the community (McIntosh &
Goeldner, 1986; Timothy, 1999).
In conclusion, tourism planning can be seen as a systematic process to promote
the tourism resources that the local community presents to the tourism markets.
Accordingly, it deals with what resources are to be developed, how well they meet
market needs, how tourism resources are utilized, and how tourism resources can be
expanded or newly developed (Gunn, 1994). Therefore, in order to create or enhance
tourism destination competitiveness, an appropriate tourism planning procedure and
approach should be selected.
REVIEW OF THE THEORETICAL FRAMEWORK
Social Exchange Theory
Social exchange theory has its origin in several disciplines, including
anthropology (Levi-Strauss, 1969), economics (Blau, 1968, 1991: Ekeh, 1974), behavior
psychology (Homans, 1991), and social psychology (Chadwick-Jones, 1976). The
common assumption that can be found in those theoretical thoughts or disciplines is
“utilitarianism” (Turner, 1986).
For example, it has been thought from the utilitarian economists’ perspectives that
people can be viewed as rationally seeking to maximize their material benefits, or utility,
from transactions or exchanges with others in a free and competitive market (Tuner,
1986). Further, the utilitarian principle proposes that people rationally weigh costs
against benefits to maximize material benefits. Additionally, social exchange theorists
reformulate this principle by asserting alternative assumptions. For example, Homans
(1967) said that “humans do not pursue to maximize profits, but they always attempt to
make some profit in their social transaction with others. Additionally, humans are not

24
perfectly rational, but they do engage in calculations of costs and benefits in social
transactions. Humans do not have perfect information on all available alternatives, but
they are usually aware of at least some alternatives, which form the basis of assessments
of costs and benefits. Further, humans do pursue material goals in exchanges, but they
also mobilize and exchange nonmaterial resources, such as sentiments, service, and
symbols” (cited in Turner, 1991, p. 286).
Anthropologists have recognized that social interaction is done in not only
economic or material exchanges but also in symbolic exchanges or social relationships.
Exchange relations are more than the result of psychological relationships and a
reflection of patterns of social organization. Under social/structural patterns, exchanging
commodities among peoples serves to satisfy their basic economic needs, which is a
reflection of economic motives. Thus, social culture and dynamics are reflected in this
view of the theory (Turner, 1998). Particularly, anthropologists view that exchange
theory involves sustaining exchange relations due to the forces of psychological needs
rather than economic needs. Symbolic exchange is emphasized for both individual
psychological processes and patterns of social integration. This view is critical in
explaining human social behavior.
As another point of view about social exchange theory, Levi-Strauss (1967), who
developed a structural exchange perspective, said that exchange must be viewed
according to its function in integrating the larger social structure. The exchange is more
than the result of psychological needs, and should be interpreted as a reflection of a
pattern of social organization that exists as an entity. Thus, the exchange behavior can be
explained by viewing the consequences or functions of norms and values. As a result, this
structural view of exchange contributes that various forms of social structure are critical
factors in explaining exchange relations. These exchange processes are affected by
patterns of social integration and organization (Turner, 1998).
In the behavioral psychology perspective, exchange theory is based on the
principle that people are reward-seeking organisms pursuing alternatives that will yield
the most reward and the least punishment (Chadwick-Jones, 1976). Psychological
rewards and punishment are reconciled with economic benefits (utility) and costs (Ekeh,
1974). Thus, the notion of reward and punishment is used to reinterpret the utilitarian

25
exchange heritage so that the reward is used to reinforce or meet the needs of the
organism, and punishment is used to deny reward or bring about the expenditure of
energy to avoid pain. Thus, people will behave so as to yield the most reward and the
least punishment and also will repeat those behaviors that have proved rewarding in the
past.
Accordingly, exchange theorists believe that exchange transactions occur based
on several assumptions (Ekeh, 1974). People are motivated by the hope of success, and
their past experiences will reduce their uncertainty in making decisions for future
possible success. Further, people will maintain an exchange relationship that is rewarding
to them. Additionally, Homans (1991), who introduced the “rationality proposition” of
people’s psychological exchange behavior, said that the more often the actions of people
are rewarded, the more likely they are to perform the action. If people receive rewards
based on their past experiences and similar situations occur, they are likely to perform the
same or similar actions in the present. Subsequently, the more valuable the result of
action, the more likely people are to perform the action.
In the tourism literature, a number of researchers have attempted to apply the
theoretical concepts and principles of social exchange theory to explain residents’
reactions to tourism development (Ap, 1990, 1992; Jurowski et al., 1997; Lindberg &
Johnson, 1997; Madrigal, 1993; Mihalik, 1992; Perdue, Long, & Allen, 1987, 1990;
Yoon, 1998; Yoon et al., 2000). Those studies have focused on how residents assess the
benefits and costs of tourism development, and some studies have explained residents’
support for future tourism development based on their evaluations of the benefits and
costs of tourism (e.g. Jurowski et al., 1997; Yoon et al., 2000).
For example, Perdue et al. (1990) briefly mentioned that social exchange theory is
a basis for investigating residents’ attitudes about tourism. They concluded that support
for additional development was positively related in the case of people who perceived
positive impacts from tourism, and negatively correlated in the case of people who
perceived negative impacts from tourism. Madrigal (1993) also said that this theory is
likened to an economic analysis of interaction that focuses on the exchange and mutual
dispensation of rewards and costs between tourism actors. He also pointed out that the
underlying assumption of this exchange is a disposition to maximize the rewards and

26
minimize the costs of residents’ experiences. Residents will be willing to exchange with
tourists if they can acquire some benefits without incurring unacceptable costs.
According to Ap (1992), in developing and attracting tourism to a community, the
goal is to achieve outcomes that obtain the best balance of benefits and costs for both
residents and tourism actors. The preceding discussion suggests that residents evaluate
tourism in terms of social exchange, that is, they evaluate it in terms of expected benefits
or costs obtained in return for the service they supply. Thus, it is assumed that host
resident actors seek tourism development for their community in order to satisfy their
economic, social, and psychological needs and to improve the community’s well being.
Jurowski et al. (1997) attempted to explain how residents weigh and balance
seven components, and why residents of the same community have different views by
using the principles of social exchange theory and a path model. This path model was
designed to investigate how the potential economic gain, use of the tourism resources,
ecocentric attitude, and community attachment as the exchange factors affect residents’
perceptions of tourism impacts, and affect both directly and indirectly the support of
tourism development.
The principle they suggested is that residents are willing to be involved in
exchanges with tourists if they can receive benefits, rather than incurring unacceptable
costs. The principle was developed based on the social exchange doctrine. For example,
residents will engage in exchange if the received results or rewards are valued, if the
exchange is likely to produce valued rewards, and if the perceived costs do not exceed the
perceived rewards (Skidmore, 1975).
Based on the empirical findings, they discussed that the above exchange factors
were found to influence the perception of tourism impacts, and the same factors both
directly and indirectly affect the support of tourism development. Thus, support tourism
development was considered as the residents’ willingness to enter into a tourism
exchange based on their perceptions of the benefits and costs of exchange factors.
Additionally, the authors concluded that theoretically, if residents perceive the
distribution of benefits over costs as positive, they will seek to maintain the exchange
relationship.

27
According to Yoon et al. (2000), who studied residents’ attitudes and support for
tourism development by using a structural model, local residents are likely to participate
in exchange (support tourism development) as long as the perceived benefits of tourism
exceed the perceived costs of tourism. Their empirical findings support this statement in
that the economic and cultural impacts were positively associated with the “total impact
of tourism,” while the social and environmental impacts negatively affected the “total
impact of tourism.” Further, the “total impact of tourism” was positively associated with
“the support for tourism development.” Additionally, environmental impact was
negatively associated with “the support of tourism development.” As a result, if residents
received benefits and rewards from tourism, they were likely to support tourism
development.
Among the number of theories that have been proposed to investigate peoples’
attitudes about tourism, social exchange theory has provided theoretical advantages in
that it facilitates a logical explanation of both the positive and negative aspects of tourism
and can accommodate the examination of relationships between and among the exchange
factors and their consequences. The assumptions and principles of the theory can enable
an explanation of the process involved in the exchanges between tourism resources and
people.
Since tourism stakeholders have been considered as important key players or
components that influence the success or failure of tourism in a region, their participation
and involvement should be considered in tourism planning and development. Thus, social
exchange theory provides a theoretical foundation for identifying tourism stakeholders’
perceptions of the benefits and costs of tourism. Additionally, it can logically explain
how the exchange factors affect the results or outcomes of the exchange process.
Therefore, this proposed study will utilize social exchange theory as the
fundamental underpinning theory for examining the structural relationships among the
constructs (tourism impacts, place attachment, and environmental attitudes), and their
results, including preferences about tourism development and support of destination
competitive strategies.
28
TOURISM DESTINATION COMPETITIVENESS
One of the goals of tourism planning and development is to create more valuable
tourism products and services for potential or current tourists so that destinations and
their communities receive social and economic benefits. However, it has been suggested
that there is a need for a clearer understanding of the ability of the tourism destination to
compete effectively in an increasingly saturated market (Evans, Fox, & Johnson, 1995;
Ritchie, Crouch, & Hudson, 2000). The planning and promotion of tourism destinations
should be guided by a thorough analysis of the destinations’ competitive factors and
development strategies (Hassan, 2000).
A number of studies have introduced and applied the concept of competitiveness
in the area of tourism destinations (Ahmed & Krohn, 1990; Bordas, 1994; Buhalis, 2000;
Crouch & Ritchie, 1999; d’Hauteserre, 2000; Go & Govers, 2000; Hassan, 2000; Kozak,
2001; Kozak & Rimmington, 1999; Mihalič, 2000; Pearce, 1997; Ritchie & Crouch,
1993; Thomas & Long, 2000; Woodside & Carr, 1988). The major interest of the existing
studies has been to investigate how destination competitiveness can be sustained as well
as enhanced while maintaining a market position among other destination competitors.
Additionally, studies have investigated the key environmental factors,
determinants, or strategies that affect the enhancement of destination competitiveness.
Especially, it has been discussed that since tourism destinations involve multi-faceted
components of natural/cultural resources and a multiplicity of businesses, a systematic
framework or analytical model for destination planning and development is necessary
(Hassan, 2000). Such an analytical framework for destination development and
promotion can contribute to creating and integrating value-added tourism resources for
enhancing destination competitiveness.
A number of conceptual models and approaches to developing destination
competitiveness have been explored, but empirical studies and results related to testing
and validating the proposed models have been limited. Particularly, the development of
destination competitive strategies has not been thoroughly addressed. Moreover, it has
not been found which competitive strategies are more supported by tourism stakeholders
in association with destination attractions and resources. The support of tourism
29
stakeholders could aid in the design and selection of competitive strategies for tourism
destinations that could enhance competitiveness as well as provide social/economic
benefits and welfare to the destination communities.
Concepts and Definitions of Destination Competitiveness
Traditionally, the concept of competitiveness has been adapted from economic
theory and applied to the general firm or company (Bordas, 1994; Poter, 1990; World
Economic Forum, 1995). The model proposed by Porter (1980, 1990) has been widely
discussed in terms of a variety of industries. The major theme of this model is that a
company should find better ways to compete by continually upgrading the firm’s
products and processes in order to create competitive advantage.
Accordingly, competitiveness has been viewed as “producing more and better
quality goods and services that are marketed successfully to consumers” (Newall, 1992,
p. 94). It is also defined as “the ability of a country or company to, proportionally,
generate more wealth than its competitors in world markets” (World Competitiveness
Report, 1994, p.18). This definition implies that competitiveness refers to the
combination of both assets and processes where assets are inherited (e.g. natural
resources) or created (e.g. infrastructures) and transformed into economic results (Crouch
& Ritchie, 1999, p. 140). Competitiveness can also defined as “the ability to retain the
competitive position of an organization by satisfying the expectations of customers and
shareholders while constantly eliminating the threats and exploiting the opportunities
which arise in the competitive environment” (Feurer & Chaharbaghi, 1994, p. 51). Thus,
competitiveness can only be sustained by continuing improvement of the offerings and
capabilities of an organization.
In the tourism context, the concept of competitiveness has been applied to
different destination settings and types as well as expanded into the sustainability of
destinations. Thus, certain marketing plans and promotional strategies such as price,
quality, image, and sustainable tourism have been discussed. The success of integrated
quality management of tourism destinations and price-based promotions as a value-
increasing strategy have been considered for destination competitiveness (Go & Govers,
30
2000; Peattie & Peattie, 1996). This discussion is focused on how to determine and
develop the future directions of destination competitiveness. As of yet, detailed future
directions and instructions for destination competitiveness have not been fully
investigated.
Competitiveness in the tourism literature has been considered as a “destination’s
ability to create and integrate value-added products that sustain its resources while
maintaining market position relative to competitors” (Hassan, 2000). It is also defined as
“the ability of a country to create added value and thus increases national wealth by
managing assets and processes, attractiveness, and aggressiveness, and proximity, and by
integrating these relationship into an economic and social model” (Ritchie & Crouch,
2000, p. 306).
Competitiveness has often incorporated the concept of marketing planning and
competitive development strategies (Bordas, 1994; Buhalis, 2000; Kozak, 2001; Heath &
Wall, 1992; Poon, 1994). Particularly, Bordas (1994) said that in a conceptual scheme of
competitive marketing, once the strongest of the tourism resources (clusters) are
identified, the most attractive markets/segments for each resource (cluster) are
determined as to their functions in the mix of specific competitive forces. Then, the
competitive opportunities in each of the resources are decided.
Similarly, Pearce (1997) described destination competitiveness as destination
evaluation techniques and methods that can systematically analyze and compare the
diverse attributes of competing destinations within a planning context. Such a systematic
evaluation and comparison of major tourism components among competitors can provide
a better appreciation of competitive advantage so that it contributes to the formulation of
more effective development polices. Mihalič (2000) also described destination
competitiveness from environmental perspectives that can be related to natural and man-
made tourism components, as well as social and cultural environments. Destination
environmental competitiveness can be enhanced by appropriate managerial efforts and
increased through certain environmental marketing activities or strategies.
Therefore, this study utilizes the concept of competitiveness as a destination’s
ability to create and integrate value-added products that sustain its resources while
maintaining market position relative to competitors.
31
Nature and Framework of Destination Competitiveness
Of major interest in tourism planning and development is destination
sustainability and market longevity. Accordingly, as competition in the tourism market
increases, an understanding of the driving forces contributing to destination
competitiveness is essential, and has become a fundamental step in maintaining tourism
destinations, their growth, and vitality (Ritchie & Crouch, 1993; Hassan, 2000).
In the tourism literature, a systematic approach to destination competitiveness
research has been taken. Additionally, the conceptual and analytical frameworks that can
help to better understand and respond to the rapidly changing environment, have been
developed and explained. Starting with Ritchie and Crouch’s research (1993), a number
of studies have discussed the important determinants or sources of competitiveness.
The model and its four determinants proposed by Porter (1990) were utilized as a
fundamental source of explaining the determinants of destination competitiveness
(Ritchie & Crouch, 1993). These determinants are factor condition (e.g. skilled labor,
infrastructures), demand condition (e.g. basic tourism services), related and supporting
industries, and firm strategy, structure, and competition. It has been said that these
determinants do not operate independently, but are mutually dependent upon each other
(Porter, 1990).
Particularly, the systemic model of destination competitiveness proposed by
Crouch and Ritchie (1999) point out that it is necessary to investigate and understand the
relationships and interplay among the forces of competitiveness. Furthermore, it also has
been suggested that a systematic analysis of the comparative and competitive advantages
or forces contributing to destination competitiveness is required.
According to Crouch and Ritchie (1999, p. 143), comparative advantages
constitute the tourism resources available to a destination, while competitive advantages
relate to a destination’s ability to use these tourism resources effectively over the long
term. The primary elements of destination appeal are essential for destination
comparative advantage and can be key motivational factors for tourists’ visits. These
primary elements are the fundamental resources that motivate tourists’ destination
choices, as well as being elements that planners and developers should consider for

32
increasing destination competitiveness. Physiography, culture and history, market ties,
activities, events, and tourism superstructures are examples of these resources.
Additionally, this model explains the supporting factors and resources as secondary
effective sources of destination competitiveness (Crouch & Ritchie, 1999). The extent
and condition of these factors, such as infrastructure, accessibility, facilitating resources,
and enterprise are critical for destination business success.
Particularly, Ritchie and Crouch (1993) have discussed the dimensions of
competitiveness that can be a framework for measuring overall competitiveness. The
factors should be identified and developed so that those that have influence on the
competitiveness and the prosperity of tourism destinations can be determined. Then, the
most appropriate indicators of success regarding the performance of tourism destinations
should be determined. Additionally, the relative strength and the positioning of a
particular destination in relation to other competitors in the market place should be
established.
Development of Destination Competitive Strategies
In the tourism literature, a number of studies point out that tourism destination
competitiveness can be enhanced through certain development strategies, including
marketing efforts (image, quality, positioning, branding, and services), destination
management efforts, and sustainable tourism. These development strategies can be
considered as the processes or actions that can enable tourism destinations to achieve a
maximum correlation with tourism demand. Competitiveness is the essential goal of
management and marketing strategies (Kozak, 2001). The development of the
competitive strategies of a tourism destination can be guided by previous studies in the
tourism literature (Buhalis, 2000; Crouch & Ritchie, 1999; Evans, Fox, & Johnson, 1995;
Flagestad & Hope, 2001; Mihalič, 2000; Poon, 1993; Ritchie & Crouch, 1993).
According to Poon (1993), destination competitiveness could be enhanced by
“permanent innovation” and “ceaseless change.” Flexible, segmented, customized
products for the tourists’ needs are necessary to create competitive tourism destinations.
Organization, management, marketing, distribution, and other forms of interaction and
33
interrelationships among tourism suppliers are fundamental sources of developing
flexibility for tourism destination competitiveness. In order to compete successfully in
tourism market places, tourism destinations and their players should follow such
principles as “put the consumer first, be a leader in quality, develop radical innovations,
and strengthen the firms’ strategic position within the industry’s value chain (p240).”
Particularly, Poon (1993) explained that linking marketing with product
development, satisfying the consumer, and developing holistic approaches to travel
experiences (ex. destination image, collaboration with the public sector, and controlling
the service delivery system, are important strategies for destination competitiveness.
Ritchie and Crouch (1993) also discussed how tourism destinations could develop
competitive strategies (p.22). For example, a carefully selected and well-executed
program of destination management can serve to improve the tourism competitiveness of
an area, and also, through certain key activities of destination management organization,
destination competitiveness could be enhanced. The collected information from research
can enable destinations to better manage the performance of the destination’s products, as
well as to adapt to changing market conditions through marketing strategies. Lastly, the
effective and efficient delivery of the tourism experience to tourists can contribute to
destination competitiveness. High or different levels of quality at a given cost as well as
the quality of human services, facilities and equipment are also important factors for
destination competitive strategy.
Furthermore, Crouch and Ritchie (1999) expanded these destination competitive
strategies, with more focus on destination management approaches and activities,
including marketing, service, information, organization, and resource stewardships
(Crouch & Ritchie, 1999). It was suggested that “those activities can enhance the appeal
of the core tourism resources and attractions, strengthen the quality and effectiveness of
the supporting resources, and best adapt to the constraints imposed by the qualifying
determinants (location, dependences, safety, and cost) (p.149).”
The marketing of destinations is related to promotional efforts that can be
achieved by product development, appropriate pricing policies, effective distribution
channels, and product packaging. It can also include selection of appropriate target
markets. Quality of services and experiences are also important components for
34
management activities. Enhancing the quality of service should be considered to increase
tourist satisfaction. As a result, these marketing efforts can have the potential to enhance
the tourism attractions’ appeal, as well as strengthen the competitive position of
destinations (Mihalič, 2000).
Destination management is related to the regular monitoring of visitor satisfaction
and the tracking of industry performance. Such information is critical to help the
destination managers understand visitors’ needs and develop more effective destination
products. It is also important to ensure destination productivity and effectiveness.
Additionally, the organization’s function within the tourism destination should be
considered in terms of its responsibility to the well-being of all aspects of the destination.
Through a broad range of opportunities and management efforts, destination
competitiveness can be enhanced.
Destination competitiveness also can be increased by resources stewardship,
which involves effectively maintaining and sustaining tourism resources, including
ecological, social, and cultural resources. Stewardship is a fundamental strategy for long-
term destination competitiveness. According to Ritchie and Crouch (2000), destination
sustainability should be emphasized in its role in enhancing competitiveness.
Sustainability has a larger function than natural environmental sustainability (Hassan,
2000). Subsequently, a destination’s development for tourism must be sustainable, not
just economically and ecologically, but socially, culturally and politically as well.
According to Mihalič (2000), who studied tourism competitiveness from the
environmental perspective, destination competitiveness can be enhanced by appropriate
managerial efforts and environmental quality management. Additionally, certain
environmental marketing activities can also enhance destination competitiveness. The
concept of environment refers to the physical environment that includes natural and man-
made components, as well as social and cultural components (Inskeep, 1991, Mathieson
& Wall, 1996).
Since environmental quality is an integral part of the quality of natural
attractions, maintaining a high level of overall environmental quality is critical for
destination competitiveness. Consequently, this study considers management elements as
a tool to link competitiveness and environmental management.

35
Go and Govers (2000) studied integrated quality management for tourist
destinations for achieving competitiveness. This study discussed that in order to meet the
challenge of competitors and to increase market share, maintaining and improving a high-
quality supply is required to sustain market position. Thus, integrated quality
management as a means to increase competitiveness was applied to different destinations
for seven European countries. As a result, an integrated approach to problem-solving
through relevant fields of knowledge such as urban and regional planning, cultural and
heritage preservation, and economic development is needed for the effective development
and implementation of integrated quality management for tourist destinations.
In conclusion, the above management activities and actions can be considered as
destination competitive strategies that can allow destinations to enhance their
competitiveness. Particularly, as Mihalič (2000) concluded, destination environmental
competitiveness (attractions and resources) can be increased by appropriate managerial
efforts and can also be enhanced through certain environmental marketing activities; the
concepts and scope of those management activities can be utilized as the framework for
developing and measuring destination competitiveness strategy. More appropriate
management efforts, marketing activities, quality of services, and environmental
management can help to create and integrate value in tourism products and resources so
that tourism destinations can achieve better competitive market positions.
Thus, as suggested by the literature review, destination competitiveness can be
improved by the appropriate matches between tourism attractions/resources and the
enhancement strategies of destination competitiveness. Consequently, identification of
the relationship between development preferences about tourism attractions/resources and
support of destination competitive strategies is important in enhancing destination
competitiveness.
36
TOURISM ATTRACTIONS/RESOURCES
The various types of tourism destinations provide an amalgam of tourism
products and services. The components of tourism products and services are essential for
tourism development and marketing, and are commonly referred to as tourism attractions
and resources. Leiper (1995) said that destinations are places where people travel to and
where they stay for awhile in order to have certain travel experiences, depending on the
destinations’ attractions. Hu and Ritchie (1993) also stated that a “tourism destination
reflects the feelings, beliefs, and opinions that an individual has about a destinations’
perceived ability to provide satisfaction in relation to his or her special vacation needs
(p.25).”
Thus, in general, these destination attractions/resources have been considered as
tourism supply factors that represent the driving forces generating tourist demand (Uysal,
1998) and also primary sources or determinants of measuring destination attractiveness
(Hu & Ritchie, 1993; Formaica, 2000). A recent study by Buhalis (2000) lists six major
components of tourism attractions and resources (p.98) that most of the tourism literature
commonly includes in assessing and evaluating the elements of tourism destinations.
These components are as follows:
1. Attractions -natural, man-made, artificial, purpose-built, heritage, special events
2. Accessibility – entire transportation system comprised of routes, terminals and vehicles
3. Amenities – accommodations, catering facilities, retailing, other tourist services
4. Available packages – prearranged packages by intermediaries and principals 5. Activities – all activities available at the destination and what consumers will
do during their visit 6. Ancillary services – services used by tourists such as banks,
telecommunications, newsagents, hospitals.
Many researchers have attempted to evaluate and classify destination
attractions/resources as tourism products (Ferrario, 1976; Gunn, 1988; Hu & Ritchie,
1993; MacCannell, 1976; Murphy, 1985; Murphy, Pritchard, & Smith, 2000; Smith,
1994; Yoon, Formica, & Uysal, 2001). Particularly, Ritchie and Crouch (1993, 2000) and
Mihalič (2000) suggested that destination attractions/resources should be acknowledged
37
as important sources of comparative and competitive advantage factors in destination
competitiveness. These are the essential components of the competitiveness of a tourism
destination and are critical attributes for sustaining tourism destinations (Crouch &
Ritchie, 1999; Hassan, 2000).
The destination attractions/resources such as natural/cultural components,
heritage/ historical resources, supporting facilities/services, infrastructure, hospitalities,
sports/recreation activities, transportation/accessibility, and cost, should be considered as
not only basic to understanding tourism planning, but also essential for successful
tourism development (Gunn, 1994; Pearce, 1997). Furthermore, maintaining and
developing the quality of these tourism resources is important to the competitiveness of
most types of tourism destinations (Inkeep, 1991; Go & Govers, 2000).
Especially, according to the model developed by Ritchie and Crouch (1993),
destination attractions/resources are considered as the destination’s appeals or
determinants of competitiveness. These include natural features, climate, culture & social
characteristics, general infrastructure, basic services in infrastructure, superstructures,
access and transportation facilities, attitudes towards tourists, cost/price levels, economic
and social ties, and uniqueness. It is suggested that these can be considered as important
sources of destination comparative advantages in destination competitiveness.
Additionally, Hassan (2000) proposed a conceptual model of determinants of
market competitiveness in an environmentally sustainable tourism industry and suggested
four critical determinants of market competitiveness: 1) comparative advantage, 2)
demand orientation, 3) industry structure, and 4) environmental commitment (p.242).
Among them, the comparative advantage that is associated with factors of both the macro
and micro-environments constitutes climate/location, cultural/heritage, history/artifacts,
tourist-oriented services, safety and health, access to information, and environmental
quality. And also, along with these examples of market comparative advantages, the other
attractions and resources are hospitality, transportation, and entertainments that can
contribute through their value-added activities to the overall competitive position in the
tourism market place.
According to Mihalič (2000), who studied the environmental quality of
destination competitive factors, destination attractions refer to destination appeal as

38
destination attractiveness and deterrents. Attractiveness includes eleven attractions and
resources: natural features, climate, cultural and social characteristics, general
infrastructures, basic services, tourism superstructures, access and transportation
facilities, attitudes towards tourists, cost/price levels, economic, social, and uniqueness.
These destination attractions are considered as environmental quality, which is an integral
part of the quality of the natural attractions. Thus, it was argued that “maintaining a high
level of overall environmental quality is important for the competitiveness of most types
of tourist destinations” (Inkeep, 1991, p.347; Mihalič, 2000, p. 66).
Many tourism destinations contain natural or man-made advantages to attract
visitors. In the long-term sustainability and success of tourism destinations, such tourism
attractions should be identified and evaluated. Especially, each destination and tourist
region could have a different advantage in its destination attractions. The assessment of
destination attractions is needed to create a more competitive and quality environment in
tourism planning and development.
TOURISM DEVELOPMENT IMPACTS
In the tourism literature, a number of studies have investigated residents’
reactions to tourism development (Akis, Peristianis, & Warner, 1996; Ap, 1992; Belisle
& Hoy, 1980; Chen, 1999; Getz, 1994; Hernandez, Cohen, & Garcia, 1996; Jurowski,
Uysal, & Williams, 1997; King, Pizam, & Milman, 1993; Lankford, 1994; Lankford &
Howard, 1994; Lindberg & Johnson, 1996; Liu & Var, 1986; Long, Perdue, & Allen,
1990; McCool & Martin, 1994, Yoon, 1998; Yoon, Gursoy, Chen, 2000).
The results of these studies have suggested that community support for tourism
development is essential for the successful operation and sustainability of tourism
(Juroski, 1994; Yoon, 1998). This is because tourism relies heavily upon the goodwill of
the local community and residents, and understanding local communities’ reactions
toward tourism development is essential in achieving the goal of favorable host
community support for tourism development (Yoon, Gursoy, & Chen, 2000).

39
Additionally, the previous tourism impact studies found that local communities’
perceptions in terms of economic, environmental, social and cultural impacts have
affected communities’ support for community tourism development and business (Davis,
Allen, & Consenza, 1988; Gee, Mackens, & Choy, 1989; Getz, 1986; Gunn, 1988;
Fesenmaire, O’Leary, & Uysal, 1996; McIntosh & Goldner, 1986; Murphy, 1985;
Perdue, Long, & Allen, 1990).
Most of these studies have been conducted based on social exchange theory, and
have claimed that local communities are likely to participate in an exchange with tourists
if they believe that they are likely to gain benefits without incurring unacceptable costs
(Jurowski et al., 1997). If residents perceive the positive impacts of tourism development
to be greater than the negative impacts, they are inclined to become involved in the
exchange and, therefore, endorse and prefer future tourism development in their
community (Allen et al.,1994; Getz, 1994).
In fact, a source of the common benefits and costs of tourism development is
economic impacts. Local communities are greatly influenced by their economies
(Husband, 1989; Liu, Sheldon, & Var, 1987; Milman & Pizam, 1987; Nelson, 1995;
Prentice, Terrace, & Road, 1993; Ritchie, 1988; Belisle & Hoy, 1980; Tyrrell &
Spaulding, 1984; Jurowski, Uysal, & Williams, 1997; Murphy, 1983). Job creation or
reduced unemployment has been discussed as the most prominent benefit of tourism
development. Changing investment and spending (Akis, Peristianis, & Warner. 1996,
1996), economic gain (Getz, 1994), an increasing standard of living (Milman & Pizam,
1988), income distributions for hosts and government (Perdue, Long, & Allen, 1987),
prices of goods and services (Johnson, Snepenger, & Akis, 1994); costs of land and
housing (Perdue, Long, & Allen 1987), costs of living, development and maintenance of
infrastructure, and resources are given as other examples of the economic impacts of
tourism development.
Additionally, the social/cultural impacts of tourism have been discussed. For
example, tourism provides cultural exchange opportunities and more recreational
facilities, and disrupts various quality of life factors. However, it was also found that
unlike the economic impacts of tourism, the social and cultural impacts of tourism
development could negatively affect residents’ perceptions (Jurowski et al., 1997; Liu &

40
Var, 1986; Milman & Pizam, 1988; Perdue et al., 1987; Pizam, 1978; Prentice, 1993).
Creating congestion, traffic jams, noise and increasing crime are examples of the
social/cultural impacts of tourism (Gunn, 1988; Johnson et al., 1994; Milman & Pizam,
1988). Researchers found that tourism improved local public services (Keogh, 1990),
cultural activity (McCool & Martin, 1994), changing traditional culture (Akis et al.,
1996) and preserved the identity of local culture (Liu & Var, 1986).
The previous literature has discussed the physical and environmental impacts of
tourism development. It has been identified that physical and environmental impacts are
associated with the development of natural, cultural or historical resources, tourist service
facilities, preservation of historic and cultural resources, recreation opportunities for
visitors and residents, and better roads and public facilities (Davis, Allen, & Cosenza,
1988; Gartner, 1996; Getz, 1994; Liu et al., 1987; Milman & Pizam, 1988; Murphy,
1983; Rothman, 1978; Lankford & Howard, 1994). Likewise, it has been concluded that
if residents have a positive perception of tourism impacts in terms of physical and
environmental consequences, they will render support for additional tourism
development.
Therefore, an investigation of the perceived impacts of tourism development is
critical for examining a community’s preferences and support of tourism development or
opposition to tourism development. Particularly, as key player in local communities,
tourism stakeholders’ perceptions on tourism impacts are critical to implementing further
tourism planning and development.
Consequently, as the success and sustainability of any tourism development
projects and development relies on the extent to which the development is planned and
constructed with the knowledge and support of the tourism stakeholders, tourism
destination competitiveness can be enhanced through the local community, particularly,
the support of tourism stakeholders who have received the benefits of tourism
development impacts.

41
ENVIRONMENTAL ATTITUDES
In the tourism literature, it has been discussed that people’s support for tourism
development could be varied, depending upon their attitudes toward environmental
concerns (Yoon, Gursoy, Chen, 2000; Jurowski, Uysal, & Williams, 1997). More
specifically, their values and preferences for preservation and utilization of tourism
resources may vary based upon their attitudes about human relationships to the natural
environment. (Gursoy, Jurowski, & Uysal, 2002).
Jurowski et al. (1995) examined the relationships among environmental attitudes,
support for conservational policies, and preferences for recreational facilities in a national
park. Two distinctive attitude groups --- ecocentric and anthropocentric were identified.
The former attitude favored protection and regulation, and the latter supported recreation
development that would transform the environment. In other words, an ecocentric value
proposes that mankind must live in harmony with nature, while an anthropocentric value
reflects the view that nature exists primarily to serve the needs of humans. Subsequently,
they suggested that diverging preferences related to recreational facilities or management
actions consistent with particular attitude groups.
Jackson (1987) points out that “one of the most urgent issues in resource
management is the problem of finding an acceptable compromise between the
development of land for recreation and its preservation for ecological, scientific, cultural,
historical, and aesthetical reasons (p. 236).” The previous studies explain that those
whose environmental attitudes include exocentric values are likely to prefer that
resources be allocated to protect and preserve the environment, while those with
anthropocentric inclinations favor transforming the environment to fulfill human needs
and desires (Crick-Furman & Prentice, 2000; Jurowski, Uysal, Williams, & Noe, 1995;
Uysal, Jurowski, Mcdonald, & Noe, 1994).
Additionally, Jurowski, Uysal, and Williams (1997) and Gursoy et al. (2002),
studied residents’ attitudes in terms of their environmental concerns about ecocentric
values and their impacts and support for tourism development. They concluded that
residents’ ecocentric attitudes have a direct impact on the support of tourism
development, showing a significant positive relationship with support for its
42
development. However, the results showed that there is an inverse relationship between
ecocentric attitudes and the perceived costs and benefits of tourism. Thus, it is interesting
to note that residents’ ecocentrism can positively influence their support for tourism
development. Furthermore, this result supports the previous findings that those with
higher ecocentric values are more likely to support cultural and event tourism rather than
attraction-based or natural based tourism Jurowski (1994).
Environmental values and attitudes have been evaluated by the New
Environmental Paradigm (NEP), which was originally developed by Dunlap and Van
Liere (1978). This view refers to the inevitability of imposing limits to human growth, the
importance of conserving a balance in nature, the need for developing a sustainable
economy, or the need to review the idea that nature exists solely to satisfy human needs
(Dunlap & Van Liere, 1978). In other words, the New Environmental Paradigm focuses
on beliefs about humanity’s ability to upset the balance of nature, the existence of limits
to growth for human society, and humanity’s right to rule over the rest of nature (Dunlap,
Van Liere, Mertig, & Jones, 2000). Thus, belief domains about the environment are
assessed by this environmental value paradigm (Crick-Furman & Prentice, 2000; Kaiser,
Wolfing, & Fuhere, 1999).
In a study done by Uysal, Jurowski, Noe, and MacDonald (1995), who
investigated the correlations between preferences for management action and the NEP
subscales, people who have more anthropocentric attitudes are likely to have more
preferences for improvements in the beaches and resort amenities group, while people
who have ecocentric attitudes are more likely to have preferences for less visible
structures, and more wildlife and vegetation projects. These results imply that for
targeting naturalists and conservationists, protection of and preserving the environment
may be desirable products for destinations. The marketing efforts recommend promoting
flora and fauna, natural as opposed to human-built attractions, and un-crowded facilities.
From the literature review of this New Environmental Paradigm, concerning other
areas such as recreation, several studies found relationships between demographics
(socioeconomic variables), and environmental attitudes (Arcury, 1990; Geisler,
Martinson, & Wilening, 1977; Jone & Dunlap, 1992; Langanau, 1987; Van Liere &
Dunlap, 1980). Generally, the studies suggest that age, education levels, gender, and

43
living area may affect environmental concerns and attitudes. For example, the young
visitor places a higher value on preservation than do others. Rural residents are likely to
be more knowledgeable about wildlife than urban residents, and have a more utilitarian
attitude about wildlife, while residents who are from cities more likely to have protective
values (Langanau, 1987). Jones and Dunlap (1992) also suggested that among young
adults, those raised in urban areas express more environmental concern than older adults,
the less educated, and rural residents.
Additionally, Dunlap and Hefferman (1975) studied the reactions of participants
in “appreciative” activities such as cross-country skiing and hiking, and found that they
showed stronger pro-environmental attitudes than participants in “consumptive” activities
such as hunting and fishing. However, since the findings about socio or demographic
characteristics have produced different aspects or inconsistent explanations of
environmental concerns and attitudes, those socio and political ideology variables may
not be recommended for use in explaining environmental concerns and attitudes
(Jurowski, Uysal, Williams, & Noe, 1995; Samdahl & Robertson, 1989).
The beliefs about the nature of the earth and humanity’s relationship with the
environment have been measured by the NEP (Dunlap, Van Liere, Mertig, & Jones,
2000). This environmental paradigm views humans as an integral part of nature (Schultz
& Zelezny, 1999) and explains a vision of the world consisting of a series of ideas that
oppose the dominant anti-ecological social paradigm (Hernandez, Suarez, Martinez-
torvisco, & Hess, 2000). The NEP scale also has been treated as a measure of
endorsement of a fundamental paradigm or worldview, as well as of environmental
attitudes, beliefs, and values.
Therefore, people’s beliefs about their environments may influence their support
for tourism development. Inevitably, different values and interests among tourism
stakeholders are likely to exist so that more clear information about and understanding of
their environmental attitudes are required for the long-term success and sustainability of
tourism destinations. Thus, this study utilized the New Environmental Paradigm as a
measurement tool to evaluate tourism stakeholders’ environmental attitudes, and
furthermore to investigate how their environmental attitudes affect their preferences
about and support of tourism development.

44
PLACE ATTACHMENT
In the field of natural resource management, the concept of place attachment has
been widely applied in the study of how people evaluate natural environments and their
surrounding places (Mitchell, Force, Carroll, & McLanughlin, 1993; Warzecha, & Lime,
2001; Williams & Stewart, 1998). This is because the theoretical strength of the linkage
between peoples’ perceptions and places has been accepted as a management tool for
assessing the value of their surroundings and natural places, understanding resource
conflicts, and identifying individuals or groups who should be included in the public
involvement process (Moore & Graefe, 1994; Warzecha, & Lime, 2001).
It also has been acknowledged that people’s attachment to the community in
terms of feelings of community, length of residency, and birth place may affect their
perceptions about tourism development, as well as perhaps being a critical determinant of
successful coexistence between residents and tourism development (McCool & Martin,
1994; Sheldon & Var, 1994; Um & Crompton, 1987; Williams, Mcdonal, Riden, &
Uysal, 1995; Yoon, 1998; Yoon, Chen, & Gursoy, 1999).
These studies have emphasized residents’ general feelings about their community
and its influences on their support of and cooperation with tourism development. It has
been argued that residents are an integral component of destination environments, and
their values and perceptions of natural and environmental settings should be evaluated
and incorporated into the management process. Additionally, building a better
understanding of the values people attach to their community can be an essential step
toward a more effective approach to destination management.
Theories and concepts about place attachment have been found in various
disciplines, including geography, architecture, and environmental psychology
(Kaltenborn, 1997). Peoples’ perceptions, attitudes, and behaviors toward their
surrounding places are commonly discussed in terms of research issues and topics in
studies of place attachment. Additionally, several models and conceptual frameworks of
people-place relationships (e.g. place identity and place dependence) have been
developed. Such models may help to conceptualize the extent to which an individual

45
values or identifies with a particular environmental setting (Moore & Graefe, 1994 ;
Twigger-Ross & Ussell, 1994).
Specifically, place attachment has been considered as “an affective bond or link
between people and specific places” (Hidalgo & Hernandez, 2001, p. 274), “emotional
involvement with places” (Hummon, 1992, p. 256), and “an individual’s cognitive or
emotional connection to a particular setting or milieu” (Low, 1992, p. 165). Tuan (1976)
said that this concept may be referred to as “geopiety,” which implies people’s
attachment to nature in general and certain places in particular. There is a broad range of
emotional and social bonds between humans and their territorial area. Subsequently,
people’s attachment to place can be considered as enduring psychological attitudes and
behavioral tendencies that can enable an understanding of the identity of a person based
upon a geographical place (Feldman, 1990).
Since the meaning of place can be complex and diverse in terms of its size,
shapes, and levels, place attachment can also be multifaceted, and the natural physical
landscape, social life, culture, community, and history of places can be involved in
building attachment to places (Kaltenborn, 1997). According to Low and Altman (1992),
there are four basic processes that lead to the development of place attachment: 1)
biological, 2) environmental, 3) psychological, and 4) socio-cultural.
In general, it has been believed that peoples’ attachment to place may be built by
expressing the sense of belonging and certain purpose that gives meaning to their lives
(Bricker & Kerstetter, 2000; Buttimer, 1980; Tuan, 1980). This implies that people have
not only a deep and complex attachment that is expressed through emotional and
behavioral actions, but also have functional attachment to places (Bricker & Kerstetter,
2000). Thus, place attachment has been assessed by at least two conceptual domains,
including place identity and place dependence (Bricker & Kerstetter, 2000; Lee & Allen,
1999; Proshansky, Fabian, & Kaminoff, 1983).
Place identity is associated with “those dimensions of self that define the
individual’s personal identity in relation to the physical environment by means of a
complex pattern of conscious and unconscious ideas, beliefs, preferences, feelings,
values, goals and behavioral tendencies and skills relevant to this environment”
(Proshansky, 1978, p. 155). It involves “place belongingness,” which is characterized by
46
strong desires and emotional attachment, and is theorized to be a “complex cognitive
structure” that consists of the “norms, behaviors, rules, and regulations that are inherent
in the use of these places and spaces” (Proshansky et al., 1983, p.61).
According to Moore and Graefe (1994), place identity is developed over a longer
period of time and builds emotional and symbolic meanings of a place. Place identity is
formed through individual awareness and perception of the world as represented by a
collection of memories, conceptions, interpretations, ideas, and related feelings about
specific physical settings and types of settings. It is implied that people recognize a place
as an important part of themselves, and as an integral component of self-identify from
their experiences of the surroundings and environment. Consequently, place identity
represents people’s symbolic/emotional relationship with their natural surroundings and
environments and places (Proshansky, Fabian, & Kaminof, 1983)
As another domain component of place attachment, place dependence can be
considered as an “occupant’s perceived strength of association between him or herself
and specific places” (Stokols & Shumaker, 1981, p. 457). It involves the quality of a
specific place, depending upon the degree to which it satisfies the needs or goals of an
individual, and also it is related to the quality of a particular place as it compares to
alternative sites or settings that may satisfy the individuals’ needs or goals (Bricker &
Kerstetter, 2000; MaCool & Martin, 1994; Shumaker & Talyor, 1983; Warzecha & Lime,
2001).
Thus, it can be said that place dependence is the level to which individuals
perceive themselves as functionally associated with places or groups. Depending upon a
person’s previous experiences with other places and also their perception or awareness of
alternative existing places, people’s attachment to place is formed. Thus, place
attachment is theorized to be peoples’ functional relationship with their environmental
settings and its facilities.
Additionally, place attachment is the extent to which people perceive the value of
natural and environmental settings and places. This valuation can be evaluated by two
general domains of place attachment, including place identity (emotional/symbolic
meanings and attachment) and place dependence (functional meanings and attachment).
In other words, place can be valued by people because it particularly appeals to peoples’

47
emotional or symbolic mind, or both, and it can be valued because it has a good quality
of facilities and activities (Moore & Graefe, 1994)
Traditionally, research on this concept of attachment to a place has been
performed in various geographical settings, such as residential communities (Cooper,
1976; Hummon, 1992; Korpela, 1989), childhood neighborhoods (Altman & Low, 1992),
and recreational settings and facilities (Schreyer, Jacob, & White, 1981). In the tourism
literature, a number of studies have applied the concept of place attachment to tourism
(McCool & Martin, 1994; Sheldon & Var, 1984; Um & Crompton, 1987; Williams,
McDonald, Riden, & Uysal, 1995, Yoon, 1998).
For example, Um and Crompton (1987) studied residents’ attachment to the
community, which was measured by length of residence, birth place, and heritage. They
found that the more attached residents were to the community, the less positively they
perceived the impacts of tourism development in their community.
Macool and Martin (1994) examined how the adverse effects of tourism
development influence feelings of community attachment. They measured community
attachment by length of residence and two Likert scale items measuring residential
preference, and concluded that people living in communities with higher levels of
tourism development have the strongest sense of attachment, but those living in these
communities also have the shortest tenure in that locale. Highly attached residents viewed
the costs and impacts of tourism as well as the sharing of costs with more concern than
those who were unattached. Additionally, highly attached individuals viewed the benefits
of tourism more positively than those who were unattached.
In a study done by Williams et al. (1995), it was found that length of residency
was correlated with community sentiment, community identity, and regional identity.
Particularly, regional identity had a strong correlation with attitude toward tourism’s
economic and social impacts. As a result, they concluded that more attached residents
perceived tourism impacts more favorably and also may express ties to the regional
character of the landscape more than ties to the community. People may have different
attitudes toward tourism development, depending upon their source or degree of
community or place attachment.

48
In conclusion, peoples’ attachment to place is apparently an important concept in
identifying their relationship with natural and environmental surroundings and settings.
Depending upon the degree or value of peoples’ attachment, they may have different
attitudes and behaviors toward their environments. Since the success of tourism
development is highly affected by tourism stakeholders’ support and interests,
information about their relationships and attachment to community are a critical source of
determining tourism development and its sustainability.
Therefore, this study applied the concept of place attachment in investigating
tourism stakeholders’ supporting of tourism development. It is interesting to note that if
tourism stakeholders have a high attachment to their community, they may have strong
preferences about tourism development.
49
CHAPTER III
RESEARCH METHODOLOGY
INTRODUCTION
Chapter I introduces the research problem, the purpose of the study, and the
knowledge foundation of the study. Chapter II presents a review of relevant literature that
lays the groundwork for this study. This chapter (Chapter III)) details the research
methodology used in the study to empirically test the research hypotheses. The first
section begins with a discussion of the research questions and research framework. Then,
the four hypotheses empirically tested in this study follow. The second section will
provide a discussion of the statistical method (structural equation modeling) that will be
employed in this study.
In the third section, the research design and survey instrument will be described.
Specifically, the research population, sampling, and data collection method will be
defined. There is a discussion of how the constructs, as well as the variables of each
construct, were selected and operationalized in this study. The variables and scaling used
to measure the constructs will be provided in this section. The next section explains how
the measurement scale and the survey instrument were refined through the pretest
procedures, which include a discussion of the pretest sample, data collection, and the
results. Finally, the issues of the reliability and validity of the measurement scales will be
addressed.
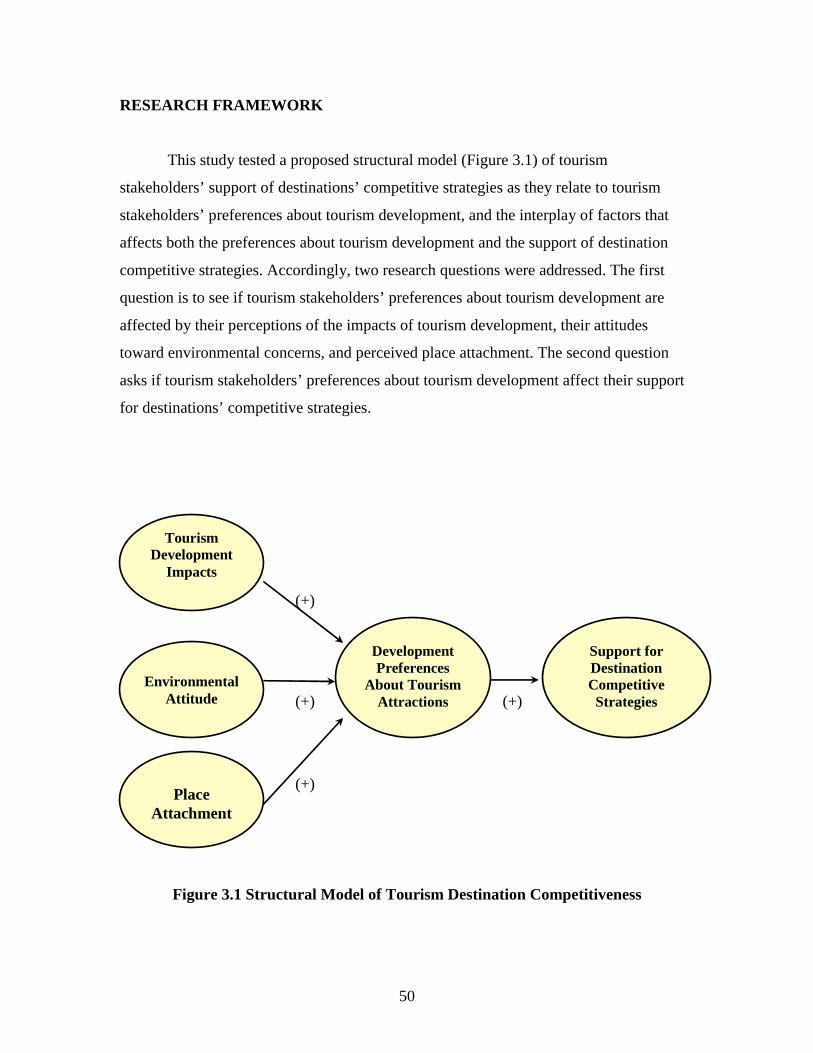
50
RESEARCH FRAMEWORK
This study tested a proposed structural model (Figure 3.1) of tourism
stakeholders’ support of destinations’ competitive strategies as they relate to tourism
stakeholders’ preferences about tourism development, and the interplay of factors that
affects both the preferences about tourism development and the support of destination
competitive strategies. Accordingly, two research questions were addressed. The first
question is to see if tourism stakeholders’ preferences about tourism development are
affected by their perceptions of the impacts of tourism development, their attitudes
toward environmental concerns, and perceived place attachment. The second question
asks if tourism stakeholders’ preferences about tourism development affect their support
for destinations’ competitive strategies.
(+)
(+) (+)
(+)
Figure 3.1 Structural Model of Tourism Destination Competitiveness
Support for Destination Competitive Strategies
Development Preferences
About Tourism Attractions
Environmental
Attitude
Place
Attachment
Tourism Development
Impacts

51
In order to achieve the objectives of the study, a thorough review of the existing
relevant literature has been performed, and subsequently, a theoretical structural model
was developed that incorporates concepts from the fields of tourism, planning, and
development. As presented in Figure 3.1, the constructs in this study include tourism
development impacts, environmental attitudes, place attachment, development
preferences about tourism attractions, and support for destination competitive strategies.
Since tourism stakeholders’ participation and involvement are essential in tourism
planning and its decision-making process, their perceptions and attitudes about tourism
are a critical source of success in tourism development. The tourism literature has
suggested that people’s preferences about tourism development are likely to be affected
by several factors. For example, if tourism stakeholders have a positive perception of
tourism development impacts, they are likely to support tourism development. If they
have high ecocentric attitudes toward environmental concerns, they are likely to support
tourism development. Additionally, if tourism stakeholders have a high attachment to
their community, they are likely to support tourism development.
A study of the existing literature provided the justification for the proposed model
that depicts the interplay of factors that are likely to directly and indirectly affect
preferences about tourism development and the support of destination competitive
strategies. Accordingly, based on the literature review, the theoretical structural
relationships among the constructs were developed, as presented in Figure 3.1. The
logical flow of the interplay of factors that affect tourism stakeholders’ preferences and
support of tourism development is described in this structural model. Each arrow at the
end of a line depicts a progressive linkage between constructs. The direction of the
arrows specifies the relationship between the constructs. Additionally, each linkage
implicitly represents a hypothesis that was empirically tested by estimating the degree of
the relationship in this study. It is also assumed that the three exogenous constructs are
not correlated with each other: tourism development impacts, environmental attitudes,
and place attachment.
In this structural model, the support of destination competitive strategies is
considered as the ultimate dependent or endogenous construct. It is thought to be affected
indirectly by the three constructs: 1) perceived tourism impacts, 2) attitudes toward
52
environmental concerns, and 3) perceived place attachment. The indirect effect of these
three constructs on the support for destination competitive strategies will be contingent
upon the manner in which they affect development preferences about tourism
attractions/resources. The total effect on support for destination competitive strategies is
comprised of both direct and indirect effects.
Another construct, the preference for tourism development, is regarded as the
mediating endogenous construct, and also plays the role of dependent variable in these
relationships. This construct also intervenes between the three exogenous constructs and
the ultimate endogenous construct. Lastly, the exogenous constructs include perceived
tourism impacts, attitudes toward environmental concerns, and perceived place
attachment. These constructs are considered to explain the development preferences
about tourism attractions/resources and support for destination competitive strategies.
The arrows lead from the exogenous constructs to the mediating construct, which is
thought to be partially explained by the preceding constructs.
As a result, the structural model in this study was empirically tested in identifying
the structural relationships among the exogenous and endogenous constructs.
Specifically, the structural model empirically examined the impacts of the exogenous
constructs of perceived tourism impacts, environmental attitudes, and perceived place
attachment on tourism stakeholders’ preferences about tourism development.
Additionally, the structural model empirically examined the impacts of tourism
stakeholders’ preferences about tourism development on tourism stakeholders’ support of
tourism destination competitive strategies. The next section will specify the research
hypotheses for this study.
RESEARCH HYPOTHESES
Four hypotheses were proposed and a structural model was tested to determine
how tourism stakeholders’ development preferences about tourism attractions/resources
affect their support for destination competitive strategies, and also how these tourism
stakeholders’ development preferences are affected by three constructs, including

53
perceived tourism impacts, attitude toward environmental concerns, and perceived place
attachment. Thus, the four hypotheses follow:
H1: There is a positive relationship between tourism stakeholders’ perceptions of the
benefits of tourism impacts and preferences about tourism attractions/resources
development.
H2: There is a positive relationship between tourism stakeholders’ environmental
attitudes and preferences about tourism attractions/resources development.
H3: There is a positive relationship between tourism stakeholders’ place attachment and
preferences about tourism attractions/resources development.
H4: There is a positive relationship between tourism stakeholders’ preferences about
tourism attractions/resources development and support for the enhancement
strategies of destination competitiveness.
STATISTICAL METHOD FOR THE HYPOTHESES TEST
The properties of the five research constructs (three exogenous and two
endogenous) in the proposed structural model (Figure 3.1) and the four hypotheses were
tested using a LISREL 8.30 and PRELIS 2.30 package for structural equation analysis
and procedures (Jöreskog & Sörbom, 1999). As an estimation method for model
evaluation and procedures, the maximum likelihood (ML) method (see in detail,
Anderson & Gerbing, 1988; Bentler, 1983; Byrne, 1998; Mueller, 1996) and the two
stage testing processes (recommended by Anderson & Gerbing, 1988; Hair, Anderson,
Tatham & Black, 1998; Sethi & King, 1994) were utilized.
Structural Equation Modeling (SEM) is designed to evaluate how well a proposed
conceptual model that contains observed indicators and hypothetical constructs explains
or fits the collected data (Bollen, 1989a & 1989b; Hoyle, 1995). It also provides the
ability to measure or specify the structural relationships among sets of unobserved
54
(latent) variables, while describing the amount of unexplained variance (Byrne, 1998;
Davies, Goode, Mazanec, & Moutinho, 1999; Hoyle, 1995; Tuner & Reisinger, 2001).
Clearly, the hypothetical model in this study was designed to measure structural
relationships among the unobserved constructs that are set up on the basis of relevant
theories and prior empirical research and results. Therefore, the SEM procedure is an
appropriate solution for testing the proposed structural model and hypotheses for this
study.
According to Byrne (1998), the SEM is “a statistical methodology that takes a
confirmatory (i.e., hypothesis-testing) approach to the multivariate analysis of a structural
theory bearing on some phenomenon” (p. 3). A structural theory is used to explain
relationships among multiple variables or constructs. The processes in structural equation
modeling are represented by a series of structural equations and relations that can be
modeled pictorially to enable a clearer conceptualization of the theory under study.
Thus, through the SEM procedure, the simultaneous examination and explanation of the
pattern of a series of inter-related dependence relationships among a set of latent
(unobserved) constructs is possible (Reisinger & Turner, 1999).
Measurement Model
Specifically, there are two distinct components in structural equation modeling:
1) the measurement model and 2) the structural equation model. First, the measurement
model is the component of the general model in which latent constructs are prescribed.
The latent constructs are unobserved variables implied by the covariances among two or
more observed indicators (Hoyle, 1995b). By using confirmatory factor analysis for the
measurement model, a priori hypotheses regarding relationships among and between
observed indicators and their underlying latent constructs are evaluated. Thus, the
measurement model specifies the posited relationships of the observed indicators to the
latent constructs, while describing the freedom of random error and uniqueness
associated with their indicators.
According to Anderson and Gerbing (1988), confirmatory measurement models
should be evaluated and re-specified before measurement, and structural equation models

55
are examined simultaneously. Thus, before testing the measurement models overall, each
construct in the model should be analyzed separately. Further, when each construct has
an acceptable fit based on the fit indices, a pair of constructs should be evaluated in order
to confirm that the pre-specified variables or indicators driven by the theory measure
what is theoretically believed to be its underlying structure. The model is modified so that
the final model becomes a theoretically meaningful as well as a statistically acceptable
model. Furthermore, the final model represents the theoretical model of interest under the
study. After assessing the overall model, the psychometric properties of each latent
construct are evaluated separately through examining the completely standardized
loading, the error variance, the construct reliability, and the variance extracted.
Structural Model
The structural model is the hypothetical model that prescribes relationships
among latent constructs and observed variables that are not indicators of latent constructs
(Hoyle, 1995b). Generally, this model is known as the component of a general model that
relates the constructs to other constructs by providing path coefficients (parameter
values) for each of the research hypotheses. Specifically, each estimated path coefficient
can be tested for its respective statistical significance for the hypotheses’ relationships,
while including standard errors and calculated t-values (Bollen, 1989a; Byrne, 1998; Hair
et al., 1998; Loehlin, 1992).
In the structural model, a specific structure between latent endogenous and
exogenous constructs must be hypothesized, and the measurement model for latent
endogenous and exogenous constructs must be determined (Hair et al., 1998; Mueller,
1996). Commonly, maximum likelihood (ML) or generalized least squares (GLS) are
utilized for the model estimation because these methods allow for the analysis of models
involving latent constructs and non-zero error covariances across structural equations
(Kline, 1998; Mueller, 1996). If a relationship can be specified in terms of directions, a
one-tailed significance test can be employed. Otherwise, a two-tailed significance test
must be used for an unknown direction for a pre-specified relationship. If a reported t-
value is greater than a certain critical value, the null hypothesis that the associated
56
parameter is equal to zero is rejected. This t-value is determined by dividing the
appropriate coefficient by its standard error. In general, if an estimated t-value is greater
than 1.96, the parameter indicates a statistical significance for a two-tailed test at the .05
level of significance (Mueller, 1996). The coefficient is significant at the .01 level if the
t-value exceeds 2.58. Particularly, these critical values are utilized and evaluated for
testing relationships between the constructs (Beta and Gamma Coefficients).
As another evaluation for the structural model, the standardized solution, where
the estimated coefficients all have equal variances and a maximum value of 1.0, must be
examined (Bollen, 1989b; Hair et al., 1998). For the measure of the entire structural
equation, an overall coefficient of determination (R2) must be calculated for the overall
explanation of the variance. As a result, the structural model provides a meaningful and
parsimonious explanation for observed relationships within a set of measured variables
(MacCallum, 1995). The model also enables explanations of direct, indirect, and total
structural effects of the exogenous latent constructs on the endogenous constructs.
Evaluation of Structural Equation Modeling
When measurement and structural models are evaluated, three types of overall
model fit measures are usually utilized: Absolute Fit Measures (AFM), Incremental Fit
Measures (IFM), and Parsimonious Fit Measures (PFM) (Byrne, 1998; Hair et al., 1998;
Hu & Bentler, 1995; Maruyama, 1998). An absolute fit index is used to directly evaluate
how well an priori theoretical model fits the sample data, and an incremental fit index
assesses the proportionate fit by comparing a target model with a more restricted, nested
baseline model. A parsimonious fit measure is used to diagnose whether model fit has
been achieved by over-fitting the data with too many coefficients.
Among the absolute fit index commonly used to evaluate the model are the Chi-
square test (χ2), the noncentrality parameter (NCP), the root mean square residual
(RMSR), and the root mean square error of approximation (RMSEA). Because the Chi-
square is heavily influenced by the sample size (Bollen & Long, 1993), other goodness-
of-fit indices are suggested to help the model evaluation (Bentler, 1990; Jöreskog &
Sörbom, 1996a).

57
Regarding the Chi-square statistic (χ2), since a large value of χ2 relative to the
degrees of freedom indicates that there is a difference between the observed and
estimated covariance matrices with a statistically significant value (p < .05), a low Chi-
square value (χ2) should be desired. Thus, little difference between the actual and
predicted input matrices is obtained. However, it should be noted that this Chi-square
statistic is too sensitive to sample size.
As another absolute fit index, the noncentrality parameter (NCP) shows the results
of another measure of the likelihood-ratio Chi-square statistic that is less affected by or
independent of the sample size. This fit measure shows the average squared Euculidean
distances between the estimated model and the unrestricted model. Since this fit index
cannot be statistically tested, it is recommended to use this measure in making
comparisons between the alternative models. The Goodness-of-fit index (GFI) represents
the overall degree of fit, indicating a nonstatistical measure ranging in value from zero
(poor fit) to 1.0 (perfect fit). Thus, a higher score indicates a better fit. The above .95
should be desired to indicate a better fitting model.
The standardized root mean square residual, standardized RMR (SRMR)
represents the average difference between the predicted and observed variances and
covariances in the model (Hu & Bentler, 1999). The smaller the standardized RMR, the
better the model fit. Thus, when model fit is perfect, SRMR is 0.
The root mean square residual (RMSR) explains an average of the residuals
between observed and estimated input matrices and is calculated by the square root of the
mean of the squared residuals. The root mean square error of approximation (RMSEA)
represents a close approximation of fit relative to the degrees of freedom that could be
expected if the model is estimated in the population, not just from the sample drawn for
the estimation (Steiger, 1990). If a) the RMSEA point estimate is less than .05; b) the
lower and upper boundaries of confidence interval is less than the recommended values
of .05 and .08 respectively (Browne & Cudeck, 1993); and c) the probability value
associated with this test of close fit is greater than .50 (Jöreskog & Sörbom, 1996), it can
be said that the degree of approximation in the population is very small and the model fits
the data well. Thus the model is acceptable.

58
As the second class of measures provided by LISREL, the incremental fit
measures can be evaluated in order to compare the proposed model to some baseline
model. The common examples of group of this fit indexes are the adjusted goodness-of-
fit index (AGFI), the Tucker-Lewis index (TLI), the normed fit index (NFI), the relative
fit index (RFI), and the comparative fit index (CFI).
The AGFI as an extension of the GFI is adjusted by the ratio of degrees of
freedom for the proposed model to the degrees of freedom for the null model. It is
recommended that a value greater than or equal to .95 is an acceptable level for a good
fit. The TLI, known as the Non-normed fit index (NNFI), is used for evaluating factor
analysis and can also be used for comparisons between alternative models by substituting
the alternative model for the null model. It is also recommended that a value greater than
or equal to .95 is an acceptable level for a good fitting model. The NFI, RFI, and CFI are
also used for a relative comparison of the proposed model to the null model or
independent model, which ranges from zero (poor fit or no fit at all) to 1.0 (perfect fit). It
is suggested that a good fitting model will obtain a value greater to or equal to .95. Thus,
larger values indicate higher levels of goodness-of-fit.
As the third class of measure, the parsimonious fit measures include the
parsimonious normed fit index (PNFI) and parsimonious goodness-of-fit index (PGFI).
These measures were used to evaluate whether model fit has been obtained by “over
fitting” the data with too many coefficients. The PNFI explains the number of degrees of
freedom used to achieve a level of fit. Higher values of the PNFI are better. The PGFI
takes into account the complexity of the hypothesized model in the assessment of the
overall fit. Typically, a PGFI value larger than .50 is an accepted value of a good model
fit (Byrne, 1998).
Lastly, as another general model evaluation fit index, the Hoelter’s Critical N
(CN) can be used for evaluating the adequacy of model fit. In particular, the purpose of
the CN is to estimate a sample size that would be sufficient to yield an adequate model fit
for an χ2 test (Hu & Bentler, 1995). Hoelter (1983) proposed that a CN value in excess of
200 is indicative of a model that adequately represents the sample data.
59
RESEARCH DESIGN
Study Population
Population can be defined as the entire group under study as specified by the
objective of the research (Burns & Bush, 1998; Pedhazur & Schmelkin, 1991). Since the
objective of this study was to investigate tourism stakeholders’ perceptions, attitudes, and
behavior toward tourism and its development, the population of this study was tourism
stakeholders. Specifically, the target population includes members or groups that are
related to chambers of commerce, state and local government officials, tourism
authorities, local tourism agencies, non-government organizations, tourism related
associations and councils, convention and visitors bureaus, tourism planning and
development companies, tourism related faculty and professionals, local and state parks,
local tourism attractions, and visiting and information centers in the state of Virginia.
Sampling
Sampling is a procedure that uses a small number of units of a given population as
a basis for drawing conclusions about the whole population (Pedhazur & Schmelkin,
1991; Zikmund, 1997). Sampling is an important method for increasing the validity of the
collected data and ensuring that the sample is representative of a population. The sample
(tourism stakeholders) for this study was collected by a simple random sampling method
from the identified sampling frame.
The major source of the sampling frame was identified from “Associations
Unlimited, the Encyclopedia of Associations (EA) series,” which has, for over 40 years,
been the premier source for information on associations and professional societies. The
EA series contains more than 158,000 detailed listings for organizations all over the
world and especially, it includes 115,00 listings for U.S. regional, state, and local
associations, and 300,000 for non-profit organizations. However, it should be noted that
since this study covered only the state of Virginia, lists relating only to Virginia were
extracted from the above database.

60
In order to get lists of respondents’ mailing addresses, the detailed subject
category, “chambers of commerce, trade and tourism organizations” was chosen from the
above database at the Virginia Tech library. This database provides full lists of chambers
of commerce, which cover the entire state of Virginia. Accordingly, possible respondents
were identified from homepages of chambers of commerce and their internet-links such
as tourism and economic development, local and state parks, outdoor recreation parks and
facilities, town and city offices, and advisor boards and councils.
Another source of mailing lists was from the local economic development office
located in Blacksburg, Virginia. This mailing information contains over 900 Destination
Management Organization (DMO) lists for Virginia tourism stakeholders. These lists
were recoded from annual tourism symposia and conferences. As another source, the
internet homepage of the Virginia Tourism Corporation (http://www.vatc.org/) provided
directories and resources about tourism stakeholders. For example, it provided lists of
convention & visitors bureaus, local/regional visitor centers, Virginia destination
marketing organizations, and local & state tourism attractions and places. Once tourism
stakeholders were identified, their qualifications were examined according to their
representation of the target population, and it was determined whether or not they would
be included in the sampling frame for this study.
Sample Size
This study employed Structural Equation Modeling (SEM) to test the proposed
structural model and hypotheses. Since the number of observations is a critical issue for
any statistical analysis and its assumption tests, and also is a crucial factor in determining
the extent to which the procedures of the currently existing model evaluation can be
reliable, the sample size should be addressed.
In general, there is no correct sample size in the absolute sense, and larger
samples are always preferable. However, it is suggested in SEM that it is acceptable if a
minimum ratio of at least 5 respondents for each estimated parameter can be achieved
(Hatcher 1994) and also, it is more appropriate if a ratio of 10 respondents per parameter
is obtained (Hair, Andesrson, Tatham, & Black, 1998). However, there are a number of
61
factors that impact the sample size requirements, including model misspecification,
model size, departures from normality, and estimation procedure (Hair et al. 1998). For
example, the ratio of respondents to parameters should increase with a ratio of 15
respondents for each parameter if the data have some violation of multivariate normality.
As a result, it is recommended that for a maximum likelihood estimation (MLE) as the
most common estimation procedure, a sample size of 200 is appropriate.
More specifically, since the acceptable level of the final model in SEM is
evaluated based on the fit indices, determination of sample size follows previous study
results and suggestions. Several studies have reported that there is an association between
sample size and the model fit indices, including the incremental fit indices and the
absolute fit indices (Anderson & Gerbing, 1984; Bollen, 1989a, 1989b; Hu & Bentler,
1995). As a result, the model and number of fit indices such as GFI, AGFI, NNFI, CFI
(or BFI), and CN are relatively and consistently stable across the MLE method at a
sample size of 250 or greater when the latent constructs are independent.
Therefore, in order to achieve the objectives of the study, using SEM, if a usable
sample size of 300 or greater is obtained, the solution for the final structural model will
be acceptable. Thus, the target usable sample size for this study was at least 300.
However, in a mail survey method, it is often found that the response rate tends to be low
thereby leading to the potential problem of generalizing the results. Usually, the response
rate varies in a range between 10% and 50%, depending upon the study design, sample,
and study site. Particularly, according to late studies on residents perceptions of tourism
development in Virginia (e.g., Yoon, 1998; Yoon, Chen, & Dogan, 2000), the response
rate has been less than 15%.
Therefore, in order to meet the sample size for this study, a total of 3,100 survey
questionnaires were mailed to the target population, which is tourism stakeholders in the
state of Virginia. Consequently, the questionnaires were distributed and collected in June
and July, 2002.

62
Data Collection
This study utilized a self-administered survey method. Once the final
measurement scales and the survey questionnaire were developed, the survey package
that included a cover letter and survey questionnaire was sent to the selected tourism
stakeholders in Virginia. However, prior to collecting the main data for the study, a pilot
study was conducted to test the measurement scales and survey questionnaire in order to
improve clarity and readability.
Pre-test and Procedures for the Survey Instrument
Once an initial measurement scale and survey questionnaire was developed based
on an extensive literature review and the objectives of the study, the initial pretest survey
questionnaire was circulated to several faculty members and graduate students in the
Department of Hospitality and Tourism Management at Virginia Polytechnic Institute
and State University. The purpose of this procedure was to determine if there was a
necessity for revision of the survey design, layout, wording, and if it was necessary to
clarify any ambiguous measurement items. Participants were encouraged to provide their
feedback and comments about the initially developed survey questionnaire, and then such
suggestions were taken into account in the revision of the questionnaire.
Next, with the first revised measurement scales and questionnaire, a focus group
interview was conducted. A total of 10 tourism stakeholders from the sampling frame
were selected and asked if they understood the questions and if anything was left out that
they felt should have been included. Additionally, they were asked to provide any
suggestions regarding survey design, layout, and wording. Their comments and
suggestions were incorporated into the design of the questionnaire used in the pilot study.
This procedure further clarified the measurement scales and survey questionnaire. Once
the final measurement scales and design of the survey questionnaire were confirmed
through the above procedures, the main survey questionnaires were delivered to the
randomly selected tourism stakeholders according to the sampling procedures.

63
MEASUREMENT SCALES AND INSTRUMENTS
The theoretical model of this study was designed to empirically test the structural
relationships among three exogenous constructs: tourism development impacts,
environmental attitudes, and place attachment, one mediate endogenous construct:
preferences about tourism attractions/resources development, and one ultimate
endogenous construct: support for destination competitiveness strategies. In this model,
the exogenous constructs are considered as predictors for the other constructs in the
model. The endogenous construct is the dependent or outcome construct in at least one
structural relationship (Hair et al., 1998).
A construct, usually called a latent variable, is a hypothesized and unobserved
concept that can only be measured by observable or measurable variables (Bollen, 1989a;
Hair et al., 1998). The measurement variables or scales are collections of items intended
to reveal levels of theoretical variables to measure the construct (Devellis, 1991).
Accordingly, the measurement scales are developed to measure phenomena that are
believed to exist because of a theoretical underpinning or observations, but cannot be
assessed directly. As a result, this measurement enables one to assign numerals to objects,
events, or observable phenomena with different degrees of a quality or property (Duncan,
1984).
The measurement scales for this study were developed based on the literature
review and relevant theories, previous empirical studies and results, and observations and
experiences of the given phenomena. The following section will detail the measurement
scales and the items used in measuring all the constructs in this study.
64
Exogenous Constructs
Measurement of Tourism Development Impacts
An initial measurement scale for assessing tourism development impacts was
adapted from Yoon (1998), Yoon, Chen and Gursoy (1999), and Yoon, Gursoy, and Chen
(2000), which was developed based on studies by Liu and Var (1986) and Akis,
Peristainis, and Waner (1996).
The original scale consisted of tourism impact items representative of tourism’s
economic, social, cultural, physical, and environmental impacts. The study done by Yoon
(1998) reported .79 of internal consistency of reliability on the scale (twenty four items).
This study investigated residents’ perceptions of tourism development in Williamsburg
and Virginia Beach areas. Additionally, the structural relationships with total impacts and
support for tourism development were identified in the study (Yoon et al., 2000) and all
dimensions of tourism impacts were directly and indirectly associated with the total
impacts and support for tourism development.
As a result, fourteen statements about tourism development impacts based on the
results of the study done by Yoon (1998) and Yoon et al. (1999) were adapted for the
measurement scale. The items were chosen if significant relationships with their
corresponding variables or constructs were identified. The statements and hypothesized
measurement model for tourism development impacts are shown in Table 3.1 and Figure
3.2, respectively. A five-point Likert scale was used as the response format with
assigned values ranging from 1 = strongly disagree to 5 = strongly agree. The reliability
of this measurement scale is reported in the result section, Chapter 4.

65
Table 3.1
Measurement of Tourism Development Impacts
1. Tourism has created more jobs for your community.
2. Tourism has attracted more investment to your community.
3. Our standard of living has increased considerably because of tourism.
4. Tourism has given economic benefits to local people and small businesses.
5. High-spending tourists have negatively affected our way of life.
6. Tourism has changed our precious traditional culture.
7. Local residents have suffered from living in a tourism destination area.
8. Tourism has encouraged a variety of cultural activities by the local residents.
9. Tourism has resulted in more cultural exchange between tourists and residents.
10. Tourism has resulted in positive impacts on the cultural identity of our community.
11. Tourism has resulted in traffic congestion, noise, and pollution.
12. Construction of hotels and other tourist facilities have destroyed the natural
environment.
13. Tourism has resulted in unpleasantly overcrowded beaches, hiking trails, parks and
other outdoor places in our community.
14. Tourism provides more parks and other recreational areas for local residents.
Note: 1 = Strongly disagree, 2 = Disagree, 3 = Neither disagree nor agree, 4 = Agree, and 5 = Strongly agree
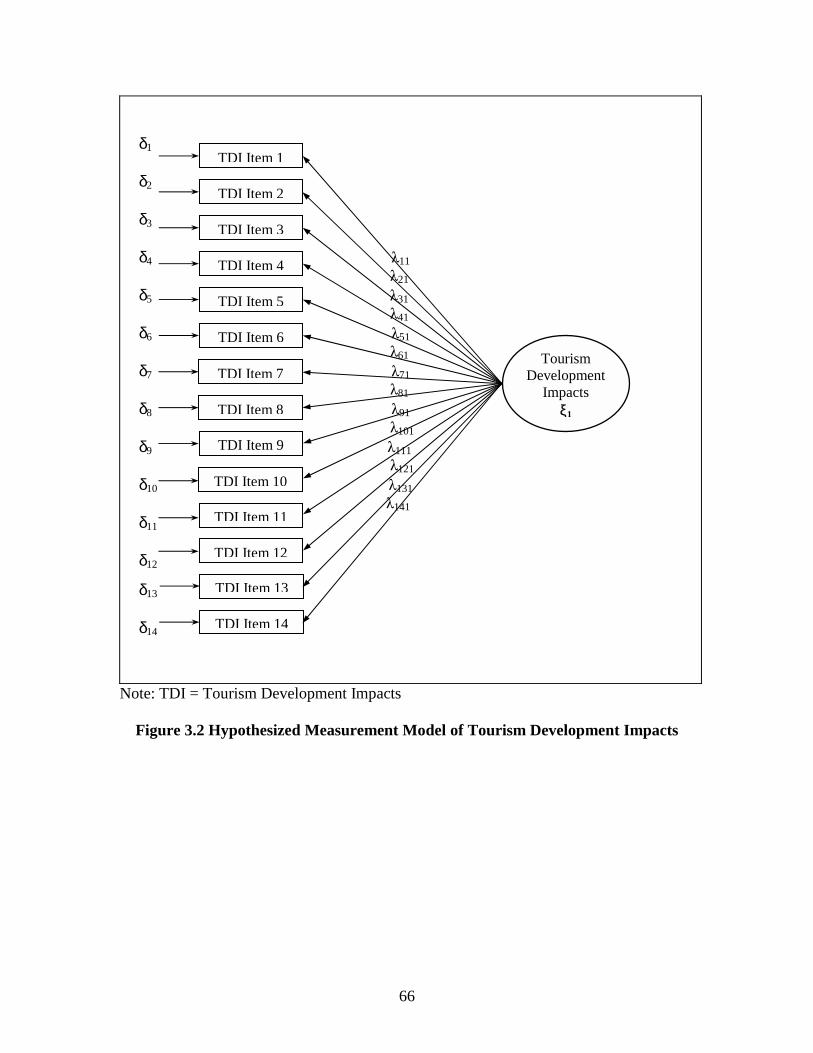
66
δ1 δ2 δ3 δ4 λ11 λ21 δ5 λ31 λ41 δ6 λ51 λ61 δ7 λ71
λ81 δ8 λ91
λ101 δ9 λ111 λ121 δ10 λ131 λ141 δ11 δ12
δ13 δ14
Note: TDI = Tourism Development Impacts
Figure 3.2 Hypothesized Measurement Model of Tourism Development Impacts
TDI Item 1
TDI Item 2
TDI Item 3
TDI Item 4
TDI Item 5
TDI Item 6
TDI Item 7
TDI Item 8
TDI Item 9
TDI Item 10
TDI Item 11
TDI Item 12
TDI Item 13
TDI Item 14
Tourism Development
Impacts ξ1

67
Measurement of Environmental Attitudes
The scale for measuring environmental concerns and attitudes was adapted from
Dunlap, Van Liere, Mertig, and Jones (2000). The scale consists of 15 items that were
designed to measure the ecological world view called the “new environmental paradigm”
(NEP). It is mainly a measure of endorsement of a world-view, environmental attitudes
and values founded on ecological principles, and comprises two domain attitudes:
ecocentric and anthropocentric (low ecocentric or high ecocentric attitudes). The basic
theme of an ecocentric attitude is that humans must live in harmony with nature and that
there are limits to the capacity of the natural environment to absorb the growth of human
activities. In contrast, the anthropocentric attitude about environments expresses the
feeling that nature lacks inherent value and exists primarily to serve the needs of
mankind.
This scale has been widely employed in different areas of research, including
environmental, natural resources, and rural planning (Dunlap, Van Liere, Mertig, &
Jones, 2000; Fransson & Garling, 1999). The studies have provided support for the
validity of the scale. For example, Kempton, Boster, and Hartely (1995) in their study
discussed content validity of the scale in providing the major facets of the NEP: balance
of nature, limits of growth, and human domination over nature (in Dunlap et al., 2000).
Predictive and criterion validity were identified based on several studies (e.g. Scott &
Willits, 1994; Tarrant & Cordell, 1997; Vining & Ebreo, 1992; Zeller & Carmines,
1980). In terms of construct validity, the study by Stern, Dietz, and Guagnano (1995)
empirically confirmed that the NEP scale forms theoretical components, along with
fundamental values, about environmental belief systems.
In the tourism context, a number of tourism researchers also have frequently
utilized the NEP measurement scale to evaluate their respondents’ environmental values
and attitudes (Crick-Furman & Prentice, 2000; Jurowski, Uysal, Williams, 1997;
Silverberg, Backman, & Backman, 1996; Uysal, Jurowski, Noe, & McDonald, 1994). In
a study by Jurowski (1994), the reliability of this scale was explained by a Cronbach’s
Alpha of .82. Particularly, Uysal et al. (1994) found support for the content and predictive
validity of the NEP scale. It was found that there was a correlation between preferences

68
for management actions and the NEP scales. For example, higher anthropocentric
attitudes were associated with preferences for improvement of beach and resort
amenities. Additionally, Jurowski et al. (1997) found that higher ecocentric attitudes were
associated with respondents’ support for nature-based tourism. Thus, since this
measurement scale has solid content, predictive, and construct validity, this study
employed this measurement scale for measuring tourism stakeholders’ attitudes about
their environment. As presented in Table 3.2 and Figure 3.3, the respondents were asked
to indicate the degree of their agreement with 12 statements, using a five-point Likert
scale as the response format, with assigned values ranging from 1 = strongly disagree to 5
= strongly agree. A high score on this scale means an indication of a highly ecocentric
attitude.
Table 3.2
Measurement of Environmental Attitudes
1. We are approaching the limit of the number of people the earth can support.
2. Humans have the right to modify the natural environment to suit their needs.
3. When humans interfere with nature, it often produces disastrous consequences.
4. Human ingenuity will insure that we do not make the earth unlivable.
5. Mankind is severely abusing the environment.
6. The earth has plenty of natural resources if we just learn how to develop them.
7. Plants and animals have as much of a right to exist as humans.
8. The balance of nature is strong enough to cope with the impacts of modern industrial nations.
9. Despite our special abilities, humans are still subject to the laws of nature.
10. The so-called “ecological crisis” facing humanity has been greatly exaggerated.
11. The earth is like a spaceship with only limited room and resources.
12. Humans were meant to rule over the rest of nature.
13. The balance of nature is very delicate and easily upset.
14. Humankind will eventually learn enough about how nature works to be able to control it.
15. If things continue on their present course, we will soon experience a major ecological catastrophe.
Note: 1 = Strongly disagree, 2 = Disagree, 3 = Neither disagree nor agree, 4 = Agree,
and 5 = Strongly agree

69
δ1 δ2 δ3 δ4 λ11 λ21 δ5 λ31 λ41 δ6 λ51 λ61 δ7 λ71
λ81 δ8 λ91
λ101 δ9 λ111 λ121 δ10 λ131 λ141 δ11 λ151 δ12 δ13 δ14 δ15
Note: EA = Environmental Attitudes
Figure 3.3 Hypothesized Measurement Model of Environmental Attitudes
EA Item 1
EA Item 2
EA Item 3
EA Item 4
EA Item 5
EA Item 6
EA Item 7
EA Item 8
EA Item 9
EA Item 10
EA Item 11
EA Item 12
EA Item 13
EA Item 14
Environmental Attitudes
ξ2
EA Item 15
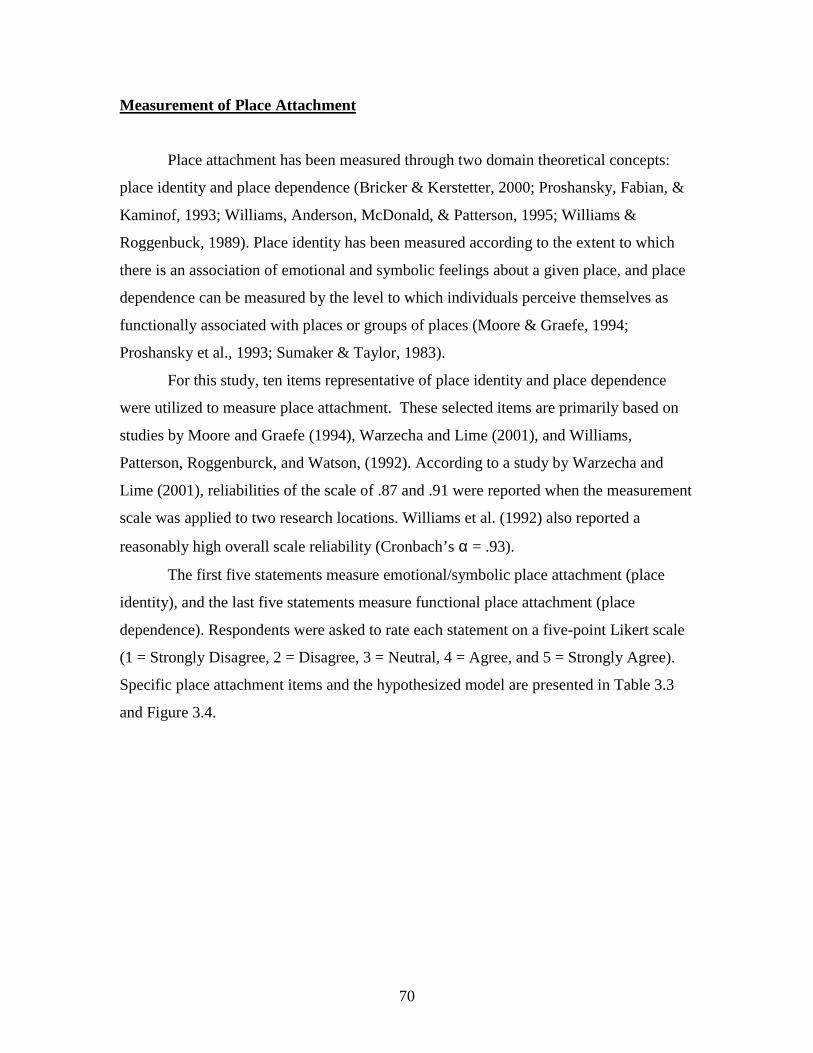
70
Measurement of Place Attachment
Place attachment has been measured through two domain theoretical concepts:
place identity and place dependence (Bricker & Kerstetter, 2000; Proshansky, Fabian, &
Kaminof, 1993; Williams, Anderson, McDonald, & Patterson, 1995; Williams &
Roggenbuck, 1989). Place identity has been measured according to the extent to which
there is an association of emotional and symbolic feelings about a given place, and place
dependence can be measured by the level to which individuals perceive themselves as
functionally associated with places or groups of places (Moore & Graefe, 1994;
Proshansky et al., 1993; Sumaker & Taylor, 1983).
For this study, ten items representative of place identity and place dependence
were utilized to measure place attachment. These selected items are primarily based on
studies by Moore and Graefe (1994), Warzecha and Lime (2001), and Williams,
Patterson, Roggenburck, and Watson, (1992). According to a study by Warzecha and
Lime (2001), reliabilities of the scale of .87 and .91 were reported when the measurement
scale was applied to two research locations. Williams et al. (1992) also reported a
reasonably high overall scale reliability (Cronbach’s α = .93).
The first five statements measure emotional/symbolic place attachment (place
identity), and the last five statements measure functional place attachment (place
dependence). Respondents were asked to rate each statement on a five-point Likert scale
(1 = Strongly Disagree, 2 = Disagree, 3 = Neutral, 4 = Agree, and 5 = Strongly Agree).
Specific place attachment items and the hypothesized model are presented in Table 3.3
and Figure 3.4.
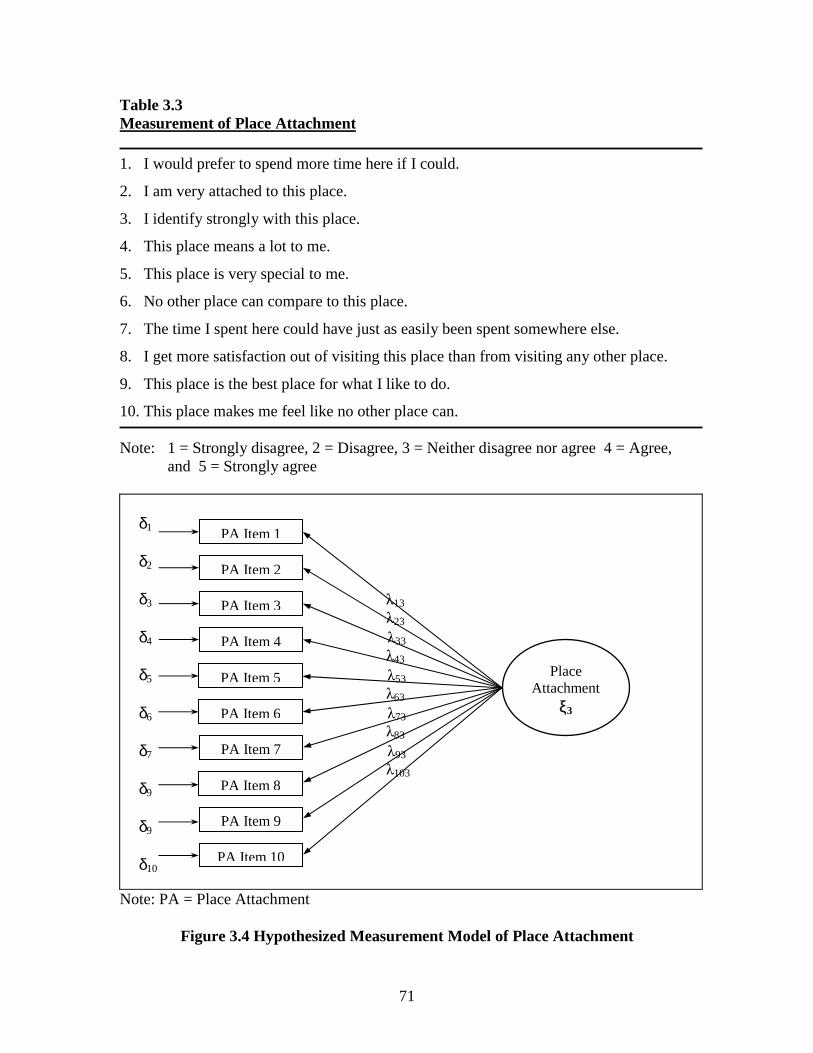
71
Table 3.3 Measurement of Place Attachment
1. I would prefer to spend more time here if I could.
2. I am very attached to this place.
3. I identify strongly with this place.
4. This place means a lot to me.
5. This place is very special to me.
6. No other place can compare to this place.
7. The time I spent here could have just as easily been spent somewhere else.
8. I get more satisfaction out of visiting this place than from visiting any other place.
9. This place is the best place for what I like to do.
10. This place makes me feel like no other place can.
Note: 1 = Strongly disagree, 2 = Disagree, 3 = Neither disagree nor agree 4 = Agree, and 5 = Strongly agree
δ1 δ2 δ3 λ13 λ23 δ4 λ33 λ43 δ5 λ53
λ63 δ6 λ73
λ83 δ7 λ93 λ103 δ9 δ9 δ10
Note: PA = Place Attachment
Figure 3.4 Hypothesized Measurement Model of Place Attachment
PA Item 1
PA Item 2
PA Item 3
PA Item 4
PA Item 5
PA Item 6
PA Item 7
PA Item 8
PA Item 9
PA Item 10
Place
Attachment ξ3
72
Mediating Endogenous Construct
Measurement of Development Preferences about Destination Attractions
In order to measure tourism stakeholders’ preferences about destination attraction
development, a total of 12 items were adapted from previous studies that measured host
communities’ support of tourism development (Jurowski, 1994; Yoon, 1998; Yoon et al.,
2000).
This scale includes six different types of tourism attractions, including: 1) nature-
based tourism, 2) attractions designed for large numbers of tourists, 3) cultural or historic
based tourism, 4) culture and folk events, 5) supporting visitor services, and 6)
event/outdoor programs. The six tourism attractions consist of the following items: 1)
improved transportation, roads, and access facilities, 2) information for tourists, 3) pre-
arranged travel packages, 4) recreation/sports facilities, 5) small and independent
businesses, and 6) nature programs.
In a study by Jurowski (1994), who proposed and tested the original tourism
attraction development scale, the internal consistent reliability was .88. In a study by
Yoon et al. (2000), the construct reliability and variance of this construct were .76 and
.52, respectively. The construct contained three attraction items, including large scale
attractions, event/outdoor programs, and supporting service development.
As a result, this measurement scale consists of 12 representative tourism
attractions, as shown in Table 3.4 and Figure 3.4. Tourism stakeholders were asked to
indicate their degrees of preferences about tourism attraction development. A five point
Likert scale as a response format was assigned, with 1 being “Don’t at all prefer” and 5
being “Highly prefer.”
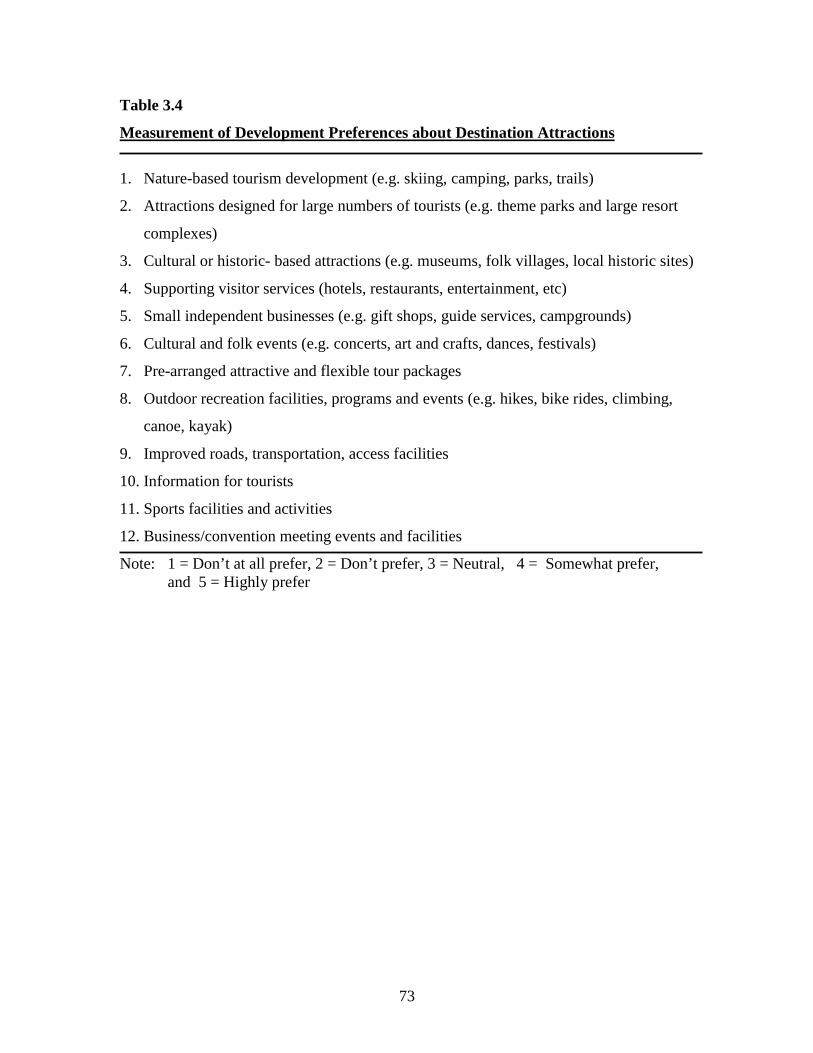
73
Table 3.4
Measurement of Development Preferences about Destination Attractions
1. Nature-based tourism development (e.g. skiing, camping, parks, trails)
2. Attractions designed for large numbers of tourists (e.g. theme parks and large resort
complexes)
3. Cultural or historic- based attractions (e.g. museums, folk villages, local historic sites)
4. Supporting visitor services (hotels, restaurants, entertainment, etc)
5. Small independent businesses (e.g. gift shops, guide services, campgrounds)
6. Cultural and folk events (e.g. concerts, art and crafts, dances, festivals)
7. Pre-arranged attractive and flexible tour packages
8. Outdoor recreation facilities, programs and events (e.g. hikes, bike rides, climbing,
canoe, kayak)
9. Improved roads, transportation, access facilities
10. Information for tourists
11. Sports facilities and activities
12. Business/convention meeting events and facilities
Note: 1 = Don’t at all prefer, 2 = Don’t prefer, 3 = Neutral, 4 = Somewhat prefer, and 5 = Highly prefer
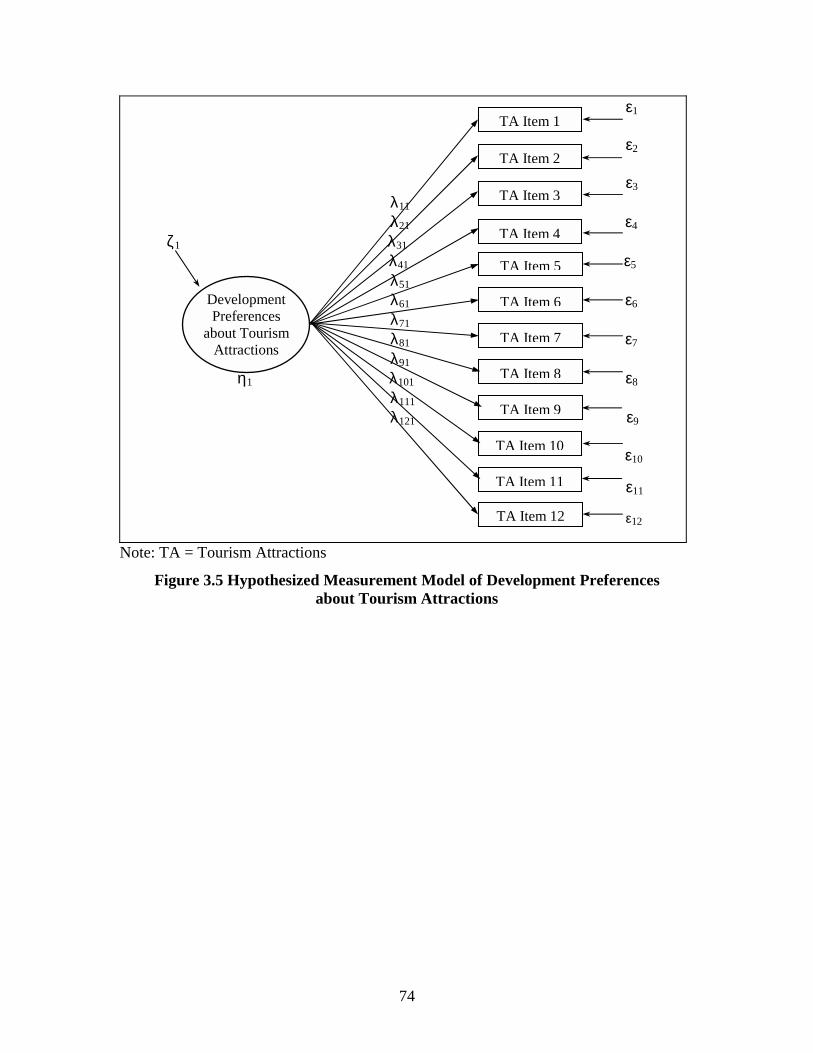
74
ε1 ε2 ε3 λ11 λ21 ε4 ζ1 λ31 λ41 ε5 λ51 λ61 ε6 λ71 λ81 ε7 λ91 η1 λ101 ε8 λ111 λ121 ε9 ε10 ε11
ε12
Note: TA = Tourism Attractions
Figure 3.5 Hypothesized Measurement Model of Development Preferences about Tourism Attractions
TA Item 1
TA Item 2
TA Item 3
TA Item 4
TA Item 5
TA Item 7
TA Item 8
TA Item 9
Development Preferences
about Tourism Attractions
TA Item 6
TA Item 10
TA Item 11
TA Item 12
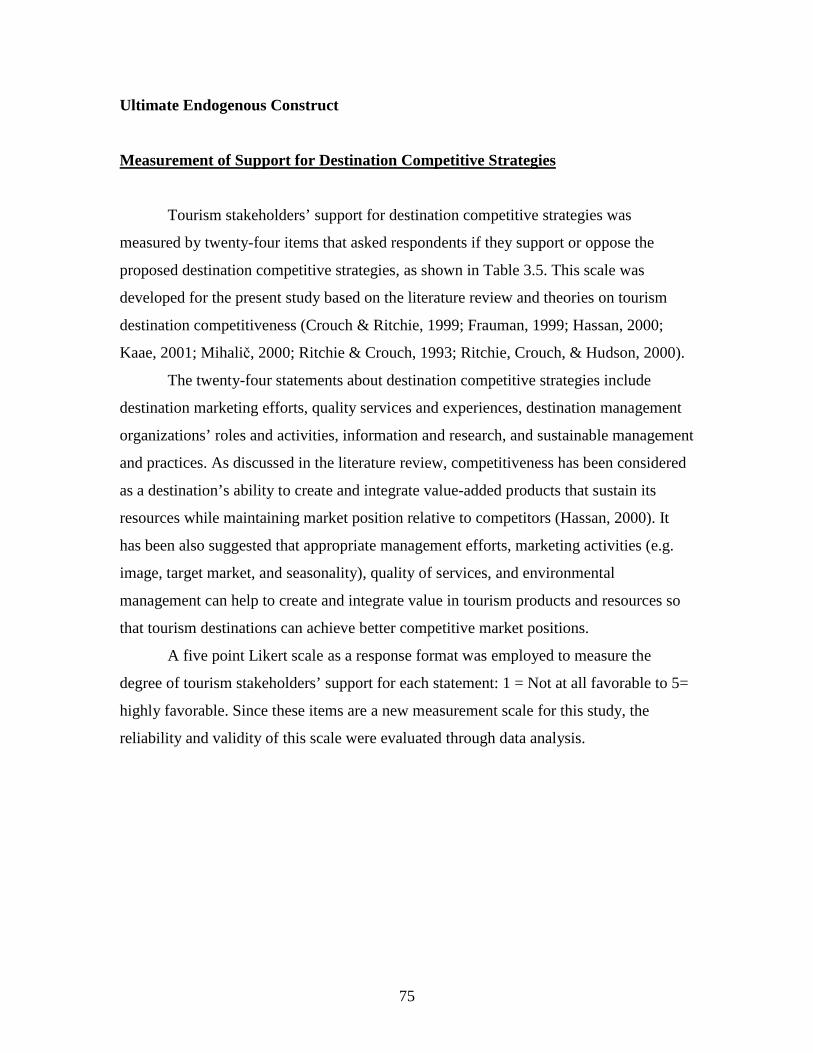
75
Ultimate Endogenous Construct
Measurement of Support for Destination Competitive Strategies
Tourism stakeholders’ support for destination competitive strategies was
measured by twenty-four items that asked respondents if they support or oppose the
proposed destination competitive strategies, as shown in Table 3.5. This scale was
developed for the present study based on the literature review and theories on tourism
destination competitiveness (Crouch & Ritchie, 1999; Frauman, 1999; Hassan, 2000;
Kaae, 2001; Mihalič, 2000; Ritchie & Crouch, 1993; Ritchie, Crouch, & Hudson, 2000).
The twenty-four statements about destination competitive strategies include
destination marketing efforts, quality services and experiences, destination management
organizations’ roles and activities, information and research, and sustainable management
and practices. As discussed in the literature review, competitiveness has been considered
as a destination’s ability to create and integrate value-added products that sustain its
resources while maintaining market position relative to competitors (Hassan, 2000). It
has been also suggested that appropriate management efforts, marketing activities (e.g.
image, target market, and seasonality), quality of services, and environmental
management can help to create and integrate value in tourism products and resources so
that tourism destinations can achieve better competitive market positions.
A five point Likert scale as a response format was employed to measure the
degree of tourism stakeholders’ support for each statement: 1 = Not at all favorable to 5=
highly favorable. Since these items are a new measurement scale for this study, the
reliability and validity of this scale were evaluated through data analysis.

76
Table 3.5
Measurement of Destination Competitive Strategies
1. The development of a strong destination image.
2. The selection of appropriate target markets (tourist groups).
3. The development of strong linkages with tourism wholesalers and retailers.
4. Overcoming seasonality (peak and off-season) in tourist’ visits.
5. Increasing tourists’ length of stay.
6. Use of modern, advanced technology and information systems.
7. Tourism promotion and operation for targeting international tourists and visitors.
8. Increasing tourists’ spending.
9. The establishment of standards for tourism facilities.
10. Both education and training programs for present and future industry personnel.
11. Establishing the cost of providing different levels of quality for various types of tourism experiences.
12. Local government and agencies’ roles as facilitator for tourism development here.
13. The leadership roles of local government and agencies in marketing this region as a tourism destination.
14. The development of safety and security programs and systems for tourists and the
tourism community. 15. Collecting information which inventories a destination’s products and services.
16. An inventory of information to monitor the attitudes of the local population towards the tourism industry.
17. Research that aids the development of new tourist services.
18. Protecting and improving more wildlife habitat.
19. Promoting ethical responsibility towards the natural environment.
20. Expanding educational opportunities for the visiting public in terms of natural/environmental quality and protection.
21. Encouraging local citizen participation in decision-making about tourism
development. 22. Sensible use of natural resources.
23. Environmental considerations in the marketing of tourism.
24. Environmental training of tourism staff.
Note: 1 = Not at all favorable, 2 = Unfavorable, 3 = Neutral, 4 = Favorable, and 5= Highly favorable
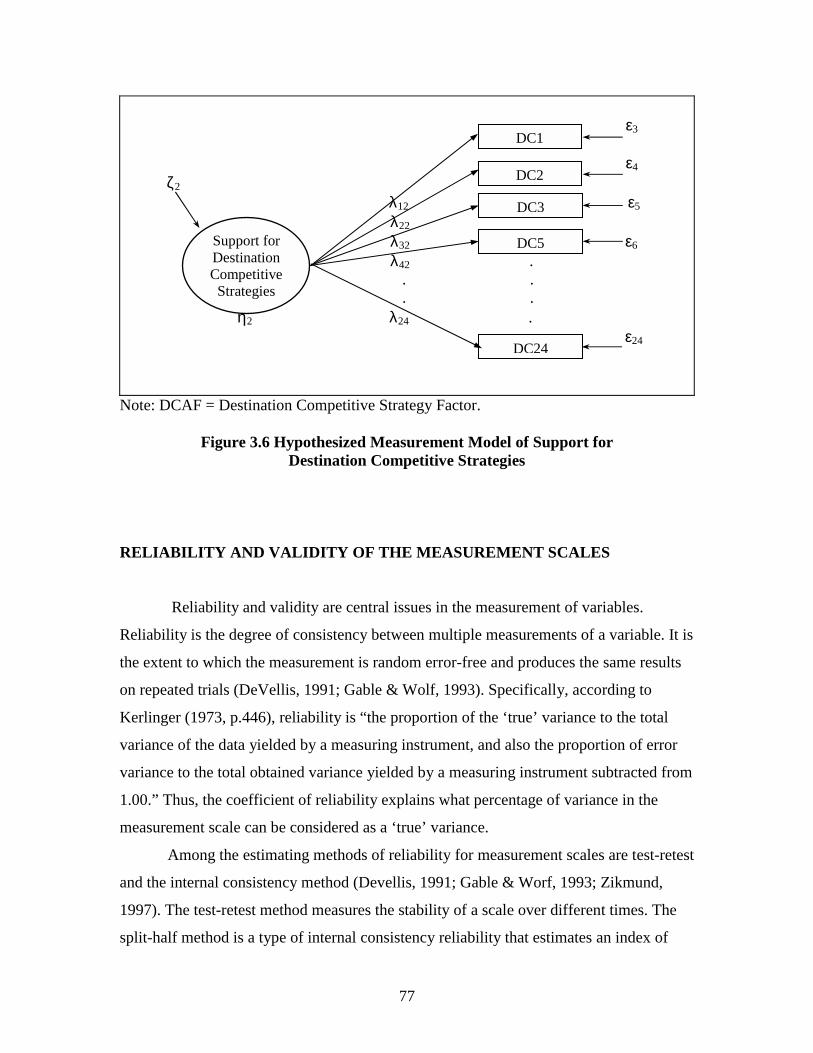
77
ε3 ε4 ζ2 λ12 ε5 λ22 λ32 ε6 λ42 . . . . . η2 λ24 . ε24
Note: DCAF = Destination Competitive Strategy Factor.
Figure 3.6 Hypothesized Measurement Model of Support for Destination Competitive Strategies
RELIABILITY AND VALIDITY OF THE MEASUREMENT SCALES
Reliability and validity are central issues in the measurement of variables.
Reliability is the degree of consistency between multiple measurements of a variable. It is
the extent to which the measurement is random error-free and produces the same results
on repeated trials (DeVellis, 1991; Gable & Wolf, 1993). Specifically, according to
Kerlinger (1973, p.446), reliability is “the proportion of the ‘true’ variance to the total
variance of the data yielded by a measuring instrument, and also the proportion of error
variance to the total obtained variance yielded by a measuring instrument subtracted from
1.00.” Thus, the coefficient of reliability explains what percentage of variance in the
measurement scale can be considered as a ‘true’ variance.
Among the estimating methods of reliability for measurement scales are test-retest
and the internal consistency method (Devellis, 1991; Gable & Worf, 1993; Zikmund,
1997). The test-retest method measures the stability of a scale over different times. The
split-half method is a type of internal consistency reliability that estimates an index of
DC1
DC2
DC3
DC24
Support for Destination Competitive Strategies
DC5

78
reliability for measures of a concept that are divided into two equal parts. The internal
consistency method as the more commonly used measure for reliability, assesses the
homogeneity of the single-factoredness of the measurement scale, and analyzes the
variance-covariance components of the measures of a construct. This method evaluates
the ability of scale items to highly correlate with other items of the same scale that are
supposed to measure the same construct.
Additionally, since this study employed structural equation modeling as a
statistical method, the composite reliability was calculated for assessing the reliability of
a principle measure of each construct in the measurement model. The reliability extracted
for a latent construct was assessed separately for each multiple indicator construct in the
model through LISREL estimating procedures (Bollen, 1989b; Hair et al., 1998; Muller,
1996).
A commonly used cut-off point for composite construct reliability is .70 (Hair,
Anderson, Tatham, & Black, 1998; Gable & Wolf, 1993). However, values below .70
could be acceptable if the study is exploratory in nature. As another evaluation method
for construct reliability, the variance extracted measure can be calculated to explain the
overall variance in the indicators accounted for by the latent construct. A higher variance
extracted value explains that the indicators are truly representative of the latent construct,
and is recommended to exceed .50 (Hair et al., 1998).
The formulas for construct reliability and variance extracted are as follows.
Construct Reliability (Sum of standardized loadings)2
= (Sum of standardized loadings)2 + Sum of indicator measurement error Variance Extracted Sum of squared standardized loadings = Sum of squared standardized loadings + Sum of indicator measurement error

79
Validity refers to the appropriateness, meaningfulness, and usefulness of the
specific inferences and actions based on test scores (Gable & Wolf, 1993). It is also
considered as the degree of fit between a construct and indicators, and how well the
conceptual and operational definition of the measurements and indicators match what
they are designed to measure (Newman, 1994; Rosenthal & Rosnow, 1984). Validity
deals with the adequacy of a scale and its ability to predict specific events, or its
relationship to measures of other constructs (Devellis, 1991).
Among the various kinds of evidence used to support construct validity are
face/content validity (item sampling adequacy or the agreement among professionals that
the item is measuring what it is supposed to measure), criterion-related validity (the
degree of correspondence between a measure and a criterion variable, usually measured
by their correlation), and construct validity (the ability of a measure to confirm a network
of related hypotheses generated from a theory based on the constructs) (Bollen, 1989b;
Devellis, 1991; Zikumund, 1998).
In criterion-related validity, two types of validity are included: predictive validity
(if the criterion variable occurs in the future) and concurrent validity (when the criterion
exists at the same time as the measurement scale). In construct validity, convergent
validity (the degree to which two measures of the same concept are correlated) and
discriminant validity (the degree to which two conceptually similar concepts are distinct)
are included (Hair et al., 1998; Hatcher, 1994). In other words, convergent validity is
associated with the degree of agreement among the measures of a concept, while
discriminant validity is related to the degree of uniqueness of a construct from other
concepts. Thus, in order to have theoretical and empirical meaning within the overall
structure of the theory used, construct validity must be evaluated.
In this study, the face/content validity was addressed by acquiring information
about the questionnaires from faculty members and graduate students who are familiar
with the concepts and content of tourism. For criterion-related validity, concurrent
validity was assessed by examining the Pearson relationship and multiple regression
between the measurement scale and criterion-variable (Table 3.6). In order to test the
concurrent validity of each measurement scale, the following variables were included and
measured in the survey questionnaire with a Likert scale.
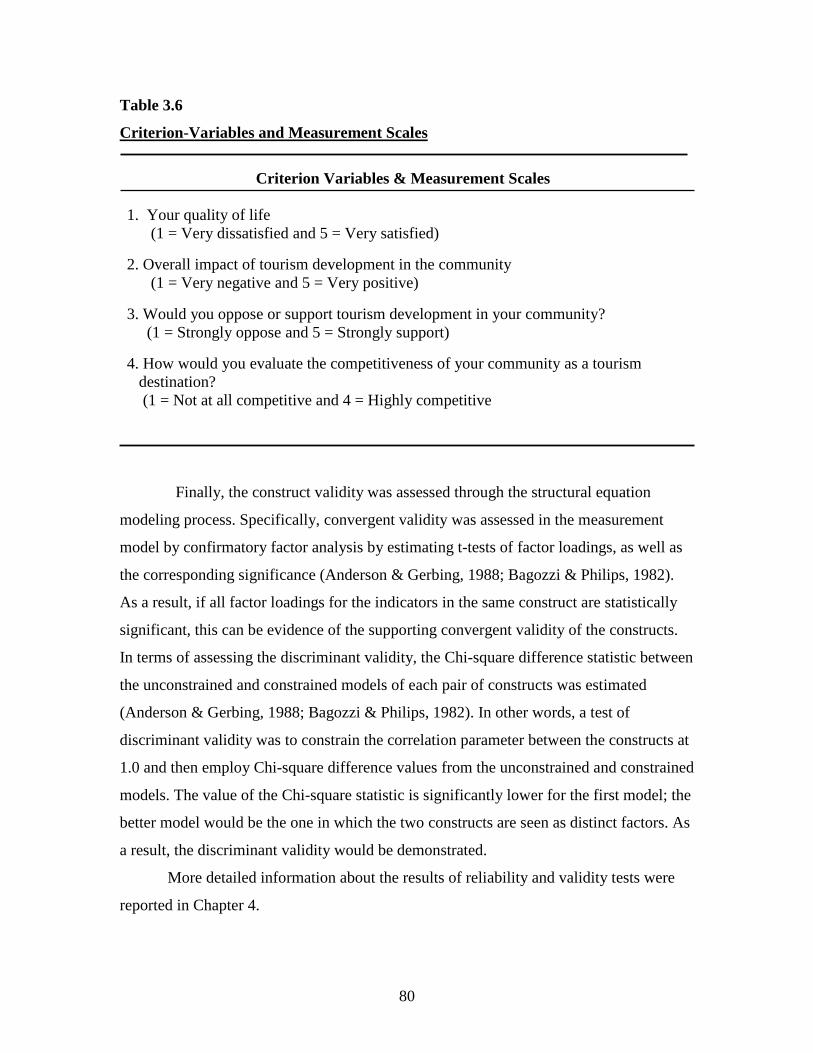
80
Table 3.6
Criterion-Variables and Measurement Scales
Criterion Variables & Measurement Scales
1. Your quality of life (1 = Very dissatisfied and 5 = Very satisfied) 2. Overall impact of tourism development in the community (1 = Very negative and 5 = Very positive) 3. Would you oppose or support tourism development in your community? (1 = Strongly oppose and 5 = Strongly support) 4. How would you evaluate the competitiveness of your community as a tourism destination? (1 = Not at all competitive and 4 = Highly competitive
Finally, the construct validity was assessed through the structural equation
modeling process. Specifically, convergent validity was assessed in the measurement
model by confirmatory factor analysis by estimating t-tests of factor loadings, as well as
the corresponding significance (Anderson & Gerbing, 1988; Bagozzi & Philips, 1982).
As a result, if all factor loadings for the indicators in the same construct are statistically
significant, this can be evidence of the supporting convergent validity of the constructs.
In terms of assessing the discriminant validity, the Chi-square difference statistic between
the unconstrained and constrained models of each pair of constructs was estimated
(Anderson & Gerbing, 1988; Bagozzi & Philips, 1982). In other words, a test of
discriminant validity was to constrain the correlation parameter between the constructs at
1.0 and then employ Chi-square difference values from the unconstrained and constrained
models. The value of the Chi-square statistic is significantly lower for the first model; the
better model would be the one in which the two constructs are seen as distinct factors. As
a result, the discriminant validity would be demonstrated.
More detailed information about the results of reliability and validity tests were
reported in Chapter 4.

81
SUMMARY OF THE CHAPTER
This chapter has been devoted to explaining the research methodology used in the
study. First, the research questions and research framework were introduced. The
statistical method (structural equation modeling) employed for this study was explained.
Next, the research design and survey instrument were specified, including the research
population, sampling, and data collection method. Then, the measurement scales and
constructs were discussed and the pre-tests and their procedures were explained. Finally,
the issues of the reliability and validity of the measurement scales were discussed.
82
CHAPTER IV
DATA ANALYSIS and RESULTS
INTRODUCTION
In this chapter, the results of data collection are described and the findings of the
applied statistical tests are presented. First of all, the preliminary tests of the collected
data are presented and the demographic characteristics of the respondents that made up
the sample are described. Next, the results of descriptive statistics of the measurement
scales for the five constructs: tourism development impacts, environmental attitudes,
place attachment, tourism attractions, and destination competitiveness are reported. Then,
the reliability and validity of the measurement scales are examined and reported. Further,
the results of hypotheses tests applied in LISREL (Structural Equation Modeling) are
presented and interpreted.
DATA COLLECTION
Since the major focus of this study was an investigation of tourism stakeholders’
roles in tourism development and destination competitiveness, the study samples were
tourism stakeholders who are currently involved in chambers of commerce, government
and tourism authorities, state and local economic development offices and councils, local
tourism agencies, non-government organizations, tourism-related associations,
convention and visitors bureaus, tourism planning and development companies, tourism
related faculty and professionals, local and state parks, and visiting and information
centers. The source of mailing lists was identified from the library database,
“Associations Unlimited, the Encyclopedia of Associations (EA) series” and relevant
linked websites such as the Virginia Tourism Corporation, and state and local tourism
parks and recreation. Additionally this study was limited to tourism stakeholders who
reside in the state of Virginia.
The self-administered survey questionnaire, which was finalized from the pilot
study was sent to 3,100 tourism stakeholders on June 2002, and the distributed surveys
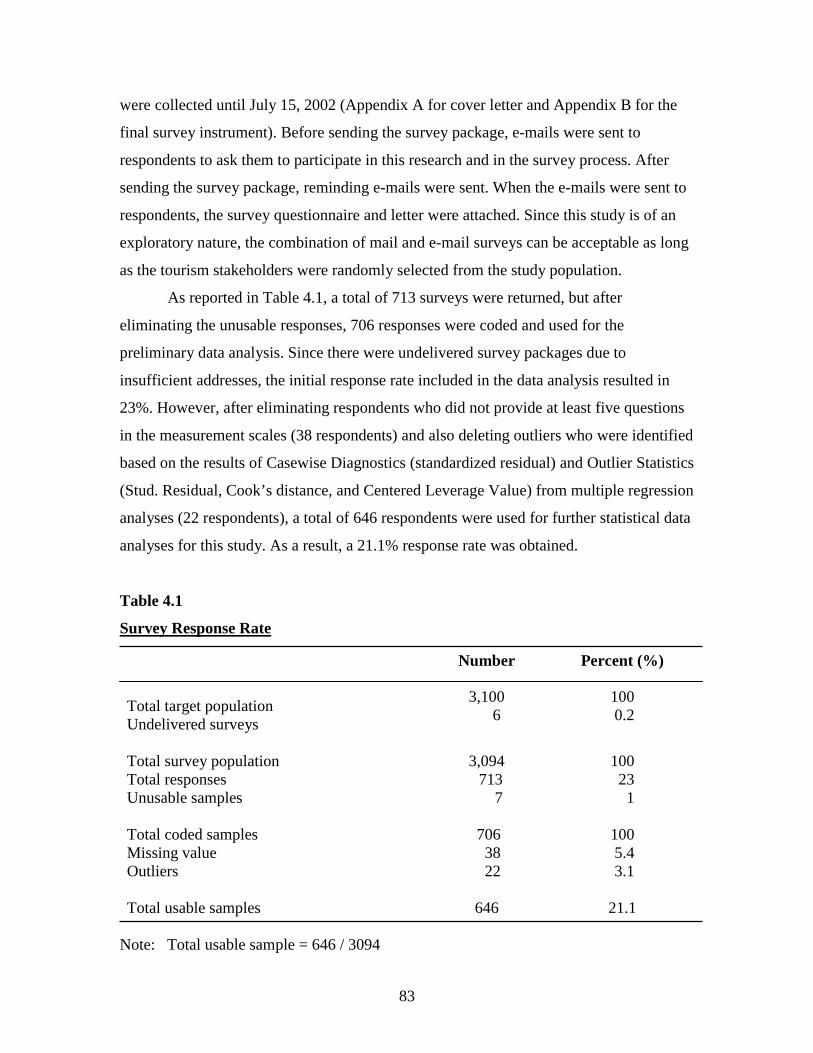
83
were collected until July 15, 2002 (Appendix A for cover letter and Appendix B for the
final survey instrument). Before sending the survey package, e-mails were sent to
respondents to ask them to participate in this research and in the survey process. After
sending the survey package, reminding e-mails were sent. When the e-mails were sent to
respondents, the survey questionnaire and letter were attached. Since this study is of an
exploratory nature, the combination of mail and e-mail surveys can be acceptable as long
as the tourism stakeholders were randomly selected from the study population.
As reported in Table 4.1, a total of 713 surveys were returned, but after
eliminating the unusable responses, 706 responses were coded and used for the
preliminary data analysis. Since there were undelivered survey packages due to
insufficient addresses, the initial response rate included in the data analysis resulted in
23%. However, after eliminating respondents who did not provide at least five questions
in the measurement scales (38 respondents) and also deleting outliers who were identified
based on the results of Casewise Diagnostics (standardized residual) and Outlier Statistics
(Stud. Residual, Cook’s distance, and Centered Leverage Value) from multiple regression
analyses (22 respondents), a total of 646 respondents were used for further statistical data
analyses for this study. As a result, a 21.1% response rate was obtained.
Table 4.1
Survey Response Rate
Number Percent (%)
Total target population Undelivered surveys
3,100 6
100 0.2
Total survey population Total responses Unusable samples
3,094 713 7
100 23 1
Total coded samples Missing value Outliers Total usable samples
706 38 22
646
100 5.4 3.1
21.1
Note: Total usable sample = 646 / 3094
84
NON-RESPONSE BIAS TEST
In the data analysis in this study, it is assumed that there are no different
distributions or opinions between respondents and non-respondents in terms of their
socio-demographic characteristics and the selected measurement items.
In order to assess potential non-response bias, this study examined differences
between early and late respondents in term of their opinions on the measurement scales
and demographic distributions. In this study, 200 people from the same study population
were contacted one month after the final questionnaires were sent. A total of 31 usable
questionnaires were returned and considered as the late respondents.
Chi-square tests and T-tests were utilized to examine if there were different
distributions between early respondents (n = 611) and late respondents (n = 31) in terms
of their socio-demographic characteristics, and also to see if there were different mean
scores between these two groups (early and late respondents) in terms of the
measurement items for this study. Accordingly, these tests were used to determine
whether the late respondents were from the same population, or were not statistically
different from the respondents,
From the Chi-square tests; the results revealed that there was no different
distribution between the early respondents and the late respondents in terms of gender,
marital status, education, income, and ethnic group (Appendix C). The results of T-tests
also showed that there was no difference between two groups for all of the five
measurement scales. The fact that only one item in the destination competitiveness scales
was found to be significantly different (p < .05), suggests that little bias on this item was
involved. Thus, further consideration was taken in the main data analysis. The item was
“the development of a strong destination image” in the destination competitiveness scale.
However, during the data analysis, since each measurement scale was examined
to confirm its relationship with the latent construct, this significant difference did not
pose a bias for the hypotheses under investigation for this study. Consequently, it can be
concluded from non-response bias tests that there was an absence of response bias in the
collected data.
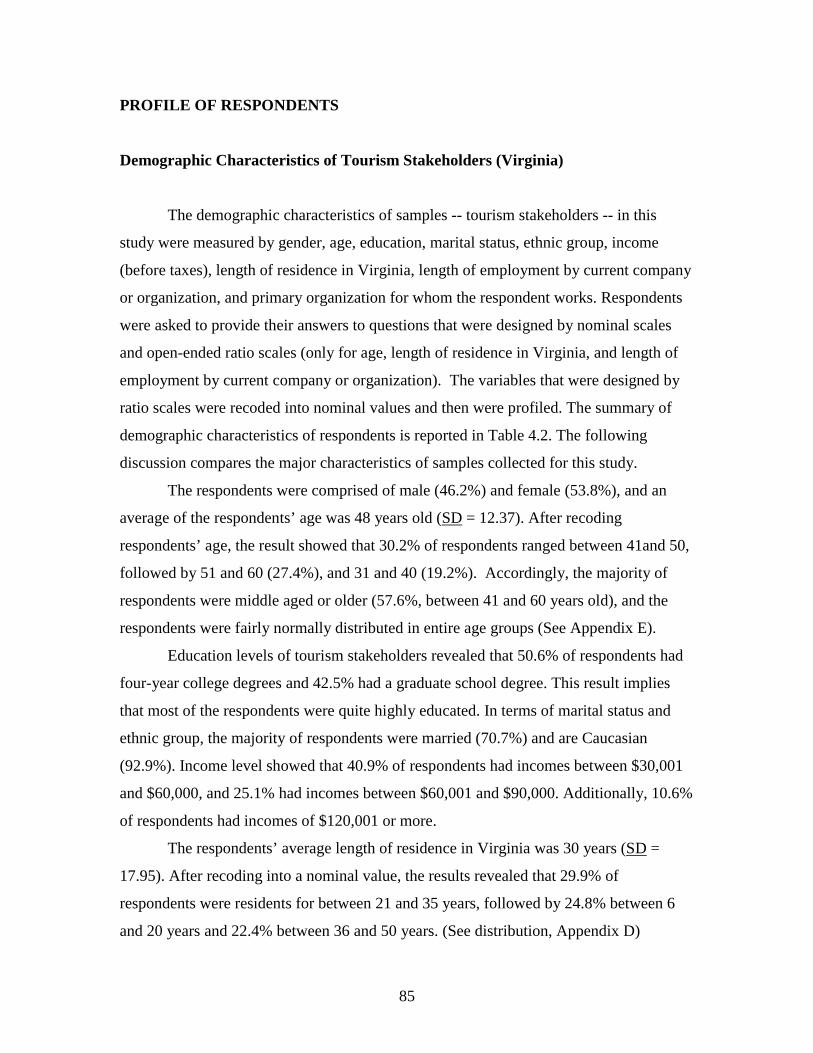
85
PROFILE OF RESPONDENTS
Demographic Characteristics of Tourism Stakeholders (Virginia)
The demographic characteristics of samples -- tourism stakeholders -- in this
study were measured by gender, age, education, marital status, ethnic group, income
(before taxes), length of residence in Virginia, length of employment by current company
or organization, and primary organization for whom the respondent works. Respondents
were asked to provide their answers to questions that were designed by nominal scales
and open-ended ratio scales (only for age, length of residence in Virginia, and length of
employment by current company or organization). The variables that were designed by
ratio scales were recoded into nominal values and then were profiled. The summary of
demographic characteristics of respondents is reported in Table 4.2. The following
discussion compares the major characteristics of samples collected for this study.
The respondents were comprised of male (46.2%) and female (53.8%), and an
average of the respondents’ age was 48 years old (SD = 12.37). After recoding
respondents’ age, the result showed that 30.2% of respondents ranged between 41and 50,
followed by 51 and 60 (27.4%), and 31 and 40 (19.2%). Accordingly, the majority of
respondents were middle aged or older (57.6%, between 41 and 60 years old), and the
respondents were fairly normally distributed in entire age groups (See Appendix E).
Education levels of tourism stakeholders revealed that 50.6% of respondents had
four-year college degrees and 42.5% had a graduate school degree. This result implies
that most of the respondents were quite highly educated. In terms of marital status and
ethnic group, the majority of respondents were married (70.7%) and are Caucasian
(92.9%). Income level showed that 40.9% of respondents had incomes between $30,001
and $60,000, and 25.1% had incomes between $60,001 and $90,000. Additionally, 10.6%
of respondents had incomes of $120,001 or more.
The respondents’ average length of residence in Virginia was 30 years (SD =
17.95). After recoding into a nominal value, the results revealed that 29.9% of
respondents were residents for between 21 and 35 years, followed by 24.8% between 6
and 20 years and 22.4% between 36 and 50 years. (See distribution, Appendix D)
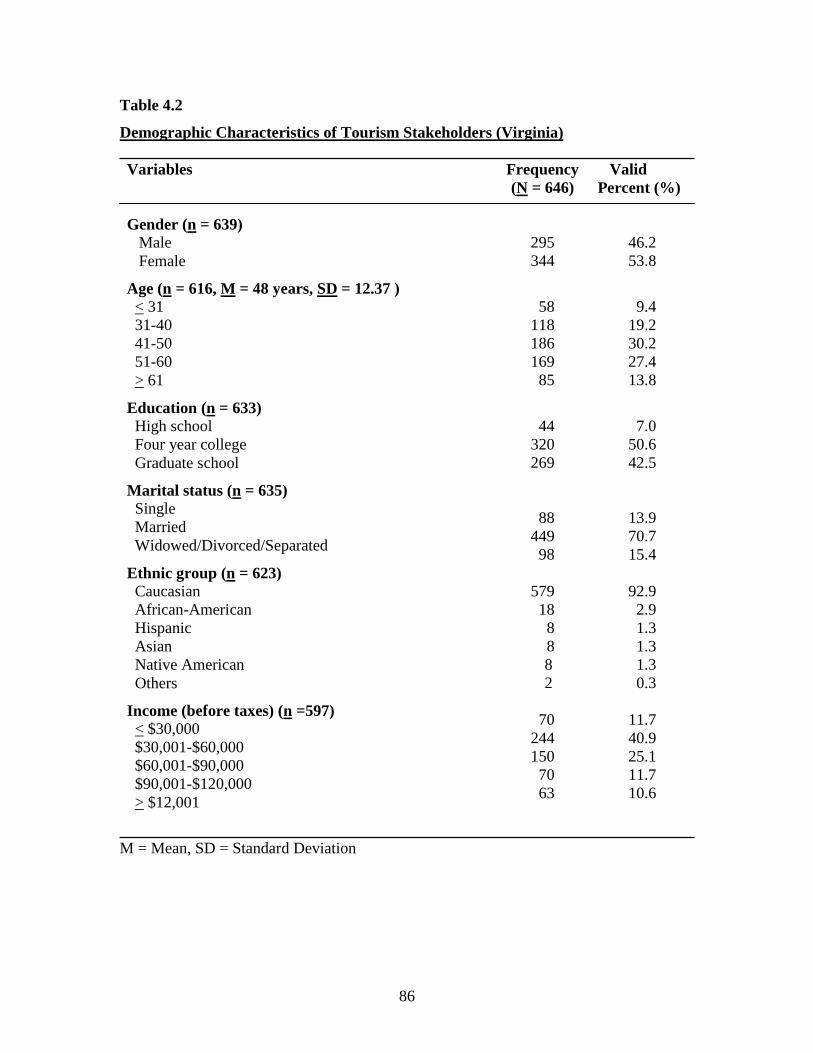
86
Table 4.2
Demographic Characteristics of Tourism Stakeholders (Virginia)
M = Mean, SD = Standard Deviation
Variables Frequency (N = 646)
Valid Percent (%)
Gender (n = 639) Male Female
295 344
46.2 53.8
Age (n = 616, M = 48 years, SD = 12.37 ) < 31 31-40 41-50 51-60 > 61
58 118 186 169 85
9.4 19.2 30.2 27.4 13.8
Education (n = 633) High school Four year college Graduate school
Marital status (n = 635) Single Married Widowed/Divorced/Separated
Ethnic group (n = 623) Caucasian African-American Hispanic Asian Native American Others
Income (before taxes) (n =597) < $30,000 $30,001-$60,000 $60,001-$90,000 $90,001-$120,000 > $12,001
44 320 269
88 449 98
579 18 8 8 8 2
70 244 150 70 63
7.0 50.6 42.5
13.9 70.7 15.4
92.9 2.9 1.3 1.3 1.3 0.3
11.7 40.9 25.1 11.7 10.6
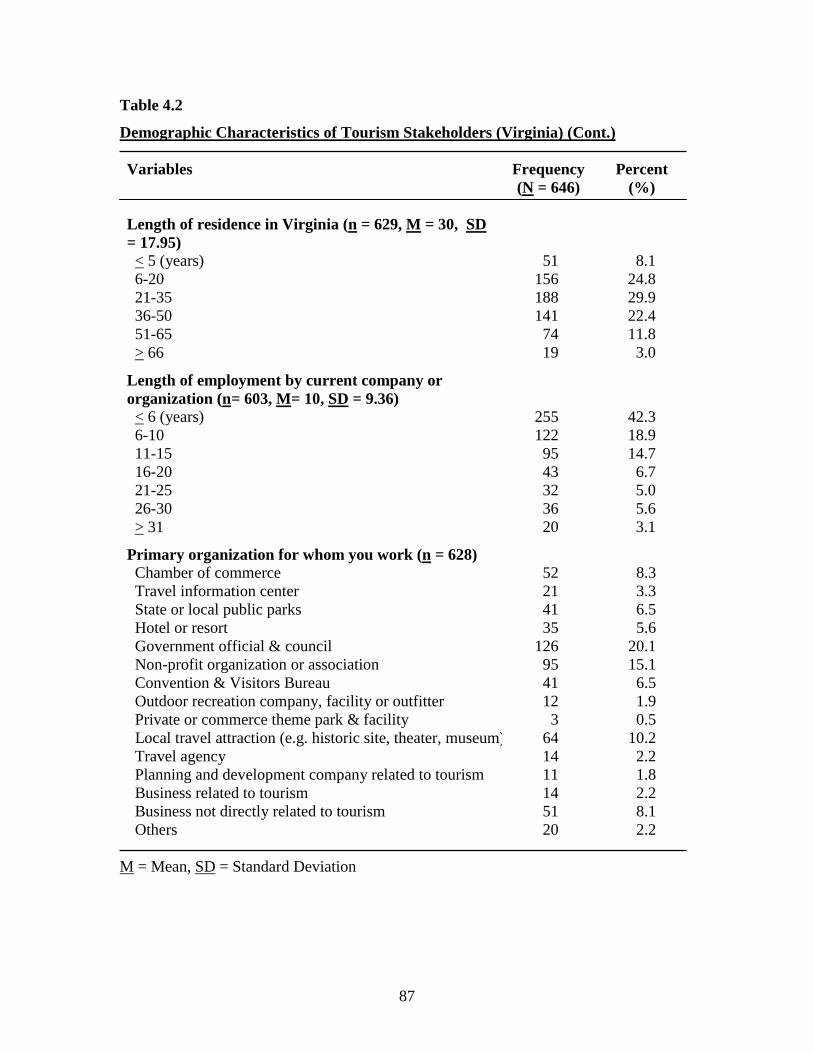
87
Table 4.2
Demographic Characteristics of Tourism Stakeholders (Virginia) (Cont.) Variables Length of residence in Virginia (n = 629, M = 30, SD = 17.95) < 5 (years) 6-20 21-35 36-50 51-65 > 66
Length of employment by current company or organization (n= 603, M= 10, SD = 9.36) < 6 (years) 6-10 11-15 16-20 21-25 26-30 > 31
Primary organization for whom you work (n = 628) Chamber of commerce Travel information center State or local public parks Hotel or resort Government official & council Non-profit organization or association Convention & Visitors Bureau Outdoor recreation company, facility or outfitter Private or commerce theme park & facility Local travel attraction (e.g. historic site, theater, museum) Travel agency Planning and development company related to tourism Business related to tourism Business not directly related to tourism Others
Frequency (N = 646)
51 156 188 141 74 19
255 122 95 43 32 36 20
52 21 41 35
126 95 41 12 3 64 14 11 14 51 20
Percent (%)
8.1 24.8 29.9 22.4 11.8 3.0
42.3 18.9 14.7 6.7 5.0 5.6 3.1
8.3 3.3 6.5 5.6
20.1 15.1 6.5 1.9 0.5
10.2 2.2 1.8 2.2 8.1 2.2
M = Mean, SD = Standard Deviation
88
In terms of respondents’ length of employment by current company or
organization, the average was approximately 10 years (SD = 9.36, while showing that
42.3 % of respondents have been working for less than 5 years, and 18.9% of respondents
have been working for 6 to 10 years in their current company or organization. The results
of the primary company or organization for whom the respondents worked revealed that
20.1% of respondents have been working for government, city or town council, followed
by non-profit organization or association (15.1%), and local travel attraction (10.2%).
This result implies that the survey questionnaires were collected from various
tourism stakeholders who are currently involved in tourism-related organizations,
associations, attractions, and businesses. Particularly, during the survey process, the
examples of the identified positions for the respondents were mayors, directors,
presidents, owners, chairpersons, and professors.
Geographical Distributions of Respondents
The geographic distributions of respondents was examined and reported in Table
4.3 and Figure 4.1. The state of Virginia was divided into eight different destination
regions according to the Virginia Tourism Corporation. They are: Northern Virginia,
North Central Virginia, Shenandoah Valley, Blue Ridge Highlands, South Central
Virginia, Tidewater & Hampton Roads, Eastern Shore, and Chesapeake Bay.
Once the questionnaire was received, the zip code was checked and sorted based
on the above eight different regions. A total of 24.5% of respondents lived in Northern
Virginia, followed by North Central Virginia (23.3%), Shenandoah Valley (13.9),
Tidewater & Hampton Roads (13.7%), and Blue Ridge Highlands (11.2%). During the
recoding process, it was identified that the survey questionnaires were collected from a
wide range of different counties and cities.
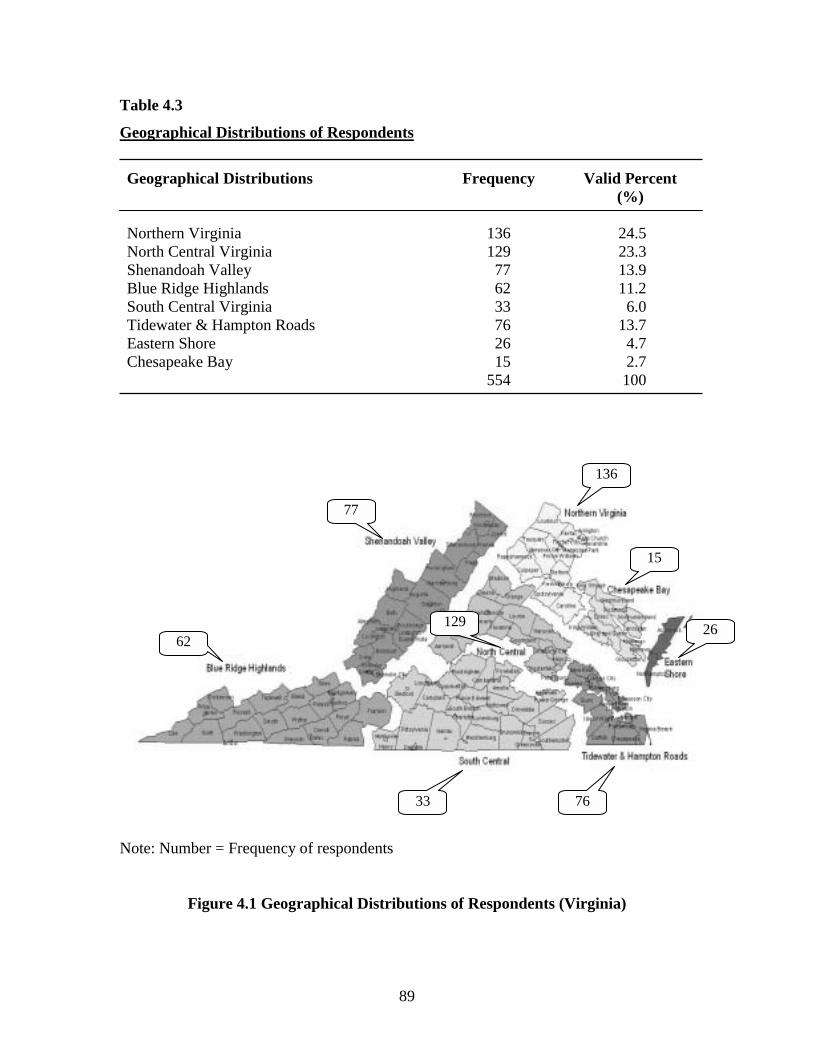
89
Table 4.3
Geographical Distributions of Respondents
Geographical Distributions Frequency Valid Percent (%)
Northern Virginia
136
24.5
North Central Virginia 129 23.3 Shenandoah Valley Blue Ridge Highlands South Central Virginia Tidewater & Hampton Roads Eastern Shore Chesapeake Bay
77 62 33 76 26 15
13.9 11.2 6.0
13.7 4.7 2.7
554 100
Note: Number = Frequency of respondents
Figure 4.1 Geographical Distributions of Respondents (Virginia)
129 62
26
15
136
77
33 76
90
PRELIMINARY DATA ANALYSIS
Nomality, Skewness, and Kurtosis
Since Structural Equation Modeling (SEM) was utilized for testing the hypotheses
in this study, violation of the univariate or multivariate normality could invalidate
statistical hypothesis testing (Byrne, 1995; Hair, Anderson, Tatham, & Black, 1998;
Kline, 1998). This is because a lack of normality can inflate the Chi-square statistic and
produce upward bias in critical values for determining coefficient significance. It is also
suggested that depending upon the degree of violation of normality, different estimation
methods may be applied to test the hypotheses in structural equation modeling.
For example, if the data have a nonnormal distribution, the weighted least square
(WLS) estimation should be used with a large sample size. Otherwise, the maximum
likelihood (ML) or generalized least squares (GLS) estimation process is suggested
(Bollen, 1989; Byrne, 1995; Jöreskog & Sörbom, 1999). Subsequently, if the data
achieve normal distribution and the sample size is large enough, the maximum likelihood
(ML) or generalized least squares (GLS) are recommended because these estimation
methods produce computational simplicity, accuracy, and correctness of statistical results
(Chou & Bentler, 1995, p. 54)
Generally, the normality of variables can be tested by skewness and kurtosis
(Byrne, 1998; Kline, 1998). Zero assumes perfect normality in the data distribution of the
variable. Skewness can be categorized into two directions; positive skewness indicates a
distribution with an asymmetric tail extending toward more a positive value, and negative
skewness shows a distribution with an asymmetic tail extending toward more negative
values. Kurtosis refers to the proportions of scores in the middle of a distribution or in its
tails relative to those in a normal curve, and it usually explains the relative peakedness or
flatness of a distribution compared to the normal distribution. Positive kurtosis indicates a
relative peak, and negative kurtosis indicates a relative flat. In this study, the normality of
data in terms of skewness and kurtosis was examined by PRELIS 2.30 (Jöreskog, &
Sörbom, 1999). As a rule of thumb, Byrne (1998) suggested that the variables can be
considered as moderately non-normal if they indicate skewness values ranging from 2.00
91
to 3.00 and kurtosis values from 7.00 to 21.00; extreme normality is defined by Skewness
values greater than 3.00, and kurtosis values greater than 21 (p. 197 – 198).
The results of skewness and kurtosis on each measurement scale for five
constructs were examined and reported in Appendix E1 (tourism development impacts),
E2 (environmental attitude), E3 (place attachment), E4 (development preferences about
tourism attractions), and E5 (support for destination competitive strategies). With the
above categories as guidelines, and with skewness and kurtosis values of less than 2 in all
of the measurement items for the five constructs, it can be considered that generally the
measurement items were normally distributed and any further treatments of data such as
log-transformation were not required.
DESCRIPTIVE ANALYSIS OF MEASUREMENT SCALES
Results of Tourism Development Impacts
The results of descriptive statistic analysis for the tourism development impact
scale are presented in Table 4.4. This measurement scale consisted of 14 items reflecting
the perceived economic, socio-cultural, environmental, and physical impacts.
Respondents were asked to provide answers on each item that was measured by a five
point Likert scale ranging from 1 being Strongly Disagree to 5 being Strongly Agree.
Based on the mean score of each item, respondents tended to strongly agree that
tourism has created jobs for the community (M = 4.33, SD = .92) and has attracted
investment to the community (M = 4.33, SD = .92 ). Additionally, they also agreed that
high-spending tourists have negatively affected the way of life (M = 4.17, SD = .86), but
the standard of living has increased considerably because of tourism.
Further, respondents were likely to agree that tourism has resulted in more
cultural exchange between tourists and residents (M = 3.65, SD = .94); tourism has
resulted in traffic congestion, noise, and pollution (M = 3.61, SD = .99); and tourism has
given economic benefits to local people and businesses (M = 3.52, SD = .1.04). Tourism
has resulted in positive impacts on the cultural identity of the community (M = 3.42, SD
= .93)
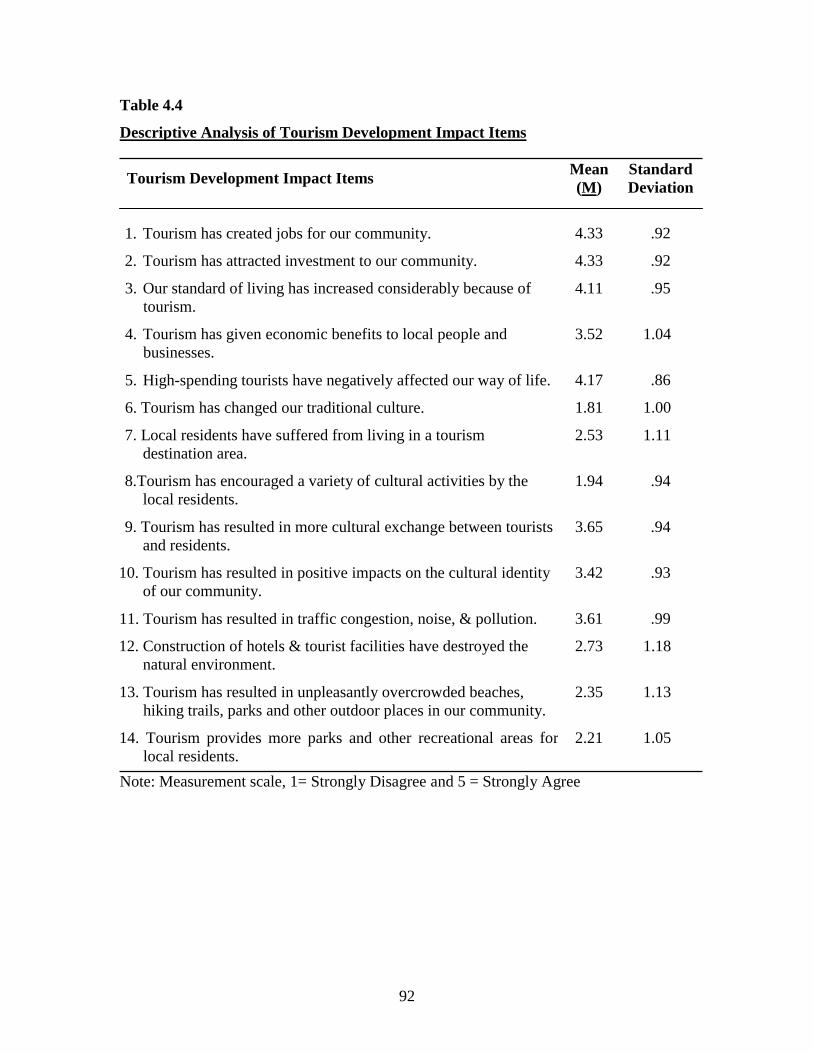
92
Table 4.4
Descriptive Analysis of Tourism Development Impact Items
Tourism Development Impact Items Mean (M)
Standard Deviation
1. Tourism has created jobs for our community.
2. Tourism has attracted investment to our community.
3. Our standard of living has increased considerably because of tourism.
4. Tourism has given economic benefits to local people and
businesses. 5. High-spending tourists have negatively affected our way of life.
6. Tourism has changed our traditional culture.
7. Local residents have suffered from living in a tourism destination area.
8.Tourism has encouraged a variety of cultural activities by the
local residents. 9. Tourism has resulted in more cultural exchange between tourists
and residents.
10. Tourism has resulted in positive impacts on the cultural identity of our community.
11. Tourism has resulted in traffic congestion, noise, & pollution.
12. Construction of hotels & tourist facilities have destroyed the natural environment.
13. Tourism has resulted in unpleasantly overcrowded beaches,
hiking trails, parks and other outdoor places in our community. 14. Tourism provides more parks and other recreational areas for
local residents.
4.33
4.33
4.11
3.52
4.17
1.81
2.53
1.94
3.65
3.42
3.61
2.73
2.35
2.21
.92
.92
.95
1.04
.86
1.00
1.11
.94
.94
.93
.99
1.18
1.13
1.05
Note: Measurement scale, 1= Strongly Disagree and 5 = Strongly Agree
93
These results indicate that tourism development has not only provided economic
benefits in terms of job creation and increase of investments, but also has resulted in the
socio-cultural benefits of an increase in standard living and cultural exchange. However,
it should be considered that tourism has also provided some negative socio-cultural
impacts such as traffic congestion, noise and pollution. Additionally, respondents were
likely to disagree that tourism has changed the traditional culture (M = 1.81, SD = 1.00),
and also has encouraged a variety of cultural activities by the local residents (M = 1.94,
SD =. 94). Respondents did not tend to believe that tourism provides more parks and
other recreation areas for local residents (M = 2.21, SD = 1.05).
Results of Environmental Attitudes
Table 4.5 shows the results of the descriptive statistics of the tourism
stakeholders’ environmental attitudes. This measurement scale, called the “New
Environmental Paradigm” scale, contains 15 items explaining the ecological worldview;
the reality of limits to growth, anti-anthropocentrism, the fragility of nature’s balance,
and the possibility of ecological catastrophe. Respondents were asked to indicate their
agreement on each item measured by five point Likert-type scales ranging from 1 being
Strongly Disagree to 5 being Strongly Agree. After obtaining the respondents’ answers to
each item from the survey, seven items out fifteen on this measurement scale were
reverse-coded. They included items 2, 4, 6, 8, 10, 12, and 14. Accordingly, the higher
mean scores can be interpreted as respondents’ higher ecocentric attitudes on each
environmental attitude statement. In other words, the higher mean scores can be viewed
as agreement with an anti-anthropocentric worldview. However, this study used
consistent terminologies such as low ecocentric attitudes (low mean) or high ecocentric
attitudes (higher mean) in further explanations.
From the results, respondents were likely to agree with most of the environmental
attitude items. With only one item, “human ingenuity will insure that we do not make the
earth unlivable,” respondents tended to disagree, with 2.92 of the mean score.
Consequently, respondents surveyed for this study have somewhat high ecocentric
environmental attitudes.
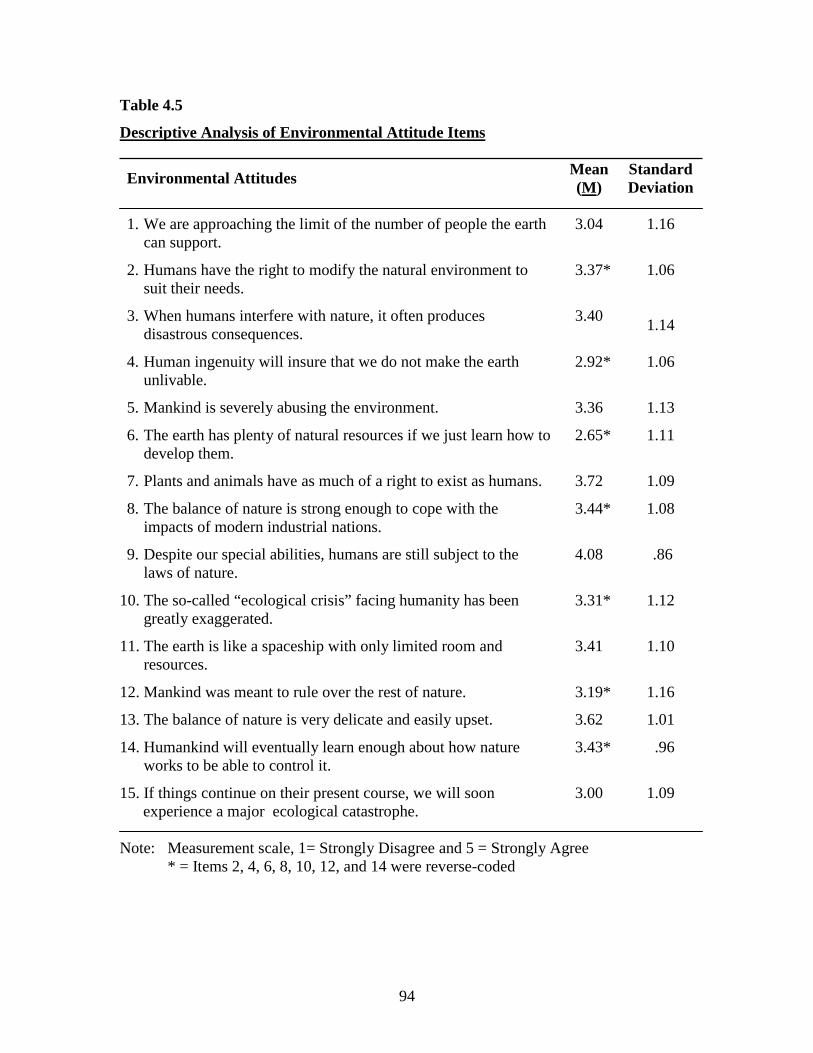
94
Table 4.5
Descriptive Analysis of Environmental Attitude Items
Environmental Attitudes Mean (M)
Standard Deviation
1. We are approaching the limit of the number of people the earth
can support. 2. Humans have the right to modify the natural environment to
suit their needs. 3. When humans interfere with nature, it often produces
disastrous consequences. 4. Human ingenuity will insure that we do not make the earth
unlivable. 5. Mankind is severely abusing the environment. 6. The earth has plenty of natural resources if we just learn how to
develop them. 7. Plants and animals have as much of a right to exist as humans. 8. The balance of nature is strong enough to cope with the
impacts of modern industrial nations. 9. Despite our special abilities, humans are still subject to the
laws of nature.
10. The so-called “ecological crisis” facing humanity has been greatly exaggerated.
11. The earth is like a spaceship with only limited room and
resources.
12. Mankind was meant to rule over the rest of nature.
13. The balance of nature is very delicate and easily upset.
14. Humankind will eventually learn enough about how nature works to be able to control it.
15. If things continue on their present course, we will soon experience a major ecological catastrophe.
3.04
3.37*
3.40
2.92*
3.36
2.65*
3.72
3.44*
4.08
3.31*
3.41
3.19*
3.62
3.43*
3.00
1.16
1.06
1.14
1.06
1.13
1.11
1.09
1.08
.86
1.12
1.10
1.16
1.01
.96
1.09
Note: Measurement scale, 1= Strongly Disagree and 5 = Strongly Agree
* = Items 2, 4, 6, 8, 10, 12, and 14 were reverse-coded
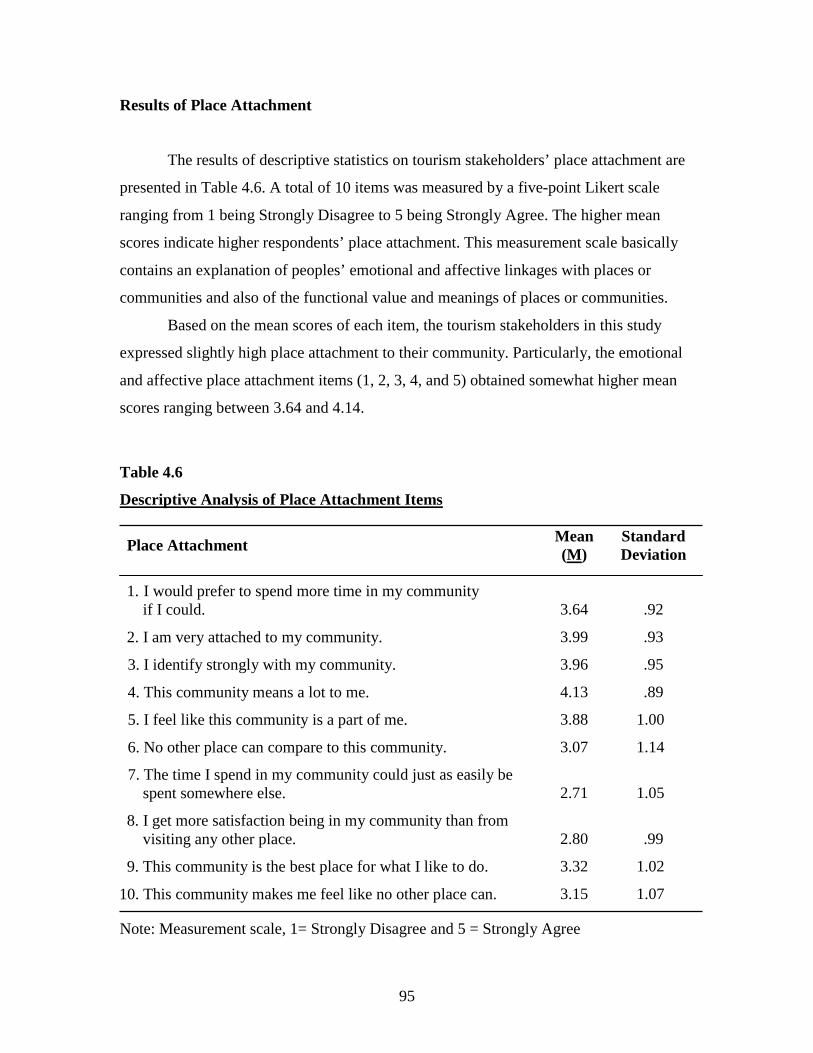
95
Results of Place Attachment
The results of descriptive statistics on tourism stakeholders’ place attachment are
presented in Table 4.6. A total of 10 items was measured by a five-point Likert scale
ranging from 1 being Strongly Disagree to 5 being Strongly Agree. The higher mean
scores indicate higher respondents’ place attachment. This measurement scale basically
contains an explanation of peoples’ emotional and affective linkages with places or
communities and also of the functional value and meanings of places or communities.
Based on the mean scores of each item, the tourism stakeholders in this study
expressed slightly high place attachment to their community. Particularly, the emotional
and affective place attachment items (1, 2, 3, 4, and 5) obtained somewhat higher mean
scores ranging between 3.64 and 4.14.
Table 4.6
Descriptive Analysis of Place Attachment Items
Place Attachment Mean (M)
Standard Deviation
1. I would prefer to spend more time in my community if I could.
2. I am very attached to my community.
3. I identify strongly with my community.
4. This community means a lot to me.
5. I feel like this community is a part of me.
6. No other place can compare to this community.
7. The time I spend in my community could just as easily be spent somewhere else.
8. I get more satisfaction being in my community than from visiting any other place.
9. This community is the best place for what I like to do.
10. This community makes me feel like no other place can.
3.64
3.99
3.96
4.13
3.88
3.07
2.71
2.80
3.32
3.15
.92
.93
.95
.89
1.00
1.14
1.05
.99
1.02 1.07
Note: Measurement scale, 1= Strongly Disagree and 5 = Strongly Agree
96
However, respondents did not have high place attachment on two items which are
related to functional value and attachment; “The time I spend in my community could
just as easily be spent somewhere else (M = 2.71, SD = 1.05),” and “I get more
satisfaction being in my community than from visiting any other place (M = 2.80, SD =
.99).” Thus, it can be generally interpreted that the tourism stakeholders in this study
showed somewhat higher emotional and affective place attachment.
Results of Preferences about Tourism Attraction Development Tourism stakeholders’ preferences about tourism attraction development were
measured by 12 tourism attraction items that consisted of nature-based tourism,
attractions designed for large numbers of tourists, cultural or historic based attractions,
supporting visitor services, small independent businesses, cultural and folk events, pre-
arranged attractive and flexible tour packages, outdoor recreation facilities, programs and
events, improved roads and transportation, information for tourists, sport facilities and
activities, and business/convention meeting events and facilities. The respondents were
asked to indicate their degree of preferences on each item that used a five-point Likert
type scale ranging from 1 being Don’t at all Prefer to 5 being Highly Prefer.
As presented in Table 4.7, tourism stakeholders surveyed for this study somewhat
highly preferred to develop cultural and folk events (M = 4.29, SD = .73), cultural and
historic-based tourism attractions (M = 4.29, SD = .77), and information for tourists (M =
4.25, SD = .73). They also preferred to improve roads and transportation (M = 4.19, SD =
.88), develop small independent businesses such as gift shops and guide services (M =
4.12, SD = .79), nature-based tourism attractions (M = 4.09, SD = .95), and outdoor
recreation facilities, programs, and events (M = 4.05, SD = .90). However, the
respondents were not likely to prefer to develop tourism attractions designed for large
numbers of tourists such as theme parks and resorts (M = 2.62, SD = 1.19). From the
results, it can be implied that tourism stakeholders are likely to develop cultural and
historic-based tourism attractions as tourism supply elements while supporting the
development of services for tourists such as information, roads, transportation, and gift-
shops.
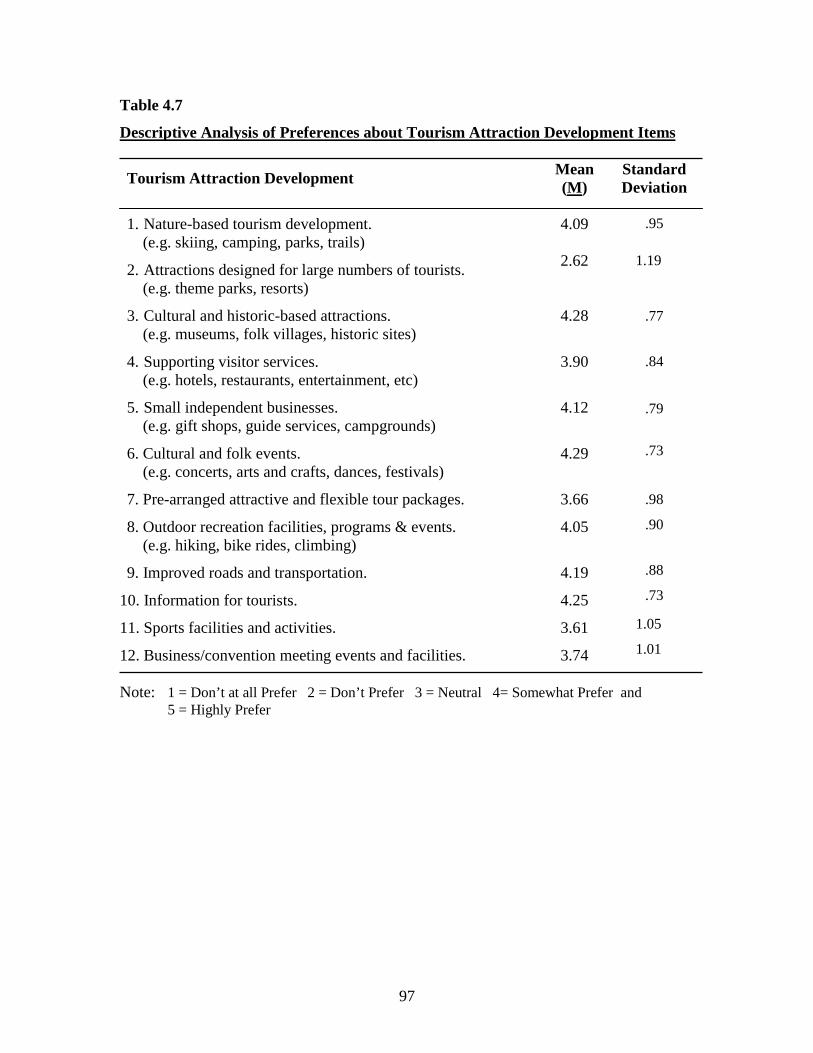
97
Table 4.7
Descriptive Analysis of Preferences about Tourism Attraction Development Items
Tourism Attraction Development Mean (M)
Standard Deviation
1. Nature-based tourism development. (e.g. skiing, camping, parks, trails) 2. Attractions designed for large numbers of tourists. (e.g. theme parks, resorts) 3. Cultural and historic-based attractions. (e.g. museums, folk villages, historic sites) 4. Supporting visitor services. (e.g. hotels, restaurants, entertainment, etc) 5. Small independent businesses. (e.g. gift shops, guide services, campgrounds) 6. Cultural and folk events. (e.g. concerts, arts and crafts, dances, festivals) 7. Pre-arranged attractive and flexible tour packages. 8. Outdoor recreation facilities, programs & events. (e.g. hiking, bike rides, climbing) 9. Improved roads and transportation.
10. Information for tourists. 11. Sports facilities and activities. 12. Business/convention meeting events and facilities.
4.09
2.62
4.28
3.90
4.12
4.29
3.66
4.05
4.19
4.25
3.61
3.74
.95
1.19
.77
.84
.79
.73
.98
.90
.88
.73 1.05
1.01
Note: 1 = Don’t at all Prefer 2 = Don’t Prefer 3 = Neutral 4= Somewhat Prefer and
5 = Highly Prefer
98
Results of Support for Destination Competitive Strategy
Descriptive statistics for support for destination competitive strategies are
presented in Table 4.8. The measurement scale consisted of 24 destination competitive
strategies reflecting marketing strategies and activities, enhancement of quality service
and experiences for tourists, destination management organization’s roles and efforts,
collecting information and research, training and education, and sustainable management
and practices. Respondents were asked to indicate how favorable or unfavorable for
Virginia they consider each item to be in order to enhance destination competitiveness.
Items were measured by a five point Likert scale ranging from 1 being ‘Not at all
Favorable’ to 5 being ‘Highly Favorable.’
As shown in Table 4.8, the mean scores of the measurement items were between
3.58 and 4.38. The highest mean score was “the development of a strong destination
image (M = 4.38, SD = .74),” followed by “use of modern, advanced technology and
information systems (M = 4.37, SD = .72),” “increasing tourists’ spending (M = 4.30, SD
= .77),” and “sensible use of natural resources (M = 4.27, SD = .83).” Respondents also
expressed a somewhat highly favorable response to destination competitive strategy items
such as “the promoting ethical responsibility towards the natural environment (M = 4.15,
SD = .91),” “increasing tourists length of stay (M = 4.11, SD = .87),” and “protecting and
improving more wildlife habitat (M = 4.09, SD = .94).” Additionally, the items related to
“both education and training programs for present/future industry personnel (M = 4.05,
SD = .90),” “overcoming seasonality (M = 4.03, SD = .88),” and “expanding
opportunities for the visiting public in terms of natural/environmental quality and
protection (M = 4.03, SD = .92).” These top 12 favorable destination competitive
strategies are summarized in Table 4.9. The lowest mean score was “establishing the cost
of providing different levels of quality for various types of tourism experiences (M =
3.58, SD = .89),” followed by “an inventory of information to monitor the attitudes of the
local population towards the tourism industry (M = 3.64, SD = .97).”
From the results, it can be noted that destination competitive strategies related to
destination marketing and efforts, sustainable management practices, and education and
training are considerably important strategies supported by tourism stakeholders.
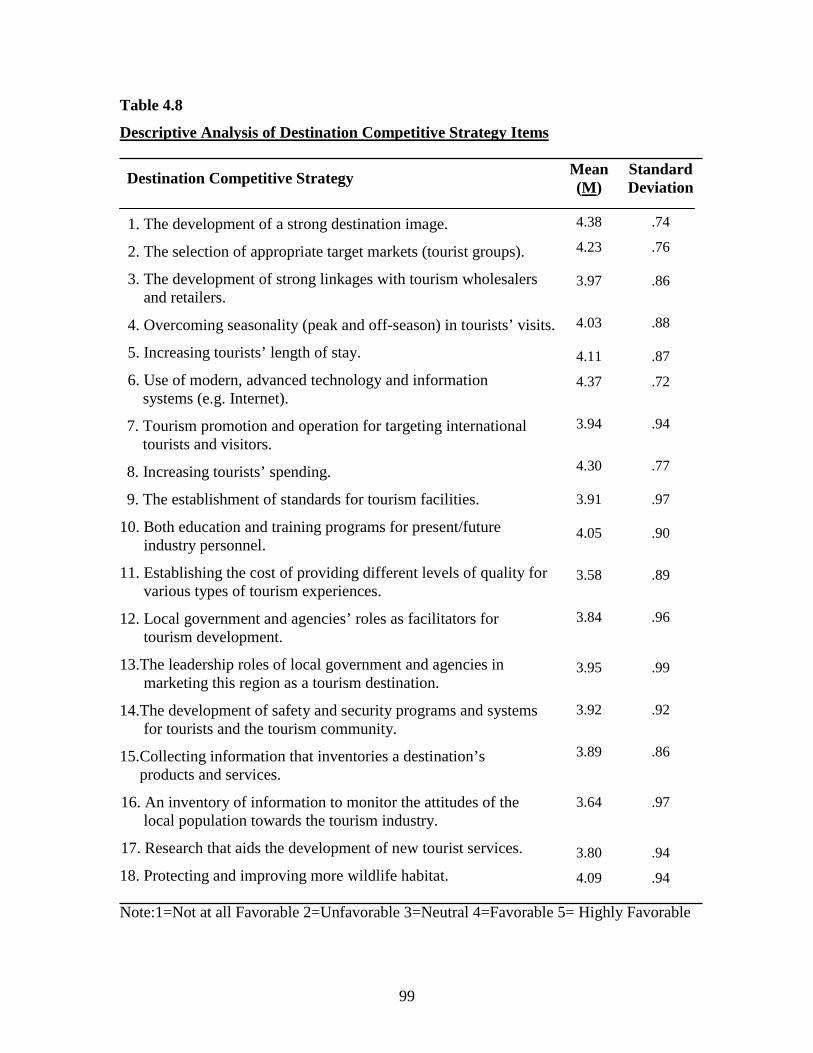
99
Table 4.8
Descriptive Analysis of Destination Competitive Strategy Items
Destination Competitive Strategy Mean (M)
Standard Deviation
1. The development of a strong destination image. 2. The selection of appropriate target markets (tourist groups). 3. The development of strong linkages with tourism wholesalers
and retailers. 4. Overcoming seasonality (peak and off-season) in tourists’ visits. 5. Increasing tourists’ length of stay. 6. Use of modern, advanced technology and information systems (e.g. Internet). 7. Tourism promotion and operation for targeting international tourists and visitors. 8. Increasing tourists’ spending. 9. The establishment of standards for tourism facilities.
10. Both education and training programs for present/future industry personnel.
11. Establishing the cost of providing different levels of quality for various types of tourism experiences.
12. Local government and agencies’ roles as facilitators for
tourism development. 13.The leadership roles of local government and agencies in
marketing this region as a tourism destination. 14.The development of safety and security programs and systems
for tourists and the tourism community. 15.Collecting information that inventories a destination’s products and services. 16. An inventory of information to monitor the attitudes of the
local population towards the tourism industry. 17. Research that aids the development of new tourist services. 18. Protecting and improving more wildlife habitat.
4.38
4.23
3.97
4.03
4.11
4.37
3.94
4.30
3.91
4.05
3.58
3.84
3.95
3.92
3.89
3.64
3.80
4.09
.74
.76
.86
.88
.87
.72
.94
.77
.97
.90
.89
.96
.99
.92
.86
.97
.94
.94
Note:1=Not at all Favorable 2=Unfavorable 3=Neutral 4=Favorable 5= Highly Favorable

100
Table 4.8
Descriptive Analysis of Destination Competitive Strategy Items (cont.) Destination Competitive Strategy
Mean Deviation
19. Promoting ethical responsibility towards the natural
environment. 20. Expanding educational opportunities for the visiting public in
terms of natural/ environmental quality and protection. 21. Encouraging citizen participation in decision-making about
tourism development 22. Sensible use of natural resources. 23. Environmental considerations in the marketing of tourism. 24. Environmental training of tourism staff.
4.15
4.03
3.83
4.27
4.08
3.90
.91
.92
.98
.83
.93
1.00 Note:1=Not at all Favorable 2=Unfavorable 3=Neutral 4=Favorable 5= Highly Favorable Table 4.9
Top 12 Favorable Destination Competitive Strategies
Destination Competitive Strategy Mean > 4
1. The development of a strong destination image.
2. Use of modern, advanced technology and information systems.
3. Increasing tourists’ spending.
4. Sensible use of natural resources.
5. The selection of appropriate target markets (tourist groups).
6. Promoting ethical responsibility towards the natural environment.
7. Increasing tourists’ length of stay.
8. Protecting and improving more wildlife habitat.
9. Environmental considerations in the marketing of tourism.
10. Both education and training programs for present/future industry personnel.
11. Overcoming seasonality (peak and off-season) in tourists’ visits.
12. Expanding educational opportunities for the visiting public in terms of natural/environmental quality and protection.
4.38
4.37
4.30
4.27
4.23
4.15
4.11
4.09
4.08
4.05
4.03
4.03

101
RELIABILITY AND VALIDITY OF MEASUREMENT SCALES Reliability of Measurement Scales Reliability is a fundamental issue in any measurement scale. Scale reliability is
considered as the proportion of variance attributed to the true score of the latent construct
(DeVellis, 1991; Gable & Keilty, 1998). It usually is measured by internal consistency
reliability that indicates the homogeneity of items comprising a measurement scale. The
meaning of internal consistency is the extent that its items are inter-correlated. Thus, high
inter-item correlations explain that the items of a scale have a strong relationship to the
latent construct and are possibly measuring the same thing.
Usually, the internal consistency of a measurement scale is assessed by using
Cronbach’s coefficient alpha and calculating the Cronbach’s alpha along with the item-
to-total correlation for each item examined in the overall reliability of the measurement
scale. It is generally recommended that if a measurement scale having a Cronabach’s
coefficient above .70 is acceptable as an internally consistent scale so that further analysis
can be possible. However, if the scale has a coefficient alpha below .70, the scale should
be examined for any sources of measurement errors such as inadequate sampling of
items, administration errors, situational factors, sample characteristics, number of items,
and theoretical errors in developing a measurement scale (Gable & Keility, 1998).
Table 4. 10
Summary of the Measurement Reliability (Cronbach’s Alpha)
Measurement Scale Number of Items
Cronbach’s Alpha (α)
Tourism Development Impacts
Environmental Attitudes
Place Attachment
Preferences about Tourism Attraction Development
Support for Destination Competitive Strategy
14
15
9
12
24
.76
.88
.90
.81
.94
102
As an initial examination of the reliability for the measurement scales for the five
constructs proposed in this study, the Cronbach’s alpha coefficients were calculated in
SPSS 10.0 and presented in Table 4.10 (see also Appendix F 1 to F5). All of the
measurement scales for the five constructs obtained an acceptable level of a coefficient
alpha above .70, indicating that the measurement scales are reliable and appropriate for
further data analysis.
Particularly, in assessing the reliability of the place attachment scale, it was
discovered that the level of alpha reliability increased from .83 to .90 after item 7 “The
time I spend in my community could just as easily be spent somewhere else” was deleted.
Accordingly, more caution on this item should be taken in further analysis.
As another approach to assessing the reliability, the composite reliability and
variance extracted were calculated and reported in the next section of Confirmatory
Factor Analysis (CFA). Composite reliability refers to a measure of the internal
consistency of indicators to the construct, depicting the degree to which they indicate the
corresponding latent construct (Hair, Anderson, Tatham, & Black, 1998). A commonly
used threshold value for an acceptable level of composite reliability is .70. If the
composite reliability is above .70, the indicators for the latent construct are reliable and
are measuring the same construct. As a complementary measure of the composite
reliability, the variance extracted can be calculated to explain the overall amount of
variance in the indicators accounted for by the corresponding latent construct. A
commonly used acceptable cut-off point is .50. If the variance extracted values are high,
the indicators are truly representative of the latent construct.
Validity of Measurement Scales Whereas reliability is related to how consistent a set of items are, validity is
associated with whether a particular construct is the underlying cause of item covariation
(DeVellis, 1991). Validity usually refers the extent to which the measurement items or
indicators measure what they are supposed to measure (Hair et al., 1998). Construct
validity deals with the adequacy of a scale as a measure of a specific variable.
In general, there are two types of evidence for scale validity: judgmental and
empirical evidence (Gable & Keilty, 1998). Judgmental validity can be obtained before
103
the measurement scale is administered to the target study population. It is mainly used as
a method for examining the adequacy of the conceptual and operational definition of the
measurement scale on the basis of the theoretical background. The face or content
validity provides evidence for the judgmental validity. For the empirical evidence, after
the measurement scale is administered to the study population, the relationships among
the items within the measurement scale are examined as well as relationships to the
measurements. The empirical evidence for validity can be obtained by criterion-related
validity and construct validity.
In order to verify the face or content validity, the measurement scales for the
constructs were examined by professors and graduate students in the Department of
Hospitality and Tourism Management at Virginia Polytechnic Institute and State
University. Further, tourism and economic development specialists from the Public
Service Program, and also staff from the Chamber of Commerce and Convention &
Visitors Bureau examined the appropriateness and adequacy of the operational
terminologies and contents of the measurement scales in targeting tourism stakeholders.
Through these procedures, the content validity of the measurement scales was achieved
and further procedures and research for this study were supported.
For the criterion-related validity, as discussed in the Chapter 3, concurrent
validity was performed to test if there was a correlation between the criterion variables
and the measurement scales. The results of Pearson correlation and linear regression
analysis are presented in Table 4.11. All of the Pearson correlations indicated that there
is some degree of correlation between measurement scales and criterion-variables.
Additionally, the results of linear regression analysis revealed that all of the models were
significant at the .01 statistical level, while explaining between 7% and 29% of the
variance.
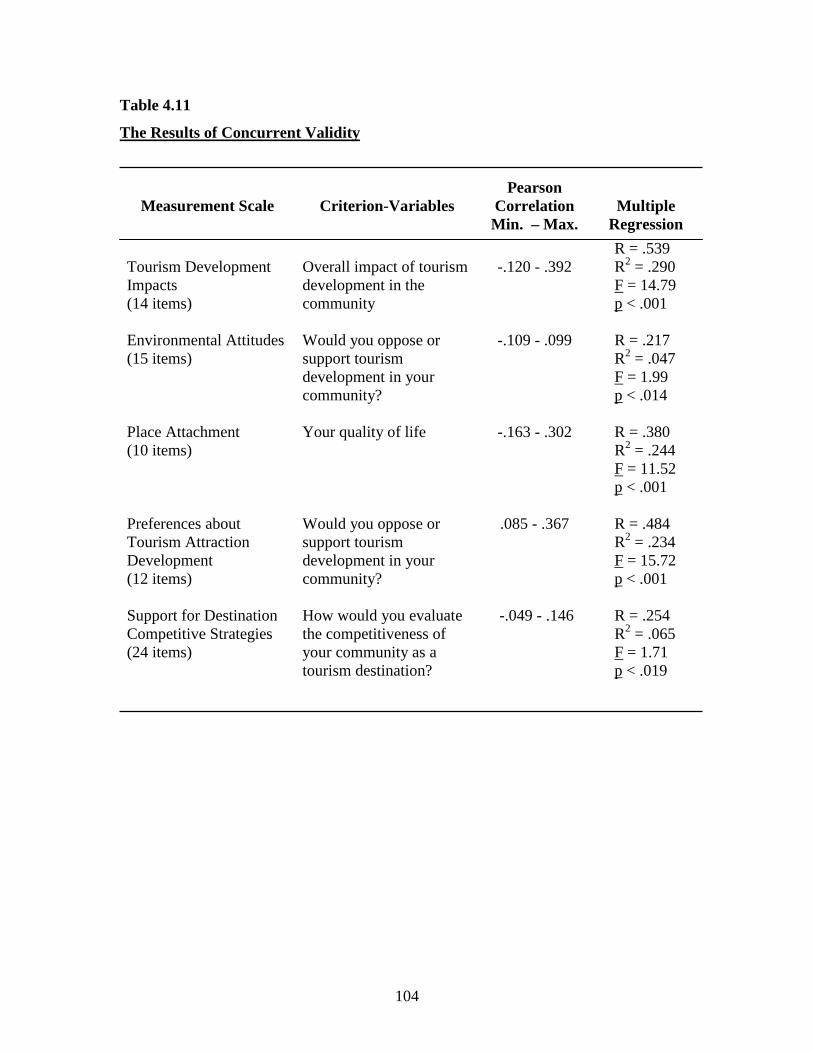
104
Table 4.11
The Results of Concurrent Validity
Measurement Scale
Criterion-Variables
Pearson Correlation Min. – Max.
Multiple
Regression
Tourism Development Impacts (14 items)
Overall impact of tourism development in the community
-.120 - .392
R = .539 R2 = .290 F = 14.79 p < .001
Environmental Attitudes (15 items)
Would you oppose or support tourism development in your community?
-.109 - .099 R = .217 R2 = .047 F = 1.99 p < .014
Place Attachment (10 items)
Your quality of life
-.163 - .302 R = .380 R2 = .244 F = 11.52 p < .001
Preferences about Tourism Attraction Development (12 items)
Would you oppose or support tourism development in your community?
.085 - .367 R = .484 R2 = .234 F = 15.72 p < .001
Support for Destination Competitive Strategies (24 items)
How would you evaluate the competitiveness of your community as a tourism destination?
-.049 - .146 R = .254 R2 = .065 F = 1.71 p < .019
105
Since two statistical procedures -- Pearson correlation and multiple regression --
provided empirical evidence of concurrent validity for the five measurement scales for
the constructs, this study was supported in using those measurement scales. However, the
measurement scales for the environmental attitudes and support for destination
competitive strategy had comparatively low correlations with the criterion variables so
that in further analysis, much attention was given to these scales to provide valid results.
Construct validity (convergent and discriminant validity) will be reported in the
next section along with the results of confirmatory factor analysis (CFA), since CFA can
produce empirical evidence of construct validity.
Convergent validity was used to measure the extent to which items purporting to
measure one construct indeed converge. This type of validity evidence can be assessed by
examining the t-tests for confirmatory factor analysis loadings, since statistically
significant t-tests for all confirmatory factor loadings indicate effective measurement of
the same construct (Anderson & Gerbing, 1998; Hair et al., 1998). Discriminant validity
refers to a measure of the indicators of dissimilar constructs that theoretically and
empirically should not be related to each other (Hair et al. 1998). Thus, the indicators that
measure one construct should not be related to the indicators that measure another
construct if the constructs have discriminant validity. This discriminant validity can be
assessed by examining χ2 in terms of every possible pair of estimated constructs.
MEASUREMENT MODEL
Each measurement model of the five constructs can be examined through a
process of confirmatory factor analysis (CFA). A confirmatory factor analysis (CFA) is
used to test the measurement model specifying the posited relations of the observed
variables to the underlying constructs. This CFA approach examines whether or not the
collected data are consistent with a highly constrained hypothesized model, or a priori
specified model (Byrne, 1998; Maruyama, 1997). Thus, CFA allows identification and
clustering of the observed variables in a pre-specified, theory-driven hypothesized model
to evaluate to what extent a particular collected data set confirms what is theoretically
believed to be its underlying constructs (Mueller, 1996).
106
In this study, a total of five measurement models of the five constructs were
proposed and tested; tourism development impacts, environmental attitudes, place
attachment, preferences about tourism attraction development, and support for destination
competitiveness. As the detailed theoretical and empirical aspects of each construct and
observed indicators were discussed in Chapters II and III, all of the measurement models
were developed on the basis of conceptual, theoretical, and empirical reviews. Through a
process of CFA, each measurement model was confirmed in terms of measuring the
underlying constructs. Since CFA is performed on the basis of the premise that the
observed variables are not perfect indicators for the underlying constructs, each construct
in the measurement model was tested separately and then the overall measurement model
was evaluated. As discussed in Chapter III, the model estimation process for each model
will be provided along with statistical results. Modification indices, Absolute Fit
Measures (AFM), Incremental Fit Measures (IFM), and Parsimonious Fit Measures
(PFM) are utilized to evaluate the proposed model
In processing the CFA, the covariance matrices based on Product Moment
Correlation and standard deviation were used as input data matrices to analyze the data,
since the analysis of correlation matrix data may create problematic results (Byrne, 1998;
Jöreskog & Sörbom, 1993). Additionally, as the method of parameter estimation,
maximum likelihood (ML) was utilized because the collected usable sample was quite
large (N=646), the scales of observed indicators were continuous, the normal distribution
of the observed variables were met according to the results of skewness and kurtosis, and
the variables in the the hypothesized model were believed to be valid.
Further, the Ml estimation method has been widely used in studies of structural
equation modeling because this estimation method has been found to be quite robust even
if the normal distribution of the observed variables are violated (Chou & Bentler, 1995).
Particularly, when the observed data are normally distributed and the collected data are
large enough, the ML method is suggested to estimate the parameters because it creates
computational simplicity, accuracy, and correctness of statistical results.
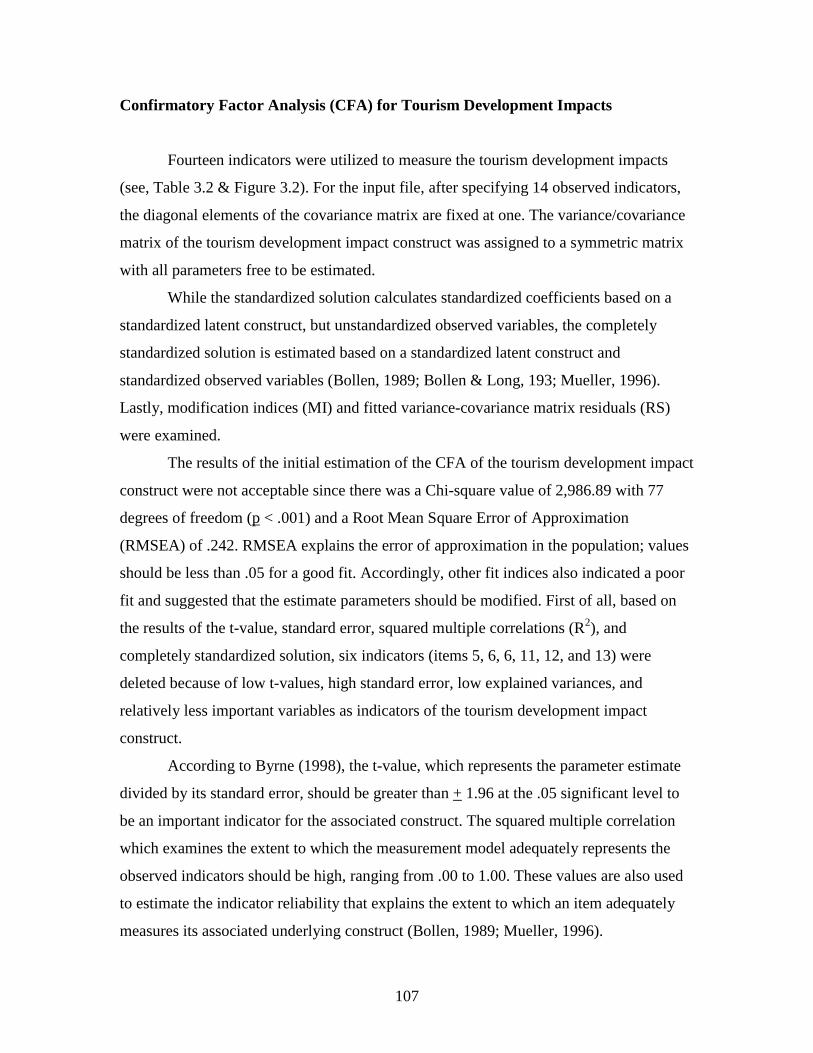
107
Confirmatory Factor Analysis (CFA) for Tourism Development Impacts
Fourteen indicators were utilized to measure the tourism development impacts
(see, Table 3.2 & Figure 3.2). For the input file, after specifying 14 observed indicators,
the diagonal elements of the covariance matrix are fixed at one. The variance/covariance
matrix of the tourism development impact construct was assigned to a symmetric matrix
with all parameters free to be estimated.
While the standardized solution calculates standardized coefficients based on a
standardized latent construct, but unstandardized observed variables, the completely
standardized solution is estimated based on a standardized latent construct and
standardized observed variables (Bollen, 1989; Bollen & Long, 193; Mueller, 1996).
Lastly, modification indices (MI) and fitted variance-covariance matrix residuals (RS)
were examined.
The results of the initial estimation of the CFA of the tourism development impact
construct were not acceptable since there was a Chi-square value of 2,986.89 with 77
degrees of freedom (p < .001) and a Root Mean Square Error of Approximation
(RMSEA) of .242. RMSEA explains the error of approximation in the population; values
should be less than .05 for a good fit. Accordingly, other fit indices also indicated a poor
fit and suggested that the estimate parameters should be modified. First of all, based on
the results of the t-value, standard error, squared multiple correlations (R2), and
completely standardized solution, six indicators (items 5, 6, 6, 11, 12, and 13) were
deleted because of low t-values, high standard error, low explained variances, and
relatively less important variables as indicators of the tourism development impact
construct.
According to Byrne (1998), the t-value, which represents the parameter estimate
divided by its standard error, should be greater than + 1.96 at the .05 significant level to
be an important indicator for the associated construct. The squared multiple correlation
which examines the extent to which the measurement model adequately represents the
observed indicators should be high, ranging from .00 to 1.00. These values are also used
to estimate the indicator reliability that explains the extent to which an item adequately
measures its associated underlying construct (Bollen, 1989; Mueller, 1996).
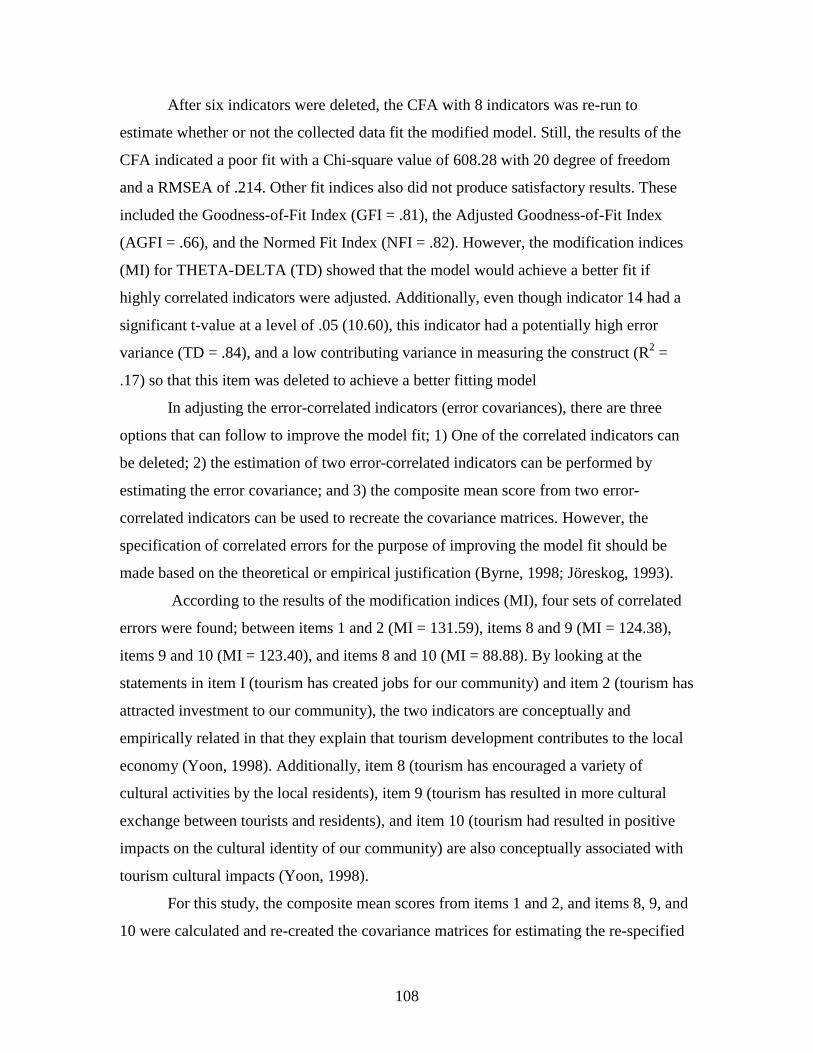
108
After six indicators were deleted, the CFA with 8 indicators was re-run to
estimate whether or not the collected data fit the modified model. Still, the results of the
CFA indicated a poor fit with a Chi-square value of 608.28 with 20 degree of freedom
and a RMSEA of .214. Other fit indices also did not produce satisfactory results. These
included the Goodness-of-Fit Index (GFI = .81), the Adjusted Goodness-of-Fit Index
(AGFI = .66), and the Normed Fit Index (NFI = .82). However, the modification indices
(MI) for THETA-DELTA (TD) showed that the model would achieve a better fit if
highly correlated indicators were adjusted. Additionally, even though indicator 14 had a
significant t-value at a level of .05 (10.60), this indicator had a potentially high error
variance (TD = .84), and a low contributing variance in measuring the construct (R2 =
.17) so that this item was deleted to achieve a better fitting model
In adjusting the error-correlated indicators (error covariances), there are three
options that can follow to improve the model fit; 1) One of the correlated indicators can
be deleted; 2) the estimation of two error-correlated indicators can be performed by
estimating the error covariance; and 3) the composite mean score from two error-
correlated indicators can be used to recreate the covariance matrices. However, the
specification of correlated errors for the purpose of improving the model fit should be
made based on the theoretical or empirical justification (Byrne, 1998; Jöreskog, 1993).
According to the results of the modification indices (MI), four sets of correlated
errors were found; between items 1 and 2 (MI = 131.59), items 8 and 9 (MI = 124.38),
items 9 and 10 (MI = 123.40), and items 8 and 10 (MI = 88.88). By looking at the
statements in item I (tourism has created jobs for our community) and item 2 (tourism has
attracted investment to our community), the two indicators are conceptually and
empirically related in that they explain that tourism development contributes to the local
economy (Yoon, 1998). Additionally, item 8 (tourism has encouraged a variety of
cultural activities by the local residents), item 9 (tourism has resulted in more cultural
exchange between tourists and residents), and item 10 (tourism had resulted in positive
impacts on the cultural identity of our community) are also conceptually associated with
tourism cultural impacts (Yoon, 1998).
For this study, the composite mean scores from items 1 and 2, and items 8, 9, and
10 were calculated and re-created the covariance matrices for estimating the re-specified

109
model in CFA. This procedure may be somewhat beneficial in that the original items are
not ignored so that information related to these items could be interpreted for practical
purposes. Further, this composite mean score may build stronger variances in estimating
a better fitting model.
After recreating the covariance matrices as an entered matrix for the CFA, the re-
specified model with four indicators was estimated. The final results of the CFA for
tourism development impacts are presented in Table 4.12. The re-specified model results
in a Chi-square (χ2) of 3.53 with 2 degrees of freedom that is not significant at a level of
.05 (p = .17). All other fit indices also showed that the data successfully fit the model
with GFI = 1.00, RMSR = .01, AGFI = .99, NNFI = 1.00, and PNFI = .33.
Additionally, the completely standardized factor loadings which determine the
relative importance of the observed variables as indicators of the tourism development
impact construct revealed comparatively high loadings, ranging from .59 to .88. In terms
of estimating the squared multiple correlations (R2), which are used to examine the extent
to which the measurement model adequately represents the observed indicators (Byrne,
1998; Kline, 1998), R2 values ranged between .35 and .78. These coefficient scores also
serve as indicator reliabilities (Bollen, 1989).
Further, the composite reliability of this measurement construct resulted in .86,
which exceeded the recommended threshold level of .70 (Hair et al., 1998, p. 642). As
another measure of reliability, the variance extracted measure was also calculated as
shown in the formula in Chapter III. This measure represents the overall amount of
variance in the indicators accounted for by the latent construct. The value should exceed
a threshold guideline level of .50 for the construct (Hair et al., 1998, p.653). In this study,
the extracted variance for the construct of tourism development impacts revealed a value
of .61, which exceeded a recommended level of .50.
Overall, the tourism development impact construct retained four observed
indicators with satisfactory results of fit indices, as discussed. Mainly, the measurement
items that are related to tourism economic and cultural impacts are relatively important
indicators to measure tourism development impacts in this study.
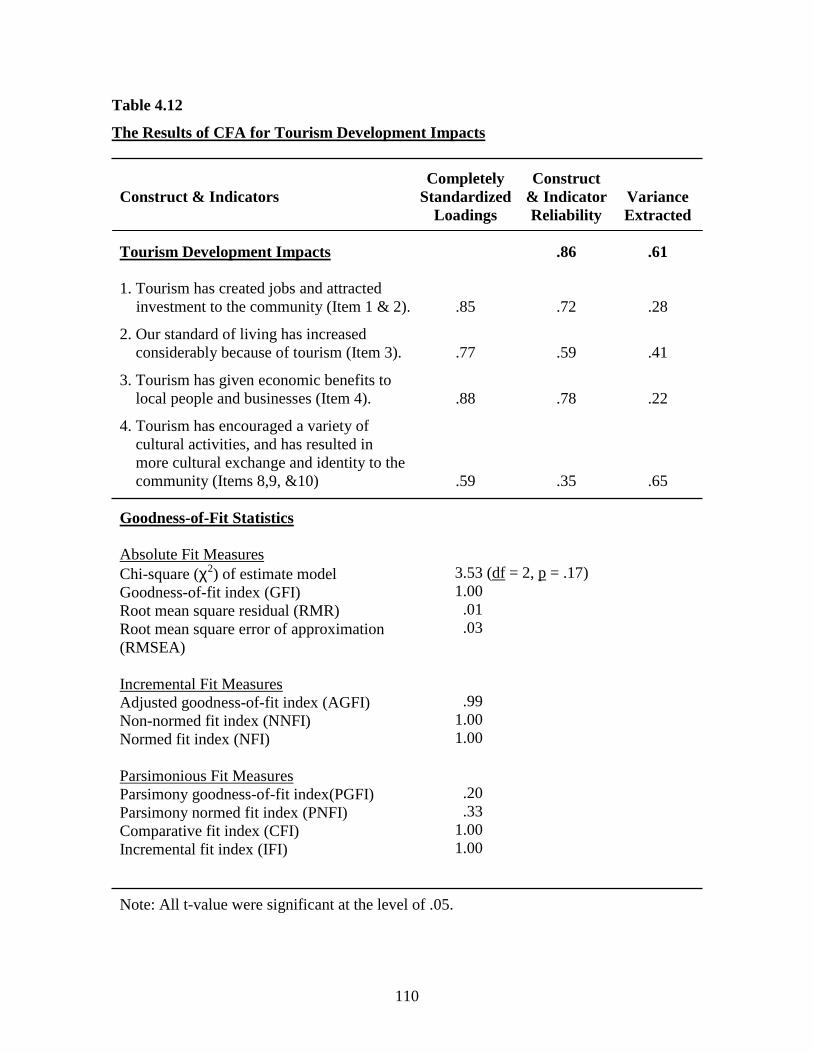
110
Table 4.12
The Results of CFA for Tourism Development Impacts
Construct & Indicators Completely
Standardized Loadings
Construct & Indicator Reliability
Variance Extracted
Tourism Development Impacts 1. Tourism has created jobs and attracted
investment to the community (Item 1 & 2). 2. Our standard of living has increased
considerably because of tourism (Item 3). 3. Tourism has given economic benefits to
local people and businesses (Item 4). 4. Tourism has encouraged a variety of
cultural activities, and has resulted in more cultural exchange and identity to the community (Items 8,9, &10)
.85
.77
.88
.59
.86
.72
.59
.78
.35
.61
.28
.41
.22
.65 Goodness-of-Fit Statistics Absolute Fit Measures Chi-square (χ2) of estimate model Goodness-of-fit index (GFI) Root mean square residual (RMR) Root mean square error of approximation (RMSEA) Incremental Fit Measures Adjusted goodness-of-fit index (AGFI) Non-normed fit index (NNFI) Normed fit index (NFI) Parsimonious Fit Measures Parsimony goodness-of-fit index(PGFI) Parsimony normed fit index (PNFI) Comparative fit index (CFI) Incremental fit index (IFI)
3.53 (df = 2, p = .17) 1.00 .01 .03 .99 1.00 1.00 .20 .33 1.00 1.00
Note: All t-value were significant at the level of .05.

111
Confirmatory Factor Analysis (CFA) for Environmental Attitudes
A total of 15 observed indicators were utilized to evaluate whether the collected
data fit the model of environmental attitudes (see, Table 3.3 & Figure 3.3). The results of
the initial estimation of the CFA for the construct did not show a well-fitting model.
having a Chi-square value of 525.27 with 90 degrees of freedom (p <.01) and an RMSEA
of .087. Other fit indices also indicated that the specified model was not acceptable and
needed to be re-specified, showing GFI = .90, AGFI = .87, NNFI = .85, and PNFI = .73.
After reviewing the t-values, standard errors, squared multiple correlations, and
completely standardized loadings, five items (4, 6, 9, 12, and 14) were deleted due to
their low contributions in fitting the data to the model.
With the re-specified model having ten observed indicators, CFA was run to
estimate the model. The results indicated that the model was improved, but still did not
produce the satisfactory results of a well-fitting model, showing a Chi-square value of
105.23 with 35 degrees of freedom (p < .01) and a RMSEA value of .056, even though
other fit indices yielded a somewhat acceptable level of value, including GFI = .97, AGFI
= .95, NNFI = .96, and PNFI = .74.
Subsequently, this means that the model possibly contained error-correlated
indicators. Therefore the modification indices were examined. There was clear evidence
of misspecification associated with the pairing of items: 1 and 11 (MI = 10.55), items 2
and 7 (MI =15.46), items 3 and 5 (MI = 17.5), items 7 and 8 (MI = 10.82), and items 8
and 10 (MI = 26.72) (see Table 3.3 and Figure 3.3).
These misspecified error variances are comparatively larger than those remaining.
According to Aish and Jöreskog (1990), these measurement error covariances may result
from some systematic error rather than random error, and these may also derive from
specific characteristics of either the items or the respondents. It may also be due to a mis-
specified model. Consequently, those four items having comparatively low values of the
squared multiple correlation and completely standardized loadings, and high values of
standard error variances were deleted (Items 3, 7, 8, and 11). A total of six observed
indicators remained to estimate the re-specified model.

112
Table 4.13
The Results of CFA for Environmental Attitudes
Construct & Indicators
Completely Standardized
Loadings
Construct & Indicator Reliability
Variance Extracted
Environmental Attitudes
1. We are approaching the limit of the number of people the earth can support (Item 1).
2. Humans have the right to modify the natural
environment to suit their needs (Item 2). 3. Mankind is severely abusing the
environment. (Item 5) 4. The so-called “ecological crisis” facing
humanity has been greatly exaggerated (Item 10).
5. The balance of nature is very delicate and
easily upset (Item 13). 6. If things continue on their present course,
we will soon experience a major ecological catastrophe. (Item 15).
.66
.52
.67
.72
.64
.79
.83
.44
.27
.45
.52
.41
.63
.45
.56
.73
.55
.48
.59
.37
Goodness-of-Fit Statistics Absolute Fit Measures Chi-square (χ2) of estimate model Goodness-of-fit index (GFI) Root mean square residual (RMR) Root mean square error of approximation (RMSEA) Incremental Fit Measures Adjusted goodness-of-fit index (AGFI) Non-normed fit index (NNFI) Normed fit index (NFI) Parsimonious Fit Measures Parsimony goodness-of-fit index (PGFI) Parsimony normed fit index (PNFI) Comparative fit index (CFI) Incremental fit index (IFI)
5.54 (df = 9, p = .78) 1.00 .01 .00 .99 1.00 1.00 .43 .60 1.00 1.00

113
The results of the estimation for the final specified model with six indicators are
presented in Table 4.13. Overall, the model produced quite satisfactory results, having a
Chi-square value of 5.54 with 9 degrees of freedom (p = .79) and a RMSEA value of .00.
Other fit indices also yielded quite strong values of a well-fitting model (GFI = 1.00,
RMSR = .01, AGFI = .99, NNFI = 1.00, PNFI = .60).
Further, the completely standardized loadings for the six observed indicators
ranged from .52 to .79, and the squared multiple correlations (R2) ranged between .27 and
.63. The estimates of the reliability and variance extracted for this construct yielded a
construct reliability of .83, and a variance extracted value of .44. These values were
assessed to see whether the specified indicators were sufficient in representing the
environmental attitude construct. However, the construct reliability exceeded the
recommended level of .70, but the variance extracted measure was somewhat short of the
recommended level of .50. This may due to the value of item 2, which had both a low
squared multiple correlation (.27) and a comparatively high error variance (.73). Thus,
more caution on this item was taken to produce a better fitting hypothesized model in a
further analysis that includes CFA for an overall measurement model. Still this
measurement scale with six indicators is reliable and acceptable to measure the construct
of environmental attitude.
Confirmatory Factor Analysis (CFA) for Place Attachment
The measurement scale for place attachment is comprised of 10 observed
indicators. However, as discussed in the earlier section concerning reliability and validity,
item 7, “The time I spend in my community could just as easily be spent somewhere
else,” did not contribute to building a high reliability of the scale for the place attachment
construct (Cronbach’s alpha = .90 without this item, and Cronbach’s alpha = .83 with this
item). Since the reliability coefficient estimates the internal consistency of the
measurement items or assesses the extent to which the items are inter-correlated, high
inter-item correlations explain that the items of a scale have a strong relationship to the
latent construct and are possibly measuring the same thing. Accordingly, item 7 may not
be a reliable item to measure place attachment so that during the process of CFA, much
114
attention was given to this time in terms of its standard error, squared multiple correlation
(R2), and completely standardized factor loadings.
The results of the initial estimation of the proposed model was not acceptable for
a well-fitting model. The Chi-square value of 517.11 with 35 degrees of freedom was
statistically significant (p < .001), suggesting that the hypothesized model was not
entirely adequate. The probability value associated with the Chi-square represents the
likelihood of obtaining a Chi-square value that exceeds the Chi-square value when a null
hypothesis is true. Accordingly, it can be explained that the proposed hypothesized model
of place attachment represents an unlikely condition with the current specified model and
should be rejected and re-specified in terms of estimating the parameters. Other indices
also provide evidence of an unacceptable model with GFI = .83, RMSR = .094, AGFI =
.74, NNFI = .85, and PNFI = .68). Consequently, four items (1, 7, 8, and 9) were
dropped, having a low squared multiple correlation (< .30), a high error variance ( > . 70),
and low completely standardized loadings (< .50). Then the CFA was run with the re-
specified model with six indicators.
In the second estimation of the re-specified model, the Chi-square value of 167.32
with 9 degrees of freedom decreased (p < .001), but the results still did not produce a
well-fitting model. Other fit indices were also improved, but did not support that the re-
specified model was acceptable as a well-fitting final model.
However, since all of the completely standardized loadings ranged from .56 to
.93, and also squared multiple correlations were between .32 and .86, the error covariance
matrices in the modification index were examined. Among the six items, the highest MI
value in terms of misspecified parameters was found between Items 6 and 10 (MI =
119.73), and also revealed the completely standardized expected change value of .30.
Additionally, evidence of error covariance was found between Items 4 and 5 (MI =
24.38), and Items 3 and 5 (MI = 12.12). These modification values indicated clear
evidence of misspecification for parameters, and needed to be adjusted. Based on the t-
value, completely standardized loading, and error variance, item 10 was dropped.
Because Item 5 had an error-correlated variance with two other items, it was deleted from
further analysis. Results of CFA for place attachment are presented in Table 4.14.

115
Table 4.14
The Results of CFA for Place Attachment
Construct & Indicators Completely
Standardized Loadings
Construct & Indicator Reliability
Variance Extracted
Place Attachment 1. I am very attached to my community. (Item 2) 2. I identify strongly with my community.
(Item 3) 3. This community means a lot to me. (Item 4) 4. No other place can compare to this
community. (Item 6)
.84
.90
.79
.64
.89
.81
.89
.79
.31
.68
.19
.11
.21
.69
Goodness-of-Fit Statistics Absolute Fit Measures Chi-square (χ2) of estimate model Goodness-of-fit index (GFI) Root mean square residual (RMR) Root mean square error of approximation (RMSEA) Incremental Fit Measures Adjusted goodness-of-fit index (AGFI) Non-normed fit index (NNFI) Normed fit index (NFI) Parsimonious Fit Measures Parsimony goodness-of-fit index(PGFI) Parsimony normed fit index (PNFI) Comparative fit index (CFI) Incremental fit index (IFI)
.45 (df = 2, p = .80) 1.00 .00 .00 1.00 1.00 1.00 .20 .33 1.00 1.00
116
With a total of four indicators for place attachment, CFA was run to estimate
whether the re-specified hypothesized model fit the collected data. As presented in Table
4.14, the Chi-square value of .45 with 2 degrees of freedom represented a better fit
compared to the previous model, and indicated a well fitting model. Other goodness-of-
fit indices also supported that the hypothesized model fits the collected sample data fairly
well (GFI = 1.00, RMSR = .001, AGFI = 1.00, NNFI = 1.00, and PNFI = .30). All of the
t-values associated with each of the loadings exceeded the critical values for the
significant level of 0.05 (1.96). Accordingly, it can be said that all variables were
significantly related to the construct of place attachment. The posited relationships among
the indicators and constructs were verified.
Further, the highest squared multiple correlation which assessed the extent to
which the measurement model was adequately represented by the observed measures was
.89 (Item 3, “I identify strongly with my community”) and the lowest squared multiple
correlation was .31 (Item 6, “No other place can compare to the community”).
Accordingly, it can be interpreted that, approximately 89% of the variance of Item 3 was
explained by the place attachment construct.
Additionally, item indicated the highest completely standardized loading of .90,
meaning that the item was the relatively highest indicator in measuring place attachment.
However, much attention should be given to Item 6 having the lowest loading (.31), and
the highest standard error (.69), even though this item exceeded the critical t-value at the
significant level of .01, because this item could contribute to a poor fit in the overall
measurement model.
The reliability and variance extracted measures of this construct were estimated
to assess whether those four specified observed indicators were sufficient to represent
place attachment. The results revealed that the construct reliability value was .89 and the
variance extracted value was .68, which exceeded the recommended levels of .70 and .50,
respectively. Overall, the goodness-of-fit indices and other estimated parameters and
variances substantially support that the hypothesized model with four observed indicators
fit the data fairly well.

117
Confirmatory Factor Analysis (CFA) for Development Preferences about Tourism
Attractions
This measurement scale consisted of 12 tourism attraction items. The respondents
were asked to indicate how much each tourism attraction was preferred in the
community. The Pearson correlations with standard deviations were calculated and
entered into the CFA as an input file.
The initial estimations of the hypothesized model did not produce satisfactory
results, indicating a Chi-square value of 928.29 with 54 degrees of freedom (p < .001)
and a RMSEA value of . 158. Based on the examination of the t-value, standard error,
squared multiple correlations (R2), and completed standardized factor loadings, those
items having unacceptable values of estimated parameters and variances were dropped,
including Items 1, 2, 3, 8, 9, and 11. Then, CFA was run again to estimate whether the re-
specified model with six observed indicators fit the data.
However, the re-estimated hypothesized model still was not adequate, showing
that a Chi-square value was 118.37 with 9 degrees of freedom and the RMSEA was .14.
Other indices were somewhat improved but did not support that the model fit fairly well
to the data (GFI = .94, RMSR = .04, AGFI = .87, NNFI = .81, and PNFI = .53). Based on
the examination of modification indices which represent misspecified error covariances,
it was identified that the error variance of Item 12 was highly correlated with the error
variances of four other items (MI ranged from 10.06 to 35.30). Subsequently, Item 12
was eliminated.
The next highest modification index (MI) value of misspecified parameters was
29.32, between Items 5 and 7. By looking at the statement of Item 5 (“Small independent
businesses - e.g., gift shops, guide services, campgrounds:), and Item 7 (“Pre-arranged
attractive and flexible tour packages”), these two items can be reasonably combined into
one item, so that the statement reads “small independent businesses such as gift shops,
prearranged attractive and flexible tour packages, guide services, and campgrounds.”
Accordingly, the composite mean score from these two items was calculated in order to
create a new covariance matrix with the other remaining items (4, 6, and 10). Table 4.15
presents the resulted model.
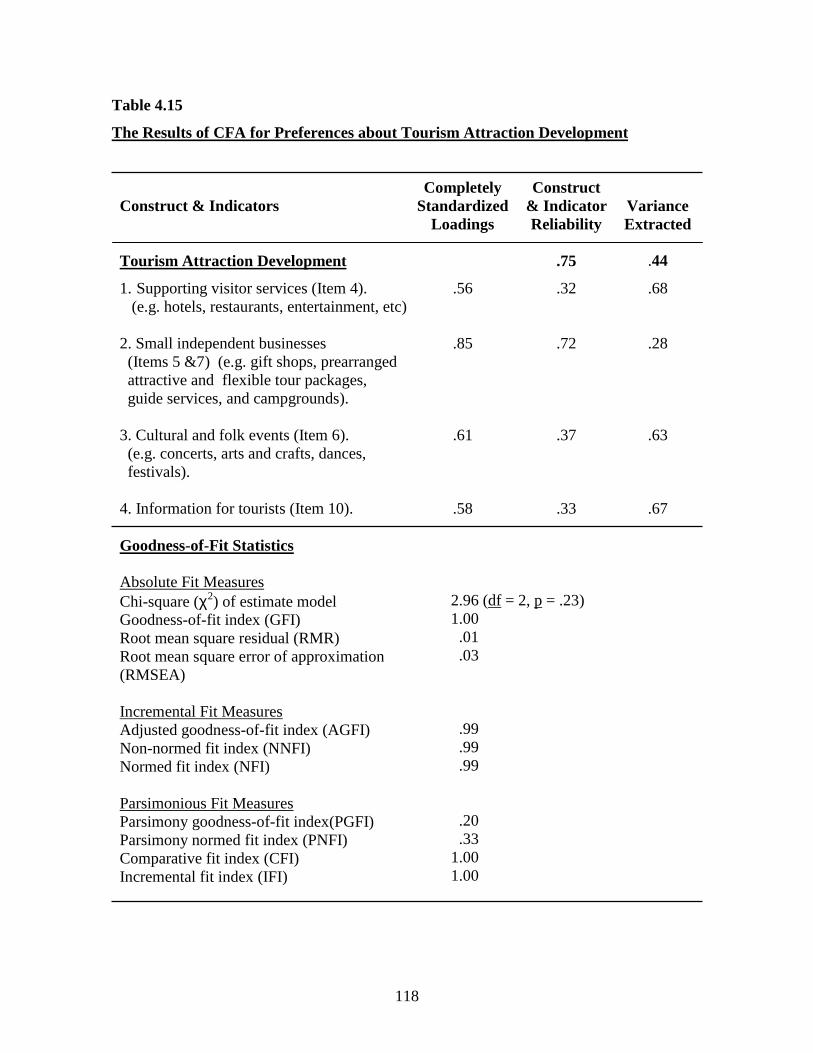
118
Table 4.15
The Results of CFA for Preferences about Tourism Attraction Development
Construct & Indicators Completely
Standardized Loadings
Construct & Indicator Reliability
Variance Extracted
Tourism Attraction Development 1. Supporting visitor services (Item 4). (e.g. hotels, restaurants, entertainment, etc) 2. Small independent businesses (Items 5 &7) (e.g. gift shops, prearranged attractive and flexible tour packages, guide services, and campgrounds).
3. Cultural and folk events (Item 6). (e.g. concerts, arts and crafts, dances, festivals).
4. Information for tourists (Item 10).
.56
.85
.61
.58
.75
.32
.72
.37
.33
.44
.68
.28
.63
.67 Goodness-of-Fit Statistics Absolute Fit Measures Chi-square (χ2) of estimate model Goodness-of-fit index (GFI) Root mean square residual (RMR) Root mean square error of approximation (RMSEA) Incremental Fit Measures Adjusted goodness-of-fit index (AGFI) Non-normed fit index (NNFI) Normed fit index (NFI) Parsimonious Fit Measures Parsimony goodness-of-fit index(PGFI) Parsimony normed fit index (PNFI) Comparative fit index (CFI) Incremental fit index (IFI)
2.96 (df = 2, p = .23) 1.00 .01 .03 .99 .99 .99 .20 .33 1.00 1.00
119
Finally, the re-specified hypothesized model with four indicators was estimated in
CFA. The results of estimated variances and fit indices were presented in Table 4.15.
Overall, the hypothesized model is adequate and fit the collected data fairly well, having
a Chi-square value of 2.96 with 2 degrees of freedom (p = .23) and other goodness-of-fit
indices (GFI = 1.00, RMR = .01, AGFI = .99, NNFI = .99, and PNFI = .33).
The t-value associated with each of the loadings exceeded the critical values for a
significant level of 0.05 (1.96) and a significant level of .001 (2.576). This means that all
variables were significantly related to the construct of preferences about tourism
attraction development, verifying the posited relationships among the indicators and
constructs. The completely standardized loadings ranged from .56 to .85. Item 2 related
to “small independent businesses” was found as relatively the most important indicator
among the observed four indicators. The examples of the tourism attractions given for
this indicator were gift shops, pre-arranged attractive and flexible tour packages, guide
services, and campgrounds.
Having a construct reliability of .75, which exceeded a recommended level of .70,
the specified four indicators for this construct were somewhat sufficient to represent the
development preferences about tourism attractions. However, for the variance extracted
measure, this construct had a value of .44, falling somewhat short of the recommended
level of .50. This means that more than half of the estimated variance for the specified
indicators for the construct was not enough (Hair et al., 1998, p.654). These insufficient
extracted variances may be due to the comparatively low correlations with the construct
and the high error covariance. In further analysis, much attention was given to each of the
observed indicators of this construct because the high standard errors may create large
error variances of the estimated parameters.
However, the overall model goodness-of-fit indices and the estimated parameters
and variances substantially supported hypothesized model with four observed indicators
fitting the model well to the data.
120
EFA and CFA for Support for Destination Competitive Strategy
Exploratory Factor Analysis for Support for Destination Competitive Strategy
The measurement scale of support for destination competitive strategy consists of
24 indicators. Prior to performing CFA, an exploratory factor analysis (EFA) was
conducted only for the purposes of reducing the number of variables from the observed
indicators in the measurement scale. Basically, factor analysis investigates relationships
between a set of observed variables and the construct, and examines the covariation
among a set of observed indicators in order to achieve underlying structures and collect
information on the construct (Byrne, 1998; Hair, Anderson, Tatham, & Black, 1998).
Specifically, EFA is conducted when links between the observed indicators and
the construct are unknown or uncertain. Since the measurement scale in this study was
newly measured for the study and was somewhat exploratory in nature, the determination
of how and to what extent the observed indicators are linked to the construct of
destination competitive strategy was essential. Typically, the underlying factors derived
from EFA are represented as correlations among sets of many interrelated variables
This procedure may help to decrease multicollinearity or error variance
correlations among indicators in the CFA of the measurement model. Such errors should
be avoided as much as possible in structural equation modeling procedures. As a result,
the identified items within a factor were calculated to create a composite mean score.
These composite factors were treated as indicators to measure the construct of support for
destination competitive strategy. Thus, from the composite mean scores, the covariance
matrix was calculated and entered as an input file in the CFA.
Since factor analysis is based upon correlations among variables, not respondents,
R-type factor analysis is employed. Furthermore, since the results from promax rotation
(the extracted factors are correlated with each other) were similar to the results of the
varimax rotation, the results of varimax rotation were reported so that the extracted
factors were independent and not correlated with each other. Regarding the sample size
(N= 646) of each variable, a 27- to-1 ratio was achieved so that the sample size was big
enough to run the factor analysis because it is normally recommended that a ten-to one
ratio of the sample size is acceptable (Hair et al., 1998).

121
With 24 items relating to support for destination competitive strategy, EFA was
performed. In order to derive and identify the underlying factors, a latent root criterion
(eigenvalue) value of above 1.0 and a factor loading of 0.30 was used as the benchmark
for including items in a factor. However, it was found that a number of variables,
including Items, 9, 10, 14, 15, 16, and 17 were strongly loaded on more than two factors.
Ideally, the determination of the uncorrelated factors was a major purpose of the EFA.
Those items double-loaded on the factors may create error covariances of
misspecification parameters in CFA, and those variables should be eliminated. This may
help to decrease standard errors as well as error covariances in this specific study.
Consequently, a total of 18 items of support for destination competitive strategy
was utilized for EFA. As an initial analysis, the Anti-image matrix indicated that most of
the values were negative or had a small value of partial correlation. The Bartlett test of
sphericity, which tests the presence of correlations among the variables indicates that the
Chi-square was 6,980.605 (df=153) with a significance of p <.001. The measure of
sampling adequacy (MSA), which analyzes a degree of intercorrelations, results was .91.
Basically, these examinations confirmed that since the initial analysis was acceptable,
further factor analysis was possible.
As presented in Table 4.16 (See also, Appendix G), three factors were derived
from the 18 support for destination competitive strategy items. All of the factor loadings
were over .50 and had an eigenvalue > 1.0. The first factor explained 27.69 percent of the
variance with an eigenvalue of 7.22. This factor was termed “Sustainable Management
and Practices” on the basis of the interpretation of the overall item context. The item
having the highest loading was “promoting ethical responsibility towards the natural
environment,” followed by the item “sensible use of nature resources.”
The second factor explained 24.76 percent of the variances with an eigenvalue of
3.19. This factor was termed “Marketing Efforts and Activities,” since all of the variables
loading on this factor were related to marketing strategies and actions such as target
market, destination image, overcoming seasonality, and promotion and operations for
international tourists. Additionally, the highest loading item was “increasing tourists’
length of stay,” and the lowest loading item was “use of modern, advanced technology
and information systems.”
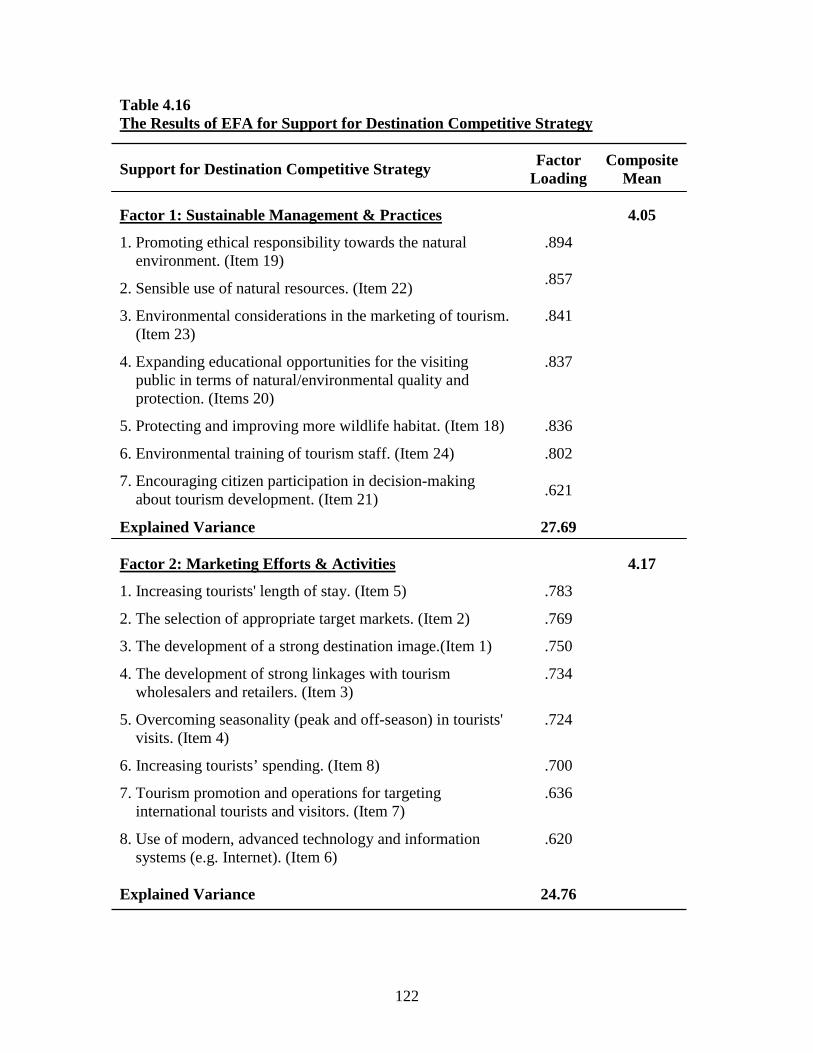
122
Table 4.16 The Results of EFA for Support for Destination Competitive Strategy
Support for Destination Competitive Strategy Factor Loading
Composite Mean
Factor 1: Sustainable Management & Practices 1. Promoting ethical responsibility towards the natural
environment. (Item 19) 2. Sensible use of natural resources. (Item 22) 3. Environmental considerations in the marketing of tourism.
(Item 23) 4. Expanding educational opportunities for the visiting
public in terms of natural/environmental quality and protection. (Items 20)
5. Protecting and improving more wildlife habitat. (Item 18) 6. Environmental training of tourism staff. (Item 24) 7. Encouraging citizen participation in decision-making
about tourism development. (Item 21) Explained Variance
.894
.857
.841
.837
.836
.802
.621
27.69
4.05
Factor 2: Marketing Efforts & Activities 1. Increasing tourists' length of stay. (Item 5) 2. The selection of appropriate target markets. (Item 2) 3. The development of a strong destination image.(Item 1) 4. The development of strong linkages with tourism
wholesalers and retailers. (Item 3) 5. Overcoming seasonality (peak and off-season) in tourists'
visits. (Item 4) 6. Increasing tourists’ spending. (Item 8) 7. Tourism promotion and operations for targeting
international tourists and visitors. (Item 7) 8. Use of modern, advanced technology and information
systems (e.g. Internet). (Item 6) Explained Variance
.783
.769
.750
.734
.724
.700
.636
.620
24.76
4.17

123
Table 4.16 The Results of EFA for Support for Destination Competitive Strategy (cont.)
Support for Destination Competitive Strategy Factor Loading
Composite Mean
Factor 3: Destination Management Organizations’ Roles 1. Local government and agencies' roles as facilitators for tourism development. (Item 12) 2. The leadership roles of local government and agencies in marketing this region as a tourism destination. (Item 13) 3. Establishing the cost of providing different levels of quality for various types of tourism experiences. (Item 11) Explained Variance
.829
.788
.634
11.95
3.79
Total Variance Explained
64.40
Note: 1 = Not at all favorable 5 = Highly favorable
Kaiser-Meyer-Olkin Measure of Sampling Adequacy = .95 Bartlett’s Test of Sphericity p <.001.
Lastly, the third factor explained 11.95 percent of the variances with an
eigenvalue of 1.18. Based on the examination of each item loaded on this factor, this
factor was considered as “Destination Management Organizations’ Roles.” The retained
variables were “local government and agencies’ roles as facilitators for tourism
development,” “the leadership roles of local government and agencies in marketing this
region as a tourism destination,” and “establishing the cost of providing different levels
of quality for various types of tourism experiences.” Basically, these statements were
associated with destination management organizations’ role in terms of how to develop
and market tourism destinations.
Overall, 64.40 percent of the variance was explained by three underlying factors
for support for destination competitive strategy. “Sustainable management and practices,”
“Destination marketing efforts and activities,” and “Destination Management
Organizations’ Roles” were identified as favorable strategies supported by tourism
stakeholders.

124
Confirmatory Factor Analysis for Support for Destination Competitive Strategy
From the exploratory factor analysis with 18 observed items, three factors were
derived, and the composite mean score of the items loading on the factors were
calculated, as shown in Table 4.16. In order to create an input file for CFA, the composite
mean scores were utilized and the correlation matrix with standard deviations was created
for estimating the hypothesized model for CFA.
The results of CFA are presented in Table 4.17. Since the hypothesized model
retained only three indicators, the model was saturated and the fit was perfect (Chi-square
= .00, p =1.00). In terms of other coefficient scores, t-values were significant at a level of
.001; the values of the completely standardized loadings were between .53 and .85. The
squared multiple correlations ranged from .28 and .72. In terms of the construct
reliability, the value of .71 slightly exceeded the recommended level of .70, so that these
three specified indicators representing the construct were moderately sufficient. Further,
an extracted variance value of .46, which is somewhat short of the recommended level of
.50, explained that more than half of the estimated variance for the specified indicators
for the construct was not enough to be accounted for by the construct. Accordingly, the
items which have low reliability and high error variance were examined in further
analysis, such as CFA for the overall measurement scale.
Table 4.17
The Results of CFA for Support for Destination Competitive Strategy
Construct & Indicators Completely
Standardized Loadings
Construct & Indicator Reliability
Variance Extracted
Support for Destination Competitive Strategy 1. Sustainable Management & Practices 2. Marketing Efforts & Activities 3. Destination Management Organizations’ Roles
.53
.62
.85
.71
.28
.39
.72
.46
.72
.61
.28
Goodness-of-Fit Statistics The model is saturated and the fit is perfect.
125
TESTING THE HYPOTHESIZIED MODEL
The study began with the development of a conceptual and theoretical model with
linkages between the latent constructs and their measurable variables. The supporting
relevant theories and discussion of the measurement variables associated with the
constructs were provided in the early sections of the literature review and the
methodology in Chapters II and III. Once the hypothetical constructs via their empirical
observed indicators were operationalized, the hypothesized structural model of how the
constructs are interrelated with each other was defined by the proposed hypotheses.
Subsequently, it was specified that the proposed hypotheses could be tested by SEM.
In structural equation modeling (SEM), the development of the hypothetical
model depicting the linkages between the latent constructs and their empirical observed
indicators is considered as a measurement model, while the theoretical relationships
between or among the constructs is referred to as a structural model (Bollen, 1989;
Byrne, 1998; Jöreskog, 1993). The measurement model can specify the patterns of how
the observed indicators load on the constructs, and also provides the measurement
properties of how much the observed indicators are reliable (reliability) and valid
(validity). A structural model can specify which of the construct(s) directly or indirectly
influence or change the values of other constructs in the model (Byrne, 1998; Maruyama,
1998). During the process of structural equation modeling, once the necessary
information and requirements of the full structural model are derived, the exogenous
(similar to independent) and endogenous (similar to dependent) constructs can be
defined. Specifically, changes in the values of the exogenous constructs are not explained
by the model, but changes in the values of the endogenous constructs are influenced by
the exogenous constructs in the model. Accordingly, all of the constructs fall into one of
these two categories.
In this proposed structural model, five theoretical constructs were discussed in
terms of not only their posited relationships with the observed indicators, but also
structural relationships among the constructs. Those include tourism development
impacts, environmental attitudes, place attachment, preferences about tourism attraction
development, and support for destination competitive strategy.
126
Overall Measurement Model
Prior to estimating the overall measurement model, each measurement model was
separately examined to investigate whether the collected data fit the specified observed
indicators of the construct successfully. Based on the results of the goodness-of-fit
indices, modification indices, and estimated coefficient scores such as t-values and
multiple correlations, the measurement models for each construct were modified and re-
specified.
Consequently, the final measurement model for each construct with the observed
indicators was determined on the basis of the statistical and theoretical soundness of the
constructs. Thus, each final model represented the best-fitting model to the data in terms
of parsimony and substantive meaningfulness.
Accordingly, 21 observed indicators associated with five constructs were
determined from CFA, as shown in Figure 4.2 and Table 4.18. This overall measurement
model to be tested consisted of five constructs represented by tourism development
impacts (TDI), environmental attitudes (EA), place attachment (PA), preferences about
tourism attraction development (TAD), and support for destination competitive strategy
(DCS). Given these five constructs, four observed indicators loaded onto TDI; six
observed indicators loaded onto EA, four observed indicators loaded onto PA, four
observed indicators loaded onto TAD, and three observed indicators loaded onto DCS.
In order to estimate the overall measurement model, this study utilized two split
samples instead of using an entire sample (N = 646) for CFA. The idea of this application
is to address the question of whether the hypothesized model in one sample replicates a
second independent sample from the same population so that the cross-validation of
estimated parameters and relationships with the constructs can be assessed. It also can be
tested to see whether the estimated parameters and relationships with the constructs are
meaningful and equivalent, given a specified sample size across two sets of samples.
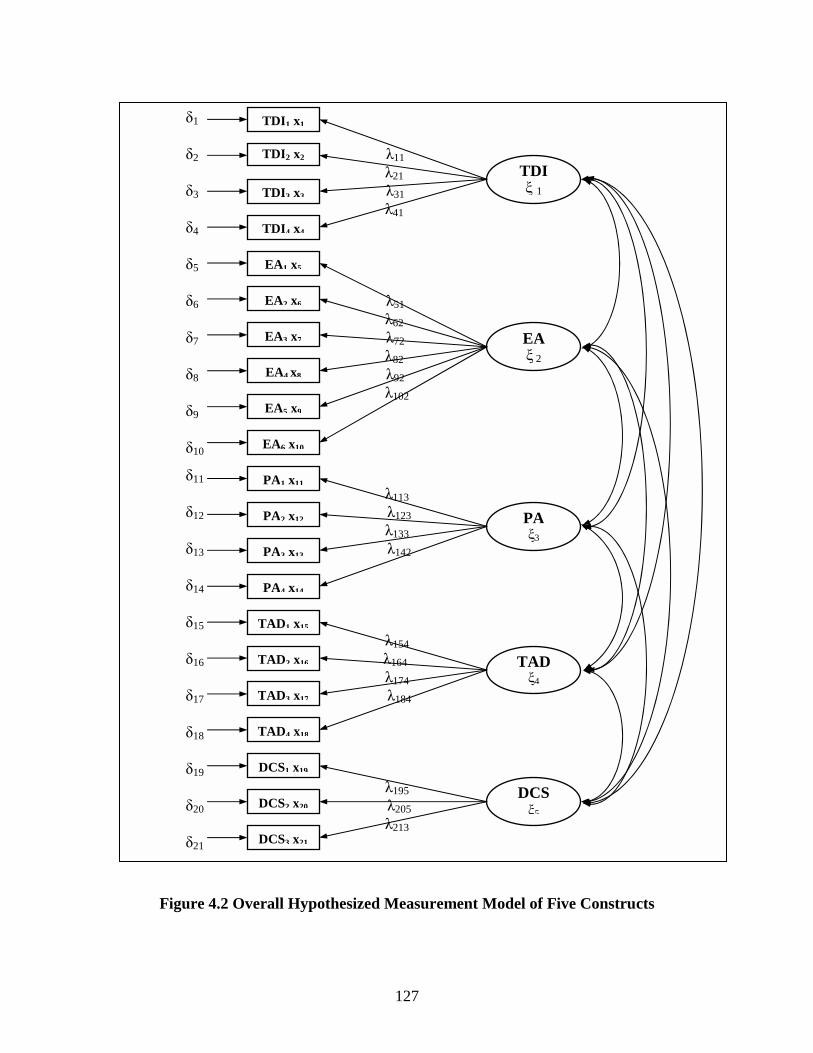
127
Figure 4.2 Overall Hypothesized Measurement Model of Five Constructs
δ1 δ2 λ11 λ21 δ3 λ31 λ41 δ4 δ5 δ6 λ51 λ62 δ7 λ72 λ82 δ8 λ92 λ102 δ9 δ10 δ11 λ113 δ12 λ123 λ133 δ13 λ142 δ14 δ15 λ154 δ16 λ164 λ174 δ17 λ184 δ18 δ19 λ195 δ20 λ205 λ213 δ21
TDI ξ 1
EA ξ 2
PA ξ3
TAD ξ4
DCS ξ5
TDI2 x2
TDI3 x3
TDI4 x4
EA1 x5
EA2 x6
EA3 x7
EA4 x8
EA5 x9
EA6 x10
PA1 x11
PA2 x12
PA3 x13
PA4 x14
TAD1 x15
TAD2 x16
TAD3 x17
TAD4 x18
DCS1 x19
DCS2 x20
DCS3 x21
TDI1 x1

128
Table 4.18
Five Constructs and 21 Observed Indicators for the Overall Measurement Model
Constructs & Indicators Tourism Development Impacts (TDI) TDI1: Tourism has created jobs and attracted investment to the community. TDI2: Our standard of living has increased considerably because of tourism. TDI3: Tourism has given economic benefits to local people and businesses. TDI4: Tourism has encouraged a variety of cultural activities, and has resulted in more cultural exchange and identity to the community. Environmental Attitudes (EA)
EA1: We are approaching the limit of the number of people the earth can support EA2: Humans have the right to modify the natural environment to suit their needs
EA3: Mankind is severely abusing the environment. EA4: The so-called “ecological crisis” facing humanity has been greatly exaggerated EA5: The balance of nature is very delicate and easily upset. EA6: If things continue on their present course, we will soon experience a major ecological catastrophe. Place Attachment (PA) PA1: I am very attached to my community. PA2: I identify strongly with my community. PA3: This community means a lot to me. PA4: No other place can compare to the community. Tourism Attraction Development (TAD) TAD1: Supporting visitor services. (e.g. hotels, restaurants, entertainment, etc) TAD2: Small independent businesses. (e.g. gift shops, prearranged attractive and flexible tour packages, guide services, and campgrounds) TAD3: Cultural and folk events. (e.g. concerts, arts and crafts, dances, festivals) TAD4: Information for tourists. Support for Destination Competitive Strategy (DCS) DCS1: Sustainable Management & Practices DCS2: Marketing Efforts & Activities DCS3: Destination Management Organizations’ Roles
Note: EA 2,4 and 6 were reverse-coded
129
In applying SEM, numerous approaches of cross-validation studies have been
made, depending upon the objective of the studies (Anderson & Gerbing, 1998; Byrne,
1998). The split sample approach is commonly used to validate results, given that the
sample size is sufficient. Since the sample size for this study is quite sufficient (N = 646)
to split into two sub-samples to meet the basic requirement in sample size for SEM, this
study used the split sample method for validating the results.
Consequently, this study tested the model replication of the overall measurement
model with 5 constructs and 21 observed indicators across the first subsample (n = 322),
and the second subsampe (n = 324). The first subsample can be called a calibration
sample, and the second subsample can be used as a validation sample (Byrne,1998;
Shumacker & Lomax, 1996). These two split samples were randomly chosen from the
entire collected sample. Accordingly, the overall measurement model was tested to see
whether the results from the validation sample replicated the results from the calibration
sample in terms of the estimated parameters and relationships with the constructs. The
final best-fitting model obtained from CFA for the calibration sample was tested to see
whether the hypothesized model fit the validation sample very well without any major
changes of parameter estimation.
CFA of Overall Measurement Model with the Calibration Sample
With the calibration sample (n = 322, 49.8% of the collected sample), the overall
measurement model with 5 constructs and 21 observed indicators was tested by CFA.
This method was used to estimate the hypothesized model fit and adequately describe the
calibration data.
An initial estimation of the measurement model did not produce acceptable levels
of model fit, having a Chi-square value of 313.27 with 179 degrees of freedom (p < .01).
Some of goodness-of-fit indices also revealed that the initial hypothesized model did not
fit the data very well, showing GFI (.91), AGFI (.89), and RMSEA (.05). These results
also indicated that the initial hypothesized model was not reliable and valid. The
modification indices suggested that more valid and reliable results of the overall
measurement model could be obtained by re-specifying the measurement model.

130
Based on an examination of modification indices, the indicators highly correlated
with other indicators or constructs were eliminated and a total of six indicators were
deleted; two indicators (TDI2 and TDI3) from tourism development impacts, two
indicators from environmental attitudes (EA2 and EA5), one indicator from tourism
attraction development (TAD1), and one indicator from support for destination
competitive strategy (DCS1). Consequently, the re-specified overall measurement model
with five constructs and 15 observed indicators was estimated by CFA.
In an assessment of model fit, the appropriateness of parameter estimates, the
individual measurement models, and the measurement model as a whole should be
evaluated to estimate a well-fitting model. Specifically, in an estimation of the fit of
individual parameters, the feasibility of the parameters estimates, the appropriateness of
the standard errors, and the statistical significance of the parameter estimates should be
examined (Byrne, 1998).
First of all, since the viability of individual estimated values should be determined
at an initial stage in assessing the fit of individual parameters in a model, estimated
parameters were examined in terms of not only the correct sign and size, but also as to
their consistency with the underlying theory. Subsequently, unreasonable estimates
having correlation values of greater than 1 and negative variances were not found in the
results of CFA for the re-specified model.
As shown in Table 4.19, which contains the estimates, standard errors, and t-
values for each observed indicator, all of the estimated parameters of the t-values
exceeded a recommended level of t-value for + 1,96 at a significant level of 0.05. The
examination of unstandardized solutions and the standard error showed that all of the
estimated parameters were reasonably and statistically significant. As a result, it can be
suggested that all of these estimated parameters are important to the hypothesized model.
As the second step in the estimation of parameters, the squared multiple
correlations (R2) were examined to see whether the hypothesized measurement model
appropriately represented the observed indicators (Byrne, 1998; Kline, 1998). These
correlations were also assessed to determine the indicator and construct reliability. As
presented in Table 4.20, the squared multiple correlations ranged from .27 to 90.

131
Table 4.19 Parameter Estimates for Overall Measurement Model (Calibration Sample=322)
Lamda – X TDI EA PA TAD DCS
TDI1 TDI4
Estimates Standard Error
T-value Estimates
Standard Error T-value
0.65 (0.07) 9.02 0.53
(0.06) 8.54
EA1 EA3 EA4 EA6
Estimates Standard Error
T-value Estimates
Standard Error T-value
Estimates Standard Error
T-value Estimates
Standard Error T-value
0.85 (0.06) 13.39 0.69
(0.06) 11.55 0.76
(0.06) 12.83 0.86
(0.06) 15.28
PA1 PA2 PA3 PA4
Estimates Standard Error
T-value Estimates
Standard Error T-value
Estimates Standard Error
T-value Estimates
Standard Error T-value
0.77 (0.04) 19.91 0.89
(0.04) 22.44 0.75
(0.04) 19.92 0.63
(0.06) 11.02
TA2 TA3 TA4
Estimates Standard Error
T-value Estimates
Standard Error T-value
Estimates Standard Error
T-value
0.52 (0.04) 13.68 0.50
(0.04) 12.03 0.45
(0.04) 11.21
DCS2 DCS3
Estimates Standard Error
T-value Estimates
Standard Error T-value
0.51 (0.05) 10.95 0.42 (0.05) 7.92
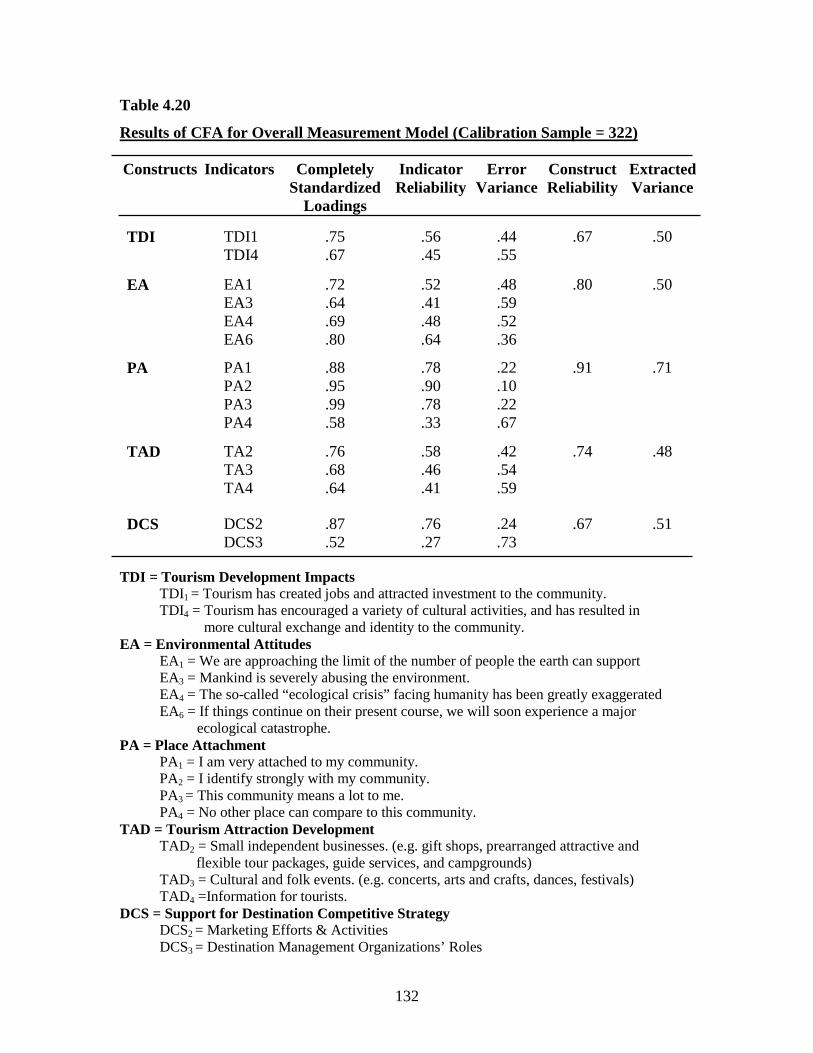
132
Table 4.20
Results of CFA for Overall Measurement Model (Calibration Sample = 322)
Constructs
Indicators Completely Standardized
Loadings
Indicator Reliability
Error Variance
Construct Reliability
Extracted Variance
TDI TDI1 TDI4
.75
.67 .56 .45
.44
.55 .67 .50
EA
EA1 EA3 EA4 EA6
.72
.64
.69
.80
.52
.41
.48
.64
.48
.59
.52
.36
.80 .50
PA
PA1 PA2 PA3 PA4
.88
.95
.99
.58
.78
.90
.78
.33
.22
.10
.22
.67
.91 .71
TAD TA2 TA3 TA4
.76
.68
.64
.58
.46
.41
.42
.54
.59
.74 .48
DCS DCS2 DCS3
.87
.52 .76 .27
.24
.73 .67 .51
TDI = Tourism Development Impacts TDI1 = Tourism has created jobs and attracted investment to the community.
TDI4 = Tourism has encouraged a variety of cultural activities, and has resulted in more cultural exchange and identity to the community. EA = Environmental Attitudes EA1 = We are approaching the limit of the number of people the earth can support
EA3 = Mankind is severely abusing the environment. EA4 = The so-called “ecological crisis” facing humanity has been greatly exaggerated EA6 = If things continue on their present course, we will soon experience a major
ecological catastrophe. PA = Place Attachment
PA1 = I am very attached to my community. PA2 = I identify strongly with my community. PA3 = This community means a lot to me. PA4 = No other place can compare to this community.
TAD = Tourism Attraction Development TAD2 = Small independent businesses. (e.g. gift shops, prearranged attractive and flexible tour packages, guide services, and campgrounds) TAD3 = Cultural and folk events. (e.g. concerts, arts and crafts, dances, festivals) TAD4 =Information for tourists.
DCS = Support for Destination Competitive Strategy DCS2 = Marketing Efforts & Activities DCS3 = Destination Management Organizations’ Roles
133
Additionally, the composite reliability of this measurement construct resulted in
TDI (.67), EA (.80), PA (.91), TAD (.74), and DCS (.67). TDI and DCS fall somewhat
short of composite reliability at the recommended threshold level of .70 (Hair et al., 1998,
p. 642). These results could be due to a number of indicators used to measure the
constructs. However, since the sample size for this study was sufficient enough to
estimate the hypothesized model, having a slightly smaller value than indicated for
composite reliability would not affect the construct correlations for the hypotheses tests.
Further, the completely standardized factor loadings were evaluated and resulted
in a range between .52 and .95. These completely standardized loadings were used to
determine the relative importance of the observed variables as indicators of the
constructs. Lastly, the extracted variances that represent the overall amount of variance in
the indicators accounted for by the latent constructs and values were calculated and
showed TDI (.50), EA (.50), PA (.71), TAD (.48), and DCS (.51), which exceed a
recommended level of .50 except for the TAD (Hair, Anderson, Tatham, & Black, 1998).
Having estimated the parameters of the measurement model, the hypothesized
model as a whole was examined by using three types of fit indices: absolute fit indices,
incremental fit indices, and parsimonious fit indices. The results of the goodness-of-fit
statistics with the calibration sample (n = 322) were reported in Table 4.21.
First of all, the absolute fit index is to directly measure how well an priori model
reproduces the collected sample data. In other words, it is used to assess how closely the
model compares to a perfect fit (Bollen, 1989; Hu & Bentler, 1995; Maruyama, 1998).
These indices include Chi-square (χ2) of the estimated model, Goodness-of-fit index
(GFI), Root mean square residual (RMR), and Root mean square error of approximation
(RMSEA). The Chi-square (χ2) of the estimated model was examined to test the
closeness of fit between the unrestricted sample covariance matrix and the restricted
covariance matrix. The Chi-square (χ2) value of 88.14 with 80 degrees of freedom was
not statistically significant at p = .25, thereby suggesting that the hypothesized overall
measurement model with five constructs and 15 indicators was appropriate and should be
accepted at this statistical level.
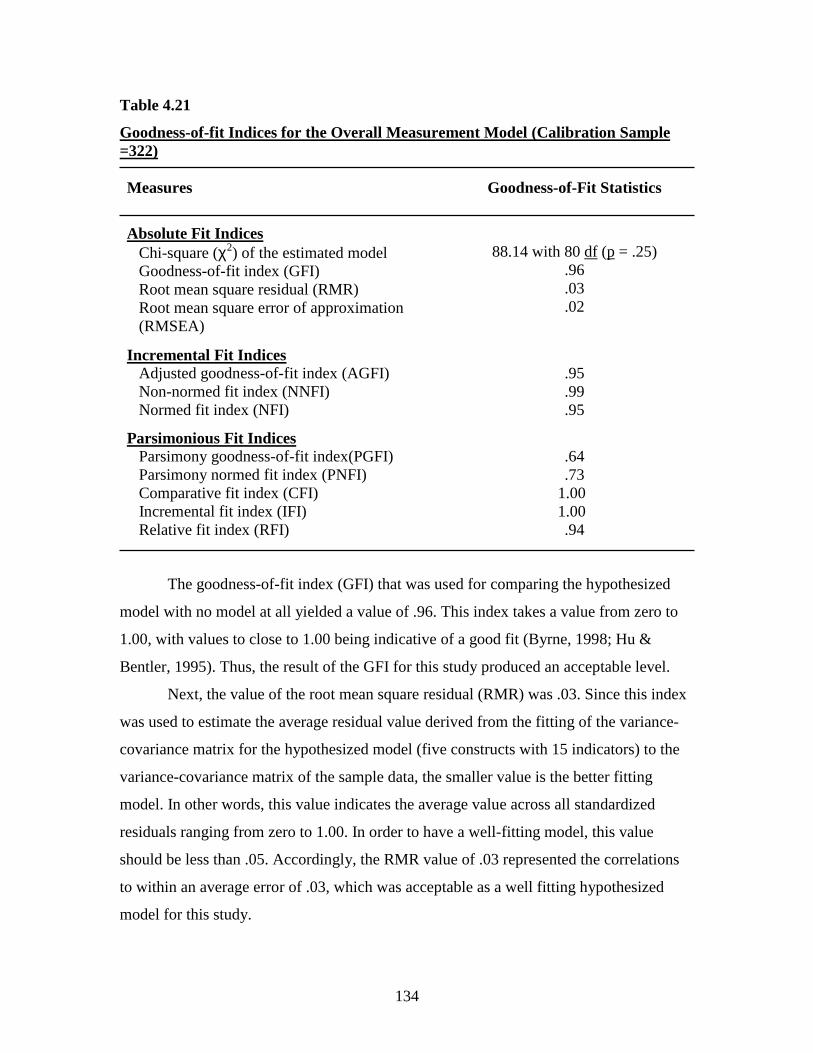
134
Table 4.21
Goodness-of-fit Indices for the Overall Measurement Model (Calibration Sample =322) Measures Goodness-of-Fit Statistics
Absolute Fit Indices Chi-square (χ2) of the estimated model Goodness-of-fit index (GFI) Root mean square residual (RMR) Root mean square error of approximation (RMSEA)
88.14 with 80 df (p = .25) .96 .03 .02
Incremental Fit Indices Adjusted goodness-of-fit index (AGFI) Non-normed fit index (NNFI) Normed fit index (NFI)
.95 .99 .95
Parsimonious Fit Indices Parsimony goodness-of-fit index(PGFI) Parsimony normed fit index (PNFI) Comparative fit index (CFI) Incremental fit index (IFI) Relative fit index (RFI)
.64 .73
1.00 1.00
.94
The goodness-of-fit index (GFI) that was used for comparing the hypothesized
model with no model at all yielded a value of .96. This index takes a value from zero to
1.00, with values to close to 1.00 being indicative of a good fit (Byrne, 1998; Hu &
Bentler, 1995). Thus, the result of the GFI for this study produced an acceptable level.
Next, the value of the root mean square residual (RMR) was .03. Since this index
was used to estimate the average residual value derived from the fitting of the variance-
covariance matrix for the hypothesized model (five constructs with 15 indicators) to the
variance-covariance matrix of the sample data, the smaller value is the better fitting
model. In other words, this value indicates the average value across all standardized
residuals ranging from zero to 1.00. In order to have a well-fitting model, this value
should be less than .05. Accordingly, the RMR value of .03 represented the correlations
to within an average error of .03, which was acceptable as a well fitting hypothesized
model for this study.

135
Lastly, the root mean square error of approximation (RMSEA) represents an
index to quantify model misfit, suggesting that a value of less than .05 indicates a good
fit, and values greater than .08 indicates reasonable errors of approximation in the
population (Hu & Bentler, 1995). The value of RMSEA for this hypothesized
measurement was .02, which falls inside the acceptable level. Additionally, this value
also yielded a 90% confidence interval ranging from .00 to .037, and the p-value for the
test of closeness-of-fit equaled 1.00. Subsequently, the value of RMSEA of .02 that fell
within the bounds of .00 and .037 represented a good degree of precision.
Overall, based on the examination of the absolute fit statistical indices, the
hypothesized model represented a well-fitting model to the data, in that the hypothesized
model fit the data for the calibration sample fairly well. Consequently, it can be suggested
that further analysis such as structural equation modeling was possible and valid.
For the second estimated goodness-of-fit statistics, the incremental fit indices
were examined. These incremental fit indices were used to evaluate the proportionate
improvement in fit by comparing a target model with a more restricted, nested baseline
model (Hu & Bentler, 1995). This includes the adjusted goodness-of-fit index (AGFI),
the non-normed fit index (NNFI), and the normed fit index (NFI).
The adjusted goodness-of-fit index (AGFI) may be considered an absolute
goodness-of-fit index (Byrne, 1998; Hu & Bentler, 1995). This index is similar to GFI,
but is also somewhat different in that it is adjusted for the number of degrees of freedom
in the specified model. Since the value of AGFI was .95,which exceeded a recommended
level of .90, the hypothesized model fit the calibration sample fairly well.
The NNFI takes the complexity of the model into account in the comparison of
the hypothesized model with the independent model. This index is similar to TLI (Tucker
and Lewis’ index) that was developed to quantify the degree to which a particular
exploratory factor model is an improvement over a zero factor model when assessing
maximum likelihood (Hu & Bentler, 1995). Since a value greater than .95 is an
acceptable level for well fitting data, the value of NNFI of .99 was accepted, suggesting
that the hypothesized model fit the data well.
The NFI represents the proportion of total covariance among observed variables
explained by a target model when using the null model as a baseline model (Hu &
136
Bentler, 1995). The values of NFI range from zero to 1.00. A value of NFI having a
greater than .95 is acceptable for indicating a well-fitting model. The value of NFI was
.95, suggesting that the model fit the data fairly well. Overall, the hypothesized model
successfully represented an adequate fit to the data.
Finally, the parsimonious fit indices provide information about a comparison
between models of differing complexity and objectives by evaluating the fit of the model
versus the number of estimated coefficients needed to achieve that level of fit. These
indices include the parsimony goodness-of-fit index (PGFI), the parsimony normed fit
index (PNFI), the comparative fit index (CFI), the incremental fit index (IFI), and the
relative fit index (RFI).
The parsimony goodness-of-fit index (PGFI) is related to the issue of the
parsimony of the model and takes into account the complexity of the hypothesized model
in the assessment of overall model fit (Byrne, 1998). The value varies between zero and
1.00, with higher values indicating greater model parsimony. Accordingly, as shown in
Table 4.21, the value of the PGFI was .64, suggesting that the hypothesized model fit the
data parsimoniously. The parsimony normed fit index (PNFI) explains the complexity of
the model in its assessment of goodness-of-fit. Basically this index is used for the
comparison of models with differing degrees of freedom. A higher value of the PNFI
indicates a better model fit. The value of the PNFI for this study was .73, which was an
acceptable value for a well-fitting model.
The incremental fit index (IFI) presents the issues of parsimony and sample size
that is associated with NFI, which is used to compare a restricted model with a full model
using a baseline null model. The value of the comparative fit index (CFI) measures the
improvement in non-centrality by going from the least restrictive model to the most
saturated model. The values of the CFI range from zero to 1.00. The relative fit index
(RFI) is equivalent to CFI. The higher value of IFI, CFI, and RFI indicate a better model
fit to the data. As shown in Table 4.23, the value of IFI, CFI, and RFI was 1.00, 1.00 and
.94 respectively, suggesting that these values were sufficient to support a well-fitting
model to the data.
As a result, the review of the three types of goodness-of-fit indices for the overall
measurement model (the calibration sample) revealed that the consistent patterns of
137
values of fit indices indicated that the model was well-fitted to the data, meaning that the
hypothesized model was reliable and valid in representing the calibration sample. In
addition to these multiple criteria, the examination of the theoretical and practical aspects
of the hypothesized model with 5 constructs and 15 observed indicators supported the
assessment that this hypothesized model was adequate in describing the collected data.
CFA of the Overall Measurement Model with the Validation Sample
The major purpose of this section is to address the question of whether the overall
measurement model that has been re-specified in the calibration sample replicates a
validation sample. Accordingly, the overall measurement model with 5 constructs and 15
observed indicators that has been hypothesized as a well-fitting model by
CFA for the calibration sample data was examined to see whether it adequately described
the validation sample (n = 324, 50.2% of a total sample).
As a result, an initial estimation of the measurement model for the validation data
described a well-fitting model to the data without any change within the re-specified
estimated parameters. As presented in Table 4.22, all of the estimated parameters of the t-
value exceeded a recommended level of + 1,96 at a significant level of 0.05. The
examination of unstandardized solutions and the standard errors showed that all of the
estimated parameters were reasonably and statistically significant.
Additionally, the squared multiple correlations (R2) that examined whether the
hypothesized measurement model appropriately represented the observed indicators
yielded between .39 and .90. The composite reliability of the constructs resulted in TDI
(.64), EA (.81), PA (.90), TAD (.74), and DCS (.77), and the completely standardized
factor loadings resulted in a range between .55 and .95. Lastly, the extracted variances
that represent the overall amount of variance in the indicators accounted for by the latent
construct were calculated and showed TDI (.47), EA (.52), PA (.66), TAD (.49), and
DCS (.64), which exceeded a recommended level of .50, except TAD. These results
confirmed that all estimated parameters showed similar patterns to the results of the
calibration sample in terms of the number of indicators, and the estimated coefficients of
the parameters.
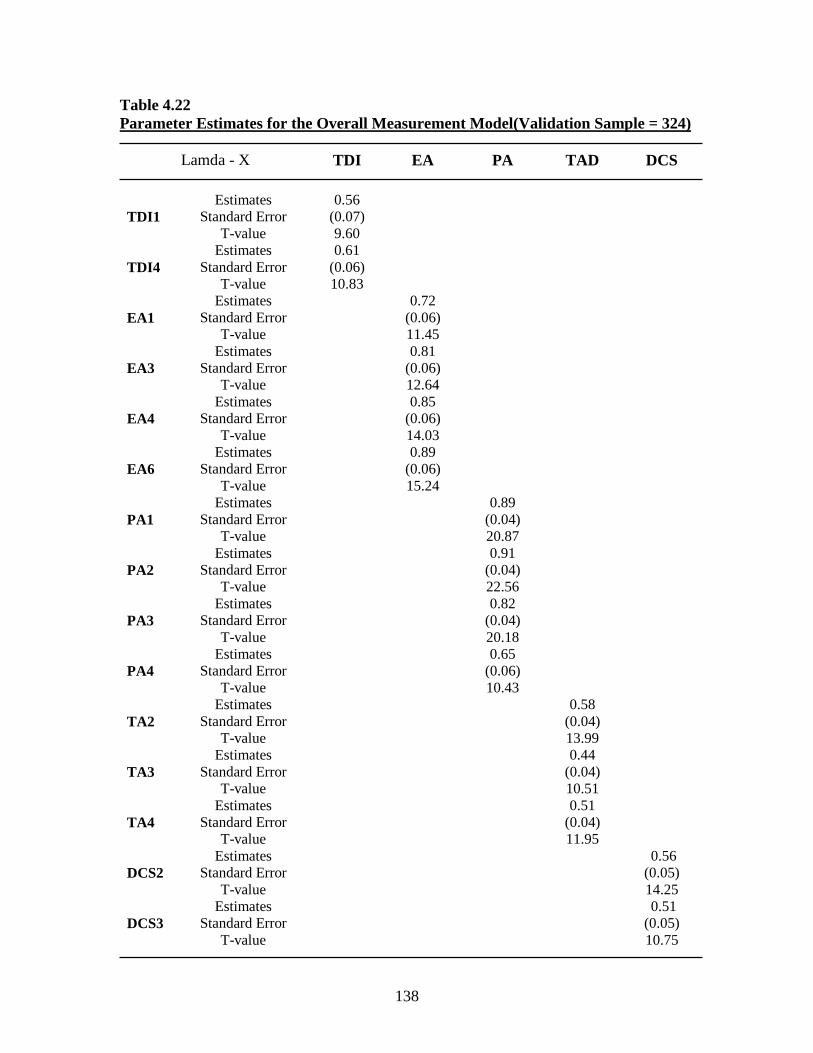
138
Table 4.22 Parameter Estimates for the Overall Measurement Model(Validation Sample = 324)
Lamda - X TDI EA PA TAD DCS
TDI1 TDI4
Estimates Standard Error
T-value Estimates
Standard Error T-value
0.56 (0.07) 9.60 0.61
(0.06) 10.83
EA1 EA3 EA4 EA6
Estimates Standard Error
T-value Estimates
Standard Error T-value
Estimates Standard Error
T-value Estimates
Standard Error T-value
0.72 (0.06) 11.45 0.81
(0.06) 12.64 0.85
(0.06) 14.03 0.89
(0.06) 15.24
PA1 PA2 PA3 PA4
Estimates Standard Error
T-value Estimates
Standard Error T-value
Estimates Standard Error
T-value Estimates
Standard Error T-value
0.89 (0.04) 20.87 0.91
(0.04) 22.56 0.82
(0.04) 20.18 0.65
(0.06) 10.43
TA2 TA3 TA4
Estimates Standard Error
T-value Estimates
Standard Error T-value
Estimates Standard Error
T-value
0.58 (0.04) 13.99 0.44
(0.04) 10.51 0.51
(0.04) 11.95
DCS2 DCS3
Estimates Standard Error
T-value Estimates
Standard Error T-value
0.56 (0.05) 14.25 0.51 (0.05) 10.75

139
Table 4.23 Results of CFA for the Overall Measurement Model (Validation Sample, n = 324)
Constructs
Indicators Completely
Standardized Loadings
Indicator Reliability
Error Variance
Construct Reliability
Extracted Variance
TDI TDI1 TDI4
.62
.74 .39 .55
.61
.45 .64 .47
EA
EA1 EA3 EA4 EA6
.63
.68
.74
.80
.40
.47
.55
.63
.60
.53
.45
.37
.81 .52
PA
PA1 PA2 PA3 PA4
.91
.95
.89
.55
.82
.90
.79
.30
.18
.10
.21
.70
.90 .66
TAD TA2 TA3 TA4
.79
.61
.68
.63
.37
.46
.37
.63
.54
.74 .49
DCS DCS2 DCS3
.92
.65 .86 .42
.14
.58 .77 .64
TDI = Tourism Development Impacts TDI1 = Tourism has created jobs and attracted investment to the community.
TDI4 = Tourism has encouraged a variety of cultural activities, and has resulted in more cultural exchange and identity to the community. EA = Environmental Attitudes EA1 = We are approaching the limit of the number of people the earth can support
EA3 = Mankind is severely abusing the environment. EA4 = The so-called “ecological crisis” facing humanity has been greatly exaggerated EA6 = If things continue on their present course, we will soon experience a major
ecological catastrophe. PA = Place Attachment
PA1 = I am very attached to my community. PA2 = I identify strongly with my community. PA3 = This community means a lot to me. PA4 = No other place can compare to the community.
TAD = Tourism Attraction Development TAD2 = Small independent businesses. (e.g. gift shops, prearranged attractive and flexible tour packages, guide services, and campgrounds) TAD3 = Cultural and folk events. (e.g. concerts, arts and crafts, dances, festivals) TAD4 =Information for tourists.
DCS = Support for Destination Competitive Strategy DCS2 = Marketing Efforts & Activities DCS3 = Destination Management Organizations’ Roles
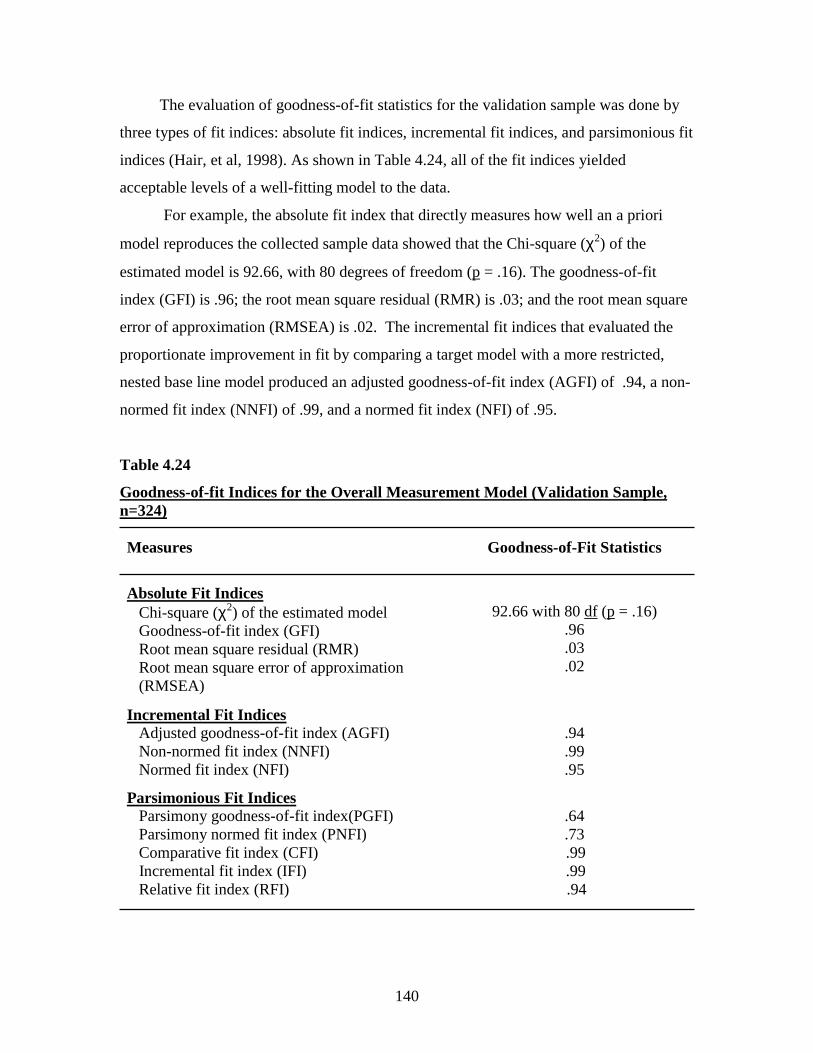
140
The evaluation of goodness-of-fit statistics for the validation sample was done by
three types of fit indices: absolute fit indices, incremental fit indices, and parsimonious fit
indices (Hair, et al, 1998). As shown in Table 4.24, all of the fit indices yielded
acceptable levels of a well-fitting model to the data.
For example, the absolute fit index that directly measures how well an a priori
model reproduces the collected sample data showed that the Chi-square (χ2) of the
estimated model is 92.66, with 80 degrees of freedom (p = .16). The goodness-of-fit
index (GFI) is .96; the root mean square residual (RMR) is .03; and the root mean square
error of approximation (RMSEA) is .02. The incremental fit indices that evaluated the
proportionate improvement in fit by comparing a target model with a more restricted,
nested base line model produced an adjusted goodness-of-fit index (AGFI) of .94, a non-
normed fit index (NNFI) of .99, and a normed fit index (NFI) of .95.
Table 4.24
Goodness-of-fit Indices for the Overall Measurement Model (Validation Sample, n=324) Measures Goodness-of-Fit Statistics
Absolute Fit Indices Chi-square (χ2) of the estimated model Goodness-of-fit index (GFI) Root mean square residual (RMR) Root mean square error of approximation (RMSEA)
92.66 with 80 df (p = .16) .96 .03 .02
Incremental Fit Indices Adjusted goodness-of-fit index (AGFI) Non-normed fit index (NNFI) Normed fit index (NFI)
.94 .99 .95
Parsimonious Fit Indices Parsimony goodness-of-fit index(PGFI) Parsimony normed fit index (PNFI) Comparative fit index (CFI) Incremental fit index (IFI) Relative fit index (RFI)
.64 .73
.99 .99
.94
141
Finally, the parsimonious fit indices provided information for comparison
between models of differing complexity and objectives by evaluating the fit of the model
versus the number of estimated coefficients needed to achieve that level of fit. For
example, the parsimony goodness-of-fit index (PGFI) was .64, the parsimony normed fit
index (PNFI) was.73, the comparative fit index (CFI) was .99, the incremental fit index
(IFI) was .99, and the relative fit index (RFI) was .94.
As a result, the review of the three types of the overall measurement model with
the validation sample revealed that the consistent patterns of values of fit indices
supported that the model fit the data well, meaning that the re-specified hypothesized
model from the calibration sample was reliable and valid in representing the validation
sample.
In addition to these multiple criteria of model fit indices, the examination of the
theoretical and practical aspects of the hypothesized model with five constructs and 15
observed indicators supported that the assessment of this hypothesized model was
adequate in describing the split data in both the calibration sample and the validation
sample. Accordingly, further analysis such as full structural equation modeling for the
hypotheses tests was possible and reliable.
Convergent and Discriminant Validity
Convergent and discriminant validity can both be considered as subcategories of
construct validity (Kline, 1998; Zikmund, 1997). In construct validity, the empirical
evidence is consistent with the theoretical logic about the concepts. Convergent validity
refers to the confirmation of the measurement of a construct by the use of multiple
methods. A measure has convergent validity when it is highly correlated with different
measures of similar constructs. Discriminant validity refers to the ability of some
measures to have a low correlation with measures of dissimilar concepts. Simply, it is
related to the distinctiveness of constructs. The correlations between two scales for two
distinct constructs should not be high for discriminant validity. In applying this concept,
the observed indicators used to measure the different constructs in models should provide
different results.
142
Particularly, in terms of the convergent validity, if the indicators specified to
measure a common underlying factor have relatively high loadings on that factor,
convergent validity is achieved (Anderson & Gerbing, 1988; Byrne, 1998; Kline, 1998).
These high loadings imply that strong correlations on the posited underlying construct are
achieved and the measurement scales are measuring what they are intended to measure
(Hather, 1994; Kline, 1998).
In a study of structural equation modeling, the standardized factor loading can be
examined to evaluate the convergent validity with an associated t-value from the results
of CFA. As seen in Table 4.19 (calibration sample) and 4.22 (validation sample), the
estimated coefficient standardized of the factor loadings on their posited underlying
construct yielded statistically significant results at the level of .05. Each observed
indicator exceeded the recommended level of t-value (+1.96). Fifteen indicators of
standardized factor loadings ranged from .52 to .99. Therefore, it can be concluded that
the measurement scale achieved convergent validity of the constructs.
For discriminant validity, this study used the procedures suggested by Anderson
and Gerbing (1988), to be sure that the constructs are not measuring the same concept or
idea. Accordingly, taking one pair of two constructs at a time, the results of the
unconstrained CFA were compared with the results of a constrained model. The
unconstrained CFA model was allowed to covary freely, while the constrained model
fixed to the factor covariance to zero, meaning that there was no correlation between two
constructs (Byrne, 1998).
In other words, discriminant validity can be examined by constraining the
estimated correlation parameter between each pair of constructs to 0.0 (the fixed model).
This implies that the correlation parameter is given as 0.0 to indicate that the two
constructs are uncorrelated. The unconstrained model (the free model) indicates that the
correlation between factors was estimated. A Chi-square difference test between the
constrained model and unconstrained model was performed. A significant Chi-square
difference between the models provided evidence of discriminant validity between the
pair of the constructs being tested (Anderson & Gerbing, 1988; Bagozzi, 1980, p.142).
Additionally, a significantly lower Chi-square value for the unconstrained model
indicates that discriminant validity is achieved (Bagozzi & Phillips, 1982) and the
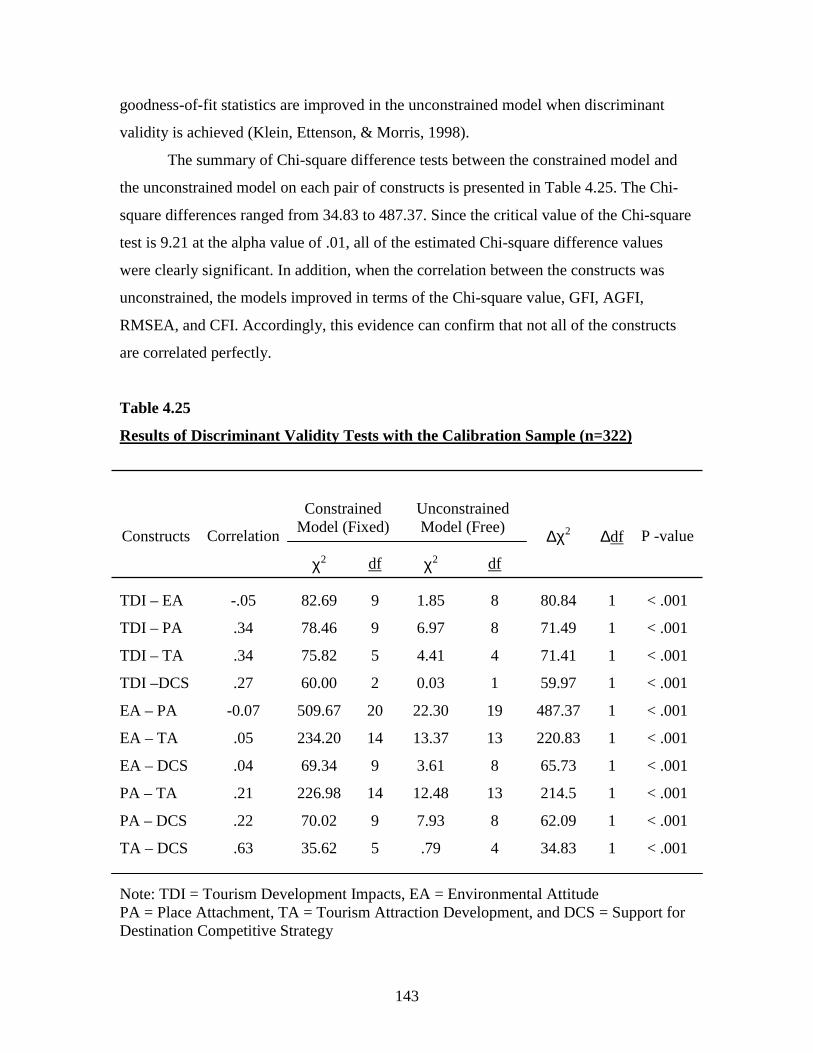
143
goodness-of-fit statistics are improved in the unconstrained model when discriminant
validity is achieved (Klein, Ettenson, & Morris, 1998).
The summary of Chi-square difference tests between the constrained model and
the unconstrained model on each pair of constructs is presented in Table 4.25. The Chi-
square differences ranged from 34.83 to 487.37. Since the critical value of the Chi-square
test is 9.21 at the alpha value of .01, all of the estimated Chi-square difference values
were clearly significant. In addition, when the correlation between the constructs was
unconstrained, the models improved in terms of the Chi-square value, GFI, AGFI,
RMSEA, and CFI. Accordingly, this evidence can confirm that not all of the constructs
are correlated perfectly.
Table 4.25
Results of Discriminant Validity Tests with the Calibration Sample (n=322)
Constrained
Model (Fixed)
Unconstrained Model (Free)
Constructs Correlation
χ2 df χ2 df
∆χ2 ∆df P -value
TDI – EA -.05 82.69 9 1.85 8 80.84 1 < .001
TDI – PA .34 78.46 9 6.97 8 71.49 1 < .001
TDI – TA .34 75.82 5 4.41 4 71.41 1 < .001
TDI –DCS .27 60.00 2 0.03 1 59.97 1 < .001
EA – PA -0.07 509.67 20 22.30 19 487.37 1 < .001
EA – TA .05 234.20 14 13.37 13 220.83 1 < .001
EA – DCS .04 69.34 9 3.61 8 65.73 1 < .001
PA – TA .21 226.98 14 12.48 13 214.5 1 < .001
PA – DCS .22 70.02 9 7.93 8 62.09 1 < .001
TA – DCS .63 35.62 5 .79 4 34.83 1 < .001
Note: TDI = Tourism Development Impacts, EA = Environmental Attitude PA = Place Attachment, TA = Tourism Attraction Development, and DCS = Support for Destination Competitive Strategy
144
Structural Equation Modeling (SEM)
This study adopted structural equation modeling (SEM) in testing the hypotheses
because SEM has been applied in testing hypotheses about relationships among observed
latent variables (Hoyle, 1995b). Particularly, SEM has been considered as a way of
testing a specified theory about relationships between theoretical constructs (Jöreskog,
1995).
More specifically, the structural equation model is used to test a hypothetical
model that prescribes relationships between latent constructs and observed variables that
are indicators of latent constructs. The relationships between the constructs can be
identified by providing path coefficients (parameter values) for each of the research
hypotheses. Each estimated path coefficient can be tested for its respective statistical
significance for the hypotheses’ relationships, while including standard errors and
calculated t-values (Bollen, 1989a; Byrne, 1998; Hair et al., 1998; Loehlin, 1992).
Initial Theoretical Structural Model
The primary objectives of this study were to develop a theoretical model of
tourism destination competitiveness and to empirically test the interplay of relationships
among the following constructs: 1) perceived tourism impacts, 2) environmental
attitudes, 3) place attachment, 4) development preferences about destination
attractions/resources, and 5) support of enhancement strategies for destination
competitiveness.
In testing the proposed hypotheses for this study, an initial theoretical structural
model was examined with three exogenous constructs and two endogenous constructs, as
presented in Figure 4.3. The properties of the five research constructs are as follows:
three exogenous – tourism development impacts (TDI), environmental attitudes (EA),
and place attachment (PA); and two endogenous – tourism attraction development (TA)
and support for destination competitive strategy (DCS). A total of 15 observed indicators
(10 for exogenous constructs and 5 for endogenous constructs) were used to measure
these five research constructs.
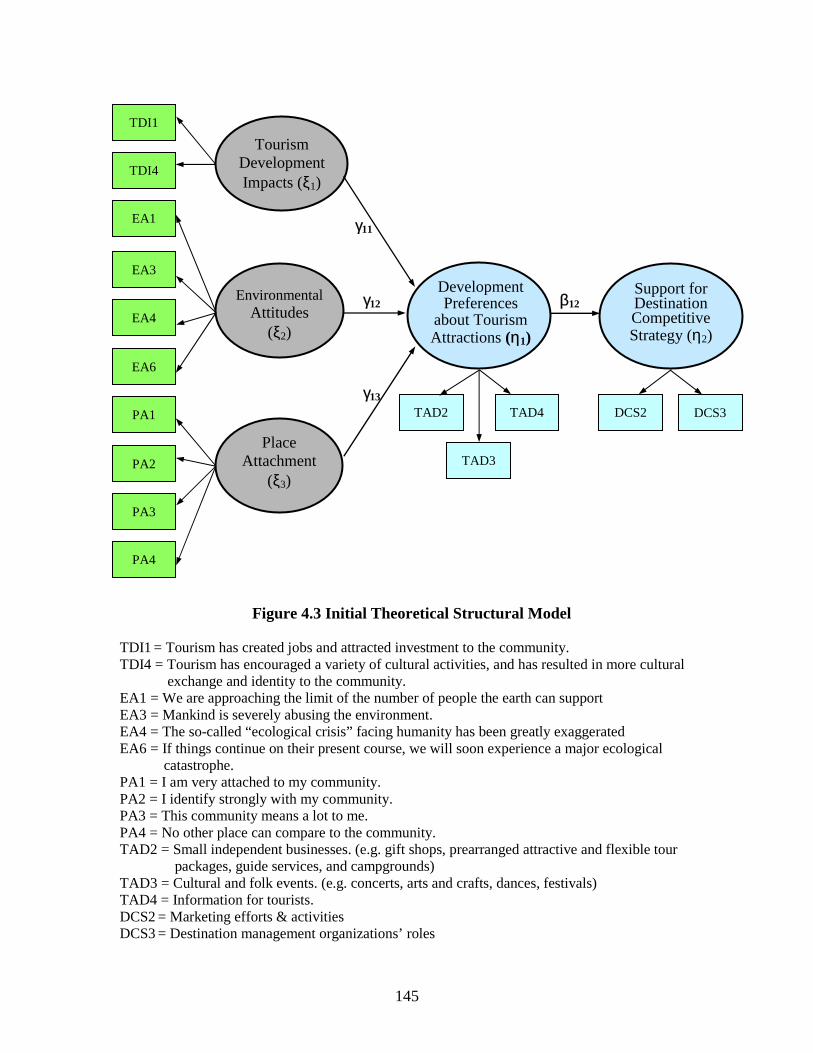
145
γ11 γ12 β12 γ13
Figure 4.3 Initial Theoretical Structural Model TDI1 = Tourism has created jobs and attracted investment to the community. TDI4 = Tourism has encouraged a variety of cultural activities, and has resulted in more cultural exchange and identity to the community. EA1 = We are approaching the limit of the number of people the earth can support EA3 = Mankind is severely abusing the environment. EA4 = The so-called “ecological crisis” facing humanity has been greatly exaggerated EA6 = If things continue on their present course, we will soon experience a major ecological catastrophe. PA1 = I am very attached to my community. PA2 = I identify strongly with my community. PA3 = This community means a lot to me. PA4 = No other place can compare to the community. TAD2 = Small independent businesses. (e.g. gift shops, prearranged attractive and flexible tour packages, guide services, and campgrounds) TAD3 = Cultural and folk events. (e.g. concerts, arts and crafts, dances, festivals) TAD4 = Information for tourists. DCS2 = Marketing efforts & activities DCS3 = Destination management organizations’ roles
Tourism Development Impacts (ξ1)
Environmental Attitudes
(ξ2)
Place Attachment
(ξ3)
Development Preferences
about Tourism Attractions (η1)
Support for Destination Competitive Strategy (η2)
TDI1
TDI4
EA1
EA3
EA4
EA6
PA1
PA2
PA3
PA4
TAD3
TAD4 TAD2 DCS2 DCS3
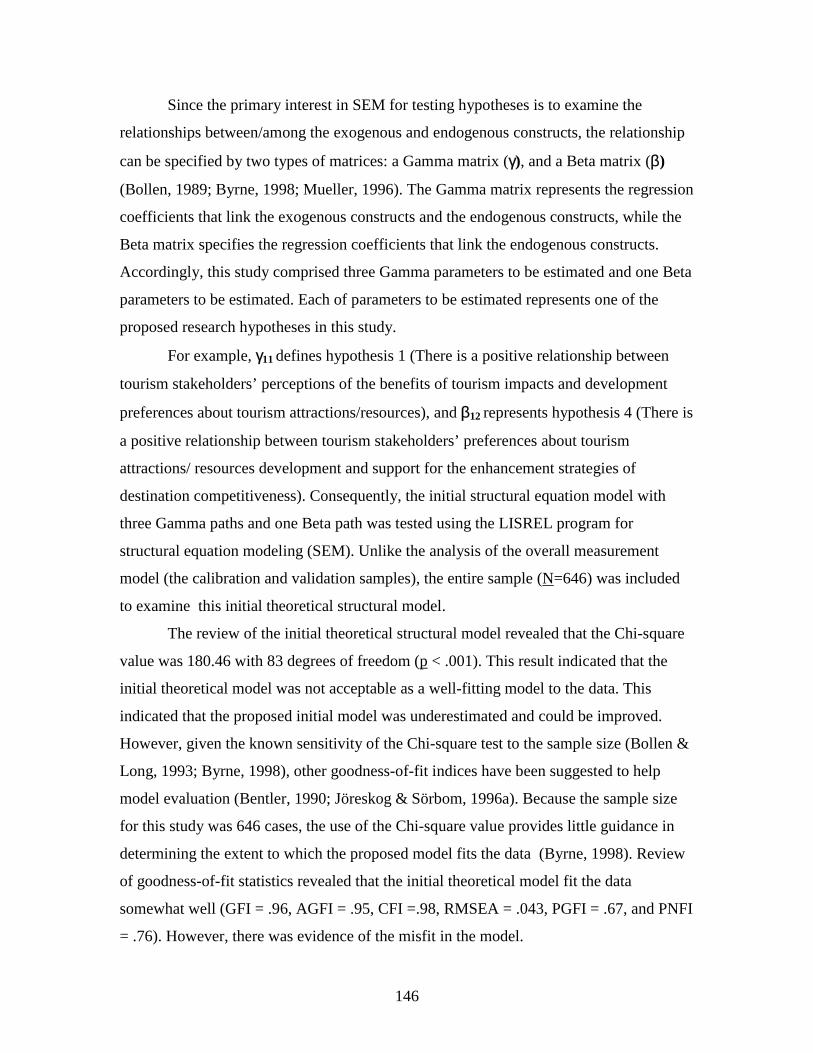
146
Since the primary interest in SEM for testing hypotheses is to examine the
relationships between/among the exogenous and endogenous constructs, the relationship
can be specified by two types of matrices: a Gamma matrix (γ), and a Beta matrix (β)
(Bollen, 1989; Byrne, 1998; Mueller, 1996). The Gamma matrix represents the regression
coefficients that link the exogenous constructs and the endogenous constructs, while the
Beta matrix specifies the regression coefficients that link the endogenous constructs.
Accordingly, this study comprised three Gamma parameters to be estimated and one Beta
parameters to be estimated. Each of parameters to be estimated represents one of the
proposed research hypotheses in this study.
For example, γ11 defines hypothesis 1 (There is a positive relationship between
tourism stakeholders’ perceptions of the benefits of tourism impacts and development
preferences about tourism attractions/resources), and β12 represents hypothesis 4 (There is
a positive relationship between tourism stakeholders’ preferences about tourism
attractions/ resources development and support for the enhancement strategies of
destination competitiveness). Consequently, the initial structural equation model with
three Gamma paths and one Beta path was tested using the LISREL program for
structural equation modeling (SEM). Unlike the analysis of the overall measurement
model (the calibration and validation samples), the entire sample (N=646) was included
to examine this initial theoretical structural model.
The review of the initial theoretical structural model revealed that the Chi-square
value was 180.46 with 83 degrees of freedom (p < .001). This result indicated that the
initial theoretical model was not acceptable as a well-fitting model to the data. This
indicated that the proposed initial model was underestimated and could be improved.
However, given the known sensitivity of the Chi-square test to the sample size (Bollen &
Long, 1993; Byrne, 1998), other goodness-of-fit indices have been suggested to help
model evaluation (Bentler, 1990; Jöreskog & Sörbom, 1996a). Because the sample size
for this study was 646 cases, the use of the Chi-square value provides little guidance in
determining the extent to which the proposed model fits the data (Byrne, 1998). Review
of goodness-of-fit statistics revealed that the initial theoretical model fit the data
somewhat well (GFI = .96, AGFI = .95, CFI =.98, RMSEA = .043, PGFI = .67, and PNFI
= .76). However, there was evidence of the misfit in the model.

147
Revised Structural Model
The review of the modification indices suggested that the initial theoretical model
could be improved in order to represent a better model fit to the data. For example, the
maximum modification index (MI) was 58.57 for theta-epsilon (TE) between TAD2 and
TAD3 (TE - 1, 2), implying that these error variances were highly correlated and
provided evidence of misfit in the model (see Figure 4.4). Since every correlated error
covariance must be justified and interpreted substantially (Jöreskog, 1993), the correlated
error variance between the indicator TAD2 (small independent businesses - e.g. gift
shops, prearranged attractive and flexible tour packages, guide services, and
campgrounds) and TAD3 (cultural and folk events - e.g. concerts, arts and crafts, dances,
festivals) could be justified on the basis of studies done by Jurowski (1994) and Yoon,
Gursoy, and Chen (2001). Both studies indicated that the respondents supported both
small independent business and cultural folk events as tourism attractions, and these
indicators successfully measured the construct of supporting tourism attraction
development, which explained correlations between the indicators. Consequently, the
covariance between these two indicators was reasonably acceptable.
After re-estimating the theoretical model with TE (1,2) specified as a free
parameter, the Chi-square value dropped to 127.03 with 82 degrees of freedom (p <
.001). Goodness-of-fit statistics were improved. However, the review of modification
indices still revealed a misfit in the model and suggested that there was strong error-
variance between TAD1 and TAD 3 (information for tourists), which was a value of 19.2
for TE (1.3). Again, according to the studies done by Jurowski (1994) and Yoon et al.
(2001), the error covariance was reasonably acceptable. The indicators TAD3 and the
indicator TAD4 measured the same construct of supporting tourism development, which
was evidence of a correlation between these two items. Subsequently, the re-specified
model with an error covariance between the indicator TAD3 and the indicator TAD4
freely estimated was evaluated to see whether the model fit the data well. The second re-
specified model provided a Chi-square value of 107.93 with 81 degrees of freedom (p =
.024), and other goodness-of-fit statistics reached quite satisfactory levels for a well-
fitting model (GFI = .98, AGFI = .97, CFI =.99, and RMSEA = .023).
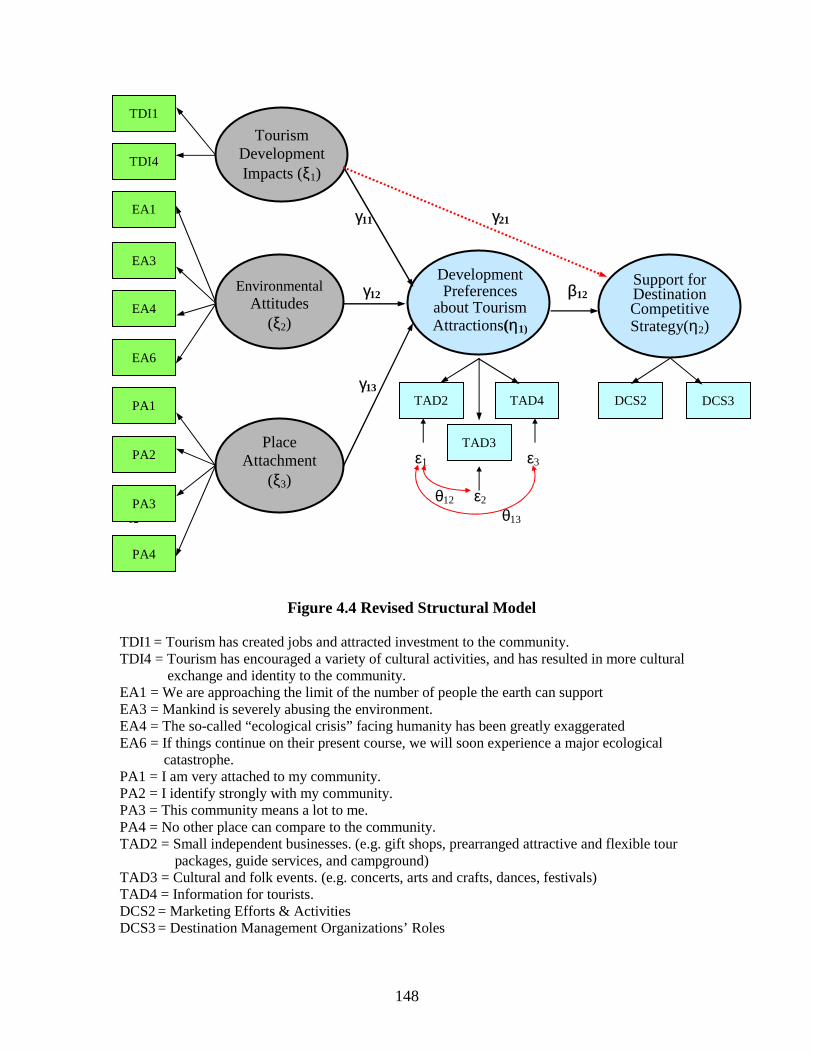
148
γ11 γ21 γ12 β12 γ13 ε1 ε3 θ12 ε2 θ12 θ13
Figure 4.4 Revised Structural Model TDI1 = Tourism has created jobs and attracted investment to the community. TDI4 = Tourism has encouraged a variety of cultural activities, and has resulted in more cultural exchange and identity to the community. EA1 = We are approaching the limit of the number of people the earth can support EA3 = Mankind is severely abusing the environment. EA4 = The so-called “ecological crisis” facing humanity has been greatly exaggerated EA6 = If things continue on their present course, we will soon experience a major ecological catastrophe. PA1 = I am very attached to my community. PA2 = I identify strongly with my community. PA3 = This community means a lot to me. PA4 = No other place can compare to the community. TAD2 = Small independent businesses. (e.g. gift shops, prearranged attractive and flexible tour packages, guide services, and campground) TAD3 = Cultural and folk events. (e.g. concerts, arts and crafts, dances, festivals) TAD4 = Information for tourists. DCS2 = Marketing Efforts & Activities DCS3 = Destination Management Organizations’ Roles
Tourism Development Impacts (ξ1)
Environmental Attitudes
(ξ2)
Place Attachment
(ξ3)
Development Preferences
about Tourism Attractions(η1)
Support for Destination Competitive Strategy(η2)
TDI1
TDI4
EA1
EA3
EA4
EA6
PA1
PA2
PA3
PA4
TAD3
TAD4 TAD2 DCS2 DCS3

149
Lastly, the examination of modification indices revealed that the model could
have a better fit if a direct path was added from tourism development impacts (TDI) to
support for destination competitive strategy (DCS) (Gamma 2, 1), which was not
hypothesized to be tested in this study. The value of the modification index for Gamma
(2.1) was 5.76, which was the highest modification index compared to other Gamma
paths, including .09 for Gamma 2,2 and 1.49 for Gamma 2,3. It would be reasonable to
assume that if respondents perceive more benefits from tourism development, they would
be likely to support destination competitive strategies. As a result, it was reasonable to
draw a path link between tourism development impacts and support for destination
competitive strategy (Gamma, 2, 1). Consequently, given the meaningfulness of this
influential flow, the final revised model was re-estimated with TE (1,2), TE (1,3), and
GA (2,1) as free parameters.
The estimation of the final revised model yielded a Chi-square value of 101.97
with 80 degrees of freedom (p < .05), which was not statistically significant.
Additionally, all of the goodness-of-fit statistics supported that the final revised model
was a well-fitting model to the data and suggested that this model could be a final
structural model to be tested for the proposed hypotheses in this study (GFI = .98, RMR
= .026, RMSEA = .02, AGFI = .97, NNFI = .99, NFI = .98, PGFI = .65, CFI = .99, and
IFI =.99). The summary of the revision processes and the associated goodness-of-fit
statistics with added parameters was reported in Table 4.26.
Having assessed the final revised model, a post-hoc test by using sequential Chi-
square tests was conducted to provide successive fit information (Anderson & Gerbing,
1988). As presented in Table 4.27, the Chi-square difference tests between the models
(theoretical model and revised model 1; revised model 1 and revised model 2) showed
that there were no statistical differences at the significance level of .01 (Chi-square
critical value is 9.21). However, it was found that there was a statistically significant
difference between the revised model 2 and the final model at the significance level of
.01 (Chi-square value was 5.96 with 1 degree of freedom). In a case of no difference in
the Chi-square test, the more parsimonious model should be selected (Hull, Lehn, &
Tedlie, 1995). The final revised model should be the revised model 2 in this study
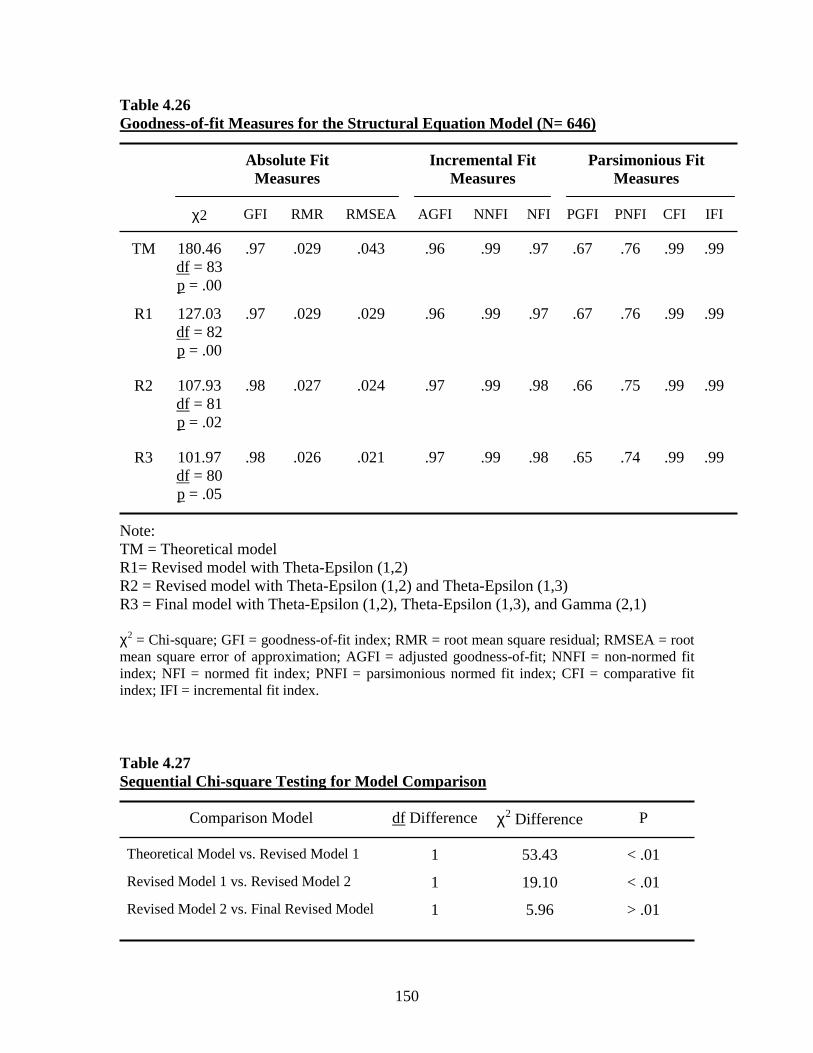
150
Table 4.26 Goodness-of-fit Measures for the Structural Equation Model (N= 646)
Absolute Fit Measures
Incremental Fit Measures
Parsimonious Fit Measures
χ2 GFI RMR RMSEA
AGFI NNFI NFI PGFI PNFI CFI IFI
TM 180.46 df = 83 p = .00
.97 .029 .043 .96 .99 .97 .67 .76 .99 .99
R1 127.03 df = 82 p = .00
.97 .029 .029 .96 .99 .97 .67 .76 .99 .99
R2 107.93 df = 81 p = .02
.98 .027 .024 .97 .99 .98 .66 .75 .99 .99
R3 101.97 df = 80 p = .05
.98 .026 .021 .97 .99 .98 .65 .74 .99 .99
Note: TM = Theoretical model R1= Revised model with Theta-Epsilon (1,2) R2 = Revised model with Theta-Epsilon (1,2) and Theta-Epsilon (1,3) R3 = Final model with Theta-Epsilon (1,2), Theta-Epsilon (1,3), and Gamma (2,1) χ2 = Chi-square; GFI = goodness-of-fit index; RMR = root mean square residual; RMSEA = root mean square error of approximation; AGFI = adjusted goodness-of-fit; NNFI = non-normed fit index; NFI = normed fit index; PNFI = parsimonious normed fit index; CFI = comparative fit index; IFI = incremental fit index. Table 4.27 Sequential Chi-square Testing for Model Comparison
Comparison Model
df Difference χ2 Difference P
Theoretical Model vs. Revised Model 1 1 53.43 < .01
Revised Model 1 vs. Revised Model 2 1 19.10 < .01
Revised Model 2 vs. Final Revised Model 1 5.96 > .01

151
Furthermore, the review of the squared multiple correlations of the final revised
model revealed that tourism development impacts, environmental attitudes, and place
attachment explained 18% of the variance in the preferences about tourism attraction
development. Meanwhile, 44% of the variance in support for destination competitive
strategy was explained by the preferences in tourism attraction development. The final
revised structural model was drawn in Figure 4.5. The t-values and completely
standardized coefficients for each estimated parameter score were reported. The
completely standardized coefficient directly explains the correlation between two
constructs: 1) each of three exogenous and endogenous constructs (development
preferences about tourism attractions and 2) two endogenous constructs. The t-value
associated with each of the path coefficients exceeded the critical value of 1.96 at the
significant level of .05 (Mueller, 1996). A more detailed discussion regarding the
hypotheses testing will follow in the next section.
ANALYSIS OF HYPOTHESES TESTING
The results of structural equation analysis by LISREL were utilized to test the
proposed hypotheses in this study. As discussed in the previous section, the relationships
between the constructs were examined based on t-values associated with path coefficients
between the constructs. If an estimated t-value is greater than a certain critical value (p <
.05, t-value = 1.96) (Mueller, 1996), the null hypothesis that the associated estimated
parameter is equal to 0 was rejected. Subsequently, the hypothesized relationship was
supported. The summary of the hypotheses testing is presented in Table 4.28.
In this study, a total of four hypotheses were proposed and tested by using
structural equation modeling . The relationship between tourism development impacts
and tourism attraction (Gamma γ11) represented hypothesis 1, and the relationship
between environmental attitudes and development preferences about tourism attractions
(Gamma γ12) explained hypothesis 2. The relationship between place attachment and
development preferences about tourism attractions (Gamma γ13) specified hypothesis 3.
Lastly, the relationship between preferences about tourism attractions and support for
destination competitive strategy (β21) defined hypothesis 4.

152
.53 .69 .51 .70 .55 . .67 .40* .56 .66 .49 .72 -.02 .68** .80 .36 .65 .60 .60 .93 . 57 .19 .15* .90 .10 .95
.57 .64 .14 .67 .21 .89 .44 .56 .64 .11
.69
Figure 4.5 Final Revised Structural Equation Model for Destination Competitive Strategy
* = p <.05 ** = p < .01 TDI1 = Tourism has created jobs and attracted investment to the community. TDI4 = Tourism has encouraged a variety of cultural activities, and has resulted in more cultural exchange and identity to the community. EA1 = We are approaching the limit of the number of people the earth can support EA3 = Mankind is severely abusing the environment. EA4 = The so-called “ecological crisis” facing humanity has been greatly exaggerated EA6 = If things continue on their present course, we will soon experience a major ecological catastrophe. PA1 = I am very attached to my community. PA2 = I identify strongly with my community. PA3 = This community means a lot to me. PA4 = No other place can compare to this community. TAD2 = Small independent businesses. (e.g. gift shops, prearranged attractive and flexible tour packages, guide services, and campgrounds) TAD3 = Cultural and folk events. (e.g. concerts, arts and crafts, dances, festivals) TAD4 = Information for tourists. DCS2 = Marketing efforts & activities DCS3 = Destination management organizations’ roles
Tourism Development Impacts (ξ1)
Environmental Attitudes
(ξ2)
Place Attachment
(ξ3)
Development Preferences
about Tourism Attractions (η1)
Support for Destination Competitive Strategy (η2)
TDI1
TDI4
EA1
EA3
EA4
EA6
PA1
PA2
PA3
TAD3
TAD4 TAD2 DCS2 DCS3
PA4
153
H1: There is a positive relationship between tourism stakeholders’ perception of the
benefits of tourism impacts and preferences about tourism attractions/resources
development.
The result of SEM analysis indicated that the path from the construct of tourism
development impacts and the construct of tourism attraction development was significant
and positive (t-value = 5.53, p < .05). This result supported that if tourism stakeholders
positively perceive tourism development impacts, they would prefer to develop tourism
attractions/resources.
Specifically, if tourism stakeholders more strongly agreed that tourism has created
jobs, attracted investment, has encouraged a variety of cultural activities, and has resulted
in more cultural exchange and identity to the community, they would support the
development of small independent businesses (e.g. gift shops, prearranged attractive and
flexible tour packages, guide services, and campgrounds), cultural and folk events. (e.g.
concerts, arts and crafts, dances, festivals), and information for tourists.
In fact, this finding was consistent with the findings of previous studies.
Researchers have demonstrated that if people receive benefits from tourism development
such as job creation, economic gain, cultural exchange, and cultural identity, they would
support tourism development (Jurowski, Uysal, & Williams, 1997;Perdue, Allen, &
Long, 1987; Yoon, Gursoy, & Chen, 2001)
H2: There is a relationship between tourism stakeholders’ environmental attitudes and
preferences about tourism attractions/resources development.
Hypothesis 2 investigated the relationship between tourism stakeholders’
environmental attitudes and preferences about tourism attractions/resources development.
However, the result of SEM analysis did not support hypothesis 2, having a t-value of -
.032, which was not statistically significant at the level of .05.
This finding suggested that tourism stakeholders’ environmental attitudes did not
affect their preferences about tourism attractions/resources development. More
specifically, this study indicated that tourism stakeholders’ ecocentric attitudes did not
lead to their preferences or support for tourism attraction development.

154
Table 4.28 Summary of Hypotheses Testing
Hypothesis Hypothesized
Path Completely
Standardized T-value Results
H1
TDI to TAD (γ11)
.34
5.53*
Supported
H2 EA to TAD (γ12) -.01 -.032 Not Supported
H3 PA to TAD (γ13) .15 2.73* Supported
H4 TAD to DCS (β21) .59 7.12* Supported
Note: * p < .05 (1.96)
TDI = Tourism Development Impacts EA = Environmental Attitudes PA = Place Attachment TAD = Development Preferences about Tourism Attractions DCS = Support for Destination Competitive Strategy
H3: There is a positive relationship between tourism stakeholders’ place attachment
and preferences about tourism attractions/resources development.
In hypothesis 3, it was postulated that tourism stakeholders who are more attached
to the community are more likely to prefer to develop tourism attractions/ resources. The
result of SEM analysis supported this hypothesis, having a positive relationship between
the constructs (t-value = 2.73, p < .05). Accordingly, this finding suggested that if
tourism stakeholders are more strongly attached to their community, they would have a
greater preference for developing tourism attractions/ resources such as small
independent businesses, cultural and folk events, and information for tourists.
Additionally, since the place attachment construct was successfully measured by
four observed indicators that were related to place identity, it can be argued that tourism
stakeholders who have more emotional/symbolic place attachment are more likely to
support tourism attractions/resources development.
155
H4: There is a positive relationship between tourism stakeholders’ preferences about
tourism attractions/resources development and support for the enhancement
strategies of destination competitiveness.
Hypothesis 4 investigated the relationship between development preferences
about tourism attractions/resources and support for destination competitive strategy.
Support for destination competitive strategy was measured by marketing efforts and
activities, and destination management organizations’ roles. The structural coefficient
and t-values associated with these two constructs were positively significant (t-value =
7.12, p < .05). Accordingly, hypothesis 4 was supported. This finding indicated that the
greater tourism stakeholders’ preferences for tourism attractions/resources development
in terms of small independent businesses, cultural and folk events, and information for
tourists, the more they support destination competitive strategies. Particularly, they are
more likely to support marketing efforts and activities and management organizations’
role in order to enhance destination competitiveness.
Finally, the results of the structural equation model analysis found that there was
an additional significant relationship between tourism development impacts and support
for destination competitive strategy (Gamma γ21), which was not hypothesized to be
tested in this study. As seen in Figure 4.4, the dotted line represents the re-specified
relationship between these two constructs. The estimated t-value and regression
coefficient were statistically positively significant (t-value = 2.70, p < .01), and suggested
that there was a positive relationship between tourism development impacts and support
for destination competitive strategy.
Reasonably, it can be implied that if tourism stakeholders perceive more positive
tourism development impacts in terms of economic and cultural aspects, they are likely to
support destination competitive strategies such as marketing efforts and activities and
management organizations’ role in enhancing tourism destination competitiveness.
156
CHAPTER V
CONCLUSION AND DISCUSSION
INTRODUCTION
This study was conducted to theoretically develop and empirically test a structural
equation model of tourism destination competitiveness from the tourism stakeholders’
perspective. The proposed hypotheses that attempted to identify the structural
relationships between/among the five constructs in the model were examined through a
series of analyses in LISREL. The principle guideline of this study was that the support
of tourism stakeholders for tourism planning and development is a key element for the
successful operation, management, and long-term sustainability of tourism destinations in
order to improve tourism destination competitiveness. Tourism stakeholders’ solid
knowledge and experiences in tourism management and industry, professional
involvement and participation in tourism planning and development, and their long-term
community observation and interactions have played an important role in a tourism
destination management. Therefore, their perceptions, attitudes, and behaviors regarding
tourism management and the tourism industry were major sources of testing the proposed
structural model and hypotheses.
In this study, tourism stakeholders included individuals who were working for or
involved in chambers of commerce, tourism and government authorities, local tourism
agencies, non-government organizations, tourism related associations and councils,
convention & visitors bureaus, tourism planning and development companies, tourism
related faculties and professionals, local and state parks, outdoor recreation companies
and facilities, and visiting and information centers. Particularly, this study focused on
tourism stakeholders in the state of Virginia as a study population, rather than in the
entire United States.
The major focus of this final chapter is to present the summary, discussion, and
managerial and theoretical implications of the findings of the analyses. Then, the
limitations of the study are discussed and the chapter concludes with suggestions for
future research.
157
SUMMARY AND DISCUSSION OF THE RESEARCH FINDINGS
General Findings and Discussion
Starting from a discussion of the research questions, this study overviewed a
theoretical background and empirical studies that exist in the literature. The objective of
the study was to develop a theoretical model about tourism destination competitiveness
and to empirically test the factors (constructs) that are likely to affect tourism
stakeholders’ development preferences about tourism attractions/resources and their
support of destination competitive strategies (endogenous constructs). The affecting
constructs (exogenous constructs) include tourism development impacts, environmental
attitudes, and place attachment. The structural model of tourism destination
competitiveness also addressed the influence of tourism stakeholders’ development
preferences about tourism attractions/resources on their support of destination
competitive strategies.
The total usable sample size from the randomly selected respondents was 646,
after eliminating unqualified respondents (n=60) due to response errors. The review of
demographic information indicated that the respondents were surveyed from very diverse
tourism stakeholders who are currently working for tourism-related organizations,
associations, attractions, and businesses. The results also showed that the survey
questionnaires were collected from a wide range of geographically distributed areas
covering the entire state of Virginia.
Based on the theoretical review and empirical studies, the measurement scales for
each construct were developed and utilized to investigate the relationships between the
constructs. An examination of reliability and validity of the measurement scales revealed
that the measurement scale for each construct was reliable and valid in terms of the
internal consistency and accuracy of what they were supposed to measure. Of
significance is that the newly developed measurement scale for support for destination
competitive strategy, which is comprised of 24 items, generated a Cronbach’s
coefficient’s alpha of .94. This result indicated that this measurement scale was highly

158
reliable in assessing support of destination competitive strategies by tourism stakeholders
for enhancing destination competitiveness.
For an analysis of the structural equation model for support for the destination
competitive strategy, first, confirmatory factor analysis (CFA) was conducted to refine
the posited relationships of the observed indicators to the construct. Through CFA
processes, the uni-dimensionality of each construct was confirmed and the composite
reliabilities for each construct were calculated. Those scores were tourism development
impacts (.86), environmental attitudes (.83), place attachment (.89), preferences about
tourism attraction development (.75), and support for destination competitive strategy
(.71). All of these composite reliabilities exceeded the recommended level of .70 (Hair,
Anderson, Tatham, & Black, 1989).
Closer examination of the relationships of the remaining observed indicators to
the construct showed that tourism development impacts were measured by four indicators
that are related to economic and cultural benefits from tourism development. For
example, job creation, attracting investment, and cultural activities and cultural exchange
were relatively important indicators to measure tourism stakeholders’ perceived tourism
development impacts. In terms of environmental attitudes, six indicators remained and
measured the construct. Those indicators revealed that tourism stakeholders’
environmental attitudes were primarily ecocentric attitudes, rather than anthropocentric,
even if other studies discussed these two different perspectives of environmental attitudes
(Dunlap & Van Liere, 1978; Dunlap, Van Liere, Mertig, & Jones, 2000). Place
attachment that is associated with a symbolic and emotional attachment to the community
contained four indicators to measure this construct. The indicators that were related to
functional attachment may not be appropriate for targeting tourism stakeholders to
measure place attachment to their community because any indicators related to a
functional attachment did not remain in measuring the construct of place attachment.
In terms of tourism stakeholders’ preferences about tourism attractions/resources
development, four indicators remained to measure this construct. Tourism stakeholders
preferred to develop small independent businesses and services, cultural and folk events,
and information for tourists. These results implied that rather than developing nature-
oriented attractions and resources, tourism stakeholders in Virginia wanted to develop
159
various travel services, activities, events, businesses, and information for tourists. For
support for tourism destination competitive strategies, three indicators including
sustainable management and practices, marketing efforts and activities, and destination
management organizations’ role were derived from EFA and retained to measure the
construct. As discussed in the literature review, these results supported other researchers’
assumptions and arguments of how tourism destination competitive strategies are formed
in order to improve destination competitiveness (Crouch & Ritchie, 1999; Hassan, 2000;
Mihaič, 2000; Ritchie & Crouch, 1993).
Having confirmed the posited relationships to the construct, the overall
measurement model was tested to see if the theoretical measurement model fit the data
fairly well. The CFA processes utilized two split samples (calibration sample, n=322) and
validation sample, n=324). With the calibration sample, the overall measurement model
was re-specified to describe a better-fitting model to the data. Then, the re-specified
theoretical measurement model was validated using the validation sample.
Ideally, the results from the validation sample should replicate the results of the
calibration sample. The re-specified model from the calibration model was a theoretical
model for the validation sample so that the re-specified model was tested to see if the
model described the data fairly well without any major re-specifications. Through these
processes, the indicators having comparatively high measurement errors and low
correlations to the constructs were dropped. As a result, 15 indicators remained to
measure the five constructs (Table 4.21). These processes were done to help not only to
identify the uni-dimensionality of the constructs but also to clarify the observed
indicators of the associated construct.
Findings and Discussion of Research Questions
A structural equation model of destination competitive strategy was utilized to
test the hypotheses that attempted to identify the structural relationships between the
constructs. Three of the four hypotheses proposed in this study were supported, and those
supported hypotheses generated a significant level of t-values and standardized
160
coefficient scores (Table 4.30). Detailed discussions of findings addressed by the
research questions are as follows.
The first research question was: Are tourism stakeholders’ development
preferences about tourism attractions/resources affected by perceived tourism impacts,
environmental attitudes, and/or perceived place attachment? This research question was
divided into three hypotheses: H1: There is a positive relationship between tourism
stakeholders’ perceptions of the benefits of tourism impacts and preferences about
tourism attractions/resources development; H2: There is a positive relationship between
tourism stakeholders’ environmental attitudes and preferences about tourism
attractions/resources development; and H3: There is a positive relationship between
tourism stakeholders’ place attachment and preferences about tourism
attractions/resources development.
The findings of the structural analysis supported hypotheses 1 and 3 that there is a
positive relationship between tourism stakeholders’ perceptions of tourism development
impacts and preferences about tourism attractions/resources development. Additionally,
there is a positive relationship between tourism stakeholders’ place attachment and
preferences about tourism attractions/resources development. However, this study did not
support hypothesis 2, that there is a positive relationship between tourism stakeholders’
environmental attitudes and preferences about tourism attractions/resources development.
Accordingly, this structural analysis concluded that tourism stakeholders’
preferences about tourism attractions/resources development are a function of perceived
tourism development impacts as well as place attachment. As previous research discussed
(Jurowski, 1994, Jurowski, Uysal, & Williams, 1997; Perdue, Long, & Allen, 1987;
Yoon, Gursoy, & Chen, 2000) if people perceive more benefits than costs from tourism
development, they are more likely to support future tourism development.
Specifically, rather than the environmental and physical benefits from tourism
development discussed in other studies (Davis, Allen, & Cosenza, 1988; Getz, 1994;
Lankford & Howard, 1994), this study demonstrated that the more tourism stakeholders
perceive economic and cultural benefits from tourism development, the more they are
likely to support future tourism attractions/resources. For example, positive perceptions
in terms of job creation and investment, and cultural exchange and identity make tourism
161
stakeholders support more tourism attraction development. Those attractions they
preferred to develop were small independent business and cultural and folk events such
as gift shops, prearranged attractive, flexible tour packages, guide services, campgrounds,
concerts, arts and crafts, dances, and festivals. And also, they supported information for
tourists to attract more tourists to their communities. These results may be due to the
abundant tourism attractions/resources related to heritage and cultural destinations that
exist in the research site (Virginia). People in the research site may have received more
economic benefits from the above attractions/resources. These tourism attractions/
resources may have created and sustained employees, as well as attracted more
investment, so that tourism may have brought economic benefits to stakeholders’
communities.
As another finding that should be acknowledged in this study, tourism
stakeholders who have expressed more emotional/symbolic attachment to their
communities, are more likely to prefer tourism attractions/ resources development. This
result indicated that place attachment may be a critical determinant of peoples’
supporting tourism development, as other previous studies have discussed (McCool &
Martin, 1994; Um & Crompton, 1987; Williams, McDonal, Riden, & Uysal, 1995; Yoon,
1998). This finding also supported the general argument of place attachment that people
may be an integral component of place or destination environments and their values and
perceptions of the natural and environmental settings surrounding their communities
could be evaluated and incorporated into the destination management process.
The second research question was: Is there a relationship between tourism
stakeholders’ development preferences about tourism attractions/resources and their
support of enhancement strategies for destination competitiveness? This research
question was addressed by hypothesis 4. The findings of the analysis for hypothesis 4
indicated that there is a positive relationship between tourism stakeholders’ preferences
about tourism attractions/resources development and support for enhancement strategies
for destination competitiveness. Again, the tourism attractions/resources that tourism
stakeholders in this study preferred to develop were small independent businesses,
cultural and folk events, and information for tourists. The more their preference for
developing tourism attractions, the more likely they were to support destination

162
competitive strategies such as marketing efforts and activities, and destination
management organizations’ role. Accordingly, this finding implied that this relationship
could represent the best combinations or matches between tourism attractions and
destination competitive strategies in order to enhance destination competitiveness. These
combinations may produce more and a better quality of tourism attractions/resources that
are marketed effectively or efficiently to current and potential tourists.
As Hassan (2000) discussed, destination competitiveness is the ability of a
destination to create and integrate value-added products and sustain its resources while
maintaining market position. Marketing efforts and activities could help to create and
sustain the product value of tourism attractions/resources. Competitiveness can be
enhanced through incorporating marketing planning and strategies (Bordas, 1994;
Buhalis, 2000; Kozak, 2001; Heath & Wall, 1992; Poon, 1994; Ritchie & Crouch, 2000).
This finding indicated that destination organizations’ role and function in tourism
destinations should not be overlooked in terms of its responsibility to the well-being of all
aspects of destination management. Ritchie and Crouch (1993) also discussed that a
carefully selected and well-executed program of destination management can serve to
improve destination competitiveness. A broad range of activities and roles might be
incorporated, according to the tourism attractions/resources they prefer to develop.
Consequently, as Crouch and Ritchie (1999) discussed, it should be noted that destination
management activities and programs could enhance the appeal of core tourism
attractions/ resources, strengthen the quality and effectiveness of the resources, and adjust
certain constraints that tourism attractions have in terms of location, safety, and cost.
In conducting post hoc testing of the structural equation model of tourism
destination competitiveness, an additional relationship that was not hypothesized was
found, and indicated that tourism stakeholders’ perceived tourism development impacts
directly influenced their support for destination competitive strategies. Reasonably, as
similar to other studies (Perdue, Long, & Allen, 1990; Yoon et al., 2000), if people
perceive benefits from tourism development, they are willing to support future tourism
development. In this case, tourism stakeholders who have perceived benefits from
tourism development, particularly in its economic and cultural aspects, are likely to
support enhancement strategies for destination competitiveness.

163
IMPLICATIONS OF THE RESEACH FINDINGS
In an increasingly saturated market, an understanding of how tourism destination
competitiveness can be enhanced and sustained is a fundamental issue in successful
destination management and planning. Since tourism destinations involve multi-faceted
components of natural/cultural tourism resources and a multiplicity of man-made tourism
businesses, a systematic analysis and framework for destination competitiveness is
required. This analytical model may also contribute to creating and integrating value-
added tourism attractions/resources to achieve greater destination competitiveness.
This study was focused on an investigation of the structural relationships between
tourism stakeholders’ preferences about tourism attractions/resources development and
their support for destination competitive strategies that are influenced by tourism
development impacts, environmental attitudes, and place attachment. The most critical
research finding from this study was the strong relationship (the highest path coefficient
score) between preferences about tourism attractions/resources development and support
for destination competitive strategies. Accordingly, the managerial implications of this
study are more focused on a discussion of this finding, rather than focusing on a
discussion of the influence of the perceived tourism development impacts and place
attachment on preferences about tourism attractions/resources development.
Importantly, these research findings may help tourism planners, developers, and
policy-makers to understand what key tourism players such as tourism stakeholders
prefer to develop in tourism attractions/resources and to plan and implement successful
competitive strategies. These results are likely to help tourism stakeholders and marketers
to collect information and plan appropriate competitive strategies based on the tourism
attractions/resources they prefer to develop.
It could be said from the findings of this study that destination competitive
strategies supported by tourism stakeholders may be associated with destination
marketing efforts and activities, and destination management organizations’ role. These
competitive strategies can be implemented based on the tourism attractions/ resources of
small independent businesses and cultural and folk events that may include gift shops,
prearranged attractive, flexible tour packages, guide services, campgrounds, concerts, arts
164
and crafts, dances, and festivals. Information for tourists in order to attract more tourists
to their communities was also an important source of tourism attraction. Accordingly,
with not only these tourism attractions/resources but also well-prepared marketing plans
and strategies, and effective support and help by destination management organizations,
the best strategies for enhancing destination competitiveness may be established for the
tourism destinations.
Closer examination of the marketing efforts and activities presented in this study
may provide more detailed information and useful sources of managerial applications,
because the incorporation of marketing concepts and competitive development strategies
may help to enhance destination competitiveness (Bordas, 1994; Kozak, 2001; Poon,
1994). As previous researchers have discussed (Crouch & Ritchie, 1999; Go & Govers,
2000; Peattie & Peattie, 1996), overcoming seasonality and quality management may be
important strategies for destination competitiveness so that tourists may spend more time
and money at their destinations. Certain marketing programs and activities to overcome
seasonality in tourists’ visits should be considered. The development of strong linkages
with tourism wholesalers and retailers could be suggested.
Moreover, as Poon (1993) argued, including “permanent innovation” and
“ceaseless change,” and flexible, segmented, customized products and services for
tourists may be necessary to enhance destination competitiveness. The selection of
appropriate target markets, the development of strong destination image, and tourism
promotion and operation for international tourists and visitors may be recommended as
specific marketing plans for destination competitive strategies. These marketing
strategies may enable tourism destinations to achieve a maximum correlation with
tourists’ demand to meet their wants and needs.
Additionally, in recent trends of tourism industry, more effective tourism product
delivery and services require the use of modern, advanced technology and information
systems. This study also found that the respondents (tourism stakeholders) supported the
development of advanced technology and information systems. Thus, it is recommended
that destination management teams or marketing planners pay attention to this current
trend.
165
Another important finding for destination competitive strategies from this
research was related to destination management organizations’ roles. Especially, in order
to effectively use tourism resources over the long term, destination management
organizations’ roles could be emphasized and systematically established, because their
functions and roles within the tourism destination may be critical in terms of their
responsibility to the well-being of all aspects of destination management and operation
(Crouch & Ritchie, 1999). As Mihalič (2000) and Ritchie and Crouch (1993) have
discussed, destination competitiveness could be enhanced through management
organizations’ capabilities and efforts. Especially, according to Crouch and Ritchie
(1999), destination management organizations’ roles should be understood as total
“management” rather than “marketing.” It should be also noted that their roles emphasize
the provision of a form of leadership for destination development that makes extensive
use of team work in all DMO-led initiatives (p.149).
More specific implications supported by tourism stakeholders in this study were
that tourism destination management organizations may need to play an important role as
facilitators between local government and agencies for tourism planning and
development. The establishment of effective linkages between local government and
agencies was recommended in order to improve destination competitiveness in the long
run. Additionally, the development of the leadership of destination management
organizations for local government and agencies was also suggested, particularly in
marketing tourism destinations to tourists. Lastly, establishing effective cost strategies in
providing different levels of quality and various types of tourism experiences can be
recommended.
Consequently, as suggested in other studies (Crouch & Ritchie, 1999; Hassan,
2000; Mihalič, 2000; Ritchie & Crouch, 1993), the findings of this research supported
that appropriate destination management efforts and marketing activities may help to
create and integrate tourism attractions, products, and resources so that tourism
destinations could achieve better competitive market environments and positions.
Therefore, destination managers and planners may need to understand what combinations
or matches of tourism attractions/resources and destination competitive strategies can be
achieved to create more competitive tourism destinations.
166
LIMITATIONS AND SUGGESTIONS FOR FUTURE RESEARCH
As expected in all research, limitations to this study were found and should be
addressed to encourage more sound research in the future. The major limitations derived
from this study are: 1) research scope and boundaries of the research, 2) selected
observed indicators and constructs, 3) lack of residents’ and tourists’ opinions, 4) absence
of longitudinal characteristics, and 5) limited analysis of performance of destination
competitive strategies.
This study investigated the structural relationships of tourism destination
competitiveness from tourism stakeholders’ perspectives. The surveyed data were only
collected in the state of Virginia. This geographically limited survey may produce
different results and conclusions in terms of the magnitude and directions of relationships
among the constructs studied in this research. Tourism stakeholders in other states and
countries may have different perceptions, attitudes, and behaviors concerning tourism
development and destination competitive strategies. Other geographic boundaries and
research scopes should be explored to see if similar findings and results could be
addressed. And also, future research may collect data from other competitive states and
countries so that comparison studies can be conducted.
This study has been somewhat limited in its selection of observed indicators,
variables, and constructs. Even if those observed indicators, variables, and constructs
were selected based on the literature review and researcher’s observations, other critical
variables and constructs may exist to achieve further insights of destination
competitiveness. For example, more specific variables and constructs that address
international competitive strategies are limited. The various variables and constructs that
are related to tourism information systems or management information systems were
abbreviated. In current tourism markets, any tourism destination may need to pay more
attention to advanced technologies and techniques so that quality products and services
are delivered effectively and efficiently. Therefore, future studies may address destination
competitiveness that includes information technology and techniques such as tourism
information systems.
167
Another critical limitation to this study is related to the respondents. Generally, in
the tourism literature, tourism stakeholders may include residents, tourists, and tourism
experts such as people who are involved in organizations, associations, destination
management and attractions such as the respondents for this study. However, this study
did not include residents’ and tourists’ opinions of destination competitive strategies.
Accordingly, compared with the respondents (tourism stakeholders) surveyed in this
study, residents and tourists may express different perceptions, attitudes, and behaviors
concerning the issues and topics presented in this study.
As a result, for more comprehensive and thorough investigations of destination
competitive strategies supported by all tourism stakeholders, future research is
recommended to include both residents and tourists. Conducting studies that include
comparisons and differences between/among tourism stakeholders in terms of destination
competitive strategies may be possible.
This study also is somewhat limited in terms of longitudinal characteristics,
which would it make possible to analyze the potential time-lag for the hypothesized
relationships and structural model. This is due to the fact that the data were collected for
a two-month period (June and July, 2002). Each measurement scale for the constructs can
be refined and validated. This study might reflect ongoing transformations that could
influence the relationships between the constructs for future research. Moreover, a
longitudinal analysis of the structural model of tourism destination competitiveness may
reveal what competitive strategies do a better job in increasing destination
competitiveness and performance.
Due to the fact that this study did not include any performance and satisfaction
variables to see what and how much destination competitive strategies work for the
current tourism market, future research should address this limitation to suggest more
appropriate destination competitive strategies to the tourism industry.
Consequently, the above-mentioned limitations should be considered as essential
and critical suggestions for future research. Future studies should take into account these
limitations to produce more complete research results.
168
CONCLUDING COMMENTS
Given the fact that, if any, there is a limited number of empirical studies on
tourism destination competitiveness, this study developed and empirically tested a
structural equation model of tourism destination competitiveness and its relevant
constructs from the perspectives of tourism stakeholders. Accordingly, as discussed in the
research findings, it is hoped that this study has made valuable contributions to the
understanding and insights about tourism destination competitive strategies.
From the results of the comprehensive data analyses and procedures, this study
may conclude that in successful tourism development and management for destination
competitiveness, a more thorough understanding of tourism stakeholders’ attitudes and
behaviors toward tourism should be made. As key players in tourism destination
competitiveness, their preferences about tourism attractions/resources and support for
destination competitive strategies should be understood so that more competitive
destination environments and positions can be achieved.
Finally, even though the results and findings of this study are somewhat
exploratory in nature, it is expected that the information produced and the implications of
the study may be of help to tourism planners, policy-makers, and marketers to build more
competitive tourism destination environments and positions in the state of Virginia.
169
REFERENCES Aish, A. M., & Jöreskog, K. G. (1990). A panel model for political efficacy and
responsiveness: An application of LISREL 7 with weighted least squares. Quarterly and Quantity, 19, 716-723.
Akis, S., Peristianis, N., & Warner, J. (1996). Residents’ attitudes to tourism
development: the case of Cyprus. Tourism Management, 17(7), 481-494.
Altman, L., & Low, S. (1992). Place attachment: A conceptual inquiry. Place Attachment, In I. Altman, & S. Low (Eds), Place Attachment. Human Behavior and Environment (vol. 12), New York and London: Plenum Press.
Anderson, J. C., & Gerbing, D. W. (1988). Structural equation modeling in practice: A review and recommended two-step approach. Psychological Bulletin, 103, 411-423.
Ap, J. (1992). Residents’ perceptions on tourism impacts, Annals of Tourism Research. 19 (4), 665-690.
Ap, J. (1990). Residents’ perceptions research on the social impacts of tourism, Annals of Tourism Research, 17(4), 610-616.
Arcury, A. T. (1990). Environmental attitude and environmental knowledge. Human Organization, 49 (4), 300-302.
Bagozzi, R. P. (1980). Causal models in marketing. New York: John Wiley.
Bagozzi, R. P., & Phillips, L. W. (1982). Representing and testing organizational theories: A holistic construal. Administrative Science Quarterly, 27, 459-489.
Bentler, P. M. (1983). Some contributions to efficient statistics in structural models: Specification and estimation of moment structures. Psychometrika, 48, 493-517.
Bentler, P. M. (1990). Comparative fit indexes in structural models. Psychological Bulletin, 107, 238-246.
Blau, P. M. (1968). Interaction: Social Exchange. International Encyclopedia of the Social Science, 7, 452-458. In J. H. Turner (1991). The structure of sociological theory (5th Edition). Chicago: The Dorsey Press.
Blau, P. M. (1991). Structural exchange theory. In J. H. Turner (5th Edition). The structure of sociological theory (pp. 328-351). Chicago: The Dorsey Press.
Bollen, K. A. (1989a). A new incremental fit index for general structural models. Sociological Methods & Research, 17, 303-316.

170
Bollen, K. A. (1989b). Structural equations with latent variables. New York, NY: John Wiley & Sons.
Bollen, K. A., & Long, J. S. (1993). Testing structural equation models. Newbury Park: Sage Publications, International Education and Professional Publisher.
Bordas, E. (1994). Competitiveness of tourist destinations in long distance
markets. The Tourist Review, 4(3), 3-9.
Bricker, K. S., & Kerstetter, D. L. (2000). Level of specialization and place attachment: An exploratory study of Whitewater Receptionists. Leisure Science, 22, 233-257.
Brown, B., & Perkins, D. (1992). Disruptions in place attachment. In I. Altman & S. Low (Eds.), Place Attachment. Human Behavior and Environment (vol. 12), New York: Plenum, pp. 279-304.
Browne, M. W., & Cudeck, R. (1989). Single sample cross-validation indices for
covariance structures. Multivariate Behavioral Research, 24, 445-455.
Buhalis, D. (2000). Marketing the competitive destination of the future. Tourism Management, 21, 97-116.
Buttimer, A. (1980). Home, reach, and the sense of place. In A. Buttimer & D.
Seamon (Eds.), The human experience of space and place (pp. 167-187). London: Croom Helm.
Byrne, B. M. (1995). One application of structural equation modeling from tow
perspectives: Exploring the EAS and LISRELM strategies. In R. H. Hoyle (ed.), Structural equation modeling: Concepts, issues, and application (pp. 138-157). Thousand Oaks, CA: Sage.
Byrne, B. M. (1998). Structural equation modeling with LISREL, PRELIS, and
SIMPLIS: Basic concepts, applications, and programming. Mahwah, NJ: Lawrence Erlbaum Associates, Inc.
Carlsen, J. (1999). A Systems Approach to Island Tourism Destination
Management, Systems Research and Behavioral Science, 16 (4), 321-326. Chadwick-Jones, J. K. (1976). Social exchange theory: Its structure and influence
in social psychology. London, New York, and San Francisco: Academy Press. Chou, C. P., & Bentler, P. M. (1995). Estimates and tests in structural equation
modeling. In R. H. Hoyle (ed.), Structural equation modeling: Concepts, issues, and application (pp. 37-55). Thousand Oaks, CA: Sage.
171
Cooper, C. (1976). The house as symbol of the self. In I. W. Proshansky and L, Rivlin (Eds.), Environmental psychology: People and Their physical settings, 3rd, pp. 435-449, New York: Hold, Rinehart, and Winston.
Crick-Furman, D., & Prentice, R. (2000). Modeling tourists’ multiple values. Annals of Tourism Research, 27(1), 69-92.
Crouch, G. I. & Ritchie, J. R. B. (1999). Tourism, competitiveness, and societal prosperity. Journal of Business Research, 44, 137-152.
Davies, F., Goode, M., Mazanec, J., & Moutinho, L. (1999). LISREL and neural network modeling: two comparison studies. Journal of Retailing and Consumer Services, 6, 249-261.
DeVellis, R. F. (1991). Scale development: Theory and applications. Newbury Park: Sage Publications.
Dogan, H. Z. (1989). Forms of Adjustment. Annals of Tourism Research, 16, 216-236.
Doxey, G. V. (1975). A Causation theory of visitor-resident irritations:
Methodology and research inference. Travel and Tourism Research Association Sixth Annual Conferences Proceedings (pp. 195-198), San Diego, Califonia.
Driscoll, A., Lawson, R., & Niven, B. (1994). Measuring tourists’ destination perceptions. Annals of Tourism Research, 21(3), 499-511.
Duncan, O. D. (1984). Notes on social measurement: Historical and critical. New York: Academic Press.
Dunlap, R. E., & Van Liere, K. D. (1978). The new environmental paradigm. The Journal of Environmental Education, 9 (4), 10-19.
Dunlap, R. E., Van Liere, K. D., Mertig, A. G., & Jones, R. E. (2000). Measuring Endorsement of the new ecological paradigm: A revised NEP scale. Journal of Social Issues, 56(3), 425-442.
Ekeh, P. P. (1974). Social exchange theory: The two traditions. Cambridge: Harvard University Press.
Evans, M. R., Fox, J. B., & Johnson, R. B. (1995). Identifying competitive strategies for successful tourism destination development. Journal of Hospitality and Leisure Marketing, 3(1), 37-45.
Feldman, R. M. (1990). Settlement identity: Psychological bonds with home place in a mobile society. Environment and Behavior, 22, 183-229.
172
Ferrario, F. F. (1979). The evaluation of tourism resources: An applied methodology (Part I). Journal of Travel Research, 7(3), 18-22.
Ferrario, F. F. (1979). The evaluation of tourism resources: An applied
methodology (Part II). Journal of Travel Research, 7(4), 24-30. Fessenmaier, D., & Uysal, M. (1990). The tourism system: Levels of economic and
human behavior. In J. B. and L. M. Caneday (ed.), Tourism and leisure: Dynamics and Diversity (pp. 27-35). Alexandria, VA: National Recreation and Park Association.
Flagestad, A., & Hope, C. A. (2001). Strategic success in winter sports
destinations: A sustainable value creation perspective. Tourism Management, 22, 445-461.
Formica, S. (2000). Destination attractiveness as a functio of supply and demand interaction. Unpublished doctoral dissertation, Virginia Polytechnic Institute and State University, Blacksburg.
Foodness, D. (1994). Consumer perceptions of tourism attraction. Journal of Travel Research, 28(4), 3-10.
Fransson, N., & Garling, T. (1999). Environmental concern: Conceptual definitions, measurement methods, and research findings. Journal of Environmental psychology, 19, 369-382.
Frauman, E. (1999). The influence of mindfulness on information services and sustainable management practices at costal South Carolina State Parks. Unpublished Doctoral Dissertation, Clemson University, South Carolina.
Gable, R. K., & Wolf, M. (1993). Instrument development in the affective domain (2nd Edition). Boston/Dordrecht/London: Klewer Academic Publishers.
Geisler, G. C., Martinson, O. B., & Wilkening, E. A. (1977). Outdoor recreation and environmental concern: A restudy. Rural sociology, 42, 241- 249. Gearing, C. E., Swart, W. W., & Var, T. (1979). Establishing a measure of touristic attrativenss. Journal of Travel Research, 12, 1-8.
Getz, D. (1987). Tourism planning and research traditions, models and futures. Australian Travel Research Workshop, 5-6 November, Bunbury.
Go, F. M., & Govers, R. (2000). Integrated quality management for tourist
destinations: A European perspective on achieving competitiveness. Tourism Management, 21, 79-88.
Gunn, C. A. (1988). Tourism Planning (2nd ed.). New York: Taylor and Francis.

173
Gunn, C. A. (1994). Tourism Planning (3rd ed.). New York: Taylor and Francis. Hair, J. F., Anderson, R. E., Tatham, R. L., & Black, W. C. (1998). Multivariate Data Analysis with Readings. New York: Macmillan Publishing.
Hassan, S. S. (2000). Determinants of market competitiveness in an environmentally sustainable tourism industry. Journal of Travel Research, 38 (February), 239-245.
Hatcher, L. (1994). A step-by-step approach to using the SAS system for factor analysis and structural equation modeling. Cary, NC: SAS Institute Inc.
Heath, E., & Wall, G. (1992). Marketing tourism destinations: A strategic planning approach. New York, John Wiley & Sons, INC.
Hernandez, B., Suarez, E., Martinez-Torvisco, J., & Hess, S. (2000). The study of
environmental beliefs by facet analysis: Research in the Cananry Islands, Spain. Environment and Behavior, 32(5), 612-636.
Hechter, M. (1991). Rational choice theory. In J. H. Turner (5th Edition), The structure of sociological theory (pp. 352-366), Chicago: The Dorsey Press.
Hidalgo, M. C., & Hernandez, B. (2001). Place attachment: Conceptual and empirical questions. Journal of Environmental Psychology, 21, 273-281.
Hoelter, J. W. (1983). The analysis of covariance structures: Goodness-of-fit
indices. Sociological Methods and Research, 11, 325-344.
Homans, G. C. (1991). Exchange behaviorism. In J. H. Turner (5th Edition). The structure of sociological theory (pp. 303-327). Chicago: The Dorsey Press.
Hoyle, R. H. (1995a). Structural equation modeling: Concepts, issues, and application. Thousand Oaks, CA: Sage.
Hoyle, R. H. (1995b). The structural equation modeling approach: Basic concenpts and fundamental issues. In R. H. Hoyle (ed.), Structural equation modeling: Concepts, issues, and application (pp. 1- 15). Thousand Oaks, CA: Sage.
Hu, L. T., & Bentler, P. M. (1995). Evaluating model fit. In R.H. Hoyle (Ed.), Structural equation modeling: Concepts, issues, and applications (pp. 76-99). Thousand Oaks, CA: Sage.
Hu, L., & Bentler, P. M. (1999). Cutoff criteria for fit indexes in covariance structure analysis: Conventional criteria versus new alternatives. Structural Equation Modeling 6(1): 1-55
174
Hu, Y., & Ritchie, J. R. B. (1993). Measuring destination attractiveness: A contextual approach. Journal of Travel Research, 32(2), 25-34.
Hudman, L. E., & Hawkins, D. E. (1989). Tourism contemporary society: An Introductory text. New Jersey: Prentice Hall.
Hull, J. G., Tedlie, J. C., & Lehn, D. A. (1995). Modeling the relation of personality variables to symptom complaints: The unique rod of negative affectivity. In R.H. Hoyle (Ed.), Structural equation modeling: Concepts, issues, and applications (pp. 217- 253). Thousand Oaks, CA: Sage.
Hummon, D. M. (1992). Community attachment: Local sentiment and sense of
place. In I. Altman & S. Low (Eds.), Place attachment, New York: Plenum.
Inkeep, E. (1991). Tourism planning: An integrated and sustainable development approach. New York: Van Nostrand Reinhold.
Jackson, L. E. (1987). Outdoor recreation participation and views on resources development and preservation. Leisure Sciences, 9, 235-250.
Klein, J. G., Ettenson, R., & Morris, M. D. (1998). The animosity model of foreign product purchase: An empirical test in the people’s republic of china. Journal of Marketing, 62 (January), 89-99
Kline, R. B. (1998). Principles and practice of structural equation modeling. New York, The Guilford Press.
Loehlin, J. L. (1992). Latent variables model: An introduction to factor, path, and structural analysis. New Jersey: Lawrence Eribaum Associates, INC.
Jones, R. E., & Dunlap, R. E. (1992). The social bases of environmental concern: Have they changed voer time? Rural Sociology, 57, 28047.
Jöreskog, K. G. (1993). Testing structural equation models. In K. A. Bollen & J. S. Long (Eds.), Testing structural equation models (294-316). Newbury park, CA: Sage.
Jöreskog, K. G., & Sörbom, D. (1993). LISREL 8: Structural equation modeling
with the SIMPLIS command language. Mooresville, Ill: Scientific Software. Jöreskog, K. G., & Sörbom, D. (1996a). LISREL 8: User’s reference guide.
Chicago: Scientific Software International, Inc.
Jöreskog, K. G., & Sörbom, D. (1996b). PRELIS 2: User’s reference guide. Chicago, IL: Scientific Software International, Inc.

175
Jöreskog, K. G., & Sörbom, D. (1999). LISREL 8.30 and PRELIS 2.30. Scientific Software International, Inc.
Jurowski, C. (1994). The interplay of elements affecting host community residents attitudes toward tourism: A path analytic approach. Unpublished doctoral dissertation, Virginia Polytechnic Institute and State University, Blacksburg.
Jurowski, C., Uysal, M., & Williams, D. R. (1997). A theoretical analysis of host community resident reactions to tourism. Journal of Travel Research, 36(2), 3-11.
Jurowski, C., Uysal, M., Williams, D. R., & Noe. F. P. (1995). An examination of preferences and evaluation of visitors based on environmental attitudes: Biscayne Bay National Park. Journal of Sustainable Tourism, 3(2), 73-86.
Kaae, B. C. (2001). The perception of tourists and residents of sustainable tourism principles and environmental initiatives. In S. F. McCool and R. N. Moisey (Eds.), Tourism, recreational and sustainability (pp. 289-314). New York: CABI Publishing.
Kaiser, F. G., Wolfing, S., & Fuhrer, U. (1999). Environmental attitude and ecological behavior. Journal of Environmental Psychology. 19, 1-19.
Kaltenborn, B. P. (1997). Nature of place attachment: A study among recreation homeowners in Southern Norway. Leisure Science, 19, 175-189.
Kerlinger, F. N. (1973). Foundation of behavioral research (2nd ed.). New York: Holt, Rinehart and Winston.
Kempton, W. Boster, J., & Hartley, J. A. (1995). Environmental values in American culture. Cambridge, MA: MIT Press.
Kline, R. B. (1998). Principles and practice of structural equation modeling. New York: The Guilford Press.
Korpela, K. (1989). Place-Identity as a product of environmental self-regulation. Journal of environmental Psychology, 9, 242-256.
Kozak, M. (2001). Repeaters’ behavior at two distinct destinations. Annals of Tourism Research, 28 (3), 784-807.
Kozak, M., & Rimmington, M. (1998). Benchmarking: Destination attractiveness
and small hospitality business performance. International Journal of Contemporary Hospitality Management, 10(5), 184-188.
Langenay, E. E. (1987). Anticipating wildlife values of tomorrow. In D. J. Decker and G. R. Goff (Eds.), Valuing wildlife: Economic and social perspective (pp. 309-317). Boulder, Co: Westview Press.
176
Lee, C. C., & Allen, L. (2000). Understanding individuals’ attachment to selected
destination: An application of place attachment. Tourism Analysis, 4, 173-185.
Leiper, N. (1979). The framework of tourism: Towards a definition of tourism, tourist, and the tourist industry, Annals of Tourism Research, 6 (4), 390-407.
Leiper, N. (1990). Tourist attraction system, Annals of Tourism Research, 17, 367-384.
Levi-Strauss, C. (1969). The elementary structure of kinship. Boston: Boston Press.
Lew, A. A. (1987). A model of tourist attraction research, Annals of Tourism Research, 14, 553-575. Lew, A. A. (1994). A Framework of tourist attraction research. In J. R. B. Ritchie and M. R. Goeldner. Travel, Tourism and Hospitality Research (2ed.), p.291-297.
Lindberg, K., & Johnson, R. L. (1997). Modeling residents attitude toward tourism. Annals of Tourism Research, 24(2), 402-424.
Liu, J. C, (1988). Touristic attractiveness of Hawaii by county. Occasional paper, Tourism Research Publications No 10, University of Hawaii at Manoa.
Lu, J. C., & Var, T.(1986). Residents attitude toward tourism impacts in Hawaii. Annals of Travel Research, 13, 193-214.
Low, S. (1992). Symbolic ties that bind: Place attachment in the plaza. In I. Altman & S. Low (Eds.), Place attachment, New York: Plenum.
Mardrigal, R. (1993). A tale of tourism in two cities. Annals of Tourism Research, 20, 336-353.
McAndrew, F. T. (1998). The measurement of ‘rootedness’ and the prediction of attachment to home-towns in college students. Journal of Environmental Psychology, 18, 409-417.
MacCallum, R. (1995). Model Specification: Procedures, strategies, and related issues. In R. H. Hoyle (ed.), Structural equation modeling: Concepts, issues, and application (pp. 16-36). Thousand Oaks, CA: Sage.
Maruyama, G. M. (1998). Basics of structural equation modeling. California: Sage Publication.
McCool, S. F., & Martin, S. T. (1994). Community attachment and attitudes toward tourism development. Journal of Travel Research, 32(3), 29-34.
177
Mathieson, A., & Wall, G. (1982). Tourism: Economic, physical, and social impacts. New York: Longman Scientific & Technical.
McIntosh, R., & Goeldner, C. (1986). Tourism: Principles, Practices and Philosophies, 5th edition, Wiley, New York.
Mihalič, T. (2000). Environmental management of a tourist destination: A factor of tourism competitiveness. Tourism Management, 21, 65-78.
Mihalik, B. (1992). Tourism impacts related to EC 92: A look ahead, Journal of Travel Research, 31 (2), 27-34.
Mill, R. C. (1990).Tourism: The international business. New Jersey: Prentice Hall.
Mill, R. C., & Morrison, A. M. (1985). The tourism system: An introductory. Engelwood Cliffs, N.J.: Prentice Hall.
Milman, A., & Pizam, A. (1995). The role or awareness and familiarity with a destination. Journal of Travel Research, 33(3), 21-31.
Mitchell, L. (1979). The geography of tourism. Annals of Tourism Research, 6(3), 235-244.
Mitchell, M. Y., Force, J. E., Carroll, M. S., & McLaughlin, W. J. (1993). Forest places of the heart: Incorporating special spaces into public management. Journal of Forestry, 9(34), 32-37.
Moore, R. L., & Graefe, A. R. (1994). Attachments to recreation settings: The case of rail trail users. Leisure Sciences, 16(1), 17-31.
Mueller, R. O. (1996). Basic principles of structural equation modeling: An introduction to LISREL and EQS. New York: Springer-Verlag.
Mulaik, S. A., & James, L. R. (1995). Objectivity and reasoning in science and structural equation modeling. In R. H. Hoyle (ed.), Structural equation modeling: Concepts, issues, and application (pp. 119- 137). Thousand Oaks, CA: Sage.
Murphy, P. E. (1985). Tourism: A community approach. New York: Routledge.
Murphy, P., Pritchard, M. P., & Smith, B. (2000). The destination product and its impact on traveler perceptions. Tourism Management, 21, 43-42.
Newall, J. E. (1992). The challenge of competitiveness. Business Quarterly, 56, 94-100.

178
Newman, W. L. (1994). Social research methods: Qualitative and quantitative approaches. Needham Heights, Mass: Allyn and Bacon.
Pearce, D. (1989). Tourist development (2nd ed.). London: Longman Scientific & Technical.
Pearce, D. (1995). Tourism Today: A geographical analysis, the second edition, London: Longman Scientific & Technical.
Pearce, D. (1995). Planning for tourism in the 1990s: an integrated, dynamic, multiscale approach. In R. Butler and D. Pearce (ed.), Change in tourism: People, place, process (pp. 229-244), London and New York: Routledge.
Pearce, D. (1997). Competitive destination analysis in Southeast Asia. Journal of Travel Research, 35 (4), 16-24.
Peattie, K., & Pearttie, S. (1996). Promotional competitions: A winning tool for tourism marketing. Tourism Management, 17(6), 433-442.
Perdue, R. R., Long. P. T., & Allen, L. (1987). Rural resident tourism perceptions and attitudes. Annals of Tourism Research, 14, 420-429.
Perdue, R. R., Long. P. T., & Allen, L. (1990). Resident support for tourism
development. Annals of Tourism Research, 17, 586-599. Poon, A. (1993). Tourism, technology and competitive strategies. Oxon, UK:
CAB International.
Porter, M. E. (1980). Competitive strategy: Techniques for analyzing industries and competitors. New York: free Press.
Porter, M. E. (1990) The competitive advantage of nations. London: The McMillan Press.
Proshansky, H. M. (1978). The city and self-identity. Environment & Behavior, 10, 147-169.
Proshansky, H. M., Fabian, A. K., & Kaminof, R. (1983). Place identity: Physical world and socialization of the self. Journal of Environmental Psychology, 3, 57-83.
Ritchie, J. B. B., & Crouch, G. I. (1993).Competitiveness in international tourism: A framework for understanding and analysis. Proceedings of the 43rd Congress of the Association International d’Experts Scientifique due Torisme on Competitiveness of Long-Haul Tourist Destination, San Carlos de Bariloche Argentina October, 17-23, 1993, pp. 23-71.
179
Reisinger, Y., & Turner, L. (1999). Structural equation modeling with Lisrel: Application in Tourism. Tourism Management, 20, 71-88.
Ritchie, J. B. B., & Crouch, G. I. (2000). The competitiveness destination: A sustainability perspective. Tourism Management, 21, 1-7.
Ritchie, J. R. B., Crouch, G. I., & Hudson, S. (2000). Assessing the role of consumers in the measurement of destination competitiveness as sustainability. Tourism Analysis, 5, 69-76.
Ritchie, J. R. B.,& Crouch, G. I. (2000). Are destination stars born or made: Must a competitive destination have star genes? In 2000 TTRA Annual Conference Proceedings (pp. 306- 315).
Rosenthal, R., & Rosnow, R. L. (1984). Essentials of behavioral research: Methods and data analysis. New York: McGraw Hill.
Ross, G. F. (1994). The psychology of tourism. Melbourne: Hospitality Press.
Ryan, C. (1995). Researching tourist satisfaction: Issues, concepts, problems. London: Routledge.
Samdahl, D. M., & Robertson, R. (1989). Social determinants of environmental concern: specification and test of the model. Environmental and Behavior, 21(1), 57-81.
Schreyer, R., Jacob, G., & White, R. (1981). Environmental meaning as a determinant of spatial behavior in recreation. In J. Frazier & B. Epstein (Eds.), Proceedings of the applied geography conferences (pp. 294-300).
Schultz, P. W., & Zelezny, L. (1999). Values as predictors of environmental attitudes: Evidence for consistency across 14 countries. Journal of Environmental Psychology, 19, 255-265.
Scott, D., & Willits, F. K. (1994). Environmental attitudes and behavior: A Pennsylvania survey. Environment and Behavior, 26, 239-260.
Sethi, V., & King, W. (1994). Development of measures to assess the extent to
which an information technology application provides competitive advantage. Management Science, 40, 1601-1624.
Sheldon, P. J., & Var, T. (1984). Resident attitudes to tourism in North Wales. Tourism Management, 5, 40-47.
Shumaker, R. E., & Lomax, R. G. (1996). A beginner’s guide to structural equation modeling. Mahwah, New Jersey: Lawrence Erlbaum Associates, Publishers.
180
Shumaker, S. A., & Taylor, R. (1983). Toward a classification of people-place relationships: A model of attachment to place. In N. R. Feimer and E. S. Geller (Eds.), Environmental psychology: directions and perspectives. (pp. 219-251). New York: Precger.
Silverberg, K. E., Backman, S., & Backman, K. (1996). A preliminary
investigation into the psychographics of nature based travelers to the South-Eastern United States. Journal of Travel Research, 14(2), 19-28.
Skidmore, W. (1975). Theoretical thinking in sociology. New/London: Cambridge University Press.
Steiger, J. H. (1990). Structural model evaluation and modification: An interval
estimation approach. Multivariate Behavioral Research, 25, 173-180.
Stern, P. C., Dietz, T., & Cuagnao, G. A. (1995). The new ecological paradigm in social –psychological context. Environment and Behavior, 27(6), 73-743.
Stokols, D., & Shumaker, S. A. (1981). People in places: A transactional view of settings. In D. Harvey (Ed.), Cognition, social behavior, and the environment (pp.442-448), Hillsdale, NJ: Erlbaum.
Tarrant, M. A., & Cprde, H. K. (1997). The effect of respondents’ characteristics on general environmental attitude0hebavirio correspondence, Environment and behavior 29, 618-637.
The world competitiveness report. (1994). World economic forum and IMP international, Switzerland: Lausanne.
Thomas, R., & Long, J. (2000). Improving competitiveness: Critical success factors for tourism development. Journal of the London Economic Policy Unit, 4, 313-328.
Timothy, D. J. (1999). Participatory planning: A view of tourism in Indonesia. Annals of Tourism Research, 26 (3), 371-391.
Twigger-Ross, C. L., & Uzzell, D. L. (1996). Place and identity processes. Journal of Environmental Psychology, 16, 205-220.
Tuan, Y. F. (1976). Geopiety: A theme in man’s attachment to nature and place. In D. Lowenthal & M Bowden (Eds.), Geographies of the mind: Essays in historical geosphy in honor of John Kirtland wright. Oxford, England: Oxford University Press (pp. 11-39).
Tuan, Y. F. (1980). Rootedness versus sense of palce. Landscape, 24, 3-8.
Tuner, J. H. (1974). The structure of sociological theory. Homewood: The Dorsey
Press.
181
Turner, J. H. (1986). The structure of sociological theory (3rd Edition). Chicago:
The Dorsey Press.
Turner, J. H. (1991). The structure of sociological theory (5th Edition). Chicago: The Dorsey Press.
Turner, L. W., & Reisinger, Y. (2001). Shopping satisfaction for domestic tourists. Journal of Retailing and Consumer Services, 8, 15-27.
Uysal, M. (1998). The determinants of tourism demand: A theoretical perspective. In Ioannides, D. and Debbage, K. G. (ed.), The economic geography of the tourist industry (pp. 79-98). London: Routledge.
Um, S., & Crompton, J. L. (1987). Measuring residents’ attachment levels in a host
community. Journal of Travel Research, 25(3), 27-29.
Uysal, M., Jurowski, C., Noe, F. P., & Mcdonald, C. D. (1994). Environmental attitude by trip and visitor characteristics. Tourism Management, 15(4), 284-294.
Van Liere, K. D., & Dunlap, R. E. (1981). Environmental concern: Does it make a difference how it’s measured? Environmental and Behavior, 13(6), 651-676.
Van Liere, K. D., & Dunlap. R. E. (1980). The social bases of environmental concern: A review of hypotheses, explanations and emprirical evidence. Public Opinion Quarterly, 44, 181-197.
Var, T. R., Beck, A., & Loftus, P. (1977). Determinants of tourist area in British Columbia. Journal of Travel Research, 15(Winter), 23-29.
Vining, J., & Ebreo, A. (1992). Prediction behavior from global and specific envrionemtnal attitudes and changes in recycling opportunities. Journal of Applied Social Psychology, 22, 1580-1607.
Warzecha, C. A., & Lime, D. W. (2001). Place attrachement in Canyonlands
National Park: Visitors’ assessment of setting attributes on the Colorado and Green Rivers. Journal of Park and Recreation Administration, 19(1), 59-78.
Wilkinson, P. F. (1997). Tourism policy & planning: Case studies from the commonwealth Caribbean, New York: Cognizant Communication Corporation.
Williams, D. R., McDonald, C. D., Riden, C. M., & Uysal, M. (1995). Community attachment, regional identity and resident attitudes toward tourism. 26th TTRA Annual Conferences, Travel and Tourism Research Association, 424-428.
Williams, D. R., Anderson, B. S., McDonald, C. D., & Pattersn, M. E. (1995, October). Measuring place attachment: More preliminary results. Paper presented at the

182
Symposium on Outdoor Recreation Planning and Management: National Recreation Parks Association Symposium on Leisure Recreation San Antonio TX.
Williams, D. R., & Roggenbuck, J. W. (1989). Measuring place attachment: Some preliminary results. Paper presented at National Recreation Parks Association Symposium on Leisure Recreation San Antonio TX, October 20-22, 1989.
Williams, D. R., & Stewart, S. L. (1998). Sense of place: An elusive concept that is fiding a place in ecosystem management, Journal of Forestry, 96(5), 18-23.
Witt, S. F., & Moutinho, L. (1994). Tourism Marketing and Management Handbook (2nd ed.). New York: Prentice Hall.
World Economic Forum. (1995). The world competitiveness report 1995. Geneve: International Institute for Management Development.
World Tourism Organization. (1980). Physical planning and area development for
tourism in the Six WTOI regions, Madrid: WTO.
Yoon, Y. (1998). Determinants of urban residents perceived impacts: A study of Williamsburg and Virginia Beach areas. Unpublished master thesis, Virginia Polytechnic Institute and State University, Blacksburg.
Yoon, Y., Chen, J., & Gursoy, (1999). An Investigation of the relationship between tourism impacts and host communities’ characteristics. Anatolia: An International Journal of Tourism and Hospitality Research, 10(1), 29-44.
Yoon, Y., Formica, S., & Uysal, M. (2001). Destination Attributes and Travel Market Segmentation. 32nd TTRA Annual Conference Proceedings, Tourism and Travel Research Association, 301-305
Yoon, Y., Gursoy, D., & Chen, J. (2000). Validating a tourism development theory with structural equation modeling. Tourism Management, 22(4), 363-372.
Zeller, R. A., & Carmines, E. G. (1980). Measurement in the social sciences. New York: Cambridge University press.
Zikmund, W. G. (1997). Business Research Method (Fifth ed.). Orlando:
Harcourt Brace College Publishers.

183
Appendix A
Cover Letter

184
Dear Participant
I am a graduate student in the Department of Hospitality and Tourism Management at
Virginia Tech, and I am working on my dissertation on the subject of tourism
development and destination competitiveness in Virginia.
The attached questionnaire is an important survey designed to assess your opinions about
general issues related to tourism development and destination competitiveness. The
answers will only be used for academic research. All information you provide will be
strictly confidential.
I would very much appreciate it if you would answer all of the questions carefully, put
the completed questionnaire into the enclosed postage-paid envelope, and drop it in any
mailbox.
Should you have any questions regarding the survey or research, feel free to contact
Yooshik Yoon (Graduate Researcher), at 540-961-3523 (email: [email protected])
Thanks for your time and help.
Sincerely, Yooshik Yoon Ph.D Student Dept. of Hospitality and Tourism Management Virginia Tech
VIRGINIA POLYTECHNIC INSTITUTE AND STATE UNIVERSITY

185
Appendix B Survey Instrument
Survey of Tourism Development and Destination Competitiveness
Part I: Tourism Development Impacts Please read each item carefully and circle the appropriate number that indicates how much you agree or disagree with each of the Tourism Development Impact statements. 1= Strongly Disagree 2= Disagree 3 = Neither Disagree nor Agree 4= Agree 5 = Strongly Agree
Strongly Strongly Disagree Agree
1. Tourism has created jobs for our community. 2. Tourism has attracted investment to our community. 3. Our standard of living has increased considerably
because of tourism. 4. Tourism has given economic benefits to local people and
businesses. 5. High-spending tourists have negatively affected our way of
life.
1 2 3 4 5 1 2 3 4 5
1 2 3 4 5
1 2 3 4 5
1 2 3 4 5
6. Tourism has changed our traditional culture. 7. Local residents have suffered from living in a tourism
destination area. 8. Tourism has encouraged a variety of cultural activities by
the local residents. 9. Tourism has resulted in more cultural exchange between
tourists and residents. 10. Tourism has resulted in positive impacts on the cultural
identity of our community.
1 2 3 4 5
1 2 3 4 5
1 2 3 4 5
1 2 3 4 5
1 2 3 4 5
11. Tourism has resulted in traffic congestion, noise, & pollution. 12. Construction of hotels & tourist facilities have destroyed the
natural environment. 13. Tourism has resulted in unpleasantly overcrowded beaches,
hiking trails, parks and other outdoor places in our community.
14. Tourism provides more parks and other recreational areas for local residents.
1 2 3 4 5
1 2 3 4 5
1 2 3 4 5
1 2 3 4 5

186
Part II: Place Attachment Please indicate how much you agree or disagree with each of the following place attachment statements. 1= Strongly Disagree 2= Disagree 3 = Neither Disagree nor Agree 4= Agree 5 = Strongly Agree
Strongly Strongly Disagree Agree
1. I would prefer to spend more time in my community if I could. 2. I am very attached to my community. 3. I identify strongly with my community. 4. This community means a lot to me. 5. I feel like this community is a part of me.
1 2 3 4 5 1 2 3 4 5 1 2 3 4 5 1 2 3 4 5 1 2 3 4 5
6. No other place can compare to this community. 7. The time I spend in my community could just as easily be spent somewhere else 8. I get more satisfaction being in my community than from visiting any other place 9. This community is the best place for what I like to do.
10. This community makes me feel like no other place can.
1 2 3 4 5 1 2 3 4 5 1 2 3 4 5 1 2 3 4 5 1 2 3 4 5
♦ What is your level of satisfaction with the following items?
Very Very Dissatisfied Satisfied
Your leisure life Your quality of life
Your recent travel experiences Your recent experiences with local event & festivals Local governments’ tourism planning & development Your participation in tourism development related decision- making Protection & preservation of tourism resources while sustaining economic benefits
1 2 3 4 5 1 2 3 4 5 1 2 3 4 5 1 2 3 4 5 1 2 3 4 5 1 2 3 4 5 1 2 3 4 5

187
Part III: Tourism Attraction Development Please indicate how much you prefer or do not prefer the development of each of the following tourism attractions in your community. 1 = Don’t at all Prefer 2 = Don’t Prefer 3 = Neutral 4= Somewhat Prefer 5 = Highly Prefer
Don’t at all Highly Prefer prefer
1. Nature-based tourism development (e.g. skiing, camping, parks, trails). 2. Attractions designed for large numbers of tourists (e.g. theme parks, resorts). 3. Cultural or historic-based attractions (e.g. museums, folk villages, historic sites). 4. Supporting visitor services (e.g. hotels, restaurants, entertainment, etc). 5. Small independent businesses (e.g. gift shops, guide services, campgrounds). 6. Cultural and folk events (e.g. concerts, arts and crafts, dances, festivals).
1 2 3 4 5 1 2 3 4 5 1 2 3 4 5 1 2 3 4 5 1 2 3 4 5 1 2 3 4 5
7. Pre-arranged attractive and flexible tour packages. 8. Outdoor recreation facilities, programs & events (e.g. hiking, bike rides, climbing). 9. Improved roads and transportation.
10. Information for tourists. 11. Sports facilities and activities. 12. Business/convention meeting events and facilities.
1 2 3 4 5 1 2 3 4 5 1 2 3 4 5 1 2 3 4 5 1 2 3 4 5 1 2 3 4 5

188
Part IV: Tourism Oriented Decisions How important are the following tourism-oriented decision, made by local tourism authorities, about developing tourism destinations and/or attractions in your community?
Not at all ExtremelyImportant Important
1. Supporting economic development of local/regional tourism products.
2. Local/regional tourism promotion and operation of tourist offices.
3. Supporting completion of local/regional tourism development plans & strategies.
4. Long term vision for tourism related to social, economic,& environmental factors.
5. Policies on zoning, permissible criteria, other controls for tourism development.
1 2 3 4 5 1 2 3 4 5 1 2 3 4 5 1 2 3 4 5 1 2 3 4 5
6. Providing guidelines & controls for facilitating tourism development possibilities.
7. Architectural and engineering designs of specific tourist facilities.
8. Safety, health & environmental integrity requirements for tourism developments.
9. Specific licenses/permits or other consents to be granted for tourism development
10. Varied assessment criteria or standards regarding tourism development.
1 2 3 4 5 1 2 3 4 5 1 2 3 4 5 1 2 3 4 5 1 2 3 4 5
11. Determining future/present land use zones for incremental tourism development.
12. Determining suitable sites that show permissible development of land for tourism
13. Infrastructure changes for enhancing the tourist experience &visitor management
14. Recreational, open space and infrastructure plans in the local region.
15. Establishing fees, taxes, rates etc.from tourism developments & visitor amenities
16. Funding for expert advice and research to address tourism-related issues.
1 2 3 4 5 1 2 3 4 5 1 2 3 4 5 1 2 3 4 5 1 2 3 4 5 1 2 3 4 5
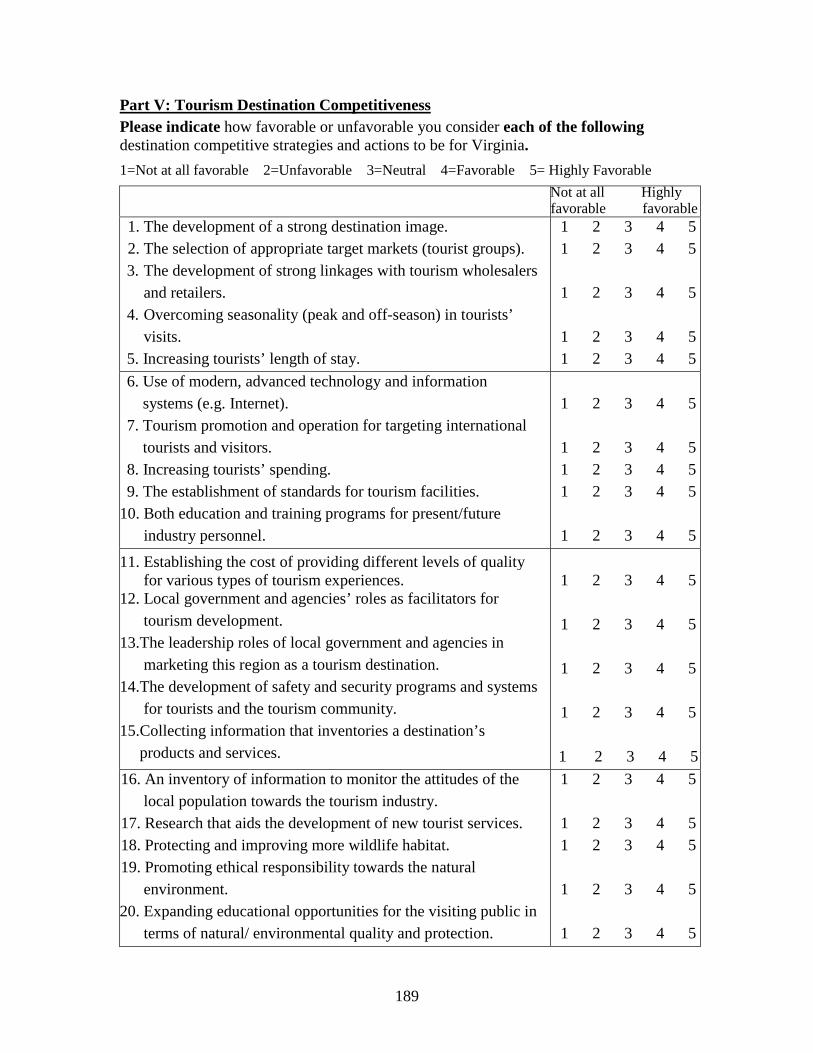
189
Part V: Tourism Destination Competitiveness Please indicate how favorable or unfavorable you consider each of the following destination competitive strategies and actions to be for Virginia. 1=Not at all favorable 2=Unfavorable 3=Neutral 4=Favorable 5= Highly Favorable
Not at all Highly favorable favorable
1. The development of a strong destination image. 2. The selection of appropriate target markets (tourist groups). 3. The development of strong linkages with tourism wholesalers
and retailers. 4. Overcoming seasonality (peak and off-season) in tourists’
visits. 5. Increasing tourists’ length of stay.
1 2 3 4 5 1 2 3 4 5
1 2 3 4 5
1 2 3 4 5 1 2 3 4 5
6. Use of modern, advanced technology and information systems (e.g. Internet). 7. Tourism promotion and operation for targeting international tourists and visitors. 8. Increasing tourists’ spending. 9. The establishment of standards for tourism facilities.
10. Both education and training programs for present/future industry personnel.
1 2 3 4 5
1 2 3 4 5 1 2 3 4 5 1 2 3 4 5
1 2 3 4 5
11. Establishing the cost of providing different levels of quality for various types of tourism experiences.
12. Local government and agencies’ roles as facilitators for tourism development.
13.The leadership roles of local government and agencies in marketing this region as a tourism destination.
14.The development of safety and security programs and systems for tourists and the tourism community.
15.Collecting information that inventories a destination’s products and services.
1 2 3 4 5
1 2 3 4 5
1 2 3 4 5
1 2 3 4 5
1 2 3 4 5
16. An inventory of information to monitor the attitudes of the local population towards the tourism industry.
17. Research that aids the development of new tourist services. 18. Protecting and improving more wildlife habitat. 19. Promoting ethical responsibility towards the natural
environment. 20. Expanding educational opportunities for the visiting public in
terms of natural/ environmental quality and protection.
1 2 3 4 5
1 2 3 4 5 1 2 3 4 5
1 2 3 4 5
1 2 3 4 5

190
21. Encouraging citizen participation in decision-making about tourism development
22. Sensible use of natural resources. 23. Environmental considerations in the marketing of tourism. 24. Environmental training of tourism staff.
1 2 3 4 5
1 2 3 4 5 1 2 3 4 5 1 2 3 4 5
Part VI: General Tourism Attitude
♦ Would you oppose or support tourism development in your community?
Strongly Oppose ___ Oppose____ Moderate____ Support ____Strongly Support ____
♦ How do you perceive the overall impacts of tourism development in your community?
Very Negative____ Negative____ Moderate ____ Positive ____ Very Positive______
♦ How would you evaluate the competitiveness of your community as a tourism destination? Not at all Competitive__ Less Competitive__Somewhat Competitive__Highly Competitive__
♦ How would you evaluate the level of tourism development in your community?
Initial Stage___ Development Stage___ Growth Stage___ Maturity Stage___ Decline Stage__
♦ How would you evaluate the attractiveness of your community as a tourism destination? Not at all Attractive___ Less Attractive ___ Somewhat Attractive____ Highly Attractive___
♦ Have you ever been involved in developing tourism attraction in your community? Not at all involved___ Seldom involved___ Somewhat involved___ Highly involved_
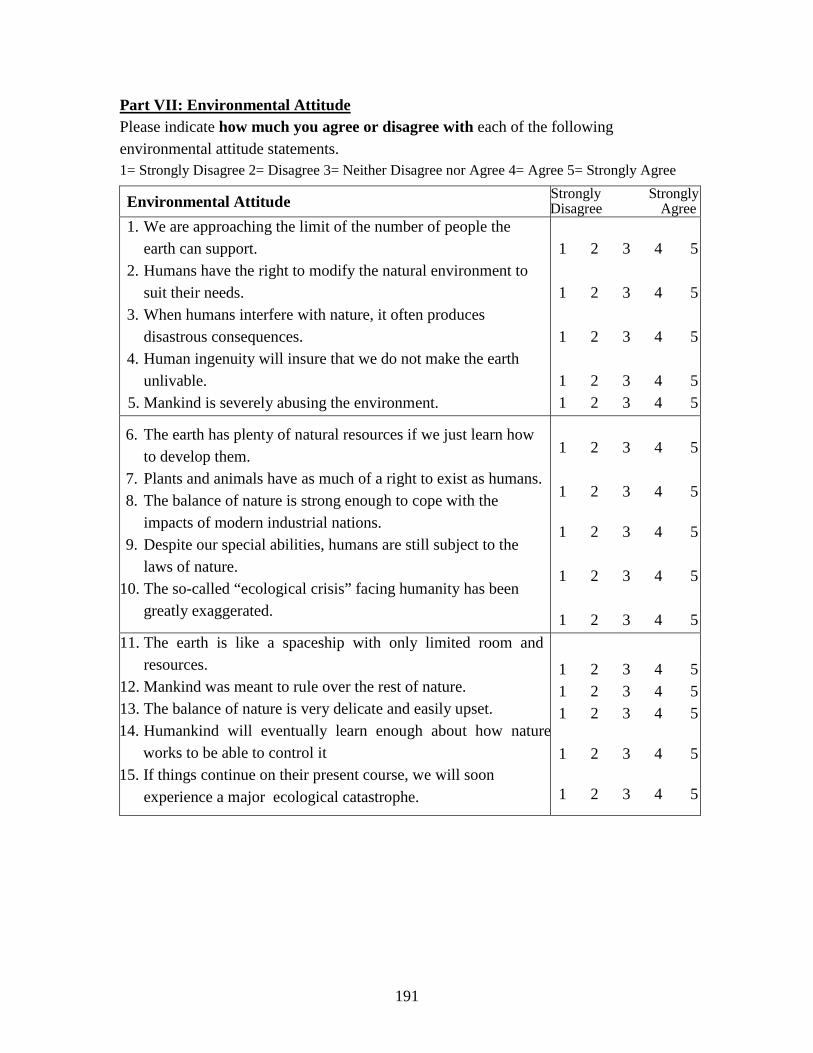
191
Part VII: Environmental Attitude Please indicate how much you agree or disagree with each of the following environmental attitude statements. 1= Strongly Disagree 2= Disagree 3= Neither Disagree nor Agree 4= Agree 5= Strongly Agree
Environmental Attitude Strongly Strongly
Disagree Agree 1. We are approaching the limit of the number of people the
earth can support. 2. Humans have the right to modify the natural environment to
suit their needs. 3. When humans interfere with nature, it often produces
disastrous consequences. 4. Human ingenuity will insure that we do not make the earth
unlivable. 5. Mankind is severely abusing the environment.
1 2 3 4 5
1 2 3 4 5
1 2 3 4 5
1 2 3 4 5 1 2 3 4 5
6. The earth has plenty of natural resources if we just learn how to develop them.
7. Plants and animals have as much of a right to exist as humans. 8. The balance of nature is strong enough to cope with the
impacts of modern industrial nations. 9. Despite our special abilities, humans are still subject to the
laws of nature. 10. The so-called “ecological crisis” facing humanity has been
greatly exaggerated.
1 2 3 4 5
1 2 3 4 5
1 2 3 4 5
1 2 3 4 5
1 2 3 4 5
11. The earth is like a spaceship with only limited room and resources.
12. Mankind was meant to rule over the rest of nature. 13. The balance of nature is very delicate and easily upset. 14. Humankind will eventually learn enough about how nature
works to be able to control it 15. If things continue on their present course, we will soon experience a major ecological catastrophe.
1 2 3 4 5 1 2 3 4 5 1 2 3 4 5
1 2 3 4 5
1 2 3 4 5

192
Part IX: Your Demographic Information
♦ Gender: (1) Male (2) Female
♦ Your Age:____________
♦ How long have you been living in Virginia?_________ year(s)
♦ Marital Status: (1) Single (2) Married (3) Widowed/Divorced/Separated
♦ Education: (1) Less than high school (2) High school (3) College (4) Graduate
♦ Your Income (before taxes):
(1) Less than $30,000 (2) $30,001–$60,000 (3) $60,001-$90,000
(4) $90,001-$120,000 (5) $120,001 or more
♦ Ethnic Groups: (1) Caucasian (2) African-American (3) Hispanic (4) Asian (5) Native American (6) Other
♦ How long have you been working for the current company or organization? _______ years
♦ Primary organization for whom you work (please mark the appropriate number)
1) (1) Chamber of Commerce 2) (2) Private business 3) (not directly related to tourism) 4) (3) Travel information center 5) (4) State & local public park
(5) Hotel & resort (6) Government official &Council (7) Non-profit organization & association (8) Convention and Visitors Bureau
(9) Outdoor recreation company, facility, & outfitters (10 Private & commercial theme park & facility (11) Local travel attractions (e.g. museum, theater) (12) College & university (13) Travel agency (14) Planning and development company related to tourism (15) Other (please specify): ________________________
Thank you for filling out the survey
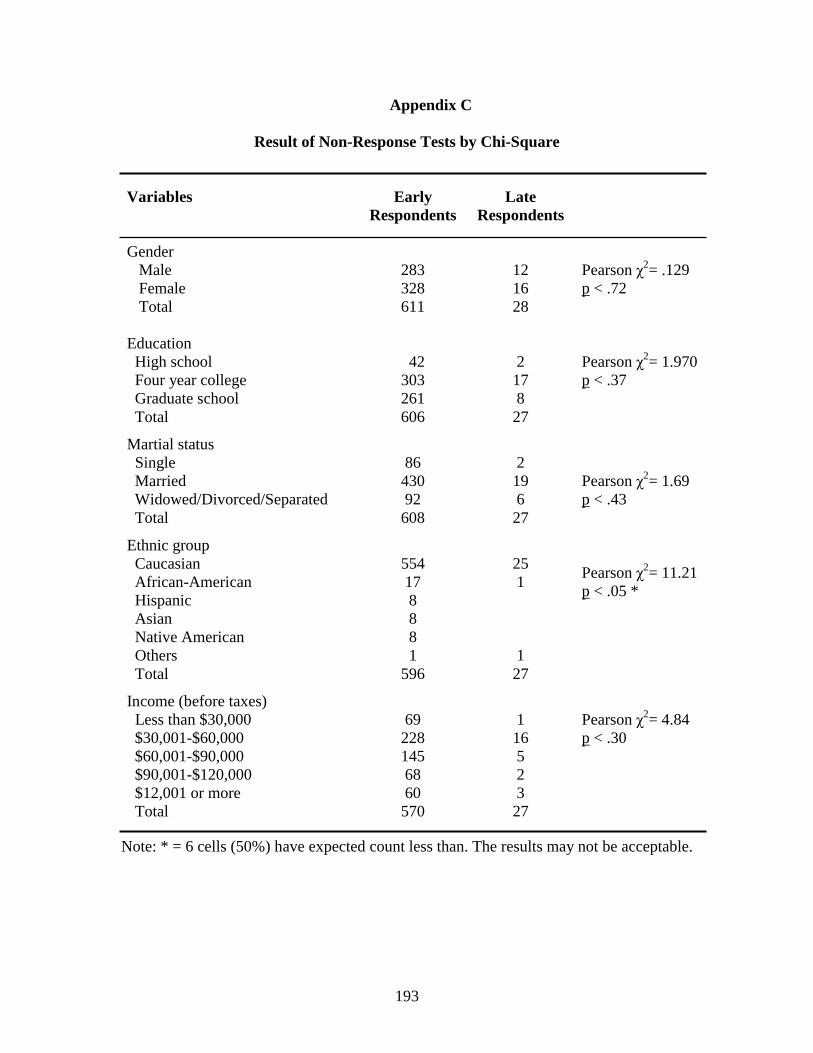
193
Appendix C
Result of Non-Response Tests by Chi-Square Variables Early
Respondents Late
Respondents
Gender Male Female Total
283 328 611
12 16 28
Pearson χ2= .129 p < .72
Education High school Four year college Graduate school Total
Martial status Single Married Widowed/Divorced/Separated Total
Ethnic group Caucasian African-American Hispanic Asian Native American Others Total
Income (before taxes) Less than $30,000 $30,001-$60,000 $60,001-$90,000 $90,001-$120,000 $12,001 or more Total
42 303 261 606
86 430 92 608
554 17 8 8 8 1
596
69 228 145 68 60 570
2 17 8 27
2 19 6 27
25 1 1 27
1 16 5 2 3 27
Pearson χ2= 1.970 p < .37
Pearson χ2= 1.69 p < .43 Pearson χ2= 11.21 p < .05 * Pearson χ2= 4.84 p < .30
Note: * = 6 cells (50%) have expected count less than. The results may not be acceptable.
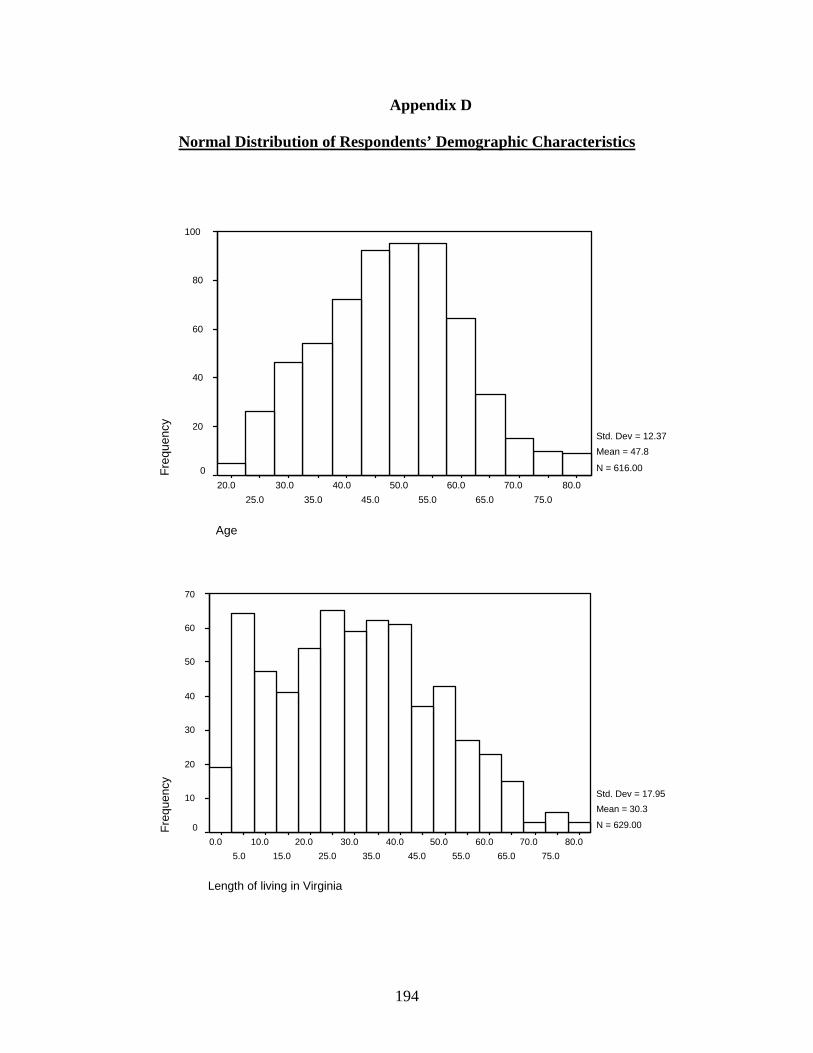
194
Appendix D
Normal Distribution of Respondents’ Demographic Characteristics
Age
80.0
75.0
70.0
65.0
60.0
55.0
50.0
45.0
40.0
35.0
30.0
25.0
20.0
Fre
quen
cy
100
80
60
40
20
0
Std. Dev = 12.37
Mean = 47.8
N = 616.00
Length of living in Virginia
80.0
75.0
70.0
65.0
60.0
55.0
50.0
45.0
40.0
35.0
30.0
25.0
20.0
15.0
10.0
5.0
0.0
Fre
quen
cy
70
60
50
40
30
20
10
0
Std. Dev = 17.95
Mean = 30.3
N = 629.00

195
Appendix E.1
Results of Skewness and Kurtosis for Tourism Development Impacts
!PRELIS SYNTAX: Can be edited SY=E:\DISSER~1\DISSER~2\DATA\TDI.PSF NS 1 2 3 4 5 6 7 8 9 10 11 12 13 14 OU MA=PM XB XM Total Sample Size = 646 Listwise Deletion Total Effective Sample Size = 636 Univariate Summary Statistics for Continuous Variables
Variable Mean St. Dev. T-Value Skewness Kurtosis Minimum Freq. Maximum Freq.
TDI1 0.000 0.871 0.000 -0.824 -0.406 -2.545 9 0.710 354 TDI2 0.000 0.911 0.000 -0.527 -0.610 -2.586 8 0.926 269 TDI3 0.000 0.949 0.000 -0.158 -0.515 -2.250 20 1.396 128 TDI4 0.000 0.904 0.000 -0.458 -0.459 -2.545 9 0.984 248 TDI5 0.000 0.894 0.000 0.647 -0.614 -0.821 309 2.250 20 TDI6 0.000 0.953 0.000 0.156 -0.562 -1.428 121 2.047 33 TDI7 0.000 0.916 0.000 0.433 -0.530 -1.024 234 2.474 11 TDI8 0.000 0.939 0.000 -0.181 -0.246 -2.413 13 1.525 101 TDI9 0.000 0.946 0.000 -0.092 -0.236 -2.413 13 1.716 69 TDI10 0.000 0.946 0.000 -0.172 -0.408 -2.291 18 1.441 118 TDI11 0.000 0.957 0.000 0.102 -0.632 -1.484 109 1.913 4 TDI12 0.000 0.945 0.000 0.260 -0.656 -1.238 168 2.161 25 TDI13 0.000 0.938 0.000 0.299 -0.585 -1.199 179 2.250 20 TDI14 0.000 0.948 0.000 -0.128 -0.299 -2.101 29 1.682 74
Note: TDI = Tourism Development Impacts
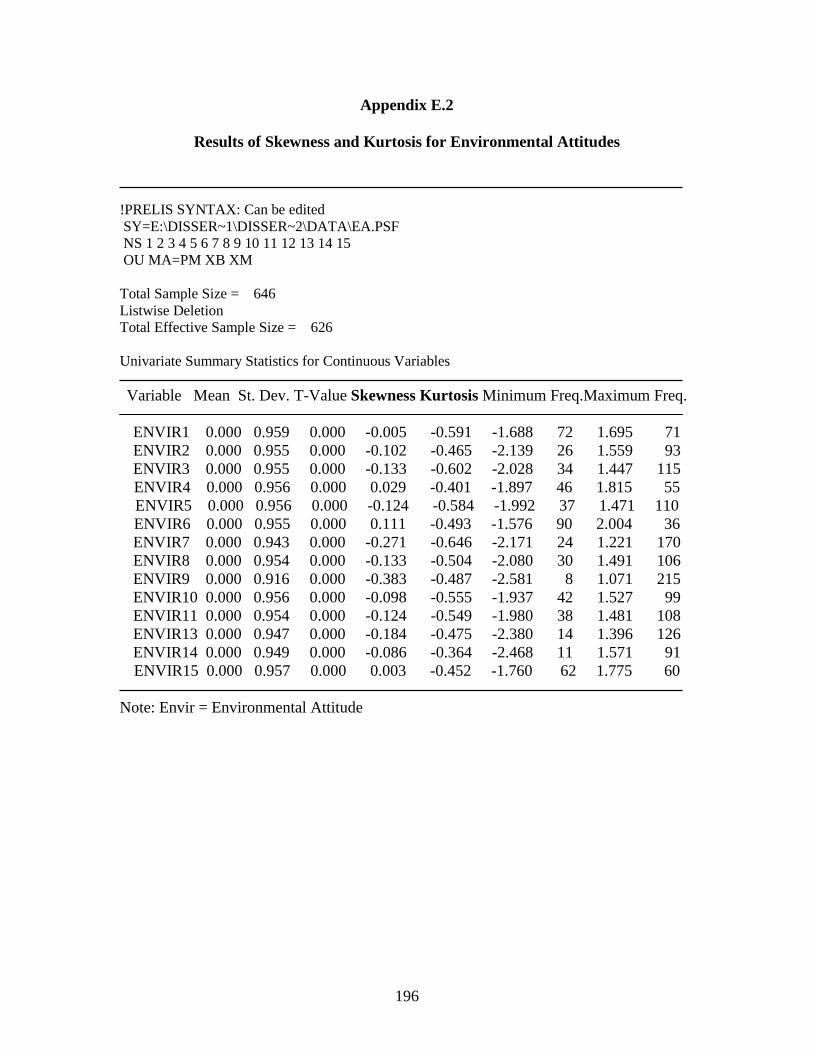
196
Appendix E.2
Results of Skewness and Kurtosis for Environmental Attitudes
!PRELIS SYNTAX: Can be edited SY=E:\DISSER~1\DISSER~2\DATA\EA.PSF NS 1 2 3 4 5 6 7 8 9 10 11 12 13 14 15 OU MA=PM XB XM Total Sample Size = 646 Listwise Deletion Total Effective Sample Size = 626 Univariate Summary Statistics for Continuous Variables
Variable Mean St. Dev. T-Value Skewness Kurtosis Minimum Freq.Maximum Freq.
ENVIR1 0.000 0.959 0.000 -0.005 -0.591 -1.688 72 1.695 71 ENVIR2 0.000 0.955 0.000 -0.102 -0.465 -2.139 26 1.559 93 ENVIR3 0.000 0.955 0.000 -0.133 -0.602 -2.028 34 1.447 115 ENVIR4 0.000 0.956 0.000 0.029 -0.401 -1.897 46 1.815 55 ENVIR5 0.000 0.956 0.000 -0.124 -0.584 -1.992 37 1.471 110 ENVIR6 0.000 0.955 0.000 0.111 -0.493 -1.576 90 2.004 36 ENVIR7 0.000 0.943 0.000 -0.271 -0.646 -2.171 24 1.221 170 ENVIR8 0.000 0.954 0.000 -0.133 -0.504 -2.080 30 1.491 106 ENVIR9 0.000 0.916 0.000 -0.383 -0.487 -2.581 8 1.071 215 ENVIR10 0.000 0.956 0.000 -0.098 -0.555 -1.937 42 1.527 99 ENVIR11 0.000 0.954 0.000 -0.124 -0.549 -1.980 38 1.481 108 ENVIR13 0.000 0.947 0.000 -0.184 -0.475 -2.380 14 1.396 126 ENVIR14 0.000 0.949 0.000 -0.086 -0.364 -2.468 11 1.571 91 ENVIR15 0.000 0.957 0.000 0.003 -0.452 -1.760 62 1.775 60
Note: Envir = Environmental Attitude

197
Appendix E.3
Results of Skewness and Kurtosis for Environmental Attitudes !PRELIS SYNTAX: Can be edited SY=E:\DISSER~1\DISSER~2\DATA\PA.PSF NS 1 2 3 4 5 6 7 8 9 10 OU MA=PM XB XM Total Sample Size = 646 Listwise Deletion Total Effective Sample Size = 639 Univariate Summary Statistics for Continuous Variables Variable Mean St. Dev. T-Value Skewness Kurtosis Minimum Freq. Maximum Freq. PA1 0.000 0.942 0.000 -0.149 -0.376 -2.510 10 1.444 118 PA2 0.000 0.925 0.000 -0.368 -0.520 -2.510 10 1.103 209 PA3 0.000 0.928 0.000 -0.360 -0.556 -2.510 10 1.110 207 PA4 0.000 0.911 0.000 -0.458 -0.531 -2.547 9 0.990 247 PA5 0.000 0.933 0.000 -0.337 -0.589 -2.361 15 1.142 197 PA6 0.000 0.959 0.000 -0.028 -0.549 -1.842 53 1.646 80 PA7 0.000 0.955 0.000 0.082 -0.400 -1.698 72 2.089 30 PA8 0.000 0.953 0.000 0.054 -0.288 -1.842 53 2.037 34 PA9 0.000 0.954 0.000 -0.083 -0.384 -2.132 27 1.640 81 PA10 0.000 0.957 0.000 -0.043 -0.441 -1.978 39 1.678 75 Note: PA = Place Attachment
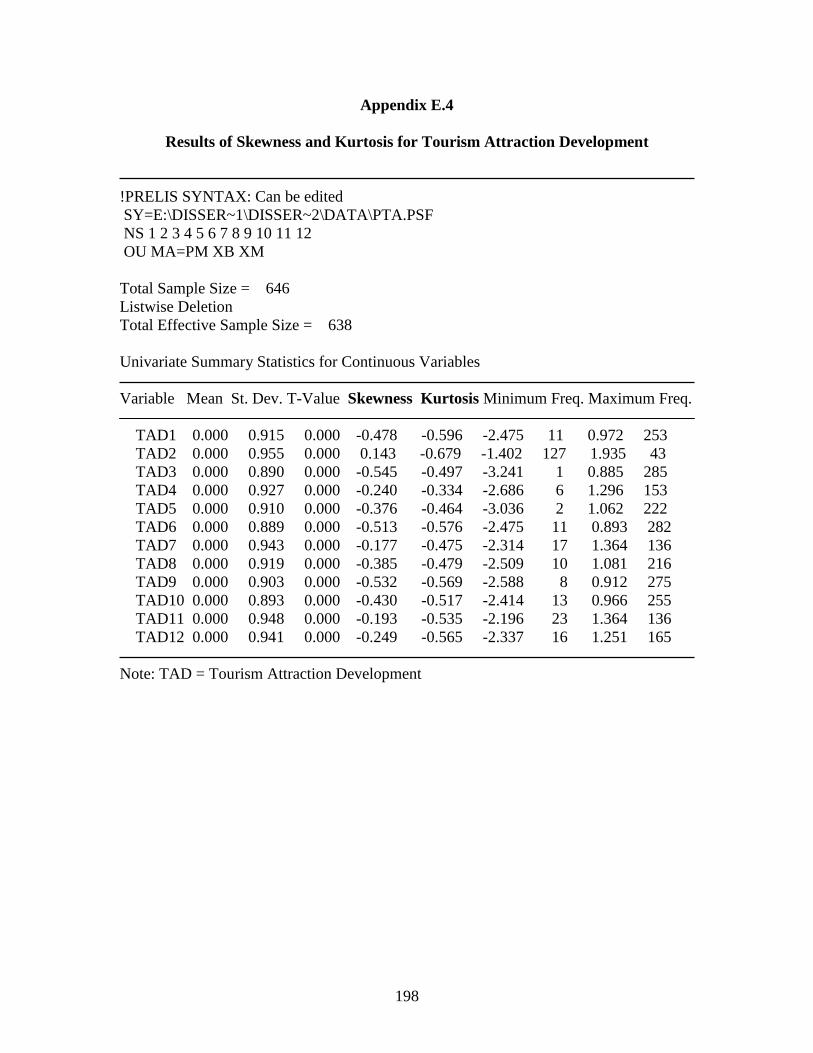
198
Appendix E.4
Results of Skewness and Kurtosis for Tourism Attraction Development !PRELIS SYNTAX: Can be edited SY=E:\DISSER~1\DISSER~2\DATA\PTA.PSF NS 1 2 3 4 5 6 7 8 9 10 11 12 OU MA=PM XB XM Total Sample Size = 646 Listwise Deletion Total Effective Sample Size = 638 Univariate Summary Statistics for Continuous Variables Variable Mean St. Dev. T-Value Skewness Kurtosis Minimum Freq. Maximum Freq. TAD1 0.000 0.915 0.000 -0.478 -0.596 -2.475 11 0.972 253 TAD2 0.000 0.955 0.000 0.143 -0.679 -1.402 127 1.935 43 TAD3 0.000 0.890 0.000 -0.545 -0.497 -3.241 1 0.885 285 TAD4 0.000 0.927 0.000 -0.240 -0.334 -2.686 6 1.296 153 TAD5 0.000 0.910 0.000 -0.376 -0.464 -3.036 2 1.062 222 TAD6 0.000 0.889 0.000 -0.513 -0.576 -2.475 11 0.893 282 TAD7 0.000 0.943 0.000 -0.177 -0.475 -2.314 17 1.364 136 TAD8 0.000 0.919 0.000 -0.385 -0.479 -2.509 10 1.081 216 TAD9 0.000 0.903 0.000 -0.532 -0.569 -2.588 8 0.912 275 TAD10 0.000 0.893 0.000 -0.430 -0.517 -2.414 13 0.966 255 TAD11 0.000 0.948 0.000 -0.193 -0.535 -2.196 23 1.364 136 TAD12 0.000 0.941 0.000 -0.249 -0.565 -2.337 16 1.251 165 Note: TAD = Tourism Attraction Development
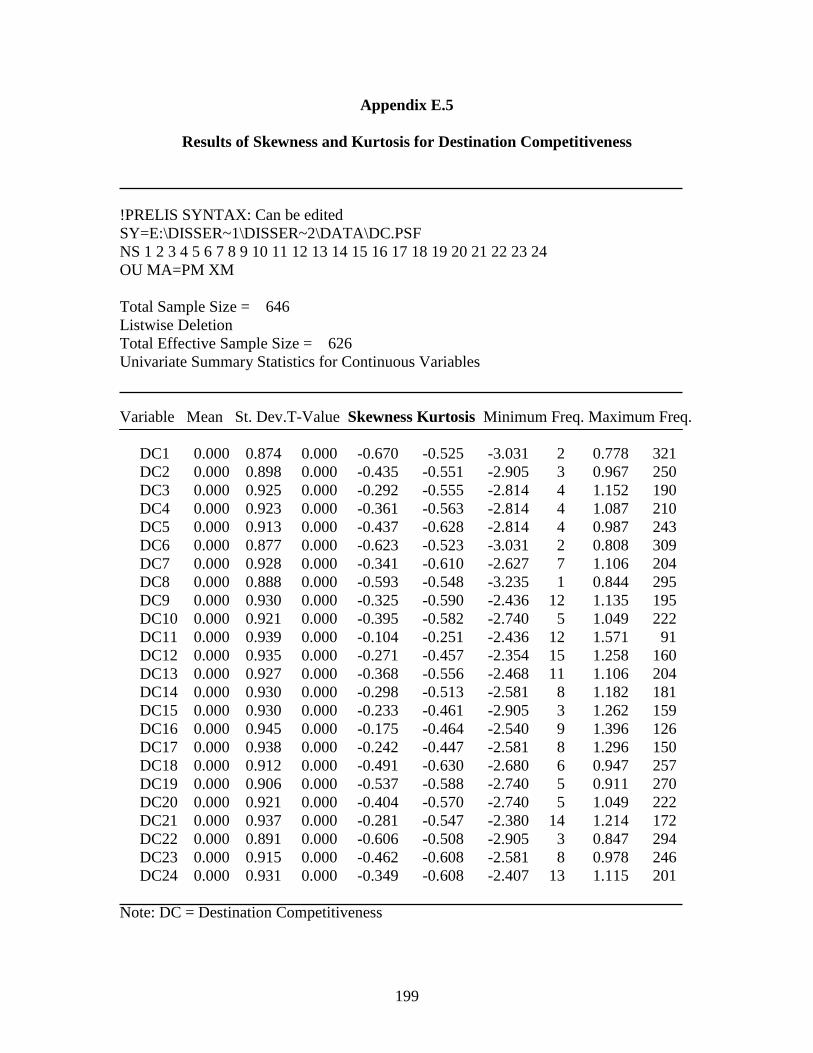
199
Appendix E.5
Results of Skewness and Kurtosis for Destination Competitiveness !PRELIS SYNTAX: Can be edited SY=E:\DISSER~1\DISSER~2\DATA\DC.PSF NS 1 2 3 4 5 6 7 8 9 10 11 12 13 14 15 16 17 18 19 20 21 22 23 24 OU MA=PM XM Total Sample Size = 646 Listwise Deletion Total Effective Sample Size = 626 Univariate Summary Statistics for Continuous Variables Variable Mean St. Dev.T-Value Skewness Kurtosis Minimum Freq. Maximum Freq. DC1 0.000 0.874 0.000 -0.670 -0.525 -3.031 2 0.778 321 DC2 0.000 0.898 0.000 -0.435 -0.551 -2.905 3 0.967 250 DC3 0.000 0.925 0.000 -0.292 -0.555 -2.814 4 1.152 190 DC4 0.000 0.923 0.000 -0.361 -0.563 -2.814 4 1.087 210 DC5 0.000 0.913 0.000 -0.437 -0.628 -2.814 4 0.987 243 DC6 0.000 0.877 0.000 -0.623 -0.523 -3.031 2 0.808 309 DC7 0.000 0.928 0.000 -0.341 -0.610 -2.627 7 1.106 204 DC8 0.000 0.888 0.000 -0.593 -0.548 -3.235 1 0.844 295 DC9 0.000 0.930 0.000 -0.325 -0.590 -2.436 12 1.135 195 DC10 0.000 0.921 0.000 -0.395 -0.582 -2.740 5 1.049 222 DC11 0.000 0.939 0.000 -0.104 -0.251 -2.436 12 1.571 91 DC12 0.000 0.935 0.000 -0.271 -0.457 -2.354 15 1.258 160 DC13 0.000 0.927 0.000 -0.368 -0.556 -2.468 11 1.106 204 DC14 0.000 0.930 0.000 -0.298 -0.513 -2.581 8 1.182 181 DC15 0.000 0.930 0.000 -0.233 -0.461 -2.905 3 1.262 159 DC16 0.000 0.945 0.000 -0.175 -0.464 -2.540 9 1.396 126 DC17 0.000 0.938 0.000 -0.242 -0.447 -2.581 8 1.296 150 DC18 0.000 0.912 0.000 -0.491 -0.630 -2.680 6 0.947 257 DC19 0.000 0.906 0.000 -0.537 -0.588 -2.740 5 0.911 270 DC20 0.000 0.921 0.000 -0.404 -0.570 -2.740 5 1.049 222 DC21 0.000 0.937 0.000 -0.281 -0.547 -2.380 14 1.214 172 DC22 0.000 0.891 0.000 -0.606 -0.508 -2.905 3 0.847 294 DC23 0.000 0.915 0.000 -0.462 -0.608 -2.581 8 0.978 246 DC24 0.000 0.931 0.000 -0.349 -0.608 -2.407 13 1.115 201 Note: DC = Destination Competitiveness

200
Appendix F.1
Result of Reliability for Tourism Development Impacts
R E L I A B I L I T Y A N A L Y S I S - S C A L E (A L P H A) Item-total Statistics Scale Scale Corrected Mean Variance Item- Alpha if Item if Item Total if Item Deleted Deleted Correlation Deleted TDI01 39.4308 41.7480 .4745 .7404 TDI2 39.6447 41.0609 .5141 .7362 TDI3 40.2374 40.6223 .4929 .7372 TDI4 39.5881 42.1702 .4773 .7411 TDI5 41.9497 45.1912 .1527 .7702 TDI6 41.2358 41.1002 .4226 .7443 TDI7 41.8286 44.4698 .2346 .7618 TDI8 40.1116 42.3230 .4121 .7460 TDI9 40.3302 42.5711 .4026 .7470 TDI10 40.1336 42.2923 .3932 .7476 TDI11 41.0346 41.1705 .3809 .7492 TDI12 41.4230 42.1279 .3365 .7537 TDI13 41.5597 42.5114 .3407 .7528 TDI14 40.3239 43.7154 .2650 .7598 R E L I A B I L I T Y A N A L Y S I S - S C A L E (A L P H A) Analysis of Variance Source of Variation Sum of Sq. DF Mean Square F Prob. Between People 2188.5161 635 3.4465 Within People 12816.3571 8268 1.5501 Between Measures 6073.5289 13 467.1945 571.9693 .0000 Residual 6742.8283 8255 .8168 Total 15004.8732 8903 1.6854 Grand Mean 3.1254 Reliability Coefficients N of Cases = 636.0 N of Items = 14 Alpha = .7630

201
Appendix F.2
Result of Reliability for Environmental Attitudes
R E L I A B I L I T Y A N A L Y S I S - S C A L E (A L P H A) Item-total Statistics Scale Scale Corrected Mean Variance Item- Alpha if Item if Item Total if Item Deleted Deleted Correlation Deleted ENVIR1 46.8147 85.2712 .5930 .8741 ENVIR2RE 46.4888 87.6519 .5326 .8769 ENVIR3 46.4665 87.4141 .4988 .8785 ENVIR4RE 46.9345 87.8629 .5184 .8775 ENVIR5 46.4792 85.2292 .6155 .8731 ENVIR6RE 47.2013 88.8394 .4439 .8808 ENVIR7 46.1390 87.3519 .5306 .8770 ENVIR8RE 46.4089 85.7781 .6233 .8729 ENVIR9 45.7700 93.3486 .3133 .8848 ENVIR10R 46.5367 83.5802 .7076 .8688 ENVIR11 46.4441 85.6713 .6099 .8734 ENVIR12R 46.6757 87.8003 .4683 .8800 ENVIR13 46.2268 87.4141 .5809 .8749 ENVIR14R 46.4121 91.0107 .4036 .8819 ENVIR15 46.8546 84.3868 .6852 .8700 R E L I A B I L I T Y A N A L Y S I S - S C A L E (A L P H A) Analysis of Variance Source of Variation Sum of Sq. DF Mean Square F Prob. Between People 4138.4852 625 6.6216 Within People 7795.2000 8764 .8895 Between Measures 1056.7012 14 75.4787 98.0097 .0000 Residual 6738.4988 8750 .7701 Total 11933.6852 9389 1.2710 Grand Mean 3.3231 Reliability Coefficients N of Cases = 626.0 N of Items = 15 Alpha = .883

202
Appendix F.3.1
Result of Reliability for Place Attachment (included Item PA7)
R E L I A B I L I T Y A N A L Y S I S - S C A L E (A L P H A) Item-total Statistics Scale Scale Corrected Mean Variance Item- Alpha if Item if Item Total if Item Deleted Deleted Correlation Deleted PA1 31.0250 33.3411 .4604 .8163 PA2 30.6745 30.3860 .7673 .7867 PA3 30.7089 30.0343 .7848 .7842 PA4 30.5430 30.9570 .7439 .7903 PA5 30.7872 29.6631 .7693 .7841 PA6 31.5978 30.1687 .6101 .8005 PA7 31.9562 44.1956 -.4434 .8988 PA8 31.8748 32.5329 .4915 .8134 PA9 31.3427 31.2288 .5969 .8025 PA10 31.5180 30.2344 .6533 .7958 Analysis of Variance Source of Variation Sum of Sq. DF Mean Square F Prob. Between People 2494.1327 638 3.9093 Within People 5454.4000 5751 .9484 Between Measures 1569.8942 9 174.4327 257.8430 .0000 Residual 3884.5058 5742 .6765 Total 7948.5327 6389 1.2441 Grand Mean 3.4670 R E L I A B I L I T Y A N A L Y S I S - S C A L E (A L P H A) Reliability Coefficients N of Cases = 639.0 N of Items = 10 Alpha = .8269
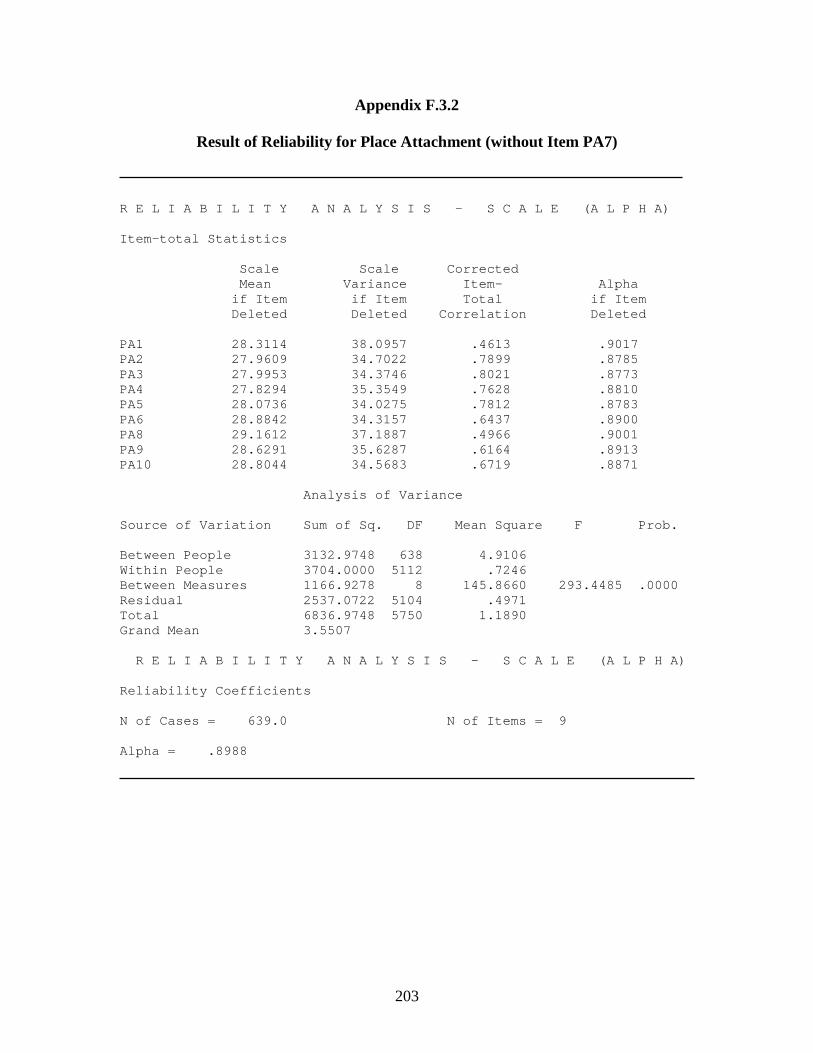
203
Appendix F.3.2
Result of Reliability for Place Attachment (without Item PA7)
R E L I A B I L I T Y A N A L Y S I S - S C A L E (A L P H A) Item-total Statistics Scale Scale Corrected Mean Variance Item- Alpha if Item if Item Total if Item Deleted Deleted Correlation Deleted PA1 28.3114 38.0957 .4613 .9017 PA2 27.9609 34.7022 .7899 .8785 PA3 27.9953 34.3746 .8021 .8773 PA4 27.8294 35.3549 .7628 .8810 PA5 28.0736 34.0275 .7812 .8783 PA6 28.8842 34.3157 .6437 .8900 PA8 29.1612 37.1887 .4966 .9001 PA9 28.6291 35.6287 .6164 .8913 PA10 28.8044 34.5683 .6719 .8871 Analysis of Variance Source of Variation Sum of Sq. DF Mean Square F Prob. Between People 3132.9748 638 4.9106 Within People 3704.0000 5112 .7246 Between Measures 1166.9278 8 145.8660 293.4485 .0000 Residual 2537.0722 5104 .4971 Total 6836.9748 5750 1.1890 Grand Mean 3.5507 R E L I A B I L I T Y A N A L Y S I S - S C A L E (A L P H A) Reliability Coefficients N of Cases = 639.0 N of Items = 9 Alpha = .8988

204
Appendix F.4
Result of Reliability for Tourism Attraction Development
R E L I A B I L I T Y A N A L Y S I S - S C A L E (A L P H A) Item-total Statistics Scale Scale Corrected Mean Variance Item- Alpha if Item if Item Total if Item Deleted Deleted Correlation Deleted TAD1 42.7351 34.7445 .2341 .8134 TAD2 44.1959 32.2143 .3424 .8087 TAD3 42.5408 33.8845 .4171 .7967 TAD4 42.9232 32.0333 .5761 .7830 TAD5 42.6975 33.1187 .4923 .7906 TAD6 42.5282 33.5400 .4917 .7914 TAD7 43.1646 31.3402 .5442 .7845 TAD8 42.7759 32.8775 .4404 .7945 TAD9 42.6332 32.6942 .4786 .7912 TAD10 42.5737 33.1209 .5497 .7873 TAD11 43.2226 31.5202 .4783 .7913 TAD12 43.0784 31.2780 .5289 .7859 R E L I A B I L I T Y A N A L Y S I S - S C A L E (A L P H A) Analysis of Variance Source of Variation Sum of Sq. DF Mean Square F Prob. Between People 2030.0282 637 3.1869 Within People 5840.5000 7018 .8322 Between Measures 1536.5282 11 139.6844 227.4105 .0000 Residual 4303.9718 7007 .6142 Total 7870.5282 7655 1.0282 Grand Mean 3.9020 Reliability Coefficients N of Cases = 638.0 N of Items = 12 Alpha = .8073
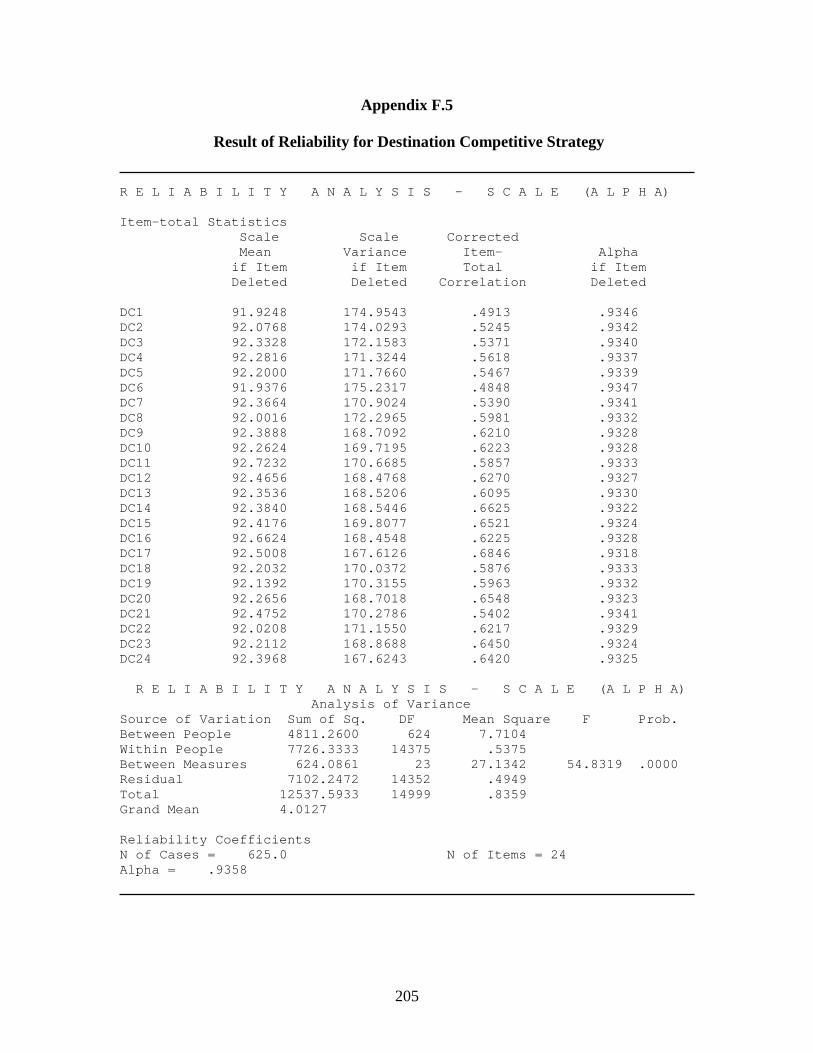
205
Appendix F.5
Result of Reliability for Destination Competitive Strategy
R E L I A B I L I T Y A N A L Y S I S - S C A L E (A L P H A) Item-total Statistics Scale Scale Corrected Mean Variance Item- Alpha if Item if Item Total if Item Deleted Deleted Correlation Deleted DC1 91.9248 174.9543 .4913 .9346 DC2 92.0768 174.0293 .5245 .9342 DC3 92.3328 172.1583 .5371 .9340 DC4 92.2816 171.3244 .5618 .9337 DC5 92.2000 171.7660 .5467 .9339 DC6 91.9376 175.2317 .4848 .9347 DC7 92.3664 170.9024 .5390 .9341 DC8 92.0016 172.2965 .5981 .9332 DC9 92.3888 168.7092 .6210 .9328 DC10 92.2624 169.7195 .6223 .9328 DC11 92.7232 170.6685 .5857 .9333 DC12 92.4656 168.4768 .6270 .9327 DC13 92.3536 168.5206 .6095 .9330 DC14 92.3840 168.5446 .6625 .9322 DC15 92.4176 169.8077 .6521 .9324 DC16 92.6624 168.4548 .6225 .9328 DC17 92.5008 167.6126 .6846 .9318 DC18 92.2032 170.0372 .5876 .9333 DC19 92.1392 170.3155 .5963 .9332 DC20 92.2656 168.7018 .6548 .9323 DC21 92.4752 170.2786 .5402 .9341 DC22 92.0208 171.1550 .6217 .9329 DC23 92.2112 168.8688 .6450 .9324 DC24 92.3968 167.6243 .6420 .9325 R E L I A B I L I T Y A N A L Y S I S - S C A L E (A L P H A)
Analysis of Variance Source of Variation Sum of Sq. DF Mean Square F Prob. Between People 4811.2600 624 7.7104 Within People 7726.3333 14375 .5375 Between Measures 624.0861 23 27.1342 54.8319 .0000 Residual 7102.2472 14352 .4949 Total 12537.5933 14999 .8359 Grand Mean 4.0127 Reliability Coefficients N of Cases = 625.0 N of Items = 24 Alpha = .9358
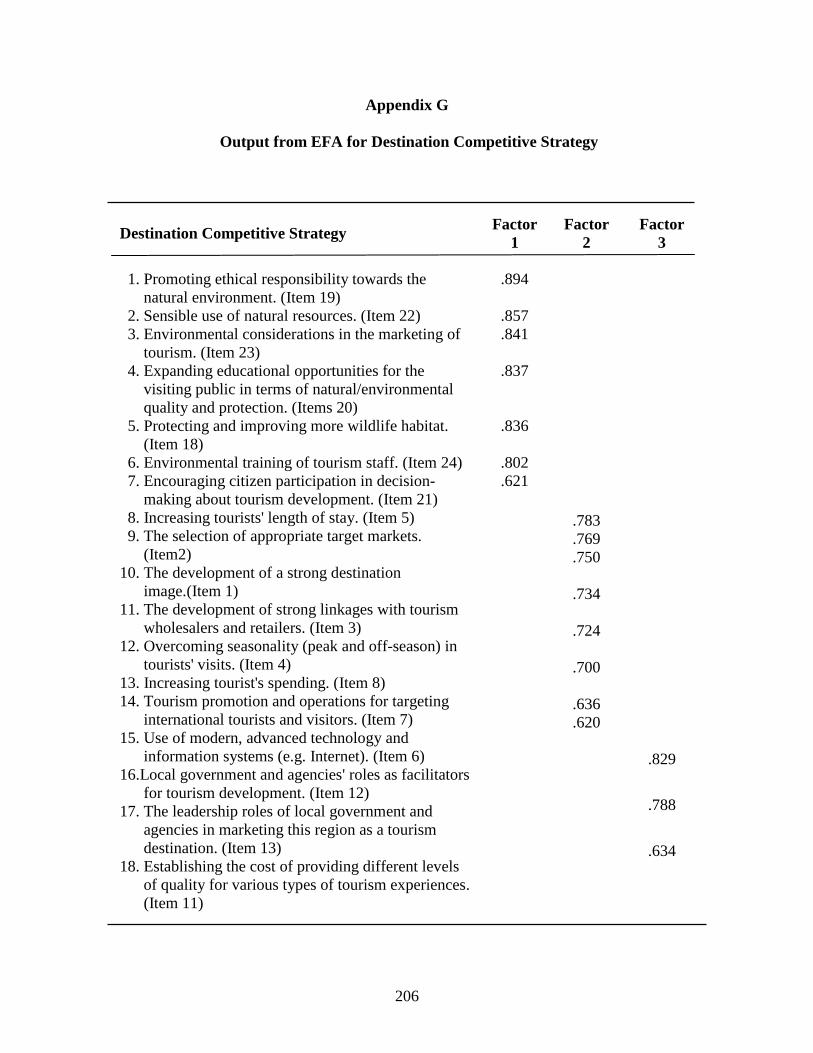
206
Appendix G
Output from EFA for Destination Competitive Strategy
Destination Competitive Strategy Factor 1
Factor 2
Factor 3
.894
.857 .841
.837
.836
.802
.621
.783
.769
.750
.734
.724
.700
.636
.620
1. Promoting ethical responsibility towards the
natural environment. (Item 19) 2. Sensible use of natural resources. (Item 22) 3. Environmental considerations in the marketing of
tourism. (Item 23) 4. Expanding educational opportunities for the
visiting public in terms of natural/environmental quality and protection. (Items 20)
5. Protecting and improving more wildlife habitat. (Item 18)
6. Environmental training of tourism staff. (Item 24) 7. Encouraging citizen participation in decision-
making about tourism development. (Item 21) 8. Increasing tourists' length of stay. (Item 5) 9. The selection of appropriate target markets.
(Item2) 10. The development of a strong destination
image.(Item 1) 11. The development of strong linkages with tourism
wholesalers and retailers. (Item 3) 12. Overcoming seasonality (peak and off-season) in
tourists' visits. (Item 4) 13. Increasing tourist's spending. (Item 8) 14. Tourism promotion and operations for targeting
international tourists and visitors. (Item 7) 15. Use of modern, advanced technology and
information systems (e.g. Internet). (Item 6) 16.Local government and agencies' roles as facilitators
for tourism development. (Item 12) 17. The leadership roles of local government and
agencies in marketing this region as a tourism destination. (Item 13)
18. Establishing the cost of providing different levels of quality for various types of tourism experiences. (Item 11)
.829
.788
.634

207
VITA
Yooshik Yoon (Ph. D)
Current Address Permanent Address Dept. of Hospitality and Tourism Management A-103, 61-27 Virginia Polytechnic Institute and State University Dae 2 –Dong, dong-Gu 362 Wallace Hall Daejeon Blacksburg, VA 24060-0429 South Korea Phone: 540-961-3523 zip code: 300-072 Email: [email protected] Phone: 82-42-673-0786 EDUCATIONAL BACKGROUND
Doctor of Philosophy, Ph. D (September, 2002)
Virginia Polytechnic Institute and State University Blacksburg, Virginia, USA
Department of Hospitality and Tourism Management Major: Tourism Management
Minor: Hospitality and Tourism Research Methods Co-Chair: Dr. Muzaffer S. Uysal
Co-Chair: Dr. Joseph S. Chen Topic of Dissertation: Development of a Structural Model for Tourism Destination Competitiveness from Stakeholders’ Perspectives
Master of Science, MS (December, 1998)
Virginia Polytechnic Institute and State University Blacksburg, Virginia, USA
Department of Hospitality and Tourism Management Major: Tourism Management
Title of Thesis: Determinants of Urban Residents’ Perceived Tourism Impacts: A Study on the Williamsburg and Virginia Beach Areas
Management Business Administration, MBA (February, 1994)
Sejong University, Seoul, South Korea Department of Tourism Management Major: Tourism Management Title of Thesis: Employees’ Job Involvement and Job Security Based on Job Characteristics in the Hospitality and Tourism Industry.
Bachelor of Art, BA (February, 1992) Hanshin University, Suwon, South of Korea.
Department of English Linguistics and Literature

208
GRADUATE COURSE-WORK TAKEN
Hospitality & Tourism Related Courses (16): Current Issues in Travel & Tourism MGT, Tourism Economics, Tourism
Planning, Travel and Tourism Behavior, Theory of Travel and Tourism, Studies on Tourism Policy, Travel and Tourism Marketing, Global Tourism Market Analysis, Tourism Resources, Hospitality and Tourism Marketing Strategy, Hotel Construction Planning, Hotel MGT, Advanced Seminar in HTM, Advance Studies on HTM, Strategic MGT and Competitive Strategy in the Hospitality Industries, Contemporary Problems in the Hospitality Industry, and Human Resources MGT, Statistics and Methodology Related Courses (8): Advanced Quantitative Methods for HTM, Statistics for Behavior Science, Advanced Statistics in Education, Research Methods for HTM, Advanced Quantitative Marketing Methodology, Measurement Theory, Applied Structural Equation Modeling, and Multivariate Statistics and Analysis, General Graduate Courses (2): Theory Construction, and Seminar in Buyer Behavior Research,
PUBLICATIONS IN REFEREED JOURNALS Yoon, Y., & Uysal, M. (accepted). An Examination of the Effects of Motivation and Satisfaction on Destination Loyalty: A Structural Model. Tourism Management.
Hallab, Z., Yoon, Y., & Uysal, M. (accepted). An Identification of Market Segments Based on Healthy-Living Attitude. Journal of Hospitality & Leisure Marketing. Weaver, P., Kaufman, T., & Yoon, Y. (2002). A Market Segmentation Study Based on Benefits Sought. Tourism Analysis, 6 (3/4): 213-222. Yoon, Y., Gursoy, D., & Chen, J. (2001). Validating a Tourism Development Theory with Structural Equation Modeling. Tourism Management, 22 (4): 363-372. Chen, J., Ekinci, Y., Rlley, M., Yoon, Y., & Tjelflasst, S. (2001). What Do Norwegians Think of US Lodging Services? International Journal of Contemporary Hospitality Management, 13 (6): 280-284. Yoon, Y., Chen, J. & Gursoy, D. (1999). An Investigation of the Relationship between Tourism Impacts and Host Communities’ Characteristics. Anatolia: An International Journal of Tourism and Hospitality Research, 10 (1): 29-44.
209
PUBLICATIONS IN REFEREED PROCEEDINGS Yoon, Y., & Kim, S. (2002). An Assessment and Construct Validation of Destination Image. 33th TTRA Annual Conference Proceedings, Tourism and Travel Research Association.
Hallab, Z., Yoon, Y., & Uysal, M. (2002). An Identification of Market Segments
Based on Healthy-Living Attitude. 33th TTRA Annual Conference Proceedings, Tourism and Travel Research Association. Yoon, Y., Uysal, M., & Mihalik, B. (2001). Effects of Tourist Motivation and Satisfaction on Destination Loyalty: A Structural Model. International Management Development Association (I.M.D.A.): Challenges and Opportunities for International Business in the Shifting Global Economic Environment. 267-270.
Yoon, Y., Formica, S., & Uysal, M. (2001). Destination Attributes and Travel Market Segmentation. 32nd TTRA Annual Conference Proceedings, Tourism and Travel Research Association, 301-305 Uysal, M., Sharma, A., & Yoon, Y. (2000). Recent Development & Trends in Tourism Demand Studies. TRENDS 2000, 5th Outdoor Recreation & Tourism Trends Symposium.
Gursoy, D., Chen, J., & Yoon, Y. (2000). Using Structure Equation Modeling to Assess the Effects of Tourism Impact Factors and Local Residents’ Support for Tourism Development. 31nd TTRA Annual Conference Proceedings, Tourism and Travel Research Association, 243-250.
Chen, J., & Yoon, Y. (1999). A Path Analytical Approach to a Tourism Impact Assessment Model. 30nd TTRA Annual Conference Proceedings, Tourism and Travel Research Association, 236-239.
Yoon, Y., & Chen, J. (1999). A Regional Analysis of the Consequences of Tourism Development from a Community Perspective. 11th Northeastern Recreation Research symposium: Public Land, Recreation, and Tourism Management for the 21st Century, Northeast Recreation Research, 11-16.
Chen, J., Sue, M., Yoon, Y., & Hun, J. (1998). Choice Factors and Destination Loyalty. 29th TTRA Annual Conference Proceedings, Tourism and Travel Research Association, 97-103.

210
PUBLICATIONS IN NON-REFEREED PROCEEDING Yoon, Y., Schroder, B., & Weaver, P. (1999). Perception and Awareness of
Explore park by Individuals in the Roanoke Valley. 15th Annual Research Symposium at Virginia Tech, 45-45. PAPERS UNDER REVIEW IN JOURNALS
Kim, S., & Yoon, Y. (Second Review). Hierarchical Effects of Affective and Cognitive Components on Tourism Destination Image: Use of Second Order Factor Analysis
McGehee, N. G., Yoon, Y., & Cardenas, D. (Third Review). Involvement as an
indicator of travel for recreational runners in North Carolina.
ACADEMIC AND TEACHING EXPERIENCES Instructor (January, 2002 – May, 2002) Taught HTM 4984 Special Study in Attraction Management
Dept. of Hospitality and Tourism MGT, Virginia Tech, Virginia, USA. The goal of this course was to acquaint the student with different types of
destination attraction management issues, including private and public sector attractions in natural and cultural settings at the local and national levels, theme and amusement parks, historical, cultural and heritage monuments, special events and festivals, impacts of attractions on destination development and marketing, assessment of importance of attractions in local economies.
Teaching Assistant (January, 1999 – December, 2001) Dept. of Hospitality and Tourism MGT, Virginia Tech, Virginia, USA August, 2001 – December, 2001
HTM 2454 Travel and Tourism Management (Internet On-line Course) 233 students enrolled, August, 2000 – May, 2001
HTM 2454 Travel and Tourism Management (Internet On-line Course) 250 students enrolled
HTM 2454 Travel and Tourism Management HTM 4984 Attraction Management
August, 1999 – May, 2000 HTM 2454 Travel and Tourism Management
January, 1999 – May, 1999 HTM 3474 Hospitality Facilities Planning and Management
211
Instructor (August, 1994 –February, 1996) Teaching position for undergraduate course in Dept. of Tourism Management, Kim-Choen College, South of Korea. In 1996, taught “Communications in Hospitality and Tourism”, and “Hotel
English and Communication” In 1995, taught “Hotel English and Communication” and “General English and
Communications” In 1994, taught “Communications in Hospitality and Tourism”, and “Tourism
English and Communication”
RESEARCH EXPERIENCES Research Assistant (January, 2002 – 2002)
Working for the grant research project: “The Current and Potential Visitor Market Research: Mountain Lake Resort,” ($61,376)
Research Assistant (January, 1997 – June 1997)
Research assistant position for Service Learning Project funded by Virginia Tech. ($3,000). Participating research areas were residents’ attitudes and perceptions of tourism development impact, travel motivation and behavior related to culture and natural oriented park, and visitor satisfaction with the travel information center.
Research Assistant (March, 1993- February, 1994)
Assistant Researcher and Administration Position for Korea Tourism Industry research Institute, Seoul, South Korea. Research areas were Tourism Marketing and Strategy, Tourism Panning and Development, and Hospitality Marketing and Management.
Research Coordinator (March 1993 to February 1994)
Served for Journal of Hotel and Tourism Management annually published by Korea Tourism Industry Research Institute in Korea, South Korea.
WORK AND PRACTICAL EXPERIENCES Translator and Consultant for Outdoor Recreation (August, 2002)
Worked for Outdoor Leisure/Recreation Teacher Group sponsored by Education Department of Seoul Metropolitan, Korea ($3,500 plus an all-expenses-paid trip). Duties were translating and consulting for Mountain Skills and Experimental Activity Programs in Yamnuska Mountain School, Canmore, Canada.
Banquet Staff (October, 2000 – August, 2001)
Worked for Donaldson Brown Hotel and Convention Center, Virginia. USA.

212
Translator and Consultant for Outdoor Recreation (August, 2001) Worked for Outdoor Leisure/Recreation Teacher Group sponsored by Education Department of Seoul Metropolitan, Korea ($4,000 plus an all-expenses-paid trip). Duties were translating and consulting for Mountain Skills and Experimental Activity Programs in Yamnuska Mountain School, Canmore, Canada.
Translator and Consultant for Outdoor Recreation (August, 2000)
Worked for Outdoor Leisure/Recreation Teacher Group sponsored by Education Department of Seoul Metropolitan, Korea ($6,000 plus an all-expenses-paid trip) . Duties were translating and consulting for Horizon Experimental Learning Program in Horizon Consulting Group, Harrisonburg, USA.
Assistant to General Manager (September, 1999 – December, 1999) Overall experiences of managerial position at front desk, and housekeeping at Clare Conner Bed & Breakfast, Virginia, USA.
Translator and Consultant for Outdoor Recreation (August, 1998)
Worked for Outdoor Leisure/Recreation Teacher Group sponsored by Education Department of Seoul Metropolitan, Korea ($3,800 plus an all-expenses-paid trip). Duties were translating and consulting for Horizon Experimental Learning Program at Horizon Consulting Group, Harrisonburg, USA.
Management Trainee (December, 1992 - February 1993)
Overall experiences in Convention and Banquet Operation/Management, Room Division, and Food & Beverage at Sheraton Walkerhill Hotel (Five Star), Seoul, South Korea.
UNIVERSITY AND PUBLIC SERVICES President (December, 2001 – October, 2002)
TTRA, Travel and Tourism Research Association, Virginia Tech Chapter Vice Present (October, 1998 – December, 2001) TTRA, Travel and Tourism Research Association, Virginia Tech Chapter Reader (May, 2001 – August 2002)
Worked for disabled person (partially blind) and conducted research project (Human Resource Management in Hospitality Industry).
PROFESSIONAL MEMBERSHIP TTRA, Travel and Tourism Research Association CHRIE, Council on Hospitality, Restaurant & Institutional Education PCMA, Professional Conventional Management Association

213
CERTIFICATIONS Mountain Skills and Experimental Activities, Yamnuska Mountain School, Canmore, Canada, 2002
Mountain Skills and Experimental Activities, Yamnuska Mountain School, Canmore, Canada, 2001
Horizons Certificate, Horizons Experimental Learning Program, Horizons Consulting Group, 2000
Horizons Certificate, Horizons Experimental Learning Program, Horizons Consulting Group, 1998
Internship of Hotel Operation, Sheraton Walker Hill Hotel and Tower, Seoul, South Korea, 1993