development of a three-tier test to assess ninth …
TRANSCRIPT

DEVELOPMENT OF A THREE-TIER TEST TO ASSESS NINTH GRADE STUDENTS’ MISCONCEPTIONS ABOUT SIMPLE ELECTRIC CIRCUITS
A THESIS SUBMITTED TO THE GRADUATE SCHOOL OF NATURAL AND APLLIED SCIENCES
OF MIDDLE EAST TECHNICAL UNIVERSITY
BY
HAKİ PEŞMAN
IN PARTIAL FULFILLMENT OF THE REQUIREMENTS FOR
THE DEGREE OF MASTER OF SCIENCE IN
SECONDARY SCIENCE AND MATHEMATICS EDUCATION
SEPTEMBER 2005

Approval of the Graduate School of Natural and Applied Sciences ____________________________ Prof. Dr. Canan ÖZGEN Director I certify that this thesis satisfies all the requirements as a thesis for the degree of Mater of Science ____________________________ Prof. Dr. Ömer GEBAN Head of Department This is to certify that we have read this thesis and that in our opinion it is fully adequate, in scope and quality, as a thesis for the degree of Master of Science ____________________________ Assist. Prof. Dr. Ali ERYILMAZ Supervisor Examining Committee Members
Assoc. Prof. Dr. Bilal GÜNEŞ (Gazi Univ., SSME) _______________
Assist. Prof. Dr. Ali ERYILMAZ (METU, SSME) _______________
Assoc. Prof. Dr. Safure BULUT (METU, SSME) _______________
Assist. Prof. Dr. Jale ÇAKIROĞLU (METU, ELE) _______________
Dr. Mehmet SANCAR (METU, SSME) _______________

iii
I hereby declare that all information in this document has been obtained and presented in accordance with academic rules and ethical conduct. I also declare that, as required by these rules and conduct, I have fully cited and referenced all material and results that are not original to this work. Name, Last name : Haki PEŞMAN Signature :

iv
ABSTRACT
DEVELOPMENT OF A THREE-TIER TEST TO ASSESS NINTH GRADE
STUDENTS’ MISCONCEPTIONS ABOUT SIMPLE ELECTRIC CIRCUITS
Peşman, Haki
M.S., Department of Secondary Science and Mathematics Education
Supervisor: Assist. Prof. Dr. Ali ERYILMAZ
September 2005, 171 pages
The main purpose of this study was to develop a three-tier test for
assessing ninth-grade students’ misconceptions about simple electric
circuits. The first tier of an item on the test presents an ordinary multiple
choice question, the second tier presents a set of reasons for the response
given to the first tier, and the third tier questions if examinees are confident
for their responses to the first two tiers. The study was carried in Polatlı,
the biggest outlying district of capital Ankara. In the light of the related
literature, interviews were conducted by the researcher so as to collect
information about students’ understanding of simple electric circuits.
Thereby, a list of misconceptions was acquired and it was used for
developing an open-ended questionnaire. Next, the questionnaire was
examined by two physics teachers and an instructor from METU for
establishing content validity. The questionnaire was administered to 99
ninth-grade students and their responses were categorized in the purpose

v
of determining the distracters of the three-tier test; the Simple Electric
Circuit Diagnostic Test (SECDT). At last, the SECDT was developed and
administered to 124 ninth-grade students. The validity of the SECDT was
established by means of quantitative methods in addition to the qualitative
methods. A positive correlation coefficient was estimated between student
scores and confidence levels, that is, successful students on the SECDT
were more confident for their responses than unsuccessful students. This
result means that the SECDT works properly, for example, students
generally understood the items and found their reasoning among the
distracters. Also, what items measure was investigated by means of factor
analysis, and three reasonable factors were obtained. Furthermore,
proportions of false positives and negatives were estimated and found as
17.47 % and 10.82 %, respectively. As well as, Cronbach alpha reliability
coefficient of student scores was estimated as 0.69, but the reliability
coefficient of student misconception scores was estimated as 0.33.
Consequently, the SECDT scores are valid and reliable measure of
students’ qualitative understanding of simple electric circuits; however,
misconception scores may not be reliable.
Keywords: Physics education, science education, misconceptions, simple
electric circuits, diagnostic test, misconception test, three-tier test

vi
ÖZ
DOKUZUNCU SINIF ÖĞRENCİLERİNİN BASİT ELEKTRİK DEVRELERİ
İLE İLGİLİ KAVRAM YANILGILARINI ÖLÇMEK AMACIYLA ÜÇ
BASAMAKLI BİR TESTİN GELİŞTİRİLMESİ
Peşman, Haki
Yüksek Lisans, Ortaöğretim Fen ve Matematik Alanları Eğitimi Bölümü
Tez Yöneticisi: Yrd. Doç. Dr. Ali ERYILMAZ
Eylül 2005, 171 sayfa
Bu çalışmanın asıl amacı dokuzuncu sınıf öğrencilerinin basit elektrik
devreleri hakkındaki kavram yanılgılarını ölçmek için üç basamaklı bir test
geliştirmekti. Testteki bir sorunun birinci basamağı sıradan bir çoktan
seçmeli soru sunar, ikinci basamak birinci basamağa verilen cevap için bir
grup neden sunar, ve üçüncü basamak öğrencilerin ilk iki basamağa
verdikleri cevaplar için emin olup olmadıklarını sorgular. Çalışma başkent
Ankara’nın en büyük dış ilçesi olan Polatlı’da yapıldı. İlgili literatürün
ışığında, öğrencilerin basit elektrik devrelerini kavrayışları hakkında bilgi
toplamak amacıyla araştırmacı mülakatlar gerçekleştirdi. Böylece, bir
kavram yanılgıları listesi elde edildi ve açık uçlu bir sınav geliştirmek için
kullanıldı. Sonra, sınav iki fizik öğretmeni ve ODTÜ’den bir öğretim üyesi
tarafından kapsam geçerliğini sağlamak için incelendi. Sınav dokuzuncu
sınıf 99 öğrenciye uygulandı ve onların cevapları üç basamaklı test olan
Basit Elektrik Devreleri Tanı Testi’nin (BEDTT) seçeneklerini belirlemek

vii
amacıyla kategorilere ayrıldı. Sonunda, BEDTT geliştirildi ve dokuzuncu
sınıf 124 öğrenciye uygulandı. BEDTT’nin geçerliği nitel yöntemlerin
yanında nicel yöntemlerle sağlandı. Öğrenci puanları ve özgüven seviyeleri
arasında pozitif bir korelasyon hesaplandı. Yani, BEDTT’deki başarılı
öğrenciler verdikleri cevaplar için kendilerine başarısız öğrencilerden daha
çok güvenmişlerdi. Bu sonuç BEDTT’nin doğru düzgün çalıştığı anlamına
gelir. Mesela, öğrenciler genelde soruları anlamış ve gerekçelerini
seçenekler arasında bulmuşlardır. Faktör Analizi aracılığıyla soruların ne
ölçtükleri de araştırıldı ve üç mantıklı faktör elde edildi. Bunlara ek olarak,
yanlış sebepli doğruların ve doğru sebepli yanlışların oranları hesaplandı
ve sırasıyla % 17,47 ve %10,82 olarak bulundu. Bunlara ilaveten, öğrenci
skorlarının güvenirlik katsayısı 0.69 olarak hesaplandı, fakat öğrenci
kavram yanılgıları skorlarının güvenirlik katsayısı 0.33 olarak hesaplandı.
Sonuç olarak, BEDTT skorları öğrencilerin basit elektrik devrelerini nitel
anlamalarının geçerli ve güvenilir bir ölçütüdür, fakat kavram yanılgıları
skorları güvenilir olmayabilir.
Anahtar Kelimeler: Fizik eğitimi, fen eğitimi, kavram yanılgıları, basit
elektrik devreleri, tanı testi, kavram yanılgısı testi, üç-basamaklı test

viii
To My Parents

ix
ACKNOWLEDGMENTS
First of all, I want to thank my supervisor Assist. Prof. Dr. Ali Eryılmaz
because he has always given me helpful guidance on the study and
provided with overcoming all issues.
I next want to thank my wife, Fatma for her patients and support.
I also thank my parents İsmail and Yasemin Peşman, my lovely sister
Zeynep, and my dear brother Onur. They have always been a constant
source of support and inspiration for me. Whenever I meet them, they
always give me the incentive to continue.
Finally, I want to thank my friend Yasin Kutluay for his support. During
the study, we shared all what we know.
x
TABLE OF CONTENTS
PLAGIARISM.......................................................................................................... iii
ABSTRACT .............................................................................................................. iv
ÖZ .............................................................................................................................vi
DEDICATION ........................................................................................................viii
ACKNOWLEDGMENTS....................................................................................... ix
TABLE OF CONTENTS..........................................................................................x
LIST OF TABLES....................................................................................................xiv
LIST OF FIGURES.................................................................................................. xv
LIST OF ABBREVIATIONS..................................................................................xvi
CHAPTERS
1. INTRODUCTION .............................................................................................1
1.1. Research Questions ..................................................................................3
1.1.1. The main problem .........................................................................4
1.1.2. The sub-problems ..........................................................................4
1.2. Definition of Important Terms ................................................................5
1.3. Significance of the Study ..........................................................................6
2. REVIEW THE LITERATURE...........................................................................8
2.1. Methods for Diagnostic Evaluation ........................................................8
2.1.1. Interviews .......................................................................................8
2.1.2. Multiple choice tests.....................................................................10
2.1.3. Two tier tests .................................................................................16
2.1.4. Three tier tests ...............................................................................19
2.2. Misconceptions about Simple Electric Circuits ....................................21
2.3. Force Concept Inventory .........................................................................26
2.3.1. Development of the Force Concept Inventory .........................27

xi
2.3.2. Some Concerns about the Force Concept Inventory ...............29
2.4. Summary ...................................................................................................31
3. METHOD ..........................................................................................................35
3.1. Population and Sample............................................................................35
3.1.1. Sample group for interviews.......................................................35
3.1.2. Sample group for the Open Ended Questionnaire ..................38
3.1.3. Sample group for the SECDT......................................................38
3.2. Variables ....................................................................................................39
3.3. Instruments ...............................................................................................42
3.3.1. Interest and Experience Questionnaire about Electricity........42
3.3.2. Interviews ......................................................................................43
3.3.3. Open Ended Questionnaire.........................................................44
3.3.4. Simple Electric Circuit Diagnostic Test .....................................45
3.4. Procedure...................................................................................................45
3.5. Analysis of Data........................................................................................48
3.6. Assumptions .............................................................................................50
4. RESULTS ...........................................................................................................51
4.1. Analysis of the Interviews.......................................................................51
4.1.1. Sink model .....................................................................................52
4.1.2. Attenuation model........................................................................53
4.1.3. Shared current model...................................................................54
4.1.4. Clashing current model ...............................................................55
4.1.5. Empirical rule model....................................................................55
4.1.6. Short circuit misconception.........................................................56
4.1.7. Power supply as a constant current source...............................57
4.1.8. Parallel circuit misconception.....................................................58
4.1.9. Sequential reasoning ....................................................................59
4.1.10. Local reasoning .............................................................................60

xii
4.1.11. Confusion between current flow and water flow ....................61
4.1.12. Vibrating tungsten filament ........................................................62
4.2. Analysis of the Open Ended Questionnaire .........................................62
4.2.1. Categorization of Responses Given to the Open Ended
Questionnaire ................................................................................62
4.2.2. Analysis of the categories ............................................................66
4.3. Analysis of the SECDT.............................................................................68
4.3.1. Validity AND Reliability of the SECDT ....................................68
4.3.2. Results of the SECDT ...................................................................84
4.4. Summary of the Results...........................................................................88
5. CONCLUSIONS, DISCUSSION AND IMPLICATIONS............................90
5.1. Overview of the Study.............................................................................90
5.2. Conclusions ...............................................................................................91
5.3. Discussion of the Results.........................................................................95
5.4. Internal Validity of the Study .................................................................97
5.5. External Validity of the Study ................................................................99
5.6. Implications of the Study ........................................................................99
5.7. Recommendations for Further Research..............................................101
REFERENCES.........................................................................................................103
APPENDICES
A. INTEREST AND EXPERIENCE QUESTIONNAIRE ABOUT
ELECTRICITY ...........................................................................................109
B. INTERVIEW CARD ..................................................................................111
C. INTERVIEW GUIDE.................................................................................112
D. OPEN ENDED QUESTIONNAIRE........................................................115
E. CATEGORIES BASED ON THE OPEN- ENDED
QUESSTIONNAIRE .................................................................................121
F. SPECIFICATIONS FOR THE OPEN-ENDED QUESTIONNAIRE ....156

xiii
G. SIMPLE ELECTRIC CIRCUIT DIAGNOSTIC TEST............................157
H. ANSWER KEY OF THE SECDT.............................................................164
I. CHOICE SELECTIONS INDICATING A MISCONCEPTION
ACCORDING TO ONLY FIRST TIERS AND ALL THREE TIERS .....165
J. RAW DATA OBTAINED FROM THE SECDT ......................................166

xiv
LIST OF TABLES
TABLES
Table 2.1 Percentages of Biology non-Majors and Majors Selecting each
Response Combination for Item 3 on Diffusion and Osmosis
Diagnostic Test .......................................................................................18
Table 3.1 List of the Interviewees .........................................................................36
Table 3.2 Students Having Taken the Open Ended Questionnaire .................38
Table 3.3 Students Having Taken the SECDT.....................................................38
Table 3.4 Diagrams on the Interview Card from the Related Literature ........43
Table 3.5 Additional Items on the Open Ended Questionnaire .......................44
Table 3.6 SPSS Settings for Factor Analysis ........................................................49
Table 4.1 Summary of Categories for Each Item on the Open Ended
Questionnaire .........................................................................................63
Table 4.2 Correlations between Scores-2 and Confidence Levels ....................69
Table 4.3 SPSS Output Showing KMO and Bartlett’s Test................................71
Table 4.4 SPSS Output Showing Communalities ...............................................72
Table 4.5 SPSS Output Showing the Rotated Component Matrix ...................72
Table 4.6 Interpretations of the Factors Extracted from Table 4.5 ...................74
Table 4.7 Results of Factor Analysis with Successful Students’
Misconceptions-4 ...................................................................................77
Table 4.8 Overall Descriptive Statistics................................................................80
Table 4.9 Discrimination Indexes of each Misconception Based on All
Three Tiers ..............................................................................................81
Table 4.10 Output of the ITEMAN .......................................................................83

xv
LIST OF FIGURES
FIGURES
Figure 2.1 Example of Electric Circuits by Students Holding Electric Sinks.....22
Figure 2.2 Two Identical Bulbs which are in Series ..............................................23
Figure 2.3 Electrical Circuit Used for Assessment of the Sequential Model .....23
Figure 2.4 Circuit Used for Eliciting the Short Circuit Misconception...............24
Figure 2.5 Question Used by Heller and Finley (1992).........................................25
Figure 3.1 Scores-1 according to only the first tiers on the SECDT ....................40
Figure 4.1 Drawings Representing the Students’ Connections...........................52
Figure 4.2 Diagram in the Episode from the Interview with Çağrı ....................53
Figure 4.3 Diagram in the Episode from the Interview with Tarık ....................56
Figure 4.4 Diagram Used for Assessing Short Circuit Misconception...............57
Figure 4.5 Diagrams Used for Assessing Power Supply as a Constant
Current Source .........................................................................................58
Figure 4.6 Drawing Used for Assessing Parallel Circuit Misconception...........58
Figure 4.7 Drawing Used for Assessing Sequential Reasoning ..........................60
Figure 4.8 Diagram Used for Assessing Local Reasoning....................................61
Figure 4.9 Diagram Used for Assessing Current at Junction Divide..................61
Figure 4.10 Scattergram of Scores-2 vs. Confidence Levels .................................70
Figure 4.11 Histogram of Scores-3 and Misconceptions-4 ...................................82
Figure 4.12 Misconceptions in terms of Type of the Test.....................................85
Figure 4.13 Correct Responses in terms of Type of the Test................................87

xvi
LIST OF SYMBOLS
SYMBOLS
FCI : Force Concept Inventory
KR-20 : Kuder-Richardson-20
MBT : Mechanics Baseline Test
MDT : Mechanics Diagnostic Test
SECDT : Simple Electric Circuit Diagnostic Test
1
CHAPTER 1
INTRODUCTION
There is extensive literature on the fact that students come to their
classes with an enormous variety of preconceptions most of which are
acquired from their life experiences (Driver, 1989; Halloun & Hestenes,
1985; Hammer, 1996; Tytler, 2002). Nevertheless, plenty of preconceptions
do not match with scientific conceptions and such preconceptions are
mostly named misconceptions. Halloun and Hestenes (1985), and
McDermott (1991) emphasized that physics instruction cannot help
students understand the scientific conceptions without taking
misconceptions into account because misconceptions mostly can prevent
students from accepting the scientific conceptions. In other words,
misconceptions are very resistive to conventional instruction; therefore,
careful research on assessing misconceptions is necessary for overcoming
them throughout the instruction.
Researchers have managed hard to develop diagnostic tools for
measuring students’ understanding of conceptions for a long time. The
most common used diagnostic tools can be listed as interviews and
multiple choice tests. Each tool is selected for some advantages. Interviews
have the advantage over multiple choice tests in terms of flexibility and
depth of the investigation (Beichner, 1994; Osborne & Gilbert, 1980).
However, interviews can be conducted with a limited number of students

2
for generalization and they consume plenty of time. On the other hand,
multiple-choice tests can be administered to a large number of students for
generalization and easily be analyzed although they cannot investigate the
student responses deeply. So, Beichner (1994) reported that the ideal course
of action is to use both of these diagnostic tools in the multiple choice test
development process for minimizing the disadvantages of each tool. In fact,
before Beichner (1994) emphasized, interviews had already been conducted
in the process of developing a multiple choice test. For example, in the
design of Mechanics Diagnostic Test, which was reported by Halloun and
Hestenes (1985), interviews had been conducted for the validity and
reliability concerns. Another type of diagnostic tool is the two-tier test
which was first developed by Treagust (1988, cited in Tan, Goh, Chia, &
Treagust, 2002). In a two-tier test, the first tier presents a multiple choice
content question and the second tier presents a set of reasons for the given
answer in the first tier. Also in the design of this type of diagnostic tool,
interviews are conducted to form a list of misconceptions, which are used
as distracters in the second tier. On account of the fact that very special
attention was paid to find any study reporting a two-tier test about physics
topics in the related literature, it is needed to emphasize that there are few
two-tier tests concerning physics topics.
Nonetheless, Griffard and Wandersee (2001) claimed some negative
aspects of two-tier tests. They used a two-tier test that had been developed
by Haslam and Treagust (1987, cited in Griffard & Wandersee, 2001) in
their study and criticized it. They claimed that the instrument items
actually diagnose isolated errors in a conceptual framework rather than
robust naïve theories because the test items were based on scientifically
correct propositions from the concept map which had been used in the
design of the test, that is, the participants were not allowed to give their
reasons in the test. The researchers also emphasized that the test results

3
overestimate the percentage of misconceptions because gap in knowledge
(lack of knowledge) cannot be discriminated from misconceptions.
Because of the some mentioned concerns, Eryılmaz and Sürmeli (2002)
developed a three-tier test to assess students’ misconceptions concerning
heat and temperature. As a result of the study, it can be absolutely said that
three-tier tests have the advantage over the two-tier tests in term of
discriminating students’ lack of knowledge from their misconceptions by
means of the third tier items which assess how confident the students are
about their responses for the first and second tiers.
Consequently, the main purpose of this study was to develop a three-
tier test for assessing ninth grade students’ misconceptions about simple
electric circuits. The second purpose was to assess ninth grade students’
misconceptions about simple electric circuits. The third purpose was to
explore which dimensions of simple electric circuits were assessed. The
forth purpose was to compare the proportions of misconceptions according
to only the first tiers, the first two tiers, and all three tiers, respectively. The
last purpose of the study was to compare the proportions of correct
answers for each item (difficulty levels) according to only the first tiers, first
two tiers, and all three tiers, respectively.
1.1 Research Questions
There are several research questions which were investigated in the
purposes of this study. They can be classified as the main problem and sub-
problems.

4
1.1.1 The Main problem of the study
The main problem investigated in this study was if the simple electric
circuit diagnostic test (SECDT) is a valid and reliable test for assessing
ninth grade students’ misconceptions about simple electric circuits.
1.1.2 The sub-problems of the study
The other research questions investigated in the study can be listed as
below:
1. What are the misconceptions which ninth grade students hold about
simple electric circuits?
2. Are there any unknown misconceptions in the student population?
3. What are the proportions of lack of knowledge for each item and in
average?
4. What are the proportions of false positives and false negatives?
5. How does the proportion of the students having a misconception
change when only the first tiers, the first two tiers, and all three tiers are
respectively taken into account?
6. How does the proportion of students giving correct answers change
when only the first tiers, the first two tiers, and all three tiers are
respectively taken into account?
7. Will related items on the SECDT yield any acceptable factors as a result
of factor analysis?
8. Will related misconceptions students hold yield any acceptable factors
as a result of factor analysis?

5
1.2 Definition of Important Terms
Some of the important definitions of the terms in this study can be
presented as below:
Concept: “an abstract or general idea inferred or derived from specific
instances” (Online Dictionary [OD], 2005).
Conception: Several definitions are presented by the OD (2005), and the
following definitions are the most appropriate ones.
1. the creation of something in the mind, and
2. the power or faculty of apprehending of forming an idea in the mind;
the power of recalling a past sensation or perception
Misconception: It is defined as an incorrect conception or a wrong
understanding by the OD (2005). Besides, Hammer (1996) listed some
characteristics of misconceptions as follow:
1. Misconceptions are strongly held,
2. They differ from expert conceptions,
3. They affect in a fundamental sense how students understand natural
phenomena and scientific explanations, and
4. They must be overcome for students to achieve expert understanding.
Diagnostic tests: Diagnostic tests are used for assessing persistent or
recurring learning difficulties, such as misconceptions (Gronlund & Linn,
1990).
False negatives: False negatives can be defined as the incorrect answers that
are given by students who have the correct, scientific conception for
answering the question (Hestenes, Wells & Swackhamer, 1992).
False positives: False positives can be defined as the correct answers that
are given by students who do not have the correct, scientific conception
(Hestenes et al., 1992).

6
1.3 Significance of the Study
There are several reasons for explaining the significance of the study.
First of all, it is very important to assess student conceptions of electric
circuits so that an instructor can help his/her students grasp the scientific
conceptions properly. It is not difficult to encounter some suggestions for
an effective instruction to overcome the student misconceptions. However,
assessing student conceptions by means of a diagnostic tool is inevitable to
succeed in overcoming the misconceptions. That is, valid and reliable
diagnostic tools are necessary to assess student misconceptions properly.
Moreover, using a three-tier test is more convenient than other types of
diagnostic tools based on the great amount of discussion in the literature
about use of each diagnostic tool. In other words, interviews are good at
probing student answers to a given question; however, it is very difficult
and time consuming to conduct interviews with a large number of
students. In order to eliminate this disadvantage, multiple choice tests have
been used for diagnostic purposes. However, multiple choice tests cannot
assess student answers deeply in spite of much superiority (Beichner,
1994). Two-tier tests have been assumed to be a great improvement in
diagnostic assessment because they have the ability not only to administer
to a large number of students but also to probe the student answers.
However, there is some important criticism about this type of diagnostic
tools, too. Eryılmaz and Sürmeli (2002), and Griffard and Wandersee (2001)
criticized two-tier tests with overestimating the fraction of misconceptions
students hold. That is, an incorrect answer for both tiers may be due to
either a misconception or a lack of knowledge. However, three-tier tests
have the ability to distinguish misconceptions from lack of knowledge by
means of third tiers which asking students if they are confident about their
answers for the first two tiers.

7
This study also will contribute to filling a gap in the literature. On
account of the fact that very special attention was paid to find any study
reporting a three-tier test on physics topics in the related literature, there
were very limited number of three-tier tests. In other words, deficiency of
three-tier tests on physics topics makes this type of studies necessary due to
the superiorities of three-tier tests.

8
CHAPTER 2
REVIEW OF THE LITERATURE
In this chapter, findings from the related literature review are presented
in four sections, respectively including methods for diagnostic evaluation,
misconceptions about simple electric circuits, the force concept inventory,
and the summary of the literature review.
2.1 Methods for Diagnostic Evaluation
In this part of the study, some diagnostic evaluation methods such as
interviews, multiple choice tests, two-tier tests and three-tier tests are
presented in four sub-sections.
2.1.1 Interviews
Osborne and Gilbert (1980) reported a technique to explore students’
views of the world. The technique is a kind of interview; the interview-
about-instances. In this kind of interview, the investigator presents some
cards on which familiar situations are depicted for the interviewee. The
cards may or may not include instances of a concept, and the students are
asked to think about if there is an instance of concept on the card, thereby
eliciting the student conceptions. The researchers also presented scope and

9
limitations of the interview-about-instances. Advantages can be listed as:
1. It is applicable over a wide range of age
2. It is enjoyable for interviewer and interviewee
3. It has advantages over written answers in terms of flexibility and depth
of the investigation
4. Classifying instances is more pertinent and penetrating than asking for
a definition
5. It is concerned with the student’s view rather than merely examining if
the students has the correct scientific view.
And some limitations can be listed as:
1. There is the problem of choosing a limited but adequate set of
instances.
2. The order of instances may influence student responses
3. Interviews, and the transcribing and analysis of transcripts, are time
consuming
4. There are the difficulties associated with interviews and the analysis of
the interview data, e.g. difficult to report succinctly.
Fredette and Lochhead (1980) conducted clinical interviews with 24
engineering students enrolled in introductory physics courses to
understand their conceptual difficulties on electric circuits. They
interviewed with each student individually and recorded all the responses
on a video tape. In the interviews, they gave three wires, an unmounted 2-
V bulb and a standard flashlight battery to the interviewee, and then asked
for lighting up the bulb. After completing the interviews, they noticed two
common incorrect wiring plans. Next, the researchers used these two
mistakes as a basis for a written short quiz, which they administered to 57
freshman level engineering students. In the analysis of the results from the
questionnaire, the researchers focused on a prevalent misconception,
electric sink.

10
Fredette and Clement (1981) started their work concentrating on three
clinical interviews they had conducted before. All the students they had
interviewed were experienced in the topic of electricity. The researchers
noticed the short circuit misconception in the interviews. Afterwards, they
followed three steps to probe their investigation. First, they administered a
written questionnaire to 57 freshman engineering students who were in the
first semester and haven’t yet studied electricity course. 14 of 57 students
were holding the misconception. Second, the researchers conducted 12
additional interviews to raise the number of interviews to 15 and obtain
more insight into the dept of the conceptual difficulty. 5 of the 15
interviewees were holding the misconception. Third, the researchers
administered another but similar written test to 10 engineering students
who had completed a course in electricity and magnetism to observe if the
misconception had been overcome after the course. 4 students were
holding the misconception and the researchers concluded that it is difficult
to overcome the misconception for some students even after a course.
2.1.2 Multiple choice tests
Tamir (1990) suggested that when multiple choice tests are used wisely,
they are excellent to identify student conceptions, including
misconceptions despite of great amount of criticism. Some characteristics of
multiple choice tests were presented as follow:
1. Multiple choice tests permit coverage of a wide range of topics in a
relatively short time.
2. They can be used to measure different levels of learning.
3. They are objective in terms of scoring and therefore more reliable.
4. They are easily and quickly scored and lend themselves to machine
scoring.

11
5. They avoid unjustified penalties to students who know their subject
matter but are poor writers.
6. They are suitable for item analysis by which various attributes can be
determined such as which items on a test are too easy, which were too
hard, which are ambiguous, etc. (Hedges, 1966; Wesman, 1971, as cited
in Tamir, 1990).
Cohen, Eylon and Ganiel (1983) conducted numerous interviews with
students at various levels and they found several misconceptions to be very
frequent. Because of the nature of interviews, the scope and the number of
the students who can be investigated are restricted. So, the researchers
decided to design and administer a written questionnaire to be able to
collect more information about the misconceptions from a large number of
students. The questions were qualitative rather than quantitative, because
the researchers declared that students have difficulties in qualitative
questions in spite of their mostly correct responses to quantitative
questions. They administered the questionnaire to 145 students and 21
teachers. The students were from 6 twelfth grade classes (96 students) and
they had learned electricity and magnetism. There were also two additional
classes (49 students), one of which was eleventh grade and the other was
gifted ninth graders. These two classes were experienced in DC circuits, but
not in electrostatics. Ten multiple choice questions and four open ended
questions were included in the questionnaire. The distracters were
designed to present students correct or incorrect conceptions and a
conception was presented with more than one question. The open-ended
questions were mostly quantitative (numerical) to observe the solution
ways the students use. Also, follow-up interviews were conducted with 14
students who had taken the questionnaire to be able to understand what
the reason of their answers on the questionnaire was.

12
Dupin and Johsua (1987) identified French pupils’ conceptions about
direct-current electricity using a group of 920 students. To be able to assess
the effect of teaching they followed the evolution of the conceptions from
the beginning of secondary school up to the forth year of university. The
researchers used a pencil-and-paper questionnaire including 44 items. Of
course, not all of the items are used for a level of students, but they paid
attention to use at least all of the items, which had been used at a level, at a
higher level. In all items, the internal resistances of batteries were ignored
to regard as constant voltage generators. The researchers used two kinds of
questions in the questionnaires, exercises of declarative or operational
nature. Exercises of declarative nature asked students to give their opinion
about electrical events. Exercises of operational nature needed the students
to analyze the behavior of physical magnitudes in electrical circuits in
diagram forms. They formed graphics figuring out the relationship
between the percentages of correct answers and different school levels, thus
the researchers could observe the effect of teaching on the conceptions of
students. As a result the researchers confirmed the misconceptions
identified by other authors and concluded that some of the misconceptions
can be overcome by teaching, however, some are resistant to change.
Shipstone et al. (1988) carried out a research study to investigate the
conceptual understandings of students from England, France, the
Netherlands, Sweden and West Germany. They assumed to find out some
significant differences in students’ understandings, because of different
teaching approaches in those countries. If it was the case, obviously the
most advantageous approach could also be identified. Ages of the students
from all five countries were in the range of 15-17. Attention was paid to the
selection of each sample to represent each country by each author. They
used a test including 13 multiple choice and true false questions. These
questions were selected from the questions used by the authors in the

13
previous studies. Each item in the test was assessing only one or at most
two aspects of electricity. After analyzing the results of the test, they
concluded that differences among countries were rather small in spite of
different teaching approaches.
McDermott and Shaffer (1992) examined student difficulties in diverse
topics of physics, one of which simple electric circuits. They started their
investigation by conducting individual demonstration interviews, which
serve a simple demonstration as a basis for a dialog between an
investigator and a student. Real equipments are usually used in these
interviews but sometimes computer simulations can also be used. The
researchers recorded the interviews on an audiotape. Analyzing the records
they characterized students’ conceptual understandings. As a result of the
findings from the interviews, they formulated written questions and they
administered to large numbers of students before, during and after
instruction. By the help of the descriptive analysis, they deepened their
understandings of students’ difficulties and also extended the scope of the
investigation. As a brief summary, they shifted their questioning mode
from interviews toward written tests as their understanding of student
difficulties grew.
Beichner (1994) suggested a model for developing and analyzing a
diagnostic test in uncovering student difficulties. He initially mentions
about interviews and multiple choice tests. Interviews are very useful in
probing the answers of students to the researcher’s questions. However,
they need too much time for conducting to large numbers of students and
analyzing. At that point, multiple choice tests are very useful, because they
can be easily administered to large numbers of students and analyzed, thus
we can generalize our results. Beichner (1994) suggested the combination of
interviews and multiple choice tests.

14
It is beneficial to focus on the process of test development suggested by
Beichner (1994) as briefly as possible.
1. Formulate a list of specific objectives after recognizing the need for the
test.
2. Carry out a pilot study for the last version of the list of specific
objectives. (Objectives which nearly all students succeed in must be
removed, because the aim of the test is to uncover students’ difficulties,
not their achievement.)
3. Ask open-ended questions of a group of students to determine the most
frequently appearing mistakes.
4. Write three items for each objective to produce the test by using the
mistakes found in the open-ended questions as distracters. (Items may
be selected from some outside sources, such as textbooks, question
banks, etc.)
5. To modify several of the questions, administer the test to 100-150
students.
6. To establish the content validity, distribute the revised test to some
educators and professors. Then, ask them to complete the tests,
comment on the appropriateness of the objectives, criticize the items,
and match items to objectives.
7. Administer the test to a sample whose size is enough.
8. Conduct an instructional activity to the sample of students.
9. Again administer the test to the sample after a little modification.
10. Calculate the Pearson product-moment correlation to examine if the
two test versions are similar (parallel forms). Steps 7, 8, 9, 10 indicate
equivalent-forms method.
11. Calculate a paired sample t-test to look for if the difference between
mean scores of pre- and post-test is significant. A significantly increase
in the mean scores is the evidence of validity.

15
Beichner (1994) administered the test to 524 students after constructing
his valid and reliable test to uncover student difficulties. Analysis from this
data revealed that the test is certainly useful for diagnostic purposes and
should be helpful as a research tool.
Engelhardt and Beichner (2004) developed the Determining and
Interpreting Resistive Electric Circuit Concepts Test (DIRECT) to assess
students’ understandings of a variety of direct current (DC). Their process
of test development started with constructing a set of instructional
objectives by a deep examination of the high school and university
textbooks and laboratory manuals plus informative discussions with
instructors using these sources. They presented the objectives to a panel of
independent experts to ensure that no significant objectives had been
ignored. In order to be able to detect the distracters for the multiple choice
format of the test, they first developed an open ended format. The
researchers tried to construct several items for an objective using different
modes of representation. Then, they developed DIRECT 1.0 and
administered to 1135 students from high schools and universities. They
used a very large sample to reduce the sampling errors. They presented a
table showing the descriptive statistics and a figure showing the
distribution of the scores. The distribution of the scores was positively
skewed indicating a difficult test. Next, they conducted follow-up inter-
views to improve their first version of the test and to increase the reliability.
Afterwards, they developed DIRECT 1.1. The final version was
administered to 692 from high schools and universities in Canada,
Germany, and the United States. The final version contained 29 items with
five choices. They again presented the descriptive statistics and the
distribution of the scores. The distribution of scores was again positively
skewed. In the descriptive analysis they estimated the overall mean,
university mean, high school mean, overall range, university range, high

16
school range, Kuder Richardson 20 (KR-20), average point-biserial
correlation (reliability of a single item, and the average is desired to be
equal or more than 0.20), average discrimination index and average
difficulty index. The KR-20 values (0.71 and 0.70) for both versions were
little above 0.70, which is the acceptable value. To cause this low reliability
value, they claim the low discrimination index (0.26 and 0.23) and high
difficulty level (0.49 and 0.41). They also claimed that the low
discrimination index may be an indication of that the test indeed uncovers
students’ misconception. They had established the content validity of the
test in the early versions of the test. They established the construct validity
by using factor analysis and follow up interviews. However, they only
inform us with the number of factors for two versions. For version 1.0 they
found 9 factors and for version 1.1 they found 11 factors. But, no
information is given about the interpretation of the factor analysis results.
They used the interviews to eliminate the question ambiguities and to
understand if students understand what had been intended in the
questions. A series of t-tests and ANOVA were used to determine if there
were significance differences between various groups of students who had
taken DIRECT 1.0 and 1.1. They found a significant difference between
high school and university students for both versions, that is, university
students outperformed high school students. They also found a significant
difference between males and females. Males outperformed females and
more misconceptions were held by females.
2.1.3 Two tier tests
Chung, Lin and Lin (2002) developed a two-tier diagnostic test to elicit
high school students’ misconceptions about the formation of images by
plane mirrors as a part of large scale survey study in all subject content

17
areas of science in Taiwan. The researchers followed a methodology
described by Treagust (1988, as cited in Chung, Lin, & Lin, 2002). First, they
constructed a concept map by means of analysis of the physics curriculum
to prepare a list of propositional knowledge statements, which are the
statements used for linking the key words in a concept map. The
propositional knowledge statements are needed for conceptual
understanding of the mechanism of formation of images by plane mirrors.
The propositional statements were examined by physics professors to
establish the content validity. When the validation was established, some of
the propositional statements were eliminated or changed. Based on the
propositional statements the researchers developed an open ended
questionnaire to be able to identify misconceptions which would be used as
distracters in the intended multiple choice instrument. After administering
the questionnaire, they also conducted follow-up interviews whose results
would be used as reference for the findings of the questionnaire.
Afterwards, they developed the two tier test. The first tier is a multiple
choice question related to the propositional statements and the concept
map. The second tier presents a scientific reason and some misconceptions
derived from the open ended questionnaire and the interviews. The
researchers estimated discrimination index, difficulty level and the
Cronbach’s alpha (for reliability). Estimated values were in the acceptable
ranges. Finally, they presented a table showing percentages of student
responses for only first tier and for the combination of first and second
tiers. They regarded responses whose percentage was more than 10% as
possible misconceptions.
Other studies about two-tier diagnostic assessments use the same
procedure suggested by Treagust (1988) to develop the test (Odom &
Barrow, 1995; Tan, Goh, Chia & Treagust, 2002; Tsai & Chou, 2002). In
addition, it is reported that the first content tier has two or three choices

18
and the second reason tier has four or five choices. Odom and Barrow
(1995) presented a table showing scoring on a two-tier test they developed
for measuring college biology students’ understanding of diffusion and
osmosis (Table 2.1). The researchers administered the test to 123 students
enrolled in a non-major freshman biology course and 117 students enrolled
in a major freshman biology course. In the table, 61.8% of the non-majors
chose the correct content (first tier), but only 21.1% chose the combination
of the correct content and reason. In other words, 61.8% of the non-majors
seem to understand the content according to only the first tier, whereas
both the first and second tiers do not indicate the same proportion. Only
21.1% of the students seem to understand the topic according to the first
two tiers.
Table 2.1 Percentage of Biology Non-majors and Majors Selecting Each
Response Combination for Item 3 on Diffusion and Osmosis Diagnostic
Test
Reason
Choice on the
first tier a b c d Total
A 8.9 18.7 4.9 5.7 38.2 Non-majors
B 8.9 4.1 27.6 21.1* 61.8
A 5.1 12.8 5.1 2.6 25.6 Majors
B 1.7 3.4 29.1 40.2* 74.4
* The correct answer according to answers for the first and second tiers
Sencar and Eryılmaz (2004) used the literature findings to form some
questions of the diagnostic test and some questions were directly translated
into Turkish. The questions were two-tiered questions. The first tier was a
classic multiple choice question with a correct answer and some distracters.

19
The second tier provides some reasons for the given answer for the first
tier. The reasons were consisted of a correct reason and some
misconceptions formed by the help of the literature review. In addition, the
questions were two kinds within the test, theoretical and empirical
questions. The theoretical questions were those which had been introduced
during the course, and the empirical questions were based on the
experience with the electrical devices. The sample was consisted of 1678
ninth grade students (914 females, 764 males) from 13 high schools in
Ankara, Turkey. When evaluating a student, one point was assigned to
each misconception held by the student. That is, a student with a high score
had more misconceptions than a student with a low score. After analyzing
the results, they found that most of the students had many misconceptions.
In addition, it was observed that females had more misconceptions than
males. However, it was also observed that theoretical questions were
answered more correctly than the empirical questions. There was no
difference between females and males for the theoretical questions,
whereas females had more difficulty in answering the empirical questions
than males.
2.1.4 Three tier tests
Eryılmaz and Sürmeli (2002) developed a three-tier test to assess
students’ misconceptions on heat and temperature. They started their study
by probing the definition of misconception. In the study, it was emphasized
that misconceptions are conceptions that are acquired from the experiences
and conflict with the scientific facts. Also, misconceptions have a
connotation of error, but not all errors are misconceptions. Some errors
may be due to lack of knowledge, and it is a fact from the definition of
misconception that misconceptions are due to some conceptions from

20
experiences, not due to some lack of knowledge. However, in the objective
tests all wrong answers are treated as misconceptions. This situation
questions the validity of objective tests. In the three tier tests, the first tier is
a classic multiple choice question. The second tier presents some reasons
for the first tier. And, the last tier asks the student whether he/she is sure or
not for the given answers. If the student answers the first tier incorrectly,
next gives the related reason for the answer, and finally the student is sure
about the answers for the first two tiers, then we can expect the student to
have a misconception. Eryılmaz and Sürmeli (2002) determined a 19-item
test on heat and temperature, and then they form the three-tier test. They
administered the test to 77 ninth grade students from local and private high
schools in Balgat, Ankara, Turkey. At the end, they compared the
percentages of students having a misconception, respectively according to
only the first tiers of items on the test, the first two tiers of items on the test
and all three tiers of items on the test. They found that 46% of the students
had in average at least one misconception according to the first tiers, 27% of
students had at least one misconception according to the first two tiers, and
18% of the students had at least one misconception according to all three
tiers. From these results, the researchers concluded that assessing
misconceptions with a one-tier test overestimates the percentages of
students having a misconception, and treats all wrong answers as a
misconception. In fact, although some of those incorrect answers may be
due to a misconception, some of them may not be due to a misconception.
In other words, as previously mentioned, some of incorrect answers may be
false negatives which are incorrect answers in spite of correct reasons, and
some may be due to randomly given answers. Additionally, some other
may be due to lack of knowledge. In the light of this explanation, 19% of
the students, which is found by subtracting 27% from 46%, gave incorrect
answers by mistake or chance because related reasons of the incorrect

21
answers were not chosen on the second tiers of the test. In the same
manner, 9% of the students were not confident about the answers for the
fist two tiers on the test although their answers for the first tiers were
consistent. Those students gave incorrect answers due to some lack of
knowledge rather than some misconceptions. Thus, the researchers
concluded that three-tier tests assess misconceptions more validly than
one-tier or two-tier tests.
2.2 Misconceptions about Simple Electric Circuits
Lots of research studies have been conducted so far in order to
investigate the student understanding of electric circuits. These studies
have revealed that students mostly cannot distinguish among related
concepts such as current, energy, voltage, etc. Assuming battery as a
constant current source is an example of confusion between electrical
current and voltage. Another example is the consumption of current by
electrical devices within a circuit because of the confusion between
electrical current and energy (Bauman, & Adams, 1990; McDermott, &
Shaffer, 1992; Shipstone, 1988). These two misconceptions are the most
common and resistant misconceptions among students according to the
related literature. Of course, there are other misconceptions in the
literature, and therefore, all the misconceptions are presented separately so
that they can be easily understood.
Sink model: Only a single wire connection between the power supply and
the electrical device is assumed to let the electric current flow from the
power supply to the electrical device, thus running it. Students who have
this misconception may confuse the electric flow with the other flow
models such as heat flow, water flow or grounded electric flow. (Fredette &
Loachhead, 1980). Figure 2.1 demonstrates two of various electric circuits

22
which are assumed by students holding this misconception so that the bulb
lights up.
Figure 2.1 Examples of Electric Circuits by Students Holding Electric Sinks.
Attenuation model: In this model, the electric current, which travels round
an electrical circuit in one direction, is assumed to decrease gradually
because of the consumption of it by the resistors within the circuit. When
students are asked to rank two identical bulbs, which are in series as in
Figure 2.2, with respect to their brightness, they regard bulb A as brighter
because they think that bulb A which encounters the electric current first
uses up some of the current and less current passes through bulb B
(McDermott & Shaffer, 1992; Shipstone, 1988).
Shared current model: This model is very similar to the attenuation model
in that the leaving current is more than the returning current. But, the
difference is that in this model the electrical current is assumed to be
shared equally by electrical devices; therefore bulbs A and B in Figure 2.2
are assumed to be equal in brightness (Shipstone, 1988).

23
Figure 2.2 Two Identical Bulbs which are in Series
Sequential model: When pupils are asked to predict what happens to the
brightness of the bulb in Figure 2.3 if either R1 or R2 is changed, many
anticipate that change in R1 affects the brightness and change in R2 does not
affect the brightness of the bulb. That is, students assume a change at a
point in the circuit to affect forward in the direction of the electric current,
not backward (Dupin & Johsua, 1987; McDermott & Shaffer, 1992;
Shipstone 1988; Shipstone et al., 1988).
Figure 2.3 Electrical Circuit Used for Assessment of the Sequence Model
Clashing current model: Students who have this model assumes that
positive electricity and negative electricity from the power supply meet at
an electrical device and clash there, thus running the electrical device.
(Chambers & Andre, 1997)

24
Empirical rule model: Students who have this conception believe that the
further away the bulb is from the battery, the dimmer the bulb (Heller &
Finley, 1992).
Short circuit misconception: Wires without any electrical devices are
ignored by the students who have this misconception as they analyze the
circuit. (Chambers, &Andre, 1997; Fredette, & Clement, 1981). Figure 2.4 is
obtained from the study of Fredette and Clement (1981) in the purpose of
exemplifying short circuit misconception. Students who have this
misconception ignore the wire path causing a short circuit and try to
analyze the electrical events through the battery, the resistor and the
capacitor as in the figure.
Figure 2.4 Circuit Used for Eliciting the Short Circuit Misconception
Power supply as a constant current source model: This misconception
belongs to the students regarding a battery as a constant electrical current
source rather than electrical energy source, whatever the circuit it is flowed
in (Cohen et al., 1983; Dupin & Johsua, 1987; McDermott & Shaffer, 1992;
Shipstone, 1988; Shipstone et al., 1988).

25
Parallel circuit misconception model: Students regard a resistor as an
obstacle to current flow and they claim that the total resistance of a circuit
increases as the number of resistors which are in parallel increases
(Chambers, & Andre, 1997; Cohen et al., 1983; McDermott, & Shaffer, 1992).
Local reasoning: If a modification is done in a part of an electrical circuit,
students who have this misconception try to analyze this local part and
they ignore global changes. However, it is required to analyze both the
local and the global changes. For example, a resistor is connected in parallel
to a given resistor, then the current is divided between the resistors, but the
sum of these currents is not equal to the previous magnitude of the current
at the original circuit before the modification (Cohen et al., 1983; Shipstone
et al., 1988).
Models of junctions in parallel circuits: Heller and Finley (1992) reported 8
different responses for the question shown in Figure 2.5.
Figure 2.5 Question used by Heller and Finley (1992)
The following list shows different types of the given answers. The given
answers were categorized according to if the junction was recognized or
not. The first four answers are the answers in which the junction divide
was not recognized and the rest of the answers are the answers in which
the junction divide was recognized.

26
1. The current is the same at all points (I1 = I2 = I3) because the current has
not yet reached the bulbs.
2. The current is the largest at point 2 because of being the closest to the
negative pole. The current at point 3 is greater than at point 1 due to the
distance to the negative pole (I2 > I3 > I1).
3. The currents at points 1 and 2 are equal because they have not yet
reached any bulb. The current at point 3 is the least because the current
has been used in passing through the bulbs A and B (I1 = I2 > I3).
4. The currents at points 1 and 2 are equal because they have not yet
reached the bulb A. The current at point 3 is least because the current
flows around the circuit with the bulb A before it flows through the
circuit with the bulb B (I1 = I2 > I3).
5. The currents at points 1 and 3 are about equal. Slightly less current
flows down the path to point 2 (I1 = I3 > I2).
6. The current at point 1 is the largest because it has not yet split. The
current at point 2 is larger than the current at point 3 because more
current flows through the closer path (I1 = I2 + I3; I2 > I3).
7. The currents at points 2 and 3 are half of the current at point 1 because
it divides evenly when the split occurs (I1 = I2 + I3; I2 = I3).
8. The current at point 1 is the sum of the currents at points 2 and 3. The
current at points at points 2 and 3 are the same because more current
flows through the path with less resistance. Since the paths have the
same resistance, the currents through each path are the same (I1 = I2 + I3;
I2 = I3).
2.3 Force Concept Inventory
During the literature review, two findings attract attention. First, there
are few two-tier or three-tier tests on physics. Second, there are so many

27
research studies focusing on the FCI. Both make inevitable to review the
research studies on the FCI. The FCI is presented by two sections. The first
section is about its development and popularity. The following section
presents some serious concerns about the FCI.
2.3.1 Development of the Force Concept Inventory
Because the FCI is an improved version of the Mechanics Diagnostic
Test (Halloun & Hestenes, 1985), it is first needed to study the MDT.
Halloun and Hestenes developed the MDT to ascertain students’
qualitative conceptions of mechanics. The researchers articulated the
design, validity and reliability of the test clearly. They started developing
the test by selecting questions in order to be able to assess students’
qualitative conceptions and identify common misconceptions obtained
from the literature. Afterwards, various open ended versions, which
request written answers, were administered to more than 1000 college
students enrolling in introductory physics courses for more than three
years. As a consequence, the most common misconceptions were identified
and used as distracters in the final multiple choice version of the test.
Halloun and Hestenes established the face and content validity of the test
in four different ways. First, the researchers had a number of physics
professors and graduate students examine the early versions of the test and
they incorporated the suggestions into the final version. Second, 11
graduate students took the test and a complete agreement was reached on
the correct answers to each question in the test. Third, the researchers
conducted interviews with 22 introductory physics students who had taken
the test before and they observed that all the questions and alternative
answers were understood clearly by the students. Forth, the answers of 31
students who received A grade in University Physics were carefully

28
examined in order to detect any probable common misunderstanding due
to the formulation of the questions in the test and they found no one. For
establishing the reliability of the test, Halloun and Hestenes (1985) not only
used quantitative data from the test results but also they used qualitative
data based on the interviews with a sample of students who had taken the
test. In the end of the interviews, they observed that the answers of the
students were identical with the answers the students had given in the test.
Furthermore, the researchers used the data from two comparable groups
tested at different times to estimate the Kuder-Richardson reliability
coefficients for pretest and posttest uses. The coefficients were 0.86 for
pretest use and 0.89 for posttest use. Accordingly, these unusual and high
values mean that the MDT is highly reliable.
In 1992, Hestenes, Wells, and Swachhamer designed the FCI which is an
improved version of the MDT and claimed that the inventory supplies a
more systematic and complete profile of the misconceptions. The
researchers divided the Newtonian force concept into six conceptual
dimensions and grouped the misconceptions in six major categories. Each
question in the inventory presents a Newtonian concept and the
misconceptions as distracters. Hestenes et al. (1992) administered the FCI to
1500 high school students and more than 500 university students with an
accompanying test, the Mechanics Baseline Test based on problem solving
skills and analyzed the test results. They also conducted some interviews
for establishing the validity and reliability. Nevertheless, Hestenes et al.
(1992) articulated that they did not expend as much effort as on the MDT
for establishing validity and reliability because half of the questions in the
FCI are the same questions in the MDT whose results replicated many
times by other researchers. Thus, they alleged that it was unnecessary to do
the same formal analysis again.

29
The results of the Mechanics Baseline Test used with the FCI were
reported by Hestenes and Wells (1992). The FCI was designed to be used as
pretest and posttest for assessing students’ qualitative understanding of
Newtonian concepts before and after the instruction. The Baseline test was
also designed in order to assess students’ qualitative understanding of
mechanics, but it requires problem solving acquired in instruction, that is, it
can be used after the instruction as a posttest. The researchers claimed that
the use of both tests can yield a complete assessment of students’
understanding of mechanics. However, the most important inference was
that the researchers indicated two thresholds for the FCI using an
Inventory posttest vs. Baseline posttest scattergram. Hestenes and Wells
indicated 60 % in the FCI for conceptual threshold because students below
this score are most likely to get below 60 % in the Baseline test. 80 % in the
FCI was indicated as threshold for mastery of basic Newtonian concepts,
because only the students above 80 % in the FCI can score above 80 % in
the Baseline test.
2.3.2 Some concerns about the Force Concept Inventory
Huffman and Heller (1995) reported some concerns about the FCI. The
researchers conducted a factor analysis using the FCI data, they obtained
by administering the test to 145 high school and 750 university students, in
order to answer what the FCI actually measures. Huffman and Heller
(1995) reminded that the force concept was divided into six conceptual
dimensions. For this reason, a factor analyzed FCI data would yield either
only one central factor or six different factors including all the items in the
FCI. Nevertheless, they found a wide variety of ambiguous factors and
only few acceptable factors. Therefore, Huffman and Heller claimed that
the items in the FCI are loosely related to each other and they do not

30
measure either a single force concept or six dimensions of the force concept.
This report was followed by some other papers on the concerns.
Hestenes and Halloun (1995) said that what the FCI measures is a
question about content validity. In other words, the probability of false
positives and false negatives must be estimated. A false negative is defined
as the incorrect answer of a Newtonian thinker and a false positive is
defined as the correct answer of a non-Newtonian thinker. Hestenes and
Halloun (1995) stated that the probability of false negatives was less than
ten percent according to the interviews they had conducted. However, they
pointed that the minimization of false positives is more difficult. Because,
the students have a chance of guessing the correct answer in a multiple
choice test, and elimination of this threat is obviously impossible. In spite of
the existence of such a difficulty, the researchers claimed that the
probability of false positives had been minimized because of the use of
more than one question assessing each dimension of the force concept and
the use of powerful distracters culled from student interviews. The
researchers showed the false positives to be the reason for the results of the
factor analysis. They suggested that if Huffman and Heller (1995) had used
the students’ data between 60 and 80 % scores and separately the data of
students above 80 %, they would have reached more acceptable results.
Heller and Huffman (1995) repeated their claim about the validity of the
FCI by giving an example of hypothetical statistical analysis.
Hestenes and Halloun (1995) also emphasized that students’
conceptions are not coherent, that is, it is not a suitable way to use factor
analysis for the FCI data. They also said that Huffman and Heller had
ignored that non-Newtonian answers (wrong answers) must be studied to
reach some results about students’ conceptions, not the Newtonian answers
(correct answers), that is, Huffman and Heller had factor analyzed the
correlations between the Newtonian answers. In their response, Hufman
31
and Heller (1995) stated that there are two possible explanations for such a
loosely related test items. First, students do not have coherent conceptions.
Second, students have coherent conceptions, but the test can not measure
them.
Another focus on the discussions is the use of the FCI. Hestenes, et al.
(1992) suggested that the FCI can be used for three different purposes.
1. As a diagnostic tool (It can be used for identifying and classifying the
misconceptions)
2. For evaluating instruction
3. As a placement exam (it can not be used to place beginning students,
but it can be used in colleges and universities for determining if a
student can be placed in a more advanced course after taking the
introductory physics course.)
However, Huffman and Heller (1995) claimed that it may be unfair to
use the FCI as a placement test, because it is not obvious what the FCI
actually measures. They also advised considerable caution when the
FCI is used as a diagnostic tool or for evaluating instruction.
2.4 Summary
The literature review can be summarized in three categories such as
diagnostic tools, misconceptions about electric circuits and the force
concept inventory.
In the literature, one of the first diagnostic tools is interviews.
Interviews can be used to investigate student conceptions deeply.
However, they cannot be administered to large number of students for
generalization, cannot be analyzed easily, and are too much time
consuming. So, multiple choice items have been most commonly used so
far. Because, multiple choice tests can be easily administered to large

32
number of students, are objective due to the scoring, and can be easily
analyzed. But, they cannot investigate the student answers deeply.
Therefore, two tier tests have been used for diagnostic assessment in the
literature for a long time. Two-tier test items include a first tier which is an
ordinary multiple choice item, and a second tier which presents reasons (a
set of misconceptions and the correct reason) for the answers on the first
tier. That is, it can be said that two-tier tests are superior to multiple choice
tests in probing the student answers. Nevertheless, two-tier tests have been
criticized due to inability to discriminate lack of knowledge from possible
misconceptions. And consequently, three-tier tests were introduced for
diagnostic purposes. Three-tier tests are superior to the two-tier tests in that
they have a third tier which is especially used for discriminating lack of
knowledge from misconceptions. Because, on the third tier, students are
asked if they are sure about the answers they give for the first two tiers. If a
student is sure for a wrong answer and the related reason he/she gives for
the first two tiers, then the student can be said to have a misconception.
Otherwise, the wrong answer, which is due to a lack of knowledge, cannot
be named a misconception.
Another topic which was reviewed in the literature is misconceptions
about simple electric circuits. The misconceptions can be listed as:
1. Sink Model: Students think that only one connection between the
electrical device and the power supply is enough for running the
device.
2. Attenuation Model: Students think that the current leaving one
terminal of the power supply is more than the current returning to the
other terminal, and the lamp receiving the current last is least in
brightness in a circuit with a series combination of identical lamps.
3. Shared Current Model: This model is identical with attenuation model
except that all the lamps in a circuit with a series combination use the

33
same amount of current, that is, they have the same brightness.
4. Sequential Reasoning: Messages about changes taking place in a circuit
are carried forward in the direction of the current but not backwards.
5. Clashing Current Model: Students holding this misconception believe
that charges from + and – terminals meet within the electrical device
and clash, thus the device runs.
6. Empirical Rule Model: The further away the bulb from the battery, the
dimmer the bulb.
7. Short Circuit Preconception: Students holding this model ignore the
wires without electrical devices and think that the wires have no effect
on the circuit.
8. Power Supply as Constant Current Source Model: Power supply is
assumed to supply the same amount of electrical current whatever the
type of circuit is.
9. Parallel Circuit Misconception Model: Adding a new resistor in a new
parallel path is believed to increase the amount of total resistance.
10. Local Reasoning: Students holding this model focus their attention
entirely upon what is happening at one point in a circuit ignoring
whatever may be happening elsewhere.
Also, Heller and Finley (1992) reported 8 different answers for
comparing electrical currents at a junction divide of a parallel circuit.
Finally, the FCI was reviewed in the literature. It was designed to assess
introductory physics students’ force conceptions by Hestenes et al. (1992.).
It is the most popular diagnostic tool on physics, was claimed to be highly
valid and reliable, and have been used many times by different researchers.
However, Huffman and Heller (1995) reported some concerns as a result of
factor analysis they conducted. They claimed that the factor analysis must
have formed one or six factors because the writers of the FCI had claimed
that the test assesses six different conceptual dimensions of the force

34
concept. Nevertheless, the factor analysis results presented a wide variety
of ambiguous factors and only few acceptable factors. That is to say,
Huffman and Heller (1995) claimed that the FCI does not measure the force
conceptions properly. Hestenes and Halloun (1995) reported their
responses to the claims. They interpreted the results in terms of the false
negatives and positives (see Section 1.2). Because, the researchers claimed
that the probabilities of false positives and false negatives are the reason for
such a result of factor analysis. They also claimed that such a result of
factor analysis is because of student conceptions which are not coherent.
They suggested the factor analysis to repeat using separately the scores of
the students whose scores are between 60 and 80%, and the scores of the
students whose scores are above 80%, thereby, getting more acceptable
results.

35
CHAPTER 3
METHOD
In this chapter, sampling, variables, instruments, procedures and
analyses of data are presented in a logical sequence.
3.1 Population and Sample
All ninth grade students in Turkey were the target population in this
study. However, it is a fact that data collection from that population is
extremely difficult. In that case, all ninth grade students in Polatlı, the
biggest outlying district of capital Ankara, were identified as accessible
population for generalization.
In this study, three sample groups were drawn from the accessible
population for conducting interviews, administering the open ended
questionnaire, and the Simple Electric Circuit Diagnostic Test (SECDT).
3.1.1 Sample Group for the Interviews
A purposive sample was drawn from general high school, foreign
language based high school and Anatolian high school because they
include most of the students at secondary school level in Turkey.
Interviewees were extracted from each school by means of administering

36
the Interest and Experience Questionnaire about Electricity (IEQ) to some
intact classes at each school with a total number of 184 students. Analyzing
the results from the questionnaire, the interviewees were selected
according to the school type, gender, knowledge level and IEQ scores.
Table 3.1 shows the list of the interviewees from each school type. Each
student at each category was interviewed at suitable locations (lit, silent,
heated, etc.). Interviewees were between 14 and 16 years old. Before the
interviewees in the table were interviewed, two students from Atatürk
Foreign Language Based High School were interviewed for practicing.
Table 3.1 List of the Interviewees
Atatürk High School
Gender Knowledge
Level Experience Grade
Name of the
Interviewee
Yes 10th Ferhat High
No 9th Fırat
Yes 10th Soner Male
Low No 9th Okan
Yes 10th Seher High
No 9th Yasemin
Yes - - Female
Low No 10th Mehtap

37
Table 3.1 (continued)
Atatürk and Polatlı Foreign Language Based High Schools
Gender Knowledge
Level Experience Grade
Name of the
Interviewee
Yes Preparatory Fikri High
No Preparatory Meriç
Yes 10th Kemal Male
Low No Preparatory Özdemir
Yes 10th İrem High
No 10th Serap
Yes - -
Female
Low
No 10th Tuğba
Polatlı Anatolian High School
Gender Knowledge
Level
Experience Grade Name of the
Interviewee
Yes 10th Mehmet High
No 10th Sefa
Yes 9th Efe Can
Male
Low
No 10th İsmet Çağrı
Yes 9th Merve High
No 9th Gökçe
Yes 9th Cangül Kübra
Female
Low
No 10th Merve
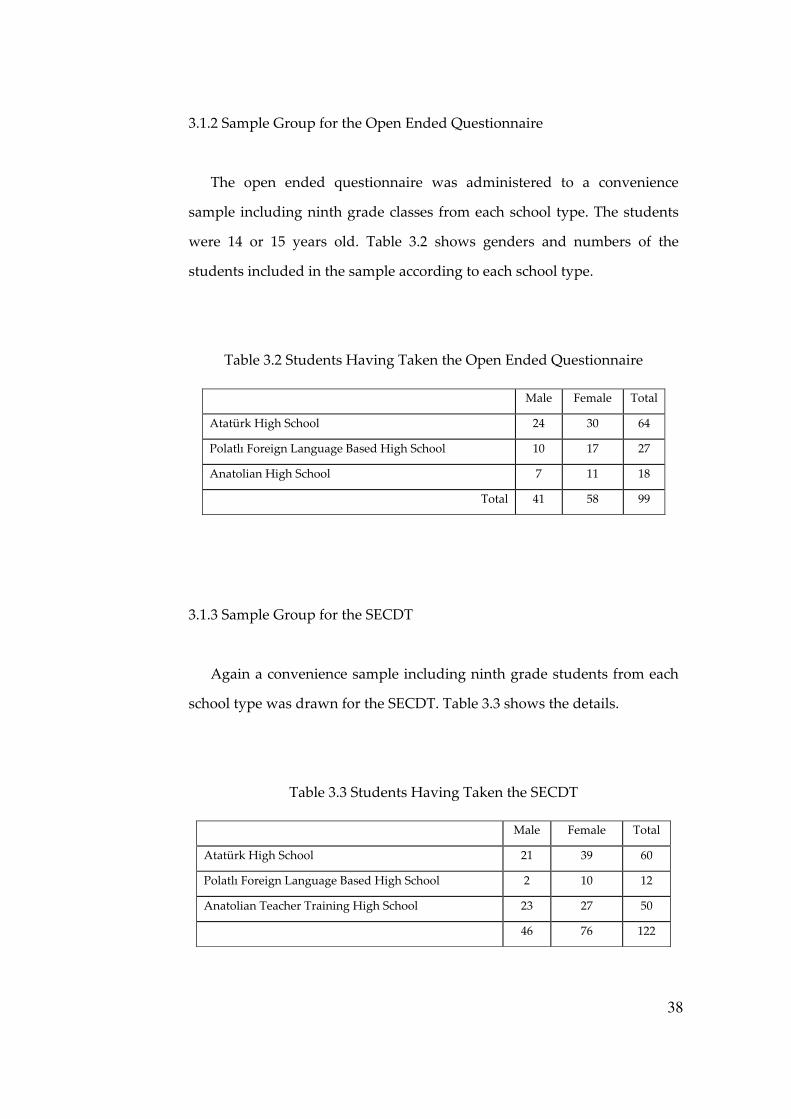
38
3.1.2 Sample Group for the Open Ended Questionnaire
The open ended questionnaire was administered to a convenience
sample including ninth grade classes from each school type. The students
were 14 or 15 years old. Table 3.2 shows genders and numbers of the
students included in the sample according to each school type.
Table 3.2 Students Having Taken the Open Ended Questionnaire
Male Female Total
Atatürk High School 24 30 64
Polatlı Foreign Language Based High School 10 17 27
Anatolian High School 7 11 18
Total 41 58 99
3.1.3 Sample Group for the SECDT
Again a convenience sample including ninth grade students from each
school type was drawn for the SECDT. Table 3.3 shows the details.
Table 3.3 Students Having Taken the SECDT
Male Female Total
Atatürk High School 21 39 60
Polatlı Foreign Language Based High School 2 10 12
Anatolian Teacher Training High School 23 27 50
46 76 122

39
In fact, the SECDT was administered to 124 students, however, 2
students had not signed gender section on the cover page of the test;
therefore, there were two missing data associated with student genders.
3.2 Variables
In the study, nine variables were produced for each student using the
raw data, answer key of the SECDT, and the choice selections indicating a
misconception (see Appendices H, I and J). Logical functions (IF, AND, OR
functions) of Microsoft Excel were used for recoding the student answers
on the raw data as 0 (incorrect answer / non-existing misconception) or 1
(correct answer / existing misconception). The details are as follow:
Scores-1: They were produced by using each student’s correct answers for
only the first tiers of items on the SECDT. Students’ answers for each item
were coded as 0 (incorrect answer) or 1 (correct answers) according to the
first tiers. In other words, each student’s correct answers for the first tiers
were coded as 1, and wrong ones were coded as 0. For example, the first
student in Figure 3.1 gave correct answers for items 1, 3, 6, 9, and 11
according to only the first tiers, and the student’s total score was 5.
Every student answers were coded with the same manner. This coding
also enabled the researcher to estimate the proportion of correct answers
for each item.
Scores-2: They were produced by using every student’s correct answers for
both of the first two tiers on the SECDT. That is, when a student’s answer
and reason were correct, it was coded as 1; otherwise, it was coded as 0.
Total scores for each student and proportion of correct answers for each
item were estimated, too.

40
Figure 3.1 Scores-1 according to only the first tiers on the SECDT
Scores-3: They were produced by using every student’s correct answers for
all three tiers on the SECDT. That is, answer of a student, who chose “Yes,
I am sure” as well as the correct answer and reason, was coded as 1;
otherwise it was coded as 0. At the end, student scores and proportion of
each correct answer according to all three tiers were estimated.
Confidence levels: They were produced by using student answers to only
the third tiers which ask if a student is confident about the answers for the
first two tiers. That is, “Yes, I am sure” selections of students were coded as
1, and the rest were coded as 0. Finally, sum of 1 points, each student had,
yielded confidence level of each student.
Misconceptions-1: They were produced by using choice selections
indicating a misconception in Appendix I and student answers for only the
first tiers. For each item on the SECDT, choice selections indicating a
misconception were coded as 1, and the rest were coded as 0. This enabled

41
the researcher to estimate the percentages of misconceptions assessed by
each item. Then, the average of percentages of the same misconceptions
assessed by different items was estimated, thus the percentages of each
misconception were found according to only the first tiers on the SECDT.
Misconceptions-2: They were produced according to the first two tiers.
When a student chose both the choice indicating a misconception and the
related reason, student was expected to have a misconception and it was
coded as 1. Thus, percentages of misconceptions, assessed by each item,
were estimated separately, and then the average percentages of the same
misconceptions, assessed by different items, were estimated.
Misconceptions-3: They were estimated by using choice selections
indicating a misconception and evaluating all three tiers on the test. That is,
when a student selected the choices indicating a misconception in the first
two tiers and chose “Yes, I am sure” in the third tier, it was coded as 1 for
the item. Using these data, percentages of misconceptions assessed by each
item were estimated. Some misconceptions are assessed by more than one
item on the test. So, the average of percentages of the same misconceptions
assessed by different items was estimated and therefore the correct
percentages of misconceptions were estimated for all three tiers on the
SECDT.
Misconceptions-4: This variable is similar misconceptions-3 in that both are
based on choice selections indicating a misconception. But, misconception-3
presents misconceptions (0 or 1) according to each choice selection whereas
misconceptions-4 presents misconceptions by combining these choice
selections. For example, Clashing current model (M4) is assessed by two
choice selections (see Appendix I). Misconceptions-3 variable presents 0’s
or 1’s for each choice selection separately, whereas misconceptions-4
presents a combination of these two choice selections. That is, if both choice
selections are coded as 0, then it is again coded as 0, otherwise, as 1.

42
Scores-based on only second tiers: They were obtained by using student
correct answers for only the second tiers. In detail, student correct answers
to only second tiers were coded as 1 and the wrong answers were coded as
0. Sum of them for each student gave the total student scores.
3.3 Instruments
In this study, four different instruments were used for different
purposes. It is more suitable to present the instruments separately.
3.3.1 Interest and Experience Questionnaire about Electricity
The IEQ was used to select suitable interviewees in the purpose of
including all types of students in terms of gender, knowledge level, type of
school they go, and experience with electricity. The IEQ had been
developed by Sencar and Eryılamaz (2004) apart from four additional
questions requesting information about students’ names, their fathers’ and
mothers’ occupations, and their physics grade on the last academic record
sheet (see Appendix A). Students’ physics grades on their last academic
record sheet were used for discriminating them on the grounds of their
knowledge level. Five items which rated on a 4 point Likert scale on the
questionnaire exhibited information about student interest in electricity.
Ten items which was rated on a 3 point Likert scale exhibited information
about the students’ experiences with electricity.
Sencar and Eryılmaz (2004) established the face and content validity of
the questionnaire asking some experts for comprehensiveness of items,
representativeness of content by the selected items, appropriateness of the
format. The researchers administered the questionnaire to 166 ninth grade
students from three different high schools for pilot study and the Cronbach
alpha reliability coefficient was estimated to be 0.89.

43
3.3.2 Interviews
The clinical interview technique (Piaget, 1929, as cited in Fredette &
Lochhead, 1980) and the interview-about-instances technique, explained by
Osborne and Gilbert (1980), were used in this study. In the clinical
interview, students were wanted to light up a bulb giving several pieces of
conducting wires, a battery and a light bulb as done by Fredette and
Lochhead (1980) so that different connections by the students for lighting
up the bulb were observed. And in the interviews-about-instances, a card
on which some diagrams are depicted was shown to the interviewees, and
then the related questions on the interview guide were put (see Appendices
B and C). All of the diagrams on the card were selected or adapted from the
literature about student difficulties in electricity. Table 3.4 demonstrates the
details about the interview card. Furthermore, the interview guide was
semi-structured, that is, only main questions used in the interviews were
included in the interview guide because also some other probing questions
were yielded during the interviews.
Table 3.4 Diagrams on the Interview Card from the Related Literature
Diagrams on the Card Source
Diagram in Figure A Heller & Finley (1980)
Diagram in Figure B Shipstone (1988)
Diagram in Figure C Heller & Finley (1980)
Diagram in Figure D Cohen et al. (1983)
Diagram in Figure E Shipstone et al. (1988)

44
3.3.3 Open Ended Questionnaire
The open-ended questionnaire was developed according to observed
student misconceptions during the interviews and the related literature
(see Appendix D). Most of the questions were adapted from the items on
the interview guide. Moreover, some textbooks and test banks were
reviewed in addition to the related literature with the object of finding
some more qualitative questions assessing students’ conceptual
understanding and assessing each misconception with more than one item.
Unfortunately, almost all of the questions in the textbooks and test banks
were quantitative, that is, mostly based on numerical calculations. As a
result, the items in Table 3.5 were added in the questionnaire after highly
careful considerations. Besides, items 13 and 14 were written by the
researcher.
Table 3.5 Additional Items on the Open Ended Questionnaire
Items on the Open Ended
Questionnaire Source
Item 1 Fredette & Lochhead (1980)
Item 2 Börklü (n.d., p. 242)
Item 11 Engelhardt & Beichner (2004)
Item 12 Fredette & Lochhead (1980)

45
3.3.4 Simple Electric Circuit Diagnostic Test
The SECDT was developed as a three-tier test (see Appendix G). First
tiers of the test items are ordinary multiple-choice questions. Second tiers
include a set of reasons for the answers on the first tiers. Third tiers
questions if examinees are confident about their answers for the first two
tiers. The SECDT was developed for assessing ninth grade students’
misconceptions about simple electric circuits as well as students’
qualitative understanding. The test was designed using findings of the
open-ended questionnaire. All item stems were the same stems on the
open-ended questionnaire. However, item 2 on the open-ended
questionnaire was not used on the SECDT because item 2 had not yielded
any considerable answers. Also, both items 9 and 12 on the open-ended
questionnaire were used for designing item 10 on the SECDT. In addition,
choices of both the first and second tiers were designed using the
categories, which include similar student answers for each item on the
open-ended questionnaire, and findings of the literature review.
Furthermore, answer key of the SECDT and choice selections indicating a
misconception are presented in Appendices H and I, respectively.
3.4 Procedure
In this study, the SECDT was designed for the purpose of assessing
ninth grade students’ misconceptions about simple electric circuits.
Therefore, this study is a cross-sectional survey study.
First of all, keywords were identified for the aim of literature review.
And then, international and national primary and secondary sources were
searched. In detail, Educational Resources Information Center (ERIC),
International Dissertation Abstracts, Social Science Citation Index, Science

46
Direct, Kluwer Online Gateway, Ebscohost were investigated, and the
search engine Google was generally used so as to look into Internet. It must
be emphasized that METU Library and Turkish Academic Network and
Information Center (ULAKBIM) online services helped so much with
searching those sources. Also, photocopies of the findings from the search
could be easily obtained by means of information and document delivery
service of ULAKBIM. Furthermore, Turkish research studies were searched
by means of METU Library, online service of the Council of Higher
Education (YÖK) for thesis search and Internet in general. Hacettepe
Üniversitesi Eğitim Fakültesi Dergisi, Eğitim ve Bilim, Çağdaş Eğitim
Dergisi, Milli Eğitim Dergisi, and Boğaziçi Üniversitesi Dergisi at METU
Library were also reviewed.
After reviewing the literature, the steps in developing the SECDT were
identified. Conducting interviews was decided to begin with, and the
interview guide was designed to assess some common misconceptions in
the light of related literature. The interviews revealed what and how
widespread the misconceptions were, and if there were any unknown
misconceptions among students. Afterwards, the open ended questionnaire
was developed with a view of the findings from the interviews and the
literature. As it was being developed, special attention was paid for each
distracter to assess only one misconception and each misconception to be
assessed by more than one distracter. And then, the questionnaire was
given to two physics teachers from Atatürk High school and an instructor
from the department of Secondary School Science and Mathematics
Education at METU with the aim of establishing the content validity. The
experts investigated the questionnaire in terms of whether the items were
appropriate for the grade level and misconceptions intended to assess,
whether the items covered all the misconceptions, and whether the items
were easily understood. Also, attention was paid for assessing each

47
misconception with more than one item and for minimizing the number of
misconceptions each item assess. Needed improvements were done
according to the feedback from the experts and the specifications were
achieved as in Appendix F. However, the content, simple electric circuits,
was waited for a while to be completed at the high schools mentioned in
Section 3.1.2 in spite of making the open ended questionnaire ready for
administration. At last, the questionnaire was administered to 99 ninth
grade students from three different types of high schools, that is, it was
time to analyze the results from the open ended questionnaire. The results
of the open ended questionnaire were going to be used for writing the
distracters of the intended three-tier test. Therefore, student answers to
each item on the questionnaire were needed to be categorized. On the other
hand, similar student responses to each item formed a category, and so, an
item on the questionnaire had several categories. Each category for an item
included either the correct conceptions or misconceptions. However, there
were also some categories including deficient or meaningless responses.
One of the difficulties in the study was to write a suitable title for each
category so that those titles were going to be the distracters and the
distracters can be chosen by all the students in the category with zero or
minimum exception. Finally, the most prevalent categories were selected to
design the SECDT after careful considerations. For establishing the content
validity, the SECDT was again given to the instructor at METU. In the light
of the feedback from the instructor, some improvements were done.
Although there was no much time for pilot study in the last week of the
term, fortunately, the SECDT was able to be administered to 124 ninth
grade students.

48
3.5 Analysis of Data
After a successful pilot study of the SECDT, the results were analyzed.
First of all, the raw data were produced by means of Microsoft Excel (MS
Excel). Variables were coded in the columns and participants were coded in
the rows of the spreadsheet. Apart form the correct answer and the
distracters, blank choices were also presented in the second tiers of the
SECDT so that students would use them if they had not found their
reasoning among the given choices. However, only several answers were
given using the blank choices and most of them could be categorized into
the choices with the same meaning. In other words, most of such answers
were coded the same as the choices with the same meaning. On the other
hand, few of them (6 or 7) were coded as blank answers because they were
different from the presented choices in meaning.
MS Excel, Statistical Package for the Social Sciences (SPSS) and Item and
Test Analysis Program (ITEMAN) were used for the statistical analyses.
Statistical analyses were first conducted for establishing the content and
construct validity of the SECDT. If there was a positive correlation between
the student scores from both the first two tiers and student confidence
levels from the third tiers was investigated to begin with, and this was
hoped to be evidence for construct validity (Çataloğlu, 2002). Then, factor
analyses of student scores and student misconceptions were respectively
conducted. The number of subjects was 124 and the number of test items
was 12, that is, the subject to item ratio was more than 10. SPSS settings
used for factor analysis in this study are given in Table 3.6. After
conducting the factor analysis first time, several factor analyses followed
the first one according to the results of each factor analysis. That is to say,
some instructions were followed as factor analyses were being conducted.
First, every correlation between each pair of variables was examined if they

49
were over 0.30 by means of the correlation matrix. Second, Kaiser-Meyer-
Olkin (KMO), which is a measure of sampling adequacy, was examined to
be more than 0.50. Also, Bartlett’s test of sphericity, which tests the
hypothesis that correlation matrix is an identity matrix (diagonals are one
and off-diagonals are zeros), was investigated. The analysis requires that
the probability (p-value) associated with Bartlett’s test of sphericity to be
less than the level of significance (0.001) so as to be able to reject the null
hypothesis which assumes the correlation matrix to be an identity matrix.
Table 3.6 SPSS Settings for Factor Analysis Univariate descriptives Statistics
Initial solution
Coefficients
KMO and Bartlett’s test of sphericity
Descriptives
Correlation Matrix
Anti-image
Method Principal components
Analyze Correlation matrix
Unrotated factor solution Display
Scree plot
Extraction
Extract Eigenvalues over 1
Method Varimax Rotation
Display Rotated solution
Exclude cases listwise
Coefficient display format Sorted by size
Options
Suppress absolute values less than 0.10

50
Third, KMO was investigated to be more than 0.50 for each individual
variable and any variable whose KMO is less than 0.50 was removed from
the analysis. Forth, every communality value which is the sum of squared
loadings for each variable and the proportion of the variance explained by
the other variables was investigated to be more than 0.50. Any variable
whose communality does not satisfy this rule was eliminated from the
analysis. Fifth, for retention of factors, either scree test was conducted, or
percent of variance explained by each variable and cumulative percent of
variance was examined to be at least 5% and 70%, respectively. At last,
rotated component matrix was examined so as to interpret the extracted
factors. Also, it was not ignored to estimate the Cronbach alpha for each
factor with the aim of understanding how reliable the factors are (Field,
2004; Costello & Osborne, 2005; Schwab, 2005).
Furthermore, probabilities of false positives and false negatives were
estimated because they were expressed by Hestenes and Halloun (1995) to
be evidence for the content validity. Also, item analysis of the SECDT was
carried out and its reliability was estimated by means of Cronbach’s alpha
test. Finally, how widespread the misconceptions were in terms of type of
the test and how widespread the correct responses were in terms of type of
the test were investigated assuming that the first tiers form an ordinary
multiple choice test, and both the first and second tiers form a two tier test.
3.6 Assumptions
There are several assumptions in this study. They can be listed as:
1. Drawing a sample size 10 times larger than the test items is enough for
item analysis (Schwab, 2005).
2. Subjects, took the open ended questionnaire and the SECDT, were
completely sincere in answering the questions.

51
CHAPTER 4
RESULTS
In this chapter, the results of the interviews, the open-ended exam and
the SECDT are given by means of three different sections.
4.1 Analysis of the Interviews
Interview results revealed what are the common misconceptions
students hold, and if there are any different misconceptions from the
literature. In this section, it is managed to present the results in a logical
order.
In general, inability to use some important terms properly was
widespread among the interviewees. When the students were asked with
what a battery does in an electrical circuit, a wide range of responses were
obtained such as it provides a circuit with current, electricity, power,
energy, etc. This situation indicates that students cannot use the physical
terminology properly, that is, electricity, current, energy and power are
interchangeable terms for them.
The students had also some other difficulties such as in determining the
direction of current, identifying the resistance or equivalent resistance,
discriminating serial, or parallel combination, etc. Even, when the question
was how a bulb lights up, most of the students could not give any answers.

52
In the following sections, the misconceptions detected during the
interviews are presented in consequence of some significant episodes from
the interviews.
4.1.1 Sink model
One of the time consuming questions in the interviews was the first
question which requests to light a bulb providing the interviewees with a
battery and one or several pieces of wires. Because, most of the students
were not able to light up the bulb at once and tried several connections
until succeeding in lighting. Most of the students managed to remember
how their science teacher had lit up the light bulb in the elementary school,
and they tried to imitate what their science teacher had done. Some
students first tried only one connection between the battery and the light
bulb as suggested in the sink model, and then they tried some other
connections. The most common connections are shown in Figure 4.1. The
correct connection D used to be formed mostly after trying other types of
connections shown in the figure.
Figure 4.1 Drawings Representing the Students’ Connections

53
4.1.2 Attenuation model
The rest of the questions were about some electrical circuit drawings on
a paper shown to the interviewees. It is suitable to present some important
episodes from the interviews in order to avoid frustrating the reader with
excessive details and making the deductions about the misconceptions
culled from the interviews concrete.
An episode from the interview with Çağrı, a tenth grade student at
Polatlı Anatolian High School, is a sufficient example of attenuation model.
It is about the diagram shown in Figure 4.2.
Figure 4.2 Diagram in the Episode from the Interview with Çağrı
Researcher I: Can you compare the brightness of bulb A and B? Interviewee (I): Bulb A lights more [brightly]. R: Why do you think so? I: Because, it [bulb A] first takes the electricity, then the rest of the electricity goes through bulb B. R: Ok! Can you compare the magnitude of the currents at points 1, 2 and 3? I: Current! [The current at point] 1 is bigger [than the current at 2], [the current at] 2 is bigger [than the current at] 3. R: Why do you think so? I: Again in the same way [The bulbs consume the current].

54
Briefly, Çağrı had the idea that bulb A takes the current first, consumes
some of it, then the current reaches bulb B, it consumes some current too,
and finally the rest of the current returns to the battery with a less
magnitude; that is, the attenuation model.
4.1.3 Shared current model
The following episode is extracted from the interview with Ferhat, a
ninth grade student at Polatlı Atarürk High School. It is again about the
question in Figure 4.2 and Ferhat assumes the direction of current from the
negative terminal to the positive one.
R: Can you compare the brightness of bulb A and B? I: Both [of bulb A and B] light equally [in brightness]. R: What is the reason? I: The circuit [current] goes in the same direction. R: That is! I: Their [the bulbs’] connections, sir. R: Their connections [paths on which the bulbs are] are the same [, aren’t they]? That is, they are on the same paths [, aren’t they]? I: Yes. R: Ok! How does being on the same path affect [the brightness]? I: The same [amount of] energy is given to both [of the bulbs] by the wires. R: Ok! What about the amount of current at points 1, 2 and 3? I: [The current at] 3 is big, this [current at 2] is the medium, [the current at] 1 is the smallest. R: That is, the current at 3 is bigger than [the current at] 2 and [the current] at 2 is bigger than [the current at] 1 as going from the negative [terminal] to the positive [terminal]. I: Yes. R: Ok! What is the reason? I: This [bulb B] is in contact with the wire [from the negative terminal] directly, and this [the current at point 1] decreases as [the bulbs] take electricity from these [wires on which points 3 and 2 are].
It is obviously that Ferhat held the shared current model. That is, in
brief, the bulbs are equally bright and the current lessens as traveling from
one terminal to the other.

55
4.1.4 Clashing current model
Another common misconception was clashing current model in which
the electricity from the positive terminal and the electricity from the
negative terminal meet in the bulb, thus lighting up it by clashing. The
episode from the interview with Gökçe, a ninth grade student at Anatolian
High School, indicates directly this misconception.
R: …Do you have an idea about how a bulb lights up? It radiates, does not it? Can you give information about it? I: Are you asking how a bulb works? R: Yes, I am asking how a bulb works. I: Because here [part of the bulb wires touch] is made of metal, it conducts electric current. There are wires, conducting wires inside [the bulb]. Here [inside the bulb], there is blue something. I think, there, when coming two currents meet, [they] clash, electricity radiates at last.
As it can be apparently understood from the episode, Gökçe thought
that a light bulb lights since electricity from positive and negative terminals
meet and clash. This is exactly the clashing current model.
4.1.5 Empirical rule model
Empirical rule model was observed among several students too. An
episode, is exactly a sign of empirical rule model, is from the interview
with Tarık, a preparatory student at Atatürk Foreign Language Based
School. The diagram which the question is about is shown in Figure 4.3.
R: … Can you compare the brightness of bulbs A and B? I: We can compare the brightness of bulbs A and B as that, because coming electric current first passes through bulb A, the brightness of bulb A will be greater than the brightness of bulb B. So, [bulb] A lights more brightly. R: Ok! Why does the current first pass through bulb A?

56
I: Because, bulb A can more easily take the electricity due to being closer to the battery.
As it can be seen in the episode, being closer to the battery is assumed to
make a bulb brighter. Therefore, this indicates an empirical rule model.
Figure 4.3 Diagram in the Episode from the Interview with Tarık.
4.1.6 Short circuit misconception
The most common misconception observed during the interviews was
short circuit misconception in which a single wire without any electrical
devices such as bulb, resistance, etc. is ignored within a circuit. For
example, almost none of the students could answer the question requesting
to rank the brightness of bulb A in the first diagram and bulb A in the
second diagram in Figure 4.4. Most of the students assumed bulb A in the
second diagram to be brighter and ignored the empty wire in the circuit.
Only a few students realized that bulb A in the second diagram does not
light as bulb A in the first diagram lights.

57
Figure 4.4 Diagrams Used for Assessing Short Circuit Misconception
4.1.7 Power supply as a constant current source
In the interviews, students were wanted to compare the amount of the
currents at point 1 in first diagram and the point 1 in the second diagram
in Figure 4.5. Most of the students said they were the same assuming that
identical batteries provide an electrical circuit with the same amount of
electric current. As an example, an episode from the interview with Serap, a
tenth grade student at Polatlı Foreign Language Teaching High School, can
be presented.
R: … Can you compare the amount of current at point 1 in the first diagram and point 1 in the second diagram? I: [They are] the same. R: Why do you think so? I: Both of the currents leave the battery from the positive terminal and in here [at the junction division in the second diagram], there will be a change due to the junction division. R: You say that it [the current at point 1 in the second diagram] changes after passing through the junction! Ok! Are the currents leaving identical batteries the same? I: [They are] the same.
As most of the students in the interviews, Serap assumed that the
batteries in both of the diagrams supply the same amount of current.

58
Figure 4.5 Diagrams Used for Assessing Power Supply as a Constant
Current Source
4.1.8 Parallel circuit misconception model
The question in Figure 4.6 was asked during the interviews. When the
change in the brightness of the bulb was asked in case of closing the switch,
most students were not able to give any answers. And then, what they
knew about the equivalent resistance of the circuit was asked. In that case,
most students said they did not know anything about it. Consequently, it
means that the question assesses a lack of knowledge rather than a
misconception.
Figure 4.6 Drawing Used for Assessing Parallel Circuit Misconception

59
As it has been said at the first section of this chapter, students mostly
had difficulties in identifying resistance or equivalent resistance during the
interviews. In fact, this misconception was extracted from the literature
review as most of the other misconceptions. However, inability to use the
knowledge that adding a resistance in parallel into a circuit decreases the
amount of equivalent resistance seems to be due to a lack of knowledge
rather than a misconception. Since equivalent resistance is a kind of
knowledge that is taught in the instruction using formulas. So, students
utilize the formulas in case of a problem asking for equivalent resistance
and they mostly do not know the knowledge that adding a resistance in
parallel into a circuit decreases the amount of equivalent resistance. That is
to say, in the literature, all incorrect answers to the questions designed for
assessing this misconception were accepted as misconception, even as a
very common misconception. However, most of the incorrect answers seem
to be because of a lack of knowledge rather than a misconception.
Briefly, this misconception was not observed during the interviews
properly. Students gave incorrect answers. However, they were due to lack
of knowledge rather a misconception. Even so, two items (2 and 11) were
designed for assessing this misconception because of the literature review
findings, not because of the interview findings.
4.1.9 Sequential reasoning
The diagram in Figure 4.7 was used during the interviews so as to
assess the sequential reasoning. First, the change in brightness of bulb A
was asked in case of a decrease in only the magnitude of resistance R1.
Then, the change in brightness of bulb A was asked in case of a decrease in
only the magnitude of resistance R2.

60
Figure 4.7 Drawing Used for Assessing Sequential Reasoning
Most of the students having the idea that the direction of current is from
the positive terminal to the negative one thought that a decrease in the
magnitude of resistance R2 does not affect the brightness of bulb A as a
decrease in the magnitude of resistance R1 affects. Besides, most of the
students having the idea that the direction of current is from the negative
terminal to the positive one thought that a decrease in the magnitude of
resistance R1 does not affect the brightness of bulb A as a decrease in the
magnitude of resistance R2 affects. Briefly, a sequential reasoning model
was commonly observed during the interviews.
4.1.10 Local reasoning
The diagram in Figure 4.8 was used during the interviews to assess the
local reasoning. Amounts of the currents I1, I2 and I3 were asked (all the
bulbs are identical). Incredibly, most of the students stated that they were
0.3, 0.3, and 0.6. The reason for such an answer was that the current on the
main path was assumed to divide into two equal amount of current at the
first junction and the rest was also assumed to divide equally at the second
junction. Such an approach to this question indicates that students
concentrate on a point within a circuit rather than a global interpretation of
the circuit.

61
Figure 4.8 Diagram Used for Assessing Local Reasoning
4.1.11 Confusion between current flow and water flow
While interviewing about the diagram in Figure 4.9, an interesting
thinking was exhibited by several interviewees.
The question was to rank the currents at points 1, 2 and 3 in amount.
Several students told that the current at 1 is the biggest, the current at 3 is
slightly smaller than the current at 1, and the current at 2 is the smallest
(I1>I3>I2). Their reasoning was that most of the current at 1 goes straight into
the path at which point 3 is.
Figure 4.9 Diagram Used for Assessing Current at Junction Divide

62
That is, some students assume a relationship between the current flow
in conducting wires and water flow in water pipes. Indeed, it is very
reasonable for students to think in such a way because it is very common
using analogies based on water flow during physics instruction or in text
books with the aim of making current flow more concrete for students.
4.1.12 Vibrating tungsten filament
One of the questions in the interviews was how a light bulb lights up.
Most of the interviewees were seen to have difficulty towards this question
because they had never learned or thought it before. Some students tried to
explain how a bulb lights up saying that current passes through the bulb
and it lights. However, they also could not explain it in detail.
Two of the interviewees, Fırat and Merve, gave an interesting answer.
They thought that the tungsten filament in the light bulb vibrates, thus
lighting up. This reasoning may be because of a misinterpretation of
clashing electrons in tungsten filament.
4.2 Analysis of the Open Ended Questionnaire
The analysis of the open ended questionnaire is exhibited by means of
two subsections; categorization, and analysis of categories.
4.2.1 Categorization of responses given to the Open Ended Questionnaire
After administering the open ended questionnaire to 99 students and
collecting the results, each student response was assigned to an appropriate
category according to similarities in meaning. That is, meaningfully similar
responses to an item formed a category; thus resulting in several categories

63
for each item in the questionnaire (see Appendix E). Table 4.1,
summarizing the categories for each item, was designed in the purpose of
avoiding the reader boring with the details in Appendix E.
Table 4.1 Summary of Categories for Each Item on the Open-Ended
Questionnaire
ITE
M
Ca
tegory
Nu
mb
er
Category Titles
Fre
qu
ency
1
A piece of wire must be connected from the negative
terminal of the battery to the upper metallic side of the bulb
so that current passes through the bulb
78
2 The battery and the bulb are in contact 11
3 The positive terminal of a battery can light up a bulb, but not
the negative terminal 2
4 The negative terminal of a battery produces electricity 4
5
A wire must be connected from the negative terminal of the
battery to the upper metallic side of the bulb so that “+” and
“-” charges meet in the bulb
2
1
6 Deficient or not meaningful 2
2 - None of categories was revealed -
1 The current in the branch leaving the battery divides into
other branches in such a way that the same amount of current
passes through each bulb because three identical bulbs are in
parallel combination
6
2 After the current divides equally into two branches at the first
junction, the current again divides equally into two branches
at the second junction
24
3 The further away the branch is from the battery, the smaller
the amount of the current
3
3
4 Deficient or not meaningful 40

64
Table 4.1 (continued)
1 The currents with the same amount from the batteries has not
been consumed yet in both of the figures
14
2 In both of the figures, potential differences supplied by the
batteries are the same, but the equivalent resistance in the
second figure is bigger
3
3 Current in the first figure is smaller because there is one bulb
in the first figure, whereas there are two bulbs in the second
figure
4
4 Current in the first figure is bigger because two bulbs in the
second figure share the current
16
5 Currents in both figures are the same because current is
constant at any point in circuits with serial combination
5
4
6 Deficient or not meaningful 28
1 Currents at all points are the same and bulbs A and B are the
same in brightness
30
2 The further away from the battery, the less the amount of
current and the brightness of a bulb
9
3 I1>I2>I3 and Bulb A is brighter 11
4 I1=I2=I3 and Bulb B is brighter due to being closer to the
battery
2
5 I1>I2>I3 and Bulb B is brighter due to being closer to the
battery
1
6 I1>I2>I3 and Bulbs A and B are the same in brightness 1
5
7 Deficient or not meaningful 15
1 It is bigger in Figure 6 because there are more bulbs in Figure
7
28
2 It is bigger in Figure 7 because the equivalent resistance in
Figure 7 is smaller
7
3 Both currents are the same in both figures because currents
leaving the batteries with the same amount have not been
divided into branches yet
39
6
4 Deficient or not meaningful 6

65
Table 4.1 (continued)
1 I1>I2=I3 44
2 I1>I2>I3 11
7.a
3 Deficient or not meaningful 11
1 Bulbs A and B are the same in brightness because the same
amount of current passes through bulbs A and B
47
2 Bulb A is brighter because bulb A is closer to the battery 14
3 Bulb B is brighter because current first passes through bulb B 6
7.b
4 Deficient or not meaningful 1
1 Bulb A in Figure 8 is brighter because all of the current is
consumed by only bulb A in Figure 8
37
2 They are the same in brightness because current is divided
into two branches in both figures
7
3 Bulb A in Figure 7 is brighter because current does not pass
through bulb A in Figure 8
28
8
4 Deficient or not meaningful 4
1 Two terminals of the battery are connected to the bulb 41
2 The bulb takes electricity from both of the positive and
negative terminals
18
3 A connection between a bulb and the negative terminal of a
battery is enough to light up a bulb
1
4 A connection between a bulb and the positive terminal of a
battery is enough to light up a bulb
1
9
5 Deficient or not meaningful 1
1 It changes in the first case, but not in the second case because
only R1 affects the bulb
17
2 It changes in the second case, but not in the first case because
only R2 affects the bulb
1
3 It does not change in both cases 8
10
4 Deficient or not meaningful 10
1 RKL>RMN 33
2 RKL=RMN 4
11
3 RKL<RMN 1
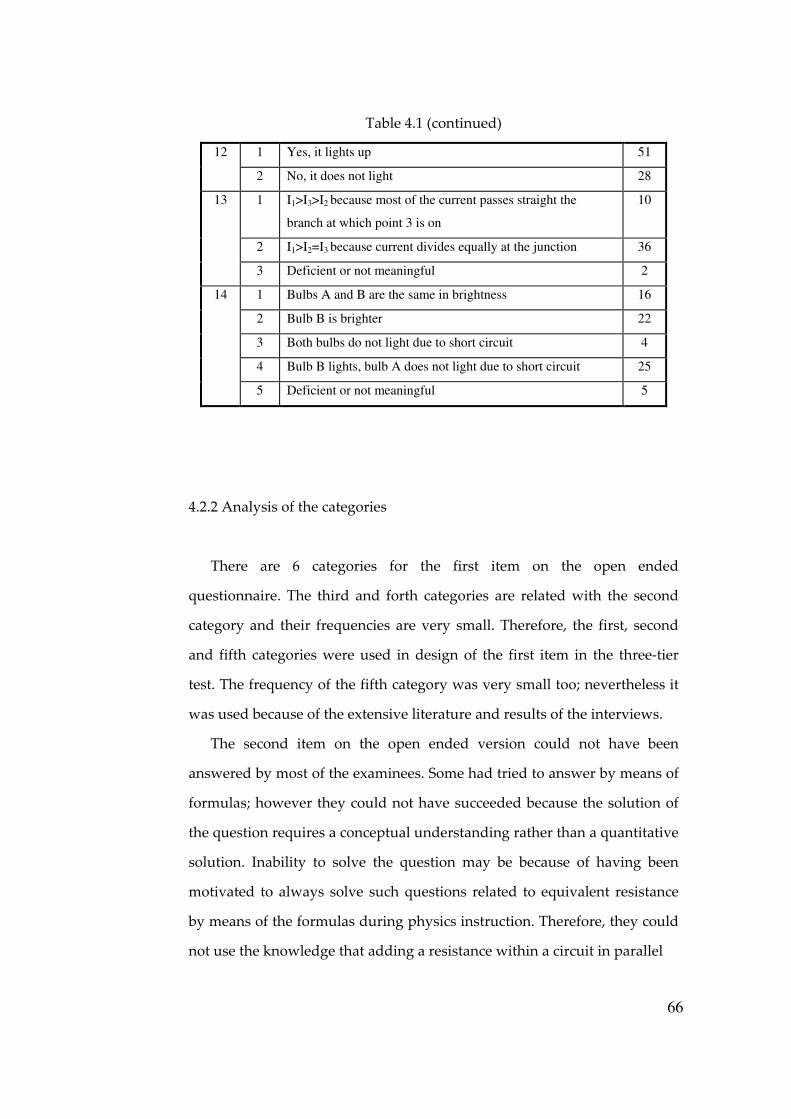
66
Table 4.1 (continued)
1 Yes, it lights up 51 12
2 No, it does not light 28
1 I1>I3>I2 because most of the current passes straight the
branch at which point 3 is on
10
2 I1>I2=I3 because current divides equally at the junction 36
13
3 Deficient or not meaningful 2
1 Bulbs A and B are the same in brightness 16
2 Bulb B is brighter 22
3 Both bulbs do not light due to short circuit 4
4 Bulb B lights, bulb A does not light due to short circuit 25
14
5 Deficient or not meaningful 5
4.2.2 Analysis of the categories
There are 6 categories for the first item on the open ended
questionnaire. The third and forth categories are related with the second
category and their frequencies are very small. Therefore, the first, second
and fifth categories were used in design of the first item in the three-tier
test. The frequency of the fifth category was very small too; nevertheless it
was used because of the extensive literature and results of the interviews.
The second item on the open ended version could not have been
answered by most of the examinees. Some had tried to answer by means of
formulas; however they could not have succeeded because the solution of
the question requires a conceptual understanding rather than a quantitative
solution. Inability to solve the question may be because of having been
motivated to always solve such questions related to equivalent resistance
by means of the formulas during physics instruction. Therefore, they could
not use the knowledge that adding a resistance within a circuit in parallel

67
decreases the equivalent resistance in order to solve the question. As a
result, the item did not reveal any categories because there were no any
properly given responses, and so, this item was not included in the three-
tier test.
There are four categories for the third item on the questionnaire. The
second category is far common than the first category which is the correct
response. The third category has a very low frequency. However, the
frequency of the forth category including deficient or meaningless
responses attracts attention. When investigating the responses in the
category in Appendix E, it seems to be because of a common cheating due
to perhaps being very difficult.
For the forth item, there are three categories with a high frequency.
However, one of them is again the category including deficient or
meaningless responses. After a profound investigation by means of
Appendix E, it seems to be on account of lack of knowledge. Also, very low
frequency of category 2 attracts attention.
The highest frequency for the fifth item belongs to category 1 which
includes correct responses. Also in this question, the category including
deficient or meaningless responses has a high frequency, and it seems to be
due to inconsistent conceptions or lack of knowledge.
In the analysis of the categories for item 9, only two main categories are
observed. One may be assumed to include correct explanations, and the
other includes responses indicating clashing current model. This item was
excluded from the three-tier test seeing that there were not enough
categories and the latter category was also observed in item 12.
In item 10, there is no any category of correct responses and other
categories indicate sequential reasoning. Also, there are lots of blank
responses as well as a high frequency of the category of deficient or
meaningless responses.

68
Item 11 revealed an interesting result. Almost all of the given responses
were correct. However, more than half of the students had not given any
responses. That is, students who know the required formula of equivalent
resistance, could solve the problem properly, nevertheless, the others could
not. Therefore, this item was also excluded from the three-tier test because
it seems to assess factual knowledge rather than a conceptual
understanding.
4.3 Analysis of the SECDT
A test has two important characteristics as validity and reliability.
Validity of a test is usually established by qualitative techniques, although
there are a few quantitative techniques for establishing validity. In this
study, some quantitative techniques were used to establish the validity of
the SECDT in addition to some qualitative techniques.
4.3.1 Validity and Reliability of the SECDT
In the purpose of statistically establishing the validity of the SECDT,
mainly three quantitative techniques were used.
First of all, the correlations between student scores on the first two tiers
(scores-2) and confidence levels on the third tiers were investigated,
because it is expected on a properly working test that students with higher
scores are more confident about the correctness of their answers if they
properly understand what they read on a test (Çataloğlu, 2002).
Table 4.2 shows the correlation between scores-2 and confidence levels.
There is a significant correlation (0.508) between student scores and
confidence levels. It means that students with high scores generally have
higher confidence levels than students with low scores.

69
.508**
.000
124
Pearson Correlation
Sig. (2-tailed)
N
Scores-2Confidence Levels
Correlation is significant at the 0.01 level
(2-tailed).
**.
Table 4.2 Correlation between Scores-2 and Confidence Levels
However, the correlation coefficient is not so high although it is
significant. This reason can be investigated using the scattergram of scores-
2 vs. confidence levels in Figure 4.10. In the figure, number of students at
each pedal can be observed. Each single pedal represents one student.
Nevertheless, there are also some sunflowers (a pedal and two or more
lines around the pedal) apart from the pedals. At the sunflowers, each line
represents one student. For example, a sunflower with three lines around it
indicates three students. At the right-bottom side of the graph, there are
some students with high confidence levels in spite of their low scores.
Those students are mainly the reason of medium correlation coefficient.
Those students are confident about their wrong answers, some of which are
misconceptions. Indeed, it is a sign of that some students hold resistive
misconceptions as well as some students who answered the questions by
chance. Another reason for the medium correlation coefficient is related to
the students at the right-upper side of the graph. Those students who have
quite high scores (above 8) are not expectable for the SECDT because they
are quite above the mean score (2.93). Additionally, the low slope of the
line in the figure indicates that students’ confidence levels are generally
more than their scores.

70
Confidence Levels
14131211109876543210
Sco
res-2
12
11
10
9
8
7
6
5
4
3
2
1
0
Figure 4.10 Scattergram of Scores-2 vs. Confidence Levels
The second quantitative technique for establishing the validity of the
SECDT includes two factor analyses. The first factor analysis was
conducted because of that related questions would result in some
acceptable factors by means of the correct responses to all three tiers
(scores-3). The second factor analysis was conducted to make possible
related misconceptions result in acceptable factors by means of the
misconceptions according to all three tiers (misconceptions-3).
When the correlation matrix of the factor analysis, which was
conducted using scores-3, was examined, 15 of 28 correlation coefficients
were observed to be over 0.30 in one side of the diagonal in the matrix.
Table 4.3 shows KMO measure of sampling and Bartlett’s test of
sphericity. The KMO indicates a meritorious value, 0.818. And, the
probability associated with the Bartlett’s test of sphericity (p-value) is less

71
KMO and Bartlett's Test
.818
221.565
28
.000
Kaiser-Meyer-Olkin Measure of Sampling
Adequacy.
Approx. Chi-Square
df
Sig.
Bartlett's Test of
Sphericity
than the significance level. Hence, it is rejected that the correlation matrix is
an identity matrix. This result means that test items are generally not
independent from each other.
Table 4.3 SPSS Output Showing KMO and Bartlett’s Test
Also, anti-image correlations were investigated so that all the KMO
measures of sampling adequacy for each variable were greater than 0.50,
which is the least acceptable value. Variables with KMO values less than
0.50 were removed from the analysis. Thus, items 9 and 10 were removed
from the analysis.
Next, each item’s communality value was investigated to be more than
0.50, and Item 1 whose communality was 0.44 was removed from the
analysis. Also, cumulative percent of variance accounted for was arranged
as 70% by changing the eigenvalue from 1 to 0.9. Afterwards, item 2 was
removed because it remained alone in one of 4 yielded factors. At the end
of the analysis, the cumulative percent of variance was 65% and
communalities of the completed factor analysis were as shown in Table 4.4.
As a result, three factors were obtained according to Table 4.5. In the
table, values less than 0.10 are not shown. Items in each factor (component)
can be said to be related according to the factor analysis. For example,
items 8, 4 and 12 are related according to the analysis.

72
Communalities
1.000 .649
1.000 .664
1.000 .698
1.000 .669
1.000 .578
1.000 .719
1.000 .670
1.000 .564
Item 3
Item 4
Item 5
Item 6
Item 7
Item 8
Item 11
Item 12
Initial Extraction
Extraction Method: Principal Component Analysis.
Rotated Component Matrixa
.822 .197
.791 .191
.691 .276 .101
.215 .787
.238 .779
.460 .599
.186 -.196 .791
.332 .731
Item 8
Item 4
Item 12
Item 6
Item 11
Item 7
Item 5
Item 3
1 2 3
Component
Extraction Method: Principal Component Analysis.
Rotation Method: Varimax with Kaiser Normalization.
Rotation converged in 6 iterations.a.
Table 4.4 SPSS Output Showing Communalities
Table 4.5 SPSS Output Showing the Rotated Component Matrix
Before mentioning about the details in interpretations of the factors, it is
beneficial to review the physics textbook, ninth grade students read, for
detecting the qualitative dimensions of simple electric circuits. From the
review of the textbook by Kalyoncu and Çakmak (2000, p. 97) and in the
light of the literature review, following five qualitative dimensions (QD)
were determined. They are as follow:

73
1. Identifying complete circuit (Items 1 and 10)
2. Identifying short circuit (Items 8 and 12)
3. Understanding the factors affecting the resistance of a conductor
4. Understanding Ohm’s Law (Items 3 and 5)
5. Understanding current in electrical circuits
a. Current in series circuits (Items 4, 9)
b. Current in parallel circuits (Item 7)
c. Current in main branch and parallel branches (Items 2, 6 and 11)
These qualitative dimensions of simple electric circuits permitted the
researcher to interpret the yielded factors. Consequently, Table 4.6 was
prepared so as to present the interpretations of each factor.
As a result, 4 of 5 qualitative dimensions are assessed by the SECDT. In
general, it can be said that most of students’ qualitative understanding of
simple electric circuits is assessed by the SECDT. But, is this assessment
reliable enough? In order to answer this question, the Cronbach alpha,
which is an internal reliability coefficient, was estimated using student
correct answers according to all three tiers (scores-3) and it was found to be
0.69. So, it can be said that at least 69% of variance of total scores-3 is owing
to the true score variance (Marx, 1998). That is, the SECDT scores are
reliable measure of students’ qualitative understanding of simple electric
circuits. In other words, high scores on the test mean high qualitative
understanding of simple electric circuits, and low scores mean low
qualitative understanding.

74
Table 4.6 Interpretations of the Factors Extracted from Table 4.5
Item(s) Factor Name (Interpretation)
1 8, 4, 12
Items 8 and 12 require students to identify the
short circuit for giving correct answers (QD2).
Item 4 requires understanding current in a series
circuit (QD5a). That is, it is reasonable that items 8
and 12 enter the same factor. But, it is not
reasonable that item 4 enters this factor. The
Cronbach alpha reliability for items 8 and 12 is
0.69.
2 6, 11, 7
Items 6 and 11 assess students’ understanding of
current in main and parallel branches (QD5c).
Item 7 assesses students’ understanding of current
in parallel circuits (QD5b). Even so, this factor is
very reasonable because QD5b and QD5c are
much related.
Fact
ors
3 3, 5
Items 3 and 5 require understanding Ohm’s Law
properly for giving the correct answers (QD4).
Circuit connections are series and parallel,
respectively; however, they both require ranking
currents at two different circuits. That is, this
factor is also a reasonable factor.
As a result, 4 of 5 qualitative dimensions are assessed by the SECDT. In
general, it can be said that most of students’ qualitative understanding of
simple electric circuits is assessed by the SECDT. But, is this assessment
reliable enough? In order to answer this question, the Cronbach alpha,
which is an internal reliability coefficient, was estimated using student
correct answers according to all three tiers (scores-3) and it was found to be

75
0.69. So, it can be said that at least 69% of variance of total scores-3 is owing
to the true score variance (Marx, 1998). That is, the SECDT scores are
reliable measure of students’ qualitative understanding of simple electric
circuits. In other words, high scores on the test mean high qualitative
understanding of simple electric circuits, and low scores mean low
qualitative understanding.
Moreover, it is beneficial to estimate the reliability of each factor by
means of Cronbach alpha. The reliability coefficients were estimated to be
0.75, 0.73, and 0.24, respectively for the first, second and third factors.
Because item 4 is thought to be irrelevant from the first factor, the reliability
coefficient of the first factor was estimated again by not including item 4 in
this factor and it was found to be 0.69. The coefficients indicate that the use
of the first factor (items 8 and 12) for assessing if students can identify short
circuit yields reliable results. Also, the use of the second factor (items 6, 7
and 11) for assessing students’ understanding of current in parallel circuits
yields reliable results. On the other hand, the use of the last factor (items 3
and 5) for assessing students’ understanding of Ohm’s Law does not yield
as reliable as results. However, in this instance, it should not be forgotten
that the number of test items can affect the reliability estimates. That is, first
two factors yielded quite good reliability coefficients although there are 2
or 3 items in these factors. However, the reason of low reliability coefficient
may be the small number of items in the last factor. Aubrecht and Aubrecht
(1983) reported the following Spearman-Brown formula for estimating a
new reliability coefficient in case of a hypothetical increase in the number
of test items.
rf
frr
)1(1'
−+
=

76
In this formula, r is the reliability of the original test, r’ is the reliability
of the test lengthened by a factor f. For example, if a forty-item test is added
10 items, then f becomes 5/4. Using this formula, a new reliability
coefficient can be estimated in case of a hypothetical increase in the number
of items in the third factor whose r is 0.24. When 10 items are added in the
factor hypothetically, f becomes 6. And, r’ is calculated as 0.66. That is, the
small number of the test items in the third factor may be the reason for such
a low reliability coefficient.
Moreover, a factor analysis was conducted using the most successful 50
students’ scores because Hestenes and Halloun (1995) suggested that factor
analysis to yield better results using successful students’ scores. However,
the Bartlett’s test of sphericity failed to reject the null hypothesis that the
correlation matrix is an identity matrix (p>0.001). So, factor analysis could
not be conducted.
As was previously mentioned, a factor analysis was also conducted for
the students’ misconceptions on the SECDT (misconceptions-4). However,
p-value of the Bartlett’s test of sphericity was estimated as 0.003 (more than
0.001); therefore, the null hypothesis that the correlation matrix is an
identity matrix cannot be rejected. That is, all misconceptions found to be
independent from each other, and any factors were not obtained as a result
of the factor analysis whereas some misconceptions may be thought to be
related according to the literature. For example, Shipstone et al. (1988)
reported the power supply as a constant current source model to be an
example of the local reasoning because of focusing on a point in a circuit
and ignoring whatever happens elsewhere. Also, the Cronbach reliability
was estimated for misconceptions-4; however, it was found as 0.33. That is,
only 33% of variance of total misconceptions is owing to variance of true
misconceptions.

77
Rotated Component Matrixa
.914 .083 -.006
.825 -.290 .058
-.054 -.861 .145
-.287 .729 .225
-.117 .256 -.791
-.078 .339 .739
M8
M5
M11
M10
M3
M2
1 2 3
Component
Extraction Method: Principal Component Analysis.
Rotation Method: Varimax with Kaiser Normalization.
Rotation converged in 4 iterations.a.
In the light of the suggestions of Hestenes and Halloun (1995), a factor
analysis conducted using the most successful students’ misconceptions to
get better results. It yielded the results in Table 4.7. Cumulative percent of
explained variance was 73.56%.
However, these factors are not as expected. Although misconceptions 8
and 5 are statistically quite related, any qualitative relationship between
them is not expected. And, misconceptions 11 and 10 seem to be inversely
related statistically. Nevertheless, a positive relationship is expected
qualitatively because students holding one or both of these misconceptions
focus on a point in the circuit and ignore whatever happens elsewhere.
Table 4.7 Result of Factor Analysis with Successful Students’
Misconceptions-4
Note: M2 : Attenuation Model M3 : Shared Current Model M5 : Empirical Rule Model M8 : Parallel Circuit Misconception M10 : Local Reasoning M11 : Confusion between Current Flow and Water Flow

78
Also, misconceptions 3 and 2 are related statistically. But, this factor is
not sensible, either. As Shipstone (1988) reported, these misconceptions are
almost the same except for the different student thoughts about the
brightness of identical bulbs in series. As previously mentioned, the
reliability of misconceptions-4 is very low. That is, indeed, misconception
scores used for the factor analysis do not soundly represent true student
misconceptions. These unexpected factors may be yielded due to deficient
sample size in the analysis (only 50 students) and unreliable misconception
scores.
Third, the proportions of false positives and false negatives were exactly
estimated using the result of the SECDT. Because, Hestenes and Halloun
(1995) reported that factor analyzing test results is related to content
validity of a test, and another way for establishing the content validity is to
minimize the probabilities of false positives and negatives. They used
follow-up interview results for observing the probabilities of false positives
and negatives. However, it is a fact that not only interviewing all the
students who have taken the test but also interviewing an enough number
of students for generalization are very difficult and time consuming.
Therefore, the three-tier tests have a big advantage for estimating
proportions of false positives and negatives because not only student
responses to the first tier but also their reasoning are available from the test
results. Thus, the proportions of false positives and negatives were
estimated using scores-1 (answers) and scores based on only second tiers
(reasons). That is, if a student’s answer for a first tier is 0 (incorrect) on
scores-1, and his / her reason is 1 (correct) on scores based on only second
tier, then it was coded as 1 for indicating false negatives. In the same
manner, 1-0 pairs were coded as 1 for indicating false positives. All of these
processes were done by using Excel. The rest was to estimate each student’s
false negatives and positives, respectively by summing each student’s 1-

79
values. Thus, sum of all students’ false negatives gave the total number of
false negatives, and sum of all students’ false positives gave the total
number of false positives. Finally, the proportions of false positives and
negatives to the total number of answers were estimated. The proportion of
false negatives was estimated as 10.82%. This is an acceptable value for
content validity because Hestenes and Halloun (1995) suggested the false
negatives and positives to be less than 10%. The reason for false negatives
can be only due to student inattention on the test because of powerful
distracters culled from the interviews and the open ended questionnaire.
However, the proportion of false positives was estimated as 17.47%. Of
course, it was inevitable to find such a result because students have a
chance to give responses randomly in all multiple choice tests.
Table 4.8 presents the overall descriptive statistics based on scores-3 and
misconception scores-4, respectively. The mean of the scores is 2.93 and
standard deviation (SD), which is a measure of the spread of scores, was
found to be 2.35. Besides, standard error of the mean for the scores is 0.21,
that is, it can be 95% confident that true mean of the scores is between 2.51
and 3.34. And, standard error of the measurement (SEM) is 1.31, that is, it
can be 95% confident that true score of a subject whose score was 7 on the
test is between 4.38 and 9.62. The mean of the misconception scores was
2.83, the SD was 1.60, the standard error of the mean was 0.14, and the SEM
was 1.31; but, the small reliability coefficient of misconceptions-4 attracts
the most attention at first glance as previously mentioned. What are the
reasons for such a small coefficient for misconceptions-4 as scores-3 yielded
a moderate value? There are several factors affecting the reliability
coefficient such as test length, homogeneity, spread of scores, difficulty of
test, objectivity (Gronlund & Linn, 1990). In the purpose of explaining this
question, first, comparing standard deviations was thought. However,
maximum scores must be the same so as to do it. Therefore, scores-3 and

80
misconceptions-4 were transformed into their percentages, respectively, so
that maximum values of both were made 100. Then, standard deviations
were estimated as 18.8 and 13.7, respectively. That is, the spread of scores is
larger than the spread of misconceptions. This may be an explanation for
the misconceptions’ small reliability coefficient.
Table 4.8 Overall Descriptive Statistics
Scores-3 Misconception-4 No of Students 124 124 No of Items / Misconceptions 12 11 Mean 2.93 2.83 Standard Deviation 2.35 1.60 Standard Error of the Mean 0,21 0.14
Lowe 2.51 2.55 95 % Confidence Interval for Mean Uppe 3.34 3.11
Variance 5.50 2.55 Skewness 0.72 0.14 Kurtosis - 0.07 - 0.65 Minimum 0.00 0.00 Maximum 10.00 7.00 Median 3.00 3.00 Reliability (Coefficient Alpha) 0.69 0.33 Standard Error of the Measurement (SEM) 1.31 1.31
Second, all students were ordered in a way that students with high
scores were at the top and students with low scores were at the bottom.
Next, each misconception proportion of 27% of the students at the top and
each misconception proportion of 27% of the students at the bottom were
estimated. Then, the differences were estimated and they were as in Table
4.9. Briefly, the technique for estimating the discrimination index was used.

81
Table 4.9 Discriminations Indexes of each Misconception Based on All
Three Tiers
Indexes
M1 : Sink Model - 0.09
M2 : Attenuation Model - 0.03
M3 : Sharing Current Model - 0.06
M4 : Clashing Current Model 0.17
M5 : Empirical Rule Model - 0.09
M6 : Short Circuit Misconception 0.06
M7 : Power Supply as a Constant Current Source Model 0.54
M8 : Parallel Circuit Misconception 0.00
M9 : Sequential Reasoning 0.11
M10 : Local Reasoning 0.40
M11 : Confusion between Current Flow and Water Flow -0.14
As a result, all misconceptions except seventh and tenth misconceptions
are common among all students. However, the seventh and tenth
misconceptions are surprisingly more common among successful students.
In other words, the sample seems to be homogeneous with respect to the
misconceptions. This may be the reason for small reliability coefficient.
Figure 4.11 shows the histograms of scores-3 and misconceptions-4.
Right-skewness of the first histogram means the difficulty of the SECDT
because most of the students got low scores on the test. The second
histogram is closer to the normal distribution because most of the students’
misconceptions are about the mean.

82
Student Scores
10,08,06,04,02,00,0
Fre
qu
en
cy
50
40
30
20
10
0
Std. Dev = 2,34
Mean = 2,9
N = 124,00
Misconceptions-4
7,06,05,04,03,02,01,00,0
Fre
qu
en
cy
30
20
10
0
Std. Dev = 1,60
Mean = 2,8
N = 124,00
Figure 4.11 Histograms of Scores-3 and Misconception-4
Moreover, Table 4.10 gives the results of the item analysis based on
scores-3. In the table, Prop. Correct is the difficulty level which is the
proportion of correct responses. And, Point-biserial (item-total) is the
correlation between the dichotomous test items (correct or incorrect
responses to each item) and the total student scores (Beichner, 1994). It

83
gives all the information that discrimination index does. Discrimination
index is the difference between the difficulty levels of upper level students
and lower level students. In addition, upper level students are usually
determined by 27 % of the students at the top, and lower level students are
usually determined by 27 % of the students at the bottom of an ordered
student scores (Aubrecht & Aubrecht, 1983). Difficulty levels are between
0.016 and 0.492 with an average of 0.244. It means that items are very
difficult in general. And, the point-biserials are quite over 0.20 except from
item 2 with an average of 0.458. That is, item 2 can be removed from the
SECDT. When item 2 is removed, the reliability of the SECDT increases to
0.75 and mean point-biserial increases to 0.508 although the difficulty level
does not change.
Table 4.10 Output of the ITEMAN
Item Statistics Alternative Statistics
----------------------- -----------------------------------
Seq. Scale Prop. Point Prop. Point
No. –Item Correct Biser. Biser. Alt. Endorsing Biser. Biser. Key
---- ----- ------- ------ ------ ----- --------- ------ ------ ---
1 0-1 0.371 0.588 0.460 1 0.371 0.588 0.460 *
2 0.629 -0.588 -0.460
Other 0.000 -9.000 -9.000
2 0-2 0.258 -0.007 -0.005 1 0.258 -0.007 -0.005 *
CHECK THE KEY 2 0.742 0.007 0.005 ?
1 was specified, 2 works better Other 0.000 -9.000 -9.000
3 0-3 0.089 0.619 0.350 1 0.089 0.619 0.350 *
2 0.911 -0.619 -0.350
Other 0.000 -9.000 -9.000
4 0-4 0.282 0.874 0.656 1 0.282 0.874 0.656 *
2 0.718 -0.874 -0.656
Other 0.000 -9.000 -9.000
5 0-5 0.016 0.612 0.196 1 0.016 0.612 0.196 *
2 0.984 -0.612 -0.196
Other 0.000 -9.000 -9.000
6 0-6 0.387 0.789 0.620 1 0.387 0.789 0.620 *
2 0.613 -0.789 -0.620
Other 0.000 -9.000 -9.000

84
Table 4.10 (continued)
Item Statistics Alternative Statistics
----------------------- -----------------------------------
Seq. Scale Prop. Point Prop. Point
No. –Item Correct Biser. Biser. Alt. Endorsing Biser. Biser. Key
---- ----- ------- ------ ------ ----- --------- ------ ------ ---
7 0-7 0.492 0.913 0.728 1 0.492 0.913 0.728 *
2 0.508 -0.913 -0.728
Other 0.000 -9.000 -9.000
8 0-8 0.210 0.934 0.661 1 0.210 0.934 0.661 *
2 0.790 -0.934 -0.661
Other 0.000 -9.000 -9.000
9 0-9 0.169 0.582 0.392 1 0.169 0.582 0.392 *
2 0.831 -0.582 -0.392
Other 0.000 -9.000 -9.000
10 0-10 0.097 0.340 0.197 1 0.097 0.340 0.197 *
2 0.903 -0.340 -0.197
Other 0.000 -9.000 -9.000
11 0-11 0.306 0.814 0.620 1 0.306 0.814 0.620 *
2 0.694 -0.814 -0.620
Other 0.000 -9.000 -9.000
12 0-12 0.250 0.850 0.624 1 0.250 0.850 0.624 *
2 0.750 -0.850 -0.624
Other 0.000 -9.000 -9.000
4.3.2 Results of the SECDT
Figure 4.12 was depicted using misconceptions-1, misconceptions-2 and
misconceptions-3. Proportion of each misconception was estimated
separately using only first tiers (misconception-1), the first two tiers
(misconception-2), and all three tiers (misconception-3).
When the figure examined, it is apparently observed that proportion of
each misconception is overestimated by only the first tiers with respect to
the first two tiers except for the forth misconception. Furthermore, each
proportion of misconception is also overestimated by the first two tiers
with respect to all three tiers apart from the eighth misconception.
Mean P 0.244
Mean Item-Tot. 0.458

85
M1 M2 M3 M4 M5 M6 M7M8 M9 M10 M11
ALL THREE TIERS
FIRST TWO TIERS
ONLY FIRST TIERS0%
5%
10%
15%
20%
25%
30%
35%
40%
45%
50%
NOTE M1 : Sink Model M2 : Attenuation Model M3 : Shared Current Model M4 : Clashing Current Model M5 : Empirical Rule Model M6 : Short Circuit Misconception M7 : Power Supply as a Constant Current Source Model M8 : Parallel Circuit Misconception M9 : Sequential Reasoning M10 : Local Reasoning M11 : Confusion between Current Flow and Water Flow
Figure 4.12 Misconceptions in terms of Type of the Test
Some correct answers may be due to some misconceptions. This is not
an issue for a two-tier or three-tier test because the reasoning can be
obtained and if a correct answer on the first tier is due to the correct reason
can be understood. However, it is not the case when only the first tiers
were evaluated. The proportion of it according to only the first tiers is zero
because the first tiers assessing it are correct answers and it cannot be
M1 M2 M3 M4 M5 M6 M7 M8 M9 M10 M11 Mean
ALL THREE TIERS 5% 4% 11% 26% 4% 16% 9% 2% 4% 15% 8% 9%
FIRST TWO TIERS 11% 6% 15% 35% 7% 22% 13% 2% 8% 18% 13% 14%
ONLY FIRST TIERS 47% 20% 24% 0% 16% 34% 27% 33% 24% 36% 28% 26%

86
known how much percent of correct answers is due to that misconception.
And, some incorrect answers may be due to correct reasons. Whereas one-
tier tests have not the ability to overcome these issues, two-tier or three-tier
tests do. That is, they can assess if correct answers are really due to correct
reasons, or if wrong answers are really incorrect reasons. Consequently,
two-tier tests and three-tests are more valid than one-tier tests.
Misconceptions 3, 4, 6, 7, 10, and 11 seem to be prevalent among the
students because their proportions are around 10% (Chen et al, 2002).
Clashing current model (M4) is the most prevalent misconception. On the
other hand, parallel circuit misconception (M8) is the least.
Another result is that about 12% of the mean proportion of the
misconceptions disappears as the type of the test changes from the one-tier
test to the two-tier test. Most of it is the proportion of false negatives.
Besides, 5% of proportion disappears as the type of the test changes from
the two-tier test to the three-tier test. It is the proportion of lack of
knowledge.
Figure 4.13 presents the proportion of correct answers for each item in
terms of type of the test. Indeed, these proportions are the difficulty levels.
Examining the figure, mean proportions are 48% and 31% separately for
the one-tier test and the two-tier test; that is, there is a 17% disappearing
value, which does not represent any misconceptions. It is the proportion of
false positives which was estimated to be about 17.47%. The difference
0.47% is due to the rounding error. Additionally, 6% is the proportion of
lack of knowledge, revealed from the third tiers. It can be concluded from
these results that multiple choice tests and even two-tier tests overestimate
the proportion of students who have the correct qualitative understanding.

87
I1 I2 I3 I4 I5 I6 I7 I8 I9 I10 I11 I12
ALL THREE TIERS
FIRST TWO TIERS
ONLY FIRST TIERS0%
10%
20%
30%
40%
50%
60%
70%
80%
I1 I2 I3 I4 I5 I6 I7 I8 I9 I10 I11 I12 Mean
ALL THREE TIERS 37% 26% 9% 28% 2% 39% 49% 21% 17% 10% 31% 25% 25%
FIRST TWO TIERS 40% 37% 12% 35% 2% 50% 60% 22% 28% 12% 40% 28% 31%
ONLY FIRST TIERS 77% 46% 51% 41% 23% 69% 69% 38% 35% 28% 60% 40% 48%
Figure 4.13 Correct Responses in terms of Type of Test
The difference between the proportions based on the first two tiers and
all three tiers gives lack of knowledge proportions for each item on the test.
For example, subtraction of 37% from 40% yields 3%, which is the
proportion of lack of knowledge for item 1. As a result, proportions of lack
of knowledge for items 2, 4, 6, 7, 9 and 11 attract attention. Items 2, 6, 7 and
11 assess students’ qualitative understanding of current in parallel circuits.
And, items 4 and 9 assess students’ qualitative understanding of current in
series circuits.

88
5.1 Summary of the Results
The results of this study can be listed as follow:
1. There was a significant correlation between scores-2 and confidence
levels. In other words, students with high scores on the SECDT were
more confident than the students with lower scores.
2. Factor analysis with scores-3 yielded 3 factors, and the internal
reliabilities (Cronbach alpha) of them were 0.75, 0.73 and 0.24,
respectively. Moreover, all test items on the SECDT assess 4 of 5
qualitative dimensions of simple electric circuits, and the Cronbach
alpha reliability of the SECDT was estimated as 0.69. That is, at least
69% of variance in the total scores is owing to the variance in true
scores.
3. The reliability of misconceptions-4 was estimated as 0.33. That is, only
33% of the variance in total misconceptions-4 scores is due to the
variance of true student misconceptions.
4. Factor analysis with misconceptions-4 yielded no factors. That is, all
misconceptions seem to be independent statistically.
5. Proportion of false negatives was estimated as 10.82%, and the
proportion of false positives was estimated as 17.47%.
6. Difference between the mean misconception proportion of the one-tier
test and the proportion of the two-tier test was 12%. And, difference
between the mean misconception proportion of the two-tier test and the
proportion of the three-tier test was 5%. 11% of 12% was false positives.
Also, 5% was the mean proportion of lack of knowledge.
7. Difference between the mean proportions of correct answers to the first
tiers and to the first two tiers was 17%. And, difference between the
mean proportions of correct answers to the first two tiers and to al the

89
three tiers was 6%. That is, 17% was the proportion of false positives
and 6% was the proportion of lack of knowledge.
8. The SECDT yielded 6 of 11 misconceptions whose proportions were
about or over 10%.
9. Proportions of lack of knowledge for items 2, 4, 6, 7, 9 and 11 attract
attention. Items 2, 6, 7 and 11 assess students’ qualitative understanding
of current in parallel circuits. And, items 4 and 9 assess students’
qualitative understanding of current in series circuits.
10. The most common misconception was clashing current model (M4).
Respectively, other common misconceptions were short circuit
misconception, local reasoning, shared current model, power supply as
a constant current source model, and confusion of current flow with
water flow.

90
CHAPTER 5
CONCLUSIONS, DISCUSSION, AND IMPLICATIONS
This chapter of the study is presented by means of seven sections. The
first section is about the overview of the study. In the second section,
conclusions from the study are presented. Discussion of the results is
exhibited in the third section. Internal and external validity is accounted for
in the fourth and fifth sections, respectively. The sixth section presents the
implications of the study as the recommendations for further research are
included in the last section.
5.1 Overview of the Study
In the purpose of assessing ninth grade students’ misconceptions about
simple electric circuits, a three-tier test was developed and administered to
124 ninth grade students in Polatlı, the biggest outlying district of capital
Ankara. So, this study is a cross-sectional survey study.
Assessing student misconceptions is very important for effective
physics instruction. However, importance of the study is not determined
only with it because one of the main characteristics of this study is the
design and use of a three-tier test. Moreover, very limited number of three-
tier tests on physics contents emphasizes the importance of the study.

91
Completely special attention was paid for developing the SECDT. First,
interviews were conducted in the light of the literature review to probe and
grasp student conceptions. Second, results from the literature and the
interviews helped the researcher develop the open-ended questionnaire.
The questionnaire was given to experts for content validation. Afterwards,
it was administered to 99 students for determining the distracters on the
desired three-tier test. Third, the SECDT was developed by means of the
item stems on the open-ended questionnaire and revealed distracters from
the open-ended questionnaire. Again, content validity was established and
the SECDT was administered to 124 subjects. And, the rest includes
statistical analyses presented in Chapter 4.
5.2 Conclusions
During the interviews, students were observed to use concepts
interchangeably such as electricity, energy, current, voltage, potential
difference, etc. It means that students have difficulty in using physics
terminology.
Also, students gave lots of wrong answers during the interviews. They
were because of lack of knowledge but mostly misconceptions.
Commonness of some misconceptions attracted attention such as power
supply as a constant current source model, short circuit misconception,
attenuation model, empirical rule model, and local reasoning. Other
misconceptions were common, too, but parallel circuit misconception. Most
of the students gave wrong answers for the question designed for assessing
that misconception. However, the reason for those incorrect answers was
not a misconception because they did not know resistance or equivalent
resistance. Some knew the concepts; but they could not answer the
questions because they were qualitative questions and students were not

92
used to giving qualitative answers. That is, this misconception was not
common, and this was supported by the results of the SECDT. Chen et al.
(2002) gave attention to answers that more than 10% of students gave. The
same evaluation was done, and 10 of 11 misconceptions were observed to
be common. Also, the most common misconceptions were power supply as
a constant current source model and short circuit misconception.
There was a significant correlation between scores-2 and confidence
levels. In other words, students with high scores on the SECDT were more
confident than the students with lower scores. This is a construct-related
evidence for validity of the SECDT. The proportions of false negatives and
positives (10.82% and 17.47%) are content-related evidence for validity.
Moreover, the test had been examined by an expert for establishing the
content validity.
Factor analysis with scores-3 yielded 3 factors, and the internal
reliabilities (Cronbach alpha) of them were 0.75, 0.73 and 0.24, respectively.
That is, the first and second factors assess reliably what they assess. But, the
same cannot be said for the third factor, which includes items 3 and 5. The
small number of the test items in the third factor may be a reason for such a
low reliability coefficient. That is, 1 or 2 items assessing the same
qualitative dimension, items 3 and 5 assess, can be added in the SECDT to
increase the reliability of the third factor. Moreover, all test items on the
SECDT assess 4 of 5 qualitative dimensions of simple electric circuits.
Although most qualitative dimensions of simple electric circuits are
assessed by the SECDT, 2 or 3 items can be added for assessing the
qualitative dimension (factors affecting the resistance) which is not
assessed by the test. In addition, the Cronbach alpha reliability of the
SECDT was estimated as 0.69. In other words, at least 69% of variance in
the total scores is owing to the variance in true scores. In spite of some

93
mentioned deficiencies, the SECDT scores are valid and reliable measure of
students’ qualitative understanding of simple electric circuits.
The Cronbach alpha reliability was estimated for misconceptions-4, too.
However, it was found as 0.33. That is, only 33% of the variance in total
misconception scores is due to the variance of true misconception scores.
Standard deviations of total scores-3 and total misconceptions-4 were
compared as in Section 4.3.1, and standard deviation of scores-3 was bigger
than the standard deviation of misconceptions-4. In other words, spread of
scores for total scores is larger than the spread of total misconception
scores. Also, discrimination indexes for each misconception were
estimated, and 9 of 11 misconceptions found to be around 0. That is, there
were no differences between students with high scores and students with
low scores with respect to the misconceptions they hold. In other words,
the sample was probably homogeneous with respect to misconceptions.
This may be the reason of such a low reliability.
Whereas the histogram of scores-3 was right-skewed, the histogram of
misconceptions-4 was similar to the normal distribution. That is, the
SECDT was difficult and most of the students had the mean misconception
scores. Item analysis using scores-3 also indicates the difficulty of the
SECDT because difficulty levels were between 0.016 and 0.492 with a mean
of 0.244. In addition, all the item-total correlations were quite over 0.20
except from item 2. It can be concluded from this result that item 2 can be
removed from the test because the misconception and the qualitative
conception which item 2 assess are assessed by other items on the SECDT.
Also, the discrimination index of misconception 10, which is also assessed
by item 2, was 0.40. That is, successful students seem to have this
misconception more than students with low scores. By removing item 2,
this problem may be overcome.

94
Difference between the mean misconception proportion of the one-tier
test and the proportion of the two-tier test was 12%. And, difference
between the mean misconception proportion of the two-tier test and the
proportion of the three-tier test was 5%. 11% of 12% was false positives and
remaining 1% was inconsistent student answers. Also, 5% was the mean
proportion of lack of knowledge. Although the misconception scores are
not reliable enough, these results indicate that three tier tests are more valid
than one-tier and two-tier tests for assessing student misconceptions.
Difference between the mean proportions of correct answers to the first
tiers and to the first two tiers was 17%. And, difference between the mean
proportions of correct answers to the first two tiers and to all the three tiers
was 6%. That is, 17% was the proportion of false positives and 6% was the
proportion of lack of knowledge. These results indicate that three-tier tests
are more valid than one-tier and two-tier tests for assessing students’
qualitative understanding.
Finally, 4 of 11 proportions of lack of knowledge about misconceptions
are over 5%, the proportion of M4 (Clashing Current Model) is the biggest.
These students selected the choices indicating a misconception on the first
two tiers; however, they were not confident about the correctness of them.
As a result, these incorrect answers were due to lack of knowledge rather
than misconceptions. As well as, proportions of lack of knowledge for
items 2, 4, 6, 7, 9 and 11 also attract attention. Items 2, 6, 7 and 11 assess
students’ qualitative understanding of current in parallel circuits. And,
items 4 and 9 assess students’ qualitative understanding of current in series
circuits. That is, students confess that they did not understand current in
series and parallel circuits although they gave correct answers for the first
two tiers.

95
5.3 Discussion of the Results
One important discussion is about the use of the factor analysis for
establishing content validity (Heller & Huffman, 1995; Hestenes & Halloun,
1995; Huffman & Heller, 1995). Hestenes and Halloun (1995) suggested
using successful students’ scores for factor analysis because their
conceptions are more coherent. Thus, they claimed to find better results. In
this study, misconceptions-4 was factor analyzed. Any factors were not
yielded, whereas some misconceptions were reported to be related in the
literature. For example, Shipstone et al. (1988) reported power supply as a
constant current source to be an example of local reasoning. Therefore, 50
successful students’ misconceptions were factor analyzed. At the end, 3
factors were yielded, but they could not be interpreted. Also, successful
students’ scores were factor analyzed, but Bartlett’s test of sphericity failed
to reject the null hypothesis that the correlation matrix is an identity matrix.
That is, factor analysis could not be conducted. Consequently, it can be said
that using successful students’ scores for factor analysis did not yield better
results in this study.
Hestenes and Halloun (1995) said that the concerns about the factor
analysis of the FCI are related to the content validity of the FCI. Instead of
having conducted a factor analysis, they had investigated the probabilities
of false positives and false negatives for establishing the content validity.
So, in this study, the proportions of false positives and false negatives were
estimated to be 17.47% and 10.82%, respectively, and these values are
evident enough for the validity of the SECDT according to the explanations
of Hestenes and Halloun (1955). In their explanations, they reported that
the probabilities of false negatives and false positives should be less than
10%. It can be fulfilled to minimize the probability of false negative by
producing powerful distracters. However, minimizing the probability of

96
false positives is not as easy as minimizing the probability of false negatives
because of some students who answer the questions on the test by chance.
Çataloğlu (2002) requested a positive correlation between students’
scores and students’ confidence levels to be evidence for validity.
Therefore, the correlation was investigated and found to be 0.508, a
significant value.
Linn (1986, as cited in Heller and Finley, 1992) suggested that students’
prior knowledge includes intuitive ideas, which are resistive to change, and
peripheral ideas, which are protective belt of intuitive ideas. That is,
students have some central ideas and some peripheral ideas to defend the
central intuitive ideas. Students readily change their peripheral ideas to
defend intuitive ideas. Briefly, student intuitive ideas are inconsistent. Also,
if student conceptions are consistent was discussed by Hestenes and
Halloun (1995), and Heller and Huffman (1995). Heller and Huffman (1995)
stated that there are two possibilities about the FCI. Student conceptions
are consistent, but the FCI does not measure; or, student conceptions are
inconsistent. In the same manner, inconsistency of student misconceptions
causes low reliability of misconceptions; or, the SECDT does not assess
misconceptions reliably. Additionally, it is known from extensive literature
that the reliability coefficient, 0.69, which was estimated by using sscores-3,
is an acceptable value for indicating a valid and reliable test to assess
students’ qualitative understanding; however, there is no any information
in the literature about what a reliability coefficient, which is estimated by
using misconception scores, must be at least to assess students’
misconceptions validly and reliably. Consequently, the reliability
coefficient, based on misconception scores, was 0.33, but if it validly and
reliably assesses student misconceptions is not known.
In addition, narrow spread of scores and homogeneity of the sample
may be the reason for low reliability coefficients (Marx, 1998). In this study,

97
spread of scores was larger than the spread of misconceptions. And,
students with high scores had as many misconceptions as students with
low scores had. That is, the sample was homogeneous with respect to the
misconceptions. These findings may be the reason of low reliability
coefficient.
Eryılmaz and Sürmeli (2002) estimated proportions of misconceptions
about heat and temperature in terms of the first tiers, first two tiers and all
three tiers. In average, they found 46% with the first tiers, 27% with the
first two tiers and 18% with all the tiers. Subtraction of 27% from 46%
yields 19%, which is the proportion of inconsistent student answers. And,
subtraction of 18% from 27% gives 9%. In this study, the proportion of
inconsistent student answers is 1%, and the proportion of lack of
knowledge is 5% as in the study of Eryılmaz and Sürmeli (2002). Eryılmaz
and Sürmeli (2002), and Griffard and Wandersee (2001) one-tier tests and
two-tier tests overestimate the proportions of misconceptions and correct
answers. Eryılmaz and Sürmeli (2002) also reported that three-tier tests
assess misconceptions more validly than one-tier or two-tier tests. Findings
of this study also support these conclusions.
5.4 Internal Validity of the Study
Internal validity is related to if an outcome observed in a study is
actually due to the independent variable of the study, or due to an
unexpected independent variable. Fraenkel and Wallen (1996, p. 383)
indicated four main threats to internal validity of survey research; (1)
mortality, (2) location, (3) instrumentation, and (4) instrument decay. And,
mortality was said to be a threat to internal validity of longitudinal survey
studies.

98
Location in which interviews were conducted and written
questionnaires were administered may affect the student responses, thus
threatening the internal validity. To control this threat during the
interviews, the same room at each school was used by paying special
attention to provide the interviewees with comfortable conditions. For
instance, all interviewees were supported with a comfortable seat, a desk,
and a silent and lightened room. For the administration of the open ended
questionnaire and the SECDT, students’ classrooms were used and the
conditions at each school were similar, that is, the classrooms had a
blackboard, seats and desks for students, a chair and a table for the teacher,
about the same wideness, the same heating conditions, etc.
Instrument decay was a threat while evaluating the open ended
questionnaire because it was long and there were 99 papers to evaluate,
that is, fatigue of the scorer was possible. In the purpose of controlling the
threat, evaluation of the papers was carried out by the same scorer and
student responses were categorized systematically.
Data collector characteristic was another threat during the interviews in
case of utilization of different interviewers. However, it was not the case
because the researcher conducted all the interviews on his own.
Another threat for the interviews was data collector bias because the
interviewer could lead student responses in the purpose of desired
outcomes from the interviews. For controlling it, a complete attention was
paid to avoid the use of leading questions. Also, student names were
questioned during the interviews and on the open-ended questionnaire but
the SECDT. However, it is believed that confidentiality was not a threat
because all the students and interviewees were informed about that
findings obtained from their answers would be used for only the purposes
of this study, and that anyone else apart from the researcher would not
know anything about their answers.

99
5.5 External Validity of the Study
The external validity of a study is determined by the extent to which the
results of the study can be generalized. There are two types of external
validity, population validity and ecological validity. Population validity is
related to the degree to which a sample represents the population of
interest. And, ecological validity is the degree to which results of a study
can be extended to other settings or conditions (Fraenkel & Wallen, 1996, p.
106).
Number of ninth grade students in Polatlı is below 1000 and the SECDT
was administered to 124 ninth grade students, that is, more than 10% of the
accessible population was included in the sample of the SECDT from three
different types of schools. Consequently, the outcomes of this study can be
undoubtedly generalized to the accessible population, which covers all
ninth grade students in Polatlı.
The SECDT was administered at each school in conventional classrooms
among which there were no many differences. However, it is obvious that
there are lots of variables determining subject characteristics within a
settlement such as region, ethnicity, educational facilities, socioeconomic
status, father’s occupation, mother occupation etc. And, those variables are
beyond the scope of this study. Therefore, the need for considerable caution
must be emphasized in case someone wants to generalize the findings of
this study to another population.
5.6 Implications of the Study
Several important implications have arisen from the findings of this
study and the related studies in the literature.

100
During the interviews, when interviewees were requested to light up a
bulb using several pieces of wire and a battery, they commonly said that
they had done it in laboratory at elementary school. However, they mostly
could not succeed in lighting up the bulb, and they explained why they
could not by saying that their teacher had demonstrated the required
connection but they could not remember how it had been. That is to say,
students had not been involved actively in the laboratory activity, and so
they could not remember what they had seen. Hence, teachers should
supply their students with the involvement of them in laboratory activities
rather than demonstrating the experiments.
Moreover, during the interviews, students complained about that their
teachers had not solved such qualitative questions in their classes. Also, on
the papers of open ended questionnaire, it was observed that students tried
to solve the questions by means of some computations. In addition to these,
low achievement on the SECDT indicates students’ inability to reason
qualitatively. Therefore, physics teachers should also pay attention on
qualitative reasoning rather than only quantitative reasoning.
It was also observed that students could not distinguish between some
concepts such as voltage, current, power, energy, etc. because they were
using these concepts interchangeably. Certainly, power supply as a
constant current source is a result of this issue. Consequently, teachers
should place more importance on teaching effectively such concepts so that
students are able to grasp and overcome their inability to distinguish
between them.
Results show that the SECDT can be validly and reliably used for
assessing ninth grade students’ qualitative understanding of simple electric
circuits. Therefore, teachers can use the SECDT for formative evaluation.
This will give teachers feedback about if instruction needs modification, or
if any individual or group remedial works are needed.

101
Reliability of the SECDT’s misconception scores was low. Even so, the
SECDT can be used for observing how widespread misconceptions about
simple electric circuits are because the SECDT was developed in the light of
the literature review and the findings of the interviews and the open-ended
questionnaire.
It was shown that three-tier tests assess student conceptions and
misconceptions more validly than one-tier or two-tier tests. Therefore,
researchers should prefer three-tier tests in their studies.
As well as, proportions of lack of knowledge showed that students did
not understand current in series and parallel circuits. So, students must be
provided with some more attempts for making them understand it.
Finally, quite commonness of clashing current model, short circuit
misconception, and local reasoning attract attention. So, teachers should
attempt more to overcome these misconceptions.
5.7 Recommendations for Further Research
There are several recommendations offered by this study. They are
listed below.
1. The validity of the SECDT can be extended by drawing a quite larger
sample. Because, there were some issues about the ecological validity of
the study although there was no any issue about the population
validity. Also, a larger sample will indeed increase the accuracy of the
statistical analysis.
2. Consistency of student conceptions and misconceptions can be
investigated. The reliability coefficient of the scores was high enough,
whereas the reliability of misconception scores was low. This reveals
the question; What if student conceptions are more consistent than
student misconceptions conceptions?

102
3. The SECDT can be used as an instrument in the purposes of various
research studies such as for measuring the effectiveness of an
instructional method. If an instructional method provides students with
qualitative understanding of simple electric circuits can be investigated
because the SECDT is a valid and reliable three-tier test for assessing
students’ qualitative understanding of simple electric circuits.
4. What a reliability coefficient based on misconception scores must be at
least so as to indicate a valid and reliable misconception test is not
known. Hence, a research study can be done for finding answer for this
question.

103
REFERENCES
Aubrecht, G. J., & Aubrecht, J. D. (1983). Constructing objective tests.
Amereican Journal of Physics 51(7), 613-620.
Bauman, R. P., & Adams, S. (1990). Misunderstanding of electric current.
The Physics Teacher, 28(5), 334.
Beichner, R. J. (1994). Testing student interpretation of kinematics graphs.
American Journal of Physics, 62(8), 750-762.
Börklü, A. (n.d.). ÖSS-ÖYS fizik. Ankara: Final Yayınları.
Çataloğlu, E. (2002) Development and validation of an achievement test in
introductory quantum mechanics: The quantum mechanics visualization
instrument (QMVI) ,
http://etda.libraries.psu.edu/theses/approved/WorldWideIndex/ETD-
145/, Last accessed date July 30, 2005
Chambers, S. K., & Andre, T. (1997). Gender, prior knowledge, interest, and
experience in electricity and conceptual change text manipulations in
learning about direct current. Journal of Research in Science Teaching
34(2), 107-123.
Chen, C. C., Lin, H. S., & Lin, M. L. (2002). Developing a two-tier
diagnostic instrument to assess high school students’ understanding-the
formation of images by a plane mirror. Proceedings of National Science

104
Council, 12(3),106-121.
Cohen, R., Eylon, B., & Ganiel, U. (1983). Potential difference and current
in simple electric circuits: A study of student’s concepts. American
Journal of Physics, 51(5), 407-412.
Costello, A. B., & Osborne, J. W. (2005). Best practices in exploratory factor
analysis: Four recommendations for getting the most from your
analysis. Practical Assessment, Research & Evaluation, 10(7).
Driver, R. (1989). Students’ conceptions and the learning of science.
International Journal of Science Education, 11, 481-490.
Dupin, J. –J., & Johsua, S. (1987). Conceptions of French pupils concerning
electric circuits: Structure and evolution. Journal of Research in Science
Teaching, 24(9), 791-806.
Engelhardt, P. V., & Beichner, R. J. (2004). Students’ understanding of
direct current resistive electrical circuits. American Journal of Physics,
72(1), 98-115.
Eryılmaz, A., & Sürmeli, E. (2002). Üç-aşamalı sorularla öğrencilerin ısı ve
sıcaklık konularındaki kavram yanılgılarının ölçülmesi,
http://www.fedu.metu.edu.tr/ufbmek-5/, Last accessed date May 29,
2004
Field, A. (2004). Factor analysis using SPSS,
http://www.sussex.ac.uk/Users/andyf/teaching/rm2/factor.pdf, Last
accessed date July 26, 2005

105
Fraenkel, J. R., & Wallen, N. E. (1996). How to design and evaluate research in
education. McGraw-Hill, Inc.
Fredette, N., & Lochhead, J. (1980). Student conceptions of simple circuits.
The Physics Teacher, 18, 194-198.
Fredette, N. H., & Clement, J. J. (1981). Student misconceptions of an
electric circuit: what do they mean? Journal of College Science
Teaching, 10, 280-285.
Griffard, P. B., & Wandersee, J. H. (2001). The two-tier instrument on
photosynthesis: what does it diagnose? International Journal of Science
Education, 23(10), 1039-1052.
Gronlund, N. E., & Linn, R. L. (1990). Measurement and evaluation
inteaching. New York: Mac Millian Publishing.
Halloun, I. A., & Hestenes, D. (1985). The initial knowledge state of
college physics students. American Journal of Physics, 53(11), 1043-
1048.
Hammer, D. (1996). More than misconceptions: Multiple perspectives on
student knowledge and reasoning, and an appropriate role for
education research. American Journal of Physics, 64(10), 1316-1325.
Heller, P. M., & Finley, F. N. (1992). Variable uses of alternative
conceptions: A case study in current electricity. Journal of Research in
Science Teaching, 29(3), 259-275.
Heller, P. & Huffman, D. (1995). Interpreting the force concept inventory.

106
The Physics Teacher, 33, 503-511.
Hestenes, D., & Halloun, I. (1995). Interpreting the Force Concept
Inventory. The Physics Teacher, 33, 502-506.
Hestenes, D., & Wells, M. (1992). A mechanics baseline test. The Physics
Teacher, 30, 159-166.
Hestenes, D., Wells, M., & Swackhamer, G. (1992). Force Concept
Inventory. The Physics Teacher, 30, 141-158.
Hinkle, D. E., Wiersma, W., & Jurs, S. G. (1988). Applied statistics for the
behavioral sciences. Boston: Houghton Mifflin Company
Huffman, D., & Heller, P. (1995). What does the Force Concept Inventory
actually measure? The Physics Teacher, 33, 138-143.
Kalyoncu, C., & Çakmak, Y. (2000). Fizik lise 1. Istanbul: Milli Eğitim
Basımevi.
Marx, J. D. (1998). Creation of diagnostic exam for introductory,
undergraduate electricity and magnetism. Dissertation Abstracts
International (UMI No. 9908686)
McDermott, L. C. (1991). Millikan Lecture 1990: What we teach and what
is learned-Closing the gap. American Journal of Physics, 59(4), 301-315.
McDermott, L. C., & Shaffer, P. S. (1992). Research as a guide for
curriculum development: An example from introductory electricity.
Part I: Investigation of student understanding. American Journal of
Physics, 60(11), 994-1003.

107
Odom, A. L., & Barrow, L. H. (1995). Development and application of a
two-tier diagnostic test measuring college biology students’
understanding of diffusion and osmosis after a course of instruction.
Journal of Research in Science Teaching, 32(1), 45-61.
Online Dictionary, http://dict.die.net, Last accessed date September 23,
2005.
Osborne, R. J., & Gilbert, J. K. (1980). A technique for exploring students’
views of the world. Physics Education, 15, 376-379.
Schwab, A. J. (2005). Solving problems in SPSS,
http://www.utexas.edu/courses/schwab/, Last accessed date July 31,
2005.
Sencar, S., & Eryılmaz, A. (2004). Factors mediating the effect of gender on
ninth-grade Turkish students’ misconceptions concerning electric
circuits. Journal of Research in Science Teaching, 41(6), 603-616.
Shipstone, D. (1988). Pupils’ understanding of simple electrical circuits.
Physics Education, 23, 92-96.
Shipstone, D. M., Rhöneck, C.v., Jung, W., Kärrqvist, C., Dupin, J. -J.,
Johsua, S., & Licht,P. (1988).A study of students’ understanding of
electricity in five European countries. International Journal of Science
Education, 10(3), 303-316.
Tamir, P. (1990). Justifying the selection of answers in multiple choice
items. International Journal of Science Education, 12(5), 563-573.

108
Tan, K. C. D., Goh, N. K., Chia, L. S., & Treagust, D. F. (2002).
Development and application of a two-tier multiplecoice diagnostic
instrument to assess high school students’ understanding of inorganic
chemistry qualitative analysis. Journal of Research in Science Teaching,
39(4), 283-301.
Tsai, C.-C. & Chou, C. (2002). Diagnosing students’ alternative conceptions
in science. Journal of Computer Assisted Learning, 18, 157-165.
Tytler, R. (2002). Teaching for understandings insights: student conception
research, and changing views of learning. Australian Science Teachers
Journal, 48(3), 14-21.

109
APPENDIX A
INTEREST AND EXPERIENCE QUESTIONNAIRE ABOUT ELECTRICITY

110

111
APPENDIX B
INTERVIEW CARD
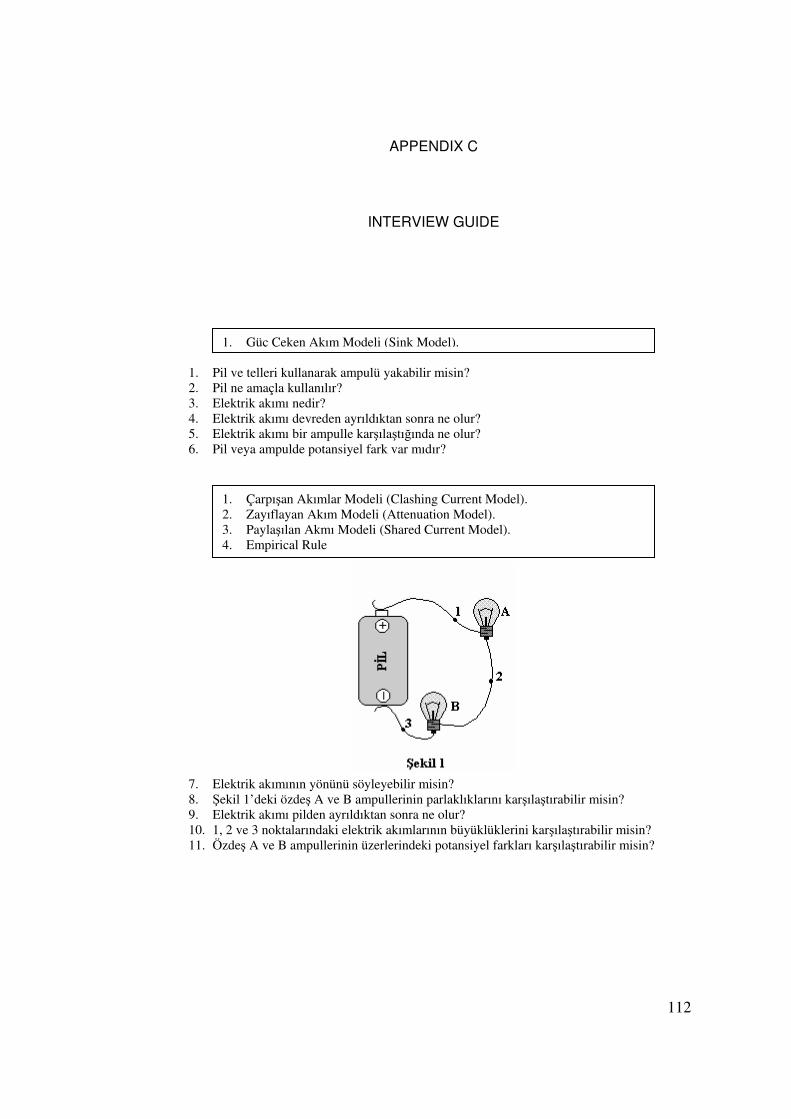
112
1. Güç Çeken Akım Modeli (Sink Model).
1. Çarpışan Akımlar Modeli (Clashing Current Model). 2. Zayıflayan Akım Modeli (Attenuation Model). 3. Paylaşılan Akmı Modeli (Shared Current Model). 4. Empirical Rule
APPENDIX C
INTERVIEW GUIDE
1. Pil ve telleri kullanarak ampulü yakabilir misin? 2. Pil ne amaçla kullanılır? 3. Elektrik akımı nedir? 4. Elektrik akımı devreden ayrıldıktan sonra ne olur? 5. Elektrik akımı bir ampulle karşılaştığında ne olur? 6. Pil veya ampulde potansiyel fark var mıdır? 7. Elektrik akımının yönünü söyleyebilir misin? 8. Şekil 1’deki özdeş A ve B ampullerinin parlaklıklarını karşılaştırabilir misin? 9. Elektrik akımı pilden ayrıldıktan sonra ne olur? 10. 1, 2 ve 3 noktalarındaki elektrik akımlarının büyüklüklerini karşılaştırabilir misin? 11. Özdeş A ve B ampullerinin üzerlerindeki potansiyel farkları karşılaştırabilir misin?

113
1. Sırasal Düşünce (Sequential Reasoning).
1. Güç Kaynağının Sabit Akım Kaynağı Olarak Algılanması (Battery as a Constant Current Source)
2. Kısa Devre Önyargısı Modeli (Short Circuit Preconception Model). 3. Bölgesel Düşünce (Local Reasoning). 4. Çarpışan Akımlar Modeli (Clashing Current Model). 5. Zayıflayan Akım Modeli (Attenuation Model). 6. Paylaşılan Akmı Modeli (Shared Current Model).
12. Elektrik akımının yönünü söyleyebilir misin? 13. R1 direncinin yerine daha küçük bir direnç bağlarsak, A ampulünün parlaklığında
değişiklik olur mu? 14. R2 direncinin yerine daha küçük bir direnç bağlarsak, A ampulünün parlaklığında
değişiklik olur mu?
15. Şekil 1 ve Şekil 2’deki 1 noktalarındaki elektrik akımlarının büyüklüklerini
karşılaştırabilir misin? 16. A ampulünün Şekil 1 ve Şekil 2’deki parlaklıklarını karşılaştırabilir misin? 17. Şekil 2’de A ve B ampullerinin parlaklıklarını karşılaştırabilir misin? 18. Şekil 2’de 1, 2, 3 ve 4 noktalarındaki elektrik akımlarını karşılaştırabilir misin? 19. A ve B lambalarının üzerlerindeki potansiyel farkları karşılaştırabilir misin? 20. A lambasının Şekil 2 ve 3’deki parlaklıklarını karşılaştırabilir misin?
1. Bölgesel Düşünce 2. Paralel Devrelerde Eşdeğer Direnç Önyargısı 3. Güç Kaynağının Sabit Akım Kaynağı Olarak Algılanması 4. Zayıflayan Akım Modeli

114
5. Bölgesel Düşünce
21. Elektrik akımının yönünü söyleyebilir misin? 22. 1, 2, 3 ve 4 noktalarındaki elektrik akımlarını karşılaştırabilir misin? 23. S anahtarı kapatılırsa, A ampulünün parlaklığında değişiklik olur mu? 24. Anahtar kapatıldıktan sonra, 1,2,3 ve 4 noktalarındaki akımları karşılaştırabilir misin? 25. Anahtar kapatıldığında toplam direnç değişir mi? 26. Şekilde i1, i2 ve i3 akımları kaç amperdir?

115
APPENDIX D
OPEN-ENDED QUESTIONNAIRE

116
SORULAR
1) Şekil 1’de gösterilen devredeki ampul ışık verir mi? Cevabınızın sebebini açıklayınız.
2) Şekil 2’de verilen devre parçasında, K-L uçları arasındaki eşdeğer
direnç 10 ohm’dur. R1 ve R2 dirençlerinin büyüklüklerini eşdeğer direncin büyüklüğü ile karşılaştırınız? Cevabınızın sebebini açıklayınız.
3) Şekil 3’deki elektrik devresinde ana koldaki akım 1,2 A olarak
verilmiştir. Buna göre, i1, i2 ve i3 akımlarının büyüklüklerini yazınız. Cevabınızın sebebini açıklayınız.
i1 = …….. A i2 = …….. A i3 = …….. A.

117
4) Şekil 4 ve Şekil 5’deki 1 noktalarından geçen elektrik akımlarının
büyüklüklerini karşılaştırınız? Cevabınızın sebebini açıklayınız. 5)
a. Şekil 5’de 1, 2 ve 3 noktalarındaki akımların büyüklüklerini karşılaştırınız? Cevabınızın sebebini açıklayınız.
b. Şekil 5’de A ve B ampullerinin parlaklıklarını karşılaştırınız. Cevabınızın sebebini açıklayınız.
Şekil 4’de verilen bir elektrik devresine, Şekil 5’de gösterildiği gibi bir B ampulü ekleniyor. 4 ve 5. soruları bu bilgiye göre cevaplandırınız.
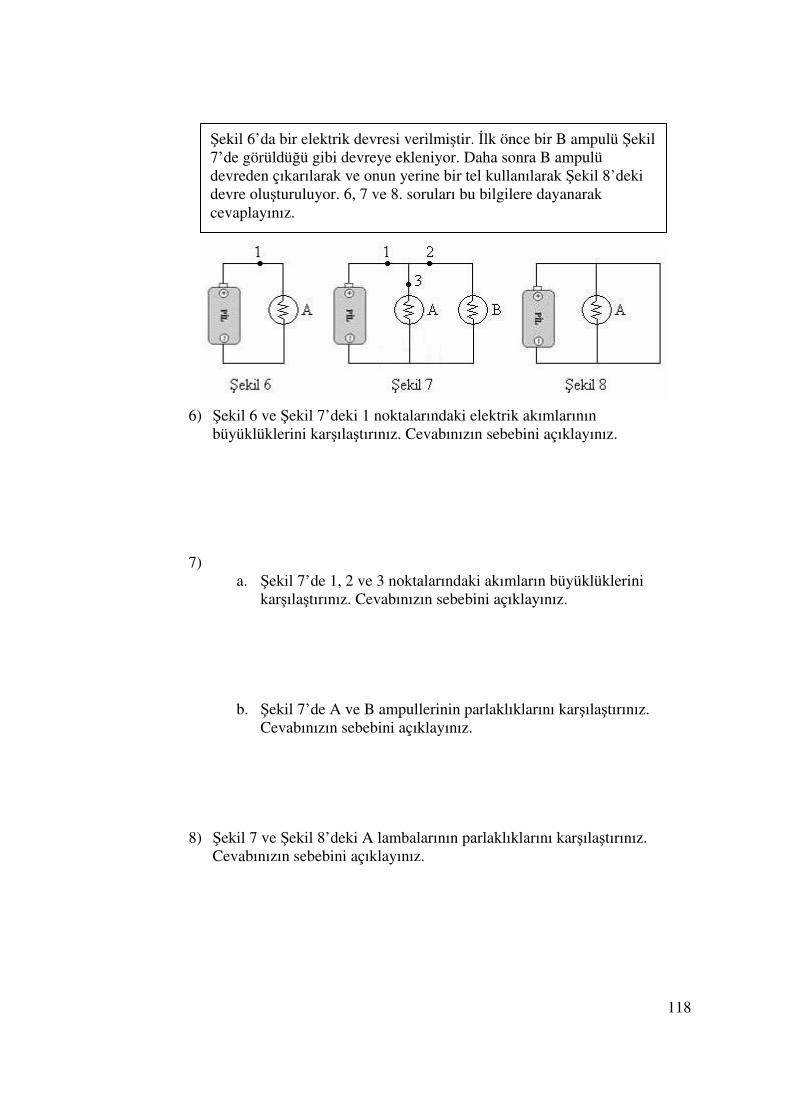
118
6) Şekil 6 ve Şekil 7’deki 1 noktalarındaki elektrik akımlarının
büyüklüklerini karşılaştırınız. Cevabınızın sebebini açıklayınız. 7)
a. Şekil 7’de 1, 2 ve 3 noktalarındaki akımların büyüklüklerini karşılaştırınız. Cevabınızın sebebini açıklayınız.
b. Şekil 7’de A ve B ampullerinin parlaklıklarını karşılaştırınız. Cevabınızın sebebini açıklayınız.
8) Şekil 7 ve Şekil 8’deki A lambalarının parlaklıklarını karşılaştırınız.
Cevabınızın sebebini açıklayınız.
Şekil 6’da bir elektrik devresi verilmiştir. İlk önce bir B ampulü Şekil 7’de görüldüğü gibi devreye ekleniyor. Daha sonra B ampulü devreden çıkarılarak ve onun yerine bir tel kullanılarak Şekil 8’deki devre oluşturuluyor. 6, 7 ve 8. soruları bu bilgilere dayanarak cevaplayınız.

119
9) Şekil 9’da verilen elektrik devresinde ampul ışık vermektedir. Ampulün ışık vermesini sağlayan nedenleri açıklayınız?
10) Şekil 10’daki devrede birbirinden bağımsız iki durum varsayınız. İlk
durumda sadece 10 ohm’luk R1 direncinin yerine 20 ohm’luk bir direnç bağlanıyor. İkinci durumda sadece 10 ohm’luk R2 direncinin yerine 20 ohm’luk bir direnç bağlanıyor. İlk ve ikinci durumlarda ampulün parlaklığında değişiklik olur mu? Cevabınızın sebebini açıklayınız.
İlk Durum: İkinci Durum:
11) R1 ve R2 dirençleri Şekil 11 ve Şekil 12’de gösterildiği gibi
bağlanmıştır. Buna göre K-L uçları arasındaki RKL eşdeğer direnci ile M-N uçları arasındaki RMN eşdeğer direncini karşılaştırınız. Cevabınızın sebebini açıklayınız.

120
12) Şekil 13’deki ampul ışık verir mi? Cevabınızın sebebini açıklayınız. 13. Şekil 14’de verilen devre parçasında elektrik akımının yönü ok ile
gösteriliyor. Buna göre, 1, 2 ve 3 noktalarındaki akımların büyüklüklerini karşılaştırınız. Cevabınızın sebebini açıklayınız.
14. Şekil 15’de gösterilen devrede A ve B ampullerinin parlaklıklarını
karşılaştırınız. Cevabınızın sebebini açıklayınız.

121
APPENDIX E
CATEGORIES BASED ON THE OPEN-ENDED QUESTIONNAIRE
Question 1
Category 1 (A piece of wire must be connected from the negative terminal of the battery to the upper
metallic side of the bulb so that current passes through the bulb)
1. Işık vermez. Çünkü ampul pilin – kutbuna bağlı değil.
2. Çalışmaz. Çünkü sadece 1 ucuna bağlıdır.
3. Ampul ışık vermez. Çünkü pilin iki ucunun da ampule bağlanması gerekir.
4. Devredeki ampul ışık vermez. Çünkü ampul sadece pozitif tarafa bağlanmış. Ampulün ışık
vermesi için negatif tarafa da bağlanması gerekir.
5. Vermez, çünkü bağlantı yanlıştır.
6. Işık vermez. Çünkü bağlantı yanlış yapılmış.
7. Işık vermez. Çünkü tek bir uçtan bağlantı yapılmış.
8. Şekildeki ampul vermez. Çünkü – kutbundan ampule enerji gelmediği için
9. Işık vermez Çünkü iki kutba da bağlı değil.
10. Vermez. Çünkü ampule bağlı olan telin – tarafına bağlı olmadığı için.
11. Işık vermez. Çünkü + ve – yükler birbirini çektiği için vermez.
12. Vermez çünkü katot (-) yükü ucuna bağlı yapmamışlar. Çünkü ışığın yanması için (+) ve (-)
yüklerin bağlı olması gerekir.
13. Vermez, çünkü devredeki pilin sadece (+) kutbuna tel bağlandığı ve (-) kutbu boş olduğu için
devreden akım geçmez. Bunun için pil ışık vermez.
14. Pilin altından elektrik yükü üst tarafa verilseydi, ampul ışık verirdi. Pilin sadece üzerinden akım
verildiği için ampul ışık vermez.
15. Hayır vermez. Çünkü tel sadece pilin + ucuna bağlıdır. Ampulün yanması için pilin ampulün + ve
– ucuna bağlı olması gerekir.
16. Vermez. Elektrik devresi sadece + yüke bağlandığı için ışık vermez.
17. Işık vermez .Çünkü sadece (+) kutba bağlı olduğu için. Eğer 2 kutba da bağlı olsaydı o zaman ışık
verirdi.
18. Işık vermez çünkü sadece kablo + ucuna deymiş. Oysa + ucunu da deymesi gerekmektedir. Diye
düşünüyorum
19. Devrede bulunan ampul ışık vermez. Nedeni ise sadece + kutbu lambaya bağlı.
20. Vermez Çünkü pilin diğer bir kablosu yok

122
21. Işık vermez çünkü – yüklü tarafına değmemiştir. + yüklü tarafıyla da yanmaz. Yanması için her iki
uca da iletken telin değmesi lazımdır.
22. Vermez: Çünkü lambanın diğer kablosu olmadığı için ışık vermez. Eğer ki diğer kablo da olsaydı
ışık verirdi.
23. Işık vermez. Çünkü + yüklü kola dokundurulurken – yüklü kola dokundurulmamıştır. – yüklü
kola dokundurulsaydı ampul yanar.
24. Aydınlatmaz. Çünkü + yüklü kola dokundurulurken – yüklü kola dokundurulmamış. Ondan
ampul ışık vermez.
25. Vermez. Çünkü, fakat, lakin, ama sebebi ampul + ya bağlı olduğu için ışık vermez.
26. Hayır. Çünkü pilin + tarafıyla bağlanmaktadır. Eksi tarafın da bağlı olması gerekir.
27. Işık vermez. Çünkü – kutbunda iletken tel yoktur.
28. Işık vermez.Çünkü – kutbunda iletken tel yoktur. Ve oradan akım çıkmaz.
29. Vermez Çünkü lambanın diğer kablosu – değmemiş. Tek uçla ampul yanmaz
30. Üretecin – kutbuna da bağlanmadığı için akım geçmez
31. Üretecin – kutbuna da bağlanmadığı için akım geçmez
32. Üretecin – kutbuna da bağlanmadığı için akım geçmez
33. Üretecin – kutbuna da bağlanmadığı için akım geçmez
34. Üretecin – kutbuna da bağlı olmadığı için ampul ışık vermez
35. Üretecin – kutbuna da bağlanmadığı için akım geçmez
36. Üretecin – kutbuna da bağlanmadığı için akım geçmez
37. Ampulün yanması için elektronların hareket ederek akım oluşturması gerekir. Normalde
elektronların hareket edebilmesi için lambalar pilin + ve – uçlarının arasına bağlanır. Ancak böyle
bir şekilde yanar. Verilen şekildeki lamba yanmaz
38. Ampulün yanması için elektronların hareket ederek akım oluşturması gerekir. Normalde
elektronların hareket edebilmesi için lambalar pilin + ve – uçlarının arasına bağlanır. Ancak böyle
bir şekilde yanar. Verilen şekildeki lamba yanmaz
39. Üretecin – kutbuna da bağlanmadığı için akım geçmez
40. Üretecin – kutbuna da bağlanmadığı için akım geçmez. Lamba yanmaz
41. Üretecin – kutbuna da bağlanmadığı için akım geçmez
42. Ampul ışık vermez. Çünkü ampulün ışık vermesi için ampulün hem (-) eksi hem de (+) artı
kutuplara bağlanması gerekir. Böylelikle hem ampul yanar fakat pil de yavaş yavaş nötrleşir ve
enerji veremez.
43. Yanmaz. Çünkü ampulün üretecin hem + hem de- kutbuna bağlanması gerekir
44. Ampul ışık vermez. Devrenin tamamlanması gerekir. Ampulün birde – yöne tel uzanmak
45. Üretecin – kutbuna da bağlanmadığı için akım geçmez
46. Vermez Çünkü sadece + ya bağlanmış
47. Işık vermez. Çünkü – ucuna bağlanması gerekir
48. Işık vermez. Çünkü ampul pilin sadece + ucuna bağlanmış
49. Işık vermez. Pilin – ucuna bağlı değil (telin teki)
50. Işık vermez Çünkü ampul pilin bir kutbuna değiyor

123
51. Işık vermez Çünkü ampul direkt pile ve + ucuna bağlanmıştır
52. Işık vermez ampul – uca bağlanmamış
53. Vermez nedeni: ampul – uca bağlanmamıştır
54. Vermez. Çünkü ampul – uca bağlanmamış
55. Vermez. Çünkü – uca bağlanmamış
56. Vermez Çünkü – yüklü devre bağlanmamış
57. Işık vermez. Çünkü – uca bağlı kablo olmadığı için devre tamamlanmamıştır
58. Vermez. Çünkü ampul sadece + uca iletken telle bağlanmış. Ampulün yanması için – ve + uçlara
tel bağlanıp, ampule bağlanmalı
59. Işık vermez. Çünkü – yüklü olmadığı için
60. Vermez. Çünkü akım – kutuptan geçmiyor
61. Işık vermez. Çünkü sadece + uca bağlıdır
62. Işık vermez. Çünkü ampulün yanması için bir + kutba bir de – kutba bağlı olması gerekir. Burada
sadece + gruba bağlı olduğundan ışık vermez
63. Işık vermez. Çünkü hem + hem – bağlanmalı. Ampule bağlı bir tel de –‘ ye bağlanmalı
64. Vermez. Çünkü akım +’ dan –‘ ye doğrudur. Ama ampule + uç bağlandığından ışık vermez. Ayrıca
telin bir ucunun – olması gerekirdi.
65. Işık vermez. Çünkü telin diğer ucu pilin – ucuna bağlı değildir
66. Vermez: Çünkü – uca da bağlanmalı
67. Işık vermez.Çünkü – yüke de bağlanmamış
68. Işık vermez. Çünkü hem + hem de – nin bağlanması gerekir.
69. Ampul ışık vermez. Çünkü – yükle bağlanmamıştır.
70. Hayır ışık vermez. Lamba sadece + uca bağlı. Dolayısıyla elektrik akımı yoktur. Akım olması için
her iki uca bağlanması gerekir.
71. Vermez. Çünkü ampulün kablosu pilin hem başına hem de altına takılması gerekir.
72. Vermez çünkü akım yok
73. Vermez. Çünkü – uçtan tel çıkmamış. Devreden akım kesilmiş. Akım tamamlanmamış. Tek uç
kullanılmış.
74. Yanmaz Çünkü ampule bağlanan + olduğu için yanmaz yanması için + ve - bağlanmalı Şu şekilde
olmalı
75. Işık vermez çünkü doğru bağlanmamıştır.
76. Işık vermez. Çünkü bağlantı yanlıştır. Ayrıca ampulü açacak bir anahtar yoktur.

124
77. Işık vermez tek olarak + kutuptan ışık vermez (-) kutbunun da kabloyla ampulü sarmak gerek
ancak (+) ve (-) kutupta kablo olması gerek
78. Işık vermez. Ampulün ucu sadece + kısmına değdiriliyor. Ampulün + kısmının üzerine kablosu –
kısmına değdirilmelidir.
Category 2 (The battery and the bulb are in contact)
1. Işık verir. Çünkü pozitif ucuna takılıdır.
2. Şekilde ampul ışık verir. Çünkü; artı ve eksi işaretleriyle bunları anlaya biriz. Artı olan yeri ışığa
iletir. Eksi olan yeri iletmez yani yakmaz. Çünkü eksile artı birbirini çeker. Bu sayede ampul yanar.
3. Ampul ışık verir. Çünkü elektrik bağlanmıştır.
4. Verir. Sebebi çünkü pilin + yerine ampul bağlanmıştır bu yüzden devredeki ampul ışık verir.
5. Işık verir, çünkü pil takılı olduğu için ışık verir.
6. Evet ışık verir. Çünkü pile bağlıdır. Pilden “+” yük alarak ampulün ışık vermesini sağlar.
7. Verir. Çünkü ampul + yüklü pile bağlı olduğu için pil ışık verir
8. Pil zayıfsa yanmaz. Değilse yanar.
9. Evet. Artı yükten çıkan akım lambayı yakabilir
10. Evet. Artı yükten çıkan akım lambayı yakabilir
11. Ampul ışık verir. Çünkü – yükler +’yı çeker. Bu devrede de – ve + yükler olduğu için birbirlerine
bağlı yani pilin uçları birbirlerine değdiği zaman ışık yanar
Category 3 (The positive terminal of a battery can light up a bulb, but not the negative terminal)
1. Işık verir. Işık vermesinin sebebi de lamba + yüke bağlıdır. – yüke bağlı olaydı ışk vermezdi.
2. Işık verir. Çünkü lambayı artıya bağladığı için lambada ışık verir. Lambayı – ye bağlarsak lamba
ışık vermez.
Category 4 (The negative terminal of a battery produces electricity)
1. Hayır vermez. Çünkü – kutbundaki elektronlar hareket etmez.
2. Üretici – dir. Akım geçmez. Bu yüzden ışık vermez
3. Üretici – dir. Akım geçmez. Bu yüzden ışık vermez
4. Üretici – dir. Akım geçmez. Bu yüzden ışık vermez
Category 5 (A wire must be connected from the negative terminal of the battery to the upper metallic
side of the bulb so that “+” and “-” charges meet in the bulb)
1. Işık vermez. Çünkü lambanın yanması için hem + hem de – yükler gerekir. Şekildeki ampule
sadece + yük bağlı.
2. Hayır ışık vermez. Çünkü +, - uçlarından ampule elektrik verilmesi lazım. Sadece + yük ışık
vermez. + uçtaki akımın – uçtan akması gerekir

125
Category 6 (Deficient or not meaningful)
1. Lamba ışık verir. Sebebi de +, - durumundaysa ışık verir.
2. Ampul ışık vermez. Çünkü devreden biri negatif olduğu için.
Question 2
None of categories was revealed.
Question 3
Category 1 (The current in the branch leaving the battery divides into other branches in such a way that
the same amount of current passes through each bulb because three identical bulbs are in parallel
combination)
1. 0.4, 0.4, 0.4. Çünkü 3i = 1.2 ise i = 0.4
2. 0.4, 0.4, 0.4. Çünkü 3i = 1.2 ise i = 0.4
3. 0.4, 0.4, 0.4. Paralel kollardaki akımın toplamı seri kollardaki akıma eşittir. Onun için 1.2 A : 3
4. 0.4, 0.4, 0.4
5. 0.4, 0.4, 0.4
6. 0.4, 0.4, 0.4. Paralel devrelerde ana koldan geçen akım tüm dirençlerden geçen akımların
toplamıyla bulunur. 0.4 x 3 =1.2 A
Category2 (After the current divides equally into two branches at the first junction, the current again
divides equally into two branches at the second junction)
1. 0.6, 0.3, 0.3
2. 0.6, 0.3, 0.3
3. 0.6, 0.3, 0.3 i3 ve i2 toplamı i1 i verir.
4. 0.6, 0.3, 0.3
5. 0.6, 0.3, 0.3
6. 0.6, 0.3, 0.3
7. 0.6, 0.3, 0.3 Devre paralel olduğundan dolayı ana koldan geçen akım paralel kollara gelince kaç
tane kablo varsa ona göre eşit bir şekilde ayrılacak. Yukarıdaki şekilde göstermiş olduğum gibi her
paralel kabloda akım bölünmüştür
8. 0.6, 0.3, 0.3
9. 0.6, 0.3, 0.3 . i1, i2=i3 i’ye paralel olarak bağlıdır
10. 0.6, 0.3, 0.3. i1 = 0.6 olur. Çünkü 1.2 iki kola ayrılmış. i2 ve i3 0.3 olur. Çünkü 0.6’da iki kola ayrılır.
11. 0.6, 0.3, 0.3
12. 0.6, 0.3, 0.3. Akım paralel olarak dağılmış ikiye ayrılan akımda i1 =akımın yarısını (0.6) A almış,
diğer yarı da kendi aralarında ikiye ayrılmış ve 0.6 / 2 = i3, i2 = 0.3 A almıştır.
13. 0.6, 0.3, 0.3. i akımı 1.2 A şiddetiyle geçerken iki kola ayrılır. Bu nedenle i1 = 1.2 / 2=0.6 olur. Diğer
kolda iki kola ayrıldığından yine ikiye böleriz. i3=i2=0.6/2=0.3 olur.
14. 0.6, 0.3, 0.3

126
15. 0.6, 0.3, 0.3
16. 0.6, 0.3, 0.3 Ana kol akımı ilk önce ikiye ayrılır. Daha sonra üstteki telden 2’ye ayrılır.
17. 0.6, 0.3, 0.3
18. 0.6, 0.3, 0.3 Akım yarı yarıya paylaşılır paralel devrelerde
19. 0.6, 0.3, 0.3. Çünkü akım ikiye ayrılır. İ1 akımın yarısını alır. Kalan akımı ise i2, i3 paralel olduğu
için paylaşırlar.
20. 0.6, 0.3, 0.3
21. 0.6, 0.3, 0.3. i2 ve i3 paralel bağlıdır. İ1’de hepsine paralel bağlıdır.
22. 0.6, 0.3, 0.3.
23. 0.6, 0.3, 0.3
24. 0.6, 0.3, 0.3
Category 3 (The further away the branch is from the battery, the smaller the amount of the current)
1. i1 > i2 > i3
2. i1 > i2 > i3
3. i1 > i2 > i3 ve 0.9, 0.6, 0.3. Çünkü yukarıya çıkıldıkça akım gücü azalır. Yoğunluk ana koldadır
Category 4 (Deficient or not meaningful)
1. 0.5, 0.4, 9.3
2. 0.5, 0.4, 9.3
3. 4.2, 4.2, 4.2. Çünkü 3+1.2=4.2 (3 ayrı kol olduğu için)
4. 1.2, 2.6, 3.6. Çünkü hepsinin çarpımı
5. 0.6, 0.4, 0.2.
6. 3.2, 2.1, 2.1
7. 5.6, 2.8, 2.8
8. 11, 48, 96
9. 2.4, 2.4, 2.4
10. 0.4, 0.2, 0
11. 1.2, 1.1, 1
12. 4.2, 6.4, 8.4
13. i2=i3<i1, i2+i3=i1, 3i=1.2, i=0.4 A. Bundan dolayı 0.8,.0.4, 0.4
14. i2=i3<i1, i2+i3=i1, 3i=1.2, i=0.4 A. Bundan dolayı 0.8,.0.4, 0.4
15. i2=i3<i1, i2+i3=i1, 3i=1.2, i=0.4 A. Bundan dolayı 0.8,.0.4, 0.4
16. 0.8,.0.4, 0.4
17. 0.8,.0.4, 0.4
18. 0.8,.0.4, 0.4
19. i2=i3<i1, i2+i3=i1, 3i=1.2, i=0.4 A. Bundan dolayı 0.8,.0.4, 0.4
20. i2=i3<i1, i2+i3=i1, 3i=1.2, i=0.4 A. Bundan dolayı 0.8,.0.4, 0.4
21. i2=i3<i1, i2+i3=i1, 3i=1.2, i=0.4 A. Bundan dolayı 0.8,.0.4, 0.4
22. i2=i3<i1, i2+i3=i1, 3i=1.2, i=0.4 A. Bundan dolayı 0.8,.0.4, 0.4

127
23. i2=i3<i1, i2+i3=i1, 3i=1.2, i=0.4 A. Bundan dolayı 0.8,.0.4, 0.4
24. i2=i3<i1, i2+i3=i1, 3i=1.2, i=0.4 A. Bundan dolayı 0.8,.0.4, 0.4
25. i2=i3<i1, i2+i3=i1, 3i=1.2, i=0.4 A. Bundan dolayı 0.8,.0.4, 0.4
26. i2=i3<i1, i2+i3=i1, 3i=1.2, i=0.4 A. Bundan dolayı 0.8,.0.4, 0.4
27. i2=i3<i1, i2+i3=i1, 3i=1.2, i=0.4 A. Bundan dolayı 0.8,.0.4, 0.4
28. 60, 30, 30 Çünkü her akım ikiye ayrılıyor
29. 0.3, 0.3, 0.6.
30. 0.3, 0.3, 0.6.
31. 1.2, 0.6, 0.6. “i” den geçen akım iki kola ayrılarak i1 gider daha sonra i2 ve i3 gitmektedir
32. 1.2, 1.2, 1.2. Akımları bulmak için hepsinin de 1.2 olması gerekir
33. 1.2, 1.2, 1.2. Şekildeki devrede pil olduğu için, anahtar kapalı olduğu için akım büyüklükleri
aynıdır. Çünkü; akım aynı doğrultuda hepsine birden yüklenir.
34. 2.4, 4.8, 9.6
35. 2.4, 4.8, 9.6 Çünkü bunlar birbirine paralel olarak bağlanmıştır
36. 2.4, 4.8, 9.6
37. 2.4, 4.8, 9.6 Çünkü devre sürekli paralel olarak bölünmüş
38. 2.4, 4.8, 9.6
39. 2.4, 3.6, 4.8
40. 2.4, 3.6, 4.8
Question 4
Category 1 (The currents with the same amount from the batteries has not been consumed yet in both of
the figures)
1. Şekil 4’den geçen akım şekil 5’deki akıma eşittir. Çünkü pilden çıkan akımı i dersek 1’de de i
olarak kalıyor. Aynen şekil 5’de de i olarak kalıyor.
2. Elektrik akımları eşittir. Çünkü akım aynı yönden aynı şekilde geçer.
3. Elektrik akımları aynıdır. Şekilde göründüğüne göre bir değişiklik yapılmamıştır.
4. Elektrik akımlarının büyüklükleri aynıdır.
5. Aynı şiddetle akım geçer. Çünkü ana koldan gider. Etkilenmez.
6. 2 devrede de yüklerin akım şiddetleri aynıdır.
7. Şekil 5’deki akım azdır. Çünkü orda 2 tane akım var pilden gelen akım 2’ye ayrılıyor. Şekil
4’dekişa akım Şekil 5’dekinden fazla çünkü orda 1 akım var. Pilden gelen akım hepsi Şekil 4’e
geliyor.
8. Şekil 4’ün ve Şekil 5’in akımı bence eşittir. Çünkü pilin enerjisi ilk 1 noktasından geçmektedir.
9. Büyüklük aynıdır. Çünkü 1 noktasında akım her iki şekilde de dirençle karşılaşmaz.
10. Akım her zaman +’dan –‘ye doğrudur. 1. noktalardaki akımlar birbirine eşittir. Çünkü iki şekilde
de direnç 1. noktaya kadar yoktur.
11. Şekil 4’deki akım, Şekil 5’deki akım aynıdır. Ama şekil 5’de 2 ampul olduğundan akım ikiye
bölünür. Parlaklık şekil 5’de daha azdır.

128
12. 1 noktalarından geçen akım +’dan –‘ye doğru gidiyor. Şekil 4=şekil5. Çünkü akım 1 noktalarından
sonra dağılıyor.
13. Şekil 4=şekil5. Çünkü + kutuptan çıkan akım boş telden 1’e girer.
14. Şekil 4 ve şekil 5’deki 1 noktalarından geçen elektrik akımları eşittir. Çünkü akım henüz ana
koldan gelmekte ve hiçbir engelle yani dirençle karşılaşmadığı için henüz 1 noktalarından geçen
akım birbirlerine eşittir.
Category 2 (In both of the figures, potential differences supplied by the batteries are the same, but the
equivalent resistance in the second figure is bigger)
1. Üreteçlerin gerilimleri V ise şekil 4 için V= i1.R (her lambanın direnci R kabul ediliyor). İ1 =V/R ise
şekil 5 için V= i2.2R yani i2=V/2R=i1/2 olur.
2. Üreteçlerin gerilimleri V ise şekil 4 için V= i1.R (her lambanın direnci R kabul ediliyor). İ1 =V/R ise
şekil 5 için V= i2.2R yani i2=V/2R=i1/2 olur.
3. Üreteçlerin gerilimleri V ise şekil 4 için V= i1.R (her lambanın direnci R kabul ediliyor). İ1 =V/R ise
şekil 5 için V= i2.2R yani i2=V/2R=i1/2 olur
Category 3 (Current in the first figure is smaller because there is one bulb in the first figure, whereas
there are two bulbs in the second figure)
1. Şekil 4’deki akım daha küçüktür. Çünkü bir devre bağlanmıştır.
2. 1. akım tek ampul olduğu için daha az gelir. Ama 2. şekilde iki ampul olduğu için 2. şekildeki
akım 1. şekildeki akımın 2 katı olmalıdır
3. Şekil 4’de elektrik akımı daha azdır. Şekil 5’de elektrik akımı daha fazladır. Çünkü fazla olarak B
ampulü ekleniyor bu yüzden…
4. Şekil 4’de 1 noktasından geçen elektrik akımı Şekil 5’dekinden daha azdır. Çünkü Şekil 4’de 1 tane
ampul olduğundan ve Şekil 5’de 2 tane ampul olduğu için Şekil 4’e göre daha fazla enerji gerekir.
Şekil 4’de akım az, Şekil 5’de daha çok.
Category 4 (Current in the first figure is bigger because two bulbs in the second figure share the current)
1. 1’deki daha yüksektir. Çünkü akım bölünmüş
2. Şekil 4’de 1 noktasından geçen akım, şekil 5’dekinden daha büyüktür. Çünkü şekil 5’de akımı ikisi
paylaşıyor.
3. Şekil 4’de 1 noktasından geçen akım, şekil 5’dekinden daha büyüktür. Çünkü şekil 5’de akımı ikisi
paylaşıyor.
1. Akımın büyüklükleri eşit değildir. Çünkü şekil 5’de A ve B ampulleri yanmaktadır. Yani şekil
4’deki akım daha büyüktür.
2. 1 noktasından geçen akım daha büyüktür. Çünkü ampul bir tanedir.
3. Şekil 4’deki daha büyüktür. Çünkü elektrik sadece bir yerde ortaya çıktığı için daha az elektrik
kaybeder. Onun için şekil 4 daha büyüktür.
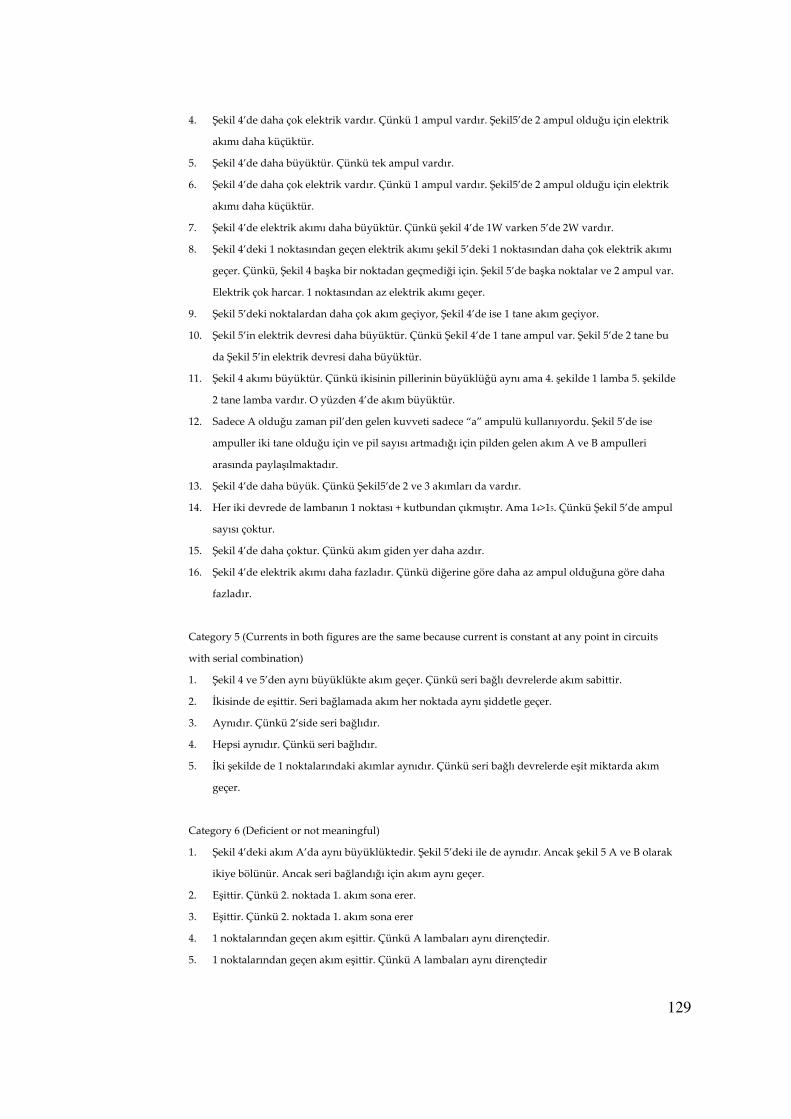
129
4. Şekil 4’de daha çok elektrik vardır. Çünkü 1 ampul vardır. Şekil5’de 2 ampul olduğu için elektrik
akımı daha küçüktür.
5. Şekil 4’de daha büyüktür. Çünkü tek ampul vardır.
6. Şekil 4’de daha çok elektrik vardır. Çünkü 1 ampul vardır. Şekil5’de 2 ampul olduğu için elektrik
akımı daha küçüktür.
7. Şekil 4’de elektrik akımı daha büyüktür. Çünkü şekil 4’de 1W varken 5’de 2W vardır.
8. Şekil 4’deki 1 noktasından geçen elektrik akımı şekil 5’deki 1 noktasından daha çok elektrik akımı
geçer. Çünkü, Şekil 4 başka bir noktadan geçmediği için. Şekil 5’de başka noktalar ve 2 ampul var.
Elektrik çok harcar. 1 noktasından az elektrik akımı geçer.
9. Şekil 5’deki noktalardan daha çok akım geçiyor, Şekil 4’de ise 1 tane akım geçiyor.
10. Şekil 5’in elektrik devresi daha büyüktür. Çünkü Şekil 4’de 1 tane ampul var. Şekil 5’de 2 tane bu
da Şekil 5’in elektrik devresi daha büyüktür.
11. Şekil 4 akımı büyüktür. Çünkü ikisinin pillerinin büyüklüğü aynı ama 4. şekilde 1 lamba 5. şekilde
2 tane lamba vardır. O yüzden 4’de akım büyüktür.
12. Sadece A olduğu zaman pil’den gelen kuvveti sadece “a” ampulü kullanıyordu. Şekil 5’de ise
ampuller iki tane olduğu için ve pil sayısı artmadığı için pilden gelen akım A ve B ampulleri
arasında paylaşılmaktadır.
13. Şekil 4’de daha büyük. Çünkü Şekil5’de 2 ve 3 akımları da vardır.
14. Her iki devrede de lambanın 1 noktası + kutbundan çıkmıştır. Ama 14>15. Çünkü Şekil 5’de ampul
sayısı çoktur.
15. Şekil 4’de daha çoktur. Çünkü akım giden yer daha azdır.
16. Şekil 4’de elektrik akımı daha fazladır. Çünkü diğerine göre daha az ampul olduğuna göre daha
fazladır.
Category 5 (Currents in both figures are the same because current is constant at any point in circuits
with serial combination)
1. Şekil 4 ve 5’den aynı büyüklükte akım geçer. Çünkü seri bağlı devrelerde akım sabittir.
2. İkisinde de eşittir. Seri bağlamada akım her noktada aynı şiddetle geçer.
3. Aynıdır. Çünkü 2’side seri bağlıdır.
4. Hepsi aynıdır. Çünkü seri bağlıdır.
5. İki şekilde de 1 noktalarındaki akımlar aynıdır. Çünkü seri bağlı devrelerde eşit miktarda akım
geçer.
Category 6 (Deficient or not meaningful)
1. Şekil 4’deki akım A’da aynı büyüklüktedir. Şekil 5’deki ile de aynıdır. Ancak şekil 5 A ve B olarak
ikiye bölünür. Ancak seri bağlandığı için akım aynı geçer.
2. Eşittir. Çünkü 2. noktada 1. akım sona erer.
3. Eşittir. Çünkü 2. noktada 1. akım sona erer
4. 1 noktalarından geçen akım eşittir. Çünkü A lambaları aynı dirençtedir.
5. 1 noktalarından geçen akım eşittir. Çünkü A lambaları aynı dirençtedir

130
6. Hepsi aynı ışık verir. Şekil + ve 5’de A’da aynı
7. Hepsi aynı ışık verir. Şekil + ve 5’de A’da aynı
8. şekil 4 > şekil 5. Çünkü Şekil 4 için Reş= R ve şekil 5içiç Reş=R/2
9. şekil 4 > şekil 5. Çünkü Şekil 4 için Reş= R ve şekil 5içiç Reş=R/2
10. şekil 4 > şekil 5. Çünkü Şekil 4 için Reş= R ve şekil 5içiç Reş=R/2
11. şekil 4 > şekil 5. Çünkü Şekil 4 için Reş= R ve şekil 5içiç Reş=R/2
12. şekil 4 > şekil 5. Çünkü Şekil 4 için Reş= R ve şekil 5içiç Reş=R/2
13. şekil 4 > şekil 5. Çünkü Şekil 4 için Reş= R ve şekil 5içiç Reş=R/2
14. şekil 4 > şekil 5. Çünkü Şekil 4 için Reş= R ve şekil 5içiç Reş=R/2
15. şekil 4 > şekil 5. Çünkü Şekil 4 için Reş= R ve şekil 5içiç Reş=R/2
16. şekil 4 > şekil 5. Çünkü Şekil 4 için Reş= R ve şekil 5içiç Reş=R/2
17. şekil 4 > şekil 5. Çünkü Şekil 4 için Reş= R ve şekil 5içiç Reş=R/2
18. şekil 4 > şekil 5. Çünkü Şekil 4 için Reş= R ve şekil 5içiç Reş=R/2
19. şekil 4 > şekil 5. Çünkü Şekil 4 için Reş= R ve şekil 5içiç Reş=R/2
20. şekil 4 > şekil 5. Çünkü Şekil 4 için Reş= R ve şekil 5içiç Reş=R/2
21. şekil 4 > şekil 5. Çünkü Şekil 4 için Reş= R ve şekil 5içiç Reş=R/2
22. Geçen akımlar eşittir. Devreler paralel bağlanmıştır.
23. Gerilim daha fazla olduğu için ikisinin de büyüklükleri aynıdır.
24. Şekil 4’de daha çok elektrik vardır. Çünkü 1 ampul vardır. Şekil 5’de 2 ampul oldupğuiçin akım
daha çoktur.
25. Şekil 4’deki akım lambayı daha çok yakar. Çünkü orada 1 akım geçiyor. Şekil 5’de elektrik lambayı
daha az yakar. Çünkü orada 2 akım geçiyor.
26. Her iki şekilde de elektrik akımlarının büyüklükleri aynı değildir. Çünkü ampul sayıları farklıdır.
27. Şekil 4’deki 1 ampul olduğu için daha az aydınlatır. Şekil 5’deki ise 2 ampul olduğu için daha çok
aydınlatır.
28. Şekil 4’de elektrik akımı daha hızlı akım geçer. Şekil 5’de ise daha yavaş akım geçer.
Question 5
Category 1 (Currents at all points are the same and bulbs A and B are the same in brightness)
1. Seri bağlı oldukları için hepsi eşit. A ve B parlaklıkları birbirine eşit.
2. Birbirlerine eşittir. Aynı parlaklıktadır.
3. Elektrik akımının büyüklükleri aynıdır. Çünkü akım kablolardan aynı anda tüm ampullere gider.
4. 1=2=3. Devredeki akımlar eşittir. A=B. Aynı yanar.
5. Akım büyüklüğü aynıdır. Seri bağlı olduğu için. Ampullerin parlaklıkları aynıdır. Seri
bağlamalarda aynı miktarda akım geçer. Bu yüzden parlaklıkları aynıdır.
6. Hepsi aynıdır. Çünkü seri bağlanmıştır. Hepsi aynı parlaklıktadır.
7. Her 3’de aynıdır. Çünkü seri bağlıdır. Akım her yerden eşit geçer. Parlaklıklar da aynıdır.
8. Hepsi aynıdır. Aynı parlaklıktadır. Çünkü seridir.

131
9. Geçen akımlar aynıdır. Çünkü akım aynı düzlükte yol izler. Geçen akımlar aynı olduğuna göre
ampuller de aynı ışığı verir. Yani parlaklıklarında bir fark yoktur.
10. 1=2=3. Çünkü seri bağlı olduğu için hepsinden geçen akım eşittir. Parlaklıklar aynıdır.
11. Seri bağlıda akım şiddeti eşittir. A ve B ampullerine etki eden akım eşit olduğu için parlaklıklar
eşittir.
12. 1=2=3’dür. Çünkü devre seridir. A=B’dir. Devreden geçen akım eşittir. Devre seridir.
13. 1, 2, 3 noktalarındaki akımların büyüklükleri aynıdır. Çünkü seri bağlamada akım her yerde
aynıdır. Ana koldan geçen akım her iki ampulde de aynı olduğundan parlaklıkları aynıdır.
14. 1, 2, 3 eşittir. + kutbundan çıkan akım –‘ye aynı şekilde gider. A=B.
15. 1, 2, 3 eşittir. + kutbundan çıkan akım –‘ye aynı şekilde gider. A=B.
16. 1, 2, 3 eşittir. + kutbundan çıkan akım –‘ye aynı şekilde gider. A=B.
17. 1, 2, 3 eşittir. + kutbundan çıkan akım –‘ye aynı şekilde gider. A=B.
18. 1, 2, 3 eşittir. + kutbundan çıkan akım –‘ye aynı şekilde gider. A=B.
19. 1, 2, 3 eşittir. + kutbundan çıkan akım –‘ye aynı şekilde gider. A=B.
20. 1, 2, 3 eşittir. + kutbundan çıkan akım –‘ye aynı şekilde gider. A=B.
21. 1, 2, 3 eşittir. + kutbundan çıkan akım –‘ye aynı şekilde gider. A=B.
22. 1, 2, 3 eşittir. + kutbundan çıkan akım –‘ye aynı şekilde gider. A=B.
23. 1, 2, 3 eşittir. + kutbundan çıkan akım –‘ye aynı şekilde gider. A=B.
24. 1, 2, 3 eşittir. + kutbundan çıkan akım –‘ye aynı şekilde gider. A=B.
25. 1, 2, 3 eşittir. + kutbundan çıkan akım –‘ye aynı şekilde gider. A=B.
26. 1, 2, 3 eşittir. + kutbundan çıkan akım –‘ye aynı şekilde gider. A=B.
27. 1, 2, 3 eşittir. + kutbundan çıkan akım –‘ye aynı şekilde gider. A=B.
28. Seri bağlı devrede sadece bir akım vardır. Ve her noktada aynı olup değeri ½’dir. Ampullerin
parlaklığı ise üzerlerindeki gerilime bağlıdır. Ampullerden aynı akım geçer, dirençlerde aynı
olduğu için: VA= IR, VB=IR olur. Gerilim eşit olduğunda parlaklıklarda aynı olur.
29. Seri bağlı devrede sadece bir akım vardır. Ve her noktada aynı olup değeri ½’dir. Ampullerin
parlaklığı ise üzerlerindeki gerilime bağlıdır. Ampullerden aynı akım geçer, dirençlerde aynı
olduğu için: VA= IR, VB=IR olur. Gerilim eşit olduğunda parlaklıklarda aynı olur
30. 1=2=3. Seri bağlanmıştır. Aynı parlaklıktadır.
Category 2 (The further away from the battery, the less the amount of current and the brightness of a
bulb)
1. Şekil 5’de 3’ün akımı daha büyüktür. 2’de ise 3’den biraz azalır. 1’de ise biraz daha azalır. Çünkü 3
pile daha yakındır. Diğerleri gittikçe azalır. B ampulü daha parlaktır. Çünkü enerji direkt gelir.
2. 3>2>1 A B’de daha parlak. Akım A’dan direkt geçtiği için.
3. En fazla akım 3’den geçmektedir. En az akım 1’den geçmektedir. En parlak B ampulüdür.
4. 3 pile yakın olduğu için akım daha fazla geçer ve en büyüktür. 2, 1 akım daha az geçer. Pil daha
uzak olduğu içindir. B pile yakın ve akım daha çok olduğu için B daha parlak yanar. A daha uzak
ve akımın daha yavaş geçeceği için parlak yanmaz.
5. 3>2>1

132
6. 3>2>1. Çünkü elektrik akımının yükü – olduğu için 3’de büyük, 2’de ise önce ampul bulunduğu
için sonra 2 ve 1’in önünde de iki tane ampul bulunduğu için.
7. 3>2>1. Çünkü 3 pile daha yakındır. B daha parlaktır. Çünkü pile daha yakındır.
8. 3>2>1. A parlak yanar.
9. 3>2>1
Category 3 (i1>i2>I3 and Bulb A is brighter)
1. Bu akımda diyelim 1 noktası 15 akım alıyorsa 2 noktası 10, 3 noktası 5 akım alır. Dolayısıyla 1
akımı her zaman akım daha fazla alır. Pilin akımı ilk önce A’dan geçtiği için A daha parlak yanar.
2. 1 en büyük, 2 1’den küçük, 3 en küçük. Anottan gelen enerji 1 akımından geçerek 2 ve 3’e geçiyor.
A kısmına + gelen yük A’yı daha çok parlatıp B’ye geçer. A B’den daha çok parlıyor.
3. 1. noktada akım fazla, 2. noktada 1’e göre daha az, 3’de ise akım daha az. Çünkü 1. noktada A’ya
gelindiğinde bir miktar akım burada kalır. 3. noktada B’ye geldiğinde bir miktar akımda burada
kalır. A daha parlaktır. Çünkü gelen ilk akım buraya uğradığı için.
4. 1>2>3. A B’den daha parlaktır.
5. 1>2>3. Çünkü 1 noktasında henüz enerji verilmemiş. 2 noktasında enerjisi 1 lambaya verilmiş. 3
noktasında enerji düşürülmüştür. A ampulü daha parlaktır. Çünkü enerjisi en yüksek olan 1
noktasıdır. B ampulünün parlaklığı daha azdır. Çünkü enerji azalmıştır.
6. 1>2>3. Çünkü 1’de akım hiç dirençle karşılaşmamış. 2’de akım dirençle karşılaşmış. 3’de akım 2
dirençle karşılaşmış.
7. 1’deki akım daha büyüktür. Çünkü akım ilk olarak oradan geçiyor. A daha parlaktır. Çünkü ilk
başta parlaklık oradan geçiyor.
8. 1’deki akım daha büyüktür. A B’den daha parlaktır.
9. 1 akım daha yüksektir. A daha parlak. Çünkü kolda tek başına olduğu için.
10. En büyük akım 1’dedir. Çünkü hiçbir dirençle karşılaşmaz. 2 noktasında A direncinden geçeceği
için akım azalır. 3 noktasında Ave B dirençlerinden geçeceği için akım daha da azalır. Yani: 1>2>3.
A B’den daha parlak yanar. Çünkü A’dan geçen akım B’den geçen akım şiddetinden daha fazladır.
11. En büyük akım 1’dedir. Çünkü henüz hiçbir dirençle karşılaşmamıştır. 2. akım 1. akımdan biraz
daha küçüktür. Çünkü A direnciyle karşılaşmıştır ve A direncini geçebilmek için enerji
harcamıştır. 3. akım ise 2’den de küçüktür. Çünkü buraya hem A hem de B direncini geçerek
gelmiştir. Bu yüzden diğerlerine göre daha çok enerji harcanmıştır.A ampulü B ampulüne göre
daha parlak yanar. Çünkü A ampulü daha fazla gelen akımı kullanarak ışık vermektedir. Ama B
ampulü kullanılmış olan akımı ve bu yüzden azalmış olan akımı kullanarak daha az ışık verebilir.
Ama B ampulü ile A ampulü yer değiştirilirse A’dan daha parlak yanar. Bunun sebebi de az önce
belirtmiş olduğum sebeple aynıdır.
Category 4 (i1=i2=I3 and Bulb B is brighter due to being closer to the battery)
1. Akımların büyüklüğü aynıdır. B’nin parlaklığı daha fazladır.
2. Akımlar aynıdır. B daha parlaktır. Çünkü ampul ile üreteç arasındaki mesafe daha azdır.

133
Category 5 (i1>i2>I3 and Bulb B is brighter due to being closer to the battery)
1. Pilin akımı önce A’dan geçtiği için 1>2>3. B ampulü daha parlaklık gösterir. Pile daha yakındır.
Category 6 (i1>i2>I3 and Bulbs A and B are the same in brightness)
1. 1. nokta daha çok, sonra 2. nokta daha sonra 3. nokta. Çünkü; pilden çıkan akım önce 1. noktaya
uğrar, sonra A ampulüne ve akım biraz azalır, sonra 2. noktadan geçer B ampulüne gelir, akım
biraz daha azalır ve 3. noktaya geldiğinde hiç kalmayacak kadar azalır. A ve B ampulleri aynı
parlaklıktadır.
Category 7 (Deficient or not meaningful)
1. 1, 2, 3 noktalarının akımları büyük değil. Çünkü noktalar uzak. A ve B ampulü yanmamaktadır.
Çünkü pilin her iki ampulü birden yakması zor bu yüzden daha çok volt gerekir.
2. Şekil 5’de elektrik akımı hepsini eşit miktarda yakar.
3. 2=3>1=2. Çünkü 2=3’ün arasındaki mesafe 1=2’nin arasındaki mesafeye göre daha azdır. A’nın
parlaklığı daha çoktur. Çünkü B’nin verdiği ışık A’ya sağdan yansır.
4. 1 akım en büyüktür. 2=3’dür. Çünkü ikisinde de arada 1 ampul vardır. A ampulü daha parlaktır.
5. 1’de daha az. 2’de daha büyüktür. Çünkü 2 lamba arasında kalır. 3’de yine daha azdır. İkisinin de
parlaklıkları aynı diye düşünüyorum. Çünkü pildeki akımı ikisi de paylaşıyorlar.
6. 1=2>3 A=B olarak akım doğru olarak geçer. A’nın ve B’nin parlaklıkları eşit olur.
7. Aynıdır. A daha parlaktır.
8. Hepsi eşittir. Akım kollara ayrılmıyor. A ampulü daha parlaktır. Çünkü…
9. 1=2=3’dür. Hepsi paralel bağlanmıştır. Parlaklıklar da eşit. Devre paralel.
10. 1, 2 ve 3 noktalardaki akımlar aynıdır. Çünkü hepsinden de aynı direnç geçiyor.
11. 3 bir ve 2’den azdır. En yakın olduğu için. 2 birden azdır.1 hepsinden çoktur. En uzak olduğu için
12. 1. akım çoktur. Daha sonra ampule geçer ve 2. noktaya ulaşır. 2. noktada B ampulüne geçer ve 3.
noktaya kadar gelir. Bu arada da ampuller yanar. A B’ye göre daha az parlaktır. Çünkü A ampulü
yandıktan sonra akım B ampulüne kadar gelir ve A ampulündeki parlaklık azalır.
13. Hepsi eşittir. Akım kollara ayrılmıyor. A daha parlaktır.
14. 1 NOKTASINDA AKIM AZDIR. Sebebi akım oradan geçmeye başlar. 2. 1.ye oranla biraz fazladır.
3’de en fazladır. Akımlar 3’de toplanır.
15. Akım 1’den 2’ye kadar daha fazla, 2’den 3’ede daha fazladır.
Question 6
Category 1 (It is bigger in Figure 6 because there are more bulbs in Figure 7)
1. Şekil 6’daki 1 noktasının akımı daha fazladır. Çünkü enerji fazla bölünmeden gelir.
2. Şekil 6’daki seri olduğu için akım daha büyüktür. Şekil 7’deki ise paralel olduğu için akım azdır,
daha küçüktür.
3. Şekil 7 daha küçüktür Şekil 6’dan. Çünkü Şekil 7’de akım iki kola ayrıldığı için.
4. Şekil 7 daha küçüktür Şekil 6’dan. Çünkü Şekil 7’de akım iki kola ayrıldığı için
5. Şekil 6 > Şekil 7

134
6. Şekil 6’daki daha büyüktür. Çünkü Şekil 7’deki elektrik akım 3’e bölünüyor.
7. 6>7. Çünkü Şekil 7’de daha fazla ampul vardır.
8. 6>7. Çünkü Şekil 7’de lamba sayısı çok olduğu için voltaj düşebilir.
9. Şekil 6’da akım daha fazladır. Çünkü direnci azdır. Şekil 7’de akım daha azdır. Direnç fazladır.
10. Şekil 6’daki akım Şekil 7’den daha büyüktür. Çünkü oradaki lamba daha fazladır.
11. Şekil 6’daki daha büyüktür. Çünkü şekil 7’deki akım 3 akımdan geçiyor.
12. Şekil 6’da 1 tane akım olduğu için Şekil 7’den akım büyüklüğü büyüktür.
13. Şekil 6’daki daha büyüktür.
14. Şekil 6’da daha büyüktür. Çünkü Şekil 6’da doğrudan, Şekil 7’de dolaylı akım vardır.
15. Şekil 6’daki elektrik akımı Şekil 7’den büyüktür. Çünkü Şekil 7’de gelen elektrik akımı çeşitli
kollara ayrılır.
16. Şekil 6’da pil 1 ampule akım verdiği için daha çoktur.
17. Şekil 6’da daha büyüktür. Çünkü Şekil 6’da bir, 7’de iki lamba vardır.
18. Şekil 6’daki 1 noktasında akım daha büyüktür. Çünkü 1 lambaya bağlanmıştır.
19. Şekil 6>Şekil7
20. Şekil 6>Şekil7
21. Şekil 6>Şekil7. Çünkü Şekil 6 tek ampule akım veriyor. Şekil 7 iki ampule akım veriyor.
22. 6>7. Çünkü altıncı şekilde akım aynıdır. 7. şekilde akım ikiye ayrılır.
23. 6>7. Çünkü altıncı şekilde akım aynıdır. 7. şekilde akım ikiye ayrılır
24. Şekil 6’daki akım daha büyüktür. Çünkü bütün akım sadece bir ampulden geçiyor. Şekil 7’deki
akım 1’den sonra 2’ye bölünecek. Bundan dolayı akım yarıya iner.
25. Pilden geçen akım Şekil 6’da A’ya gider. Şekil 7’de A ve B daha küçüktür. Çünkü akım ikiye
bölünür.
26. Pilden geçen akım Şekil 6’da A’ya gider. Şekil 7’de A ve B daha küçüktür. Çünkü akım ikiye
bölünür
27. Pilden geçen akım Şekil 6’da A’ya gider. Şekil 7’de A ve B daha küçüktür. Çünkü akım ikiye
bölünür
28. Şekil 6’da daha büyüktür. Çünkü Şekil 6’da 1 ampule bağlıdır.
Category 2 (It is bigger in Figure 7 because the equivalent resistance in Figure 7 is smaller)
1. Karşılaştırdığımızda Şekil 7’nin akımı daha fazladır.
2. Şekil 6’daki elektrik akımının büyüklüğü azdır.
3. Şekil 7’de daha büyüktür. Çünkü hem 2 hem de 3’e akım verebiliyor.
4. Şekil 7’deki 1 noktasında akım daha büyüktür.
5. Her üretecin gerilimleri V ve lamba dirençleri R ise: Şekil 6’da V= I1R, I1= V/R=i olsun. Şekil 7’de
V=I2Reş ve Reş=R/2’dir. Yani, I1= 2V/R=2i olur.
6. Her üretecin gerilimleri V ve lamba dirençleri R ise: Şekil 6’da V= I1R, I1= V/R=i olsun. Şekil 7’de
V=I2Reş ve Reş=R/2’dir. Yani, I1= 2V/R=2i olur.

135
7. Her üretecin gerilimleri V ve lamba dirençleri R ise: Şekil 6’da V= I1R, I1= V/R=i olsun. Şekil 7’de
V=I2Reş ve Reş=R/2’dir. Yani, I1= 2V/R=2i olur.
Category 3 (Both currents are the same in both figures because currents leaving the batteries with the
same amount have not been divided into branches yet)
1. Büyüklükleri aynıdır. Akım ilk 1 noktasından geçmektedir. Bu nedenle elektrik akımlarının
büyüklükleri eşittir.
2. İkisi de aynıdır. Çünkü aynı oranda aynı 1 noktasında kesişmiş ve 1’er nokta konulmuştur. Buda
arasında bir büyüklük yoktur. Yani aynıdır.
3. Aynı olur. Akım ikiye ayrılıp sonra birleşir. İkisi de birbirine eşittir.
4. Akımlar aynı olur.
5. Büyüklükleri aynıdır.
6. Şekil 6 ve 7’deki 1 noktadaki elektrik akımı eşittir. Çünkü iki şekilde de 1 noktası ana kolda
bulunuyor.
7. Bence 2 devrede de yükleri eşittir. Çünkü 2 devrede de ilk başta geçmiş.
8. Şekil 6 ve 7’de aynı büyüklüktedirler.
9. Elektrik akımının büyüklükleri aynıdır. Çünkü Şekil 7’de akım A ve B’den geçip tekrar ana kolda
birleşiyor.
10. Ana koldan geçen akım aynıdır. Çünkü ikisi de akımın geçtiği ilk koldur.
11. Akımlar eşittir. Çünkü pilden çıkan akım ikisinde de aynı yerdedir.
12. Eşittir. Çünkü akımla karşılaşmamıştır.
13. Aynıdır. Çünkü ikiye bölünmeden gidiyor.
14. 1 noktalarının akımları aynıdır. Çünkü pilden çıkan akım eşittir.
15. Aynıdır. Çünkü akımın ayrılacağı hiçbir kol yoktur.
16. Aynıdır. Çünkü Şekil 7’dekinde 1’de akım daha kollara ayrılmamıştır.
17. İki şekilde de akım 1 noktalarına direkt gittiği için büyüklükleri aynıdır.
18. 1 noktalarında akım eşit. Çünkü 1 noktalarından sonra dirençlere ulaşıyor.
19. Elektrik akımları aynıdır. Çünkü akım daha ayrılmamıştır ve aynı düzlük akım ilerler. Akımlarda
fark yoktur.
20. Şekil 6=Şekil 7. Çünkü akım pilden çıkar çıkmaz 1 noktalarına ulaşmıştır. Bu yüzden 1
noktalarında akımların büyüklükleri eşittir.
21. Eşittir. Çünkü akımla karşılaşmamıştır.
22. Eşittir. Çünkü Şekil 7’de akım 1 noktasından geçer, sonra 2 ve 3 noktalarına dağılır. Şekil 6’da ilk
önce 1 noktasından geçer. İki şekilde de geçen elektrik akımları aynı büyüklüktedir.
23. 61=71. + kutbundan boş telle 1 noktasına gidiyor.
24. 61=71. + kutbundan boş telle 1 noktasına gidiyor
25. 61=71. + kutbundan boş telle 1 noktasına gidiyor
26. 61=71. + kutbundan boş telle 1 noktasına gidiyor
27. 61=71. + kutbundan boş telle 1 noktasına gidiyor
28. 61=71. + kutbundan boş telle 1 noktasına gidiyor

136
29. 61=71. + kutbundan boş telle 1 noktasına gidiyor
30. 61=71. + kutbundan boş telle 1 noktasına gidiyor
31. 61=71. + kutbundan boş telle 1 noktasına gidiyor
32. 61=71. + kutbundan boş telle 1 noktasına gidiyor
33. 61=71. + kutbundan boş telle 1 noktasına gidiyor
34. 61=71. + kutbundan boş telle 1 noktasına gidiyor
35. 61=71. + kutbundan boş telle 1 noktasına gidiyor
36. 61=71. + kutbundan çıkan akım direkt 1 noktasından geçiyor.
37. 61=71. + kutbundan boş telle 1 noktasına gidiyor
38. 61=71. + kutbundan boş telle 1 noktasına gidiyor
39. Şekil 6 ve 7’de elektrik akımları aynıdır. Çünkü hiçbir dirençle karşılaşmamışlardır.
Category 4 (Deficient or not meaningful)
1. Şekil 7’de daha fazla olabilir. Sebebi de seri bağlı oldukları için olabilir.
2. İkisi de eşittir. Çünkü ampul tarafından kullanılmış
3. 1 lamba yandığı için A’daki daha parlaktır.
4. 1 noktasından geçen akımlar birbirine eşittir.
5. 1 noktasından geçen akımlar birbirine eşittir. Çünkü akımlar 1 noktasına kadar akımla
karşılaşmıştır.
6. Şekil 6>Şekil 7. Çünkü ilk devre seri, diğeri paralel.
Question 7.a
Category 1 (i1>i2=i3)
1. 2 ve 3 birbirine eşittir. 1’de 2 ve 3’ün toplamına eşittir.
2. 1>2=3
3. 1>2=3
4. 1’de en büyük daha sonra 2 daha sonra da 3’tür. Nedeni devreye sonradan B ampulü eklenmiş.
5. 1 noktasında akım şiddeti büyüktür. Çünkü ana koldadır. 2 ile 3’de birbirine eşittir. Çünkü iki kola
ayrılıyor. Burada eşit bir şekilde ayrılır.
6. 1>2 ve 3 eşit
7. 1>2=3
8. Pilin enerjisi önce 1’den geçtiği için 1 en büyüktür. 2 ve 3 eşit olabilir.
9. 1>2=3. Akımlar 1 noktasından geçer ve 2 ile 3’e dağılır.
10. 1>2=3. Akım hiçbir yere uğramadan 1’den geçtiği için en büyük akım geçer. 2 ve 3’de 1’deki akım
ikiye ayrılır.
11. 1>2=3. Akım hiçbir yere uğramadan 1’den geçtiği için en büyük akım geçer. 2 ve 3’de 1’deki akım
ikiye ayrılır.

137
12. 1>2=3. Akım hiçbir yere uğramadan 1’den geçtiği için en büyük akım geçer. 2 ve 3’de 1’deki akım
ikiye ayrılır
13. 1>2=3’dür. Çünkü 1 noktasında enerjinin tamamı yer almaktadır. 2 ve 3 noktalarında ayrılarak
ikiye ayrılmış, 1 noktasından akım 2 ve 3’e yarı yarıya dağılmıştır.
14. 1>2=3.
15. 1>2=3 olur. Akım 1’den geçtikten sonra ikiye ayrılır. Yani akım iki kola bölünür ve iki koldan da
aynı şiddetle geçer.
16. 1>2=3. 1’deki akım büyüktür, çünkü tam olarak geçer. 2 ve 3’de akım yarıya iner. Çünkü iki telden
geçer.
17. 1>2=3. Akım 1 noktasından sonra ikiye ayrılıyor.
18. 1>2=3. Akım 1 noktasından sonra iki kola ayrılıyor.
19. 1>2=3. 2 ve 3 noktalarında iki tane ampul var. 1 direkt akım alarak dağılıyor.
20. 1>2=3. Çünkü 2 ve 3. noktalara gelirken akım ikiye ayrılıyor.
21. I1>I2>I3 1. noktada akım bölünmemiş. 1. noktadan sonra 2. ve 3. noktalara eşit paylaşılmıştır.
22. 1>2=3.
23. 1>2=3.
24. 1>2=3. 1’deki akım büyüktür, çünkü tam olarak geçer. 2 ve 3’de akım yarıya iner. Çünkü iki telden
geçer.
25. 1>2=3. Çünkü 2 ve 3. noktalara gelirken akım ikiye ayrılıyor
26. 1>2=3. Akım hiçbir yere uğramadan 1’den geçtiği için en büyük akım geçer. 2 ve 3’de 1’deki akım
ikiye ayrılır.
27. 1>2=3. Akım hiçbir yere uğramadan 1’den geçer ve 2 ve 3’de i/2 olacak şekilde paylaşılır. 1.si ise
i’dir.
28. I1=I2+I3 ise I1>I2=I3. Çünkü akım iki kola ayrılır.
29. 1>2=3.
30. i1>i2=i3 Paralel kollarda dirençler özdeş, akımlar eşit olarak paylaşılır.
31. i1>i2=i3 Paralel kollarda dirençler özdeş, akımlar eşit olarak paylaşılır.
32. i1>i2=i3 Paralel kollarda dirençler özdeş, akımlar eşit olarak paylaşılır.
33. i1>i2=i3 Paralel kollarda dirençler özdeşse, akımlar eşit olarak paylaşılır.
34. i1>i2=i3 Paralel kollarda dirençler özdeşse, akımlar eşit olarak paylaşılır.
35. i1>i2=i3 Paralel kollarda dirençler özdeşse, akımlar eşit olarak paylaşılır.
36. i1>i2=i3 Paralel kollarda dirençler özdeşse, akımlar eşit olarak paylaşılır.
37. i1>i2=i3 Paralel kollarda dirençler özdeşse, akımlar eşit olarak paylaşılır.
38. i1>i2=i3 Paralel kollarda dirençler özdeşse, akımlar eşit olarak paylaşılır.
39. i1>i2=i3 Paralel kollarda dirençler özdeşse, akımlar eşit olarak paylaşılır.
40. i1>i2=i3 Paralel kollarda dirençler özdeşse, akımlar eşit olarak paylaşılır.
41. i1>i2=i3 Paralel kollarda dirençler özdeşse, akımlar eşit olarak paylaşılır.
42. i1>i2=i3 Paralel kollarda dirençler özdeşse, akımlar eşit olarak paylaşılır.
43. i1>i2=i3 Paralel kollarda dirençler özdeşse, akımlar eşit olarak paylaşılır.
44. i1>i2=i3 Paralel kollarda dirençler özdeşse, akımlar eşit olarak paylaşılır.

138
Category 2 (i1>i2>i3)
1. 1. devrede daha çok, 2. devrede normal, 3. devrede ise yok denecek kadar azdır. Çünkü akım
kollara ayrılmıştır.
2. 1 ve 2 daha büyüktür. Çünkü ilk akımı onlar yapıyor.
3. 1 ve 2 daha büyüktür. Çünkü akımlar ilk önce ona gelir.
4. 1>2>3. Önce akım 1’den, daha sonra 2 ve daha sonra 3’den geçer.
5. 1 akım daha fazladır. 2 akım normaldir. 3 daha az. Çünkü dirençleri az.
6. 1’in akımı daha fazla çünkü enerji direkt 2’de biraz daha azalır. Enerji 1’den sonra gelir. 3’de ise
daha azalır. Çünkü enerji 1 ve 2’ye uğramıştır.
7. 1>2>3. Pile daha yakın daha sonra 2, sonra da 3’dür.
8. 1 ve 2 noktalarında akım daha büyüktür. Çünkü akım ilk onlara geliyor.
9. 1>2>3’dür.
10. 1>2>3. nokta
11. 1>2>3. nokta
Category 3 (Deficient or not meaningful)
1. 1=2=3. Çünkü devredeki akımlar A ve B ampullerine eşit miktarda veriliyor.
2. Akımların büyüklükleri aynı, hepsi aynı boydadır, hepsi aynı büyüklüktedir.
3. Şekil 7’de akımların hepsi eşittir.
4. 1=2=3 Çünkü devreden geçen akım birbirine eşit. Pilin voltajından dolayı devreden akım miktarı
aynı geçer.
5. 1, 2 ,3 akımlarının büyüklükleri aynıdır.
6. 1=2=3. Akımlar eşit ayrıldığı için.
7. 1 ve 2’deki akım eşit. Çünkü seri bağlıdır. 3’de ise daha azdır.
8. 1 ve 2’de akımlar daha fazladır. 3’de ise daha azdır
9. Ana kollarda daima akım fazladır. 1 ve 2 fazla 3 ise azdır.
10. 1. nokta >3. nokta >2. nokta
11. 1>3>2. Çünkü akım önce 1 sonra 3 daha sonra 2 gider.
Question 7.b
Category 1 (Bulbs A and B are the same in brightness because the same amount of current passes
through bulbs A and B)
1. Eşittir. Çünkü A ve B birbirine paraleldir.
2. İkisi de aynı yanar. Çünkü ikisi de aynı elektriklidir.
3. Eşittir. Çünkü burada A ve B ampulleri birbirine paralel olduğu için.
4. İkisinin de parlaklığı aynıdır.
5. Eşit parlaklıkta yanar. Paralel bağlamadır.
6. Eşittir. Çünkü A ve B ampulleri birbirine paraleldir.
7. A ve B’nin parlaklıkları aynı. Çünkü aynı boyda, aynı büyüklükte oldukları için.

139
8. Aynı parlaklıktadırlar. Akım tam ikiye bölünür.
9. A ve B ampullerinin parlaklıkları aynı diye düşünüyorum Çünkü paralel bağlılar.
10. Her ikisi de aynı yanar. Çünkü elektrik akımı hepsini aynı yakar.
11. A ve B eşittir. Çünkü A ve B’ye aynı akımlar gider.
12. İkisinin de parlaklığı eşittir. Birbirine karşılıklı ışık verirler.
13. Parlaklıkları aynı. Aynı akım gelir.
14. Eşit akım geçtiği için eşit parlaklıktadırlar.
15. Dirençleri verilmediği için tam bir sayı verilmemiştir ama A ve B ampullerinin parlaklıkları
aynıdır. Çünkü paralel devreye bağlıdırlar.
16. Dirençleri verilmediği için tam bir sayı verilmemiştir ama A ve B ampullerinin parlaklıkları
aynıdır. Çünkü paralel devreye bağlıdırlar.
17. Dirençleri verilmediği için tam bir sayı verilmemiştir ama A ve B ampullerinin parlaklıkları
aynıdır. Çünkü paralel devreye bağlıdırlar
18. A=B’dir. Çünkü 2 ve 3 akımlarında enerjiler eşittir.
19. İkisi de aynı parlaklıktadır. Çünkü akım ikisine de aynı anda gelir.
20. A=B’dir. Paralel bağlı ampuller akımlar eş olduğundan aynı şiddetle yanar. (özdeş ise)
21. A ve B’de akım yarıya düştüğü için ikisi de eşittir. Aynı parlaklıkta olurlar.
22. A ve B ampullerinin parlaklıkları aynıdır. Devreden geçen akımdan dolayı
23. A ve B ampullerinden aynı akım geçtiği için parlaklıkları aynıdır.
24. Eşittir. Aynı akım geçiyor.
25. Parlaklıklar aynıdır. Çünkü her ikisine de aynı akım gelir.
26. Ave B ampulleri aynı parlaklıkta yanmıştır. 1. noktadan sonra akım eşit olarak paylaşılmıştır.
27. Eşittir. Aynı akım geçiyor.
28. A=B’dir. Çünkü ikisinden de geçen akımlar eşittir
29. Ampullerin parlaklıkları aynıdır. Üzerlerinden geçen akımlar eşittir.
30. Eşittir. Aynı akım geçiyor.
31. A=B’dir. Çünkü ikisinden de geçen akımlar eşittir
32. A=B’dir. Çünkü ikisinden de i/2’lik akım geçer.
33. Eşit parlaklıkta yanar. Çünkü üzerinden geçen akım eşittir.
34. A ve B lambalarının parlaklıkları aynıdır. Çünkü devre paraleldir.
35. A=B
36. A=B
37. A=B
38. A=B akım eşit
39. A=B akım eşit
40. A=B
41. A=B
42. A=B
43. A=B
44. A=B

140
45. A ve B paralel oldukları için gerilimleri eşittir. Bundan dolayı parlaklıkları eşittir.
46. A ve B paralel oldukları için gerilimleri eşittir. Bundan dolayı parlaklıkları eşittir
47. A ve B paralel oldukları için gerilimleri eşittir. Bundan dolayı parlaklıkları eşittir
Category 2 (Bulb A is brighter because bulb A is closer to the battery)
1. A ampulü daha parlak yanar B ampulüne göre
2. A B’ye göre parlaktır.
3. A ampulü daha parlak. 1 ve 3. akımlar buraya uğradığı için.
4. A lambası daha çok parlaklık gösterir. Çünkü pile daha çok yakındır.
5. A B’den parlaktır. Çünkü pilden çıkan akım önce A alır daha sonra ise B alır.
6. A daha parlaktır. B’ye göre akım fazladır.
7. A daha parlaktır. Çünkü devrede en çok akım ondan geçer
8. A ampulü daha parlaktır.
9. A’daki ışık parlaktır. B’deki ışık ise daha azdır. Sebebi A’daki akım daha fazladır. Daha fazla
parlaklık gösterir.
10. A B’den daha parlak yanar
11. A ampulü B ampulünden parlaktır.
12. A daha parlaktır. Pile daha yakındır.
13. A B’den daha parlaktır. Çünkü akım ilk önce A’ya sonra B’ye gelir.
14. A B’den daha parlaktır. Çünkü akım ilk önce A’ya sonra B’ye gelir
Category 3 (Bulb B is brighter because current first passes through bulb B)
1. B ampulü daha parlaktır. Çünkü akım ilk başta ondan geçiyor.
2. B’de parlaklık daha fazladır.
3. B daha parlaktır. Çünkü akım ilk ona geliyor.
4. B lambası A lambasından daha parlaktır. Devreden gelen akım ilk olarak B noktasından geçer.
5. B ampulü daha parlaktır. Çünkü en başta akım ondan geçiyor.
6. B akımı daha parlak. Çünkü ilk başta akım ona gelir.
Category 4 (Deficient or not meaningful)
1. A az parlaktır. Yakındır. B daha parlaktır. Uzaktır.
Question 8
Category 1 (Bulb A in Figure 8 is brighter because all of the current is consumed by only bulb A in
Figure 8)
1. Parlaklıkları eşit değildir. Çünkü Şekil 7’de iki ampul vardır. Paralel bağlıdır. Şekil 8’de ise sadece
bir ampul vardır.
2. Şekil 8’deki lamba daha parlaktır. Çünkü tek lamba var.

141
3. Şekil 7’deki lamba az yanar. Çünkü iki devre olduğu için A lambası fazla yanmaz.
4. Şekil 7’de daha az, çünkü; iki tane lamba olduğu için.
5. Şekil 8’de daha çok parlaklık verir. Çünkü 1, 3 gibi noktalardan geçmediği için çok parlaklık verir.
6. 7. şekildeki lambanın parlaklığı daha azdır. Çünkü, şekil 8’deki akım sadece A lambasından
geçiyor.
7. 7<8
8. Şekil 8’de lamba daha parlaktır. Çünkü onda tek bir lamba var.
9. Şekil 8’deki A lambası daha parlaktır. Çünkü başka ampul olmadığı için daha parlaktır.
10. Şekil 8’deki büyüktür. Çünkü şekil 7’deki akımı B lambası da kullanıyor. Şekil 8’de akım direkt A
lambasına veriliyor.
11. 7. şekilde daha az yanar. Çünkü; akım 2’ye ayrılır. 8’de ise sadece doğru gelir ve gider.
12. Şekil 7’deki daha az yanar. Şekil 8 iyi yanar. Sebebi Şekil 7 2W elektrik olması şekil 8’de 1 W
elektrik akımı vardır.
13. Şekil 8’de büyük, şekil 7’de küçüktür. Çünkü şekil 7’de 2 tane ampul kullanılmış.
14. Şekil 7’de akım iki lambayı yaktığı için parlaklığı azdır. Fakat şekil 8’de akım sadece bir ampulü
yaktığı için şekil 7’den parlaktır.
15. Şekil 8’de daha parlaktır. Çünkü şekil 8’de B ampulü kalkmış.
16. 8 daha parlaktır. Çünkü elektrik yükü daha fazladır.
17. Parlaklıkları eşit değildir. Çünkü şekil 7’de 2 ampul vardır. Paralel bağlıdır. Şekil 8’de ise sadece 1
ampul var.
18. Şekil 7’deki ampul daha sönük yanar.
19. 7’deki lamba 8’deki lambadan daha park değildir.
20. Şekil 8’de tek ampul olduğu için daha parlak yanabilir.
21. 8<7. Çünkü 7’de akım B lambasına da gidiyor. Ancak 8’de sadece A lambasına gidiyor.
22. Şekil 8’deki A lambası daha parlaktır. Çünkü akım yüksektir.
23. 7’deki akım az parlar.
24. 7’deki akım azdır. Çünkü şekil8’de A lambasına etki eden akım daha çoktur.
25. Şekil 8’de daha parlak. Çünkü şekil 7’de 2 ampul bağlanmıştır. Bu yüzden akım ikisine de
gelecektir.
26. Şekil 8’deki A daha parlaktır. Çünkü o daha çok ışık alır. Ama diğerinde B ampulüde olduğu için
B’ye de ışık gider ve ışığı yarıya paylaşırlar.
27. Şekil 8’deki şekil 7’den daha parlaktır.
28. Şekil 7’de akım direkt A lambasına gelmez. Bu yüzden 8 daha parlaktır.
29. Şekil 8’deki B lambası daha parlaktır. Şekil 7’deki A lambasına gelen akım daha az olduğu için
parlak değildir.
30. Şekil 7’de akım ikiye bölünüyor. Bunun için daha az parlak.
31. Şekil 8’deki A lambasına direkt olarak akım gider. Diğer kolda ise kısa devre olur.
32. Şekil 8’de A lambası daha parlaktır.

142
33. Şekil 8’de daha parlak, çünkü; seri bağlı devrelerde lambalar paralel bağlı olanlardan daha
parlaktır.
34. Şekil 7’de daha az parlaktır. Çünkü 7’de A’da parlaklık normalin yarısıdır.
35. 8’deki A lambası daha parlaktır. Çünkü akım direkt gelir. 7’deki A lambasına akım direkt gelmez.
36. Şekil 8’deki daha parlaktır. Çünkü 7. şekilde iki ampul vardır.
37. 8’de daha parlaktır.
Category 2 (They are the same in brightness because current is divided into two branches in both
figures)
1. Aynı parlaklıkta olur.
2. Parlaklıkları aynıdır.
3. Aynıdır çünkü akım gücü aynı
4. Paralel oldukları için parlaklıkları aynıdır.
5. İkisi de aynı. B ampulü alınmasına rağmen orada tel akımın ikiye bölünmesine neden olur. Ampul
olmasa da oradan akım geçer.
6. A lambalarının parlaklıkları her iki devrede de eşittir. Çünkü akım her iki devrede de ikiye
ayrılmıştır.
7. İkisi de aynı parlaklığı gösterir.
Category 3 (Bulb A in Figure 7 is brighter because current does not pass through bulb A in Figure 8)
1. 8 yanmaz, 7 yanar. Çünkü şekil 8’de kısa devre olur. Şekil 7’de lambalar yanar.
2. 8’de kısa devre olur ve A yanmaz.
3. Şekil 8’deki A lambası yanmaz. Çünkü akım direnci sevmez. Direnç olmayan yolu seçer. Şekil
7’deki A lambası yanar, çünkü, üzerinden bir akım geçer.
4. Şekil 7’de akım 3 noktasından geçerek A lambasından geçer. Ancak şekil 8’de akmı dirençle
karşılaşmak istemeyeceğinden A’ya uğramaz. Direkt telden geçer.
5. Şekil 7’deki daha parlaktır. Şekil 8’deki yanmaz. Çünkü kısa devre yapar.
6. Şekil 7’de A daha parlaktır. Şekil 8’de ampul yanmaz. Çünkü kısa devre yapar.
7. Şekil 7’de A daha parlaktır. Şekil 8’de ampul yanmaz. Çünkü kısa devre yapar.
8. Şekil 7’deki ampul yanar, ama şekil 8’de akım ampulden geçmez, düz telden geçer. Bu yüzden
şekil8’deki yanmaz.
9. Şekil 8’deki lambaya akım gitmez ve devre kısa devre olur. Akım her zaman boş teli seçer. Dirençli
tele geçmez.
10. Şekil 7’deki lambanın parlaklığı daha büyüktür. Çünkü akım gitmez, ve kısa devre olur. Akım
daima boş teli seçer.
11. Şekil 7’deki lambanın parlaklığı daha büyüktür. Çünkü akım gitmez, ve kısa devre olur. Akım
daima boş teli seçer.
12. 7A>8A 8’de ampul yanmaz. Akım boş telden geçer.
13. 7A>8A 8’de ampul yanmaz. Akım boş telden geçer.
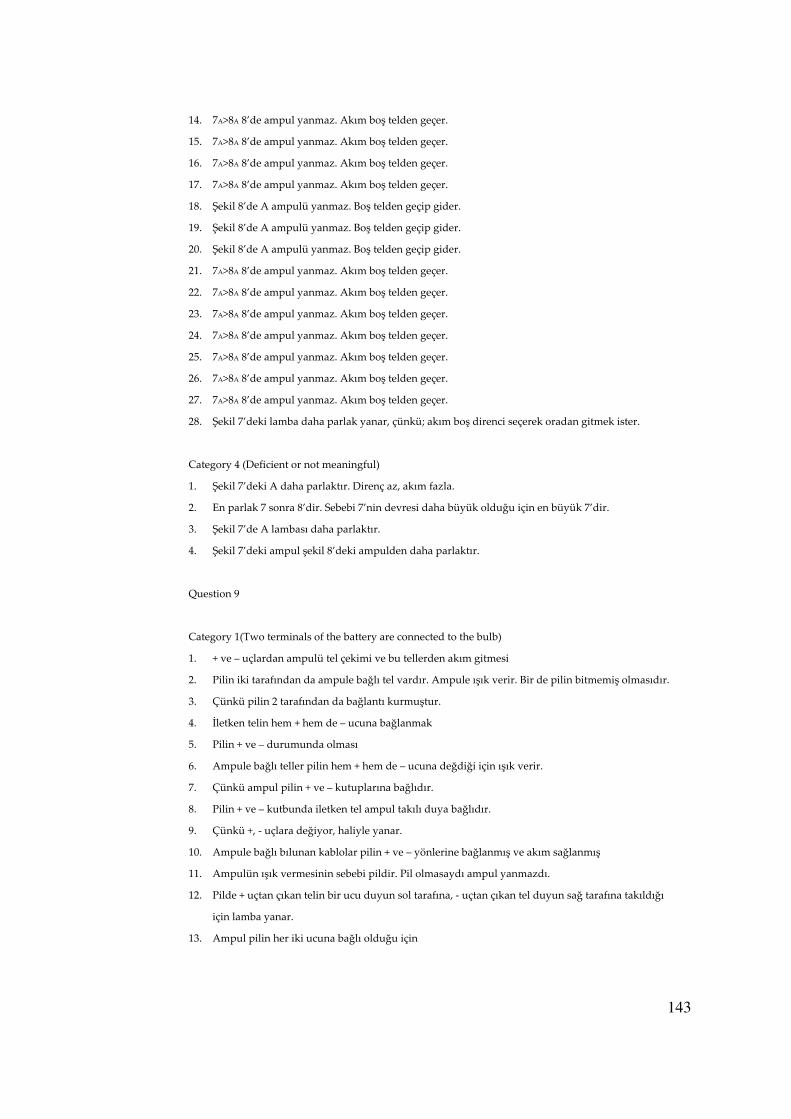
143
14. 7A>8A 8’de ampul yanmaz. Akım boş telden geçer.
15. 7A>8A 8’de ampul yanmaz. Akım boş telden geçer.
16. 7A>8A 8’de ampul yanmaz. Akım boş telden geçer.
17. 7A>8A 8’de ampul yanmaz. Akım boş telden geçer.
18. Şekil 8’de A ampulü yanmaz. Boş telden geçip gider.
19. Şekil 8’de A ampulü yanmaz. Boş telden geçip gider.
20. Şekil 8’de A ampulü yanmaz. Boş telden geçip gider.
21. 7A>8A 8’de ampul yanmaz. Akım boş telden geçer.
22. 7A>8A 8’de ampul yanmaz. Akım boş telden geçer.
23. 7A>8A 8’de ampul yanmaz. Akım boş telden geçer.
24. 7A>8A 8’de ampul yanmaz. Akım boş telden geçer.
25. 7A>8A 8’de ampul yanmaz. Akım boş telden geçer.
26. 7A>8A 8’de ampul yanmaz. Akım boş telden geçer.
27. 7A>8A 8’de ampul yanmaz. Akım boş telden geçer.
28. Şekil 7’deki lamba daha parlak yanar, çünkü; akım boş direnci seçerek oradan gitmek ister.
Category 4 (Deficient or not meaningful)
1. Şekil 7’deki A daha parlaktır. Direnç az, akım fazla.
2. En parlak 7 sonra 8’dir. Sebebi 7’nin devresi daha büyük olduğu için en büyük 7’dir.
3. Şekil 7’de A lambası daha parlaktır.
4. Şekil 7’deki ampul şekil 8’deki ampulden daha parlaktır.
Question 9
Category 1(Two terminals of the battery are connected to the bulb)
1. + ve – uçlardan ampulü tel çekimi ve bu tellerden akım gitmesi
2. Pilin iki tarafından da ampule bağlı tel vardır. Ampule ışık verir. Bir de pilin bitmemiş olmasıdır.
3. Çünkü pilin 2 tarafından da bağlantı kurmuştur.
4. İletken telin hem + hem de – ucuna bağlanmak
5. Pilin + ve – durumunda olması
6. Ampule bağlı teller pilin hem + hem de – ucuna değdiği için ışık verir.
7. Çünkü ampul pilin + ve – kutuplarına bağlıdır.
8. Pilin + ve – kutbunda iletken tel ampul takılı duya bağlıdır.
9. Çünkü +, - uçlara değiyor, haliyle yanar.
10. Ampule bağlı bılunan kablolar pilin + ve – yönlerine bağlanmış ve akım sağlanmış
11. Ampulün ışık vermesinin sebebi pildir. Pil olmasaydı ampul yanmazdı.
12. Pilde + uçtan çıkan telin bir ucu duyun sol tarafına, - uçtan çıkan tel duyun sağ tarafına takıldığı
için lamba yanar.
13. Ampul pilin her iki ucuna bağlı olduğu için

144
14. Duya bağlı olan piller hem + ucuna hem de – ucuna bağlıdır. Üzerinden bir akım geçer. Pile bağlı
olduğu için gerilim vardır.
15. Pil + ve – kutuplardan bağlanıyor ve pilden geçen akım ampulü ulaşıyor.
16. Telerin + ve – uçlara bağlanıp, pilden güç alınmasıdır.
17. Enerji veren bir pilin olması ve devre elemanlarının tam olmasıdır.
18. Hem + hem de – devrelerine bağlanmıştır.
19. Ampulün iki ucunun da pile bağlı olmasıdır.
20. Pil ve ampul birbirlerine doğru kutuplardan bağlanmış
21. Ampulün iki ucunun da pile bağlı olmasıdır.
22. Akım +’dan –‘ye doğrudur. Buda ampulün ışık vermesine etkendir. Çünkü buradaki pilden geçen
akım pozitiften negatife doğrudur.
23. Akım +’dan –‘ye doğrudur. Buda ampulün ışık vermesine etkendir. Çünkü buradaki pilden geçen
akım pozitiften negatife doğrudur
24. Bir üreteç var ve ampul bu üretece + ve – kutuplardan bağlı. Buda ampulün yanması için yeterli.
25. Akım + kutuptan çıkıp – kutba gider
26. Akım + kutuptan çıkıp – kutba gider
27. Akım + kutuptan çıkıp – kutba gider
28. Teller pilin her iki tarafına bağlanarak döngü sağlanmıştır. Ampulün belirli bir dirence sahip
olması
29. Ampulün + ve –uca bağlanması, devrenin tamamlanması
30. Akım + kutuptan çıkıp – kutba gider
31. Akım + kutuptan çıkıp – kutba gider
32. Akım + kutuptan çıkıp – kutba gider
33. Akım + kutuptan çıkıp – kutba gider
34. Akım + kutuptan çıkıp – kutba gider. Bu yüzden ışık saçar.
35. Ampul üretecin iki cunu da bağlıdır.
36. Akım + kutuptan çıkıp – kutba gider
37. Akım + kutuptan çıkıp – kutba gider.
38. Akım + kutuptan çıkıp – kutba gider
39. Akım + kutuptan çıkıp – kutba gider
40. Yanması için elektronların hareket etmesi ve akım oluşması gerekir. Bunun içinde lambalar pilin +
ve – ucuna bağlanır. Bu yüzden ışık verir.
41. Pil vardır. İletken tel vardır. Pilin + ve – uçlarına bağlı ampulün içinde de filaman vardır.
Category 2 (The bulb takes electricity from both of the positive and negative terminals)
1. Her iki kutuptan da enerji alıyor. Yalıtkan tellerle bağlanmış
2. Ampul pilden hem + hem de – yük aldığı için
3. Çünkü ampule hem + hem de – taraftan güç gelmektedir.
4. Çünkü ampul hem + hem de – yüklü uçtan elektrik aldığı için
5. İki ucunda elektrik vermesi

145
6. + ve – yükle bağlanmıştır.
7. İki kutuptan da akım gelmesi ve pildir.
8. Her iki kutuptan da enerji alması
9. Pil, + ve – yükler
10. + ve – birbirini çektiği için ampul daha iyi ışık verir.
11. + ve – yükler birleşerek bir enerji ortaya çıkar, buda ampulün içinde çıkardığı enerji ışık enerjisine
döner, bu yüzden yanar.
12. Pillerin uçlarındaki yükler
13. Nedeni pilden + ve – yük alarak ampulün ışık vermesinin sağlanmasıdır.
14. Pildeki enerji akım kuvveti yanmasını sağlar. Yükler pile geçer.
15. Elektrik akımı hem + hem de- olduğu için yanar.
16. Ampul hem + hem de –‘ye bağlandığından, iki devreden de ampule akım gelir.
17. + ve – yüke bağlanmış olması
18. Hem + hem de – yüklere bağlı
Category 3 (A connection between a bulb and the negative terminal of a battery is enough to light up a
bulb)
1. Ampul ışık verir, çünkü bir pile bağlı pilin – ucundan gelen akım ampulün yanmasını sağlar.
Category 4 (A connection between a bulb and the positive terminal of a battery is enough to light up a
bulb)
1. + uca bağlı olduğu için yanar.
Category 5 (Deficient or not meaningful)
1. Çünkü + ve – birbirini sevmediği için elektronu dışarıya verir ve ampulün parlamasına sebep olur.
Question 10
Category 1 (It changes in the first case, but not in the second case because only R1 affects the bulb)
1. V=IR. Akım her yerden aynı geçer. Yalnız R’ler etkiler. R1 etkiler lambayı çünkü, ilk akım oradan
geçer.
2. V=IR. Akım her yerden aynı geçer. Yalnız R’ler etkiler. R1 etkiler lambayı çünkü, ilk akım oradan
geçer.
3. V=IR. Akım her yerden aynı geçer. Yalnız R’ler etkiler. R1 etkiler lambayı çünkü, ilk akım oradan
geçer.
4. İlk durum: Azalır. Akım daha büyük bir dirençten etkileniyor. İkinci durum: Değişmez. Ampulün
etkilendiği direnç R1.

146
5. İlk durum: Azalır. Akım daha büyük bir dirençten etkileniyor. İkinci durum: Değişmez. Ampulün
etkilendiği direnç R1.
6. İlk durum: Azalır. Akım daha büyük bir dirençten etkileniyor. İkinci durum: Değişmez. Ampulün
etkilendiği direnç R1.
7. İlk durum: Azalır. Akım daha büyük bir dirençten etkileniyor. İkinci durum: Değişmez. Ampulün
etkilendiği direnç R1.
8. İlk durum: Azalır. Akım daha büyük bir dirençten etkileniyor. İkinci durum: Değişmez. Ampulün
etkilendiği direnç R1.
9. İlk durum: Azalır. Akım daha büyük bir dirençten etkileniyor. İkinci durum: Değişmez. Ampulün
etkilendiği direnç R1.
10. İlk durum: Azalır. Akım daha büyük bir dirençten etkileniyor. İkinci durum: Değişmez. Ampulün
etkilendiği direnç R1.
11. İlk durum: Azalır. Akım daha büyük bir dirençten etkileniyor. İkinci durum: Değişmez. Ampulün
etkilendiği direnç R1.
12. İlk durum: Azalır. Akım daha büyük bir dirençten etkileniyor. İkinci durum: Değişmez. Ampulün
etkilendiği direnç R1.
13. İlk durum: Azalır. Akım daha büyük bir dirençten etkileniyor. İkinci durum: Değişmez. Ampulün
etkilendiği direnç R1.
14. İlk durum: Azalır. Akım daha büyük bir dirençten etkileniyor. İkinci durum: Değişmez. Ampulün
etkilendiği direnç R1.
15. İlk durum: Azalır. Akım daha büyük bir dirençten etkileniyor. İkinci durum: Değişmez. Ampulün
etkilendiği direnç R1.
16. İlk durum: Azalır. Akım daha büyük bir dirençten etkileniyor. İkinci durum: Değişmez. Ampulün
etkilendiği direnç R1.
17. İlk durum: Azalır. Akım daha büyük bir dirençten etkileniyor. İkinci durum: Değişmez. Ampulün
etkilendiği direnç R1.
Category 2 (It changes in the second case, but not in the first case because only R2 affects the bulb)
1. İlk durum: R1 direncinin 20 ohm olması bir şeyi değiştirmez. Çünkü; akımın geldiği son noktadır.
İkinci durum: R2 direncinin 20 ohm olması ile ampulün parlaklığı azalma gösterebilir.
Category 3 (It does not change in both cases)
1. Her iki durumda da değişiklik olmaz. Çünkü seri bağlıdır.
2. Değişiklik olmaz. Her durumda da 20 ohm’luk direnç var.
3. Değişiklik olmaz. Aynı akımı ilettiği için.
4. Her iki durumda da değişiklik olmaz.
5. Aynı dirençler bağlıdır. Değişiklik olmaz.
6. Aynı dirençler bağlıdır. Değişiklik olmaz.

147
7. Aynı dirençler bağlıdır. Değişiklik olmaz.
8. Aynı dirençler bağlıdır. Değişiklik olmaz.
Category 4 (Deficient or not meaningful)
1. İlk durum: 10+10=20 ohm. Sonra 10+20=30ohm. İkinci durum: 10+10=20 ohm. Sonra 10+20=30ohm.
Evet olur. Devreden geçen akım şiddeti değişir.
2. Her iki durumda da değişiklik olur. Çünkü, üretecin akımı öbür dirence de gideceği için
dirençlerin ohm’u düşer.
3. İlk durum: Mesela devrenin gerilimi 40 V ve lambanın direnci de 10 ohm ise bu durumda
devreden bir akım geçer ve ampulün gerilimi 10 V’dur. İkinci durum: 40 = IReş, 40 = I.40, I=1 ve
Vlamba=1.10=10V olur. Yani parlaklıkta bir değişiklik olmaz.
4. İlk durum: Mesela devrenin gerilimi 40 V ve lambanın direnci de 10 ohm ise bu durumda
devreden bir akım geçer ve ampulün gerilimi 10 V’dur. İkinci durum: 40 = IReş, 40 = I.40, I=1 ve
Vlamba=1.10=10V olur. Yani parlaklıkta bir değişiklik olmaz.
5. İlk durum: Mesela devrenin gerilimi 40 V ve lambanın direnci de 10 ohm ise bu durumda
devreden bir akım geçer ve ampulün gerilimi 10 V’dur. İkinci durum: 40 = IReş, 40 = I.40, I=1 ve
Vlamba=1.10=10V olur. Yani parlaklıkta bir değişiklik olmaz.
6. İkinci durumda ampul daha parlak. Çünkü direnç arttıkça parlaklık artar.
7. İlk durum: Daha parlak yanar. Çünkü direnç daha fazladır. Ampulden direnç geçmektedir. İkinci
durum: Daha sönük yanar. Direnç ampule uğramamıştır.
8. İlk durum: Daha parlak yanar. Çünkü direnç daha fazladır. Ampulden direnç geçmektedir. İkinci
durum: Daha sönük yanar. Direnç ampule uğramamıştır.
9. İlk durum: Daha parlak yanar. Çünkü direnç daha fazladır. Ampulden direnç geçmektedir. İkinci
durum: Daha sönük yanar. Direnç ampule uğramamıştır.
10. İlk durumda normal bir parlaklıkla yanar. İkinci durumda daha parlak yanar. Direnç arttıkça
parlaklık artar.
Question 11
Category 1 (RKL>RMN)
1. İlk durumda bağlantı düz olduğu için direnç daha fazladır. İkincisinde paralel olduğu için direnç
daha azdır.
2. İlk durumda bağlantı seri olduğu için direnç daha fazladır. İkincisinde paralel olduğu için direnç
daha azdır.
3. Rkl>Rmn
4. İlk durumda bağlantı düz olduğu için direnç daha fazladır. İkincisinde paralel olduğu için direnç
daha azdır.
5. İlk durumda bağlantı seri olduğu için direnç daha fazladır. İkincisinde paralel olduğu için direnç
daha azdır.

148
6. İlk durumda bağlantı seri olduğu için direnç daha fazladır. İkincisinde paralel olduğu için direnç
daha azdır.
7. RKL seri bağlı olduğu için eşdeğer direnci daha fazladır.
8. RKM>RMN
9. KL>MN. K-L seri bağlıdır. M-N ise paralel bağlıdır.
10. RKL=R1+R2 ve RMN=(R1.R2) / (R1+R2)’dir. Bundan dolayı RKL>RMN
11. RKL=R1+R2 ve RMN=(R1.R2) / (R1+R2)’dir. Bundan dolayı RKL>RMN
12. Şekil 11 seri bağlıdır. Eşdeğer direnç dirençlerin toplamıdır. Diğer şekil ise paraleldir. Eşdeğer
direnç azalır. Bundan dolayı ilk eşdeğer direnç daha büyüktür.
13. Şekil 11>Şekil 12. Çünkü güç yarıma düşer. Şekil 11’de ise düz bağlıdır.
14. RKL=R1+R2 ve RMN=(R1.R2) / (R1+R2)’dir. Bu durmda aynı olamaz.
15. Birincisi seri bağlıdır. İkincisi paralel.
16. Birincisi 2R1. İkincisi ise R1/2’dir. ReşKL>ReşMN
17. İlki seri bağlı olduğu için daha büyüktür.
18. Birincisi 2R1. İkincisi ise R1/2’dir. ReşKL>ReşMN
19. (R1+R2) >(R1.R2) / (R1+R2)’dir. Bundan dolayı RKL>RMN
20. RKL=R1+R2 ve RMN=(R1.R2) / (R1+R2)’dir. Bundan dolayı RKL>RMN
21. RKL=R1+R2 ve RMN=(R1.R2) / (R1+R2)’dir. Bundan dolayı RKL>RMN
22. RKL=R1+R2 ve RMN=(R1.R2) / (R1+R2)’dir. Bundan dolayı RKL>RMN
23. RKL=R1+R2 ve RMN=(R1.R2) / (R1+R2)’dir. Bundan dolayı RKL>RMN
24. RKL=R1+R2 ve RMN=(R1.R2) / (R1+R2)’dir. Bundan dolayı RKL>RMN
25. RKL=R1+R2 ve RMN=(R1.R2) / (R1+R2)’dir. Bundan dolayı RKL>RMN
26. RKL=R1+R2 ve RMN=(R1.R2) / (R1+R2)’dir. Bundan dolayı RKL>RMN
27. RKL=R1+R2 ve RMN=(R1.R2) / (R1+R2)’dir. Bundan dolayı RKL>RMN
28. RKL=R1+R2 ve RMN=(R1.R2) / (R1+R2)’dir. Bundan dolayı RKL>RMN
29. RKL=R1+R2 ve RMN=(R1.R2) / (R1+R2)’dir. Bundan dolayı RKL>RMN
30. Birincisi 2R1. İkincisi ise R1/2’dir. ReşKL>ReşMN
31. Birincisi 2R1. İkincisi ise R1/2’dir. ReşKL>ReşMN
32. Birincisi 2R1. İkincisi ise R1/2’dir. ReşKL>ReşMN
33. Birincisi 2R1. İkincisi ise R1/2’dir. ReşKL>ReşMN
Category 2 (RKL=RMN)
1. İkisi de eşittir. İlkinde seri, ikincisin de paraleldir.
2. İkisi de eşittir
3. Eşittir. Çünkü, ikisi de aynı şekilde akım iletir ve ulaşır.
4. RKL=RMN
Category 3 (RKL<RMN)

149
1. Seri ve paralel bağlı oldukları için eşdeğer paralelde daha çoktur.
Question 12
Category 1(Yes, it lights up)
1. Verir, çünkü iki tarafla da bağlantı kurulmuştur.
2. Işık verir. Her iki uca da iletken tel değiyor. Ve ampule iletken tel değiyor.
3. Işık verir. Çünkü düz bağlanmıştır.
4. Işık verir. Ampul telle bağlandığı için + ve – yüklere dokundurulduğu için yanar.
5. Işık verir. Ampul telle bağlandığı için + ve – yüklere dokundurulduğu için yanar.
6. Verir, çünkü ampul iki kutba da bağlıdır.
7. Verir, çünkü elektrik teli bağlanmıştır.
8. Verir. Çünkü kablo hem – hem de+ değiyor. Değince de yanar.
9. Verir. Elektrik devresi hem – yüke hem de + yüke bağlandığı için ışık verir.
10. Verir. Elektrik devresi hem – yüke hem de + yüke bağlandığı için ışık verir.
11. Verir. Çünkü pilin iki ucu da bağlı.
12. Işık verir. Çünkü -, + kutupları ampulü yakar.
13. Işık verir. Hem alt tarafından elektrik yükü verilmiş hem de üst tarafından – ve + elektrik yükünün
birleşmesiyle ampul ışık verir.
14. Evet verir, çünkü pilden + ve – yük aldığı için ışık verir.
15. Verir. Çünkü teller + ve – uçlarına ve ampule bağlanmıştır.
16. Ampul ışık verir. Çünkü kablonun ucu + ve – kutba da değiyor.
17. Işık verir. Çünkü kablonun + kısmının ucu – kısmına değdiriliyor.
18. Tabi ki ışık verir. Çünkü her iki kutba da bağlı.
19. Işık verir. Çünkü lambaya temas halinde. Bağlı olduğu için.
20. Yanar. Çünkü ampul üretece bağlı.
21. Ampul ışık verir. Çünkü – uca bağlanmıştır.
22. Verir. Çünkü teller + ve – uçlarına ve ampule bağlanmıştır.
23. Verir. Teller hem + hem de – geçer.
24. Verir. Çünkü teller + ve – uçlarına ve ampule bağlanmıştır.
25. Verir. Eğer telin ucu sadece +’ya olsaydı ışık vermezdi ama telin bir ucu da –‘de. Buda telin ışık
vermesine sebep olur.
26. Işık verir. Çünkü ampul pilin hem + hem de- ucuna bağlı.
27. Ampul yanar. Akım + ve – yüklerle bağlanıp ampule gitmiştir.
28. Işık verir. Çünkü ampul pilin – ucuna ve + ucuna bağlanmıştır.
29. Verir. Çünkü – uca bağlanmıştır.
30. Verir. Çünkü – uca bağlanmıştır.
31. Verir. İletken tel yardımıyla.
32. ışık verir. Çünkü lambaya ister +’dan ister –‘den akım gelebilir.
33. Verir. Çünkü her iki kutuptan da akım alıyor.

150
34. Işık verir. Tel sayesinde elektron geçişi sağlanır.
35. Evet ışık verir. Çünkü tel sayesinde elektron geçişi olur.
36. Evet ışık verir. Çünkü tel sayesinde elektron geçişi olur. Telin bir ucu + bir ucu – uca bağlanmıştır.
37. Yanar. + ve –‘ye değer.
38. Yanar. + ve –‘ye değer.
39. Yanar. + ve –‘ye değer.
40. Yanar. + ve –‘ye değer.
41. Yanar. + ve –‘ye değer.
42. Ampul – ve +’ya bağlı olduğu için yanar.
43. Ampul ışık verir. Çünkü akım +’dan –‘ye gitmektedir.
44. Ampul ışık verir. Çünkü akım +’dan –‘ye gitmektedir.
45. Yanar. + ve –‘ye değer.
46. Ampul ışık verir.
47. Yanar. + ve –‘ye değer.
48. Işık verir. Çünkü ampul pilin hem + hem de- ucuna bağlı.
49. Yanar. + ve –‘ye değer.
50. Yanar. + ve –‘ye değer.
51. Yanar. + ve –‘ye değer.
Category 2 (No, it does not light)
1. Vermez. Kısa devre yapar.
2. Işık yanmaz. Çünkü ampule değmez. Kısa devre yapar, ışık vermez.
3. Vermez, çünkü; tek kablo ile hem + hem de – kutuptan enerji alınmaz. Kabloda + ve – enerjiler
birbirine karışır.
4. Vermez, sebebi de tel pillerin ortasından değil, ucuna takılması gerekir. Bu yüzden ışık vermez.
5. Vermez.
6. Vermez, çünkü…
7. Yanmaz, çünkü iletken tel ampule değmiyor.
8. Vermez. Çünkü kısa devre yapar.
9. Işık vermez. Çünkü tel ampule değmemiş.
10. Vermez. Ampul direkt bağlanmış
11. Vermez, çünkü kısa devre yapar.
12. Işık vermez. Çünkü ampul bağlama şekli doğru değildir. Kısa devre yapar, yanmaz. Ampul duya
bağlanmamıştır.
13. Işık vermez. Çünkü kısa devre yapar.
14. Ampul ışığı vermez. Çünkü kısa devre yapar.Vermez, çünkü kısa devre yapar.
15. Kısa devre yapar vermez.
16. Kısa devre yapar. Çünkü – yükü yine + uca geri verir. Ampule etki etmez.
17. Vermez, çünkü ampule doğru olarak bağlanmamış.

151
18. Vermez. Çünkü devrede kısa devre var. Lambanın yan tarafına değdirilmelidir.
19. Vermez. Çünkü devrede kısa devre var. Lambanın yan tarafına değdirilmelidir.
20. Hayır vermez. Çünkü + uca temas yoktur.
21. Vermez, Çünkü iletken tel pilin + ve – ucuna bağlı değil.
22. Işık vermez. Ampul – uca bağlı değil.
23. Vermez. Çünkü ampule bağlı uç ampulün uç kısmına bağlanması lazım.
24. Vermez.
25. Vermez.
26. Vermez. Çünkü – uç duya bağlanmamış.
27. Vermez. Bir telin iki kutba değmesi yüzünden yanmaz.
28. Işık vermez. Nedeni tellerin uçlarının tam olarak değmesi gerekir. + ve – uçlarına tel
dokundurulursa ampul yanar.
Question 13
Category 1 (i1>i3>I2 because most of the current passes straight the branch at which point 3 is on)
1. 1>3>2
1. Devre 1’de akım büyüktür. Sonra 3’de, sonra da 2’de.
2. Önce 1, sonra 3, sonra da 2’ye gider. Çünkü elektrik akımı hep düz gider.
3. 1>3>2
4. 1’in akım şiddeti büyüktür. Çünkü ok işareti 1’den geçerek diğer sayılara geçer. 3’ün akımı 2’den
fazladır. Çünkü elektrik akımı hiç kıvrılmadan düz giderse daha çabuk ulaşır. 2 akım şiddeti en
azdır.
5. 1>3>2. 1 noda akım daha önce olduğu için büyüktür. 3 numarada akım birden direkt geldiği için
fazladır. 2’de daha azdır.
6. 1>3>2
7. 1. akım>3. akım>2. akımdır.
8. 1>3>2. Çünkü ilk olarak 1’e, ikinci 3’e, 3. de 2’ye akım gider.
9. 1>3>2. Akımın yönü 1 yönünde, ondan 1 büyüktür.
10. 1>3>2. Akım ilk 1’e, oradan 3’e, sonra 2’ye gittiği için.
Category 2 (i1>i2=I3 because current divides equally at the junction)
1. Direncin fazla olduğu yerde akım az, direncin az olduğu yerde akım fazladır.
2. 1>2=3
3. 1>2=3.
4. 1>2=3’dür. Çünkü 1 i aynı şekilde geçer. Sonra ise 2 kola ayrılır. Bu yüzden de eşit olur.
5. 1 büyüktür. 2 ve 3 ise eşittir.
6. 1 büyüktür. 2 ve 3 ise eşittir. Çünkü akım orada 2’ye ayrılır.

152
7. 1’de akım ana kolda olduğu için fazladır. 2 ve 3 noktalarında akım eşittir. Çünkü ana koldan ikiye
ayrılıyor.
8. 1’in akım şiddeti en büyüktür. 2 ve 3 birbirine eşittir ve toplamları 1’in akım şiddetini verir.
9. Şekil I’de daha fazla, Şelil II veIII’de eşittir.
10. 1>2=3. Çünkü örnek veriyorum. Elektrik akımı 1’e i diye gelir. Daha sonra 2’ye ve 3’e i/2 diye
ayrılır.
11. 1’de fazladır. 2 ve 3’de eşittir.
12. 1>2=3. Çünkü 1’de akım i’dir, seridir. 2 ve 3’de ise akım i/2’dir. Çünkü akım ikiye ayrılır.
13. En büyük 1’dir. Daha sonra akım 2 kola ayrılır. 2 ve 3’ün akım şiddeti 1’den küçük ve birbirine
eşittir.
14. 1>2=3
15. 1>2=3. Çünkü 1’de akımın hepsi geçer. 2 ve 3’de ise akım ikiye bölündüğü için akımın yarısı geçer.
16. 1>2=3. Akım kollara ayrılmadan geldiği için büyüktür. 2 ve 3’e gelmeden önce akım iki kola ayrılır.
17. 1>2=3.
18. 1>2=3. Paralel devrede akım eşit oluşur.
19. 1>2=3.
20. i1>i2=i3, i1>i2+i3
21. i1>i2=i3, i1>i2+i3
22. i1>i2=i3, i1>i2+i3
23. i1>i2=i3, i1>i2+i3
24. 1>2=3. Ana koldan gelen akmım 1 olduğu için 1 daha büyüktür. 2 ve 3’de akımlar 1’den ayrılır.
25. 1>2=3
26. i1>i2=i3, i1>i2+i3
27. i1>i2=i3, i1>i2+i3
28. i1>i2=i3, i1>i2+i3
29. i1>i2=i3, i1>i2+i3
30. i1>i2=i3, i1>i2+i3
31. i1>i2=i3, i1>i2+i3
32. i1>i2=i3, i1>i2+i3
33. i1>i2=i3, i1>i2+i3
34. i1>i2=i3, i1>i2+i3
35. i1>i2=i3, i1>i2+i3
36. i1>i2=i3, i1>i2+i3
Category 3 (Deficient or not meaningful)
1. 1 ve 3 noktalarının büyüklüğü eşittir. 2’nin ise daha fazladır.
2. Akımların büyüklükleri aynı.
Question 14

153
Category 1 (Bulbs A and B are the same in brightness)
1. Eşit gider. İkisi de aynı anda yanar.
2. Parlaklıkları aynıdır. Birbirlerine paralel oldukları için.
3. Karşılaştırdığımızda A ve B’nin parlaklıkları aynıdır.
4. A ve B aynı parlaklıkta yanarlar.
5. Parlaklıkları aynıdır. Ama ilk önce B sonra A yanar.
6. Parlaklıkları aynı. Aynı boyda ve büyüklüktedirler.
7. Parlaklıkları eşittir. Çünkü paralel bağlanmışlardır. Akım 3 eşit parçaya ayrılır.
8. Parlaklıkları aynıdır. Birbirlerine paralel oldukları için.
9. Eşit olur. Çünkü paralel akım kollara eşit şekilde ayrılır.
10. Parlaklıkları eşittir. Ama B daha parlaktır gibi görünüyor.
11. Parlaklıklar eşittir.
12. A=B.Çünkü devre paraleldir.
13. İkisi de aynı yanar. Çünkü aynı direnç geçer.
14. Parlaklıkları eşittir. Çünkü paralel oldukları için geçen akımlar eşittir.
15. Eşittir. Parlaklıkları eşit olur.
16. A=B. Akımlar 3’e bölünür ve A ile B’nin aynı şekilde ışık vermesini sağlar.
Category 2 (Bulb B is brighter)
1. B ampulü A ampulünden daha parlaktır. Çünkü B akımı daha önce alır.
2. B ampulü daha parlaktır. Enerji daha önce gelir.
3. B’de daha fazla
4. B pile daha yakın olduğundan daha parkaltır.
5. B A’ya göre daha parlaktır. Çünkü pilden gelen ilk enerji ilk önce ondan geçer.
6. B daha parlaktır. Çünkü akımı önce B alır.
7. B daha parlaktır. Çünkü pilin enerjisi A ‘dan daha çabuk B’ye gelir.
8. B ampulü daha parlaktır. Çünkü B ampulü pile daha yakındır.
9. B pile daha yakın olduğu için daha bir parlak yanar.
10. B daha parlaktır. Çünkü elektrik B’ye daha yakındır.
11. B daha parlak. Akım önce B’ye gelir.
12. B A’dan parlaktır. Pile daha uzak olduğu için.
13. B’de A’ya göre daha parlaktır.
14. B>A. Çünkü enerji ilk başta o lambaya gittiği için
15. B ampulü daha parlaktır. Çünkü önce B’ye geçer.
16. B ampulü daha parlaktır. Çünkü akım en başta B’deb geçmektedir.
17. B, A’ya göre daha parlak yanar. İlk akım B’den geçer.
18. B, A’ya göre daha parlak yanar.
19. B>A. Çünkü B’de sadece iki kola ayrılıyor. Ama A’ya gelinceye kadar daha fazla kola ayrılıyor.
20. B daha parlak yanar. A’nın parlaklığı daha azdır.
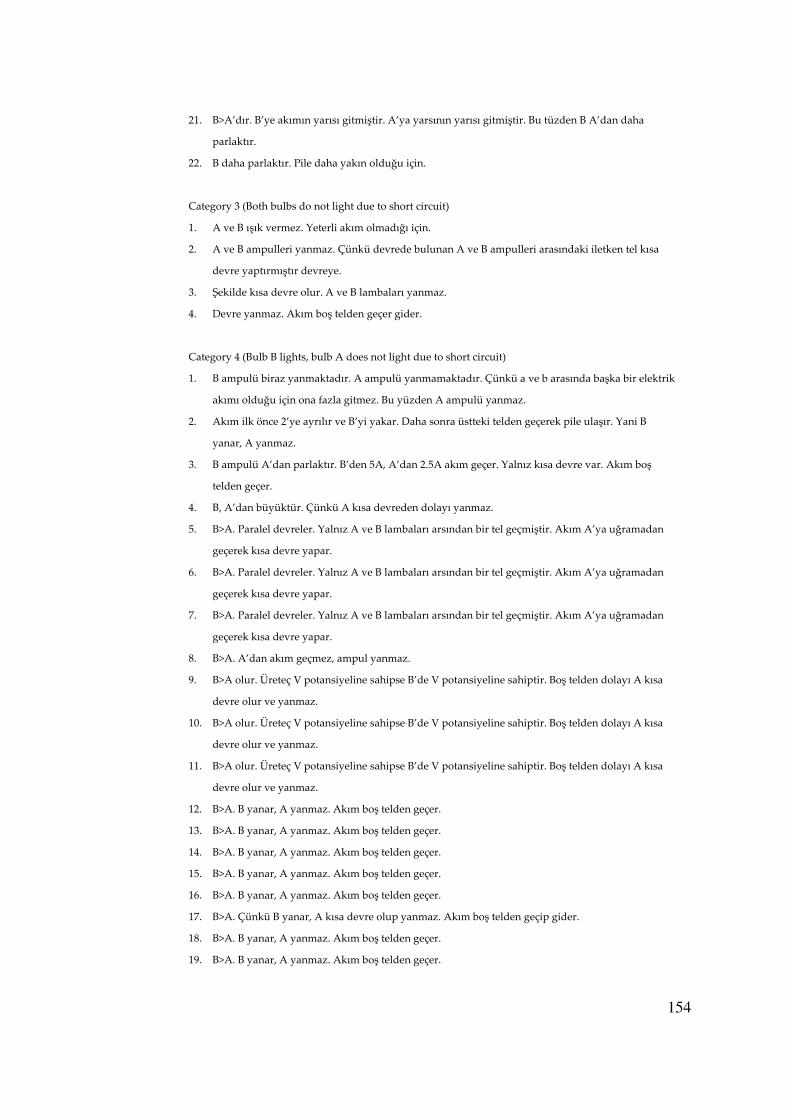
154
21. B>A’dır. B’ye akımın yarısı gitmiştir. A’ya yarsının yarısı gitmiştir. Bu tüzden B A’dan daha
parlaktır.
22. B daha parlaktır. Pile daha yakın olduğu için.
Category 3 (Both bulbs do not light due to short circuit)
1. A ve B ışık vermez. Yeterli akım olmadığı için.
2. A ve B ampulleri yanmaz. Çünkü devrede bulunan A ve B ampulleri arasındaki iletken tel kısa
devre yaptırmıştır devreye.
3. Şekilde kısa devre olur. A ve B lambaları yanmaz.
4. Devre yanmaz. Akım boş telden geçer gider.
Category 4 (Bulb B lights, bulb A does not light due to short circuit)
1. B ampulü biraz yanmaktadır. A ampulü yanmamaktadır. Çünkü a ve b arasında başka bir elektrik
akımı olduğu için ona fazla gitmez. Bu yüzden A ampulü yanmaz.
2. Akım ilk önce 2’ye ayrılır ve B’yi yakar. Daha sonra üstteki telden geçerek pile ulaşır. Yani B
yanar, A yanmaz.
3. B ampulü A’dan parlaktır. B’den 5A, A’dan 2.5A akım geçer. Yalnız kısa devre var. Akım boş
telden geçer.
4. B, A’dan büyüktür. Çünkü A kısa devreden dolayı yanmaz.
5. B>A. Paralel devreler. Yalnız A ve B lambaları arsından bir tel geçmiştir. Akım A’ya uğramadan
geçerek kısa devre yapar.
6. B>A. Paralel devreler. Yalnız A ve B lambaları arsından bir tel geçmiştir. Akım A’ya uğramadan
geçerek kısa devre yapar.
7. B>A. Paralel devreler. Yalnız A ve B lambaları arsından bir tel geçmiştir. Akım A’ya uğramadan
geçerek kısa devre yapar.
8. B>A. A’dan akım geçmez, ampul yanmaz.
9. B>A olur. Üreteç V potansiyeline sahipse B’de V potansiyeline sahiptir. Boş telden dolayı A kısa
devre olur ve yanmaz.
10. B>A olur. Üreteç V potansiyeline sahipse B’de V potansiyeline sahiptir. Boş telden dolayı A kısa
devre olur ve yanmaz.
11. B>A olur. Üreteç V potansiyeline sahipse B’de V potansiyeline sahiptir. Boş telden dolayı A kısa
devre olur ve yanmaz.
12. B>A. B yanar, A yanmaz. Akım boş telden geçer.
13. B>A. B yanar, A yanmaz. Akım boş telden geçer.
14. B>A. B yanar, A yanmaz. Akım boş telden geçer.
15. B>A. B yanar, A yanmaz. Akım boş telden geçer.
16. B>A. B yanar, A yanmaz. Akım boş telden geçer.
17. B>A. Çünkü B yanar, A kısa devre olup yanmaz. Akım boş telden geçip gider.
18. B>A. B yanar, A yanmaz. Akım boş telden geçer.
19. B>A. B yanar, A yanmaz. Akım boş telden geçer.

155
20. B>A. B yanar, A yanmaz. Akım boş telden geçer.
21. B>A. B yanar, A yanmaz. Akım boş telden geçer.
22. B>A. Çünkü B yanar, A kısa devre olup yanmaz. Akım boş telden geçip gider.
23. B>A. Çünkü B yanar, A kısa devre olup yanmaz. Akım boş telden geçip gider.
24. B>A. B yanar, A yanmaz. Akım boş telden geçer.
25. A yanmaz. Kısa devre olur. Çünkü akım her zaman kolay kolu seçer.
Category 5 (Deficient or not meaningful)
1. A ampulü daha parlaktır. Çünkü akım ilk A’dan geçer.
2. Sonuçta ikisinin de akımları aynı ve aynı dirençler. Ama paralel olduğu için akım da A’dan daha
çok geçer. A’daki akım B’deki akımdan daha fazladır.
3. A’da daha fazladır. B’de ise daha azdır.
4. A uzak olduğu için daha parlaktır.
5. A daha parlaktır. Çünkü akım önce A’ya sonra B’ye gelir.

156
APPENDIX F
SPECIFICATIONS FOR THE OPEN-ENDED QUESTIONNAIRE
Items 1 2 3 4 5 6 7 8 9 10 11 12 13 14 Total
M1 * * 2 M2 * 1 M3 * * * 3 M4 * * 2 M5 * * 2 M6 * * * 3 M7 * * 2 M8 * * 2 M9 * 1 M10 * * 2 M11 * * 2
Mis
co
nce
ption
s
M12 * 1 Total 2 1 1 2 3 2 2 1 2 1 1 2 1 2 23
EXPLANATIONS M1 : Sink Model M2 : Attenuation Model M3 : Sharing Current Model M4 : Clashing Current Model M5 : Empirical Rule Model M6 : Short Circuit Misconception M7 : Power Supply as a Constant Current Source Model M8 : Parallel Circuit Misconception M9 : Sequential Reasoning M10 : Local Reasoning M11 : Confusion between Current Flow and Water Flow M12 : Vibrating Tungsten Filament

157
APPENDIX G
SIMPLE ELECTRIC CIRCUIT DIAGNOSTIC TEST

158
SORULAR
1.1. Şekil 1’de gösterilen devredeki ampul ışık verir mi?
(a) Evet, ışık verir. (b) Hayır, ışık vermez.
1.2. Yukarıda verdiğim cevabın sebebi; (a) Pil ve ampul temas halindedir. (b) “+” ve “-” yüklerin ampulde birleşmesi için pilin “-” ucundan ampulün
yan metal kısmına bir tel bağlanmalıdır. (c) Ampulden akım geçmesi için pilin “-” ucundan ampulün yan metal
kısmına bir tel bağlanmalıdır. (d) ………………………………………………………………………
1.3. Yukarıdaki iki soruya verdiğim cevaptan; (a) Eminim. (b) Emin değilim.
2.1. Şekil 2’deki elektrik devresinde ana koldaki akım 1,2 A olarak verilmiştir.
Buna göre i1, i2 ve i3 akımlarının büyüklüklerinin değerleri kaçtır?
(a) 0,6 / 0,3 / 0,3 (b) 0,4 / 0,4 / 0,4
2.2. Yukarıda verdiğim cevabın sebebi;
(a) Elektrik akımı ilk kol ayrımında eşit olarak ikiye ayrıldıktan sonra ikinci kol ayrımında tekrar eşit olarak ikiye ayrılır.
(b) Üç özdeş ampul birbirine paralel bağlı olduğundan ana koldaki elektrik akımı üç ampul üzerinden de aynı büyüklükte geçecek şekilde kollara ayrılır.
(c) ………………………………………………………………………… 2.3. Yukarıdaki iki soruya verdiğim cevaptan;
(a) Eminim. (b) Emin değilim.

159
3.1. Şekil 3 ve Şekil 4’deki 1 noktalarından geçen elektrik akımlarının
büyüklüklerini karşılaştırınız? (a) Şekil 3’de daha fazladır. (b) Şekil 4’de daha fazladır. (c) Her iki şekilde de eşittir.
3.2.Yukarıda verdiğim cevabın sebebi;
(a) Pilden gelen aynı büyüklükteki elektrik akımları her iki şekilde de 1 noktalarında henüz kullanılmamıştır.
(b) Her iki şekilde de pillerin sağladığı potansiyel farklar aynı ama Şekil 4’deki eşdeğer direnç daha büyüktür.
(c) Şekil 3’de bir ampulün kullandığı elektrik akımı, Şekil 4’de ise iki ampulün kullandığı elektrik akımı vardır.
(d) ……………………………………………………………………… 3.3. Yukarıdaki iki soruya verdiğim cevaptan;
(a) Eminim. (b) Emin değilim.
4.1. Şekil 4’de 1, 2 ve 3 noktalarındaki akımların büyüklükleri ile A ve B
ampullerinin parlaklıklarını karşılaştırınız? Akım Parlaklık
(a) i1 = i2 = i3 A ve B ampulleri aynı parkalıktadır. (b) i3 > i2 > i1 B ampulü daha parlaktır. (c) i1 > i2 > i3 A ampulü daha parlaktır. (d) i1 > i2 > i3 A ve B ampulleri aynı parlaklıktadır.
4.2.Yukarıda verdiğim cevabın sebebi; (a) Pile ne kadar çok yakın olunursa, elektrik akımı da o kadar çok olur. (b) Seri bağlı devrelerde akım şiddeti her yerde aynıdır. (c) Elektrik akımı ampuller tarafından kullanıldığı için azalır. (d) …………………………………………………………………………
4.3.Yukarıdaki iki soruya verdiğim cevaptan;
(a) Eminim. (b) Emin değilim.
Şekil 3’de gösterilen bir elektrik devresine, Şekil 4’de gösterildiği gibi bir B ampulü ekleniyor. 3. ve 4. soruları bu bilgiye göre cevaplandırınız.

160
5.1. Şekil 5 ve Şekil 6’deki 1 noktalarındaki elektrik akımlarının büyüklüklerini
karşılaştırınız. (a) Şekil 5’de daha büyüktür. (b) Şekil 6’da daha büyüktür. (c) Şekil 5’de ve Şekil 6’da eşittir.
5.2.Yukarıda verdiğim cevabın sebebi; (a) Şekil 6’da iki ampul olduğundan eşdeğer direnç daha fazladır. (b) Şekil 6’da pilden gelen akım iki kola ayrılır. (c) Şekil 5’de pil tek ampule, Şekil 6’da ise iki ampule akım verir. (d) Şekil 6’daki paralel devrede eşdeğer direnç daha küçüktür. (e) Her iki şekilde de 1 noktalarında pilden gelen aynı büyüklükteki
elektrik akımı henüz kollara ayrılmamıştır. (f) …………………………………………………………………………
5.3.Yukarıdaki iki soruya verdiğim cevaptan;
(a) Eminim. (b) Emin değilim.
6.1. Şekil 6’da 1, 2 ve 3 noktalarındaki akımların büyüklüklerini karşılaştırınız.
(a) i1 > i2 > i3 (b) i1 > i2 = i3
6.2.Yukarıda verdiğim cevabın sebebi; (a) Akım kollara ayrılırken gidiş yönüne düz kola daha çok, kıvrılan kola
daha az akım geçer. (b) Akım kol ayrımına geldiğinde ampuller özdeş olduğundan eşit bir
şekilde iki kola ayrılır. (c) …………………………………………………………………………
6.3.Yukarıdaki iki soruya verdiğim cevaptan;
(a) Eminim. (b) Emin değilim.
Şekil 5’de bir elektrik devresi verilmiştir. İlk önce bir B ampulü Şekil 6’da görüldüğü gibi devreye ekleniyor. Daha sonra B ampulü devreden çıkarılarak ve onun yerine bir tel kullanılarak Şekil 7’deki devre oluşturuluyor. 5., 6., 7. ve 8. soruları bu bilgilere dayanarak cevaplayınız.

161
7.1. Şekil 6’da A ve B ampullerinin parlaklıklarını karşılaştırınız. (a) A ve B ampullerinin parlaklıkları eşittir. (b) A ampulü daha parlaktır. (c) B ampulü daha parlaktır.
7.2.Yukarıda verdiğim cevabın sebebi; (a) Kollara ayrılan akımın çoğu B ampulünden geçer. (b) A ampulü pile daha yakındır. (c) A ve B ampullerinden aynı büyüklükte akım geçer. (d) ……………………………………………………………………
7.3. Yukarıdaki iki soruya verdiğim cevaptan; (a) Eminim. (b) Emin değilim.
8.1. Şekil 6 ve Şekil 7’deki A lambalarının parlaklıklarını karşılaştırınız. (a) Şekil 6’daki daha parlaktır. (b) Şekil 7’deki daha parlaktır. (c) İki şekildeki de eşit parlaklıktadır.
8.2.Yukarıda verdiğim cevabın sebebi; (a) Şekil 7’deki A ampulünün üzerinden akım geçmez. (b) Şekil 6’da akım iki ampul, Şekil 7’de ise tek ampul tarafından
kullanılır. (c) Her iki şekilde de akım iki kola ayrılır. (d) …………………………………………………………………………
8.3. Yukarıdaki iki soruya verdiğim cevaptan; (a) Eminim. (b) Emin değilim.
9.1. Şekil 8’deki devrede bir pil, ampul ve iki dirençten oluşan bir düzenek
gösterilmektedir. İlk önce sadece 10 ohm’luk R1 direncinin yerine 20 ohm’luk bir direnç bağlanıyor ve Şekil 9 elde ediliyor. Daha sonra Şekil 8’deki 10 ohm’luk R2 direncinin yerine 20 ohm’luk bir direnç bağlanıyor ve Şekil 10 elde ediliyor. Şekil 9 ve Şekil 10’daki ampullerin parlaklıklarında Şekil 8’deki ampule göre değişiklik olur mu?
Şekil 9’da Şekil 10’da
(a) Değişir Değişmez (b) Değişir Değişir (c) Değişmez Değişir (d) Değişmez Değişmez

162
9.2.Yukarıda verdiğim cevabın sebebi; (a) Akım ampule ulaşmadan önce R1 direnci tarafından etkilenir. (b) Akım ampule ulaşmadan önce R2 direnci tarafından etkilenir. (c) Her iki şekilde de eşdeğer direnç Şekil 8’e göre değiştiğinden ana
koldaki akım da değişir. (d) Piller aynı olduğundan ana kollardaki akımlar aynıdır. (e) …………………………………………………………………………
9.3. Yukarıdaki iki soruya verdiğim cevaptan;
(a) Eminim. (b) Emin değilim.
10.1. Şekil 11’deki ampul ışık verir mi?
(a) Evet, ışık verir. (b) Hayır, ışık vermez.
10.2.Yukarıda verdiğim cevabın sebebi;
(a) Ampul “+” ve “-” yüklere dokundurulduğu için “+” ve “-” yükler ampulde birleşebilirler.
(b) Ampul üretecin “+” kutbuna değiyor. (c) Ampulden elektrik akımı geçer. (d) Ampulden elektrik akımı geçmez. (e) ………………………………………………………………………
10.3. Yukarıdaki iki soruya verdiğim cevaptan; (a) Eminim. (b) Emin değilim.
11.1 .Şekil 12’de verilen devre parçasında elektrik akımının yönü ok ile gösteriliyor. Buna göre, 1, 2 ve 3 noktalarındaki akımların büyüklüklerini karşılaştırınız.
(a) i1 > i3 > i2 (b) i1 > i2 = i3
11.2.Yukarıda verdiğim cevabın sebebi;
(a) Akım kol ayrımına geldiğinde ampullerin dirençleri eşit olduğu için eşit bir şekilde kollara ayrılır.
(b) Akım kol ayrımına geldiğinde gidiş yönündeki düz kola daha çok akım, kıvrılan kola ise daha az akım geçer.
(c) ………………………………………………………………………
11.3.Yukarıdaki iki soruya verdiğim cevaptan; (a) Eminim. (b) Emin değilim.

163
12.1.Şekil 13’te gösterilen devrede A ve B ampullerinin parlaklıklarını karşılaştırınız.
(a) B ampulü daha parlaktır. (b) İki ampulün de parlaklıkları eşittir. (c) İki ampulde yanmaz.
12.2.Yukarıda verdiğim cevabın sebebi;
(a) Akım A ve B ampullerinin arasındaki boş telden geçer. (b) B ampulü pile daha yakındır. (c) Akım ilk iki kola ayrıldığında, akımın yarısı B ampulüne geçer. Daha
sonra tekrar kol ayrımına geldiğinde akımın hepsi boş telden geçer ve pile döner.
(d) İki ampul birbirine paralel olduğundan üzerlerinden eşit büyüklükte akım geçer.
(e) …………………………………………………………………………
12.3.Yukarıdaki iki soruya verdiğim cevaptan; (a) Eminim. (b) Emin değilim.

164
APPENDIX H
ANSWER KEY OF THE SECDT
1.1) B 3.1) A 5.1) B 7.1) A 9.1) B 11.1) B 1.2) C 3.2) B 5.2) D 7.2) C 9.2) C 11.2) A 1.3) A 3.3) A 5.3) A 7.3) A 9.3) A 11.3) A 2.1) B 4.1) A 6.1) B 8.1) A 10.1) B 12.1) C 2.2) B 4.2) B 6.2) B 8.2) A 10.2) D 12.2) A 2.3) A 4.3) A 6.3) A 8.3) A 10.3) A 12.3) A

165
APPENDIX I
CHOICE SELECTIONS INDICATING A MISCONCEPTION ACCORDING
TO ONLY FIRST TIERS AND ALL THREE TIERS
Item Choices (Only First Tiers) Total M1 1.1 a, 10.1 a 2 M2 4.1 b, 4.1 c 2 M3 3.1 b, 4.1 d 3 M4 - 0 M5 7.1 b 1 M6 8.1 b, 8.1 c, 12.1 b 3 M7 3.1 c, 5.1 c, 9.1 d 3 M8 5.1 a 1 M9 9.1 a, 9.1 c, 2
M10 2.1 a, 12.1 a 2 M11 6.1 a, 7.1 c, 11.1 a 3
Mis
co
nce
ption
s
Total 22 Item Choices (All Three Tiers) Total
M1 (1.1 a, 1.2 a, 1.3 a), (10.1 a, 10.2 b, 10.3 a), (10.1 b, 10.2 b, 10.3 a)
3
M2 (4.1 c, 4.2 c, 4.3 a), (4.1 b, 4.2 c, 4.3 a) 2 M3 (3.1 b, 3.2 c, 3.3.a), (3.1 a, 3.2 c, 3.3.a), (4.1 d, 4.2
c, 4.3 a), (5.1 b, 5.2 c, 5.3 a), (5.1 a, 5.2 c, 5.3 a) 5
M4 (1.1 b, 1.2 b, 1.3 a), (10.1 a, 10.2 a, 10.3 a) 2 M5 (4.1 b, 4.2 a, 4.3 a), (7.1 b, 7.2 b, 7.3 a), (12.1.a,
12.2.b, 12.3 a) 3
M6 (8.1 b, 8.2 b, 8.3 a), (8.1 c, 8.2 c, 8.3 a), (10.1 a, 10.2 c, 10.3 a), (12.1 b, 12.2 d, 12.3 a)
4
M7 (3.1 c, 3.2 a, 3.3 a), (3.1a, 3.2.a, 3.3 a), (5.1 c, 5.2 e, 5.3 a), (9.1 d, 9.1 d, 9.3 a)
4
M8 (5.1 a, 5.2 a, 5.3 a) 1 M9 (9.1 a, 9.2 a, 9.3 a), (9.1 c, 9.2 b, 9.3 a) 2
M10 (2.1 a, 2.2 a, 2.3 a), (5.1 a, 5.2 b, 5.3 a), (12.1 a, 12.2 c, 12.3 a)
3
M11 (6.1 a, 6.2 a, 6.3 a), (7.1 c, 7.2 a, 7.3 a), (11.1 a, 11.2 b, 11.3 a)
3
Mis
co
nce
ption
s
Total 30

166
APPENDIX J
RAW DATA OBTAINED FROM THE SECDT

167

168

169

170

171