development of adjustment factors for hcm sixth edition
TRANSCRIPT

Development of Adjustment Factors for HCM Sixth Edition Freeway Work Zone Capacity MethodologyFinal ReportJuly 2020
Sponsored bySmart Work Zone Deployment Initiative(Part of TPF-5(295))Federal Highway Administration (InTrans Project 18-645)

About the Smart Work Zone Deployment InitiativeIowa, Kansas, Missouri, and Nebraska created the Midwest States Smart Work Zone Deployment Initiative (SWZDI) in 1999 and Wisconsin joined in 2001. Through this pooled-fund study, researchers investigate better ways of controlling traffic through work zones. Their goal is to improve the safety and efficiency of traffic operations and highway work.
About InTrans and CTREThe mission of the Institute for Transportation (InTrans) and Center for Transportation Research and Education (CTRE) at Iowa State University is to develop and implement innovative methods, materials, and technologies for improving transportation efficiency, safety, reliability, and sustainability while improving the learning environment of students, faculty, and staff in transportation-related fields.
Iowa State University Nondiscrimination Statement Iowa State University does not discriminate on the basis of race, color, age, ethnicity, religion, national origin, pregnancy, sexual orientation, gender identity, genetic information, sex, marital status, disability, or status as a US Veteran. Inquiries regarding nondiscrimination policies may be directed to the Office of Equal Opportunity, 3410 Beardshear Hall, 515 Morrill Road, Ames, Iowa 50011, telephone: 515-294-7612, hotline: 515-294-1222, email: [email protected].
Disclaimer NoticeThe contents of this report reflect the views of the authors, who are responsible for the facts and the accuracy of the information presented herein. The opinions, findings and conclusions expressed in this publication are those of the authors and not necessarily those of the sponsors.
This document is disseminated under the sponsorship of the U.S. DOT in the interest of information exchange. The sponsors assume no liability for the contents or use of the information contained in this document. This report does not constitute a standard, specification, or regulation.
The sponsors do not endorse products or manufacturers. Trademarks or manufacturers’ names appear in this report only because they are considered essential to the objective of the document.
Quality Assurance StatementThe Federal Highway Administration (FHWA) provides high-quality information to serve Government, industry, and the public in a manner that promotes public understanding. Standards and policies are used to ensure and maximize the quality, objectivity, utility, and integrity of its information. The FHWA periodically reviews quality issues and adjusts its programs and processes to ensure continuous quality improvement.
Iowa DOT Statements Federal and state laws prohibit employment and/or public accommodation discrimination on the basis of age, color, creed, disability, gender identity, national origin, pregnancy, race, religion, sex, sexual orientation or veteran’s status. If you believe you have been discriminated against, please contact the Iowa Civil Rights Commission at 800-457-4416 or the Iowa Department of Transportation affirmative action officer. If you need accommodations because of a disability to access the Iowa Department of Transportation’s services, contact the agency’s affirmative action officer at 800-262-0003.
The preparation of this report was financed in part through funds provided by the Iowa Department of Transportation through its “Second Revised Agreement for the Management of Research Conducted by Iowa State University for the Iowa Department of Transportation” and its amendments.
The opinions, findings, and conclusions expressed in this publication are those of the authors and not necessarily those of the Iowa Department of Transportation or the U.S. Department of Transportation Federal Highway Administration.

Technical Report Documentation Page
1. Report No. 2. Government Accession No. 3. Recipient’s Catalog No.
InTrans Project 18-645
4. Title 5. Report Date
Development of Adjustment Factors for HCM Sixth Edition Freeway Work
Zone Capacity Methodology
July 2020
6. Performing Organization Code
7. Author(s) 8. Performing Organization Report No.
Jing Dong and Yilun Yang InTrans Project 18-645
9. Performing Organization Name and Address 10. Work Unit No. (TRAIS)
Center for Transportation Research and Education
Iowa State University
2711 South Loop Drive, Suite 4700
Ames, IA 50010-8664
11. Contract or Grant No.
12. Sponsoring Organization Name and Address 13. Type of Report and Period Covered
Smart Work Zone Deployment Initiative
Iowa Department of Transportation
800 Lincoln Way
Ames, Iowa 50010
Federal Highway Administration
U.S. Department of Transportation
1200 New Jersey Avenue SE
Washington, DC 20590
Final Report
14. Sponsoring Agency Code
Part of TPF-5(295)
15. Supplementary Notes
Visit https://swzdi.intrans.iastate.edu/ for color pdfs of this and other Smart Work Zone Deployment Initiative research reports.
16. Abstract
This project validated the Highway Capacity Manual (HCM) work zone capacity methodology for urban and rural freeways and
provides recommendations for a more accurate estimation of work zone capacity. This study collected data from 16 work zone
sites across Iowa in 2018 and 2019. The free flow speeds (FFSs), capacities, and queue discharge rates (QDRs) at these work
zones were calculated using the HCM method and compared to field measurements.
For the work zones considered in this study, the key findings are as follows:
FFSs estimated using the HCM method had a greater variance than the field-measured values. Under free flowing conditions,
Iowans generally drove around the work zone speed limits, while the HCM method predicted a wide range of FFSs.
The field-measured prebreakdown capacities and QDRs were significantly lower than the values computed using the HCM
method, indicating that traffic breakdown could happen at a much lower flow level than the capacity predicted by the HCM
method.
With complex work zone configurations, such as narrow lanes, lane shifts, and crossovers, the observed FFS and
prebreakdown capacity were significantly lower than typical work zone configurations.
17. Key Words 18. Distribution Statement
free flow speed—queue discharge rate—work zone capacity No restrictions.
19. Security Classification (of this
report)
20. Security Classification (of this
page)
21. No. of Pages 22. Price
Unclassified. Unclassified. 33 NA
Form DOT F 1700.7 (8-72) Reproduction of completed page authorized


DEVELOPMENT OF ADJUSTMENT FACTORS FOR
HCM SIXTH EDITION FREEWAY WORK ZONE
CAPACITY METHODOLOGY
Final Report
July 2020
Principal Investigator
Jing Dong, Transportation Engineer
Center for Transportation Research and Education, Iowa State University
Co-Principal Investigator
Anuj Sharma, Research Scientist
Center for Transportation Research and Education, Iowa State University
Research Assistants
Muthumari Anbumani, Bryce Hallmark, Shannon Morrissey, and Yilun Yang
Authors
Jing Dong and Yilun Yang
Sponsored by the Smart Work Zone Deployment Initiative and
the Federal Highway Administration (FHWA) Pooled Fund Study TPF-5(295):
Iowa (lead state), Kansas, Missouri, Nebraska, and Wisconsin
Preparation of this report was financed in part
through funds provided by the Iowa Department of Transportation
through its Research Management Agreement
with the Institute for Transportation
(InTrans Project 18-645)
A report from
Smart Work Zone Deployment Initiative
2711 South Loop Drive, Suite 4700
Ames, IA 50010-8664
Phone: 515-294-8103 / Fax: 515-294-0467
https://swzdi.intrans.iastate.edu/

v
TABLE OF CONTENTS
ACKNOWLEDGMENTS ............................................................................................................ vii
EXECUTIVE SUMMARY ........................................................................................................... ix
CHAPTER 1. INTRODUCTION ....................................................................................................1
CHAPTER 2. DATA COLLECTION .............................................................................................3
2.1. Work Zone Data ............................................................................................................3 2.2. Traffic Data ...................................................................................................................5
CHAPTER 3. METHODOLOGY ...................................................................................................6
3.1. HCM Work Zone Methodology....................................................................................6 3.2. Field Measurement of Work Zone Capacity .................................................................9
CHAPTER 4. RESULTS ...............................................................................................................13
4.1. Free Flow Speed .........................................................................................................13 4.2. Capacity and Queue Discharge Rate...........................................................................17
CHAPTER 5. CONCLUSIONS AND RECOMMENDATIONS .................................................22
REFERENCES ..............................................................................................................................23

vi
LIST OF FIGURES
Figure 1. HCM work zone methodology for basic freeway segments ............................................2 Figure 2. Sensor locations of work zone IJ—I-35/80 at 100th St. in Urbandale .............................5 Figure 3. Prebreakdown capacity and QDR measured at work zone IJ (westbound traffic)
on June 28, 2019 ................................................................................................................11 Figure 4. Free flow speed comparison: HCM method vs. field measurement ..............................15 Figure 5. Speed time series of work zone 4.1_I29 on June 10–11 and June 14–15, 2018 ............16 Figure 6. Snapshot of work zone 4.1_I29 at 9:10 p.m. on June 10, 2018 ......................................17 Figure 7. Traffic breakdown at work zone 2P on June 29, 2018 ...................................................19 Figure 8. Time series of speeds and flow rates at work zone 2P on June 29, 2018 .......................21
LIST OF TABLES
Table 1. List of work zones ..............................................................................................................4 Table 2. Proportion of work zone QDR (relative to the basic work zone capacity) available
for mainline flow upstream of merge area ...........................................................................7 Table 3. Proportion of work zone capacity available for mainline flow downstream of
diverge area ..........................................................................................................................8 Table 4. Scenario definition ...........................................................................................................13 Table 5. Free flow speed comparison: field measurement vs. HCM method ................................14 Table 6. Number of breakdowns observed at each work zone ......................................................17 Table 7. QDR and prebreakdown capacity comparison: HCM method vs. field
measurement ......................................................................................................................18 Table 8. Capacity comparison: HCM 2010 vs. field measurement ...............................................18 Table 9. Queue discharge rate and prebreakdown capacity for different work types ....................21

vii
ACKNOWLEDGMENTS
This research was conducted under the Smart Work Zone Deployment Initiative (SWZDI) and
Federal Highway Administration (FHWA) Pooled Fund Study TPF-5(295), involving the
following state departments of transportation:
Iowa (lead state)
Kansas
Missouri
Nebraska
Wisconsin
The authors would like to thank the FHWA, the Iowa Department of Transportation (DOT), and
the other pooled fund state partners for their financial support and technical assistance.
The authors would like to thank the technical advisory committee members, Dan Sprengeler,
Willy Sorenson, Mark Bortle, and Tim Simodynes, for providing guidance and support
throughout the project.


ix
EXECUTIVE SUMMARY
The Highway Capacity Manual (HCM), Sixth Edition, introduced a new methodology to
estimate freeway work zone capacity. The data used to develop the HCM work zone capacity
methodology were collected from 12 work zone sites with different configurations across 6 states
including Arizona, Arkansas, California, Maryland, Nevada, and Virginia. It was expected that
capacity at work zones in the Smart Work Zone Deployment Initiative (SWZDI) states might be
significantly different from the states where the data were collected. Thus, it was crucial to
validate the HCM methodology using locally collected data and provide adjustment factors as
necessary. In addition, for the special work zone configurations, the queue discharge rate (QDR)
adjustment factors were derived from field-calibrated microsimulation models. Validating the
capacities at merge, diverge, and weaving segments using field data shed light on the
applicability of the simulated results to SWZDI states.
The objective of this project was to validate the HCM work zone capacity methodology for
urban and rural freeways in Iowa and provide recommendations for a more accurate estimation
of work zone capacity. This study collected data from 16 work zone sites across Iowa in 2018
and 2019. The free flow speeds (FFSs), capacities, and QDRs at these work zones were
calculated using the HCM method and compared with the field measurements.
For the work zones considered in this study, the key findings are as follows:
FFSs estimated using the HCM method had a greater variance than the field-measured
values. Under free flowing conditions, Iowans generally drove around the work zone speed
limits, while the HCM method predicted a wide range of FFSs.
The field-measured prebreakdown capacities and QDRs were significantly lower than the
values computed using the HCM method, indicating that traffic breakdown could happen at a
much lower flow level than the capacity predicted by the HCM.
With complex work zone configurations, such as narrow lanes, lane shifts, and crossovers,
the observed FFS and prebreakdown capacity can be significantly lower than ones of typical
work zones.

1
CHAPTER 1. INTRODUCTION
The Highway Capacity Manual (HCM), Sixth Edition, introduced a new methodology to
estimate freeway work zone capacity. The data used to develop the HCM work zone capacity
methodology were collected from 12 work zone sites with different configurations across 6 states
including Arizona, Arkansas, California, Maryland, Nevada, and Virginia. It was expected that
capacity at work zones in the Smart Work Zone Deployment Initiative (SWZDI) states might be
significantly different from the states where the data were collected. Thus, it was crucial to
validate the HCM methodology using locally collected data and provide adjustment factors as
necessary. In addition, for the special work zone configurations, the queue discharge rate (QDR)
adjustment factors were derived from field-calibrated microsimulation models. Validating the
capacities at merge, diverge, and weaving segments using field data shed light on the
applicability of the simulated results to SWZDI states.
The objective of this project was to validate the HCM work zone capacity methodology for
urban and rural freeways in Iowa and provide recommendations for a more accurate estimation
of work zone capacity. This study collected data from 16 work zone sites across Iowa in 2018
and 2019. Flow rate, speed, and work zone active times and configurations were collected to
estimate work zone capacity, discharge flow rate, and free flow speed (FFS). Work zone capacity
describes a traffic facility’s ability to sustain service flow rates near the operational optimum.
Different methods have been used in the literature to estimate work zone capacity based on
traffic volume data, including average QDR, maximum QDR, prebreakdown flow rate, and 95th
percentile flow rate. In the HCM Sixth Edition, work zone capacity is defined as the
prebreakdown flow rate.
As illustrated in Figure 1, the new HCM work zone methodology estimates QDRs and FFSs
based on a set of work zone characteristics.

2
Figure 1. HCM work zone methodology for basic freeway segments
The capacity is then estimated based on the QDR and a pre-determined capacity drop percentage.
The QDR model states that additional closed lanes, soft barrier separation (e.g., cones or plastic
drums), rural area, less lateral clearance, and night conditions will reduce the queue discharge
rates, as well as the work zone capacity. Similarly, the FFS model states that lower work zone
speed limits, additional closed lanes, soft barrier separation, night conditions, and higher ramp
density will reduce the free flow speed in work zones. Furthermore, for work zones involving
merge, diverge, weaving maneuvers, or with directional crossovers, the queue discharge rate
estimates are adjusted. In general, more complicated driving conditions result in lower QDRs
and lower FFSs.

3
CHAPTER 2. DATA COLLECTION
2.1. Work Zone Data
The project team explored the archived traffic and work zone data from previous years. Due to
incompleteness and discrepancies in the archived work zone data, work zones prior to 2018 were
not included in this study. A new dataset was collected during the 2018 and 2019 construction
seasons. The dataset includes 10 work zones from 2018 and 6 work zones from 2019 (see Table
1).

4
Table 1. List of work zones
Year Project Location Construction activity
2018
1J I-35/80 Douglas Ave, IA 141 (Rider
Corner) & 100th St. interchanges
Bridge replacement in 2016 and
paving in 2018
1T/1U I-35 & US 30 interchange in Ames PCC pavement - grade and new,
bridge new-steel girder
1AM
I-35 from N of Oralabor Rd. to NE 36th
St., including 1st St. and 4 Mile Creek
bridge in Ankeny
ITS equipment, grading, bridge
replacement, RCB culvert replacement
- triple box, reconstruction - bridge
widening
1AQ NB I-35 bridge over S Skunk River 2.6 mi
S of US 30
Northbound bridge replacement-PPCB
structures – miscellaneous traffic
signs, PCC pavement - grade and
replace
2P Iowa 58 and Viking Road grade separation
in Waterloo
Interchange construction and grade
separation
3B
I-29 (SBL) over SB Frontage Rd./Pierce
St./Virginia St./Floyd Blvd./Wesley
Pky./Perry Creek in Sioux City
Bridge replacement; new PCC
pavement; grade and replace ITS
equipment
4.1
I-29 NB/SB at UPRR b/w Neb Ave. & 9th
Ave.; I-29 NB/SB from US 275 to S
Expressway; I-80/I-29 from WSI to
Madison Ave. (MM 5) in Council Bluffs
New interchange, PCC pavement,
grade and replace
4AH I-80 bridge over Franklin Ave., 2.3 mi W
of US 6 in Council Bluffs Deck joint repair
6AA WB US 30 bridge over CIC RR 0.8 mi W
of I-380 in Cedar Rapids Bridge deck overlay
6AM I-80, 1.1 mi E of Y40 to E of IA 130 in
Scott County HMA resurfacing
2019
1J/1BC
I-35/80 Douglas Ave., IA 141 (Rider
Corner) & 100th St interchanges; Douglas
Ave. to E of 100th St., includes IA 141
interchange, Rider Corner in Urbandale
Grading, bridge-new steel girder
1AM In Ankeny at E 1st St. interchange (E 1st
St./SE Creekview Dr./Frisk Dr.) Pavement grade replace
2Q IA 21 to the Cedar River in Waterloo PCC pavement replacement
3P
US 75 NBL from the Woodbury County
Line N to Hinton Stream 1.6 mi N of Co.
Rd. C70 (NB)
PCC pavement grade and replace;
bridge replacement
3S
I-29 SB from Missouri Valley to
Mondamin: 0.4 mi N of UP PP to 0.5 mi N
of IA 127 (SBL)
PCC pavement - grade and replace
5V From S of the Decatur Co. Rest Area to IA
2 (SBL) PCC pavement -grade and replace

5
Images from video cameras were used to verify the work zone configuration and active work
times. The work zone characteristics include lane closure type, barrier type, lateral clearance,
project duration, and lane closure times.
2.2. Traffic Data
Traffic conditions including travel speed, volume, and vehicle classification were collected from
the Iowa Department of Transportation’s (DOT’s) permanent sensors and through the temporary
sensors deployed by the DOT’s Traffic Critical Projects program. The aggregation interval of the
data was set to 5 minutes. There are usually several sensors associated with each project. The
sensors closest to both ends of the work zone were identified as the upstream and downstream
sensors. For some projects, no archived traffic data were available at the closest sensor during
the work zone active times. Data from adjacent sensors were used in those instances. As shown
in Figure 2, since no data were available at the sensor location I-35/80 milepost 128.5, data from
the sensor located at I-35/80 at IA 141 were used. If the next available sensor was too far from
the work zone, field measurements of prebreakdown capacity or QDR were not available.
Figure 2. Sensor locations of work zone IJ—I-35/80 at 100th St. in Urbandale

6
CHAPTER 3. METHODOLOGY
3.1. HCM Work Zone Methodology
3.1.1. Capacity and Queue Discharge Rate
The HCM work zone capacity method estimates the work zone prebreakdown flow and queue
discharge flow by accounting for lane closure type, barrier type, area type, lateral clearance,
lighting, and speed limit. In particular, for basic freeway segments, the QDR is computed using
the following equation:
𝑄𝐷𝑅𝑤𝑧 = 2,093 − 154 × 𝐿𝐶𝑆𝐼 − 194 × 𝑓𝐵𝑟 − 179 × 𝑓𝐴𝑇 + 9 × 𝑓𝐿𝐴𝑇 − 59 × 𝑓𝐷𝑁
where,
𝑄𝐷𝑅𝑤𝑧 = 15 minute queue discharge rate in passenger car per hour per lane (pc/hr/ln) at the
work zone bottleneck
LCSI = lane closure severity index; 𝐿𝐶𝑆𝐼 =1
𝑂𝑅×𝑁𝑜, OR = open ratio, the ratio of the number of
open lanes during road work to the total number of lanes (decimal); 𝑁𝑜 = number of open lanes
in the work zone
𝑓𝐵𝑟 = indicator variable for barrier type; = 0 for concrete and hard barrier separation; =1 for
cones, plastic drums, or other soft barrier separation
𝑓𝐴𝑇 = indicator variable for area type; = 0 for urban area; =1 for rural area
𝑓𝐿𝐴𝑇 = lateral distance from the edge of travel lane adjacent to the work zone barrier, barricades,
or cones (0–12 ft)
𝑓𝐷𝑁 = indicator variable for daylight or night; = 0 for daylight; =1 for night
In this study, lane closure (𝐿𝐶𝑆𝐼), barrier type (𝑓𝐵𝑟), and lateral clearance (𝑓𝐿𝐴𝑇) variables were
determined from the archived images of the work zone. The area type (𝑓𝐴𝑇) and indicator
variable for daylight or night (𝑓𝐷𝑁) were determined based on the location and the time of work.
The prebreakdown capacity for work zone is then estimated based on the queue discharge rate, as
follows:
𝑐𝑤𝑧 =𝑄𝐷𝑅𝑤𝑧
100 − 𝛼𝑤𝑧× 100

7
where,
𝑐𝑤𝑧 = work zone capacity (i.e., prebreakdown flow rate) in pc/hr/ln.
𝛼𝑤𝑧 = the percentage drop in prebreakdown capacity at the work zone due to queuing condition
(%). The default value of 𝛼𝑤𝑧 for freeway work zones is 13.4%.
For special work zone configurations, such as merge, diverge, weaving segments, and work
zones with directional crossovers, the QDRs need to be adjusted. Table 2 and Table 3 show the
adjustment factors for merge and diverge segments based on the acceleration lane length and
ramp flow. The acceleration lane lengths were measured using Google Earth Pro, and the ramp
flows were obtained from the annual average daily traffic (AADT) map provided by Iowa DOT
open data portal.
Table 2. Proportion of work zone QDR (relative to the basic work zone capacity) available
for mainline flow upstream of merge area
Work zone
lane
configuration
On-ramp
input demand
( pc/hr)
Acceleration lane length (ft)
100 300 500 700 900 1,100 1,300 1,500
2 to 1
0 1.00 1.00 1.00 1.00 1.00 1.00 1.00 1.00
250 1.00 0.86 0.86 0.86 0.86 0.86 0.86 0.86
500 1.00 0.70 0.70 0.70 0.70 0.70 0.70 0.70
750 1.00 0.53 0.53 0.53 0.53 0.53 0.53 0.53
1,000 1.00 0.49 0.45 0.40 0.40 0.40 0.40 0.40
2 to 2
0 1.00 1.00 1.00 1.00 1.00 1.00 1.00 1.00
250 1.00 0.92 0.92 0.92 0.92 0.92 0.92 0.92
500 1.00 0.84 0.84 0.84 0.84 0.84 0.84 0.84
750 1.00 0.75 0.75 0.75 0.75 0.75 0.75 0.75
1,000 1.00 0.67 0.67 0.67 0.67 0.67 0.67 0.67
3 to 2
0 1.00 1.00 1.00 1.00 1.00 1.00 1.00 1.00
250 1.00 0.95 0.95 0.95 0.95 0.95 0.95 0.95
500 1.00 0.87 0.87 0.87 0.87 0.87 0.86 0.86
750 1.00 0.78 0.78 0.78 0.78 0.78 0.78 0.78
1,000 1.00 0.70 0.70 0.70 0.70 0.70 0.70 0.70
4 to 3
0 1.00 1.00 1.00 1.00 1.00 1.00 1.00 1.00
250 1.00 0.97 0.97 0.98 0.98 0.98 0.98 0.98
500 1.00 0.91 0.91 0.91 0.92 0.92 0.92 0.92
750 1.00 0.85 0.85 0.85 0.86 0.86 0.86 0.86
1,000 1.00 0.79 0.79 0.79 0.79 0.80 0.80 0.80
Source: HCM, Exhibit 25-8

8
Table 3. Proportion of work zone capacity available for mainline flow downstream of
diverge area
Work zone
lane
configuration
Off-ramp
volume
percentage
Deceleration lane length (ft)
100 300 500 700 900 1,100 1,300 1,500
2 to 1
0.0 1.00 1.00 1.00 1.00 1.00 1.00 1.00 1.00
6.3 0.94 0.94 0.94 0.94 0.94 0.94 0.94 0.93
12.5 0.87 0.88 0.88 0.88 0.88 0.88 0.87 0.87
18.8 0.79 0.82 0.82 0.82 0.82 0.81 0.81 0.81
25.0 0.72 0.76 0.76 0.75 0.75 0.75 0.75 0.75
2 to 2
0.0 1.00 1.00 1.00 1.00 1.00 1.00 1.00 1.00
6.3 0.93 0.94 0.94 0.94 0.94 0.94 0.94 0.94
12.5 0.84 0.87 0.87 0.87 0.87 0.87 0.87 0.87
18.8 0.76 0.81 0.81 0.81 0.81 0.81 0.81 0.81
25.0 0.68 0.75 0.75 0.75 0.75 0.75 0.75 0.75
3 to 2
0.0 1.00 1.00 1.00 1.00 1.00 1.00 1.00 1.00
6.3 0.93 0.94 0.94 0.94 0.94 0.94 0.94 0.94
12.5 0.86 0.87 0.87 0.87 0.87 0.87 0.87 0.87
18.8 0.78 0.81 0.81 0.81 0.81 0.81 0.81 0.81
25.0 0.69 0.74 0.74 0.74 0.74 0.74 0.74 0.74
4 to 3
0.0 1.00 1.00 1.00 1.00 1.00 1.00 1.00 1.00
6.3 0.93 0.93 0.93 0.93 0.93 0.93 0.93 0.93
12.5 0.86 0.87 0.87 0.87 0.87 0.87 0.87 0.87
18.8 0.76 0.80 0.80 0.80 0.80 0.80 0.80 0.80
25.0 0.64 0.73 0.73 0.73 0.73 0.73 0.73 0.73
Source: HCM, Exhibit 25-10
3.1.2. Free Flow Speed
The HCM recommends the following equation to compute the free flow speed:
𝐹𝐹𝑆𝑤𝑧 = 9.95 + 33.49 × 𝑓𝑠𝑟 + 0.53 × 𝑆𝐿𝑤𝑧 − 5.6 × 𝐿𝐶𝑆𝐼 − 3.84 × 𝑓𝐵𝑟 − 1.71 × 𝑓𝐷𝑁 − 8.7 ×𝑇𝑅𝐷
where,
𝐹𝐹𝑆𝑤𝑧 = free flow speed at the work zone
𝑓𝑆𝑟 = speed ratio (decimal); the ratio of non-work zone speed limit to work zone speed limit
𝑆𝐿𝑤𝑧 = work zone speed limit (mph)
TRD = total ramp density along the facility (ramps/mi)

9
The Iowa DOT’s policy regarding speed limits in temporary traffic control zones is based on the
2009 Manual on Uniform Traffic Control Devices for Streets and Highways (MUTCD).
Specifically, for multi-lane divided highways, the following policies apply:
Four-Lane Divided Highways:
Existing regulatory speed limit (65 mph, 60 mph, or 55 mph) maintained if all existing lanes
are open to traffic and the width between barriers (other than spot locations) is 30 ft or
greater
Regulatory 55 mph speed limit where the roadway width between barriers is less than 30 ft
(temporary barrier rail [TBR], 3 ft shoulder, 12 ft lane, 12 ft lane, 3 ft shoulder, TBR) other
than spot locations such as bridges
Regulatory 55 mph speed limit with single lane closure only when workers are present
Regulatory 55 mph speed limit where construction vehicles must frequently merge into high
volume traffic lanes
Regulatory 55 mph speed limit with single lane closure using temporary barrier rail due to
potential side friction from use of barrier rail
Regulatory 55 mph speed limit for two-lane, two-way operation
Six-Lane or More Divided Highways:
Existing regulatory speed limit (65 mph, 60 mph, or 55 mph) maintained if all existing lanes
are open to traffic
Existing regulatory speed limit (65 mph, 60 mph, or 55 mph) maintained if at least two
existing lanes are open to traffic per direction and the cross section configuration is 30 ft or
greater
Regulatory 55 mph speed limit when cross section configuration is less than 30 ft (TBR, 3 ft
shoulder, 12 ft lane, 12 ft lane, 3 ft shoulder, TBR)
Regulatory 55 mph speed limit with only single lane available to traffic
The non-work zone speed limits and total ramp density were collected from Google Maps. The
work zone speed limits were collected from the archived images of the work zone where the
speed limit sign was visible; otherwise, 55 mph was used as the work zone speed limit.
3.2. Field Measurement of Work Zone Capacity
Work zone FFSs, QDRs, and prebreakdown capacity were estimated using the 5 minute
aggregated traffic volume and speed data collected by Wavetronix sensors. Work zone FFSs
were computed as the average speed when the work zone was active, and the flow rate was less
than 1,000 vehicles per hour per lane (veh/hr/ln). Because one work zone site might have
different configurations at different times, FFSs were computed for each scenario that was
defined by the work zone configuration and time of work.

10
The prebreakdown capacity is defined as the maximum flow rate observed before traffic breaks
down. In particular, traffic breakdowns are detected when there is a sudden drop in speed of at
least 25% below the FFS for at least 15 minutes that results in queuing upstream of the work
zone. The traffic is considered as returning to normal when the speed recovers to greater than
75% of the FFS. After identifying the breakdown, the flow rates observed during the 15 minute
period before the breakdown occurred (i.e., 3 flow observations) were compared and the highest
flow rate was used as the prebreakdown capacity.
QDR is defined as the average flow rate immediately downstream of an active bottleneck (i.e.,
the work zone) measured over a 15 minute sampling interval while there is active queuing
upstream during oversaturated conditions (i.e., after traffic breaks down and before recovery).
The flow data collected from a sensor immediately downstream of a work zone is used to
calculate the QDR.
Figure 3 shows the time series plots of flow and speed data collected at the upstream and
downstream of work zone 1J on June 28, 2019.

11
Prebreakdown capacity
Queue discharge rate
Figure 3. Prebreakdown capacity and QDR measured at work zone IJ (westbound traffic)
on June 28, 2019
The right shoulder for westbound traffic was closed from 8:51 a.m. to 4:32 p.m. Traffic
breakdown occurred at 3:10 p.m. and lasted until 4:15 p.m. The prebreakdown capacity (1,336
veh/hr/ln) was observed at 3:05 p.m., before the traffic breakdown at sensor DMDS93 at 86 St.
WB (see previous Figure 2). The QDR is computed as the average flow rate (1,006 veh/hr/ln)
observed from downstream sensor DMDS95 at IA 141 WB during the breakdown. In this
example, the percentage drop in prebreakdown capacity at the work zone due to queuing
condition (i.e., 𝛼𝑤𝑧) is 24.7%.
0
10
20
30
40
50
60
70
80
0
200
400
600
800
1000
1200
1400
1600
2:2
0 P
M
2:2
5 P
M
2:3
0 P
M
2:3
5 P
M
2:4
0 P
M
2:4
5 P
M
2:5
0 P
M
2:5
5 P
M
3:0
0 P
M
3:0
5 P
M
3:1
0 P
M
3:1
5 P
M
3:2
0 P
M
3:2
5 P
M
3:3
0 P
M
3:3
5 P
M
3:4
0 P
M
3:4
5 P
M
3:5
0 P
M
3:5
5 P
M
4:0
0 P
M
4:0
5 P
M
4:1
0 P
M
4:1
5 P
M
4:2
0 P
M
4:2
5 P
M
4:3
0 P
M
4:3
5 P
M
4:4
0 P
M
4:4
5 P
M
Spee
d (
mp
h)
Flo
w R
ate
(veh
/hr/
lan
e)
Upstream Flow(veh/hr/l) Speed
400
600
800
1000
1200
1400
2:2
0 P
M
2:2
5 P
M
2:3
0 P
M
2:3
5 P
M
2:4
0 P
M
2:4
5 P
M
2:5
0 P
M
2:5
5 P
M
3:0
0 P
M
3:0
5 P
M
3:1
0 P
M
3:1
5 P
M
3:2
0 P
M
3:2
5 P
M
3:3
0 P
M
3:3
5 P
M
3:4
0 P
M
3:4
5 P
M
3:5
0 P
M
3:5
5 P
M
4:0
0 P
M
4:0
5 P
M
4:1
0 P
M
4:1
5 P
M
4:2
0 P
M
4:2
5 P
M
4:3
0 P
M
4:3
5 P
M
4:4
0 P
M
4:4
5 P
M
Flo
w R
ate
(veh
/hr/
lan
e)
Downstream Flow(veh/hr/l)
Average QDR = 1006

12
The QDR and capacity are measured in terms of number of vehicles per hour per lane
(veh/hr/ln), including trucks and passenger cars. To compare with the HCM estimated values, the
field measurements are converted to equivalent passenger car per hour per lane (pc/hr/ln) using
the capacity adjustment factor as follows:
𝐶𝐴𝐹𝑀𝐼𝑋,𝐽 = 𝐶𝐴𝐹𝐴𝑂 − 𝐶𝐴𝐹(𝑇.𝑀𝐴𝑋) − 𝐶𝐴𝐹𝐺,𝑀𝐼𝑋,𝐽
where,
𝐶𝐴𝐹𝑀𝐼𝑋,𝐽= mixed-flow capacity adjustment factor for segment j
𝐶𝐴𝐹𝐴𝑂 = capacity adjustment factor for the auto-only case (default = 1)
𝐶𝐴𝐹(𝑇.𝑀𝐴𝑋) = capacity adjustment factor for the percentage of trucks in mixed-flow conditions
(𝐶𝐴𝐹(𝑇.𝑀𝐴𝑋) = 0.53 × 𝑃𝑇𝑟𝑢𝑐𝑘0.72 )
𝐶𝐴𝐹𝐺,𝑀𝐼𝑋,𝐽 = capacity adjustment factor for grade for segment j in mixed-flow conditions, which
is assumed to be 0 in this study
The percentage of trucks were computed using the traffic counts by vehicle class during the
active work zone time.

13
CHAPTER 4. RESULTS
This chapter compares the FFS, capacity, and QDR obtained based on the HCM method and
from the field measurements. Various scenarios were defined according to the work zone
configuration, location, and time of work. In particular, the definition of each component of a
scenario is given in Table 4.
Table 4. Scenario definition
Scenario
code Definition
#LC Number of closed lanes
S/H Barrier type: S for soft barrier separation, H for hard barrier separation
U/R Area type: U for urban, R for rural
# lateral distance from the edge of travel lane adjacent to the work zone
to the barrier, in feet
D/N Work time: D for daylight, N for night
D/M/B Segment type: D for diverge, M for merge, B for basic
For example, the scenario 1LC-S-U-0-D-D stands for a work zone with one lane closed (1LC),
soft barrier separation (S), in an urban area (U), with no lateral distance between the cone and the
traveled lane (0), during daytime (D), and at a diverge segment (D).
4.1. Free Flow Speed
The free flow speeds were computed using the HCM method and compared with the field
measurements, as shown in Table 5 and Figure 4.

14
Table 5. Free flow speed comparison: field measurement vs. HCM method
Project Scenario
Non-work
zone speed
limit
Work zone
speed limit TRD
HCM
method
(mph)
Field
measurement
(mph)
1J
0LC-S-U-0-D-D 65 55 2.00 55.57 66.00
1LC-S-U-0-N-D 65 55 2.00 51.53 55.27
2LC-S-U-0-N-D 65 55 2.00 38.93 54.86
0LC-S-U-0-N-D 65 55 2.00 53.86 65.71
1LC-S-U-0-D-D 65 55 2.00 53.24 59.46
0LC-H-U-0-D-D 65 55 2.00 59.41 60.03
0LC-S-U-0-D-M 65 55 2.00 55.57 68.25
0LC-S-U-0-N-M 65 55 2.00 53.86 68.93
1LC-S-U-0-N-M 65 55 2.00 51.53 60.41
2LC-S-U-0-N-M 65 55 2.00 38.93 52.53
1LC-S-U-0-D-M 65 55 2.00 53.24 54.41
0LC-H-U-0-D-M 65 55 2.00 59.41 69.28
1AQ
0LC-S-R-0-D-B 70 55 0.00 75.08 57.49
1LC-S-R-0-N-B 70 55 0.00 64.97 54.00
0LC-S-R-0-N-B 70 55 0.00 73.37 64.75
1T 1LC-S-R-0-N-B 55 55 0.67 50.04 55.34
1LC-S-R-0-N-D 55 55 0.67 50.04 47.51
2P 1LC-H-R-0-D-B 55 55 0.50 57.04 49.19
3B
1LC-S-R-2-D-B 55 55 1.17 47.40 55.68
0LC-S-R-2-D-B 55 55 1.17 55.80 58.12
1LC-S-R-2-N-B 55 55 1.17 45.69 54.97
1AM 1LC-S-R-0-N-B 65 55 0.00 53.23 54.72
1LC-S-R-0-N-B 65 55 0.00 53.23 61.90
4.1_I29 1LC-S-R-2-N-B 55 55 2.50 34.09 28.27
4AH 0LC-S-R-2-D-B 70 55 0.67 69.28 60.62
1LC-H-R-2-D-B 70 55 0.67 64.72 50.26
6AA
0LC-S-R-2-D-B 65 55 1.67 57.54 59.95
0LC-S-R-2-N-B 65 55 1.67 55.83 57.84
1LC-S-R-2-N-D 65 55 1.67 47.43 54.31
6AM
1LC-S-R-2-N-B 65 55 0.33 59.03 64.97
1LC-S-R-2-D-B 65 55 0.33 60.74 71.48
0LC-S-R-2-N-B 65 55 0.33 67.43 71.48
2Q 0LC-S-R-0-D-D 55 55 1.67 48.65 58.34
0LC-S-R-0-N-D 55 55 1.67 46.94 57.78
3P 0LC-S-U-0-D-B 65 55 0.50 64.89 67.09
3S 1LC-S-U-0-D-B 65 55 0.50 51.75 56.20
1LC-S-U-0-N-B 65 55 0.50 50.04 56.25
5V 1LC-S-U-0-D-B 70 55 1.00 57.98 67.65
0LC-H-U-0-D-B 70 55 1.00 67.42 59.08

15
Figure 4. Free flow speed comparison: HCM method vs. field measurement
20 30 40 50 60 70 80
2LC-S-U-0-N-M
2LC-S-U-0-N-D
1LC-S-U-0-N-M
1LC-S-U-0-N-D
1LC-S-U-0-N-B
1LC-S-U-0-D-M
1LC-S-U-0-D-D
1LC-S-U-0-D-B
1LC-S-U-0-D-B
1LC-S-R-2-N-D
1LC-S-R-2-N-B
1LC-S-R-2-N-B
1LC-S-R-2-N-B
1LC-S-R-2-D-B
1LC-S-R-2-D-B
1LC-S-R-0-N-D
1LC-S-R-0-N-B
1LC-S-R-0-N-B
1LC-S-R-0-N-B
1LC-S-R-0-N-B
1LC-H-R-2-D-B
1LC-H-R-0-D-B
0LC-S-U-0-N-M
0LC-S-U-0-N-D
0LC-S-U-0-D-M
0LC-S-U-0-D-D
0LC-S-U-0-D-B
0LC-S-R-2-N-B
0LC-S-R-2-N-B
0LC-S-R-2-D-B
0LC-S-R-2-D-B
0LC-S-R-2-D-B
0LC-S-R-0-N-D
0LC-S-R-0-N-B
0LC-S-R-0-D-D0LC-S-R-0-D-B
0LC-H-U-0-D-M0LC-H-U-0-D-D
0LC-H-U-0-D-B
Free flow speed (mph)
Scen
ario
Field Measurement HCM method

16
For the work zones considered in this study, FFSs estimated using the HCM method had a larger
variance than the field-measured values. For work zones with an original speed limit of 70 mph
and reduced speed limit of 55 mph, the HCM method overestimated FFSs for all but one
scenario. For example, the HCM method estimated the FFS for scenario 0LC-S-R-0-D-B (i.e., no
lane closure, with soft barrier, in a rural area, no distance from the cones to the traveled lanes, in
daytime, on a basic freeway segment) at work zone 1AQ as 75.08 mph. This is unrealistic
considering the work zone speed limit is 55 mph. The field-measured FFS was 57.49 mph, which
is consistent with the typical driver behavior at work zones. On the other hand, the HCM method
underestimates FFSs for scenarios with two lanes closed. In particular, for scenarios 2LC-S-U-0-
N-D and 2LC-S-U-0-N-M at work zone 1J, the HCM method estimated the FFS as 38.93 mph,
while the field-measured FFSs were 54.86 mph and 52.53 mph, respectively. This indicates that
when the traffic is free flowing, Iowans drove only slightly below the speed limit even when two
of three lanes were closed.
In Figure 4, one of the obvious outliers is scenario 1LC-S-R-2-N-B at work zone 4.1_I29. The
field-measured FFS was 28.27 mph, and the calculated FFS using the HCM method was 34.09
mph. As shown in Figure 5, the speed dropped significantly when the work started around 8 p.m.
and remained low until the end of the work at 6 a.m.
Figure 5. Speed time series of work zone 4.1_I29 on June 10–11 and June 14–15, 2018
Since the flow rate was relatively low, the measured speeds were considered as free flow speeds,
although it was significantly below the work zone speed limit of 55 mph. This could be due to
several factors, including the presence of multiple workers and the horizontal curve (see Figure
6).
0
10
20
30
40
50
60
70
80
5:0
0 P
M
6:0
0 P
M
7:0
0 P
M
8:0
0 P
M
9:0
0 P
M
10
:00
PM
11
:00
PM
12
:00
AM
1:0
0 A
M
2:0
0 A
M
3:0
0 A
M
4:0
0 A
M
5:0
0 A
M
6:0
0 A
M
7:0
0 A
M
8:0
0 A
M
9:0
0 A
M
Spee
d (
mp
h)
Speed for workzone active time on 6/10-6/11Speed for workzone active time on 6/14-6/15
Active work time

17
Figure 6. Snapshot of work zone 4.1_I29 at 9:10 p.m. on June 10, 2018
4.2. Capacity and Queue Discharge Rate
To measure prebreakdown capacity and queue discharge rate, traffic breakdowns are identified
and summarized in Table 6.
Table 6. Number of breakdowns observed at each work zone
Project Direction Scenario LCSI 𝒇𝑩𝒓 𝒇𝑨𝑻 𝒇𝑳𝑨𝑻 𝒇𝑫𝑵
# of
breakdowns
1J
East 0LC-H-U-0-D-D 0.33 0 0 0 0 2
1LC-H-U-0-D-D 0.75 1 0 0 0 1
West 0LC-H-U-0-D-M 0.33 0 0 0 0 7
0LC-S-U-0-D-M 0.33 1 0 0 0 2
1AQ Both 0LC-S-R-0-D-B 0.5 1 1 0 0 3
3B Both 1LC-S-R-2-D-B 2 1 1 2 0 15
The field-measured prebreakdown capacity and QDR are compared with the computed values
using the HCM method as shown in Table 7.

18
Table 7. QDR and prebreakdown capacity comparison: HCM method vs. field
measurement
Scenario
# of
breakdowns
HCM method
(pc/hr/ln)
Field data
(pc/hr/ln)
QDR Capacity QDR Capacity 𝜶𝒘𝒛 0LC-H-U-0-D-D 2 2,042 2,358 1,496 1,519 1.5%
1LC-H-U-0-D-D 1 2,042 2,358 1,582 1,678 5.8%
0LC-H-U-0-D-M 7 1,784 2,059 1,096 1,821 39.8%
0LC-S-U-0-D-M 2 1,848 2,134 893 1,657 46.1%
0LC-S-R-0-D-B 3 1,725 1,991 1,171 1,737 32.6%
1LC-S-R-2-D-B 15 1,378 1,591 1,032 1,482 30.3%
The field-measured capacity and QDR are significantly lower than the values computed using
the HCM method. Although the sample size is not large enough to draw definite conclusions,
caution should be taken when applying the HCM method to estimate work zone capacity in
Iowa.
In addition, the default value of 𝛼𝑤𝑧 for freeway work zones is 13.4%, as suggested in the HCM.
This value is averaged over capacity drop values found in the literature, which included different
lane closures and barrier types. The capacity definitions were not consistent in these studies,
including prebreakdown flow rate, average or maximum queue discharge rate, and 95th
percentile (Yeom et al. 2015). Based on the work zones studied in this project, the percentage
drops in prebreakdown capacity (𝛼𝑤𝑧) vary greatly.
The field-measured capacity values were also compared with the default work zone capacity as
given in Exhibit 10-14 in the HCM 2010. Since only scenarios with reduced lanes are included in
the HCM 2010, Table 8 lists two scenarios with lane closures.
Table 8. Capacity comparison: HCM 2010 vs. field measurement
Scenario Project
Number of lanes to
reduced lanes
HCM 2010
(veh/hr/ln)
Field data
(veh/hr/ln)
1LC-H-U-0-D-D 1J 3 to 2 1,450 1,395
1LC-S-R-2-D-B 3B 2 to 1 1,400 1,289
The field measurements are slightly lower than the default values of work zone capacity given in
the HCM 2010.
The previous Table 6 lists only traffic breakdowns detected in six scenarios from three work
zones. The researchers have also observed sudden speed drops in other scenarios, where flow
rates were relatively low before the speed drop (i.e., less than 800 veh/hr/ln). These breakdowns
could be due to other disruptions (e.g., crashes) or special configurations of the work zone. For
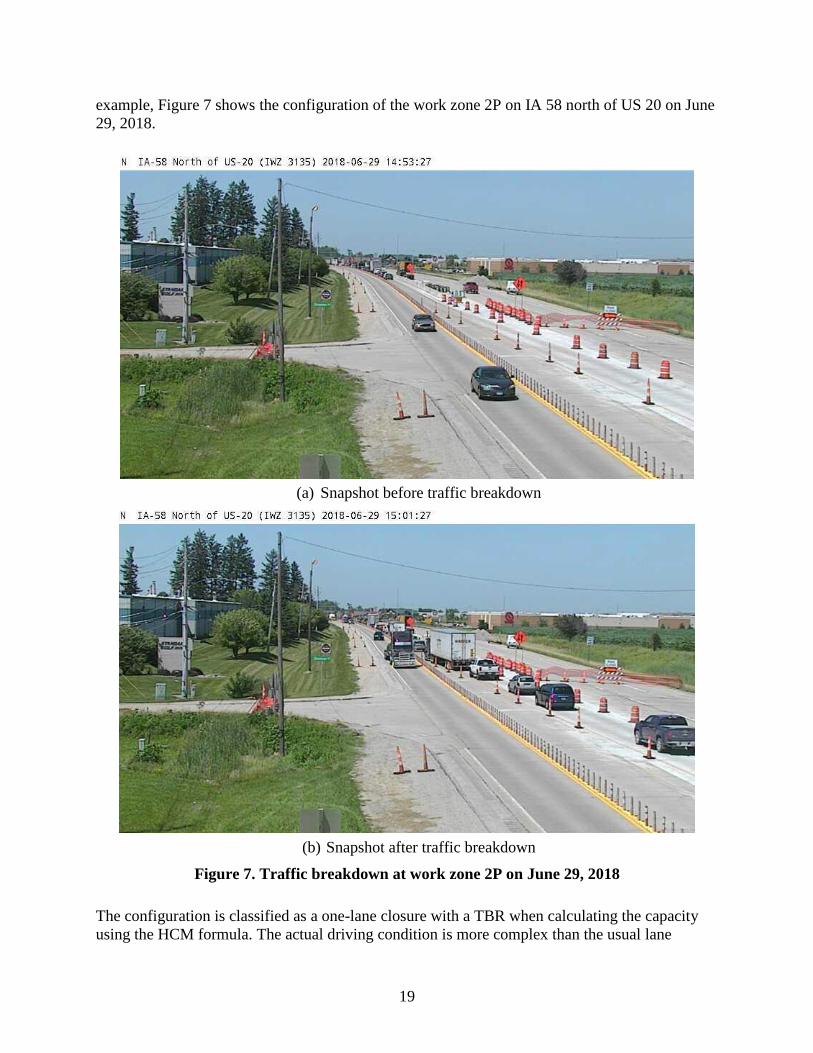
19
example, Figure 7 shows the configuration of the work zone 2P on IA 58 north of US 20 on June
29, 2018.
(a) Snapshot before traffic breakdown
(b) Snapshot after traffic breakdown
Figure 7. Traffic breakdown at work zone 2P on June 29, 2018
The configuration is classified as a one-lane closure with a TBR when calculating the capacity
using the HCM formula. The actual driving condition is more complex than the usual lane

20
closure. Figure 8 shows the speed and flow plots during the active work zone time from 6 a.m. to
6 p.m. The traffic breakdown was detected at 2:55 p.m., and the prebreakdown capacity (648
veh/hr/ln) was observed at 2:40 p.m. The queue discharge rate observed at the downstream
sensor was 775 veh/hr over two lanes or 387 veh/hr/ln.
(a) Time series of speed and flow data at upstream sensor (IWZ 3556)
(b) Time series of speed and flow data at downstream sensor (IWZ 3553)

21
(c) Sensor locations
Figure 8. Time series of speeds and flow rates at work zone 2P on June 29, 2018
In addition, the field-measured capacity and QDR were grouped based on the work type, as
defined in the Iowa DOT Lane Closure Planning Tool (LCPT). The results are summarized in
Table 9.
Table 9. Queue discharge rate and prebreakdown capacity for different work types
Work type
# of
breakdowns
QDR
(veh/hr/ln)
Capacity
(veh/hr/ln)
QDR
(pc/hr/ln)
Capacity
(pc/hr/ln)
TC-402, Shoulder closure
with cones 3 966 1,376 1,171 1,737
TC-40x: Shoulder closure
with TBR 11 922 1,404 1,132 1,736
TC-418, Lane closure 16 929 1,290 1,073 1,488
These capacity values can be used to update the thresholds in the LCPT.

22
CHAPTER 5. CONCLUSIONS AND RECOMMENDATIONS
This project compared the results from the HCM work zone capacity methodology with field
measurements for urban and rural freeways in Iowa. Work zone activity data and the
corresponding traffic data from 16 work zones were collected during the 2018 and 2019
construction seasons. The free flow speeds, capacities, and queue discharge rates at these work
zones were calculated using the HCM method and compared with field measurements.
For the work zones considered in this study, the key findings are as follows:
FFSs estimated using the HCM method had a greater variance than the field-measured
values. Iowans generally drove around the work zone speed limits under free flowing
conditions, while the HCM method predicted a wide range of FFSs.
The field-measured prebreakdown capacities and QDRs were significantly lower than the
values computed using the HCM method, indicating that traffic breakdown could happen at a
much lower flow level than the capacity predicted by the HCM method.
The HCM work zone capacity method does not account for the effects of complex work zone
configurations, such as narrow lanes, lane shifts, and crossovers; thus, the observed FFS and
prebreakdown capacity can be significantly lower than typical work zones.
Accordingly, the following recommendations are made for estimating work zone capacity:
When possible, work zone queue discharge rate and capacity should be estimated using field
data to account for the unique features of the work zone.
If the HCM method estimates a free flow speed that is significantly lower or higher than the
posted work zone speed limit, one should consider adjusting the estimated value unless the
special configuration of the work zone can justify such discrepancy.
Recognizing that traffic breakdown might occur at a flow level lower than the HCM
estimated capacity, the traffic control target should be set lower than the estimated capacity
to avoid slowdowns in work zones.
The Iowa DOT Lane Closure Planning Tool can use the field-measured capacity in this study
as the thresholds for three work types—TC-402: Shoulder closure with cones, TC-40x:
Shoulder closure with TBR, and TC-418: Lane closure.

23
REFERENCES
TRB. 2010. Highway Capacity Manual, 5th Edition. Transportation Research Board of the
National Academies. Washington, DC.
TRB. 2016. Highway Capacity Manual, 6th Edition. Transportation Research Board of the
National Academies. Washington, DC.
Yeom, C., A. Hajbabaie, B. J. Schroeder, C. Vaughan, X. Xuan, and N. M. Rouphail. 2015.
Innovative Work Zone Capacity Models from Nationwide Field and Archival Sources.
Transportation Research Record: Journal of the Transportation Research Board, No.
2485, pp. 51–60.


THE INSTITUTE FOR TRANSPORTATION IS THE FOCAL POINT FOR TRANSPORTATION AT IOWA STATE UNIVERSITY.
InTrans centers and programs perform transportation research and provide technology transfer services for government agencies and private companies;
InTrans contributes to Iowa State University and the College of Engineering’s educational programs for transportation students and provides K–12 outreach; and
InTrans conducts local, regional, and national transportation services and continuing education programs.
Visit InTrans.iastate.edu for color pdfs of this and other research reports.