development of an efficient method for isolation and ... · isolation and purification of bioactive...
TRANSCRIPT

1
DEVELOPMENT OF AN EFFICIENT METHOD FOR
ISOLATION AND PURIFICATION OF BIOACTIVE
COMPOUNDS FROM PANAX GINSENG AND RHODIOLA
ROSEA USING HIGH PERFORMANCE COUNTER
CURRENT CHROMATOGRAPHY
A thesis submitted for the degree of
Master of Philosophy
By
Yi Li
Brunel Institute for Bioengineering
Brunel University London
December 2012

2
DECLARATION OF AUTHENCITY
I hereby declare that I am the sole author of this thesis
Yi Li

3
ABSTRACT
Traditional Chinese medicine has developed for several thousands of years and
accumulated an abundant amount of human pharmacological information and experience
as a large potential resource in drug discovery and development. Panax ginseng C. A.
Meyer and Rhodiola rosea are both popular herbs worldwide and have many potential
pharmacological effects including adaptogenic, antistress, and vasodilating, anticancer
and anti-inflammatory. To improve the isolation and separation effect of the two
traditional Chinese herbs for quantity and quality control herbal products in general,
Separation and purification techniques using high performance counter-current
chromatography (HPCCC) are widely applied for this purpose. High performance
counter-current chromatography (HPCCC) is a form of liquid liquid chromatography
with the higher “g” ” field, which the Brunel Institute for Bioengineering (BIB) team
have developed to process scale. It would provide not only more rapid and high
throughout isolation and purification process of crude sample, but also relatively simply
volumetric and linear scale-up between all scales instruments.
A rapid and convenient method for the separation and purification of five ginsenosides
from crude sample of Panax ginseng by high-performance counter-current
chromatography was successfully developed. One gradient method in normal phase
mode was applied for the first separation step for the isolation of ginsenosides using a
Spectrum CCC (73 ml coil volume, 1.6 mm bore) with an EtOAc/BuOH/aqueous 5mM
ammonium acetate solvent system. The composition ratio of mobile phase changed from
3.5:0.5:4 (v/v) to 2.5:1.5:4 (v/v). Ginsenosides Rd, Rg1 and Rb1 were separated in less
than 120 minutes with purities of 96.3% and 98.6% yield, 88.5% and 95.8% yield,
93.7% and 97.4% yield respectively and ginsenosides Rb2 and Rb3, Re and Rc were co-
eluted. The final retention of stationary phase was 77.6%. Methylene
chloride/methanol/aqueous 5mM ammonium acetate/isopropanol (6:3:4:3, v/v/v) solvent
system was used for the isocratic separation of ginsenosides Re and Rc in the second
separation step. The ginsenosides Rb2 and Rb3 have similar structures and properties as
they are isomers and their aglycone moieties both belong to the same 20 (S) –
protopanaxadiol. They were difficult to isolate using this solvent system. The purity of
ginsenosides Re and Rc was assessed by HPLC–DAD to be 97.5% with 98.2% recovery
and 92.6% with 96.3% recovery. These purified ginsenosides was identified using
commercial reference standard on the HPLC and MS.

4
A simple and efficient high-performance counter-current chromatography method for
the simultaneous separation and purification for quantity and quality of the two
biological compounds salidroside and tyrosol from Rhodiola rosea extract has been
developed and scale up for the first time. The experiment were conducted initially by
sample concentration, sample loading volume and flow rate study at analytical scale
using a Mini HPCCC (17.7 ml coil, 0.8 mm bore) with a new MTBE/butanol
/ACN/water (4:2:4:10 v/v/v) solvent system. Then linearly scaled up to the Midi-
HPCCC (923 ml coil volume, 4.0 mm bore). Midi-HPCCC runs produced 28.2mg
(purity 93%) of salidroside and 13.1mg (purity 96.5%) of tyrosol from the 1000mg
crude Rhodiola rosea extract. with the throughput scaled up 50 times. The results
demonstrate that HPCCC operating at the high flow and high “g” field is a reliable
strategy for linear scale-up from analytical-scale high-throughput screening to
preparative-scale.

5
ACKNOWLEDGEMENTS
Firstly, I would like to acknowledge all my supervisors for giving me the opportunity to
accomplish a personal ambition for this studying. This thesis would not have been
possible without the advice, guidance and support of many people who in one way or
another contributed and extended their valuable assistance in the preparation and
completion of this research study.
Foremost, I would like to thank my supervisors, Prof. Ian A. Sutherland and Dr. Svetlana
Ignatova for the continuous support during my research study, for all their invaluable
support, ideas, enthusiasm, encouragement and advice.Their kind guidance made me
confident and helped me in completing my study and research as well as writing of this
thesis.
Great thanks and appreciation is given to all my colleagues at the Brunel Institute for
Bioengineering. In particular, to Mr. Peter Hewitson for his experimental advice,
training, assistance within the laboratory at times of difficulty, scientific discussion and
most of all friendship. Dr. Ian Garrard (for invaluable insight and experimental advice
on HPLC machine), Dr. Lukasz Grudzien (assistance within the laboratory), It is also a
pleasure to thank to Mrs Jenny Kume, Prof. Derek Fisher and Dr. Carola Koenig,
without whose facilities, support and assistance, this study would not have been
successful. Also I thank Dr. Steve Barton and Mr. Federico in department of pharmacy
and chemistry of Kingston University for analysis by LC-MS and NMR.
I wish to extend a heartfelt thank you to all the other students at BIB, who have now
become great friends. Mostly for all the camaraderie, entertainment, and laughter we
have shared, through what has been an extremely challenging time.
Finally, special thanks to my parents for all the unconditional love and constant support.
I thank my mother for her endless support and persistent encouragement at the hardest of
times. I thank my father, for his constant reassurance and reasoning.
Yi Li

6
TABLE OF CONTENTS
Declaration
Abstract……………………………………………………………………………………………….3
Acknowledgements………………………………………………………………………………………....5
Table of Contents……………………………………………………………………………………………6
List of Figures……………………………………………………………………………………………...10
List of Tables…………………………………………………………………………………………….....13
Abbreviations……………………………………………………………………………………………....15
CHAPTER 1Introduction and literature review…………………………………………………………...18
1.1 Aim and objects........................................................................................................................... 19
1.2 Panax ginseng ............................................................................................................................. 19
1.2.1 Panax Ginseng Historical and botanical background ................................................................ 19
1.2.2 Chemistry ............................................................................................................................. 20
1.2.3 Adaptogenic Effects of Panax ginseng .................................................................................. 22
1.2.4 Pharmacological effects of Panax ginseng ............................................................................. 23
1.2.5 Panax ginseng extractions for experimental studies ............................................................... 23
1.2.6 Separation and purification methods of Panax ginseng .......................................................... 24
1.2.6.1 Thin layer chromatography (TLC) ..................................................................................... 26
1.2.6.2 Medium pressure liquid chromatography (MPLC) ............................................................. 26
1.2.6.3 Flash chromatography ........................................................................................................ 27
1.2.6.4 High-performance liquid chromatography (HPLC), hydrophilic interaction LC (HILIC)
and ultra-performance LC (UPLC) ................................................................................................. 27
1.2.6.5 Gas chromatography (GC) .................................................................................................. 28
1.2.6.6 Capillary electrophoresis (CE) and Micellar electrokinetic chromatography (MEKC) and
microemulsion EKC (MEEKC) ...................................................................................................... 29
1.2.6.7 Counter-current chromatography (CCC) ............................................................................ 29
1.2.7 On-line detection methods ......................................................................................................... 32
1.2.7.1 Ultraviolet (UV) or diode-array detection (DAD) .............................................................. 32
1.2.7.2 Evaporative light scattering detection (ELSD) ................................................................... 33
1.2.7.3 Fluorescence ....................................................................................................................... 34
1.2.7.4 Charged aerosol detection (CAD) ....................................................................................... 34
1.2.7.5 .Pulsed amperometric detection (PAD) ............................................................................... 34
.1.2.7.6 Mass spectrometry (MS).................................................................................................... 35
1.2.7.7 .Enzyme-linked immunosorbent assay (ELISA) ................................................................ 36
1.3 Rhodiola rosea ............................................................................................................................ 36
1.3.1 Historical and botanical background.......................................................................................... 36
1.3.2 Chemistry ................................................................................................................................... 37
1.3.3 Pharmacological effects of Rhodiola rosea ................................................................................ 38
1.3.3.1Adaptogenic and anti-stress effect ....................................................................................... 38

7
1.3.3.2 Cardioprotective effects ...................................................................................................... 38
1.3.3.3 Anti-inflammatory effects ................................................................................................... 38
1.3.4 Separation and purification methods of Rhodiola rosea ............................................................ 38
1.4 CCC application for preparation and isolation of Chinese herb medicine ...................................... 40
1.4.1 Successful CCC application for preparation and isolation of Chinese herb medicine ............... 40
1.4.2 Basic theory of countercurrent chromatography ........................................................................ 41
1.4.3 The advantages of CCC ............................................................................................................. 48
1.4.4 Main CCC separation methods .................................................................................................. 48
1.4.5 Coupling techniques of CCC ..................................................................................................... 48
1.4.6 Optimization of Operational Parameters of CCC ...................................................................... 49
1.4.7 A generic practical approach of purification and analysis for the natural products ................... 51
1.5 Huge potential application for isolation and separation of traditional Tibetan medicine ................. 54
1.5.1 The growth of interest in Tibetan herb medicine ....................................................................... 54
1.5.2 Huge potential application for CCC to traditional Tibetan medicine ......................................... 62
1.6 Conclusion .................................................................................................................................. 63
CHAPTER 2 Separation and identification of ginsenosides from the Panax ginseng with HPCCC……...65
2.1 Introduction to the ginsenosides ................................................................................................... 66
2.2 Aims ........................................................................................................................................... 66
2.3 Methods for separation and purification of ginsenosides ............................................................... 66
2.4 Experimental method and materials ............................................................................................. 67
2.4.1 Apparatus ................................................................................................................................... 67
2.4.2 Chemicals .................................................................................................................................. 67
2.4.3 Sample preparation .................................................................................................................... 68
2.4.4 Measurement of partition coefficient and settling time ............................................................. 68
2.4.5 Preparation of the two-phase solvent systems and sample solution ........................................... 68
2.4.6 HSCCC separation procedure .................................................................................................... 69
2.4.7 Measurement of stationary retention (Sf) ................................................................................... 70
2.4.7.1 Measurement of dead volume (VD) of HSCCC .................................................................. 70
2.4.7.2 Measurement of Sf .............................................................................................................. 70
2.4.8 HPLC analyses sample .............................................................................................................. 71
2.5 Result and discussion .................................................................................................................. 71
2.5.1 HPLC retention behavior of ginsenosides ................................................................................. 71
2.5.1.1 Effect of Concentration of acetonitrile of mobile phase ..................................................... 72
2.5.1.2 Effect of pH value of mobile phase .................................................................................... 73
2.5.1.3 Effect of Ionic strength of mobile phase ............................................................................. 73
2.5.2 Selection of solvent system for the separation of ginsenosides in HPCCC ............................... 74
2.5.2.1 Selection of solvent system for the first step separation of ginsenosides in HPCCC ......... 75
2.5.3 HPCCC separation of ginsenosides ........................................................................................... 86
2.5.3.1 Application of E-B-W addition of formic acid solvent system in reverse phase isocratic
elution for separation of ginsenosides in Spectrum ........................................................................ 86

8
2.5.3.2 Application of E-B-W addition of ammonium acetate solvent system in reverse phase
isocratic elution for separation of ginsenosides in Spectrum .......................................................... 90
2.5.3.3 Application of E-B-W addition of ammonium acetate solvent system in in normal phase
gradient elution for separation of ginsenosides in Spectrum .......................................................... 92
2.5.3.4 Application of DWMI (6:2:4:3) addition of ammonium acetate solvent system in normal
phase isocratic elution for the second separation of HPCCC fractions part 3 and part 4 ............... 93
2.5.4 Analysis and identification of HPCCC fractions ....................................................................... 94
2.5.4.1 HPLC analysis of HPCCC fractions of crude ginseng ....................................................... 94
2.5.4.2 Identification of HPCCC fractions by LC-MS and NMR ................................................... 97
2.6 Conclusion .................................................................................................................................. 98
CHAPTER 3 Separation and quantitative determination of salidroside and tyrosol from the Rhodiola rosea
extract with HPCCC…………………………………………………………………………………99
3.1 Aim ........................................................................................................................................... 100
3.2 Experimental Method and Materials .......................................................................................... 100
3.2.1 Apparatus ................................................................................................................................. 100
3.2.2 Chemicals and standards .......................................................................................................... 100
3.2.3 Preparation of crude sample .................................................................................................... 100
3.2.3.1 Preparation of standard curve ........................................................................................... 101
3.2.3.2 Orthogonal design L9 (34) ................................................................................................ 101
3.2.4 Selection procedureof solvent system ...................................................................................... 102
3.2.5 Measurement of partition coefficient and settling time ........................................................... 105
3.2.6 Preparation of two-phase solvent system and sample solution ................................................ 105
3.2.7 CCC separation procedure ....................................................................................................... 106
3.2.8 HPLC analysis and identification of HPCCC fractions ........................................................... 106
3.3 Results and discussion ............................................................................................................... 106
3.3.1 Method validation .................................................................................................................... 106
3.3.2 Selection of two-phase solvent system .................................................................................... 110
3.3.2.1 HEMWat solvent systems ................................................................................................. 110
3.3.2.2 terAcWat solvent system .................................................................................................. 110
3.3.2.3 Methylene chloride–methanol–water–isopropanol solvent system .................................. 111
3.3.3 HP CCC separation of Salidroside and Tyrosol ....................................................................... 112
3.3.3.1 Analytical HPCCC ............................................................................................................ 112
3.3.3.1.1 Application of terAcWat solvent system(4:6:10) in reverse phase isocratic elution for
Salidroside and Tyrosol ......................................................................................................... 112
3.3.3.1.2 Application of Methylene chloride–methanol–water–isopropanol solvent system
(5:6:4:1) with 5mg/ml ammonium acetate solvent system in normal phase isocratic elution for
Salidroside and Tyrosol ......................................................................................................... 114
3.3.3.1.3 Application of system MTBE- Butanol- ACN- Water (4:2:4:10) in for Salidroside
and Tyrosol ............................................................................................................................ 115

9
3.3.3.2 Scale-up to preparative Midi-HPCCC .............................................................................. 118
3.3.4 Analysis and identification of HPCCC fractions ..................................................................... 120
3.4 Conclusion ................................................................................................................................ 122
CHAPTER 4 Scale-up process for rapid purification of salidroside and tyrosol with HPCCC……….....123
4.1 Introduction .............................................................................................................................. 124
4.2 Experimental method and materials ........................................................................................... 125
4.2.1 Apparatus ................................................................................................................................. 125
4.2.1.1 Mini-HPCCC centrifuge ................................................................................................... 125
4.2.1.2 Spectrum –DE centrifuge ................................................................................................. 125
4.2.1.3 Midi-HPCCC centrifuge ................................................................................................... 126
4.2.1.4 High performance liquid chromatography (HPLC) .......................................................... 126
4.2.2 Reagents and materials ............................................................................................................ 126
4.2.3 Preparation of crude sample .................................................................................................... 126
4.2.4 Solvent system preparation ...................................................................................................... 126
4.2.5 High-performance HSCCC separation procedure .................................................................... 126
4.2.6 HPLC analysis and identification of high-performance HSCCC fractions .............................. 127
4.3 Results and discussion………………………………………………………………………....127
4.3.1 Parameters optimization on analytical HPCCC ....................................................................... 127
4.3.2 Flow rate study ................................................................................................................... 127
4.3.3 Sample concentration loading study ........................................................................................ 130
4.3.4 Sample volume loading study .................................................................................................. 133
4.3.5 Linear scale-up on Spectrum in reversed mode ....................................................................... 135
4.3.6 Volumetric scale-up from Spectrum to Midi-HPCCC in reversed modes ............................... 137
4.4 Conclusion ................................................................................................................................ 142
Chapter 5 Summary, conclusion and future work………………………………………………………...143
5.1 Summary .................................................................................................................................. 144
5.2 Conclusion ................................................................................................................................ 145
5.3 Future work............................................................................................................................... 145
References………………………………………………………………………………………………...150
Appendix………………………………………………………………………………………………… 166

10
LIST OF FIGURE
1.2.1.1Abovegroundparts of P. ginseng……………………………………………………………………20
1.2.1.2 Roots of P.ginseng………………………………………………………………………………….20
1.2.2.1 Main structures of ginsenosides, including a) protopanaxadiol, b) protopanaxatriol, c) ocotillol acid,
d) oleanolic acid……………………………………………………………………………………………22
1.3.1.1 Aboveground parts of Rhodiola Rosea…………………………………………………………….37
1.3.1.2 Roots of Rhodiola Rosea…………………………………………………………………………..36
1.3.2.1Structer of Salidroside and Tyrosol…………………………………………………………………37
1.4.2.1 Schematic view of the liquid motion in CCC columns. A – Hydrostatic columns or CPCs. B –
Hydrodynamic columns …………………………………………………………………………………...43
1.4.2.2 Schematic drawing of the rotating coil in a hydrodynamic CCC instrument equipped with
planetary gear………………………………………………………………………………………………43
1.4.7.1 A generic practical approach of purification and analysis for the natural products………………..54
1.5.1.1Different species number of traditional Tibetan herbs and traditional Chinese
herbs………………………………………………………………………………………………………..55
1.5.1.2 The growth of the number of journal papers published of the Tibetan medicines china from 1989 to
2007………………………………………………………………………………………………………...56
1.5.1.3 Pie chart showing geographical distribution of Tibetan medicine papers review in China from 1989
to 2007, data from Bianbaciren…………………………………………………………………………….58
1.5.1.4 The map showing the geographical distribution of Tibetan medicine research review in China from
1989 to 2007……………………………………………………………………………………………….59
1.5.1.5 The affiliation of the corresponding authors which have published more than 20 Tibetan medicine
papers from 1989 to 2007, data from Bianbaciren………………………………………………………...60
1.5.2.1 Pie chart showing methods of the analysis and separation used in 92 papers review from 2008 to
2009………………………………………………………………………………………………………..62
2.5.1.1.1Effect of concentration of acetonitrile in mobile phase on the retention values of PPT
ginsenosides Rg1 and Re…………………………………………………………………………………..72
2.5.1.1.2 Effect of concentration of acetonitrile in mobile phase on the retention values of PPD
ginsenosides Rc, Rb1, Rd and Rb2………………………………………………………………………...72
2.5.1.2.1 Effect of pH value of mobile phase on the logarithm of partition coefficient of ginsenosides…..73
2.5.1.3.1 Effect of ionic strength of mobile phase on the logarithm of partition coefficient of
ginsenosides………………………………………………………………………………………………..74
2.5.2.1.1 The effect of ethyl acetate/butanol ratio in EBW with 0.1% formic acid solvent system on
logarithmic KD of ginsenosides…………………………………………………………………………….77
2.5.2.1.2 HPLC chromatograms of ginsenosides in upper phase of EBW (2.5:1.5:4) addition of
0.1%formic acid solvent system with three repeat times…………………………………………………..79
2.5.2.1.3 HPLC chromatograms of ginsenosides in lower phase of EBW (2.5:1.5:4) addition of formic
acid solvent system with three repeat times………………………………………………………………..79
2.5.2.1.4 HPLC chromatograms of ginsenosides in upper phase of EBW (2.5:1.5:4) solvent system
addition of 5mM ammonium acetate salt with three repeat times
11
test………………………………………………………………………………………………………….80
2.5.2.1.5 HPLC chromatograms of ginsenosides in lower phase of EBW (2.5:1.5:4) addition of 5mM
ammonium acetate salt with three repeat time……………………………………………………………..80
2.5.2.1.6 The effect of ethyl acetate/butanol ratio in EBW with 5mM ammonium acetate solvent systems
on the logarithmic KD value for ginsenosides……………………………………………………………...82
2.5.2.2.1 Effect on the log KD value of the content of methanol in the DMWI (6: x: 4:3) phase system for
ginsenosides……………………………………………………………………………………………….84
2.5.2.2.2 Effect on the logKD value of the content of isopropanol in the DMWI (6:2:4: y) phase system for
ginsenosides………………………………………………………………………………………………..86
2.5.3.1.1 HPCCC Chromatograms of ginsenosides with reverse phase elution mode using ethyl acetate–n-
butanol–0.1%formic acid solvent system………………………………………………………………….87
2.5.3.1.2 The fractogram of crude sample with EtOAc-BuOH-Water with 0.1% formic acid (2:2:4) solvent
system using DE-Spectrum with 73ml column volume…………………………………………………...88
2.5.3.1.3 The fractogram of crude sample with EtOAc-BuOH-water with 0.1% formic acid (2.5:1.5:4)
solvent system using De-spectrum with 73ml column volume……………………………………………88
2.5.3.2.1 The fractogram of crude sample with EtOAc-BuOH-water with 5mM ammonium acetate (2:2:4)
using DE-Spectrum with 73ml column volume……………………………………………………………91
2.5.3.2.2 The fractogram of crude sample with EtOAc-BuOH-water with 5mM ammonium acetate
(2.5:1.5:4) using DE-Spectrum with 73ml column volume………………………………………………..91
2.5.3.3.1 The fractogram of ginsenosides using gradient from EBW with 5mM ammonium acetate
(3.5:0.5:4) to EBW with 5mM ammonium acetate (2.5:1.5:4) using a DE-Spectrum with 73ml column
volume……………………………………………………………………………………………………...93
2.5.3.2.2.1 The fractogram of part 3 with Methylene chloride–methanol–water–isopropanol with 5mg/ml
ammonium acetate (6:2:4:3) on Spectrum with 73ml column volume…………………………………….94
2.5.4.1.1 The HPLC chromatogram of ginseng sample (C) and standards (D)……………………………95
2.5.4.1.2.HPLC chromatogram of HPCCC fractions of Rd, Rg1, Rb1, Rc and Re using mobile phase
consisting of water (solvent A) and acetonitrile (solvent B) at a flow rate of 1.0 ml/min…………………96
2.5.4.2.1 The mass spectrum data of HPCCC fraction Rg1……………………………………………… 97
3.3.3.1.1.1Separation chromatograms of the crude sample R.rosea extract in Mini HPCCC.…………...113
3.3.3.1.1.2The fractogram of the separation of salidroside and tyrosol from the crude sample R.rosea
extract in the Mini-HPCCC centrifuge.…………………………………………………………………..113
3.3.3.1.2.1The separation chromatograms on Mini HPCCC of the crude sample of
R.Rosea…………………………………………………………………………………………………...114
3.3.3.1.2.2 The fractogram of the crude sample of R.Rosea obtained at flow rates of 0.5 ml/min in
theMini-HPCCC centrifuge………………………………………………………………………………115
3.3.3.1.3.1 Separation chromatograms of the crude sample R.rosea extract in Mini-HPCCC centrifuge
with the reversed phase mode.……………………………………………………………………………116
3.3.3.1.3.2 The fractogram of the crude sample of R.Rosea obtained with the reversed phase mode in the
Mini-HPCCC centrifuge.…………………………………………………………………………………116
3.3.3.1.3.3 Separation chromatograms of the crude sample R.rosea extract in Mini HPCCC with the
normal phase mode……………………………………………………………………………………….117

12
3.3.3.1.3.4 The fractogram of the separation of salidroside and tyrosol from the crude sample R.rosea
extract in the Mini-HPCCC centrifuge with the normal phase mode ……………………………………117
3.3.3.2.1Separation chromatograms of the crude sample R.rosea extract in Midi HPCCC ……………..119
3.3.3.2.2 The fractogram of the separation of salidroside and tyrosol in Midi HPCCC………………...120
3.3.4.1 HPLC chromatogram of crude sample (A), standards (B) and targets(C-D)…………………… 121
4.3.2.1 Comparison of chromatograms of the crude sample of R.Rosea obtained at flow rates of 0.5
ml/min (A) and 1.0ml/min (B) with a coil volume of 17.7 ml in the Mini-HPCCC centrifuge………….128
4.3.2.2 The fractogram of the separation of salidroside and tyrosol from the crude sample R.rosea extract
in the Mini-HPCCC centrifuge at flow rates of 0.5 ml/min ……………………………………………..129
4.3.2.3 The fractogram of the separation of salidroside and tyrosol from the crude sample R.rosea extract
in the Mini-HPCCC centrifuge at flow rates of 1.0 ml/min ……………………………………………..130
4.3.3.1 The fractogram of the separation of salidroside and tyrosol from the crude sample R.rosea extract
in Mini-HPCCC with 10 mg/ml, 30 mg/ml, 50mg/ml and 70 mg/ml sample
concentration ……………………………………………………………………………………………..132
4.3.4.1 The fractogram of the separation of salidroside and tyrosol from the crude sample R.rosea extract
in Mini HPCCC with 0.43 ml sample loop… …………………………………………………………….134
4.3.4.2 The fractogram of the separation of salidroside and tyrosol from the crude sample R.rosea extract
in Mini HPCCC with 0.86 ml sample loop… …………………………………………………………….134
4.3.5.1 Separation chromatograms of the crude sample R.rosea extract in the Spectrum centrifuge with
reversed phase mode.……………………………………………………………………………………..136
4.3.5.2 The fractogram of the separation of salidroside and tyrosol from the crude sample R.rosea extract
in Spectrum with reversed phase mode ………………………………………………………………….136
4.3.6.1 Separation chromatograms of the crude sample of R.Rosea in Spectrum at flow rate 4ml/min…138
4.3.6.2 The fractogram of the separation of salidroside and Tyrosol in Spectrum at flow rate 4ml/min...139
4.3.6.3 The separation chromatograms of the crude sample of R.Rosea in Spectrum at flow rate
8ml/min…………………………………………………………………………………………………...140
4.3.6.4 The fractogram of the separation of Salidroside and Tyrosol in Spectrum at flow rate 8ml/min.. 140
4.3.6.5 Separation chromatograms of the crude sample R.rosea extract in Midi HPCCC ………………141
4.3.6.6. The fractogram of the separation of salidroside and tyrosol in Midi HPCCC…………………...141

13
LIST OF TABLES
1.2.5.1 Characteristics of nine extraction techniques for saponins from ginseng plant materials……………….24
1.2.6.1 Advantages and disadvantages of other analytical techniques compared to CCC.................................... 25
1.2.6.7.1 Separation of ginsenosides from ginseng products by CCC…………………………………………...31
1.2.6.7.2 Characterization of CCC to separation of ginsenosides from ginseng products ................................... 31
1.2.7.1 Characterization of detection methods for ginseng analysis .................................................................... 32
1.5.1.1 The corresponding author’s cooperation in the Tibetan medicine papers review in China from 1989 to
2007 data from Bianbaciren ............................................................................................................................... 57
1.5.1.2 The affiliation of the corresponding authors which have published more than 10 Tibetan medicine papers
from 1989 to 2007 ................................................................................................................................................ 61
2.5.2.1.1 KD values of ginsenosides with different ratios of EBWsolvent system addition of 0.1% formic acid 75
2.5.2.1.2 Average KD value of ginsenosides in EBW (2.5:1.5:4) solvent system addition of 0.1% formic acid
with three times tube test ..................................................................................................................................... 78
2.5.2.1.3 Average KD value of ginsenosides in EBW (2.5:1.5:4) solvent system with three times tube test ........ 78
2.5.2.1.4 Average KD value of ginsenosides in EBW (2.5:1.5:4) solvent system addition of 5mM ammonium
acetate salt with three times tube test ................................................................................................................... 79
2.5.2.1.5 KD values of ginsenosides with different ratios of EBWsolvent system addition 5mM ammonium
acetate .................................................................................................................................................................. 81
2.5.2.1.6 Comparison of K of ginsenosides, setting time, phase ratio and Sf value with two different ratio of
EBW solvent systems addition of ammonium acetate in normal phase mode ..................................................... 83
2.5.2.2.1 KD values in Methylene chloride–methanol–water–isopropanol=6: x: 4:3 solvent systems when the
ratio of methanol was varied for different ginsenosides with reversed phase
mode……………………………...................................................................................................................84
2.5.2.2.2 The effect of solvent ratio on settling time for DWMI solvent systems……………………………..85
2.5.2.2.3 KD values in Methylene chloride–methanol–water–isopropanol (6:2:4: y) solvent system when the
ratio of isopropanol was varied for different ginsenosides with reversed phase mode……………….................85
2.5.3.1.1Comparison of KD value of ginsenosides with two different ratios of EBW with addition of formic acid
solvent system ...................................................................................................................................................... 87
2.5.3.1.2 KD value of ginsenosides compounds from EtOAc-BuOH-water with 0.1% formic acid (2:2:4) solvent
system .................................................................................................................................................................. 89
2.5.3.1.3 KD value of ginsenosides compounds from EtOAc-BuOH-water with 0.1% formic acid (2.5:1.5:4)
solvent system ...................................................................................................................................................... 89
2.5.3.2.1 Comparison of KD value of ginsenosides with two different ratios of EBW solvent systems with
addition of ammonium acetate ............................................................................................................................. 90
3.2.3.2.1Orthogonal design L9 (34) variables level of salidroside and tyrosol extraction…………………….. 102
3.2.3.2.2Orthogonal design L9 (34) table of salidroside and tyrosol extraction ................................................. 102
3.2.4.1 System numbering and solvent composition of the Heptane / ETOAc / MeOH/ Butanol/ Water
(HEMWat) solvent system ................................................................................................................................. 103
3.2.4.2 System number and solvent composition of the methyl tert-butyl ether/acetonitrile/ water (terAcWat)
solvent system .................................................................................................................................................... 104
3.2.4.3 pH value of No7 of terAcWat solvent systems withTFA, NH3OH, respectively ................................... 104
3.2.4.4 System number and solvent composition of the methyl tert-butyl ether /butanol/acetonitrile/ water

14
(terBuAcWat) solvent system ............................................................................................................................ 105
3.2.4.5 System number and solvent composition of the Methylene chloride/methanol/water/isopropanol solvent
system ................................................................................................................................................................ 105
3.3.1.1 Calibration curves, linear range, limit of detection, limit of quantification (n = 6) and system precision
data (n = 5) for the standards of salidroside and tyrosol .................................................................................... 107
3.3.1.2 Orthogonal design L9 (34) table and results of salidroside and tyrosol extraction ................................. 107
3.3.1.3 Analysis of variance with orthogonal L9 (34) test design of salidroside and tyrosol extraction ............ 108
3.3.1.4 result of stability experiment of salidroside and tyrosol extraction process ........................................... 108
3.3.1.5 Recovery of salidroside from Rhodiola Rosea L. sample (n=6) ............................................................ 109
3.3.1.6 Recovery of tyrosol from Rhodiola Rosea L. sample (n=6)................................................................... 109
3.3.1.7 Intra-day (n = 6) and inter-day (n = 6) precision of the standards of Salidrosides and Tyrosol ............. 109
3.3.2.1.1 KD value of Salidroside and Tyrosol compounds from HEMWat solvent systems ............................. 110
3.3.2.2.1 KD value for salidroside and 7yrosol compounds from different pH value of #7 terAcWat solvent
system ................................................................................................................................................................ 111
3.3.2.2.2 KD value of Salidroside and Tyrosol compounds from system MTBE/Butanol/ACN/Water solvent
systems ............................................................................................................................................................... 111
3.3.2.3.1 KD value of Salidroside and Tyrosol compounds from methylene chloride/methanol/water/isopropanol
with 5mg/ml ammonium acetate solvent systems .............................................................................................. 112
3.3.3.1.1.1 the initial Sf, purity and yield of salidroside and Tyrosol with reversed phase mode in the Mini
HPCCC separation ............................................................................................................................................. 112
3.3.3.1.3.1 the initial Sf, purity and yield of salidroside and Tyrosol with reversed mode in the Mini HPCCC
separation ........................................................................................................................................................... 116
3.3.3.1.3.2 the initial Sf,, purity and yield of salidroside and Tyrosol with normal phase mode in the Mini
HPCCC separation ............................................................................................................................................. 117
3.3.3.2.1 Summary of scale- up parameters from analytical to preparative HPCCC. ........................................ 118
3.3.3.2.2 The initial Sf, purity and yield of salidroside and Tyrosol in the Midi HPCCC separation with reversed
phase mode......................................................................................................................................................... 119
4.3.2.1 The initial Sf, purity and yield of salidroside and Tyrosol at the 0.5ml/min ........................................... 128
4.3.2.2 The initial Sf, purity and yield of salidroside and Tyrosol at the 1.0ml/min ........................................... 128
4.3.4.1 The initial Sf, purity and yield of salidroside and tyrosol with 0.43 ml sample loop ............................. 133
4.3.4.2 The initial Sf, purity and yield of salidroside and tyrosol with 0.86 ml sample loop ............................. 133
4.3.5.1 Summary of scale-up parameters from analytical to preparative HPCCC ............................................. 135
4.3.5.2The initial Sf, purity and yield of salidroside and tyrosol in reversed mode with the Spectrum
separation……………………………………………………………………………………………………….135
4.3.6.1 The initial Sf, purity and yield of salidroside and tyrosol in the Spectrum separation with reversed phase
mode at flow rate 4 ml/min……………………………………………………………………………………..138
4.3.6.2The initial Sf, purity and yield of salidroside and tyrosol in the Spectrum separation with reversed phase
mode at flow rate 8ml/min ................................................................................................................................. 139
4.3.6.3The initial Sf, purity and yield of salidroside and tyrosol in the Midi HPCCC separation with reversed
mode ................................................................................................................................................................... 140

15
ABBREVIATIONS
APCI Atmospheric pressure chemical ionization
BECCC Back-extrusion counter current chromatography
BIB Brunel Institute for Bioengineering
CAD Charged aerosol detection
CCC Counter current chromatography
CE Capillary electrophoresis
ChMWat Chloroform/methanol/water
CPC Centrifugal partitioning chromatography
DAD Diode-array detection
DNA Deoxyribonucleic acid
DMWI Methylene chloride/methanol/water/isopropanol
DuCCC Dual countercurrent chromatography
EBuWat Acetate/butanol/water
EECCC Elution-extrusion counter current chromatography
ELSD Evaporative light scattering detection
ELISA Enzyme-linked immunosorbent assay
ESI Electrospray ionization
F C Flash chromatography
FT-ICR Fourier transform ion cyclotron resonance
G C Gas chromatography
HEMWat Hexane/ethyl/acetate/methanol/water
HPCCC High performance counter-current chromatography
(Brunel based CCC operating at higher g level and higher flow rate than HSCCC)
HPMAE Microwave-assisted with high pressure extraction
HPTLC High-performance thin-layer chromatography
HPLC High-performance liquid chromatography
HILIC Hydrophilic interaction chromatography
HHP Hydrostatic pressure extraction
HSCCC High speed counter-current chromatography
IT Ion trap
KD Partition coefficient
LC Liquid chromatography
LOD Limits of detection
LOQ Limits of quantification
Lr Linear range
MAE Microwave-assisted extraction
MTBE Methyl tert-butyl ether

16
M S Mass spectrometry
MPLC Medium pressure liquid chromatography
MEKC Micellar electrokinetic chromatography
MEEKC Microemulsion micellar electrokinetic chromatography
NMR Nuclear magnetic resonance
PAD Pulsed amperometric detection
PLE Pressurized liquid extraction
PPD 20(S) – protopanaxadiol
PPT 20(S) – protopanaxatriol
PTFE Polytetrafluoroethylene
PHWE Pressurized hot water extraction
Q Quadrupole
QqQ Triple quadrupole
R E Reflux extraction
RSD Relative standard deviation
SD Standard deviation
SE Soxhlet extraction
Sf Stationary phase retention
SFE Supercritical fluid extraction
TCM Traditional Chinese medicine
terAcWat t-butylmethylether/acetonitrile/ water
terBuAcWat Methyl tert-butyl ether /butanol/acetonitrile/water
TLC Thin layer chromatography
TSP Thermospray
TOF Time-of-flight
UPLC Ultra performance liquid chromatography
UE Ultrasonic extraction
UV Ultraviolet
The following abbreviations have been used to ease representation in phase system composition:
CHCl3 Chloroform
CH3COONH4 Ammonium acetate
CH3COOH Acetic acid
CF3COOH Trifluoroacetic acid
EtOAc Ethyl acetate
HCOOH Formic acid

17
KH2PO4 Monopotassium phosphate
MeCN Acetonitrile
MeOH Methanol
NH4OH Ammonium hydroxide

18
CHAPTER 1
Introduction and Literature review

19
1.1 Aims and objectives
1. Development of new counter-current chromatography (CCC) methods for separation
of ginsenosides from Panax ginseng
2. Development of quantitative and qualitative liquid chromatography method for
Rhodiola rosea
3. Investigation of Scale-up of analytical HPCCC to preparative HPCCC for rapid
purification of salidroside and tyrosol from crude sample Rhodiola rosea.
1.2 Panax ginseng
1.2.1 Panax Ginseng Historical and botanical background
Panax ginseng is a Chinese herb that has been commonly used for over thousands of years as a key herb in
Chinese traditional medicine. It was first recorded as the “king of the herbs” in the Chinese herbal textbook
(Shen Nong Ben Cao Jing) in the 300 B.C and is currently widely applied as a medicine gloablly due to its
clinic efficacy. There are several different Panax species in the world, the most studies of ginseng usually have
been carried out in P. ginseng C. A. Meyer (Chinese or Korean ginseng) and P. quinquefolius (American
ginseng), the other P. notoginseng (Tienchi or Sanchi), P. vietnamensis (Vietnamese ginseng) and P. japonicus
(Japanese ginseng) are not popular but more and more researcher attach importance to them recently. The name
of genus Panax is derived from the Greek which means “all heal”. While the name of ginseng is derived from
the Chinese name rensen, because its root shape looks like a man. The other common names include five fingers
or seng. Traditionally, ginseng root can be classified into white ginseng and red ginseng based on the different
drying processes. White ginseng is prepared by air drying after peeling and red ginseng is prepared by the steam
at 98 - 100 ºC without peeling. Recently, another black ginseng has been reported to enhance its preservation
and biological effects, which has been processed by the steaming at 120 ºC temperature under high pressure [1].
It has been shown that ginseng berry or fruit and leaf also contain distinct bioactive constituents [2]. The
aboveground and root of P. ginseng are shown in Figs. 1.2.1.1 and Fig. 1.2.1.2, respectively.

20
Fig 1.2.1.1 Aboveground parts of Panax ginseng Fig 1.2.1.2 Roots of Panax ginseng.
1.2.2 Chemistry
To date more than 100 chemical entities from ginseng species have been reported [3]. The active chemical
entities found in most ginseng species include saponins, polysaccharides, peptidoglycans, polyacetylenic
alcohols, polyynes and volatile oils [4, 5]. Ginseng saponins are commonly called ginsenosides, which have a
triterpene dammarane skeleton with various sugar moieties such as glucose, maltose, fructose, and saccharose.
But the basic skeleton is similarly composed of 17 carbon atoms in a four ring structure. The property of
ginsenosides depended on the different type and number of sugar moieties attached to the C-3 and C-20
positions [6]. Currently, more than 100 ginsenosides have been extracted and separated from Panax species and
classified into the four types of aglycone moieties: the 20(S) – protopanaxadiol including Rb1, Rb2, Rb3, Rc,
Rd, Rg3, Rh2, Rs1 and malonylginsenoside Rb1, Rb2, Rc and Rd, the 20(S) – protopanaxatriol including Re,
Rf, Rg1, Rg2, Rh1, ocotillol-type including ginsenosides F11 [7] and oleanolic acid including ginsenosides Ro
(Fig 1.2.2.1). Ginsenosides are considered the major active compounds of ginseng and often used as the quality
standards to identify the ginseng species and ginseng drug in the market. Polysaccharides have proved that they
have the various biological activities used in drug by the Modern pharmacological experiments. Most of them
can be isolated from the leaves, roots or fruits of Panax ginseng [8, 9]. Volatile oils are also the other
ingredients of Panax ginseng. One experiment showed that 36 terpenoids were identified from the volatile oil in
the radixes of Panax ginseng at the age of 3 years by comprehensive two-dimensional gas chromatography [10].

21
a) 20(S) – protopanaxadiol
b) 20(S) – protopanaxatriol
Ginseoside R1 R2
F11 H Glc2-Rha

22
c) ocotillol-type
GinsenosideRo
d) Oleanolic acid R=GlcUA2-Glc
Fig 1.2.2.1 Main structures of ginsenosides including a) protopanaxadiol, b) protopanaxatriol, c) ocotillol
acid, d) oleanolic acid.
1.2.3 Adaptogenic Effects of Panax ginseng
Panax ginseng has traditionally been used for thousand years in China as an important tonic herb to strengthen
the whole body immune capacity and promote longevity. According to the traditional Chinese medicine theory,
panax ginseng can restore the vitality and energy with increasing Qi in the body and restore the body’s dynamic
balance of Ying and Yang to treat fatigue and weakness. In 1969, Brekhman first introduced the term adaptogen
to describe these tonic effects of ginseng [11].These adaptogenic effects are described as promoting resistance
to physical and biological stress coming from different environment conditions. They increase the body’s
physical and mental ability to stay the healthy and help the body to recover from illness by itself. The concept of
adaptogen was formally established by Russia researcher between 1950 and 1960[12] and defined the term of
adaptogen as a substance that had the non-specific effect in its pharmacological properties and builds up the
body function and improve the anti-stress capacity of an organism to adapt to environmental factors.[13]. One
report pointed out panax ginseng improved the capability of oxygen uptake in the elderly and greatly increased

23
the logic arithmetic and improved mental health in normal people [14]. Some of these effects were also
described by Pieralisi et al. [15] .Adaptogenic actions of panax ginseng are significantly enhanced in the
human subject when the organism suffered the influence of the different external environments. In the animal
model, Panax ginseng was shown to increase the ability of resistance to X-irradiation, viral and tumor load,
temperature stress, hyperbaric hyperoxia and physical exercise [16, 17].
1.2.4 Pharmacological effects of panax ginseng
It is reported that the saponins, also called ginsenosides, are the major active components in panax ginseng.
Most pharmacological actions of panax ginseng are attributed to them [18]. Pharmacological effects of the
panax ginseng have been reviewed by Anoja S et al.[19]. Furthermore, the pharmacology of ginsenosides was
reviewed by Leung & Wong [20]. Pharmacological effects of panax ginseng have been demonstrated that
ginsenosides had cognitive and anti-cancer effect in the cardiovascular and immune systems.
Cardiovascular Effects of Panax Ginseng
Scott et al. described ginsenosides Rb1 and Re as having depressant action on cardiomyocyte contraction
through a NO-mediated mechanism [21]. The cardiac depression associated with the ginseng-induced NO-
mediated vasodilatation should favour a reduced after-load for the heart and benefit cardiac pump function [22].
Cognitive effects of Panax Ginseng
Mook-Jung et al. described that the use of herbal medicine, particularly ginseng can improve cognitive
performance and this study has shown its enhancing effect on learning and memory in aged and brain damaged
rodents [23]. Experiments with animals have demonstrated the psychomotor effects of ginseng. Petkov et
al.,[24] showed that oral administered ginseng, at a dose of 20 mg/kg for 3 days, improved learning and
memory in rats performing a maze task.
Anticancer activities
Saponin and non-saponin compounds have been reported to show cytotoxic activities against various kinds of
cancer cell lines in culture. Lee et al. [25] previously reported that an acidic polysaccharide from panax ginseng
inhibited the incidence of benzopyrene-induced autochthonous lung tumors in mice through activating multiple
effector arms of the immune system. This property may contribute to its effectiveness in the immune prevention
and immunotherapy of cancer.Kim et al. [26] investigated the effect of 11 ginsenosides on cell proliferation of
prostate cancer cell lines and found Rg3 and Rh2 inhibit DNA synthesis in prostate cancer cells
1.2.5 Panax ginseng extractions for experimental studies
Efficient sample preparation can improve extraction efficiency, especially for Panax ginseng which contains
more than 100 different ginsenosides, and improve the target compounds purification and separation. To date,
different solvents and methods have been applied for the extraction of Panax ginseng. Panax ginseng are

24
traditionally made by using water, alcohol or and alcohol-water mixture as solvents in the industry. However,
for research purposes, a variety of solvents have been employed to extract active components including
methanol, 70% methanol, acetonitrile, water, hexane , acetone and diethyl ether and 50% ethanol. Among
various solvent systems, 100% methanol has better extraction efficiency than water or 70% aqueous methanol
extraction [27]. Extraction solvent and extraction volume are very important to achieve high recovery [28].
Soxhlet extraction (SE) [29], reflux extraction (RE) [30], ultrasonic extraction (UE) [31] and shaking extraction
[32] have been applied for extraction of ginsenosides from Panax ginseng as conventional methods. Recently,
some modern extraction methods have been performed such as Microwave-assisted extraction (MAE) [33],
Microwave-assisted with high pressure extraction (HPMAE) [34], Supercritical fluid extraction (SFE) [35],
pressurized liquid extraction (PLE) [36] and pressurized hot water extraction (PHWE) [37]. The advantages of
the new exaction methods contribute to easy operation, low cost solvent, speed and high efficient [38]. Table
1.2.5.1 lists the characteristics of nine different extraction techniques. Each has advantages and disadvantages.
Table 1.2.5.1 Characteristics of nine extraction techniques for saponins from ginseng plant materials
Technique key technology Advantage Disadvantage
SE Soxhlet extractor High efficiency, low cost Very low speed
RE Heating Easy operation, low cost Low efficiency, low speed
UE Ultrasound Easy operation, low cost Low efficiency, low speed
SAE Mechanical shaking High efficiency, Easy operation Hard automation
Low cost
MAE Microwave Easy operation, high speed Hard automation
Low cost
HPMAE High pressure Easy operation, high speed Hard automation
with microwave Low cost
SFE Supercritical fluid High speed, easy automation Hard operation, high cost
PLE High pressure High speed, easy automation Hard operation
PHWE High pressure and hot water Low cost, easy automation, Hard operation
Abbreviations: SE: Soxhlet extractor; RE: heat extraction; UE: ultrasound extraction; SAE: shaking-assisted
extraction; MAE: microwave-assisted extraction; HPMAE: high pressure MAE; SFE: supercritical fluid
extraction PLE: pressurized liquid extraction; PHWE: pressurized hot- water extraction;
1.2.6 Separation and purification methods of Panax ginseng
Many techniques can be used for the isolation and analysis of natural products. Separation and detection are the
main steps in this process. Separation of Panax ginseng saponins is employed by Thin layer chromatography
(TLC) or high-performance thin-layer chromatography (HPTLC); High-performance liquid chromatography
(HPLC), Hydrophilic interaction chromatography (HILIC) or Ultra Performance Liquid Chromatography
(UPLC); Flash chromatography (FC); medium pressure liquid chromatography (MPLC); gas chromatography

25
(GC); capillary electrophoresis (CE) and counter current chromatography (CCC). Among these techniques,
liquid chromatography is still the popular main technique for the Panax ginseng separation. A comparison of
different separation methods for ginseng analysis is given in Table 1.2.6.1
Table 1.2.6.1 Advantages and disadvantages of other analytical techniques compared to CCC
Technique Advantage Disadvantage
TLC Multiple sample analysis in one plate Low revolution, accuracy and repeatability
Simplicity, versatility and high velocity, Length of separation is limited
Sensitivity and simple sample preparation
GC High selectivity, high sensitivity Limit polar and non-volatile compounds
High separation efficiency Relative complex operation
FC Rapid, low cost and flexibility Low revolution
MPLC Lower cost, higher sample loading Low revolution
High throughput.
HPLC Speed of analysis, excellent resolution Particulates not tolerated
High sensitive, robust technique Undesirable interaction with stationary phase
HILIC Suitable for hydrophilic molecules Peak broadening
Weak interaction with stationary phase Short column lifetime
UPLC Highly efficient separation Back-pressure increase
Reduced analytical time
CE Small sample volume Low relative sensitivity
Short separation time Low reproducibility
Low sample loading
Poor concentration detection
26
CCC Versatile technique, cross contamination unlikely Lower efficiency,
High sample loading, economical Difficult optimisation
Predictable and reproducible Labour intensive operation
Particulates or crude sample accepted Narrow polarity range
Abbreviations: HPTLC: high-performance thin layer chromatography; GC: gas chromatography; FC: Flash
chromatography MPLC: medium pressure liquid chromatography HPLC: high-performance liquid
chromatography; HILIC: hydrophilic interaction liquid chromatography; UPLC: ultra-performance liquid
chromatography; CE: electrophoresis;
1.2.6.1 Thin layer chromatography (TLC)
Thin layer chromatography technique is a common and convenient method of determining the quality of herbal
products. The main advantages of TLC are its ease of use, versatility, speed, specific sensitivity, low cost and
simple sample preparation. Thus to now, TLC is still employed for the identification and analysis of the herbal
medicines by the United States Pharmacopoeia and European Pharmacopoeia [39]. A reversed-phase TLC
method is applied for analyzing multiple components of crude drugs containing ginseng, red ginseng and so on.
Ginsenoside-Rg1 is identified as a single spot separated from the sample solution using the sodium
sulphate/acetonitrile/methanolsolution (10:7:3) instead of the chloroform/methanol/water solution (13:7:2) [40]
to avoid the harmful reagents. Glensk et al. [41] developed a graft-TLC method of resolution of saponins from a
ginseng preparation using MeOH/ H2O (70:30, v/v) solution and CHCl3/MeOH/H2O (70:30:4, v/v/v) solution.
A method different from the standard TLC also has been developed for analysis of the ginseng species. It is
HPTLC with the high performance conditions. The advantages of HPTLC compared with the TLC are speed,
sensitivity and low solvent consumption. It also can be apply for the quantitative analysis of ginseng saponins.
A new high-performance thin-layer chromatography (HPTLC) method combining an automatic TLC sampler
and scanner has been employed for quantification of seven major ginsenosides in different ginseng species and
identifies their sources [42]. Vanhaelen-Fastre et al. [43] developed a successful method for simultaneous
determination of the six major ginsenosides in Panax ginseng roots with HPTLC after detection with thionyl
chloride, the disadvantage of TLC or HPTLC are low resolution, accuracy and repeatability.
1.2.6.2 Medium pressure liquid chromatography (MPLC)
Medium-pressure liquid chromatography (MPLC) is one of the efficient methods for the preparative separation
for nature products. It was developed from the low-pressure liquid chromatography and the separation under
medium pressure by using smaller particle size, which improves the efficiency of separation and provide more

27
choices for the stationary phase. These separation methods are now usually used in combination with the other
common preparative tools such as open-column chromatography, flash chromatography, LPLC or preparative
high performance liquid chromatography (HPLC) [44]. Compared with the low pressure and high pressure
liquid chromatography, the typical pressure of MPLC is 5-20 bar, the other two are 1-5 bar and more than 20 bar
respectively. MPLC has big advantages which allow higher loading capacities and higher throughput resulting
in increasing compound purity compared with flash chromatography. It also can provide faster separations and
higher resolution of compounds because its column design and packing of material with lower particle size
under pressure enhances separation quality [45]. MPLC has been employed for the ginseng sample preparation
due to its lower cost, higher sample loading and higher throughput. Cheng et al. [46] used the NP-MPLC
method with a 460mm×36mm I.D. column under gradient elution mode to enrich and purify the ginsenoside
Ro from panax ginseng in the first pre-treatment process, and then the enriched sample was further purified by
HPCCC. The result showed that 61mg with 96.0% purity ginsenoside Ro was obtained from 100mg sample
after a single CCC run in the end.
1.2.6.3 Flash chromatography
Flash chromatography is also a medium pressure chromatography technique based on optimized pre-packed
columns with a high flow rate of solvent. Flash chromatography normally uses the smaller silica gel particles
and air pressure to push the solvent through the column leading to reducing the separation time and therefore
separation time could take less than 10-15 minutes. Furthermore, the solvent system should be chosen that Rf of
the desired compound was in between 0.15 – 0.35 based on its polarity, most preferably 0.35, and there are two
sample loading methods for the flash column including wet loading and dry loading [47]. Thus, it is a rapid, low
cost and flexibile chromatography. As a type of preparative liquid chromatography, Flash chromatography used
to apply for the sample preparation and separation of organic compounds. Kim et al [48] performed the Diaion
HP-20 adsorption chromatography, silica gel flash chromatography, recrystallization, and preparative HPLC
methods to isolate the ginsenoside Rb1 and Rg1 as standard reference materials for good manufacturing
practice (GMP) based quality control.
1.2.6.4 High-performance liquid chromatography (HPLC), hydrophilic interaction LC (HILIC) and
ultra-performance LC (UPLC)
High-performance liquid chromatography (HPLC) is an advanced and ideal technology of liquid
chromatography used in separating the complex mixture compounds of panax ginseng because it is easy to use,
fast, high accuracy and precise and is not limited by the volatility or stability of the sample compound. The
other main advantage of HPLC is that many detectors can be coupled with it such as UV, DAD, ELSD, MS,
MS-MS, PAD and NMR, which can be widely applied for analyses ginsenosides of different complexity from
the Panax ginseng. In general, analysis of ginsenosides by HPLC is usually performed with standard 150 or 250
mm ×4.6 mm C18 columns under gradient elution mode using the reversed-phase conditions. Acetonitrile and
water with buffer such as KH2PO4 buffer or CH3COONH4 buffer are often used for the mobile phase. Hu et al.
[49] systematically investigated the retention behaviour of seven major neutral ginsenosides of Panax ginseng
28
with RP-HPLC and developed one novel HPLC method as above for the quantitative analysis of ginsenosides in
eight batches of ginseng samples from different sources. Recently, more than 100 new saponins have been
isolated from various parts of Panax plants and most of them are separated by the HPLC method coupled with
different detectors [50]
Hydrophilic interaction chromatography (HILIC) is an alternative approach to effectively separate small polar
compounds and ionisable solutes. In HILIC, the polar analytes are separated by passing aqueous– organic
mobile phases across a polar stationary phase such as silica, amino, cyano and diol causing solutes to elute in
order of increasing hydrophilicity which is opposite to that of RPLC [51]. Bonfill et al. [52] described one
HILIC method with a diol column using a mobile phase consisting of aqueous orthophosphoric acid and
acetonitrile (MeCN) for the separation and quantitative determination of ginsenosides in panax ginseng
preparations under isocratic mode. Shorter analysis time (20min) and better resolution were achieved, but
ginsenosides Rg1 and Re are still hard to separate individually.Thus, Quiming et al [53] developed one HILIC
method to investigate the retention of ginsenosides on a poly(vinyl alcohol) (PVA) bonded stationary phase. The
percentage of MeCN in the mobile phase, the column temperature and the flow rate are the key factors that
affect the retention behavior of ginsenosides on the PVA-bonded column and better resolution were obtained by
optimisation.
UPLC is an other ideal approach for the chromatographic separation of ginseng species. It uses smaller packing
(less than 2 µm particle) columns and operated at higher pressures (up to 15,000 psi). Compared with traditional
HPLC method, the advantages of UPLC are providing a higher peak capacity, greater resolution, increased
sensitivity and higher speed of analysis [54]. UPLC coupled with MS detector and MS2 or carried out with ESI,
TOF or QqTOF instruments are developed for the the analysis of ginseng saponins in metabolomic
fingerprinting[55,56],quality control [57] and biological samples [58]. The main disadvantages of UPLC are the
higher backpressure of the system and the solvent cost compared to conventional HPLC.
1.2.6.5 Gas chromatography (GC)
Gas chromatography has always been the sensitive method of choice for analyzing essential oils or volatile
compounds [59]. GC has big advantages of high selectivity, high sensitivity and high separation efficiency on
the analysis of many active volatile components from herbal medicines. Sample preparation as the first step in
GC analysis of saponins in Panax ginseng is very important due to the efficiency of detection. Most GC method
used for capillary columns with dimensions of 30 m×0.25 mm×0.25 µm. For detection, the flame ionization
detector (FID) is extremely popular due to its detector range. GC coupled with the MS can provide the
advantage of both chromatography and structure of the compound information [60]. In addition, GC-MS
coupled with a chemometric resolution method has commonly been used for the analysis of volatile compounds
in Panax ginseng. Richter et al.[61] used the GC-MS method to investigate the volatile constituents of the
roots of Panax ginseng. Three sesquiterpene hydrocarbons have been isolated from the essential oil and their
structures identified by MS and NMR. The GC method has also been applied for the screening of pesticides in
the ginseng extracts. In order to achieve the speed and efficient, GC has been combined with MS/MS, HR-

29
TOF)/MS (high resolution time-of flight) also are described [62]. Recently, a new two-dimensional
comprehensive GC (GC ×GC) method has been introduced to employ in the analysis of the Panax ginseng
extracts. This technique promotes the resolution and sensitivity by using two GC columns [63]. Shellie et al.
[64] used the comprehensive GC ×GC-FID and GC ×GC -qMS method for analysis of Asian and American
ginseng. Qiu et al. [65] employed the 2-D GC (GC×GC) coupled with TOF/ MS method to characterize and
quantify the chemical composition of volatile oil in the radixes of Panax ginseng at different ages. Thirty-six
terpenoids were successfully identified. However, the most serious disadvantages of GC are that it is not
convenient for its analysis of the samples of polar and non-volatile compounds and the samples must be
thermally stable to prevent degradation when heated.
1.2.6.6 Capillary electrophoresis (CE) and Micellar electrokinetic chromatography (MEKC) and
microemulsion EKC (MEEKC)
Capillary electrophoresis was introduced in early 1980s as a powerful analytical and flexible separation
technique. It provides an efficient way to identify the complexity of a sample and can deal virtually every kind
of charged sample components ranging from simple inorganic ions to orgnic. Due to the absence of charge in
ginsenosides, capillary electrophoresis (CE) was applicable. Therefore, micellar electrokinetic chromatography
(MEKC) and microemulsion EKC (MEEKC) have been introduced to use for the isolation of neutral ginseng
saponins, because MEKC allows the separation of neutral, charged, and ionic, acidic and basic compounds.
Advantages of MEKC are high efficiency, fast analyses, and a powerful flexibility in rapidly tuning or changing
the running buffer composition and subsequently the selectivity of the separation [66]. A method with Micellar
electrokinetic chromatography (MEKC) was developed for analysis of ginsenosides Rb1, Rb2, Re, Rc, Rf,Rd
and Rg1 in a Panax ginseng extract .Seven major ginsenosides were successfully separated in less 20min better
than the normal HPLC method [67]. Cao et al. [68] employed a novel on-line preconcentration technique
combining dual sweeping for analysis of ginsenoside Rf, ginsenoside Rg1, and ginsenoside Re with nonionic
MEKC and achieved a high separation efficiency. In addition, MEKC method was also successfully applied for
the the pharmaceutical quality control of Panax notoginseng [69]. Compared to MEKC, MEEKC can enhance
solubilization capacity and explore migration window for various compounds, which provided reducing sample
pre-treatment steps, unique selectivities and higher efficiencies [70]. Cao et al improve their method using
MEEKC combining complex formation and acetonitrile (ACN) sweeping to separate and detect the
ginsenosides Rf, Rb2 and Re with selectivity and efficiency [71].
1.2.6.7 Counter-current chromatography (CCC)
Liquid–liquid isolation techniques such as high-speed counter-current chromatography (HSCCC) and
centrifugal partition chromatography (CPC) depend on the partition of a sample between two-phase solvents

30
system. As methods with high efficiency, high recovery and low cost that are easy to scale-up, HSCCC and CPC
have been used in preparative separation of ginseng saponins [72- 77]. The separation of ginsenosides Rf, Re,
Rd, Rb1, Rc, Rb2 and Ro by HSCCC has already been reported recently. Several papers have been published on
the preparation of ginsenosides and notoginsenosides from Panax ginseng or notoginsen by CCC. Qi et al. [72]
have successfully separated ginsenosides Rf, Re, Rd and Rb1from the panax ginseng with a salt/containing
solvent system and flow step-gradient by using HSCCC coupled with ELSD. Furthermore, Cheng et al. [73]
have developed a two–step counter-current chromatography method for the preparation of ginsenosides Re,
Rb1, Rc and Rb2 from Panax ginseng, using two different solvent systems combined with ELSD based on Qi’s
previous study. The first separation step was applied for the classical CCC mode while the EECCC mode was
used in the second separation step. Cheng et al. [74] also first chromatographed and separated the ginsenoside
Ro from Panax ginseng by a combination of normal phase medium-pressure liquid chromatography (NP-
MPLC), which was initially used to enrich ginsenoside Ro and was further purified by HPCCC. In addition, in
2003, Du et al. performed HSCCC to successfully separate ginsenosides Rb1, Re, Rg1 and notoginsenoside R1
from the Panax notoginseng [75]. Later HPCCC coupled with an evaporative light scattering detector (ELSD)
was introduced for the separation of ginsenoside Re, ginsenoside Rg1, ginsenoside Rd and ginsenoside Rb1by
Cao et al. [76]. After the success of this approach, it has been more widely used in the separation of
ginsenosides. Ha et al. [77] applied this method (HSCCC coupled with ELSD) to separate less polar
ginsenosides such as Rg3, Rk1, Rg5 and F4 from Korean red ginseng. In addition, the solvent systems
containing chloroform have been replaced by other chlorinated solvent systems such as methylene chloride-
methanol-water since 2004 [78], or alternatively by adding another alcohol such as isopropanol [77]. Although
the chloroform-methanol-water solvent system is suitable for separation of glycoside compounds, the use of
chloroform will bring about the risk of contamination of the environment. Qi performed methylene chloride–
methanol–5mM aqueous ammonium acetate–isopropanol (6:2:4:3 v/v/v) solvent system to separate
ginsenosides Rf, Re, Rd and Rb1 [72]. Cheng performed methylene chloride–methanol– water–isopropanol
(6:2:4:3, v/v/v) and n-hexane–n-butanol–0.1% formic acid (0.7:3:4 v/v), two different solvent systems, to
separate ginsenosides Re, Rb1, Rc and Rb2, and ethyl acetate–isopropanol–0.1% formic acid (3:1:5 v/v) solvent
system for the separation of ginsenosides of Ro [72, 73]. N-hexane–n-butanol–water (3:4:7 v/v) and methylene
chloride–methanol–water–isopropanol (6:6:4:1 v/v/v) were used as the two-phase solvent system of the HSCCC
separation in Du’s and Ha’s papers [75, 77], respectively. Only Cao used the chloroform -methanol-2-butanol-
water (5:6:1:4 v/v/v/v) and ethyl acetate – 1-butanol-water (1:1:2 v/v/v) solvent system to separate saponin
(2003) [76]. For this reason, the chloroform-methanol-water-isopropanol (4:3:2:1 v/v) solvent system is not the
optimal selection of solvent system for the separation of ginsenosides. Furthermore, compared with the different
HSCCC methods of separation of ginsenosides, only 120 minutes of separation time was needed for Midi-
HPCCC in Qi’s method and 160 minutes of separation time each for two steps of CCC separations in Cheng’s
method [72,73]. Finally, macroporous adsorption resin applied for separation and purification of 20(S)-
protopanaxtriol(PPT) and 20(S)-protopanaxdiol (PPD) type ginsenosides from Panax ginseng extract is
recommended preparation method used for separation of ginsenosides, because it was commonly used for
enriching compounds such as saponins from Chinese herbs and this was used as a general method of
preparation of saponins in Chinese Pharmacopoeia [79]. Zhao et al. [80] has developed a novel method for the
separation of two types of ginsenosides (PPD and PPT) combining macroporous resin adsorption with

31
microwave assisted desorption. Qi also used the macroporous resin for the preparation of the crude sample of
Panax ginseng prior to HPCCC separation [72]. As one of the conventional column separation technologies for
ginsenosides, macroporous resin is a useful method for separation and purification of 20(S)-protopanaxtriol
(PPT) and 20(S)-protopanaxdiol (PPD) type ginsenosides as they have different adsorption forces to resin,
which can be subsequently eluted with different concentrations of organic solvent, such as methanol. Table
1.2.6.7.1 summarizes recent applications of CCC to isolation of saponins from Panax ginseng products.
Notoginsenoside R1 and ginsenosides Ro, Rb1, Rg1, Re, Rf, Rd, Rg3, Rg5, Rk1and F4 have been isolated by
CCC. Table 1.2.6.7.2 summarizes the characterization of HPCCC for the separation of ginsenosides from Panax
ginseng products.
Table 1.2.6.7.1 Separation of ginsenosides from panax ginseng products by CCC
Material Solvent system (volume ratio) Detection Target compound Isolation efficiency Reference
P. ginseng, CH2Cl2–MeOH–NH4OAc–iPrOH ELSD Ginsenosides Rf, Rd, 11.0, 10.7 , 13.4 and 13.9 mg of Rd, 72
root (6 : 2 : 4 : 3) Re, and Rb1 Rf, Re and Rb1 from 480 mg
enriched by macroporous resin
P. ginseng, EtOAc–iPrOH–0.1% formic ELSD Ginsenoside Ro 61 mg Ro from 100 mg enriched 74
root acid in H2O (3 : 1 : 5) sample by normal-phase MPLC
P. notoginseng, Hex–n-BuOH–H2O (3 : 4 : 7) TLC Ginsenosides Rb1, Re, Rg1 157, 13, 56, and 17 mg of Rb1, Re 75
Root and notoginsenoside R1 Rg1 and R1 from 283 mg MeOH extract of five tablets
P. notoginseng, CHCl3–MeOH–2-BuOH–H2O Ginsenosides Rg1, Rd, Re NA 76
Root (5 : 6 : 1 : 4), EtOAc–nBuOH–H2O ELSD Rb1 and notoginsenoside R1
(1:1:2)
Red P. ginseng, CH2Cl2–MeOH–H2O–iPrOH ELSD Ginsenosides Rg3, Rk1 32.2, 26.6, 28.6 and 8.1 mg of Rg3, 77
steamed root (6 : 6 : 4 : 1) Rg5 and F4 Rk1, Rg5 and F4 from 350 mg
enriched fraction by RP-C18 column
P. ginseng, Hex–n-BuOH–0.1% formic ELSD Ginsenosides Re, Rb1, Rb2 76.1mg,137.0mg, 58.8mg and 85.1mg 73
Root acid in H2O(0.7 : 3 : 4) Rc of Re,Rb1, Rc and Rb2 from 1440 mg
CH2Cl2–MeOH–NH4OAc–iPrOH enriched by macroporous resin
(6:2:4:3)
Abbreviations: Hex: n-hexane; BuOH: butanol; CH2Cl2: dichloromethane; MeOH: methanol; NH4OAc:
ammonium acetate; iPrOH: isopropanol; CHCl3: chloroform; EtOAc: ethyl acetate. ELSD: evaporative light
scattering detection; UV: ultraviolet. RP: reversed-phase; MPLC: medium-pressure liquid chromatography,
TLC: thin-layer chromatography
Table 1.2.6.7.2 Characterization of CCC for separation of ginsenosides from Panax ginseng products
CCC machine coil volme tube β value sample loop rpm flow rate run time type of Ref No
ml mm ml ml/min min CCC
Analytical milli 0.4 1.6 0.56 NA 1800 flow step gradient 140 HPCCC 72 0.5~0.75~1 Preparative midi 912 4.0 NA 20 1250 flow step gradient 140 HPCCC 72 20~50~100

32
Analytical midi 33 0.8 0.52-0.86 0.8 1400 1.0 70 HPCCC 74
Preparative midi 903 4.0 0.64-0.81 20 1400 30 70 HPCCC 74
Multilayer coil 385 2.6 NA NA 650 2.5 HSCCC 75
Analytical multi 35 0.8 0.4-0.72 NA 1800 1.0 80-300 HSCCC 76
Preparativemulti 230 1.6 0.5-0.75 NA 800 2.0 300 HSCCC 76
Preparative 325 1.6 0.5-0.75 NA 800 1.3 400 HSCCC 77
Analytical midi 33 0.8 0.52-0.86 NA 1400 1.5 150 HPCCC 73
preparative midi 903 4.0 0.64-0.81 NA 1250 flow step gradient 140 HPCCC 73
20~50~100
Abbreviations: β is the ratio of the coil radius r to the revolution radius R
1.2.7 On-line detection methods
Correct detection techniques application for the analysis of Panax ginseng after separation is also a very
important step as Panax ginseng contains many complex bioactive ginsenosides. On-line detection methods
include ultraviolet (UV), diode-array detection (DAD), evaporative light scattering detection (ELSD),
fluorescence, charged aerosol detection (CAD), Pulsed amperometric detection (PAD), mass
(MS) and ELISA. Also different detectors can be combined together to get more information of the target
compounds. Table 1.2.7.1 compares the advantages and disadvantages of the various methods.
Table 1.2.7.1 Characterization of detection methods for Panax ginseng analysis
Method Advantage Disadvantage Ref No
UV/DAD Low cost, wide linear range Middle sensitivity 83, 84, 85, 86, 87
Good precision
ELSD Good precision,speed Poor sensitivity, narrow range 91,92,93,94,95,96
Low cost
Fluorescence High sensitivity, wide linear range Unavailable to structure 101,102,103
CAD Good precision, easy operation Middle sensitivity 104,105,106
PAD High sensitive, repeatable, Narrow range 107,108,109,110
High selective,
MS High sensitivity, powerful to structure Expensive, hard operation 124,125,126,127
ELISA High sensitivity, low cost Low precision, narrow range 132,133,134,135,136
Abbreviations: UV/DAD: ultraviolet or diode-array detection; ELSD: evaporative light scattering detection;
CAD: charged aerosol detection; PAD: Pulsed amperometric detection; MS: mass spectrometry; ELISA:
enzyme-linked immunosorbent assay.
1.2.7.1 Ultraviolet (UV) or diode-array detection (DAD)

33
UV detection is the most popular and common method among the different techniques for the detection of
Panax ginseng. It is cheap and easy to operate. But the UV absorption of most saponins of Panax ginseng is not
strong with poor sensitivity and causes the high level of baseline noise during the analysis process, the detection
of UV is usually set at 198-205 nm [81,82], using at 203 nm, most main saponins of ginseng can give
relatively satisfatory result [83-85]. DAD has also been used for the analysis of Panax ginseng due to the
accuracy, precision and reproducibility, the main disadvantage is also poor sensitivity to saponins. The
combined use of HPLC-DAD-ELSD has been shown to be suitable for detection of the multiple and complex
analytes in Panax ginseng [86], five constituents of FZS, namely baicalin, ferulic acid, and ginsenosides Rg1,
Re, and Rb1, were identified based on their retention times. HPLC-UV/DAD coupled with MS method was
employed for simultaneous determination of flavonoid, saponins and polyacetylenes in Folium ginseng and
Panax ginseng with pressurized liquid extraction and promoted the identification and quantification of
compounds in ginseng [87].
1.2.7.2 Evaporative light scattering detection (ELSD)
Due to the weak UV absorption of ginsenosides, the main problems encountered in performing UV analyses of
Folium ginseng is poor sensitivity [88], ELSD works by measuring the light scattered from the solid solute
particles remaining after nebulization and evaporation of the mobile phase [89].It is a mass detection method
which is based on LC column effluent nebulization into droplets by the nebulizing gas, The sensitivity of ELSD
detection typically ranges from 10 to 100ng [90]. The advantage of ELSD is that it can provide a stable baseline
with high sensitivity compared with the UV and it can modified by the different volatile mobile phase such as
NH4OH, HCOOH,CH3COOH, CF3COOH to obtain the information of the targets [91,92]. The flow rate of the
nebulizer gas and the drift tube temperature are the main factors of the ELSD [93, 94].
The ELSD can provide a stable baseline even with gradient elution and has firstly been successfully applied to
the analysis of ginsenosides in Asian ginseng in 1996 by Park et al. [91]. Ginsenosides Rb1, Rb2, Rc, Rd, Re,
Rf, Rg1, Rg3 and Rh in white and red Asian ginseng (Panax ginseng) were identified by HPLC-ELSD using the
a LiChrosorb NH2 column and gradient elution. S.W. Kwon, et al [95] developed the HPLC-ELSD method for
the determination of less polar ginsenosides in processed ginseng including ginsenosides F, Rg , Rk and Rs used
a C-bonded silica column with a reversed-phase gradient elution. W. Li, et al, used the HPLC-ELSD method to
successfully quantitate 24(R)-pseudoginsenoside F11 in North American ginseng. This method also used
reverse-phase column withacetonitrile and water as the mobile phase [96]. Wan et al. [92] developed a HPLC-
ELSD method with pressurized liquid extraction (PLE) to qualitatively and quantitatively determine twelve
major saponins (notoginsenoside R1, pseudo-ginsenoside F11, ginsenosides Rg1, Re, Rf, Rb1, Rg2, Rc, Rb2,
Rb3, Rd, and Rg3 ) from the three Panax ginseng, Panax quinquefolius, and Panax notoginseng of the Panax
genus. The ELSD was found to be rapid, relatively inexpensive and accurate. ELSD is used when a compound
has no UV absorbance or a weak UV absorbance or the absorbing wavelength of the target compound is
unknown. Although the sensitivity of ELSD is not better than MS/MS analysis, it is preferable to the UV. Thus
it can be used to quantitate any ginsenoside of ginseng in principle. But ELSD is not available for the volatile
solutes and it’s signal measurement is direct from sensor which can limit the sensitivity and stability of the

34
detector, because this type of measurement has inherent sensor noise and drift [97]. Also the ELSD has
significant limitations in dynamic range and the nature of calibration curves [98].
1.2.7.3 Fluorescence
Fluorescence is one of the most sensitive detection methods for HPLC analyses. It affords greater sensitivity to
sample concentration due to the fluorescent light being measured against a very low light background [99].
Fluorescence detection methods with HPLC have been applied for the analyses ginsenosides of Panax ginseng
as a supplement of the UV and ELSD detection methods. Because UV detection has poor sensitivity to
ginsenoside and the ELSD detection method has limitation of ginsenosides Rg1, Rd and Re reported as 50, 40,
65 ng, respectively [100]. A new HPLC method with fluorescence detection has been described for the analysis
of ginsenosides Rb1, Rb2, Re, Rd and Rg1 in Panax ginseng and Panax notoginseng, The detection limit for the
ginsenoside Rg1 was found to be about 130ng [101] and the detection limits for the ginsenoside Rg1 using
TBAQ, CAQ or AQ as a photoreagents were found to be 35 ng, 50 ng and 50 ng, respectively [102]. Shangguan
et al. [103] developed a novel, reliable and sensitive pre-column derivatization method for fluorometric
detection for ginsenosides Rb1 and Rg1, The detection limits of ginsenosides Rg and Rb 1 were 2.0 ng and 1.0
ng. Thus the detection limits of ginsenosides with fluorescence detection methods can be improved.
1.2.7.4 Charged aerosol detection (CAD)
Charged aerosol detection (CAD) is a new universal detector similar to ELSD, a mass-dependent detector based
upon innovative technology. It has been developed to be used to determine compounds with weak UV
absorption and low content at the same time. The main advantages of a CAD detector include better sensitivity
than the ELSD system, a dynamic range of up to 4 orders of magnitude, ease of use and constancy of response
factors [104]. Like ELSD, CAD is also employed for the analysis of saponins. Seven saponins, notoginsenoside
R1, ginsenosides Rg1, Re, Rb1, Rg2, Rh1, and Rd in Radix et Rhizoma Notoginseng were successfully
determined and quantified by using the HPLC-DAD method for the first time [105]. In addition, compared with
UV and ELSD, the response and the sensitivity of most saponins in Radix et Rhizoma Notoginseng by CAD are
both higher than that of others. Wang et al. [106] made a comparison of the literature of LC-CAD, LC-UV and
LC-ELSD for simultaneous determination of seven major triterpenoid saponins in Panax ginseng including
ginsenosides Rg1, Re, Rb1, Rc, Rb2, Rb3 and Rd based on the sensitivity, linearity and reproducibility. The
CAD is somewhat more sensitive than UV and ELSD for ginsenosides detection. The linearity of CAD is
somewhat better than that of ELSD but both linearities are poorer than UV. For reproducibility, the CAD has a
close reproducibility to UV but over ELSD. Therefore, although CAD is not considered a perfect detector for
the analysis of saponins, it is still the alternative selection due to its remarkable sensitivity, ease of operate, and
its outstanding performance on reproducibility.
1.2.7.5 .Pulsed amperometric detection (PAD)
Pulsed amperometric detection (PAD) is an electrochemical detection method that measures the positive
potential produced by carbohydrate oxidation on a gold electrode, allowing the direct detection of carbohydrates

35
at low pico-mol levels, while PAD allows direct analysis of non-derivatized substrates at low p mol levels [107].
HPAEC-PAD has been used for the quantitation of carbohydrates in natural samples due to its strong anion-
exchange properties [108]. Thus a new PR-HPAEC-PAD method with reversed-phase C-18 column was
developed for analysis of polar ginsenosides in ginseng [109]. Eight different polar ginsenosides were separated
completely in 50 min with PAD under NaOH alkaline conditions and this method has proved sensitive,
repeatable, and selective without the pretreatment step. The same research group later used the RP-HPLC-PAD
method to successfully separate six non-polar ginsenosides (Rh1, Rh2, Rg2, Rg3, Rg5 and Rk1) in 6-year-old
red ginseng, 4-year-old red ginseng and hairy root of 4-year-old red ginseng [110]. Nonpolar ginsenosides
efficiently extracted by ethyl acetate were well separated in 40 min. but the previous two methods have several
problems such as long time taken for analysis and peaks overlap. Lee et al. [111] described a direct
determination method for polar and non-polar ginsenosides in red ginseng with the Kinetex C-18 column using
PR- HPAEC-PAD without pretreatment or extraction steps and enabled highly sensitive analysis within 1 h. It
also had a high selectivity, high sensitivity, and good reproducibility
1.2.7.6 Mass spectrometry (MS)
Mass spectrometers (MS) hyphenated with LC chromatography technology have been successfully applied to
the analysis and identification of saponins for some years. HPLC-MS and GC-MS are mostly used for the
quality of Panax ginseng samples. Frit-fast atom bombardment (FRIT-FAB) [112,113] and thermospray (TSP)
[114] interfaces connecting with HPLC once used to be employed for the qualitative analysis of Panax ginseng,
but have been replaced by atmospheric pressure chemical ionization (APCI) [115,116] and electrospray
ionization (ESI), [117,118], in ginseng analysis, because they have good reproducibility. Quadrupole (Q) [119]
ion trap, (IT) [120] time-of-flight (TOF) [121,122] and Fourier transform ion cyclotron resonance (FT-ICR)
[123] have been reported to be used as the mass analyzer for the analysis of Panax ginseng. Quadrupoles are
easer and cheaper mass analyzers compared to other mass analyzers. Ion trap can be employed in the MS/ MS
without any other mass analyzer. Time-of-flight mass analyzer has a good accurate analysis with high resolution
but is expensive. Fourier transform ion cyclotron resonance mass analyzers are also similar to TOF. In order to
promote the accuracy of compound structure information, multi-stage MS has been developed to be applied for
the analysis of ginseng. Ji et al. performed the HPLC–MS/MS with negative ionisation mode to successfully
quantify ginsenosides Rb1, Rb2, Rc, Re, Rf, Rd and Rg1 from Panax ginseng and Panax quinquefolius [124].

36
Also HPLC–MS/MS with positive ion mode was used for the determination of ginsenosides Rb1, Rb2, Rc, Re,
Rf, Rd and Rg1 from Asian and American ginseng [125]. Multi-stage MS has also been employed for the
quantification of ginsenoside Rf and 24(R) pseudoginsenoside F11 [126, 127] in the Asian and American
ginseng. Ginsenoside Rf was found only in Asian ginseng. Whilst 24(R) pseudoginsenoside F11 was found in
the American ginseng. Many mass analyzers are also hyphenated for the requirement of analysis of ginseng
such as triple quadrupole (QqQ) [128] quadrupole ion trap (Q-IT) [129] quadrupole time-of-fight (Q-TOF)
[130] or ion trap time-of-flight (IT-TOF) [131].
1.2.7.7 .Enzyme-linked immunosorbent assay (ELISA)
ELISA is a simple, sensitive, rapid and reliable biochemical assay system for quantitation of antigens and
antibodies. MAbs are often used. In the earlier experiments, Fukuda et al. [132] prepared the MAb against the
major active component, ginsenoside Rb1 for use with ELISA for the qualitative analysis of ginsenosides Rb1
as a marker component of Panax ginseng, immunoaffinity concentration and Western blotting for the
determination of ginsenosides in the crude drug of Panax species and traditional Chinese herbal medicines. But
the western blotting method has not t been applied for small molecules, a new Staining Method for ginsenosides
called Eastern Blotting with ELISA has been developed for the require and applied for the study of ginsenosides
Re,Rb1,Rg1,Rd and Rc [133-137]. In addition, Morinaga et al. [138] also employed the ELISA method for
determination of total ginsenosides used ginsenosides Re as a standard. The advantages of the ELISA method
compared with the HPLC method contribute to its effective cost-performance, speed, sensitivity, and ease of
use.
1.3 Rhodiola rosea
1.3.1 Historical and botanical background
Rhodiola rosea, also known as Arctic root or Golden root, is a member of the Crassulaceae family. It grows at
high altitudes above sea level. As an herb, it grows about 2.5 feet high and has yellow flowers. Rhodiola rosea is
a perennial herbaceous plant distributed in southwest China, including Yunnan and Sichuan provinces as well as
in Tibet. It also grows primarily in dry sandy ground at high altitudes in the arctic areas of Europe [139]. For
centuries, Rhodiola rosea has been used in the traditional medicine of Russia, Scandinavia, and other countries.
In China, it was first used by Tibetans for maintaining body health and treating various diseases in AD 760. As a
traditional herbal remedy, Rhodiola rosea has been used by Tibetans in many ways such as clearing heat in the
lungs, eliminating toxins from the body, treating various epidemic diseases, edema of limbs, traumatic injuries
and burns [140]. It also has the direct effects of central nervous system, endocritic system and assists the body
in excellent balance situation. It has been also reported that it plays a role in attenuating the mental fatigue
caused by voyage [141]. On the whole, Rhodiola rosea has been shown to have a significant effect on the

37
treatment of cardiovascular and cerebrovascular diseases, such as coronary heart disease, hypertension and
menopausal syndrome. The aboveground and root of Rhodiola rosea are showed in Figs. 1.3.1.1 and Fig.
1.3.1.2, respectively.
Fig 1.3.1.1 Aboveground parts of Rhodiola rosea. Fig 1.3.1.2 Roots of Rhodiola rosea
1.3.2 Chemistry
Based on the investigations by Saratikov et al. and Kurkin & Zapesochnaya [142,143], the compounds of the
Rhodiola rosea are classified into six groups: Phenylpropanoids (rosavin, rosin, rosarin); Phenylethanol
derivatives (salidroside, tyrosol); Flavanoids (rodiolin, rodionin, rodiosin, acetylrodalgin, tricin); Monoterpenes
(rosiridol, rosaridin); Triterpenes (daucosterol, beta-sitosterol) and Phenolic acids (chlorogenic and
hydroxycinnamic, gallic acids). Salidroside and tyrosol have been both found in all species of Rhodiola and
identified significant bioactivity, which can be selected as the standardization of quantity and quality the
Rhodiola species [144]. Fig.1.3.2.1 shows the Salidroside and tyrosol chemistry structure.
Rohloff [145] reported that 86 compounds were identified from the essential oil of Rhodiola rosea L. dry
root including monoterpene hydrocarbons (25.40%), mono-terpene alcohols (23.61%) and straight chain
aliphatic alcohols (37.54%). n-Decanol (30.38%), geraniol (12.49%) and 1,4-p-menthadien-7-ol (5.10%).
a) Structures of salidroside b) Structures of tyrosol
Fig 1.3.2.1 Structures of salidroside (a) and tyrosol (b)

38
1.3.3 Pharmacological effects of Rhodiola rosea
1.3.3.1Adaptogenic and anti-stress effect
Rhodiola rosea was also recommended as an adaptogen by Russian researchers similar to Panax ginseng and
Eleutherococcus senticosus due to its ability to resist the stress related conditions and relieve the body fatigue
[146]. Spasov, et al. [147] described that the Rhodiola rosea SHR-5 extract can improve the attention and
relieve the stress of foreign students during a stressful examination period and also SHR-5 extracts can show
significant improvement in physical fitness, mental fatigue and neuro-motor tests.
1.3.3.2 Cardioprotective effects
Cardioprotective effects are one of the important Pharmacological effects of Rhodiola rosea. Wang et al. [148]
observed the effects of salidroside on carbohydrate metabolism and differentiation of 3T3-L1 adipocytes and
found that salidroside can promote 3H-glucose up-take. Kucinskaite et al. [149] also found they can prevent the
heart system from stress and arrhythmias, and possess some antioxidant activity. It may provide a new insight
into the mechanism of cardioprotection. Thestudy of Zhang et al [150] observed that salidroside has protective
effect against hypoxia-induced cardiomyocytes necrosis and apoptosis by increasing HIF-1α expression and
subsequently up-regulating VEGF levels.
1.3.3.3 Anti-inflammatory effects
Rhodiola rosea roots contain a rich amount of polyphenols including flavonoids and tannins, which have proved
to show a significant anti-inflammatory activity. Pooja et al [151] investigated and determined that the tincture
extract of Rhodiola rosea roots can inhibit some enzymes relating to inflammation and the effect depended on
the concentrations. Panossian et al. [152] also summarized the pharmacological effects of Rhodiola rosea not
only including the adaptogenic effect such as anti-stress and anti-fatigue effect, but also including an
antioxidant effect, antidepressive and anxiolytic effects and life-span increasing effect on the human or animal
models.
1.3.4 Separation and purification methods of Rhodiola rosea
As previously described Pharmacology of the Rhodiola rosea, the Salidroside (rhodioloside), the additional
salidroside-like glycoside compounds (rhodiolin, rosin, rosavin, rosarin, and rosiridin), and tyrosol contribute to
the bioactivity of Rhodiola rosea [153]. Many separation methods have been applied for the purification and
analysis of the active constituents in R.rosea. Liquid chromatography (LC) still plays a significant role in the
separation and isolation of polar compounds of R.rosea such as HPLC coupled with UV [154-157] and MS
[158-162].Generally, reversed-phase mode and C18 columns are recommended for use because of the high
throughput [10]. HPLC coupled with MS has been proved to be a more advanced method for the determination

39
and identification of complex compounds in natural herbs with high sensitivity. Atmospheric pressure chemical
ionization (APCI) [153] and electrospray ionization (ESI) [159,162] coupled with LC/MS are both commonly
employed for the identification of the flavonoids, phenylalkanoids and monoterpenoids in Rhodiola rosea, while
Tolonen et al. [160] performed with APCI and ESI to optimize the ionization process for the analysis of the
main active compounds from Rhodiola rosea extracts and make a comparison study of them. The ESI had the
best sensitivity compared to APCI. The multi-stage MS method with LC was used for the quantification of
salidroside in biological fluids due to its more specificity and sensitivity [163].
TLC, as an easy and rapid method, also was used for the separation of the Rhodiola rosea [164] especially for
HPTLC [165], It is becoming a routine analytical technique because of its low operating cost, high sample
throughput. Recently, a new rapid resolution liquid chromatography (RRLC) method has been developed for
qualitative and quantitative analysis of six major bioactive compounds in Rhodiola rosea [166]. The big
advantages of RRLC are high speed with high resolution and low analysis costs; the whole analysis time was
finished in 8 min with baseline separation. Therefore, RRLC is an attractive alternative to conventional HPLC
technique with high sample throughput and fast analytical speed.
In addition, Capillary electrophoresis (CE) is an effective tool for the separation of polar natural compounds
with high speed and low solvent consumption. Compared with LC method, CE method can eliminate the
contamination from the silica column and organic solvent which could be a potential risk for humans. It has
been successfully used to separate five active compounds from extracted Rhodiola rosea including salidroside,
tyrosol, rhodionin, gallic acid and ethyl gallate in 7 min with the high effciency [167]. Furthermore, Cui et al.
[168] developed the same method for simultaneous determination of tyrosol and salidroside in three different
Rhodiola species, both target compounds were separated within 15 min.
For industrial applications, adsorption chromatography using macroporous resins was introduced for preparative
separation and purification of salidroside [169], rosavin [170] and oligomeric proanthocyanidins [171] from the
Rhodiola rosea for its easy operation, low cost, high efficiency and easy regeneration. The big advantage was it
was suitable for large scale industrial production compared with other separation technology. The HD-200 resin
is the best medium for the Rhodiola rosea separation based on the optimization of the main four parameters: the
volume, concentration, bed height and flow rate of loading sample.
High-speed counter-current chromatography is a liquid-liquid chromatography with high efficiency and high
recovery that are easy to scale–up, because it is a liquid liquid partition chromatography without solid support
matrix and eliminates irreversible adsorption of the sample onto the solid support. It has not been widely
employed for the preparative isolation and purification of Rhodiola species with only two studies found in the
literature as follows: Li & Chen [172] performed HSCCC with a two- phase solvent system composed n-
butanol–ethyl acetate–water (2:3:5, v/v) for achieving salidroside at 98% purity in a one step separation with
isocratic elution. Another HSCCC method was also used to purity salidroside with two steps separation [173].
Ethyl acetate–n-butanol–water (1:4:5, v/v) and chloroform–methanol–isopropanol–water (5:6:1:4 v/v/v) were
selected as solvent system for the first run and second run, respectively. Totally the separation yielded

40
salidroside at 98% purity by the HPLC analysis. During the HSCCC procedure, the selection of a suitable
solvent system for the separation of salidroside is the most important step, which may be estimated to be 80% of
the work [173].
Sample preparation and extraction is the crucial first step in the analysis of herbs. It can clear up the impurities
from the crude herbs and enrich the desired components for the next quality control. There are various methods
for extracting active compounds like salidroside and tyrosol from the Rhodiola species such as solid-phase
extraction (SPE) [163,164], liquid extraction [174,175] reflux extraction (RE) [176], ultrasonic extraction (UE)
[176], and microwave-assisted extraction (MAE) [177]. Each exaction method has its own advantages and
limitations. For example, reflux extraction is more efficient than ultrasonic extraction with high extraction
yields of six active constituents from Rhodiola.L but with much time [176]. MAE can reduce the extraction time
and organic solvent but with moderate yield [177]. A new high hydrostatic pressure extraction (HHP) [178]
method was introduced to apply for the exaction of salidroside from Rhodiola sachalinensis and has been
compared with Soxhlet extraction, reflux extraction and other methods. The result showed that the extraction
ratio of salidroside was up to 0.401% in 3 min with HHP, which was much better than 0.302% in 120 min with
reflux extraction and 0.288% in 30 min with Soxhlet extraction.
1.4 CCC application for preparation and isolation of Chinese herb
medicine
1.4.1 Successful CCC application for preparation and isolation of Chinese herb
medicine
In the past decades, several conventional separation methods, such as thin-layer chromatography (TLC), gas
chromatography (GC), high-performance liquid chromatography (HPLC), have been used for the isolation and
purification of components from TCM. Later, some advanced technologies were introduced to promote the
separation efficiency of the TCM including Hydrophilic Interaction Chromatography (HILIC), Microemulsion
EKC (MEEKC) and so on. However these methods were associated with some disadvantages: they were tedious
and time consuming and require multiple chromatographic steps and is not widely employed in the TCM field
[179]. CCC, which was based on liquid-liquid distribution chromatography, eliminates irreversible adsorption
of samples on solid support with conventional column and provides better recovery of the sample. This method
is proposed in order to develop a modern chromatographic separation and preparation technology since 1980 by
Ito [180]. Afterwards it was introduced into China as one effective and advantage chromatography for the
separation of TCM by Zhang due to its sustained high recovery, productivity and low cost. The CCC method
was appealing for the separation of TCM compared with other technologies because of the highly reduced
sample loss. Therefore, CCC has been successfully employed in the fields of purification and separation,
especially extraction and separation of active components from TCM. Liu et. al. [179] reviewed about 60
research articles of CCC relative to the separation of TCM: 60 different compounds flavonoids, alkaloids,
coumarins and phenols were purified and analysed by CCC. It was also proven that CCC could be a feasible and

41
cost-effective method in the development of the fingerprint of TCM [181]. Later, Sutherland and Fisher [78]
comprehensively reviewed about 198 journal papers on the separation and purification of bioactive ingredients
from TCM using CCC including 108 herbs. 363 compounds were successfully isolated including 89 flavonoids
accounting for about 25% of the 363 compounds, 57 polyphenols accounting for about 15.7%, 56 alkaloids
accounting for about 15.4%, 45 terpenoids accounting for 12.6% and other active compounds such as
glycosides, saponin and amides. With the high rapid development of CCC technology and hyphenated
techniques such as pH-dependent CCC techniques [182,183], Elution-extrusion (EECCC) and back-extrusion
(BECCC) [184,185], multi- channel (MC-CCC) [186], two-dimensional (2D-CCC) and liquid-liquid-liquid
three-phase (LLL-TP-CCC) techniques [187,188], interfacing CCC with MS [189-192], interfacing CCC with
ELSD [193,194], combination of HSCCC technique with ESI-MS- MS[195] and combination of HSCCC with
HPLC-PDA-MS [196], CCC has a more and more significant role in the separation and purification of TCM in
the future .
1.4.2 Basic theory of countercurrent chromatography
CCC Columns
Countercurrent chromatography is a liquid –liquid chromatography without the solid support matrix, which
provide many unique advantages including large sample loading, less solvent consumption and no solid
absorption. There are two common typical liquid-liquid columns: hydrodynamic and hydrostatic column. The
hydrostatic column is made of a series of chambers or channels fixed circumferentially round a rotor, which can
be rotated around a singe-axis toproduce the constant gravity field. The stationary phase is held in the each
chamber or channel and the mobile phase was passed through the rotating seal with cascade mixing. Also the
mobile phase is flowed in ascending mode if it is the less dense phase or in descending mode if it is the dense
phase. The hydrostatic pressure will build up and accumulates relative to the number of chambers, the height of
each chamber and the “g” field times [197]. Thus the Hydrostatic CCC, also named Centrifugal Partition
Chromatography, make the two immiscible solvent phases contact in the each chamber or channel with quiet
and the changes in characters of two phase system and the mobile phase flow rate are hardly affected the
Stationary phase retention. But the disadvantages are the pressure limitation and less efficient separation with
rotating seal [198]. The hydrodynamic column is made of a continuous piece of tube twined a column, which
isrotated in a planetary two-axis gyration to produce the variable gravity field. The stationary phase is held
along the length of tube with stratified approach and the mobile phase was passed through the stationary phase
with spiral way affected by Archimedean screw effect without rotating seal. The heavy phase is used to occupy
one end of tube called “tail” and the light phase gathers the other end of tube called “head”. Thus, there are two
elution modes in the hydrodynamic column: if the mobile phase is lower phase it is better pumped from “head”
to “tail” and if it is upper phase it is better pumped from “tail” to “head”. The two elution ways both can achieve
the high retention level during the rotation process. Fig 1.4.2.1 shows the schematic view of the liquid motion in
CCC columns. A – Hydrostatic columns or CPCs. B –Hydrodynamic columns. The J-Type coil planet

42
centrifuge is the typical instrument performed on the separation. It provides the planetary motion which caused
the mobile phase continues elution and unique hydrodynamic motion of two phases within the rotating column.
Fig 1.4.2.2 shows the schematic drawing of the rotating coil in a hydrodynamic CCC instrument equipped with
planetary gear.

43
Fig 1.4.2.1 Schematic view of the liquid motion in CCC columns: A – Hydrostatic columns or CPCs. B –
Hydrodynamic columns [Berthod, 199]
- Fig1.4.2.2 Schematic drawing of the rotating coil in a hydrodynamic CCC instrument equipped with planetary
gear. [Ito, 200]

44
Partition coefficient
In counter current chromatography, retention of a solute only relies on the partition coefficient of the solute. It is
the ratio of solute distributed between the two solvent phases mutually equilibrated. Usually it is calculated as
the ratio between the amount of solute in the stationary phase and that of the mobile phase, as it is expressed in
the conventional liquid chromatography. The partition Coefficient, KD, is calculated as below:
KD=Cs/Cm (Equation 1)
Where Cs is the concentration of the sample component in the stationary phase and Cm is the concentration of
the component in the mobile phase. Target compounds suitable for CCC are characterized by a KD included
between 0.5 and 1.0. Any values lower or higher the optimal range will adversely affect the resolution
proportionally. In addition, although a higher KD value will contribute to better resolution it will also result in
broader peaks with a longer elution time [199].
Simple mechanism
The only parameter included in the retention equation, reported below, is the liquid–liquid partition ratio (KD) of
the solute in the biphasic liquid system, which is used to perform the CCC separation.
VR = VM + KD VS (Equation 2)
Where, as mentioned above, KD is partition coefficient of the solute (if only one solute form is involved), and
VM and VS, respectively, the mobile and stationary phase volumes inside the CCC apparatus. VM refers to the
hold-up volume in HPLC [201].
The solid support is absent, so the column volume VC is expressed as following:
VC = VM + VS (Equation 3)
The column volume can be either given by the manufacturer or measured. Equation 2 can be then written as
below:
VR = VC + (KD – 1) VS (Equation 4)
This last expression shows that solute partitioning between the two liquid phases and VS are the only parameters

45
acting on solute retention.
Retention factor
Most of the equations applicable in CCC (classical equations also used for LC) are briefly recalled here,
pointing out the specificity of the liquid stationary phase.
The solute retention volume is derived from equations 2 or 4. VS, the liquid stationary phase volume, can be
used in LC, and therefore in CCC, in order to express all its parameters. The retention factor is expressed as
following [199]:
k = (VR – VM)/VM = KD VS/VM (Equation 5)
The separation factor, which is used in order to compare the retention factors of two different peaks, 1 and 2, is
calculated as below:
α= k2/k1 = KD2/KD1 (Equation 6)
The suitable α value should be bigger than 1.5: in this case the two different peaks are separated individually
[199].
Resolution
The quality of the separation is used for measuring the peak resolution. A 1.5 resolution value means that two
adjacent peaks are separated with a baseline return. A resolution factor lower than 1.5 means there is some peak
overlap. Resolution factors higher than 1.5 means there is space between the two peaks. It is expressed as the
ratio of the distance between the two peaks to the average peak width, Wb, at the baseline [199]
RS =2 (VR2 – VR1) [ (wb1 + wb2)] (Equation 7)
Resolution depends on two factors, the peak widths and the peak separation. The efficiency of the column
determines the peak widths, and in CCC is a function of the mass transfer and mixing. These are affected by the
parameters such as flow rate; rotational speed and tube bore [202]. Peak separation depends on the nature of the
stationary and mobile phase.
The chromatographic efficiency can be expressed using N, the theoretical plate number as
N = 16 (VR/wb)2 (Equation 8)
It is defined as the ability of a column to keep the concentration bands of the solutes as narrow as possible.
According to the above equations, the peak resolution equation in CCC is established as following:
Rs=
2
412
12
DD
S
M
DD
KK
V
V
KKN (Equation 9)

46
Retention
In CCC system the volume of stationary phase is not steady, due to the liquid nature of the stationary phase
[199]. The retention of the stationary phase, Sf expressed as the volume of stationary phase retained in the
column over the parameters in countercurrent chromatography (CCC) and it is used for the derivation of the
column efficiency, peak resolution and solute retention.
Sf = VS/VC (Equation 10)
Sf regardless of the properties of the single CCC machine permits the comparison of stationary-phase retention
capabilities of different CCC apparatuses. The retention of the stationary phase (Sf) is dependent on three
classes of parameters or variables: active parameters: the mobile phase flow rate, rotation speed, and
temperature; nonactive parameters : the geometrical parameters of the instrument, such as the revolution radius
R, β-value (where β is the ratio of the coil radius r to the revolution radius R), tubing diameter, and tubing
material; and the physical properties of the two-phase system: density and viscosity of each phase and
interfacial tension between the two phases [199].
The influences of operation conditions and apparatus parameters on the retention of the stationary phase have
been studied by many researchers. [203,204]. A constant observation with different HSCCC apparatus is that Sf
increases with the centrifuge rotation speed and decreases with the flow rate [205]. Du et al.have shown that Sf
decreases proportionally to the square root of the mobile phase flow rate: Sf = A - B F [206], Wood et al.
[207] have shown that this relationship can be explained by considering the coil planet centrifuge as a constant
pressure pump, and using the Hagen–Poiseuille equation under the assumption that the mobile phase flow is
laminar, as follows:
Sf =1- FP
L
dF
P
L
d
mm
22
383.628 (Equation 11)

47
Where µm is the viscosity of the mobile phase; L is the length of the column and P is the hydrodynamic
pressure drop, d is the diameter of the column, and F is the flow rate of the mobile phase.
He & Zhao[208] have proposed a mathematical model to describe the influences of operation conditions
physical properties (density difference, viscosity, and interfacial tension), and instrument parameters (tube
diameter, revolution radius) on the retention of the stationary phase, by building on the flow behaviour of the
two phases in the coiled column, laminar flow or droplet flow. They have shown that Sf decrease proportionally
to the square root of the mobile phase flow rate to the rotational speed: Sf =A-B
F.
The influences of physical properties of two-phase solvent systems on the retention of the stationary phase have
also been experimentally researched by many authors [209, 210]. Parameters such as the polarity of solvent,
density, and viscosity difference of the two phases, settling time, interfacial tension, and capillary wavelength
have been considered.
Choice of the Solvent System
The choice of the solvent system is a key factor for determining a successful separation because it plays a
critical role on the solute KD values [211]. However, this is time consuming and it is preferable to start with the
right solvent due to more than 187 solvent systems were reported in the separation and purification of natural
products and a total of 20 different solvents were used. Four solvents, i.e., n-hexane, EtOAc, MeOH, and
water, comprised 74% of individual solvents used to create solvent systems such as the popular n-hexane-
EtOAc-MeOH-water (HEMWat) solvent system [212]. Sutherland & Fisher also summarised chlorinated
systems and alkane/alcohol systems were the most popular solvent system used for the CCC separation of TCM
till 2007[78]. Therefore, a suitable solvent system selection approach should be developed to use for a desired
counter current separation. Many publications have shown how to optimize the choice of the solvent [213,214].
There are some ideal ways to select the suitable solvent system. First searching for the similar solvent system
used for the target compounds or compounds with similar chemical structures such as MBE, HEMWat and
Arizona liquid system can be applied for the test. [211].They recommends chloroform–methanol–water or less
polar n-hexane–ethyl acetate–methanol–water mixture solvent system as the first attempt to find a suitable
solvent system by modifying the relative proportions of each constituent solvent. The search based on the
polarities and the KD values of the sample. In the case of the hexane-containing system, n-butanol can be added
if the sample is more hydrophilic [214]. In addition, a similar approach has started with a mixture of n-heptane–
ethyl acetate–methanol–water 1:1:1:1 and ending with ethyl acetate–water 1:1 for polar compounds or n-
heptane–methanol 1:1 for less polar samples [215]. In addition, application of GUESSmix also is logical
method to test and select the right solvent system during the selection of the solvent system process [216]. A
suitable two-phase solvent system has to reach the following five requirements: 1) the settling time of the
solvent system is less than 30 seconds, 2) The suitable partition coefficient (KD) value of the target compounds,
which is between 0.5 and 2. If the KD is less than 0.5, the elution time is tiny result in low resolution; If KD is
bigger than 2, the elution time is longer and the peaks become wide. Meantime, the separation factor between
any two peaks should be bigger than 1.5. [213]. 3) In order to save solvent cost, the volume of upper phase and

48
lower phase is better equal, 4) Satisfactory retention of the stationary phase. 5) The choice of solvent systems
should be considered the compatible with the detector. For example, solvents that absorb strongly in the UV are
normally avoided when UV detectors are employed
1.4.3 The advantages of CCC
Counter-current chromatography benefits from a number of advantages when compared with the more
traditional liquid solid separation methods: (1) no irreversible adsorption; (2) total recovery of sample loaded ;
(3) tailing minimized; (4) low risk of sample denaturation; (5) low solvent consumption; (6) low cost. It uses
significantly less solvent than HPLC (7) Crude samples tolerated. Dirty samples are accepted. Very little prior
clean-up is necessary. (8) High sample loading. (9) Easy scale up . Another advantage of CCC is enough
flexibility to exchange the mobile phase and stationary flow direction based on the different requirements. With
these advantages, CCC is very popular as a purification tool for natural products, and especially in the bioassay-
guided fractionation of plant-derived compound
1.4.4 Main CCC separation methods
As we know, CCC is an all liquid chromatographic technique without the solid support. It has aunique
characteristic that the two phase system can exchange different directions with different elution ways, which not
only separate one single compound using one solvent system. There are different elution modes and methods
developed to separate more complex compounds from the natural herbs and improved the isolation effective and
shorten the separation time. Stepwise elution, Gradient Elution [217-220], pH-gradient [221-223] elution-
extrusion (EECCC [224] and back-extrusion (BECCC) [225] have been successfully employed in the separation
of natural product. Cross-axis counter current chromatography (Cross-axis CCC)[226], dual countercurrent
chromatography (DuCCC) [227], pH zone refining countercurrent chromatograph [228], two-dimensional CCC
(2D-CCC) [229], Multi-channel CCC (MC-CCC)[230] and Dual-flow CCC [231] also have been developed for
the quality of separation.
1.4.5 Coupling techniques of CCC
On-line detect methods also can be applied for use with the CCC technique currently. Most of them are based
on UV detectors. Recently some hyphenated techniques such as evaporative light scattering detectors (ELSD),
mass spectrometers (MS) and diode array detectors (DAD) are widely used with the HSCCC due to the high
sensitivity and high efficiency.

49
In the procedure of separating natural compounds using HSCCC, a UV detector is widely used as the data
acquisition device, but the chemicals should show strong UV adsorption. Evaporative light scattering detector
(ELSD), as a alternative detector, can detect the poor absorption of light UV and it does relate to the
concentration of the sample not to their optical feature [232]. Furthermore, compared with the MS, ELSD can
easy combine with the CCC and successfully apply for the separation of ginsenosides [72, 76, 77], Therefore,
ELSD is employed more and wider for the drug discovery. But the limitation of the ELSD method was only
suitable for non-volatile compounds. Mass spectrometers (MS) are the technique of choice for solute
identification with excellent sensitivity and specific detection. However, there were initially some difficulties
with this hyphenated technique such as high back pressure of MS system, high noise in MS and the effluent
from the CCC column is not always stable. These shortcomings have now been overcome by using an HPLC
pump plugging in at the interface junction to protect the CCC column [233] or the frit interface which reducing
the high back pressure [234] and T-split tee for reducing the effluent velocity and sample amount introduced
into MS [235]. Thus, it became an ideal tool in the quantitative and qualitative study of natural drug discovery.
Moreover, with the development of research, the combination of HSCCC technique with MS, diode array
detectors (DAD), charged aerosol detector (CAD), Fourier transform infrared spectroscopy (FTIR), and other
new kinds of detectors can increase the ability of HSCCC in the future.
1.4.6 Optimization of Operational Parameters of CCC
In addition to solvent system selection, the optimization of operational parameters of CCC is a prerequisite for
effective countercurrent separation. In general, flow rate, rotational speed, temperature, sample concentration
loading and sample loading volume are the parameters to be optimized. As we known, slower flow rates may
give better resolution and good retention of stationary phase, but they may also lengthen the time of the
experiment excessively. Conversely, fast flow rates shorten experimental times but are more likely to be the
cause of insufficient resolution and loss of stationary phase. Therefore, the flow rate should be fast enough to
ensure a sufficient resolution in a reasonable amount of time. Normally, larger capacity instruments require and
support faster flow rates than smaller capacity instruments. For the typical HSCCC with rotation at 75 g, the
recommended flow rates are as follows: 5–6 ml/min for a preparative column with 2.6mm i.d. PTFE tubing; 2–3
ml/min for a semi-preparative column with 1.6mm i.d. PTFE tubing; and 1 ml/min for an analytical column
with 0.85–1.0mm i.d. PTFE tubing [236]. For preparative scale separation, the typical flow rate is in the range
of 1-3ml/min. But for the HPCCC with high g level, it is achievable to maintain high stationary phase retentions
at high flow rates with a higher rotational speed. It has enabled a tenfold increase in mobile phase flow rate
while maintaining the required stationary phase retention to ensure resolution. High flow rate also can increase
the mobile phase move in the time interval between mixing waves in the column resulting in greater change in
solute concentration of mobile phase and achieve the large mass transfer rate[237]. Thus, the HPCCC can
shorten the separation time and improve the throughput of samples. It is possible with pumps that work at 50
mL/ min to easily process up to 200 g of crude material per day and potentially up to 400 g at the preparative
scale. Furthermore, it was now possible to develop robust analytical-scale instruments, using small-bore
columns, so that milligram quantities of compound could be processed. While, the HSCCC was impossible for

50
the analytical scale because at low g-level the wall effects of small-bore columns affected the partitioning
mechanism [238].
In general, a faster rotational speed increases the stationary phase retention volume, because stationary phase
retention is not only depended on the qualitative properties of the solvent system in use but also increases with
gravitational field force. Increasing the rotational speed can lead to the improving g level with the apparatus and
resolution of samples. In addition, higher rotational speed can probably produce higher interfacial area where
the mass transfer occurs and shorten the time interval between mixing steps in the column. Finally, the mass
transfer rate will increase and improve the resolution of samples [237]. Therefore, a separation should be run at
highest rotational speed possible. Also the rotational speed should be consistent with the instrument design and
not put too much of a strain on the bearings, seals, and tubing.
The column temperature affects KD values, the retention of the stationary phase and the mutual solubility of the
two-phase system. Moreover, high temperature can lead to a decrease in fluid viscosity and degrade some
samples that are volatile. Therefore, temperature control of the columns of CCC is essential [211].
Usually, the concentration of the sample dissolved in the stationary phase or both phases was considered an
important factor for the separation using HSCCC [236]. Based on one review[239], the range from 0.5 to 2
mg/ml is the typical main sample loading values at analytical scale. Zhao and He suggested that the sample load
concentration increases exponentially with column volume [240], which showed the potential possibility on
future CCC scale-up. Thus, the injected sample size must be considered based on the HSCCC column size, the
apparatus performance and the solubility of the sample in the solvent system [211]. But the solubility of
samples is not a limiting factor any more in HPCCC because the sample can be injected onto the column in
either the mobile, stationary, or a mixture of both phases without affecting the performance of the
chromatography.The problem of large sample in HSCCC sometimes is the stationary phase loss, but the
HPCCC can provide high sample recovery and high-loading capacity. Sutherland et al . [241] found that the 5%
of the Milli CCC column volume was the optimum percentage of the column volume loaded because the
resolution dropped off quickly when sample volumes exceeded 5%. Also the sample concentration was
increased and selected until the resolution fell below 1.5, because a high concentration in a low volume was
better than low concentration in a high volume is better at preserving the resolution. The other advantage of
HPCCC is quickly and predictably scalable to produce sufficient quantities of the pure ingredients required,
because it was discovered that scale up was simply volumetric and linear between all scales developed [242].
Lijuan Chen et al. [243] have developed a rapid separation approach using high-capacity high-speed counter-
current chromatography to isolate and purify honokiol and magnolo and scaled up at analytical scale to
preparative scale. The optimization of the solvent selection process, sample concentration loading, sample
loading volume and flow rate was systematically studied using analytical high-capacity HSCCC. Wood et al.
[244] and Sutherland et al. [245] investigated on the counter-current chromatography separation scale up from a
5.4 ml analytical column to pilot scale with 4.6L column and 18L column each. Recently Hacer Guzlek et al.
[246] have developed a novel model to predict the elution profile of a CCC column from scratch using
instrument and operational parameters only. This model not only predicted the solute retention time, peak width,

51
and peak resolution with accuracy but also estimated several process parameters such as mobile phase flow rate,
rotational speed of the column and β-value.
Therefore, the higher stationary phase retention of high performance counter current chromatography
instruments allows higher mobile phase flow rates and thence shorter cycle times to be used without loss of
resolution for a given separation. Now that HPCCC machines are available, high throughput separations can be
achieved across the whole range of polarity.
1.4.7 A generic practical approach of purification and analysis for the natural products
Traditional Chinese medicines (TCMs) are very popular and acceptable in the world for enhancing the whole
body immunity with little toxic effect on the treatment of disease. The goal of TCM is not only curing the
diseases but also rebuilting the energy balance of the body to resist them. Thus, the TCM is like a complex
system with many different bioactive constituents or toxic compounds. In order to achieve the desire
compounds from a chosen TCM, developments of effective technologies of separation and analysis in TCM are
a very important objective. Compared to other liquid-liquid techniques, CCC is an advantageous and suitable
technique for the separation and purification of active compounds from TCM due to the high recovery, low cost
and high throughput. However, the variety of different types of CCC instruments used for the separation of
TCM compounds and the large number of the two phase solvent systems employed for CCC cause the operation
process of separation to be very complicated which is limiting the wide application of CCC for natural products.
Thus, a novel generic practical approach to separation and analysis for CCC separation of TCM should be
established and developed for quality and quantity of the active compounds in TCM. The Fig.1.4.7.1 provides a
generic CCC separation approach from raw material to pure compound. The following provides an overview of
the main consideration and practical steps in the CCC separation of natural products.
When considering how to approach liquid chromatography of a natural product material such as traditional
Chinese medicine, the first consideration is which desired target compounds you want to isolate from the natural
products, whether known or unknown, simple or complex. Thus, sample preparation is the first important step
in the quality control and analysis of TCMs. Many sample preparation techniques have been developed for the
extraction and enrichment of the desire compounds from natural herbs such as solvent extraction, ultrasound
assisted extraction, microwave assisted extraction and high pressure exaction. The selection of the sample
extraction methods is due to the property of the TCM and the effect of the procedure. Basically, the solvent
extraction method assisted with ultrasound is widely used for the preparation of TCM because it is simple and
effective in general. But the number and type of extraction solvents determine the range of polarity of the
resulting crude extract, which is the main determination of its chromatographic behavior in the countercurrent
separation. The bioassay-guided fractionation and chemical or metabolomic analysis procedure for the next step
are to assay a wide range of sample constituents for a particular biological activity to target the bioactive
compounds or discover new natural products with novel structures and resolving highly complex mixtures.
Thus, some pre-isolation methods can be applied for eliminating the major known compounds which do not

52
have the bioactivity in order to concentrate and purify the extract sample. These methods include the liquid-
liquid extraction, macroporous resin chromatography and silica gel column chromatography. Once the target
compounds are identified, the choice of solvent system for the CCC is another crucial step in the separation
protocol which can occupy up to 80% of the total work of countercurrent separation. The selection of the
appropriate solvent system follows principles which have already been discussed such as proper partition
coefficient of compounds in the “sweet spot” [247], good retention of stationary phase volume and
compatibility with the detection process. In addition, the simplicity of a shake-flask experiment in the selection
of solvent system can not only help find the proper solvent system but also reliably predict the countercurrent
chromatographic behaviour of target compound. With the development of CCC instruments with a greater
analytical capacity, the analytical CCC apparatuses will take place of the shake flask experimentation to adjust
the solvent system composition and proportions to select the suitable solvent system [248]. In general, solvent
system selection so far has been an empirical process involving significant elements of experience. After a
solvent system has been selected, the next decision is whether to perform the separation with the hydrophilic
phase as mobile phase or stationary phase. The majority of CCC separations of TCM are performed with the
hydrophilic phase as the mobile phase for the follow reasons. 1) Hydrophilic phase as mobile phase has the low
risk of the affect on the detector, 2) the higher stationary phase retention in hydrodynamic system using the
lower phase as mobile phase [236]. Of course, the decision to use normal or reverse mode is often determined
by the K value of solute. Different CCC elution and method can be employed for the separation of TCM
considered with the characters of target compound in the two phase solvent system and the natural feature of
solvent system in the CCC instrument. Furthermore, the selection of CCC separation methods should consider
the simple, effective method with a corresponding short separation time and low laboratory costs. Detection in
CCC is also critical. On-line detection is desired for shortening the separation time using CCC, so hyphenated
CCC techniques have been developed. The three main types of hyphenation are: CCC-UV/ELSD (Evaporative
Light Scattering Detector), CCC-HPLC-DAD (Diode Array Detector) and CCC-MS (Mass Spectrometry).
During the operation of CCC separation, several chromatographic parameters such as flow rate, rotational
speed, column volume and sample loading can be optimized to improve the resolution and reduce the retention
time of compounds. Also the fact that the KD value of a compound in a given solvent system is independent of
the chromatographic run [249,250] which means that chromatographic runs can be optimized to elute the target
compound in either the classical elution or extrusion step. Following the above approach to the CCC separation
of TCM, most of target compounds can be separated and purified in one run but still some bioactive compounds
can not be isolated individually because of the complexity of the TCM samples. In this case, a further
purification will be employed for the second separation procedure to get pure compounds by using preparative
liquid chromatography, common column chromatography or a second CCC separation, as detailed below in
Fig.1.4.7.1:

53
Determined K
Chemical analysis
Solvent extraction Ultrasound–assisted extraction Microwave-assisted extraction
Supercritical fluid extraction Extracted sample
Raw material
Targeted Purification
Bioassay-guided fractionation
Bioassy-
guided Fract
Pre-Isolation
Liquid-liquid extraction Macroporous resin chromatography Silica gel column chromatography Sephadex column chromatography
Cleaned sample
Choice of solvent systems From the literature Shake Flask Analytical CCC Supercritical fluid extraction
Separation Conventional CCC PH-zone-refining CCC Elution-extrusion CCC Two-dimensional CCC Multi-channel CCC Dual-flow CCC pH-gradient CCC Back-extrusion CCC
Operating Conditions NP/RP phase Flow Speed Sample Loading Elution modes Detection Fraction collection
Pure
compounds
Un-pure
compounds
Pure
compounds
Optimum solvent system Preparative liquid chromatography Common column chromatography Second CCC procedure

54
Fig.1.4.7.1 A generic practical approach of purification and analysis for the natural products
1.5 Huge potential application for isolation and separation of traditional
Tibetan medicine
1.5.1 The growth of interest in Tibetan herb medicine
As a typical medicine system, traditional Tibetan medicine has developed for several thousands of years and has
rich human pharmacological information and experience to form an integrated theory system. It has been
successfully practised in treatment of plateau diseases. Tibetan herbs also have been considered huge as the
largest potential natural resource of herbs. 2294 kinds of Tibetan medicine resources in China, including 1,006
kinds of plants, 448 kinds of animals and 840 kinds of minerals, play an important role in the application of
Tibetan herbal medicine [251]. Compared to the traditional Chinese herbs, there are two apparent differences
between them. Firstly, using many minerals and animals refined with plants can produce a special effect on
stroke, paralysis, nerve damage, heart disease and other incurable diseases compared to other traditional
medicine Secondly, the unique environment of Tibet such as higher attitude, cold plateau and longer sunshine
makes the Tibetan herbs more effective, less pollution and higher quality than other traditional Chinese herbs
[252]. Fig1.5.1.1 shows the different species number of traditional Tibetan herbs and traditional Chinese herbs
[251], [253]. It shows that the total amount of traditional Tibetan herbs is less than that of traditional Chinese
herbs, but the percentage of mineral in total Tibetan herbs is 37% much bigger than 1% of that in traditional
Chinese herbs. Therefore, a rapid growth in the research of Tibetan herb medicine is occurring in China with
986 Tibetan herb research papers published from 2000 to year 2007 [254], In contrast, only 271 papers were
published in the 11 years from 1989 to 1999 (Fig. 1.5.1.2 ). The Figure showed that the growth of the research
of Tibetan herb medicine in China was vey slow between 1989 and 1999 because there were only 271 papers
published in the 11 years. It was probably significant that research of Tibetan herb medicine just had not been
explored in China. But from 2000 to 2007, there were 986 Tibetan herb medicine papers published and it was
very rapid growth in the 8 years, which occupied 78.44% of the total amount of papers. It indicated that people
have got to know the importance of natural production for their health, especially for the Tibetan herb medicine,
it gradually became a hot research topic of TCM in China now.

55
Traditional Tibetan Herbs
43%
20%
37%
mineral
animal
plant
T r a d i t io n a l C h in e s e He r b s
1 2 %
8 7 %
1 %
m i n e r a l
a n i m a l
p l a n t
Fig 1.5.1.1.Different species number of traditional Tibetan herbs and traditional Chinese herbs.[251,253]
Table 1.5.1.1 shows that the situation of the corresponding author’s cooperation in the papers from 1989 to year
2007. From the year 2003, the co-authors in the papers are mostly greater than 3 number which show that
collaboration has started to become the main form of research for Tibetan medicine, authors have begun to
have the cooperative consciousness in the research. However, only 69 papers were published by the 6 co-
authors or more, which occupied 5% of the total amount of papers. It showed that the cooperation is still small
and need to further strengthen collaboration in the future. Table 1.5.1.1 also shows that in total there are
different authors named on 1257 Tibetan medicine papers. The single author was only occupied 38% in the all
papers, which suggests that large research groups are mainly active in the Tibetan medicine studies.
.
Figures 1.5.1.3 and 1.5.1.4 show the geographical distribution of Tibetan medicine papers in China. 313 papers
did not indicate the publication agencies, and the remaining 944 papers were published by the 28 provinces. 764
papers were published from Qinghai, Sichuan, Gansu, Xizang, Beijing, Shandong province, accounting for 81%
of the total number of papers, which shows the six provinces that carry out the core area of the Tibetan
medicine studies. Strangely there was virtually nothing from Shanghai, possible because the geography location
is far away from the Tibetan herbs resources. Conversely, because of the location, Qinghai, Sichuan, Gansu
provinces and Xizang region have a rapid growth in the Tibetan medicine studies.
The Fig 1.5.1.5 shows that the affiliation of the corresponding authors which have published more than 20

56
papers. Northwest Institute of Plateau Biology and Qinghai institute of drug control are the top two
organizations producing the highest number of publications per year, a total of 109, accounting for 9% of the
total amount of papers. In addition, according to the table 1.5.1.2, 11 higher education institutions with 212
papers account for 17% of the total amount of papers show that the higher education institutions have given the
adequate attention on the Tibetan medicine research and became a major force in the study. Next, five
research institutes with 148 papers, accounting for 11.77% of the total amount of papers; three medical
organizations with 64 papers accounting for 5% of the total amount of papers. It suggests that education and
scientific research have begun into the forefront of Tibetan medicine; next one is the health care
Fig 1.5.1.2 The growth of the number of journal papers published of the Tibetan medicines china from 1989 to
2007 [254]

57
Table 1.5.1.1 The corresponding author’s cooperation in the Tibetan medicine papers review in China from
1989 to 2007 data from Bianbaciren [254]
Year 1 2 3 4 5 6 7 8 9
Group
of
Author
Number
of
Papers
1989 1 7 8
1990 2 6 8
1991 3 11 14
1992 3 10 13
1993 1 8 9
1994 4 12 1 17
1995 11 17 2 30
1996 17 11 28
1997 22 25 1 1 1 50
1998 19 21 40
1999 17 38 55
2000 34 29 3 66
2001 45 26 31 102
2002 40 18 38 96
2003 42 20 27 10 13 3 1 2 1 119
2004 67 16 17 6 10 9 1 2 2 130
2005 50 30 18 16 16 7 2 1 140
2006 38 27 26 20 14 8 3 136
2007 65 40 33 20 12 15 9 1 1 196
Total 481 372 195 75 65 42 16 6 1 4 1257

58
Fig 1.5.1.3 Pie chart showing geographical distribution of Tibetan medicine papers review in China from 1989
to 2007, data from Bianbaciren [254]

59
Fig. 1.5.1.4 The map showing the geographical distribution of Tibetan medicine research review in China
from 1989 to 2007
Najing
Chengdu
Lasa
Xining
Lanzhou
Beijing

60
The Affilication of The Authors with 20 or More
Papers
0
10
20
30
40
50
60
70
80
NIP
B
QID
CSCU
QHNU
SW
U
QHM
C
QHTH
QHU TU
Affiliation of the corresponding authors
Pu
blis
h p
ap
er
nu
mb
er Total papers
Fig 1.5.1.5 The affiliation of the corresponding authors which have published more than 20 Tibetan medicine
papers from 1989 to 2007, data from Bianbaciren [254]. Abbreviations: NIPB: Northwest Institute of Plateau
Biology; QIDC: Qinghai institute of drug control; SCU: Sichuan University; QHNU: Qinghai Normal
University; SWU: Southwest University for Nationalities; QHMC: Qinghai Medical College; QHTH: Qqinghai
Hospital of Tibetan; QHU: Qinghai University; TU: Tibet University.

61
Table 1.5.1.2 The affiliation of the corresponding authors which have published more than 10 Tibetan medicine
papers from 1989 to 2007
Affiliation Total
papers
Northwest Institute of Plateau Biology 67
Qinghai institute of drug control 42
Sichuan University 31
Qinghai Normal University 25
Southwest University for Nationalities 25
Qinghai Medical College 23
Qqinghai Hospital of Tibetan 22
Qinghai University 22
Tibet University 21
Tibet Autonomous Regional Hospital 18
Introduction of Qinghai High Altitude Medical Research Academy 17
Chengdu University of TCM 15
Qinghai Nationalities College 14
Beijing Tibetan Hospital 13
Lanzhou University 13
Lanzhou Medical College 13
Lanzhou Institute of Chemical Physics 12
Qinghai Cardiovascular Disease Specialized Hospital 11
Central University of Nationalities 10
Sichuan Academy of Chinese Medicine Sciences 10

62
1.5.2 Huge potential application for CCC to traditional Tibetan medicine
Traditional Tibetan medicine is becoming more and more of a potential source of the natural drug discovery in
the world. A survey conducted as part of this thesis from some 92 papers [255-346], published from 2008 to
2009, summarized the latest research on the purification and analysis of traditional Tibetan medicine. All the
papers are from the VIP medicine journals database. 55 Tibetan herbs are reported and more than one hundred
compounds were separated by the modern isolation technology and method. In addition, four main methods of
analysis and separation are widely used for the 55 Tibetan herbs. They are HPLC (43%), Silica Gel Column
(25%), GC-MS (13%), TLC (8%) (Fig 1.5.2.1), respectively. However, only one English Journal paper has been
published for using CCC to isolate active compounds from the Tibetan herbs. Compared with the other
conventional chromatography methods, for example, GC–MS is suitable for analysis of volatile substances and
high precision, but with limited application, HPLC is of high precision. But HPLC requires complicate
pretreatments of samples and TLC is suitable for the analysis of complex and dirty samples, fast and easy to
operate but poor precision. CCC is a kind of liquid–liquid partition chromatography without any solid matrix,
which eliminates irreversible adsorption of samples on solid support in the conventional chromatographic
column. It has been successfully applied to analysis and separation of various natural products, especially for
polar substances such as flavonoid, alkaloid and polyphenols. It’s successful use for the purification and
separation of traditional Chinese medicine is strong evidence that CCC has many advantages and capacities for
the crude sample. Therefore, the CCC can obviously be more suitable for analysis and separation in the Tibetan
herb with the advantages and also can be the biggest challenge in modernizing the Tibetan herbal medicine in
the future.
Fig. 1.5.2.1 Pie chart showing methods of the analysis and separation used in 92 papers review from 2008 to
2009

63
1.6 Conclusion
Based on the previous literature review, Panax ginseng and Rhodiola rosea are both typical traditional Chinese
medicines characterized by high pharmacy efficiency. Also they are treated as popular adaptogens for many
years and play an important role in the world drug market due to their anti-stress,anti-fatigue and
cardioprotective effects. Many research and studies focus on the fields of pharmacological mechanism,
pharmacokinetics and clinical pathology. Development of high effective, recovery, speed and selectivity
methods of isolation and purification from Panax ginseng and Rhodiola rosea is still a big challenge as they are
multi-component system, containing more than hundred chemical constituents. Many separation technologies
have been investigated for the isolation of different ginsenosides from the ginseng species and salidroside and
tyrosol from the Rhodiola species, because all of them are considered the main contribution to the active
effects.TLC, HPLC or HILIC, gas chromatography (GC), multidimensional chromatography, capillary
electrophoresis (CE) and counter current chromatography(CCC) are all introduced to perform the separation of
ginsenosides, salidroside and tyrosol coupled with different on-line detection methods including UV, DAD,
ELSD, CAD, PAD, MS, ELISA and fluorescence. A comparison of these studies show the different advantages
and limitations of each method and demonstrate that the CCC technology has huge advantages for separation of
ginsenosides, salidroside and tyrosol due to no solid absorption, large sample loading and less solvent
consumption. Different CCC separation of methods for ginsenosides and salidroside are also investigated
according to the main parameters such as solvent system selection, target compounds yielding and elution
mode. Most of them have the big disadvantage of a long time spent on the separation process leading to huge
amount of solvent consumption, according to the literature review. Thus, development of gradient method for
separation of ginsenosides with CCC is necessary for reducing the separation time in this project. Among
several of CCC methods, gradient method is the first time used for the separation of ginsenosides by HPCCC in
this project for improving the efficacy of separation and makes a comparison study to previous methods.
Ultimately, this work investigates the feasibility of CCC as an alternative to separation and purification of
ginsenosides. In addition, only two papers have been published for using CCC to separate Rhodiola species in
the literature review. A simple and efficient CCC method for simultaneous quantification and quality of
salidroside and tyrosol compounds in the Rhodiola rosea has been developed and validated for the first time in
this project. The developed method could be suitable for use as a tool for quality assurance and determination of
adulteration of the crude drug. Moreover, different CCC columns are investigated on the ability of scale-up
from an analytical Mini-HPCCC to a preparative Midi-HPCCC for the separation of salidroside and tyrosol to
evaluate a feasibility study with industry on separation process for the drug market. This project are carried on
and supported with the CCC research group team in Brunel University. They have the biggest advantages
compared with other research teams as they are equipped with different advanced CCC apparatus from Mini to
Maxi size of HPCCC associated instrument operation and establish an advanced bioprocess centre to perform
liquid-liquid dynamic extraction technology. Based on the previous discuss, HPCCC was selected for the
projects because it offers various advantages for the following reasons: 1) It could provide higher “g” fields to
be competitive with rapid processes like HPLC; 2) there is high sample recovery and high-loading capacity; 3)
it is a multistage high resolution liquid–liquid dynamic extraction process; 4) isolated compounds can be
recovered at high concentration requiring less solvent extraction compared to other chromatography [243]. Also

64
varied technologies of choice for CCC are provide d and applied for the separation process with Dynamic
Extractions Ltd. Therefore, the aim and objects of these projects are following as:
1) Develop an appropriate solvent system for the separation of the majority of different polar ginsenosides
from the Panax ginseng with HPCCC technology and set up a high effective and rapid gradient method for
separation of different main ginsenosides from the Panax ginseng;
2) Develop a simple and efficient high performance liquid chromatographic method for the simultaneous
quantification of the two biological compounds salidroside and tyrosol from the crude sample of Rhodiola
rosea and a rapid and high-throughput HPCCC purification method has developed for the large-scale
preparation of the salidroside and tyrosol from Rhodiola rosea using step-flow gradient CCC.
3) Investigate on scale- up process from analytical HPCCC to the preparative HPCCC for rapid purification of
salidroside and tyrosol from crude sample Rhodiola rosea and set up a preliminary research on predictable
and linear scale-up process from the current laboratory scale technology to industrial process scale using
HPCCC.
These projects make use of these advantages of HPCCC to improve the separation and purification on natural
products and modernizes traditional Chinese and Tibetan medicine.
,
.

65
CHAPTER 2
Separation and purification of
ginsenosides from Panax ginseng
C.A.Meyer with high performance
counter-current chromatography
66
2.1 Introduction to the ginsenosides
Panax ginseng (Panax ginseng C.A.Meyer, Araliaceae) has been traditionally used as an expensive and precious
medicine in Asian countries for more than 2000 years. The triterpenoid saponins, called ginseng saponins or
ginsenosides, are the major active constituents responsible for their adaptogenic, antidiabetic and anti-
inflammatory activities in Panax ginseng and till now more than 100 different ginsenosides have been isolated
and separated and shown to have different pharmacological effects. Among them, seven major ginsenosides,
including Rb1, Rb2, Rb3, Rc, Rd, Re, and Rg1, represent approximately 90% w/w of total ginsenosides in
Panax ginseng. Ginsenosides Rb1, Rb2, Rb3, Rc and Rd are 20(S)-protopanaxadiols (PPDs) and ginsenosides
Re and Rg1 are 20(S)-protopanaxatriols (PPTs). The difference between PPTs and PPDs is the presence of
carboxyl group at the C-6 position in PPDs [3], which relative to the different pharmacological properties. Due
to the fact that Panax ginseng is a very popular phytomedicine used all around the world, a huge quantity of
work has been carried out during the last 30 years in order to develop analytical methods for the identification,
quantification and quality control of ginsenosides in raw plant materials, extracts and marketed products[.
2.2 Aims
In order to take traditional Chinese medicine to a higher level and utilize it on a large scale, it is both necessary
and interesting to find the bioactive components in the traditional drugs by modern scientific techniques and to
use them as leading compounds for new drug design. In this chapter, our aims are to search a new method to
separate and purify known and unknown bioactive ginsenosides from the crude Panax ginseng in a single or
two step separation and develop a gradient method to isolate the known ginsenosides and use the results to
screen bioactive compounds in order to service the new drug design.
2.3 Methods for separation and purification of ginsenosides
Many techniques can apply for the isolation and analysis of ginsenosides from nature products. TLC or HPTLC;
HPLC, HILIC or UPLC; Flash chromatography(FC); medium pressure liquid chromatography (MPLC); gas
chromatography (GC); capillary electrophoresis (CE) and counter current chromatography (CCC) are typically
used for the separation of ginseng saponins. Among these techniques, liquid chromatography is still the most
popular technique for ginseng separation, particularly counter-current chromatography technology. CCC is a
developing liquid-liquid separation method with many advantages compared with other separation techniques.
According to the literature review chapter one, six papers have illustrated the large scale separation of
ginsenosides by CCC [72-77], they have one common advantage that coupled with the ELSD for separation of
ginsenosides since Ginsenosides are dammarane saponins that exhibit very poor ultraviolet (UV) absorbance
due to their lack of chromophores, while ELSD allows the detection that measures the scattered light generated
by the non-volatile particles of analytes produced by nebulization into droplets of the effluent. It has been
known to be a universal, non-specific detection method that can provide a stable baseline even with gradient
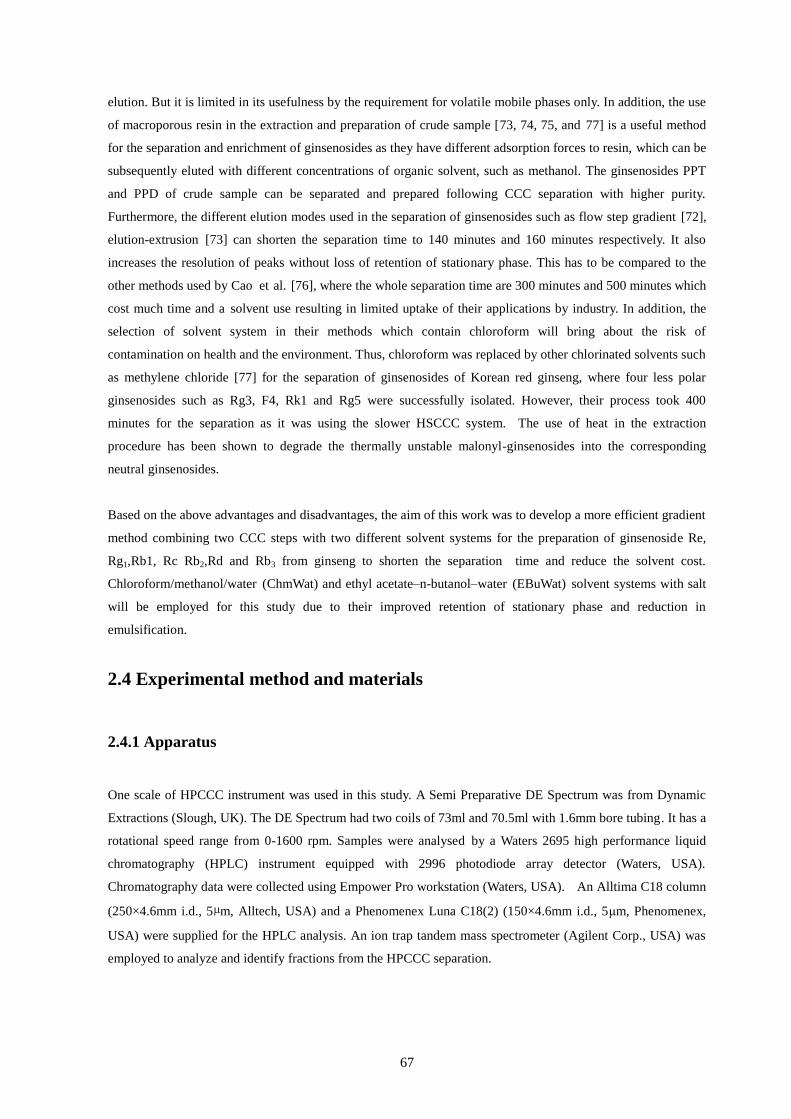
67
elution. But it is limited in its usefulness by the requirement for volatile mobile phases only. In addition, the use
of macroporous resin in the extraction and preparation of crude sample [73, 74, 75, and 77] is a useful method
for the separation and enrichment of ginsenosides as they have different adsorption forces to resin, which can be
subsequently eluted with different concentrations of organic solvent, such as methanol. The ginsenosides PPT
and PPD of crude sample can be separated and prepared following CCC separation with higher purity.
Furthermore, the different elution modes used in the separation of ginsenosides such as flow step gradient [72],
elution-extrusion [73] can shorten the separation time to 140 minutes and 160 minutes respectively. It also
increases the resolution of peaks without loss of retention of stationary phase. This has to be compared to the
other methods used by Cao et al. [76], where the whole separation time are 300 minutes and 500 minutes which
cost much time and a solvent use resulting in limited uptake of their applications by industry. In addition, the
selection of solvent system in their methods which contain chloroform will bring about the risk of
contamination on health and the environment. Thus, chloroform was replaced by other chlorinated solvents such
as methylene chloride [77] for the separation of ginsenosides of Korean red ginseng, where four less polar
ginsenosides such as Rg3, F4, Rk1 and Rg5 were successfully isolated. However, their process took 400
minutes for the separation as it was using the slower HSCCC system. The use of heat in the extraction
procedure has been shown to degrade the thermally unstable malonyl-ginsenosides into the corresponding
neutral ginsenosides.
Based on the above advantages and disadvantages, the aim of this work was to develop a more efficient gradient
method combining two CCC steps with two different solvent systems for the preparation of ginsenoside Re,
Rg1,Rb1, Rc Rb2,Rd and Rb3 from ginseng to shorten the separation time and reduce the solvent cost.
Chloroform/methanol/water (ChmWat) and ethyl acetate–n-butanol–water (EBuWat) solvent systems with salt
will be employed for this study due to their improved retention of stationary phase and reduction in
emulsification.
2.4 Experimental method and materials
2.4.1 Apparatus
One scale of HPCCC instrument was used in this study. A Semi Preparative DE Spectrum was from Dynamic
Extractions (Slough, UK). The DE Spectrum had two coils of 73ml and 70.5ml with 1.6mm bore tubing. It has a
rotational speed range from 0-1600 rpm. Samples were analysed by a Waters 2695 high performance liquid
chromatography (HPLC) instrument equipped with 2996 photodiode array detector (Waters, USA).
Chromatography data were collected using Empower Pro workstation (Waters, USA). An Alltima C18 column
(250×4.6mm i.d., 5µm, Alltech, USA) and a Phenomenex Luna C18(2) (150×4.6mm i.d., 5μm, Phenomenex,
USA) were supplied for the HPLC analysis. An ion trap tandem mass spectrometer (Agilent Corp., USA) was
employed to analyze and identify fractions from the HPCCC separation.

68
2.4.2 Chemicals
Panax ginseng exact (C.A. Meyer) was supplied by Guangzhou Xiangxue Pharmaceutical Co., Ltd.
(Guangdong, China). The ginsenosides Rg1, Re, Rb1, Rb2, Rb3 Rd and Rg3 standards were from Guangzhou
Xiangxue Pharmaceutical Co., Ltd. (Guangdong, China). All analytical grade solvents (methylene chloride,
methanol, and isopropanol), ammonium acetate for the HPCCC separation and HPLC grade acetonitrile for
HPLC analysis were supplied by Fisher Chemicals (Loughborough, UK). Deionised water was prepared by a
Millipore waterpurification system (Watford, UK)
2.4.3 Sample preparation
Approximately 10mg powdered Panax ginseng was accurately weighed into a 50-mL conical flask, and 10 ml
of 100% methanol was added. The suspension was sonicated for 30 min, and the sample solution was filtered
through a 0.45 μm filter and used as the test solution for the quantitative analysis of ginsenosides in Panax
ginseng.
.
2.4.4 Measurement of partition coefficient and settling time
6ml of each selected solvent system were first prepared and equilibrated in test tubes. An equal volume of upper
and lower phases (600μl) was then dispensed into a HPLC vial with a pipette. This was repeated three times.
Later the HPLC vials were put in a water bath at 30ºC for 15 min. Meanwhile, 6mg of crude extract was
weighed and added to each phase system. The HPLC vial was shaken vigorously and put back in the water bath
until equilibrium had been established in both phases. Equal volumes (400 µl) of upper and lower phases were
each then transferred into separate HPLC vials and evaporated to dryness under vacuum at 25 ºC, respectively.
The residues were dissolved in 1 ml methanol and analysed by HPLC at 203nm. The partition coefficient (KD)
of a particular compound in reversed-phase mode was calculated as the ratio of peak area in the upper
(stationary) phase to the lower (mobile) phase. The partition coefficient was defined as KD = Aupper /Alower ,
where Aupper and Alower were ginsenoside HPLC peak areas in the upper and lower phases respectively
The settling time, which is highly correlated with the retention of stationary phase, was expressed as the time
for a clear layer between the two phases to be formed when each phase was mixed in the appropriate ratios.
2.4.5 Preparation of the two-phase solvent systems and sample solution
Two solvent systems composed of ethyl acetate–n-butanol–5mM aqueous ammonium acetate(3.5:0.5:4 v/v)
solvent system and ethyl acetate–n-butanol– 5mM aqueous ammonium acetate (2.5:1.5:4 v/v) solvent system
were used for the first step separation of ginsenosides with gradient elution. Methylene chloride–methanol–
water–isopropanol (6:3:4:3 v/v/v) was used for the second step CCC separation with iscroatic elution. All
solvent systems used in this study were made by mixing organic solvents in a separator funnel. After vigorous

69
shaking, solvents were left to settle till both phases would become transparent and, therefore, equilibrated. Then
the two phases were separated shortly before HPCCC separation.
The sample solution is usually prepared by dissolving the sample mixture in the upper and/or lower phase to be
used for separation. When the sample is small and the target component has a low KD value, the sample will be
dissolved in the mobile phase. However, it is better to dissolve the sample in a solvent mixture consisting of
equal volumes of both upper and lower phases for the following reasons: if a large amount of sample is
dissolved in a one phase solvent, the physical properties of the two-phase solvent system is altered and in an
extreme case a single phase can be formed. Injection of this sample into the separation column would result in a
detrimental loss of the stationary phase and bad resolution would be observed. This can be prevented by
dissolving the sample into a mixture of both phases. Also, when the sample mixture contains multiple
components with a wide range of polarity, the use of the two phase system can minimize the volume of the
sample solution, hence improving the peak resolution.
In contrast to HPLC, CCC permits relatively large amounts of sample to be injection without seriously affecting
the peak resolution. Generally, the volume of sample is one-tenth of the capacity of the column volume. Too
much volume of injection of sample will result in a loss of retention of the stationary phase. The sample
solution was prepared by dissolving the ginseng extraction (60 mg) in 5 ml of the two phases of the solvent
system being used for the HPCCC separation
2.4.6 HPCCC separation procedure
In this study, an experimental prototype J-type coil planet centrifuge high-performance semi-preparative
instrument originally supplied by Dynamic Extractions ltd, 890 Plymouth Road, Slough, was provided by
Brunel Institute from Bioengineering, Brunel University. This machine has a rotor radius of 85 mm, tubing bore
of 1.6mm and two bobbins (columns) with a total capacity of 143 ml. It was one type of semi-preparative
instrument. The Spectrum can rotate up to a speed of 1600rpm (241×g), has a typical flow range of 0.5–10
ml/min and a mean β value of 0.79. A manual sample injection valve was used to introduce the samples into the
column. This HPCCC unit has semi- preparative column wound on each separate bobbin. The semi-preparative
columns are 70.5ml and 73ml (143.5ml total) capacity with 1.6mm bore PTFE tubing. In this study, the 73 ml
column was used. When one column was used, the other unused column was filled with 50:50 methanol/water
to maintain balance. A series of biphasic mixtures was prepared and was thoroughly equilibrated in a separator
funnel by repeated vigorous shaking and degassing at room temperature. In each HPCCC preparative separation
run, the coil was filled with the stationary phase. Then the mobile phase was pumped into the column at a flow
rate of 2 ml/min with a centrifuge rotation speed of 1600 rpm at 30 ˚C. When hydrodynamic equilibrium was
established, the sample solution was injected into the coil through a 3.66 ml sample loop. The equilibration
point of the system was determined when no more stationary phase was eluted (hydrodynamic equilibration).
The retention volume of the system could then be calculated by subtracting the volume of stationary phase
eluted at the end of the equilibration process and dead volume from the total volume of the system. The effluent

70
from the tail end of the column was continuously monitored with a UV detector and the retention of the
stationary phase relative to the total column capacity was computed from the volume of the stationary phase
collected from the column after the separation was completed. Peak fractions were collected into test tubes with
a sampler controller for analysis by HPLC.
2.4.7 Measurement of stationary phase retention (Sf)
2.4.7.1 Measurement of dead volume (VD) of HSCCC
According to the theory of CCC [207, 347], the volume of stationary phase retained in the column plays an
important factor in getting high-resolution efficiency. The volume of stationary phase (Vs) in the coil system can
be expressed as a fraction (Sf) or percentage of the column volume (Vc) as follows:
Sf =Vs/Vc or Vs/Vc×100% (Equation 12)
Total system volume (Vsv) =Vc+Vin+Vout=Vs+Vm+Vin+Vout. Where Vc= Vs+Vm (Equation 13)
Vm - the active mobile phase volume in the coil.
Vin-the volume in the inlet leads
Vout-the volume in the outlet leads
Dead Volume (VD) is defined as the volume in the inlet and outlet leads and the coil feed pipes. The volume of
the coil feed pipes is usually very small. VD can be expressed as
VD= Ve-Vm Ve - the eluted volume of mobile phase (Equation 14)
Vsv is usually measured by determining the increase in weight when the column is filled with water and then
blowed it out using regulated N2 supply.
So, if the VD can be measured, it is possible to get a value for the retained volume of stationary phase (Vs) by
subtracting the measured volume eluted (Ve) from the system volume (Vsv)
Vs=Vsv-(Vm+Vd) =Vsv-Ve (Equation 15)
Wood has observed that there is a relationship between the stationary phase eluted and the square root of mobile
phase flow, which can be expressed as equation [207]
Ve=Vd+AQm1/2
(Equation 16)
It is obtained by incrementally increasing the mobile phase flow until a new equilibrium is reached and plotting
the new eluted volume of stationary phase against the square root of the flow. The intercept at Qm=0 gives the
value of VD and any value above this gives the volume of mobile phase in the coil at any given flow in excess of
this value. In our case, the VD was measured by this method.
2.4.7.2 Measurement of Sf
According to the equations Vm= Ve-VD (Equation 17)
Vs
Vc
*100*100*100Vsv-Ve
Vc=Vc-Vm
VcRetention (SF % )==
(Equation 18)

71
2.4. 8 HPLC analysis and identification of HPCCC fractions
Based on the investigation of retention behavior of ginsenosides in HPLC (result are shown in Section 2.5.1),
two HPLC methods were developed and optimazed for this study. The first method was used for the analysis of
crude sample and pooled fractions. HPLC separation was carried out on an Altima C18 column (250×4.6mm
i.d., 5µm) at 25 ˚C with a binary mobile phase consisting of 5mM aqueous ammonium acetate (solvent A) and
acetonitrile (solvent B) at a flow rate of 1.0 ml/min. The gradient elution program was as follows: 0–15 min,
hold 21% B; 15–69 min, 21–38.1% B. For rapid screening of HPCCC fractions the first HPLC method was
shortened from 69 to 40 min by using a Phenomenex Luna C18 (2) (150×4.6mm i.d., 5µm) column and
adjusting the gradient to: 0–12 min, hold 30% B, 12–40 min, 30–60% B. Temperature and flow rate were kept
the same as for the first HPLC method. All HPLC analysis was done with DAD detection at 203 nm.
Identification of the purified compounds was performed using LC-MS/MS system API 3000 (LinacTM
)
consisting of a mass spectrometer equipped with a triple quadrupole system and electro spray ionization (ESI).
The system has been optimized for working in positive and negative mode, scan time was 0.2 s. The analysis of
the fraction was carried out using a using a Grace Luna C-18 (100 ×4.6 mm 5.0µm) column the experiment was
performed using a binary mobile phase composed of water solvent and Acetonitrile solvent B, the following
gradient elution program was used: 0-30 min, 50-90% B.
NMR spectra were recorded on an AV400 FT-NMR and AV600 FT-NMR, respectively operating at 400 MHz
and 600 MHz for 1H. The 1H and 13C chemical shifts are referenced to SiMe4 using the residual protio
impurities of the deuterated methanol solvent.
2.5 Result and discussion
2.5.1 HPLC retention behavior of ginsenosides
The effect of the acetonitrile concentration in the mobile phase on the retention values of six ginsenosides was
investigated. The relationships between the concentration of organic solvent in the mobile phase and the
logarithm of the partition coefficients (logKD) of PPT ginsenosides Rg1 and Re; PPD ginsenosides Rb1, Rb2,
Rc, and Rd; respectively, were illustrated in Fig 2.5.1.1.1 and Fig 2.5.1.1.2.which indicated a linear
relationship between the log KD and the concentration of acetonitrile. This is consistent with Snyder’s linear-
solvent-strength model [348].
log KD = logkw–Sφ (Equation 19)
Where kw is the extrapolated value of KD for water as the mobile phase (for which φ= 0), φ is the volume
fraction of the organic solvent in the mobile phase, and S is a constant for a given solute when only φ varies.

72
2.5.1.1 Effect of Concentration of acetonitrile of mobile phase
The ginsenosides Rg1 and Re have similar properties and structures, both carrying the same (20S)-
protopanaxatriol aglycone moiety. The curves of these two ginsenosides nearly overlap (Fig 2.5.1.1.1), which
indicates a very small difference in their retention times. Therefore, it would be difficult to entirely separate
these ginsenosides using C18 RP-HPLC. Furthermore, when the concentration of acetonitrile in the mobile
phase was greater than 23%, the partition coefficient of Rg1 was less than 7 and under these conditions Rg1 and
Re couldn’t achieve baseline separation with either isocratic or gradient elution. Besides, the curves intersected
at approximately 26% acetonitrile, demonstrating that changes in the ratio of the mobile phase would lead to a
reversal of the elution sequence of Rg1 and Re. The same phenomenon is acheived with regard to separating Rd
from Rb1, Rb2, and Rc (Fig 2.5.1.1.2).
Fig 2.5.1.1.1 Effect of concentration of acetonitrile in mobile phase on the retention values of PPT
ginsenosides Rg1 and Re
Fig 2.5.1.1.2 Effect of concentration of acetonitrile in mobile phase on the retention values of PPD ginsenosides
Rc, Rb1, Rd and Rb2

73
2.5.1.2 Effect of pH value of mobile phase
The effect of the pH value of mobile phase on the partition coefficient KD of ginsenosides is shown in Fig
2.5.1.2.1. The retention values of the ginsenosides Rg1, Re, Rb1, Rb2, Rc, and Rd barely changed with an
increase in the pH value of the aqueous phase from 2.5 to 7.0. However, the retention time of acid ginsenosides
could be markedly influenced by the pH change due to the ionization of the –COOH group. Increasing the pH
of the mobile phase favored the generation of polar -COO−, resulted in a decrease in the retention times and
distortion of the peak shape [349].
Fig 2.5.1.2.1 Effect of pH value of mobile phase on the logarithm of partition coefficient of ginsenosides
2.5.1.3 Effect of Ionic strength of mobile phase
The effect of the ionic strength of the mobile phase on the partition coefficient of six ginsenosides was
subsequently studied by adding specific amounts of NaCl to the aqueous phase (Fig 2.5.1.3.1). The retention
times of the ginsenosides Rg1, Re, Rb1, Rb2, Rc and Rd remained substantially constant but were slightly
shortened with increasing concentrations of ions in the mobile phase. One explanation for these phenomena is
that NaCl in the mobile phase causes hydration, which leads to a decrease in the number of free water molecules
and an increase in the ratio of the organic phase, thereby decreasing the retention time of neutral ginsenosides.

74
Fig 2.5.1.3.1 Effect of ionic strength of mobile phase on the logarithm of partition coefficient of ginsenosides
Based on the above discuss, if the concentration of acetonitrile in the mobile phase was greater than 23%, the
ginsenoside Rg1 and Re were hard to separate. However, if the starting concentration of acetonitrile is too low, a
longer elution time would be required. In this study, the gradient program was set to start with isocratic elution
at acetonitrile 21% for 15 min and increase to 38.1% over 69 min with a linear gradient. Using this elution
program, baseline separation of Rg1 and Re was achieved.
The retention values of neutral ginsenosides in Panax ginseng are not sensitive to the pH value or ionic strength
of the mobile phase. However, acidic ginsenosides were largely affected by the properties of the mobile phase.
Addition of salts to the mobile phase was helpful in prolonging the retention time and obtaining a good peak
shape [349]. Therefore, 5mM ammonium acetate salt was selected and added to the mobile phase to ensure a
suitable pH and ionic strength.
Thus, a new HPLC method were established for quality control of ginsenosides from Panax ginseng. Seven
ginsenosides Rg1, Re, Rc, Rd, Rb1, Rb2, Rb3 and Rd were successfuly separated (the result was shown in the
Section 2.5.4.1). The method was: HPLC separation was carried out on an Altima C18 column (250×4.6mm
i.d., 5µm) at 25 ˚C with a binary mobile phase consisting of 5mM aqueous ammonium acetate (solvent A) and
acetonitrile (solvent B) at a flow rate of 1.0 ml/min. The gradient elution program was as follows: 0–15 min,
hold 21% B; 15–69 min, 21–38.1% B.
2.5.2 Selection of solvent system for the separation of ginsenosides in HPCCC
A critical step in achieving a successful separation of saponins by CCC was the selection of suitable two phase
solvent systems. The target compounds must have an appropriate partition coefficient (KD) between 0.5 and 2.0.
From the literature review, many different solvent solvents have been found for the separation of saponins such

75
as hexane/butanol/water [75], chloroform/methanol/water (ChMWat) [76], methylene
chloride/methanol/water/isopropanol [72,73,77] and methyl t-butyl ether/acetonitrile/butanol/water [350]
solvent systems. ChMWat solvent system has been widely used CCC and these solvent systems are suitable for
the separation of polar saponins [351].
2.5.2.1 Selection of solvent system for the first step separation of ginsenosides in HPCCC
1) Ethyl acetate–n-butanol–0.1% formic acid solvent system
In this case, as most of the ginsenosides were medium polar or polar compounds, they were hard to dissolve in
non-polar solvents but dissolved easily in water or other appropriate polar solvents. Therefore, solvent systems
based on n-heptane or n-hexane could not be used for the separation of ginsenosides as they have large KD
values in normal-phase mode and take a long time to elute. Ethyl acetate/n-butanol/water (EBuWat) solvent
systems solvent system targets compounds of moderate to hydrophilic polarity. The general organization of the
solvent system family can be described as organic/organic modifier/water. In this case, the alcohol, butanol, is
considered to be an organic modifier since it is miscible with ethyl acetate, but only somewhat miscible with
water. Shake tests showed the major components could almost partition into two layers with this solvent system.
On the other hand, the addition of crude sample into the EBuWat solvent system can cause emulsification,
which potentially leads to stripping of the stationary phase from the column and loss of separation efficiency.
But the addition of acid or salt in the solvent system can suppress the emulsification. In addition, the solvent
system with some acid solubility shortens the settling time and improves the retention of the stationary phase
since these acidic analytes have two molecular forms, protonated (-COOH) and deprotonated (COO−), each
having a different KD value, they form a broader peak when partly ionized [213]. Therefore, the use of an acidic
modifier to the solvent system is recommended and the ethyl acetate/n-butanol/0.1% aqueous formic acid
solvent system was selected as the two phase solvent system for the first step separation of ginsenosides. The
results were given in Table 2.5.2.1.1 and the effect of ethyl acetate/butanol ratio in EBW with 0.1% formic acid
solvent system on logarithmic KD of ginsenosides is shown in the Fig 2.5.2.1.1.
Table 2.5.2.1.1 KD values of ginsenosides with different ratios of EBWsolvent system addition of 0.1% formic
acid (v/v)
KD value of EBF(4:0:4 v/v) with acid 30ºC KD average α
Rb2 0.003
Rc 0.005 1.7
Rd 0.009 1.8
Rb1 0.021 2.3
Re 0.069 3.3
Rg1 0.089 1.0
KD value of EBF(3:1:4 v/v) with acid 30ºC KD average α
Rb1 0.22
Rb2 0.34 1.5
Rb3 0.45 1.3

76
Rc 0.60 1.3
Re 1.25 2.9
Rg1 1.74 1
Rd 2.10 1.2
KD value of EBF(2.5:1.5:4 v/v) with acid 30ºC KD average α
Rb1 0.47
Rb2 0.75 1.6
Rb3 0.97 1.3
Rc 1.05 1.1
Re 2.11 2
Rg1 2.68 1.3
Rd 3.95 1.5
KD value of EBF(2:2:4 v/v) with acid 30ºC KD average α
Rb1 0.68
Rb2 0.96 1.4
Rb3 1.15 1.2
Rc 1.23 1.1
Re 2.32 1.9
Rg1 3.02 1.3
Rd 4.13 1.5
KD value of EBF(1:3:4 v/v) with acid 30ºC KD average α
Rb1 3.29
Rb2 5.18 1.6
Rb3 8.43 1.6
Rc 9.64 1.1
Re 11.35 1.2
Rg1 13.59 1
Rd 22.72 2
KD value of EBF(0:4:4 v/v) with acid 30ºC KD average α
Rb1 7.00
Rb2 10.93 1.6
Rb3 10.78 1
Rc 15.63 1.5
Re 17.72 1.1
Rg1 19.35 1.1
Rd 48.82 2.5
The α refers to separation of peaks on the elution order (ginsenoside Rb1&Rb2, ginsenoside Rb2&Rb3, etc.)

77
Fig 2.5.2.1.1 The effect of ethyl acetate/butanol ratio in EBW with 0.1% formic acid solvent system (v/v) on
logarithmic KD of ginsenosides
From the ethyl acetate–n-butanol–0.1% aq formic acid solvent systems in Figure 2.5.3.1.1, the solubility of
ginsenosides in the upper organic phase increased as the ratio of n-butanol increased and that of ethyl acetate
decreased, leading to an increase of the KD values because ginsenosides were well dissolved in the butanol. If
either the organic or aqueous phases were chosen to be the mobile phase, changing the ratio of butanol against
ethyl acetate will result in fast elution of all constituents. According to the literature, the best KD for good
resolution is between 0.5 and 2.0. Also the separation facto (α) should be bigger than 1.2, Hence, the ethyl
acetate/n-butanol/0.1% aqueous formic acid (2:2:4 v/v) solvent system and ethyl acetate/n-butanol/0.1%
aqueous formic acid (2.5:1.5:4 v/v) solvent system can provide a separation of most of the target compounds
and was selected as the solvent system for the first step separation of ginsenosides.
However, the result of the separation of ginsenosides using such solvent system in HPCCC showed that the
dynamic KD value of ginsenosides are not consistent with their static KD value with the tube test (result showed
in Section 2.5.3.1.2). This could be caused by the acid environment leading to ginsenosides hydrolyzing in the
water and decomposing during the tube test procedure. In order to investigate the effect the acid has on the
partition of ginsenosides three phase systems were selected: 1) ethyl acetate–n-butanol–0.1% aqueous formic
acid solvent system (2.5:1.5:4 v/v), 2) ethyl acetate–n-butanol–water solvent system alone and 3) ethyl
acetate/n-butanol/5mM ammonium acetate salt solvent system (2.5:1.5:4 v/v). The partition coefficients of
ginsenosides by HPLC for these phase systems were repeated three times and a comparison study performed.
Table 2.5.2.1.2 - 2.5.2.1.4 showed the KD values of ginsenosides in the above three phase systems. It indicated
that the standard deviations of KD values of most target ginsenosides in EBW (2.5:1.5:4 v/v) solvent system and
EBW (2.5:1.5:4 v/v) solvent system with 5mM ammonium acetate salt were less than 10%, which indicated the
results were accurate and reliable, but the standard deviations of KD values of most target ginsenosides in EBW
(2.5:1.5:4 v/v) solvent system with 0.1% formic acid were bigger than 20%. Besides, the comparison study with
HPLC area of target ginsenosides between EBW (2.5:1.5:4 v/v) solvent system with acid and EBW (2.5:1.5:4)

78
solvent system with 5mM ammonium acetate salt has further verified that acid environment lead ginsenosides
to hydrolyze and decompose particularly in the KD value measurement process. Because it clearly showed that
the HPLC area of target ginsenosides in the upper phase of the two solvent systems kept constant with the three
repeat times, which were showed in the Fig 2.5.2.1.2 and Fig 2.5.2.1.4. On the contrary, the HPLC areas of
target ginsenosides in the lower phase of the two solvent systems have performed the different result. The
HPLC areas of target ginsenosides in the lower phase of EBW (2.5:1.5:4 v/v) solvent system with addition 0.1%
formic acid varied with big different values in the three repeat times (Fig 2.5.2.1.3 v/v), while the HPLC areas
of target ginsenosides in the lower phase of EBW (2.5:1.5:4) solvent system with addition of 5mM ammonium
acetate salt (Fig 2.5.2.1.5) were still consistent in the three tests. This phenomenon only happened in the
aqueous phase (lower phase) with the formic acid but did not happen in the organic phase (upper phase) and
aqueous phase without acid solute. This phenomenon also happened in the other solvent system with the
addition of acid solute. Therefore, it indicated that the acid environment was not suitable for the separation of
ginsenosides. Moreover, it was also established that the emulsification could be suppressed by the addition of
ammonium acetate and what could easily been removed by re-suspending the fraction in acetone during the
HPCCC fraction analysis. Therefore, the ethyl acetate–n-butanol–water solvent system with addition of 5mM
ammonium acetate salt was used for the first step separation of ginsenosides.
Table 2.5.2.1.2 Average KD value of ginsenosides in EBW (2.5:1.5:4 v/v) solvent system addition of 0.1%
formic acid with three times tube test
EBW with acid(2.5:1.5:4 v/v) Average KD of three times SD
Rb1 0.47 11.75
Rb2 0.75 17.95
Rb3 0.97 23.22
Rc 1.05 24.22
Re 2.11 21.91
Rg1 2.68 21.91
Rd 3.95 38.09
Table 2.5.2.1.3 Average KD value of ginsenosides in EBW (2.5:1.5:4 v/v) solvent system with three times tube
test
EBW (2.5:1.5:4 v/v) Average KD of three times SD
Rb1 0.48 9.37
Rb2 0.76 8.70
Rb3 0.66 24.00
Rc 1.51 7.22
Re 2.67 8.68
Rg1 2..67 8.68
Rd 3.28 16.88

79
Table 2.5.2.1.4 Average KD value of ginsenosides in EBW (2.5:1.5:4 v/v) solvent system addition of 5mM
ammonium acetate salt with three times tube test
EBW with salt(2.5:1.5:4 v/v) Average KD of three times SD
Rb1 0.77 1.53
Rb2 1.18 4.73
Rb3 1.33 7.63
Rc 1.80 4.06
Re 1.87 15.28
Rg1 2.35 15.28
Rd 4.00 19.87
0.0
90
0.4
38
0.5
70
0.7
10
1.0
44
1.1
66
1.8
56
1.9
70
Re -
2.1
86
Rg1 -
2.5
27
3.0
99
3.6
41
3.9
30
4.0
62
5.2
13 5.4
98
6.4
21
7.1
60
7.7
51
10.5
97 Rb1 -
11.4
17
Rc -
13.8
93
Rb2 -
16.6
00
Rb3 -
17.2
94 R
d -
19.2
82
20.6
32
21.1
24
22.0
69
22.7
87
24.9
97
26.2
00
27.1
95
Rg3 -
27.6
90
28.5
56
28.9
80
29.5
64
30.3
83
31.4
47
31.8
16
32.7
16
33.1
31
33.7
34
34.1
83
34.4
98
35.0
72
35.6
65
36.7
02
37.6
31
38.8
35
39.3
11
41.9
03
42.1
71
AU
0.00
0.02
0.04
0.06
0.08
0.10
0.12
0.14
0.16
0.18
Minutes
0.00 5.00 10.00 15.00 20.00 25.00 30.00 35.00 40.00 45.00
Fig 2.5.2.1.2, HPLC chromatograms of ginsenosides in upper phase of EBW (2.5:1.5:4 v/v) with addition of
0.1%formic acid solvent system with three repeat times
0.1
19
0.4
36
0.7
17
1.0
57
1.4
33
1.8
50
2.0
10
Re -
2.1
93
Rg1 -
2.5
21
3.9
53
5.4
91
7.2
70
7.6
98
10.4
96
Rb1 -
11.3
03
Rc -
13.7
16
14.4
89
Rb2 -
16.4
62
Rb3 -
17.1
91
17.5
94
Rd -
19.1
73
19.4
43
20.5
99
22.7
03
Rg3 -
32.3
20
40.6
37
42.1
58
AU
0.000
0.010
0.020
0.030
0.040
0.050
0.060
0.070
0.080
Minutes
0.00 5.00 10.00 15.00 20.00 25.00 30.00 35.00 40.00 45.00
Fig 2.5.2.1.3 HPLC chromatograms of ginsenosides in lower phase of EBW (2.5:1.5:4 v/v) with addition of
formic acid solvent system with three repeat times

80
0.0
69
0.4
12
0.6
77
1.1
20
1.2
43
1.5
89
1.8
60
2.0
12
2.2
00
Re -
2.3
85
Rg1 -
2.5
44
3.0
75
3.6
81
3.9
75
5.1
87 5
.538
6.4
72
7.2
22
7.8
08
10.7
13
Rb1 -
11.5
12
Rc -
14.0
53
Rb2 -
16.6
79
Rb3 -
18.4
82
Rd -
19.3
88
21.0
92
21.5
69
22.8
79
23.1
95
23.4
22
25.0
91
26.5
68
27.1
28
Rg3 -
27.7
77
28.4
82
31.3
66
31.7
80
32.6
40
32.9
58
33.8
06
34.9
46
36.6
13
37.5
30
37.9
94
38.7
46
39.3
48
41.8
02
42.1
88
AU
0.00
0.05
0.10
0.15
0.20
Minutes
0.00 5.00 10.00 15.00 20.00 25.00 30.00 35.00 40.00 45.00
Fig 2.5.2.1.4 HPLC chromatograms of ginsenosides in upper phase of EBW (2.5:1.5:4 v/v) solvent system with
addition of 5mM ammonium acetate salt with three repeat times test
0.4
34
0.7
15
1.0
69
1.6
12
1.8
39
1.9
89
Re -
2.1
74
Rg1 -
2.5
21
3.9
60
4.3
23
5.5
10
6.4
23
7.3
56
7.7
20
9.3
84
10.6
82
Rb1 -
11.6
10
Rc -
14.0
08
14.7
66
Rb2 -
16.6
78
Rb3 -
17.6
62
18.6
85
Rd -
19.3
02
20.6
99
22.8
38
25.0
52
Rg3 -
27.7
66
28.3
99
31.3
33
33.8
33
41.2
01
AU
0.00
0.02
0.04
0.06
0.08
Minutes
0.00 5.00 10.00 15.00 20.00 25.00 30.00 35.00 40.00 45.00
Fig 2.5.2.1.5 HPLC chromatograms of ginsenosides in lower phase of EBW (2.5:1.5:4 v/v) with addition of
5mM ammonium acetate salt with three repeat times
2) Ethyl acetate–n-butanol–water solvent system addition of 5mM ammonium acetate salt
Several EBW solvent system with additions of 5mM ammonium acetate solvent systems were tested for the
separation of ginsenosides. Table 2.5.2.1.5 shows the KD values for different ratios of EBW solvent systems.
The effect of ethyl acetate/butanol ratio in EBW with 5mM ammonium acetate solvent system on logarithmic
KD of ginsenosides is shown in the Fig 2.5.2.1.6. It shows the partition coefficients of ginsenosides increase as
the ratio of n-butanol increases. According to the literature, the best KD for good resolution is between 0.5 and
2.0. Hence, the ethyl acetate/n-butanol/5mM aqueous ammonium acetate (2:2:4 v/v) solvent system and ethyl
acetate/n-butanol/5mM aqueous ammonium acetate (2.5:1.5:4 v/v) solvent system can provide suitable KD
values to most of the target ginsenosides, which are between 0.5 and 2.0 or close to 0.5 and 2.0 and the
partition coefficients indicate that the component ginsenosides Rb1, Rb2 and Rb3 would be easily the first to
elute when the concentration of butanol was low. The component Rc, Re, Rg1 and Rd would be the last to elute
in the reverse phase mode. However, partition coefficient study also indicated these two solvent systems still
can not cover all the polarity range of ginsenosides making it hard to separate ginsenosides Rb2, Rb3, Rc, Re

81
and Rg1.Thus, applying for the gradient solvent system is necessary for the separation of ginsenosides.
Table 2.5.2.1.5 KD values of ginsenosides with different ratios of EBWsolvent system with addition 5mM
ammonium acetate
KD value of EBW(4:0:4 v/v) with salt 30ºC KD average α
Rb1 0.00
Rb2 0.00 0
Rb3 0.00 0
Rc 0.00 0
Re 0.01 0
Rg1 0.01 1.0
Rd 0.00 0
KD value of EBW (3:1:4 v/v) with salt 30ºC KD average α
Rb1 0.18
Rb2 0.28 1.5
Rb3 0.29 1.0
Rc 0.42 1.4
Re 0.49 1.1
Rg1 0.60 1.2
Rd 1.05 1.75
KD value of EBW (2.5:1.5:4 v/v) with salt 30ºC KD average α
Rb1 0.77
Rb2 1.18 1.5
Rb3 1.33 1.1
Rc 1.80 1.4
Re 1.87 1.0
Rg1 2.35 1.3
Rd 4.00 1.8
KD value of EBW (2:2:4 v/v) with salt 30ºC KD average α
Rb1 1.64
Rb2 2.77 1.7
Rb3 2.94 1.1
Rc 3.96 1.4
Re 4.27 1.1
Rg1 5.44 1.3
Rd 6.60 1.3
KD value of EBW (1:3:4 v/v) with salt 30ºC KD average α
Rb1 3.01
Rb2 4.73 1.5
Rb3 5.03 1.1
Rc 6.30 1.3
Re 7.45 1.2
Rg1 11.25 1.5
Rd 20.29 1.8

82
KD value of EBW (0:4:4 v/v) with salt 30ºC KD average α
Rb1 5.10
Rb2 7.65 1.4
Rb3 8.55 2.5
Rc 10.97 1.3
Re 12.41 1.2
Rg1 15.76 1.4
Rd 35.33 2.3
The α refers to separation of peaks on the elution order (ginsenoside Rb1&Rb2, ginsenoside Rb2&Rb3, etc)
Fig 2.5.2.1.6 The effect of ethyl acetate/butanol ratio in EBW with 5mM ammonium acetate solvent systems on
the logarithmic KD value for ginsenosides
3) Ethyl acetate–n-butanol–water solvent system addition of 5mM ammonium acetate salt gradient
selection
Based on the literature review in chapter 1, gradient elution can be employed for the separation of ginsenosides
with CCC because it is a practical way to reduce the separation time. The ease of optimization with gradient
HPLC compared to sequential isocratic optimization suggested that this was the route to take with CCC. Indeed,
gradient CCC (either linear or step) is possible and is likely to have significant potential. The importance of
gradient separation is the ability to cover the entire polarity range in one single run and shorten the elution time.
The solvent gradients were selected based on the KD values of target compounds, settling time and phase ratio.
Also these solvent systems should retain high stationary phase retension in the HPCCC due to gradient elution
easily leading to loss of much stationary phase. Based on the previous partition coefficient study, EBW
(3.5:0.5:4 v/v) and EBW (2.5:1.5:4 v/v) solvent system with 5mM ammonium acetate were selected as the
solvent system for the gradient elution. They can provide the satisfactory KD values for the target ginsenosides

83
when the ratio of ethyl acetate to butanol decreases from the 3.5/0.5 to 2.5/1.5. The ginsenoside Rd will elute
first and the ginsenoside Rb1 will elute last. Both KD values of them are between 0.5 and 2.0 (1.16 and 1.30), in
addition, both solvent systems have fast settling time with the 1:1 phase ration which ensure the high retention
of stationary phase in the column, which prevent the loss of much stationary phase. Both of the KD values of
ginsenosides, setting time, phase ratio and Sf value in these two EBW solvent systems in normal phase mode are
shown in Table 2.5.2.1.6.
Table 2.5.2.1.6 Comparison of KD of ginsenosides, setting time, phase ratio and Sf value with two different ratio
of EBW solvent systems addition of ammonium acetate (v/v) in normal phase mode
E-B-W addion
of ammonium
acetate (Ratio of
volume)
Rb1
KD
value
Rb2
KD
value
Rb3
KD
value
Rc
KD
value
Re
KD
value
Rg1
KD
value
Rd
KD
value
Setting
time
(sec)
Phase
ratio
3.5:0.5:4
8.28 4.51 4.07 2.77 2.63 2.08 1.16
20
1:1
2.5:1.5:4
1.30 0.85 0.75 0.56 0.53 0.43 0.25
20
1:1
2.5.2.2 Selection of solvent system for the second step separation of ginsenosides in HPCCC
Ethyl acetate/butanol/5mM aqueous ammonium acetate solvent system is a good solvent system for separation
of ginsenosides. Ginsenoside Rb1, Rg1 and Rd could be well separated from each other, but this solvent system
could not separate ginsenosides Rb2, Rb3, Re and Rc (result was showed in section 2.5.3.1.4). Though
ginsenosides coexist in the extract and cover a wide range of polarities, the target ginsenosides are medium
polar and polar compounds. The EBW solvent system generally is suitable for the separation of hydrophobic
components and ginsenosides are more easily dissolved in the polar solvents. Hence, another solvent system
was needed for the second step separation of ginsenosides in HPCCC. Chloroform-methanol-water solvent
system has been widely used in CCC and is suitable for separation of glycosides compounds such as flavonoids
glucosides and ginsenosides [351]. However, in recent years, this solvent system has been avoided for
environmental reasons. Other chlorinated solvents, such as methylene chloride, can replace chloroform due to
its high solvating power and its high density. In addition, butanol or isopropanol are usually added to the
ChMWat solvent system to adjust the polarity [351]. Because most of ginsenosides are easy dissolved in them,
also the ammonium acetate can be used for suppressing the sample emulsification and increased the retention of
the stationary as it changed the density and viscosity of the two phases. Thus, methylene
chloride/methanol/water/isopropanol solvent system with ammonium acetate was selected as an alternative
CCC solvent system for the second step separation of ginsenosides. Table 2.5.2.2.1 shows the KD values of the
ginsenosides in methylene chloride/methanol/water/isopropanol (6: x: 4:3 v/v/v) with ammonium acetate
solvent systems when the ratio of methanol was increased from 1 to 3. The Fig 2.5.2.2.1 also describes the KD
values varation with the ratio of methanol in the methylene chloride/methanol/water/isopropanol (6: x: 4:3 v/v/v)
with ammonium acetate solvent systems.

84
Table 2.5.2.2.1 KD values in methylene chloride/methanol/water/isopropanol (6: x: 4:3 v/v/v) solvent
systems with addition 5mM ammonium acetate when the ratio of methanol was varied for different
ginsenosides with reversed phase mode
Ratio of
methanol
Rb1
KD value
Rb2
KD
value
Rb3
KD
value
Rc
KD
value
Re
KD
value
Rg1
KD
value
Rd
KD
value
1 13.69 5.94 5.78 4.13 3.16 2.07 1.41
2 7.54 8.93 8.80 6.28 5.20 3.59 1.62
3 5.49 3.10 2.90 2.40 1.67 1.29 0.74
Fig 2.5.2.2.1 Effect on the logKD value of the content of methanol in the DMWI (6: x: 4:3 v/v/v) solvent
system with addition 5mM ammonium acetate for ginsenosides
For these solvent systems, most of the ginsenosides were easy dissolved in the methanol rich layer and thus KD
value of ginsenosides increased dramatically with the ratio of methanol composition increasing to 2, but the KD
value of ginsenosides fell dramatically when the proportions of methanol composition continued to reach 3. It
showed that the methanol composition has various effects on the partition coefficients of ginsenosides. The
retention of stationary phase is relative to the settling time of the two phases in the tube test [213]. If the settling
time is less than 20 seconds, this selected solvent system would provide the good retention of stationary phase.
Table 2.5.2.2.2 shows the effect of methanol content on settling time for DMWI solvent system. It indicates that
the DMWI (6:3:4:3 v/v/v) solvent system could be chosen to separate the ginsenosides due to its shortest
settling time.
.

85
Table 2.5.2.2.2 The effect of solvent ratio on settling time for DMWI solvent systems with addition 5mM
ammonium acetate (v/v/v)
DMWI MeOH
Phase Ratio
(up/lp v/v)
Settling
Time(sec)
6:1:4:3 1 1.2:1 45
6:2:4:3 2 2:1 30
6:3:4:3 3 1.6:1 25
Isopropanol
6:2:4:2 2 1.25:1 40
6:2:4:3 3 2:1 40
6:2:4:4 4 1.6:1 50
Also most of the ginseosides are more easily dissolved in the isopropanol-rich layer than the methanol-rich one
when the isopropanol content increased. Thus the KD value of ginsenosides decreased with the proportion of
isopropanol volume increasing from 2 to 3 and the KD value of ginsenosides fell dramatically when the
proportion of isopropanol volume reached 4. It shows that the isopropanol content has a big effect on the
partition coefficients of ginsenosides. Table 2.5.2.2.3 shows the KD values of the ginsenosides in methylene
chloride/methanol/water/isopropanol (6: 2: 4: y v/v/v) with ammonium acetate solvent systems when the ratio
of isopropanol was increased from 2 to 4. The Fig 2.5.2.2.2 also describes the KD values variation with the ratio
of isopropanol in the methylene chloride/methanol/water/isopropanol (6: 2: 4: y v/v/v) with ammonium acetate
solvent systems. But if the ratio of isopropanol composition increases more than 4, the two phase systems will
become a single phase. It further indicated that the DWMI (6:3:4:3) solvent system can be chosen for the
second step separation of the ginsenosides of Re, Rc and Rb2, Rb3 fractions, which were obtained from the first
step separation using EBW solvent system with 5mM ammonium acetate in HPCCC.
Table 2.5.2.2.3 KD values in methylene chloride/methanol/water/isopropanol (6:2:4: y v/v/v) solvent system
with addition 5mM ammonium acetate when the ratio of isopropanol was varied for different ginsenosides with
reversed phase mode
Proportion of
isopropanol
Rb1
KD value
Rb2
KD
value
Rb3
KD
value
Rc
KD
value
Re
KD
value
Rg1
KD
value
Rd
KD
value
2 10.10 9.35 8.42 7.47 5.74 4.24 1.78
3 7.54 8.93 8.80 6.28 5.20 3.59 1.62
4 5.28 3.02 2.46 2.07 1.43 1.23 0.58
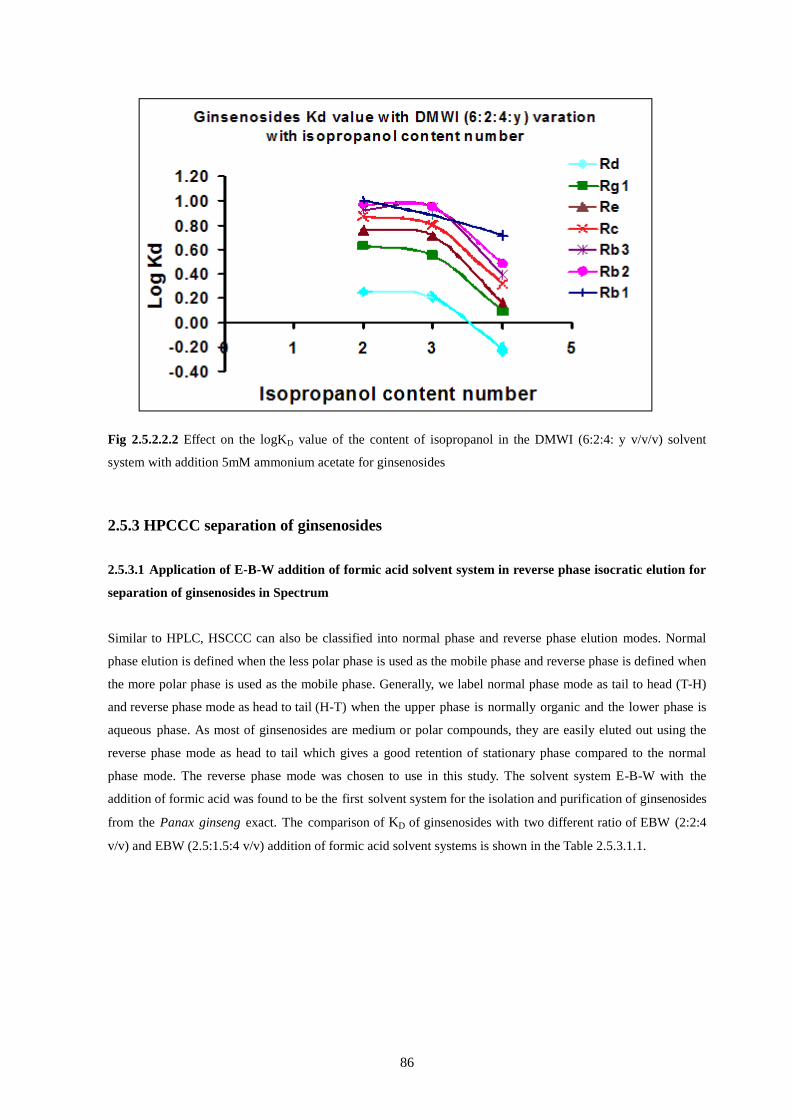
86
Fig 2.5.2.2.2 Effect on the logKD value of the content of isopropanol in the DMWI (6:2:4: y v/v/v) solvent
system with addition 5mM ammonium acetate for ginsenosides
2.5.3 HPCCC separation of ginsenosides
2.5.3.1 Application of E-B-W addition of formic acid solvent system in reverse phase isocratic elution for
separation of ginsenosides in Spectrum
Similar to HPLC, HSCCC can also be classified into normal phase and reverse phase elution modes. Normal
phase elution is defined when the less polar phase is used as the mobile phase and reverse phase is defined when
the more polar phase is used as the mobile phase. Generally, we label normal phase mode as tail to head (T-H)
and reverse phase mode as head to tail (H-T) when the upper phase is normally organic and the lower phase is
aqueous phase. As most of ginsenosides are medium or polar compounds, they are easily eluted out using the
reverse phase mode as head to tail which gives a good retention of stationary phase compared to the normal
phase mode. The reverse phase mode was chosen to use in this study. The solvent system E-B-W with the
addition of formic acid was found to be the first solvent system for the isolation and purification of ginsenosides
from the Panax ginseng exact. The comparison of KD of ginsenosides with two different ratio of EBW (2:2:4
v/v) and EBW (2.5:1.5:4 v/v) addition of formic acid solvent systems is shown in the Table 2.5.3.1.1.

87
Table 2.5.3.1.1Comparison of KD value of ginsenosides with two different ratios of EBW with addition of
formic acid solvent system (v/v)
E-B-W
addition of
formic acid
(Ratio of
volume)
Rb1
KD
value
Rb2
KD
value
Rb3
KD
value
Rc
KD
value
Re
KD
value
Rg1
KD
value
Rd
KD
value
2:2:4 0.68 0.96 1.15 1.23 2.32 3.02 4.13
2.5:1.5:4 0.47 0.75 0.97 1.05 2.11 2.68 3.95
In both of the above two solvent systems (Table2.5.3.1.1), the stationary phase retention was more than 70%
percentage, and the partition coefficients indicated that the ginsenosides Rb1, Rb2, Rb3 and Rc were easily to
be first eluted when the concentration of ethyl acetate was high. The ginsenosides Re, Rg1 and Rd would be last
eluted in the reverse phase mode.
Fig.2.5.3.1.1 HPCCC Chromatograms of ginsenosides using ethyl acetate/n-butanol/0.1% aq formic acid
(2.5:1.5:4 v/v) solvent system. Experimental conditions: Coil volume: 73 ml; the reversed phase mode; Rotation
speed: 1600 rpm; Flow rate: 2.0 ml/min; Sample volume: 5 ml; Sample concentration: 12mg/ml; Derction of
motor: Reverse. DAD detector wavelength: 203 nm

88
Fig 2.5.3.1.2 The fractogram of ginsenosides with EtOAc/BuOH/Water with 0.1% formic acid (2:2:4 v/v)
solvent system using DE-Spectrum. Experimental conditions: Column volume: 73 ml; the reversed phase mode;
Rotational speed: 1600 rpm; Flow rate: 2.0 ml/min; Sample loop volume: 3.66 ml; Sample concentration:
12mg/ml. The Sf was 74%
0
100000
200000
300000
400000
500000
600000
700000
0 20 40 60 80 100 120 140 160 Minutes
HP
LC
peak a
rea
Rb1
Rb2
Rc
Rd
Rb3
Re
Rg1
Fig 2.5.3.1.3 The fractogram of ginsenosides with EtOAc/BuOH/water with 0.1% formic acid (2.5:1.5:4 v/v)
solvent system using DE-spectrum. Experimental conditions: Coil volume: 73 ml; Stationary phase: Organic
phase; Mobile phase: Aqueous phase; Rotation speed: 1600 rpm; Flow rate: 2.0 ml/min; Sample loop volume:
3.66 ml; Sample concentration: 12mg/ml; The Sf was 75.3%

89
From the above CCC chromatograms of ginsenosides use a DAD detector, as the UV absorption of most
saponins of Panax ginseng are not strong enough to effectively be detected resulting in a high level of baseline
noise during the analysis process (Fig 2.5.3.1.1). Thus, all of the fractions of the CCC separation were analyzed
by HPLC and a fractogram plotted to investigate the different ginsenosides separated with different ratios of
ethyl acetate and n-butanol in the EBuWat solvent systems.The fractogram plot of the Spectrum CCC run with
ethyl acetate/n-butanol/0.1%formic acid (2:2:4 v/v) system (Fig 2.5.3.1.2) and ethyl acetate/n-
butanol/0.1%formic acid (2.5:1.5:4 v/v) system (Fig 2.5.3.1.3) showed the target compounds Rb1 and Rd were
separated individually with the purity of 92.5% and 95.7%, 90.3% and 95% respectively. The other
ginsenosides (Rb2, Rb3, Re, Rg1 and Rc) were co-eluted with low purity. Besides, both dynamic KD values of
target ginenosides in the two solvent systems (Table 2.5.3.1.2) were not consistent with their static KD value
measured in the tube test. The results were shown in the Table 2.5.3.1.2 and Table 2.5.3.1.3. This was probably
caused by the acid environment which leads the ginsenosides to hydrolyze and decompose. Also some acid
ginsenosides include four malonyl derivatives of the ginsenosides Rb1, Rb2, Rc, and Rd of the Panax ginseng
sample extraction were relatively unstable and are readily hydrolyzed to the corresponding ginsenosides Rb1,
Rb2, Rc, and Rd during acid environment [352]. This phenomenon was discussed and verified that the solvent
system with acid environment was not suitable for the separation of ginsenosides using HPCCC (result was
showed in the section 2.5.2.1)
Table 2.5.3.1.2 KD value of ginsenosides compounds from EtOAc/BuOH/water with 0.1% formic acid (2:2:4
v/v) solvent system
EBF(2:2:4) KD value test Static KD Dynamic KD
Rb1 0.68 1.49
Rb2 0.96 2.39
Rb3 1.15 2.86
Rc 1.23 3.54
Re 2.32 4.02
Rg1 3.02 5.13
Rd 4.13 6.31
Table 2.5.3.1.3 KD value of ginsenosides compounds from EtOAc/BuOH/water with 0.1% formic acid
(2.5:1.5:4 v/v) solvent system
EBF(2.5:1.5:4) KD value test Static KD Dynamic KD
Rb1 0.47 0.83
Rb2 0.75 1.31
Rb3 0.97 1.60
Rc 1.05 2.15
Re 2.11 2.22
Rg1 2.68 2.95
Rd 3.95 4.11

90
2.5.3.2 Application of E-B-W addition of ammonium acetate solvent system in reverse phase isocratic
elution for separation of ginsenosides in Spectrum
In order to prevent the ginsenosides from hydrolyzing and decomposing during the separation process,
ammonium acetate was selected as an additive to the solvent system. Also it could suppress emulsification. The
ethyl acetate/n-butanol/5mM aqueous ammonium acetate (2:2:4 v/v) solvent system and ethyl acetate/n-butanol/
5mM aqueous ammonium acetate (2.5:1.5:4 v/v) solvent system were collected for the separation of
ginsenosides in HPCCC. The separation conditions were: EtOAc/BuOH/water (2:2:4 v/v) and (2.5:1.5:4 v/v)
solvent systems with 5mM ammonium acetate, respectively, a reversed-phase mode, a rotation speed of 1600
rpm, a flow rate of 2.0 ml/min and temperature at 30◦C. Table 2.5.3.2.1 showed the KD values of ginsenosides
in the two EBW solvent systems with ammonium acetate and the initial stationary phase retention value
respectively. Both of their stationary phase retention values were 75.4% and 77.4%, which were higher than the
previous solvent systems and provided the better separation of ginsenosides in the Spectrum. The effects of
mobile phase flow rate and revolution speed on separation were also investigated. Ginsenoside Rb1 and Rb2
could not be separated with a high flow rate. Similarly, reducing the flow rate could improve the resolution and
stationary phase retention; however, the total time for separation would be greatly increased. Finally, a flow rate
of 2 ml/min with a revolution speed of 1600 rpm was optimized for the experiment.
Table 2.5.3.2.1 Comparison of KD value of ginsenosides with two different ratios of EBW solvent systems with
addition of ammonium acetate (v/v)
E-B-W addion of
ammonium
acetate (Ratio of
volume)
Rb1
KD
value
Rb2
KD
value
Rb3
KD
value
Rc
KD
value
Re
KD
value
Rg1
KD
value
Rd
KD
value
2:2:4 1.64 2.77 2.94 3.96 4.27 5.44 6.60
2.5:1.5:4 0.77 1.18 1.33 1.80 1.87 2.35 4.00

91
0
100000
200000
300000
400000
500000
600000
700000
0 40 80 120 160 200
Minutes
HP
LC
pea
k ar
ea
Rb1
Rb2
Rc
Rd
Rb3
Re
Rg1
Fig 2.5.3.2.1 The fractogram of ginsenosides with EtOAc/BuOH/water with 5mM ammonium acetate (2:2:4
v/v) using DE-Spectrum. Experimental conditions: Column volume: 73 ml; the reversed phase mode; Rotational
speed: 1600 rpm; Flow rate: 2.0 ml/min; Sample loop volume: 3.66 ml; Sample concentration: 12mg/ml; The Sf
was 75.4%.
Fig 2.5.3.2.2 The fractogram of ginsenosides with EtOAc/BuOH/water with 5mM ammonium acetate (2.5:1.5:4
v/v) using DE-Spectrum. Experimental conditions: Column volume: 73 ml; the reversed phase mode; Rotational
speed: 1600 rpm; Flow rate: 2.0 ml/min; Sample loop volume: 3.66 ml; Sample concentration: 12mg/ml; The Sf
was 77.4%.

92
The fractogram plot of the Spectrum CCC run with ethyl acetate–n-butanol–water with 5mM ammonium
acetate (2:2:4 v/v) solvent system (Fig.2.5.3.2.1) and ethyl acetate–n-butanol–water with 5mM ammonium
acetate (2.5:1.5:4 v/v) solvent system (Fig.2.5.3.2.2) showed that the target compounds Rb1 and Rd were
separated individually with the purity of 92.8% and 95.1%, 90% and 95.6% respectively. The ginsenosides Rb2,
Rb3, Rc and Re were overlapped and hard to separate individually. Ginsenoside Rg1 could achieve 87.6% and
86% purity but with the low yields of 56% and 48% respectively. Therefore, a new gradient method with ethyl
acetate–n-butanol–water with 5mM ammonium acetate solvent system was developed to optimize the
separation of ginsenosides in Spectrum.
2.5.3.3 Application of E-B-W addition of ammonium acetate solvent system in normal phase gradient
elution for separation of ginsenosides in Spectrum
The separation conditions were: a normal phase mode, a rotation speed of 1600 rpm, a flow rate of 2.0 ml/min
and temperature at 30◦C. Fig 2.5.3.3.1 showed the gradient elution of ginsenosides with the mobile phase (upper
phase)changing from EBW=3.5:0.5:4 to 2.5:1.5:4. It clearly shows that Rd, Rg1 and Rb1 can be separated
individually, while Re and Rc, Rb2 and Rb3 were still co-eluted and were hard to be separated. The whole run
time was less 120 minutes. This gradient elution can shorten the elution time. The Sf was 77.6%, which was
better than the isocratic elution. Therefore, all the fractions were divided into five parts as follow: part 1
included ginsenoside Rd with the purity of 96.3% and 98.6% yield, part2 includes ginsenoside Rg1 with the
purity of 88.5% and 95.8% yield; Part 3 included ginsenoside Re and Rc with the purity of 65.8% and 30.7%;
part 4 included ginsenosides Rb2 and Rb3 with purity of 86.3%; part5 was column content including ginsenoside
Rb1 with purity 93.7% and 97.4% yield. It yielded 1.60 mg of Rd, 1.14 mg of Rg1, 7.66 mg of Re and Rc, 2.12
mg of Rb2 and Rb3 and 1.89 mg of Rb1. The methylene chloride–methanol–water–isopropanol solvent system
will be used for the second step separation of fractions of part 3 and part 4.
Gradient programme:
A-upper phase of EBW with 5mM ammonium acetate (3.5:0.5:4 v/v) solvent system
B-upper phase of EBW with 5mM ammonium acetate (2.5:1.5:4 v/v) solvent system
Min A % B%
2 100 0
102 0 100

93
Fig 2.5.3.3.1 The fractogram of ginsenosides using gradient from EBW with 5mM ammonium acetate
(3.5:0.5:4 v/v) to EBW with 5mM ammonium acetate (2.5:1.5:4 v/v) using a DE-Spectrum. Experimental
conditions: Normal phase mode: lower phase of EBW with 5mM ammonium acetate (3.5:0.5:4 v/v) as
stationary phase, upper phase of EBW (3.5:0.5:4 v/v) with 5mM ammonium acetate (solvent A) and upper
phase of EBW (2.5:1.5:4 v/v) with 5mM ammonium acetate (solvent B) as mobile phase. Linear gradient: 0-2
min, hold 100% A; 2-102 min, 100%-0% A. Flow rate: 2.0 ml/min; Coil volume: 73 ml; the normal phase
mode; Rotation speed: 1600 rpm; Sample loop volume: 3.66 ml; Sample concentration: 12mg/ml; The Sf was
77.6%.
2.5.3.4 Application of DMWI (6:3:4:3 v/v/v) addition of ammonium acetate solvent system in normal
phase isocratic elution for the second separation of HPCCC fractions of part 3 and part 4 from the first
step sparation
The density of methylene chloride is greater than that of water. In this solvent system, the methylene chloride is
the lower phase and aqueous the upper phase. When the ratio of methylene chloride/methanol/water/isopropanol
(v/v/v) is 6:3:4:3 and lower phase (methylene chloride-rich layer) was used as the mobile phase, target
compound of ginenoside Re and Rc could be separated individually. Fig 2.5.3.4.1 showed the separation of
ginsenosides in this elution mode. It indicates that ginsenosides Re and Rc were separated completely with the
purity of 97.5% and 98.2% yield, 92.6% and 96.3% yield respectively . It yielded 1.76 mg of ginsenoside Re
and 1.28 mg of ginsenoside Rc. But the fraction part 4 (Rb2 and Rb3) still was not separated using this solvent
system due to they had similar structures.Thus; the next work is searching for an other solvent system to
separate the ginsenosides Rb2 and Rb3.

94
Fig 2.5.3.2.2.1 The fractogram of part 3 (ginsenoside Re and Rc) with methylene
chloride/methanol/water/isopropanol with 5mg/ml ammonium acetate (6:3:4:3 v/v/v) on Mini HPCCC.
Experimental conditions: Coil volume: 17.7 ml; the normal phase mode; Rotation speed: 2100 rpm; Flow rate:
0.5 ml/min; sample loop volume, 0.43ml, Sample concentration: 14 mg/ml; The Sf was 81%.
2.5.4 Analysis and identification of HPCCC fractions
2.5.4.1 HPLC analysis of HPCCC fractions of crude Panax ginseng
Five fractions of ginsenoside Rd, Rg1, Rb1, Re and Rc were collected after the HPCCC separation of crude
Panax ginseng sample extraction and combined after HPLC analysis. 1.60 mg of ginsenoside Rd, 1.14 mg of
ginsenoside Rg1, 1.89 mg of ginsenoside Rb1, 1.76 mg of ginsenoside Re and 1.28 mg of ginsenoside Rc were
obtained, with the purity of 96.3% and 98.6% yield, 88.5% and 95.8% yield, 93.7% and 97.4% yield, 97.5%
and 98.2% yield, 92.6% and 96.3% yield respectively. The HPLC chromatograms of the crude sample (C) and
standards (D) are shown in Fig 2.5.4.1.1. The HPLC chromatogram of purified target peaks is shown in Fig
2.5.4.1.2. The targets have the same HPLC retention time as the standards.

95
.
Fig 2.5.4.1.1 The HPLC chromatogram of crude Panax ginseng sample (C) and standards (D). The column was
an Alltima C18 column (250mm×4.6mm i.d., 5.0µm). Column temperature was 25◦C; solvent A: water; solvent
B: acetonitrile; elution gradient were as follows: The gradient elution program was as follows: 0–15 min, hold
21% B; 15–69 min, 21–38.1% B, flow rate was 1 mL/min.

96
Fig 2.5.4.1.2.HPLC chromatogram of HPCCC fractions of ginsenoside Rd, Rg1, Rb1, Rc and Re using mobile
phase consisting of water (solvent A) and acetonitrile (solvent B) at a flow rate of 1.0 ml/min. The gradient
elution program was as follows: 0–15 min, hold 21% B; 15–69 min, 21–38.1% B, flow rate was 1 mL/min.

97
2.5.4.2 Identification of HPCCC fractions by LC-MS/MS and NMR
These analyses were performed by Mr.Federico at Kingston University. For the analysis of LC-MS and LC-
MS/MS a mass spectrometer connected to a HPLC system (API 3000 LC/MS/MS), using a Grace Luna C-18
(100 ×4.6 mm 5.0µm) column was used, the experiment was performed using a binary mobile phase composed
of water solvent and Acetonitrile solvent B, the following gradient elution program was used: 0-30 min, 50-90%
B. The fraction analyzed by mass spectroscopy was Rg1 and the mass spectrometer data of ginsenoside Rg1
were 802.2.0 [M+H], 824.4 [M+Na] 784.2 [M-H2O] and 622.1 [M-Glucose] as follow Fig 2.5.4.2.1. Other
peaks were observed in the chromatogram due to impurities present in the column, however an analysis of blank
solution was performed and impurity peaks was still observed. The other spectrometric datas of the fractions of
ginsenosides Rb1, Rc, Re and Rd were given as: ginsenoside-Rb1, m/z: 1109.2 [M+H]; ginsenoside-Rc, m/z:
1080.2 [M+H]; ginsenoside-Re, m/z: 947.8 [M+H]; ginsenoside-Rd, m/z: 946.8 [M+H]. The molecular ions and
fragments agreed with the corresponding ginsenoside in the literature [353]. Besides, the target fractions have
the same HPLC retention time as the standards in the LC-MS analysis. Thus, the ginsenosides Rg1, Rb1, Rc, Re
and Rd separated from HPCCC are identified.
Fig 2.5.4.2.1 The mass spectrum data of HPCCC fraction ginsenoside Rg1
NMR was attempted for the structure identification of HPCCC fractions from crude Panax ginseng sample due
to they were separated individually by HPCCC according to the data of HPLC analysis. However, because of
the small amount of each fraction, it was not possible to get the satisfactory result from 2D-NMR analysis.

98
2.6 Conclusion
As ginsenosides easily emulsify when they are dissolved in organic solvents, two solvent systems have been
successfully developed and applied for the two step separation of ginsenosides using HPCCC. It is first time to
verify that ginsenosides are unstable in an acidic environment and using an inorganic salt for suppressing
sample emulsification. The salt chosen was ammonium acetate which is easily volatile and can be precipitated
in warm acetone for pure sample recovery.
In addition, one study systematically investigated the retention behavior of six neutral ginsenosides Rg1, Re,
Rb1, Rb2, Rc and Rd with RP-HPLC. The effects of solvent, pH value and ionic strength of the mobile phase,
were investigated using an Altima C18 column. Based on the ginsenosides retention characteristics, the
concentration of acetonitrile and the gradient of the mobile phase needed to maintain the baseline separation of
the major neutral ginsenosides in Panax ginseng were eastablished. Furthermore, the ionic strength of mobile-
phase was necessary to achieve good resolution of the neutral ginsenosides. According to the above results, a
new HPLC method has developed for the quality control of Panax ginseng. The separation of seven
ginsenosides was successfully eastablished from the crude sample.
The gradient elution and classical isocratic elution of HPCCC were combined for the preparation of
ginsenoside-Rd, Rg1, Rb1, Re and Rc from Panax ginseng with two different solvent systems. A simple
screening solvent system was successfully developed to select solvent gradients for CCC separation. The study
indicated that the settling time is a key parameter to ensure retention of the stationary phase in the column.
Ethyl acetate/butanol/water (3.5:0.5:4 v/v) and ethyl acetate/butanol/water (2.5:1.5:4 v/v) solvent system
addition of 5mM ammonium acetate salt solvent system were applied for the first step separation of
ginsenosides from Panax ginseng with gradient elution. This established gradient method not only successfully
separate three ginsenosides Rd, Rg1 and Rb1 in a short time by HSCCC, but also retained higher stationary
phase retention (77.6%) compared with other CCC methods. Ginsenosides Re and Rc were separared in a
second step separation by HPCCC with isocratic elution using methylene chloride/methanol/water/isopropanol
(6:3:4:3 v/v/v) solvent system. All fractions collected were analyzed by HPLC, and the structures of these
compounds were characterized by ESI-MS/MS. Based on the developed method, 1.60 mg of ginsenoside Rd,
1.14 mg of ginsenoside Rg1, 1.89 mg of ginsenoside Rb1, 2.12 mg of ginsenosides Rb2/Rb3, 1.76 mg of
ginsenoside Re and 1.28 mg of ginsenoside Rc were obtained from 43.92 mg crude sample extraction , with
purity of 96.3% and 98.6% yield, 88.5% and 95.8% yield, 93.7% and 97.4% yield, 86.3% and 81.7% yield,
97.5% and 98.2% yield, 92.6% and 96.3% yield respectively. The ginsenoside Rg1 was first time reported to
separate and identify from the Panax ginseng. The gradient method efficacy was significant when it was applied
for wide range of polarity compounds. Moreover, the current solvent system was used as an example and it
provided a new sight for selecting solvent gradients for CCC to purify compounds from the natural products.
The two-step CCC separation strategy was proved to be suitable for the separation of complex compounds from
herbal medicines with great advantages.

99
CHAPTER 3
Separation and quantitative
determination of salidroside and
tyrosol from Rhodiola rosea with
high-performance counter-current
chromatography

100
3.1 Aim Rhodiola rosea is a perennial herbaceous plant distributed in southwest China, including Yunnan and Sichuan
provinces as well as the Tibetan Autonomous region. As a traditional herbal remedy, Rhodiola rosea has been
used by Tibetans in many ways such as clearing heat in the lungs, eliminating toxins from the body, treating
various epidemic diseases, edema of limbs, traumatic injuries and burns [354]. Salidroside and tyrosol are the
most active ingredients of Rhodiola rosea [355]. Our purpose in the Project is developing a simple and precise
method for the qualitative and quantitative analysis of the active compounds of Rhodiola rose by CCC.
Salidroside and Tyrosol are the main target compounds for separation by HPCCC
3.2 Experimental Method and Materials
3.2.1 Apparatus Two scales of HPCCC instrument were used in this study: A) An analytical Mini-CCC from Dynamic
Extractions (Slough, UK).This instrument has a coil of 17.7mL with 0.8mm bore tubing and extra coil volume
of 0.39 ml. The revolution radius or the distance between the column axis and central axis of the centrifuge (R)
for this column is 50mm with a β value varying from 0.68 at the internal terminal to 0.79 at the external
terminal. A maximum speed was 2100rpm (240×g). A rotation speed of 2100 rpm was use in our study. B) The
preparative HSCCC instrument was the Midi-DE centrifuge. It is also a “J” type coil planet centrifuge but has
been improved with a quieter drive system capable of controlling rotation speed up to 1400 rpm (240×g) and
temperature between 25 ºC and 35 °C. The preparative column had coil volume of 455mL with 4mm bore
tubing. The distance between the column axis and the central axis of the centrifuge for these columns was 11cm
and the βvalue ranges were 0.64–0.8. A rotation speed of 1250 rpm was setin our study. Samples were analyzed
by a Waters 2695 high performance liquid chromatography (HPLC) instrument equipped with 2996 photodiode
array detector (Waters, USA). Chromatography data were collected using Empower Pro workstation (Waters,
USA). A Gemini C18 column (150 × 3.0 mm; 5 μm particle size) was supplied for the HPLC analysis
3.2.2 Chemicals and standards Rhodiola rosea was purchase from the Tibet herbal company, Qinghai (Qinghai, China). The salidroside and
tyrosol standards were from Sichuan Provincial Administration of Food and Drugs (Sichuan, China). All
analytical grade solvents (methylene chloride, methanol, butanol, and isopropanol), ammonium acetate for the
HPCCC separation and HPLC grade acetonitrile for HPLC analysis were supplied by Fisher Chemicals
(Loughborough, UK). Deionised water was prepared by a Millipore water purification system (Watford, UK).
3.2.3 Preparation of crude sample The objective of this study is to establish a method permitting the simultaneous determination of the salidroside
and tyrosol from the roots of Rhodiola rosea. Sample preparation is the first important step in the experiment,
previous investigation of Rhodiola rosea sample preparation showed that reflux exaction was more efficient

101
than ultrasonic extraction with high extraction yields but needed much more time [176] and that the high
hydrostatic pressure extraction (HHP) [178] method was best but not an easy operation. Thus, the ultrasonic
extraction method with methanol was selected as our sample preparation method due to its ease of operation
and time saving. In addition, the ultrasonic extraction temperature, the duration of ultrasonic extraction, the
ratio of methanol to water and the ratio of raw material to methanol solvent were the four main variables that
influenced the yields of extracts. This sample extraction experiment has four variables at different settings
leading to carry out many experiments. In order to get the best extraction effect of salidroside and tyrosol from
the crude sample and saving time, an orthogonal L9 (34) test design was used for optimization of the extraction
conditions as orthogonal design was used can generate a data set of several factors without testing every
combination of factor levels. Therefore, four variables at 3 different settings were selected for the ectraction
experiment and only 9 experiments need to be carried out to replace the initial 81 experiments with the same
result. The samples of Rhodiola rosea were ground into powder and dried at 60 ºC. The accurately weighed
powder (2.00 g) was placed in a 50 mL flask at room temperature, dissolved with different proportions of
methanol solution and sonicated with different time periods and temperatures based on the orthogonal design.
Subsequently the filtrate was evaporated and the residue was washed with methanol several times.The methanol
extraction was transferred to 50 mL volumetric flask and diluted to 50 ml with methanol. A 1ml sample solution
was taken to 10ml volumetric flask and dilute to 10ml with methanol. Prior to HPLC analysis, the sample
solution was passed through a 0.45 µm membrane filter.
3.2.3.1 Preparation of standard curve
Accurately weighed standards of salidroside and tyrosol (4.0mg) were placed in a 50 mL volumetric flask at
room temperature, dissolved and sonicated with 20 mL of 100% methanol for 30 minutes, and then diluted to 50
ml with methanol. Linearity was established by injection of 3 µL, 5 µL, 7 µL, 9 µL, 11 µL, 13 µL of the
standard of salidroside solutions of six different injections with six replicates and 2µL, 4 µL, 6 µL, 8µL, 10 µL,
12 µL of the standard of tyrosol solutions. Calibration graphs were plotted subsequently based on linear
regression analysis of the integrated peak (Y) versus injection amount (X µg).
3.2.3.2 Orthogonal L9 (34) test design
The variables levels for the orthogonal L9 (34) test design are shown in the Table 3.2.3.2.1. According to the
extraction effect of salidroside, four variables of extraction were selected: the ultrasonic extraction temperature,
the duration of ultrasonic extraction, the ratio of methanol to water and the ratio of methanol solvent to raw
material, each variable has three different levels. 9 experiments were carried out following the orthogonal L9
(34) test design table (Table 3.2.3.2.2) to find out the best parameters for extraction.

102
Table 3.2.3.2.1 Orthogonal design L9 (34) variables level of salidroside and tyrosol extraction
level
variables
1 2 3
A: ultrasonic extraction temperature(ºC) 20 40 60
B: duration of ultrasonic extraction(min) 10 30 60
C: ratio of methanol to water (%) 10 50 90
D:ratio of sample to methanol solvent(g/ml) 1:10 1:20 1:30
Table 3.2.3.2.2 Orthogonal design L9 (34) table of salidroside and tyrosol extraction
variables
level
number of
expriment
A(ºc) B(min) C(%) D (g/ml) salidroside
1 2 3 4 content
mg/g
1
2
3
4
5
6
7
8
9
1(20) 1(10) 1(10) 1(1:10)
1(20) 2(30) 2(50) 2(1:20)
1(20) 3(60) 3(90) 3(1:30)
2(40) 1(10) 2(50) 3(1:30)
2(40) 2(30) 3(90) 1(1:10)
2(40) 3(60) 1(10) 2(1:20)
3(60) 1(10) 3(90) 2(1:20)
3(60) 2(30) 1(10) 3(1:30)
3(60) 3(60) 2(50) 1(1:10)
3.2.4 Selection procedure of solvent system The CCC technique uses a two-phase solvent system made of a pair of mutually immiscible solvents, one used
as the stationary phase and the other as the mobile phase. The use of two-phase solvent systems allows one to
choose solvents from an enormous number of possible combinations. The selection of this two-phase solvent
system for the target compounds is the most important and first step in CCC. Moreover, a suitable partition
coefficient (KD) of target compound in the two-phase solvent systems is most important as well because a KD
value of close to one is generally considered to be the ideal system for separating that compound with optimal
resolution. The partition coefficients KD =CU/CL, where CU is the solute concentration in the upper phase and
CL, that of the lower phase. The main purpose in this experiment is to find suitable solvent systems with KD
values of the target compounds salidroside and tyrosol in the appropriate range (0.5≤ KD≤2.0.). Therefore, it is a
critical and important step to find the suitable solvent system for the separation of salidroside and tyrosol from
the crude sample. Four kinds of solvent system selected to test the partition coefficient for the target
compounds. HEMWat solvent systems were selected as the first solvent system to test.
1, The HEMWat solvent systems comprised of heptane/ethyl acetate/methanol/butanol/water (Table 3.2.4.1). A
set of HEMWat solvent systems (No1 –No28) is arranged from the top to the bottom according to a decreasing
order of the polarity of their organic phases (Table 3.2.4.1). When the polarity of the target compounds are
unknown, the search first start at No17 heptane/ethyl acetate/methanol/water (1:1:1:1, v/v/v), because their

103
volume ratio are equal .A set of solvent systems is arranged from the top to the bottom according to a
decreasing order of the hydrophobicity of their organic phases. No2, 5, 7, 8, 12, 17, 22, and 27 have been
selected systematically to test the KD value as comparison.
2. The terAcWat solvent systems comprised of the methyl tert-butyl ether /acetonitrile/water (Table 3.2.4.2)
No7 with 0.1%TFA in water, No7 and No7 with 1% NH3OH in water have been selected to test the target
compounds KD value because the No7 solvent system shows the more hydrophilic effect of organic phase. Their
solvent pH values are increasing gradually. (Table 3.2.4.3)
3. In order to adjust the range of the methyl tert-butyl ether/ acetonitrile/water solvent system family to include
more hydrophilic compounds, a solvent system family was developed by adding butanol as a fourth solvent
based on the ratio of methyl tert-butyl ether / acetonitrile/water(4:6:10) (Table 3.2.4.4 ).
4. The ChMWat solvent systems comprised of the chloroform/methanol/water, which is suitable for the polarity
compounds such as Salidroside and Tyrosol. Butanol or isopropanol solvent also usually added to the ChMWat
solvent system to adjust the polarity of solvent system (Table 3.2.4.5).
Table 3.2.4.1 System numbering and solvent composition of the Heptane / EtOAc / MeOH/ Butanol/ Water
(v/v/v) solvent system
No Heptan
e EtOAc MeOH Butanol Water
1 0 0 0 5 5
2 0 1 0 4 5
3 0 2 0 3 5
4 0 3 0 2 5
5 0 4 0 1 5
6 0 1 0 0 1
7 More 1 19 1 0 19
8 Polar 1 9 1 0 9
9 1 6 1 0 6
10 1 5 1 0 5
11 1 4 1 0 4
12 1 3 1 0 3
13 2 5 2 0 5
14 1 2 1 0 2
15 2 3 2 0 3
16 5 6 5 0 6
17 Entry 1 1 1 0 1
18 Point: 6 5 6 0 5
19 3 2 3 0 2
20 2 1 2 0 1
21 5 2 5 0 2
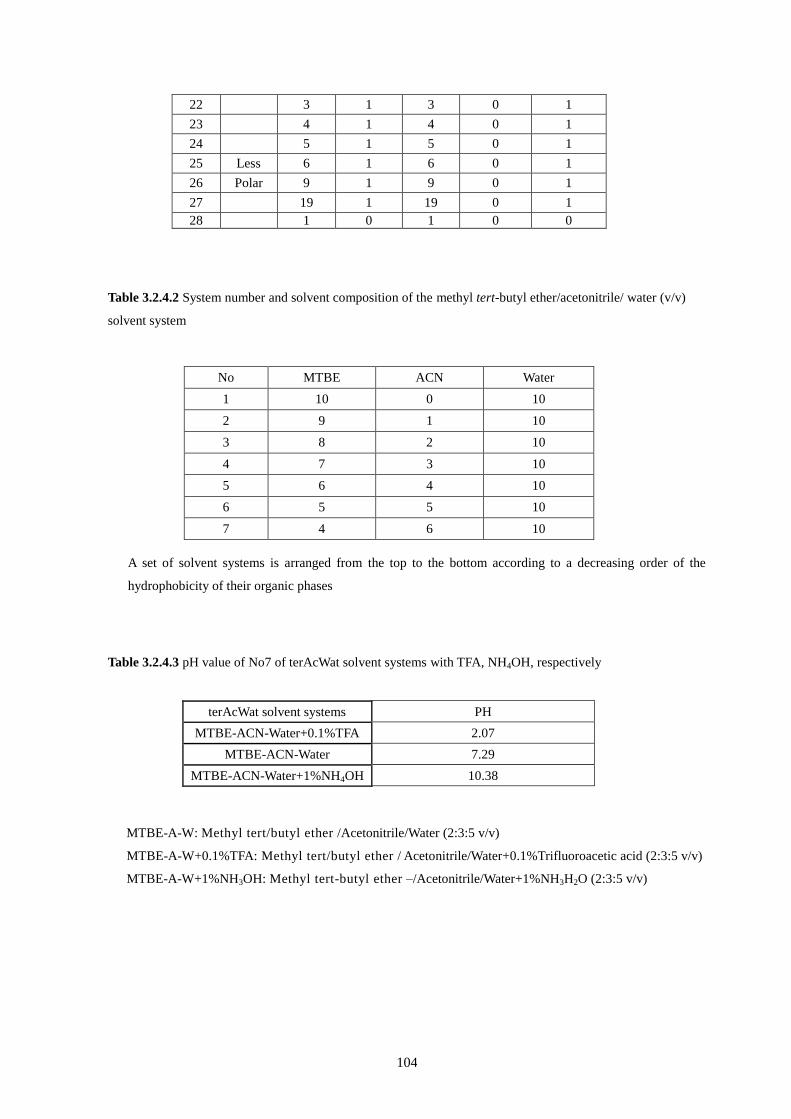
104
22 3 1 3 0 1
23 4 1 4 0 1
24 5 1 5 0 1
25 Less 6 1 6 0 1
26 Polar 9 1 9 0 1
27 19 1 19 0 1
28 1 0 1 0 0
Table 3.2.4.2 System number and solvent composition of the methyl tert-butyl ether/acetonitrile/ water (v/v)
solvent system
No MTBE ACN Water
1 10 0 10
2 9 1 10
3 8 2 10
4 7 3 10
5 6 4 10
6 5 5 10
7 4 6 10
A set of solvent systems is arranged from the top to the bottom according to a decreasing order of the
hydrophobicity of their organic phases
Table 3.2.4.3 pH value of No7 of terAcWat solvent systems with TFA, NH4OH, respectively
terAcWat solvent systems PH
MTBE-ACN-Water+0.1%TFA 2.07
MTBE-ACN-Water 7.29
MTBE-ACN-Water+1%NH4OH 10.38
MTBE-A-W: Methyl tert/butyl ether /Acetonitrile/Water (2:3:5 v/v)
MTBE-A-W+0.1%TFA: Methyl tert/butyl ether / Acetonitrile/Water+0.1%Trifluoroacetic acid (2:3:5 v/v)
MTBE-A-W+1%NH3OH: Methyl tert-butyl ether –/Acetonitrile/Water+1%NH3H2O (2:3:5 v/v)

105
Table 3.2.4.4 System number and solvent composition of the methyl tert-butyl ether /butanol/acetonitrile/ water
(v/v/v) solvent system
No MTBE Butanol ACN Water
1 4 2 4 10
2 4 4 2 10
Table 3.2.4.5 System number and solvent composition of the methylene chloride/methanol/water/isopropanol
(v/v/v) solvent system
No Methylene chloride Methanol Water Isopropanol
1 5 6 4 1
2 5 6 4 2
3 5 5 4 1
4 6 6 4 1
5 6 2 4 3
6 6 3 4 3
3.2.5 Measurement of partition coefficient and settling time In the present study, the partition coefficients (KD) for the target compounds were measured by HPLC as
follows. Each selected solvent systems were prepared and equilibrated in a test tube. An equal volume of upper
and lower phases (600μl) was then dispensed into a HPLC vial with a pipette. Approximately 6mg of crude
sample was dissolved in equal volumes of aqueous and organic phases respectively.. After the distribution
equilibrium was established, an equal volume of upper and lower phases (400µL) each was transferred into a
separate vial and solvents removed at 30 ºC under vacuum conditions. Then 1ml of 100% methanol was added
to solubilise the remaining contents of the vial. Afterwards, both upper (aqueous phase) and lower (organic
phase) were analyzed separately by HPLC. The partition coefficient was defined as KD = Aupper/Alower, where
Aupper and Alower were target compound HPLC peak areas in the upper and lower phases respectively
The settling time, which gives an indication of how well the stationary phase is retained in the column, was
expressed as the time for a clear layer between the two phases to be formed when each phase was mixed in the
ratios.
3.2.6 Preparation of two-phase solvent system and sample solution
A solvent system was used for the CCC separation. Each component of the solvent systems was added to a
separatory funnel and thoroughly equilibrated for 30 min at room temperature. The upper phase and the lower
one were separated and degassed by sonication for 30 min shortly before use. Sample solutions were prepared
by dissolving 20.0mg crude sample in 400µl mobile phase (lower phase) of the solvent system

106
3.2.7 CCC separation procedure
The solvent system, containing the chosen ratios of methylene chloride, methanol, water and isopropanol was
prepared, equilibrated and separated shortly before CCC separation. 20mg of crude sample was dissolved in
400µL of mobile phase (lower phase). In each HPCCC preparative separation run, the coil was filled with the
stationary phase (upper phase) in the head to tail mode. Then the mobile (lower) phase was pumped into the coil
at a flow rate of 0.5 mL/min with a centrifuge rotational speed of 1600rpm at 25 ˚C. When hydrodynamic
equilibrium was established, the sample solution was injected into the coil through a 0.43mL sample loop. The
eluent was continuously monitored by connecting the tail outlet of the coiled column with Waters 996
photodiode array detector. Each peak fraction was collected according to the elution profile and analyzed by
HPLC. After the separation was completed, retention of the stationary phase was measured by collecting the
column contents by forcing them out of the column with pressurized nitrogen gas.
3.2.8 HPLC analysis and identification of HPCCC fractions
The HPLC system consisted of a Waters Alliance 2695 HPLC system, equipped with a 996 photodiode array
detector (Waters Corp., Milford, MA, USA). A computerized data station was equipped with Waters Empower 2
software. A Gemini C18 column (150 × 3.0 mm; 5 μm particle size) from Phenomenex was used as the
stationary phase and the temperature was maintained at 50°C. The mobile phase consisted of acetonitrile
(0.05% phosphoric acid) (C) and water (0.05% phosphoric acid) (D), at a flow rate of 0.5 mL/min. Analysis was
performed using the following gradient elution: 5% C /95% D to 19% C /81% D/for 30 min then hold for 5 min.
Each run was followed by a 5 min wash with 98% C and an equilibration period of 15 min. The detection
wavelengths were from 190 to 400 nm. The purified Salidroside and Tyrosol were identified using commercial
reference standard on HPLC.
3.3 Results and discussion
3.3.1 Method validation
The analytical method described above was used to analyze the Rhodiola rosea samples. This method was
validated for its specificity, linearity, precision, and accuracy, limit of detection (LOD) and limit of
quantification (LOQ) with the following results.The retention times and the UV spectra of the eluted
components from the samples agreed well with those of the standards indicating the identity and purity of the
peaks eluted from the samples. Therefore, the specificity of the method was validated.
For quantification of salidroside and tyrosol, calibration curves were constructed and tested for linearity. The
plot of peak area (Y) against the concentration (X, µg) was evaluated using linear regression analysis. The

107
regression equations and correlation coefficients (R2) of salidroside and tyrosol were derived as Y=5*10
6X-
13606 (n=6, R2= 0.9998, 0.024-0.104µg) and Y=9*10
6X (n=6, R
2 = 0.9992, 0.016-0.096 µg), respectively. The
limit of detection (LOD), defined as the lowest sample concentration which can be detected (S/N > 3), was 2.25
ng for salidroside and 1.41ng for tyrosol, and the limit of quantification (LOQ), defined as the lowest sample
concentration which can be quantitatively determined with suitable precision and accuracy (S/N > 10), was 7.52
ng for salidroside and 4.70 ng for tyrosol (R.S.D < 10%). The regression equations, correlation coefficients, and
linear ranges for the salidroside and tyrosol are shown in Table 3.3.1.1. The limits of detection (LOD) and
quantification (LOQ) were determined at a signal-to-noise ratio (S/N) of 3 and 10. The results are also
summarized in Table 3.3.1.1.
Table 3.3.1.1 Calibration curves, linear range, limit of detection, limit of quantification (n = 6) and system
precision data (n = 5) for the standards of salidroside and tyrosol
Compounds Salidroside Tyrosol
Linear regressiona y=5*10
6x-13606 y=9*10
6x
Lrb µg 0.024-0.104 0.016-0.096
R2
0.9998
0.9993
LODc ng 2.25 1.41
LOQd ng 7.52 4.70
Peak areae 490052±5744 969849±11555
RSD% 1.19 1.17
a: In the regression equation, the X value is the concentration of analytes (µg); the Y value is the peak area
b: Linear range (µg)
c: Limit of detection (ng)
d: Limit of quantification (ng)
e: Mean ± SD
Orthogonal design L9 (34) experiment result and analysis
Table 3.3.1.2 Orthogonal design L9 (34) table and results of salidroside and tyrosol extraction
row
level
number of expriment
A (ºc) B (min) C (%) D (g/ml) salidroside
1 2 3 4 content
mg/g
1
2
3
4
5
6
7
8
9
The mean 1
The mean 2
The mean 3
Range(Rj)
Sj
1(20) 1(10) 1(10) 1(1:10) 11.5
1(20) 2(30) 2(50) 2(1:20) 23.3
1(20) 3(60) 3(90) 3(1:30) 28.4
2(40) 1(10) 2(50) 3(1:30) 16.0
2(40) 2(30) 3(90) 1(1:10) 15.3
2(40) 3(60) 1(10) 2(1:20) 19.4
3(60) 1(10) 3(90) 2(1:20) 21.4
3(60) 2(30) 1(10) 3(1:30) 14.1
3(60) 3(60) 2(50) 1(1:10) 8.30
21.1 16.3 15.0 11.7 T=157.7
16.9 17.6 15.9 21.4
14.6 18.7 21.7 19.5
6.50 2.40 6.70 9.70
6.90 1.20 8.30 16.2 ST=32.7

108
Table 3.3.1.3 Analysis of variance with orthogonal L9 (34) test design of salidroside and tyrosol extraction
Variance
source Sj fj
j
j
S
f F=
j e
e
S S
fj f Significance
A 6.9 2 3.4 5.67 F0.10(2,4)> FA>F0.25(2,4)
B 1.2 2 0.6 1
C 8.3 2 4.15 6.92 F0.05(2,4)> FC>F0.10(2,4)
D 16.2 2 8.1 13.5 F0.01(2,4)> FD>F0.05(2,4)
e 1.2 2 0.6
From the range value in Table 3.3.1.2, it showed that the Rj value order effect on parameters of salidroside
extraction order is D (9.7) > C (6.7) > A (6.5) > B (2. 4), hence, the effect on parameters of salidroside
extraction order is D > C > A > B, the best parameters arranged as: D2 C3 A1 B3. Thus, the best parameters of
sample extraction are following as: the ratio of raw material to methanol solvent: 1:20, the ratio of methanol to
water: 1:9, the ultrasonic extraction temperature: 20 ºC and the duration of ultrasonic extraction: 60 minutes. It
was also validated that the ratio of raw material to methanol solvent and the ratio of methanol to water were the
most significance parameters of the salidroside and tyrosol extraction according to the analysis of variance with
the orthogonal L9 (34) test. The result is shown in the Table 3.3.1.3. The significant test result shows the FD is
13.5 based on the above F test. It is bigger than the F0.05 (2, 4), which is 6.94, but less than the F0.01 (2, 4), which
is 18. Thus, FD can be expressed as: F0.01 (2, 4)> FD>F0.05 (2, 4), Similarly, The FC can be expressed as F0.05 (2,
4)> FC>F0.10 (2, 4) and F0.10 (2, 4)> FA>F0.25 (2, 4). It was demonstrated that factor D or the parmater of the ratio
of raw material to methanol solvent has the highest significant in this experiment, which is consistent with the
perivous experiment result. Therefore, this method for salidroside extraction is validated.
Stability of extraction process experiment
In order to investigate the reproducibility of the optimized extraction process, the extraction process experiment
was validated by injecting a pulverized samples solution six times to analyze the content of salidroside and
tyrosol from the Rhodiola rosea sample 1.0 g pulverized samples of Rhodiola rosea were extracted as describes
above and repeated 6 times. The RSD value of the retention time and peak areas were used to evaluate
precision. The result is shown in Table 3.3.1.4. The results of the experiments are equal to or better than any
other group of orthogonal experimental, indicating that the optimized extraction process is stable and feasible.
Table 3.3.1.4 result of stability experiment of salidroside and tyrosol extraction process
No Salidroside mg/g Tyrosol mg/g
1 31.20 13.78
2 31.62 13.95
3 30.86 13.95
4 31.89 14.02
5 31.19 13.48
6 31.16 13.54
Average 31.32 13.79
RSD% 1.18 1.67

109
Recovery
The recovery tests were studied by spiking a known quantity of the two references to 0.2 g of the pulverized
samples of Rhodiola rosea. Weight accurately six parts of Rhodiola rosea sample, each part was 0.2g. Then,
1mg standards of salidroside and tyrosol respectively were added. The samples were then extracted and
analyzed as described above. The recovery values were obtained by comparing the results from samples and
fortified samples. As a result, the recoveries of salidroside were satisfactory between 98.9–101.57% with RSD
1.02% for all analytes. The recoveries of tyrosol were satisfactory between 95.95–100.18% with RSD 1.82% for
all analytes. The results are shown in the Table 3.3.1.5 and Table 3.3.1.6
Table 3.3.1.5 Recovery of salidroside from Rhodiola rosea sample (n=6)
Added ug/g Founded ug/g Recovery % Mean of recovery% RSD%
1000 988.99 98.90
1000 998.87 99.89
1000 1014.94 101.49 100.46 1.02
1000 1015.68 101.57
1000 1001.52 100.15
1000 1007.42 100.74
Table 3.3.1.6 Recovery of tyrosol from Rhodiola rosea sample (n=6)
Added ug/g Founded ug/g Recovery % Mean of recovery % RSD%
1000 960.47 96.05
1000 959.50 95.95
1000 1001.80 100.18 97.96 1.82
1000 986.68 98.67
1000 995.17 99.52
1000 974.10 97.41
Precision
The precision of the chromatographic system was validated by injecting a mixed reference solution six times
during one day. The RSD value of the retention time and a peak area was used to evaluate precision. The data
showed a high precision of the system with an RSD <3%. The results are also shown in Table 3.3.1.1
The method precision was evaluated by intra-day and inter-day tests. Intra-day experiments were performed by
replicate analysis of six aliquots of the same sample within one day. Inter-day tests were carried out on three
consecutive working days in the same way as intra-assay experiments with newly prepared mobile phase and
samples. The RSD of intra- and inter-day precision was less than 2% for all compounds. The precision of the
analytical method was excellent. The results are shown in Table 3.3.1.7
Table 3.3.1.7 Intra-day (n = 6) and inter-day (n = 6) precision of the standards of Salidrosides and Tyrosol
.
Analytes Peak area RSD%
Intra-day Inter-day
Salidrosides 1.54 1.89
Tyrosol 1.11 1.24

110
3.3.2 Selection of two-phase solvent system
3.3.2.1 HEMWat solvent systems
Table 3.3.2.1.1 show the KD value result for the salidroside and tyrosol compounds using HEMWat solvent
systems, the KD values in ethyl acetate/butanol/water (4:1:5 v/v) and ethyl acetate/butanol/water (4.5:0.5:5 v/v)
solvent system are better than others, which signify the salidroside and tyrosol compounds easy distribute to the
organic phase. The KD value of salidroside and tyrosol compounds between ethyl acetate/butanol/water solvent
system with ratio of 4:1:5 and 4.5:0.5:5 could be in the appropriate range 0.5 to 2.0. If the partition coefficient is
slightly off from the appropriate range, it can be adjusted upwards by modifying the HEMWat number to
become more polar and downwards by making the HEMWat number more hydrophobic. The search should be
continued until a suitable range of KD values for all of the compounds of interest are obtained. But the next
search for the ethyl acetate/butanol/water solvent system with ratio of 4:1:5 to 4.5:0.5:5 is unsuccessful for the
both salidroside and tyrosol compounds.
Table 3.3.2.1.1 KD value of Salidroside and Tyrosol compounds from HEMWat solvent systems
Heptane/EtOAc/MeOH/Butanol/Water
solvent systems (v/v/v/v) SKD TKD
0:1:0:4:5 2.71 9.51
0:4:0:1:5 2.08 5.37
0:4.5:0:0.5:5 0.130 1.712
1:19:1:0:19 0.018 1.24
1:9:1:0:9 0.044 1.41
1:3:1:0:3 0.007 0.614
1:1:1:0:1 0.0137 0.0656
3:1:3:0:1 0.0024 0.0049
19:1:19:0:1 0.0004 0.0011
SKD stands for Salidroside KD, TKD stands for Tyrosol KD.
3.3.2.2 terAcWat solvent system
The terAcWat solvent system targets compounds of moderate hydrophobic to hydrophilic polarity, If the target
compound distributes more to the aqueous phase of butanol/water in the EBuWat solvent system , the search
can apply the terAcWat solvent system and even add some acids such as TFA or some base such as NH4OH to
modify the pH value of the terAcWat solvent system. Since these acidic analyses have two molecular forms,
protonated (COOH) and deprotonated (COO−), each having a different KD value, they form a broader peak
when partly ionized. Therefore, the use of an acidic modifier to the solvent system is recommended. Also,
adding the acid (typically 0.1% TFA) to the solvent system often substantially shortens the settling time,
improving retention of the stationary phase. Moreover, No.7 of terAcWat solvent system (MTBE/ACN/Water
4:6:10 v/v) is the biggest of the hydrophilic and polarity. Therefore, No.7 terAcWat solvent system
(MTBE/ACN/Water 4:6:10 v/v) and No.7 terAcWat solvent system (MTBE/ACN/Water 4:6:10 v/v) with
0.1%TFA in water and No.7 terAcWat solvent system (MTBE/ACN/Water 4:6:10 v/v) with 1% NH4OH in
water have been selected to test the target compounds KD value. The KD values of salidroside and tyrosol

111
compounds from the three solvent systems were showed in the Table3.3.2.2.1. It indicates that the three solvent
systems are suitable for separation of tyrosol but not suitable for the separation of salidroside due to their KD
values was less than 0.5.
Table 3.3.2.2.1 KD value for Salidroside and Tyrosol compounds from different pH value of No.7 terAcWat
solvent system (MTBE/ACN/Water 4:6:10 v/v)
terAcWat solvent systems SKD TKD
MTBE/ACN/Water+0.1%TFA 0.184 1.55
MTBE/ACN/Water 0.274 1.62
MTBE/ACN/Water+1%NH3OH 0.23 2.1
SKD stands for KD of salidroside, TKD stands for KD of tyrosol.
Thus, in order to find a suitable solvent system for separation of both salidroside and tyrosol compounds,
butanol can be added in based on the No.7 terAcWat solvent system (MTBE/ACN/Water 4:6:10 v/v) to adjust
the hydrophilic polarity of organic phase due to the butanol is considered to be an organic modifier since it is
miscible with t-butylmethylether, but only somewhat miscible with water. In general, KD increased as the ratio
of n-butanol relative to acetonitrile increases. Based on the KD value of salidroside and tyrosol compounds
from MTBE/ Butanol/ACN/Water (v/v/v) solvent systems (Table 3.3.2.2.2), the solvent system
MTBE/Butanol/ ACN /Water (4:2:4:10 v/v/v) is suitable for separation of salidroside and tyrosol only the KD
value of tyrosol is little bigger than 2.0.
Table 3.3.2.2.2 KD value of salidroside and tyrosol compounds from MTBE/ Butanol/ACN/Water (v/v/v)
solvent systems
No MTBE Butanol ACN Water SKD TKD Settling time
1 4 2 4 10 0.55 2.45 15s
2 4 4 2 10 0.53 2.82 15s
3.3.2.3 Methylene chloride–methanol–water–isopropanol solvent system
DMWI(5:6:4:1 v/v/v) with 5mg/ml ammonium acetate solvent system was selected as the two phase solvent
system for the separation of Salidroside and Tyrosol compounds according to the literature review. Based on the
result of Table 3.3.2.3.1, KD value of tyrosol is available for the CCC separation. Increasing or decreasing the
ratio of methanol composition result in increasing the KD value of both salidroside and tyrosol compounds, but
it is hard to adjust both the KD values of salidroside and tyrosol compounds between 0.5 to 2.0. However,
increasing the proportion of isopropanol to 2 as DMWI (5:6:4:2 v/v/v) solvent system can decrease the KD value
of salidroside and tyrosol compounds to between 0.5 to 2.0 due to the compounds being well dissolved in the
lower isopropanol layer of the two phase system. However, the retention of stationary phase (upper phase) with
DMWI (5:6:4:2 v/v/v) solvent system using analytical Milli-CCC was too low to get the good separation result
since the increasing the isopropanol composition to the solvent system resulted in increasing the viscosity of the
two phases. Therefore, DMWI (5:6:4:1 v/v/v) with 5mg/ml ammonium acetate solvent systems were selected to

112
test the KD value of salidroside and tyrosol.
Table 3.3.2.3.1 KD value of Salidroside and Tyrosol compounds from methylene
chloride/methanol/water/isopropanol (v/v/v) with 5mg/ml ammonium acetate solvent systems
No Methylene
chloride
Methanol Water Isopropanol
S KD T KD Settling
time Ratio
1 5 6 4 1 3.15 1.42 20s 1:1
2 5 6 4 2 1.69 1.10 45s 2:1
3 5 5 4 1 4.84 1.73 18s 1:1
4 6 6 4 1 5.45 1.87 15s 1:1
5 6 2 4 3 3.50 0.96 40s 2:1
3.3.3 HP CCC separation of salidroside and tyrosol
3.3.3.1 Analytical HPCCC
3.3.3.1.1 Application of terAcWat (4:6:10) solvent system in reversed phase isocratic elution for
separation of salidroside and tyrosol
According to the previous discussion of terAcWat solvent system, terAcWat (4:6:10 v/v) solvent system can be
selected as solvent system for the separation of salidroside and tyrosol. In this reverse phase elution mode,
organic phase was chosen to be stationary phase and aqueous phase to be mobile, According to the partition
coefficients in shake tests, polar compounds will first be eluted. In this elution mode, salidroside and tyrosol can
be easily eluted. Fig.3.3.3.1.1 showed that salidroside eluted so fast in 40 minutes because the KD value of
salidroside was only 0.274 less than 0.5, tyrosol eluted between 60 to 80 minutes, which was consistent with the
tube test. The Sf% was 66%. HPLC analytical results showed that the purities of components salidroside and
tyrosol could reach 85% and 88%.Table 3.3.3.3.1.1.1 showed the initial Sf, purity and yield of salidroside and
tyrosol in the Mini HPCCC separation with reversed phase mode.
Table 3.3.3.1.1.1 the initial Sf, purity and yield of salidroside and tyrosol with reversed phase mode in the Mini
HPCCC separation using MTBE/ACN/water (4:6:10, v/v) solvent system.
Compound Purity % Yield % Sf %
Salidroside 85 99 66
Tyrosol 88 98

113
Fig 3.3.3.1.1.1 Separation chromatograms of the crude sample Rhodiola rosea extract in Mini HPCCC.
Separation conditions were: coil volume 17.7ml; sample loop volume 0.43ml; Solvent system,
MTBE/ACN/water (4:6:10, v/v) solvent system ; reversed phase model ; flow-rate, 0.50 ml/min; revolution
speed, 2100 rpm; temperature at 25ºC; sample concentration , 50mg/ml; The Sf was 66%.
Fig 3.3.3.1.1.2 The fractogram of the separation of salidroside and tyrosol from the crude sample Rhodiola
rosea extract in the Mini-HPCCC centrifuge. Separation conditions were: coil volume 17.7ml,sample loop
volume 0.43ml; Solvent system, MTBE/ACN/water (4:6:10, v/v) solvent system ; reversed phase model ; flow-
rate, 0.50 ml/min; revolution speed, 2100 rpm; temperature at 25ºC; sample concentration, 50mg/ml; The Sf was
66%.

114
3.3.3.1.2 Application of methylene chloride/methanol/water/isopropanol (5:6:4:1 v/v/v) solvent system
with 5mg/ml ammonium acetate in normal phase isocratic elution for separation of Salidroside and
Tyrosol
DMWI solvent systems is very popular solvent system for separation of polar compounds from natural
production by HSCCC, This type of system is particularly good for the fractionation of root extracts as it
provides a good solubility for saponin-like compounds and a gradual polarity change between phases can be
obtained by varying the methanol ratio or isopropanol ratio in the system. The normal phase elution mode can
prevent the sample wash off and fast target compounds elution in the low resolution. Fig 3.3.3.1.2.1 showed the
tyrosol eluted between 40 to 60 minutes with good sharp peak. But the salidroside eluted in long time case the
peak broad. The Sf% was 88%. HPLC analytical results showed that the components salidroside and tyrosol are
not very pure and their purities were 79 % and 83%, respectively. The results are shown in the Fig 3.3.3.1.2.2,
which was the fractogram of fractions from the separation of crude sample of Rhodiola rosea in Mini HPCCC.
Also the table 3.3.3.1.2.1 showed the initial Sf, purity and yield of salidroside and tyrosol in the Mini HPCCC
separation with normal phase mode.
Table 3.3.3.1.2.1 the initial Sf, purity and yield of salidroside and tyrosol with normal phase mode in the Mini
HPCCC separation using methylene chloride/methanol/water/isopropanol (5:6:4:1, v/v/v) solvent system.
Compound Purity % Yield % Sf %
Salidroside 79 99 88
Tyrosol 83 98
Fig 3.3.3.1.2.1 Separation chromatograms of the crude sample Rhodiola rosea extract in Mini HPCCC.
Separation conditions were: coil volume 17.7ml; sample loop volume 0.43ml; Solvent system, methylene
chloride/methanol/water/isopropanol (5:6:4:1, v/v/v); normal phase model ; flow-rate, 0.50ml/min; revolution
speed, 2100 rpm; temperature at 25ºC; sample concentration, 50mg/ml; The Sf was 88%.

115
Fig.3.3.3.1.2.2 The fractogram of the separation of salidroside and tyrosol from the crude sample Rhodiola
rosea extract in the Mini-HPCCC centrifuge. Separation conditions were: coil volume 17.7ml,sample loop
volume 0.43ml; Solvent system, methylene chloride/methanol/water/isopropanol (5:6:4:1, v/v/v); normal phase
model; flow rates, 0.5 ml/min; revolution speed, 2100 rpm; temperature at 25ºC; sample concentration,
50mg/ml; The Sf was 88%.
3.3.3.1.3 Application of MTBE/Butanol/ACN/Water (4:2:4:10 v/v/v) solvent system in reversed phase for
separation of Salidroside and Tyrosol
Based on the KD study result of the MTBE/Butanol /ACN/water (4:2:4:10 v/v/v) solvent system, adding butanol
to terAcWat solvent system can help to increase the hydrophilic polarity of organic phase, which would lead to
an increase of KD value of target compounds. Also the settling time of this solvent system is only 15 seconds,
shorter than other potential solvent systems, which would provide more satisfactory retention of the stationary
phase. Fig.3.3.3.1.3.1 shows that salidroside and tyrosol eluted fast in 90 minutes with good resolution. The Sf
% was 60%. HPLC analytical results (Fig.3.3.3.1.3.2) showed that the purities of salidroside and tyrosol
components could reach 92 % and 95%, respectively. Table 3.3.3.1.3.1 showed the Sf, purity and yield of
salidroside and tyrosol with reverse phase mode. Also the normal phase mode has been investigated in the Mini-
HPCCC with the same separation conditions. Fig3.3.3.1.3.3 showed that the tyrosol and salidroside eluted in 70
minutes. The Sf % was 70%, which was better than the reversed phase mode. But the purities of tyrosol and
salidroside were 83% and 90% (Fig.3.3.3.1.3.4), respectively, because the compound tyrosol eluted faster than
other peaks. Table 3.3.3.1.3.2 showed the Sf, purity and yield of salidroside and tyrosol with the normal phase
mode.

116
Table 3.3.3.1.3.1 the initial Sf, purity and yield of salidroside and tyrosol with reversed mode in the Mini
HPCCC separation using MTBE/butanol/ACN/water (4:2:4:10 v/v/v) solvent system.
Compound Purity % Yield % Sf %
Salidroside 92 98 60
Tyrosol 95 98
Fig.3.3.3.1.3.1. Separation chromatograms of the crude sample Rhodiola rosea extract in Mini-HPCCC
centrifuge with the reversed phase mode. Separation conditions were: coil volume 17.7ml; sample loop volume
0.43 ml; Solvent system, MTBE/butanol/ACN/water (4:2:4:10 v/v/v) solvent system; flow-rate, 0.5ml/min;
revolution speed, 2100 rpm; temperature at 25ºC; sample concentration, 50mg/ml; The Sf was 60%.
0
500000
1000000
1500000
2000000
2500000
3000000
3500000
4000000
4500000
0 20 40 60 80 100
Minutes
HP
LC
Are
a v
alu
e
Salidroside
Contamination1
Contamination2
Contamination3
Tyrosol
Contamination4
Contamination5
Fig.3.3.3.1.3.2 The fractogram of the crude sample of Rhodiola rosea obtained with the reversed phase mode in
the Mini-HPCCC centrifuge. Separation conditions were: coil volume 17.7ml,sample loop volume 0.43ml;
Solvent system, MTBE/butanol/ACN/water (4:2:4:10 v/v/v) solvent system; flow rates, 0.5 ml/min; revolution
speed, 2100 rpm, temperature at 25ºC; sample concentration, 50mg/ml; The Sf was 60%.

117
Table 3.3.3.1.3.2 the initial Sf,, purity and yield of salidroside and tyrosol with normal phase mode in the Mini
HPCCC separation using MTBE/butanol/ACN/water (4:2:4:10 v/v/v) solvent system.
Fig.3.3.3.1.3.3 Separation chromatograms of the crude sample Rhodiola rosea extract in Mini HPCCC with the
normal phase mode. Separation conditions were: coil volume 17.7ml; sample loop volume 0.43 ml; Solvent
system, MTBE/butanol/ACN/water (4:2:4:10 v/v/v) solvent system; flow-rate, 0.5ml/min; revolution speed,
2100 rpm, temperature at 25ºC; sample concentration, 50mg/ml; The Sf was 70%.
Fig.3.3.3.1.3.4 The fractogram of the separation of salidroside and tyrosol from the crude sample Rhodiola
rosea extract in the Mini-HPCCC centrifuge with the normal phase mode. Separation conditions were: coil
volume 17.7ml,sample loop volume 0.43ml; Solvent system, MTBE/butanol/ACN/water (4:2:4:10 v/v/v)
solvent system; flow rates, 0.5 ml/min; revolution speed, 2100 rpm, temperature at 25ºC; sample concentration,
50mg/ml; The Sf was 70%.
Compound Purity % Yield % Sf %
Salidroside 83 98 70
Tyrosol 90 98

118
Generally, based on the above discussion of the separation of salidroside and tyrosol using three solvent system
by Mini-HPCCC, system MTBE-Butanol –ACN-Water (4:2:4:10) was an appropriate system with short
separation time and higher resolution. Also the purities of the two compounds were higher than other solvent
system. In addition, using the reversed phase mode with this solvent system can achieve a better result than the
normal phase mode. Therefore, MTBE/butanol/ACN/water (4:2:4:10 v/v/v) solvent system was finally chosen
for the separation of salidroside and tyrosol from the R.rosea sample. The normal phase mode was abandoned in
this study.
3.3.3.2 Scale-up to preparative Midi-HPCCC
As there is approximately a 25×capacity between the analytical (17.7mL coil volume) and preparative (912 ml
coil volume) HPCCC columns, a linear scale-up would result using a 20mL sample loop volume, loading of
1000 mg of crude material and a 12 mL/min mobile phase flow rate. In addition, as the Midi column (72.7m) is
longer than the Mini one (35.2m), a better resolution can be achieved. When this purification procedure was
transferred to the preparative Midi-HPCCC instrument, the separation at 12 ml/min took nearly 4 hours. Five
peaks eluted with 120 min intervals between them. In order to shorten the separation, the flow rate was
increased up to 50 mL/min. This led to a 70min run with better resolution of target peaks. This is typical for
wide columns when higher flow rate in HPCCC can lead to better mixing and better separation. Hence, the
combination of both flow rates as a step flow gradient was applied to achieve a reasonable purification (Fig
3.3.3.2.1). At the beginning of the separation, the Midi-HPCCC column was equilibrated at 12 mL/min to
maintain as high as possible stationary phase retention. After 66 min of separation when the first target
compound of peak eluted from the column, the flow rate was ramped up to 50 mL/min to elute the second target
compound.
The rotor was stopped at 120 min and the column contents were pumped out with pressure air. All HPCCC
fractions were collected and analyzed as described below in Section 3.3.4 and the fractogram of the separation
of salidroside and tyrosol in Midi HPCCC was shown in the Fig 3.3.3.2.2. A summary of scale-up conditions
from the analytical to preparative CCC is listed in Table3.3.3.2.1. The table3.3.3.2.2 showed the initial Sf, purity
and yield of salidroside and tyrosol in the Midi HPCCC separation with reversed phase mode
Table 3.3.3.2.1 Summary of scale-up parameters from analytical to preparative HPCCC using
MTBE/butanol/ACN/water (4:2:4:10 v/v/v) solvent system. .
Instrument type Crude sample
mass (mg)
Flow rate
(ml/min)
“g” field Rotational speed
(rpm)
Analytical Mini
HPCCC
21.5 0.5 240 2100
Preparative Midi
HPCCC
1000 12-50 240 1400

119
Table 3.3.3.2.2 The initial Sf, purity and yield of salidroside and tyrosol in the Midi HPCCC separation with
reversed phase mode and step flow gradient using MTBE/butanol/ACN/water (4:2:4:10 v/v/v) solvent system.
Compound Purity % Yield % Sf %
Salidroside 93 97 72
Tyrosol 95 98
Fig 3.3.3.2.1 Separation chromatograms of the crude sample Rhodiola rosea extract in Midi HPCCC.
Separation conditions were: coil volume 912.5ml; sample loop volume 20 ml; Solvent system,
MTBE/butanol/ACN/water (4:2:4:10 v/v/v) solvent system; flow-rate, step flow gradient: 1–66 min at 12
mL/min, 66–120 min at 50 mL/min; revolution speed, 1400 rpm, temperature at 25ºC; sample concentration,
50mg/ml; The Sf was 72%.

120
Fig 3.3.3.2.2 The fractogram of the separation of salidroside and tyrosol from the crude sample Rhodiola rosea
extract in Midi HPCCC. Separation conditions were: coil volume 912ml, sample loop volume 20 ml; Solvent
system, MTBE/butanol/ACN/water (4:2:4:10 v/v/v) solvent system; flow-rate, step flow gradient: 1–66 min at
12 ml/min, 66–120 min at 50 ml/min; the reversed phase mode; revolution speed, 1400 rpm; temperature at
25ºC; sample concentration, 50mg/ml; The Sf was 72%.
According to Table 3.3.3.2.1, with the same ‘g’ level maintained, the crude sample mass was scaled up 47 times,
which is great due to the fact that the Midi column is 2-fold longer and 5-fold wider than the Mini column.
Scale-up from an analytical to a preparative process proved to be successful. The chapter 4 will discuss the
details of separation parameters from analytical to preparative HPCCC.
3.3.4 Analysis and identification of HPCCC fractions
All fractions were collected each minute and analysed according to the description in Section 3.2.8. The volume
of stationary phase eluted was measured for each run mode as a check on the retention of the stationary phase.
Fractions of target peaks from the Mini-HPCCC in Fig. 3.3.3.1.3.2 were collected and combined after HPLC
analysis. 0.63 mg of salidroside and 0.35 mg of tyrosol were obtained, with purities of 92% and 95%,
respectively. Fractions of target peaks from the Midi-HPCCC in Fig. 3.3.3.2.2 were collected and combined
after HPLC analysis. 28.2 mg of salidroside and 20.6 mg of tyrosol were obtained, with purities of 93% and
95%, respectively. The HPLC chromatogram of the crude sample, standards and the purified target peaks is
shown in Fig. 3.3.4.1. The purified salidroside and tyrosol have the same HPLC retention time as the standards
(Fig 3.3.4.1).

121
Fig.3.3.4.1. HPLC chromatogram of crude sample Rhodiola rosea (A), standards (B) and targets(C-D). The
column was a Gemini C18 column (150 × 3.0 mm; 5 μm particle size). Column temperature was50°C; The
mobile phase consisted of acetonitrile (0.05% phosphoric acid) (C) and water (0.05% phosphoric acid) (D), at a
flow rate of 0.5 mL/min. Analysis was performed using the following gradient elution: 5% C /95% D to 19% C
/81% D/for 30 min then hold for 5 min. Each run was followed by a 5 min wash with 98% C and an
equilibration period of 15 min. The detection wavelengths were from 190 to 400 nm; flow rate was 0.5 mL/min.
122
3.4 Conclusion
In this study, by optimizing the extraction, separation and analytical conditions, a simple and efficient high
performance liquid chromatographic method for the simultaneous quantification of the two biological
compounds salidroside and tyrosol from the crude sample of Rhodiola rosea has been developed and validated
for the first time. Orthogonal L9 (34) test design was used for extraction of crude sample Rhodiola rosea to
optimize extraction parameters.The crude sample extraction was performed with the ratio of raw material to
methanol solvent 1:20, the ratio of methanol to water1:9, the ultrasonic extraction temperature 20 ºC and the
duration of ultrasonic extraction 60 minutes. Based on the calibration curves test, the contents of salidroside and
tyrosol in the crude sample extraction were 31.32 mg/g and 13.79 mg/g, respectively. The optimized method
provided good linear relation (R2 > 0.9992 for the two target compounds), satisfactory precision (RSD values
less than 1.24%) and good recovery (the recoveries of salidroside were satisfactory between 98.9–101.57% with
RSD 1.02% and the recoveries of tyrosol were satisfactory between 95.95–100.18% with RSD 1.82%). The
limit of detection (LOD) was 2.25 ng for salidroside and 1.41ng for tyrosol. The developed method has been
successfully applied to analysis and quality control salidroside and tyrosol of Rhodiola rosea.
To optimise the separation of salidroside and tyrosol, a new solvent system MTBE/butanol/ACN/water
(4:2:4:10 v/v) has been successfully developed and applied for the first time in the separation of salidroside and
tyrosol from the crude Rhodiola rosea extraction by high-performance counter-current chromatography
(HPCCC). HPCCC also can provide an easy scale-up from analytical to predictable preparative process with
high throughput. A rapid and high-throughput HPCCC purification method has been developed for the large-
scale preparation of the salidroside and tyrosol from Rhodiola rosea using step-flow gradient CCC. The linear
scale-up was performed from an analytical Mini-HPCCC to a preparative Midi-HPCCC. All fractions collected
were analyzed by HPLC. 28.2 mg of salidroside and 20.6 mg of tyrosol were successfully achieved from the
1000 mg crude sample extraction, with the purity of 93% and 97% yield, 95% and 98% yield respectively.
Therefore, the separation and analytical method developed can be used for the quantitative and qualitative
control of Rhodiola rosea sample and contribute to the modernization of Tibetan herbal medicine.

123
CHAPTER 4
Scale-up process for rapid
purification of salidroside and
tyrosol with high-performance
counter-current chromatography

124
4.1 Introduction
Counter-current chromatography (CCC) is considered as an efficient tool for separation and purification of
bioactive constituents from various sources. The advantages of this technology over HPLC including higher
loading capacity, less solvent usage, high sample loading, ease of scaling up to manufacturing stage and 100%
recovery are well documented [197, 356]. More importantly, it has been developed to the stage that it can be
predictably scaled up from analytical to preparative scale and it has the big potential of the industrial scale up in
the future. CCC can not only develop a generic high-resolution purification process that is as rapid as HPLC
analysis, but also can be linearly scaled up from laboratory to industry scale. Some papers have been published
for the research on the scale-upon of the CCC. Ito & Bhatnagar [357] have demonstrated unit-gravity slowly
rotating coil devices could be suitable for large-scale CCC separations. Sutherland et al.[358] have used
different applications to verify the versatility from 50 mg to 5g capacity separations using one coil in Quattro
CCC. Later, they have performed a preliminary review of the scale-up of CCC [359] and they found it to be
linear and predictable [360]. They have demonstrated that there were three major variables affecting the scale-
up process including the rotation speed, flow rate and tubing bore and they found the retention increases
predictably with rotational speed and tubing bore. Also, retention can be sustained using larger bore tubing for
much higher linear flow rates than for the smaller bore devices. Hence, it will be possible to predict the
appropriate operating conditions for separation on a given partition coefficient but it was difficult to predict how
good the separation would be [361]. In 2005, Sutherland et al. [356] reviewed the scale-up process of CCC
toward the industry and described that great scale-up factors can be achieved based on tubing cross-sectional
area if only considering the stationary phase volume retention. Ignatova et al. [362] have investigated two
variables of the rotor radius and the tubing bore affecting the scale-up from pilot to process. It was shown there
was very little difference in retention and resolution as rotor radius increases at constant bore when tubing bore,
β-value and helix angle are kept constant and the tubing bore results show that good retention is maintained as
bore increases and resolution only decrease slightly. Wood et al. [244] have performed an analytical J-type
counter-current chromatography (CCC) separation using a 5.4 ml column to scale up to the Maxi column with
4600 ml. The scale up factor is 850 based on an 850 increase in both the column volume and mobile phase flow
rate. The identical chromatograms and similar separation time for both scales demonstrates that high-
performance CCC (HPCCC) is linearly scalable. Scale-up process also investigated on the separation of natural
herbs with CCC. Peng, el al.[363] have investigated the critical parameters including sample concentration,
sample volume and flow rate on an analytical Mini-DE HPCCC system and successfully scaled up to a
preparative TBE 300A HSCCC system with different gravitational force based on the same retention. Six
bioactive compounds were separated individually from the Triperygium wilfordii Hook.f.
Although High-Speed Counter-Current Chromatography (HSCCC) is considered as an efficient tool for
separation and purification of bioactive constituents from various sources, the traditional HSCCC is described
as a typical separation which can take many hours. In addition, linear scale-up from analytical to predictable
preparative process with high throughput is limited by the low gravitational force and flow rates. Recently a
new generation of HPCCC coil planet centrifuges developed by Dynamic Extractions (DE) at higher “g” fields

125
(240g) than conventional HSCCC (60-80g) enable higher flow rates to be used so that separation times are
minutes rather than hours whilst maintaining resolution and elution times. The benefits of the HPCCC were not
only possible to provide milligram quantities of compound separation process but also provide relative simply
volumetric or linear scale-up between all scales instruments [364]. Lijuan Chen et al.[365] have developed a
rapid separation approach using high-capacity HSCCC to isolate and purify honokiol and magnolol from Houpu
and successfully rapid scale-up from the analytical Mini-DE centrifuge with 18 ml column to the Maxi-DE
centrifuge with 4600 ml column with the optimized parameters obtained rapidly at analytical scale.Yuan Yuan
et al.[366] have used three different HPCCC instrument columns (4.7ml, 17.2ml and 915.2ml) to investigate on
the linear scale-up process for purification of compounds from S. tamariscina. Five biflavonoids and an
apigenin-diglucoside were obtained with the throughput scaled up 50 times. Sutherland et al. [241] have further
demonstrated that scale-up process from test tube distribution ratios combined with sample loading studies
performed at the analytical scale can be feasibility transferred directly and predictably to process scale.
Therefore, this chapter used the isolation of salidroside and tyrosol from Rhodiola rosea exact as an example to
demonstrate how to achieve rapid and predictable linear scale-up processes in both normal and reversed phase
high performance counter-current chromatography with three different columns.
4.2 Experimental method and materials
4.2.1 Apparatus
4.2.1.1 Mini-HPCCC centrifuge
The analytical Mini-CCC was from Dynamic Extractions (Slough, UK). This instrument has a coil of 17.7mL
with 0.8mm bore tubing and extra coil volume of 0.39 ml. The revolution radius or the distance between the
column axis and central axis of the centrifuge (R) for this column is 50mm with a β value varying from 0.68 at
the internal terminal to 0.79 at the external terminal. The Mini-CCC can rotate up to a speed of 2100rpm
(246×g) and has a typical flow range for most organic/aqueous phase systems of 0.5–2 mL/min for a separation.
4.2.1.2 Spectrum –DE centrifuge
The Spectrum –DE centrifuge (Dynamic Extractions, Slough, UK) has a rotor radius of 85 mm, tubing bore of
1.6mm and two bobbins (columns) with a total capacity of 143 ml. It was one type of semi-preparative
instrument. The Spectrum can rotate up to a speed of 1600rpm (241×g), has a typical flow range of 0.5–10
ml/min and a mean β value of 0.79.

126
4.2.1.3 Midi-HPCCC centrifuge
The Midi-CCC centrifuge (Dynamic Extractions, Slough, UK) has a rotor radius of 110mm, tubing bore of
4mm and two bobbins (columns) with a total capacity of 912.5 ml. The Midi can rotate up to a speed of
1400rpm (241×g), has a typical flow range of 10–100 ml/min and a mean β value of 0.75 where β is the ratio of
planet to rotor radius.
4.2.1.4 High performance liquid chromatography (HPLC)
The HPLC equipment used was a Waters 2695 high performance liquid chromatography (HPLC) instrument
equipped with 2996 photodiode array detector (Waters, USA). Chromatography data were collected using
Empower Pro workstation (Waters, USA). A Gemini C18 column (150 × 3.0 mm; 5 μm particle size) was
supplied for the HPLC analysis
4.2.2 Reagents and materials
Rhodiola rosea was purchased from Tibet herbal company of Qinghai (Qinghai, China). The Salidroside and
Tyrosol standards were from Sichuan Provincial Administration of Food and Drugs (Sichuan, China). All
analytical grade solvents (Methyl tert-butyl ether, acetonitrile, and butanol) for the HPCCC separation and
HPLC grade acetonitrile for HPLC analysis were supplied by Fisher Chemicals (Loughborough, UK).
Deionised water was prepared by a Millipore water purification system (Watford, UK).
4.2.3 Preparation of crude sample
The crude sample was prepared as described in the previous study (Section 3.2.3); the dried Rhodiola rosea
(100g) was pulverized into small pieces and mixed with 2 L of 90% aq methanol to sonicate for 60 minutes at
20ºC. The extract solution was filtered and filtrate was evaporated at 30ºC to dryness under reduced vacuum. 18
g of brown powder was obtained for HPCCC purification.
4.2.4 Solvent system preparation
The two-phase solvent systems were tested and selected based on the KD values of the main compounds in the
crude sample. A terAcWat solvent system containing methyl tert-butyl ether, butanol, acetonitrile and water
in a volume ratio of 4:2:4:10 was used for the salidroside and tyrosol separation. This system is hydrophilic.
The solvent mixture was thoroughly equilibrated in a separation funnel at room temperature.
4.2.5 High-performance HSCCC separation procedure
The separation procedure was carried out as follows: the stationary phase of Methyl tert/butyl
ether/butanol/acetonitrile/water (4:2:4:10 v/v/v) system was pumped into the separation column while it was

127
stationary. The centrifuge was then set to run at the required speed and the mobile phase then pumped into the
system at a constant flow rate in the head to tail elution mode for a reversed-phase separation, but in the tail to
head elution mode for a normal-phase separation. Note that the upper phase was used as the stationary phase
and the lower phase as the mobile phase in the reversed-phase mode; on the contrary, the lower phase was the
stationary phase and the upper phase was the mobile phase in the normal-phase mode. When hydrodynamic
equilibrium was achieved a known concentration of crude sample was injected into the coil. The temperature
was held at 25 °C, and the effluent from the end of the column was monitored with an UV detector at 270 nm.
Fractions were collected each minute, evaporated to dryness and the residue dissolved in methanol for
subsequent HPLC analysis
4.2.6 HPLC analysis and identification of HPCCC fractions
All fractions were collected and analysed according to the description in Section 3.2.8. The volume of
stationary phase eluted was measured for each run mode as a check on the retention of the stationary phase. The
latter was also analysed by HPLC.
4.3 Results and discussion
4.3.1 Parameters optimization on analytical HPCCC
This work was performed on Mini analytical HPCCC. In each run, the upper phase (stationary phase) was
pumped into the coil. Then, the rotor was rotated at 2100 rpm, and at the same time, the lower phase was
pumped through the column at selected flow rate. After hydrodynamic equilibrium was established in the
column, the sample solution of crude extract was injected through the valve. The effluent was monitored with a
2996 photodiode array detector at 270nm. The temperature was set at 25 °C. Each peak was collected by
starting collection approximately halfway up the rising part and stopping half way down each falling part. Each
fraction was evaporated under reduced pressure and dissolved by methanol for HPLC analysis.
4.3.2 Flow rate study
The relationship between flow rate and stationary phase retention was reported by Du et al. in 1999 [206]. It
was the first to show that the stationary phase retention (Sf) has a linear relationship to the square root of the
mobile phase flow rate: Sf=A-BCF . It meant the stationary phase retention will reduce with the flow rate
increase. Lower stationary phase retention will lead to the lower resolution [367]. In order to find the suitable
flow rate for the separation of salidroside and tyrosol using Mini analytical HPCCC , the flow rate was initially
set at 0.5 ml/min and then flow rate was increased to 1.0 ml/min, the retention of stationary phase was recorded
in each run.
The HPCCC chromatograms at two flow rates are shown in Fig. 4.3.2.1 A and B. The fractogram of these with
0.5ml/min and 1.0ml/min flow rate are shown in the Fig.4.3.2.2 and Fig.4.3.2.3. Table 4.3.2.1 and Table 4.3.2.2

128
showed the initial Sf, purity and yield of salidroside and tyrosol at the 0.5ml/min and 1.0ml/min. Separation
conditions were: reversed-phase mode; rotation speed, 2100 rpm; sample concentration, 50 mg/ml; sample loop,
0.43 ml. The whole elution time was 90 minutes at 0.5ml/min and 60minutes at 1.0 ml/min with stationary
phase volume retentions of 60 % and 43%, respectively. Flow rates higher than 1.0ml/min caused stationary
phase retention decrease result in the lower resolution, both of two compound purities decreased with the flow
rate increasing and therefore 0.5 ml/min was chosen for sample concentration optimization.
Table 4.3.2.1 The initial Sf, purity and yield of salidroside and tyrosol in the Mini HPCCC separation with
reversed phase mode using MTBE/butanol/ACN/water (4:2:4:10 v/v/v) solvent system at the 0.5 ml/min flow
rate
Compound Purity % Yield % Sf %
Salidroside 92 98 60
Tyrosol 95 98
Table 4.3.2.2 The initial Sf, purity and yield of salidroside and tyrosol in the Mini HPCCC separation with
reversed phase mode using MTBE/butanol/ACN/water (4:2:4:10 v/v/v) solvent system at the 1.0 ml/min flow
rate
Compound Purity % Yield % Sf %
Salidroside 86 98 43
Tyrosol 93 98
Fig 4.3.2.1 Comparison of chromatograms of the crude sample Rhodiola rosea extract obtained at flow rates of
0.5 ml/min (A) with 60% Sf and 1.0 ml/min (B) with 43% Sf using a coil volume of 17.7 ml in the Mini-

129
HPCCC centrifuge. Separation conditions were: coil volume 17.7ml,sample loop volume 0.43ml, Solvent
system, MTBE/butanol/ACN/water (4:2:4:10 v/v/v) solvent system; reversed phase model ; revolution speed,
2100 rpm, temperature at 25ºC; sample concentration , 50 mg/ml.
0
500000
1000000
1500000
2000000
2500000
3000000
3500000
4000000
4500000
0 20 40 60 80 100
Time (minutes)
HP
LC
Pe
ak
Are
a
Salidroside
Contaminant1
Contaminant2
Contaminant3
Tyrosol
Contaminant4
Contaminant5
Fig 4.3.2.2 The fractogram of the separation of salidroside and tyrosol from the crude sample Rhodiola rosea
extract in the Mini-HPCCC centrifuge at flow rates of 0.5 ml/min. Separation conditions were: coil volume
17.7ml; sample loop volume 0.43ml; Solvent system, MTBE/butanol/ACN/water (4:2:4:10 v/v/v) solvent
system; reversed phase model ; revolution speed, 2100 rpm; temperature at 25ºC; sample concentration, 50
mg/ml; The Sf was 60%.

130
0
500000
1000000
1500000
2000000
2500000
3000000
3500000
4000000
4500000
0 20 40 60 80 100
Time (minutes)
HP
LC
Pe
ak
Are
aSalidroside
Contaminant1
Contaminant2
Contaminant3
Contaminant4
Tyrosol
Contaminant5
Contaminant6
Fig 4.3.2.3 The fractogram of the separation of Salidroside and Tyrosol from the crude sample Rhodiola rosea
extract in the Mini-HPCCC centrifuge at flow rates of 1.0 ml/min. Separation conditions were: coil volume
17.7ml; sample loop volume 0.43ml; Solvent system, MTBE/butanol/ACN/water (4:2:4:10 v/v/v) solvent
system; reversed phase model; revolution speed, 2100 rpm; temperature at 25ºC; sample concentration, 50
mg/ml; The Sf was 43%.
4.3.3 Sample concentration loading study
The first sample loading study focused on increasing sample concentration to the highest value possible before
either resolution was lost or the sample precipitated. Fig. 4.3.3.1 showed a single run on the Mini-HPCCC with
0.43 ml injected samples at 10 mg/ml, 30 mg/ml, 50 mg/ml and 70 mg/ml, respectively. The separation
conditions were: MTBE/butanol/ACN/water (4:2:4:10 v/v/v) solvent system, a reversed-phase mode, a rotation
speed of 2100 rpm, a flow rate of 0.5 ml/min and temperature 25ºC. The fractograms of 50mg/ml and 70 mg/ml
are nearly the same, indicating that the sample solution had reached saturation. The target compounds can
achieve good resolution and reproducible results. On the other hand, the resolution of salidroside and stationary
phase volume retention values were 1.4, 60% and 1.2, 60% for 50 mg/ml and 70 mg/ml concentration,
respectively. Since increasing the concentration had little effect on both resolution and stationary phase
retention, 50 mg/ml was chosen as the optimum concentration.

131
10 mg/ml Sample Concentration
0
100000
200000
300000
400000
500000
600000
700000
800000
900000
0 20 40 60 80 100 120
Time (minutes)
HP
LC
Peak A
rea Peak1
Salidroside
Tyrosol
30 mg/ml Sample Concentration
0
500000
1000000
1500000
2000000
2500000
3000000
0 20 40 60 80 100 120
Time (minutes)
HP
LC
Peak A
rea
Peak1
Salidroside
Tyrosol

132
50mg/ml Sample Concentration
0
500000
1000000
1500000
2000000
2500000
3000000
3500000
4000000
4500000
0 20 40 60 80 100 120
Time (minutes)
HP
LC
Peak A
rea
Peak1
Salidroside
Tyrosol
70 mg/ml sample Concentration
0
1000000
2000000
3000000
4000000
5000000
6000000
0 20 40 60 80 100 120
Time (minutes)
HP
LC
Peak A
rea Peak1
Salidroside
Tyrosol
Fig 4.3.3.1 The fractogram of the separation of salidroside and tyrosol from the crude sample Rhodiola rosea
extract in Mini-HPCCC with 10 mg/ml, 30 mg/ml, 50 mg/ml and 70 mg/ml sample concentration. Separation
conditions: Solvent system, MTBE/butanol/ACN/water (4:2:4:10 v/v/v) solvent system; flow rates, 0.5 ml/min;
reversed phase model; revolution speed, 2100 rpm; temperature at 25ºC.
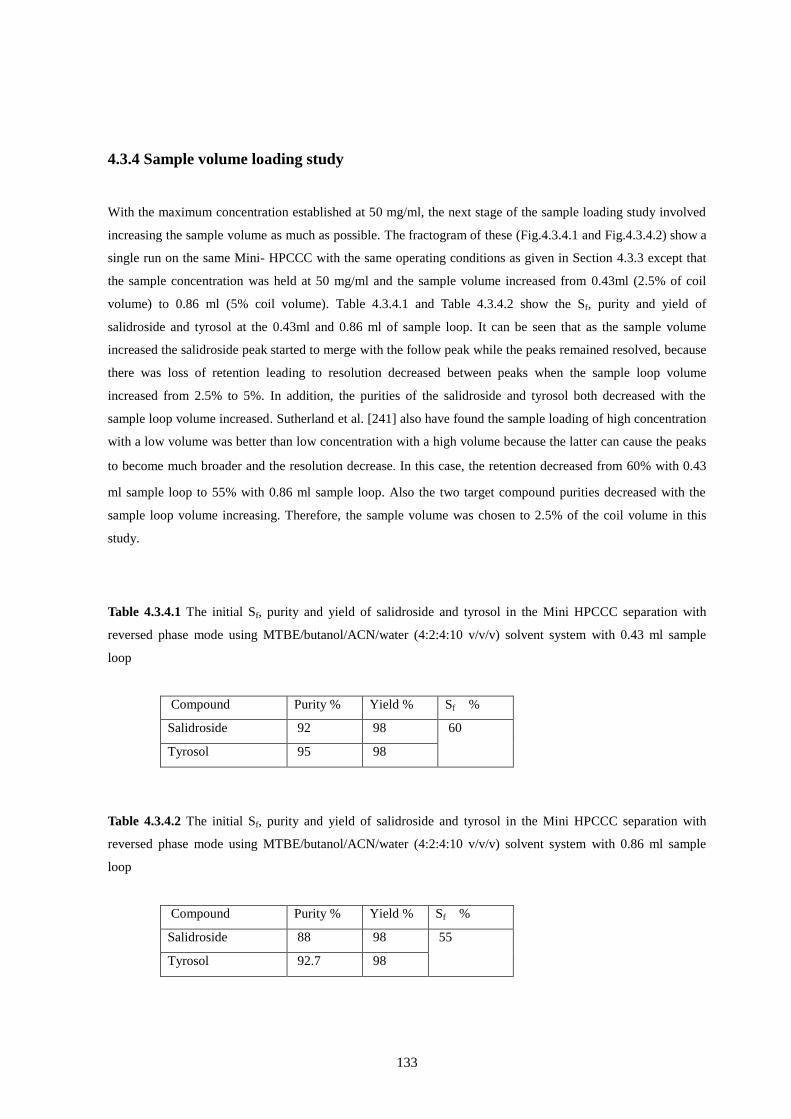
133
4.3.4 Sample volume loading study
With the maximum concentration established at 50 mg/ml, the next stage of the sample loading study involved
increasing the sample volume as much as possible. The fractogram of these (Fig.4.3.4.1 and Fig.4.3.4.2) show a
single run on the same Mini- HPCCC with the same operating conditions as given in Section 4.3.3 except that
the sample concentration was held at 50 mg/ml and the sample volume increased from 0.43ml (2.5% of coil
volume) to 0.86 ml (5% coil volume). Table 4.3.4.1 and Table 4.3.4.2 show the Sf, purity and yield of
salidroside and tyrosol at the 0.43ml and 0.86 ml of sample loop. It can be seen that as the sample volume
increased the salidroside peak started to merge with the follow peak while the peaks remained resolved, because
there was loss of retention leading to resolution decreased between peaks when the sample loop volume
increased from 2.5% to 5%. In addition, the purities of the salidroside and tyrosol both decreased with the
sample loop volume increased. Sutherland et al. [241] also have found the sample loading of high concentration
with a low volume was better than low concentration with a high volume because the latter can cause the peaks
to become much broader and the resolution decrease. In this case, the retention decreased from 60% with 0.43
ml sample loop to 55% with 0.86 ml sample loop. Also the two target compound purities decreased with the
sample loop volume increasing. Therefore, the sample volume was chosen to 2.5% of the coil volume in this
study.
Table 4.3.4.1 The initial Sf, purity and yield of salidroside and tyrosol in the Mini HPCCC separation with
reversed phase mode using MTBE/butanol/ACN/water (4:2:4:10 v/v/v) solvent system with 0.43 ml sample
loop
Compound Purity % Yield % Sf %
Salidroside 92 98 60
Tyrosol 95 98
Table 4.3.4.2 The initial Sf, purity and yield of salidroside and tyrosol in the Mini HPCCC separation with
reversed phase mode using MTBE/butanol/ACN/water (4:2:4:10 v/v/v) solvent system with 0.86 ml sample
loop
Compound Purity % Yield % Sf %
Salidroside 88 98 55
Tyrosol 92.7 98

134
0
500000
1000000
1500000
2000000
2500000
3000000
3500000
4000000
4500000
0 20 40 60 80 100
Time (minutes)
HP
LC
Pe
ak
Are
a
Salidroside
Contaminant1
Contaminant2
Contaminant3
Tyrosol
Contaminant4
Contaminant5
Fig 4.3.4.1 The fractogram of the separation of salidroside and tyrosol from the crude sample Rhodiola rosea
extract in Mini HPCCC with 0.43 ml sample loop. Separation conditions were: coil volume 17.7 ml; Solvent
system, MTBE/butanol/ACN/water (4:2:4:10 v/v/v) solvent system; flow rates, 0.5 ml/min; revolution speed,
2100 rpm; temperature at 25ºC; sample concentration, 50 mg/ml; The Sf was 60%
0
1000000
2000000
3000000
4000000
5000000
6000000
0 20 40 60 80 100 120
Time (minutes)
HP
LC
Peak A
rea
Salidroside
contaminant1
Contaminant2
Contaminant3
Tyrosol
Contaminant4
Contaminant5
Fig 4.3.4.2 The fractogram of the separation of salidroside and tyrosol from the crude sample Rhodiola rosea
extract in Mini HPCCC with 0.86 ml sample loop. Separation conditions were: coil volume 17.7ml; Solvent

135
system, MTBE/butanol/ACN/water (4:2:4:10 v/v/v) solvent system; flow rates, 0.5 ml/min; revolution speed,
2100 rpm; temperature at 25ºC; sample concentration, 50 mg/ml; The Sf was 55%
4.3.5 Linear scale-up from Mini-HPCCC to Spectrum in reversed phase mode
All parameter optimization and sample loading studies were performed on the short coil of 17.7 ml capacity on
the Mini- HPCCC for further scale-up. There are different ways to scale-up including linear and volumetric
scale-up. The first is called linear scale-up. It is based on cross sectional area of a CCC column and applied to
columns with different length. Stationary phase retention has the linear relationship with the mobile phase flow
rate. Wood et al. [368] showed that the volume of mobile phase (Vm) present in a CCC column is proportional to
the square root of the mobile phase flow rate, which means the mean cross sectional area of the column is also
proportional to the square root of the mobile phase flow rate. Hence, Wood et al. [244] found the liner scale-up
in CCC was based upon increasing to cross sectional area of the column and the liner scale–up factor is equal to
the square of the mean cross sectional area scale-up factor, which meant the liner scale–up factor was equal to
the square of ratio of two different column diameter, if the elution time was same during the scale-up process.
Fristly, the separation was scaled up from Mini HPCCC (17.7 ml coil volume) to semi-preparative Spectrum
(143 ml coil volume) for verifying and optimising the scale-up parameters. A summary of scale-up conditions
from the analytical to preparative CCC is listed in Table 4.3.5.1. All operating conditions remained the same
except flow rate, sample volume and rotation speed which were scaled up according to the following rules: (1)
flow rate was scaled up in proportion to the change in the square of bore diameter when the length columns
were not same, because the scale–up factor was relative to the cross-sectional area of the column bore (with
respective bore diameter of 0.8 mm and 1.6 mm, this was 4:1 giving in rounded terms a flow rate of 2 ml/min.
(2) the sample volume was chosen 2.5% of the 143 ml coil volume of the Spectrum, which can provide good
stationary phase retention and high purity of target compounds (a sample volume of 3.35 ml for the Spectrum,
loading of 168 mg of crude material). (3) Rotation speed was chosen to generate the same “g” value of 240 g as
Mini HPCCC, which would give a Spectrum speed of 1600 rpm. It was noted that these scale-up settings gave
the same retention time for the KD = 1 elution point. All other parameters remained the same. The separation
was run in reversed phase to achieve the good purity of target compounds as shown in Fig. 4.3.5.1 Also the
fractogram was shown in the Fig.4.3.5.2 Table 4.3.5.2 showed the initial Sf, purity and yield of salidroside and
tyrosol in the Spectrum separation with reversed phase mode.
Table 4.3.5.1 Summary of scale-up parameters from analytical to preparative HPCCC
* “g” field and tubing bore data come from Brunel official webside (http://www.brunel.ac.uk/bib/bioprocess-engineering/scale-up)
Instrumen
t type
Scale-up
factor
Crude sample
mass (mg)
Flow rate
(ml/min)
“g” field Tubing bore
(mm)
Column
length (m)
Rotation
speed
(rpm)
Mini 1 21.5 0.5 240 0.8 35.2 2100
Spectrum 4 167.5 2 240 1.6 71.4 1600
Midi 6 1000 12-50 240 4.0 72.7 1400

136
Table 4.3.5.2 The initial Sf, purity and yield of salidroside and tyrosol in the Spectrum separation with reversed
phase mode using MTBE/butanol/ACN/water (4:2:4:10 v/v/v) solvent system.
Compound Purity % Yield % Sf %
Salidroside 93 98 80
Tyrosol 95 98
Fig 4.3.5.1 Separation chromatograms of the crude sample Rhodiola rosea extract in the Spectrum centrifuge
with reversed phase mode. Separation conditions: coil volume 143ml; sample loop volume 3.35 ml; Solvent
system, MTBE/butanol/ACN/water (4:2:4:10 v/v/v); flow-rate, 2 ml/min; revolution speed, 1600 rpm;
temperature at 25ºC; sample concentration, 50 mg/ml; The Sf was 80%
0
1000000
2000000
3000000
4000000
5000000
6000000
7000000
0 50 100 150 200 250 300
Time (minutes)
HP
LC
Peak A
rea
Salidroside
Contaminant1
Contaminant2
Contaminant3
Tyrosol
Contaminant4
Contaminant5
Fig 4.3.5.2 The fractogram of the separation of salidroside and tyrosol from the crude sample Rhodiola rosea
extract in Spectrum with reversed phase mode. Separation conditions were: coil volume 143ml; Solvent system,
MTBE/butanol/ACN/water (4:2:4:10, v/v/v); flow-rate, 2ml/min; revolution speed, 1600 rpm; temperature at
25ºC; sample concentration, 50 mg/ml; The Sf was 80.

137
In the CCC, there are two major measures of prime importance in Countercurrent Chromatography (CCC):
retention of the stationary phase and the resolution. The former reflects the hydrodynamic equilibrium of a
given phase system and the latter can be used as a measure of the process efficiency in mixing and settling
terms. The Sf value can be varied with the rotation speed and flow rate. Increasing the flow rate leads to the
decreasing of the stationary phase retention. Also the Sf has a proportional relationship with the rotation speed.
In this study, the three different HPCCC instruments can generate the same 240 g field at the max rotation speed
and provide the same Sf value at a suitable flow rate. Hence, if the K and Sf remain the same in the scale-up
process, the target compounds should elute at the same number of column volumes. So the elution time of
compounds could be predicted. Since the retention volume (VR) of the compounds may be predicted using the
elution volume of the solvent front (VSF) and the total column capacity (VC) by the following equation [213]:
VR = VSF + KD (VC − VSF) (Equation 20)
The VSF contains dead volume and retained volume of the mobile phase (VM) in the coil. If the dead volume is
small, it could be ignored and Equation (20) could be written as:
VR = VM + KD (VC − VM) VR = VC + (KD – 1) VS (Equation 21)
After VM was replaced by VC −VS, it could be rewritten as:
VR = VC [1 + (KD − 1) Sf] (Equation 22)
Therefore, once the KD and Sf remain the same, the elution volume of compounds could be predicted by
VR = N VC (Equation 23)
N express the number of column volumes, it could be obtained through the experiment on analytical HPCCC.
4.3.6 Volumetric scale-up from Spectrum to Midi-HPCCC in reversed phase modes
There is approximately a 6×capacity between the Spectrum (143ml coil volume) and preparative Midi HPCCC
columns (912ml coil volume) as their length of these columns were same both near 72m. A volumetric scale-up
to Midi could be set up based upon increases of both cross-sectional area and column length [244]. The flow
rate scale-up factor was same as the column volume scale up; it would result in a 20ml sample volume, loading
of 1000 mg of crude material and a 12 ml/min mobile phase flow rate. However, when this purification
procedure was transferred to the preparative Midi-HPCCC instrument, the separation at 12 ml/min took nearly 4
h (results are not shown). Two of peaks eluted with 160 min interval between them. In order to shorten the
separation, the flow rate can be increased without loss of much stationary phase and the resolution. This is
typical for wide bore columns when higher flow rate in HPCCC can lead to better mixing and better separation.
Therefore, two different flow rates (4 ml/min and 8 ml/min) were investigated on the separation of Spectrum
and their chromatograms and fractogram are shown respectively in Fig. 4.3.6.1-Fig. 4.3.6.4. Also the Table

138
4.3.6.1 and Table 4.3.6.2 showed the initial Sf, purity and yield of salidroside and tyrosol in the Spectrum
separation with reversed phase mode at flow rate 4 ml/min and 8 ml/min. With the flow rate increasing from
2ml/min to 4 ml/min and 8 ml/min, the retention dropped from the 80% to 79% and 62% leading to the loss of
the both compound purity and peaks resolution, but the purity of tyrosol dropped little compared with the loss
purity of salidroside and the separation time of tyrosol will be short in 60 minutes with the 8 ml/min flow rate.
On the other hand, high flow rate can improve the sample mixing in the column with the wide bore resulting in
good separation. Hence, the combination of both flow rates (2ml/min and 8ml/min) as a step-gradient was
applied to achieve a reasonable purification in the Spectrum and volumetric scale-up to the Midi HPCCC with
6×capacity (Fig. 4.3.6.5 and Fig. 4.3.6.6). At the beginning of the separation, the Midi-HPCCC column was
equilibrated at 12 ml/min to maintain as high as possible stationary phase retention. After 66 min of separation
when the salidroside eluted from the column, the flow rate was increased up to 50 ml/min to elute the tyrosol
compound. The rotor was stopped at 120 min and the column contents were pumped out with organic mobile
phase at 200 ml/min. All HPCCC fractions were collected and analysed. The table 4.3.6.3 shows the Sf, purity
and yield of salidroside and tyrosol in the Midi HPCCC separation with reversed mode.
Table 4.3.6.1 The initial Sf, purity and yield of salidroside and tyrosol in the Spectrum separation with reversed
phase mode using MTBE/butanol/ACN/water (4:2:4:10 v/v/v) solvent system at flow rate 4 ml/min
Compound Purity % Yield % Sf %
Salidroside 91.4 98 79
Tyrosol 94.4 98
Fig 4.3.6.1 Separation chromatograms of the crude sample Rhodiola rosea extract in Spectrum at flow rate 4
ml/min. Separation conditions: coil volume 143 ml; sample loop volume 3.35 ml; Solvent system,
MTBE/butanol/ACN/water (4:2:4:10 v/v/v) solvent system; reversed phase model; revolution speed, 1600 rpm;
temperature at 25ºC; sample loop, 3.35ml; sample concentration, 50 mg/ml; The Sf was 79%

139
Fig 4.3.6.2 The fractogram of the separation of salidroside and tyrosol from the crude sample Rhodiola rosea
extract in Spectrum at flow rate 4 ml/min. Separation conditions were: coil volume 143 ml; Solvent system,
MTBE/butanol/ACN/water (4:2:4:10 v/v/v) solvent system; reversed phase model; revolution speed, 1600 rpm,
temperature at 25ºC; sample loop, 3.35ml; sample concentration, 50 mg/ml; The Sf was 79%
Table 4.3.6.2 The initial Sf, purity and yield of salidroside and tyrosol in the Spectrum separation with reversed
phase mode using MTBE/butanol/ACN/water (4:2:4:10 v/v/v) solvent system at flow rate 8 ml/min
Compound Purity % Yield % Sf %
Salidroside 89.8 98 62
Tyrosol 95 98

140
Fig 4.3.6.3 Separation chromatograms of the crude sample Rhodiola rosea extract in Spectrum at flow rate 8
ml/min. Separation conditions: coil volume 143ml; sample loop volume 3.35 ml; Solvent system,
MTBE/butanol/ACN/water (4:2:4:10 v/v/v) solvent system; reversed phase model; revolution speed, 1600 rpm;
temperature at 25ºC; sample loop, 3.35ml; sample concentration, 50 mg/ml; The Sf was 62%
0
1000000
2000000
3000000
4000000
5000000
6000000
7000000
8000000
0 10 20 30 40 50 60
Time (minutes)
HP
LC
Peak A
rea
Salidroside
Contaminant1
Contaminant2
Contaminant3
Tyrosol
Contaminant4
Contaminant5
Fig 4.3.6.4 The fractogram of the separation of salidroside and tyrosol from the crude sample Rhodiola rosea
extract in Spectrum at flow rate 8 ml/min. Separation conditions were: coil volume 143ml; Solvent system,
MTBE/butanol/ACN/water (4:2:4:10 v/v/v) solvent system; reversed phase model ; revolution speed, 1600 rpm,
temperature at 25ºC; sample loop, 3.35ml; sample concentration, 50 mg/ml; The Sf was 62%
Table 4.3.6.3 The initial Sf, purity and yield of salidroside and tyrosol in the Midi HPCCC separation with
reversed phase mode and step flow gradient using MTBE/butanol/ACN/water (4:2:4:10 v/v/v) solvent system
Compound Purity % Yield % Sf %
Salidroside 93 97 72
Tyrosol 95 98

141
Fig 4.3.6.5 Separation chromatograms of the crude sample Rhodiola rosea extract in Midi HPCCC. Separation
conditions were: coil volume 912 ml; sample loop volume 20 ml; Solvent system, MTBE/butanol/ACN/water
(4:2:4:10 v/v/v) solvent system; reversed phase model; flow-rate, step flow gradient: 1–66 min at 12 ml/min,
66–120 min at 50 ml/min; revolution speed, 1400 rpm, temperature at 25ºC; sample concentration, 50 mg/ml;
The Sf was 72%
Fig 4.3.6.6 The fractogram of the separation of salidroside and tyrosol from the crude sample Rhodiola rosea
extract in Midi HPCCC. Separation conditions were: coil volume 912 ml, sample loop volume 20 ml; Solvent
system, MTBE/butanol/ACN/water (4:2:4:10 v/v/v) solvent system (4:2:4:10, v/v/v); flow-rate, step flow
gradient: 1–66 min at 12 ml/min, 66–120 min at 50 mL/min; reversed phase model; revolution speed, 1400 rpm,
temperature at 25ºC; sample concentration, 50 mg/ml; The Sf was 72%

142
4.4 Conclusion
The linear and volumetric scale-up of Rhodiola rosea separation from analytical to preparative HSCCC
instruments have been successfully demonstrated. The process was first developed on the analytical Mini-
HPCCC and then linearly scaled up to the semi-preparative Spectrum, and later volumetrically scale up to the
Midi-HPCCC. Also the separation parameters including selection of solvent system, sample concentration,
sample loading volume and flow rate were optimized on analytical HPCCC, and flow rate step gradient elution
was also tested on high gravitational force HPCCC. Then optimized parameters were successfully scaled up
from analytical HPCCC to preparative HPCCC. The study involved the use of three different insurements with
columns of increasing volume: 17.7 ml, 143ml and 912.5 ml. After the optimization and scale-up in reversed
phase mode, two main compounds of salidroside and tyrosol were obtained with a high throughput scaled up.
Midi-HPCCC runs produced 28.2mg (purity 93%) of salidroside and 13.1mg (purity 96.5%) of tyrosol. The
results demonstrate that HPCCC operating at the high flow and high “g” field is a reliable strategy for linear
scale-up from analytical-scale high-throughput screening. Further linear CCC scale-up using the Maxi-DE
centrifuge will be investigated in due course.

143
Chapter 5
Summary, conclusions and
future work

144
5.1 Summary
The work detailed within this thesis demonstrates the simple, rapid and efficient separation of different polarity
active compounds from crude sample of traditional Chinese medicines (TCMs) by HPCCC. Two traditional
Chinese medicines Panax ginseng and Rhodiola rosea were investigated in this thesis to show HPCCC is an
advantageous and suitable technique for the separation and purification with the high recovery, low cost and
high throughput. This fundamental separation work has allowed the determination of the required critical
operating parameters. Furthermore the scale-up ability of HPCCC has been demonstrated. Positive indications
have been seen that further future optimisation would allow HPCCC purified samples the potential to approach
industry standard. Two step separation procedures were applied for the separation of ginsenosides from the
Panax ginseng to achieve a satisfactory isolation and purification. A rapid orthogonal L9 (34) test design was
used for optimizing the preparation of the Rhodiola rosea sample to enrich salidroside and tyrosol compounds
for further HPCCC separation and purification. Four parameters of extraction were optimised including the ratio
of raw material to methanol solvent, the ratio of methanol to water, the ultrasonic extraction temperature and the
duration of ultrasonic extraction. In order to quality control Panax ginseng and Rhodiola rosea, both simple and
efficient HPLC methods have been developed and demonstrated in this thesis.
Key to a successful separation by HPCCC is the choice of phase system employed. A simple screening solvent
system was successfully developed to select solvent gradients for separation of ginsenosides. Ethyl
acetate/butanol/water (3.5:0.5:4 v/v) and ethyl acetate/butanol/water (2.5:1.5:4 v/v) solvent systems with
addition of 5mM ammonium acetate salt were selected as the solvent system for the first step gradient
separation. Three ginsenosides Rd, Rg1 and Rb1 were separated in 120 minutes with high stationary phase
retention. Methylene chloride/methanol/water/isopropanol (6:3:4:3 v/v/v) solvent system was selected for the
second step separation, ginsenosides Re and Rc were sucessfuly separated with high purity. On the other hand,
three solvent systems were investigated for the isolation of salidroside and tyrosol using HPCCC. The
systematic and logical selection solvent system approach was firstly to search published papers for suitable
solvent systems for similar chemical structures or identical compounds. If these solvent systems were not found,
the new solvent system would be developed and tested based on the known solvent systems by a series of
empirical processes. A HPLC analytical method was developed to tolerate the phase system, allowing the
respective partition coefficients (KD) of the target compounds within phase systems to be calculated. A new
solvent system of MTBE/Butanol/ACN/Water solvent system with 4:2:4:10 ratio has been successfully
developed and applied for the first time in the separation of salidroside and tyrosol from the crude Rhodiola
rosea extraction.
Different CCC elution processes and methodology can be employed for the separation of TCM based on the
nature of target compound in the two phase solvent system and the natural behaviour of solvent system in the
CCC instrument. A rapid gradient method was used for the first time for the first step separation of ginsenosides
from the Panax ginseng. It was demonstrated it was an efficient method to purify compounds from natural
products with a wide range of polarities. In addition, several chromatographic parameters such as flow rate,

145
rotational speed and sample loading were optimized to improve the resolution and shorten the separation time
during both the isolation and purification process of Panax ginseng and Rhodiola rosea.
Linear and volumetric scale-up were investigated on the three HPCCC instruments for purification of
salidroside and tyrosol compounds from Rhodiola rosea. The process was first investigated on the analytical
Mini-HPCCC and then linearly scaled up to the preparative Midi-HPCCC. The separation parameters including
selection of solvent system, sample concentration, sample loading volume and flow rate were optimized on
analytical Mini-HPCCC. Furthermore, three different flow rates (2ml/min, 4ml/min and 8ml/min) were
investigated on the Spectrum and established a step-flow gradient model to achieve a reasonable purification of
salidroside and tyrosol compounds.Then optimized parameters and step-flow gradient model were successfully
scaled up to preparative Midi-HPCCC.
.
5.2 Conclusion
Panax ginseng and Rhodiola rosea are both typical traditional Chinese medicines characterized by high
pharmacological effects. Also they are treated as popular adaptogens for many years and play an important role
in the world drug market due to their anti-stress, anti-fatigue and cardioprotective effects. Many separation
technologies have been investigated for the isolation of different ginsenosides from the Panax species and
salidroside and tyrosol from the Rhodiola species such as thin layer chromatography (TLC), high-performance
thin-layer chromatography (HPTLC), high-performance liquid chromatography (HPLC), gas chromatography
(GC); capillary electrophoresis (CE) and counter current chromatography (CCC). Two developing isolation and
purification methods of HPCCC were investigated, one for Panax ginseng, one for Rhodiola rosea, and
demonstrated that HPCCC technology has huge advantages on separation and purification of ginsenosides from
Panax ginseng, salidroside and tyrosol from the Rhodiola rosea because of no solid absorption, large sample
loading, high g force, vigorous mixing and sufficient stationary phase retention.
A HPLC method has successfully been optimized for the quality control of Panax ginseng based on the
retention behavior of ginsenosides with RP-HPLC. The effects of solvent, pH value and ionic strength of the
mobile phase were investigated and demonstrated. This optimized method using gradient elution with
ammonium acetate salt and acetonitrile for simultaneous determination of several ginsenosides in ginseng
samples was established. Baseline separation of the seven polar ginsenosides Rg1, Re, Rb1, Rb2, Rb3, Rc and
Rd in Panax ginseng was achieved within 70 minutes. This optimized HPLC technique may serve as a valuable
tool for analysis of Panax ginseng and related herbs from Panax plants.
A simple solvent screening solvent system was successfully developed to select solvent gradients for CCC
separation of ginsenosides based on the KD values, settling time and phase ratio. The study indicated that the
phase ratio is a key parameter to ensure retention of the stationary phase in the column. The model was applied
toward the first step separation of ginsenosides from Panax ginseng and successfully developed a rapid gradient
method for the separation of ginsenosides with high stationary phase retention (77.6%). 1.60 mg of ginsenoside

146
Rd, 1.14 mg of ginsenoside Rg1, 1.89 mg of ginsenoside Rb1 and 2.12 mg of ginsenosides Rb2/Rb3 were
obtained from 43.92 mg crude sample extraction, with the purity of 96.3% and 98.6% yield, 88.5% and 95.8%
yield, 93.7% and 97.4% yield, 86.3% and 81.7% yield respectively. The model efficacy was significant when it
was applied for different solvent systems. Furthermore, 1.76 mg of ginsenoside Re and 1.28 mg of ginsenoside
Rc were obtained from the second step separation with the purity of 97.5% and 98.2% yield, 92.6% and 96.3%
yield respectively.
There are three published papers regarding separation of ginsenosides from the Panax ginseng using HPCCC
methods [72-74] discussed in detail in the literature review, Chapter 1 and in Tables 1.2.6.7.1 and 1.2.6.7.2. The
method described in this thesis was demonstrated to be more advantageous compared to those methods. Firstly,
it was at that time the first gradient method for the separation of ginsenosides from Panax ginseng using
HPCCC, shortened the separation time to 120 minutes. Conversely, Qi et al.and Cheng et al.’s methods [72, 73]
took 140 minutes even using a flow step gradient method. Another HPCCC method spent near 70 minutes to
separate only one ginsenoside Ro [74]. Secondly, in our studies no pre-purification was used for the preparation
of the crude sample Panax ginseng compared with these three methods, yet we achieved relatively high purities
of target ginsenosides (ginsenosides Rd with purity of 96.3%, ginsenosides Rg1 with purity of 88.5%,
ginsenosides Rb1 with purity of 93.7%, ginsenosides Rb2/Rb3 with purity of 92.3%, ginsenosides Re with purity
of 97.5% and ginsenosides Rc with purity of 92.6%). By contrast, solid chromatography was initially used to
enrich and purify ginsenosides in all of the other three methods such as macroporous resin [72, 73] and
medium-pressure liquid chromatography [74]. Finally, six different polar ginsenosides (Rd, Rg1, Rb1, Rb2/Rb3,
Re and Rc) were successfully isolated and purified using a two step HPCCC separation method compared to the
four ginsenosides (Rf, Rd, Re and Rb1) separated in Qi’s method [72], four ginsenosides (Re, Rb1, Rb2 and Rc)
in Cheng’s method [73] and one ginsenoside (Ro) in other Cheng’s method [74].
In addition, there were also three published papers for the separation of ginsenosides using the HSCCC methods
[75-77]. Compared to those HSCCC methods, our current HPCCC method achieved a rapid separation process
and high sample recovery because the HPCCC can provide higher “g” field level than HSCCC. Most of the
HSCCC methods spend more than 300 minutes for the whole separation of target ginsenosides [76, 77].
Furthermore, no pre-purification was used for the preparation of crude sample Panax ginseng in our current
method described in this thesis compared to those HSCCC methods. In these HSCCC methods, Ha et al.’s
method also used solid chromatography (reversed-phase C18 open column) to enrich target ginsenosides and the
purity of all of them was more than 95% [77]. Du’s HSCCC method was for the separation of traditional
Chinese medicine tablet not for the crude sample [75]. Only Cao et al. [76] did not use pre-purification for the
preparation of her crude sample, but provided no detail of purity and yield of target ginsenosides. Finally, it is
possible to note that these three HSCCC methods were used for the separation of Panax notoginseng [75, 76]
and Korean red ginseng [77], not for Panax ginseng.
After completing the writing of this thesis, two other papers for the separation of ginsenosides from the Panax
ginseng using the HSCCC method have been sourced [369,370]. They also have used pre-purification for the
sample preparation. Shehzad et al. employed macroporous resin following a two step extraction from the crude

147
sample Panax ginseng to purify the ginsenosides-protopanaxadiol (PPD) and protopanaxatriol (PPT) from the
ginseng extract [369,370]. In addition, they use conventional HSCCC methods for the separation of PPD and
PPT ginsenosides [369] and developed a one step gradient method for the separation of eight ginsenosides from
Panax ginseng to shorten the separation time [370], but both of the separation times were still more than 400
minutes and much longer than our 120 minutes described earlier with no pre-purification. Also this one step
gradient method did extra separation of ginsenoside Rh1, Rf and Rb2 from the ginseng extraction and they are not
acknowledge that isomers Rb2 and Rb3 co-elute as the method described in this thesis did. Moreover, the
solvent gradients selection in Shehzad’s method [370] were based on the three-stage screening process, which
was more complex compared to the simple solvent screening selection described in this thesis.
Therefore, based on the above discussion, this two-step HPCCC separation strategy and the gradient method
proved that they were rapid and high efficient methods for the separation of complex compounds from herbal
medicines with great advantages and this novel method could allow us to search for selecting solvent gradients
for CCC to purify compounds with a wide range of polarity from natural products. In addition, there was
evidence that an acidic environment solvent system was unsuitable for the separation of ginsenosides as it easily
leads ginsenosides to hydrolyze and decompose.
A simple, accurate and rapid HPLC method has also been established and validated to quantify and be used for
the quality control of Rhodiola rosea, which provided good linear relation (R2 > 0.9992) for the two target
compounds salidroside and tyrosol. There was also satisfactory precision (RSD values less than 1.24%) and
good recovery. The recoveries of salidroside were satisfactory between 98.9–101.57% with RSD 1.02% and the
recoveries of tyrosol were satisfactory between 95.95–100.18% with RSD 1.82%. The limit of detection (LOD)
was 2.25 ng for salidroside and 1.41ng for tyrosol. 31.32 mg/g of salidroside and 13.79 mg/g of tyrosol were
quantified from the crude sample extraction. The developed method could be suitable for use as a tool for
quantity and quality assurance and determination of the Rhodiola species.
A simple and fast orthogonal L9 (34) test design was successfully used and validated for the extraction of a
crude sample of Rhodiola rosea to optimize extraction parameters. Only 9 experiments replaced the initial 81
experiments to achieve the best extraction parameters. The crude sample extraction was performed with the
ratio of raw material to methanol solvent 1:20, the ratio of methanol to water1:9, the ultrasonic extraction
temperature 20 ºC and the duration of ultrasonic extraction 60 minutes. This effective method may be used as a
valuable tool for the industrial application for the extraction of natural herbs or plants.
A rapid step-flow gradient method was established for the first time for the large-scale preparation of
salidroside and tyrosol from Rhodiola rosea by HPCCC and successfully achieved high-throughput purification
of target compounds. Previously there had been only two published papers regarding the separation of
salidroside using HSCCC technology as described in the literature review, Chapter 1 [172, 173]. The method
described in this thesis demonstrates that it has many advantages over these previous publications for the
separation of salidroside and tyrosol. Firstly, it was the first time that salidroside and tyrosol had been
simultaneously separated from a Rhodiola rosea extract using HPCCC (the other two methods were only for the

148
separation of salidroside using HSCCC). Secondly, due to using HPCCC and flow step gradient, the whole
separation time for the salidroside and tyrosol was less than 100 minutes with the Midi-HPCCC in our study. In
contrast, in the other two methods, Li & Chen [172] performed HSCCC for a one-step separation of salidroside
in 150 minutes and Han et al. [173] used HSCCC for two-step separation of salidroside in 160 minutes. Thirdly,
based on the scale-up study, 28.2 mg of salidroside and 20.6 mg of tyrosol were successfully achieved from the
1000 mg crude sample Rhodiola rosea extraction using the Midi-HPCCC described in this thesis. While, 32 mg
of salidroside was achieved from the 250 mg crude sample Rhodiola sachalinensis extraction in Li & Chen’s
method [172] and 3.66 mg salidroside was achieved from the 200 mg crude sample Rhodiola crenulata
extraction in Han et al.’s method [173]. In addition, these two HSCCC methods were not used for the separation
of crude sample Rhodiola rosea.
Scale-up study was investigated on the three HPCCC instruments including the Mini (17.7 ml, coil volume),
Spectrum (143 ml, coil volume) and Midi (912 ml, coil volume). Linear and volumetric scale-up model were
demonstrated. The process was first investigated and optimized on the analytical Mini-HPCCC based on the
purity, yield and resolution of salidroside and tyrosol compounds, and then linearly scaled up to the preparative
Midi-HPCCC. Four optimized separation parameters were selected on analytical HPCCC including selection of
solvent system (MTBE/Butanol/ACN/Water phase system with 4:2:4:10 ratio), sample concentration (50
mg/ml), sample loading volume (2.5% of coil volume) and flow rate (0.5 ml/min).
Therefore, based on the above discussion, a rapid and high-throughput HPCCC purification method has been
successfully developed and demonstrated. Salidroside and tyrosol were successfully extracted with a respective
purity and yield of 93% and 97% for salidroside and 95% and 98% for tyrosol. The crude sample mass was
scaled up 47 times, which is impressive due to the fact that the Midi column is 2-fold longer and 5-fold wider
than the Mini column. Also preliminary research on the CCC scale-up process from the laboratory scale
technology to industrial scale was set up.
In conclusion, all the aims and objectives outlined in Chapter one have been met. This work has indicated that
Panax ginseng and Rhodiola rosea separation and purification by HPCCC was efficient for the quantitative and
qualitative control and contributes to the modernization of TCM.
5.3 Future work
Future work is required to eastablish a more integral and efficient solvent system screening model for the
selection of solvent gradients. My research study was based on the KD values, settling times and phase ratio,
which was good for individual gradients in CCC separation. However, these parameters are easily affected by
changing the mobile phase composition. Besides, it is difficult to maintain stationary phase retention in the CCC
column with the gradient elution. Therefore, it is necessary to establish a solvent system screening model for the
gradient separation of TCM by CCC. Another area of future work is searching for the suitable solvent system
for the separation and purification of ginsenoside Rb2 and Rb3, because they are isomers with the similar

149
structures and property and their aglycone moiety both belong to the same 20 (S)–protopanaxadiol. Furthermore,
the purified salidroside and tyrosol compounds require the HPLC–ESI-MS/MS system and NMR spectra to
identify their structures and verify the purity achieved from the CCC separation, because the mass spectrometry
can provide a powerful analytical ability to detect and quantify very limited amount of compounds and also
identify their chemical structures based on the ionization of a molecule. Finally, Further linear CCC scale-up
study will be investigated on the Maxi-DE centrifuge (4.5 L and 18 L capacity) for the isolation and purification
of Panax ginseng and Rhodiola rosea to match the industry requirement and develop a high productivity and
high flow through process at an industrial scale.

150
References
[1] Tung, N.H., Yang, S.Y., Kim, J.A., Song, G.Y., Kim, Y.H., 2010,31 (11) , 3423-3426.
[2] Kitts, D.D., Hu, C., Public Health Nutr. 2000, 3(4 A), 473-485.
[3] Jia, L, Zhao, Y., Curr Med Chem. 2009, 16(19), 2475-2484.
[4] Choi, K., Acta Pharmacol Sin. 2008, 29(9):1109-1118.
[5] Lee, S.Y., Kim, Y.K., N, Kim, C.S., Lee, C.Y., Park, S.U., 2010, 4(5), 349-353.
[6] Liu, C.X., Xiao, P.G., J. Ethnopharmacol., 1992, 36, 27-38.
[7] Morita, T., Kong, Y.C., But, P. P. H., Chemical and Pharmaceutical Bulletin, 1986, 34(10), 4368-4372.
[8] Xiang, Y.Z, Shang, H.C, Gao, X.M., Zhang, B., Phytotherapy Research. 2008, 22(7), 851-858.
[9] Zhang, X., Yu, L., Bi, H., Li, X., Ni, W., Han, H., Li, N., Wang, B., Zhou, Y., Tai, G.., Carbohydr Polym.
2009, 77(3), 544-552.
[10] Qiu, Y.Q., Lu, X., Pang, T., Ma, C.F., Li, X., Xu, G.W., Journal of separation science. 2008, 31(19), 3451-
3457.
[11] Brekhman, I.I., Dardymov, I.V., Annu Reo Pharmucol 2009, 419-430, 1969.
[12] Lazarev, N.V., Department of the USSR Navy.Leningrad. 1946, 5(17), 62–69.
[13] Brekhman, I.I., Eleutherococcus. Leningrad: Nauka, 1968, 1–168.
[14] Bahrke, M.S., Morgan,W.P., Sports Med, 1994,18, 229-248.
[15] Pieralisi, G.., Ripari, P., Vecchiet, L., Clin Ther 1991, 13, 373-382.
[16] Brekhman I.I., Dardymov I.V., Annu Rev Pharmacol 1969, 9, 419-430.
[17] Sonnerborn, U., Proppert, Y., Br J Phytother, 1991, 2, 3-14.
[18] Huang, K.C.,CRC Press, Boca Raton, FL, 1999.
[19] Attele, A.S., Wu, J.A., Yuan, C.S., Biochemical Pharmacology, 1999, Vol. 58, 1685–1693.
[20] Leung, K.W., Wong, A.S., Chinese Medicine, 2010, 5, 20.
[21] Scott, G.I., Colligan, P.B., Ren, B.H., Ren, J., J. Br. J. Pharmacol, 2001, 134, 1159- 1165.
[22] Chen, X., Pharmacol. Physiol, 1996, 23, 728 - 732.
[23]Mook Jung, I., Hong, H.S., Boo, J.H., Lee, K.H., Yun, S.H.; Cheong, M.Y., Joo, I., Jung, M.W., J.
Neurosci.Re., 2001, 63, 509-515.
[24] Petkov, V. D., Mosharrof, A.H., Am J Chin Med, 1987, 15(1– 2), 19– 29.
[25] Lee, S. R., Park, J. H., Choi, K. J., Kim, N. D., Kor. J. Ginseng Sci, 1997, 21, 132-140.

151
[26] Kim, H.S., Lee, E.H., Ko, S.R., Choi, K.J., Park, J.H., Im, D.S., Arch Pharm Res, 2004, Vol 27, No 4, 429-
435.
[27] Corbit, R.M., Ferreira, J. F. S., Ebbs, S.D., Murphy, L. L., J. Agric. Food Chem., 2005, 53, 9867–9873.
[28] Dong, T.T., Zhao, K.J., Huang, W.Z., Leung K.W., Tsim, K.W., Phytother. Res., 2005, 19, 684–688.
[29] Quan, L., Li, S., Tian, S., Xu, H., Lin, A., Gu, L., J. Supercrit. Fluids, 2006, 39, 40–47.
[30] Kim, S. J., Murthy, H. N., Hahn, E. J., Lee, H. L., Paek, K. Y., Sep. Purif. Technol., 2007, 56, 401–406.
[31] Sun, B. S., Gu, L. J., Fang, Z. M., Wang, C. Y., Wang, Z., Lee, M. R., Li, Z., Li, J. J., Sung, C. K., J. Pharm.
Biomed. Anal., 2009, 50, 15–22.
[32] Ligor, T., Ludwiczuk, A., Wolski, T., Buszewski, B., Anal. Bioanal. Chem., 2005, 383, 1098–1105.
[33] Kwon, J. H., Belanger, J. M., Pare, J. R., J. Agric. Food Chem., 2003, 51, 1807–1810.
[34] Wang, Y. T., You,J. Y., Yu, Y., Qu, C. F., Zhang, H. R., Ding, L., Zhang, H. Q., Li, X. W., Food Chem.,
2008, 110, 161–167.
[35] Wood, J. A., Bernards, M. A., Wan, W. K., Charpentier, P. A., J. Supercrit. Fluids, 2006, 39, 40–47.
[36] Wan, J. B., Li, S. P., Chen, J. M., Wang, Y. T., J. Sep. Sci., 2007, 30, 825–832.
[37] Engelberth, A. S., Clausen, E. C., Carrier, D., J. Sep. Purif. Technol., 2010, 72, 1–6.
[38] Wu, J., Lin, L., Chau, F. T., Ultrason. Sonochem., 2001, 8, 347–352.
[39] Fuzzati, N., 2004,812, 119–133.
[40] Ohno, T., Mikami, E., Oka, H., J. Nat. Med., 2006, 60, 141–145.
[41] Glensk, M., Czekalska, M., Cisowski, W., J. Planar Chromatogr., 2001, 14, 454.
[42] Kevers, C., Jacques, P., Gaspar, T., Thonart, P., Dommes, J., J.Chromatogr. Sci., 2004, 42, 554–558.
[43] Vanhaelen-Fastre, R. J., Faes, M. L., Vanhaelen, M. H., J. Chromatogr., A, 2000, 868, 269–276.
[44] Htittenhain, S. H., Hoffmann, C., J.Chemosphere, 1998, 31 (9-12), 2315-2384.
[45] Hostettmann, K., Terreaux, C., 2000, 3296-3303.
[46] Cheng, Y., Liang, Q., Hu, P., Wang, Y., Jun, F.W., J.Separation and Purification Technology, 2010, 73 (3),
397-402.
[47] Still, W. C., Kahn, M.; Mitra, A., J. Org. Chem 1978, 43, 2923-2925.
[48] Kim, I.W., Hong, H. D., Choi, S.Y., Hwang, D. H., Her, Y., Kim, S.K., Journal of Ginseng Research, 2011,
35 (4), 487-496.
[49] Hu, P., Luo, G. A., Wang, Q., Zhao, Z.Z., Wang, W., Jiang, Z. H., Arch Pharm Res, 2008, Vol 31, No 10,
1265-1273.

152
[50] Qi, L.W., Wang, C. Z., Yuan, C. S., Natural Product Reports, 2011, 28 (3), 467-495.
[51] Quiming, N. S., Denola, N. L., Saito, Y., Jinno, K., J. Sep. Sci., 2008, 31, 1550–1563.
[52] Bonfill, M, Casals, I, Palazon, J, Mallol, A, Morales, C, Biomed Chromatogr, 2002,16, 68–72.
[53] Quiming, N. S., Denola, N. L., Soliev, A. B., Saito, Y., Jinno, K., Chromatographia, 2007, 66, 5–11.
[54] Li, L., Luo, G. A., Liang, Q. L., Hu, P., Wang, Y. M., J. Pharm. Biomed. Anal., 2010, 52, 66–72
[55] Dan, M., Su, M. M., Gao, X. F., Zhao, T., Zhao, A. H., Xie, G. X., Qiu, Y. P., Zhou, M. M., Liu, Z., Jia, W.,
Phytochemistry, 2008, 69, 2237–2244.
[56] Xie, G. X., Ni, Y., Su, M. M., Zhang, Y. Y., Zhao, A. H., Gao, X. F., Liu, Z., Xiao, P. G.., Jia, W.,
Metabolomics, 2008, 4, 248–260.
[57] Guan, J., Lai, C. M., Li, S. P., J. Pharm. Biomed. Anal., 2007, 44, 996–1000.
[58] Deng, G. F., Wang, D. I., Meng, M. X., Hu, F., Yao, T. W., J. Chromatogr., B, 2009, 877, 2113–2122.
[59] El-Aty, A. M. A., Kim, I. K., Kim, M. R., Lee, C., Shim, J. H., Biomed. Chromatogr., 2008, 22, 556–562.
[60] Li, P., Qi, L. W., Liu, E. H., Zhou, J. L., Wen, X. D., TrAC-Trends Anal. Chem., 2008, 27, 66–77
[61] Richter, R., Basar, S., Koch, A., J, Phytochemistry 66 (2005) 2708–2713
[62] Wong, J. W., Zhang, K., Tech, K., Hayward, D. G.., Krynitsky, A. J., Cassias, I., Schenck, F. J., Banerjee,
K., Dasgupta, S., Brown, D., J. Agric. Food Chem., 2010, 58, 5884–5896.
[63] Adahchour, M., Beens, J., Vreuls, R.J.J., Brinkman, U.A.T., Trends Anal. Chem., 2006, 25, 438, 540, 726,
821.
[64] Shellie, R. A., Marriott, P. J., Huie, C. W., J. Sep. Sci. 2003, 26, 1185 – 1192.
[65] Qiu, Y. Q., Lu, X., Pang, T., Ma, C. F., Li, X., Xu, G..W., J. Sep. Sci., 2008, 31, 3451–3457.
[66] Pappas, T. J., Gayton-Ely, M., Holland, L. A., Electrophoresis, 2005, 26, 719–734.
[67] Glöckl, I., Veit, M., Blaschke, G., Planta Med., 2002, 68, 158.
[68] Cao, J., Li, B., Chang, Y. X., Li, P., Electrophoresis, 2009, 30, 1372– 1379.
[69] Wang, S. F., Ye, S., Cheng, Y. Y., J. Chromatogr., A, 2006, 1109, 279–284.
[70] Huie, C. W., Electrophoresis, 2006, 27, 60–75.
[71] Cao, J., Yi, L., Li, P., Chang, Y. X., J. Chromatogr., A, 2009, 1216, 5608–5613.
[72] Qi, X. C., Ignatova, S., Luo, G. A., Liang, Q. L., WuJun, F., Wang, Y. M., Sutherland,I.A., J. Chromatogr, A,
2010, 1217, 1995-2001.
[73] Cheng, Y., Zhang, M., Liang, Q., Hu, P., Wang, Y., Jun, F.W., Luo, G., Separation and Purification
Technology, 2011, 77 (3), 347-354.
153
[74] Cheng, Y.J., Liang, Q.L., Hu, P., Wang, Y.M., Wu Jun, F., Luo, G .A., Sep. Purif. Technol., 2010, 73, 397–
402.
[75] Du, Q., Jerz, G.., Waibel, R., Winterhalter, P., J. Chromatogr. A, 2003, 1008, 173–180.
[76] Cao, X.L., Tian, Y., Zhang, T.Y., Liu, Q.H., Jia, L.J., Ito, Y., J. Liq. Chromatogr. Rel. Technol., 2003, 26,
1579–1591.
[77] Ha, Y.W., Lim, S.S., Ha, I.J., Na, Y.C., Seo, J.J., Shin, H., Son, S.H., Kim,Y.S., J.Chromatogr.A, 2007,
1151, 37–44.
[78] Sutherland, I.A., Fisher, D., J. Chromatogr. A, 2009, 1216, 740.
[79] Pharmacopoeia of China,The Pharmacopoeia Commission of China Beijing,1997.
[80] Yu, Z., Bo, C., Yao, S. Z., Separation and Purification Technology, 2007, 52, 533–538.
[81] Wang, C. Z., H. Aung, H., Ni,M., Wu, J. A., Tong, R. B., Wicks,S., He,T. C., Yuan, C. S., Planta Med.,
2007, 73, 669–674.
[82] Wang, C.Z., Wu, J.A., E. McEntee, Yuan,C.S., J. Agric. Food Chem., 2006, 54, 2261–2266.
[83] Zhou, W., Li, J.Y., Li, X.W., Qin, Y., Zhou, E., Journal of Separation Science,2008, 31 (6-7), 921-925.
[84] Zang, P., Zhang, P.J., Gao, Y.G., Hao, J.X., Wang, Y. X., Li, R., Yang, H., Li, X., Li, P., Zhou, D. W., Zhang,
L. X., J. Med. Plants Res., 2011, 5 (23), 5513-5516.
[85] Lee, M.J., Choi, L.J., Cha, S.W., Lee, K.S.Al., Process Biochemistry, 2011, 46 (1), 258-264.
[86] Zhao, J.K., Wang, D.S., Duan, S.R., Wang, J.X., Bai, J., Li, W.L., Arch Pharm Res, 2009,32 (7), 989-996.
[87] Qian, Z.M., Lu, J., Gao, Q.P., Li, S.P., J. Chromatogr., A, 2009, 1216 (18), 3825-3830.
[88] Fuzzati, N., J. Chromatogr., B, 2004, 812, 119–133.
[89] Avery, B.A., Venkatesh, K.K., Avery, M.A., J. Chromatogr. B, 1999, 730, 71–80.
[90] Caraponovo, F.F., Wolfender, J.L., Maillard, M.P., Potterat, O., Hostettman, K., Phytochem. Anal., 1995, 6,
141–148.
[91] Park, M.K., Park, J.H., Han, S.B., Shin, Y.G., Park, I.H., J. Chromatogr.A, 1996,736, 77.
[92] Wan, J.B., Li, S.P., Chen, J.M., Wang, Y.T., J. Sep. Sci., 2007, 30, 825–832.
[93] Qi, L.W., Yu, Q.T., Li, P., Li, S.L., Wang,Y.X., Sheng, L.H., Yi, L., J. Chromatogr., A, 2006, 1134, 162–
169.
[94] Cao, J., Wei ,Y.J., Qi, L.W., Li, P., Qian, Z.M., Luo, H.W., Chen, J., Zhao, J., Biomed. Chromatogr., 2008,
22, 164–172.
[95] Kwon, S.W., Han, S.B., Park,I. H., Kim, J.M., Park,M.K., Park, J.H., J. Chromatogr. A, 2001,921, 335.

154
[96] Li, W., Fitzloff, J.F., J. Pharm. Biomed. Anal., 2001, 25, 257.
[97] Dixon, R.W., Peterson, D.S., Anal. Chem., 2002, 74, 2930–2937.
[98] Koropchak, J.A., Magnusson, L.E., Heybroek, M., Sadain,S., Yang, X., Anisimov, M. P., Adv. Chromatogr.,
2000, 40, 275–314.
[99] Kim, B.Y., Lee, M.Y., Cho, K.H., Park, J.H., Park, M.K..J, Archives of Pharmacal Research., 1992, 15 (4),
328-332.
[100] Park, M.K., Park, J.H., Han, S.B., Shin, Y.G., Park, L.H., Yaowu, Fenxi Zazhi, 1996, 16, 412.
[101] Park, M.K., Kim, B.K., Park, J.H., Shin, Y.G., J. Liq. Chromatogr A1995, 18, 2077.
[102] Park, M.K., Kim, B.K., Park, J.H., Shin, Y.G., Cho, K.H., Do, Y.M., Arch. Pharm. Res., 1996, 19, 562.
[103] Shangguan, D., Han, H., Zhao, R., Zhao, Y., Xiong, S., Liu, G., J.Chromatogr A, 2001, 910, 367.
[104] Vehovec, T., Obreza, A., J. Chromatogr., A, 2010, 1217, 1549–1556.
[105] Bai, C.C., Han, S.Y., Chai, X.Y., Jiang, Y., Li, P., Tu, P.F., J. Liq.Chromatogr Relat Technol., 2009, 32,
242–260.
[106] Wang, L., He, W.S., Yan, H.X., Jiang, Y., Bi, K.S., Tu, P.F., Chromatographia, 2009, 70, 603–608.
[107] Jeong, J.S., Yoon, H.R., Hong, S.P., J. Chromatogr. A, 2007, 1140, 157–162.
[108] Cai, Y., Liu, J., Shi, Y., Liang, L., Mou, S., J. Chromatogr. A, 2005, 1085, 98.
[109] Kwon, H.J., Jeong, J.S., Lee, Y.M., Hong, S.P., J. Chromatogr. A, 2008, 1185, 251–25.
[110] Kwon, H.J., Jeong, J.S., Sim, H.J., Lee, Y.M., Kim, Y.S., Hong, S.P,. J. Chromatogr. A, 2009, 1216, 4445–
4450.
[111] Lee, S. I., Kwon, H.J., Lee, Y. M., Lee, J .H., Hong, S. P., Journal of Pharmaceutical and Biomedical
Analysis, 2012, 60, 80– 85.
[112] Hattori, M., Kawata,Y., Kakiuchi, N., Matsuura, K., Tonimori, T., Namba,T., Chem. Pharm. Bull. 1988,
36, 4467.
[113] Hattori, M., Kawata,Y., Kakiuchi, N., Matsuura, K., Tonimori, T., Shoyakugaku Zasshi, 1988, 42, 228.
[114] Park, M.K., Park, J.H., Hwang, G.S., Lee, M.Y., Park, I. J., Korean J. Ginseng Sci., 1995, 19, 134.
[115] Leung, K. S., Chan, Y. K., Bensoussan, A., Munroe, M. J., Phytochem. Anal., 2007, 18, 146–150.
[116] Ma, X., Xiao, H.B., Liang, X.M., Chromatographia, 2006, 64, 31–36.
[117] Liu, Y., Li, J., He, J., Abliz, Z., Qu, J., Yu, S., Ma, Liu, S., J., Du, D., Rapid Commun. Mass Spectrom.,
2009, 23, 667–679.
[118] Liu, S., Cui, M., Liu, Z., Song , F., Mo,W,. Soc, J., Mass Spectrom., 2004, 15, 133–141.

155
[119] Hayward, D. G., Wong, J. W., Anal. Chem., 2009, 81, 5716–5723.
[120] Kite, G. C., Howes, M. J. R., Leon, C. J., Simmonds, M. S. J., Rapid Commun. Mass Spectrom., 2003, 17,
238–244.
[121] Cho, W.C.S., Yip, T.T., Chung, W. S., Lee, S.K. W., Leung, A.W.N., Cheng, C.H.K., Yue, K.K.M., J.
Ethnopharmacol., 2006, 108, 272–279.
[122] Li, S.L., Lai, S.F., Song, J.Z., Qiao, C.F., Liu, X., Zhou,Y., Cai, H., Cai, B.C., Xu, H.X., J. Pharm.
Biomed. Anal., 2010, 53, 946–957.
[123] Kong, H., Wang, M., Venema, K., Maathuis, A., van der Heijden, R., van der Greef, J., Xu, G.,
Hankemeier,T., J. Chromatogr., A, 2009, 1216, 2195–2203.
[124] Ji, Q.C., Harkey, M.R., Henderson,G.L., Gershwin, M.E., Stern, J.S., Hackman, R.M., Phytochem. Anal.,
2001, 12,320.
[125] Wang, X., Sakuma, T., Asafu-Adjaye, E., Shiu, G.K., Anal. Chem, 1999, 71, 1579.
[126] Chan, T.W.D., But, P.P.H., Cheng, S.W., Kwok, I.M.Y., Lau, F.W., Xu, H.X., Anal. Chem., 2000,72,1281
[127] Li, W., Gu, C., Zhang, H., Awang, D.V.C., Fitzloff, J.F., Fong, H.H.S., van Breemen, R.B., Anal. Chem.,
2000, 725,417.
[128] Ha, Y.W., Ahn, K.S., Lee, J.C., Kim, S.H., Chung, B.C., Choi, M.H., Anal. BioAnal. Chem., 396, 3017–
3025.
[129] Ji, Q.C., Harkey, M.R., Henderson, G.L., Gershwin, M.E., Stern, J.S., Hackman, R.M., Phytochem. Anal.,
2001, 12, 320–326.
[130] Li, S.L., Lai, S.F., Song, J.Z., Qiao, C.F., Liu, X., Zhou, Y., Cai, H., Cai, B.C,. Xu,H.X., J. Pharm.
Biomed. Anal., 2010, 53, 946–957.
[131] Hao, H., Cui, N., Wang, G., Xiang, B., Liang, Y., Xu, X., Zhang, H., J. Yang, Zheng, C., Wu, L., Gong, P.,
Wang, W., Anal. Chem., 2008, 80, 8187–8194.
[132]Fukuda, N., Tanaka, H., Shoyama, Y., J.The Royal Society of Chemistry, 2000,125, 1425–1429.
[133] Morinaga, O., Tanaka, H., Shoyama, Y., J. Chromatogr. B, 2006, 830 (1), 100–104,
[134] Fukuda, N., Tanaka, H., Shoyama, Y., Journal of Natural Products, 2000, 63 (2), 283–285,
[135] Putalun, W., Fukuda, N., Tanaka, H., Shoyama, Y., Anal. Bioanal. Chem., 2004, 378, 1338–1341.
[136] Sritularak, B., Morinaga, O., Yuan, C. S., Shoyama,Y., Tanaka, H., J. Nat. Med., 2009, 63, 360–363.
[137] Morinaga, O., Uto,T., Yuan, C. S., Tanaka, H., Shoyama,Y., Fitoterapia, 2010, 81, 284–288.
[138] Morinaga, O., Tanaka, H., Shoyama,Y., Analytical Letters,2006,39 (2), 287-296.

156
[139] Saratikov, A.S., Krasnov, E.A., Tomsk, Russia: Tomsk State University Press; 1987
[140] Zhang, S.Q., Sun, F., Liu, Z.Y., Yu, Q.F., Zhang, F.M., Chen, X.Q., Jilin Trad. Chin. Med.,1999, 4, 56.
[141] You, D.Q., Zou, L. F., Gao, F., Ding, X.G., Yang, P., Han, L., Chen, Q., Cai, J.M., Acad. J. Sec. Mil. Med.
Univ, 2003, 24, 1187.
[142] Saratikov, A.S., Krasnov, E.A., Khnikina, L. A., Duvidson, LM., Proc Siberian Acad Sci Biol, 1967, 1,
54–60.
[143] Kurkin, V.A., Zapesochnaya, G.G., J Med Plants, 1985, 1231–445.
[144] Linh, P.T, Kim, Y.H., Hong, S.P., Jian, J.J., Kang, J.S., Arch Pharm Res, 2000, 23, 349–52.
[145] Rohloff, J., Phytochemistry, 2002, 59, 655–661.
[146]Saratikov, A.S., Krasnov, E.A., Chnikina, L.A., Duvidson, L.M., Sotova, M.I., Marina, T.F., Nechoda,
M.F., Axenova, R.A., Tscherdinzeff, S.G., Pharmazie, 1968, 23, 392–395.
[147] Spasov, A.A., Wikman, G.K., Mandrikov,V.B., Mironova,I.A., Neumoin,V.V., Phytomedicine, 2000, 7,
85–89.
[148] Wang, S.H., Wang, W.J., Wang, X.F., Chen, W.H., Zhong Xi Yi Jie He Xue Bao, 2008, 2, 193–195.
[149] Kucinskaite, A., Briedis, V., Savickas, A. Medicina (Kaunas, Lithuania), 40 (7), 614-61.
[150] Zhang, J., Liu, A., Hou, R., Zhang, J., Jia, X., Jiang, W., Chen, J., Eur. J. Pharmacol, 2009, 607-614.
[151] Pooja, Bawa, A.S., Khanum, F., Phytother.Res., 2009, 23,1099–1102.
[152] Panossian , A., Wikmana, G., Sarris, J., J. Phytomedicine, 2010, 17, 481–493.
[153] Wang, H., Li, Y., Ding, C., Zhao, X., You, J., Suo, Y. J., Liq. Chromatogr. Rel. Technol., 2006, 29(6), 857-
68.
[154] Linh, P.T., Kim, Y.H., Hong, S.P., Jian, J.J., Kang, J.S., Arch Pharm Res., 2000, 23(4), 349-352.
[155] Tolonen, A., Pakonen, M., Hohtola, A., Jalonena, J., Chem. Pharm. Bull. 2003b, 51, 467–470.
[156] Ganzera, M., Yayla, Y., Khan, I.A., Chemical and Pharmaceutical Bulletin., 2001, 49(4), 465-467.
[157] Peng, Y., Luo, J., Lu, Q., Chen, X., Xie, Y., Chen, L., et al. J. Pharm Biomed Anal., 2009, 49(3), 828-832.
[158] Petsalo, A., Jalonen, J., Tolonen, A., J. Chromatogr., A, 2006, 1112(1-2), 224-231
[159] Avula, B., Wang, Y., Ali, Z., Smillie, T.J., Filion, V., Cuerrier, A., et al. Biomedical Chromatography.
2009, 23(8), 865-872.
[160] Tolonen, A., Hohtola, A., Jalonen, J., Journal of Mass Spectrometry., 2003, 38(8), 845-853.
[161] Brown, R.P., Gerbarg, P.L., Ramazanov, Z., HerbalGram 56 (2002) 40–52.
[162] Tolonen. A., Uusitalo, J., Rapid Communications in Mass Spectrometry., 2004, 18(24), 3113-3122.

157
[163] Chang, Y., Yao, H., Hsieh, S., Lu, T., Yeh.T., J. Chromatogr., B, Analytical Technologies in the
Biomedical and Life Sciences, 2007, 857(1), 164-169.
[164] Kučinskaite, A., Pobłocka-Olech, L., Krauze-Baranowska, M., Briedis, V., Savickas, A., Sznitowska, M.,
Journal of Planar Chromatography - Modern TLC., 2007, 20(2), 121-125.
[165] Rumalla, C.S., Avula, B., Ali, Z., Smillie, T.J., Filion, V., Cuerrier, A et al. Journal of Planar
Chromatography - Modern TLC., 2011, 24(2), 116-120.
[166] Ma, Y., Wang, X., Hou, F., Ma, J., Luo, M., Lu, S et al., J. Pharm Biomed Anal., 2011, 55(5), 908-915.
[167] Suo, Y., Wang, H., Li, Y., You, J., Wang, H., Chromatographia, 2004, 60(9-10), 589-595.
[168] Liu, S., Yi, L., Liang, Y.., J Sep Sci., 2008, 31(11), 2113-2137.
[169] Ma, C., Tang, J., Wang, H., Tao, G., Gu, X., Hu, L., Journal of Separation Science., 2009, 32(2),185-191.
[170] Ma, C., Tao, G., JianTang, Lou, Z., Wang, H., Gu, X et al., Separation and Purification Technology., 2009,
69(1), 22-8.
[171] Yin, Z., Zhang, B., Chen, H., Wang, S., Zhao, W., Frontiers of Agriculture in China., 2011, 5(4), 637-642.
[172] Li, H., Chen, F., J. Chromatogr., A, 2001, 932(1-2), 91-95.
[173] Han, X., Zhang, T., We,i Y., Cao, X., Ito, Y., J. Chromatogr., A, 2002, 971(1-2), 237-241.
[174] Du, M., Xie, J.M., Phytochemistry., 1995, 38(3), 809-810.
[175]Akgul, Y., Ferreira, D., Abourashed, E. A., Khan, I. A., Fitoterapia., 2004, 75(6), 612-614.
[176] Ma, C, Tang, J., Wang, H., Gu, X., Tao, G., Chromatographia., 2008, 67(5-6), 383-388.
[177] Mao, Y., Li, Y., Ya,o N., J Pharm Biomed Anal., 2007, 45(3),510-515.
[178] Bi, H., Zhang, S., Liu, C., Wang, C., J. Food Process Eng., 2009, 32(1), 53-63.
[179] Zhang, X., Yu, L., Bi, H., Li, X., Ni, W., Han, H., et al., Carbohydr Polym., 2009, 77(3), 544-552.
[180] Ito, Y., Bowman, R. L., Science, 1970, 167, 281–283.
[181] Qiu, Y., Lu, X., Pang, T., Ma, C., Li, X., Xu, G.. Journal of separation science., 2008, 31(19), 3451-3457.
[182] Van Der Heijden, R, Hermans-Lokkerbol, A., Verpoorte, R., Baerheim Svendsen, A., J. Chromatogr A.,
1987, 396(C), 410-415.
[183] Weisz, A., Mazzola, E.P., Ito, Y., J. Chromatogr A., 2009, 1216(19), 4161-4168.
[184] Lu, Y., Ma, W., Hu, R., Berthod, A., Pan, Y., J. Chromatogr A., 2009, 1216(19), 4140-4146.
[185] Lu, Y., Pan, Y., Berthod, A., J Chromatogr A., 2008, 1189(1-2), 10-18.
[186] Wu, S., Yang, L., Gao, Y., Liu, X., Liu, F.. J. Chromatogr A., 2008, 1180(1-2), 99-107.
[187] Yang, F.Q., Quan, J., Zhang, T.Y., Ito, Y., J. Chromatogr A., 1998, 803(1–2), 298–301.

158
[188] Wei, J., Zhang, T., Ito, Y., J. Liq Chromatogr Relat Technol., 2005, 28(12-13), 1903-1911.
[189] Chen, L., Games, D.E., Jones, J., Kidwell, H., J. Liq Chromatogr Relat Technol., 2003, 26(9-10), 1623-
1636.
[190] Lee, Y., Pack, T.W., Voyksner, R.D., Fang, Q.C., Ito, Y., J Liq Chromatogr., 1990, 13(12), 2389-2398.
[191] Janaway, L., Hawes, D., Ignatova, S., Wood, P, Sutherland, I.A., J Liq Chromatogr Relat Technol. 2003,
26 (9-10), 1345-54.
[192] Chen, L.J., Song, H., Games, D.E., Sutherland, I.A., J Liq Chromatogr Relat Technol., 2005, 28(12-13),
1993-2003.
[193] Markus, G., Hermann, S., Curr Pharm. Anal., 2005, 1(2), 135-146.
[194] Cao, X.L., Tian, Y., Zhang, T.Y., Liu, Q.H., Jia, L.J., Ito, Y., J Liq Chromatogr Relat Technol., 2003, 26(9–
10), 1579–1591.
[195] Gutzeit, D., Winterhalter, P., Jerz, G., J. Chromatogr A, 2007, 1172, 40–46.
[196] Zhou, T., Chen, B., Fan, G., Chai, Y., Wu, Y., J. Chromatogr A, 2006, 1116, 39 (2), 97–101.
[197] Sutherland, I.A., J. Chromatogr A, 2007, 1151 (1-2), 6-13.
[198] Sutherland, I.A., Hawes, D., Ignatova, S., Janaway, L., Wood, P., Journal of Liquid Chromatography and
Related Technologies, 2005, 28(12-13), 1877-1891.
[199] Berthod, A., Maryutina, T., Spivakov, B., Shpigun, O., Sutherland, I.A., Pure and Applied Chemistry.,
2009, 81(2), 355-87.
[200] Pan, Y.J., Lu, Y.B., J Liq Chromatogr Relat Technol., 2007, 30, 649–679.
[201] Ito Y., Comprehensive Analytical Chemistry, 2002, 38.
[202] Conway, W.D., Theory and Application, New York, VCH, 1990.
[203] Berthod, A., Schmitt, N., Talanta., 1993, 40, 1489–1498.
[204] Menet, J.M., Thiebaut, D., Rosset, R., Wesfreid, J.E., Martin, M., Anal Chem., 1994, 66,168–176.
[205] Berthod, A., J Chromatogr., 1991,550, 677–693.
[206] Du, Q.Z., Wu, C.J., Qian, G.J., Wu, P.D., Ito, Y., J Chromatogr A., 1999, 835, 231–235.
[207]Wood, P.L., Hawes, D., Janaway, L., Sutherland, I.A., J Liq Chromatogr Relat Technol., 2003, 26, 1373–
1396.
[208] He, C. H., Zhao, C. X., AIChE Journal, 2007, 53 (6), 1460-1471.
[209] Foucault, A.P., Bousque,t O., Le Goffic, F., J Liq Chromatogr., 1992, 15, 2721–2733.
[210] Berthod, A., Malle,t A.I., Bully, M., Anal Chem., 1996, 68, 431–436.

159
[211] Yin, L., Li, Y., Lu, B., Jia, Y., Peng, J., Separation and Purification Reviews., 2010, 39(1-2), 33-62.
[212] Pauli, G. F., Samuel, M., Pro, J., Friesen, J.B., Nat. Prod. 2008, 71, 1489–1508.
[213] Ito, Y., J. Chromatogr A., 2005, 1065, 145-168.
[214] Oka, F., Oka, H., Ito, Y., J. Chromatogr A 1991, 538 (1), 99–108.
[215] Camacho-Frias, E., Foucault, A., Analusis, 1996, 24, 159.
[216] Friesen, J.B., Pauli, G. F., J. Chromatogr A, 2007, 1151 (2007), 51–59.
[217]Oliveira, R.R., Leitao, G.G., Moraes, M.C.C., Kaplan, M.A.C., Lopes, D., Carauta, J.P.P., J. Liq.
Chromatogr. Ret. Technol., 2005, 28(12–13), 1985–1992.
[218] Ito, Y., Goto, T., Yamada, S., Matsumoto, H., Oka, H., Takahashi, N., Nakazawa, H., Nagase, H. and Ito,
Y., J. Chromatogr A, 2006, 1108(1), 20–25.
[219] Du, Q.Z., Wu, C.J., Qian, G.J., Wu, P.D. and Ito, Y., J. Chromatogr A, 1999, 835(1–2), 231–235.
[220] Okunji, C., Komarnytsky, S., Fear, G.; Poulev, A., Ribnicky, D.M., Awachie, P.I., Ito, Y., Raskin, I., J.
Chromatogr. A, 2007, 1151(1–2), 45–50.
[221] Wang, X., Liu, J.H., Zhang, T.Y., Ito, Y., J. Liq Chromatogr. Relat Technol., 2007, 30(17), 2585–2592.
[222] Liu, Z.H., Du, Q.Z., Wang, K.W., Xiu, L.L., Song, G.L., J. Chromatogr A, 2009, 1216(22), 4663–4667.
[223] Cooper, R.A., Bowers, R.J., Beckham, C.J., Huxtable, R.J., 1996.
[224] Berthod, A., Ruiz-Angel, M.J., Carda-Broch, S., Anal. Chem., 2003, 75(21), 5886–5894.
[225] Berthod, A., Hassoun, M., Harris, G., J Liq. Chromatogr Relat Technol., 2005, 28(12–13), 1851–1866.
[226] Wei, Y., Zhang, T. Y., Ito, Y., J. Chromatogr A, 2001, 917, 347–351.
[227] Heuvel, R.van den., Sutherland, I.A., J. Chromatogr. A, 2007, 1151, 99–102.
[228] Wang, X., Geng, Y. L., Li, F. W., Gao, Q. S., Shi. X. G.., J. Chromatogr. A, 2006, 1103: 166–169.
[229] Wei, J., Zhang, T.Y., Ito, Y., J. Liq. Chromatogr. Relat Technol., 2005, 28(12–13), 1903–1911.
[230] Wu, S.H., Yang, L., Gao, Y.A., Liu, X.Y., Liu, F.Y., J. Chromatogr A, 2008, 1180(1–2), 99–107.
[231]Yang, F.Q., Quan, J., Zhang, T.Y., Ito, Y., J. Chromatogr A, 1998, 803(1–2), 298–301.
[232] Cao, X.L., Tian, Y., Zhang, T.Y., Liu, Q.H., Jia, L.J. and Ito, Y., J. Liq. Chromatogr Relat. Technol., 2003,
26(9–10), 1579–1591.
[233] Lee, Y.W.; Pack, T.W.; Voyksner, R.D.; Fang, Q.C.; Ito, Y., J. Liq. Chromatogr., 1990, 13, 2389-2398.
[234]Oka, H., Ikai, Y., Kawamura, N., Hayakawa, J., Harada, K.I., Murata, H., Suzuki, M., Ito, Y., Anal. Chem.,
1991, 63, 2861-2865.
[235] Chen, L.J., Song, H., Games, D. E., Sutherland, I.A., J. Liq. Chromatogr. Relat Technol., 2005, 28, 1993-

160
2003.
[236] Ito, Y., J. Chromatogr A, 2005, 1065, 145–168.
[237] Guzlek, H., Wood, P., Janaway, L., J. Chromatogr. A, 2009, 1216, 4181–4186.
[238] Di, D., Zheng, Y., Chen, X., Huang, X., Feng, S., Fenxi Huaxue/ Chinese Journal of Analytical
Chemistry., 2011, 39(2), 269-75.
[239] Pauli, G. F., Samuel, M., Brent, F. J., J. Nat. Prod. 2008, 71, 1489–1508.
[240] Zhao, C. X., He, C. H., J. Chromatogr. A, 2007, 1146, 186–192.
[241] Sutherland, I.A., Hewitson,P., Ignatova S., J. Chromatogr A, 2009, 1216, 8787–8792.
[242] Wood, P.; Ignatova, S.; Janaway, L.; Keay, D.; Hawes, D.; Garrard,I.; Sutherland, I.A., J. Chromatogr. A
2007, 1151(1, 2), 25–30.
[243] Chen, L. J.; Zhang Q. , Yang G. L., , Fan L.Y., , Tang J., Garrard I., Ignatova S., Fisher D., Sutherland,
I.A., J. Chromatogr. A, 2007 1142, 115–122.
[244] Wood P., Ignatova S., Janaway L., Keay D., Hawes D., Garrard I., Sutherland I.A., J. Chromatogr. A,
2007, 1151, 25.
[245] Sutherland, I.A., Hewitson,P., Ignatova S., J. Chromatogr A, 2009, 1216, 4201.
[246] Guzlek, H., Baptista ,Ines I.R., Wood, P., Livingston, A., J. Chromatogr. A, 2010, 1217 6230–6240.
[247] Friesen, J.B., Pauli, G.F., J. Chromatogr A, 2007, 1151(1, 2), 51–59.
[248] Chen, L. J., Songb, H., Lanb, X.Q., Gamesc, D.E., Sutherland, I.A., J. Chromatogr. A, 2005, 1063, 241–
245.
[249] Berthod, A., Friesen, J. B., Inui, T.; Pauli, G. F., Anal. Chem., 2007, 79, 3371–3382.
[250] Cao, X. L., Beijing: Chemical Industry Press, 2005, 39-42.
[251] Wu, F.H., Geng, P. L., Journal of Chinese herbal medicines, 2002, 25(1), 65-66.
[252] Dou, G., Journal of Qinghai Nationalities Institute, 2000.20(4), 31-34.
[253] Xie, Z. W., National Chinese herbal medicine, People's Health Publishing House, Beijing, 1996.
[254] Bianbaciren, China National Medicine, 2009, 5(5), 57-60.
[255] Renceng, C.D., Tong, L., Li, W. Y., Journal of Sichuan of Traditional Chinese Medicine, 2008,10, 58-59.
[256] Li, M., Xiao, W. M., Journal of Chinese National Medicine. 2009.2(2), 54-55.
[257] Limao, C.R., Renceng, C.D., Wang, Y. F., Journal of Chinese Medicinal Materials. 2008, 12(12), 1834-
1835.
[258] Tong, L., Renceng, C.D., Li, W. Y., Journal of Chinese Medicinal Materials.2008, 33(14), 1761-1762.

161
[259] Renceng, C.D., Tong, L., Limao, C.R., Li, W. Y., Wang, Y. F., Journal of Chinese Medicinal Materials.
2009, 34(4), 493-494.
[260] Wang, Y., Gong, S. J., Tao, C.C., Chin J Pharm Anal 2008, 28(3),345-349.
[261] Liu, Y., Chong, L.H., Yan, M.Q., Chinese Traditional and Herbal Drugs. 2008, 39(4), 612-613.
[262] Chen, Y., Hai, Y. J., Liu, Y.H., 2009.6(6), 46-49.
[263] Ji, B., Journal of Chinese National Medicine, 2009, 1(1), 49-50.
[264]Acirenl, N.I.M., Ntunzhul, G.S.A.,Ncirenl, G.S.A., Liao, Z.G., Wan G.F., Journal of Chinese National
Medicine, 2009, 4(4), 51-52.
[265] Wei, L. X., Du, Y.Z., Zhou, X. Y., Chinese Traditional Patent Medicine, 2008, 30(3), 454-455.
[266] Yang, B. B., Li, S., Zhang, R. P., Wang, Y., Shi, J. G., Journal of Chinese Medicinal Materials, 2009,
34(14), 1819-1822.
[267] Zhang, J. L., Xu, J., Li, M. X., Journal of the People's Liberation Army Pharmacy. 2009, 25(3), 262-263.
[268] Zhang, C. H., Xun,.Z. M., Dong Q., Chinese Journal of Analysis Laboratory. 2009, 128-130.
[269] Tong S.Q., Sheng L.Q.,Yan J.Z.,Wang S.L., Chin JMAP,2009, 26(5),391-394.
[270] Feng, L. J., Ji, L. J., Chinese Journal of Analysis Laboratory. 2008, 147-149.
[271] Wen H. X., Shao Y., Tao Y., Mei L. J., Chin J Pharm Anal 2009, 29 (1),137-139.
[272] Liu, W. H., Xiao, Y. S., Chinese Journal of Analysis Laboratory. 2008, 239-240.
[273] Lin, C. Z., Be Ie Zeren - dawa, Chai, L., Kangsa Suolang qimei , Zhu, C. C., Zang, C. X., Zhao, Z. X.,
WCJ. PS, 2009, 24 (2), 184-185
[274] Zen, G. R., Qu. Y., Gao, Y. M., Journal of Sout hwest Univer sity (Natural Science Edition), 2009,
31(5),121-123.
[275] Cong, L. B., Wang, Q., Huang, Y. J., Yuan, H. L., Gong, Q. F.,Yang, M., He, X. X., Chin Pharm J2008,
43(12), 946-949.
[276] Liu, Y. H., Huang,Z. F., Cgen, Y., Chinese Traditional Patent Medicine, 2008, 30(9),28-29.
[277] Fang, Q. M., Zhang, H., Uu, X. F., Shu, G. M., Zhou, X. J., Hu, P., Zhang, M., WCJ. PS, 2008, 23 (1),
107-108.
[278] Tong, L., Renceng, C. D.,, Weng, Y.L., Journal of Chinese Medicinal Materials.2009, 32(1), 22-23.
[279] Gongbu, D. Z., Yang, J.D., Kao, M. J., Gansu Journal of TCM, 2009, 22(3).
[280] Hou, F. H., Yang, H., Xu, H. Q., Cai,B. C., Journal of Nanjing TCM University. 2008,24(3),172-172.
[281] Li, Y., Yuan, W., Liu, C., Liu, Y., Lishizhen medicine and material medica research, 2009, 20(7),1617-

162
1619.
[282] Lou, C. H.,Yang, H., Cai, H., Xu, H. Q., Chin Pharm J,2009,44(6), 477-478.
[283] Liu, Y. R., Shanxi Journal of Traditional Chinese Medicine. 2009, 30(1), 85-87.
[284] Meng, Q. Y., Liu, Y., Li, H. C., Shui, Z. R., Chinese Traditional Patent Medicine, 2008, 30(4),610-612.
[285]Huo, Y. J., Ceng,N. Y., Zhang, M., Shanxi Journal of Traditional Chinese Medicine.2009,30(12),1658-
1660.
[286] Li, M. X., Li, W. B., Fan, P. C., Zhang, R. X., Chin Hosp Pharm J ,2009,29(8),688-690.
[287] Zhang, F., Shui, L. N. , Chen, W. S., Journal of Pharmaceutical Practice.2008,26(3),169-171.
[288] Du, L. Y., Mao, Y., Xu, J., Liu, X. Y., Li, Y. F., Wang, P., Journal of Southwest University for Nationalities
Natural Science Edition.2009, 35(6),1207-1209.
[289] Dawa,Zhuoma., Gong, Y. L., Journal of Chinese Medicinal Materials.2008, 31(6), 857-860.
[290] Dawa,Zhuoma., Zhou, Y., Bai, Y., Journal of Chinese Medicinal Materials.2008, 33(9), 1032-1035.
[291] Yan, T. Q., Yan L., Tang, L., Lishizhen medicine and material medica research, 2008, 19(1), 25-27.
[292] Xun, C. M., Xing, Y. X., Ca, X. Y., Chin J Pharm Anal 2008, 28 (1), 108-110.
[293] Li, X.F., Wei, L., Yuan, M., Li, Y. P., Zhu, J. B., Nima, C. R., Li,G. R., WCJ. PS, 2008, 23 (6), 668-670
[294] Li, X. Y., Feng, W. L., Zhu, J. B., Nima Cairang, Li, G. R., Chinese Traditional and Herbal
Drugs.2009,40(9),1425-1429.
[295] Wu, H. F., Shen, J. W., Song, Z. J., Nat Prod Res Dev 2009, 21,430-432.
[296] Chen, Y., De J., Huang, Z. F., Journal of Chinese Medicinal Materials.2009, 32(8), 1218-1220.
[297] Ma, Y. H., Li, S. H., Lishizhen medicine and material medica research, 2009, 20(10), 2529-2530.
[298] Zhong, B. X., Tang, L., Jiao, j., Na, L., Yang, Lin., Ma, Y., Journal of Chinese National Medicine.
2009.6(6), 58-59.
[299] Zhang, Z. F., Wu, C, L., Chinese Traditional and Herbal Drugs.2009,40(10),1612-1614.
[300] Li, Y., Jiang, N., Luo, X., Qing, Y., Xu, X, Y., Yang, Z. R., Lishizhen medicine and material medica
research, 2008, 19(5),1118-1120.
[301] Peng, C., Yang, Z.D., Journal of Chinese Medicinal Materials.2009, 34(8), 1007-1008.
[302]Que, S., Zhao, Y. Y., Zhou, Y., Zang, Q. Y., Journal of Chinese Medicinal Materials.2009, 34(12), 1523-
1526.
[303] Que, S., Zhao, Y. Y., Zhang, Q. Y., Journal of Chinese Medicinal Materials.2008,33(22), 2639-2641.
[304] Yan,G. M., Lu, R. H. , Shi, Y. P., Chinese Traditional Patent Medieine.2008,30(5),731-733.

163
[305] Zhang, Y. P., Yang, Y. S., Liu, Y., Ma, X. M., Lishizhen medicine and material medica research, 2009,
20(3),595-597.
[306] Xun, C.M., Dong, Q., Xing, Y.X., Nat Prod Res Dev 2008. 20, 466-468.
[307] Xun, C. M., Dong, Q., Acts Bot.Boreal.Occident. Sin. 2008, 28(12), 2543—2546.
[308]Chen, Y., Liu, Q. L., De,J., Liu, Y. H.,Yi, J. H., Journal of Chinese National Medicine.2009. 5(5), 40-42.
[309] Liu, X., Liu Y., Shi, Y. P., Journal of Chinese Medicinal Materials.2009, 34(5), 580-581.
[310] Chun, J. Z., Liu, C. M., Journal of Chinese Pharmaceutical Sciences.2009, 18,240-244.
[311] Zhao Xianen ,Liu Y.,J., Wang, H. L. , Suo, Y. R., Nat Prod Res Dev 2009, 21, 76-83.
[312] Wang, W., Zhang, X. F., Shen J. W., Lou, D. J., Nat Prod Res Dev 2009, 21, 199-202.
[313] Shen, J., Ye, Y. H., Zhou, Y. W., Chin Pharm J,2009, 44(3), 170-175.
[314] Chen, X. H., Peng, C., Journal of Chinese Medicinal Materials.2009, 32(3), 365-367.
[315] Yang, A. M., Du, J., Miao, Z. H., Yuan, H. J., Journal of Chinese Medicinal Materials.2009, 32(10), 1534-
1537.
[316] Chi, F., Deng, J., Wang, Y. H., Journal of Chinese Medicinal Materials.2009, 34(16), 2054-2056.
[317] Xiao, Y., Chan, Y. S., Bin,Liu, D.M., N at Prod Res Dev 2008, 20: 288-291.
[318]Han, L., Guo, X. L., Feng, Y.F., Lin, M. N., Chinese journal of ethnomedicine and ethnopharmacy, 2009,
148-150.
[319] Zeng, Y. L., Li, L., Chinese journal of ethnomedicine and ethnopharmacy. 2008, 7-9.
[320] Huang, S. Z., J iang, S. P., Zhu, H. J., N at Prod Res Dev 2009, 21: 549-552.
[321] Gao, Y.L., Yu, Z. X., Lin, R. C., Chin,J,Mod,Drug, 2009,3 (4), 25-26.
[322] Liu,Q. L., Hung, Z. F. , De Ji et al, Journal of Medicine & Pharmacy of Chinese Minorities,2009,3,70-71
[323] Chu, L., Wang, L. B., Zhang, Z., Gao, H. Y., Huang, J., Sun, B, H., Wu, L. L., Modem Chinese
Medicine,2008,10(3),10-13.
[324] Zhao, B., Liang, H. X., Yu, Y. F., Dong, X. P., Acta Pharmaceutica Sinica 2009, 44(1): 60-62
[325] Zhao, B., Dong, X. P., Journal of Chinese National Medicine. 2008, 31(8), 1170-1172.
[326] Sun, J. , Xu W. H., Wang, Y. H., Han, Y. J., Chen, G. C., Chinese Journal of Analysis Laboratory,
2008, 27(12), 51-54.
[327] Li, X.F., Jin, H.Z., Chen, G., Yan, S.K., Shen, Y.H., Yang, M., Zhang, W.D. N at Prod Res Dev 2008, 20,
1125-1128.
[328] Chao, W.S., Lishizhen medicine and material medica research, 2009, 20(6), 1509-1510.

164
[329] Li, M. X., Lan, Z. H., Journal of Chinese National Medicine. 2009.32(8), 1318-1322.
[330] Li, R., Zhang, H., Chen, C., Yuan Y., Yu, D., W C J· P S, 2009, 24 (5), 469-470.
[331] Zhou, X. L., Forward Trends, 2009, 1, 16-18.
[332] Song, P., Hao, M.D., Liu, Y., Li, L., Journal of jiangxinormal university (natural science), 2009, 33(5),
515-517.
[333] Yang, H., Wang, D., Tong, L., Cai, B.C., Chin Pharm J, 2008, 43(5), 338-340.
[334] Wang, D., Yang, H., Dai, Y.P., Tong, L., Cai, B. C., Chin Pharm J, 2008, 43(17), 1292-1294.
[335] Yang, H., Wang, D., Tong, L., Cai, B.C., Chin Pharm J, 2008, 43(20), 1538-1540.
[336] Liu, Y., Meng, Q.Y., Ren, C.Q., Chin Pharm J, 43(7), 538-540.
[337] Zhang, W.Y., Journal of Qinghai medical college, 2009, 30 (1), 61-63.
[338] Song, P., Yang, Z.L, Zao, M.D., Chemical World, 2009, 5, 271-272.
[339] Liu J., Xu, J. Z., Tiejun, Modern Pharmacy and Clinic, 2009, 24(3), 166-168.
[340] Song, P., Li, C.R., Yu, J., Lishizhen medicine and material medica research 2008, 19(9),2076-2077.
[341] Tao Y.R., Zhe, T.Y., Shao, B., Lishizhen medicine and material medica research, 2009, 20(1), 24-25.
[342] Rui, G., Yao, Z.G., Traditional Chinese Drug Research & Clinical Pharmacology.2009, 20(4), 397-400.
[343] Lai, Y.X., Zhou, X.L., Liang, Z., A, P., Wu, N.Z., Journal of Sichuan University (Natural Science Edition),
2008, 45, 377-379.
[344] Qing, C.H., Zhou, X.L., Zheng, L., Journal of Sichuan University (Natural Science Edition), 2008,
45,380-382.
[345] Jiang, F.Q., Tao, Y.D., Shao, Y., Journal of Ethnopharmacology, 2007,111, 265–270.
[346] Xiao, H., Zhang, T.Y., Wei, Y., Cao, X.L., Ito, Y., J. Chromatogr A, 2002, 971, 237–241.
[347] Sutherland, I.A., J. Chromatogr A, 886, 283-287, 2000.
[348] Snyder, L. R., Kirkland, J. J., Glajch, J. L., “Practical HPLC Method Development,” 2nd ed., Wiley-Inter
Science,New York, 1997.
[349] Hu, P., Guo-An Luo, Wang ,Q., Zhong, Z, Z., Wan Wang, Jiang, Z.H., Archives of Pharmacal Research,
2008, 31, 1265-1273.
[350] Benjamin, K., Gosse, John N. Gnabre., J. Liq. Chromatogr Relat Technol. 2002, 25, 3199–3211, 2002.
[351] Friesen, J.B., Pauli, G.F., J. Liq. Chromatogr Relat Technol., 2005, 28, 2777.
[352] Du, X. W., Wills, R. B. H., Stuart, D. L., Food Chem., 2004,86, 155-159.
[353] Fuzzati, N., Gabetta, B., Jayakar, K., Pace, R., Peterlongo, F., J. Chromatogr. A, 1999,854, 69–79

165
[354] Zhang, S.Q., Sun, F., Liu, Z.Y., Yu, Q.F., Zhang, F.M., Chen, X.Q., Jilin Trad. Chin. Med., 1999,4, 56.
[355]Wang, H., Li, Y., Ding, C., Zhao, X., You, J., Suo, Y., Journal of Liquid Chromatography and Related
Technologies. 2006, 29(6), 857-868.
[356] Sutherland, I.A., Hawes, D., Ignatova, S., Janaway, L., Wood, P., J. Liq. Chromatogr Relat Technol. 2005,
28, 1877.
[357] Ito, Y., Bhatnagar, R., J. Chromatog A 1981, 207, 171-180.
[358] Sutherland, I.A.; Brown, L.; Forbes, D.; Games, D.; Hawes, D.; Hostettmann, K.; McKerrell, E.H.;
Marston, A.; Wheatley, D.; Wood, P., J. Liq. Chromatog. 1998, 21 (3), 279-298.
[359] Sutherland, I.A., In Encyclopaedia of Chromatography; Cazes, J., Ed.; Marcel Dekker, Inc., New York,
2001.
[360] Sutherland, I.A.; Brown, L.; Graham, A.S.; Guillon, G.G.; Hawes, D.; Janaway, L.; Whiteside, R.; Wood,
P., J. Chromatogr. Sci., 2001, 39 (1), 21-28
[361] Sutherland, I.A., Booth A., Brown L., Kemp B., Kidwell H., Games D., Graham A.S., Guillon G.G.,
Hawes D., Hayes M., Janaway L., Lye G., Massey P., Preston C., Shering P., Shoulder T., Strawson C., Wood P.,
J. Liq. Chromatogr. Relat Technol. 2001, 24, 1533-1553.
[362] Ignatova, S., Wood, P., Hawes, D., Sutherland, I.A., Hewitson, P., J. Chromatogr A, 2007, 1151, 20–24.
[363] Peng, A. H., Li, R., Jia H., Chen, L. J., Zhao, X., Luo,H. D., Ye, H. Y., Yuan, Y., Wei, Y, Q., J.
Chromatogr. A, 2008, 1200, 129–135.
[364] Janaway, L., Hawes, D., Ignatova, S., Sutherland, I.A., Wood, P., J. Liq. Chrom. Rel. Tech. 2003, 26(9,
10), 1345–54.
[365] Chen, L.J., Zhang, Q., Yang, G.L., Fan, L.Y., Tang J., Garrard, I.A., Ignatova, S., Fisher, D., Sutherland, I.
A., J. Chromatogr A, 2007, 1142, 115–122.
[366] Yuan, Y., Wang, B.Q., Chen, L.J., Luo, H.D., Fisher, D., Sutherland, I.A., Wei, Y.Q., J. Chromatogr. ,
2003, 1194 (2008) 192–198.
[367] Sutherland, I.A., Hawes, D., van den Heuvel, R., Janaway, L., Tinnion, E., J. Liq. Chromatogr Relat
Technol. 2003, 26, 1475-1491.
[368] Wood, P., Hawes, D., Janaway, L., Sutherland, I.A., J. Liq. Chromatogr Relat Technol, 2003, 26, 1373.
[369] Shehzad, O., Jin Ha, I., Park, Y., Wan Ha, Y., Shik Kim, Y., Journal of Separation Science, 2011, 34 (10),
1116-1122.
[370] Shehzad, O., Khan, S., Ha, I.J., Park, Y., Kim, Y.S., Journal of Separation Science, 2012, 35 (12), 1462-
1469.

166
Appendix
The presentation of aspects of this thesis at various conferences is detailed:
1) CCC 2010, Lyon, France, Jul 2010 (Poster)
Tibetan Herbal Medicines: the challenge for counter current chromatography (CCC)
2) Research Student Poster Conference 2011, Brunel University, London, UK, Mar 2011
(presentation)
Separation of salidroside and tyrosol from Rhodiola rosea roots by counter current
chromatography (CCC)
3) Research Student Poster Conference 2011, Brunel University, London, UK, Mar 2012
(presentation)
Ginsenosides purification by high-performe counter current chromatography (HPCCC)
4) CCC 2012, Hangzhou, China, Aug 2012 (Poster)
Separation of six ginsenosides from panax ginseng using high-performance counter-current
chromatograph (HPCCC)

167