development of an entropy- based fuzzy …
TRANSCRIPT
Iran. J. Environ. Health. Sci. Eng., 2010, Vol. 7, No. 1, pp. 1-14
1
DEVELOPMENT OF AN ENTROPY- BASED FUZZY EUTROPHICATION INDEX FOR RESERVOIR WATER QUALITY
EVALUATION
*1M. Taheriyoun, 2M. Karamouz, 1A. Baghvand
1Faculty of Environment, University of Tehran, Tehran, Iran2School of Civil Engineering, University of Tehran, Tehran, Iran
Received 3 August 2009; revised 9 December 2009; accepted 20 December 2009
ABSTRACTEutrophication phenomenon is one of the most common water quality problems in reservoirs in many regions. Determining the trophic status of the reservoirs is not a precise process and contains vagueness. Fuzzy set and entropy theories are concepts which can model uncertainty and imprecision in the data and the analysis. In this study, an Entropy-based Fuzzy Eutrophication Index model has been developed for classification of trophic level of Satarkhan Reservoir in the north-western part of Iran. Through the Fuzzy Synthetic Evaluation technique, trophic levels were considered as fuzzy sets and a fuzzy evaluation matrix was formed by defining the membership function of water quality indicators. The indicators were weighed by integrating both objective and subjective criteria. In this regard, the entropy method was used to determine the objective weights of the indicators based on the amount of useful information available in the data set and the subjective weight was determined by the analytical hierarchy process using a pairwise comparison done by the expert judgment. Classification of the trophic status of the reservoir was determined by multiplying the weighed vector by the fuzzy evaluation matrix. The results showed that critical months for eutrophication in Satarkhan reservoir occur in autumn and spring after the overturning phenomena. The strength of the results of developed entrophy-based fuzzy entrophication index is that the trophic level in each month was expressed with a degree of certainty. Also due to the ability of the model to integrate different kinds of objective and subjective quality observations considering the information included in the data, the proposed model is more robust than the previous index models such as Trophic Status Index and fuzzy trophic index.
Key words: Trophic level, Reservoir, Fuzzy Synthetic Evaluation, Entropy, Analytical hierarchy process
INTRODUCTIONEutrophication, or the nutrient enrichment of aquatic systems, is a natural aging process of a waterbody that contains an undesirable abundance of algae growth. This process is usually accelerated by excessive nutrient inputs, thereby causing the water quality to deteriorate impairing the intended uses of reservoirs such as aquatic life and fisheries, drinking water supply and recreational use. USEPA (1999) has established the Total Maximum Daily Load (TMDL) process for impaired *Corresponding author: E-mail: [email protected]: 0913 305 42 77
waterbodies especially eutrophied lakes and reservoirs. This process determines the allowable nutrient loading to a reservoir to preserve the water quality standards. To develop a TMDL, it is necessary to have one or more quantitative measures or indictors that can be used to evaluate the trophic level of the reservoir. Indicators for a nutrient TMDL include parameters such as total phosphorus, total nitrogen and chlorophyll a. Once an indicator is selected, a target value for the indicator must be established which classifies the impaired and unimpaired state of the waterbody (USEPA, 1999). Trophic state is not obtained through a unique method without vagueness.
M. Taheriyoun, et al., DEVELPOMENT OF AN ENTROPY ...
2
Traditional classification methods of trophic state levels such as the Carlson index (Carlson, 1977) utilizes crisp sets, and the index values which are close or far from the upper or lower limits are considered in the same classes. Moreover, several parameters are considered in trophic level determination and the limits between different classes have inherent imprecision (Lu et al., 1999; Silvert, 2000). Therefore, multivariable indexing allows for a more thorough investigation of water quality and a more continuous description of the eutrophication process than a single variable index system (Lu and Lo, 2002).The Fuzzy Set Theory (Zadeh, 1965) which introduced the specification of uncertainty by membership functions has been used by Silvert (2000) to develop the environmental indices. Fuzzy-based techniques can provide a mean for measuring the intensity of exceeding regulated thresholds with the help of memberships to various water quality levels. It has been applied extensively in water quality classification of water resources. The majority of research in this field is centered on fuzzy synthetic evaluation and fuzzy clustering analysis (Chang et al, 2001). Fuzzy Synthetic Evaluation (FSE) uses a numerical scale to represent the water quality status. It aggregates the defined fuzzy values of the water quality parameters to various quality features such as eutrophication of reservoirs. FSE is used to classify samples at a known center of classification (or group), whereas the fuzzy clustering analysis (FCA) is used to classify samples according to their relationships when this center is unknown (Lu et al., 1999). FSE classifies samples for known standards and guidelines, and is a modified version of traditional synthetic evaluation techniques. This technique has been used in the following studies:Lu et al., (1999) studied the feasibility of applying the FSE method to the quality of water in a reservoir. According to the results, FSE does a better job in detecting the trends of water quality changes than the Carlson Index. Chang et al, (2001) used FSE in water quality classification of a river. Lu and Lo (2002) developed a multivariable trophic state indexing method, for diagnosing water quality and evaluated this method using the FSE technique.
Chang et al., (2001) used three fuzzy synthetic evaluation approaches to assess water quality conditions of a river and compared the results with the conventional Water Quality Index (WQI) for rivers. Estimation of the weights of quality parameters was drawn from a commonly used weight information database which is not based on the objective importance of the parameters.Liou and Lo (2005), developed a fuzzy index model for trophic evaluation of reservoirs based on the formula of similarity membership functions in the fuzzy c-means (FCM) clustering algorithm. The weights of water quality indicators were not considered in this analysis. Also Karamouz et al., (2004) applied fuzzy c-means clustering analysis in order to zone a river based on the water quality values at different monitoring stations along the river.Icaga (2007) proposed an index model for water quality classification using fuzzy logic. In this survey, quality classes are transformed into continuous form and then the concentration values of the different quality parameters are summed using fuzzy rules. Finally, defuzzification of these summed values develops the index. Relative importance for quality parameters was not considered in this study. Duque et al., (2006) also used the fuzzy inference system to assess the river water quality. The relative importance of water quality indicators involved in the study was dealt with the Analytic Hierarchy Process (AHP) (Saaty, 1988) method using pairwise comparison.In the FSE method, the weights of water quality parameters are determined empirically or by using the pair-wise comparison method. These methods which are based on the subjective importance of different indicators are dependent on human judgments and biases; thus the possibility of expert’s misjudgments could be increased (Chowdhury and Husain, 2006).The entropy theory which initially emerged from thermodynamics was introduced into the information theory by Shannon (1948). In information theory, the disorder degree of a system is measured. The larger values of entropy indicate more randomness and thus less information is expressed by data (Zeleny, 1982). It can measure uncertainties and the extent of

Iran. J. Environ. Health. Sci. Eng., 2010, Vol. 7, No. 1, pp. 1-14
3
useful information provided by data. Therefore, entropy is an objective means of defining the weights of water quality parameters or indicators based on the useful information in the available data. Chen et al., (2008) applied entropy weight coefficients for the attributes of a model for the groundwater quality assessment. In another study Zhi-hong et al., (2006) used the entropy method for determination of weight of evaluating indicators in water quality assessment of a river. In both studies, the results were found more reliable since the entropy weight of each criterion overcomes the subjectivity of expert evaluation. However, it does not seem that considering the weights only based on entropy values without expert judgment would be sufficient. Chowdhury and Husain (2006) applied a methodology to health risk management of different water treatment technologies using the entropy and fuzzy set theories applied in a multi - attribute decision making technique. In their study, the weights of the attributes were determined based on a combined approach using the AHP method as a mean of measuring the subjective weight and the concept of entropy determining the objective weight of the attributes.In the previous studies, in the context of the fuzzy evaluation methods, less attention was given to the weight of indicators. In some other studies such as Lu et al., (1999) only it was considered in the framework of the AHP process. The shortcomings of these approaches have been on their reliance on expert attitude and judgment about the weight of each indicator. There are many redundancies and misjudgments that cannot be captured through AHP process. Applying the concept of entropy and integrating the objective and subjective measure of weights proposed by Chowdhury and Husain (2006) is not considered in the previous fuzzy evaluation of water quality classification studies especially trophic status assessment.In this study, an entropy-based fuzzy synthetic evaluation method is developed to capture the randomness and uncertainties in the input data in order to analyze the trophic status. Fuzzy membership functions are defined for selected water quality indicators and the weights of the
indicators are determined using the entropy based and AHP methods.
MATERIALS AND METHODSThe developed methodology is mainly comprised of a typical three-step process of fuzzification, aggregation, and defuzzification which is commonly used in the fuzzy-based decision making problems. The target of the proposed approach is to interpret observations to different trophic levels. In fuzzification, the fuzzy membership function for the trophic indicators is defined based on the criteria used for the trophic state classification. Aggregation is the grouping process of fuzzy sets by establishing an evaluation matrix. Finally, to interpret the fuzzy results to crisp numbers, defuzzification technique is applied. Fig.1 illustrates the steps of the methodology which are further discussed in the following sections.
Fig.1: Flowchart of the proposed methodology for Entropy- based Fuzzy Eutrophication Index (EFEI)

M. Taheriyoun, et al., DEVELPOMENT OF AN ENTROPY ...
4
Determination of trophic indicatorsIn several approaches for the establishment of trophic state classification system, the values of certain measured water quality parameters (e.g., total phosphorus, chlorophyll a, etc.) have been used as trophic indicator. Ideally, observed water quality values can be compared to the established classification systems to determine the trophic status of any particular waterbody. (USEPA, 1999)The trophic indicators applied in most of trophic classification systems are chlorophyll a, total phosphorous (TP), total nitrogen (TN), secchi depth (SD) and hypolimnetic oxygen saturation
percentage (HO%) (Novotny and Olem, 1994; Chapra, 1997; Vollenweider and Kerekes, 1980; USEPA, 1999). In inland waters such as lakes and reservoirs, typically phosphorus is the limiting nutrient rather than nitrogen, because blue-green algae can “fix” elemental nitrogen from the water as a nutrient source. In marine waters, either phosphorus or nitrogen can be limiting (USEPA, 1999). Therefore, in this study regarding the above limitation, total nitrogen was omitted from the analysis and four indicators including chlorophyll a (Chla), T.P., S.D. and HO% were considered in the assessment process.
Table 1: Trophic status classification
*OECD (1982)**USEPA (1999)
SD (m)
Fig 2- Bell shaped probability distribution curves for trophic indicators (OECD, 1982): (a) Total phosphorous (b) Chlorophyll a (c) Secchi disk
c
a b
Oligotrophic Mesotrophic Eutrophic Water quality indicator range mean range mean range mean
Chlorophyll a 0.3- 4.5 1.7 3-11 4.7 2.7-78 14 Total phosphorus* 3-18 8 11-96 27 16-390 84 Secchi depth (m)* 5.4-28 9.9 1.8-8.1 4.2 0.8-7 2.4 Hypolimnetic oxygen (% of saturation)** >80% 10-80% <10%

Iran. J. Environ. Health. Sci. Eng., 2010, Vol. 7, No. 1, pp. 1-14
5
Select trophic state classification criteriaThe OECD (Organization of Economic Cooperation and Development) index proposed by Vollenweider and Kerekes (1980) was applied as the trophic classification criteria, (OECD, 1982). In the OECD index, statistical approach to quantify the ranges of several water quality variables is used within each trophic designation (Table 1). This index was derived by asking a group of experts their opinion as to what was the average value for each trophic class for each variable. The summarized data were used to produce bell-shaped curves for each variable for each class of eutrophicaton, Fig. 2 (USEPA, 2000).The overlap of water quality ranges shown in Table 1 and Fig.2 implies that there are some fuzzy zones between the eutrophic, mesotrophic, and oligotrophic states. It emphasized that reservoirs of the same concentrations may be in more than one trophic class. For hypolimnetic oxygen (percent of saturation) HO%, the limits were adopted from USEPA (1999).
Define fuzzy membership functions (Fuzzification)The ranges of variables in Table 1 were considered as the criteria to set the fuzzy input data. Therefore, the fuzzy limits of the parameters and membership functions were derived from the OECD index which was approved by EPA (USEPA, 1999).
The fuzzy sets were defined for the three trophic levels of eutrophic, mesotrophic and oligotrophic using triangular and trapezoidal types. Fig. 3 shows the typical membership function of trophic indicators. As it is shown in the figure, higher values of total phosphorous and chlorophyll a
represent higher degree of eutrophic condition. On the other hand, secchi disk and hypolimnetic oxygen saturation percent are at the opposite side.According to this figure, equation (Eq.) (1) demonstrates the typical form of the membership
function for TP and Chla. For SD and HO%, eµ
and oµ are substituted.
−−=
0)/()(
1)( bcbxxeµ
axcxb
cx
≤<<
≥
−−−−
=
0)/()()/()(
0
)(abaxbcxc
xmµ
axbxacxb
cx
≤≤<<<
≥
−−=
1)/()(
0)( abxbxoµ
axbxa
bx
≤<<
≥
Table 2: Key values defining the fuzzy limits of the membership functions
Where µ is the membership function and subscripts e, m and o stand for eutrophic;, mesotrophic, and oligotrophic classes, respectively. Table 2 shows a, b and c values of different trophic indicators considered in this study.From what is shown in Fig. 3 , the membership values of the points a, b and c for each fuzzy set of TP and Chla are as follows:For eutrophic level:
0)b(,1)c( e\e == µµ
(1)
Fig. 3: Typical membership function of trophic indicators
Trophic indicator Unit a b c Chlorophyll a g/L 1.7 4.7 14 Total phosphorus g/L 8 27 84 Secchi depth m 2.4 4.2 9.9 Hypolimnetic oxygen percentage
(%) of saturation 10 45 80
Chla)
M. Taheriyoun, et al., DEVELPOMENT OF AN ENTROPY ...
6
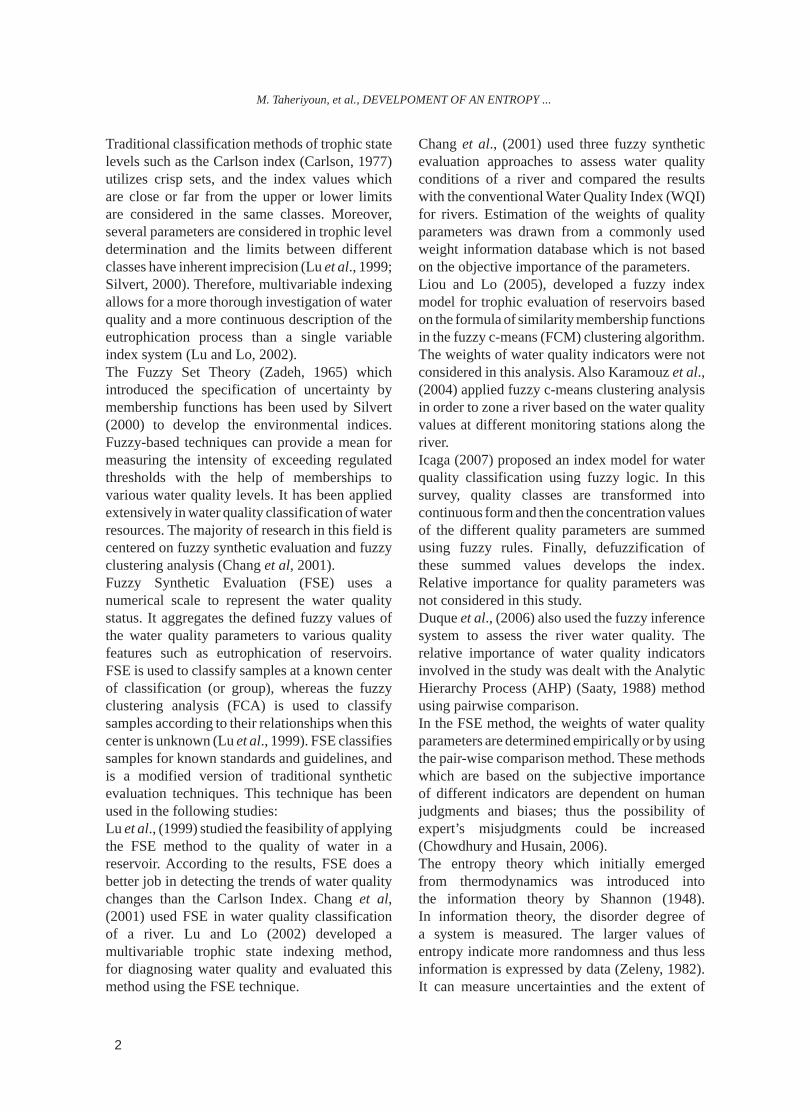
Element Xik of the evaluation matrix represents the ith set of data for the kth indicator. (i=1,2 ,…,m; k=1,2,…, n) (Zeleny, 1982; Hwang and Yoon, 1981)
The procedure of determining weights of indicators is as follows:
Normalization of the elements of the original 1. evaluation matrix:
For the sake of having the same scale of measurement for the n indicators, it is assumed that all the initial entry values in the matrix are in the range from 0 to 1. This is achieved by normalizing the elements of the initial matrix according to the Eq. (5).
In the above equation the maximum criterion refers to the indicator with preferred higher value and thus each element is divided by the maximum value of kth indicator (maximum value in column k in Eq. (4)). On the other hand, the minimum criterion means the indicator with preferred lower value and the minimum value is divided by each element. According to this procedure, it is
evident that [ ]1,0∈ikr .
Calculating the probability of the criterion to 2. occur is defined by pik as:
(6)∑=
= m
kik
ikik
r
rp
1
pik
rik
rik
For mesotrophic level:
0)c(,1)b(,0)a( mmm === µµµ
For oligotrophic level: 0)b(,1)a( oo == µµ
As mentioned above, for SD and HO%, eµ and
oµ are substituted in Eq. (2).
Construction of the fuzzy relationship matrixDefining the membership functions in the previous step, a fuzzy relationship matrix was constructed in which the rows are the indicators and the columns are trophic state levels. Considering four trophic indicators with three trophic levels of eutrophic, mesotrophic, and oligotrophic, a matrix of 34× was formed as the fuzzy relationship matrix, as shown in Eq. (3):
Where subscripts p, c, SD and HO represent phosphorous, chlorophyll a, secchi depth and hypolimnetic oxygen saturation percent, respectively.
Weighing the indicatorsThe successful application of the FSE technique depends on an appropriate weight assignment to the indicators involved in the procedure. (Zeleny, 1982; Qui, 2002,) Weight assignment defines the relative importance and influence of the input parameters in the final justification. In this study an integrative weight was considered to reflect both the subjective considerations of a decision maker or expert and the objective information. The objective weight was calculated from the entropy weighing method and the subjective weight was derived from the AHP process which is discussed in the following section.Entropy weighing method The m set of data for n indicators is used to form the evaluation matrix as shown in Eq. (4).
(2)
=
HOoHOmHOe
SDoSDmSDe
popmpe
cocmce
R
µµµµµµ
µµµµµµ
(3)R
(4)
=
mnmm
n
n
XXX
XXXXXX
EM
21
22221
11211
EM
pik
rik
: for maximum criterion
: for minimum criterion
(5){ }
{ }
=
:min
:max
ik
kik
kik
ik
ik
XX
XX
rrik
Xik
Xik
Xik
Xik

Iran. J. Environ. Health. Sci. Eng., 2010, Vol. 7, No. 1, pp. 1-14
7
Analytical Hierarchy Process weighing method The AHP method (Saaty, 1988) is used to calculate the subjective importance of the indicators which considers the significance of expert's judgment and intended use of waterbody. A pairwise comparison matrix is established to obtain the weight of the indicators. The consistency measure of the pairwise comparison results is necessary in the subjective choice of the weights. In this regard, the inconsistency ratio of the matrix is calculated according to Eq. (11), (Saaty, 1988):
CRICIIR =
where CRI refers to random inconsistency coefficient of a nn× matrix and is presented in Table 3 and CI is the coefficient of inconsistency which is calculated according to Eq. (12).
where n is the dimension of the matrix and
maxλ is the maximum eigenvalue of the pairwise comparison matrix.
Determination of evaluation result matrix (aggregation)The aggregation or grouping process is needed to put different fuzzy values of the individual indicators into a united indexing model. A schematic of grouping process used in this paper for four indicators of Chla, TP, SD and HO% is shown in Fig.4. To perform the aggregation process, various fuzzy reasoning methods have been applied by different investigators. The method used in this study was similar to the weighted average method described by Chang et al., (2001). In other words, the aggregation of the results was achieved by multiplying the matrix of fuzzy membership and weighted vector of the n indicators according to Eq. (13), (Lu et al., 1999):
(11)I R C ICRI
CRI
The entropy measurement of the 3. kth criterion (indicator):
Where c represents a constant defined here:
Calculating the objective importance of the 4. indicators as the weight of entropy:
Zeleny (1982) stated that a weight assigned to an attribute (indicator or criteria) is directly related to the average intrinsic information generated by a given set of data in addition to its subjective assessment. Based on this, the degree of
diversification ( kd ) of the information provided by kth indicator is defined as the complementary of entropy value as shown in Eq. (9).
kk E1d −=
Therefore, the objective importance of kth criteria is evaluated as:
Equations (9) and (10) state that the indicators with less entropy values have upper level of information content and thus a higher weight is assigned to them.
Equation (11) is applied to combine the 5. objective importance wk with the subjective
importance kλ to evaluate the integrated importance of the kth indicator parameter
*kw
B=W* ×R= [ be bm bo]
(12)1n
nCI max
−−
=λCI
n 1n
C I
∑=
= n
1kk
kk
d
dw(10)
dk
dk
Wk
(9)dk Ek1
(8)CmLn
c 1=
Ln m
(7)-C [ ]∑=
−=m
iikikk LnppcE
1.Ek= pik
pik
Wk*
(11)∑=
= n
jjj
kkk
w
ww
1
*
.
.
λ
λWk* Wk
Wjj
k
M. Taheriyoun, et al., DEVELPOMENT OF AN ENTROPY ...
8
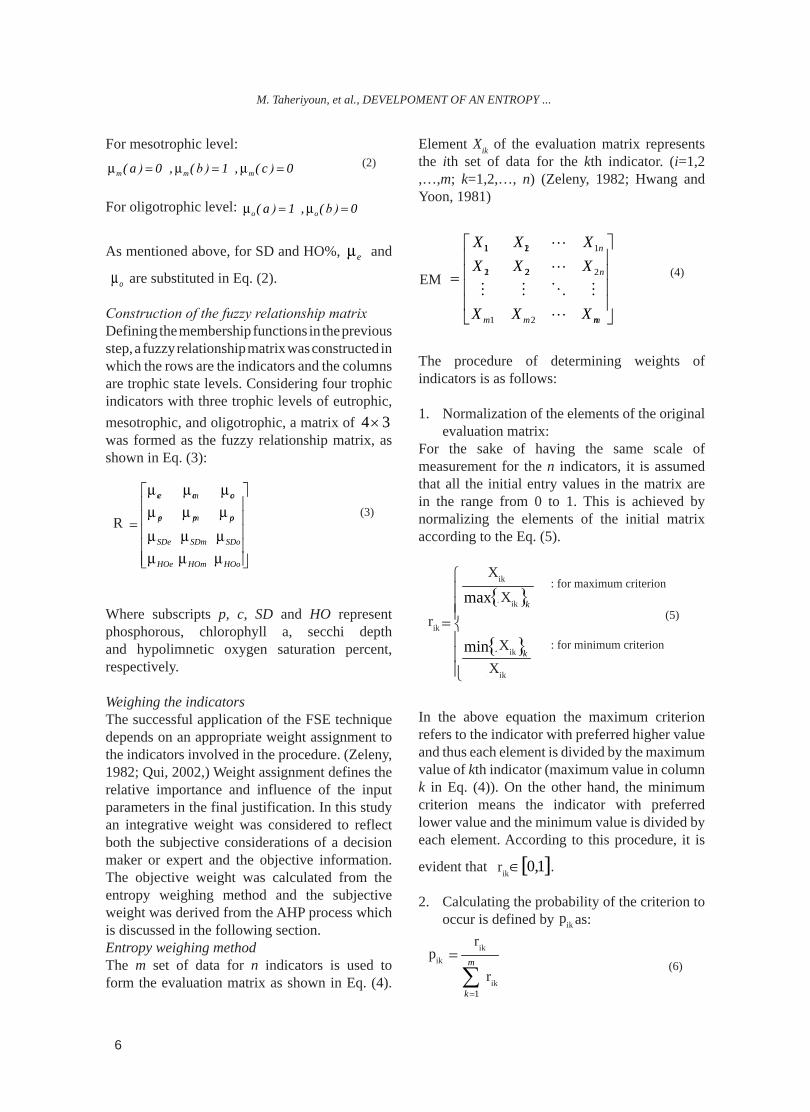
in which:
be, bm, bo are the components that show the membership degree of the reservoir trophic status to each level such as eutrophic, mesotrophic and oligotrophic.
DefuzzificationDefuzzification is the process of combining several partial memberships to produce a single numerical value. It is commonly used in applications of fuzzy logic to produce a result compatible with non-fuzzy approaches and can be easily understood without reference to the fuzzy set theory. In this study defuzzification is achieved through maximizing trophic membership in matrix B as shown in Eq. (14).
E represents the predominant trophic level of the reservoir water quality, i.e. the highest value of membership that determines the overall trophic classification. The crisp value of the eutrophication level can also be determined by assigning coefficients (weights) to the memberships of the result matrix (B) (Lu et al.,, 1999; Silvert, 2000). Therefore, the EFEI value is calculated by Eq. (15) and can be plotted versus time to reveal the trend of eutrophication.
EFEI emo bbb ×+×+×= 421
The coefficients are assigned arbitrarily in this study and guidelines may be established for the EFEI values based on expert opinion (Lu et al., 1999). The EFEI with the highest value represents the most eutrophic condition.
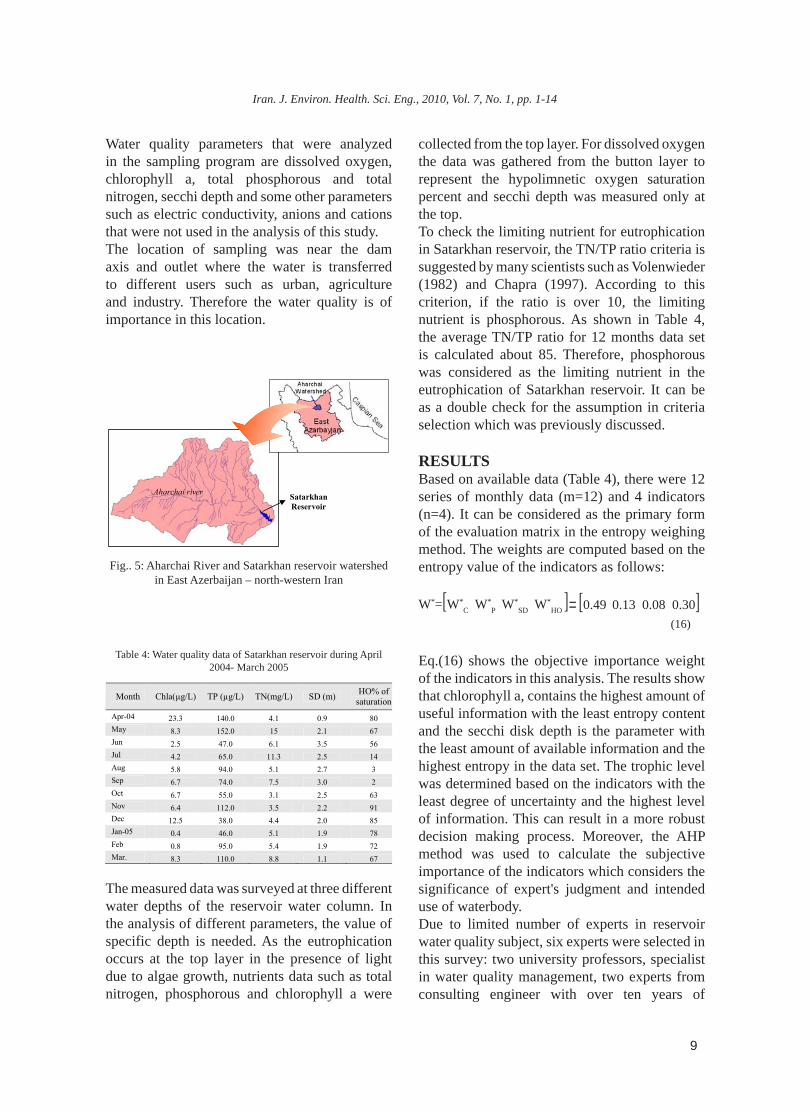
Case StudyThe case study is the Satarkhan Reservoir located in the Aharchai River watershed in the province of East Azerbaijan, north-western Iran. The
geographic coordinates are 35 46 ′ E and 38° 28´ N and the altitude of dam site is about 1430m. The Satarkhan dam was constructed in 1998 with the aims of supplying water for drinking and industrial purposes for the city of Ahar and for development and remediation of 10,000 hectares of downstream agricultural lands. The reservoir has a volume of 131 million cubic meter (MCM) with normal elevation of 1451 m above sea level and an average annual inflow of about 91 MCM/yr. The maximum depth of the reservoir is 59 meters and the detention time based on the ratio of reservoir normal volume to average flow is about 500 days. Water quality of the reservoir has deteriorated during recent years due to excessive nutrient input loads and residential wastewater and agricultural drainage in the watershed. Therefore the control and detection of the eutrophication in the reservoir is of great importance. Many water supply problems have been reported since the operation of the reservoir such as clogging of irrigation pipes, decrease in the time of filter backwash in the water treatment plant as well as other taste and odor problems. The location of the Satarkhan reservoir and the watershed is shown in Fig. 5.
Input data gatheringA monitoring program for the reservoir water quality was held from April 2004 to March 2005 by the regional water authority of East Azerbaijan province. The sampling was done monthly and a 12 month data set was gathered from that period. Therefore, according to the data sampling frequency the daily variations of water quality parameters has been ignored. Table 4 presents the gathered data in detail.
),,max( ome bbbE = (14)E (be, bm, bo)
46
(15)bo bm be
(13)[ ]ome
HOoHOmHOe
SDoSDmSDe
popmpe
cocmce
bbbR =
=
µµµµµµµµµµµµ
W*=[W*C W*
P W*SD W*
HO ]
R=
Table 3: Random inconsistency coefficient of a n×n matrix (Saaty, 1988)
Iran. J. Environ. Health. Sci. Eng., 2010, Vol. 7, No. 1, pp. 1-14
9
Water quality parameters that were analyzed in the sampling program are dissolved oxygen, chlorophyll a, total phosphorous and total nitrogen, secchi depth and some other parameters such as electric conductivity, anions and cations that were not used in the analysis of this study.The location of sampling was near the dam axis and outlet where the water is transferred to different users such as urban, agriculture and industry. Therefore the water quality is of importance in this location.
Table 4: Water quality data of Satarkhan reservoir during April2004- March 2005
The measured data was surveyed at three different water depths of the reservoir water column. In the analysis of different parameters, the value of specific depth is needed. As the eutrophication occurs at the top layer in the presence of light due to algae growth, nutrients data such as total nitrogen, phosphorous and chlorophyll a were
collected from the top layer. For dissolved oxygen the data was gathered from the button layer to represent the hypolimnetic oxygen saturation percent and secchi depth was measured only at the top. To check the limiting nutrient for eutrophication in Satarkhan reservoir, the TN/TP ratio criteria is suggested by many scientists such as Volenwieder (1982) and Chapra (1997). According to this criterion, if the ratio is over 10, the limiting nutrient is phosphorous. As shown in Table 4, the average TN/TP ratio for 12 months data set is calculated about 85. Therefore, phosphorous was considered as the limiting nutrient in the eutrophication of Satarkhan reservoir. It can be as a double check for the assumption in criteria selection which was previously discussed.
RESULTS Based on available data (Table 4), there were 12 series of monthly data (m=12) and 4 indicators (n=4). It can be considered as the primary form of the evaluation matrix in the entropy weighing method. The weights are computed based on the entropy value of the indicators as follows:
[ ]HOSDPC wwwwW = = [0.49 0.13
Eq.(16) shows the objective importance weight of the indicators in this analysis. The results show that chlorophyll a, contains the highest amount of useful information with the least entropy content and the secchi disk depth is the parameter with the least amount of available information and the highest entropy in the data set. The trophic level was determined based on the indicators with the least degree of uncertainty and the highest level of information. This can result in a more robust decision making process. Moreover, the AHP method was used to calculate the subjective importance of the indicators which considers the significance of expert's judgment and intended use of waterbody. Due to limited number of experts in reservoir water quality subject, six experts were selected in this survey: two university professors, specialist in water quality management, two experts from consulting engineer with over ten years of
W*=[W*C W*
P W*
SD W*HO ] [0.49 0.13 0.08 0.30]=
(16)
Fig.. 5: Aharchai River and Satarkhan reservoir watershed in East Azerbaijan – north-western Iran

M. Taheriyoun, et al., DEVELPOMENT OF AN ENTROPY ...
10
experience, and two from the East Azerbaijan Water Authority, expert in reservoir operation and water treatment. They were invited in a session and after being presented to the results of sampling and the facts about the parameters mentioned in the references, the priority of the parameters was discussed. The questions were regarding the pairwise comparison of the importance between the parameters. The answers were limited to three levels: equal, moderate and strong and the equivalent numbers for these three levels were 1, 2 and 3, respectively. The discussion was held to achieve a consensus on the coefficients of pairwise comparison which was finally validated through calculating the coefficient of inconsistency according to Eq. (11). Therefore, the pairwise comparison matrix for selected indicators is shown as Eq.(17).
The value of the inconsistency ratio was 0.01 (less than 10%) which shows the acceptable scores of judgment.After the normalization of the columns and calculating the row means, the weight vector (λ ) was calculated through the AHP process,as follows:
[ ]HOSDPC λλλλλ = = [0.45 0.27 0.14
The integrated weight vector ( *W ) using Eq. (19) will be as follows:
Since chlorophyll a is estimated both subjectively and objectively as the most important parameter in this analysis, the integrated weight of this parameter has been assigned as the highest value. Thus, the eutrophication level is mostly
determined based on the variation of chlorophyll a, in the reservoir. On the other hand, secchi depth has the least variation rate in this study.The integrated weight vector also shows that hypolimnetic oxygen is more important than total phosphorous which is different from what was expressed by experts in the pairwise comparison matrix.Table 5 shows the results of membership values from evaluation matrix for three levels of trophic status which is illustrated in Fig. 6. Fig. 7 shows the monthly variation of Tropic State Index (TSI). The dominant trophic level according to Eq. (14) is specified in Table 5. The EFEI values are shown in Table 5 and Figs. 8 and 9.The results show that critical months for eutrophication occur in autumn and spring after the overturning phenomena. Two months of
λ =[λC λP λSD λHO ] =[0.45 0.27 0.14 0.14](18)
W*
(19)
W*=[W*C W*
P W*SD W*
HO ] [0.71 0.11 0.04 0.14]=
Table 5. Trophic status classification and EFEI values
=
115.033.0115.033.02215.03321
%
%
HO
SD
TP
Chla
HOSDTPChla
A
Chla TP SD HO%Chla
TP SD
HO%
A=(17)
January and February during winter stratification were assessed as oligotrophic condition mainly because of low concentration of chlorophyll a. Also in June, the oligotrophic condition occurs because of low concentration of both chlorophyll a and total phosphorous, high measured secchi depth and hypolimnetic oxygen. But the main strength of the results is that the trophic level in each month is expressed with a degree of certainty; i.e. the oligotrophic condition in June with 0.6 as membership value, has less degree of certainty than for the same trophic condition in winter months with a 0.8 membership value. In the summer, the dominant trophic level is

Iran. J. Environ. Health. Sci. Eng., 2010, Vol. 7, No. 1, pp. 1-14
11
mesotrophic with a certainty level about 60 % as shown in Table 5. It can also be stated that in summer months the reservoir is eutrophic with a certainty of 20-40%.Therefore, the proposed classification system is a realistic method to classify the trophic status of a reservoir which considers the uncertainties
involved in various steps through the entire evaluation process. The uncertainty due to data measurements is regarded by the entropy concept while the uncertainty in the limits of different trophic levels and the vagueness embedded in the decision making output values is dealt with by
(20)
Fig.6: Fuzzy membership values of three trophic state class
Fig.7: Monthly variation of Trophic State Index (TSI)
0.0
20.0
40.0
60.0
80.0
100.0
1 2 3 4 5 6 7 8 9 10 11 12
Month
TSI
TSI(TP) TSI(SD) TSI(Chla)
Hypertrophic
Oligotrophic
Eutrophic
Mesotrophic
0.0
0.2
0.4
0.6
0.8
1.0
Apr.2004
May Jun Jul Aug Sep Oct Nov Dec Jan.2005
Feb Mar.
Month
Fuzz
y m
embe
rshi
p V
alue
be bm bo
`
v

M. Taheriyoun, et al., DEVELPOMENT OF AN ENTROPY ...
12
the fuzzy set theory. To evaluate the utility of the index, a comparison with the Carlson Trophic Status Index (TSI) is made here.
Trophic Status Index (TSI)A frequently used biomass-related trophic status index was developed by Carlson (1977). Carlson’s trophic status index (TSI) uses secchi depth, chlorophyll a, and total phosphorus, each producing an independent measure of trophic state. Index values range from approximately 0 (oligotrophic) to 100 (hypertrophic). The Carlson index is calculated based on the following equations (Carlson, 1977):
TSI(Chla)=30.6+9.81 Ln(Chla)TSI(TP)=4.15+14.42 LN(TP)TSI(SD)=60-14.41 LN(SD)
Fig. 8 illustrates the variation of TSI values for each indicator. The line limits of trophic classes used in the Carlson index is also shown in this figure. In this index, the relative importance of the indicators is not considered and the limits between the classes are crisp. So the imprecision or vagueness included in the boundaries is not accounted for.
As shown in Fig. 8, the results of TSI values are classified into different levels dependent on the parameter used in the formula. Based on the total phosphorous, the reservoir is hypertrophic in most months of the year. But according to the other parameters, the reservoir is mostly in mesotrophic and eutrophic class. This may be a potential source of debate and conflict between decision makers and stakeholders in a watershed to decrease the nutrient load of the reservoir in a TMDL process. On the other hand, TSI cannot deal with uncertainties involved at various steps in the decision-making process. Therefore, despite the wide use of the TSI (Carlson index), it cannot be an efficient and realistic tool in reservoir water quality management. To evaluate the validation of EFEI, a comparison has been made with average TSI values (Fig. 9). The trends of monthly variation of EFEI show a good agreement with TSI. The main advantage of the EFEI over TSI is that the predicted intensity variation in different months seems more realistic as it considers the fuzziness within the limits of trophic classes.Fig. 9 presents a comparison between the EFEI index and the fuzzy index developed by Lu et al., (
0.00
0.50
1.00
1.50
2.00
2.50
3.00
3.50
4.00
Apr.2004
May Jun Jul Aug Sep Oct Nov Dec Jan.2005
Feb Mar.
Month
Inde
x va
lue
0.0
10.0
20.0
30.0
40.0
50.0
60.0
70.0
TSI
EFEI TSI (Ave)
Fig.8: Entropy Fuzzy Eutrophication Index (EFEI) and average TSI monthly variations
Iran. J. Environ. Health. Sci. Eng., 2010, Vol. 7, No. 1, pp. 1-14
13
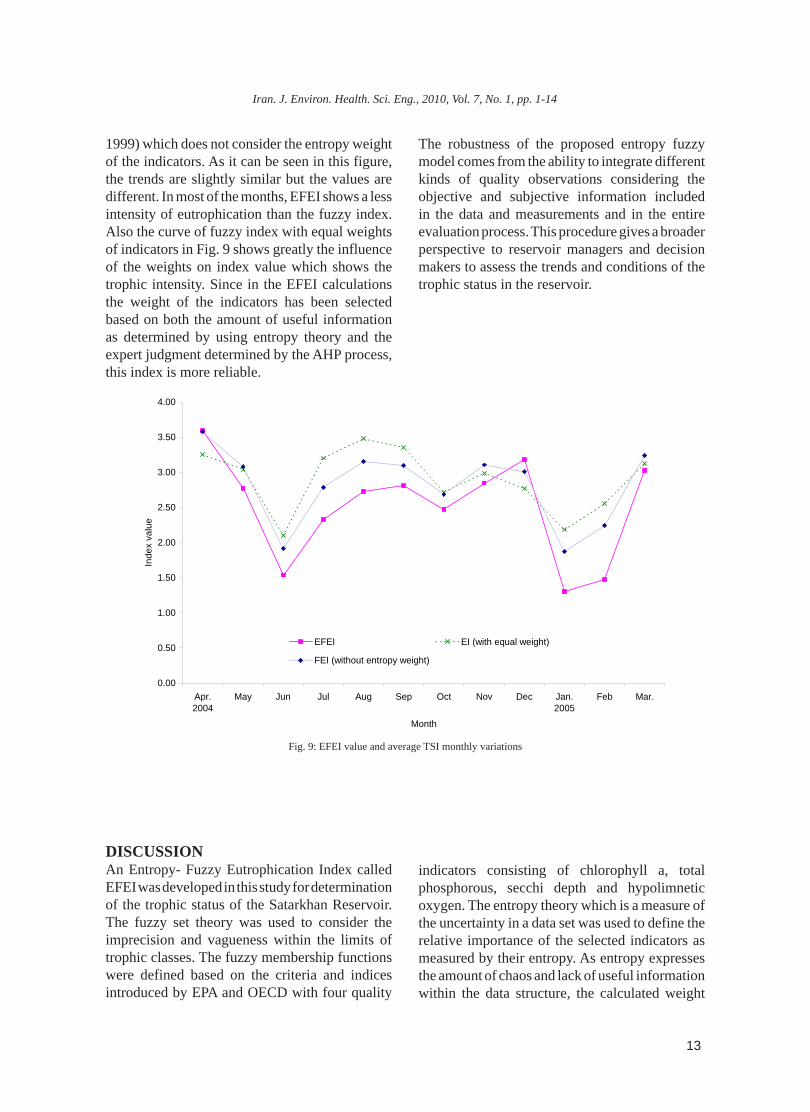
1999) which does not consider the entropy weight of the indicators. As it can be seen in this figure, the trends are slightly similar but the values are different. In most of the months, EFEI shows a less intensity of eutrophication than the fuzzy index. Also the curve of fuzzy index with equal weights of indicators in Fig. 9 shows greatly the influence of the weights on index value which shows the trophic intensity. Since in the EFEI calculations the weight of the indicators has been selected based on both the amount of useful information as determined by using entropy theory and the expert judgment determined by the AHP process, this index is more reliable.
The robustness of the proposed entropy fuzzy model comes from the ability to integrate different kinds of quality observations considering the objective and subjective information included in the data and measurements and in the entire evaluation process. This procedure gives a broader perspective to reservoir managers and decision makers to assess the trends and conditions of the trophic status in the reservoir.
0.00
0.50
1.00
1.50
2.00
2.50
3.00
3.50
4.00
Apr.2004
May Jun Jul Aug Sep Oct Nov Dec Jan.2005
Feb Mar.
Month
Inde
x va
lue
EFEI EI (with equal weight)
FEI (without entropy weight)
Fig. 9: EFEI value and average TSI monthly variations
DISCUSSIONAn Entropy- Fuzzy Eutrophication Index called EFEI was developed in this study for determination of the trophic status of the Satarkhan Reservoir. The fuzzy set theory was used to consider the imprecision and vagueness within the limits of trophic classes. The fuzzy membership functions were defined based on the criteria and indices introduced by EPA and OECD with four quality
indicators consisting of chlorophyll a, total phosphorous, secchi depth and hypolimnetic oxygen. The entropy theory which is a measure of the uncertainty in a data set was used to define the relative importance of the selected indicators as measured by their entropy. As entropy expresses the amount of chaos and lack of useful information within the data structure, the calculated weight
M. Taheriyoun, et al., DEVELPOMENT OF AN ENTROPY ...
14
coefficients state the relative importance of the indicators in an objective fashion. To consider the relative importance of the parameters based on expert judgment, the AHP method was also used to show the subjective importance of indicators. Therefore, the final weight coefficients of the indicators were obtained by integrating the objective and subjective weights computed from the entropy and AHP methods, respectively.Fuzzy membership functions and the weight of each indicator are aggregated by calculating the final evaluation matrices for trophic levels which show the degree of membership of the reservoir water quality status to each trophic class. The results of the entropy- fuzzy index show the uncertainty of each trophic level. This method is useful when dealing with missing data or unreliable information by measuring the entropy content of indicator values. In this way, the best indicators for differentiating the trophic levels are chosen and their impact on the process is proportionally weighted. Therefore, the evaluation process would be more accurate and reasonable. The EFEI in comparison with TSI and the fuzzy index without entropy weight shows a more consistent trend in detecting the monthly variation of trophic levels. The EFEI proposed in this study can be used as an effective tool in eutrophication management of reservoirs.
ACKNOWLEDGEMENTSThis study was partially supported by a contract entitled " Studies of upgrading supply and demand and drought management in Aharchai Watershed" sponsored by the University of Tehran and the East Azerbaijan Water Authority.
REFERENCESCarlson, R.E., (1977). A trophic state index for lakes.
Limnol. Oceanog., 22(2): 361-369.Chang, N. B., Chen, H., Ning, S., (2001).Identification of
river water quality using the Fuzzy SyntheticEvaluation approach , J. Environ Manag, 63: 293–305.Chapra, S., (1997). Surface Water Quality Modeling, Mc-
Graw Hill Int.Chen, S., Wang, X. , Zhao, X. , (2008). An attribute
recognition model based on entropy weight forevaluating the quality of groundwater sources, J China
Univ Mining & Technol, 18: 0072–0075.Chowdhury, S., Husain, T., (2006). Evaluation of Drinking
Water Treatment Technology: An Entropy-Based Fuzzy Application, J. Environ. Eng, ASCE, 132(10):
1264-1271.Duque, W. O., Huguet, N. F., Domingo, J. L.,
Schuhmacher, M., (2006). Assessing water quality in rivers with fuzzy inference systems: A case study, Environment International, 32: 733–742.
Hwang, C., Yoon, K., (1981). Multiple Attribute Decision Making, Methods and Applications, A state-of the- art Survey. Springer-Verlag.
Icaga, Y., (2007). Fuzzy evaluation of water quality classification, Ecological Indicators, 7: 710–718.
Karamouz, M., Mahjouri, N., Kerachian, R., (2004). River Water Quality Zoning: A Case Study of Karoon and Dez River System, Iran. J. Environ. Health Sci & Eng ;1(2), 16-27.
Liou, Y., Lo, S., (2005). A fuzzy index model for trophic status evaluation of reservoir waters, Water Research, 39: 1415–1423.
Lu, R., Lo, L., Hu, J., (1999). Analysis of reservoir water quality using fuzzy synthetic evaluation, Stochastic Environmental Research and Risk Assessment, 13: 327-336.
Lu, R., Lo, S., (2002). Diagnosing reservoir water quality using self-organizing maps and fuzzy theory, Water Research, 36: 2265–2274.
Novotny, V., Olem, H., (1994). Water quality: Prevention, identification, and management of diffuse pollution. Van Nostrand Reinhold Company, New York,NY.
OECD., (1982). Eutrophication of Water: Monitoring, Assessment and Control, Organization for Economic Cooperation and Development, Paris.
Qiu, W. H., (2002). Management decision and applied entropy, Beijing: China Machine Press, 193-196.
Rooyan Consulting Engineers, (2006). Study of the Satarkhan Reservoir Water Quality, Technical Report, Regional Water Organization of Eastern Azerbaijan Province.
Saaty, T.L., (1988). Multicriteria Decision-Making: The Analytic Hierarchy Process. University of Pittsburgh, Pittsburgh, PA.
Shannon, C., (1948). A Mathematical Theory of Communication Bell System Tech. Journal, 27: 379-423.
Silvert, W.,(2000). Fuzzy indices of environmental conditions, Ecol. Model. 130: 111–119.
U.S. EPA, (2000). Nutrient Criteria Technical Guidance Manual Lakes and Reservoirs.
U.S. EPA, (1999). Protocol for Developing Nutrient TMDLs (First Edition).
Vollenweider, R.A., Kerekes. J.J., (1980). Background and summary results of the OECD cooperative program on eutrophication. International Symposium on Inland Waters and Lake Restoration. EPA 440/5-81-010. U.S. Environmental Protection Agency, Washington, DC.
Zadeh, L. A., (1965). ,Fuzzy sets, Inf. Control., 8: 338–353.Zeleny, M., (1982). Multiple criteria decision making,
McGraw-Hill, New York.Zhi-hong, Z., Yi, Y., Jing-nan, S., (2006). Entropy method
for determination of weight of evaluating indicators in fuzzy evaluation for water quality assessment, Journal of environmental Science, 18(5): 1020-1023.