development of an ultra-high performance – two-dimensional
TRANSCRIPT
Development of an Ultra-high Performance –Two-Dimensional –Liquid Chromatography (UHP-2D LC) Method for Synthetic Polymers2D-LC) Method for Synthetic Polymers
Lu Bai, Miroslav Janco, Edwin Mes, Lucia Asensi Bernardi, Kimy Yeung, James Alexander IVAlexander IV
Acknowledgements: Sven Claessens, Scott Wills, Dave Meunier, Kebede Beshah, Dean Lee
Analytical SciencesAnalytical SciencesDow Chemical Company

2D-LC Advantages and Challenges
• An increasingly used technique for analysis of synthetic polymers – more information on distributions (MWD, CCD, FTD t ) ti d i it f li tiFTD etc) : practiced in quite a few applications
• Total time required essentially proportional to the analysis time on the D2
• Short SEC columns often used but compromisedShort SEC columns often used, but compromised resolution
T l th ti l• Two examples on synthetic polymers

Mode combinations 1st Dimension x 2nd Dimension Columns Mobile phasesAnalysis time
(min)Applications
RP‐temperature gradient interaction C18 × C18 Isocratic CH2Cl2/CH3CN 200 Branched polystyrenes (PS)
Survey of 2D‐LC Literature for Analysis Time
chromatogra phy (RP‐TGIC) × RP (LC‐CC)C18 × C18 Isocratic CH2Cl2/CH3CN 200 Branched polystyrenes (PS)
RP × RP C18 × carbon clad zirconia (CCZ) Methanol × acetonitrile 250 complex mixt. of oligostyrenes
RP × NP (HILIC) C18 microbore × aminopropyl silicagradient acetonitrile × isocratic ethanol‐dichloromethane‐water 120
Polymers: ethylene oxide‐propylene oxide (EO‐PO)
(co)oligomers
RP x NP Supelco C18 column (150 Â 2.1 mm, 5 mm particles, 120 A ˚ pore size) x Hypersil bare silica column (150Â 4 6mm 3mm
ACN/THF x n‐hexane in (non‐ 140 PS, PMMA, styrene‐MMA block
RP x RP
RP x NP
RP x NP size) x Hypersil bare silica column (150 Â 4.6 mm, 3 mm particles, 120 A ˚ pore‐size); Nucleosil bare silica
stabilized) THF 140 copolymer
NP (LC‐CC) × SEC Alltech Platinum Silica × HSPgel‐RT MB‐L/Mchloroform/diethylether ×
chloroform ‐Polymer: degradation product of poly(bisphenol A)carbonate
(PC)
NP × SEC Hypersil “bare” silica× PLgel Isocratic 48% ACN in DCM × THF 90Polymer characterization: poly(methyl methacrylate)
(PMMA)
NP × SEC Hypersil “bare” silica ×Mixed‐C Isocratic THF–hexane × THF 240 Polymer: polystyrene (PS)
NP and SEC
NP × SEC Hypersil bare silica × Mixed C Isocratic THF hexane × THF 240 Polymer: polystyrene (PS)
LCCC and SEC LC @ near critical x SEC
Hypersil “bare” silica columns (150 mm × 1.0 mm i.d., 3 �m parti‐ cles; 100 ˚ A pore size; ThermoQuest, Breda, The Netherlands) x
One or two 50 mm × 4.6 mm i.d. PLgel columns (Polymer Laboratories, 5 �m particles with 100 ˚ A pore size and/or 6 �m
oligoPore particles with 100 ˚ A pore size, 25 ◦C)
ACN/DCM x THF 120 (1.5) hydroxyl‐functional PMMA polymers.
RP × SEC NovaPak silica × HSPgel Gradient × THF 300analysis of a series of styrene‐
methylacrylate (SMA) copolymers
RP x SEC Zorbax Eclipse XDB‐C8 column 80‐Å pores x PLGel Mixed C H2O/ACN‐THF x THF 240 poly(styrene)‐co‐poly(methyl methacrylate) latex used in
coating formulations
NP ‐ TGIC x RP ‐ isocratica diol‐ bonded silica column (Nucleosil, 7 µm, 100 Å, 250 × 7.8 mm i.d.) x C18‐bonded silica column (Kromasil, 5 µm, 100 Å,
150 × 4.6 mm i.d.)iso‐octane/THF x ACN/DCM 1200 (12) polystyrene‐block‐
polyisoprene (PS‐b‐PI)
bare silica column (Nucleosil, 3 µm, 100Å, 50 × 2.1mm i.d.)/C18 PMMA and PBMA homo‐ and
RP and SEC
NP/RP and TGIC
NP/RP‐TGIC x HT‐SECbare silica column (Nucleosil, 3 µm, 100 Å, 50 × 2.1 mm i.d.)/C18 bonded silica column (Nucleosil, 7 µm, 500 Å, 150 × 4.6 mm i.d.) x
PolyPore (5 µm, 250 x 4.6 mm i.d.)
iso‐octane/THF or ACN/DCM x THF as low as 60
PMMA and PBMA homo and copolymers, polyurethane
samples
MTF and SEC MTF x SEC150 mm × 4.6 mm i.d. column packed with 0.1 to 1 �m
polydisperse silica particles (Admatech, Aichi, Japan) x 10‐�m 106 Å PLgel particles
non‐stabilized HPLC‐grade tetrahydrofuran 360 branched polymers
UHPLC and UHPSEC UHPLC x UHPSECUPLC BEH C18, 130 pore size x UPLC BEH C18 w/ 130 pore size or
BEH HILICACN/THF x THF 60 (1)
Poly(methyl meth‐ acrylate), PMMA, and poly(n‐butyl methacrylate), PBMA,
homopolymers, as well as (methyl methacrylate)‐(n‐butyl methacrylate) random copolymers, P(MMA‐co‐BMA),

Example I: Polymer Dispersion Analysis with 2D-LC Step 1. Using UHP-SEC to Speed Up D2
Ultra Violet Response (mV)
571.82
514.19
456.56
398.94
341.31
283.68
Data File: 2013-13604-007_2014-06-02_23;24;00_01.vdt Method:
629.44
UVUV UVUV
V)
878.82
787.30
695.78
Data File: 2013-13604-007_2014-06-02_23;24;00_01.vdt Method:
970.34
Retention Volume (mL) 12.00 14.00 16.00 18.00 20.00 22.00 24.00 26.00 28.00
226.06
168.43
110.81
53.18
10.00 30.00
Component CRIRI ELSELS Component C
Component D
Refractive Inde
x Response (mV)
Retention Volume (mL) 12.00 14.00 16.00 18.00 20.00 22.00 24.00 26.00 28.00
604.27
512.75
421.23
329.71
238.20
146.68
55.16
10.00 30.00
Components A+B
12 L12 LEl ti V l
Component D
11 LL
Components A+BComponent D
12mL12mLElution Volume
Speed up D2: 2 min 1 min
1 1 mLmL
Original D2: SEC (conventional) Conditions:Column: high speed SDV LIM (50 × 20 ID mm, 5 µm) Mobile phase: THF; Flow rate: 6 mL/minSample concentration: ~ 16 mg/mLInjection volume: 100 μL
Updated D2: SEC (UHP-SEC) Conditions:Column: Acquity HILIC column (130 Å, 150 x 3 mm, 1.7 µm)Mobile phase: THF; Flow rate: 1 mL/min (back pressure ~6400 psi)Injection volume: 100 μL (back pressure ~6400 psi)Sample concentration: ~1.25 mg/mLInjection volume: 1, 3, 5, 10 μL.
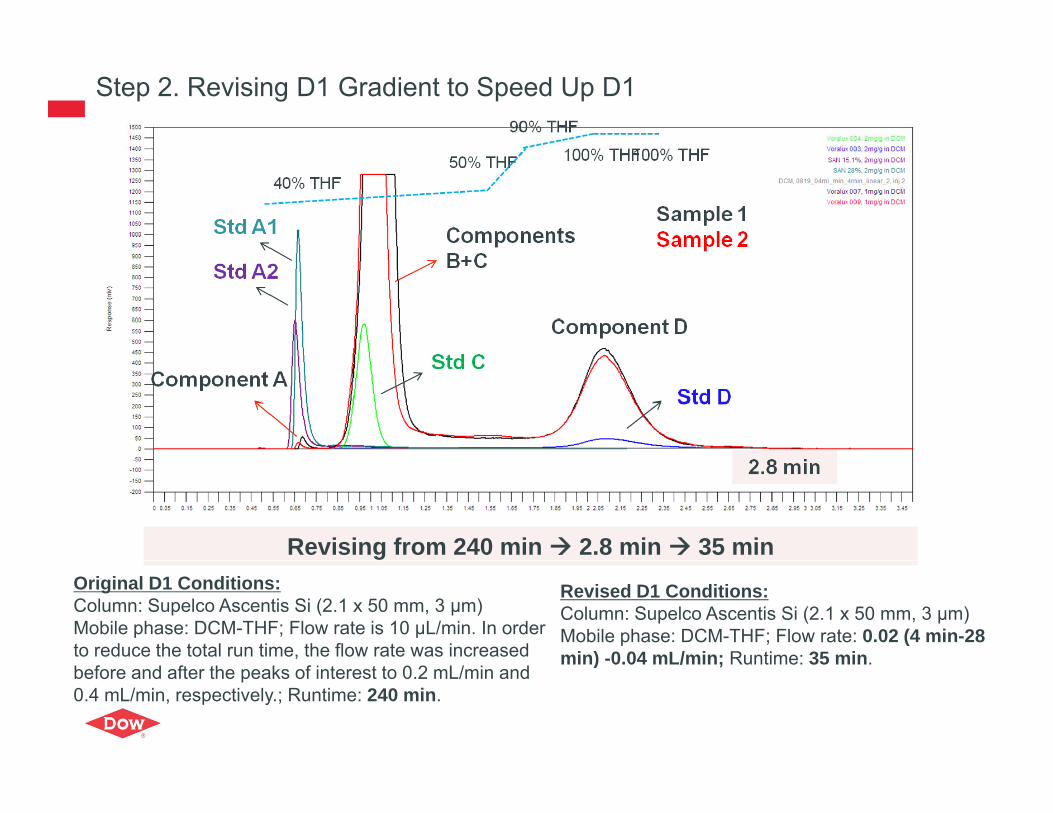
Step 2. Revising D1 Gradient to Speed Up D1
Revising from 240 min 2.8 min 35 minOriginal D1 Conditions:Column: Supelco Ascentis Si (2.1 x 50 mm, 3 μm)Mobile phase: DCM-THF; Flow rate is 10 µL/min. In order to reduce the total run time, the flow rate was increased
Revised D1 Conditions:Column: Supelco Ascentis Si (2.1 x 50 mm, 3 μm)Mobile phase: DCM-THF; Flow rate: 0.02 (4 min-28 min) -0.04 mL/min; Runtime: 35 min.
before and after the peaks of interest to 0.2 mL/min and 0.4 mL/min, respectively.; Runtime: 240 min.
min) 0.04 mL/min; Runtime: 35 min.

Comparison: Conventional Vs. UHP-2D-LCConventional 2D-LC
Total runtime: 240 minUHP-2D-LC
Total runtime: 35 min
Component BComponents CComponents D
Component D
Components CComponents B
RI
(Identified by spiking)
RIComponent A Component A
Analysis time is much shortened by using sub 2 um particle size column and revising the
RTMWMW MWMW
. Analysis time is much shortened by using sub-2 um particle size column and revising the gradient
. Peak identification matched original data; product now in scale-up
Future Improvement includes increasing resolution of the 2D contour map by making more cuts. Future Improvement includes increasing resolution of the 2D contour map by making more cuts across each peak.

Example II: End-cap Distribution for Polymer ProductsChallenges with Separating by End-Cap Distributions
• MWD and End-cap distributions are correlated with application properties• Polyurethane backbone with A and B end-caps: three different end-capping possibilities in this product: AA, AB and BB
A B
*Ideal structure of the polymer
AA l
Co-elution of AB + BB polymers; molecular weight
polymer effects on retention
From residual A Impurity from sample
UPLC Conditions: water/THF, 0.2 mL/min on Acquity BEH C18, 1.7 µm, 2.1 mm X 50 mm

Offline 2D-LC Analysis of End-capping: SEC x UHPLCGPC Fractionation
[a.u
.]
MALDI-MS analysis of a low MW fraction
1012
6.8
1500
2000
Inte
ns. [
BB series
1164
2.6
500
1000 AB series
Dow Confidential Information
8000 9000 10000 11000 12000 13000 14000m/z
8

Leveraging APC in UHP-2D-LC Method DevelopmentLoops emptied to D2 : UHP‐SEC
Loop s filled from D1:UPLCValco 8‐port 2‐position valve; Loop Size10 μL
Modulation Period 0.5 min
D1 Conditions:Column: Acquity BEH C18, 1.7 μm, 1x100 mmFlow rate: 0.02 mL/minD t t UV@254 R ti 55 i
D2 Conditions:Column: Waters APC XT200, 2.5 μm,4.6 x 150 mm
/Detector: UV@254 nm; Runtime: 55 min. Flow rate: 1.8 mL/minDetector: ELSD; Runtime: 0.5 min.
9

Advanced Polymer Chromatography (APC)UHP SEC Analysis of 16 PS StandardsUHP SEC Analysis of 16 PS Standards
se, [
mV
] 1 13
0K56
0K 310K
200K
20K
98K
66K
30K
2K
~200 – 1M
tor r
espo
ns 12
44K
22
11.6
K
7000
250
00 220
(BH
T)
RI d
etec
t
32 170
580
2
UHP SEC Conditions:
Column set: 3 UHP SEC columns (150x4.6 mm ID) packed with BEH TMS particles,
Run time: 6 min
( )
Pore Size: 45+125+450Å, Particle Size: 2.5 µm, Tc= 40 oC
Eluent: THF (Certified grade from Fisher), Flow rate: 1 mL/min
Injection volume: 10 µL, Inj. C: ~0.07 mg/mL/component
Janco, M., Alexander, J., Bouvier, E., & Morrison, D. (2013). Ultra-high performance size-exclusion chromatography of synthetic polymers. J. Sep. Sci. , 36, 2718-2727.
Detector: RI, TD = 40 oC

Online 2D-LC Analysis of the Polymer Products Product 2Product 1
Pea
k 2
ntio
n Ti
me
Stro
nger
BB 72k 30k 16k134k
Pea
k 1
UPL
C R
eten
Inte
ract
ion:
S
AB
AA
AB
AAU
SEC Elution Volume Hydrodynamic volume: smaller
I
View with Inclination (Side view) View with Inclination (Side view)
AA AA
( ) ( )
11Residual A can also be detected but not shown in the zoom-in figures.

Correlating Volume% with Performance
AA
AB
A
BB
2 samples (#1 and #3) “different from control”, 2 of “close to control” samples (#2 and #4) d 1 “ diff t f t l” (#5) h
1 2 3 4 ctrl 5
#4), and 1 “very different from control” (#5) are shown
Volume% can be calculated from 2D charts
It shows the distribution of different end-capped polymers in the sample
The distribution pattern a very sensitive parameter to sample composition and correlate with performance of the samples.

Conclusions and Future Directions•UHP-2D-LC has shown great potential to improve throughput for 2D-LC analysis. Analysis time can be significantly reduced with these technologies.
•Analysis of polymer dispersion adopted some of the above mentioned tools and•Analysis of polymer dispersion adopted some of the above mentioned tools and was used to demonstrate the possibility of making 2D-LC a practical tool for industrial use. Analysis of another polymer product showed the high resolution separation of three end-capped types, providing a direct, visual means for evaluating the variants and correlate end-cap distributions with performance.
•A potential drawback with using these technologies is the narrower retention window on D1 possibly resulting in small number of slices per D1 peakwindow on D1 possibly resulting in small number of slices per D1 peak.
•Use of RI is still challenging if cycle time needs to be minimized
Th i l d l i b 2 l h D1 f h ff i• The next steps include evaluating sub-2 µm column on the D1 for the effects it has on resolution of the 2D contour map in the polymer dispersion analysis

Thanks for Your Attention!