development of and recovery from secondary hypogonadism in
TRANSCRIPT

Development of and Recovery from SecondaryHypogonadism in Aging Men: Prospective Resultsfrom the EMAS
Giulia Rastrelli, Emma L. Carter, Tomas Ahern, Joseph D. Finn, Leen Antonio,Terence W. O’Neill, Gyorgy Bartfai, Felipe F. Casanueva, Gianni Forti,Brian Keevil, Mario Maggi, Aleksander Giwercman, Thang S. Han,Ilpo T. Huhtaniemi, Krzysztof Kula, Michael E. J. Lean, Neil Pendleton,Margus Punab, Dirk Vanderschueren, Frederick C. W. Wu,and the EMAS Study Group*
Context: Secondary hypogonadism is common in aging men; its natural history and predisposingfactors are unclear.
Objectives: The objectives were 1) to identify factors that predispose eugonadal men (T � 10.5 nmol/L) todevelopbiochemicalsecondaryhypogonadism(T�10.5nmol/L;LH�9.4U/L)andsecondaryhypogonadalmen to recover to eugonadism; and 2) to characterize clinical features associated with these transitions.
Design: The study was designed as a prospective observational general population cohort survey.
Setting: The setting was clinical research centers.
Participants: The participants were 3369 community-dwelling men aged 40–79 years in eightEuropean centers.
Intervention: Interventions included observational follow-up of 4.3 years.
Main Outcome Measure: Subjects were categorized according to change/no change in biochemicalgonadal status during follow-up as follows: persistent eugonadal (n � 1909), incident secondary hypogo-nadal(n�140),persistentsecondaryhypogonadal(n�123),andrecoveredfromsecondaryhypogonadismto eugonadism (n � 96). Baseline predictors and changes in clinical features associated with incident sec-ondary hypogonadism and recovery from secondary hypogonadism were analyzed by regression models.
Results: The incidence of secondary hypogonadism was 155.9/10 000/year, whereas 42.9% of men withsecondary hypogonadism recovered to eugonadism. Incident secondary hypogonadism was predicted byobesity(bodymassindex�30kg/m2;oddsratio[OR]�2.86[95%confidenceinterval,1.67;4.90];P� .0001),weightgain(OR�1.79[1.15;2.80];P� .011),andincreasedwaistcircumference(OR�1.73[1.07;2.81],P�
.026; and OR � 2.64 [1.66; 4.21], P � .0001, for waist circumference 94–102 and �102 cm, respectively).Incident secondary hypogonadal men experienced new/worsening sexual symptoms (low libido, erectiledysfunction, and infrequent spontaneous erections). Recovery from secondary hypogonadism was pre-dictedbynonobesity (OR�2.28 [1.21;4.31];P� .011),weight loss (OR�2.24 [1.04;4.85];P� .042),normalwaist circumference(OR�1.93 [1.01;3.70];P� .048), youngerage(�60y;OR�2.32 [1.12;4.82];P� .024),and higher education (OR � 2.11 [1.05; 4.26]; P � .037), but symptoms did not show significant concurrentimprovement.
Conclusion: Obesity-related metabolic and lifestyle factors predispose older men to the develop-ment of secondary hypogonadism, which is frequently reversible with weight loss. (J Clin Endo-crinol Metab 100: 3172–3182, 2015)
ISSN Print 0021-972X ISSN Online 1945-7197Printed in USACopyright © 2015 by the Endocrine SocietyReceived March 3, 2015. Accepted May 18, 2015.First Published Online May 22, 2015
Author Affiliations are shown at the bottom of the next page.Abbreviations: BDI, Beck Depression Index; BMI, body mass index; CI, confidence interval; DSST,digit symbol substitution test; EUG, eugonadism; HDL, high-density lipoprotein; HG, hypogonad-ism; HOMA-IR, homeostasis model assessment of insulin resistance; isHG, incident sHG; MetS,metabolic syndrome; OR, odds ratio; PASE, Physical Activity Scale for the Elderly; pEUG, persistentEUG; PPT, physical performance test; psHG, persistent sHG; rsHG, recovery from sHG; SF-36, 36-item Short-Form Health Survey; sHG, secondary HG; WC, waist circumference.
O R I G I N A L A R T I C L E
3172 press.endocrine.org/journal/jcem J Clin Endocrinol Metab, August 2015, 100(8):3172–3182 doi: 10.1210/jc.2015-1571
The Endocrine Society. Downloaded from press.endocrine.org by [Andrew Harmon] on 14 January 2016. at 06:31 For personal use only. No other uses without permission. . All rights reserved.The Endocrine Society. Downloaded from press.endocrine.org by [${individualUser.displayName}] on 21 June 2016. at 02:52 For personal use only. No other uses without permission. . All rights reserved.
brought to you by COREView metadata, citation and similar papers at core.ac.uk
provided by SZTE Publicatio Repozitórium - SZTE - Repository of Publications

After the third decade, T decreases in men by 0.4–2%per year (1). Besides aging, other risk factors, par-
ticularly obesity, contribute substantially to the T declineirrespective of age (1, 2). There is also evidence suggestingthat low T can promote fat accumulation (3) and suggest-ing a bidirectional relationship between obesity and low T.Longitudinal data from the European Male Ageing Study(EMAS) showed that weight gain was progressively asso-ciated with a decline in T levels without a concomitantchange in LH (4), compatible with secondary hypogonad-ism (sHG). Furthermore, weight loss was proportionatelyassociated with increases in T (4), suggesting that sHG ispotentially reversible.
sHG accounts for more than 50% of men with low T inthe general population (5) and in patients with sexual dys-function (6). To better understand the natural history andclinical significance of sHG, it is important to further in-vestigate longitudinally the role of obesity, relative toother potential risk factors, in predicting the developmentof and recovery from sHG.
Symptoms of androgen deficiency in the presence oflow T provide the diagnostic cornerstone of the syndromeof hypogonadism (7). Late-onset hypogonadism has beenstringently defined by us as subnormal T associated withthree sexual symptoms (5, 8). However, the cross-sec-tional association between low T and symptoms was at-tenuated after adjusting for body mass index (BMI) andcomorbidities (5), underlining the multicausal origin ofputative symptoms of hypogonadism in aging men. More-over, obesity, independent of T, is associated with sexual(9) and psychological symptoms (10) as well as impairedphysical activity (11). Confirming the appearance of thesesymptoms with the development of biochemical hypogo-nadism and/or their resolution after recovery to eugonad-ism (EUG) would support their relevance as specific clin-ical markers of androgen deficiency, important in thediagnostic workup of men with low T.
The aim of the study was to identify predictors of, andsymptoms associated with, incident sHG (isHG) and re-covery from sHG (rsHG) in middle-aged and older menfrom the general population.
Subjects and Methods
Participants and study designThe EMAS design and methods have been previously described
(12, 13). Briefly, an age-stratified sample of 3369 men aged 40–79(mean � SD, 60 � 11) years was recruited from population registersineightEuropeancenters:Manchester(UnitedKingdom),Leuven(Bel-gium), Malmö (Sweden), Tartu (Estonia), Lodz (Poland), Szeged(Hungary), Florence (Italy) and Santiago de Compostela (Spain). Par-ticipantsattendedresearchclinicsatbaselineand4.3years later(range,3.0–5.7y) for follow-upassessments (12,13).During thisperiod,193mendied,334werelosttofollow-up,and106wereinstitutionalizedorbecametoofrail.Ethicalapprovalforthestudywasobtainedaccordingto institutional requirements in each center. All participants providedwritten, informed consent. They completed questionnaires at bothbaselineand follow-up (12,13)about smoking,alcohol consumption,and currently treated comorbidities (1). Anthropometric measure-ments, Reuben’s physical performance test (PPT), and psychomotorprocessing speed (digit symbol substitution test [DSST]) were per-formed according to standardized methods (12, 13). Physical, sexual,and psychological symptoms were determined from responses to theMedical Outcomes Study (MOS) 36-item Short-Form health survey(SF-36), the EMAS Sexual Function Questionnaire, and the Beck De-pression Inventory (BDI), respectively.
Hormone measurementsSingle, fasting morning (before 10 AM) venous blood samples
were obtained at baseline and follow-up. T was measured byliquid chromatography–tandem mass spectrometry, with pairedbaseline and follow-up samples analyzed simultaneously. LH,FSH, and SHBG were measured by the E170 platform electro-chemiluminescence immunoassay (Roche Diagnostics). Free Twas calculated using the Vermeulen formula (14). Intra- andinterassay coefficients of variation (CVs) were: T, 4.0 and 5.6%;SHBG, 1.7 and 3.2%; LH, 1.9 and 3.0%; and FSH, 1.8 and5.3%, respectively. The lower limit of total T measurement was0.17 nmol/L (0.05 ng/mL). Insulin was assayed using chemilu-minescence (coefficients of variation, 3.9 and 5%). Biochemistryand hematology parameters were performed with standardizedmeasurements, undertaken in hospital laboratories in each cen-ter. Insulin resistance was calculated using the homeostasismodel assessment of insulin resistance (HOMA-IR � fastinginsulin [U/mL] � fasting glucose [mmol/L]/22.5) (15).
Gonadal statusParticipantswithT�10.5nmol/LweredefinedasEUG;whenT�
10.5 nmol/L and LH � 9.4 U/L, they were defined as having sHG (5).Subjectswerefurthercategorizedbytheirchangeingonadalstatusinto:
Sexual Medicine and Andrology Unit (G.R., G.F., M.M.), Department of Experimental Clinical and Biomedical Sciences, University of Florence, 50139 Florence, Italy; Andrology ResearchUnit (E.L.C., T.A., J.D.F., F.C.W.W.), Centre for Endocrinology and Diabetes, Institute of Human Development, The University of Manchester, Manchester M13 9WL, United Kingdom;Department of Andrology and Endocrinology (L.A., D.V.), Katholieke Universiteit Leuven, B 3000 Leuven, Belgium; Arthritis Research UK Centre for Epidemiology (T.W.O.), Institute ofInflammation and Repair, Faculty of Medical and Human Sciences, Manchester Academic Health Science Centre, University of Manchester and National Institute for Health ResearchManchester Musculoskeletal Biomedical Research Unit, Central Manchester National Health Service Foundation Trust, Manchester M13 9WL, United Kingdom; Department of Obstetrics,Gynaecology, and Andrology (G.B.), Albert Szent-György Medical University, H6725 Szeged, Hungary; Department of Medicine (F.F.C.), Santiago de Compostela University, ComplejoHospitalario Universitario de Santiago, Centro de Investigación Biomedical en Red de Fisiopatología Obesidad y Nutricion (CB06/03), Instituto Salud Carlos III, 15076 Santiago deCompostela, Spain; Department of Clinical Biochemistry (B.K.), Istituto Nazionale Biostrutture e Biosistemi (M.M.), Consorzio Interuniversitario, 00136 Rome, Italy; University Hospital ofSouth Manchester, Manchester M13 9WL, United Kingdom; Reproductive Medicine Centre (A.G.), Malmö University Hospital, University of Lund, SE-205 02 Malmö, Sweden; Departmentof Endocrinology (T.S.H.), Ashford and St Peter’s National Health Service Trust, Surrey KT16 0PZ, United Kingdom; Department of Surgery and Cancer (I.T.H.), Institute of Reproductiveand Developmental Biology, Imperial College London, London W12 0NN, United Kingdom; Department of Andrology and Reproductive Endocrinology (K.K.), Medical University of Łódz,90-419 Łódz, Poland; Department of Human Nutrition (M.E.J.L.), University of Glasgow, Glasgow G12 8QQ, United Kingdom; School of Community-Based Medicine (N.P.), The Universityof Manchester, Hope Hospital, Salford M6 8HD, United Kingdom; and Andrology Unit (M.P.), United Laboratories of Tartu University Clinics, 50406 Tartu, Estonia
doi: 10.1210/jc.2015-1571 press.endocrine.org/journal/jcem 3173
The Endocrine Society. Downloaded from press.endocrine.org by [Andrew Harmon] on 14 January 2016. at 06:31 For personal use only. No other uses without permission. . All rights reserved.The Endocrine Society. Downloaded from press.endocrine.org by [${individualUser.displayName}] on 21 June 2016. at 02:52 For personal use only. No other uses without permission. . All rights reserved.
1) persistent EUG (pEUG)—EUG at baseline and follow-up; 2) inci-dent sHG (isHG)—EUG at baseline and sHG at follow-up; 3) persis-tent sHG (psHG)—sHG at baseline and follow-up; and 4) rsHG—sHG at baseline and EUG at follow-up.
Statistical analysisBaseline differences between isHG and pEUG and between
rsHG and psHG in hormone levels, anthropometrics, biochem-istry, symptoms, and health and lifestyle measures were initiallyevaluated by Student’s t test for continuous variables and �2 testfor categorical variables.
Multiple regression models, adjusted for center as a random effect,were used to account for the hierarchical study design (individualsnested within center). The relationships between gonadal status andputative predictors were assessed using multilevel binary logistic re-gression models, where gonadal status was the outcome, with thepEUG or psHG group being the referent for the analyses of predictorsof isHG or rsHG, respectively. Nine factors were included as fixed-effectpredictors:age, smokingstatus (current smoker,yes/no),alcoholintake (alcoholconsumptionfor�5d/wkvs less), education level (low[compulsoryeducationonly],medium[noncompulsoryeducationbe-low university level], or high [university education]), Physical ActivityScale for the Elderly (PASE) score (�78 vs �78), chronic widespreadpain(yes/no),maritalstatus(nopartner,havingapartnerbutnotlivingtogether, or having a partner and living together), comorbidity (pres-ence/absence of at least one self-reported disorder), BMI (�25, 25–29.9, and �30 kg/m2), and waist circumference (WC) (�94, 94–101.9, and �102 cm).
The relationship between gonadal status and clinical featuresof hypogonadism was investigated using binary logistic regres-sion models with symptoms dichotomized as stable or new/wors-ened as the outcome when assessing outcomes of isHG, and as
stable or resolved/improved when assessing outcomes of rsHG.A symptom was defined as “new” when absent at baseline andpresent at follow-up and as “worsened” when present at baselinebut with a lower severity grading than at follow-up. A symptomwas defined as “resolved” when present at baseline and absent atfollow-up and as “improved” when present at follow-up with alower severity grading than at baseline.
Differences in clinical characteristics between isHG andpEUG or between rsHG and psHG at baseline and changes overtime were investigated by multiple logistic regression modelsadjusted for age (as a continuous variable), center, baseline BMI(as a continuous variable), presence of at least one comorbidityat baseline, smoking, and alcohol intake.
Linear regression models were used to evaluate the associa-tion between isHG or rsHG and baseline levels or percentagechange of metabolic and hematological parameters, expressed ascontinuous variables.
For isHG predictor analysis, weight gain was defined as �5%increase of the baseline value. In the rsHG predictor analysis,weight loss was defined as �5% decrease of the baseline value.
Results from logistic regression models are presented as oddsratios (ORs) and 95% confidence intervals (CIs), and resultsfrom linear regression models are presented as � coefficients with95% CIs. All statistical analyses were conducted using SPSS forWindows 20.1 (IBM).
Results
Natural history of sHGOf the 3369 men that participated in the EMAS (Figure
1), 193 were excluded at baseline because of medical con-
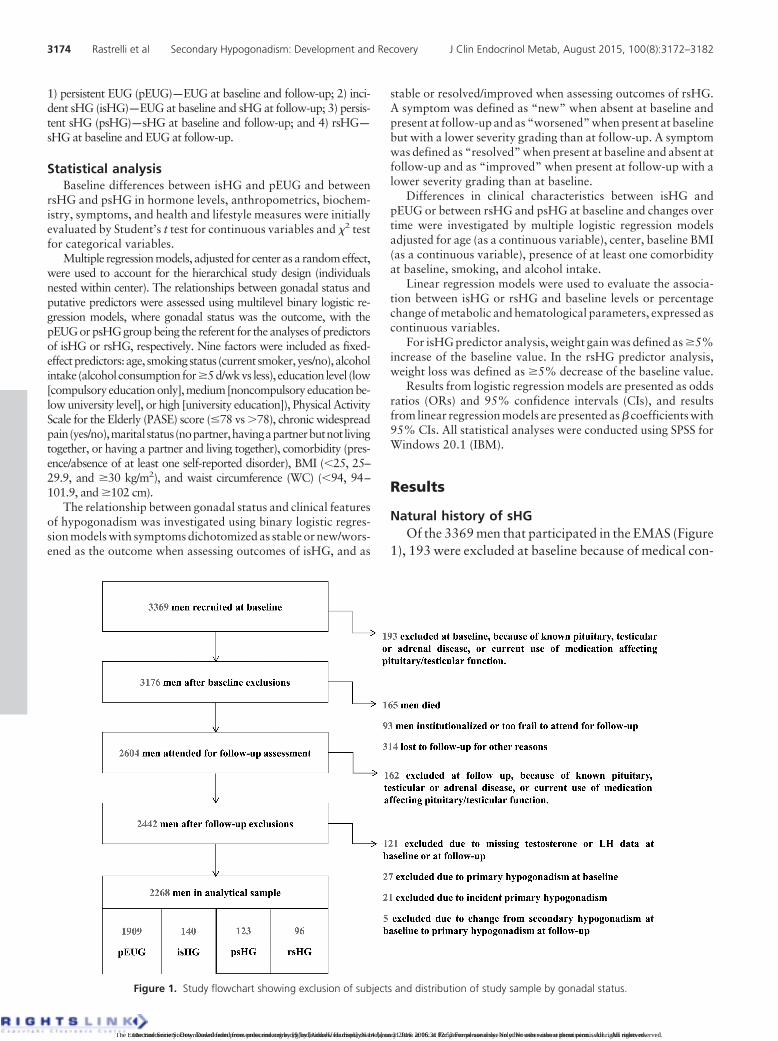
Figure 1. Study flowchart showing exclusion of subjects and distribution of study sample by gonadal status.
3174 Rastrelli et al Secondary Hypogonadism: Development and Recovery J Clin Endocrinol Metab, August 2015, 100(8):3172–3182
The Endocrine Society. Downloaded from press.endocrine.org by [Andrew Harmon] on 14 January 2016. at 06:31 For personal use only. No other uses without permission. . All rights reserved.The Endocrine Society. Downloaded from press.endocrine.org by [${individualUser.displayName}] on 21 June 2016. at 02:52 For personal use only. No other uses without permission. . All rights reserved.
ditions (known pituitary-testicular diseases and medica-tions affecting T); 165 died during the follow-up period;93 were institutionalized or too frail to attend for follow-up; and 314 were lost to follow-up for other reasons. An-other 162 were excluded at follow-up because of medicalconditions/medications, and 121 were excluded due tomissing total T and/or LH levels at baseline and/or follow-up. Among the baseline attendees, the prevalence of sHGwas 10.0% (n � 318). In this sHG group, mortality andlost-to-follow-up rates were 8.2 and 11.3%, compared tothe entire cohort’s rates of 5.2 and 9.9%, respectively. Inthe analytical sample of 2268 men, 1909 were pEUG, 140isHG, 123 psHG, and 96 rsHG (Figure 1). The prevalenceof sHG at follow-up was 11.0%, and the incidence of sHGfrom EUG was 6.28% in 4.3 years, or 155.9 per 10 000per year, or 1.6% per annum. The recovery rate from sHGto EUG was 30.2% (96 of 318) or 42.9% (96 of 224,excluding 94 subjects not attending the second assess-ment) in 4.3 years.
Compared with the analytical sample, men who died,who were institutionalized, or who were too frail to attendwere older; had lower free T and higher SHBG and gonad-otropins, but not significantly different total T levels; andreported more diabetes mellitus and cardiovascular diseasesand worse physical performance (Supplemental Table 1).Conversely, subjects who were lost to follow-up for otherreasons were similar to the analytical group, except for ahigher prevalence of smoking and metabolic syndrome(MetS) and lower psychomotor processing speed.
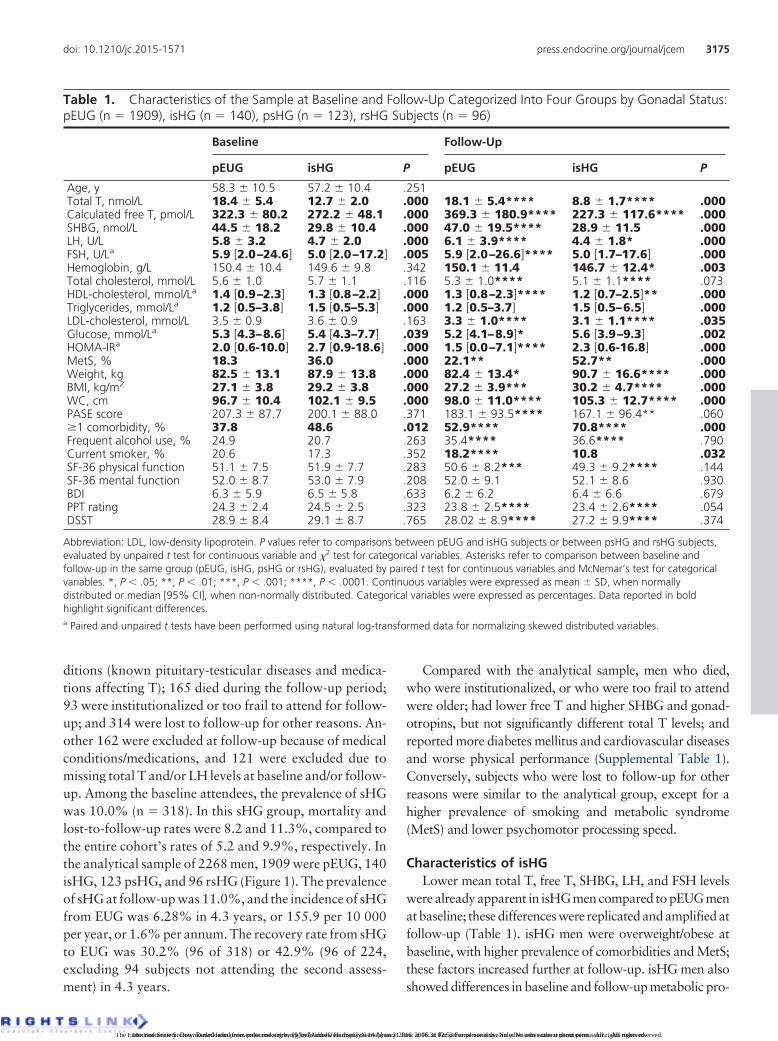
Characteristics of isHGLower mean total T, free T, SHBG, LH, and FSH levels
were already apparent in isHG men compared to pEUG menatbaseline; thesedifferenceswere replicatedandamplifiedatfollow-up (Table 1). isHG men were overweight/obese atbaseline, with higher prevalence of comorbidities and MetS;these factors increased further at follow-up. isHG men alsoshowed differences in baseline and follow-up metabolic pro-
Table 1. Characteristics of the Sample at Baseline and Follow-Up Categorized Into Four Groups by Gonadal Status:pEUG (n � 1909), isHG (n � 140), psHG (n � 123), rsHG Subjects (n � 96)
Baseline Follow-Up
pEUG isHG P pEUG isHG P
Age, y 58.3 � 10.5 57.2 � 10.4 .251Total T, nmol/L 18.4 � 5.4 12.7 � 2.0 .000 18.1 � 5.4**** 8.8 � 1.7**** .000Calculated free T, pmol/L 322.3 � 80.2 272.2 � 48.1 .000 369.3 � 180.9**** 227.3 � 117.6**** .000SHBG, nmol/L 44.5 � 18.2 29.8 � 10.4 .000 47.0 � 19.5**** 28.9 � 11.5 .000LH, U/L 5.8 � 3.2 4.7 � 2.0 .000 6.1 � 3.9**** 4.4 � 1.8* .000FSH, U/La 5.9 [2.0–24.6] 5.0 [2.0–17.2] .005 5.9 [2.0–26.6]**** 5.0 [1.7–17.6] .000Hemoglobin, g/L 150.4 � 10.4 149.6 � 9.8 .342 150.1 � 11.4 146.7 � 12.4* .003Total cholesterol, mmol/L 5.6 � 1.0 5.7 � 1.1 .116 5.3 � 1.0**** 5.1 � 1.1**** .073HDL-cholesterol, mmol/La 1.4 [0.9–2.3] 1.3 [0.8–2.2] .000 1.3 [0.8–2.3]**** 1.2 [0.7–2.5]** .000Triglycerides, mmol/La 1.2 [0.5–3.8] 1.5 [0.5–5.3] .000 1.2 [0.5–3.7] 1.5 [0.5–6.5] .000LDL-cholesterol, mmol/L 3.5 � 0.9 3.6 � 0.9 .163 3.3 � 1.0**** 3.1 � 1.1**** .035Glucose, mmol/La 5.3 [4.3–8.6] 5.4 [4.3–7.7] .039 5.2 [4.1–8.9]* 5.6 [3.9–9.3] .002HOMA-IRa 2.0 [0.6-10.0] 2.7 [0.9-18.6] .000 1.5 [0.0–7.1]**** 2.3 [0.6-16.8] .000MetS, % 18.3 36.0 .000 22.1** 52.7** .000Weight, kg 82.5 � 13.1 87.9 � 13.8 .000 82.4 � 13.4* 90.7 � 16.6**** .000BMI, kg/m2 27.1 � 3.8 29.2 � 3.8 .000 27.2 � 3.9*** 30.2 � 4.7**** .000WC, cm 96.7 � 10.4 102.1 � 9.5 .000 98.0 � 11.0**** 105.3 � 12.7**** .000PASE score 207.3 � 87.7 200.1 � 88.0 .371 183.1 � 93.5**** 167.1 � 96.4** .060�1 comorbidity, % 37.8 48.6 .012 52.9**** 70.8**** .000Frequent alcohol use, % 24.9 20.7 .263 35.4**** 36.6**** .790Current smoker, % 20.6 17.3 .352 18.2**** 10.8 .032SF-36 physical function 51.1 � 7.5 51.9 � 7.7 .283 50.6 � 8.2*** 49.3 � 9.2**** .144SF-36 mental function 52.0 � 8.7 53.0 � 7.9 .208 52.0 � 9.1 52.1 � 8.6 .930BDI 6.3 � 5.9 6.5 � 5.8 .633 6.2 � 6.2 6.4 � 6.6 .679PPT rating 24.3 � 2.4 24.5 � 2.5 .323 23.8 � 2.5**** 23.4 � 2.6**** .054DSST 28.9 � 8.4 29.1 � 8.7 .765 28.02 � 8.9**** 27.2 � 9.9**** .374
Abbreviation: LDL, low-density lipoprotein. P values refer to comparisons between pEUG and isHG subjects or between psHG and rsHG subjects,evaluated by unpaired t test for continuous variable and �2 test for categorical variables. Asterisks refer to comparison between baseline andfollow-up in the same group (pEUG, isHG, psHG or rsHG), evaluated by paired t test for continuous variables and McNemar’s test for categoricalvariables. *, P � .05; **, P � .01; ***, P � .001; ****, P � .0001. Continuous variables were expressed as mean � SD, when normallydistributed or median [95% CI], when non-normally distributed. Categorical variables were expressed as percentages. Data reported in boldhighlight significant differences.a Paired and unpaired t tests have been performed using natural log-transformed data for normalizing skewed distributed variables.
doi: 10.1210/jc.2015-1571 press.endocrine.org/journal/jcem 3175
The Endocrine Society. Downloaded from press.endocrine.org by [Andrew Harmon] on 14 January 2016. at 06:31 For personal use only. No other uses without permission. . All rights reserved.The Endocrine Society. Downloaded from press.endocrine.org by [${individualUser.displayName}] on 21 June 2016. at 02:52 For personal use only. No other uses without permission. . All rights reserved.

files, with lower high-density lipoprotein (HDL) and highertriglycerides, glucose, and HOMA-IR.
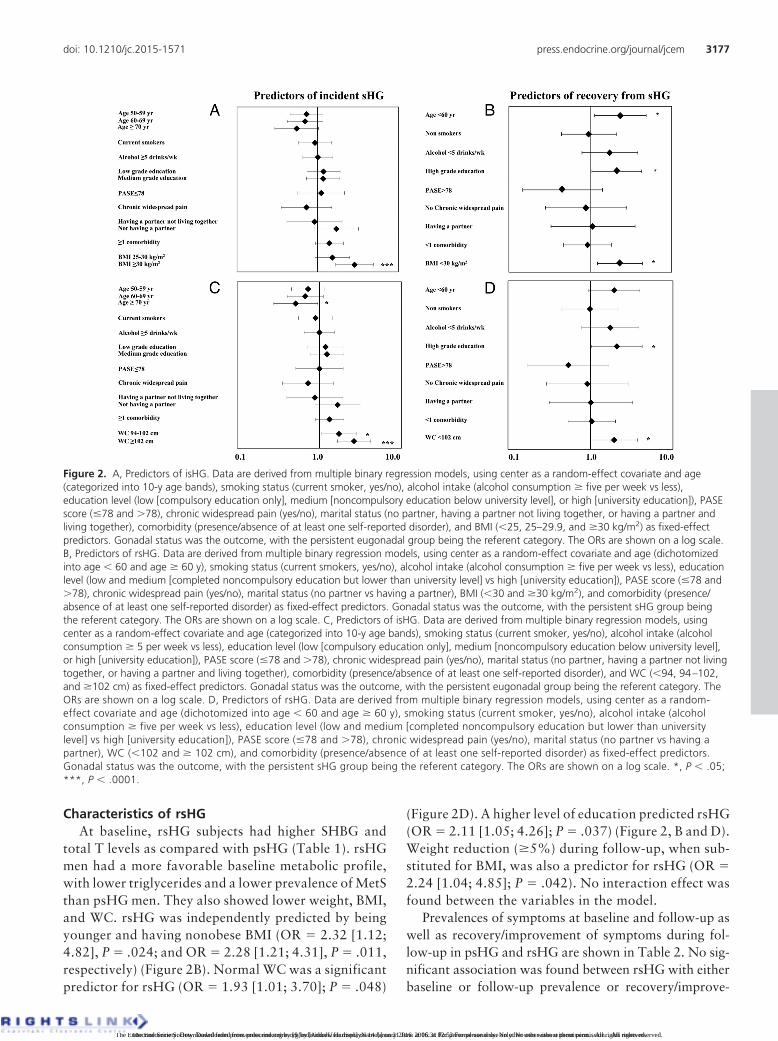
Multiple logistic regression modeling identified obesity(OR � 2.86 [1.67; 4.90]; P � .0001) as an independentpredictor of isHG (Figure 2A). Substituting WC for BMIcategories showed that increased WC was a predictor ofisHG (OR � 1.73 [1.07; 2.81], P � .026; and OR � 2.64[1.66; 4.21], P � .0001, for WC of 94–102 cm and WC �
102 cm, respectively) and that older men (�70 y of age)demonstrated a significantly lower predisposition to de-velop sHG compared to younger subjects (OR � 0.51[0.28; 0.96]; P � .035) (Figure 2C). Weight gain of �5%was also a risk factor for isHG (OR � 1.79 [1.15; 2.80];P � .011). No significant interaction effect was foundbetween the variables in the model.
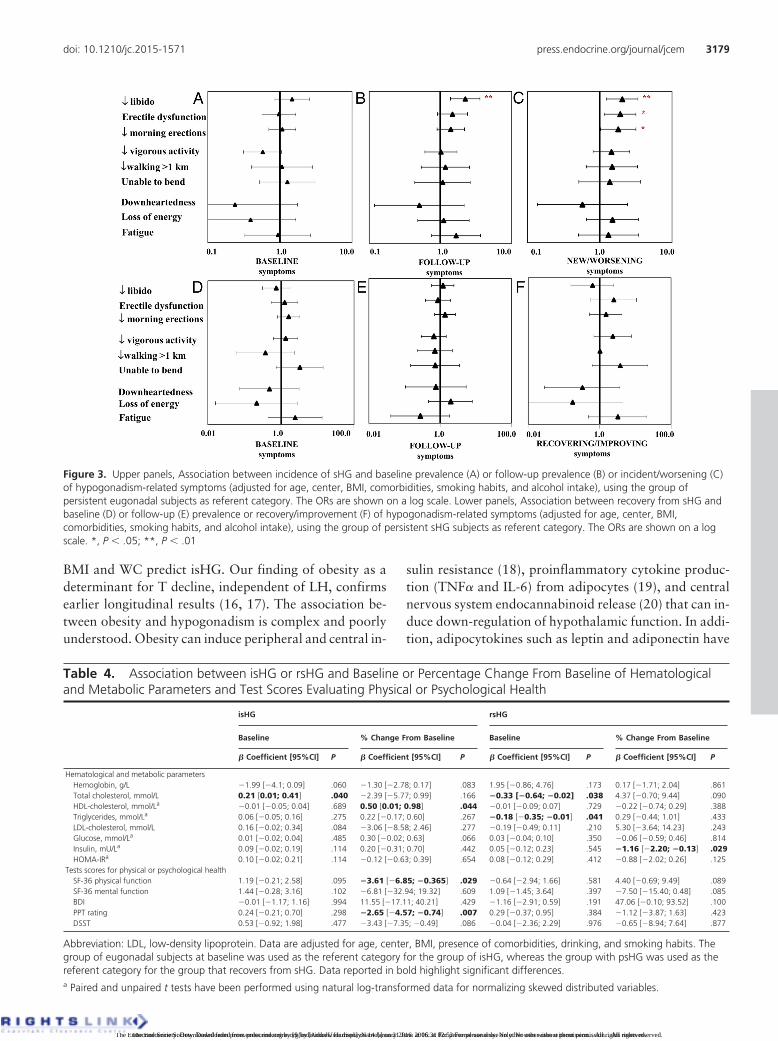
The prevalence of symptoms at baseline and follow-upand new/worsening symptoms during follow-up areshown in Table 2. Men with isHG, compared with pEUG,did not show any difference in the prevalence of symptomsat baseline before or after adjustment (Table 3 and Figure3A). isHG was associated with a higher prevalence of de-
creased libido at follow-up, and although just missing sta-tistical significance, the prevalence of erectile dysfunctionand infrequent morning erections was higher than pEUGat follow-up (Table 3 and Figure 3B). isHG, however, wassignificantly associated with the development or worsen-ing of all three sexual symptoms and one physical symp-tom (impaired vigorous activity) (Table 3). Incrementaladjustments for potential confounders (Table 3) showedthat isHG maintained its association only with new/wors-ening sexual symptoms (Figure 3C).
Compared with pEUG, isHG subjects had significantlyhigher total cholesterol at baseline (Table 4). In addition,isHG was associated with a significant increase in HDL-cholesterol (Table 4). The apparent relationship betweenisHG with increased HDL-cholesterol became insignifi-cant (� � 0.44 [�0.08; 0.95]; P � .096) after adjusting forthose starting lipid-lowering medications during follow-up. isHG men did not differ from pEUG men at baseline,but they showed a significant decrease in the perception ofphysical well-being (SF-36 physical component score) anddeterioration in PPT rating (Table 4).
Table 1. (Continued)
Baseline Follow-Up
psHG rsHG P psHG rsHG P
Age, y 57.6 � 10.6 55.8 � 8.6 .165Total T, nmol/L 8.3 � 1.8 9.2 � 1.0 .000 8.0 � 2.0 13.3 � 2.9**** .000Calculated free T, pmol/L 198.0 � 49.5 202.4 � 37.5 .455 240.7 � 156.2*** 329.7 � 161.6**** .000SHBG, nmol/L 22.7 � 8.9 26.1 � 7.7 .004 24.5 � 9.2**** 31.9 � 10.0**** .000LH, U/L 3.9 � 1.8 4.2 � 1.8 .253 4.1 � 1.8 4.8 � 1.6*** .001FSH, U/La 5.1 [1.7–16.2] 5.2 [1.9–12.9] .914 5.1 [1.5–16.7] 5.3 [1.9–15.7]**** .513Hemoglobin, g/L 149.5 � 9.8 150.5 � 9.1 .431 148.5 � 12.2 149.4 � 10.1 .594Total cholesterol, mmol/L 5.7 � 1.2 5.5 � 1.0 .278 5.1 � 1.3**** 5.2 � 1.0* .345HDL-cholesterol, mmol/La 1.2 [0.7–2.2] 1.2 [0.7–2.1] .266 1.1 [0.6–2.1] 1.2 [0.8–1.9] .062Triglycerides, mmol/La 2.0 [0.8–8.5] 1.5 [0.6–5.8] .009 1.6 [0.7–5.1]* 1.5 [0.6–5.8] .130LDL-cholesterol, mmol/L 3.4 � 1.1 3.4 � 0.9 .607 3.1 � 1.2** 3.3 � 1.0 .213Glucose, mmol/La 5.8 [4.3–9.5] 5.6 [4.1–13.3] .713 5.7 [4.2–9.4] 5.3 [3.8–9.9]* .063HOMA-IRa 3.7 [1.1–24.4] 3.1 [0.7–21.8] .128 2.3 [0.6–12.5]**** 1.7 [0.5–8.4]**** .003MetS, % 62.0 37.9 .000 56.5* 44.0 .087Weight, kg 95.1 � 16.2 90.8 � 12.8 .037 95.0 � 17.6 89.6 � 13.4* .015BMI, kg/m2 31.2 � 4.5 29.5 � 3.4 .002 31.5 � 4.8 29.5 � 3.7 .001WC, cm 107.3 � 10.8 103.4 � 9.6 .006 109.0 � 11.6*** 104.4 � 10.1* .004PASE score 197.5 � 82.0 221.3 � 96.6 .058 185.2 � 91.8* 190.2 � 110.5* .729�1 comorbidity, % 55.3 46.9 .217 71.7**** 66.7 .436Frequent alcohol use, % 24.6 17.7 .220 35.8** 26.5 .171Current smoker, % 18.3 20.8 .654 13.6 19.6 .241SF-36 physical function 50.5 � 7.8 50.3 � 6.9 .799 48.3 � 8.0** 51.0 � 8.9 .025SF-36 mental function 53.1 � 9.2 52.5 � 7.2 .580 53.4 � 8.8 51.7 � 9.3 .188BDI 6.6 � 6.2 5.9 � 4.7 .332 6.4 � 6.8 6.4 � 5.5 .964PPT rating 24.4 � 2.4 24.8 � 2.2 .188 23.7 � 2.3**** 24.0 � 2.4**** .340DSST 29.4 � 8.1 29.9 � 8.4 .644 28.5 � 8.0 28.9 � 8.7 .777
3176 Rastrelli et al Secondary Hypogonadism: Development and Recovery J Clin Endocrinol Metab, August 2015, 100(8):3172–3182
The Endocrine Society. Downloaded from press.endocrine.org by [Andrew Harmon] on 14 January 2016. at 06:31 For personal use only. No other uses without permission. . All rights reserved.The Endocrine Society. Downloaded from press.endocrine.org by [${individualUser.displayName}] on 21 June 2016. at 02:52 For personal use only. No other uses without permission. . All rights reserved.
Characteristics of rsHGAt baseline, rsHG subjects had higher SHBG and
total T levels as compared with psHG (Table 1). rsHGmen had a more favorable baseline metabolic profile,with lower triglycerides and a lower prevalence of MetSthan psHG men. They also showed lower weight, BMI,and WC. rsHG was independently predicted by beingyounger and having nonobese BMI (OR � 2.32 [1.12;4.82], P � .024; and OR � 2.28 [1.21; 4.31], P � .011,respectively) (Figure 2B). Normal WC was a significantpredictor for rsHG (OR � 1.93 [1.01; 3.70]; P � .048)
(Figure 2D). A higher level of education predicted rsHG(OR � 2.11 [1.05; 4.26]; P � .037) (Figure 2, B and D).Weight reduction (�5%) during follow-up, when sub-stituted for BMI, was also a predictor for rsHG (OR �2.24 [1.04; 4.85]; P � .042). No interaction effect wasfound between the variables in the model.
Prevalences of symptoms at baseline and follow-up aswell as recovery/improvement of symptoms during fol-low-up in psHG and rsHG are shown in Table 2. No sig-nificant association was found between rsHG with eitherbaseline or follow-up prevalence or recovery/improve-
Figure 2. A, Predictors of isHG. Data are derived from multiple binary regression models, using center as a random-effect covariate and age(categorized into 10-y age bands), smoking status (current smoker, yes/no), alcohol intake (alcohol consumption � five per week vs less),education level (low [compulsory education only], medium [noncompulsory education below university level], or high [university education]), PASEscore (�78 and �78), chronic widespread pain (yes/no), marital status (no partner, having a partner not living together, or having a partner andliving together), comorbidity (presence/absence of at least one self-reported disorder), and BMI (�25, 25–29.9, and �30 kg/m2) as fixed-effectpredictors. Gonadal status was the outcome, with the persistent eugonadal group being the referent category. The ORs are shown on a log scale.B, Predictors of rsHG. Data are derived from multiple binary regression models, using center as a random-effect covariate and age (dichotomizedinto age � 60 and age � 60 y), smoking status (current smokers, yes/no), alcohol intake (alcohol consumption � five per week vs less), educationlevel (low and medium [completed noncompulsory education but lower than university level] vs high [university education]), PASE score (�78 and�78), chronic widespread pain (yes/no), marital status (no partner vs having a partner), BMI (�30 and �30 kg/m2), and comorbidity (presence/absence of at least one self-reported disorder) as fixed-effect predictors. Gonadal status was the outcome, with the persistent sHG group beingthe referent category. The ORs are shown on a log scale. C, Predictors of isHG. Data are derived from multiple binary regression models, usingcenter as a random-effect covariate and age (categorized into 10-y age bands), smoking status (current smoker, yes/no), alcohol intake (alcoholconsumption � 5 per week vs less), education level (low [compulsory education only], medium [noncompulsory education below university level],or high [university education]), PASE score (�78 and �78), chronic widespread pain (yes/no), marital status (no partner, having a partner not livingtogether, or having a partner and living together), comorbidity (presence/absence of at least one self-reported disorder), and WC (�94, 94–102,and �102 cm) as fixed-effect predictors. Gonadal status was the outcome, with the persistent eugonadal group being the referent category. TheORs are shown on a log scale. D, Predictors of rsHG. Data are derived from multiple binary regression models, using center as a random-effect covariate and age (dichotomized into age � 60 and age � 60 y), smoking status (current smoker, yes/no), alcohol intake (alcoholconsumption � five per week vs less), education level (low and medium [completed noncompulsory education but lower than universitylevel] vs high [university education]), PASE score (�78 and �78), chronic widespread pain (yes/no), marital status (no partner vs having apartner), WC (�102 and � 102 cm), and comorbidity (presence/absence of at least one self-reported disorder) as fixed-effect predictors.Gonadal status was the outcome, with the persistent sHG group being the referent category. The ORs are shown on a log scale. *, P � .05;***, P � .0001.
doi: 10.1210/jc.2015-1571 press.endocrine.org/journal/jcem 3177
The Endocrine Society. Downloaded from press.endocrine.org by [Andrew Harmon] on 14 January 2016. at 06:31 For personal use only. No other uses without permission. . All rights reserved.The Endocrine Society. Downloaded from press.endocrine.org by [${individualUser.displayName}] on 21 June 2016. at 02:52 For personal use only. No other uses without permission. . All rights reserved.
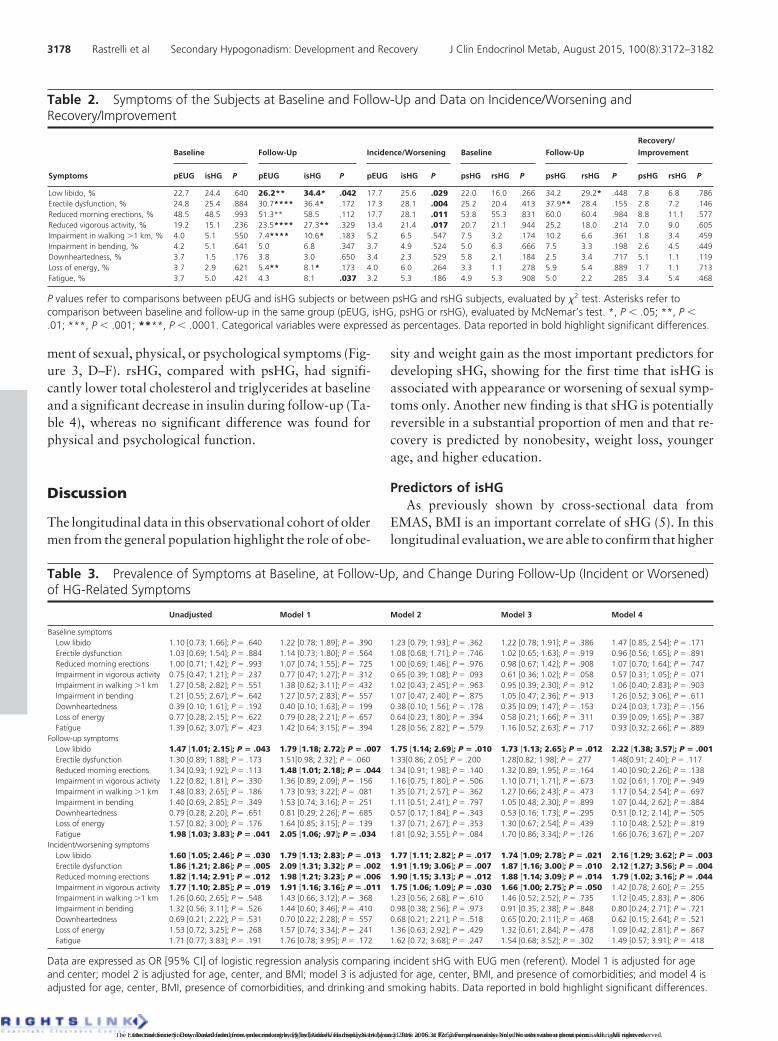
ment of sexual, physical, or psychological symptoms (Fig-ure 3, D–F). rsHG, compared with psHG, had signifi-cantly lower total cholesterol and triglycerides at baselineand a significant decrease in insulin during follow-up (Ta-ble 4), whereas no significant difference was found forphysical and psychological function.
Discussion
The longitudinal data in this observational cohort of oldermen from the general population highlight the role of obe-
sity and weight gain as the most important predictors fordeveloping sHG, showing for the first time that isHG isassociated with appearance or worsening of sexual symp-toms only. Another new finding is that sHG is potentiallyreversible in a substantial proportion of men and that re-covery is predicted by nonobesity, weight loss, youngerage, and higher education.
Predictors of isHGAs previously shown by cross-sectional data from
EMAS, BMI is an important correlate of sHG (5). In thislongitudinal evaluation, we are able to confirm that higher
Table 2. Symptoms of the Subjects at Baseline and Follow-Up and Data on Incidence/Worsening andRecovery/Improvement
Symptoms
Baseline Follow-Up Incidence/Worsening Baseline Follow-Up
Recovery/
Improvement
pEUG isHG P pEUG isHG P pEUG isHG P psHG rsHG P psHG rsHG P psHG rsHG P
Low libido, % 22.7 24.4 .640 26.2** 34.4* .042 17.7 25.6 .029 22.0 16.0 .266 34.2 29.2* .448 7.8 6.8 .786Erectile dysfunction, % 24.8 25.4 .884 30.7**** 36.4* .172 17.3 28.1 .004 25.2 20.4 .413 37.9** 28.4 .155 2.8 7.2 .146Reduced morning erections, % 48.5 48.5 .993 51.3** 58.5 .112 17.7 28.1 .011 53.8 55.3 .831 60.0 60.4 .984 8.8 11.1 .577Reduced vigorous activity, % 19.2 15.1 .236 23.5**** 27.3** .329 13.4 21.4 .017 20.7 21.1 .944 25.2 18.0 .214 7.0 9.0 .605Impairment in walking �1 km, % 4.0 5.1 .550 7.4**** 10.6* .183 5.2 6.5 .547 7.5 3.2 .174 10.2 6.6 .361 1.8 3.4 .459Impairment in bending, % 4.2 5.1 .641 5.0 6.8 .347 3.7 4.9 .524 5.0 6.3 .666 7.5 3.3 .198 2.6 4.5 .449Downheartedness, % 3.7 1.5 .176 3.8 3.0 .650 3.4 2.3 .529 5.8 2.1 .184 2.5 3.4 .717 5.1 1.1 .119Loss of energy, % 3.7 2.9 .621 5.4** 8.1* .173 4.0 6.0 .264 3.3 1.1 .278 5.9 5.4 .889 1.7 1.1 .713Fatigue, % 3.7 5.0 .421 4.3 8.1 .037 3.2 5.3 .186 4.9 5.3 .908 5.0 2.2 .285 3.4 5.4 .468
P values refer to comparisons between pEUG and isHG subjects or between psHG and rsHG subjects, evaluated by �2 test. Asterisks refer tocomparison between baseline and follow-up in the same group (pEUG, isHG, psHG or rsHG), evaluated by McNemar’s test. *, P � .05; **, P �.01; ***, P � .001; ****, P � .0001. Categorical variables were expressed as percentages. Data reported in bold highlight significant differences.
Table 3. Prevalence of Symptoms at Baseline, at Follow-Up, and Change During Follow-Up (Incident or Worsened)of HG-Related Symptoms
Unadjusted Model 1 Model 2 Model 3 Model 4
Baseline symptomsLow libido 1.10 [0.73; 1.66]; P � .640 1.22 [0.78; 1.89]; P � .390 1.23 [0.79; 1.93]; P � .362 1.22 [0.78; 1.91]; P � .386 1.47 [0.85; 2.54]; P � .171Erectile dysfunction 1.03 [0.69; 1.54]; P � .884 1.14 [0.73; 1.80]; P � .564 1.08 [0.68; 1.71]; P � .746 1.02 [0.65; 1.63]; P � .919 0.96 [0.56; 1.65]; P � .891Reduced morning erections 1.00 [0.71; 1.42]; P � .993 1.07 [0.74; 1.55]; P � .725 1.00 [0.69; 1.46]; P � .976 0.98 [0.67; 1.42]; P � .908 1.07 [0.70; 1.64]; P � .747Impairment in vigorous activity 0.75 [0.47; 1.21]; P � .237 0.77 [0.47; 1.27]; P � .312 0.65 [0.39; 1.08]; P � .093 0.61 [0.36; 1.02]; P � .058 0.57 [0.31; 1.05]; P � .071Impairment in walking �1 km 1.27 [0.58; 2.82]; P � .551 1.38 [0.62; 3.11]; P � .432 1.02 [0.43; 2.45]; P � .963 0.95 [0.39; 2.30]; P � .912 1.06 [0.40; 2.83]; P � .903Impairment in bending 1.21 [0.55; 2.67]; P � .642 1.27 [0.57; 2.83]; P � .557 1.07 [0.47; 2.40]; P � .875 1.05 [0.47; 2.36]; P � .913 1.26 [0.52; 3.06]; P � .611Downheartedness 0.39 [0.10; 1.61]; P � .192 0.40 [0.10; 1.63]; P � .199 0.38 [0.10; 1.56]; P � .178 0.35 [0.09; 1.47]; P � .153 0.24 [0.03; 1.73]; P � .156Loss of energy 0.77 [0.28; 2.15]; P � .622 0.79 [0.28; 2.21]; P � .657 0.64 [0.23; 1.80]; P � .394 0.58 [0.21; 1.66]; P � .311 0.39 [0.09; 1.65]; P � .387Fatigue 1.39 [0.62; 3.07]; P � .423 1.42 [0.64; 3.15]; P � .394 1.28 [0.56; 2.82]; P � .579 1.16 [0.52; 2.63]; P � .717 0.93 [0.32; 2.66]; P � .889
Follow-up symptomsLow libido 1.47 [1.01; 2.15]; P � .043 1.79 [1.18; 2.72]; P � .007 1.75 [1.14; 2.69]; P � .010 1.73 [1.13; 2.65]; P � .012 2.22 [1.38; 3.57]; P � .001Erectile dysfunction 1.30 [0.89; 1.88]; P � .173 1.51[0.98; 2.32]; P � .060 1.33[0.86; 2.05]; P � .200 1.28[0.82; 1.98]; P � .277 1.48[0.91; 2.40]; P � .117Reduced morning erections 1.34 [0.93; 1.92]; P � .113 1.48 [1.01; 2.18]; P � .044 1.34 [0.91; 1.98]; P � .140 1.32 [0.89; 1.95]; P � .164 1.40 [0.90; 2.26]; P � .138Impairment in vigorous activity 1.22 [0.82; 1.81]; P � .330 1.36 [0.89; 2.09]; P � .156 1.16 [0.75; 1.80]; P � .506 1.10 [0.71; 1.71]; P � .673 1.02 [0.61; 1.70]; P � .949Impairment in walking �1 km 1.48 [0.83; 2.65]; P � .186 1.73 [0.93; 3.22]; P � .081 1.35 [0.71; 2.57]; P � .362 1.27 [0.66; 2.43]; P � .473 1.17 [0.54; 2.54]; P � .697Impairment in bending 1.40 [0.69; 2.85]; P � .349 1.53 [0.74; 3.16]; P � .251 1.11 [0.51; 2.41]; P � .797 1.05 [0.48; 2.30]; P � .899 1.07 [0.44; 2.62]; P � .884Downheartedness 0.79 [0.28; 2.20]; P � .651 0.81 [0.29; 2.26]; P � .685 0.57 [0.17; 1.84]; P � .343 0.53 [0.16; 1.73]; P � .295 0.51 [0.12; 2.14]; P � .505Loss of energy 1.57 [0.82; 3.00]; P � .176 1.64 [0.85; 3.15]; P � .139 1.37 [0.71; 2.67]; P � .353 1.30 [0.67; 2.54]; P � .439 1.10 [0.48; 2.52]; P � .819Fatigue 1.98 [1.03; 3.83]; P � .041 2.05 [1.06; .97]; P � .034 1.81 [0.92; 3.55]; P � .084 1.70 [0.86; 3.34]; P � .126 1.66 [0.76; 3.67]; P � .207
Incident/worsening symptomsLow libido 1.60 [1.05; 2.46]; P � .030 1.79 [1.13; 2.83]; P � .013 1.77 [1.11; 2.82]; P � .017 1.74 [1.09; 2.78]; P � .021 2.16 [1.29; 3.62]; P � .003Erectile dysfunction 1.86 [1.21; 2.86]; P � .005 2.09 [1.31; 3.32]; P � .002 1.91 [1.19; 3.06]; P � .007 1.87 [1.16; 3.00]; P � .010 2.12 [1.27; 3.56]; P � .004Reduced morning erections 1.82 [1.14; 2.91]; P � .012 1.98 [1.21; 3.23]; P � .006 1.90 [1.15; 3.13]; P � .012 1.88 [1.14; 3.09]; P � .014 1.79 [1.02; 3.16]; P � .044Impairment in vigorous activity 1.77 [1.10; 2.85]; P � .019 1.91 [1.16; 3.16]; P � .011 1.75 [1.06; 1.09]; P � .030 1.66 [1.00; 2.75]; P � .050 1.42 [0.78; 2.60]; P � .255Impairment in walking �1 km 1.26 [0.60; 2.65]; P � .548 1.43 [0.66; 3.12]; P � .368 1.23 [0.56; 2.68]; P � .610 1.46 [0.52; 2.52]; P � .735 1.12 [0.45; 2.83]; P � .806Impairment in bending 1.32 [0.56; 3.11]; P � .526 1.44 [0.60; 3.46]; P � .410 0.98 [0.38; 2.56]; P � .973 0.91 [0.35; 2.38]; P � .848 0.80 [0.24; 2.71]; P � .721Downheartedness 0.69 [0.21; 2.22]; P � .531 0.70 [0.22; 2.28]; P � .557 0.68 [0.21; 2.21]; P � .518 0.65 [0.20; 2.11]; P � .468 0.62 [0.15; 2.64]; P � .521Loss of energy 1.53 [0.72; 3.25]; P � .268 1.57 [0.74; 3.34]; P � .241 1.36 [0.63; 2.92]; P � .429 1.32 [0.61; 2.84]; P � .478 1.09 [0.42; 2.81]; P � .867Fatigue 1.71 [0.77; 3.83]; P � .191 1.76 [0.78; 3.95]; P � .172 1.62 [0.72; 3.68]; P � .247 1.54 [0.68; 3.52]; P � .302 1.49 [0.57; 3.91]; P � .418
Data are expressed as OR [95% CI] of logistic regression analysis comparing incident sHG with EUG men (referent). Model 1 is adjusted for ageand center; model 2 is adjusted for age, center, and BMI; model 3 is adjusted for age, center, BMI, and presence of comorbidities; and model 4 isadjusted for age, center, BMI, presence of comorbidities, and drinking and smoking habits. Data reported in bold highlight significant differences.
3178 Rastrelli et al Secondary Hypogonadism: Development and Recovery J Clin Endocrinol Metab, August 2015, 100(8):3172–3182
The Endocrine Society. Downloaded from press.endocrine.org by [Andrew Harmon] on 14 January 2016. at 06:31 For personal use only. No other uses without permission. . All rights reserved.The Endocrine Society. Downloaded from press.endocrine.org by [${individualUser.displayName}] on 21 June 2016. at 02:52 For personal use only. No other uses without permission. . All rights reserved.
BMI and WC predict isHG. Our finding of obesity as adeterminant for T decline, independent of LH, confirmsearlier longitudinal results (16, 17). The association be-tween obesity and hypogonadism is complex and poorlyunderstood. Obesity can induce peripheral and central in-
sulin resistance (18), proinflammatory cytokine produc-tion (TNF� and IL-6) from adipocytes (19), and centralnervous system endocannabinoid release (20) that can in-duce down-regulation of hypothalamic function. In addi-tion, adipocytokines such as leptin and adiponectin have
Figure 3. Upper panels, Association between incidence of sHG and baseline prevalence (A) or follow-up prevalence (B) or incident/worsening (C)of hypogonadism-related symptoms (adjusted for age, center, BMI, comorbidities, smoking habits, and alcohol intake), using the group ofpersistent eugonadal subjects as referent category. The ORs are shown on a log scale. Lower panels, Association between recovery from sHG andbaseline (D) or follow-up (E) prevalence or recovery/improvement (F) of hypogonadism-related symptoms (adjusted for age, center, BMI,comorbidities, smoking habits, and alcohol intake), using the group of persistent sHG subjects as referent category. The ORs are shown on a logscale. *, P � .05; **, P � .01
Table 4. Association between isHG or rsHG and Baseline or Percentage Change From Baseline of Hematologicaland Metabolic Parameters and Test Scores Evaluating Physical or Psychological Health
isHG rsHG
Baseline % Change From Baseline Baseline % Change From Baseline
� Coefficient [95%CI] P � Coefficient [95%CI] P � Coefficient [95%CI] P � Coefficient [95%CI] P
Hematological and metabolic parametersHemoglobin, g/L �1.99 [�4.1; 0.09] .060 �1.30 [�2.78; 0.17] .083 1.95 [�0.86; 4.76] .173 0.17 [�1.71; 2.04] .861Total cholesterol, mmol/L 0.21 [0.01; 0.41] .040 �2.39 [�5.77; 0.99] .166 �0.33 [�0.64; �0.02] .038 4.37 [�0.70; 9.44] .090HDL-cholesterol, mmol/La �0.01 [�0.05; 0.04] .689 0.50 [0.01; 0.98] .044 �0.01 [�0.09; 0.07] .729 �0.22 [�0.74; 0.29] .388Triglycerides, mmol/La 0.06 [�0.05; 0.16] .275 0.22 [�0.17; 0.60] .267 �0.18 [�0.35; �0.01] .041 0.29 [�0.44; 1.01] .433LDL-cholesterol, mmol/L 0.16 [�0.02; 0.34] .084 �3.06 [�8.58; 2.46] .277 �0.19 [�0.49; 0.11] .210 5.30 [�3.64; 14.23] .243Glucose, mmol/La 0.01 [�0.02; 0.04] .485 0.30 [�0.02; 0.63] .066 0.03 [�0.04; 0.10] .350 �0.06 [�0.59; 0.46] .814Insulin, mU/La 0.09 [�0.02; 0.19] .114 0.20 [�0.31; 0.70] .442 0.05 [�0.12; 0.23] .545 �1.16 [�2.20; �0.13] .029HOMA-IRa 0.10 [�0.02; 0.21] .114 �0.12 [�0.63; 0.39] .654 0.08 [�0.12; 0.29] .412 �0.88 [�2.02; 0.26] .125
Tests scores for physical or psychological healthSF-36 physical function 1.19 [�0.21; 2.58] .095 �3.61 [�6.85; �0.365] .029 �0.64 [�2.94; 1.66] .581 4.40 [�0.69; 9.49] .089SF-36 mental function 1.44 [�0.28; 3.16] .102 �6.81 [�32.94; 19.32] .609 1.09 [�1.45; 3.64] .397 �7.50 [�15.40; 0.48] .085BDI �0.01 [�1.17; 1.16] .994 11.55 [�17.11; 40.21] .429 �1.16 [�2.91; 0.59] .191 47.06 [�0.10; 93.52] .100PPT rating 0.24 [�0.21; 0.70] .298 �2.65 [�4.57; �0.74] .007 0.29 [�0.37; 0.95] .384 �1.12 [�3.87; 1.63] .423DSST 0.53 [�0.92; 1.98] .477 �3.43 [�7.35; �0.49] .086 �0.04 [�2.36; 2.29] .976 �0.65 [�8.94; 7.64] .877
Abbreviation: LDL, low-density lipoprotein. Data are adjusted for age, center, BMI, presence of comorbidities, drinking, and smoking habits. Thegroup of eugonadal subjects at baseline was used as the referent category for the group of isHG, whereas the group with psHG was used as thereferent category for the group that recovers from sHG. Data reported in bold highlight significant differences.a Paired and unpaired t tests have been performed using natural log-transformed data for normalizing skewed distributed variables.
doi: 10.1210/jc.2015-1571 press.endocrine.org/journal/jcem 3179
The Endocrine Society. Downloaded from press.endocrine.org by [Andrew Harmon] on 14 January 2016. at 06:31 For personal use only. No other uses without permission. . All rights reserved.The Endocrine Society. Downloaded from press.endocrine.org by [${individualUser.displayName}] on 21 June 2016. at 02:52 For personal use only. No other uses without permission. . All rights reserved.

been shown to modulate GnRH and gonadotropin secre-tion (21) and to influence testicular T production (22).Conversely, the suggested role for an excess of estrogens,due to an increased aromatase activity in obese subjects, inreducing the GnRH-gonadotropin secretion has not beenconfirmed in obese diabetic (23) and nondiabetic men (5),their estradiol levels being lower, rather than higher, andcorrelated with T levels but not with BMI.
Our results also demonstrated a lower probability thatolder men will develop sHG. Cross-sectional data fromEMAS have shown that aging is associated with elevatedgonadotropins and primary hypogonadism (1, 5). Disor-ders causing a derangement of hypothalamic-pituitaryaxis superimposed on a background of high gonadotropin(as in older men) are less likely to suppress LH to valuesbelow the threshold used to define sHG. Men who at-tended both phases of the study are healthier as comparedwith those who did not (Supplemental Table 1). It is there-fore conceivable that among those attending for follow-up, a survival bias may have selected healthier older menwho are less prone to develop sHG (24).
Developing sHG: clinical featuresIn this study, development of sHG was associated, in-
dependently of BMI, comorbidities, and lifestyle, withnew or worsening sexual symptoms but not physical orpsychological ones. This is consistent with our previouscross-sectional analyses (8) indicating that these three sex-ual symptoms are the most specific subjective features as-sociatedwith lowT. Inaddition, to confirmthe substantialbaseline prevalence (22.7–48.5%) of sexual symptoms,occurrence of new or worsening symptoms in the pEUGmen is not negligible (almost 18%), albeit at a lower ratethan in isHG men (25.6–28.1%), thus accounting for theweaker association between isHG and increased preva-lence of sexual symptoms at follow-up. This emphasizesthe importance of the co-occurrence of all three sexualsymptoms for increasing the probability of a robust syn-dromic clustering with low T (8), which serves to providethe operational definition of symptomatic hypogonadismor late-onset hypogonadism. The longitudinal results,showinga specific associationbetween thedevelopmentofsHG with the appearance or worsening of all three sexualsymptoms prospectively, strongly endorse this approach.
In the cross-sectional analyses, physical or psycholog-ical symptoms did not cluster together with low T, but oneof the physical symptoms, decreased vigor, did show aninverse correlation with T levels (8). Interestingly, in thelongitudinal study, decreased vigorous activity is the onlynonsexual symptom whose new occurrence or worseningwas significantly associated with isHG, until smoking andalcohol habits were included as covariates. This empha-
sizes the nonspecific nature of nonsexual symptoms insHG. However, when considering the objective evaluationof physical performance (PPT rating), a significantlygreater reduction was found in isHG men, although thiswas not translated into a subjective perception ofdeterioration.
Predictors of rsHGThe present results show that sHG is frequently revers-
ible (42.9% when excluding or 30.2% when not excludingthe subjects not attending the second assessment). Rever-sion to EUG was predicted by lower BMI and WC, weightloss, younger age, and higher education. The weight as-sociations are compatible with recent evidence from a gen-eral population showing that weight loss is associated witha proportionate increase in T levels (4, 25). Thus, a �5%weight loss was associated with a significant increase of Tlevels with the maximum effect in those men who lost�15% of weight when LH as well T increased contem-poraneously (4). Supervised dieting/exercise or bariatricsurgery in obese men has been shown to increase T and LHlevels proportionally to the amount of weight loss (26).Interestingly, T increase attained in treated subjects washigher in younger individuals (26). We found, in additionto lower weight, that younger age was an independentpredictor of rsHG, suggesting that the potential for weightloss to improve hypothalamic-pituitary function may beeroded by adverse effects of aging. A novel finding is thata higher level of education was an independent predictorof rsHG. Education is a socioeconomic status surrogateand an important determinant of health inequality.Higher education is a protective factor for cardiovasculardiseases and all-cause mortality (27, 28). Changes in be-havior in response to health education are most beneficialin higher socioeconomic groups (27–29), which maytranslate into improved metabolic status and avoidance ofobesity. Taken together, these results strongly suggest thatsHG or functional hypothalamic suppression associatedwith obesity is potentially reversible with weight loss andamenable to lifestyle-influenced metabolic modificationsespecially in younger educated men. Weight loss, espe-cially in older men, can be unintentional and due to co-morbidities, cancer cachexia, or other wasting diseases.However, excluding men with incident cancer or heartdiseases in our analyses did not influence the relationshipsbetween BMI or weight loss with rsHG (data not shown),suggesting that the observed weight loss in those obesemiddle-aged men (mean age, 56 y) with rsHG may wellhave been intentional and that the concomitant rise in T ispart of the overall, positive health outcome.
3180 Rastrelli et al Secondary Hypogonadism: Development and Recovery J Clin Endocrinol Metab, August 2015, 100(8):3172–3182
The Endocrine Society. Downloaded from press.endocrine.org by [Andrew Harmon] on 14 January 2016. at 06:31 For personal use only. No other uses without permission. . All rights reserved.The Endocrine Society. Downloaded from press.endocrine.org by [${individualUser.displayName}] on 21 June 2016. at 02:52 For personal use only. No other uses without permission. . All rights reserved.

Recovering from sHG: clinical featuresIn this study, the anticipated association between rsHG
and resolution/improvement of symptoms was not found.There are a number of possible explanations. The rela-tively small sample size may not provide sufficient statis-tical power to detect small differences between psHG (n �
123) and rsHG (n � 96), with a minority (two to 11 men)only showing symptomatic improvements. Both groupsare subjected to uncontrolled multiple and multidirec-tional influences during follow-up in this noninterven-tional observational study. The increase in T documentedat one time point at follow-up may not represent a suffi-ciently sustained improvement to transmute into subjec-tive symptomatic recovery. Randomized controlled trialsof T replacement therapy demonstrating improvements insexual function (30), physical strength (31), and depres-sive symptoms (32) usually show a 2-fold increase of Tlevels into the mid-normal physiological range duringtreatment, for a minimum of 24 weeks. The spontaneousrise in T levels observed in our rsHG subjects is relativelysmall by comparison (9.2 nmol/L at baseline, increasing to13.3 nmol/L at follow-up or a 45% increment) and maynot be sufficient to drive improvements or resolution ofsexual symptoms. Given the high prevalence of sexualsymptoms irrespective of the concentration of circulatingT, a further explanation could be that important nonhor-monal (eg, psychosocial and relational) factors contributeto the persistence of symptoms, even after restoration ofnormal T levels.
Strengths and limitationsThe strengths of this study include a large unbiased
sample from the general population, the prospective de-sign providing noninterventional longitudinal data to in-vestigate the natural history and predictors of hypogo-nadism, and the standardized instruments applied acrosscenters and between the phases of the study. T levels weremeasured by liquid chromatography–tandem mass spec-trometry, with paired baseline and follow-up samples an-alyzed simultaneously. Limitations in EMAS have beendescribed previously (13). The study interval of 4.3 yearsmay be relatively short for capturing the more subtlechanges in signs and symptoms of hypogonadism in anobservational study. A single LH measurement only wasavailable to categorize hypogonadism, but its collinearitywith FSH would have minimized any potential misclassi-fication. Also for T, a single measurement only was avail-able at each time point. However, T is a stable analyte (33),and single measurements of T on morning samples canprovide representative and reliable data in large epidemi-ological studies such as the EMAS.
ConclusionsOur longitudinal data showed that obesity or weight
gain predisposed older men to develop sHG. Older menwere at lower risk. Development of sHG was associatedwith the appearance of new or worsening sexual, but notphysical and psychological, symptoms. sHG frequentlyremits; this is predicted by lower BMI, lower WC, orweight loss, as well as younger age and higher education.Biochemical reversal of sHG to EUG, however, was notaccompanied by a significant symptomatic improvement.Further studies are indicated to corroborate and extendthe present results.
Acknowledgments
The authors thank the patients who participated in the study; theresearch/nursing staff in the eight centers: C. Pott (Manchester),E. Wouters (Leuven), M. Nilsson (Malmö), M. del Mar Fernan-dez (Santiago de Compostela), M. Jedrzejowska (Łódz), H.-M.Tabo (Tartu), and A. Heredi (Szeged) for their data collection;and C. Moseley (Manchester) for data entry and projectcoordination.
Address all correspondence and requests for reprints to:Giulia Rastrelli, MD, PhD, Department of Experimental Clini-cal and Biomedical Sciences, University of Florence, VialePieraccini, 6, 50139 Florence, Italy. E-mail: [email protected].
The European Male Aging Study is funded by the Commis-sion of the European Communities Fifth Framework Program“Quality of Life and Management of Living Resources” GrantQLK6-CT-2001-00258 and facilitated by the Manchester Bio-medical Research Center and the National Institute for HealthResearch Greater Manchester Clinical Research Network. Ad-ditional support was provided by Arthritis Research UK, theNational Institute for Health Research, and the Manchester Bio-medical Research Center. The Principal Investigator of EMAS isProfessor Frederick Wu, MD, Andrology Research Unit, Uni-versity of Manchester, Manchester, United Kingdom.
Disclosure Summary: G.R., E.L.C., T.A., J.D.F., L.A.,T.W.O., G.B., F.F.C., G.F., B.K., M.M., A.G., T.S.H., K.K.,M.E.J.L., N.P., M.P., and D.V. have nothing to declare. I.T.H.has research contracts with Ferring Pharmaceuticals and Pan-tarhei Bioscience. I.T.H. consults for Novartis. F.C.W.W. hasconsulted for Bayer-Schering, Eli Lilly, Repros Therapeutics Inc,and Besins Healthcare and also participated in advisory boardmeetings and lectured on their behalf. F.C.W.W. has receivedgrant support (2010–2014) from Bayer Schering AG, PAREXELInternational, and Besins Healthcare. D.V. is a senior clinicalinvestigator supported by the Clinical Research Fund of the Uni-versity Hospitals Leuven, Belgium.
References
1. Wu FC, Tajar A, Pye SR, et al. Hypothalamic-pituitary-testicularaxis disruptions in older men are differentially linked to age and
doi: 10.1210/jc.2015-1571 press.endocrine.org/journal/jcem 3181
The Endocrine Society. Downloaded from press.endocrine.org by [Andrew Harmon] on 14 January 2016. at 06:31 For personal use only. No other uses without permission. . All rights reserved.The Endocrine Society. Downloaded from press.endocrine.org by [${individualUser.displayName}] on 21 June 2016. at 02:52 For personal use only. No other uses without permission. . All rights reserved.

modifiable risk factors: the European Male Aging Study. J Clin En-docrinol Metab. 2008;93:2737–2745.
2. Travison TG, Araujo AB, Kupelian V, O’Donnell AB, McKinlay JB.The relative contributions of aging, health, and lifestyle factors toserum testosterone decline in men. J Clin Endocrinol Metab. 2007;92:549–555.
3. Saad F, Aversa A, Isidori AM, Gooren LJ. Testosterone as potentialeffective therapy in treatment of obesity in men with testosteronedeficiency: a review. Curr Diabetes Rev. 2012;8:131–143.
4. Camacho EM, Huhtaniemi IT, O’Neill TW, et al. Age-associatedchanges in hypothalamic-pituitary-testicular function in middle-aged and older men are modified by weight change and lifestylefactors: longitudinal results from the European Male Ageing Study.Eur J Endocrinol. 2013;168:445–455.
5. Tajar A, Forti G, O’Neill TW, et al. Characteristics of secondary,primary, and compensated hypogonadism in aging men: evidencefrom the European Male Ageing Study. J Clin Endocrinol Metab.2010;95:1810–1818.
6. Corona G, Maseroli E, Rastrelli G, et al. Characteristics of com-pensated hypogonadism in patients with sexual dysfunction. J SexMed. 2014;11:1823–1834.
7. Bhasin S, Cunningham GR, Hayes FJ, et al. Testosterone therapy inmen with androgen deficiency syndromes: an Endocrine Society clin-ical practice guideline. J Clin Endocrinol Metab. 2010;95:2536–2559.
8. Wu FC, Tajar A, Beynon JM, et al. Identification of late-onset hy-pogonadism in middle-aged and elderly men. N Engl J Med. 2010;363:123–135.
9. Han TS, Tajar A, O’Neill TW, et al. Impaired quality of life andsexual function in overweight and obese men: the European MaleAgeing Study. Eur J Endocrinol. 2011;164:1003–1011.
10. Luppino FS, de Wit LM, Bouvy PF, et al. Overweight, obesity, anddepression: a systematic review and meta-analysis of longitudinalstudies. Arch Gen Psychiatry. 2010;67:220–229.
11. Riebe D, Blissmer BJ, Greaney ML, Garber CE, Lees FD, Clark PG.The relationship between obesity, physical activity, and physicalfunction in older adults. J Aging Health. 2009;21:1159–1178.
12. Lee DM, O’Neill TW, Pye SR, et al. The European Male AgeingStudy (EMAS): design, methods and recruitment. Int J Androl.2009;32:11–24.
13. Lee DM, Pye SR, Tajar A, et al. Cohort profile: the European MaleAgeing Study. Int J Epidemiol. 2013;42:391–401.
14. Vermeulen A, Stoïca T, Verdonck L. The apparent free testosteroneconcentration, an index of androgenicity. J Clin Endocrinol Metab.1971;33:759–767.
15. Matthews DR, Hosker JP, Rudenski AS, Naylor BA, Treacher DF,Turner RC. Homeostasis model assessment: insulin resistance and�-cell function from fasting plasma glucose and insulin concentra-tions in man. Diabetologia. 1985;28:412–419.
16. Derby CA, Zilber S, Brambilla D, Morales KH, McKinlay JB. Bodymass index, waist circumference and waist to hip ratio and changein sex steroid hormones: The Massachusetts Male Ageing Study.Clin Endocrinol (Oxf). 2006;65:125–131.
17. Mohr BA, Bhasin S, Link CL, O’Donnell AB, McKinlay JB. Theeffect of changes in adiposity on testosterone levels in older men:longitudinal results from the Massachusetts Male Aging Study. EurJ Endocrinol. 2006;155:443–452.
18. Porte D Jr, Baskin DG, Schwartz MW. Insulin signaling in the cen-tral nervous system: a critical role in metabolic homeostasis anddisease from C. elegans to humans. Diabetes. 2005;54:1264–1276.
19. Pittas AG, Joseph NA, Greenberg AS. Adipocytokines and insulinresistance. J Clin Endocrinol Metab. 2004;89:447–452.
20. Pagotto U, Marsicano G, Cota D, Lutz B, Pasquali R. The emergingrole of the endocannabinoid system in endocrine regulation andenergy balance. Endocr Rev. 2006;27:73–100.
21. George JT, Millar RP, Anderson RA. Hypothesis: kisspeptin medi-ates male hypogonadism in obesity and type 2 diabetes. Neuroen-docrinology. 2010;91:302–307.
22. Stokes VJ, Anderson RA, George JT. How does obesity affect fer-tility in men - and what are the treatment options? Clin Endocrinol(Oxf). 2015;82(5):633–638.
23. Dhindsa S, Furlanetto R, Vora M, Ghanim H, Chaudhuri A, Dan-dona P. Low estradiol concentrations in men with subnormal tes-tosterone concentrations and type 2 diabetes. Diabetes Care. 2011;34:1854–1859.
24. Lindsted KD, Fraser GE, Steinkohl M, Beeson WL. Healthy volun-teer effect in a cohort study: temporal resolution in the AdventistHealth Study. J Clin Epidemiol. 1996;49:783–790.
25. Shi Z, Araujo AB, Martin S, O’Loughlin P, Wittert GA. Longitudi-nal changes in testosterone over five years in community-dwellingmen. J Clin Endocrinol Metab. 2013;98:3289–3297.
26. Corona G, Rastrelli G, Monami M, et al. Body weight loss revertsobesity-associated hypogonadotropic hypogonadism: a systematicreview and meta-analysis. Eur J Endocrinol. 2013;168:829–843.
27. Mensah GA, Mokdad AH, Ford ES, Greenlund KJ, Croft JB. Stateof disparities in cardiovascular health in the United States. Circu-lation. 2005;111:1233–1241.
28. Hu B, Li W, Wang X, Liu L, Teo K, Yusuf S. Marital status, edu-cation, and risk of acute myocardial infarction in Mainland China:the INTER-HEART study. J Epidemiol. 2012;22:123–129.
29. McMichael AJ, McKee M, Shkolnikov V, Valkonen T. Mortalitytrends and setbacks: global convergence or divergence? Lancet.2004;363:1155–1159.
30. Corona G, Isidori AM, Buvat J, et al. Testosterone supplementationand sexual function: a meta-analysis study. J Sex Med. 2014;11:1577–1592.
31. Isidori AM, Giannetta E, Greco EA, et al. Effects of testosterone onbody composition, bone metabolism and serum lipid profile in mid-dle-aged men: a meta-analysis. Clin Endocrinol (Oxf). 2005;63:280–293.
32. Zarrouf FA, Artz S, Griffith J, Sirbu C, Kommor M. Testosteroneand depression: systematic review and meta-analysis. J PsychiatrPract. 2009;15:289–305.
33. Vermeulen A, Verdonck G. Representativeness of a single pointplasma testosterone level for the long term hormonal milieu in men.J Clin Endocrinol Metab. 1992;74:939–942.
3182 Rastrelli et al Secondary Hypogonadism: Development and Recovery J Clin Endocrinol Metab, August 2015, 100(8):3172–3182
The Endocrine Society. Downloaded from press.endocrine.org by [Andrew Harmon] on 14 January 2016. at 06:31 For personal use only. No other uses without permission. . All rights reserved.The Endocrine Society. Downloaded from press.endocrine.org by [${individualUser.displayName}] on 21 June 2016. at 02:52 For personal use only. No other uses without permission. . All rights reserved.