development of bioassessment tools for ecological status ... · n. chazanah et al. 773 figure 1....
TRANSCRIPT

Journal of Water Resource and Protection, 2017, 9, 770-785 http://www.scirp.org/journal/jwarp
ISSN Online: 1945-3108 ISSN Print: 1945-3094
DOI: 10.4236/jwarp.2017.97051 June 19, 2017
Development of Bioassessment Tools for Ecological Status Using Macrozoobenthic Community in Upstream Area (Case Study: Citarum River, West Java, Indonesia)
Nurul Chazanah1, Priana Sudjono1, Fahri Azhari Hasby2, Gede Suantika2, Barti Setiani Muntalif1
1Environmental Management Technology Research Group, Department of Environmental Engineering, Faculty of Civil and Environmental Engineering, Bandung Institute of Technology, Bandung, Indonesia 2Microbial Biotechnology Research Group, Department of Microbiology, School of Life Science and Technology, Bandung Institute of Technology, Bandung, Indonesia
Abstract This research aims to develop an assessment tool of ecological status in the upstream area using macrozoobenthic community and its relationship to the physicochemical parameters of water and sediment, in Citarum River. The number of species and abundance of macrozoobenthos in the dry season was higher compared to rainy season. The predominant family (Pachychilidae, Hydropsychidae, Glossiphonidae, and Chironomidae) obtained in both sea-son was significantly correlated with the physicochemical parameter. Based on the Shannon-Wiener index, diversity in upstream area of Citarum River dur-ing the dry season (1.68) was similar with the rainy season (1.80) and it showed that the diversity of macrozoobenthic community was moderately di-verse in both seasons. The physicochemical parameters that strongly related with the presence and abundance of predominant macrozoobenthic taxa were turbidity, total suspended solid (TSS), total nitrogen, total phosphate, gravel particle, and organic carbon. By considering biological and physicochemical parameters obtained from this study, we developed a modified scoring system to assess the ecological status of upstream area in Citarum River. Based on the scoring system, the ecological status was quite polluted in dry season (2.19) and moderately polluted in rainy season (4.94). Keywords Bioassessment, Macrozoobenthic Community, Ecological Status, Dry Season, Rainy Season
How to cite this paper: Chazanah, N., Sudjono, P., Hasby, F.A., Suantika, G. and Muntalif, B.S. (2017) Development of Bio-assessment Tools for Ecological Status Using Macrozoobenthic Community in Upstream Area (Case Study: Citarum River, West Java, Indonesia). Journal of Water Resource and Protection, 9, 770-785. https://doi.org/10.4236/jwarp.2017.97051 Received: March 29, 2017 Accepted: June 16, 2017 Published: June 19, 2017 Copyright © 2017 by authors and Scientific Research Publishing Inc. This work is licensed under the Creative Commons Attribution International License (CC BY 4.0). http://creativecommons.org/licenses/by/4.0/
Open Access
N. Chazanah et al.
771
1. Introduction
The river plays an important role in daily human activities such as farming and industry. These activities in turn will produce liquid waste that may contribute to water pollution [1] [2]. Water quality across Indonesia is deteriorating due to contamination of domestic, industrial, and farming waste [3]. Unfortunately, this day, water quality assessment is approached by physicochemical and micro-biological parameters that have several limitations. For example, physicochemi-cal parameters only give an insight about the existing condition, while the water is contaminated continuously, however, physicochemical parameters are still important for water quality assessment [4] [5]. Therefore, to overcome these li-mitations, another approach on water quality assessment has been continuously developed for several decades and, most of the studies (around 60%), focused on analysis of macrozoobenthic community [6] [7] [8] [9] [10] [11].
River biota has a higher sensitivity towards changes in the environment. Its current community structure (diversity, species richness, and abundance) is ac-tually a reflection of gradual changes that occur in the environment [5] [12] [13] [14] [15] [16]. The use of macrozoobenthos as bio-indicator gives us some ad-vantages compared to other river biota [17] [18] [19]. Macrozoobenthic com-munity structure, for example, may describe the water quality months or even years before sampling. Meanwhile other aquatic organisms, such as protozoa, ci-liate, and algae only reflect the condition from weeks before [13] [20]. Water quality measurements using macrozoobenthic community have been researched in temperate climate countries, while in tropical countries such as Indonesia has not been evaluated optimally, whereas the existence of macrozoobenthic com-munity in tropical countries has more diversity in comparison to countries with temperate climates [19].
Citarum River basin is one of the largest watersheds in Java Island. It is an important water source in West java and Jakarta. About 11.255 million people inhabited the watershed area. The river is also home to about 1000 industries that become the lifeline of many people, and also the greatest threat to the river. The problems of water quality degradation in Citarum River will increase year after year due to the increasing pollutant loads particularly from Bandung region located in the upper areas of the river basin if the pollutant is released without treatment. The deterioration of water quality caused by human activities in the upstream areas reduces the benefits of the resources taken by stakeholders in the downstream areas. Over the past 20 years, rapid urbanization and industrial growth have resulted in growing quantities of untreated domestic sewage, solid waste, and industrial effluents being dumped into the river. Pollution levels now have compromised public health, and the livelihoods of impoverished fishing families have been jeopardized by widespread dying fishes [21].
To compose a comprehensive management plan and periodic monitoring, a rapid assessment tool was needed. Therefore, this research aims to develop eco-logical status assessment method in Citarum upstream area by using macrozoo-
N. Chazanah et al.
772
benthic community as an indicator and to observe its relation with physico-chemical parameters.
2. Material and Methods 2.1. Sampling Area
This research was done in 7 different sampling stations in Citarum River up-stream area, West java, Indonesia. The sampling stations were spread along the coordinate 107˚39'20.30"S - 107˚44'53"S, longitude 07˚04'29"E - 07˚13'27.27"E. This research was conducted from July 2014-September 2015 to represent varia-tions in dry and rainy season.
Four stations were selected to serve as reference site for its minimal distur-bance in the surrounding area. Station 1 (St.1; 1.586 m a.s.l.) was a natural spring located in Kampong Pejaten, Tarumajaya Village, Kertasari District, Bandung Regency. The spring flows to Cisanti Lake and merged into Citarum River. The area around St.1 was still dominated by dense riparian vegetation with 7% - 15% slope. Station 2 (St.2; 1.586 m a.s.l.) was a natural spring located in Kampong Cikembang, Cikembang Village, Kertasari District, Bandung Regency, Mt. Guha. The station was situated 3.24 km away from Citarum mainstream and was still dominated by dense riparian vegetation with 15% - 30% slope. Not far from St.2, anarea has been converted into a farming area. Station 3 (St.3; 1672 m a.s.l.) was located in Kampong Padawas, Cihawuk Village, Kertasari District, Bandung Re-gency, Mt. PuncakCae. The station was situated 4 km away from Citarum main-stream and was still dominated by dense riparian vegetation with 30% - 70% slope. Similar to St.2, the nearby area also has been converted for farming pur-pose. Station 4 (St.4; 1720 m a.s.l.) was located in Kampong Cirawa, Cibeureum Village, Kertasari District, Bandung Regency, Mt. Halimun. The station was si-tuated 2.38 km away from Citarum mainstream and was still dominated by ripa-rian vegetation (mostly cogon grass; Imperatacylindrica) with 30% - 70% slope. Similar to St.2, the nearby area has also been converted for farming purpose.
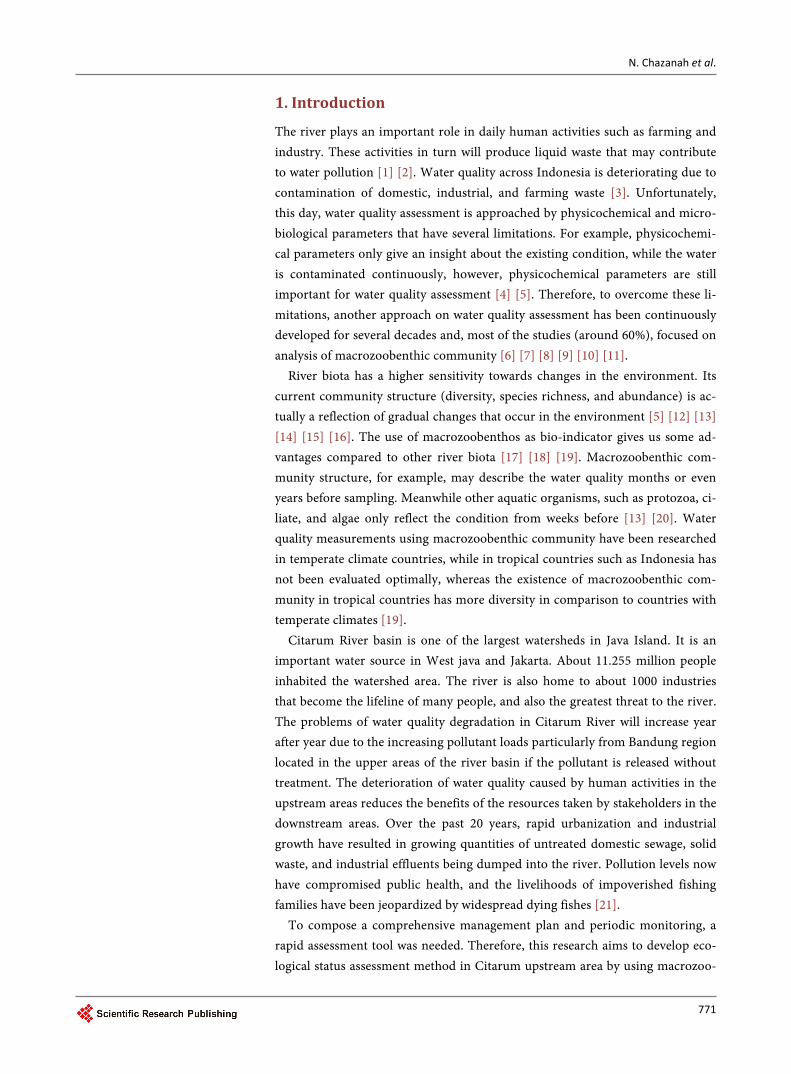
The other three stations were selected for land use conversion in its sur-rounding area for various purposes such as settlement, cattle farm, farming, and traditional sand mining. Station 5 (St.5; 1521 m a.s.l.) was located in Kampong Cikitu, Cibeureum Village, Kertasari District, Bandung Regency. The station was situated 1.82 km away from St.1 and was dominated by cogon grass with 7% - 15% slope. The effect of pollution from cattle farm can be seen physically from the water. Station 6 (St.6; 1057 m a.s.l.) was located in Kampong Babakan, Suka-rame Village, Pacet District, Bandung Regency. The station was situated 12.6 km away from St.1 and was dominated by grass with 7% - 15% slope. Station 7 (St.5; 1521 m a.s.l.) was located in Kampong Andir, Wangisagara Village, Majalaya District, Bandung Regency. The station was situated 24.9 km away from St.1 and was dominated by bamboo with 2% - 7% slope. This area was also surrounded by settlement and an embankment was also built to support traditional sand mining activity. The research map location is shown in Figure 1.

N. Chazanah et al.
773
Figure 1. Location of study area and station (BAKOSURTANAL, 1997).
2.2. Measurement of Physicochemical Parameters
Assessment of the water quality by analyzing physical and chemical parameters was also conducted to predict the status of organic pollution that occurred at all sites. Physicochemical parameters (pH, conductivity, temperature, and DO) were measured both in the field (in situ) and in the laboratory (ex situ). Other water quality parameters (BOD, COD, TSS, Turbidity, Total P and Total N) and sediment parameters (Organic-C, pH, Total P, Total N, and Particle distribu-tion) were also measured in the laboratory. DO and conductivity was measured using Metler-Toledo Seven Gopro, temperature using 2550 B method, pH by 4500-H+-B model pH 6 Pocket-Sized pH meter Milwaukee.
For chemical parameters measurement, the water sample was stored in a plas-tic bottle at 4˚C and further analyzed according to APHA method [22]. Sedi-ment collection was done using “van Geen Grab Sampler”. The sediment then stored in a 500 ml plastic bottle and covered with aluminum foil for particle-size distribution analysis according to ASTM method [23].
2.3. Sampling of Macrozoobenthic Community
The sampling of macrozoobenthos was done using Surber Net with mesh size of

N. Chazanah et al.
774
0.5 mm and area of 1000 cm2 [24]. Macrozoobenthos abundance stated as num-ber of individual per area (ind m−2). There were 3 replicates of sampling done in each location. The macrozoobenthos were sorted and identified to the lowest possible taxonomic level and were counted under a stereomicroscope [24] [25] [26] [27].
2.4. Data Analysis
The macrozoobenthic community was analyzed using Shannon-Wiener diversity index. Shannon-Wiener diversity index is an index that commonly used for en-vironmental management and serves as a tool to describe the community struc-ture and detecting the amount of degradation in aquatic ecosystems [28]. Diver-sity index formula is as follows [29]:
2logi in nH
N N′ = −∑ (1)
With: H ′ = Diversity, ni = number of individuals in species i, N = total number of individuals in the community.
2.5. Scoring System
Determination of ecological status in Citarum River was done by using scoring system proposed by Canter (1977) with some modification. The system was based on physicochemical and diversity index (H’) of macrozoobenthic commu-nity. The modified system can be adapted with modifications for implementa-tions in the Citarum river basin [30]. The modification was done to increase the accuracy and sensitivity of the tools based on local condition. The modified pa-rameters were chosen from linear regression correlation analysis that highly af-fects the abundance of predominant family of macrozoobenthic fauna. These parameters were turbidity, total suspended solid (TSS), total nitrogen, total phosphate, carbon-organic, and gravel percentage. Scores for each variable and the criteria of ecological disturbances that adapted for this research can be seen in Table 1.
( )average Score of parameter 1 6Final Score
2H ′− +
= (2)
Criteria for the ecological status were as follows: 1) Not polluted or slightly polluted = final score ≤ 2; 2) Quite polluted = final score 2 - 4; 3) Moderately polluted = final score 4 - 6; 4) Heavily polluted = final score > 6.
3. Results and Discussions 3.1. Water Quality
The water quality in Citarum were highly affected by various factors, especially

N. Chazanah et al.
775
Table 1. Scoresfor each variable and the criteria of ecological disturbances (modified from BPLHD West Java Prov. [30]).
No. Parameter Score
1 3 6 10
1 Total Suspended Solids (ppm) [30] <20 >20 - 100 101 - 400 >400
2 Turbidity (NTU) [11] <15 15 - 30 30 - 45 >45
3 Total Nitrogen in sediment (ppm) [31] <2 >2 - 4 >4 - 6 >6
4 Total Phosphate (ppm) [32] <0.5 >0.5 - 1 >1 - 2 >2
5 C-Organic (%) [19] >30 20 - 30 10 - 20 <10
6 Gravel (%) [19] >20 >10 - 20 5 - 10 <5
7 H’ (Diversity index) [30] >2.5 1.5 - 2.5 1 - 1.5 <1
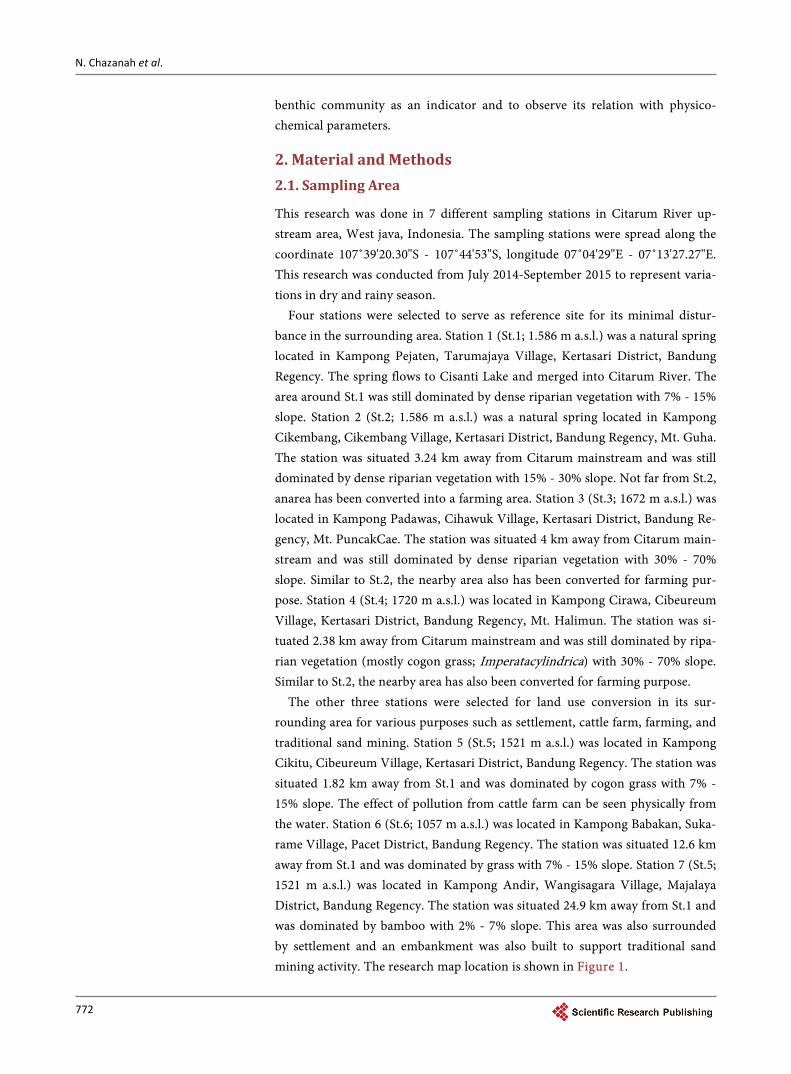
anthropogenic activities. Population growth and land use conversion around the Citarum River basin have caused the water quality to deteriorate. The correla-tion between conductivity, total suspended solids (TSS), and turbidity in each station is shown in Figure 2(a) (dry season) and Figure 2(b) (rainy season). Generally, TSS and turbidity concentration in rainy season was higher compared to dry season. Highest TSS and turbidity concentration was measured in St.5 during rainy season and the lowest was measured in St.2. This is due to the mi-nimal disturbance that St.2 had. In contrary, St.5 had undergone high level of disturbance from discharged water (especially during the rainy season), settle-ments, traditional cattle farm, and agriculture areas which caused significant runoff with high organic content into the river [33] [34] [35]. Highest conduc-tivity was measured in St.1 and decreased in St.2 and St.3, and increased again in St.5 and St.7 due to higher concentration of minerals. This was due to the loca-tion of St.1 which was at the foot of Mt. Wayang that contains considerable amount of dissolved minerals so that it was high in conductivity and TSS, while in all three reference station the value was lower. Whereas at St.5 and St.7, min-eral content of dissolved ions were possibly originated from agricultural soil ero-sion and sediment of traditional rock and sand mining [30].
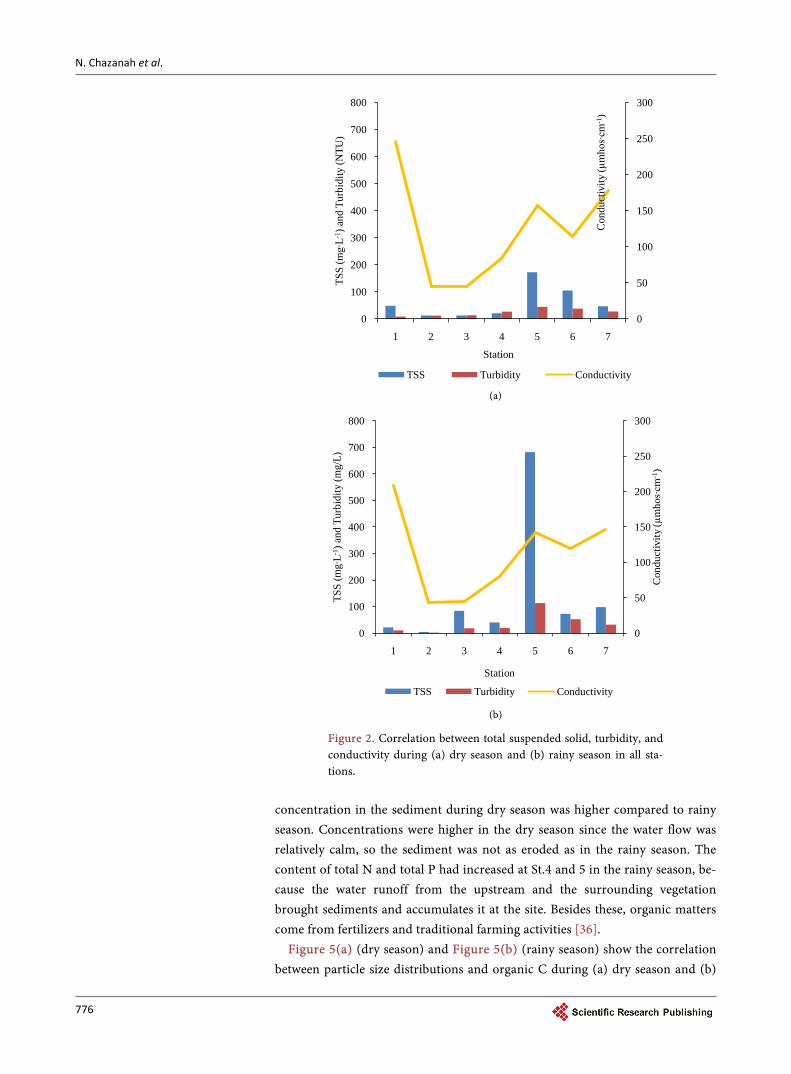
Figure 3(a) (dry season) and Figure 3(b) (rainy season) depict the correlation between total nitrogen, total phosphate, and chemical oxygen demand (COD) in each station. During the dry season, all parameters in all stations had increased because the water discharge was smaller, so all the chemicals were concentrated. The total nitrogen at St.1 to St.4 in the dry season was more than 1.5 mg·L−1 and total phosphate was more than 0.05 mg·L−1, thus it was classified as a river that rich in nutrients [31]. The nutrients come from the high density of riparian ve-getation and aquatic organisms in the site. It was also indicated by the low COD concentration. Increased nitrogen in some of the stations was likely caused by organic pollution from anthropogenic activities (agriculture, traditional farms and settlements) thereby increasing the concentration of COD [36].
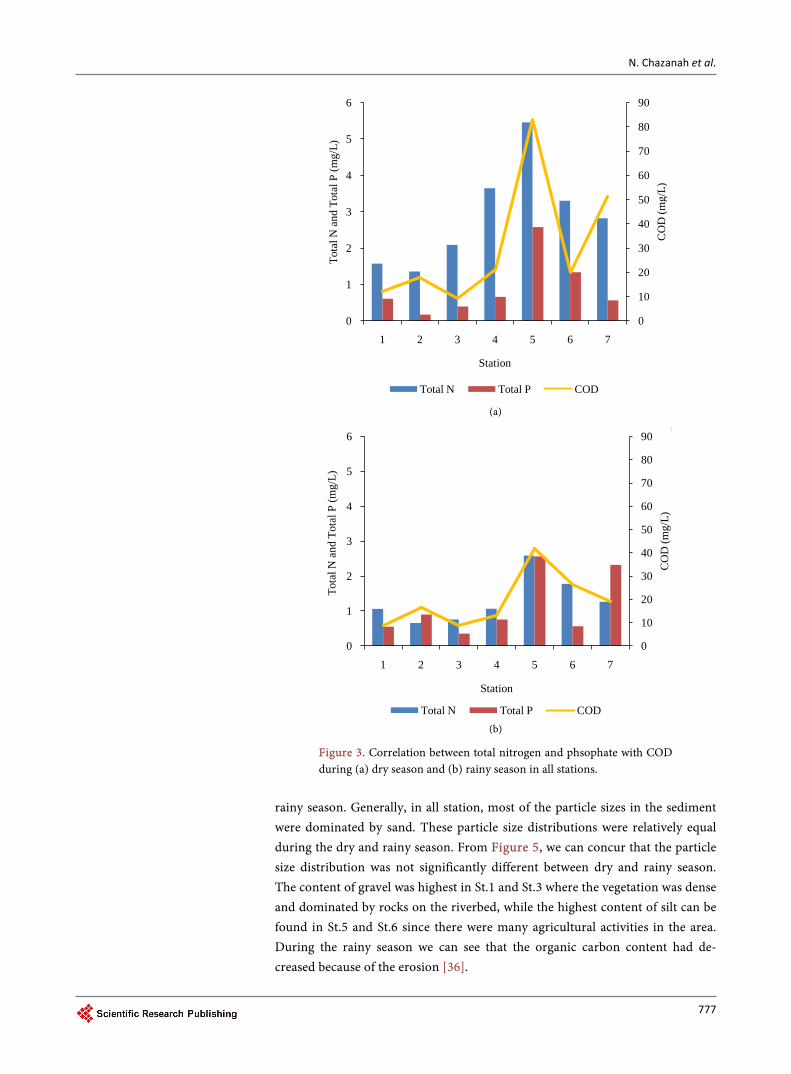
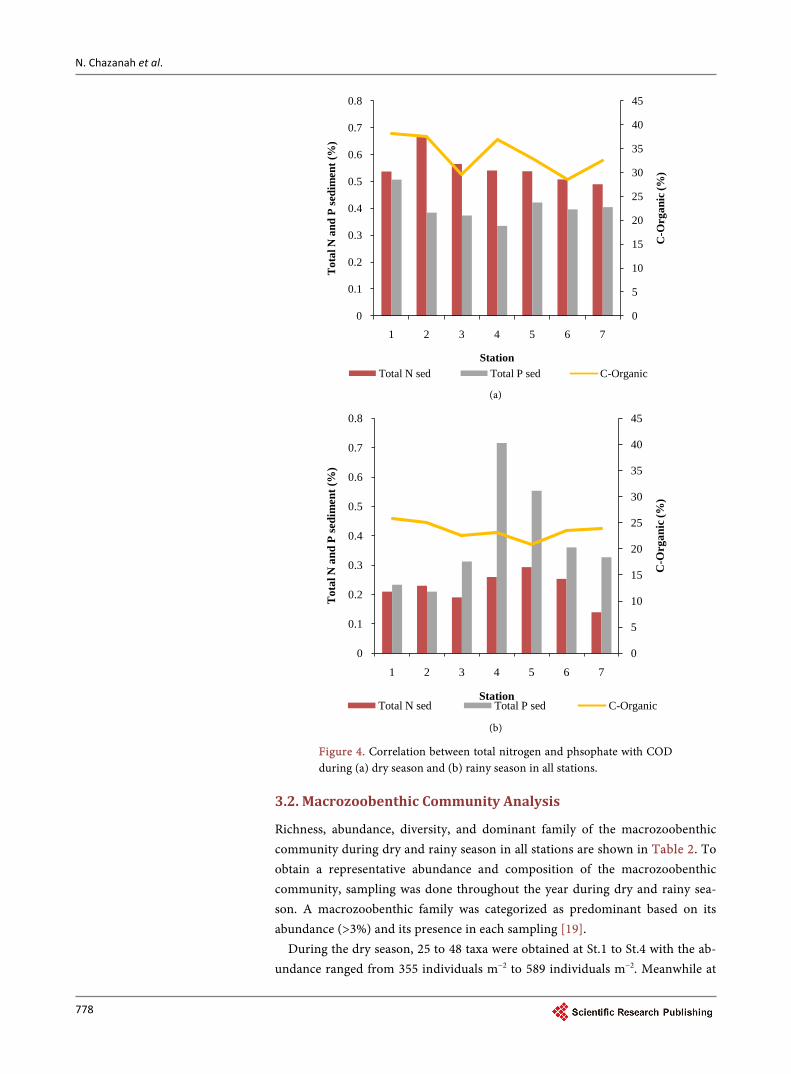
Figure 4(a) (dry season) and Figure 4(b) (rainy season) show the correlation between Total nitrogen and total phosphate in sediment with organic C during (a) dry season and (b) rainy season. The total N, total P and Carbon Organic
N. Chazanah et al.
776
(a)
(b)
Figure 2. Correlation between total suspended solid, turbidity, and conductivity during (a) dry season and (b) rainy season in all sta-tions.
concentration in the sediment during dry season was higher compared to rainy season. Concentrations were higher in the dry season since the water flow was relatively calm, so the sediment was not as eroded as in the rainy season. The content of total N and total P had increased at St.4 and 5 in the rainy season, be-cause the water runoff from the upstream and the surrounding vegetation brought sediments and accumulates it at the site. Besides these, organic matters come from fertilizers and traditional farming activities [36].
Figure 5(a) (dry season) and Figure 5(b) (rainy season) show the correlation between particle size distributions and organic C during (a) dry season and (b)
0
100
200
300
400
500
600
700
800
1 2 3 4 5 6 70
50
100
150
200
250
300
TSS
(mg∙L-
1 ) an
d Tu
rbid
ity (N
TU)
Station
Con
duct
ivity
(µmhos∙cm
-1)
TSS Turbidity Conductivity
0
100
200
300
400
500
600
700
800
1 2 3 4 5 6 70
50
100
150
200
250
300
TSS
(mg∙
L-1)a
nd T
urbi
dity
(mg/
L)
Station
Con
duct
ivity
( µmhos∙cm
-1)
TSS Turbidity Conductivity
N. Chazanah et al.
777
(a)
(b)
Figure 3. Correlation between total nitrogen and phsophate with COD during (a) dry season and (b) rainy season in all stations.
rainy season. Generally, in all station, most of the particle sizes in the sediment were dominated by sand. These particle size distributions were relatively equal during the dry and rainy season. From Figure 5, we can concur that the particle size distribution was not significantly different between dry and rainy season. The content of gravel was highest in St.1 and St.3 where the vegetation was dense and dominated by rocks on the riverbed, while the highest content of silt can be found in St.5 and St.6 since there were many agricultural activities in the area. During the rainy season we can see that the organic carbon content had de-creased because of the erosion [36].
0
1
2
3
4
5
6
1 2 3 4 5 6 70
10
20
30
40
50
60
70
80
90
Tota
l N a
nd T
otal
P (m
g/L)
Station
CO
D (m
g/L)
Total N Total P COD
0
1
2
3
4
5
6
1 2 3 4 5 6 70
10
20
30
40
50
60
70
80
90
Tota
l N a
nd T
otal
P (m
g/L)
Station
CO
D (m
g/L)
Total N Total P COD
N. Chazanah et al.
778
(a)
(b)
Figure 4. Correlation between total nitrogen and phsophate with COD during (a) dry season and (b) rainy season in all stations.
3.2. Macrozoobenthic Community Analysis
Richness, abundance, diversity, and dominant family of the macrozoobenthic community during dry and rainy season in all stations are shown in Table 2. To obtain a representative abundance and composition of the macrozoobenthic community, sampling was done throughout the year during dry and rainy sea-son. A macrozoobenthic family was categorized as predominant based on its abundance (>3%) and its presence in each sampling [19].
During the dry season, 25 to 48 taxa were obtained at St.1 to St.4 with the ab-undance ranged from 355 individuals m−2 to 589 individuals m−2. Meanwhile at
0
0.1
0.2
0.3
0.4
0.5
0.6
0.7
0.8
1 2 3 4 5 6 70
5
10
15
20
25
30
35
40
45
Tot
al N
and
P se
dim
ent (
%)
Station
C-O
rgan
ic (%
)
Total N sed Total P sed C-Organic
0
0.1
0.2
0.3
0.4
0.5
0.6
0.7
0.8
1 2 3 4 5 6 70
5
10
15
20
25
30
35
40
45
Tot
al N
and
P se
dim
ent (
%)
Station
C-O
rgan
ic (%
)
Total N sed Total P sed C-Organic

N. Chazanah et al.
779
(a)
(b)
Figure 5. Correlation between total nitrogen and phsophate with COD during (a) dry season and (b) rainy season in all stations.
St.5 to St.7 there was 29 to 37 taxa and the abundance ranged from 1073 indi-viduals m−2 to 7019 individuals m−2. The conversion of land use and the presence of anthropogenic activities on the study site led to changes in the number of taxa and abundance of certain taxa that are tolerant to organic pollution. Based on the season, richness and abundance of macrozoobenthos in the rainy season had decreased. This is due to increased water discharge, especially at stations that are often flooded [37]. The abundance of the major taxa is also mostly higher during
0
10
20
30
40
50
60
70
80
90
100
1 2 3 4 5 6 70
5
10
15
20
25
30
35
40
45
Part
icle
Siz
e D
istr
ibut
ion
(%)
Station
C-O
rgan
ic (%
)
Sand Gravel Silt C-Organik
0
10
20
30
40
50
60
70
80
90
100
1 2 3 4 5 6 70
5
10
15
20
25
30
35
40
45
Part
icle
Siz
e D
istr
ibut
ion
(%)
Station
C-O
rgan
ic (%
)
Sand Gravel Silt C-Organik

N. Chazanah et al.
780
Table 2. Macrozoobenthic community during the dry and rainy season.
Dry Season
St. Taxa Abundance (ind m−2)
Shannon-Wiener Index
Predominant Family
1 48 526 2.2 Pachychilidae, Chironomidae, Simuliidae
2 34 589 1.5 Chironomidae, Simuliidae
3 42 543 2.3 Chironomidae, Simuliidae, Capniidae
4 25 355 1.7 Chironomidae, Hydropsychidae
5 35 7019 1.0 Chironomidae, Glossiphoniidae, Tubificidae
6 29 3913 1.4 Chironomidae, Hydropschidae
7 37 1073 1.7 Chironomidae, Hydropsychidae
Rainy Season
St. Taxa Abundance (ind m−2)
Shannon-Wiener Index
Predominant Family
1 25 278 3.1 Pachychilidae, Thiaridae
2 14 524 1.1 Chironomidae, Rhyacophilidae
3 12 191 1.1 Chironomidae
4 15 346 2.1 Chironomidae, Rhyacophilidae
5 13 2123 0.6 Chironomidae, Glossiphoniidae
6 14 673 1.1 Chironomidae, Hydropsychidae
7 9 254 1.1 Chironomidae, Hydropsychidae
dry season [38].
The Shannon-Wiener index implies that, during the dry season, the macro-zoobenthic community in St.1 to St.4 and St.7 were moderately diverse, mean-while in St.4 and St.5 the diversity were low. In the rainy season, the diversity of macrozoobenthic community in St.1 was high, meanwhile in St.4 was moderate. In St.2, St.3, St.6, and St.7 the diversity were low and was very low in St.5.
BPLHD West Java Prov. [30] and Muntalif et al. [39], have shown in their study that Chironomidae was dominant in Cikitu (St.5 in this study), while Hy-dropsyche was dominant in Babakan station (St.6 in this study). At St.1, in the dry season, the dominant families were Pachychilidae, Chironomidae and Simu-liidae, while in the rainy season; the dominant families were Thiaridae and Pa-chychilidae. In St.2 the dominant taxa were Chironomidae and Simuliidae, while in the rainy season, Rhyacophilidae and Chironomidae became dominant.
The fact that Chironomidae can be found in all stations was in accordance with the study by Mayaningtias [40] that shows Chironomidae was not only found in polluted water but also in the upstream area, in an even higher diversity compared to the downstream area. While at St.2, Chironomidae and Simuliidae were dominant in dry season. Rhyacophilidae and Chironomidae were domi-nant in the rainy season. At St.3 Chironomidae, Simuliidae and Capniidae were dominant in the dry season and Chironomidae in the rainy season. At St.4, the

N. Chazanah et al.
781
macrozoobenthic community was dominated by Hydropsychidae and Chirono-midae during the rainy season, while Rhyacophilidae and Chironomidaedomi-nated in the dry season.
At St.5 during the dry season, the dominant macrozoobenthos were Chiro-nomidae, Glossiphoniidae, and Tubificidae, while in the rainy season the domi-nant families were Glossiphoniidae and Chironomidae. Glossiphoniidae, which is a predator and prefers gravel substrate with some vegetation. Tubificidae presence may indicate bad water quality due to excess of food and bad water sa-nitation. This situation was often found on water that had undergone fecal con-tamination from cattle farms, domestic waste, and agricultural activities. Chiro-nomidae and Hydrospychidae were also dominant in St.6 and 7.
3.3. Ecological Status of Citarum River Upstream Area
Below in Table 3 are the selected predominant families that appear in both sea-son and equations that show significant relationship (R2 > 0.9) with certain en-vironmental factor.
The equations resulted from linear regression correlation analysis between the abundance of the dominant family, water quality, and the sediment concentra-tion at all stations.
From the selected equations, we can concur that the highly correlated para-meters were: conductivity, TSS, turbidity, total N, total P, organic C, and particle distribution (percentage of sand, silt, and gravel). The total N, P, and organic C were selected to modify the scorings system since the two parameters were cor-related to nutrient availability. These nutrients can be in various form such as litter and dead animals. Furthermore, total P also describes the pollutant that being discharged from various activities in the surrounding. Moreover, total P has not been widely used as a parameter in river management.
TSS and turbidity were chosen since they can indicate that pollutants are be-ing discharged to the river. Usually, the pollutant was organic. These two para-meters have been widely used in river management. In addition to that, these two parameters are included in the Indonesian government regulation on water
Table 3. Selected equations of linear regression correlation analysis.
Family Dry Season Rainy Season
Pachychilidae R = 0.82 y = −25.68*T + 422.06 R = 0.85 y = −4.67*T + 168
Chironomidae R = 0.86 y = 29.47*G + 60.13
R = 0.99 R = 0.99 R = 0.96 R = 0.94
y = 570.88*Co − 9870 y = −1143.5*Pt + 4962.3
y = 1764*G − 7965 y = 262.3 Nt − 79.41
Glossiphoniidae R = 0.8 y = 3.82*TSS + 295152 R = 0.99 y = 0.08*TSS + 14.69
Hydropsychidae R = 0.79 y = 122.67*Pt + 36.08 R = 0.99 R = 0.95
y = −0.18*TSS + 36.57 y = −814*G + 62.43
S = Sand; G = gravel; Co = C-Organic; C = conductivity; Nt = total organic nitrogen; Ns = total organic ni-trogen in sediment; Pt = total organic phosphate; Ps = phosphate in sediment; TSS = total suspended solid; T = Turbidity.

N. Chazanah et al.
782
quality standard, making the newly developed tools not only suitable with local environmental condition but also with the local regulation.
Besides nutrient availability, substrate type is also highly correlated to the ab-undance and diversity of the macrozoobenthic community. Different taxa may prefer different substrate for attachment. The substrate type also provides shad-ing and protection for the macrozoobenthos [19]. The substrate type that highly correlated to the abundance of macrozoobenthos was gravel. Besides the signifi-cant correlation, gravel has been widely used as a parameter for ecological as-sessment in river.
After selecting the key parameters from the research conducted by BPLHD of West java Prov. [30] and this research, the modification of this ecological status based on the calculation of ecological scoring during the dry season and the rainy season can be seen in Table 4.
Based on the scoring system result of this research, ecological status in the dry season is quite polluted while in the rainy season it is moderately polluted. This is because during the rainy season, the runoff from the rain water brought eroded particles as well as fertilizers from farming activities surrounding the area [36] [41].
Further research on bioassessment using benthic macro invertebrates to de-termine the water quality of the Citarum River upstream area suggests that at
Table 4. Macrozoobenthos community during the dry and rainy season.
Dry Season Rainy Season
No. Variable Score Score
1 3 6 10 1 3 6 10
1 Total Suspended
Solids (mg/L) <20 >20 - 100 101 - 400 >400 <20 >20 - 100 101 - 400 >400
60.2
143.59
2 Turbidity (NTU) <15 15 - 30 30 - 45 >45 <15 15-30 30 - 45 >45
24.76
36.07
3 Total Nitrogen
(ppm) <2 >2 - 4 >4 - 6 >6 <2 >2 - 4 >4 - 6 >6
2.89
1.31
4 Total Phosphate
(ppm) <0.5 >0.5 - 1 >1 - 2 >2 <0.5 >0.5 - 1 >1 - 2 >2
0.9
1.18
5 C-Organic (%) >30 20 - 30 10 - 20 <10 >30 20 - 30 10 - 20 <10
33.71
23.53
6 Gravel (%) >20 >10 - 20 5 - 10 <5 >20 >10 - 20 5 - 10 <5
12.54
16.32
7 H’ (Diversity index) >2.5 1.5 - 2.5 1 - 1.5 <1 >2.5 1.5 - 2.5 1 - 1.5 <1
1.72
1.54
Final Score 2.19 Quite Polluted
4.94 Moderately Polluted
N. Chazanah et al.
783
least there are three dominant sources of organic waste that pollute the water: traditional cattle farm, domestic waste, and liquid waste from textile industry [29]. Other studies concerning the determination of the ecological status of the Citarum upstream area based on criteria of organic pollution shows that the ecological status was categorized as slightly polluted to moderately polluted [42].
4. Conclusions
Water quality and sediment parameters for TSS and turbidity concentration were higher in rainy season compared to the dry season. The highest conductiv-ity parameter was at St.1. Total N, Total P, and COD in the dry season were higher compared to the rainy season. Total P, total N, and C-Organic in the se-diments were higher in the dry season than the rainy season. The particle size distribution in the sediment showed no significant difference between the dry and rainy seasons.
The diversity and the abundance of macrozoobenthic fauna in the dry season were higher than that in the rainy season. The diversity can be categorized as moderately diverse. Based on the assessment of water quality in the upstream area of Citarum River using newly developed scoring system, the water quality was more polluted during the rainy season compared to dry season. Based on the scoring system index, the ecological status of the upstream area in Citarum River was quite polluted during dry season and moderately polluted during rainy sea-son.
References [1] Al-Shami, S.A., Rawi, C.M., Ahmad, A.H., Hamid, S.A. and Nor, S. (2011) Influence
of Agricultural, Industrial, and Anthropogenic Stresses on the Distribution and Di-versity of Macroinvertebrates in Juru River Basin, Penang, Malaysia. Ecotoxicology and Environmental Safety, 74, 1195-1202.
[2] Chopra, G., Bhatnagar, A. and dan Malhotra, P. (2012) Limnochemical Characteris-tics of River Yamuna in Yamunanagar, Haryani, India. International Journal of Wa- ter Resources and Environmental Engineering, 4, 97-104.
[3] Sutriati, A. (2012) Penilaian Tingkat Pencemaran Air S. Bengawan Solo Dengan-Menggunakan Indeks Kimia-Fisika. Jurnal Sumber Daya Air, 8, 81-93.
[4] Fulazzaky, A.M. (2010) Water Quality Evaluation System to Assess the Status and the Suitability of the Citarum River Water to Different Uses. Environmental Moni-toring and Assessment, 168, 669-684. https://doi.org/10.1007/s10661-009-1142-z
[5] Rahayu, D.M., Yoga, G.P., Effendi, H. and Yusli, W. (2015) PenggunaanMakrozoo-bentos Sebagai Indikator Status Perairan Hulu Sungai Cisadane, Bogor. Jurnal Ilmu Pertanian Indonesia, 20, 1-8.
[6] Bahri, S. and danPriadie, B. (2006) Korelasi Tiga Metrik Makroinvertebratadan In-deks Kimia-fisikadalam Memprediksi Tingkat Pencemaran Air Sungai (StudiKasus Sungai Cikapundung). Jurnal Sumber Daya Air, 2, 40-50.
[7] Bahri, S. and danPriadie, B. (2007) Prediksi Tingkat Pencemaran Air Sungai Menggunakan Indeks Kimia-Fisikadan Metrik Bentik Makroinvertebrata. Jurnal-Sumber Daya Air, 3, 2007.
[8] Huang, Q., Gao, J., Cai, Y., Yin, H., Gao, Y., Zhao, J., Liu, L. and Huang, J. (2015)

N. Chazanah et al.
784
Development and Application of Benthic Macroinvertebrate-Based Multimetric In-dices for the Assessment of Streams and Rivers in the Taihu Basin, China. Ecologi-cal Indicators, 48, 649-659.
[9] Efrizal, T. (2008) Struktur Komunitas Makrozoobenthosperairansungai Sail Kota Pekanbaru. Journal of Environmental Science, 2, 22-32.
[10] Purwati, S.U. (2015) Karakteristik Bioindikator Cisadane: Kajian Pemanfaatan Ma-krozoobentikuntukmenilaikualitas Sungai Cisande. Ecolab, 9, 47-104. https://doi.org/10.20886/jklh.2015.9.2.47-59
[11] Radiarta, I.N. and Erlania (2015) Indeks Kualitas Air dan Sebaran Nutrien Sekitar-Budidaya Laut Terintegrasi di Perairan Teluk Ekas, Nusa Tenggara Barat: Aspek Penting Budidaya Rumput Laut. Pusat Penelitiandan Pengembangan Perikanan Budidaya, Jakarta.
[12] Asry, A., Yunasfi and Harahap, Z.A. (2014) Komunitas Makrozoobentos Sebagai Bioindikator Kuallitas Perairan Kecamatan Pantai Labu Kabupaten Deli Serdang. Jurnal Aquacoastmarine, 4, 151-165.
[13] Clarke, A., Nally, R.M., Bond, N. and Lake, P.S. (2008) Macroinvertebrate Diversity in Headwater Streams: A Review. Freshwater Biology, 53, 1707-1721. https://doi.org/10.1111/j.1365-2427.2008.02041.x
[14] Handayani, T.S., Suharto, B. and Marsoedi (2001) Penentuan Status Kualitas Perai-ran Sungai Brantas Hulu dengan Biomonitoring Makrozoobentos: Tinjauandari-Pencemaran Bahan Organik.
[15] Khamis, K., Hannah, D.M., Brown, L.E., Tiberti, R. and Milner, A.M. (2014) The Use of Invertebrates as Indicators of Environmental Change in Alpine Rivers and Lakes. Science of the Total Environment, 493, 1242-1254.
[16] Pribadi, T.D.K. and Bahri, S. (2008) Kajian Kualitas Air Sungai Menggunakan Or-ganisme Makrobenthosdengan Metode Family Biotic Index. Jurnal Sumber Daya Air, 4, 75-88.
[17] Plafkin J.L., Barbour, M.T., Porter, K.D., Gross, S.K. and Hughes, R.M. (1989) Rapid Bioassessment Protocol for Use in Stream and River: Benthic Macroinvertebrates and Fish. EPA 440-4-89-001, US-EPA, Office of Water Regulation and Standard, Washington DC.
[18] Sharma, K.K. and Chowdhary, S. (2011) Macroinvertebrate Assemblages as Biolog-ical Indicators of Pollution in a Central Himalayan River, Tawi (J&K). International Journal of Biodiversity and Conservation, 3, 167-174.
[19] Sudarso, Y. and Wardianto, R. (2015) Penilaian Status Mutu Sungai dengan Indi-kator Makrozoobentos. Pena Nusantara, Bogor.
[20] UNESCO, WHO, UNEP (2014) Water Quality Assessment a Guide to Use of Biota, Sediments and Water in Environmental Monitoring. 2nd Edition. http://www.who.int/water_sanitation_health/resourcesquality/watqualassess.pdf
[21] Directorate General of Water Resources (DGWR) (2007) Indonesia: Integrated Ci-tarum Water Resources Management Project. DGWR Indonesia.
[22] American Public Health Association (APHA), American Water Works Association (AWWA) and Water Environment Federation (WEF) (2012) Standard Methods for the Examination of Water and Wastewater. 19th Edition, Washington DC.
[23] ASTM, C. (2009) 597, Standard Test Method for Pulse Velocity through Concrete. ASTM International, West Conshohocken.
[24] Marwoto, R.M., Isnaningsih, N.R., Mujiono, N., Heryanto, A. and dan Riena (2011) Keong Air Tawar PulauJawa (Moluska, Gastropoda). Pusat Penelitian Biologi Lem-baga Ilmu Pengetahuan Indonesia Widyasatwaloka, Bogor.

N. Chazanah et al.
785
[25] Gooderham, J. and Edward, T. (2002) A Guide to Freshwater Macroinvertebrates of Temperate Australi. The Waterbug Book. CSIRO Publishing.
[26] Jutting, W.S.S.V.B. (1948) Systematic Studies on the Non Marine Mollusca of the Indo-Australian Archipelago: Critical Revision of the Javanese Freshwater Gastro-pods. Zoological Museum, Amsterdam.
[27] McCafferty, W.P. and Provonsha, A.V. (1983) Aquatic Entomology. Jones and Bartlet Publishers International, London.
[28] Ratnawati, K., Bahri, S. and Priadie, B. (2009) Bioassesment Kualitas Air Sungai Ci-tarummenggunakan Makrozoobenthosdengan Metode Lincoln Quality Index. Bule-tin Keairan, 2, 79-94.
[29] Peilou, E.C. (1969) An Introduction to Mathematical Ecology. Wiley-Interscience a Division of John Wiley & Sons, New York-London-Sydney-Toronto.
[30] Badan Pengelolaan Lingkungan Hidup (BPLHD) West Java Prov. (2003) Status Ekologis Keanekaragaman Hayati di DAS Citarum. Kegiatan Pengendalian Kerusa-kan Kehati, Pesisir & Laut di Jawa Barat. BPLHD Jabar.
[31] Scrimgeour, G.J. and Winterbourne, M.J. (1989) Effects of Floods on Epilithon and Benthic Macroinvertebrate Population in an Unstable New Zealand River. Hydro-biologia, 171, 33-44. https://doi.org/10.1007/BF00005722
[32] President of Republic of Indonesia (2001) Peraturan Pemerintah No. 82 tahun 2001 tentang Pengelolaan Kualitas Air Dan Pengendalian Pencemaran Air.
[33] Gonzalez, O.S., Almeida, C.A. and Calderon, M. (2014) Assessment of the Water Self-Purification Capacity on a River Affected by Organic Pollution: Application of Chemometrics in Spatial and Temporal Variations. Environmental Science and Pollution Research, 21, 10583-10593. https://doi.org/10.1007/s11356-014-3098-y
[34] Zhang, L.J., Wang, L., Cai, W.-J., Liu, D.M. and Yu, Z.G. (2013) Impact of Human Activities on Organic Carbon Transport in the Yellow River. Biogeosciences, 10, 2513-2524. https://doi.org/10.5194/bg-10-2513-2013
[35] Sager, P.M. (1986) The Effects of Floods on Invertebrate Fauna of a Large, Unstable Braided River. New Zealand Journal of Marine and Freshwater Resources, 20, 37- 46.
[36] Angelier, E. (2003) Ecology of Streams and Rivers. BIOS Scientific Publisher Li-mited, 228.
[37] Hussain, Q.A. and Pandit, A.K. (2012) Macroinvertebrates in Stream: A Review of Some Ecological Factor. International Journal of Fisheries and Aquaculture, 4, 114- 123.
[38] Masikini, J.R. (2012) Spatial Variability of Macroinvertebrate Assemblages and the Influence of Hydrology and Environmental Variables along the Sigi River, Tanza-nia-East Africa. Erasmus Mundus Master of Science in Ecohydrology.
[39] Muntalif, B.S., Ratnawati, K. and Bahri, S. (2008) Bioassessment Menggunakan Makroinvertebrata Bentik Untuk Penentuan Kualitas Air Sungai Citarum Hulu. Jurnal Purifikasi, 9, 49-60.
[40] Mayaningtias, P. (2010) Pengembangan Biokriteriauntuk Menilai Kualitas Sungai dengan Menggunakan Larva Chironomidae (Diptera) di Sungai Ciliwung. PhD Dissertation, Institut Teknologi Bandung, 117-132.
[41] Nepal, S., Flugel, W.A. and Shrestha, A.B. (2014) Upstream-Downstream Linkages of Hydrological Processes in the Himalayan Region. Ecological Processes: A Sprin-ger Open Journal, 3, 19. https://doi.org/10.1186/s13717-014-0019-4
[42] Fitriyyah, I. (2012) Penentuan Status Ekologis Hulu Sungai Citarum Berdasarkan Kriteria Pencemaran Organik. Master Thesis, Institut Teknologi Bandung.

Submit or recommend next manuscript to SCIRP and we will provide best service for you:
Accepting pre-submission inquiries through Email, Facebook, LinkedIn, Twitter, etc. A wide selection of journals (inclusive of 9 subjects, more than 200 journals) Providing 24-hour high-quality service User-friendly online submission system Fair and swift peer-review system Efficient typesetting and proofreading procedure Display of the result of downloads and visits, as well as the number of cited articles Maximum dissemination of your research work
Submit your manuscript at: http://papersubmission.scirp.org/ Or contact [email protected]