development of cbr design curves for am1 landing … · cv) development of cbr design curves for...
TRANSCRIPT

cv) DEVELOPMENT OF CBR DESIGNCURVES FOR AM1 LANDING MAT
Ni
MISCELLANEOUS PAPER NO. 4-599
S.ptomber 1963
DDCNATIONAL TECHNICAL
INFORMATION SERVICE OCT 25 I972US D~portmeflt of Commerce
A
U. S. Army Engineer Waterways Experiment Station
CORPS OF ENGINEERSVicksburg, Mississippi
ARMY.MRC VICKSBURO, MISS.

BestAvai~lable
Copy

I -- S
-~b. i7A597.,
21
,1
The investigations reported herelnk e. a#[thor ized bythe Naval Air
Material Center, Philadelphia, Pennsyln i4.Project Orders No. 2-4036
b -=
nd3-4007., dated 15 February 1962 and i~~l'A62,, respectively. Respon-
! ' '
sibility for prosecution of these invesiti ins was assigned to the U. S.
Army Engineer Waterways Experiment Station (WES), and they were performed
by WES during the period March through November 1962.
The investigations were under the general supervision of Messrs. W. J.
Turoi,:ll, Chief, and W. G. Shockley, Assistant Chief, of the WES Soils
Diw.tsion. Engineers of the Flexible Pavement Branch, Soils Division, who
wer ;adtively concerned with the planning, testing. analysis, and report
pha:res of the study were Messrs. A. A. Maxwell, Branch Chief, 0. B. RayI
W. b. McInnis) C. D. Burns, M. J. Mathews, and W. B. Fenwick. This report
was prepared by Messrs. Burns and Fenwick.
Col. Alex G. Sutton, Jr., CEi, was Director of the WES during the con-
duct of the study and preparation of this report. Mr. J. B. Tiffany was
Technical Director.
30456

CONTENTS
PagePREFACEii
6UMMaRY.. . . . . . . . . . . . . .... vii
PART I: INTRODUCTION . . . . 1Background .......................... 1Objectives of the Investigations ............... 2Scope of Report . . . . . . . ................ 2
PART II: TESTING AND DEVELOPMENT OF DESIGN CURVES FOR THEPFIJ TRA MARK III MAT .......... ..... ........ 3
mat .. . . . . . . . . . . . . . . 3Test Section .. 4..... . ...... 4Test Load Cart . . . .. . . . . . ....... . 8Traffie Tests ............. ...... ... . 9Soil Tests and Miscellaneous Observations ........... 11 -
Behavior of Mat Under Traffic 1............... 2Failure Criteria and Analysis of Test Results . . . . . . . . . 20Development of Design Curves ....... .... ... 23Conclusions and Action Taken ................. 26
PART III: TESTING AND DEVELOPMENT OF DESIGN CURVESFOR BJTLER AM1 MAT . ........ ..... . 27
mat 27 ATest Section . . . . . . .. . . .. . 4 . . .. . 27Test Load Cart . . . ... . . . . 28Traffic Tests * 9 9 o 6 28Soils Tests and Miscellaneous Observations- . . . . . . 29 1Behavior of M at Under Traffic . .... ... . ... . . . 29Summary and Analysis of Test Results ...... .9•99.. 37 -CBR Design Curves . . . . . . . 0 0 0 0 37T
PART IV: CONCLUSIONS . . . . . . . . . . . 0 ' . a . . . . & 40TABLES 1-5
PHOTOGRAPHS 1-14
PLATES 1-19
V

SJMMARY
The initial phase of this study was conducted to evaluate four ex-. ±l(i,,ental, aluminum landing mats, and to develop CBR design curves for the*n, selected as most satisfactory, which was staudkrdized and designated by•, ]•a..'y as Airfield Matting No. 1 (AM1). The design curves were to 1epre-
i:,t i1600 operational cycles of an aircraft having a 60,000-lb gross weightSi A . ' single-wheel, main-gear assembly weight of 27,000 lb and a 30-7.7
S;.•'lated to 400 psi. CBR design curves were also desired for 1600o0f a 39,000-lb single-wheel load applied in a single track to repre-
lie loading calculated to be imposed on the landing mat during the'-IL of0 a 60,000-lb aircraft by catapult.
A test section consisting of items with different subgrade strengths,:u.:L.aced with the four mat types, was constructed and subjected to•, dxd traffic of 27,000- and 39,000-lb single-wheel loads with aLire inflated to 400 psi. Analysis of the data obtained indicates
j:,:t. l-d, later designated AMl, will satisfactorily sustain 1600 cycles-Kcraft operations with a 27,000-lb single-wheel load and 400-psi tire
CL1L'(2 when placed over a subgrade having a CMR of 7 or greater through-,u1,0 Lh,, traffic period. The minimum subgrade strength required for 1600, :.,) of the 39,000-lb load was not determined; however, it was determinedtal.I ,naI, l-d would support this traffic when placed on a subgrade with aC1R of' 1.3 or more.
For the second phase of the study, a production quantity of the AM1?,,aL w4aS manufactured and subjected to the same types of field tests usedrot the experimental mats on subgrades with CWR's ranging from about 5 toI (', Because the end joints of the mats in test item 1 with the weakest•;u(.b':,-ade began to fail early in the tests whereas the mats in the other
".ir. showed no distress, the mats in item 1 were strengthened with end-, t.e.r~cting rods. Analysis of the test results indicates that the mat with'iyJ-connccting rods will sustain 1600 cycles of the 27,000-3\b single-wheel
loud, or 1600 passes of the 39,000-lb single-wheel load on a subgrade with('1311 of 8 or more throughout the traffic period. Without, the end-
-,nnectine rods, the AMI mat must be -placed on a subgrade having a CER of:,bout 10.7 to carry the design traffic.
Best AvaIlable Copyvii

•_DEVELOPMENT OF CBR DESIGN CURVES•'YO ADN A 4
,•-• PART 1: INTRODUCTION
Background '
S;1. For several years the Marine Corps has been engaged in a st dy of •
A-2
• • problems involved in the construction and support of small airfields• for
Stactical support (SATS) in amphibious,-operations. A SATS has been defined M
S• ~as a small, !uclcosrteacticael-support airfi eld of temporary!
Snature, capable of sustaining operations-bf modern jet aircraft of the
1Marine Corps employing assisted takeoffs and arrested landings. The mini-
S• ,:.um operational installation must be ready for use in the objective area'Svithiin the first three to five days of an amphibious assault. The runway*
ra • tlt' be capable of withstaniding the heavy wheel loads and arresting-hook 4
Slanding impacts of the using -air'cx/aft, and heat blasts from tailpipes ofSjet engines during takeoffs; it must also remain serviceable with minimum -
F\
Smaintenance for 1600 aircr'aft cycles (or round trips) during at 30-day pe-Sriod. At the time of this study, theý'weight of the newest proposed Marine
Saircraft that, will uti~lize SATS was 60,,000 lb (27,000O lb per main wheel)
vwith'W" 30-7.7,, 18-ply tire inflated to 400 psi (formerlyj, the weight of
this "aircraft was 40,,000 lb., or 17.,000 lb per main wheel.. with the same
tire size). Computations show that a single-wheel load of 39.,000 lb will
be imposed on the landing mat during the launching of the 60,O00-ib aii- 4
craft by catapult.
2. At the beginning of fiscal year 1969., the responsibility for
development of BATS landing mat was assigned to the Naval Air Material
Center. This agency requested several manufacturers to develop small quan-
titles of experimental landing mats for use in tests to establish their
•;Aitability for surfacing SATS. The first of these" experimental mats to be
tz.Sted consisted of a group of four mats manufactured by Fenestra., Inc.,,
11,11adelphia, Pennsylvania. These mats were initially identified as
• •"n(-:Lrra Mark III. BaseLd on the results of these tests, one of these mats
i'rtz :t•andardi'zed and designated as Airfield Matting No. 1 (AMI) by the
Ny.A contract was subsequently let by the Navy to Butler Manufacturing
I!TI

2
L Company, Kansas City, Missouri, for a production quantity of AM1 mat. A
portion of this mat was furnished WES for further testing.
r Objectives of the Investigations
3. The preliminary objective of the investigations reported herein
was to evaluate the performance of the four experimental Penestra Mark III
mats under accelerated traffic tests with single-wheel loads of 17,000,
£ 27,000, and 39,000 lb with 400-psi tire pressures. Tests with the 17,000-
lb single-wheel load were included to provide a comparison of performance
of the Fenestra mats with previous mats tested with the 17,000-lb single-
wheel load. The primary objective of the investigations was to develop CBR
design curves for the most satisfactory Fenestra Mark III mat, later desig-
nated AM1, and the Butler AM1 mat. The CBR design curves were to indicate
the minimum strength required for subgrades surfaced with the AMl mat to
support 1600 cycles of aircraft operations with 27,000- and 39,000-lb
Scope of Report
4. Part II of this report describes and gives the results of the
field traffic tests which were conducted to evaluate the four experimental
landing mats. Part III describes tests on production quantities of the
most satisfactory of these mats (designated AM1)., and includes an analysis
of the data obtained and the CBR design curves which were developed for use
in designing airfields to be surfaced with AM1 mat. Part IV summarizes the
conclusions derived from the investigations.
46

7 -T --T-- - - -T
3
PART II: TESTING AM~ DEVELOPMENT OF DESIGN CURVESFOR THE FENESTRA MARK III MAT
MatJ
5. The landing wats used in this investigation were fabricated from
nine alumi~num extrusions which were mechanicall~y interlocked and usually
welded to form a mat plank approximately 2 by 12 ft. Aluminum end connec-
tors were welded across the ends of the 2-ft planks. The variation in the
experimental, mats was primarily in the degree of welding along the longi-
tudinal joints of the individual extrusions. A top view of the four- ex-
perimental mat types studied is shown in fig. 1. A brief description of
-c the mats is given below:
-z
V - V- 4¶.4~' N1-
ý V*g\
j ; h ~ j-~ ~-:J~A
- 't-~Y'p ..
-a-; -~.WTI-- i IRV
- _ ~ < ~ SO
- 4 ak.
Fig. 1. The four types of Fenestra mat
IDesigna- Official Full Plank Weightion in Designs- Laying Dimensions of Full
~~ tion Description Lenth Wdh PlnlR 1-a Longitudinal 11 ft 11-3/hI in. 2 ft 1/4 in. 176.5
weld; withleg
Y 1-b Tack weld; 12 ft 2 ft 1/8 in. 172.0With leg (Continued)

Designa- Official Full Plank Weight
tion in Designa- Laying Dimensions of Fullfig. 1 tion Description Length Width Plank, lb
1-c o weld; 11 ft 11-7/8 in. 2 ft 1/4 in. 169.0S• with leg
LB l-d ongitudinal U1 ft 11-3/4 in. 2 ft 1/8 in. 173.0weld; with-out leg
The leg is a small extension of the
underlapping plank edge (fig. 2) onS•the bottom of the mat. When the matA
is in place, the leg rests on theS• bottora extension of the overlapping
_plank, thus furnishing vertical sup-
port to the underlaling plank. A
total of 15 bundles of mat, each
j consisting of 9 full planks and
Fig. 2. Bottom view of type 1-a mat 6 half planks, were received forwith leg and l-d mat without leg surfacing the test section.
Test Section
Location
6. All traffic tests were conducted at the WES on a test section
which was constructed and tested under shelter to control the water content
and strength of the s&.grade.
Description
7. A layout of the test section is shown in plate 1. The test sec-
tion consisted of four items, each approximately 24 ft wide and 40 ft long.
Items I and 2 were constructed of a heavy clay soil, iter 3 of an uncom-
pacted rook, and item 4 of a loose sand.
gSubrade materials
8. Gradation and classification data for the subgrade materials used
in the test section are shown in plate 2. The sand used in this investiga-tion was obtained from a local river bar, and had characteristics resem.
bling those of a beach sand. It classified as SP according to the Unified
Zo_- -

Soil Classificaior System. The rock classified as GP, and -was a hard,
jLb durable, crushed limestone obtained from a nearby source. It was graded
from a mayimum size of 2 Lo. down to that passing a 'fo. 4 screen. Therock w•s used to simulate an existir3 paved runway or an area surfacedwith iwoken concrete. The heavy clay soil (buckshot) had a liquid limit
of 561 . plasticiAt- index of 33, ari classified as CU. Laboratory com-
pacti,3,. ind CM dat.I'a the heavy clay soil are shown in plate 3.
9. Items_ Ia J. 2.. These items were to be constructed to a total
-.t thicknes of 24 in.; therefore, the existing material at the test site
Swas excavat-!!, to a depth of 24 in. below finished grade. The soil at
the bottom of the excavation was a lean clay having a CBO value of about
10. It was desired to construct items 1 and 2 with tbn heavy clay soil at
water contents that would result in CBR values of 5 and 10, respectively,
when compacted. The soil for each item was processed to the desired water
content, hauled to the test section site by truck, spread, and compacted
in 6-in. lifts. Compaction of items 1 and 2 was accomplished by applying
eight coverages of a four-wheel rubber-tired roller loaded to 40,000 lb
with tires inflated to 90 psi. The surface of each compacted lift was
scarified prior to placement of the next lift. After placement and . mpac-tion of the fourth and final lift, the surface of the subgrade was fine-
bladed to grade with a motor patrol. ConstructitVn control data were ob-
tained for each lift immediately after placement. strengths were measured
by in-place CBR tests. Construction data representing the average of the
four lifts are shown below.
Test Water Dry DensityItem C~ontent. lb/cu ft CBR
1 27•.6 95.0 5
2 24.3 97.3 11
10. Items 3 and 4. Item 3 of the test section consisted of 12 in.
of uncompacted, loose rock that had been end-dumped (fig. 3) and spread by
hand. 'Item 4 consisted of 24 In. of uncompacted sand that had been end-
dumped (fig. 4) and spread with a D4 tractor. A CBR of abouri 3 wMs meas-
tured In the sand it~em prior to placement of the mnat. A CBR of 3 for a]
U3_ !- -

IV
Fig. 3. End-dumping of rock in
-item 3'
MA A
IMIFig.14.~d-urnpng f snd i itm A
0q,loos, uconine sad ba lttl meningwit repec toitsstragt wtcn4_ I
confined, s sand cosolidatesand develps a highrsteghndrtaic

7
Due to the coarseness and loose state of the rock, no attempt was made to
obtain an initial CBR value in item 3.
placement of mat
11. The Fenestra mat was placed on the test section by a crew of six
experienced laborers working under the supervision of a foreman. The maU
bundles were placed alongside the test section by crane, and individual
planký; were carried about 30 ft into place (fig. 5). Approximately 250 sq
Fig. 5. Placement of Fenestra mat on test section
ft pzr man-hour was laid by the seven-man crew. This laying speed included
opening the bundles and carrying the mats into place. Minor difficulties
were encountered occasionally in aligning the slots on adjacent planks.
This would be considered a serious handicap only if the mat were being
placed on an irregular subgrade surface.
12. The entire test section was surfaced with Fenestra mat for a
total width of 24 ft, ai shown in plate 1. Five runs of each type of mat
were placed in each of tho four test items to evaluate all four va
types on each subgrade streagth. The laying order in all items was l-d,
1-a, 1-b, a' 1-c. Photrograph 1 shows a general view of the test sec-
tion prior to traffickinjL. With this arrangement, each time the load cart
(described on following page) traversed the entire length of the section,

r 8
the four types of mat were tested on each type of subgrade.
Test toad Cart
13. A specially designed single-wheel test cart (fig. 6) was used
•\ . for traffic tests with 17,000- and 27,000-lb single-wheel loads. This test
cart was fitted with an outrigger wheel (not visible in fig. 6) to prevent
Ai
JI
Fig. 6. Test load cart with 27,000-lb sibgli-%pheel loadwith tire inflated to 400 psi
overturning$.and was powered by the front half of a fouz(.lheel-drive truck.
The aircraft which the test load was to simaiLate is equipped with 30-T7.7,
18-ply tires inflated to 400 psi. However,, at.ftthe time the tests wqre
initiated, these tires were not available iozi test purposes, and F8D3 air-
craft wheels and tires, furnished by the Naval Air Engineeriipgj ab~~ratory
were used for the 17.,000-lb single-wheel-load testsq.'ý T6eF8Up'
26-6.6, l6-ply tires were inflated to 400 psi., which resulted in a tire-
contact area of about 48 sq in. with a tire-print width of about 5 in. whenloaded to 17,000 lb. The average contact pressure Vas about 353 Psi. The
30-7.7 tires were obtained after 50 coverages of traffic had been applied
- , _ - - = -- =--- 4 4

9
with the 17j,000-lb load on the 26-6.6 tires. At this stage of traffic, A 4[ nAE requested that the 30-7.7 tires be used and the test load be increasedSto 27.,000 lb. The 27,000-lb load on the 30-7.7 tire resulted in a tire-
4
Fig- 7. Test load cart with 39,000-lb single-wheel loadwith tire inflated to 400O psi
contact area of 82 sq in. with aItire-.print width of 7.3 in. The av-erage contact pressure was about 330
Psi. A large runway test cart (fig.
7) was used Wiith the 30-7.7 tire for........ %the 39,,000-ib,, single-wheel-load
traffic. A close-up of the load
"iheel mounz-e untler the load box isnhown in fig. 8. The 39,000-lb, load
o~n this tire resulted in a contact''Area of 103 sq in. and an average Fg .Coeu f3,0-b jcontact pres sure of 378 psi. single-wheel assembly
Traffic Tests
A~. A statisf.tcal study of aircraft landiings on ar 78-f t-wid4e runway

10aJ
by the Marine Corps Equipment Board* indicated that with a probability of
100 percent, a main landing-gear wheel path would not vary more than 25 ft
laterally from the runway center line. For about 90 percent of the land-
ings, the main gear load was fairly evenly distributed over a 10-ft width
of runway. For the traffic tests reported herein, it was assumed that
100 percent of the main-gear-load operations of the design aircraft would
be evenly distributed over about a 10-ft width of runway, which may be
slightly conservative based on the statistical results of the study refer-
enced at the beginning of this paragraph. However, for test purposeas this
assumption was considered reasonable. Therefore, a 2l0-ft-wide traffic lane
was laid out down the center of the test section.
15. The test objective was 'to develop a CBR design curve for 1600
cycles of aircraft operations. One takeoff and one landing comprise one
aircraft cycle. Therefore, 1600 cycles is equivalent to 320 passes of the
load wheel. For the 17,000- and 27,000-lb single-wheel loads, the traffic
passes were evenly distributed over the 10-ft-wide traffic lane. Since the
tire-print width of the 26-6.6 tire was 5 in., 24 passes of the load wheel
were required to obtain one cov~rage over the 10-ft-wide lane. This traf-
Lic was applied by driving the load cart forward and then backward the
length of the traffic lane, shifting the path of the cart laterally 5 in.
on each successive forward trip. This resulted in two complete coverages
each time the load cart maneuvered from one side of the traffic lane to the
other. For the 2T,000-lb wheel load, the tire-print width was 7.3 in.;
therefore, about 17 passes of the wheel load would be required to obtain
one complete coverage over the 10-ft-wide traffic lane, or a total of i88
coverages to equal 3200 passes. However, since guidelines had previously
been laid out for shifting laterally 5 in. on each successive forward trip,
the same guidelines were used for the 27,000-1b load traffic; this resulted
in an overlap of 46 percent on each forward pass. Thus, each 24 passes of
the load cart with a 27T,000-lb load and 5-in. spacing resulted in 1.46
coverages.
Sinile-track traffic
16. If a catapult system is used for launching the aircraft from the
* Small Airfield for Tactical Supmort (SATS) Concept. Second Interim Re-port, Project No. 51-58-01, dated 5 March 19W0.

311
mat-surfaced runway, then the main-gear wheels of a given type aircraftwill run in the same path during each takeoff operation. In this type of
operation there will also be an added vertical load imposed on the mat be-
sides the static load of the aircraft. NAEL has calculated that the main-
gear single-wheel load which will be imposed on the landing mat during the
launching of a 60,000-1b aircraft by catapult. may be as much as 39,000 lb.
For 1600 cycles of aircraft operations, 1600 launchings would be required.
Therefore, to simulate these operations, traffic was applied in a singlepath with the single-wheel test cart loaded to 39,000 lb with a tire pres-
sure of 400 psi. The load cart was driven forward and backward in the same
track. The center line of the traffic path was located 2 ft outside the
uniform-coverage traffic lane and 5 ft from the outside edge of the sec-tion, as shown in plate 1.
Soil Tests and Miscellaneous Observations
17. For the 17,000- and 27,000-lb load tests, water content, den-:;ity, and in-place CBR were determined in test items 1 and 2 prior to traf-
fic and at various stages during traffic, and in item 4 before and after
Lraffic. CBR measuremeuts were made in item 3, the rock item, at theend of the traffic period. These data are summarized in table 1. Thesetests were made at depths of 0, 6, and 12 in. in the clay and sand sub-grades, and on the surface of the rock item. A minimum of three tests were
made at each depth, and the values listed in table 1 are the averages ofthe values measured at each depth. No MR tests were made in the subgradesalong the wheel path used for the 39,000-lb single-wheel-load traffic.However, the CBR values shown in table l'are considered to be representa-
tive of the subgrade strength along the 39,000-lb single-wheel-load traffic
* path.
18. Visual observations of the behavior of the- test items and otherPertinent factors were recorded throughout the traffic-testing period.These observations were supplemented by photographs. Level readings were
S taken prior to and at various intervals during traffic to show the develop-ment of permanent deformation and deflection of the mat under the wheel
loads.

12
Behavior of Mat Under Traffic
170.00-lb single-wheel load
19. Observations. A total of 50 coverages of traffic with the
1T,000-lb single-wheel load were applied to the test lane. The mat per-
formance was considered satisfactory in all test items. However, some
weaknesses did appear in the mat types designated 1-b and 1-c. The tack
welds in the type 1-b mat
(fig. 9) were conpletely in-
effective, as more than 50
percent of these welds failedIin all test items during the
50 coverages of traffic.
| • Therefore, theperformance of
types 1-b and 1-c mats, which
had no longitudinal welds be-
tween the individual extru-
sions, was quite similar.
There was a tendency for the
individual extrusions of both
types 1-b and 1-c mats to work
or move with respect to each
other under the rolling wheel
loads; this caused a number of
minor cracks to develop at the
end-connector joints, as shown
in fig. 10. A number of over-
lapping corner breaks along
the side connector also de-
l ýveloped, as shown in fig. 10.
These breaks were more preva-
lent in test item 1, the low-
strength clay subgrade, thanFig. 9. Tack weld breaks in mat 1-b in ititem 2 after 20 coverages of 17000-lb
single-wheel load traffic with the 17,000-lb
-MEMO

-• Fig. 10. Cracks at end joint and overlapping corner breakS• in item 1 after 20 coverages of traffic }
Ssingle-wheel load had no detrimental effects on types 1-a and 1-d matsp ex--S cept for a jainor crack at an end joint of a plank of type 1-d mat.
• ~2D. Permanent deformation. Level readings taken to show permanent :
SE deformation of the mat during traffic are shown in plate 4. As the mat was
[ .--
laid in a staggered pattern., every other run of mat consisted of two whole
S•Planks with an end Joint located at the center of the traffic lane. The
Sadjacent runs consisted of two half planks and a whole plank; one half
SPlank was located on each side of the lane with the whole plank in the4
Center so that the center of the whole plank was located at the center of
Si the ti-affic lane. The data in plate 4 show average cross sections for both
S• conditions for each item of the test lane. These data indicate that the
• : deformation across the traffic lane is about the same regardless of where
Sthe end Joint is located. The 4v. -D- w,-o show that the permanent deforma-I ~ tion In itcns 1 and 2 was very snmb.Z.,-;% a maximum of about 1/ in.,
* §132

14
whereas in items 3 and 4 the permanent deformation exceeded 1/2 in. This
was due to the fact that the rock and sand were placed loose with no com-
paction, and were densified by the traffic load.
21. Center-line profiles showing deformation of the mat in each test
item down the center line of the test lane are shown in plate 5- These
profiles show slight deviations in deformation within the various test
items., but no consistent difference due to mat type. In general, the sur-
face grade remained smooth throughout the 50 coverages of traffic, as can 2
be noted in photograph 2.
22. Mat deflection. Level readings taken to show the mat deflection
under load are shown in plate 6. These data indicate the elastic deflec-
tion, or rebound, of the mat as the wheel load moved over the surface.
Data are shown for three locations on a mat panel in each test item: at &
an end Joint, at a quarter point, and at a center point of a plank. The
maximum deflection indicated is for item 4 where the value approached 1 in.
at the end of 50 coverages of traffic. The severe deflection in item 4 was
due to the densification of the sand under the mat and the bridging of the
subgrade by the mat. A few observations made at the end of 50 coverages of A
traffic indicated that the subgrade was 1/2 to 3/4 in. below the mat along
the center line of the section in test item 4.2,,000-lb single-wheel load I
23. Traffic tests with the 2T,000-lb single-wheel load were con-
ducted in the same traffic lane used for the 17,000-lb Eingle-wheel-load&
traffic. This load was considerably more detrimental to the mat than the
17,000-1b load. The behavior of the mat in the various test items is dis-
cussed in the following paragraphs.
24. Item 1. Types 1-b and 1-c mats in item 1 deteriorated rapidly
under the 27,000-lb wheel load. After 18 coverages. two end joints in each
type of mat sheared completely off, as shown in fig. 11. A close-up of one
of the end-Joint failures is shown in fig. 12. This condition created a
ftire hazerd, and traffic was discontinued on types 1-b and 1-c mats. Types
1-a and l-d mats were still in good condition. At this stage types 1-b and
1-c mats were removed from item 1, and types 1-a and 1-d mats were shifted I"and placed adjacent to item 2. As traffic contim ed, a number of mat
breaks developed in both types 1-a and 1-d muats. 3y 29 coverages, aA

15
7."
VV
F 11 i. Failures in types 1-b and. 1-c mats in item 1 after. 18 coveraresof traffic with 27,000-lb single-wheel load
Fig. 12. Close-up of end-joint failure
I.uinber of7 overlapping corner breaks had developed) as shown in fig. 13.
1h0l0se projecting ends f'rom these breaks were cut off to prevent tiredw'fftleu, LL.., i-Iiown in fig. 14.. The breaks continucd to progress as traffic

13. 0verlviiping corner breaks in item 1 after 29 coverages of trafficwith 27.,000-lb single-wheel load
- N.
'MIN.
Fig. 14. Area where loose projecting ends of overlapping edge of mat were
cut Off-I

17FAUwas continued, and by 128 coverages three end-joint failures developed; at
this point, traffic was discontinued. A general view of item 1 at the end
of 128 coverages of traffic is shown in photograph 3.
25. Item 2. All mat in this item withstood the full 188 coverages J
of traffic with the 27,000-lb single-wheel load. However, there was con-
siderable breakage in types 1-b and 1-c mats of the same type that occurred
in item 1, but the breaks were not as severe. Only one serious break de- N
veloped in the entire item--an. end-joint failure in one plank of type 1-bJ
mat, which occurred at about 73 coverages. No breaks developed in type 1-d
mat, and only two minor overlapping corner breaks developed in type 1-a mat.
26. Item 3. All four mat types performed satisfactorily in this
item. Although practically all the 'tack welds on type 1-b mat failed early
during the traffic period, this did not affect the performance of the mat.A few other minor breaks developed in typets 1-b and 1-c mats, but no breakswere noted in type 1-a or 1-d mat.
27. Item 4. Considerable breakage occurred in types 1-b and 1-c
mats. These breaks were similar to those discussed for item 1, and started
during the early stages of traffic. By 73 coverages, three end joints had
completely failed, as shown in fig. 15, and types 1-b and 1-c mats were
removed from the item. Types 1-a and l-d mats performed satisfactorily
for the full period of traffic (188 coverages).
•ig. 15. Failed end joints in item h after 73 coverages with 27,000-lb
single-wheel load AN
28. Permanent deformation. Level readings taken to show permanent
deformation across the traffic lane during the 27,000-lb single-wheel-load j_ ----=--

i8i
traffic tests ar.• A4hown in plate 7. These data show about the same patternas that discussed 10 paragraph 20 for the 17,000-lb single-wheel load, ex-cept that the degre, of deformation had increased. Center-line profilesshowing the defortin•lun down the center of each test item are shown inplate 8. These daIt show that by the end of traffic (188 coverages) the
permanent deformatiun down the center of the traffic lane exceeded 1 in.•'• • in test items 3 anr •
29. Mat deth ion. Plots presenting elastic deflection of the 1-a
and l-d mats under load for the various intervals of traffic are shown inplate 9. The mat d:rlection in item 4 was severe, exceeding 1.5 in. As
discussed in parugruph 22, this severe deflection was due to the mat
bridging the subgrtts-, as the mat did not conform to the subgrade aster
densification of th,, sand occurred under traffic. As can be noted in
table 1, the densiLt of the sand increased from about 91 1b per cu ftprior to traffic Lo, about 106 to III lb per cu ft after traffic.
Single-track trafi' ,.139,0UO-lb single-wjh%..| .: load
30. Based on lihe performance of the various typls of mats under the27,000-lb single-wzi.t.j load, it was concluded that only types 1-a and l-d,
' K which had continuouu longitudinal welds, should be considered for trafficwith the 39,000-lb utugle-wheel load. There was only a sufficient quantity
. of this mat for two iximplete test items; therefore, only items 2 and 3, thehigh-strength clay told the rock items, were utilized for the 39,000-lb"single-wheel-load tot. For this test, it was necessary to reuse types 1-a
"A and 1-d wats that hta4 previously been subjected to traffic with the 17,W000-and 27,000-lb singleswheel loads. However, the mat was taken up and relaid
on items 2 and 3 with the ends reversed so that none of the mat along the
single-track traffiQ path had previously been trafficked. Although allplanks us;ed were in ft4-o± condition, some difficulty was encountered in re- 1
laying the mat, MostLy in aligning the connector slots on adjacent planks.
Sixteen runs of mat wrre placed on each of the two test items.
31. The mat I% both test items performed satisfactorily under the39,000-lb single-whe.¢t load. Fig. 16 shows a failure of the interior of Aone plank; this £ai-luiv occurred in item 2 after 400 passes of the loadwheel. The reason that the mat collapsed was not apparent, and this
SoI

19
Fig. 16. Interior failure of met plank in item 2 after hWO passesof 39,000-lb single-wheel load
condition wa,, not representa- 6
tive of the section.
32. The load tire blew
out after 260 1435, and 638
passes, and in each instance,
the impact of -the wheel rim
.aused rathur severe damage
to the mat. A view or a
blown..out tir-e is shown in
fig. 17. Fia. 18 shows a
ClOce-.up of' damage to the mat
caused by a tire blowout. Fig. 17. Blowout of 30-7.7 tire(39,000-lb single-wheel load with
Iffunediately after there tire inflated to 1400 poi)

=77 477"n 77-"W -'M
20
3
Fig. 13. Mat damage from blowout at 638 passes
blowouts, the damaged mat run was offset by 2 ft to avoid interference with
continued trafficking operations. A total of 946 passes had been applied
when the carcass of the last available tire separated and became unsafe for
further use. It was apparent at this stage of trafficking that the mat
would satisfactorily withstand the full 1600 passes of the load wheel., and
Sthe test was considered complete.
Failure Criteria and Analysis of Test Results
Failure criteria33. The criteria for failure of the Fenestra Mark III mat were es-
sential3y the siame as that used for the MqM2 mat, as reported in WES
Miscellaneous Paper no. 4-501, Development of CBR Design Curve for M91M
Landing Mat, dated June 1962. However., some slight modifications had to
be made due tl the differences in the design and performance of the
I •.. ... , i lid

S,,,,, ,, t l l
.iF:
Fenc¢•gra mat. The failure criteria used for the Fenestra mat were as •4•
•:ollows: •a. Excessive mat breakage
End-joint failures
Core (interior) failuresb. DeflectAon•
Maximum permissible, about i in.
3•. It was assumed that a certain amount of maintenance would beperformed in the field during actual usage, and that short weld breaks,
overlapping corner breaks, etc., could be repaired rather easily. However,
when an end-connector joint sheared off or a mat core failed, the mat plank
7•would be considered failed, and should be replaced. It• was also considered
fcasible •o replace up to i0 percent of the ma• with new planks during the •design life of the runway. For replacement 5f more than i0 percent of the ••Iplanks, the maintenance effort would be excessive. Therefore, for the test
•ection, it was assumed that up to i0 percent of the mat planks in each
item could be replaced, and when an additional i0 percent fa.•" ed, or ato•al of 20 percent, the entire item was considered failed. •-•
i35. The deflection criterion of l-in. maximum is based on previous
•xperienc• in ma• testing in which it has been observed that a deflection I-f.1in excess of 1 in. causes the nat to break up at a rapid rate, and also to
--• • create a high rolling resistance.
S'" 36. 'fne degree of roughness is also normally used in •udging fail-
•mooth throughout the period of traffic except, when an end •oint of a plank •
fail•l,
S•Sum•ry of test resui•s
• 37. A summary of th• traffic test results for the iT, O00- and• •7,000-1b sing.1.•:•heel-load unlform-covers6e traffic is shown in table 2.
Th£s •ble ideD•_fies the test items• shc•:s the rated sub•rade CEq, in•i-
•at•s the number of planks of the different type mats in each item, and IIPr•:sents data on mat breakage and deflection at various stages of traffic.
The last column in table 2 indxcates a ra•ing for each type of mat in each
ltem• based on the fail•re criteria d.•scribed previously. •
3•. The rated subgrade CER for the clay subgra•e (items 1 and 2) is •:

22
based on the numerical averages of the CBR values measured at 0-, 6-, and A
12-in. depths prior to traffic and at various traffic intervals where tests
t • were iru±de (see table 1). The only value measured for the rock subgrade was
a CBR of 81 at the end of traffic. However, this strength was developed as
a result of densification and confinement of the rock under the mat during
traffic. As previously stated, the material was placed loose with no com-
paction, and would have had a very low CBR value at the start of the test.
Therefore, the item is not assigned a CBR value, as the mat behavior wzas
probably influenced more by the initial strength than by the strengthJ which
developed during the traffic tests. The sand in item 4 had an initial OBF
of 3.5, but the value increased considerably to about 15 to 20 during the
traffic period, as shown in table 1. The bridging and severe mat deflec-tion, as discussed previously for thio~item, were due to densification of
the sand during traffic. The initial CBR value is a relative measure of
the degree of density in a sand, and the lower the initial. CBR value, the
more outtlement can be anticipated. Therefore, the initial CBR strength
of 4 is used for evaluating this item, as it is believed that the initial
strength, or density, of the sand more nearly indicates how the mat will
behave.
39. Since the 27,000-lb single-wheel-load traffic was applied on
the same traffic lane as that previously subjected to 50 coverages of a
17,000-lb single-wheel load, the effects of the initial traffic are con-
sidered in the evaluation. This was accomplished by taking the actual
coverages applied with the 17,000-lb single-wheel load and converting them
to equivalent coverages of a 27,000-lb single-wheel load. The conversion
was based on equivalent-wheel-load relations which have been developed at-
the WIS for flexible-pavement design.* From these relations it was com-
puted that 50 coverages of the 17,000-lb single-wheel load were equivalent
to 6 coverages of the 27,000-lb single-wheel load. Therefore, the 6 cover-
ages were added to the number of coverages of the 27,000-lb load (see
"Equivalent Accumulative Coverages of 27,000-lb Load" in table 2).
40. The borderline ratings of types 1-a and 1-d mats in items 3 and
* U. S. Army Engineer Waterways Experiment Station, CE, Revised Method ofThickness Design for Flexible Highway Pavements at Military Installa-STechnical Report No. (Vicksburg, Miss., August 1961).
tin r o -6 (ikbrMs.

23
and were .1n good condition at the end of the test. The se severe
ns ere t• to ien...icatlon of the subgrade and to the matS•" -1 -!.-h sub:--ad•e as previously discussed. This condition is not de-
a.--- coul 'ael :r.,atea pratice by some compaction cf the rockor, sanda pri~or to iain:- the mat.
41. As previously stated, the single-track traffic with 39,000-lb
wheel Ioad was applied on test items 2 and 3 only. No CBR tests were made
fin the subgrade along the wheel path, and it was assumed that the subgrade
strengh wat as consire to bs measulred in these items within the uniform-
icad over traffic s aee. The mat performed satisfactorily through 946 aasses
nsof the 39,000-cb o eel load. The maximum mat deflection under load wasignabout 0.06 to 0.7 In- in item 2 and about 0.7 to 0.8 in. in item 3. Based
Son the mat performance throug~h 946 passes., it was evident that the mat
could sustain the desired 1600 passes of the 39,000-1b single-wheel load
when placed on a subgrade with a CBR of 13 or greateri
CDevelopment of Design Curves
!i Approach
42. In arriving at a CBR design curve for the Fe2estrab Mark IIl mat,
vthe mat was considered 2, hihcoespond to ta base course in distributingi lead over the subgrade, and thus, in a sense, to replace a certain thick-
nhess of base course. Therefore, a standard flexible-pavement CBR design -
faicurve for 188 coverages of a 2 r,000-eb sd.ngle-wheel load with a tire pres-
onsure of s00 psi was used a a basof,6nd the reduction in 2 v e tphickness of
base course that could be applied to the flexible-pavement design curve
was determined from the landing-mat test data.CBR design curves
43. A plot of CBR versus coverages for the 27,000-1b single-wheel-
Sload traffic is shown in piefte 10. The points plotted are the rated CBR
Svalues listed in table 2, which correspond to the number of coverages at
S; failure or end of traffic. Failures developed in types 1-b and 1-c mats
on the subgrade with a rated CBR of 6 at about 24 -coverages; types 1-a and
1l-d mats failed on the samec strength cubgradde at about 134 coverages.
STheýrefore, to determaine the minimwn CBR required to support the load for

the f'iiure points at 24 and 134 coverages were tran :.iS: ..- by ust of the CBR equation, which is written in the
f! • o:•- ze--.2ral form:*
0-.23 iota0 C + 0.15 V- "7-1M -P1 1
where
t = thickness, in.
C = number of coverages
P = single-wheel load, lb
CBR = measure or subgrade strength
p = tire pressure, psi
For flexible-pavement design, the value of t obtained from this equation
indicates the total thickness of base course ard pavement construction
which wDuld be required to support the load for a given number of coveragez
on a subgrade of given strength. In the case of landing mat, the t value
indicates the thickness of base course and pavement which the mat can re-
place. For the data shown in plate 10, the t value was computed for the
fail'are points on the clay subgrade at 24 and 134 coverages. Then, on the
assumption that the thick.ness of the base course and pavement which was rc-
placed by the mat was constant throughout the range of coverages from fail-
ure to 188 coverages, the minimum CBR which would support 188 coveraees w-1.
conmuted. The computed values were a CBR of 13 for types 1-b and 1-c :
and a CBR of 7 for types 1-a and 1-d mats. An example of these computa-
tions is given in WES Miscellaneous Paper No. 4-501, pages 17 and 18. ID
is interesting to note that the computed failure point for types 1-b and
1-c mats is 188 coverages on a CBR of 13. The subgrade strength for Ac.S.tem 2 wva rated at a CBR of 13, and although the mat performance was c7:±-
sidered satisfactory at the end of 194 coverages, one plank of type 1-1:
had failed, and numerous mat breaks were noted in other planks of typ.:J -
and 1-c mats. Thus, complete failure of these mats was imminent at th.
• This is a combination of e.uation 2, page 2, IWES Instruction Repor*.io. 4, D.v..r I a 3.1,, of CDR Di'n Curve;.; dated November 1959,the equation gur slop;. of curve, p;!ate b, of the same report.
£7.

i 7i25
of the tests. This indicates *chat the method used for translating cover-
ages iz reasonably accurate.
44. PlaLe 11 shows CBR design curves for 188 coverages of a 27,000-lib single-wheel load with a tire pressure of 400 psi. The lower curve is a
standard fleucible-piement CBR design curve. The curves for the Mark III
luading mat were developed as follows: In plate 10, it was shown that a A
subgrade with a CBR of 13 would sat:.sfactorily support a 27,000-lb single-
wheel load for 188 coverages when surfaced with type 1-b or 1-c mat. It
can be seen from plate 11 that a flexible-pavement design based on a sub-
grade CBR of 13 would require about 10 in. of base course. Thus, types 1-b
and 1-c mats are equivalent to about 10 in. of base course. Similarly for
the types 1-a and l-d mats, it was shown in plate 10 that a subgrade with a
CBR of 7 would satisfactorily support the 27,000-lb single-wheel load for
188 coverages; and as shown in plate U, the indicated thickness for a
flexible-pavement design for a subgrade with a CBR of 7 would be about 3
14 in. Thus, types 1-a and 1-d mats are equivalent to 14 in. of base
course. The GBR design curves for types 1-b and 1-c mats, and 1-a and l-d
mats were obtained by taking 10 and 14 in., respectively, from the thick-
ness indicated by the flexible-pavement design curve.
145. The data obtained from the loose rock and sand test items were
not used in developing the design curves shown in plate 11. However, the
data indicated that a loose sand or rock subgrade with an initial CBR of
4 or better, surfaced with type 1-a or l-d mat, would perform satisfac-
torily for 188 coverages of the 27,000-lb wheel load provided that the
severe mat deflections caused by the mat bridging the subgrade were not
detrimental to aircraft performance. A slightly higher initial subgrade
strength would be required for type 1-b or 1-c mat.
46. The minimum subgrade strernth required for type 1-a or 1-d matto sustain 1600 passes of the 39,000-lb single-wheel load in a single path
was not determined. However, from the performance of the mat through 946
passes on a subgrade with a CER of 13, it was evident that the mat could
carry the desired 1600 passes of traffic when placed on a subgrade with
a CBR of 13 or greater.
304 5 6

LEE 26
Conclusions and Action Taken i
47. From the results of the tests discussed in the preceding VU:
S..-, i; was concluded that the continuous welds used in the types 1-
and 1-d rts provided a stronger mat and were needed to meet the test •..A
quireients. It was further concluded that types 1-b and 1-c mats did r.
meet the cest requirements of the Navy. Therefore, type 1-d mat was
standardized and designated AM by the Navy.al
'I
A4
2-4

ZA
27
PART III: TESTING Q.1D DEVELOPMENM OF DESIGN CURVESFOR BUTLER AMI MAT
Mat
48. The A14. mat was essentially the same design as the Fenestra type
l-d mat except that a groove along the overlapping edge of the panels was
omitted in the AMI mat. Fig. 19 shows the AMI plank. The planks were
about 2 ft wide, 12 ft long, and weighed approximately 171 lb. A total of
16 bundles, each consisting of 10 full planks and 4 half planks, were re-
ceived for surfacing the test section. A
Fig. 19. Butler AM. mat plank
Test Section
Location
i49. All traffic tests were conducted at WES on a test section which
was constructed and tested under shelter to control the water content and
strength o0 the subgrade.
Description
50. A layout of the test section is shown in plate 12. As can be
seen, the test section consisted of five test items, each of which was ap-
proximately 24 ft wide and 30 ft long. Items 1, 2, and 3 were constructed
, of a heavy clay soil, item 4 of an uncompacted rock, and item 5 of a loose
sand.
Eubzrade materials
51. These materials were similar to those used in the Fenestra mat
tests and have been described in paragraph 8 of this report. Gradation and
classification data are shown in plate 2.

Cu...• .. .n of i::.:rade
52. Items 1. 2, and S. It was desired to construct items 1, 2, -
10. aind 15, respectively, when compacted. Construction procedures wer. t!.
same as those described in paragraph 9. Construction data represent n .L;
average of four lifts are shown below.
Test Water Dry DensityItem Contentbcu ft CB
S27.5 93.5 52 23.7 96.3 10
19.7 97.1 14
53. Items 4 and 5. Items 4 and 5 were constructed using the same
procedures as those described in paragraph 10 of this report.
Mat ulacement
54. The A9.4 mat was placed in the same manner as the Fenestra mat
(see paragraph 11). Approximately 290 sq ft per man-hour were laid by thu
six-man crew. EKo difficulties were encountered during the placement opera-
tion. The entire subgrade was surfaced with AM1 mat, resulting in a total
mat vidth of 214 ft, as shown in plate 12. Fifteen runs of mat were placed
in each of the five test items.
Test Load Cart
55. The test load cart described in paragraph 13 and shown in fic. -
was used in the 27,000-lb single-wheel traffic tests. This same cart was
strengthened and used for the 39,000-lb single-wheel-load tests. A 30-7.7
tire inflated to 400 psi was used for both wheel loads.
Traffic Tests
Uniform- coverasre traffic
56. The test section was suibjected to traffic with the 27,000-lb
zinale-wheel load at a tire pressure of 400 psi. Each time the load cart
traversed the length of the test section, data were obtained for each L•.
of sub,-yade. The tra^ffic was di'tributed uniformly over a traffic lane
_J

29j
1i ft wide laid out down the center of the test section, as indicated in
nlaLe 12. Traffic wa* applied on each test item until failure or to a max-.
;*-Iu •i of 188 coverages. The coverage criterion was established as described
-n paraGr.'aph 15.
: ~ single-track traffic
5T. Traffic with the 39,000-lb single-wheel load was applied to a
single-w;heel path to simulate catapult launching operations. The traffic
path was located 5 ft from one edge of the mat section and 2 ft from the
edge of the 27,000-lb single-wheel-load, uniform-coverage lane, as indi-
cated in plate 12. The traffic path was also 1 ft from an end joint on
every other run of mat.
Soils Tests and M4iscellaneous Observations
58. Water content, density, and in-place CBR data were obtained in I
each test item prior to traffic and at the end of the traffic period.
These data are shown in table 3. A minimum of three tests was made at each
depth, and the values listed in table 3 are averages of the values meas-
ured at the indicated depths. The test values shown in table 3 were ob-
tained from within the area subjected to the 27,000-lb single-wheel-load
traffic. No tests were made along the 39,000-lb wheel path; however, the
rated CBR values derived from the 27,CO0-lb test lane were considered ap-
plicable for analysis of tests with the 39,000-lb single-wheel load.
59. Visual observations of the behavior of the test items and other
pertinent factors were recorded throughout the traffic-testing period.
These observations were supplemented by photographs. Level readings were
taken prior to and at intervals during the traffic period to show the de-
velopment of permanent deformation and mat deflection under the wheel load. I
Behavior of Mat Urder Traffic
Uniform- coverage traffic,27,000-lb single-wheel load
60. Observations. It was apparent at the beginning of trafficking
operations that considerably more flexing of the mat was occurring in
item 1 than in the other item*. Small breaks in the overlapping ends

30N A
I
I
Fig. a•. Overlapping-edge breaks in item 1 after 10 coveragesof traffic with 27,000-lb single-wheel load
and in the overlapping edges began to occur at an early stage of traffic i:.
item 1. Fig. 20 shows two overlapping-edge breaks in item 1 after 10 cov-
erages of traffic. This same type of break occurred in item 2 after 10
coverages, although it was much less severe than in item 1. No breaks had
* "•-" • / " -; , - -..... : / -'-. .... occurred in items
S3, 4, and 5 by th,.
- end of 10 coveraGo,.
. of traffic, and th_
Sriding surface rc-
Smained in excelle:.
" condition over th,
Sentire test sects-
" 61. The nu-.,-
) ber and severity
I breaks in item 1
A*. increased rather
rapidly as traf*
Scontinued. Fik.... shows an
Fig. 21. Overlapping-edge and end-joint breaks initem i after 20 coveraGes of traffic with 27,000-lb overlappin-,cdLe
single-wheel load break and an

31
end-joint b ea, in item 1 after 20 coverages of traffic. The broken over-
''.• - .. eC cut of after 22 coverages, and the sharp edges beaten
covetees and therge, an ed enin
- t 1
in item 1 sheared completaely (see
Fig. 23 shows the load
wheel stopped on this end Joint.
It can be seen that the mat de-
formed severely which resulted in
a considerable amount of roughness
in item 1. This item was con- .• Isidered failed after 36 coverages,
although traffic was continued to
42 coverages. A close-up of an
overlapping-edge failure in item 1
after 42 coverages of traffic is
shown in fig. 24.62. The Aivil mat was de- Fig. 23. Load over end joint in item 1
after 30 coverages of traffic withsigned so that a 5/8-in.-diameter 27,000-lb single-wheel load

Fig. 24. Failure of mat in center of plank. Item 1 after 42 coverages oftraffic with 27,000-lb single-wheel load
rod could be used at the end joints, which would provide some load transfer
across the end joints. The end rods were not used initially in laying the
mat as the ,AMiC preferred to use the mat without the rods. However, be-
cause of the early mat failure in item 1, it was decided to take up the mat
in this item and relay it using the end-connecting rods in order to evalu-
ate the benefits in load-carrying capacity that might result from use of
these rods. Therefore, as traffic continued from 42 to 50 coverages in
.............. .... ............ items 2, 3, 4, and
I 5, the mat in item
1 was removed, the
Sends of the mats
were reversed, and
the mat was relaid
using 5/8-in.-
diameter steel
rods in the end
.... . ... . '. , ........ .. I joints as shown
Fig. 25. End-connecting rod in joint in fig. 25. Traf-of Butler AI1 mat fic was then re-
sumed on the test lanie with 0 coverages on item 1, and 50 coverages on the
othcr itemo. It was found that the rods added significantly to the load-
carry!ng capabilitits of the mat. After 30 coverages on item 1 with the
cnd-connecting rods installed, the section was in good condition with only

F
33
minor defý':14-1ities. However, after 32
coverages, One end joint sheared (see "
fig. 26), and the entire mat run was .replacedý.
63. An end-joint break devel-
oped in item 2 after 90 coverages andts
became more severe with increasingStraffic (fig. 27). It was noted
a efter 00 coverages that small amounts
of clay were being squeezed up be-
tween the joints in items 1 and 2,and some side slipping was occurring
in item 4 (rock section). e
64. After 1 t0 coverages of Itraffic (60 coverages on item F),ili/4-in.-diameter holes were drilled
near the ends of progressing edge 1
breaks in items 1 and a in an effort3
to stop the breaks. A second end s
joint sheared in item 1 at 66 cover-
ages, and the entire run was re-.....placed. As traffic progressed, some Fg 6 rknedjit ed
of the breaks extended beyond the and overlapping edge. Item 1 mat
drilled holes. After 90 coverages on item e2daftert18cove fers0coverages of traffic with 27,000--bi tem i, 20 percent of the mat planks single-wheel load
Fig. 27. End-joint b~reak in item 2 after 188 coverageswith 27,000-1b single-whe'el load •

had failed; however, traffic was continued through 138 coverages wiJth
frequeri maintenance of the test item. Test items 2 through 5 with 4,i
the full 1i8 coverage4 of traffic with only one plank failure in itu:.,
a fe, :i:r.nor breaks in the other items. A general view of the test i~w: i.
the end of traffic is shown in photograph 4.
65. Permanent deformation.: Level readings taken to show perr,:.,:•. .:,
deformation of the mat during traffic are shown in plate 13 for all Lt.vi
items. From these data it can be nc~ed that little settlement occurr.d i,.
any of the clay subgrades, items 1 through 3. However, considerable ,
znation occurred in items 4 and 5, roqk and sand subgrade items, respec-
tively. ThIs deformation was due to' densification of the rock and sand
under traffic, as was the case for t6e Fenestra mat discussed previously.
66. Profiles showing the deformation ,of the mat along the center
line of the test lane are shown in plate 14'. These data show considerabiL-
deviation in the deformation of adjacent mat planks in item 1 at the end ,:
36 and 138 coverages, respectively. This Is due primarily to breaks in U:
end joints. This condition would result in a rough riding surface. Tht:
mat surface remained fairly smooth in items 2, 3, 4, and 5 throughout th.'
period of traffic, even though considerable deformati6n occurred in
items 4ý,'and 5.
67.!. t- d~lection. Plots showing elastic deflection of the matL
under load at whrious intervals of traffic for all test items are ohuwn o:,
plate 15. e.h rather high deflections indicated for the mat in itCMrn L'
and 5 were aue, to thdw mat bridging the subgrade, as was discussed for Lt,.
Fenestra mht. 1 ''
Single-tradk• traffic ,39,000-lb sýhgle-whd', load
68. No mat br akage was noted in any of the test items during th,*
initial stages of traffic using the 39,000-lb single-wheel load. '1TW*,1
runs in test item 4 were damaged by a tire blowout at 146 passes (i"'
fiG. 28). The damaged mat was replaced with new mat planks. A•I tt.
continued, some breaks did develop in all test items. A core fI],:I."
started developing in a mat plank in item 1 at about 150 paOses u,""' "
greased to complete failure at about 400 passes. At Lhis pointL, i,. '
joint also sheared, as shown in fig. 29. By 500 passes, three uid-,.
m Best AvaIlable CopY

I I
Fig. 28. Damaged AM]. mat in item 4 caused by tire blowout after146 passes of 39,000-lb single-wheel load
Fig. 29. Sheared und Joint ;.'ter core failure of AMX] r-rnt initem 1 aftt;r 400 passes of 39,000-lb sinle-.whc(el load
9I

I
31
36
..... .cre failure had developed in item 5, and one core Vai I.:
a&n• v•,za r.-nudinal-wld fai lures were noted in item 4. Typical3o.0 _ t •1•-w~..1 failures are shown in fig. 30. General views of ite...
I
Fig. 30. Typical longitudinal-weld failures in AM1 mat
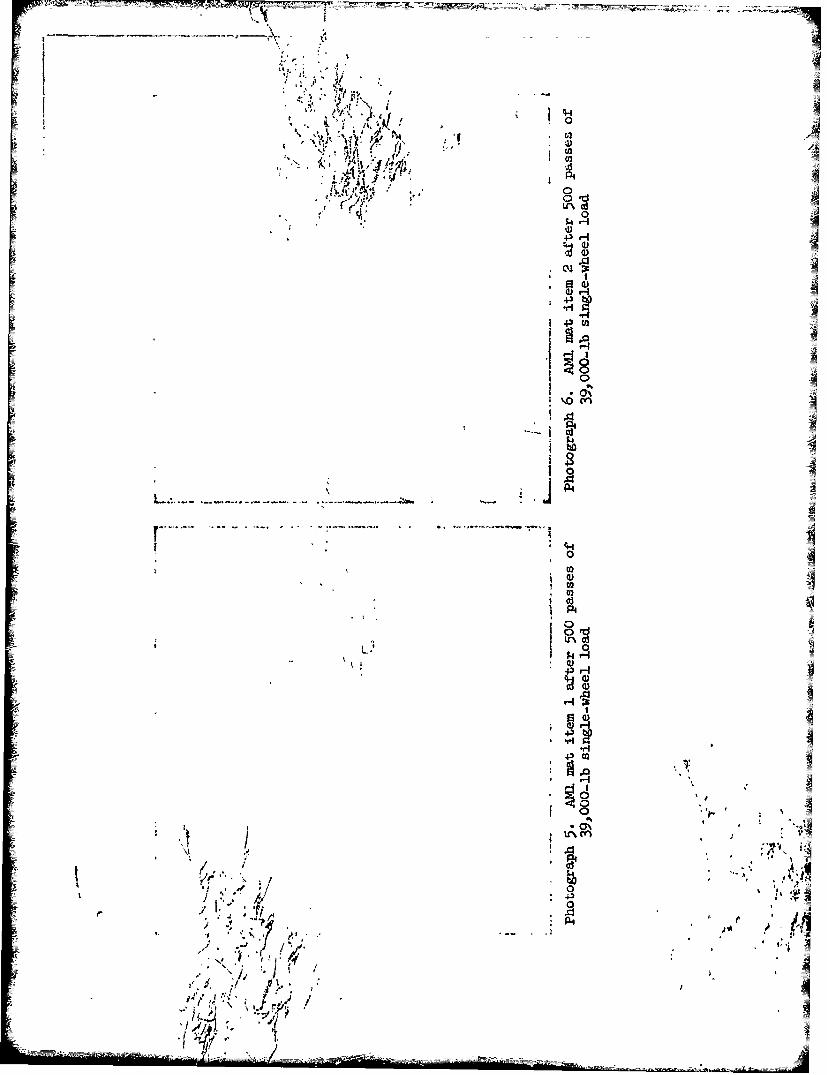
through 5 at the end of 500 passes are shown in photographs 5 through 9%
respectively. A close-up of a mat depression indicating a core failure
item 5 is shown in fig. 31.
-=
Fig- 31. 1Xpreasicin in A111 rat. in item 5 inaicating core 1'a OUafter 5u.) paz;;s of 39,000-lb ;;Ingle-wheel load
k JA
--al

37
rapdl69. As traffic continued, test items I and 5 deteriorated quite
Srapidly, and were considered failed at about 616 passes. However, traffic
[ •was continucd to 750 passes on item 5 and to 954 passes on item 1. The mat
a inite,:• 2, 3, ana 4 performed satisfactorily through 1200 passes, although
some minor breaks developed in all test items. Traffic was discontinued
at the end of 1200 passes as it was evident that items 2, 3, and 4 would
sustain 163u •Csses of' th wheel load with a reasonable maintenance effort.
General views of test items 1 through 5 at the end of traffic are shown in
photographs 10 through 14, respectively.
Summary and Analysis of Test Results
TO. The results of traffic tests with the 27,000-lb single-wheel
load are summarized in table 4. The rated subgrade CBR shown therein was
determined from the test values shown in table 3, using the method of anal-
ysis described in paragraph 38. The failure criteria were the same as
those discussed in paragraph 33. From table 4 it can be noted that mat
failure occurred in only item 1. Item 5 is rated borderline due to the mat
deflection under load exceeding 1 in. at the end of 188 coverages of traf-
fic. However, there was no mat breakage in item 5, and the item would be
considered satisfactory provided the severe deflection is not detrimental
to aircraft performance. This deflection was due to the densification of
the sand and to the mat bridging the subgrade, as previously discussed.
71. A summary of test results of the 39,000-lb single-wheel load is
shown in table 5. As previously stated, traffic was applied in a single
path 2 ft outside the uniform-coverage traffic lane used for the 27[,000-lb
single-wheel load. No CBR tests were made along this traffic path, and it
was assumed that the subgrade strength was the same as that for the 27,00u-
lb single-wheel-load traffic. Therefore, the same rated CBR values are
used for analysis.
CBR Design Curves
72. The approach used for establishing CBR design curves for the.
lButler AM] mat was the same as that used for the Fenestra mat and described
in paragraph 42.
I

E i
4.X-~ ~l CWZ~~2.load
" 1*. A po; of ClI• vef suz coverages is shown in plate 16. Th" .:
it:- • ;,ne •hu r:-t-d COR ".. _vc_ listed in table 4 for test items 1 tt-..
4 ccr....._oring to the number of coverages at failure or at end of tra:'.
As can be seen i" 2•late 16, all test items with a subgrade OBR of 12 u.-
[I groat-.z 'sere saz~sfsaory at the end of 188 coverages of traffic. Failu:...
occurred in item I (rated CBR of 6.4) at 36 coverages of traffic for th..mat wifhout end-connecting rods and at 90 coverages of traffic for thi il-e ,
with end-connecting rods. These failure points were translated to 188 -
coverages by use of the CBR equation given in paragraph 43. From these
data the indicated CBR required for 188 coverages of the 27,000-lb sinhl- Iwheel lsad is 10.7 for the A941 mat without end-connecting rods and 7.9 i1*, :
the AU-' mat with end-connecting rods.
74. CBR design curves for 188 coverages of the 27,000-lb single-
wheel load with a tire pressure of 400 psi are shown in plate 17. The
lower curve is a standard flexible-pavement CBR design curve. The curves!
for the Butler AM]. mat were developed in the same manner as those for the
Fenestra mat, as discussed in paragraph 44. I75. The data obtained from the sand test item were not used in dk-
veloping the design curves shown in plate 17. However, the data indicatt
that a loose-sand subgrade with an initial CBR of 5.6 or better surfacc:d
with Lutler Alf" mat would perform satisfactorily for 188 coverages ofL tLh
27,0.0-Db single-wheel load with 400-psi tire pressure, provided the •.
mat deflection caused by the bridging of the subgrade by the mat was not,
detri.•cntal to aircraft performance.
39,000-lb single-wh'eel load
76. A plot of CBR versus passes for the 39,000-lb single-wheel-3.
traffic is shown in plate 18. The points plotted are the rated CBR val.-
listed in table 5 for test items 1 through 4 corresponding to the nPU;t:'-'"
passes at failure or end of traffic. From these data it can be notcd U.
all tes, items with a subgrade CBR of 12 or better performed satisfac-
torily. However, zat failure occurred on the subrrade with a ratcd C.':
6.4 at about 616 passes of the load wheel. In order to deterilin-> -h
mum CBR required to support the 39,000-lb single-wheel load for liu'
passes, this failure point at 616 passes was translated to 1(00 paSe;

39
[ use of tire CBR equation in paragraph 4.,. The indicated minimum CBR re-iuiz'd .,. .A. uain iC passes of the 39,000-lb single-wheel load is 8. 21
.:,:-:.,. C= of -is based on the performance of the mat in test
_,Le= I, was placed with the end-connecting rods at joints. By coin-
S.... .... nee of he ".11 malts with and without the end-connecting
"rods u:nzer the 27,C&¢-1b single-wheel-load traffic (see plates 16 and 17),
the mini---.am zubgrade CBR required to support the 39,000-lb single-wheel
load for IC0O passes on the AM.. mat without the end-connecti•g rods would
be about 10.8. The satisfactory points shown in plate 18 are for the AM).
mat withzut end-connecting rods.
77. A CBR design curve for 1600 passes of the 39,000-lb single-wheelload with a 400-psi tire pressure for the Butler AM] mat with end-connecting
rods is shown in plate 19. This curve was developed in the same manner as
that previously described.
78. The Butler AM] mat placed on a sand subgrade with an initial CBRof 5.6 withstood 616 passes of the 39,000-lb single-wheel load. During the
application of traffic, the sand densified under the mat, resulting in de-
pression of the subgrade under the mat. The strength of the sand increasedconsiderably due to densification. However, the mat did not conform to the
subgrade settlement and tended to bridge the subgrade. This resulted in
rather severe mat deflections and caused the mat to break up. Therefore,
for the AW-. mat to sustain 1600 passes of the 39,000-lb single-wheel load,
the sand should receive some initial compaction to avoid detrimental set-
tlement. By translating the failure point for the sand subgrade (CBR 5.6
at 616 passes) to 1600 passes, the indicated initial CBR required for the
sand subgrade to sustain 1600 passes of the 39,000-lb single-wheel load is
about 7. This is just slightly less than the strength required for a clay
subgrade.
-1W
SI
A1

40
PART IV: CONCLUSIONS
79. The following conclusions are drawn from the data presented in
this rerort.
a. The Fenestra type 1-d mat, designated AMi by the Navy, willsustain 1•0 cycles of aircraft operations with a 2 7 ,000-lbsingle-wheel load and a 400-psi tire pressure when placed Una subgrade having a CBR of 7 or better throughout the periodof traffic.
b. The minimum subgrade strength required for the Fenestra typel-d (A1.1I) mat to sustain 1600 Dasses in a single path of the39,000-lb single-wheel load with a 400-psi tire pressure warnot determined. However, it was determined that the matawould support the desired 1600 passes of the 39,000-lbsingle-wheel load with a 400-psi tire pressure when placedon a subgrade with a CBR of 13 or greater.
c. The Butler A141 mat with end-connecting rods will sustain
1600 cycles of aircraft operations with a 27,000-lb single.wheel load and a 400-psi tire pressure when placed on a sub-grade having a CBR of 8 or better throughout the period oftraffic. For the Butler A.4I mat without the end-connectingrods, the subgrade CBR required for 1600 cycles of the sameloading is about 10.7.
fd. The Butler A111 mat with end-connecting rods will sustain- 1600 passes of a 39,000-lb single-wheel load with a tire
pressure of 400 psi applied in a single path when placedon a subgrade having a CBR of 8 or better throughout theperiod of traffic. For the same mat without the end-connecting rods, the subgrade strength required for 1600passes of the same loading is about 10.8.
gI
| oI

~~C',
;.4 0 4
43~4 I - 4
%. A.
411
414 44vLl-
41. 4.1
4j4
0.4p . ý44 U 41
t4 4.4 ' -43
41t0 4 (
0
41 o 414
41 . d
0 000 to,
-4 -4 2
-44 f4.-
43 44 o 4J
El~* 8.1r64)4H
(' I . 4
_u 'I1u

IfA
*~~Z 00. ,, .
05 0. .* .4 . 0 .0,. .. .,.' .... . .
. . ..0 .0 ..*. .* Vo~ .* . 4
.4.
___ 40 ooD0 00012 6OCo
0 -C4-.M ý3! -_X 1
-in 00 0 0 0 00 O O O~.40
4A VI
Ao. z
-; ,04 ~.L4- ' ~ .00 ~O0~?~0 *00 .54 t~ 00 00.O4

C24 "2
4j
"-, % % 4 ca a,
R R.. 41
223.,s 0 %0c 00% mC
t2
-4 *- W .
o ~~~ ~ ~ > )- C c c
E' 34 -qV %
0
ji7 4R' 9 n0 e - -0 0tKIA41...A.21 0 ýo co % =1q 0g4j a
H 3 (4 0 a (. ' .
0 11* .4
U~~~' inOC' 8'".~ ~~I~.4-4 -- 4-4.
t at LI

>IV4 v
44
-4. -t j 3' t O fI .-t -t W4 I ý 1 ý C 7 IIC
-. 000000000 0 ý4
-. 400 . -.. a 100000
0 .a7 21 0 14440 00 0 o 0
131In1

I
0 00I.,.__
0• o 0 0 o 0 0
biiI. 7, I
1 "• t • [0 0 M . .. 0 0 0 0 0 0 0 0 0 0 0 0 0 ,0 .. It 0 0 l (n. -tSm 0 CU . 0 0 0 0 CU 0 0 0 0 M e0 00 0 0 0 fn -n414
0 *I u0 -0O 00 0 O -a. . . 4
"-4 -
S0
0 000,41 0a ca
ý4 0000004f

ISI
.1
P~t~ah1.Fenestra naat test section aftri5 ovra tof traffic wt
I iI -,
I 'P: o hotogl . enrah i. teestr ts section atr 5 ovrge •oi traffic.wt
II

I _
Photograph 3- Item 1 of Fenestra. mat test section after 128 coverages oftraffic with 27,000-lb single-wheel load
I i -A
Pho'"Vogaph 4. AM]. moat te:st section cfter 188 coverages with 27,000-IL'single-wheel load
',k 1. 9,! : ' .- "
-. Co•
,)
L 'r%
p4AA
-. .
i° I
" * O, -A
4 M _
""F.-'.- * .'.
CMA
II
.0
43U
M 0).5
I I-j
4s M
.1 N-5 M t
~ ~'Xi

:--- - -0- ---- -
4.4
E)2 j |
.01
4-5
o
S oSON
,43
C H
0
to -
* F
0
0
Cii
AA
4-1 Q
- 0

U)
to)
if'
4.,
0
14)
UN
'0
* 43 r
0f0)
(;I aA
43W

*10
43 I
0
r4Ti
10A.44
0
4~-I
43 W
,4
0A
4J0-

S1J
,-04
4to
fOJI
43 0
ýo0
o
0
t4 -1
pa €
I-i
..-.----------- ,.--.- -.
0
A
V (D
43 CO
iXg

<0
*iII
I;-x
II 4
-. Jo
PLT I

p4aioM 1q mmeo3 ;ua~jm
a~~~n 0
' - a
-~!4 jf--4
-t-a
icC,I ZM1EI+_ _q _u 4u
PLATE0

MI. <
z W
w
P.- o Z a adou I-b14
coN~ - 4
0 0 a
1 11
It nU
004
00 ~I 00
--
0 zoo
vzO
4w z I.-'It -zo0
8 a 0 2q LI - 2 -N9VG'3 0313idO~ IA (M~ w38 91 NI AlISN30 A" n1
* -~ PLATE 3

r L
-C J
'I S ~ 'J4ja
mt. ma VLJ~
z z
C j zI IL
t , I a: '
U. Sf a 0 Sn -* n c S n 0 Sn I n C0T d d
93HDNI NI NollynNOA3
hii
44
,SS IJ
%0 3c
w usI a...4 I0~ IiIi. t-
2 n 0 In 0 In -0 n 0
0 0
S3I4QNI Mi NOILVnVO43051
PLATE 4

r. w
0 1*1M
it I
W No
Wa 0
w
I Cu
ocI W 2 w
+ I j 0
I. LoI * * 14
SNN 5~nfjo
I AI z
PLT

0 u
Jl II\ _j
w w0
,I, Ix w
aV /I I
0 1 a o' a0 a *c noe 0 o qf nT 0 dl -
7ý11
aL m
Ii IL0 0
w 0
I- I o rz1 I
0 T
SD'N 1 N01111
II ~ ~ A
PLAT 6(

Li Io
v LL
m c C
LI - li wwL L )iz :.O
mz 1. zix Z
p. - 4 i-. -U - I
*~~L10 z co ~ 4 ~ In IC ~z~~~n < 3 .
y ~ 2 2 uz4
14 0 0 . 4
14w I- W1
JJ J114.~ ~ u~ Iao ~ I-3.-Ai
lx4, InI
z - " 0o 0 0w W - I- I- '
o a o* o a a o0 0
I I IJ I
I I - *
44 14.
S3H3N HI NOILiWASoflq
PLATE 7

- mAT I-u MAT I-b MAT I MAT
II
r -
- ITEM I
I ___FAILURE A
o 4 8 12 1 20 24 28 32 36 40 2
ITEM I(AFTER REPLACING I-b AND I-c MAT WITH I-d AND I-ct MAT)
04
I I
-- J2. -2.04 4462 so 60 64IJK276 6
'l I ' -°*----i*~IS•ITEM 2
I I-1-I.0-I
"-3."so 4 as 92 96 100 104 108 I11 116 120 •
ITEM 3I .0
"-2.o°18 22 12$ 130 134 138 i42 14 I ISO 154 158DISTANCE IN FEET
ITEM 4
LEGEND
-- -
16 COVER•AGE•S FENESTRA MARK M1 MAT •128 COVERAGES
•108 COVERA4Es CENTER-LINE PROFILES i-• 27,O00-LB SINGLE-WHEEL LOAD
S~ 012163 m ,
PLATE 8

N
L !, t !),!-•11•' ", • •-•'.... u .•F !•; I•.1 F-•',•I RI • •,.• ,.. • •_.,.,,,.,• ,b,'l --•thiiHtl°:' • i!-- :•' •'• •
--- •,, < •- • : I /} z.•li"l I'- gS-,_..=.1 ,I•:.LI I-F--I !-J- •,jl/I ""
,!_ ,;•'/• •
--- •{
II II a
II |I
\i ....I |1,\il_. 01 iil,[ (• I I \\ •- -=
S•..--•" -'1 I'\I:•1',.._.•.,_,_" " • " =-•1•1
•"1 il/ "ffl
S ilooo•:
.• o • o o .• o. o • o •'--•--o • • o .• o--•,s , r ? , , € " ", , , ? ; T- ? T " " "
..
o,.
PLATE 9
•I

-( w
/ -j
0 a: - io
w CDO.
z0
AA
.a.
o II
2 <
co . Z
od
PLATE 10'

a. 3 4 6 6 7 a 9 to go 30 40TYE /-*O --, f
-/ -FLE.XIBLt.-r,"•",eEf•v7" E$r4N Cimme
20
I•0 - --
30
FENESTRA MARK III MATCBR DESIGN CURVES
27,000-LB SINGLE-WHEEL LOAD400-PSI TIRE PRESSURE
188 COVERAGES0113K
PLATE 11

0
CLj u)
II,-I
z w
! I I.-.
I.CII-1u -
I I,
*202
P E
PLATE.__1_____

01ITANCE IN FEETI 5 7 9 1 , 13 Is 17 19 21 3 S 7 9 '1 13 IS 17 It 21
i l.l-. , I T, I I ! IC"-"r rRArric LAN -r 1'- T MAM' LAW-o.-•-44-1 ... !... i....s---- •- 4 j--: I t -
. | -•-*-' ._ T 7 - j1.9
CEINTEROLN AT rt OF TRAFFIC LANE-
ITEM I -------,---I I5
J ..
c ! -.-- , - ITEM 4
0~ -A
.hi ! . ,.
ACNTE OAT.OFRAFFICLANE I T
ITE 11011.
0.5C
CENTER OF PLANK AT t OF TRAFFIC LANE
-- ITEM 4
41 1b F.1 - I 0.
-.0 0~I-- IC-
JOINT AT CtE OF ATRAFFIC LANEA
i :: -*-- --- I~IE
0 -0.. ,__--- I[~ ill II.• I • , _"
CENTER OF PLANK AT rL OF TRAFFIC LANEITEM 3 "
LEGEND
0 3COVAGES
S.. . 6 OVL•'AGL[S1...... 4zCOVLNGCS BUTLER AMi MAT
. . .140 COV;RAGJ AO COVFRAFC. PERMANENT DEFORMATION
27,000-LB SINGLE-WHEEL LOAD -:
sL T - ----

-L1-
• ;{ ... A ....
z 4 6 a to 12 14 16 Is 20 22 24 26 28 30ITEM I0 S- .
30 32 34 36 38 40 42 44 46 48 s0 62 24 20 8 60
ITEM 2F0
6 62 64 0T O8 70 72 74 76 78 o &82 84 &8a to
ITEM 3
"hi S-0.5 ' " . .'. . . ..
90 92 94 90 28 100 102 104 108 106 110 112 114 116 Il1 120
ITEM 4
122 12 2 2 3 3 3 3 3 4 4 144 146 148 15OI3TANCE IN FEET
ITEM 5
1 C G9 38 C.OVI•qAGES (WITHOjT
£ND-C0•NtCING SARS) •-- a COVCRAGES BUTLER AMM MAT
CENTER-LINE PROFILES27,000-LB SINGLE-WHEEL LOAD
01- .3N
PLATE 14
_so

-+ , + .. = + --. - -- -
N JoOINT ON JOINT
i I J I ! I. .I I I I I IQUARTER POINT QUARTEC POINT
!__ _ 1.,,IC I a Ls
CENTER OF PLANK CENTER OF PLANK
ON JO' ' JOINT
-, , .LT
SQUARTER POINT QUARTER POINT1. _ .10 - -,--•--j0I - , 1iI- i. -__ ._ I l +
CEN'TER OF PLANK 30 20 10 rL 10 20 .,UDISTANCE IN WvC.ES
ITEM 2 CENTER OF PLANK
o _. _ . 1 T ? -,-.-.-ITEM 5 J
.- - -EGEND--ji I i '-0 ------ 0 COVE:RAGES
I i-I 36 COVERAGES (FAILURE WITHOUT- 3 BARS IN END JOINTS)
ON JOINT IO COVERAGES (AFTER RELAYINGMAT WITH BARS IN END JOINTS)
- 105 COVERAGES
QUARTER POINT
-4 BU TELECTAMIOMAT
OISTANCE IN ICMHESCEN'TER OF PLANK 27,00-LB SINGLEWHEEL LOAD
ITEM 3
SPLATE 15

- ~ ~ ~ ~ ~ ~ ~ ~ ~ ~ _ W 2 ' r~~--~-- ~ - -- =--
LrI
WI
I___ ,0 fiLO
to o
- o 0
0
131
400
uii
aC
in
"oa.u
Cal
011111ILPLAT 16

2a to 1 ' ~2 30 40
-AMI MAT IVIH EN-CONNEMWON RODS
AAEI mAT WiTHOuT END-CONNECT/NG ROD
25
nE~IDE-PCEEN DESIGN CURVE SI
PLAI I
-id

TF--7
0
J)W
OJWu)wi
7V~~ CC ___ ____jill-f cc
1~ 0
hii Nr.
040
z0 :..
-. U ' ýV.
oii
moo4l 2-
000
PLATE 13

3 5 $ a 10 20 30 40
.44AMi mAr WITH END-coNvEcT/Af RODS
I _
/~ ~ B DFE IL-A£ENSI£$GN CURVESj
2-
..
BUTLER AMI MAT
CBR DESIGN CURVES _
39,000-LB SINGLE-WHEEL LOAD400-PSI TIRE PRESSURE
1600 PASSES
PLATE 19
...................................--