development of chromatographic and molecular spectroscopic multivariate...
TRANSCRIPT

i
DEVELOPMENT OF CHROMATOGRAPHIC AND
MOLECULAR SPECTROSCOPIC
MULTIVARIATE CHEMOMETRIC MODELS FOR
THE GEOGRAPHICAL CLASSIFICATION OF
OLIVE OILS
A Thesis Submitted to
the Graduate School of Engineering and Sciences of İzmir Institute of Technology
in Partial Fulfillment of the Requirements for the Degree of
MASTER OF SCIENCE
in Chemistry
by
Deniz ÇELİK
September 2013
İZMİR

ii
We approve the thesis of Deniz ÇELİK
Examining Committee Members:
______________________________________
Prof. Dr. Durmuş ÖZDEMİR
Department of Chemistry, İzmir Institute of Technology
______________________________________
Prof. Dr. Şerife Hanım YALÇIN
Department of Chemistry, İzmir Institute of Technology
______________________________________
Assoc. Prof. Dr. Figen KOREL
Department of Food Engineering, İzmir Institute of Technology
26 September 2013
______________________________________
Prof. Dr. Durmuş ÖZDEMİR
Supervisor, Department of Chemistry
İzmir Institute of Technology
______________________________________ _________________________
Prof. Dr. Ahmet E. EROĞLU Prof. Dr. R. Tuğrul SENGER Head of the Department of Chemistry Dean of the Graduate School of
Engineering and Sciences

iii
ACKNOWLEDGEMENTS
I would like to extend my special appreciation to my research advisor, Prof. Dr.
Durmuş ÖZDEMİR for his support, endless patience and guidance through my master
thesis.
Next, I wish to express my thanks to all my friends at IZTECH especially Esra
KUDAY, Duygu VURAL, Murat BAĞCIOĞLU, Müşerref YERSEL, Özlem ECE,
Begüm AKARSU, Suna BÜYÜKKILIÇ, Funda UYGUN, Ayça ZEYBEK, Deniz
BOLEK, İrem KAHRAMAN and all my laboratory mates.
I also wish to express my thanks to Banu BAKSİ, Tuğçe AKKAYA and Yüksel
BABADAĞLI for their emotional supports.
Additionally, my deepest gratitude goes to my family, my mother Nurseli
KAYMALOĞLU, my brother Ufuk ÇELİK for their endless love, understanding,
encouragement, patience and support throughout my entire life. Special thanks to Halit
YAĞAÇ for his all help, support and understanding through my master.
Finally, I would like to thank Dr. Hüseyin ÖZGENER for Fourier Transform
Infrared Spectroscopy (FT-IR) analysis, Assoc. Prof. Dr. Harun DIRAMAN for Gas
Chromatography (GC) and High Performance Liquid Chromatogaphy (HPLC) analyses,
Republic of Turkey Ministry of Food, Agriculture and Livestock and Olive Research
Institute for their financial support.

iv
ABSTRACT
DEVELOPMENT OF CHROMATOGRAPHIC AND MOLECULAR
SPECTROSCOPIC MULTIVARIATE CHEMOMETRIC MODELS
FOR THE GEOGRAPHICAL CLASSIFICATION OF OLIVE OILS
Olive oil is a fat obtained from the olive (the fruit of Olea europaea; family
Oleaceae), a traditional tree crop of the Mediterranean Basin. The oil is produced by
grinding whole olives and extracting the oil by mechanical or chemical means. It is
commonly used in cooking, cosmetics, pharmaceuticals, and soaps and as a fuel for
traditional oil lamps. The classification of olive based on geographical origin is of great
interest since the quality of olive oil depends on its chemical composition and
geographical origin. In this study, it is aimed to develop classification models using
elemental and molecular composition of olive oil samples via chromatographic method
and molecular spectrometry. For this purpose, olive oil samples from diffirent regions
of Turkey (Manisa and Bursa) were collected from producers and they were scanned
with Fourier Transform Infrared spectrometer equiped with attenuated total reflectance
(FTIR-ATR) accesory, and Gas Chromatography (GC), High Performance Liquid
Chromatography (HPLC). Afterwards, any clustering of samples based on their regions
was investigated using principal component analysis (PCA) and hierarchical cluster
analysis (HCA).
In conclusion, although molecular spectrometry is more advantageous for the
classification of olive oil samples in the case of saving time, saving chemicals and ease
of usage, chromatography gave better classification results based on geograpical origin
compared to results obtained with molecular spectrometry.

v
ÖZET
ZEYTİNYAĞLARININ COĞRAFİ SINIFLANDIRILMASI İÇİN
KROMATOGRAFİK VE MOLEKÜLER SPEKTROSKOPİK ÇOK
DEĞİŞKENLİ KEMOMETRİK MODELLERİN GELİŞTİRİLMESİ
Zeytinyağı, Akdeniz Havzasına ait geleneksel zeytin ağaçlarından elde edilen bir
yağdır. Yağ, bütün zeytinin öğütülmesi ve mekanik ya da kimyasal vasıtalarla yağı
çıkarılması sureti ile üretilir. Genellikle yemek, kozmetik, ilaç, sabun ve geleneksel yağ
lambaları için yakıt olarak kullanılır. Zeytinyağlarının kalitesi, içeriği ve yetiştirildiği
bölgeye bağlı olmasından dolayı, sınıflandırılmaları büyük önem taşımaktadır. Bu
çalışmada, kromatografik ve moleküler spektroskopik verilere kemometrik analiz
yöntemleri uygulayarak sınıflandırma modellerinin kurulması amaçlanmıştır. Bu
amaçla, Türkiye’nin farklı yörelerinden (Manisa ve Bursa) zeytinyağı örnekleri
toplanmış ve toplanan örnekler Fourier Transform Infrared spektroskopisinde
zayıflatılmış toplam reflektans aparatı (FTIR-ATR) ve Gaz Kromatogafisi (GC) ayrıca
Yüksek Performanslı Sıvı Kromatogafisi (HPLC) ile taranmıştır. Sonrasında, bölgelere
göre kümelenme olup olmayacağını araştırmak için yönlendirmesiz sınıflandırma
(unsupervised classification) metotlarından temel bileşenler analizi (principal
component analysis, PCA) ve hiyerarşik kümeleme analizi (hierarchical cluster analysis,
HCA) uygulanmıştır.
Sonuç olarak, moleküler spektrometrinin analiz için harcanan süre, kimyasal
madde kullanımı ve kullanım kolaylığı açısından daha avantajlı olmasına rağmen
zeytinyağlarının coğrafi bölgelere göre sınıflandırılmasında kromatografik verilerin
moleküler spektrometri verilerine göre daha başarılı olduğu belirlenmiştir.

vi
TABLE OF CONTENTS
LIST OF FIGURES ....................................................................................................... viii
LIST OF TABLES .......................................................................................................... xii
CHAPTER 1. INTRODUCTION ................................................................................... 1
CHAPTER 2. OLIVE OIL ............................................................................................. 3
2.1. Composition of Olive Oil ..................................................................... 3
2.2. Olive Oil Processing ............................................................................. 6
2.2.1. Washing and Leaf Removal ........................................................... 6
2.2.2. Milling ............................................................................................ 7
2.2.2.1. Stone Mills ............................................................................ 7
2.2.2.2. Hammer Mills ....................................................................... 8
2.2.3. Mixing of the Olive Paste (Malaxation) ......................................... 9
2.2.3.1. Malaxing Time ...................................................................... 9
2.2.3.2. Heating .................................................................................. 9
2.2.3.3. Using Inert Gases .................................................................. 9
2.2.3.4. Adding Water ........................................................................ 9
2.2.4. Oil Extraction From the Paste ...................................................... 10
2.2.4.1. Lever or Screw Olive Presses ............................................. 10
2.2.4.2. Hydraulic Olive Press ......................................................... 10
2.2.4.3. Centrifugal Decanters (Three Phase) .................................. 11
2.2.4.4. Advanced Dual Phase-Triple Phase Centrifuge .................. 12
2.2.4.5. Percolation-Sinolea ............................................................. 12
2.2.5. Processing Waste .......................................................................... 13
2.2.5.1. Separation by Gravity ......................................................... 13
2.2.5.2. Centrifugal Olive Oil Separator .......................................... 13
2.3. Definitions of Olive Oil ...................................................................... 14
2.4. Factors Affecting Olive Oil Composition .......................................... 15
2.5. The Rule of Olive Oil in Human Health............................................. 18

vii
CHAPTER 3. MULTIVARIATE STATISTICAL ANALYSIS .................................. 21
3.1. Unsupervised Methods ....................................................................... 23
3.1.1. Principal Component Analysis (PCA) ......................................... 23
3.1.2. Hierarchical Cluster Analysis (HCA) .......................................... 27
3.2. Supervised Methods ........................................................................... 30
CHAPTER 4. EXPERIMENTAL ................................................................................ 31
4.1. Materials ............................................................................................. 31
4.1.1. Olive Oil Samples ........................................................................ 31
4.1.2. Chemicals ..................................................................................... 33
4.2. Instruments and Methods ................................................................... 33
4.2.1. Fourier Transform Infrared (FTIR) Spectrometry ....................... 33
4.2.1.1. Measurements Using Fourier Transform Infrared -
Attenuated Total Reflectanes (FTIR-ATR) ....................... 35
4.2.2. Gas Chromatography (GC) .......................................................... 36
4.2.2.1. Measurements Using Gas Chromatography (GC) .............. 37
4.2.3. High Performance Liquid Chromatography (HPLC) ................... 38
4.2.3.1. Measurements Using High Performance Liquid
Chromatography (HPLC) ................................................... 39
4.3. Statistical Classification Studies ......................................................... 40
CHAPTER 5. RESULT AND DISCUSSION .............................................................. 41
5.1. Classification Studies in 2009-2010 Harvest Year ............................. 41
5.1.1. FTIR-ATR Results ....................................................................... 46
5.1.2. GC Results .................................................................................... 54
5.1.3. HPLC Results ............................................................................... 70
5.2. Classification Studies in 2010-2011 Harvest Year ............................. 85
5.2.1. FTIR-ATR Results ....................................................................... 87
5.2.2. GC Results .................................................................................... 91
5.2.3. HPLC Results ............................................................................... 99
CHAPTER 6. CONCLUSION ................................................................................... 107
REFERENCES ............................................................................................................. 108

viii
LIST OF FIGURES
Figure Page
Figure 2.1. Various types and forms of edible oil fatty acids ........................................ 4
Figure 2.2. Triacylglycerol (oil) molecule with three different fatty acids attached ..... 4
Figure 2.3. Stone mill ..................................................................................................... 8
Figure 2.4. Hammer mill ................................................................................................ 8
Figure 3.1. Principal Component Analysis (PCA) ....................................................... 25
Figure 3.2. Simple example illustrating the protocol for cluster analysis. (a) Data
set consisting of four objects, each characterized by two characters,
(b) Objects plotted in character space, (c) Similarity matrix showing
dissimilarity between objects, (d) and (e) Derived similarity matrices
used in successive steps of the clustering process (f) Dendrogram. .......... 29
Figure 4.1. Types of molecular vibrations. + indicates motion from the page
toward the reader; - indicates the motion away from the reader. .............. 34
Figure 4.2. Optical diagram of Foruier Transform Infrared (FTIR) Spectrometer ...... 34
Figure 4.3. Attenuated total reflectance (ATR) cell used in infrared spectroscopy..... 35
Figure 4.4. Schematic representation of a system for gas chromatography (GC) ....... 36
Figure 4.5. Schematic representation of a system for high performance liquid
chromatography (HPLC) .......................................................................... 38
Figure 5.1. The FTIR-ATR spectra of olive oil samples. ............................................ 46
Figure 5.2. Score plot of the first component versus the second component for
olive oil samples from Manisa (Akhisar) and Bursa using FTIR
spectra. ....................................................................................................... 48
Figure 5.3. Dendrogram for olive oil samples from Manisa (Akhisar) and Bursa
using FTIR spectra. ................................................................................... 51
Figure 5.4. Score plot of the first component versus the second component for
olive oil samples from Manisa (Salihli-Saruhanlı) and Bursa using
FTIR spectra .............................................................................................. 52
Figure 5.5. Dendrogram for olive oil samples from Manisa (Salihli-Saruhanlı)
and Bursa using FTIR spectra ................................................................... 53
Figure 5.6. The GC chromatogram of olive oil samples. ............................................. 54

ix
Figure 5.7. Score plot of the first component versus the second component for
olive oil samples from Manisa (Akhisar) and Bursa using GC
chromatogram. ........................................................................................... 55
Figure 5.8. Loading plot of the first component versus the second component for
olive oil samples from Manisa (Akhisar) and Bursa using GC
chromatogram. ........................................................................................... 58
Figure 5.9. Biplot plot of the first component versus the second component for
olive oil samples from Manisa (Akhisar) and Bursa using GC
chromatogram. ........................................................................................... 59
Figure 5.10. Dendrogram for olive oil samples from Manisa (Akhisar) and Bursa
using GC chromatogram and raw data ...................................................... 60
Figure 5.11. Dendrogram for olive oil samples from Manisa (Akhisar) and Bursa
using GC chromatogram and 7 PCs .......................................................... 61
Figure 5.12. Dendrogram for variables (Fatty Acid Methyl Ester). .............................. 62
Figure 5.13. Score plot of the first component versus the second component for
olive oil samples from Manisa (Salihli-Saruhanlı) and Bursa using
GC chromatogram. .................................................................................... 64
Figure 5.14. Loading plot of the first component versus the second component
for olive olive oil samples from Manisa (Salihli-Saruhanlı) and
Bursa using GC chromatogram. ................................................................ 65
Figure 5.15. Biplot plot of the first component versus the second component for
olive olive oil samples from Manisa (Salihli-Saruhanlı) and Bursa
using GC chromatogram. ........................................................................... 66
Figure 5.16. Dendrogram for olive oil samples from Manisa (Salihli-Saruhanlı)
and Bursa using GC chromatogram and raw data ..................................... 67
Figure 5.17. Dendrogram for olive oil samples from Manisa (Salihli-Saruhanlı)
and Bursa using GC chromatogram and 7 PCs ......................................... 68
Figure 5.18. Dendrogram for variables (Fatty Acid Methyl Ester). .............................. 69
Figure 5.19. The HPLC chromatogram of olive oil samples. ........................................ 70
Figure 5.20. Score plot of the first component versus the second component for
olive oil samples from Manisa (Akhisar) and Bursa using HPLC
chromatogram. ........................................................................................... 71

x
Figure 5.21. Loading plot of the first component versus the second component for
olive oil samples from Manisa (Akhisar) and Bursa using HPLC
chromatogram ............................................................................................ 73
Figure 5.22. Biplot plot of the first component versus the second component for
olive oil samples from Manisa (Akhisar) and Bursa using HPLC
chromatogram ............................................................................................ 74
Figure 5.23. Dendrogram for olive oil samples from Manisa (Akhisar) and Bursa
using HPLC chromatogram and raw data.................................................. 75
Figure 5.24. Dendrogram for olive oil samples from Manisa (Akhisar) and Bursa
using HPLC chromatogram and 8 PCs ...................................................... 76
Figure 5.25. Dendrogram for variables (Triacylglycerol).............................................. 77
Figure 5.26. Score plot of the first component versus the second component for
olive oil samples from Manisa (Salihli-Saruhanlı) and Bursa using
HPLC chromatogram. ................................................................................ 79
Figure 5.27. Loading plot of the first component versus the second component
for olive olive oil samples from Manisa (Salihli-Saruhanlı) and
Bursa using HPLC chromatogram. ............................................................ 80
Figure 5.28. Biplot plot of the first component versus the second component for
olive olive oil samples from Manisa (Salihli-Saruhanlı) and Bursa
using HPLC chromatogram. ...................................................................... 81
Figure 5.29. Dendrogram for olive oil samples from Manisa (Salihli-Saruhanlı)
and Bursa using HPLC chromatogram and raw data ................................ 82
Figure 5.30. Dendrogram for olive oil samples from Manisa (Salihli-Saruhanlı)
and Bursa using HPLC chromatogram and 7 PCs ..................................... 83
Figure 5.31. Dendrogram for variables (Triacylglycerol).............................................. 84
Figure 5.32. Score plot of the first component versus the second component for
olive oil samples from Manisa (Akhisar-Salihli-Saruhanlı) and Bursa
using FTIR spectra .................................................................................... 89
Figure 5.33. Dendrogram for olive oil samples from Manisa (Akhisar-Salihli-
Saruhanlı) and Bursa using FTIR spectra .................................................. 90
Figure 5.34. Score plot of the first component versus the second component for
olive oil samples from Manisa (Akhisar-Salihli-Saruhanlı) and Bursa
using GC chromatogram. ........................................................................... 93
xi
Figure 5.35. Loading plot of the first component versus the second component
for olive olive oil samples from Manisa (Akhisar-Salihli-Saruhanlı)
and Bursa using GC chromatogram........................................................... 94
Figure 5.36. Biplot plot of the first component versus the second component for
olive olive oil samples from Manisa (Akhisar-Salihli-Saruhanlı) and
Bursa using GC chromatogram. ................................................................ 95
Figure 5.37. Dendrogram for olive oil samples from Manisa (Akhisar-Salihli-
Saruhanlı) and Bursa using GC chromatogram and raw data ................... 96
Figure 5.38. Dendrogram for olive oil samples from Manisa (Akhisar-Salihli-
Saruhanlı) and Bursa using GC chromatogram and 7 PCs ........................ 97
Figure 5.39. Dendrogram for variables (Fatty Acid Methyl Ester). .............................. 98
Figure 5.40. Score plot of the first component versus the second component for
olive oil samples from Manisa (Akhisar-Salihli-Saruhanlı) and Bursa
using HPLC chromatogram. .................................................................... 101
Figure 5.41. Loading plot of the first component versus the second component
for olive olive oil samples from Manisa (Akhisar-Salihli-Saruhanlı)
and Bursa using HPLC chromatogram. ................................................... 102
Figure 5.42. Biplot plot of the first component versus the second component for
olive olive oil samples from Manisa (Akhisar-Salihli-Saruhanlı) and
Bursa using HPLC chromatogram. .......................................................... 103
Figure 5.43. Dendrogram for olive oil samples from Manisa (Akhisar-Salihli-
Saruhanlı) and Bursa using HPLC chromatogram and raw data ............. 104
Figure 5.44. Dendrogram for olive oil samples from Manisa (Akhisar-Salihli-
Saruhanlı) and Bursa using HPLC chromatogram and 7 PCs ................. 105
Figure 5.45. Dendrogram for variables (Triacylglycerol)............................................ 106

xii
LIST OF TABLES
Table Page
Table 2.1. Allowable fatty acid ranges for extra virgin olive oil. ................................. 5
Table 4.1. Samples ...................................................................................................... 31
Table 4.2. Chromatographic method for the analysis of fatty acid methyl esters ...... 37
Table 4.3. Chromatographic method for the analysis of triacylglycerol .................... 39
Table 5.1. Coded Samples (Akhisar and Bursa) ......................................................... 41
Table 5.2. Coded Samples (Salihli-Saruhanlı and Bursa) .......................................... 44
Table 5.3. Coded Samples (Manisa and Bursa) .......................................................... 85

1
CHAPTER 1
INTRODUCTION
Olive oil’s recent popularity could be attributed to its sensorial characteristics as
well as its potential health benefits. These benefits have been related to its wellbalanced
fatty acid composition, where oleic acid is the main component, and to the presence of
minor biomolecules, such as vitamins and natural antioxidants (Matos, et al. 2007).
Olive oil constitutes various chemical components including triacylglycerols,
free fatty acids, phosphotides as the major components and also minor components such
as phenolic compounds, hydrocarbons etc. With increasing consumer demand for high
quality olive oil, oil produced from olives of just one variety (monovarietal) or one
geographical region have been appeared on the market. Therefore, it has become
important to characterize each monovarietal olive oil by its chemical and sensorial
properties. Chemical composition of olive oils might also differ due to influence of
geographical, argonomic and technological factors (Aparicio and Luna, 2002).
Differences in composition depending on geographic orjin or variety are the basis of the
legislations such as Protected Denomination of Origin (PDO) and Protected
Geographical Indication (PGI). PDO and PGI certifications allow labelling of food
products with growing areas and provide extra economical benefits for products of
designated areas. Consequently, there is a need to develop reliable analytical methods
for geographical and varietal classification and adulteration determination of olive oils
(Ulberth and Buchgraber, 2000; Babcook and Clemens, 2004).
To characterize each olive oil variety few series of chemical compounds or a
univariate statistics is not adequate. Instead multivariate analysis techniques should be
applied to a number of variables (chemical compounds and/or sensory descriptions).
The multivariate data analysis enables the extraction of meaningful information from
the large amount of data such as chemical and sensorial properties of olive oil (Aparicio
and Luna, 2002). Multivariate data analysis can be used for both classification and
regression issues. It is common to employ principal component analysis (PCA) which
shows the relation between observations to classify olive oil with respect to variety or
geographical origin.

2
Chromatographic methods have been generally prefered in classification and
adulteration studies. Although chromatographic methods supply high dgree of precision,
there is an increasing demand for rapid, inexpensive and effective techniques for
determination of authenticity of olive oils. Infrared spectroscopy combined with
chemometric techniques is one of the promising rapid methods (Downey, 1998). FT-IR
(frourier transform infrared spectroscopy) is a quite suitable analysis tool for oil and fat
analysis because it could be applied directly to samples without any chemical treatment
(Bendini, et al. 2007). High number of data generated as a result of IR measurements
makes it necessary to use multivariate data analysis tools. Therefore, FT-IR
spectroscopy combined with principal component analysis (PCA) could be performed
for varietal and geographical characterization.
The purpose of this study is to develop new chemometric methods for the
classification of olive oils, which are come from different regions of Turkey (Manisa
and Bursa), according to variety, geographical origin and harvest year using three
different data sets (1) fatty acid profile obtained from gas chromatography (GC)
analysis, (2) triacylglycerol profile obtained from high performance liquid
chromatography (HPLC) analysis and (3) spectral data obtained from fourier transform
infrared spectroscopy (FT-IR) analysis. Discrimination ability of these three methods
was also compared and discussed.

3
CHAPTER 2
OLIVE OIL
2.1. Composition of Olive Oil
Olive oil contains triacylglycerols and small quantities of free fatty acids,
glycerol, pigments, aroma compounds, sterols, tocopherols, phenols, unidentified
resinous components and others ( Kiritsakis, et al. 1998). Among these constituents the
unsaponifiable fraction which covers a small percentage (0,5-15%) plays a significant
role on human health.
Fatty Acids; the most important components in olive oil are the fatty acids. Fatty
acids are simple structures made up of long chains of various numbers of carbon atoms.
There are only a few types of fatty acids in olive oil, but the proportions of each
strongly influence the characteristics and nutritive value of olive oil.
The majority of olive oil fatty acid chains contain 16 or 18 carbon atoms. The
carbon chains of all fatty acids have a carboxly group (COOH) at one end.
Edible oil fatty acids can have between 12 and 24 carbons. Nearly all of the fatty
acids have an even number of carbons. Olive oil contains a small proportion of fatty
acids with 17 carbons.
Although fatty acids are relatively similar in structure, there are some variations
that have a strong influence on their properties. The number of carbon atoms will
determine if they are;
volatile – such as butyric acid, C4
solid at room temperature – such as palmitic acid, C16
liquid at room temperature – such as oleic acid, C18
Fatty acids can also be “saturated” or “unsaturated”.
A saturated fatty acid has all of the carbon atoms attached by single bonds.
A monounsaturated fatty acid has one double bond joining two of the carbon
atoms.
A polyunsaturated fatty acid has two or more double bonds, each joining two
carbon atoms.

4
The number of double bonds is defined by the abbreviation, for example
“C18:1” denotes 18 carbons and one double bond.
The fatty acids can be bent (cis form) or straight (trans form) (Figure 2.1).
Figure 2.1. Various types and forms of edible oil fatty acids.
(Source: Primefacts, August 2006)
Triacylglycerols; olive oil is composed mainly of triacylglycerols. In a unit (or
molecule) of olive oil, the fatty acids are bound in groups of three together with a unit
of glycerol. These units are called triacylglycerol molceculse or TAGs (Figure 2.2).
Figure 2.2. Triacylglycerol (oil) molecule with three different fatty acids attached.
(Source: Primefacts, August 2006)
Only when the fatty acids are bound in these small units are they considered to
be good quality oil. A triacylglycerol unit may lose one fatty acid to become a

5
diacylglycerol or if it loses two fatty acids it is a monoacylglycerol. The fatty acid
which is lost form the triacylglycerol is then called a “free fatty acid”.
The glycerol unit can have any three of several fatty acids attached to form
TAGs. The carbon chains may be different lengths and they may be saturated,
monounsaturated or polyunsaturated. It is the relative proportion of these that make one
oil different from another.
About 95-98% of olive oil consists of TAGs. The remainder of the oil, although
only a small part in proportion to TAGs, includes a very large number of minor
compounds, including the phenolic and the sterols. These compounds give olive oil its
unique flavour and contribute greatly to the nutritional benefits.
Oleic Acid; olive oil contains a high percentage of the monounsaturated oleic
acid. Thus, it is a natural monounsaturated oil. This particular fatty acid reduces low-
density lipoprotein (LDL-cholesterol), which is responsible for the formation of the
atherosclerotic plaque, and increase the high- density lipoprotein (HDL- cholesterol).
Table 2.1. Allowable fatty acid ranges for extra virgin olive oil.
Fatty Acid Carbon
Number
Allowable
Range %
(1) Palmitic C16:0 7.5-20.0
(2) Palmitoleic C16:1 0.3-3.5
(3) Stearic C18:0 0.5-5.0
(4) Oleic C18:1 55.0-83.0
(5) Linoleic C18:2 3.5-21.0
(6) Linolenic C18:3 <1.0
(7) Arachidic C20:0 <0.6
(8) Gadoleic C20:1 <0.4
Tocopherols; olive oil contains the tocopherols -, -, -, - (- tocopherol
covers almost 88%). The tocopherol content of olive oil depends not only on the
presence of these compounds in olive fruit but also on several other factors, involved in
the transportation, sorage and olive fruit processing. According to Viola et al. (1997),

6
the ratio of vitamin-E to polyunsaturated fatty acids in olive oils is better than in other
edible oils.
Pigments; the colour of olive oil is mainly related to the presence of chlorophyll
and pheophytin. Carotenoids are also responsible for the colour of olive oil. The
presence of these constituents depend on several factors, such as cultivar, soil and
climate, and fruit maturation as well as applied conditions during olive oil processing.
Phenolic Compounds; olive fruit contains simple and complex phenolic
compounds. Most of these compounds pass into the oil, increase its oxidative stability
and improve the taste. Hydrohtyrosol, tyrosol and some phenolic acids are mainly found
in olive oil (Kiritsakis, et al. 1998). The phenol content and the specific composition of
these phenols in olive oil depend on the altitude where olive trees are grown, on the
harvesting time and on the processing conditions (Cinquanta, et al. 1997; Kiritsakis, et
al. 1998).
Aroma Components; aroma and the taste of olive oil are its main sensory
characteristics. These characteristics are attributed to a group of aroma compounds.
Their formation occurs in olive fruit, via a series of enzymatic reactions (Kiritsakis, et
al. 1998).
2.2. Olive Oil Processing
Virgin olive oil quality depends on different factors such as olive cultivar, olive
tree cultivation and the operations of olive picking, storage and processing. Olive oil
takes on odors and flavors readily. Fruit should be classified and separated by quality.
Fruit with defects should be processed separately from good fruit, because a very small
portion of bad fruit producing defective oil can ruin a large quantity of good oil (Di
Giovacchino, et al. 2002).
2.2.1. Washing and Leaf Removal
The purpose of preliminary washing is to remove any foreign material that coıld
damage machinery or contaminate the oil. Only olives that have been harvested from
the soil or require removal of copper, sprays, etc. need to be washed. If olives are

7
crushed in a hammermills, the extra moisture from the wash water can cause
extractability problems because an emulsion forms between the oil and water.
Polyphenol content is lower in washed olives; there can be as high as a 49% loss
in oil stability. Oil sensory ratings for washed olives is usually affected negatively and
washed olives generally have a lower bitterness rating, and a less fruity flavor. Wash
water is often dirty and has a good chance of passing flavors into the oil.
It is important that no fruit remains stuck in the bins and hoppers at the processing
plant as it can ferment and ruin the oil. Olives should be stored for as short a period as
possible and at cool temperatures (4.5-7.5 oC). Temperatures above 10
oC can cause
problems. Wet fruit is also much more likely to ferment than dry fruit.
Small quantities of leaves are not detrimental to the oil and sometimes leaves are
added to produce a chlorophyll (green) colour and flavour in the oil.
2.2.2. Milling
Olive fruit is made up approximately 1/3 water, and 1/3 oil. The objective of the
first true step of olive oil production, crushing the olives, is to produce a paste with
easily extracted oil droplets. Two types of machines are used to crush olives: stone mills
and stainless steel hammermills. Each has advantages (Di Giovacchino, et al. 2002).
2.2.2.1. Stone Mills
Stone crushers consist of a stone base and upright millstones enclosed in a metal
basin, often with scrapers and paddles to guide the fruit under the stones and to circulate
and expel the paste. The slow movement of the stone crushers does not heat the paste
and result in less emulsification so the oil is easier to extract without as much mixing.
The major disadvantages of this method are bulky machinery and its slowness, its
high cost, and its inability to be continuously operated. The stones are also more
difficult to clean, and the slow milling time can increase oxygen exprosure and paste
fermentation. Stone mills, because of their inefficiency, have been replaced by hammer
mills in most large operations (Di Giovacchino, et al. 2002).

8
Figure 2.3. Stone mill
(Source: Klazomenai; Urla, 2010)
2.2.2.2. Hammer Mills
It consists of a metal body that rotates at high speed, hurling the olives against a
metal grate. The major advantage of metal crusher is their speed and continuous
operation, which translate into high output, compact size, and low cost. Their major
disadvantage is the type of paste produced. The oil is more emulsified, requiring a
longere mixing period to achieve a good oil extraction and the speed of metal crushing
can produce elevated temperatures and possible metal contamination. Both factors
reduce oil quality (Di Giovacchino, et al. 2002).
Figure 2.4. Hammer mill
(Source: Olive Oil Source, 2013)

9
2.2.3. Mixing of the Olive Paste (Malaxation)
Malaxation prepares the paste for separation of the oil from the pomace. This
step is particularly important if the paste was produced in a hammermill. The mixing
process optimizes the amount of oil extracted through the formation of larger oil
droplets and a reduction of the oil-water emulsion (Aparicio and Harwood, 2000).
2.2.3.1. Malaxing Time
A longer malaxing time increases the oil yield and helps the oil pick up minor
components of the oil that can improve flavour. But a longer malaxing time allows
oxidation that decreases shelf life; the oil has a higher acidity and peroxide level
(Aparicio and Harwood, 2000).
2.2.3.2. Heating
Heating the olive paste will decrease viscosity and improve the separation of oil
and water. This increases the yield. Heating speeds oxidation and enzymatic breakdown
of the paste, however, resulting in a lower quality product with higher acidity and
peroxides. The oil has a shorter shelf life (Aparicio and Harwood, 2000).
2.2.3.3. Using Inert Gases
To discourage oxidation, mixing tanks system can be ordered with covers that
contain an inert gas such as carbon dioxide or nitrogen, allowing increased yield and
flavour without the danger of oxidation. Mixing chambers kept under a vacuum will
accomplish the same purpose, but cannot remove as much oxygen as an inert gas
blanket.
2.2.3.4. Adding Water
Water can also be added to facilitate the oil extraction but also results in lower
quality oil with higher acidity and lower polyphenol level, hence a shorter shelf life.

10
2.2.4. Oil Extraction From the Paste
The next step is exracting the oil from the paste and fruit water (water of
vegetation). The oil can be extracted by pressing, centrifugation, percolation, or through
combinations of the different methods.
2.2.4.1. Lever or Screw Olive Presses
Historically, olive paste was put on round mats or in burlap bags, stacked, and
squeezed with a long lever weighted with stones, or via a twisting screw. These presses
were bulky and inefficient, since the pressure was low and the process discontinuous. In
addition, the mats or bags were nearly impossible to clean.
Because it was not possible to extract all the oil in the “first press”, hot water
was added to the pomace to help release additional oil, and a second press (or several)
was done, hence the terms “ first press” and “cold press”, which are now pretty much
obsolete, even though still widely used improperly for marketing reasons.
2.2.4.2. Hydraulic Olive Press
This is somewhat similar to a hydraulic car jack; a piston squeezes the paste that
has been applied to stacks of disk-like filters. This method has some advantages and
disadvantages.
Adavatages;
Requires a limited invesment.
It is simple and reliable machinery.
The energy consumption is low.
The resulting pomace has a low moisture content.
It tolerates rocks and sand without wear.
No water has to be added and there is minimal vegetable water disposal.
Disadvantages;
It is very labor intensive.
Decomposition of materials left on mats, if not properly cleaned and stored,
can produce chemicals responsible for winey and fusty defects.

11
It is a discontinuous process.
An additional step is needed to separate the oil from the vegetable water.
There is more exposure to oxygen resulting in more oxidation and a higher
level of peroxides.
2.2.4.3. Centrifugal Decanters (Three-Phase)
These days, modern facilities all use a centrifuge-based system of extraction,
also referred to as horizontal decanters. The traditional centrifuges (stiil commonly
used) are three-phase; they spin the olive paste in a horizontal drum, the heavier flesh
and pits go to the outside and the water and oil are tapped off separately from the center.
Adavntages;
The machinery is compact- one decanter can take the place of several
presses.
They are semi-continuous and automated.
The amount of labor required is limited.
There is no need for an oil/water separation step.
Disadvantages;
They are expensive.
More technical labor is required.
They may consume hot water.
The enegy consuption is high.
The pomace may end up moist.
As water has to be added to the process, a greater amount of vegetable water
has to be disposed of.
There is a lost of polyphenols due to the added water.

12
2.2.4.4. Advanced Dual Phase, Triple Phase Centrifuge
These are similar to the centrifugal decanter, but some of the vegetable water is
recycled to extarct more from the pomace. The water, oil, and pomace are
simultaneously removed in a single step.
Advantages;
They have highest percentage of oil extraction.
In three-phase systems, the pomace is dry and readily usable. (ın dual phase
systems, the pomace and vegetable water are extracted together.)
There is no need for an oil/water separation step.
Less or no water needs to be added.
The oil has more polyphenols and a longer shelf life.
The vegetable water disposal is less of a problem.
Olive oil from two-phase centrifugation systems contains more phenols,
tocopherols, trans-2-hexenal and total aroma compounds and is more
resistant to oxidation than oil from three-phase ones and from hydraulic
presses.
Disadvantages;
They are expensive.
More technical labor required.
The energy consumption is high.
They are subject to wear from rocks, sand, and grit.
The oil has more polyphenols so will be bitterer.
2.2.4.5. Percolation – Sinolea
Rows of metal discs or plates are dipped into the paste; the oil preferentially
wets and sticks to the metal and is removed with scrapers in a continuous process. This
is not very commonly used and sale of future machiners is currently outlawed in the
European Union due to the difficulty of cleaning such large surface areas.
Advantages;
The polyphenol content of the oil is higher.
It is low temperature method.

13
It is automated.
The labor requirement to operate the machine is low.
There is no need for an oil/water separation step.
The energy consumption is low.
Disadvantages;
It must be combined with one of the above methods to maximize oil
extraction; this, of course, requires more space, labor, and expense.
The large surface area can lead to rapid oxidation.
2.2.5. Processing Waste
This is the final step. Depending on what equipment was used in the extarction
process, this may be unnecessary. When a hydraulic press is used and the liquid output
is a mix of oil and water, with microscopic bits of olives, this final separation of oil
from water is obviously required. In the case of separation with a centrifuge, when the
product is almost completely oil, this step can still be beneficial (especially in the case
of very ripe, overwatered olives when the oil has not separated perfectly in the first
centrifugation), but it is not always an absolute necessity.
2.2.5.1. Separation by Gravity
The oil and water are put into tanks where they separate by gravity. This method
is not used in any modern facility. It is inexpensive from an equipment point of view but
very time consuming, bulky, and leads to wasted oil if the separation is incomplete. It
can also lead to a deterioration of the oil.
2.2.5.2. Centrifugal Olive Oil Separator
Like a cream separator ina dairy, the liquid is spun, separating the heavier water
from the oil. Vertical centrifuges with perforated conical discs can act as either:
Purifier; they take a little water out from mostly oil. This is the most
common case.

14
Skimmer; they take a little oil from a lot of water (if the goal is to scavenge
the waste water).
Clarifier; removes a little solid from a liquid phase (removes microscopic
partides from the oil).
Advantages;
It is a quick step.
The process is continuous.
It is very efficient and results in higher yield than gravity separation.
Disadvantages;
They are expensive.
They are energy intensive.
They can be complicated to operate and difficult to clean, although the
newer Pieralisi decanters with their self-flushing systems, are much easier to
use than other equipment.
2.3. Definitions of Olive Oil
There are two main categories; olive oils (including virgin olive oil, refined
olive oil, and olive oil), all obtained directly from the olive fruit without the use of
solvents or re-esterification. Olive-pomace oils, obtained by treating olive pomace (the
ground olive flesh and pits left after oil extraction) with solvents or other physical
treatments (excluding re-esterification processes).
Extra Virgin Olive Oil: Extra virgin olive oil which has a free acidity, expressed
as oleic acid, of no more than 0.8 gram per 100 gram (0.8%) and this is the highest
quality of olive oil (IOOC 2012).
Virgin Olive Oil: Virgin olive oil which has a free acidity, expressed as oleic
acid, of not more than 2 gram per 100 gram (0.2%) and their quality is lower than extra
virgin olive oils (IOOC 2012).
Ordinary Virgin Olive Oil: Ordinary virgin olive oil which has a free acidity,
expressed as oleic acid, of not more than 3.3 gram per 100 gram (3.3%) (IOOC 2012).
Lampante Virgin Olive Oil: Lampante virgin olive oil which has a free acidity,
expressed as oleic acid, of more than 3.3 gram per 100 gram (3.3%) and it is not
suitable for consumption (IOOC 2012).

15
Riviera Olive Oil: The oil that is obtained by mixing refined olive oil with virgin
olive oil that can directly be consumed as a food. It has a free acidity, expressed as oleic
acid, of no more than 1.0 gram per 100 gram (1%) (IOOC 2012).
Refined Olive Oil: Refined olive oil is the olive oil obtained from virgin olive
oils by refining methods that do not lead to alterations in the initial glyceridic structure.
It has a free acidity, expressed as oleic acid, of no more than 3.0 gram per 100 gram
(0.3%) (IOOC 2012).
Olive oil: Olive oil is the oil consisting of a blend of refined olive oil and virgin
olive oil fit for consumption as they are. It has a free acidity, expressed as oleic acid, of
not more than 1 gram per 100 gram (1%) (IOOC 2012).
Refined Pomace Oil: Oil that is obtained by refining methods not causing any
change in triglyceride structure of raw pomace oil. Refined pomace oil can be marketed
directly or by mixing with virgin olive oil. It has a free acidity, expressed as oleic acid,
of not more than 0.3 gram per 100 gram (0.3%) (IOOC 2012).
Olive Pomace Oil: The oil that is obtained by mixing refined pomace oil and
virgin olive oil can be consumed directly as a food. It has a free acidity, expressed as
oleic acid, of not more than 1 gram per 100 gram (1%) (IOCC 2012).
2.4. Factors Affecting Olive Oil Composition
Influence of Pedoclimatic Conditions; Climate has a great influence on the
ripeness and hence, on the chemical composition of vegetable oils. Cultivars do not
always grow at the same altitude, but olive grove zones are disseminated over a wide
range of altitudes where climatic conditions (rainfall, temperature, humidity) obviously
can be quiet different. Consequently, this has an impact on chemical and sensory
profiles. Author reported that in the case of the varieties Frantoio, Leccino, Moraiolo
and Coratina the amount of total polyphenols in oils produced in the coastal zones
(altitude <100 ml) of Tuscany is double that of oils produced in the inland (Cimato,
1991). Other authors found that virgin olive oils of fruits collected from low altitude
have higher amounts of sterols (Aparicio, et al. 1991), polyphenols and tocopherols
(Moussa, et al. 1996), but lower contents of chlorophylls and unsaturated fatty acid
(Moussa, et al. 1996 ; Ferreiro, et al. 1992).

16
It is well known that the percentage of unsaturated fatty acids in olive oil
increases with decreasing temperature or increasing altitude (Osman, et al. 1994). In
consequence, olive oils from high altitude should have theorically a lower stability than
those from low altitudes because of their ratio of polyunsaturated to saturated fatty
acids. The oxidative stability, however, is also due to the content of -tocopherol and
polyphenolic compounds that are considered the most important antioxidants
traditionally (Blekas, et al. 1995 ; Papadopoulos, et al. 1991). Thus, the hypothetical
lower stability of the olive oils produced in the mountains can also be due to their lower
content of total polyphenols (Mousa, et al. 1998).
Virgin olive oils obtained from monovarietal olive groves at the high altitudes
are, in general, more sweet and have an herbaceous fragance compared to their
corresponding oils from lower elevations. Recent studies have established that the
production of hexanol increases when the temperature decreases (Aparicio, et al. 2000).
Apart from altitude and temperature, other climatic variables and the soils of
olive grove zones influence the chemical composition of virgin olive oil. The influence
of rainfall on the synthesis of oil was studied by authors and they found that the
amounts of sterols, squalene, oleic acid and of some triacylglycerols were explained by
the autumn temperatures, the relative humidity of the summer months and the rainfall of
the whole year (Angerosa, et al. 1996).
Influence of Agronomical Conditions; Until recently the olive tree was a crop of
dry regions since traditional agricultural practices did not involve irrigation. The price
increase for olive oil and recent droughts in the Mediterranean basin have increased
irrigated olive groves whose numbers have become exponentially greater in all olive-
producing countries. Chemical and sensory characteristics, however, allow to
distinguish clearly between monovarietal virgin olive oils from irrigated and non-
irrigated olive trees. Thus, the total content of polyphenols, which contribute to the
bitter taste of the oil (Gutierrez, et al. 1989), is lower in the virgin olive oil harvested
from irrigated zones. This is of great importance for varieties characterised by high
values of astringent, throat-catching or bitter sensory descriptiors. This olive oils have a
shorter shelf life and a more “light” sensory profile than oils produced from non-
irrigated olive groves (Salas, et al. 1997).
Influence of Ripeness; The ripeness of olives is an important determinant for
harvesting, because the accumulation of fatty acids rises with ripeness index has been
universally accepted for determining the ripeness stage of olives (Frias, et al. 1991) and

17
hence the optimum time for harvesting. The scale is based on the colour and texture of
the olive drupe, and the first numbers correspond to uniripe olives, values around 3.5-
4.5 correspond to normal ripe olives, while numbers above 6 correspond to overripe
olives.
Over the ages farmers were normally paid according to the percentage of oil
obtained from their olives, so they were interested in harvesting when their olives were
ripe enough. Recent studies on the evolution of chemical compounds during ripeness
(Aparicio, et al. 1998), however, have allowed delineating not only the best time for
harvesting but also the importance of olive ripeness to sensory quality. Virgin olive oil
obtained from overripe olives is received in a higher yield but its chlorophyll content is
relatively low (Minguez-Mosquero, et al. 1986), it contains smaller amounts of total
phenols (Maestro Duran, 1990) and some aromatic compounds (Morales, et al. 1996).
The effects of ripeness on the sensory quality of virgin olive oil and
monovarietal virgin olive oils are obvious and were studied with either sensory
descriptors or volatile and phenolic compounds. The influence of ripeness on the
concentration of green aroma compounds were studied by authors (Morales, et al.
1990). The authors found that the total content of volatile compounds decreases with
ripeness and there are markers for monovarietal virgin olive oils obtained from unripe
(E-2-hexenal), normal ripe (hexyl acetate) and overripe olives (E-2-hexenol), regardless
of the variety selected (Aparicio, et al. 1998).
Influence of Extraction Systems; Various studies have shown that a monovarietal
virgin olive oil produced by the three-phases centrifugation system contains lower
amounts of polyphenols (De Felice, et al. 1979) and of aliphatic alcohols (Mattei, et al.
1988), but slightly higher amounts of cholorophylls (De Felice, et al. 1979) than the
same oill obtained by cold press. It is also well konwn that oils from cold press are
significantly more bitter, have less gross flavour and higher values of undesirable
attributes like yeast aroma and ferment odour than those obtained by the three-phase
centrifugation procedure. Besides, with respect to volatiles, concentrations of almost all
of them higher in the oils obtained by cold press (Angerosa, et al. 1996).
However due to the problems with the volume of waste waters (Fiestas, J. A.
1953 ; Capasso, et al. 1992), the three-phases centrifugation systems evolved to
centrigugal decanters of two-phases that avoid adding water during the process. Since
the adoption of the former system in the early 1990s, numerous researchers have
pointed out the sensory and chemical differences between these three- and two-phases

18
centrifugation systems. Comparing monovarietal virgin olive oils obtained by both
processes, the oils obtained by two-phases decanters have higher contents of
polyphenols (Jimenez-Marquez, et al. 1995), ortho-diphenols, hydroxytyrosol,
tocopherols (Angerosa, et al. 1996), E-2-hexenal and total aromatic substances, but
lower values of pigments, aliphatic and triterpenic alcohols, steroid hydrocarbons and
waxes (Ranalli, et al. 1996) with a significance lower than 0.05.
2.5. The Role of Olive Oil in Human Health
There is no doubt that the traditional olive oil has contributed to the low rates of
numerous chronic diseases observed in Mediterranean region and that has been proved
as a model of healthy nutrition. In particular, a large body of evidence documents the
relationship between the olive oil, cardiovascular risk factors (especially
hyperlipidaemia, diabetes, obseity) and coronary heart disease (CHD) (International
Consensus Conference on the Mediterranean Diet, 2000).
Hyperlipidaemia; With regard to the prevention, but also the therapy of
hyperlipidaemia, the low saturated fatty acid (SFA) and high monounsaturated fatty
acid (MUFA) contents of olive oil are of outstanding importance. However, its total
nutrient composition also meets the requirements of the internationally recommended
lipid-lowering and coronary heart disease (CHD)-preventive diet (Expert Panel on
Detection, Evaluation, and Treatment of High Blood Cholestrol in Adults, 2001).
Diabetes; The most important measure for preventing type 2 diabetes is the
prevention of obesity, which is also facilitated by a olive oil with its lower energy
density compared to other oils. The basic measure in the treatment of type 2 diabetes is
weight reduction, together with increased physical activity in the majority of obese
patients. In addition, a reduction of saturated fatty acid (SFA) intake is the main dietary
invention, due to the high coronary heart disease (CHD) risk in diabetic patients which
is frequently associated with dyslipidaemia (Ha, et al. 1998). To improve the blood
glucose and serum lipid profile a diet rich in carbonhydrates and dietary fibre and with a
high content of monounsaturated fatty acid (MUFA) is recommended (Wright, J. 1998).
The olive oil gives an excellent example for an adequate diabetes diet.
Coronary Heart Disease (CHD); Verschuren, et al. (1995) documented a
negative correlation between the intake of monounsaturated fat and the

19
monounsaturated fatty acid (MUFA) to saturated fatty acid (SFA) ratio and coronary
heart disease (CHD) incidence. All cause and coronary heart disease (CHD) death rates
were low in the Mediterranean cohorts with the monounsaturated fatty acid (MUFA)
rich olive oil as the main fat, underlining the favourable role of olive oil. Furthermore,
there is a body of indirect evidence from interventional studies that the traditional
Mediterranean diet with its abundance in plant foods, preferential and regular intake of
olive oil, and low to moderate consumption of animal foods protects against coronary
heart disease (CHD) efficiently (Spiller, G. A. 1991 ; Denke, M. 1995 ; Kris-Etherton,
et al. 2001).
Recent findings indicate that the olive oil yield its benefits not only through its
effect on established coronary heart disease (CHD) risk factors such as hyperlipidaemia,
diabetes, and obesity but also through direct protective effects, particularly its
antioxidative properties (Hertog, et al. 1995), due to its abundance of both antioxidative
vitamins (vitamin E, -carotene, vitamin C) and other antioxidative compounds, like
flavonoids and other polyphenols. These antioxidants seem to contribute to the
prevention of processes, such as low density lipoprotein (LDL) oxidation, that are
considered to promote atherogenesis (Visioli, et al. 1995 ; Heinecke, et al. 1998 ; Jialal,
et al. 1996 ; Esterbauer, et al. 1992).
Cancer; A study from Barcelona by Menendez, et al. (2009) confirmed that the
polyphenols in extra virgin olive oil are effective in combinating breast cancer cells of
the HER-2 type. The study notes that the isolated polyphenols were applied in much
higher concentrations than what can be consumed in dietary olive oil, but their findings
may help explain the protective effect olive oil seems to have in preventing certain
types of cancer among Mediterranean women.
Investigators studied the effects of a diet rich in safflower, fish oil or olive oil on
rats, which had been given a chemical that accelerates cancer in the bowel. After five
months, twice as many rats in the safflowerr group had developed tumors as the rats in
the other two groups. In fact, the rats that received olive oil had colon cancer rates
almost as low as those fed fish oil, which several studies have already linked to a
reduction in colon cancer risk (Olive Oil Source, 2012).
Women who ate more olive oil had better protection against ovarian cancer. The
study looked at the diets of nearly 3.500 Italian women; 1.031 with ovarian cancer, and
2.411 without cancer. The women who consumed the highest amount of olive oil had
the lowest rate of ovarian cancer, reduced 30% from the average (Bosetti, et al. 2002).

20
A study from Japan found that hairless mice exposed to damaging doses of
sunlight then soothed with olive oil developed fewer skin cancers. We do not know if
people’s skin will react the same as hairless mice, but it is likely that the antioxidants in
olive oil could help prevent cancer in humans too.
21
CHAPTER 3
MULTIVARIATE STATISTICAL ANALYSIS
Chemometrics has been defined as the application of mathematical and
statistical methods to chemical measurements (Kowalski, B. 1980). Chemometrics
developments and the accompanying realization of these developments as computer
software provide the means to convert raw data into information, information into
knowledge and finally knowledge into intelligence (Delaney, M. 1984). Measurements
related to the chemical composition of a substance are taken and the value of a property
of interest is inferred from them through some mathematical relation (Lavine, B. 1998).
Chemometrics is a chemical discipline that uses mathematics, statistics and
formal logic;
to design or select optimal experimental procedures
to provide maximum relevant chemical information by analyzing chemical
data
to obtain knowledge about chemical systems (Massart, et al. 1997).
Most of the published studies in chemometrics are on pattern recognition.
Pattern recognition is used to classify the pbjects into sets based upon some similarity in
properties (Einax, et al. 1995). The aim is to classify data (patterns) based on either
knowledge or on statistical information. In chemistry, there are many applications using
data to determine the patterns. The following examples can be given: wine
characterization based on the analysis of the biogenic amine composition using the
chromatographic profiles (Garcia-Villar, et al. 2007), verifying the geographical origin
olive oils by near infrared spectroscopy (Woodcock, et al. 2008) and monitoring of
water quality using nitrate, sulphate, chloride, turbidity, conductivity, hardness,
alkalinity, coliforms and Escherichia coli data (De luca, et al. 2008).
There are many methods for chemical classification. Classification methods in
chemometrics are mainly divided into two groups: unsupervised and supervised
techniques.
This section will attempt to give some elementary background mathematical
skills that will be required to understand the process of unsupervised technique.
22
Standard Deviation & Variance; Standard deviation is a statistical value used to
determine how spread out the data in a sample are, and how close individual data points
are to the mean (or average) value of the sample. A standard deviation of a data set
equal to zero indicates that all values in the set are the same.
To calculate the standard deviation, first calculate the mean value of all the data
points. The mean is equal to the sum of all the values in the data set divided by the total
number of data points. Next, the deviation of each data point from the average is
calculated by subtracting its value from the mean value. Each data point’s deviation is
squared, and the individual squared deviations are averaged together. The resulting
value is known as the variance. Standard deviation is the square root of the variance,
and the variance is squared of the standard deviation.
(3.1) (3.2)
Covariance; Covariance is such a measure. Covariance is always measured
between two dimensions. If we calculate the covariance between one dimension and
itself, we get the variance. So, if we had a three-dimensional data set (x, y, z), then we
could measure the covariance between the x and y dimensions, the x and z dimensions,
and the y and z dimensions. Measuring the covariance between x and x, or y and y, or z
and z would give we the variance of the x, y and z dimensions respectively.
If two variables tend to vary together (that is, when one of them is above its
expected value, then the other variable tends to be above its expected value too), then
the covariance between the two variables will be positive. On the other hand, when one
of them is above its expected value the other variable tends to be below its expected
value, then the covariance between the two variables will be negative.
2
1( )
( 1)
n
iiX X
sn
2
2 1( )
( 1)
n
iiX X
sn
(3.3)

23
Eigenvectors & Eigenvalues; We say is an eigenvalue of a square matrix A if
Ax = x
for some x ≠ 0. The vector x is called an eigenvector of A, associated with the
eigenvalue . Note that if x is an eigenvector, then any multiple ax is also an
eigenvector. Eigenvalues presented as percentage.
Note that square matrices of any size, not just 2x2 matrices, can have
eigenvectors and eigenvalues.
3.1. Unsupervised Methods
The main goal of unsupervised methods is to evalute whether clustering exists in
a data set and to find a property of objects using measurements on them. Unsupervised
methods do not require any prior knowledge about the group structure in the data, but
instead produce the grouping and this type of methods mainly analyzes the data. In
some situations the class membership of the samples is known. If the aim is any
grouping between samples or any outliers, unsupervised pattern recognition techniques
such as principal component analysis (PCA), hierarchical cluster analysis (HCA) can be
used. Thus, the class information is known or suspected but is not used initially (Sharaf,
et al. 1986).
3.1.1. Principal Component Analysis (PCA)
Principal component analysis (PCA) is a multivariate technique that analyzes a
data table in which observations are described by several inter-correlated quantitative
dependent variables. Its goal is to extract the important information from the table, to
represent it as a set of new orthogonal variables called principal components, and to
display the pattern of similarity of the observations and of the variables as points in
(3.4)

24
maps. The quality of the principal component analysis (PCA) model can be evaluated
using cross-validation techniques (Williams, J. 2010).
The goals of principal component analysis (PCA) are to (a) extract the most
important information from the data table, (b) compress the size of the data set by
keeping only this important information, (c) simplify the description of the data set, and
(d) analyze the structure of the observations and the variables (Abdi, H. 2010).
In order to achieve these goals, principal component analysis (PCA) computes
new variables called principal components which are obtained as linear combinations of
the original variables. The first principal component is required to have the largest
possible variance (inertia and therefore this component will explain or extract the
largest part of the inertia of the data table). The second component is computed under
the constraint of being orthogonal to the first component and to have the largest possible
inertia.
While principal component analysis (PCA) is performed, the dataset is
decomposed into two parts, namely, meaningful information and erro (or noise). The
transformation is often mathematically described as follows (Brereton, 2002)
where
X is teh original data
T is the principal component scores and has as many rows as the original
data matrix
P is the principal component loadings and has as many columns as the
original data matrix
E is error matrix.
(3.5)

25
Figure 3.1. Principal Component Analysis (PCA)
(Source: Brereton, 2002)
Principal component (PC) account for the majority of the variability in the data.
This enables to describe the information with considerably few variables than originally
present. The number of components extracted in a principal component analysis (PCA)
is equal to the number of observed variables being analyzed. The first component
extracted in a principal component analysis (PCA) accounts for a maximal amount of
total variance in the observed variables. This means that the first component will be
correlated with at least some of the observed variables. The second component extracted
will have two important characteristics. First, this component will account for a
maximal amount of variance in the data set that was not accounted for by the first
component. This means tahta the second component will be correlated with some of the
observed variables that did not display strong correlations with first component. The
second characteristic of the second component is that it will be uncorrelated with the
first component (Davies, A.M.C. 1992).
The cumulative percentage eigenvalue explains the proportion of the data which
has been modelled using principal component analysis (PCA). The model is faithful if
this vaşue is close to 100%. Using the size of eigenvalues, estimation of the number of
significnat components in the data set is carried out (Brereton, 2002).
The significance of the each principal component (PC) can be tasted by cross-

26
validation. In cross-validation, each sample is removed once from the data set and
principal component analysis (PCA) is performed on the remaining samples. Different
scores and loadings matrices are obtained depending on removed sample. In this way,
all samples are removed once and the remaining sample is predicted.
Application of principal component analysis (PCA) chemometric method
combined with many spectroscopic and chromatographic techniques has been carried
out to characterize the olive oils according to cultivar, location and sampling date and
classification of olive oils according to cultivar and geographical origin.
Aranda, et al. (2004) have measured triglycerides, total and 2-position fatty acid
composition by high performance liquid chromatography (HPLC) and achieved 90%
correct classification using principal component analysis (PCA) and linear discriminant
analysis (LDA) in differentiating Spanish olive oil cultivars.
D’Imperio, et al. (2005) and Rezzi, et al. (2005) had work out related to
classification of olive oils from Italy and from various Mediterranean areas,
respectively, by the combination of Nuclear Magnetic Resonance (NMR) with
multivariate analysis techniques of principal component analysis (PCA) and linear
discriminant analysis (LDA).
Poulli, et al. (2005) studied the classification of virgin olive oils based on their
synchronous fluorescence spectra by hierarchical cluster analysis (HCA) and principal
component analysis (PCA). According to result of this study, principal component
analysis provided better discrimination between the virgin olive oil classes, while
hierarchical cluster analysis (HCA) allowed 97% correct classification.
Piŝ, et al. (2011) studied synchronous scanning fluorescence spectroscopy in
combination with multivariate data analysis is introduced for the characterization and
classification of brandies and wine distillates. Using principal component analysis
(PCA), correct classification of brandy and wine distillates samples observed for
synchronous fluorescence data set, hierarchical cluster analysis (HCA) showed that the
brandy and wine distillate samples created two cluster, the first cluster included only
wine distillate samples and the second one only brandy samples. Linear discriminant
analysis (LDA) performed on selected wavelengths provided 93% of correct
classification.

27
3.1.2. Hierarchical Cluster Analysis (HCA)
Hierarchical cluster analysis (HCA) has become a standard method in searching
for similarities among data sats, its applications are related to the partitioning are related
to the similarity classes that are represented as cluster. Hierarchical cluster analysis
(HCA) constitutes a method for classifying the original set with which it is posssible to
study the behavior of a member of determined class and finally generalize sucg
knowledge to the other members of the class (Restrepo, et al. 2006).
The main idea is to exmine the interpoint distance between all the samples and
represent that information in the form of two dimensional plots as a dendrogram. This
idea has been applied in many areas including astronomy, archeology, medicine,
chemistry, education, psychology, linguistics and sociology.
While constructing a dendgrogram. The first step is to determine the similarities
between samples or variables. It is possible with measuring the distances between
objects. There are many different methods for measuring a distance and the most
common ones for hierarchical cluster analysis are as follows:
Euclidean Distance: The distance between samples k and l is defined by:
where there are j measurements and xkj is the jth
measurement on sample k.
Manhattan Distance: This is defined slightly differently to the Euclidean
distance and is given by:
Mahalanobis Distance: This method is similar to the Euclidean distance; it takes
into account that some variables may be correlated, thus it measures more or less the
same properties.
(3.6)
(3.7)
28
where C is the covariance matrix. The Mahalanobis distance is as same as with
Euclidean distance if the covariance matrix is the identity matrix.
After all distances or similarities have been calcukated, need a way of
determining how closely samples are related or grouped. Start with the two most related
samples and link them forming an initial cluster. The process is repeated until all
samples have been linked. Several methods of linking the samples are avaliable.
Single Linkage: Here the shortest distance between opposite clusters is
calculated. Thus, first cluster is one with two observation that have the shortest distance.
A third observation, which has the next least distance, is added to the two observation
cluster to create a three observation cluster or a new two observation cluster is formed.
The algorithm continues until all the observations are in one cluster. The distance
between any two clusters is the shortest distance from any point in one cluster to any
point in the second cluster. Two clusters are merged at any single stage by the single
shortest or strongest link between them (Hair, et al. 1987).
Complete Linkage: This is similar to single linkage except that this is based on
maximum distance not minimum distance. The maximum distance between any two
individuals in a cluster represents the smallest (minimum diameter) sphere that can
enclose the cluster. The advantage here is that this does not create one cluster for “chain
observations”. This happens in single linkage distance where the whole collection of
data becomes a cluster, though the first and the last observation will be at the maximum
distance for the entire sample space (Hair, et al. 1987).
Average Linkage: Here the average distance from samples in one cluster to
samples in other clusters are used. There are two diffirent way of doing this, according
to the size of each group being joined together.
i) Unweighted average linkage: with this method the number of objects in a
cluster is used for weighting the cluster distances.
ii) Weighted average linkage: the sizes of clusters and their weights are assumed
to be egual.
Centroid (Mean) Method: Euclidean distance is measured between centroids of
two clusters.
(3.8)

29
Ward Distance: This method is distinct from all other methods because it uses
an analysis of variance approach to evaluate the distance between clusters. In short, this
method attempts to minimize the Sum of Squares (SS) of any two (hypotheical) clusters
that can be formed at each step. In general, this method is regarded as very efficient,
however, it tends to create clusters of small size (Samba Moorthi, S. 2011).
After conducting the linkage, need a way to visualizing the results. Dendrograms
can be used for this purpose and provide a very simple two dimensional plot that
indicates clustering, similarities and linkage (Figure 3.2).
Figure 3.2. Simple example illustrating the protocol for cluster analysis. (a) Data set
consisting of four objects, each characterized by two characters, (b) Objects
plotted in character space, (c) Similarity matrix showing dissimilarity
between objects, (d) and (e) Derived similarity matrices used in successive
steps of the clustering process (f) Dendrogram. (Source: Varmuza and
Filzmoser, 2008)

30
3.2. Supervised Methods
Supervised methods are methods that attempt to discover the relationship
between input attributes (sometimes called independet variables) and a target attribute
(sometimes referred to as a dependent variable). The relationship discovered is
represented in a structure referred to as a model. Usually models describe and explain
phenomena, which are hidden in the data set and can be used for predicting the value of
the target attribute knowing the values of the input attributes. The supervised methods
can be implemented in a variety of domains such as marketing, finance and
manufacturing.
The supervised classification is the essential tool used for extracting quantitative
information from remotely sensed image data (Richards, 1993). Using this method, the
analyst has available sufficient known pixels to generate representative parameters for
each class of interest. This step is called training. Once trained, the classifier is then
used to attach labels to all the image pixels according to the trained parameters.
It is useful to distinguish between two main supervised models: classification
models (classifiers) and regression models. Regression models map the input space into
a real-value domain. For instance, a regressor can predict the demand for a certain
product given its characteristics. On the other hand, classifiers map the input space into
pre-defined classes. For instance, classifiers can be used to classify mortgage consumers
as good (fully payback the mortgage on time) and bad (delayed payback). There are
many alternatives for representing classifiers, for example, support vector machines,
decision trees, probabilistic summaries, algebraic function, etc.

31
CHAPTER 4
EXPERIMENTAL
4.1. Materials
4.1.1. Olive Oil Samples
Two set of extra virgin olive oil (EVOO) samples were used in this study. The
first set of samples were obtained from Manisa (Akhisar, Salihli and Saruhanlı), and the
other set of samples were obtained from Bursa (Gemlik) region in the two successive
harvest year 2009/2010 and 2010/2011. All of the samples were provided by Olive
Research Institue (Izmir, Turkey).
Table 4.1. Samples
Sample
no
Geographic
origin
Sample
code
Number of
samples
Harvest
year
1 ZAE Bornova ZAE1 1 1st-2nd
2 ZAE Kemalpaşa ZAE2 1 1st-2nd
3 Kayalıoğlu (M) KY 6 1st-2nd
4 Mecidiye (M) MCD 14 1st-2nd
5 Işıkköy (M) IŞK 2 1st-2nd
6 Ballıca (M) BLC 13 1st-2nd
7 Hamidiye (M) HMD 1 1st-2nd
8 Belen (M) BLN 9 1st-2nd
9 Salihli (M) SLH 1 1st-2nd
10 Gökçeköy (M) GKÇ 1 1st-2nd
11 Tendirlik (M) TND 1 1st-2nd
12 Alyattes (M) BT 2 1st-2nd
13 Tekelioğlu (M) TK 1 1st-2nd
(cont. on the next page)

32
Table 4.1. (cont.)
14 Derici (M) DRC 1 1st-2nd
15 Gürpınar (M) GP 1 1st-2nd
16 Dombaylı (M) DMB 1 1st-2nd
17 Durasıllı (M) DRS 1 1st-2nd
18 Eşkel (B) EŞ 1 1st-2nd
19 Esenge (B) ES 1 1st-2nd
20 Konaklı (B) KNK 1 1st-2nd
21 Trilya (B) TR 5 1st-2nd
22 Güzelyalı (B) GY 1 1st-2nd
23 Mudanya (B) MD 1 1st-2nd
24 Bursa (B) BRS 1 1st-2nd
25 Umurbey (B) UB 1 1st-2nd
26 Yukarı Benli (B) YB 1 1st-2nd
27 Büyük Benli (B) BB 1 1st-2nd
28 Kumla (B) KM 1 1st-2nd
29 Büyük Kumla (B) BKM 1 1st-2nd
30 Haydariye (B) HY 1 1st-2nd
31 Kurtul (B) KR 1 1st-2nd
32 Karamürsel (B) KMR 1 1st-2nd
33 Gençali (B) GA 1 1st-2nd
34 Karacaali (B) KAL 1 1st-2nd
35 Soğuksu (B) SS 1 1st-2nd
36 Narlı (B) NR 1 1st-2nd
37 Kapaklı (B) KPK 1 1st-2nd
38 Armutlu (B) ART 1 1st-2nd
40 Çeltikçi (B) ÇLT 1 1st-2nd
41 Boyalıca (B) BY 1 1st-2nd
42 Gürle (B) GR 1 1st-2nd
43 Müşküle (B) MŞ 1 1st-2nd
44 Orhaniye (B) OR 1 1st-2nd
45 Keramet (B) KR 1 1st-2nd
46 İğdir (B) İG 1 1st-2nd
47 Orhangazi (B) OG 2 1st-2nd

33
4.1.2. Chemicals
Reagents used in chemical analysis were obtained from Riedel-de Haén and
Sigma-Aldrich and they are either high performance HPLC or analytical grade. In
chromatographic analysis, fatty acid methyl esters containing C8-C24 (2%-11% relative
concentration) was used as reference standard (Supelco # 18918).
4.2. Instruments and Methods
4.2.1. Fourier Transform Infrared (FTIR) Spectrometry
The region starts from 4000 cm-1
and ends at 400 cm-1
in the electromagnetic
spectrum assigns the middle infrared region. Infrared radiation is not sufficient to cause
the transitions between the electronic states. The vibrational levels and infrared spectra
are generated by the characteristic twisting, bending, rotating and vibrational motions of
atoms in a molecule. All of the motions can be described in terms of two types of
molecular vibrations. One type of vibration, a strech, produces a change of bond length.
A strech is a rhythmic movement along the line between the atoms so that the
interatomic distance is either increasing or decreasing. The second type of vibration, a
bend, results in a change in bond angle. These are also called scissoring, rocking or
wigwag motions. Each of these two main types of vibration can have variations. A
stretch can be symmetric or asymmetric (Figure 4.1).
In a Fourier Transform Infrared (FTIR) Spectrometer, a continuum source of
light is used to produce light over a broad range of infrared wavelengths. Light coming
from this continuum source is split into two paths using a half-silvered mirror; this light
is then reflected two mirrors back onto the beam splitter, where it is recombined.
Because the path that one beam travels is a fixed length and the other is constantly
changing as its mirror moves, the signal which exits the interferometer is the result of
these two beams “interfering” with each other. The resulting signal is called an
interferogram which has the unique property that every data point (a function of the
moving mirror position) which makes up the signal has information about every
infrared frequency which comes from the source.

34
Figure 4.1. Types of molecular vibrations. + indicates motion from the page toward the
reader; - indicates the motion away from the reader. (Source: Skoog, et al.
1998)
In infrared instruments, Nernst glower, globar, tungsten filament, mercury arc or
CO2 laser are used as a source. Due to the heat property of sources, the detectors should
be resistant to the heat. Thermocouples, bolometer, photoconducting tubes or
pyroelectrics are generally used detectors in infrared spectrometers and also the mostly
used one as an interferometer is the Michelson interferometer. Figure 4.2 shows the
optical diagram of an infrared instrument.
Figure 4.2. Optical diagram of Foruier Transform Infrared (FTIR) Spectrometer
(Source: wikipedia.com 2012)

35
The analysis of aqueous solutions is complicated by the solubility of the NaCl
cell window in water. One way to obtaining infrared spectra on aqueous solutions is to
use attenuated total reflectance (ATR) instead of transmission. Figure 4.3 shows a
diagram of a typical ATR sampler, consisting of an IR-transparent crystal of high
refractive index, such as ZnSe, surrounded by a sample of lower-refractive index.
Radiation from the source enters the ATR crystal, where it goes through a series of total
internal reflections before exiting the crystal. During each reflection, the radiation
penetrates into the sample to a depth of a few microns. The result is a selective
attenuation of the radiation at those wavelengths at which the sample absorbs.
Figure 4.3. Attenuated total reflectance (ATR) cell used in infrared spectroscopy
(Source: Harvey, 2000)
Solid samples also can be analyzed by means of reflectance. The ATR sampler
described for the analysis of aqueous solutions can be used for the analysis of solid
samples, provided that the solid can be brought into contact with the ATR crystal.
4.2.1.1. Measurements Using Fourier Transform Infrared-Attenuated
Total Reflectance (FTIR-ATR)
Fourier Transform Infrared spectra of the olive oil samples were collected at
room temperature on Perkin Elmer Spectrum 100 FTIR. Spectrometer (Waltham, MA,
USA) between 600 and 4000 cm-1. Since olive oil is liquid attenuated total reflectance
with diamond was used for measurements. The spectra were saved as log 1/R and the
resolution was 8 cm-1
. Background spectrum was obtained empty and dry ATR cell.
Before and after each sample analyses background was collected to reduce the
contaminations that would come from the ATR crystal. ATR crystal was cleaned with
pure ethanol and allowed to dry.

36
4.2.2. Gas Chromatography (GC)
Gas chromatography (GC) is a powerful and widely used tool for the separation,
identification and quantitation of components in a mixture. In this technique, a sample is
converted to the vapor state and a flowing stream of carrier gas (often helium or
nitrogen) sweeps the sample into a thermally-controlled column. In the case of gas
liquid chromatography, the column is usually packed with solid particles that are coated
with a non-volatile liquid, referred to as the stationary phase. As the sample mixture
moves through the colımn, sample components that interact strongly with the stationary
phase spend more time in the stationary phase vs. the moving gas phase and thus require
more time to move through the column.
Retention time is defined as the time from injection of the sample to the time a
specific sample component is detected. Components with higher volatility (lower
boiling points) tend to spend more time in the moving gas phase and therefore tend to
have shorter retention times. After exiting the column the separated components are
detected and a detector response is recorded (Figure 4.4).
The most application field of Gas Chromatography (GC) in olive oil analysis is
the determination of methyl esters of fatty acids. The aim of this determination is to
establish the percentage composition of fatty acids in olive oil, more commonly known
as fatty acid composition, which is influenced by the olive variety, production zone,
climate and stage of maturity of the drupes when they are collected. Determination of
fatty acid composition of olive oil is not only a quality indicator but also is used for
classification and characterization of the oils.
Figure 4.4. Schematic representation of a system for gas chromatography (GC)
(Source: Oliveoil, 2012)

37
4.2.2.1. Measurements Using Gas Chromatography (GC)
European Official Methods of Analysis (EEC, 1991) was used for the
preparation of methyl esters. 100 mg oil samples was weighted in 20mL test tube. The
sample was dissolved in 10 mL n-hexane and 100 μL 2 N potassium hydroxide in
methanol was added (2.8 g in 25 mL). The sample solution was vortexed for 30 seconds
and centrifuged for 15 minutes. After centrifugation, supertant phase was transferred
into 2 mL autosampler vial for chromatographic analysis.
Chromatographic analyses were performed on a HP 6890 GC equipped with a
flame ionization detector (FID). The instrument configuration and analytical conditions
were summarized in Table 4.2.
Table 4.2. Chromatographic method for the analysis of fatty acid methyl esters
Chromatographic system HP 6890 GC
Inlet Split/spitless
Detector FID
Automatic sampler HP 7683
Liner Split linear (p/n 5183-4647)
Column 30 m x 0.25 mm i.d x 0.250 mm
Inlet temperature 250 oC
Injection volume 1μL
Split ratio 1/100
Carrier gas Helium
Head pressure 0.5 mL/min constant flow
Oven temperature 170 oC, 2
oC/min, 210
oC, 10 min
Detector temperature 250 oC
Detector gas Hydrogen: 30 mL/min; Air: 300
mL/min; Nitrogen make up gas: 24.5
mL/min
Fatty acids used in the analysis were myristic acid (C14:0), palmitic acid
(C16:0), palmitoleic acid (C16:1), margaric acid (C17:0), margoleic acid (C17:1),
stearic acid (C18:0), elaidic acid (C18:1 trans), oleic acid (C18:1), linoelaidic acid

38
(C18:2 trans), linoleic acid (C18:2), trans linolenic acid (C18:3 trans), linolenic acid
(C18:3), arachidic acid (C20:0), gadoleic acid (C20:1), behenic acid (C22:0), lignoseric
acid (C24:0). Each sample was analyzed at least two times. 16 main fatty acids in olive
oil samples were determined by retention time of each one according to the reference of
standard fatty acids. The area of the each peak which belonged to these fatty acids was
integrated by using Chem-station software. The integrated area of each fatty acid was
converted to the % concentraction by dividing the calculated area of each acid to total
area content of all related fatty acids existed in olive oil.
4.2.3. High Performance Liquid Chromatography (HPLC)
High performance liquid chromatography (HPLC) is a chemistry tool for
quantifiying and analyzing mixtures of chemical compounds which is used to find the
amount of a chemical compounds within a mixture of other chemicals. High
performance liquid chromatography (HPLC) has the ability to separate, identify and
quantitate the compounds that are present in any sample that can be dissolved in a
liquid.
Figure 4.5. Schematic representation of a system for high performance liquid
chromatography (HPLC). (Source: Oliveoil, 2012)

39
High performance liquid chromatography (HPLC) and combined
chromatographic methods has a great emphasis in olive oil analysis techniques. Several
minor components of olive oil such as phenolic compounds, pigments, sterols,
tocopherols and triacylglycerols can be identified and quantitated with this technique.
Reversed-phase high performance liquid chromatography (RP-HPLC) currently is the
most popular and reliable technique for the determination of triacylglycerols. Numerous
mobile phases have been employed with different modifiers, which include methanol,
acetonitrile or tetrahydrofuran (Ryan, et al. 1999). Percentage determination of the
various triglycerides present in virgin olive oil or high performance liquid
chromatography offers a way of detecting possible adulterations with oils which, while
having a similar fatty acid composition to olive oil, have a different triglyceride
composition.
4.2.3.1. Measurements Using High Performance Liquid
Chromatography (HPLC)
European Official Methods of Analysis (EEC, 2568-91) was used for the
analysis of triacylglycerols.
Chromatographic analyses were performed on a Agilent HP 1200 HPLC
equipped with a refractive index detector (RID). The instrument configuration and
analytical conditions were summarized in Table 4.3.
Table 4.3. Chromatographic method for the analysis of triacylglycerol
Chromatographic system Agilent HP 1200 HPLC
Inlet Split/spitless
Detector RID
Liner Split linear (p/n 5183-4647)
Column 244 m x 4.0 mm i.d x 4.0 mm
Inlet temperature 35 oC
Injection volume 0.5 mL / min
Inlet pressure 200 bar
Mobile phase
Acetone: 63.6 % mL; Acetonitrile:
36.4 % mL/

40
4.3. Statistical Classification Studies
The multivariate unsupervised calssification analyses (principal component
analysis, PCA and hierarchical cluster analysis, HCA) were carried out by Minitab 15
(Minitab Inc.). Data obtained from analyses were put in a matrix with the rows relating
to the olive oil varieties and geographical origins to the individual absorbance or
intensity values. Prior to multivariate analysis, the data were pre-processed by the
standard procedure. This procedure includes mean-centring (the mean value of each
variable is calculated and subtracted from the data) and normalization.
The models were developed for classification of olive oil samples according to
geographical origin. Principal component analysis (PCA) results were illustrated on the
plot of the first component vs the second component and meanwhile hierarchical cluster
analysis (HCA) results were shown on dendrograms.

41
CHAPTER 5
RESULT AND DISCUSSION
5.1. Classification Studies in 2009-2010 Harvest Year
It is worth to investigate the clustering of the collected olive oil samples based
on their regions as they are received in different geographic regions of Turkey from
north (Bursa) to south (Manisa). For this purpose, two different scenarios were tested
and they were decided according to their sample size and the region. The first group
was based on the samples from Akhisar (which is the subgroup of Manisa) and Bursa
and the second one established on the samples Salihli-Saruhanlı (which are the
subgroup of Manisa) and Bursa. The sample names are coded according to city from
where they are collected. The sample codes are illustrated in Table 5.1 and Table 5.2.
The mentioned two groups were scanned with the spectroscopic and
chromatographic methods, such as FTIR, GC and HPLC and then analyzed with PCA
and HCA.
Table 5.1. Coded Samples (Akhisar and Bursa)
Sample Name
Sample
Code
Sample
Number Group
ZAE Bornova ZAE 1 1 1
ZAE Kemalpaşa ZAE 2 2 1
Kayalıoğlu 1 KY 1 3 1
Kayalıoğlu 2 KY 2 4 1
Kayalıoğlu 3 KY 3 5 1
Kayalıoğlu 4 KY 4 6 1
Kayalıoğlu 5 KY 5 7 1
Kayalıoğlu 6 KY 6 8 1
Mecidiye 1 MCD 1 9 1
Mecidiye 2 MCD 2 10 1
(cont. on the next page)

42
Table 5.1. (cont.)
Mecidiye 3 MCD 3 11 1
Mecidiye 4 MCD 4 12 1
Mecidiye 5 MCD 5 13 1
Mecidiye 6 MCD 6 14 1
Mecidiye 7 MCD 7 15 1
Mecidiye 8 MCD 8 16 1
Mecidiye 9 MCD 9 17 1
Mecidiye 10 MCD 10 18 1
Mecidiye 11 MCD 11 19 1
Mecidiye 12 MCD 12 20 1
Mecidiye 13 MCD 13 21 1
Mecidiye 14 MCD14 22 1
Işıkköy 1 IŞK 1 23 1
Işıkköy 2 IŞK 2 24 1
Ballıca 1 BLC 1 25 1
Ballıca 2 BLC 2 26 1
Ballıca 3 BLC 3 27 1
Ballıca 4 BLC 4 28 1
Ballıca 5 BLC 5 29 1
Ballıca 6 BLC 6 30 1
Ballıca 7 BLC 7 31 1
Ballıca 8 BLC 8 32 1
Ballıca 9 BLC 9 33 1
Ballıca 10 BLC 10 34 1
Ballıca 11 BLC 11 35 1
Ballıca 12 BLC 12 36 1
Ballıca 13 BLC 13 37 1
Hamidiye HMD 38 1
Eşkel EŞ 39 2
(cont. on the next page)

43
Table 5.1. (cont.)
Esenge ES 40 2
Konaklı KNK 41 2
Trilya 1 TR 1 42 2
Trilya 2 TR 2 43 2
Trilya 3 TR 3 44 2
Trilya 4 TR 4 45 2
Trilya 5 TR 5 46 2
Güzelyalı GY 47 2
Mudanya MD 48 2
Bursa BRS 49 2
Gemlik 1 GMK 1 50 2
Gemlik 2 GMK 1 51 2
Umurbey UB 52 2
Yukarıbenli YB 53 2
Büyükbenli BB 54 2
Büyükkumla BKM 55 2
Kumla KM 56 2
Haydariye HY 57 2
Kurtul KR 58 2
Karamürsel KMR 59 2
Gençali GA 60 2
Karacaali KAL 61 2
Soğuksu SS 62 2
Narlı NR 63 2
Kapaklı KPK 64 2
Armutlu ART 65 2
Çeltikçi ÇLT 66 2
Boyalıca BY 67 2
Gürle GR 68 2
Müşküle MŞ 69 2
(cont. on the next page)

44
Table 5.1. (cont.)
Orhaniye OR 70 2
Keramet KR 71 2
İğdir İG 72 2
Orhangazi 1 OG 1 73 2
Orhangazi 2 OG 2 74 2
Table 5.2. Coded Samples (Salihli-Saruhanlı and Bursa)
Sample Name Sample Code
Sample
Number Group
ZAE Bornova ZAE 1 1 1
ZAE Kemalpaşa ZAE 2 2 1
Belen 1 BLN 1 3 1
Belen 2 BLN 2 4 1
Belen 3 BLN 3 5 1
Belen 4 BLN 4 6 1
Belen 5 BLN 5 7 1
Belen 6 BLN 6 8 1
Belen 7 BLN 7 9 1
Belen 8 BLN 8 10 1
Belen 9 BLN 9 11 1
Salihli SLH 12 1
Gökçeköy GKÇ 13 1
Tendirlik TND 14 1
Alyattes 1 BT 1 15 1
Alyattes 2 BT 2 16 1
Tekelioğlu TK 17 1
Derici DRC 18 1
Gürpınar GP 19 1
Dombaylı DMB 20 1
(cont. on the next page)

45
Table 5.2. (cont.)
Durasıllı DRS 21 1
Eşkel EŞ 22 2
Esenge ES 23 2
Konaklı KNK 24 2
Trilya 1 TR 1 25 2
Trilya 2 TR 2 26 2
Trilya 3 TR 3 27 2
Trilya 4 TR 4 28 2
Trilya 5 TR 5 29 2
Güzelyalı GY 30 2
Mudanya MD 31 2
Bursa BRS 32 2
Gemlik 1 GMK 1 33 2
Gemlik 2 GMK 1 34 2
Umurbey UB 35 2
Yukarıbenli YB 36 2
Büyükbenli BB 37 2
Büyükkumla BKM 38 2
Kumla KM 39 2
Haydariye HY 40 2
Kurtul KR 41 2
Karamürsel KMR 42 2
Gençali GA 43 2
Karacaali KAL 44 2
Soğuksu SS 45 2
Narlı NR 46 2
Kapaklı KPK 47 2
Armutlu ART 48 2
Çeltikçi ÇLT 49 2
Boyalıca BY 50 2
(cont. on the next page)

46
Table 5.2. (cont.)
Gürle GR 51 2
Müşküle MŞ 52 2
Orhaniye OR 53 2
Keramet KR 54 2
İğdir İG 55 2
Orhangazi 1 OG 1 56 2
Orhangazi 2 OG 2 57 2
5.1.1. FTIR-ATR Results
Fourier Transform infrared spectrometer is used for classifying the olive oil
samples based on their spectral features. The spectrometer is equipped with attenuated
total reflectance (FTIR-ATR) accessory that carries a diamond-ZnSe crystal plate. The
samples are scanned between 4000 and 600 cm-1
and the collected spectra are shown in
Figure 5.1.
Figure 5.1. The FTIR-ATR spectra of olive oil samples.
In FTIR spectrum, the peaks around 2950-2800 cm-1
region are due to C-H
stretching vibrations of –CH3 and –CH2 groups. The large peak around 1745 cm-1
results from C=O double bond strecthing vibration of carbonyl groups. Peaks around

47
1470-1200 cm-1
region corresponds to CH bending of –CH3 and –CH2. Fingerprint
region lay between 1250-700 cm-1
which is due to stretching vibration of C-O ester
group and CH2 rocking vibration (Harwood & Aparicio, 2000). Extra virgin olive oil
that has a maximum absorbance at 3006cm-1
. This is due to their composition, extra
virgin olive oil consists higher proportion of oleic acyl groups. The entire spectral
profiles of each olive oil sample used in this study were similar.
After scanning the olive oil samples with FTIR-ATR spectrometer, the collected
spectra were used for principal component analysis (PCA) and hierarchical cluster
analysis (HCA) by Minitab software. As it is known principal component analysis
(PCA) is an unsupervised classification method and is generally used to obtain a lower
dimensional graphical representation which describes a maximum variation in a data
set. The first principal component accounts for as much of the variability in the data as
possible, and each succeedinng component accounts for as much of the remaining
variability as possible (Beebe, et al. 1998).

48
50
25
0-2
5-5
0-7
5
40
30
20
10 0
-10
PC
1
PC21 2
Groups
OG
2
OG
1
İG
KR
OR
MŞ
GR
BY
ÇL
T
AR
TK
PK N
RS
SK
AL
GAK
MR
KR
HY
KM
BK
MBB
YB
UBG
MK
1
GM
K 1
BR
S
MD
GY
TR
5
TR
4
TR
3
TR
2
TR
1K
NK
ES
EŞ
HM
DB
LC
13
BL
C 1
2B
LC
11
BL
C 1
0
BL
C 9
BL
C 8
BL
C 7
BL
C 6
BL
C 5
BL
C 4
BL
C 3
BL
C 2
BL
C 1
IŞK
2
IŞK
1
MC
D1
4
MC
D 1
3M
CD
12
MC
D 1
1
MC
D 1
0
MC
D 9
MC
D 8
MC
D 7
MC
D 6
MC
D 5
MC
D 4
MC
D 3
MC
D 2
MC
D 1
KY
6K
Y 5
KY
4K
Y 3
KY
2
KY
1
ZA
E2
ZA
E1
Fig
ure
5.2
. S
core
plo
t of
the
firs
t co
mponen
t ver
sus
the
seco
nd c
om
ponen
t fo
r oli
ve
o
il s
ample
s fr
om
Man
isa
(Akhis
ar)
and B
urs
a usi
ng F
TIR
spec
tra.

49
The first combination is made with two groups which consist of olive oil
samples from Manisa (Akhisar) and Bursa. The score plot of the first component versus
the second component is demonstrated in Figure 5.2. The first and second principal
components explained 90% of the variation of the data.
When the score plot of the samples is examined, it is seen that all of the group 1
samples (Manisa - Akhisar samples) expect some of them were characterized with
positive value of components; neverthless, some of the group 2 samples (Bursa
samples) were classified on the negative sides of components.
Following the principal component analysis (PCA) another unsupervised
classification method which is also commonly used to demonstrate the similarities
between the samples is applied to the same spectroscopic data set. This method is called
hierarchical cluster analysis (HCA) and it generates rectangular tables of variables and
objects that are called dendrograms. The aim of hierarchical cluster analysis (HCA) is to
find out the grouping of the objects (samples) and variables (features) in addition to
similarities possibly, in terms of a hierarchy of embedded groups. Briefly, two main
steps are repeated. The first step is to investigate the distance matrix for the two closest
objects (or variables) whereas the second one is used to consider this pair of objects as a
single individual and to recompute the distance between this new element and the the
rest of the objects (Devillers, et al. 2002). As it can be directly applied to raw data set, it
is also possible to apply hierarchical cluster analysis (HCA) to the principal component
analysis (PCA) score vectors and loading vectors. In fact, when the original data
contains too many variables (e.g. spectroscopic data contains several absorbance values
at corresponding wavelengths or wave numbers), it is better to preprocess the data with
principal component analysis (PCA) so that the dimensionality of the original data
(either normalized or not) can be reduced to a few most important principal components
(PC’s). After principal component analysis (PCA), the resulting significant score and
loading vectors can be used to cluster teh objects and variables, respectively. If there are
only a few original variables in the data set, hierarchical cluster analysis can be directly
applied to the original data. In the present study, the Fourier Transform infrared (FTIR)
spectra of the olive oil samples have contained around 1800 individual wave numbers
and therefore, the hierarchical cluster analysis (HCA) has to be applied to principal
component analysis (PCA) score and loading vectors. Figure 5.3. depicts the
dendrogram of olive oil samples from Manisa (Akhisar) and Bursa obtained with
hierarchical cluster analysis (HCA). The first three principal component (PC) score

50
vectors that are accounted 95% of the total variability in the original spectral data are
used in the distance calculation.
Although the samples in dendrogram were not separated in two main classes
according to their sampling regions, the clusters contained the samples from the same
city, for example, Manisa (Akhisar) samples were cluster together and Bursa samples
were classified separately. Dendrogram also shows the closeness of the samples.
The next combination was made up with the samples from Manisa (Salihli and
Saruhanlı) and Bursa. The score plot of the first component versus the second
component is presented in Figure 5.4. The two principal components (PC’s) explain
approximately 93% of the total variance of the data.
As can be seen from the Figure 5.4 the samples from group 2 (Bursa samples)
were classified in the negative region of the first component and the positive region of
the second component whereas the samples from group 1 (Manisa – Salihli/Saruhanlı
samples) were characterized with positive side of the first component. Nonetheless,
some olive oil samples from group 1 (Manisa – Salihli/Saruhanlı samples) were not
classified and scattered on three regions.
In order to see the closeness of the olive oil samples, hierarchical cluster
analysis (HCA) dendrogram is applied by using three principal components which are
explained 97 % variation of the original data and the dendrogram is depicted in Figure
5.5. The samples are not clustered according to sampling city and it can be concluded
that Fourier Transform Infrared (FTIR) spectra is not sufficient enough to classify the
samples in which the regions are very close.

51
212222211
112122121
21112
121112
21221122222211
12222
1212211
111121
1122121122
111
-509.7
8
-306.5
2
-103.2
6
100.0
0
Sam
ple
s
Similarity
Fig
ure
5.3
. D
endro
gra
m f
or
oli
ve
oil
sam
ple
s fr
om
Man
isa
(Akhis
ar)
and B
urs
a usi
ng F
TIR
spec
tra.

52
20
0-2
0-4
0-6
0-8
0
40
30
20
10 0
-10
PC
1
PC21 2
Groups
OG
2
OG
1
İG
KR
OR
MŞ
GR
BY
ÇL
TA
RT
KP
K N
RS
S
KA
LG
AKM
R
KR
HY
KM
BK
MBB
YB
UBG
MK
2
GM
K 1
BR
S
MD
Y
GY
LT
R 5
TR
4
TR
3
TR
2
TR
1
KN
KE
S
EŞ
DR
S
DM
B
GP
DR
CT
K
BT
2
BT
1
TN
D
GK
Ç
SL
H
BL
N 9
BL
N 8
BL
N 7
BL
N 6
BL
N 5
BL
N 4
BL
N 3
BL
N 2
BL
N 1
ZA
E 2
ZA
E 1
Fig
ure
5.4
. S
core
plo
t of
the
firs
t co
mponen
t ver
sus
the
seco
nd c
om
ponen
t fo
r oli
ve
oil
s
ample
s fr
om
Man
isa
(Sal
ihil
- S
aruhan
lı)
and B
urs
a usi
ng F
TIR
spec
tra.
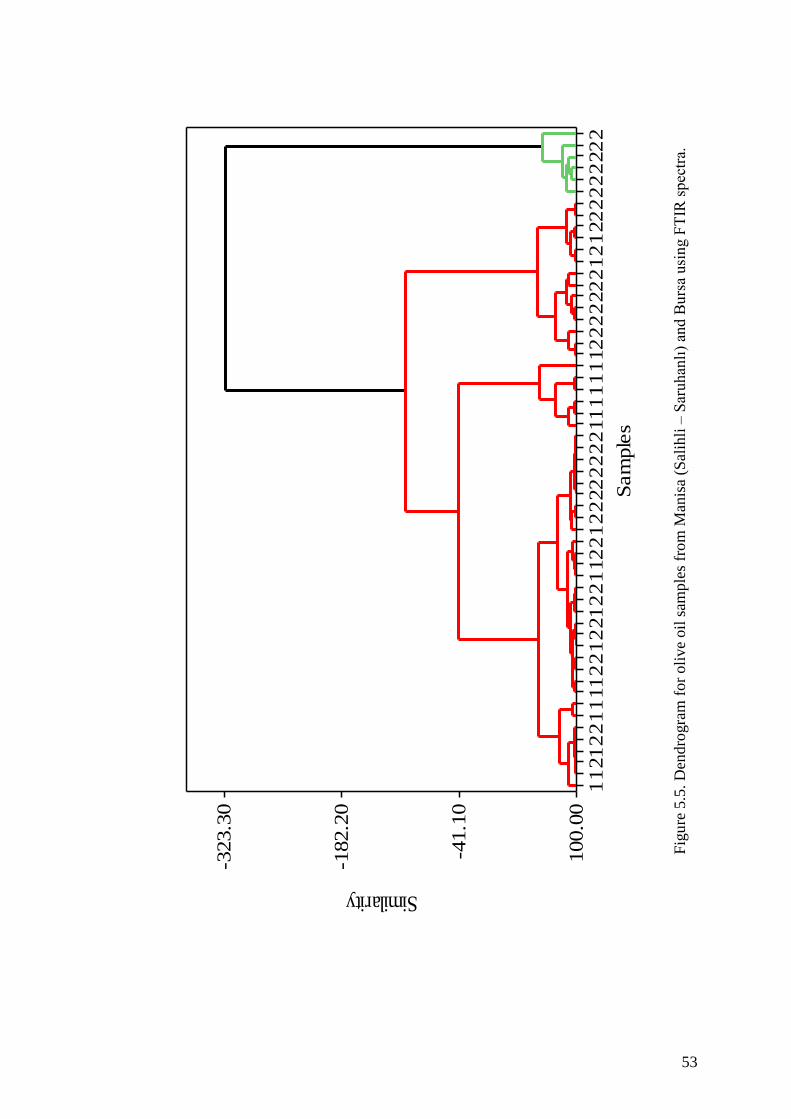
53
22
22
22
22
21
21
22
22
22
21
11
11
11
22
22
22
22
12
21
12
21
22
12
21
11
12
21
21
1
-323.3
0
-182.2
0
-41.1
0
100.0
0
Sam
ple
s
Similarity
Fig
ure
5.5
. D
endro
gra
m f
or
oli
ve
oil
sam
ple
s fr
om
Man
isa
(Sal
ihli
– S
aruhan
lı)
and B
urs
a usi
ng F
TIR
spec
tra.

54
5.1.2. GC Results
The most application field of Gas Chromatography (GC) in olive oil analysis is
the determination of methyl esters of fatty acids. The aim of this determination is to
establish the percentage composition of fatty acids in olive oil, more commonly known
as fatty acid composition, which is influenced by the olive variety, production zone,
climate and stage of maturity of the drupes when they are collected. Determination of
fatty acid composition of olive oil is not only a quality indicator but also is used for
classification and characterization of the oils. The monounsaturated fatty acids have
great importance because of their nutritional implication and their effect on oxidative
stability of oils (Aparicio, et al. 1999). As the most abundant fatty acid in olive oil, the
amount of oleic acid varied remarkably between the olive oil samples.
Figure 5.6. The GC chromatogram of olive oil samples.
After scanning the olive oil samples with GC chromatography, the collected data
were used for principal component analysis (PCA) and hierarchical cluster analysis
(HCA) by Minitab software.
The first combination is made with two groups which consist of olive oil
samples from Manisa (Akhisar) and Bursa. The score plot of the first component versus
the second component is demonstrated in Figure 5.7. The first and second principal
components explained 65% of the variation of the data.

55
12,5
10,0
7,5
5,0
2,5
0,0
-2,5
-5,0
7,5
5,0
2,5
0,0
-2,5
-5,0
PC
1
PC21 2
Groups
OG
2
OG
1İG
KR
OR
MŞ
GR
BY
ÇL
T
AR
T
KP
K
NR
SS
KA
LG
A
KM
RK
R
HY
KM
BK
M
BB
YB
UB
GM
K 2
GM
K 1
BR
S
MD
Y
GY
L
TR
5
TR
4
TR
3
TR
2
TR
1
KN
K
ES
EŞ
HM
D
BL
C 1
3
BL
C 1
2
BL
C 1
1 BL
C 1
0
BL
C 9
BL
C 8
BL
C 7
BL
C 6
BL
C 5
BL
C 4
BL
C 3
BL
C 2
BL
C 1
IŞK
2
IŞK
1M
CD
14
MC
D 1
3
MC
D 1
2
MC
D 1
1M
CD
10 M
CD
9
MC
D 8
MC
D 7
MC
D 6
MC
D 5
MC
D 4
MC
D 3
MC
D 2
MC
D 1
KY
6
KY
5
KY
4
KY
3
KY
2
KY
1Z
Aİ
2
ZA
İ 1
Fig
ure
5.7
. S
core
plo
t of
the
firs
t co
mponen
t ver
sus
the
seco
nd c
om
ponen
t fo
r oli
ve
oil
sa
mple
s fr
om
Man
isa
(Akhis
ar)
and B
urs
a usi
ng G
C c
hro
mat
ogra
m.

56
As can be seen from the Figure 5.7. the samples from group 1 (Manisa – Akhisar
samples) were classified in the positive region of the first component and the negative
region of the second component whereas the samples from group 2 (Bursa samples)
were characterized with positive side of the second component. Nonetheless, the olive
oil samples were not classified clearly.
A typical principal component analysis (PCA) loading plot is shown in Figure
5.8. The loading plot is a plot of the relationship between the original variables and the
subspace dimension. It is used to interpret relationship between variables. The loadings
of the two first components, were plotted to investigate the relationship between the
various fatty acid methyl esters (FAME). In the loading plot, we can see that vaccenic,
palmitoleic and palmitic acid have similar heavy loadings for principal component 1.
Oleic acid, stearic acid, squalene and monounsaturated fatty acid (MUFA), however,
have similar heavy loadings for principal component 2.
In Figure 5.9. shows principal component analysis (PCA) biplot. A biplot uses
points to represent the score of the observation on the principal components, and it uses
vectors to represent the coefficients of the variables on the principal components. In this
graph, the points represent olive oil samples, and the vectors represents variables. The
relative location of the points can be interpreted. Points that are close together
correspond to observations that have similar scores on the components displayed in the
plot. To the extent that these components fit the data well, the points also correspond to
observations that have similar values on the variables.
In figure 5.10 shows hierarchical cluster analysis (HCA) dendrogram by using
raw (original) data. As we can see in the figure altough the samples in dendrogram were
not separated in two main classes according to their sampling region ( Manisa and
Bursa), the clusters contained the samples from the same city, for example, Manisa
samples were clustered together and Bursa samples were classified separately.
Furthermore, HCA also demonstrates that similar samples are clustered in the
same region (Figure 5.11). The number of PCs for HCA (hierarchical cluster analysis) is
7 which explained about 95 % of the variance in the data.
As it can be concluded from Figure 5.11, most of the olive oil samples from
Manisa are clustered at the left side and most of the samples from Bursa are clustered at
the right side.
Figure 5.12 is a dendrogram that shows us which samples are classified
according to which variables. As we can see in the graph, Manisa samples, which are

57
clustered at the left side of the garph, are affected palmitic acid, palmitoleic acid,
vaccenic acid and classified according to these fatty acid methyl ester. On the other
hand Bursa samples, which are clustered of the right side of the graph, are affected
eicosanoic acid, oleic acid, gadoleic acid and classified according to these fatty acid
methyl esters.

58
0,3
0,2
0,1
0,0
-0,1
-0,2
-0,3
0,4
0,3
0,2
0,1
0,0
-0,1
-0,2
-0,3
PC
1
PC2
Ox
Suc
IV
LO
/LN
PA
/LO
OA
+V
A/L
OM
UF
A/P
UF
A
PU
FA
/SF
A
PU
FA
MU
FA
SF
A
TF
A
Skuale
n
Lig
noseri
k
Behenik
Gadole
ikA
raşid
ik
Lin
ole
nik
TL
0 +
TL
N
Lin
ole
ik
Vaksenik
Ole
ik
Ela
idik
Ste
ari
k
Marg
ole
ik
Marg
ari
k
Palm
itole
ik
Palm
itik
Fig
ure
5.8
. L
oad
ing p
lot
of
the
firs
t co
mponen
t ver
sus
the
seco
nd c
om
pon
ent
for
oli
ve
oil
sa
mple
s fr
om
Man
isa
(Akhis
ar)
and B
urs
a usi
ng G
C c
hro
mat
ogra
m.

59
12,5
10,0
7,5
5,0
2,5
0,0
-2,5
-5,0
7,5
5,0
2,5
0,0
-2,5
-5,0
PC
1
PC2
Ox
Suc
IV
LO
/LN
PA
/LO
OA
+V
A/L
OM
UF
A/P
UF
A
PU
FA
/SF
AP
UF
AM
UF
A
SF
AT
FA
Skuale
n Lig
noseri
k
BehenikG
adole
ikA
raşid
ik
Lin
ole
nik
TL
0 +
TL
N
Lin
ole
ik
Vaksenik
Ole
ik
Ela
idik
Ste
ari
k
Marg
ole
ikM
arg
ari
kP
alm
itole
ikP
alm
itik
Fig
ure
5.9
. B
iplo
t of
the
firs
t co
mponen
t ver
sus
the
seco
nd c
om
pon
ent
for
oli
ve
oil
sa
mple
s fr
om
Man
isa
(Akhis
ar)
and B
urs
a u
sin
g G
C c
hro
mat
og
ram
.

60
22
22
22
22
22
22
22
22
22
22
22
22
11
11
12
22
22
22
22
22
21
11
11
11
11
11
11
11
11
11
11
11
11
11
11
11
11
-383.0
9
-222.0
6
-61.0
3
100.0
0
Sam
ple
s
Similarity
Fig
ure
5.1
0. D
endro
gra
m f
or
oli
ve
oil
sam
ple
s fr
om
Man
isa
(Akhis
ar)
and B
urs
a usi
ng G
C c
hro
mat
ogra
m a
nd r
aw d
ata.

61
22
22
22
22
22
22
22
22
22
22
22
22
22
22
22
22
22
22
11
11
11
11
11
11
11
11
11
11
11
11
11
11
11
11
11
11
11
-506.0
5
-304.0
3
-102.0
2
100.0
0
Sam
ple
s
Similarity
Fig
ure
5.1
1. D
endro
gra
m f
or
oli
ve
oil
sam
ple
s fr
om
Man
isa
(Akhis
ar)
and B
urs
a usi
ng G
C c
hro
mat
ogra
m a
nd
7 P
Cs.

62
GadoleikBehenikAraşidikSkualen
OA+VA/LOMUFA/PUFA
MUFAOleik
StearikPA/LO
SFAMargoleikMargarik
LO/LNLignoserik
IVLinolenik
PUFA/SFAOx Suc
PUFALinoleik
TFATL0 +TLN
ElaidikVaksenik
PalmitoleikPalmitik
-388.2
8
-225.5
2
-62.7
6
100.0
0
Vari
able
s
Similarity
Fig
ure
5.1
2. D
endro
gra
m f
or
var
iable
s (F
stty
aci
d m
eth
yl
este
rs).

63
The second combination was constructed with olive oil samples from Manisa
(Salihli-Saruhanlı) and Bursa. The result of classification analysis with Principal
Component Analysis (PCA) is shown Figure 5.13 and 63 % of the total variance of the
data is explained with the first two components. As can be seen from the Figure 5.13
almost all Bursa samples were characterized in the positive region of both components.
The graph, Figure 5.14, is a loading plot from principal component analysis
(PCA). Lines that go in the same direction and are close to one another indicate how the
variables may be grouped. In this diagram, the first component in the horizontal
direction is a summary of the vaccenic, palmitoleic and palmitic. Oleic acid, stearic
acid, squalene and monounsaturated fatty acid (MUFA), however, have similar heavy
loadings for principal component 2. These variables have been grouped together as they
are closely associated/correlated from a statistical point of view.
In Figure 5.15. shows principal component analysis (PCA) biplot. The biplot
contains a lot of information and can be helpful in interpreting relationships between
olive oil samples and variables (fatty acid methyl esters).
In order to investigate the similarities between the olive oil samples, hierarchical
cluster analysis (HCA) was performed with raw data and 7 PCs explain approximately
95 % of the total variance of the data. The dendrogram is illustrated in Figure 5.16
constructed by using raw data (fatty acid methyl esters). As we can see in the figure
only one Manisa (Salihli-Saruhanlı) sample mixed with Bursa samples and the samples
in dendrogram were separated in two main classes according to their sampling region
(Manisa and Bursa).
In figure 5.17 shows hierarchical cluster analysis (HCA) dendrogram by using 7
PCs explain approximately 95 % of the total variance of the data. The dendrogram
showed us Manisa (Salihli-Saruhanlı) and Bursa samples were separated clearly.
Manisa (Salihli-Saruhanlı) samples were classified at the left side whereas Bursa
samples at the right side.
Figure 5.18 is a dendrogram that shows us which samples are classified
according to which variables. As we can see in the graph, Manisa samples, which are
clustered at the left side of the garph, are affected palmitic acid, palmitoleic acid,
polyunsaturated fatty acid (PUFA) and classified according to these fatty acid methyl
ester. On the other hand Bursa samples, which are clustered of the right side of the
graph, are affected eicosanoic acid, oleic acid, gadoleic acid and classified according to
these fatty acid methyl esters.

64
50
-5-1
0-1
5
5,0
2,5
0,0
-2,5
-5,0
-7,5
PC
1
PC2
1 2
Groups
OG
2O
G 1
İG
KR
OR
MŞ
GR
BY
ÇL
TA
RT
KP
K NR
SS
KA
L
GA
KM
RK
RH
Y
KM
BK
M
BB
YB
UB
GM
K 2
GM
K 1
BR
S
MD
Y
GY
L
TR
5
TR
4 TR
3
TR
2
TR
1K
NK
ES
EŞ
DR
S
DM
B GP
DR
C
TK
BT
2
BT
1
TN
DG
KÇ
SL
H
BL
N 9
BL
N 8 B
LN
7
BL
N 6
BL
N 5
BL
N 4
BL
N 3
BL
N 2
BL
N 1
ZA
E 2
ZA
E 1
Fig
ure
5.1
3.
Sco
re p
lot
of
the
firs
t co
mponen
t ver
sus
the
seco
nd c
om
ponen
t fo
r oli
ve o
il
sam
ple
s fr
om
Man
isa
(Sal
ihli
-Sar
uhan
lı)
and B
urs
a usi
ng G
C c
hro
mat
ogra
m.

65
0,3
0,2
0,1
0,0
-0,1
-0,2
-0,3
0,4
0,3
0,2
0,1
0,0
-0,1
-0,2
-0,3
-0,4
PC
1
PC2
Ox
Suc
IV
LO
/LN
PA
/LO
OA
+V
A/L
OM
UF
A/P
UF
A
PU
FA
/SF
AP
UF
A
MU
FA
SF
A
TF
A
Skuale
n
Lig
noseri
k
Behenik
Gadole
ik
Ara
şid
ik
Lin
ole
nik
TL
0 +
TL
NL
inole
ik
Vaksenik
Ole
ik
Ela
idik
Ste
ari
k
Marg
ole
ikMarg
ari
k
Palm
itole
ikP
alm
itik
Fig
ure
5.1
4.
Lo
adin
g p
lot
of
the
firs
t co
mponen
t v
ersu
s th
e se
cond c
om
pon
ent
for
oli
ve
oil
sam
ple
s fr
om
Man
isa
(Sal
ihli
-Sar
uhan
lı)
and B
urs
a usi
ng G
C c
hro
mat
ogra
m.

66
50
-5-1
0-1
5
5,0
2,5
0,0
-2,5
-5,0
-7,5
PC
1
PC2
Ox
Suc
IV
LO
/LN
PA
/LO
OA
+V
A/L
OM
UF
A/P
UF
A
PU
FA
/SF
AP
UF
AM
UF
AS
FA
TF
A
Skuale
nL
ignoseri
k
Behenik
Gadole
ikAra
şid
ik
Lin
ole
nikTL
0 +
TL
NL
inole
ik
Vaksenik
Ole
ik
Ela
idik
Ste
ari
kM
arg
ole
ikM
arg
ari
k
Palm
itole
ikP
alm
itik
Fig
ure
5.1
5.
Bip
lot
of
the
firs
t co
mpo
nen
t ver
sus
the
seco
nd c
om
ponen
t fo
r oli
ve
oil
sam
ple
s fr
om
Man
isa
(Sal
ihli
-Sar
uhan
lı)
and B
urs
a u
sing G
C c
hro
mat
ogra
m.
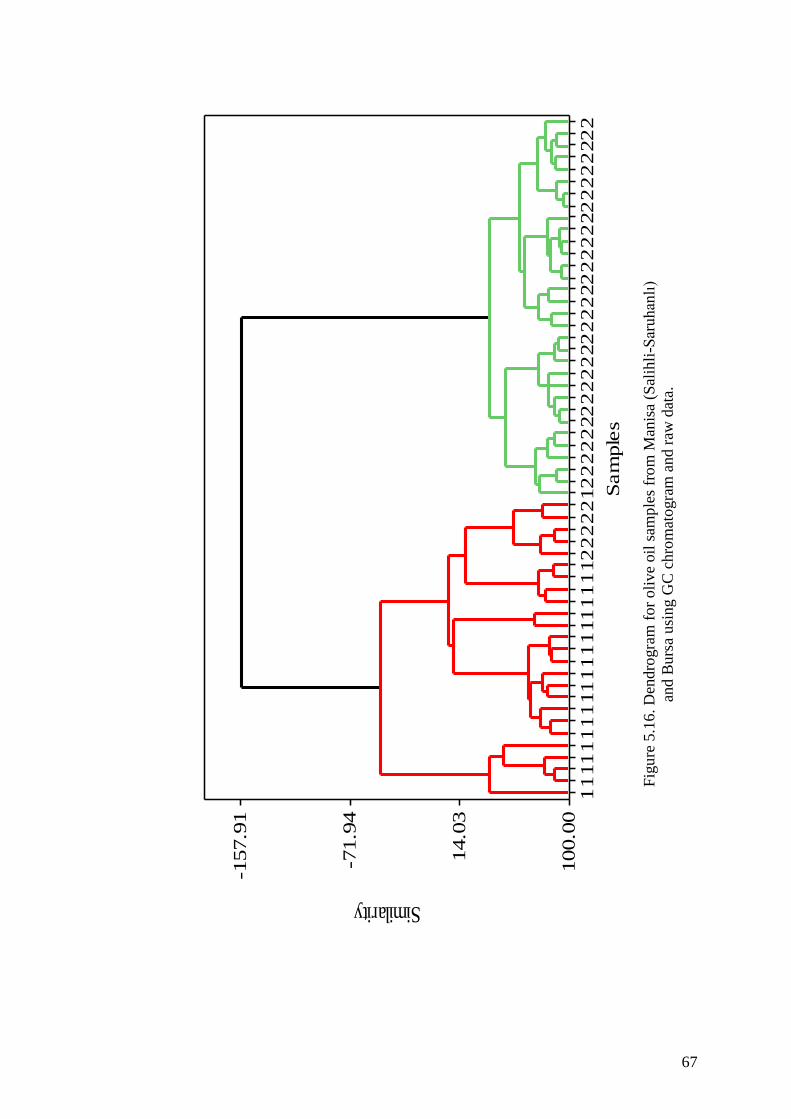
67
22
22
22
22
22
22
22
22
22
22
22
22
22
22
22
21
22
22
21
11
11
11
11
11
11
11
11
11
1
-157.9
1
-71.9
4
14.0
3
100.0
0
Sam
ple
s
Similarity
Fig
ure
5.1
6. D
endro
gra
m f
or
oli
ve
oil
sam
ple
s fr
om
Man
isa
(Sal
ihli
-Sar
uhan
lı)
and B
urs
a usi
ng G
C c
hro
mat
ogra
m a
nd r
aw d
ata.

68
22
22
22
22
22
22
22
22
22
22
22
22
22
22
22
22
22
22
11
11
11
11
11
11
11
11
11
11
1
-141.8
5
-61.2
3
19.3
8
100.0
0
Sam
ple
s
Similarity
Fig
ure
5.1
7. D
endro
gra
m f
or
oli
ve
oil
sam
ple
s fr
om
Man
isa
(Sal
ihli
-Sar
uhan
lı)
and B
urs
a usi
ng G
C c
hro
mat
ogra
m a
nd 7
PC
s.
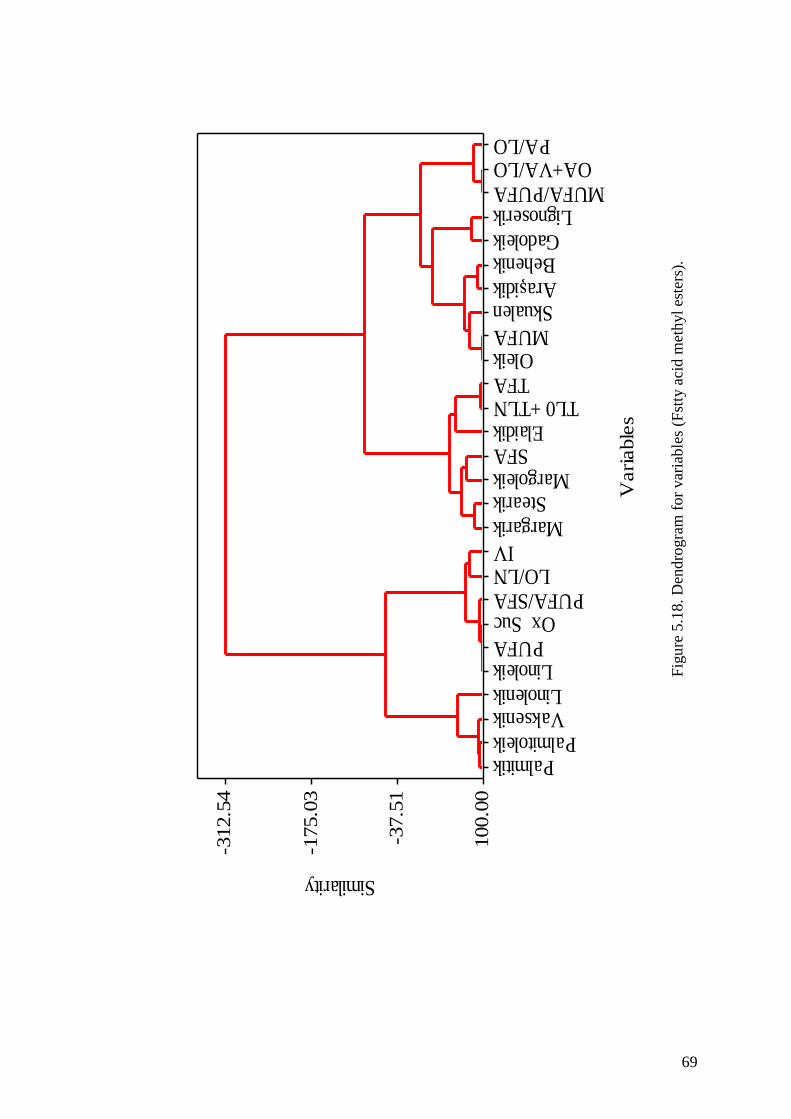
69
Fig
ure
5.1
8. D
endro
gra
m f
or
var
iable
s (F
stty
aci
d m
eth
yl
este
rs).
PA/LOOA+VA/LO
MUFA/PUFALignoserik
GadoleikBehenikAraşidikSkualenMUFA
OleikTFA
TL0 +TLNElaidik
SFAMargoleik
StearikMargarik
IVLO/LN
PUFA/SFAOx Suc
PUFALinoleik
LinolenikVaksenik
PalmitoleikPalmitik
-312.5
4
-175.0
3
-37.5
1
100.0
0
Vari
able
s
Similarity

70
5.1.3. HPLC Results
High performance liquid chromatography (HPLC) and combined
chromatographic methods has a great emphasis in olive oil analysis techniques. Several
minor components of olive oil such as phenolic compounds, pigments, sterols,
tocopherols and triacylglycerols can be identified and quantitated with this technique.
Reversed-phase high performance liquid chromatography (RP-HPLC) currently is the
most popular and reliable technique for the determination of triacylglycerols. Numerous
mobile phases have been employed with different modifiers, which include methanol,
acetonitrile or tetrahydrofuran (Ryan, et al. 1999). Percentage determination of the
various triglycerides present in virgin olive oil or high performance liquid
chromatography offers a way of detecting possible adulterations with oils which, while
having a similar fatty acid composition to olive oil, have a different triglyceride
composition.
Figure 5.19. The HPLC chromatogram of olive oil samples.
After scanning the olive oil samples with HPLC chromatograhy, PCA (principal
component analysis) and HCA (hierarchical cluster analysis) were performed with the
same combinations of regions (Manisa-Akhisar and Bursa) mentioned above in order to
compare chromatographic methods for the classification of olive oils based on the
geographical region and the score plot obtained is represented in Figure 5.20.

71
15
10
50
-5
5,0
2,5
0,0
-2,5
-5,0
PC
1
PC2
1 2
Groups
OG
2 OG
1İG
KR
OR
MŞ
GR
BY
ÇL
T
AR
TK
PK
NR
SS
KA
LG
A
KM
RK
RH
Y KM
BK
M
BB
YB
UB
GM
K 2
GM
K 1
BR
SM
D
GY
TR
5
TR
4
TR
3
TR
2
TR
1
KN
K
ES
EŞ
HM
D
BL
C 1
3
BL
C 1
2
BL
C 1
1
BL
C 1
0 BL
C 9
BL
C 8
BL
C 7
BL
C 6
BL
C 5
BL
C 4
BL
C 3
BL
C 2
BL
C 1
IŞK
2
IŞK
1
MC
D 1
4
MC
D 1
3
MC
D 1
2M
CD
11M
CD
10
MC
D 9
MC
D 8
MC
D 7
MC
D 6
MC
D 5
MC
D 4
MC
D 3
MC
D 2
MC
D1
KY
6
KY
5
KY
4K
Y 3
KY
2
KY
1
ZA
İ 2
Z
Aİ
1
Fig
ure
5.2
0.
Sco
re p
lot
of
the
firs
t co
mponen
t ver
sus
the
seco
nd c
om
ponen
t fo
r oli
ve
oil
sa
mple
s fr
om
Man
isa
(Akhis
ar)
and B
urs
a usi
ng H
PL
C c
hro
mat
ogra
m.

72
As can be seen from the figure, almost all Bursa samples were placed on the
negative part of the principal component one (PC1) and positive part of the principal
component two (PC2). On the other hand Manisa samples were to be scattered on the
graph.
The loading of the two first components, were plotted to investigate the
relationship between the various triacylglycerol (TAG) and represet in Figure 5.21. The
plot of the loading of the two first components, expressing the relationship between the
various triacylglycerol (TAG) showed the lack of correlation between triolein and
palmatin olein palmatin (POP).
Figure 5.22. represents the principal component analysis (PCA) biplot. Biplots
are a type of exploratory graph used in statistics, a generalization of the simple two
variable scatterplot. A biplot allows information on both samples and variables of a data
matrix to be displayed graphically. Samples are displayed as points while variables are
displayed either as vectors, linear axes or nonlinear trajectories.
In figure 5.23 shows hierarchical cluster analysis (HCA) dendrogram by using
raw (original) data. As we can see in the figure some Bursa samples mixed with Manisa
(Akhisar) samples and the samples in dendrogram were separated in two main classes
according to their sampling region (Manisa and Bursa).
Furthermore, HCA also demonstrates that similar samples are clustered in the
same region (Figure 5.24). The number of 8PCs for HCA (hierarchical cluster analysis)
is 8 which explained about 95 % of the variance in the data. Altough the samples in
dendrogram were not separated in two main classes according to their sampling region
(Manisa and Bursa), the clusters contained the samples from the same city, for example,
Manisa samples were clustered together and Bursa samples were classified separately.
Figure 5.25 is a dendrogram that shows us which samples are classified
according to which variables. As we can see in the graph, Manisa samples, which are
clustered at the left side of the garph, are affected trilinolein (LLL), equivalent carbon
number 42 (ECN42), equivalent carbon number 44 (ECN44) and classified according to
these triacylglycerols. On the other hand Bursa samples, which are clustered of the right
side of the graph, are affected equivalent carbon number 48 (ECN48), equivalent carbon
number 50 (ECN50), triolein (OOO) and classified according to these triacylglycerols.

73
0,3
0,2
0,1
0,0
-0,1
-0,2
-0,3
0,5
0
0,2
5
0,0
0
-0,2
5
-0,5
0
PC
1
PC2
EC
N 4
2 F
ark
OO
O/P
OO
LO
O/P
LO
EC
N48/E
CN
46
PL
L/O
LL
LL
L/E
CN
42
PL
O/O
OO
EC
N 5
0
EC
N 4
8
EC
N46
EC
N44
EC
N42
PO
S
SO
OP
PP
PO
P
SL
O +
PO
O
OO
O
PL
P
PoO
P
PL
O +
SL
L
PoO
O
LO
O +
PL
nP
PO
Ln
PL
L
OL
nO
OL
L
PL
Ln
LO
Ln +
PO
LL
LL
L
Fig
ure
5.2
1.
Lo
adin
g p
lot
of
the
firs
t co
mponen
t v
ersu
s th
e se
cond c
om
pon
ent
for
oli
ve
o
il s
ample
s fr
om
Man
isa
(Akhis
ar)
and B
urs
a usi
ng H
LP
C c
hro
mat
ogra
m.
Fig
ure
5.2
1.
Load
ing p
lot
of
the
firs
t co
mponen
t ver
sus
the
seco
nd c
om
ponen
t fo
r oli
ve
oil
sam
ple
s fr
om
Man
isa
(Akhis
ar)
and B
urs
a usi
ng H
PL
C ch
rom
atogra
m

74
15
10
50
-5
5,0
2,5
0,0
-2,5
-5,0
PC
1
PC2
EC
N 4
2 F
ark
OO
O/P
OO
LO
O/P
LO
EC
N48/E
CN
46 P
LL
/OL
LLL
L/E
CN
42
PL
O/O
OO
EC
N 5
0E
CN
48
EC
N46
EC
N44
EC
N42
PO
SS
OO
PP
P
PO
P
SL
O +
PO
O
OO
OP
LP
PoO
P
PL
O +
SL
L
PoO
OLO
O +
PL
nP
PO
Ln P
LL
OL
nOO
LL
PL
Ln
LO
Ln +
PO
LL
LL
L
Fig
ure
5.2
2.
Bip
lot
of
the
firs
t co
mponen
t ver
sus
the
seco
nd c
om
pon
ent
for
oli
ve
oil
sa
mple
s fr
om
Man
isa
(Akhis
ar)
and B
urs
a usi
ng H
PL
C c
hro
mat
ogra
m.

75
22
22
22
22
22
22
22
22
22
22
22
22
22
22
22
22
11
11
11
11
11
22
12
21
11
11
11
11
11
11
11
11
11
11
11
11
11
-420.5
5
-247.0
3
-73.5
2
100.0
0
Sam
ple
s
Similarity
Fig
ure
5.2
3. D
endro
gra
m f
or
oli
ve
oil
sam
ple
s fr
om
Man
isa
(Akhis
ar)
an
d B
urs
a usi
ng H
PL
C c
hro
mat
ogra
m a
nd r
aw d
ata.

76
22
22
22
22
22
22
22
22
22
22
22
22
22
21
11
11
22
11
22
22
11
11
11
11
11
11
11
11
22
12
11
11
11
11
11
11
11
-456.5
9
-271.0
6
-85.5
3
100.0
0
Sam
ple
s
Similarity
Fig
ure
5.2
4. D
endro
gra
m f
or
oli
ve
oil
sam
ple
s fr
om
Man
isa
(Akhis
ar)
and B
urs
a usi
ng H
PL
C c
hro
mat
ogra
m a
nd 8
PC
s.

77
POSPPP
ECN48/ECN46ECN 48ECN 50
SOOLOO/PLO
OOO/POOOOO
PLL/OLLPoOPPoOO
POPSLO + POO
POLnOLnO
ECN 42 FarkPLLn
LLL/ECN42PLP
ECN46PLO/OOO
PLO + SLLLOO +PLnP
PLLECN42
LOLn +POLLECN44
OLLLLL
-513.4
5
-308.9
7
-104.4
8
100.0
0
Vari
able
s
Similarity
Fig
ure
5.2
5. D
endro
gra
m f
or
var
iable
s (T
riac
ylg
lyce
rol)
.

78
The next trial was constructed with the samples from Manisa (Salihli-Saruhanlı)
and Bursa and the plot of the first two components which were accounted for 88 %
variation are illustrated in Figure 5.26. As can be seen from the figure, almost all Bursa
samples were placed on the negative part of the principal component one (PC1) and the
principal component two (PC2). On the other hand Manisa samples were to be scattered
on the graph and were placed positive part of the components.
The loading of the two first components, were plotted to investigate the
relationship between the various triacylglycerol (TAG) and represet in Figure 5.27. The
plot of the loading of the two first components, expressing the relationship between the
various triacylglycerol (TAG) showed the lack of correlation between equivalent carbon
number 48 (ECN48) and equivalent carbon numver 42 (ECN42).
In Figure 5.28. shows principal component analysis (PCA) biplot. The biplot
contains a lot of information and can be helpful in interpreting relationships between
olive oil samples and variables (triacylglycerols).
In figure 5.29 shows hierarchical cluster analysis (HCA) dendrogram by using
raw (original) data. As we can see in the figure some Bursa samples mixed with Manisa
(Salihli-Saruhanlı) samples and the samples in dendrogram were not separated in two
main classes according to their sampling region (Manisa and Bursa).
Figure 5.30 represents the hierarchical cluster analysis (HCA) dendrogram
obtained with seven principal components covering again 95 % of the variability in the
data set. This dendrogram shows similarity with the result obtained by principal
component analysis (PCA) and shows the closenes of the samples. As can be seen, most
of the samples from cities formed small clusters with respect to each other and could not
observed formation of clear two cluster.
Figure 5.31 is a dendrogram that shows us which samples are classified
according to which variables. As we can see in the graph, Manisa samples, which are
mostly clustered at the left side of the garph, are affected trilinolein (LLL), olein
linolein linolein (OLL), equivalent carbon number 44 (ECN44) and classified according
to these triacylglycerols. On the other hand Bursa samples, which are mostly clustered
of the right side of the graph, are affected equivalent carbon number 48 (ECN48),
equivalent carbon number 50 (ECN50), triolein (OOO), tripalmitin (PPP) and classified
according to these triacylglycerols.

79
20
15
10
50
-5
7,5
5,0
2,5
0,0
-2,5
-5,0
PC
1
PC2
1 2
Groups
OG
2
OG
1
İGK
R
OR
MŞ
GR
BY
ÇL
TA
RT
KP
K
NR
SS
KA
LG
A
KM
RK
R HYKM
BK
M
BB
YB
UB
GM
K 2
GM
K 1
BR
SM
DY
GY
LT
R 5
TR
4
TR
3
TR
2
TR
1K
NK
ES
EŞ
DR
S
DM
B
GP
DR
C
TK
BT
2
BT
1
TN
DG
KÇ
SL
HB
LN
9
BL
N 8
BL
N 7
BL
N 6
BL
N 5
BL
N 4
BL
N 3
BL
N 2
BL
N 1
ZA
E 2
ZA
E 1
Fig
ure
5.2
6.
Sco
re p
lot
of
the
firs
t co
mponen
t ver
sus
the
seco
nd c
om
po
nen
t fo
r oli
ve
oil
sam
ple
s fr
om
Man
isa
(Sal
ihli
-Sar
uhan
lı)
and B
urs
a usi
ng H
PL
C ch
rom
atogra
m.

80
0,3
0,2
0,1
0,0
-0,1
-0,2
-0,3
0,5
0,4
0,3
0,2
0,1
0,0
-0,1
-0,2
-0,3
PC
1
PC2
EC
N 4
2 F
ark
OO
O/P
OO
LO
O/P
LO
EC
N48/E
CN
46
PL
L/O
LL L
LL
/EC
N42P
LO
/OO
O
EC
N 5
0
EC
N 4
8
EC
N46
EC
N44
EC
N42
PO
S
SO
O
PP
P
PO
P
SL
O +
PO
O
OO
OP
LP
PoO
P
PL
O +
SL
L
PoO
O
LO
O +
PL
nP
PO
Ln
PL
L
OL
nO
OL
L
PL
Ln
LO
Ln +
PO
LL
LL
L
Fig
ure
5.2
7.
Lo
adin
g p
lot
of
the
firs
t co
mponen
t v
ersu
s th
e se
cond c
om
po
nen
t fo
r o
liv
e o
il
sam
ple
s fr
om
Man
isa
(Sal
ihli
-Sar
uhan
lı)
and B
urs
a usi
ng H
LP
C ch
rom
atogra
m.

81
20
15
10
50
-5
7,5
5,0
2,5
0,0
-2,5
-5,0
PC
1
PC2
EC
N 4
2 F
ark
OO
O/P
OO
LO
O/P
LO
EC
N48/E
CN
46
PL
L/O
LL
LL
L/E
CN
42
PL
O/O
OO
EC
N 5
0
EC
N 4
8
EC
N46
EC
N44
EC
N42
PO
S
SO
OP
PP
PO
PS
LO
+ P
OO
OO
OP
LP
PoO
P
PL
O +
SL
L
PoO
O
LO
O +
PL
nP
PO
Ln
PL
L
OL
nO
OL
L
PL
Ln
LO
Ln +
PO
LL
LL
L
Fig
ure
5.2
8.
Bip
lot
of
the
firs
t co
mponen
t ver
sus
the
seco
nd c
om
pon
ent
for
oli
ve
oil
sam
ple
s fr
om
Man
isa
(Sal
ihli
-Sar
uhan
lı)
and B
urs
a usi
ng H
PL
C ch
rom
atogra
m.

82
22
22
22
22
22
22
22
22
11
11
11
12
22
21
22
21
22
22
22
22
22
21
11
22
11
11
11
11
1
-152.6
1
-68.4
1
15.8
0
100.0
0
Sam
ple
s
Similarity
Fig
ure
5.2
9. D
endro
gra
m f
or
oli
ve
oil
sam
ple
s fr
om
Man
isa
(Sal
ihli
-Sar
uhan
lı)
And B
urs
a usi
ng H
PL
C c
hro
mat
ogra
m a
nd
raw
dat
a.

83
11
11
11
22
22
22
22
22
22
22
22
22
12
22
12
22
22
22
22
21
11
22
12
22
11
11
11
11
1
-161.4
8
-74.3
2
12.8
4
100.0
0
Sam
ple
s
Similarity
Fig
ure
5.3
0. D
endro
gra
m f
or
oli
ve
oil
sam
ple
s fr
om
Man
isa
(Sal
ihli
-Sar
uhan
lı)
and B
urs
a usi
ng H
PL
C c
hro
mat
ogra
m a
nd 7
PC
s.

84
Fig
ure
5.3
1. D
endro
gra
m f
or
var
iable
s (T
riac
ylg
lyce
rol)
.
POSPPP
ECN48/ECN46ECN 48ECN 50
SOOLOO/PLO
OOO/POOOOOPOP
SLO + POOPLL/OLL
POLnOLnOPoOPPoOO
ECN 42 FarkPLLnPLP
LLL/ECN42LOO +PLnP
ECN42LOLn +POLL
ECN46PLO/OOO
PLO + SLLECN44
PLLOLLLLL
-515.9
6
-310.6
4
-105.3
2
100.0
0
Vari
able
s
Similarity
Fig
ure
5.3
1.
D
endro
gra
m f
or
var
iable
s (T
riac
ylg
lyce
rol)

85
5.2. Classification Studies in 2010-2011 Harvest Year
It is worth to investigate the clustering of the collected olive oil samples based
on their regions as they are received in different geographic regions of Turkey from
north (Bursa) to south (Manisa). The group was constructed based on the samples from
Akhisar and Salihli-Saruhanlı (which are the subgroups of Manisa) and Bursa The
sample names are coded according to city from where they are collected. The sample
codes are illustrated in Table 5.3.
The mentioned group was scanned with the spectroscopic and chromatographic
methods, such as FTIR, GC and HPLC and then analyzed with PCA and HCA.
Table 5.3. Coded Samples (Manisa and Bursa)
Sample Name
Sample
Code
Sample
Number Group
ZAE Bornova ZAE 1 1 1
ZAE Kemalpaşa ZAE 2 2 1
Kayalıoğlu 1 KY 1 3 1
Kayalıoğlu 2 KY 2 4 1
Kayalıoğlu 3 KY 3 5 1
Kayalıoğlu 4 KY 4 6 1
Kayalıoğlu 5 KY 5 7 1
Kayalıoğlu 6 KY 6 8 1
Akhisar 1 AKH 1 9 1
Akhisar 2 AKH 2 10 1
Akhisar 3 AKH 3 11 1
Dereköy DK 12 1
Zeytinliova 1 ZO 1 13 1
Zeytinliova 2 ZO 2 14 1
Beyoba BY 15 1
Ballıca 1 BLC 1 16 1
Ballıca 2 BLC 2 17 1
Ballıca 3 BLC 3 18 1
(cont. on the next page)

86
Table 5.3. (cont.)
Mecidiye 1 MCD 1 19 1
Mecidiye 2 MCD 2 20 1
Mecidiye 3 MCD 3 21 1
Mecidiye 4 MCD 4 22 1
Mecidiye 5 MCD 5 23 1
Mecidiye 6 MCD 6 24 1
Mecidiye 7 MCD 7 25 1
Mecidiye 8 MCD 8 26 1
Mecidiye 9 MCD 9 27 1
Mecidiye 10 MCD 10 28 1
Sarılar 1 SR 1 29 1
Sarılar 2 SR 2 30 1
Sarılar 3 SR 3 31 1
Karakurt KRK 32 1
Belen 1 BLN 1 33 1
Belen 2 BLN 2 34 1
Belen 3 BLN 3 35 1
Belen 4 BLN 4 36 1
Belen 5 BLN 5 37 1
Belen 6 BLN 6 38 1
Koldere KD 39 1
Borlu 1 BR 1 40 1
Borlu 2 BR 2 41 1
Karayahşi KYH 42 1
Dombaylı 1 DMB 1 43 1
Dombaylı 2 DMB 2 44 1
Pazarköy PZ 45 1
Balıkhane BLK 46 1
Derici 1 DR 1 47 1
Derici 2 DR 2 48 1
Tendirlik TND 49 1
(cont. on the next page)

87
Table 5.3. (cont.)
Kestelli KST 50 1
Görece GRC 51 1
Mandallı MND 52 1
Manavdere MNV 53 1
Mudanya MDN 54 2
Trilya 1 TR 1 55 2
Trilya 2 TR 2 56 2
Trilya 3 TR 3 57 2
Trilya 4 TR 4 58 2
Trilya 5 TR 5 59 2
Trilya 6 TR 6 60 2
İznik İZN 61 2
Tacir TCR 62 2
Drazali DRA 63 2
Çakırcalı ÇKR 64 2
Boyalıca BYL 65 2
Gemlik GM 66 2
5.2.1. FTIR-ATR Results
Fourier Transform infrared spectrometer is used for classifying the olive oil
samples based on their spectral features. The spectrometer is equipped with attenuated
total reflectance (FTRI-ATR) accessory that carries a diamond-ZnSe crystal plate. The
samples are scanned between 4000 and 600 cm-1
.
After scanning the olive oil samples with FTIR-ATR spectrometer, the collected
spectra were used for principal component analysis (PCA) and hierarchical cluster
analysis (HCA) by Minitab software.
The combination is made with two groups which consist of olive oil samples
from Manisa (Akhisar-Salihli-Saruhanlı) and Bursa. The score plot of the first
component versus the second component is demonstrated in Figure 5.32. The first and
the second principal components explained 90 % of variation of the data. Principal
component analysis (PCA) result explains that there is no grouping of the olive oil

88
samples according to their geographical origins as the samples from all regions are
overlapped on the graph.
Furthermore, hierarchical cluster analysis (HCA) also demonstrates that similar
samples are clustered in the same region (Figure 5.33). The number of PCs for
hierarchical cluster analysis is 4 which explained about 95 % of the variation in the
data.
As it can be concluded from Figure 5.33 most of the olive oil samples from
Manisa and Bursa are clustered mixed and spreaded along the line.. Although the
samples were very scattered they were clustered mainly with some exceptions.

89
40
20
0-2
0-4
0-6
0-8
0
30
20
10 0
-10
PC
1
PC2
1 2
Groups
AK
H 3
DK
BY
L
BY
DM
B 2
DM
B 1
GR
C
İZN
KY
H
KR
K
PZ
BL
K
DR
C 2
DR
C 1
MN
D
KS
T
TN
D
MN
V
MD
N
ZO
1
GM
L
KD
SL
H 2
SL
H 1
AK
H 2
AK
H 1
ÇK
RDR
Z
KK
2
KK
1
BL
N 6
BL
N 5
BL
N 4
BL
N 3
BL
N 2
BL
N 1
BL
C 3BL
C 2
BL
C 1
KY
6K
Y 5
KY
4
KY
3
KY
2
KY
1
MC
D 1
O
MC
D 9
MC
D 8
MC
D 7
MC
D 6
MC
D 5
MC
D 4
MC
D 3
MC
D 2
MC
D 1
TC
R
SR
3 SR
2
SR
1T
R 4 T
R 3
TR
2
TR
1
ZO
2
ZA
E 2
ZA
E 1
Fig
ure
5.3
2.
Sco
re p
lot
of
the
firs
t co
mponen
t ver
sus
the
seco
nd c
om
ponen
t fo
r oli
ve
oil
sam
ple
s fr
om
Man
isa
(Akhis
ar-S
alih
li-S
aruhan
lı)
and B
urs
a usi
ng F
TIR
sp
ectr
a.

90
11
11
11
11
11
11
11
12
22
11
11
22
22
12
11
11
11
11
11
11
11
12
21
11
11
11
11
11
11
12
22
11
11
-356.7
2
-204.4
8
-52.2
4
100.0
0
Sam
ple
s
Similarity
Fig
ure
5.3
3. D
endro
gra
m f
or
oli
ve
oil
sam
ple
s fr
om
Man
isa
(Akhis
ar-S
alih
li-S
aruhan
lı)
and B
urs
a usi
ng F
TIR
sp
ectr
a.

91
5.2.2. GC Results
As we mentioned before the most application field of Gas Chromatography
(GC) in olive oil analysis is the determination of methyl esters of fatty acids. The aim of
this determination is to establish the percentage composition of fatty acids in olive oil,
more commonly known as fatty acid composition, which is influenced by the olive
variety, production zone, climate and stage of maturity of the drupes when they are
collected. Determination of fatty acid composition of olive oil is not only a quality
indicator but also is used for classification and characterization of the oils.
After scanning the olive oil samples with GC chromatography, the collected data
were used for principal component analysis (PCA) and hierarchical cluster analysis
(HCA) by Minitab software.
The combination was made up with the samples from Manisa (Akhisar-Salihli-
Saruhanlı) and Bursa. It is important to investigate the classification since these regions
are very close to each other on the map of Turkey. The score plot of the first component
versus the second component is presented in Figure 5.34. The two PC’s explain
approximately 62 % variation of the data.
As can be seen from the Figure 5.34. most of the olive oil samples were not
discriminated according to geographical origin, all samples were scattered the software
could not idetified samples as a class.
In Figure 5.35. shows principal component analysis (PCA) loading plot.
.Loadings plot is a plot of relation between original variables and subspace dimensions.
Loading plot shows us, variables which are close have high correlation and variables on
opposite side of origin have negative correlation and showed the lack of correlation
between linoleic aicd and monounsaturated fatty acids (MUFA).
Biplots display interunit distance, as weel as variances and correlations of
variables of large data sets. They can be used as a tool to reveal clustering,
multicollinearity, and multivariate outliers, and to guide the interpretation of principal
component analysis (PCA). In a biplot, the length of the lines approximates the variance
of the variables. The longer the line, the higher is the variance. In figure 5.36 shows
biplot, squalene has lower variance but monounsaturated fatty acid (MUFA) has higher
variance because of their line measurements.
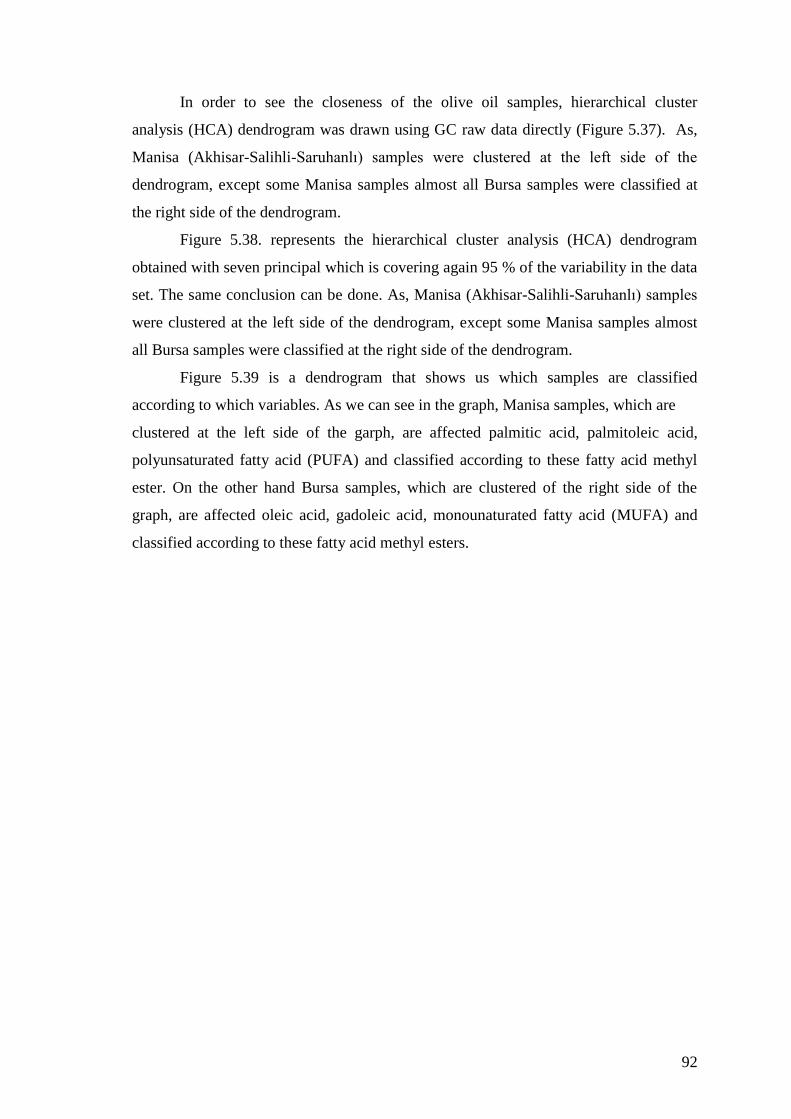
92
In order to see the closeness of the olive oil samples, hierarchical cluster
analysis (HCA) dendrogram was drawn using GC raw data directly (Figure 5.37). As,
Manisa (Akhisar-Salihli-Saruhanlı) samples were clustered at the left side of the
dendrogram, except some Manisa samples almost all Bursa samples were classified at
the right side of the dendrogram.
Figure 5.38. represents the hierarchical cluster analysis (HCA) dendrogram
obtained with seven principal which is covering again 95 % of the variability in the data
set. The same conclusion can be done. As, Manisa (Akhisar-Salihli-Saruhanlı) samples
were clustered at the left side of the dendrogram, except some Manisa samples almost
all Bursa samples were classified at the right side of the dendrogram.
Figure 5.39 is a dendrogram that shows us which samples are classified
according to which variables. As we can see in the graph, Manisa samples, which are
clustered at the left side of the garph, are affected palmitic acid, palmitoleic acid,
polyunsaturated fatty acid (PUFA) and classified according to these fatty acid methyl
ester. On the other hand Bursa samples, which are clustered of the right side of the
graph, are affected oleic acid, gadoleic acid, monounaturated fatty acid (MUFA) and
classified according to these fatty acid methyl esters.

93
5,0
2,5
0,0
-2,5
-5,0
-7,5
7,5
5,0
2,5
0,0
-2,5
-5,0
PC
1
PC2
1 2
Groups
BY
LÇ
KR
DR
AT
CR
İZN
GM
TR
6
TR
5T
R 4
TR
3T
R 2
TR
1
MD
N
MN
V
MN
DG
RC
KS
T
TN
DD
R 2
DR
1BL
K
PZ
DM
B 2
DM
B 1
KY
H
BR
2
BR
1
KD
BL
N 6
BL
N 5
BL
N 4
BL
N 3
BL
N 2
BL
N 1
SR
3S
R 2
SR
1
MC
D 1
0
MC
D 9
MC
D 8
MC
D 7
MC
D 6
MC
D 5
MC
D 4
MC
D 3
MC
D 2
MC
D 1
BL
C 3
BL
C 2
BL
C 1ZO
2Z
O 1
DK
DN
G
AK
H 3
AK
H 2
AK
H 1
BY
KY
6 KY
5
KY
4K
Y 3
KY
2
KY
1Z
AE
2
ZA
E 1
Fig
ure
5.3
4.
Sco
re p
lot
of
the
firs
t co
mponen
t ver
sus
the
seco
nd c
om
pon
ent
for
oli
ve
oil
sam
ple
s fr
om
Man
isa
(Akhis
ar-S
alih
li-S
aruhan
lı)
and B
urs
a u
sin
g
chro
mat
ogra
m.
94
0,3
0,2
0,1
0,0
-0,1
-0,2
-0,3
0,4
0,3
0,2
0,1
0,0
-0,1
-0,2
-0,3
PC
1
PC2
Ox
Suc
IVL
O/L
N
PA
/LO
OA
+V
A/L
OM
UF
A/P
UF
A
PU
FA
/SF
A
PU
FA
MU
FA
SF
A
TF
A
Skuale
n
Lig
noseri
k
Behenik
Gadole
ik
Ara
şid
ik
Lin
ole
nik
TL
0 +
TL
N
Lin
ole
ik
Vaksenik
Ole
ik
Ste
ari
k
Marg
ole
ikM
arg
ari
k
Palm
itole
ikP
alm
itik
Fig
ure
5.3
5.
Lo
adin
g p
lot
of
the
firs
t co
mponen
t v
ersu
s th
e se
cond
com
pon
ent
for
oli
ve
oil
sam
ple
s fr
om
Man
isa
(Akhis
ar-S
alih
li-S
aruhan
lı)
and B
urs
a usi
ng G
C c
hro
mat
ogra
m.

95
5,0
2,5
0,0
-2,5
-5,0
-7,5
7,5
5,0
2,5
0,0
-2,5
-5,0
PC
1
PC2
Ox
Suc
IVL
O/L
N
PA
/LO
OA
+V
A/L
OM
UF
A/P
UF
AP
UF
A/S
FA
PU
FA
MU
FA
SF
A
TF
A
Skuale
nL
ignoseri
kB
ehenik
Gadole
ikA
raşid
ik
Lin
ole
nik
TL
0 +
TL
NL
inole
ik
Vaksenik
Ole
ikSte
ari
kM
arg
ole
ikM
arg
ari
k
Palm
itole
ikP
alm
itik
Fig
ure
5.3
6.
Bip
lot
of
the
firs
t co
mponen
t ver
sus
the
seco
nd c
om
pon
ent
for
oli
ve
oil
sam
ple
s fr
om
Man
isa
(Akhis
ar-S
alih
li-S
aruhan
lı)
and B
urs
a usi
ng G
C c
hro
mat
ogra
m.

96
11
11
22
22
11
12
11
12
22
12
22
22
11
11
11
11
11
11
11
11
11
11
11
11
11
11
11
11
11
11
11
11
11
-332.0
9
-188.0
6
-44.0
3
100.0
0
Sam
ple
s
Similarity
Fig
ure
5.3
7. D
endro
gra
m f
or
oli
ve
oil
sam
ple
s fr
om
Man
isa
(Akhis
ar-S
alih
li-S
aruhan
lı)
and B
urs
a usi
ng G
C c
hro
mat
ogra
m a
nd r
aw d
ata.

97
22
22
11
11
11
21
11
22
21
22
22
21
11
11
11
11
11
11
11
11
11
11
11
11
11
11
11
11
11
11
11
11
11
-339.8
1
-193.2
0
-46.6
0
100.0
0
Sam
ple
s
Similarity
Fig
ure
5.3
8. D
endro
gra
m f
or
oli
ve
oil
sam
ple
s fr
om
Man
isa
Akhis
ar-(
Sal
ihli
-Sar
uhan
lı)
a
nd B
urs
a u
sing G
C c
hro
mat
ogra
m a
nd 7
PC
s.

98
PA/LOOA+VA/LO
MUFA/PUFAMUFA
OleikAraşidik
StearikLO/LN
IVPUFA/SFA
Ox SucPUFA
LinoleikTFA
TL0 +TLNMargoleikMargarik
BehenikGadoleik
LignoserikLinolenikSkualen
Vaksenik
PalmitoleikSFA
Palmitik
-263.2
5
-142.1
7
-21.0
8
100.0
0
Vari
able
s
Similarity
Fig
ure
5.3
9. D
endro
gra
m f
or
var
iable
s (F
atty
aci
d m
eth
yl
este
rs).

99
5.2.3. HPLC Results
High performance liquid chromatography (HPLC) and combined
chromatographic methods has a great emphasis in olive oil analysis techniques. Several
minor components of olive oil such as phenolic compounds, pigments, sterols,
tocopherols and triacylglycerols can be identified and quantitated with this technique.
Percentage determination of the various triglycerides present in virgin olive oil or high
performance liquid chromatography offers a way of detecting possible adulterations
with oils which, while having a similar fatty acid composition to olive oil, have a
different triglyceride composition.
The same combination of the samples that are given in GC were used for
principal component analysis (PCA) and principal component analysis (PCA)
hierarchical cluster analysis (HCA) in order to compare the results. The group had
included Manisa (Akhisar-Salihli-Saruhanlı) and Bursa olive oil samples. The principal
component analysis (PCA) score plot result using HPLC is shown in Figure 5.40. As
can be seen from the figure, almost all Bursa samples were placed on the negative part
of the principal component one (PC1) and positive part of the principal component two
(PC2). On the other hand Manisa samples were to be scattered on the graph.
The loading of the two first components, were plotted to investigate the
relationship between the various triacylglycerol (TAG) and represet in Figure 5.41. The
plot of the loading of the two first components, expressing the relationship between the
various triacylglycerol (TAG) showed the lack of correlation between triolein and
trilinolein (LLL).
Figure 5.42. represents the principal component analysis (PCA) biplot. Biplots
are a type of exploratory graph used in statistics, a generalization of the simple two
variable scatterplot. A biplot allows information on both samples and variables of a data
matrix to be displayed graphically. Samples are displayed as points while variables are
displayed either as vectors, linear axes or nonlinear trajectories.
In figure 5.43. shows hierarchical cluster analysis (HCA) dendrogram by using
raw (original) data. As we can see in the figure some Bursa samples mixed with Manisa
(Akhisar) samples and the samples in dendrogram were separated in two main classes
according to their sampling region (Manisa and Bursa).

100
Furthermore, HCA also demonstrates that similar samples are clustered in the
same region (Figure 5.44). Figure 5.44. represents the hierarchical cluster analysis
(HCA) dendrogram obtained with seven principal components covering again 95 % of
the variability in the data set. This dendrogram shows similarity with the result obtained
by principal component analysis (PCA) and shows the closeness of the samples. As it
can be concluded from Figure 5.44. most of the olive oil samples from Bursa are
clustered at right cluster and the others at the left cluster. Although the samples were
from very close neighbor regions (from Manisa samples) they were clustered mainly
with some exceptions.
Figure 5.45 is a dendrogram that shows us which samples are classified
according to which variables. As we can see in the graph, Manisa samples, which are
clustered at the left side of the garph, are affected trilinolein (LLL), equivalent carbon
number 42 (ECN42), equivalent carbon number 44 (ECN44) and classified according to
these triacylglycerols. On the other hand Bursa samples, which are clustered of the right
side of the graph, are affected equivalent carbon number 48 (ECN48), equivalent carbon
number 50 (ECN50), triolein (OOO) and classified according to these triacylglycerols.

101
86
42
0-2
-4-6
-8
5,0
2,5
0,0
-2,5
-5,0
-7,5
PC
1
PC2
1 2
Groups
GM
BY
L
ÇK
R
DR
A
TC
R
İZN
TR
6T
R 5
TR
4
TR
3T
R 2
TR
1
MD
N
MN
V
MN
DG
RC
KS
TT
ND
DR
2D
R 1
BL
KP
Z
DM
B 2
DM
B 1
KY
H
BR
2
BR
1
KD
BL
N 6
BL
N 5
BL
N 4
BL
N 3
BL
N 2
BL
N 1
KR
KS
R 3
SR
2
SR
1
MC
D 1
0
MC
D 9
MC
D 8
MC
D 7
MC
D 6M
CD
5
MC
D 4
MC
D 3
MC
D 2
MC
D 1
BL
C 3
BL
C 2
BL
C 1
BY
ZO
2
ZO
1
DK
AK
H 3
AK
H 2
AK
H 1
KY
6
KY
5
KY
4K
Y 3K
Y 2
KY
1Z
AE
2
ZA
E 1
Fig
ure
5.4
0. S
core
plo
t of
the
firs
t co
mponen
t ver
sus
the
seco
nd c
om
ponen
t fo
r oli
ve
oil
sam
ple
s fr
om
Man
isa
(Akhis
ar-S
alih
li-S
aruhan
lı)
and B
urs
a usi
ng H
PL
C c
hro
mat
ogra
m.

102
0,3
0,2
0,1
0,0
-0,1
-0,2
-0,3
0,4
0,3
0,2
0,1
0,0
-0,1
-0,2
-0,3
-0,4
Fir
st
Com
ponent
Second Component
EC
N 4
2 f
ark
OO
O/P
OO
LO
O/P
LO
EC
N48/E
CN
46
PL
L/O
LL
LL
L/E
CN
42
PL
O/O
OO
EC
N 5
0E
CN
48
EC
N46
EC
N44
EC
N42
PO
S
SO
O
PP
P
PO
PS
LO
+ P
OO
OO
O
PL
P
PoO
P
PL
O +
SL
L
PoO
O
LO
O +
PL
nP
PO
Ln
PL
L
OL
nO
OL
L
PL
LnLO
Ln +
PO
LL
LL
L
Fig
ure
5.4
1.
Lo
adin
g p
lot
of
the
firs
t co
mponen
t v
ersu
s th
e se
cond c
om
pon
ent
for
oli
ve
oil
sa
mple
s fr
om
Man
isa
(Akhis
ar-S
alih
li-S
aruhan
lı)
and B
urs
a usi
ng H
LP
C
c
hro
mat
ogra
m.
Fig
ure
5.4
1.
Lo
adin
g p
lot
of
the
firs
t co
mponen
t v
ersu
s th
e se
cond c
om
pon
ent
for
oli
ve
oil
sam
ple
s fr
om
Man
isa
(Akhis
ar-S
alih
li-S
aruhan
lı)
and B
urs
a usi
ng H
PL
C c
hro
mat
ogra
m.

103
86
42
0-2
-4-6
-8
5,0
2,5
0,0
-2,5
-5,0
-7,5
PC
1
PC2
EC
N 4
2 f
ark
OO
O/P
OO
LO
O/P
LO
EC
N48/E
CN
46
PL
L/O
LL
LL
L/E
CN
42
PL
O/O
OO
EC
N 5
0E
CN
48
EC
N46
EC
N44
EC
N42
PO
S
SO
OP
PP
PO
PS
LO
+ P
OO
OO
O
PL
PP
oO
PPL
O +
SL
L
PoO
O
LO
O +
PL
nP
PO
LnP
LL
OL
nO
OL
L
PL
Ln
LO
Ln +
PO
LL
LL
L
Fig
ure
5.4
2.
Bip
lot
of
the
firs
t co
mponen
t ver
sus
the
seco
nd c
om
pon
ent
for
oli
ve
oil
sam
ple
s fr
om
Man
isa
(Akhis
ar-S
alih
li-S
aruhan
lı)
and B
urs
a usi
ng H
PL
C c
hro
mat
ogra
m.

104
22
22
11
22
22
12
11
11
11
11
11
11
11
11
11
21
11
12
12
11
11
11
11
12
11
11
11
11
11
11
11
11
11
-457.4
1
-271.6
1
-85.8
0
100.0
0
Sam
ple
s
Similarity
Fig
ure
5.4
3. D
endro
gra
m f
or
oli
ve
oil
sam
ple
s fr
om
Man
isa
(Akhis
ar-S
alih
li-S
aruhan
lı)
a
nd B
urs
a u
sing H
PL
C c
hro
mat
ogra
m a
nd r
aw d
ata.
Fig
ure
5.4
3.
Den
dro
gra
m f
or
oli
ve
oil
sam
ple
s fr
om
Man
isa
(Akhis
ar-S
alih
li-S
aruhan
lı)
and B
urs
a usi
ng H
PL
C c
hro
mat
ogra
m a
nd r
aw d
ata

105
22
22
11
22
22
21
12
11
11
11
11
11
11
11
11
11
11
11
11
12
11
12
12
11
11
11
11
11
11
11
11
11
11
-510.4
1
-306.9
4
-103.4
7
100.0
0
Sam
ple
s
Similarity
Fig
ure
5.4
4. D
endro
gra
m f
or
oli
ve
oil
sam
ple
s fr
om
Man
isa
Akhis
ar-(
Sal
ihli
-Sar
uhan
lı)
and B
urs
a usi
ng H
PL
C c
hro
mat
ogra
m a
nd 7
PC
s.

106
ECN 50SOOPOSPPP
ECN48/ECN46ECN 48
OOO/POOLOO/PLO
OOOPLL/OLL
SLO + POOPoOO
POPPLP
PoOPPOLnOLnO
ECN 42 farkPLLn
ECN42LOLn +POLL
PLO/OOOPLO + SLL
ECN44PLL
LOO +PLnPECN46
OLLLLL/ECN42
LLL
-444.4
2
-262.9
5
-81.4
7
100.0
0
Vari
able
s
Similarity
Fig
ure
5.4
5. D
endro
gra
m f
or
var
iable
s (T
riac
ylg
lyce
rol)
.

107
CHAPTER 6
CONCLUSION
In this thesis, it is aimed to develop classification models of olive oil produced
in Turkey based on geographical origin via chromatographic and molecular
specgtrometry. The olive oil samples were taken from different regions of Turkey and
then they were scanned with molecular spectrometric method (FTIR-ATR) and
chromatographic methods (GC and HPLC). Afterwards, unsupervised (principal
component analysis, PCA and hierarchical cluster analysis, HCA) methods were used
for the classification of olive oil samples.
Differentiation of olive oil samples was examined based on their geographical
origins. For this purpose two different harvest year and three different scenarios were
tested. The first harvest year (2009-2010) two different scenarios were constructed, the
first one was based on the samples from Manisa (Akhisar region) and Bursa and the
second one was established on the samples from Manisa (Salihli-Saruhanlı region) and
Bursa. The second harvest year (2010-2011) one scenario was tested, it was based on
the samples from Manisa (Akhisar-Salihli-Saruhanlı) and Bursa. Successful
differentiations were obtained with samples from Manisa and Bursa by processing
molecular spectrometric and chromatographic data. Although the samples from
neighbor regions (Akhisar, Salihli and Saruhanlı) clear distinctions were obtained by
processing molecular spectrometric and chromatographic data.
In conclusion, although molecular spectrometry is more advantageous for the
classification of olive oil samples in the case of saving time, saving chemicals and ease
of usage, chromatography gave better classification results based on geograpical origin
compared to results obtained with molecular spectrometry.
108
REFERENCES
Abdi, H. Principal component analysis. Wiley Interdisciplinary Reviews: Computational
Statistics, 2. 2010.
Angerosa, F.; Di Giacinto. L.; Basti, C.; Serraiocco. A. Influence of the enviroment
variable on composition of virgin olive oils. Rivista Italiana delle Sostanze
Grasse. 1996, 73, 461-467.
Aparicio, R.; Luna, R. Characterization of monovarietal virgin olive oils. European
Journal of Lipid Science Technology. 2002, 104, 614-627.
Aranda, F.; Gomez-Alanso, S.; Riveradel, R. M.; Salvador, M. D.; Fregapane, G.
Triglyceride, total and 2-position fatty acid composition of Cornicabra virgin
olive oil: Comparison with other Spanish cultivars. Food Chemistry. 2004, 86,
485-492.
Babcock, B. A.; Clemens, R. Geographical indications and property rights; Protecting
value-added agricultural products. MATRIC Briefing Paper 04-MBP 7. 2004,
Ames, Iowa.
Beebe, K. R.; Pell, R. J.; Seasholtz,M. B. Chemometrics, a pratical guide. Wiley
Interscience: John Wiley & Sons, Inc. 1998.
Bendini, A.; Cerretani, L.; Di Virgilio, F.; Belloni, P.; Bonoli-Carbognin, M.; Lercker,
G. Preliminary evaluation of the application of the FT-IR spectroscopy to
control the geographic origin and quality of virgin olive oils. Journal of Food
Quality. 2007, 30, 424-437.
Blekas; G.; Tsimidou, M.; Boskou, D. Contribution of α-tocopherol to olive oil stability.
Food Chemistry 1995, 52, 289-294.
Bosetti, C.; La Vecchia, C.; Talamini, R.; Negri, E.; Levi, F.; Dal Maso, L.; Franceschi,
S. Food groups and laryngeal cancer risk: A case-control study from Italy and
Switzerland. International Journal of Cancer. 2002, 100, 355-360.
Brereton, R. G. Chemometrics, data analysis of the laboratory chemical plant. Wiley,
John Wiley & Sons Ltd. 2003.
Capasso, R.; Cristinzio, G.; Evidente, A.; Scognamiglio, F. Isolation spectroscopy and
selective phytotoxic effects of polyphenols from vegetable waste waters.
Phytochemistry. 1992, 32, 4125-4128.
Cinquanta, L.; Esti, M.; La Notte, E. Evoulation of phenolic compounds in virgin oliive
oil during storage. Journal of American Oil Chemists’ Society. 1997, 74, 1259-
1264.
De Fellice, M. Gomes, T. Catalano, M. Centrifugazione delle paste. Risultati di ricerche
trienali. Rivista Italiana delle Sostanze Grasse. 1979, 56, 361-369.

109
De luca, M.; Oliverio, F.; Ioelea, D.; Husson, G. P.; Ragno, G. Monitoring of water
quality in South Paris district by clustering and SIMCA. International Journal
of Enviromental Analytical Chemistry. 2008, 88(15), 1087-1105.
Delaney, M. Chemometrics. Analytical Chemistry. 1984, 52, 261-277.
Di Giovacchino, L.; Sestili, S.; Di Vincenzo, D. Influence of olive processing on virgin
olive oil quality. European Journal of Lipid Science and Technology. 2002, 104,
587-601.
D’Imperio, M.; Dougo, G.; Alfa, M.; Mannina, L.; Segra, A. L. Statistical analysis on
Sicilian olive oils. Food Chemistry. 2007, 102, 956-965.
Downey, G. Food and food ingredient authentication by mid-infrared spectroscopy and
chemometrics. Trends Analytical Chemistry. 1998, 17, 418-424.
Einax, J. W.; Zwanziger, H. W.; Geiss, S. Chemometrics in enviromental chemistry.
Weinheim, Germany. VCH. 1997.
Ferreiro, L.; Aparicio, R. Influence of altitude on the chemical composition of virgin
olive oils. Grasa y Aceites. 1992, 43, 149-155.
Garcia-Villar, N.; Hernandez-Cassou, S.; Javier,S. Characterization of wines through
the biogenic amine contents using chromatographic techniques and chemometric
data analysis. Journal of Agricultural and Food Chemistry. 2007, 55(18), 7453-
7461.
Gutiérrez, F.; Perdiguero, S.; Garcia, J.; Castellano, M. Quality of oils from olives
stored under controlled atmosphere. Journal of American Oil Chemists’ Society.
1992, 69, 1215-1218.
Ha, C. S.; Dubey, P.; Goyal, L. K.; Hess, M.; Cabanillas, F.; Cox, J. D. Localized
primary non-Hogkin lymphoma of the breast. American Journal of Clinical
Oncology. 1998, 21, 376-380.
Hair, J. F.; Anderson, R. E.; Tatham, R. L. Multivariate data analysis. Ed. 2. MacMillan.
1987. 449.
Harvey, D. Modern Analytical Chemistry. The McGraw-Hill Companies. 2000.
Harwood, John and Aparicio Ramon eds. Handbook of olive oil. Analysis and
Properties. 2000, Gaithersburg. Aspen publications.
http://en.wikipedia.org/wiki/FTIR (accessed February 14, 2013).
International Olive Oil Council. 2012. www.internationaloliveoil.org (accessed
December 14, 2012)
Kiritsakis, A. K. Flavour components of olive oil- A review. Journal of the American
Oil Chemists’ Society. 1998, 75(6), 673-681.

110
Kowalski, B. Chemometrics. Analytical Chemistry. 1980, 54, 233-243.
Kris-Etherton, P. M. High-monounsaturated fatty acid diets lower both plasma
cholesterol and triacylglycerol concentrations. The American Journal of Clinical
Nutrition. 1999, 70, 1009-1015.
Lavine, B. Chemometrics. Analytical Chemistry. 1998, 70, 209-228.
Maestro Duran, R. Relationship between the composition and ripening of the olive and
quality of the oil. Acta Horticulturae. 1990, 286, 441-451.
Mailer, Rod. 2006. Chemistry and Quality of Olive Oil.
http://www.dpi.nsw.gov.au/__data/assets/pdf_file/0003/87168/pf227-Chemistry-and
quality-of-olive-oil.pdf. (accessed February 2013)
Massart, D. L.; Vandeginste, B. G. M.; Buydens, L. M. C.; de Jong, S. Handbook of
chemometrics and qualimetrics. Elsevier. 1998.
Matos, L. C.; Cunha, S. C.; Amaral, J. S.; José, A. P.; Andrade, P. B.; Seabra, R. M.;
Oliveira, B. P. P. Chemometric characterization of three varietal olive oils (Cvs.
Cobrançosa, Madural and Verdeal Transmontana) extracted from olives with
different maturation indices. Food Chemistry. 2007, 102, 406-414.
Minguez-Mosquera, M.; Rejano-Navarro, L.; Gandul-Rojas, B. Color pigment
correlation in virgin olive oil. Journal of the American Oil Chemists’ Society.
1991, 68, 332-336.
Morales, M. T.; Aparicio, R.; Calvente, J. J. Influence of olive ripeness on the
concentration of green aroma compounds in virgin olive oil. Flavour and
Fragrance Journal. 1996, 11, 171-178.
Moussa, M. Y.; Gerasopoulos, D. Effect of altitude on fruit and oil quality
characteristics of “Mastoides” olives. Journal of the Science of Food and
Agriculture. 1996, 71, 345-350.
Osman, M.; Metzidakis, I.; Girasopoulos, G.; Kiritsakis, A. Quantitative changes in
olive oil of fruits collected from trees grown at two altitudes. Rivista Italiana
delle Sostanze Grasse. 1994, 71, 187-189.
Papadopoulos G.; Tsimidou, M.; Boskou, D. Stability of virgin olive oil: Assessment of
natural antioxidants and other related factors. Elsevier. 1993, 321-326.
Pis, L.; Majek, P.; Sadecka, J. Synchronous Fluorescence Spectroscopy for
Differentiating Between Brandies and Wine Distillates. Acta Chimica Slovaca.
2011, 4, 47-58.
Poulli, K. I.; Mousdia, G. A.; Georgiou, C. A. Classification of edible and lampante
virgin olive oil based on synchronous fluorescence and total luminescence
spectroscopy. Analytica Chimica Acta. 2005, 542, 151-156.

111
Ranalli, A.; Angerosa, F. Integral centrifuges for olive oil extraction. The qualitative
characteristics of products. Journal of American Oil Chemists’ Society. 1996,
74, 1105-1113.
Restrepo, G.; Mesa, H.; Llanos, E. J. Three Dissimilarity Measures to Contrast
Dendrograms. Journal of Chemical Information and Modelling. 2007, 47, 761-
770.
Rezzi, S.; Axelson, D. E.; Heberger, K.; Reniero, F.; Mariani, C.; Guillou,C.
Classification of olive oils using high throughput flow 1H NMR fingerprinting
with principal component analysis, linear discriminant analysis and probabilistic
neural networks. Analytica Chimica Acta. 2005, 552, 13-24.
Salas, J.; Sanchez, J. The decrease of virgin olive oil flavor produced by high
malaxation temperatures is due to inactivation of hydroperoxide lyase. Journal
of Agricultural and Food Chemistry. 1999, 47, 809-812.
Sharaf, M. A.; Illma, D. L.; Kowalski, B. R. Chemometrics. John Wiley & Sons Inc.
1986.
Skoog, D. A.; Holler, F. J.; Nieman, T. A. Principles of instrumenatl analysis. Saunders
College Publishing, Harcourt Brace College Publishers. 1998, 357-383.
Ulberth, F.; Buchgraber, M. Authenticity of fats and oils. European Journal of Lipid
Science Technology. 2000, 102, 687-694.
Varmuza, K.; Filmose, P. Introduction to multivariate statistical analysis in
chemometrics. Taylor and Francis. 2008.
Williams, J. Principal component analysis. Wiley Interdisciplinary Reviews:
Computational Statistics, 2. 2010.
Woodcock, T.; Downey, G.; Kelly, J. D.; O”Donnell, C. Geographical classification of
honey samples by near-infrared spectroscopy: A feasibility study. Journal of
Agricultural and Food Chemistry. 2007, 55, 9128-9134.
Wright, J. Effect of high-carbohydrates versus high-monounsaturated fatty acid diets on
metabolic control in diabetes and hyperglycemic patients. Clinical Nutrition.
1998, 17, 35-45.