development of computerized bangkok bus transit analytical
TRANSCRIPT

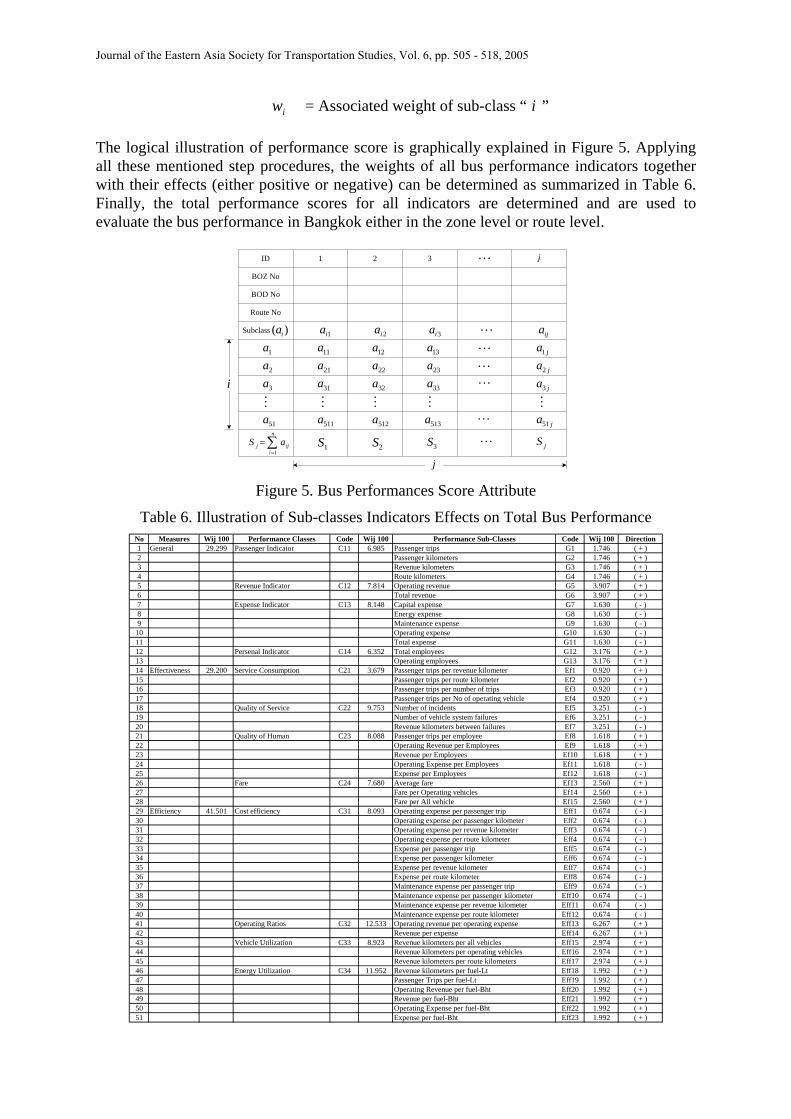
DEVELOPMENT OF COMPUTERIZED BANGKOK BUS TRANSIT ANALYTICAL SYSTEM
Narongsak BORVORNVONGPITAK Graduate Student School of Civil Engineering Asian Institute of Technology P.O.Box 4, Klong Luang, Pathumthani 12120, Thailand Fax: +662-524-5509 E-mail: [email protected]
Yordphol TANABORIBOON Professor School of Civil Engineering Asian Institute of Technology P.O.Box 4, Klong Luang, Pathumthani 12120, Thailand Fax: +662-524-5509 E-mail: [email protected]
Abstract: This paper presents the development of the Computerized Bangkok Bus Transit Analytical System, BBTAS, to enhance the performance evaluation of the existing bus system in Bangkok. The bus performance indicators are classified into three performance measurement groups and each group was broken down into the performance class and sub-class. The weights of each performance class and sub-class were conducted mathematically to describe the bus operating performance level. The Analytical Hierarchy Process (AHP) was applied for weighing the bus performance class and sub-class. Finally, the user gracious computerized BBTAS package was developed to evaluate the performances of all bus routes in Bangkok. To demonstrate the real world application of this developed system, this paper used the bus operating data of 88 non- air-conditioned bus routes in Bangkok to evaluate their performances. Considering all mentioned performance indicators, this developed system can rank all 88 routes from the best to the worst. Key Words: Bus Performance Indicator, Computerized, Analytical Hierarchy Process
(AHP), Bangkok 1. INTRODUCTION The existing bus transit system in Bangkok has just recently been added up with another system locally known as “sky-train” rail transit. Ironically, this new rail transit system is not only an alternative but it can also be the competitor of the existing bus system. As the user’s perspective, both systems must have adequate operation performance. Thus, the transit company must have a good evaluating system to self-evaluate their own services. Unfortunately, the planning, management and operation of Bangkok bus system still depend on manual daily bus data collection. Everyday, bus personnel are required to manually record their entire bus operations and services on the prepared forms, which are later summarized as a monthly report. These monthly reports are then submitted to the executives for their assessment and recommendation for further bus operation, planning, and management development, which normally take place on a month by month basis. Considering these large number of bus operations, it is significant to have a good performance evaluation system in order to obtain the system’s drawback effectively. However, the existing Bangkok bus transit performance evaluation has been performed manually and straightforwardly. The manager/administrator just simply selected certain single indicators to evaluate their bus performances. Considering the large number of buses
Journal of the Eastern Asia Society for Transportation Studies, Vol. 6, pp. 505 - 518, 2005
505

and services, it seems that these indicators cannot represent the actual bus performance in different perspectives. Therefore, this paper aims to develop the computerized system to enhance performance evaluation of the existing bus system in Bangkok. 2. CURRENT BANGKOK BUS TRANSIT The Bangkok Mass Transit Authority, BMTA, a state enterprise under the Ministry of Transport, was established in 1976 to provide bus services to serve about two-thirds of the total public transport demand in Bangkok. Presently, BMTA operates with about 4,000 buses covering 122 bus routes (BMTA, 2003), offering services to approximately 10 million inhabitants throughout the Bangkok Metropolitan Area and its surrounding provinces. BMTA divides its operation and services into 8 bus operation zones (BOZ). However, all these 8 zones do not have much spatial relevance. Bus routes under control of any zone may operate in different zones of the city. Basically, each zone serves as an operational unit and not as spatial unit. Each BOZ normally controls around 10-20 bus routes. On the other hand, the BOZ is an important level in the decision-making process of BMTA as all planning and management decisions relating to bus operation are taken at this level. The BOZ Offices function as an implementing arm of BMTA as all tasks relating to daily bus operations are delegated to the zone offices. The Head Quarter or the Main Office functions primarily as the overall policy making, coordinating and monitoring authority while the main responsibility of a BOZ Office is to manage bus operations in its jurisdiction according to the policies set by the Head Quarter. These policies include the setting of some performance indicators. Each BOZ Office is divided into 3 bus operational divisions (BOD) and each BOD is operated under the broad policy guidelines set by the Head Quarter. As mentioned earlier, BMTA still employs the primitive approach of manual data collection for their performance evaluation. The major instruments used in collecting relevant bus operation data in BMTA are a set of forms which include driver form, conductor form and bus operation form. Each BOD is required to prepare a daily summary for each bus route and all forms are forwarded and processed at the BOZ Office. This report is presented at a monthly meeting and an assessment is made on overall bus performance evaluation of the zone against the target for the concerned month. Also, this report is submitted to the Head Quarter for the use by BMTA executives. In an organized management perspective, the analysis and evaluation of bus performance should be done at the organizational level instead of the independent analysis at BOZ levels through the specific performance indicators, which unfortunately are not available in the current practice of BMTA. Therefore, it is very essential that BMTA comes up with a proper analytical system and also the computerized analytical system to overcome these problems 3. DEVELOPMENT OF BANGKOK BUS TRANSIT ANALYTICAL SYSTEM
(BBTAS) Prior to develop the computerized Bangkok Bus Transit Analytical System, it is necessary to develop its bus performance analytical system. The evaluation procedure of the bus operating performance namely the Bangkok Bus Transit Analytical System (BBTAS) is demonstrated as shown in Figure 1. The characteristics of bus operating data type affecting the operating
Journal of the Eastern Asia Society for Transportation Studies, Vol. 6, pp. 505 - 518, 2005
506

performance are specific and assorted in their nature. Therefore, these data should be hierarchically categorized into the form of the bus standard performance indicators by applying the concept of definition a community performance measurement. These indicators are classified into three groups: general performance, effectiveness measures, and efficiency measures. Each performance measurement group was broken down into the performance class and the performance sub-class based on their related characteristics and criteria.
captured
BMTA Operating Characteristics
identified
weighted
Bus Standard Performance Criteria Priority
Bus Standard Performance Indicators
Bus Standard Performance Criteria categorized
Analytic Hierarchy Process(AHP)
analyzed
General Performance Indicators
Efficiency MeasureEffectiveness Measure
Figure 1. Overall Framework of Evaluation Procedure
The weights of each performance class and sub-class were mathematically conducted to describe the bus operating performance. Since the variables affecting bus operating performance are hierarchically organized, Analytical Hierarchy Process (AHP) (Saaty, 2000; Atthirawong and MacCarthy, 2001; Atthirawong, 2002) was then applied for weighing the bus performance classes and sub-classes. Accordingly, the questionnaire was designed for identifying the priority for the bus standard performance indicators/variables. The pilot survey was performed to assess the validity of the questionnaire. Subsequently the verified versions of questionnaires were distributed to the specialists who are the keyed managers/administrators of BMTA. Finally, the results of AHP analysis were applied to measure the relative weights of each performance measurement. 3.1 Classification of Bus Performance Indicators As mentioned earlier, the bus performance indicators are classified into three groups, and each bus performance group is further divided into four classes while different classes explain different performance characteristics. The first performance group, the general performance indicator, composes of the passenger indicator, the revenue indicator, the expense indicator, and the personal indicator. The second group, the effectiveness measures, consists of the service consumption indicator, the quality of service indicator, the quality of human indicator and the fare indicator. The last group, the efficiency measures, contains the cost efficiency indicator, the operating ratios indicator, the vehicle utilization indicator, and the energy utilization indicator. Each bus performance class is then further divided into several sub-classes based on their related characteristics as illustrated in Table 1.
Journal of the Eastern Asia Society for Transportation Studies, Vol. 6, pp. 505 - 518, 2005
507