development of enhanced lateral flow test devices for
TRANSCRIPT
University of Rhode Island University of Rhode Island
DigitalCommons@URI DigitalCommons@URI
Open Access Master's Theses
2013
Development of Enhanced Lateral Flow test Devices for Point-of-Development of Enhanced Lateral Flow test Devices for Point-of-
Care Diagnostics Care Diagnostics
Roman Gerbers University of Rhode Island, [email protected]
Follow this and additional works at: https://digitalcommons.uri.edu/theses
Recommended Citation Recommended Citation Gerbers, Roman, "Development of Enhanced Lateral Flow test Devices for Point-of-Care Diagnostics" (2013). Open Access Master's Theses. Paper 123. https://digitalcommons.uri.edu/theses/123
This Thesis is brought to you for free and open access by DigitalCommons@URI. It has been accepted for inclusion in Open Access Master's Theses by an authorized administrator of DigitalCommons@URI. For more information, please contact [email protected].

DEVELOPMENT OF ENHANCED LATERAL FLOW TEST DEVICES
FOR POINT-OF-CARE DIAGNOSTICS
BY
ROMAN GERBERS
A THESIS SUBMITTED IN PARTIAL FULFILLMENT OF THE
REQUIREMENTS FOR THE DEGREE OF
MASTER OF SCIENCE
IN
MECHANICAL ENGINEERING
UNIVERSITY OF RHODE ISLAND
2013

MASTER OF SCIENCE THESIS
OF
ROMAN GERBERS
APPROVED:
Thesis Committee:
Major Professor Dr. Mohammad Faghri
Dr. Constantine Anagnostopoulos
Dr. Jason R. Dwyer
Dr. Nasser H. Zawia
DEAN OF THE GRADUATE SCHOOL
UNIVERSITY OF RHODE ISLAND
2013

ABSTRACT
Lateral flow Imunoassays (LFIA) are common, simple to use point-of-care devices
for the diagnostic market. Conventionally LFIAs are limited in their complexity since
they are optimized for minimally trained operators. Paper-based analytical devices
(PAD) are advanced sensors based on a wide range of recently developed techniques
for complex analytical methods. In this research, a point-of-care (POC) immunosensor
was developed based on techniques adapted from lateral flow and paper-based
analytical devices. Alternating layers of paper and tape were used to expand the
common 2D design of lateral flow tests to 3D in order to enable complex fluid flow
control. Four fluidic valves were integrated for automatic sequential loading of three
different fluids to a detection area. Fabrication processes, reagent concentrations,
materials and device geometries were optimized and a chip-yield of 92% was achieved.
A three step alkaline phosphatase (ALP)-based enzyme-linked immunosorbent assay
(ELISA) procedure with Rabitt IgG as model analyte was used to prove the working
principle of the sensor. After optimization of crucial assay parameters practicability was
verified by visual detection of signal development on nitrocellulose membrane after
reaction of ALP and NBT/BCIP with a good detection limit of 4.8 fm.
Keywords: Lateral Flow Imunoassay (LFIA) Paper-based Analytical device (PAD),
Alkaline Phosphatase (ALP), Enzyme Linked Immunosorbent Assay (ELISA), Point-of-
Care (POC)
iii
ACKNOWLEDGMENTS
It has been a wonderful and unforgettable experience spending the exchange year
on completing my Master’s thesis in the Department of Mechanical Engineering,
University of Rhode Island.
First of all, I would like to thank Dr. Mohammad Faghri for his continuous guidance,
encouragement and support throughout the course of this research. It has been a real
pleasure to work with him, on this promising field.
I am grateful to Dr. Constantine Anagnostopoulos for his invaluable suggestions
and continuous help. Furthermore, I would also like to thank Dr. Hong Chen, and
Jeremy Cogswell. I learned a lot from them, such as sophisticated laboratory skills and
the ability of developing new techniques to tackle the challenges in research. Great
thanks to my lab colleague and good friend Wilke Föllscher without him it would not
have been the same unforgettable experience.
Special thanks to Nadine Madanchi, who has been supporting and encouraging
me from the beginning till the end, especially in the time of difficulties.
Finally, I want to thank my parents Kirsten Gerbers and Björn Gerbers. Without
their enduring love, care and support in any situations of my life I could not have gone
this path and reached the point where I am today.
iv
TABLE OF CONTENTS
ABSTRACT ........................................................................................................................ ii
ACKNOWLEDGMENTS .................................................................................................... iii
TABLE OF CONTENTS ...................................................................................................... iv
LIST OF TABLES ............................................................................................................. viii
LIST OF FIGURES ............................................................................................................. ix
LIST OF ABBREVIATIONS............................................................................................... xiii
LIST OF SYMBOLS ......................................................................................................... xiv
CHAPTER 1 - INTRODUCTION ......................................................................................... 1
1.1 Point of Care Diagnostics and Diagnostic Devices ......................................... 1
1.2 Justification .................................................................................................... 4
1.3 Paper Based Analytical Devices ..................................................................... 5
1.4 Immunoassays ............................................................................................... 6
1.4.1 Antibodies and Recognition Reaction ................................................ 6
1.5 Lateral Flow Test Strips .................................................................................. 9
1.5.1 Membrane ....................................................................................... 10
1.5.2 Sample Pad ...................................................................................... 12
1.5.3 Conjugate Pad .................................................................................. 14
1.5.4 Absorbent Pad ................................................................................. 16
1.5.5 Housing ............................................................................................ 16
1.6 Objective and Outline of the Thesis ............................................................ 16
CHAPTER 2 – LITERATURE REVIEW .............................................................................. 18
2.1 Analytical Methods Based on Immunoassays ............................................. 18
2.1.1 Labeling-Detection Systems ............................................................. 18
2.1.2 Immunoassay Designs ..................................................................... 21

v
2.1.3 Surface Binding Techniques ............................................................. 23
2.1.4 Assay Validation ............................................................................... 25
2.2 Limitations of Lateral Flow Immunoassay ................................................... 31
2.3 Sensing Approaches on Paper-based Devices ............................................. 32
2.3.1 Optical Detection: Methods and Detector Systems ........................ 33
2.3.2 Electrochemical Detection: Methods and Detector Systems .......... 35
2.3.3 Energetic Principles ......................................................................... 37
2.3.4 Analytical Principles ......................................................................... 37
2.4 Fabrication Methods for PADs .................................................................... 39
2.4.1 Three-dimensional PADs .................................................................. 40
2.5 Control of Fluid Flow in Paper-based Devices ............................................. 42
2.5.1 Single-use Buttons ........................................................................... 43
2.5.2 Fluidic Timers ................................................................................... 44
2.5.3 Mechanical Switch ........................................................................... 44
2.5.4 Fluidic Valve ..................................................................................... 45
2.6 Modelling of Fluid Flow in Cellulose Substrates .......................................... 47
2.6.1 Paper Wet-out.................................................................................. 47
2.6.2 Fully wetted Flow ............................................................................. 48
2.6.3 Abundant vs. Constricted Flow ........................................................ 49
2.6.4 Electrical Circuit Analogy ................................................................. 50
CHAPTER 3 - METHODOLOGY ...................................................................................... 52
3.1 Chip Fabrication Method ............................................................................. 52
3.2 Valve Fabrication Methods .......................................................................... 53
3.2.1 Disk Punching ................................................................................... 55
3.2.2 Disk-holding Layers .......................................................................... 57
3.2.3 Surfactant Cellulose-Powder ........................................................... 59
vi
3.2.4 Optimization of Surfactant .............................................................. 61
3.3 Material Selection and Processing .............................................................. 62
3.4 3D Lateral Flow Test Strip Development ..................................................... 63
3.4.1 One Valve two Inlets Design ............................................................ 64
3.4.2 Two Valves two Inlets Design ........................................................... 65
3.4.3 Four Valves three Inlets Design ....................................................... 67
3.5 Chip Optimization ........................................................................................ 69
3.6 Assay Development ..................................................................................... 70
3.6.1 Assay Preparation Procedure........................................................... 71
3.6.2 Assay Implementation Procedure ................................................... 72
3.6.3 Optimization of Conjugate Release ................................................. 74
3.6.4 Optimization of Detection Antibody ................................................ 75
3.6.5 Optimization of Capture Antibody................................................... 75
3.6.6 Dose Response ................................................................................. 76
3.7 Housing Development ................................................................................. 76
3.7.1 Reagent Storing ............................................................................... 77
CHAPTER 4 – FINDINGS AND DISCUSSION ................................................................... 79
4.1 Material Processing ..................................................................................... 79
4.2 Development and Optimization of the Fluidic Circuit ................................. 80
4.2.1 Comparison of Fabrication Methods ............................................... 81
4.2.2 Impact of Fabrication on Reliability and Repeatability .................... 84
4.2.3 Optimization of Surfactant .............................................................. 87
4.2.4 Optimization of Trigger-channel Design .......................................... 88
4.3 Determination of Chip Geometry and Materials ........................................ 89
4.3.1 Trigger Channel Length .................................................................... 89
4.3.2 Chip Geometry and Absorption Area .............................................. 91

vii
4.3.3 Geometry and Proof of Concept ..................................................... 93
4.4 Optimization of Assay Parameters .............................................................. 94
4.4.1 Optimization of Conjugate Release ................................................. 94
4.4.2 Polyclonal vs. Monoclonal Antibodies ............................................. 97
4.4.3 Optimization of Detection Antibody Amount.................................. 98
4.4.4 Assay Results and Dose Response ................................................... 98
CHAPTER 5 – CONCLUSION AND FUTURE WORK....................................................... 102
5.1 Recommendations for Future Work .......................................................... 103
5.1.1 Signal Enhancement ...................................................................... 103
5.1.2 Signal Amplification ....................................................................... 104
5.1.3 Multiplexing ................................................................................... 105
5.1.4 Origami Fabrication Method ......................................................... 107
5.1.5 Electrochemical Detection ............................................................. 107
APPENDICES ............................................................................................................... 109
BIBLIOGRAPHY............................................................................................................ 113
viii
LIST OF TABLES
Table 1.1: Paper as sensor substrate in comparison with traditional materials adapted from [37] .................................................................................... 6
Table 1.2: Binding properties of different membrane polymers [34]..................... 11
Table 1.3: Properties of conjugate pad materials adapted from [34] .................... 15
Table 2.1: Common labeling-detection systems, adapted from [8] ....................... 19
Table 2.2: Comparison of techniques and detection limits for state of the art LFIAs ........................................................................................................ 32
Table 2.3: Overview Paper-based Analytical Devices ............................................. 33
Table 2.4: Comparison of common fabrication techniques for resolution, cost and high throughput (HT) adapted from [37] ............................................... 40
Table 3.1: Specifications and manufacturer for materials used during the study .. 63
Table 4.1: Optimized cutting parameters for materials used during the study ..... 80
Table 4.2: Comparison of valve fabrication methods used during the study ......... 81
Table 4.3: Retention capacity and effective pore size for selected materials ........ 90

ix
LIST OF FIGURES
Figure 1.1: Schematic representation of an antibody. VL: variable part of the light chain, VH: variable part of the heavy chain, CL constant part of the light chain, CH1, CH2, CH3: constant parts of the heavy chain, Fab: fragment antigen binding, Fc: fragment constant/crystallyzable. Adapted from [44]. ........................................................................................................... 7
Figure 1.2: Schematic view of a lateral flow test strip [34] ...................................... 10
Figure 1.3: Structure of nitrocellulose ester and protein dipoles [34] ..................... 11
Figure 1.4: Effect of capillary flow rate on the effective Analyte concentration. X refers to Analyte concentration in the sample [34] ............................... 12
Figure 2.1: Indirect (A) and direct (B) immunoassay adapted from [50] ................ 21
Figure 2.2: Competitive immunoassay is based on the competition of two reagents. A) Immobilized antibody approach, B) Decreasing Signal intensity with increasing analyte concentration for competitive assays, C) Immobilized antigen approach adapted from [50] ..................................................... 22
Figure 2.3: Non-competitive assay A) Sandwich assay with analyte sandwiched between capture and detection antibody B) Increasing signal with increasing analyte concentration for non-competitive assays adapted from [50] ................................................................................................. 23
Figure 2.4: Different alternatives to immobilize antibodies on a solid surface A) Anti-antibody bounding B) Antibody binding proteins C) Streptavidin-modified surface and biotinylated antibody bounding [50] .................................. 24
Figure 2.5: Paper based analytical devices: A) Oxygen sensor based on nanoporous gold [37] B) Potentiometric immunoassay [37] C) Tree-shaped self-calibrating detection system [53] ........................................................... 36
Figure 2.6: Paper based analytical devices. A) Paper based ELISA [5] B) Chemi-luminescence assay [37] C) Temperature sensor [37] ........................... 39
Figure 2.7: Origami paper based analytical device for electrochemical detection of adenosine [28] ........................................................................................ 42

x
Figure 2.8: Programmable microfluidic paper based devices using push buttons adapted from [32]. A) Schematic of the layers in a fluidic de-multiplexer B) Use of the fluidic de-multiplexer C) Schematic of the cross-section of an button D) Photographs of the cross-sections before and after use.. 43
Figure 2.9: Two-dimensional representation of the valve principle [15] ................. 45
Figure 2.10: Colorimetric assay with triggering system using fluidic valves [3] ......... 46
Figure 2.11: Fluid flow in channels with variation of the width adapted from [64] A) Abundant flow B) Constricted Flow........................................................ 50
Figure 2.12: Schematic of the fluidic network analogy to electrical resistance. The total volumetric flux through a paper network of N segments in series, during fully wetted flow, follows the same form as Ohm’s Law for a circuit with N resistors in series. [12] ................................................................ 50
Figure 3.1: General principle of chip fabrication ...................................................... 53
Figure 3.2: Flowchart for the valves fabrication initaly developed at the labarotory of professor Faghri ...................................................................................... 54
Figure 3.3: Flowchart for valve fabrication using a tool to punch-out the disks ..... 56
Figure 3.4: Tooling to punch out and place several valve-disks at once .................. 57
Figure 3.5: Flowchart for valve fabrication using layers to hold and align disks ..... 58
Figure 3.6: Flowchart for valve fabrication using layers to hold and align disks ..... 60
Figure 3.7: Experimental setup for the optimization of the surfactant amount per disk in fluidic valves ................................................................................ 62
Figure 3.8: Two fluid lateral flow test based on fluidic valve ................................... 64
Figure 3.9: Two fluid lateral flow test based on two fluidic valves .......................... 66
Figure 3.10: Trigger channel designs used during the study ...................................... 69
Figure 3.11: ELISA procedure in lateral flow: A) Analyte (Rabbit IgG) is applied to sample pad B) Analyte binds to detection AB labeled to ALP (in conjugate pad) C) Complex of analyte and detection antibody is captured by capture
xi
antibody (on nitrocellulose) D) Color is produce by reaction of ALP and NBT/BCIP. ............................................................................................... 71
Figure 3.12: Housing design with valve compression adapted from [10] .................. 76
Figure 3.13: CAD model for housing with reagent storing ......................................... 77
Figure 4.1: Chip yield for different fabrication methods with respect to valve failure probability for at least 18 replicates for each method. A refers to valve complex of valve 1&2 and B to the complex of valve 3&4. ................... 85
Figure 4.2: Valve opening performance for different fabrication methods. Opening duration and standard deviation of opening for at least 18 replicates. 86
Figure 4.3: Average valve opening duration and standard deviation in dependence of the amount of surfactant per disk for at least 18 replicates. Rectangular indicates optimized amount. .................................................................. 87
Figure 4.4: Chip yield for different trigger channel designs. Chips were fabricated with the manual method and at least 18 replicates were observed. .... 88
Figure 4.5: Description and geometries for a batch of 6 chips after fabrication ..... 91
Figure 4.6: Results of the development process. A) Main channel geometries B) Trigger channel geometries C) Proof of concept with food coloring ..... 93
Figure 4.7: Comparison of conjugate release for non-blocked glass fiber pads to blocked glass fiber pads.......................................................................... 94
Figure 4.8: Comparison of conjugate release for 4x5 mm glass fiber pads to 5x5 mm glass fiber pads ....................................................................................... 95
Figure 4.9: Comparison of conjugate release for glass fiber with and without binder 96
Figure 4.10: Comparison of signal intensities for monoclonal and polyclonal capture antibodies ............................................................................................... 97
Figure 4.11: Signal quality in dependence of detection antibody amount per conjugate pad ......................................................................................... 98
Figure 4.12: Assay response to different analyte concentrations.............................. 99

xii
Figure 4.13: Dose response for different analyte concentrations and three replicates fitted with the Weibull equation .......................................................... 100
Figure 5.1: Signal amplification using gold nanoparticles to incorporate several ALP enzymes ................................................................................................ 105
Figure 5.2: Proposed system to integrate multiplexing into the developed lateral flow test device .................................................................................... 106
Figure 5.3: Proposed geometries [mm] for electrodes printed on nitrocellulose. Hydrophobic wax is used to prevent fluid flow to wiring area ............ 108

xiii
LIST OF ABBREVIATIONS
POC Point-of-Care
ELISA Enzyme Linked Immunosorbent Assay
LFIA Lateral Flow Imunoassay
LFT Lateral Flow Test
LOD Limit of Detection
LOQ Limit of Quantification
PAD Paper based Analytical Device
LOP Lab on Paper
Ig Imunoglubin
A3CS Allyltrichlorosilane
AB Antibody
AG Antigen
GNP Gold Nanoparticles
HRP Horseradish Peroxidase
T20 Tween 20

xiv
LIST OF SYMBOLS
Latin Symbols
t Time s
KD Antibody affinity %
∆P Pressure difference N/m2
Req Fluidic resistance Ns/m5
WH Channel surface area m2
Q Volumetric flow rate m3/s
q Flow rate m/s
V Volume m3
L Distance moved by fluid m
D Average pore diameter m
Greek Symbols
μ Viscosity Ns/m2
κ permeability m2
γ effective surface tension N/m

1
CHAPTER 1 - INTRODUCTION
This chapter will introduce the background knowledge about point-of-care
diagnostics and diagnostic devices, immunoassays and antibody recognition reaction
advantages for paper as sensor substrate and lateral flow test devices.
1.1 Point of Care Diagnostics and Diagnostic Devices
Point-of-care (POC) devices allow rapid diagnostic tests to be performed at the site
of patient care facility. This means the test can be done in the hospital, the emergency
room, a physician’s office or at home by minimally trained personnel. And, the results
are available immediately rather than waiting for hours or days for the results to come
back from a central facility [51].
Point of care testing is a fast growing area with a growth rate around 10% in clinical
diagnostics which will be one of the biggest driving forces for the future of the in-vitro
diagnostics market [54]. According to the market analyst Frost & Sullivan, the US
market for Point-of-Care testing devices will increase from a revenue of $2.13 billion
USD in 2009 to $3.93 billion USD in 2016 [11]. The market is thereby driven mainly by
two high-growth segments, infectious diseases and coagulation monitoring. The
infectious disease market is growing due to increasing infections, detection of new
diseases and mutations. The coagulation monitoring market is growing dramatically
because of expanded testing in patient homes and the growth of patient services [11].

2
Therefore, diagnostic testing devices have to be lightweight, portable and easy-to-
use to perform complex biological tests at the site where they are most needed [54].
Microfluidic systems are suitable for those developments since they can be designed
to operate from small volumes of complex fluids with efficiency and speed and without
the requirement for highly trained personnel [31].
Several companies around the world market rapid tests. They have developed a
variety of devices and technologies which reduce the test times to hours or even
minutes [51]. Those technologies can be grouped in three different categories:
Permanent integrated instruments; pure disposables; and permanent instruments that
use disposable components [61].
Permanent integrated instruments are designed for a high-throughput work, with
fast and accurate results but even when those devices would be cheap enough, they
could not be considered as point of care devices because trained personnel are
needed. Carry over between two tests has to be prevented by rinsing the component
with cleaning solutions and also frequent calibration is necessary to keep the settings
with the standards even when they use microfluidic components [61].
Disposables are analytical tests based on a disposable substrate (e.g. paper) they
are normally based on a microfluidic device (e.g. Lateral flow test) and they rely on
relatively inexpensive components and reagents which can be produced as commercial
off-the-shelf (COTS) products on large-scale production methods, to be relatively
affordable. They can be designed for detection of antigens or antibodies and are usable

3
with a wide range of specimens. Most of them are developed to be stable at ambient
temperatures without refrigeration for more than a year and the analytical
performance for some of them are comparable to reference-level laboratory methods
[29].
Disposable tests provide POC diagnostics in areas without access to well-equipped
and well-staffed clinical laboratories. Users can quickly learn to perform such
disposable-based tests without the requirement to be repeatedly retrained. Because
of this, disposable rapid tests are the one diagnostic technology which has been
successfully used in the modern military and the developing world. However, complex
and expensive approaches do not deliver the needs of the majority of the world’s
people suffering with infectious diseases, which have access mostly to poorly
resourced health care facilities [60].
Disposable tests currently on the market have a number of disadvantages. They
are still not as sufficiently sensitive, specific and accurate as laboratory results. They
also usually provide just a yes/no answer.
Disposables with a reader are a compromise between disposables and
professional instruments. The sample, the process reagents and the waste remain in
the disposable while the reader is used to add more complexity to the test by using
electrically driven valves and pumps to control the fluid flow of different fluids within
the disposable. The advantage over integrated instruments is that the reader does not
need to be cleaned between two samples and that calibrates can be stored on the
4
disposable. This compromise allows high performance with low per-test cost [61]. This
approach is the perfect POC solution for hospitals where several tests have to be done
daily at the patient’s bedside. But the higher prices for the readers in comparison to
just disposable tests keeps this approach from being widely accepted for at home use.
And, the need for electricity for the pumps and valves is a disadvantage when the test
has to be run in developing countries in places without easily available power sources.
For a portable instrument the power could come from automobile generators,
photocells, hand-generators, or stored in the disposable [61]. But all these points
increase the complexity in comparison to disposable test devices.
Therefore, more complex diagnostic tests based on inexpensive disposables are
needed to fulfill the requirements of POC applications at the patient’s home and for
the developing world.
1.2 Justification
One approach for more complex disposable devices with a better sensitivity is to
use advanced lateral flow devices which are able to incorporate multiple fluids for the
test. With multiple fluids, it is possible to perform more advanced Immunoassay
protocols with disposable lateral flow tests. As example, for an ELISA immunoassay
assay (vide infra) at least a substrate is needed as another input fluid in addition to
the sample [23].

5
Devices on the market normally consist of a plastic housing with a developing
solution pot which contains the second input fluid (e.g. substrate) that is heat-sealed
with laminated aluminum film [23]. The user has to rapture the seal in order to release
the developing solution. Their major disadvantage is that the user has to rapture the
seal at the right time after the sample has been added to the strip test.
Using the paper based fluidic valve technology developed at the University of
Rhode Island by Dr. Hong Chen et al. [3] at the microfluidics laboratory of Professor M.
Faghri (vide infra), it is possible to develop lateral flow test devices with more than two
fluids that are self-triggered after a certain amount of time. Such advanced lateral flow
test strips are capable of conducting ELISA on paper without operator intervention,
except for the application of the sample fluid.
1.3 Paper Based Analytical Devices
Advanced sensors based on a paper substrate are called paper based analytical
devices (PAD) or lab on paper devices (LOP). They have recently gained increasing
interest. For decades paper was used for analytical chemistry but lately it was
rediscovered as substrate for sensors. This is because paper offers many advantages
including biocompatibility, biodegradability, price and availability (see Table 1.1) which
makes this material first-choice for development of disposable sensors and integrated
sensing platforms [37].
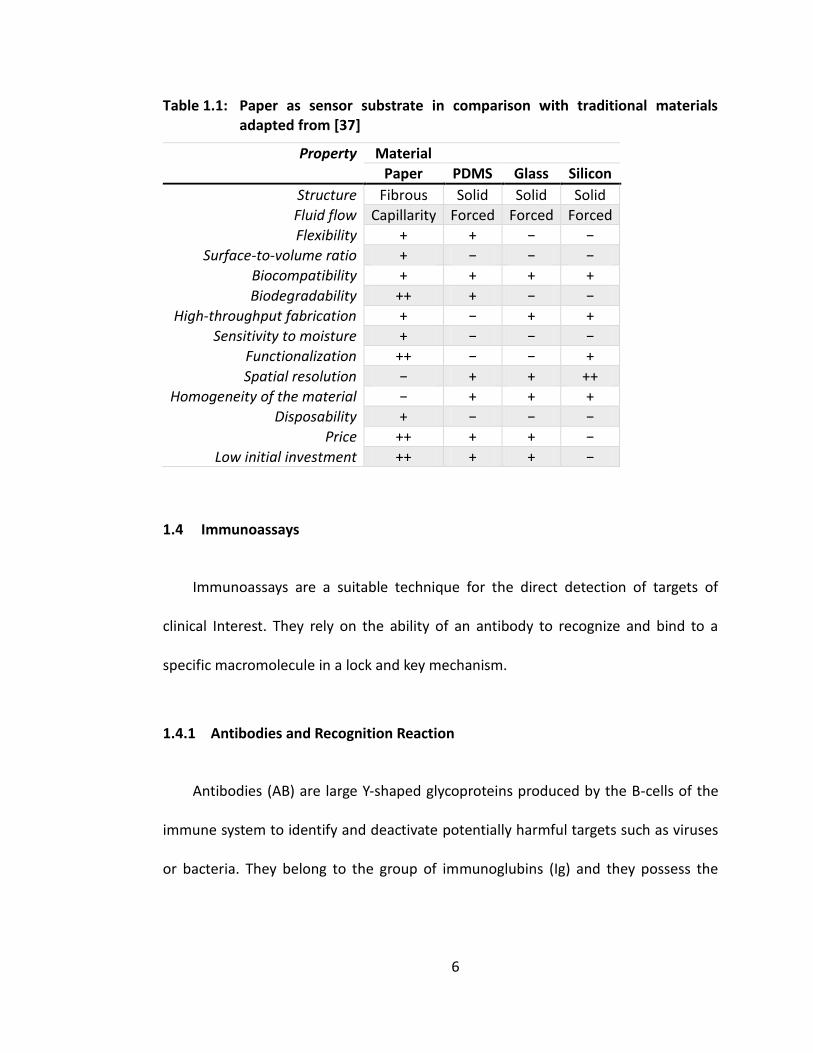
6
Table 1.1: Paper as sensor substrate in comparison with traditional materials adapted from [37]
1.4 Immunoassays
Immunoassays are a suitable technique for the direct detection of targets of
clinical Interest. They rely on the ability of an antibody to recognize and bind to a
specific macromolecule in a lock and key mechanism.
1.4.1 Antibodies and Recognition Reaction
Antibodies (AB) are large Y-shaped glycoproteins produced by the B-cells of the
immune system to identify and deactivate potentially harmful targets such as viruses
or bacteria. They belong to the group of immunoglubins (Ig) and they possess the
Property Material
Paper PDMS Glass Silicon
Structure Fibrous Solid Solid Solid
Fluid flow Capillarity Forced Forced Forced
Flexibility + + − −
Surface-to-volume ratio + − − −
Biocompatibility + + + +
Biodegradability ++ + − −
High-throughput fabrication + − + +
Sensitivity to moisture + − − −
Functionalization ++ − − +
Spatial resolution − + + ++
Homogeneity of the material − + + +
Disposability + − − −
Price ++ + + −
Low initial investment ++ + + −

7
ability to form specific binding sites by recognition of a unique part of the target, called
an antigen (AG) [20].
To bind to an antigen the antibody binding-site contains a paratope that is specific
for one particular region of 15–22 amino acids on the antigen called the epitope [13].
Figure 1.1: Schematic representation of an antibody. VL: variable part of the light chain, VH: variable part of the heavy chain, CL constant part of the light chain, CH1, CH2, CH3: constant parts of the heavy chain, Fab: fragment antigen binding, Fc: fragment constant/crystallyzable. Adapted from [44].
Besides the fragment antigen binding-region (Fab) the antibodies consist of
another binding region called fragment constant or crystallyzable region (Fc) which is
used as contact region in the immune system for other molecules which can finally
destroy the antigen. All antibodies are built on the same mirror-symmetrical Y-
structure of four polypeptide chains, two of those chains are “light chains” (L-chains)
and two of them are “heavy chains” (H-chains) They are linked by disulfide bridges
(Figure 1.1) [44].
8
There are two types of immunoglubin light chains which are called lambda (λ) and
kappa (κ) and five types of heavy chains (α, δ, ε, γ, and μ) [20]. The type of heavy chains
defines the class of immunoglobulins (IgA, IgD, IgE, IgG, or IgM ) [42].
In human serum approximately 85% of the antibodies belong to the IgG class at a
concentration of 8–18 gL–1, the dimeric IgA (0.9–4.5 gL–1) and the pentameric IgM (0.6–
2.8 gL–1) can also be found [44]. The molecular weights of antibodies are 150 kDa for
IgG and IgD, 900 kDa for IgM, 150 or 600 kDa for IgA and 190 kDa for IgE. The chemical
composition of the reachable surface of an average antibody is 55% non-polar, 25%
polar, and 20% charged [25]. Three groups of antibodies are typically produced:
polyclonal, monoclonal and fragments of monoclonal antibodies [44].
Polyclonal antibodies are produced by vaccinating a mammal such as rabbit, goat,
mouse, sheep or horse with the corresponding antigen. The blood serum isolated from
these animals contains multiple antibodies which consist of different paratopes and
recognize different epitopes on their respective antigen. Monoclonal antibodies are
specific for only one single epitope of an antigen. They are produced by hybridoma
cells which are isolated antibody-secreting lymphocytes from an animal and which are
immortalized by fusing them with a cancer cell line [6]. Lately, genetically produced
antibody fragments have played an increasing role, because of their characteristics to
inhibit unspecific binding. The antibodies only consist of the Fab binding side while the
Fc part is separated by enzymatic cleavage [44].

9
The recognition reaction between the paratope, the antigen-binding region (Fab)
and the eptitope, the surface structure on the antigen is mainly driven by four different
non-covalent binding reactions. Those are electrostatic attraction between
corresponding charges, van-der-Waals forces because of electron-density fluctuations,
hydrogen bonds between electronegative atoms and hydrophobic interactions
between nonpolar carbohydrates [44]. For example the usual number of hydrogen
bonds in an Antibody-Antigen complex is acknowledged to be around 10 [21].
𝐾D =𝑘assosc
𝑘diss=
[𝐴𝐺][𝐴𝐵]
[𝐴𝐺𝐴𝐵] (1.1)
The probability of an antibody to bind to a specific antigen is called affinity and it
is described by a dissociation constant, KD. KD is the ratio of the association rate
constant kassoc and the dissociation rate constants kdiss. For monoclonal antibodies,
studies [2 16, 17] have found that the dissociation rate constant has a wider variation
than the association rate constant (kassoc = 105–107 M–1s–1). The affinity can also be
approximately derived from the law of mass action (Equation 1.1). The affinities for
antibodies found in the literature vary between 10–5 M–1 and 10–12 M–1 [44].
1.5 Lateral Flow Test Strips
This section provides information on the key aspects of the design of lateral flow
immunoassay (LFIA) also called lateral flow tests (LFT) with respect to the materials
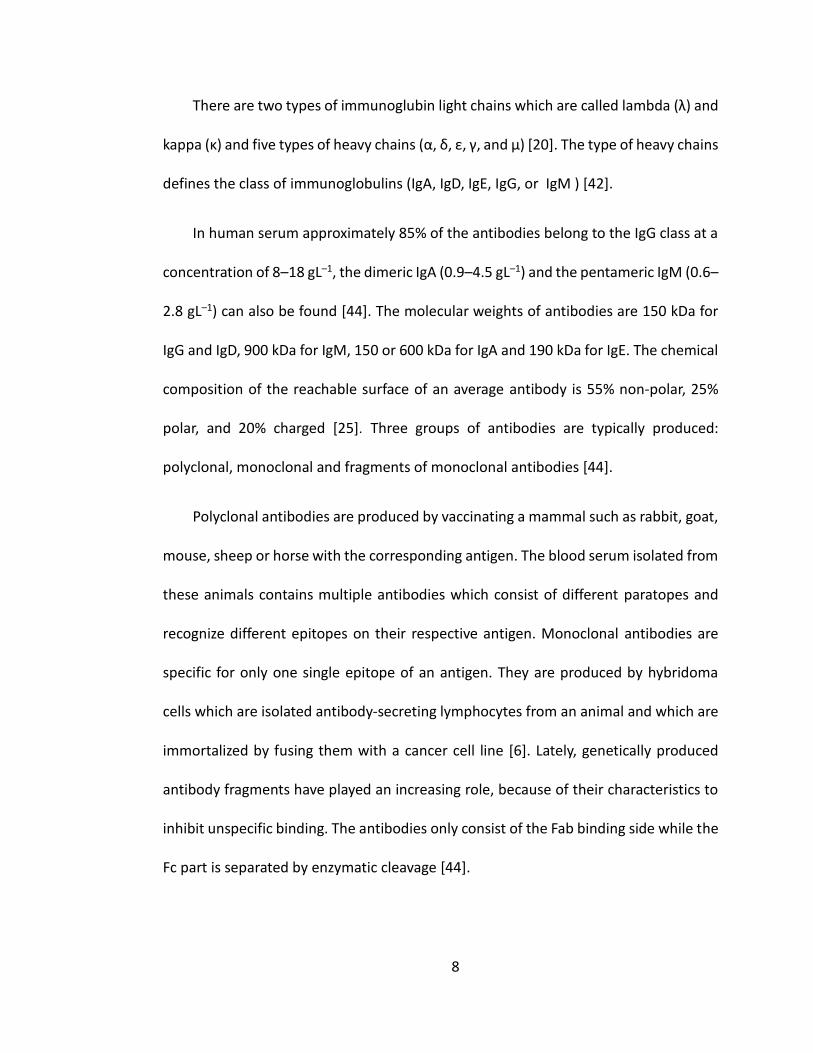
used and their integration with the assay conditions. Figure 1.2 shows the main parts
10
of a lateral flow test including the housing, membrane, sample-, conjugate- and
absorbent pad.
Figure 1.2: Schematic view of a lateral flow test strip [34]
1.5.1 Membrane
The membrane is the most important material used in a lateral flow test strip. For
lateral flow test strips, the membrane must irreversibly bind capture reagents at the
test or control lines. Physical and chemical attributes of the membrane affect its
capillary flow properties which affects the reagent deposition, assay sensitivity, assay
specificity, and test line consistency [34]. The binding characteristics of the membrane
are defined by the polymer from which the membrane is made. Commonly used
polymers and their binding characteristics are presented in Table 1.2.
11
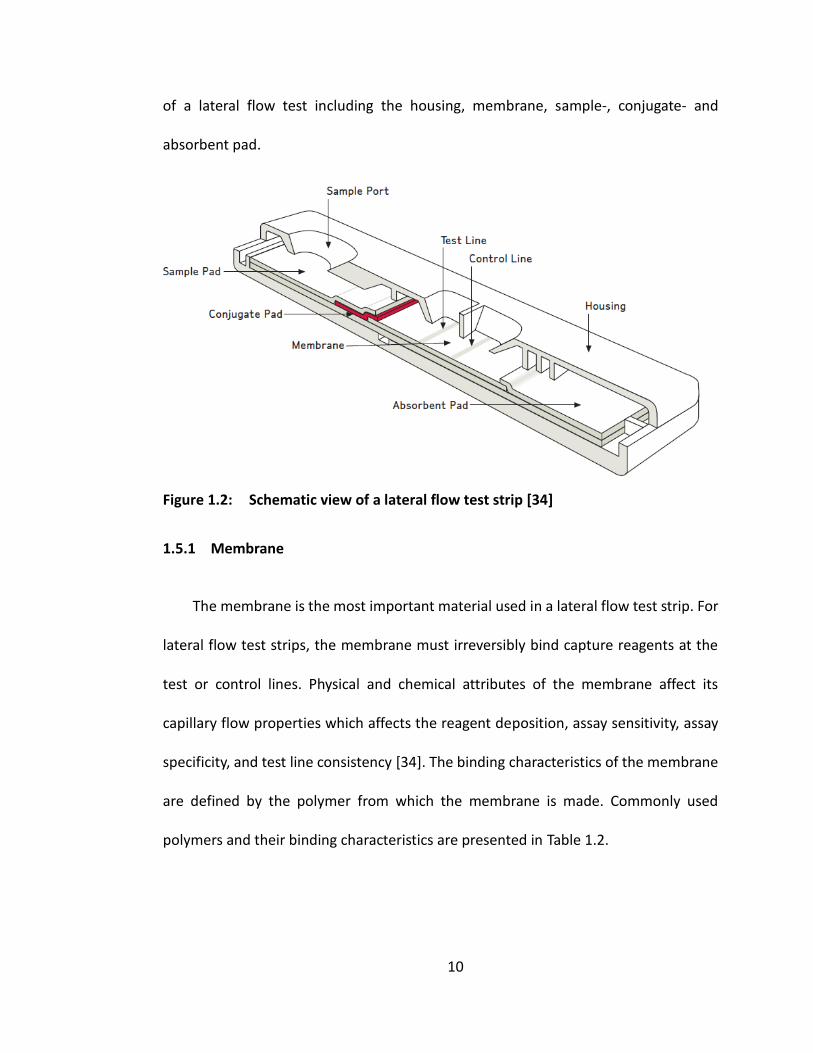
Table 1.2: Binding properties of different membrane polymers [34]
Membrane polymer Primary binding Mechanism
Nitrocellulose Electrostatic
Polyvinylidene fluoride Hydrophobic
(Charge-modified) nylon
(Ionic) electrostatic
Polyethersulfone Hydrophobic
Because of electrostatically binding through interaction of strong dipole of nitrate
ester with strong dipole of peptide bonds of the protein (Figure 1.3), nitrocellulose
membranes are the most used membranes in the field.
Figure 1.3: Structure of nitrocellulose ester and protein dipoles [34]
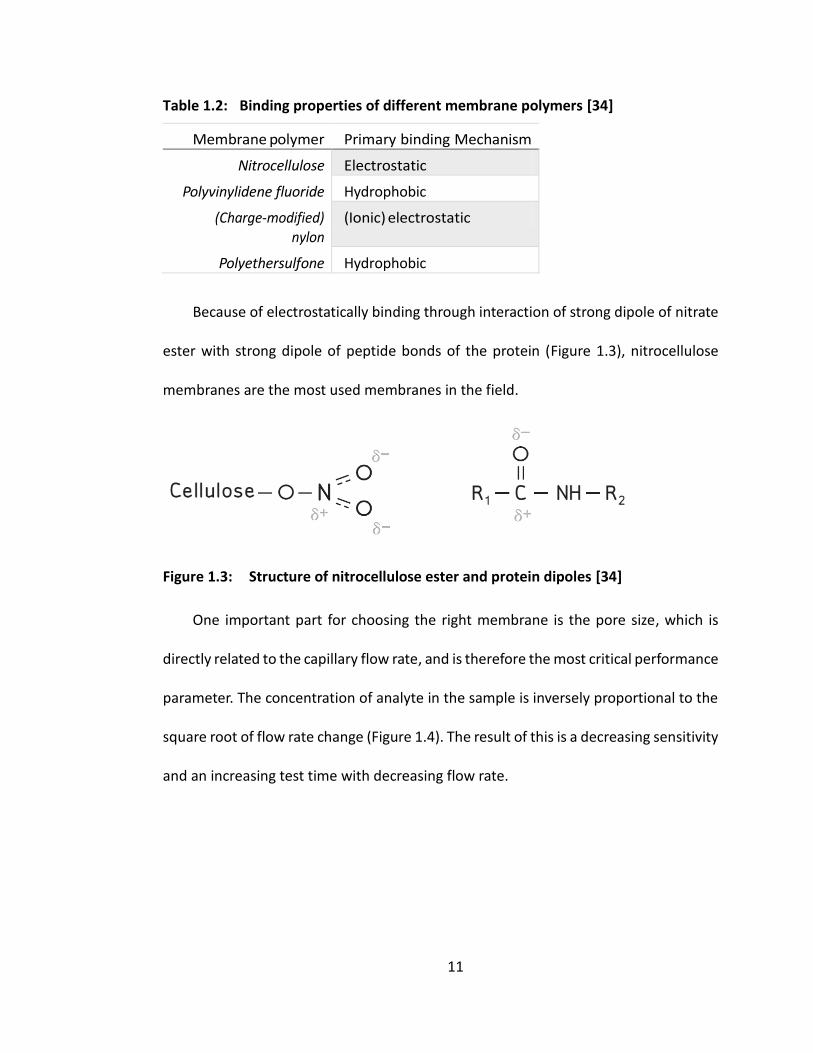
One important part for choosing the right membrane is the pore size, which is
directly related to the capillary flow rate, and is therefore the most critical performance
parameter. The concentration of analyte in the sample is inversely proportional to the
square root of flow rate change (Figure 1.4). The result of this is a decreasing sensitivity
and an increasing test time with decreasing flow rate.
12
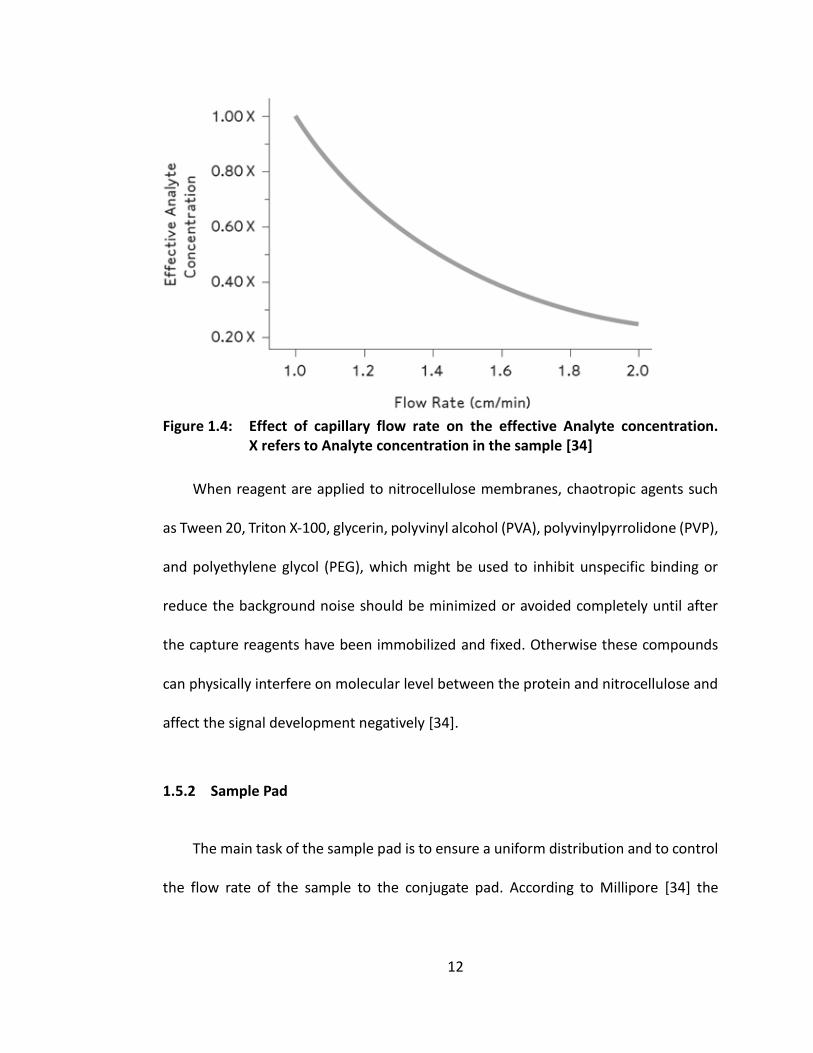
Figure 1.4: Effect of capillary flow rate on the effective Analyte concentration. X refers to Analyte concentration in the sample [34]
When reagent are applied to nitrocellulose membranes, chaotropic agents such
as Tween 20, Triton X-100, glycerin, polyvinyl alcohol (PVA), polyvinylpyrrolidone (PVP),
and polyethylene glycol (PEG), which might be used to inhibit unspecific binding or
reduce the background noise should be minimized or avoided completely until after
the capture reagents have been immobilized and fixed. Otherwise these compounds
can physically interfere on molecular level between the protein and nitrocellulose and
affect the signal development negatively [34].
1.5.2 Sample Pad
The main task of the sample pad is to ensure a uniform distribution and to control
the flow rate of the sample to the conjugate pad. According to Millipore [34] the
13
sample pad can be treated with reagents such as proteins, detergents, viscosity
enhancers, and buffer salts to perform multiple tasks:
Increase sample viscosity to improve flow properties
Enhance the ability of the sample to solubilize the detector reagent.
Prevent nonspecific binding of the conjugate and analyte to downstream
materials.
Chemical modification of the sample to ensure immunocomplex formation at
the test line
Woven meshes and cellulose filters are the two commonly used materials as
sample pads. Woven meshes or also called screens have a very low bed volumes, which
is why they retain small sample volume, normally around 1 – 2μl/cm2 and they also
have good sample distribution properties [34]. Because of this they are used for
applications where limited sample volume is available. Besides this meshes are
relatively expensive compared to other porous material and the low bed volume is also
a disadvantage when the sample pad should be pretreated with different reagents.
Cellulose filters on the other hand are inexpensive and have large bed volumes,
which is why they are used when large amount of blocking agents, detector reagents,
release agents, pH and ionic strength modifiers or viscosity enhancers have to be
loaded to the sample pad. The disadvantage of cellulose filters is the bad contact
behavior with different materials because of this a sufficient and consistent contact
might have to be ensured by compression with a housing.

14
1.5.3 Conjugate Pad
The main task of the conjugate pad is to store the dried detection reagents until a
liquid test sample is applied to the sample pad and then ensure uniform transfer of the
detection reagent and test sample onto the membrane.
According to the membrane manufacturer Millipore [34] the ideal conjugate pad
material has to comprise the following attributes.
a) Low non-specific binding
If the detector reagent or analyte binds to the conjugate pad, it is lost for the
test and thereby reduce the signal intensity and sensitivity
b) Consistent flow characteristics
Consistent flow properties are very important, otherwise it could happen that
the detector reagent may be channeled onto the membrane and the
membrane contaminates with streaks resulting into an uneven signal
development at the test and control lines
c) Consistent bed volume.
Normally the conjugate reagents are loaded by dipping the conjugate pad into
the liquid. The amount of detection reagent in each test strip then depends
on the bed volume of the material. The bed volume has to be consistent, to
prevent variable signal intensities.

15
d) Low extractables.
To prevent clogging at the connection between conjugate pad and membrane
chemical extractables should be avoided and the material should be free of
particles that
e) Consistent compressibility.
This is important for consistent reagent transfer onto the membrane and for
incorporation into test strip manufacture
Conjugate pads are commonly made of non-woven material such as cellulose,
glass, or surface-treated (hydrophilic) plastic (polyester, polypropylene, or
polyethylene) which are compressed into thin sheets. Those materials for conjugate
pads are inexpensive compared to membranes. The different materials and there key
properties are summarized in Table 1.3.
Table 1.3: Properties of conjugate pad materials adapted from [34]
Non-woven Material Description Advantages
Glass fibers 100 – 500 µm thick, can contain binders to hold fibers together
Good hold-up volumes, low nonspecific binding
Cellulose filters 300 – 1000 µm thick, compact fibers of consistent density
Very low nonspecific binding, normally very uniform
Surfacemodified polyester
100 – 300 µm thick, hydrophilic polyester filters
Low nonspecific binding, excellent tensile strength and web handling

16
1.5.4 Absorbent Pad
The absorbent or also called wick or waste pad is used to keep a uniformly capillary
flow through the membrane in the right direction and at a proper flow rate. Without
or with a too small absorption pad the sample will flow back in the membrane and
could raise the background or possibly cause false positives [34]. Absorption pads are
commonly fabricated from non-woven, cellulose fiber sheets in variety of thicknesses
and densities to suit the needs of the assay
1.5.5 Housing
A housing is not required for accurate assay functionality but there a different
reasons why many manufactures choose to place the lateral flow tests into a housing.
The most obvious reason is, to ensure proper operation by forcing the user to apply
the sample in the sample pad. For over-the-counter products it also protects the
membrane from contamination through splashes. The Housing is also used for labeling
to provide important information to the user (e.g. position of test and control line).
Internal pins and bars in the housing are used to keep the strip test in the right place
and compresses the materials together to ensure repeatable fluid flow conditions [34].
1.6 Objective and Outline of the Thesis
The overall goal of this project is to develop a highly sensitive ELISA based lateral
flow test device by using fluidic valves to trigger multiple fluids automatically in a
17
sequential manner. As first step of the project, the knowledge for point-of-care
diagnostics and paper based analytical devices is established, following by the
development of a multifluid lateral flow test and the integration of an ELISA procedure.
So, this thesis is comprised of six chapters in the following orders:
Chapter 1, background introduction covers the information of point-of-care
diagnostics and diagnostic devices, possibility of paper as substrate for sensors and
functionality of immunoassays.
Chapter 2, literature review, provides a review on the current approaches for
paper based analytical devices and presents immunoassay techniques and validation
methods.
Chapter 3, methodology, describes the principle and procedure of the sensor
fabrication and immunoassay development. Sensor fabrication using wax printer and
laser cutter and development of sandwich enzyme linked immunosorbent assay for
lateral flow are described in detail.
Chapter 4, findings and discussion, presents and discusses the results of this study.
Including different fabrication methods and variation of reagents.
Chapter 5, findings and future work, summarizes all the chapters of the thesis and
addresses recommendations for future research.

18
CHAPTER 2 – LITERATURE REVIEW
This chapter reviews the current status of analytical methods based on
Immunoassays including different labeling-detection techniques, designs for
immunoassays and validation methods. Also paper as substrate for sensors is discussed
and the newest approaches for paper based analytical devices including fabrication
techniques and fluid flow manipulation and calculation are being presented.
2.1 Analytical Methods Based on Immunoassays
Immunoassays are an important technique for developing highly sensitive sensors.
The targets cover hormones, proteins, metabolites, drugs, tumor products, antigens
and antibodies to infectious agents [8]. Polyclonal or monoclonal [42] antibodies are
used to detect the target. Current immunoassays have the ability to detect down to
10-13 mol/l of analyte [8]. Immunoassays have been developed since 1950 and the
development still continues [20]. The most recent and commonly used immunoassay
technologies and validation methods will be presented in this chapter.
2.1.1 Labeling-Detection Systems
In order to detect or visualize the antibody-antigen complex, which is typically
bound to a surface, one of the antibodies needs to be labeled by a marker that can
generate a signal. This is mostly the last antibody which is called the detection-
antibody. Those detection markers can be of different structure and composition they

19
can be bound covalently or adsorptive and can generate direct (e.g., optical,
absorption) or indirect signals (e.g., enzymatic reaction of colored products).
According to Seydack et. al. [44] the ideal detection marker has to meet the
following requirements:
Simple and sensitive detection
No compromise of sensitivity and specificity of the antibody
No disruption of the conjugation process as the assay progresses
No effect to the long-term stability of the conjugate
Binding to Fab part of the antibody is not dominant
Simple removal of unbound markers is possible
Not toxic
Several labeling-detection systems have been establish over the past decades. The
major labeling systems used in the field are shown below:
Table 2.1: Common labeling-detection systems, adapted from [8]
Labeling-detection system Examples
Radioactive nuclides 125I, 32P, 35S, 3H
Fluorescent labels Fluorescein, Rhodamines, Phycobiliproteins, Rare-earth chelates, Ethidium, Quantum dots
Luminescent labels Luminol derivatives, Acridinium esters, Dioxetane derivatives, Bacterial or firefly luciferace
Colored labels Latex beads (blue color), nanometer sized gold particles (red color)
Enzymes Alkaline phosphatase (ALP), Horseradish peroxidase (HRP), beta-Galactosidase

20
Since 1970 the Enzyme Linked Immunosorbent Assay (ELISA), is the most common
diagnostic method. It involves reaction between an enzyme label and a substrate. The
cascading character of the enzymatic reaction leads to a very good signal-to-noise (S/N)
values. They are superior by several orders of magnitude to any non-cascading method
values and consequently very low limits of detection are possible [44].
For lateral flow test devices particle based detection labels (e.g. 20–40 nm gold
particles) are common. This is because only one fluid, the sample fluid, may flow
through the device. The sample fluid contains the analyte or antigen which binds to an
antibody labeled with gold or colored latex particles that have been previously dried
onto the conjugation pad and the complex of the antigen and detection antibody flows
to a nitrocellulose membrane where capture antibodies have been immobilized during
the device manufacturing process in a narrow stripe perpendicular to the flow. The
antigen-detection antibody complexes then conjugate with the immobilized capture
antibodies. The end result is to concentrate a large number of the gold nanoparticles
or color beads in the stripe, thus making the stripe visible to the naked eye. Recent
studies [2] also report the use of fluorescent labels in lateral flow test devices instead
of the colored particle labels that lead to a better Limit of Detection (LOD) but require
the use of a reader box.
21
2.1.2 Immunoassay Designs
All Immunoassay protocols can be grouped into direct or indirect (Figure 2.1) and
into competitive and not competitive assays (Figure 2.2). The majority of
immunoassays are performed with three different general approaches: competitive
assay with either immobilized antibody or immobilized antigen approach or
noncompetitive two-site (sandwich) assay [50].
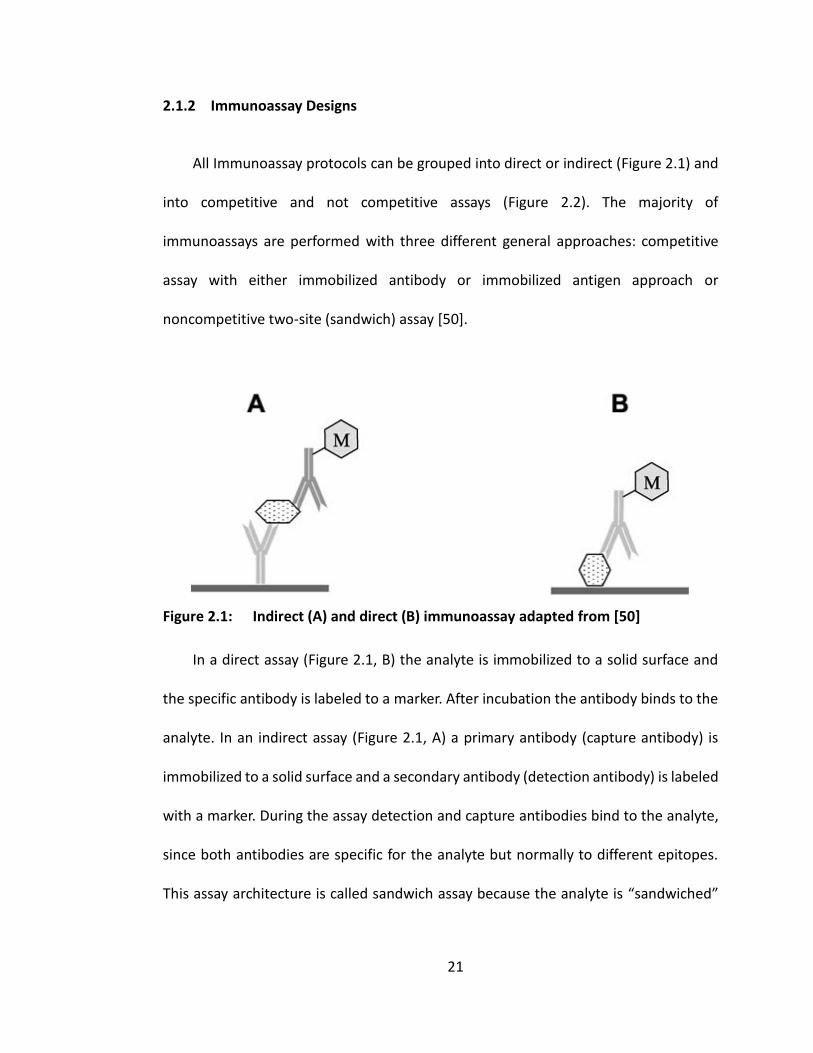
Figure 2.1: Indirect (A) and direct (B) immunoassay adapted from [50]
In a direct assay (Figure 2.1, B) the analyte is immobilized to a solid surface and
the specific antibody is labeled to a marker. After incubation the antibody binds to the
analyte. In an indirect assay (Figure 2.1, A) a primary antibody (capture antibody) is
immobilized to a solid surface and a secondary antibody (detection antibody) is labeled
with a marker. During the assay detection and capture antibodies bind to the analyte,
since both antibodies are specific for the analyte but normally to different epitopes.
This assay architecture is called sandwich assay because the analyte is “sandwiched”

22
between two antibodies. This design is reported to provide a better sensitivity and is
the preferred method in the field [20].
Figure 2.2: Competitive immunoassay is based on the competition of two reagents. A) Immobilized antibody approach, B) Decreasing Signal intensity with increasing analyte concentration for competitive assays, C) Immobilized antigen approach adapted from [50]
In a competitive assay the analyte competes with another antigen for the binding
to the antibody. This principle leads to a decreasing intensity with increasing analyte
concentration (Figure 2.2, B). The maximum signal is reached when the sample
contains no analyte. For competitive assays either the antibody can be immobilized
onto the surface (Figure 2.2, A) and the analyte competes with a labeled antigen that
has to be added to each sample in the same concentration. When low-molecular
weight analytes need to be detected the antigen can be immobilized on the surface
(Figure 2.2, C) and the analyte competes with the antigen for the marker labeled
antibody.

23
Figure 2.3: Non-competitive assay A) Sandwich assay with analyte sandwiched between capture and detection antibody B) Increasing signal with increasing analyte concentration for non-competitive assays adapted from [50]
In non-competitive assays the signal increases with increasing analyte
concentration (Figure 2.3, B). The most common non-competitive assay is the sandwich
assay (Figure 2.3, B), when more antigens are in the sample more labeled antibodies
can form a sandwich complex with the capture antibodies.
For most immunoassays the sandwich design is preferred. But when the analyte
has a too low molecular weight and can’t react with to two antibodies at the same time
one of the other presented methods has to be used [8].
2.1.3 Surface Binding Techniques
Immunoassays require one type of antibody or antigen to be immobilized on a
solid surface while the other reagents remain in the reaction buffer or sample matrix
[44]. Most used materials for the solid phase are nitrocellulose or nylon membranes
24
which are used for test strips and pre- or untreated polymer (as example polystyrene)
which is used for microtiter plates [44]. To keep the functionality of the protein
consistent, the binding to the solid has to be as adsorptive as possible. Therefore
different surface modifications for the support material are used to allow molecules
with different degrees of hydrophobicity to be absorbed. As example hydrophilic
surface coatings (= O, – OH, – NH2 or = N) are commonly used for microtiter plates.
Direct immobilization of highly specific monoclonal antibodies to the surface can
cause denaturing of the proteins. To avoid this circumstance indirect binding
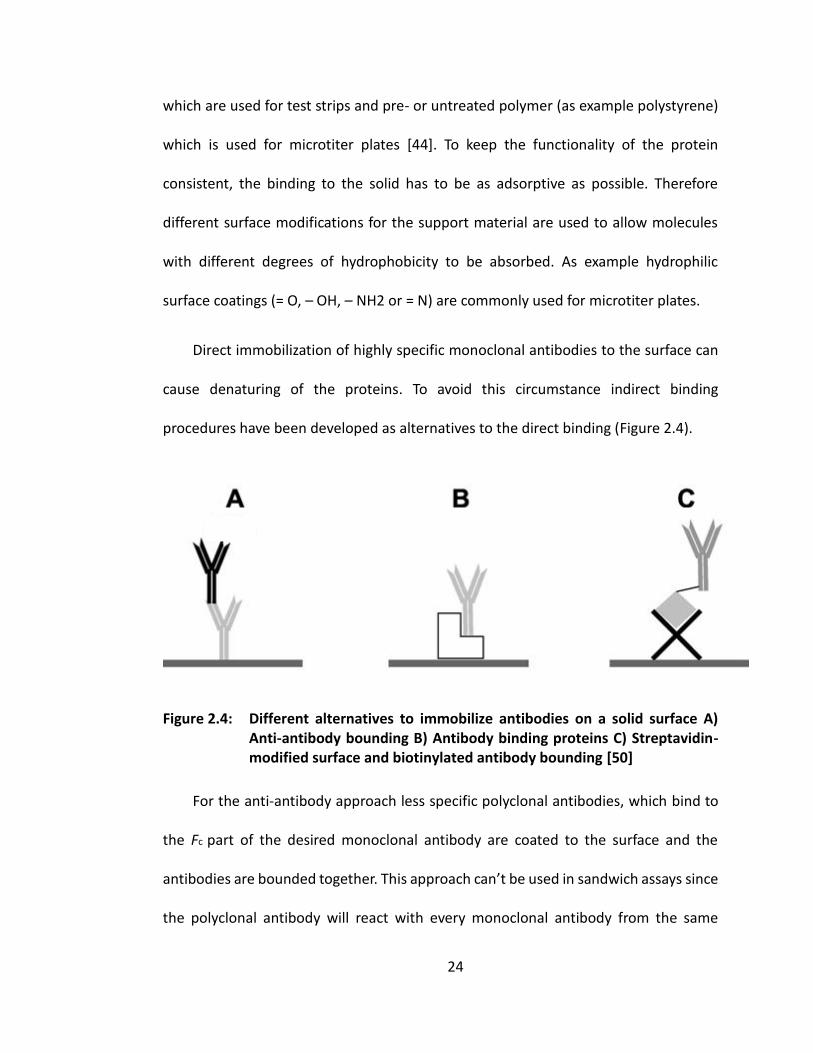
procedures have been developed as alternatives to the direct binding (Figure 2.4).
Figure 2.4: Different alternatives to immobilize antibodies on a solid surface A) Anti-antibody bounding B) Antibody binding proteins C) Streptavidin-modified surface and biotinylated antibody bounding [50]
For the anti-antibody approach less specific polyclonal antibodies, which bind to
the Fc part of the desired monoclonal antibody are coated to the surface and the
antibodies are bounded together. This approach can’t be used in sandwich assays since
the polyclonal antibody will react with every monoclonal antibody from the same

25
animal. In a different method antibody binding proteins (e.g. protein A, G, or L) can be
immobilized on the surface to hold the desired antibody since these proteins bound to
the Fc part (Protein A and G) or the Κ-type light chain (Protein L) of the antibodies.
Sandwich assays are not possible with these techniques.
An indirect method to immobilize antibodies for sandwich assays can be applied
by using the biotin-(strept)avidin system. Here the antibody is conjugated to biotin and
the surface is coated with avidin or streptavidin. The antibody is then held by the biotin-
(strept)avidin reaction. The advantage of this method is the simple and well
understood process of labeling the antibodies with biotin which barely influences the
recognition properties [14].
2.1.4 Assay Validation
Validating of immunoassay is an important tool during the development of
immunoassay applications and it is also a requirement of the European Directive 98/79
EC on in vitro diagnostic tests approved by the European Parliament and Council to
bring applications to the market [44]. The following definitions, in accordance to the
ICH Guideline “Validation of Analytical Procedures: Text and Methodology Q2(R1)" will
provide a background of the validation procedures:
Specificity or selectivity
Specificity is defined as the ability to clearly assess the analyte in the presence of
components which could be expected to be present (e.g. impurities, degradants) [47].

26
Other literature [48] further differentiates between specificity and selectivity:
Specificity is an evaluation of the response to a single analyte in contrast to selectivity
which is the evaluation of a response to a group of analytes that may not be
differentiated from each other.
It should be demonstrated, that the assay results are not affected by typical
impurities therefore the pure analyte has to be contaminated with a specified amount
of impurities and the test result of the purified and the contaminated analyte have to
be compared.
Accuracy or Trueness
The accuracy or trueness of an immunoassay specifies the closeness of agreement
between the value which is accepted either as a conventional true value or an accepted
reference value and the value found. The accuracy should be determined by using at
least nine trials over a minimum of three concentrations in the specified range. The
accuracy is described as percent recovery by the assay of known added amount of
analyte in the sample [44]. Otherwise the accuracy can be described with the
difference between the mean and the accepted true value together with the
confidence intervals [47]. If the accuracy is a controversial issue international reference
material can be used to prove the accuracy of an assay [44].

27
Precision
Precision is defined as the closeness of agreement (degree of scatter) between a
series of measurements obtained from multiple sampling of the same homogenous
sample under the prescribed conditions. The precision should be described as standard
deviation, variance or coefficient of variation obtained from a series of measurements
[47]. The precision has to be calculated for three different levels:
f) Repeatability
Repeatability is the precision determined under the same operating
conditions over a short period of time. (e.g same operator, same day, same
laboratory)
g) Intermediate precision
Intermediate precision is determined within-laboratory variations. (e.g.
different operators, different batch, different days, same laboratory)
h) Reproducibility
Reproducibility is the precision determined between different laboratories. It
can only be assessed by inter-laboratory trials or round robin tests.
The precision should be determined using a minimum of nine trials over the
specified range for the procedure or using minimum of six determinations at the
maximum test concentration. For all precision levels the conditions of the trials have
to be included to the precision data as specific as possible.

28
Limit of Detection
The detection limit is the lowest concentration of an analyte in a sample that can
be detected by the assay. The three most common approaches to determine the Limit
of detection are listed below. Other Approaches than those listed may be acceptable
too [47].
i) Visual Evaluation
Visual evaluation can be used for non-instrumental methods like lateral flow
tests. The detection limit is thereby determined by the analysis of samples
with known analyte concentrations and by evaluation of the minimum level
at which the analyte can be reliably detected
j) Blank Determination
This method is simple and quick it can be used when the blanks have a non-
zero standard deviation. The LOD is expressed as the analyte concentration
corresponding to the sample blank value including three times the standard
deviation [45].
𝐿𝑂𝐷 = 𝑋𝑏 + 3𝜎𝑏 (2.1)
Where Xb is the mean concentration of the blank and σb the standard
deviation of the blank.
k) Signal-to-Noise Approach
29
The Signal-to-Noise Ratio is determined by comparing the measured signal of
samples with a negative control. The detection limit is reached, when, the
Signal-to-Noise Ratio falls below a specified limit. A ratio between 3:1 or 2:1
is usually considered acceptable for determining the detection limit [47]
l) Standard Deviation of Response and Slope
A more accurate and refined method than the methods described above uses
the Slope S of the calibration curve and the standard deviation σ of the
response. The detection limit is then expressed with following equation:
𝐿𝑂𝐷 =3.3 𝜎
𝑆 (2.2)
Limit of Quantification
A quantitative or semi-quantitative assay relies on the opportunity to detect the
exact or a range of the analyte amount in a sample in contrast to a qualitative assay
which is only capable of detecting whether there is analyte in the sample or not. In
order to develop a quantitative assay the Limit of Quantification is an important
number for comparison of assays. The Limit of detection is defined as the lowest
amount of analyte in a sample that can be quantitatively determined with suitable
precision and accuracy [47]. The procedures to detect the LOQ are the same as for the
LOD. A visual evaluation is applicable for non-instrument tests such as lateral flow test.
A Signal-to-noise ratio of 10:1 is acceptable for the LOQ and for the method which is

30
using the standard deviation of the calibration curve and the Slope of the response
following equation can be used [44]:
𝐿𝑂𝑄 =10 𝜎
𝑆 (2.3)
Also the blank determination applies for the limit of quantification [45]. The LOQ is
expressed as the analyte concentration corresponding to the sample blank value
including ten times the standard deviation:
𝐿𝑂𝐷 =3.3 𝜎
𝑆 (2.4)
Linearity
The linearity of an analytical immunoassay is the ability to obtain linear test result
in a given range which are directly proportional to the analyte concentration in the
sample. The linearity can be evaluated by plotting the signal intensity response of
different analyte concentrations. The regression line, correlation coefficients, slope of
the regression line, and residual sum of squares can be used to compare assay
configurations. For immunoassays which do not show linear behavior the response
should be described with suitable nonlinear functions [47]
Range
The range describes the analyte concentration interval in which the immunoassay
has been proven to have a suitable level of precision, accuracy and linearity [47].

31
Robustness
Robustness is defined as the resistance of an immunoassay against the influenced
by variations of the assay parameters (e.g. temperature, pH, humidity). It is an indicator
for the reliability during regular usage [47].
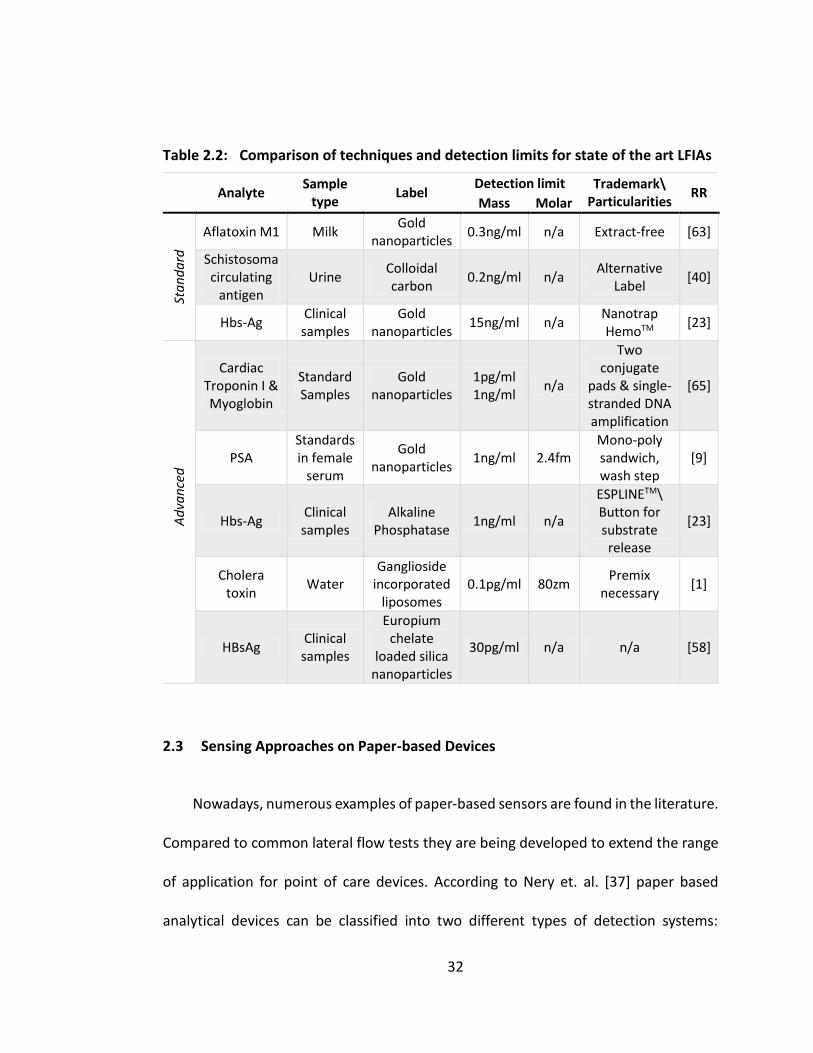
2.2 Limitations of Lateral Flow Immunoassay
Lateral flow immunoassay are the oldest technique for paper based analytical
devices and can be traced back to the 1950s [57]. They were designed as easy to
operate rapid diagnostic devices for the point of care market. Paper based analytical
devices, can be classified as standard LFIA when they are composed according to
section 1.5 and operated without prior sample preparation and without additional
steps other than the sample application. Because of their simplicity LFIA have some
major disadvantages compared to recent developments advanced paper based
analytical devices (vide intra) such as miniaturization of sample volume requirements
below microliter level, sensitivity or multiplexing [57]. To compare LFIAs with recent
developed paper based analytical devices various performance parameters for LFIAs
on the market or recent published in the literature were summarized in Table 2.2. The
table list also some more advanced LFIA which are still based on the standard LFIA
principle with a conjugate release zone and a reaction membrane but also with some
more sophisticated principles to enhance the test results.
32
Table 2.2: Comparison of techniques and detection limits for state of the art LFIAs
Analyte Sample
type Label
Detection limit Trademark\ Particularities
RR Mass Molar
Sta
nd
ard
Aflatoxin M1 Milk Gold
nanoparticles 0.3ng/ml n/a Extract-free [63]
Schistosoma circulating
antigen Urine
Colloidal carbon
0.2ng/ml n/a Alternative
Label [40]
Hbs-Ag Clinical samples
Gold nanoparticles
15ng/ml n/a Nanotrap HemoTM
[23]
Ad
van
ced
Cardiac Troponin I & Myoglobin
Standard Samples
Gold nanoparticles
1pg/ml 1ng/ml
n/a
Two conjugate
pads & single-stranded DNA amplification
[65]
PSA Standards in female
serum
Gold nanoparticles
1ng/ml 2.4fm Mono-poly sandwich, wash step
[9]
Hbs-Ag Clinical samples
Alkaline Phosphatase
1ng/ml n/a
ESPLINETM\ Button for substrate release
[23]
Cholera toxin
Water Ganglioside
incorporated liposomes
0.1pg/ml 80zm Premix
necessary [1]
HBsAg Clinical samples
Europium chelate
loaded silica nanoparticles
30pg/ml n/a n/a [58]
2.3 Sensing Approaches on Paper-based Devices
Nowadays, numerous examples of paper-based sensors are found in the literature.
Compared to common lateral flow tests they are being developed to extend the range
of application for point of care devices. According to Nery et. al. [37] paper based
analytical devices can be classified into two different types of detection systems:

33
optical and electrochemical. The basic methods of optical detection are colorimetric,
fluorescence, chemiluminescene, and transmittance based. For electrochemical
detection the most commonly used methods are voltammetric, potentiometric, and
conductivity based. Besides the type of detection system paper based sensors can be
distinguished in the type of detector that is used (e.g. naked eye, scanners) the
energetic principle (e.g. electricity, capillarity) and the analytical principle that is used
(e.g. biological, chemical, physical). Paper-based analytical devices which are cited in
this chapter are summarized in Table 2.3.
Table 2.3: Overview Paper-based Analytical Devices
Sensor Method Detector Analytical principle
Energetic principle
Analyte LOD RR
Op
tica
l
Tree-shaped paper strip
Colorimetric Naked-eye or
camera Chemical capillarity BSA 0.08mg/ml [53]
Paper based ELISA Colorimetric Scanner Imunoassay
& Enzymatic
capillarity Rabbit
IgG 54fm [5]
Microfluidic paper-based
chemiluminescence biosensor
Chemi-luminescene
Luminescence analyzer
Chemical capillarity Glucose & Uric acid
0.14mM &
0.52mM [62]
Temperature sensor
Colorimetric Naked-eye Chemical Oxidation n/a n/a [37]
Elec
tro
chem
ica
l
Paper based oxygen Sensor
Voltammetric Multimeter Chemical Capillarity
& electricity
Oxygen 0.0075%. [43]
PAD for el.chem. Flow-Injection
Analysis Voltammetric Amperometer Chemical
Capillarity, gravity & electricity
Glucose 200pmol [24]
Paper-Based Electrohemical
ELISA Potentiometric Potentiostat
Imunoassay &
Enzymatic
Capillarity &
electricity
Rabbit IgG
3.9fM [58]
Potentiometric enzyme
immunoassay Potentiometric Potentiostat
Imunoassay &
Enzymatic
Capillarity &
electricity IgE 0.1ng/ml [46]
2.3.1 Optical Detection: Methods and Detector Systems
Optical detection is the most inexpensive and universal method [22] and it is a
perfect application for paper based analytical devices since this substrate offers a

34
bright, high-contrast, and colorless background for the read out of color intensity
changes [59] . Several researcher groups [41] also discovered, that paper can give a
better sensitivity and quantification than other substrate materials. The complex
cellulose structure could also lead to some disadvantages. Researchers discovered, that
high background signals (e.g. non-specific binding) or signal non-uniformity (e.g. liquid
accumulating on the borders of the detection zone) can be a problem [37]. Chen et. al.
[4] discovered that drying of reagent in an incubator at 37 °C can help to reduce
background signal. And other research groups mentioned that treatment with
poly(vinyl amine), gelatin, poly(acrylic acid), or poly(ethylene glycol) can help to
stabilize color development [37].
A big advantage of optical detection methods is the simplicity of the detector
systems. The least expensive detector which doesn’t require to buy any further
equipment is the naked eye. Detection based on the naked eye might be precise
enough for the detection of non- or semi-quantitative assays such as Lateral flow
immunoassays. For quantitative assays a reading device is essential. Those reading
devices could be simple tools like scanners, digital cameras or phone cameras which
are available all over the world and which are easily portable. These detectors are
inexpensive and simple to use point of care devices. For application where a higher
sensitivity, lower limit of detection or limit of quantification is needed, more specialized
detector systems are being developed, including spectrophotometers, fluorimeters
and gel documentation systems [2].

35
A notable device using colorimetric detection is a paper based protein detection
system developed by Wang et. al. [53]. The group used bromophenol blue for
semiquantitative analysis of bovine serum albumin in artificial urine in a tree-shaped
(Figure 2.5, C) self-calibrating detection system. The design ensures uniform conditions
of each assay.
2.3.2 Electrochemical Detection: Methods and Detector Systems
Compared to optical sensors, electrochemical sensors are not affected by dust,
light or insoluble compounds [19]. Also different research groups found that using
paper instead of solid materials for electrochemical sensors the influence of convection
of liquids caused by random motion, vibration, or heating can be reduced [37].
Electrodes can easily be integrated into PADs. For example Hu et. al. [19] presented
nanoporous gold electrode arrays on cellulose membranes which were used to develop
a cost-effective and environment-friendly paper-based electrochemical gas sensor for
the detection of oxide (Figure 2.5, A). Other researchers [43] also discovered that the
large surface area of the paper on top of the electrode is able to increase the signal
response of the sensor. An interesting PAD approach using electrochemical detection
is a device based on potentiometric immunoassay to detect IgE [46]. The PAD is built
from nitrocellulose paper sandwiched between two silicone rubber sheets connected
to electrodes on both sides (Figure 2.5, B).

36
Figure 2.5: Paper based analytical devices: A) Oxygen sensor based on nanoporous gold [37] B) Potentiometric immunoassay [37] C) Tree-shaped self-calibrating detection system [53]
For electrochemical detection normally electrochemical scanning systems such as
high-end potentiostats are used to measure very small signal changes. These devices
can be used to develop highly sensitive and quantitative assays. In order to develop
cheap and easy to use point of care devices without being forced to give up the benefits
of electrochemical detection several groups worked on simpler and cheaper detector
systems. Prof. George Whitesides group, for example, developed a PAD for
Electrochemical Flow-Injection with low cost components for the detector system
(amplifier, voltage regulator, voltage inverter & batteries) [24]. Also multimeters are
being discussed to be the next generation of electrochemical detectors [37]. Liu et. al.
[28] recently developed a paper based analytical device for electrochemical detection
of adenosine using a digital multimeter for the readout (Figure 2.7).
37
2.3.3 Energetic Principles
Most paper based analytical devices are based on 2D or 3D microfluidic circuits
using the advantage of capillarity for fluidic manipulations like transportation, sorting,
mixing or separation of the needed reagents [26]. Also gravity is sometimes used to
enhance the fluid flow [24]. The great benefit of this is, that these devices do not need
additional energy sources to cause fluid flow and the analytical test will run on its own
after the user has introduced the sample to the system. To accomplish multi-step-
analysis and diagnostic procedures some PADs are based on mechanical manipulators
like switches [30] or buttons [17] (vide infra). Also some paper based analytical devices
need electric energy sources (e.g. to drive UV lamps or to enable electrochemical
readout). Because of this several researchers are working on paper based batteries. For
example Thom et al. [49] developed a disposable paper-based galvanic cell battery for
diagnostic applications in resource-limited settings. The battery is composed of
multiple galvanic cells and can be incorporated directly into a multilayer paper-based
microfluidic device.
2.3.4 Analytical Principles
There are several analytical principles in the field, which are used to generate
either an optical or electrochemical detectable signal. One main principle to generate
a signal is chemical reactions. For example Yu et al. [62] developed a PAD based on
chemiluminescence signal generation which is used for simultaneous quantification of

38
glucose and uric acid. Their system is based on generation of hydrogen peroxide
through the chemical reaction of glucose and uric acid with oxidase enzymes. Hydrogen
peroxide is then used to produce light by reacting with a rhodanine derivative (Figure
2.6, B).
Another important type of analytical techniques are biological reactions especially
those which are based on immunoassays (see section 2.1). Immunoassays have the
advantage of high selectivity, rapid detection, and the possibility to analyze complex
matrices without pretreatment [37]. Using immunoassays on a paper substrate rather
than on a solid surface also leads to a higher surface-to-volume ratio and shorter
incubation times (e.g. 10 minutes for paper based ELISA [5] vs. hours on solid surfaces)
and possibly better limit of detection. The Whitesides group [5] for example developed
a paper based method to replace conventional 96-microzone microtiter plates with
paper based ones. Their method requires smaller reagent volumes (e.g 3 μl of sample
vs. 70 μl on microtiter plates) and less time (51 min vs. 213 min). Their limit of detection
for Rabbit IgG was about 54 fm.
Other biological methods are using different strains of bacteria which are able to
produce specific enzymes, which, for example have been used in a paper based
colorimetric assays [18]. A different analytical principle is based on the piezoelectric
effect discovered in oriented cellulose fibers. It was used to develop paper based strain
and vibration sensors [37]. Also temperature dependent reactions are used to develop
PADs. For example Nery et al. [37] described a method using thermochromic ink to

39
develop temperature sensors. The sensors consist of a series of pixels of various
actuation temperatures. When the actuation temperature of the pixel is reached it
turns colorless (Figure 2.6, C).
Figure 2.6: Paper based analytical devices. A) Paper based ELISA [5] B) Chemi-luminescence assay [37] C) Temperature sensor [37]
However many platforms are using combinations of those different principles. One
example is a paper based electrochemical ELISA that was developed again by the
Whitesides group. This analytical device uses the immunoassay technique combined
with an enzymatic catalyzed electrochemical reaction. It was used to detect rabbit IgG
with a detection limit of 3.9fm [58].
2.4 Fabrication Methods for PADs
Fabcrication of paper based analytical devices is fairly simple and inexpensive. The
First PAD was introduced by the Whitesides Group of Harvard University [35] which
used a photolithographic technique to fabricate their chips. The main goal of all
fabrication processes is to create hydrophobic barriers on sheet of hydrophillic
cellulose in order to generate millimeter-sized capillary channels [3]. Techniques

40
reported in the literature include cutting, printing, drawing, dip-coating, plotting,
photolithography and laser treatment (Table 2.4). To protect the devices from
contamination various enclosure methods like wrapping in adhesive tape, lamination
and toner or polymer coating are used [37].
Table 2.4: Comparison of common fabrication techniques for resolution, cost and high throughput (HT) adapted from [37]
Technique Resolution Cost HT
Cutting
Manual Cutting −− ++ −
CNC Cutting plotter − + ++
Laser cutter ++ −− +
Mechanical drill − − +
Printing
Wax printing ++ + +
Screen printing + ++ +
Flexographic printing
++ − +
Ink-jet printing ++ + +
Laser printing ++ + +
Transfer printing + + +
Others
Drawing −− ++ −
Dip-coating + ++ −
Plotting − + +
Photolithography ++ − +
2.4.1 Three-dimensional PADs
Compared to 2D paper based devices (e.g. dipsticks and lateral flow systems) that
are based on lateral movement of fluids across paper strips, 3D paper based
microfluidic systems are capable to distribute fluids both vertically and laterally. Using
a 3D design it is possible to develop PADs with complex microfluidic paths and the

41
capabilities of those low-cost analytical systems can be expanded significantly. Two
different approaches have been developed to build 3D PADs.
Layered paper and tape
Martinez et. al. [33] described a method stacking alternating layers of water-
impermeable double sided tape and paper to create three-dimensional PADs. First they
patterned the paper layers with hydrophobic wax in order to define the fluid channel
and cut holes into the tape do define the area where the fluid has to flow vertically.
Then they stacked the layers together, the holes in the tape were filled with a paste
made from cellulose powder and water in order to ensure a good connection between
the layers. The advantage of this approach is the simplicity with which these devices
are assembled which makes the prototyping of new designs rapid.
Origami approach
Origami PADs (oPADs) first described by Liu et al. [27] are fabricated on a single
sheet of paper (e.g. filter- or chromatography paper) and then assembled into a 3D
fluidic architecture by folding and sealing. Prior to the assembly the paper is patterned
with hydrophobic wax and heat treated in order to create the desired channels.
Compared to 3D devices fabricated from stacked layers of paper and tape this approach
is much simpler in particular for automated mass production. For sealing of those
devices the group reported a method using a glossy plastic envelope sealed with an
impulse thermal edge laminator [28]. That approach avoids adhesives which can lead

42
to contamination or nonspecific adsorption of reagents or targets [52]. They also
reported that it is possible to integrate electrodes by screen printing in those devices
(Figure 2.7).
Figure 2.7: Origami paper based analytical device for electrochemical detection of adenosine [28]
2.5 Control of Fluid Flow in Paper-based Devices
In microfluidic PADs, movement of the various fluids is based on capillary flow, this
is why mechanisms and equations developed for conventional microfluidic devices
cannot be applied. To accomplish multi-step-analysis and complex diagnostic
procedures (e.g. ELISA) the fluid flow in PADs has to be controlled and manipulated
(e.g. valves). For designing and modeling, the fluid flow in PADs has to be described
with suitable equations.
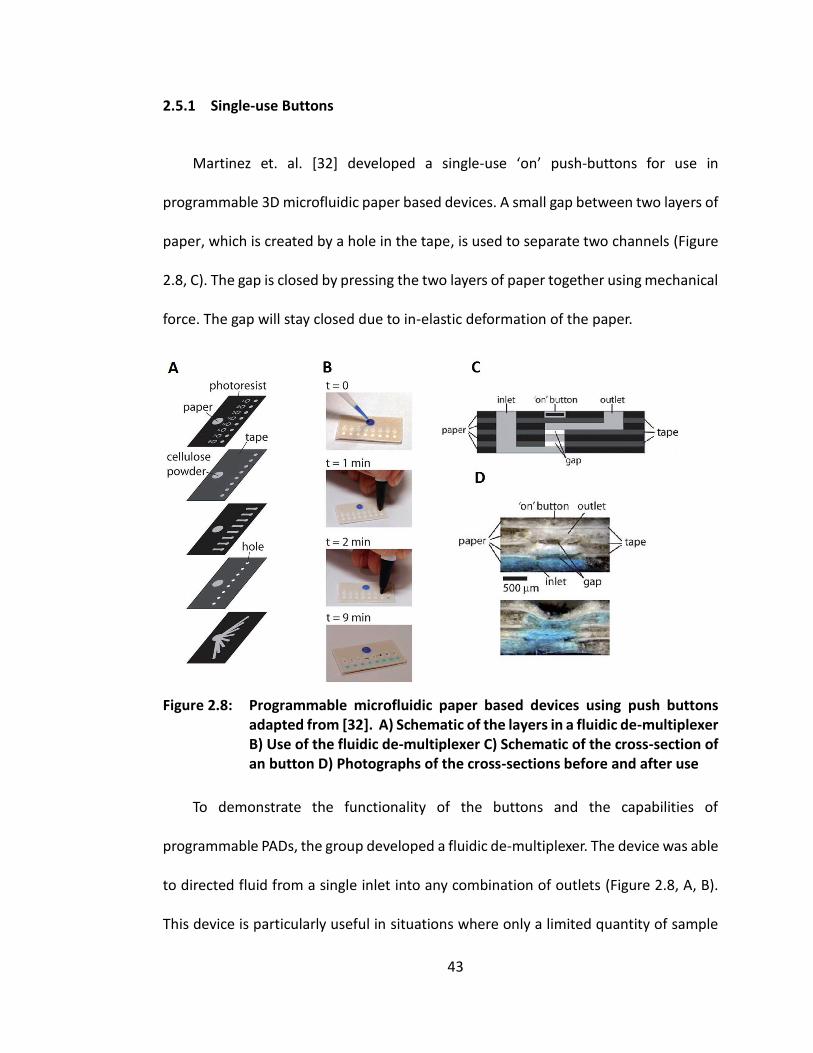
43
2.5.1 Single-use Buttons
Martinez et. al. [32] developed a single-use ‘on’ push-buttons for use in
programmable 3D microfluidic paper based devices. A small gap between two layers of
paper, which is created by a hole in the tape, is used to separate two channels (Figure
2.8, C). The gap is closed by pressing the two layers of paper together using mechanical
force. The gap will stay closed due to in-elastic deformation of the paper.
Figure 2.8: Programmable microfluidic paper based devices using push buttons adapted from [32]. A) Schematic of the layers in a fluidic de-multiplexer B) Use of the fluidic de-multiplexer C) Schematic of the cross-section of an button D) Photographs of the cross-sections before and after use
To demonstrate the functionality of the buttons and the capabilities of
programmable PADs, the group developed a fluidic de-multiplexer. The device was able
to directed fluid from a single inlet into any combination of outlets (Figure 2.8, A, B).
This device is particularly useful in situations where only a limited quantity of sample

44
is available, where analytical standards require multiple duplications of an assay, or
where reagents and samples must be combined in a timed sequence.
2.5.2 Fluidic Timers
Noh et. al. [38] develop a fluidic timer which does not require starting, stopping,
reset buttons, batteries, or maintenance. The fluidic timers can be integrated in any 3D
or 2D PADs. They are made using paraffin wax and the timing function is made possible
by the specific time required for a fluid to wick through a region coated with this wax.
The time period can be anywhere between 1 min and 2 h and is defined by the amount
of paraffin wax coated in the region. The group integrated their invention into a 3D PAD
(Figure 2.6, B) for the detection of glucose. They used the timer in combination with a
colorimetric signaling component (1μl of a dye solution) to pinpoint the time when the
test has to be read out.
2.5.3 Mechanical Switch
Zhong et. al. [64] developed a mechanical switch which can be integrated into a
PAD to stop the fluid flow through a channel until the switch is pulled mechanically.
The switches were produced from rectangular holes in the channels and a paper strip
that was patterned with wax leaving out an area with the same width as the fabricated
channels. After heating, the paper strip was inserted into the cut-out area of the paper

45
device. Pulling on the paper strip could then be used as a switch that restricts or allows
the fluid to flow through the fluidic channel.
2.5.4 Fluidic Valve
Chen et. al. [3] developed a fluidic valve which acts like a electric diode. The valves
consists of two functionalized discs fabricated of paper. One disc is made hydrophobic
by soaking the paper in Allyltrichlorosilane (A3CS) and the other is infused with
surfactant. If the fluid enters the valve from the hydrophobic side it is stopped. If it
enters from the side containing the surfactant, the fluid goes through the valve,
because the surfactant transforms the surfaces of the fibers in the hydrophobic disc
from hydrophobic to hydrophilic. Once the fluid passes the diode the valve is open for
fluid flow in both directions.
Figure 2.9: Two-dimensional representation of the valve principle [15]
The principle behind this is a simple reaction of two reagents (Figure 2.9). The
hydrophobic side of the valve is treated with Allyltrichlorosilane and the surfactant side
is treated with Tween 20. Treating filter paper with A3CS coats the cellulose fibers with

46
thin hydrophobic film and fluid cannot flow in the pores. Tween 20 on the other hand
makes the cellulose fibers hydrophilic again thus allowing fluid flow. Using this device,
fluidic networks can be developed which can sequentially pass different fluids through
a detection area. Chen et. al. [3] for example proposed the circuit shown in Figure 2.10
with two valves and a triggering channel to sequentially pass two different reagents by
a detection area. In this fluidic network or circuit the enzyme alkaline phosphatase was
used as the model analyte. It was deposited and dried at the detection spot. At one of
the input pads a color agent, such as a substrate was deposited, and at the same time
a stop buffer was pipetted in the other pad. At first the substrate solution travels
through the detection region and reacts with the immobilized enzyme to produce a
color. When the substrate solution reaches diode 2 it opens it and allows the stopping
buffer to begin flowing. However, this solution cannot at first go through the test spot
because diode 1 blocks the flow. Instead, it travels around the fluidic channel with a
clock indicator and after some time arrives at the forward end of diode 1 causing it to
open. Now the stop buffer can flow through the test spot and end the color producing
enzymatic reaction.
Figure 2.10: Colorimetric assay with triggering system using fluidic valves [3]
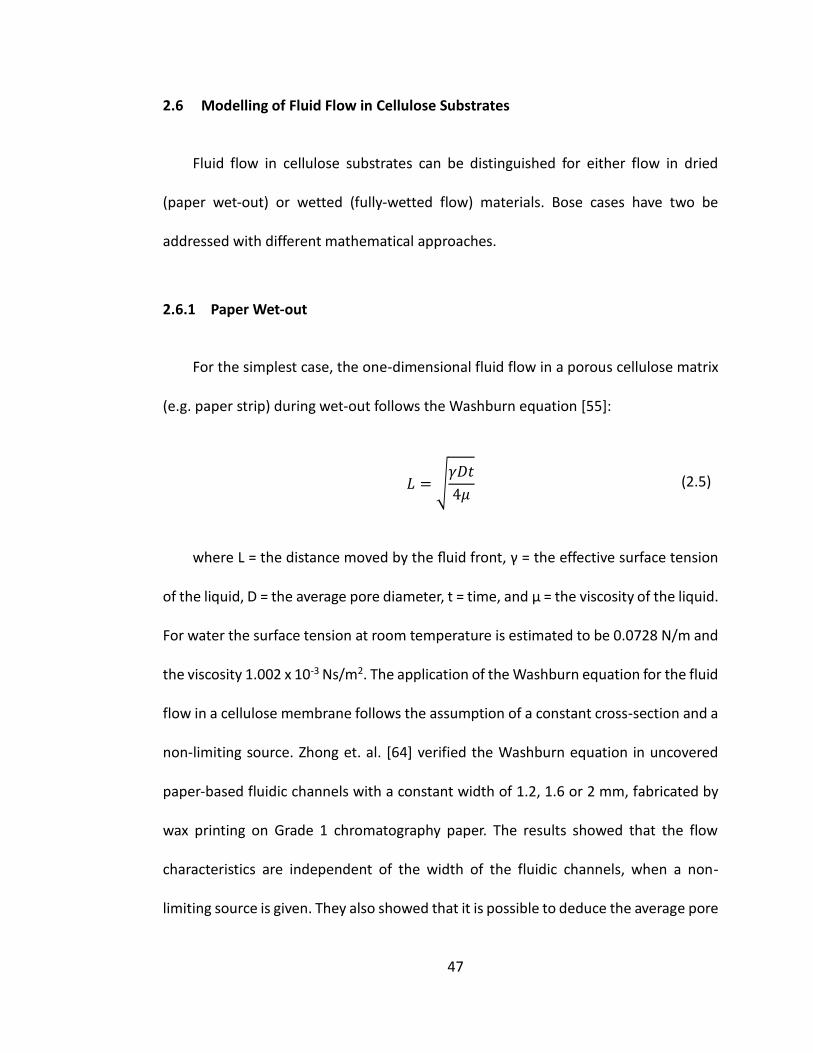
47
2.6 Modelling of Fluid Flow in Cellulose Substrates
Fluid flow in cellulose substrates can be distinguished for either flow in dried
(paper wet-out) or wetted (fully-wetted flow) materials. Bose cases have two be
addressed with different mathematical approaches.
2.6.1 Paper Wet-out
For the simplest case, the one-dimensional fluid flow in a porous cellulose matrix
(e.g. paper strip) during wet-out follows the Washburn equation [55]:
𝐿 = √𝛾𝐷𝑡
4𝜇 (2.5)
where L = the distance moved by the fluid front, γ = the effective surface tension
of the liquid, D = the average pore diameter, t = time, and μ = the viscosity of the liquid.
For water the surface tension at room temperature is estimated to be 0.0728 N/m and
the viscosity 1.002 x 10⁻³ Ns/m2. The application of the Washburn equation for the fluid
flow in a cellulose membrane follows the assumption of a constant cross-section and a
non-limiting source. Zhong et. al. [64] verified the Washburn equation in uncovered
paper-based fluidic channels with a constant width of 1.2, 1.6 or 2 mm, fabricated by
wax printing on Grade 1 chromatography paper. The results showed that the flow
characteristics are independent of the width of the fluidic channels, when a non-
limiting source is given. They also showed that it is possible to deduce the average pore

48
diameter with a good estimation by flow experiments using the rearranged Washburn
equation:
𝐷 =4𝐿2𝜇
𝛾𝑡 (2.6)
2.6.2 Fully wetted Flow
A flow in a pre-wetted paper channel of constant width can be described by
Darcy’s law [7]:
𝑄 = −𝜅𝑊𝐻
𝜇𝐿∆𝑃 (2.7)
where Q = the volumetric flow rate, κ= the permeability of the paper to the fluid,
μ = the viscosity of the fluid, WH = the area of the channel perpendicular to flow, and
∆P = the pressure difference along the fluid flow direction over the length L. The flow
rate of the fluid, q can be derived by assuming a constant cross-sectional area and by
division of WH on both sides of the equation:
𝑞 = −𝜅
𝜇𝐿∆𝑃 (2.8)
According to the principle of conservation of mass, the volumetric flow rate, Q has
to be constant along a channel. Therefore the time a fluid front needs to travel a certain
distance can be calculated from the ratio of volumetric flow rate and the volume of the
geometry and substituting in Darcy’s law [12]:

49
𝑡 =𝑉
𝑄=
𝑉𝜇𝐿
𝜅𝑊𝐻∆𝑝=
𝜇𝐿2
𝜅∆𝑃 (2.9)
where V = the volume of the fluid at the time t. For most fluid flow calculations
the fluid flow can be approximated with following parameters [64]: The viscosity of
water at the room temperature 1.002 x 10⁻³ Ns/m2 ;The pressure variation ∆P which is
assumed to be constant in capillary driven flow and estimated to be 4,560 N/m2 for
paper [12]; The permeability of paper can also be assumed to be constant, in the range
of 3 x 10-13 m2 [12]. Since all constants are known the fluid flow only depends on the
geometry. For more accurate calculations the permeability for a specific paper can be
developed through iteration.
2.6.3 Abundant vs. Constricted Flow
Zhong et.el [64] also studied the condition for abundant (Figure 2.11, A) and
constricted (Figure 2.11, B) fluid flow. They discovered that an abundant flow (from a
channel with a larger width to a channel with a smaller width) does not affect the fluid
flow rate. This is because a flow from a larger width channel acts as a non-limiting
source for the flow entering into a smaller width channel. In contrast a constricted flow
(from a channel with a smaller width to another channel with a larger width) constricts
the fluid flow rate at the transition point.

50
Figure 2.11: Fluid flow in channels with variation of the width adapted from [64] A) Abundant flow B) Constricted Flow
2.6.4 Electrical Circuit Analogy
For the purpose of simplified mathematical calculations of complex fluid flow in
2D or 3D paper networks, the fluid flow can be calculated with the analogy to an
electric circuit:
Figure 2.12: Schematic of the fluidic network analogy to electrical resistance. The total volumetric flux through a paper network of N segments in series, during fully wetted flow, follows the same form as Ohm’s Law for a circuit with N resistors in series. [12]
The total volumetric flow through a paper network of N segments of varying
widths in series, during fully wetted flow, follows the same form as Ohm’s law for
calculating the electric current through a circuit with N resistors in series [12]. By
extension of the simplest case of Darcy’s law and by imposing equality of the
volumetric fluxes in the segments of different widths the fluid flow in N connected
channels can be calculated:

51
𝑄 = −∆𝑃
𝜇𝜅
∑ 𝐿𝑖𝑊𝑖𝐻𝑖
⁄𝑁𝑖=1
=∆𝑃
𝑅𝑒𝑞 (2.10)
where WiHi = the area of segment i of the channel perpendicular to flow, Li = the
length of segment i of the channel in the direction of flow, and ∆P = the absolute
magnitude of pressure difference in the direction of flow. ∆P is thereby the fluidic
counterpart to voltage change, Q the fluidic counterpart to current, and Req the fluidic
equivalent to the resistance. As consequence of Darcy’s law, also fluidic channel
connected in parallel can be reduced to a single element by adding the fluidic
resistances in reciprocals.

52
CHAPTER 3 - METHODOLOGY
This chapter is used to present the methods and experiments used to develop and
optimize a fluidic circuit and an immunoassay based on the ELISA procedure for lateral
flow. Fabrication methods for the device, different circuit designs, assay development,
and housing development are addressed.
3.1 Chip Fabrication Method
Fabrication of all chips for this study was done using the layered paper and tape
method described in section 2.4 [33]. Briefly, all 3D fluidic circuits were built to contain
at least three layers consisting of two layers of filter paper with wax printed fluidic
channels held together by one layer of double-sided tape. Holes in the double-sided
tape filled with hydrophilic material were used to connect the flow layers (Figure 3.1).
Additional layers of one-sided tape were used to cover the channels to prevent
contamination, contact, or evaporation. All chips were fabricated in batches of 4 - 6
chips. The channels were printed on filter paper using a solid ink printer (Xerox®
ColorQube® 8570) with solid wax ink (Xerox® Genuine Solid Ink Black). All Flow
channels were cured for 60 seconds at 120⁰C using a Vacuum Oven (Isotemp® Model
280A, Fisher Scientific). Cut outs were made using a CO2 laser cutter (Epilog® Mini 24)
and cutting and printing masks were designed using vector graphic programs such as
Inkscape and Corel Draw®. To protect the adhesive sides of the tape during handling
and cutting processes tape was covered with wax paper (Parchment Paper, Reynolds®).

53
Figure 3.1: General principle of chip fabrication
3.2 Valve Fabrication Methods
To fabricate 3D fluidic valves two parts are needed: a hydrophobic anode and a
surfactant treated hydrophilic cathode (see section 2.5.4). Cellulose material was
treated with Allyltrichlorosilane (A3CS) to create a hydrophobic cathode and then
treated with Polysorbate 20 commonly known as Tween 20 (T20), a surfactant.
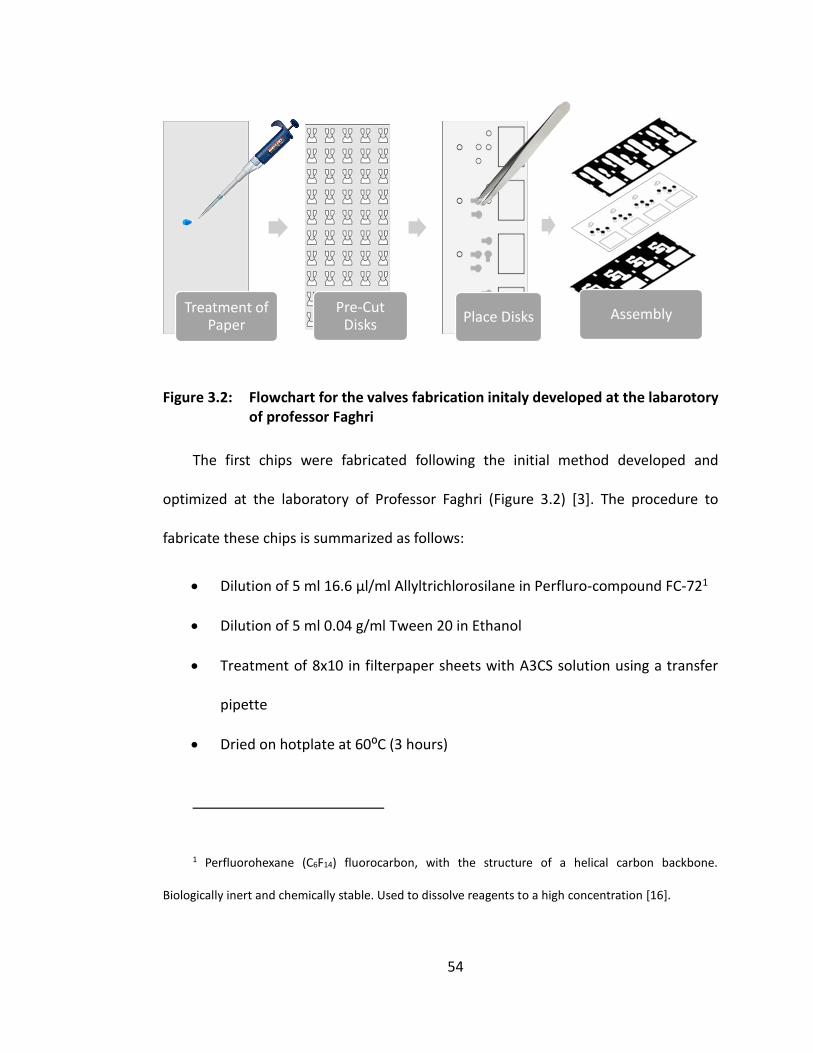
54
Figure 3.2: Flowchart for the valves fabrication initaly developed at the labarotory of professor Faghri
The first chips were fabricated following the initial method developed and
optimized at the laboratory of Professor Faghri (Figure 3.2) [3]. The procedure to
fabricate these chips is summarized as follows:
Dilution of 5 ml 16.6 μl/ml Allyltrichlorosilane in Perfluro-compound FC-721
Dilution of 5 ml 0.04 g/ml Tween 20 in Ethanol
Treatment of 8x10 in filterpaper sheets with A3CS solution using a transfer
pipette
Dried on hotplate at 60⁰C (3 hours)
1 Perfluorohexane (C6F14) fluorocarbon, with the structure of a helical carbon backbone.
Biologically inert and chemically stable. Used to dissolve reagents to a high concentration [16].
Treatment of Paper
Pre-Cut Disks Place Disks Assembly

55
Treatment of 8x10 in filterpaper sheets with entire amount of T20 solution
using a transfer pipette (dried at room temperature)
Cutting of 3 mm (hydrophobic) and 2.2 mm (surfactant) disks including a gap
and handling area
Cutting of 2.2 mm holes in double sided tape (middle layer of chip)
Manual assembly of valves using tweezers to place disks
For assembly (see Figure 3.2) on protective sides of the double sided tape was
removed and the surfactant disks were placed into the holes of the tape using tweezers
and the gap and handling area to position and attach the disks. Then the respective
flow layer was attached to the tape and the other protective side of the tape was
removed. Next the bigger hydrophobic disks were placed on top of the holes to
completely cover them. For the last step the missing flow layer was attached to the
tape.
To improve the fabrication process three advanced methods based on the one
described have been developed during this study.
3.2.1 Disk Punching
This method uses the same treatment for the disks as described before. However,
the method of manually handling the disks was replaced with a semi-automatic tool to
place all disks at once. The tool (Figure 3.4) consists of three parts: alignment, disk
holding, and punching.

56
Figure 3.3: Flowchart for valve fabrication using a tool to punch-out the disks
The CAD model of the tool was designed with SolidWorks (Dassault Systèmes®)
and the fabrication was done using rapid prototyping with fused deposition modeling
of ABS (Stratasys - Dimension Elite). The procedure to fabricate disks with the tool is
shown in Figure 3.3 and the necessary steps are as follows:
Pretreatment of filterpaper with Allyltrichlorosilane and Tween 20
Cutting of round shaped disks keeping attachment points to hold multiple
disks in strips
Fixation of disk holding strips in tool
Placing of double sided tape into alignment tool
Insertion of disk holding tool into alignment tool
Push out of disk by punching tool
Attachment of flow layer and slewing
Repeat of procedure for disks on the other side of the chip
Assembly of layers
Pretreatment of paper
Pre-cut disks Punch out disks
Assembly
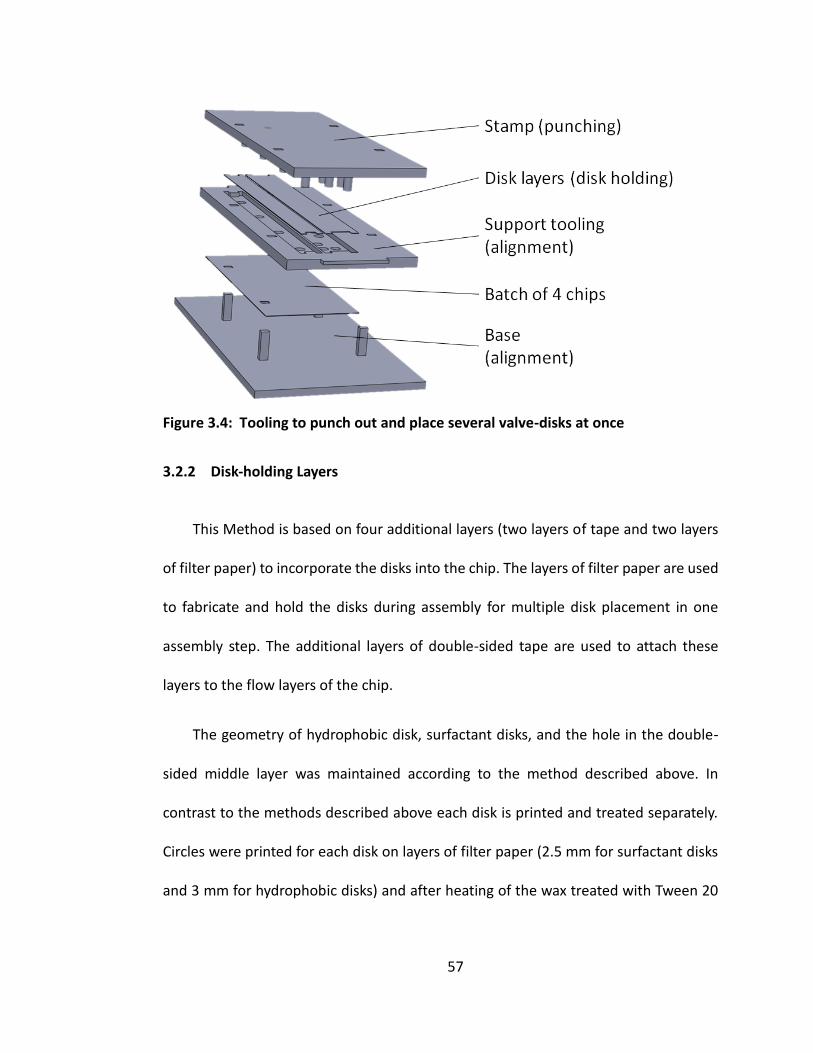
57
Figure 3.4: Tooling to punch out and place several valve-disks at once
3.2.2 Disk-holding Layers
This Method is based on four additional layers (two layers of tape and two layers
of filter paper) to incorporate the disks into the chip. The layers of filter paper are used
to fabricate and hold the disks during assembly for multiple disk placement in one
assembly step. The additional layers of double-sided tape are used to attach these
layers to the flow layers of the chip.
The geometry of hydrophobic disk, surfactant disks, and the hole in the double-
sided middle layer was maintained according to the method described above. In
contrast to the methods described above each disk is printed and treated separately.
Circles were printed for each disk on layers of filter paper (2.5 mm for surfactant disks
and 3 mm for hydrophobic disks) and after heating of the wax treated with Tween 20
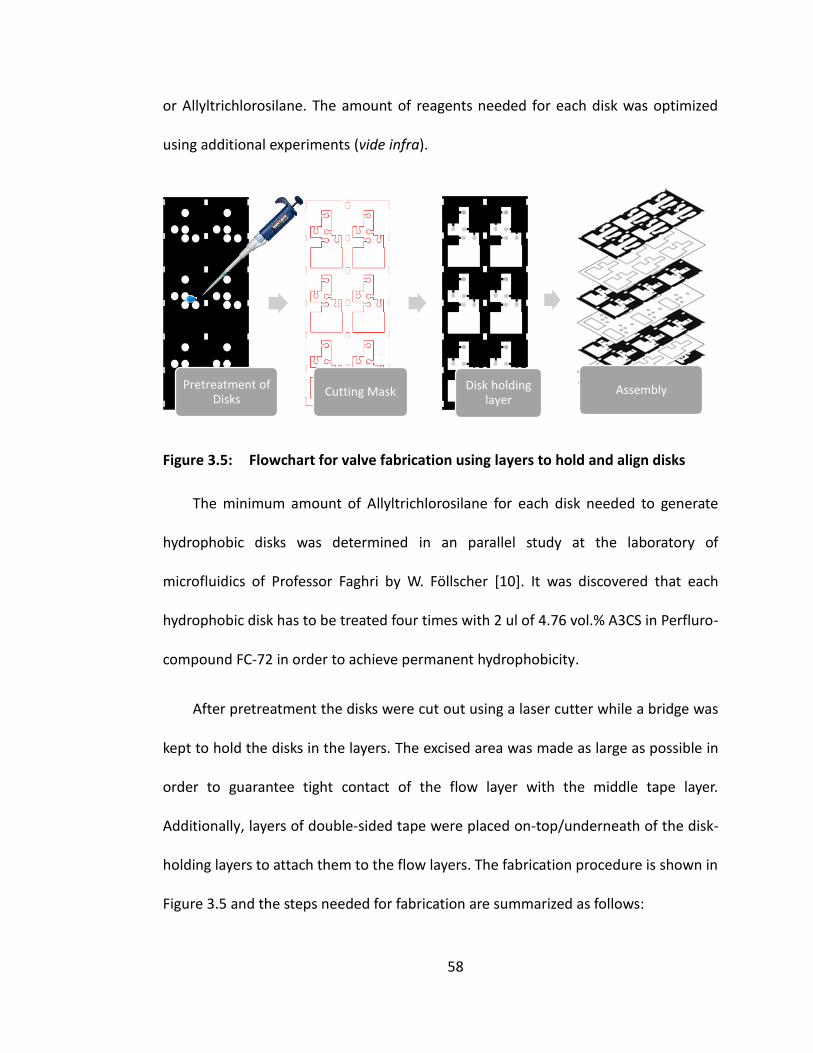
58
or Allyltrichlorosilane. The amount of reagents needed for each disk was optimized
using additional experiments (vide infra).
Figure 3.5: Flowchart for valve fabrication using layers to hold and align disks
The minimum amount of Allyltrichlorosilane for each disk needed to generate
hydrophobic disks was determined in an parallel study at the laboratory of
microfluidics of Professor Faghri by W. Föllscher [10]. It was discovered that each
hydrophobic disk has to be treated four times with 2 ul of 4.76 vol.% A3CS in Perfluro-
compound FC-72 in order to achieve permanent hydrophobicity.
After pretreatment the disks were cut out using a laser cutter while a bridge was
kept to hold the disks in the layers. The excised area was made as large as possible in
order to guarantee tight contact of the flow layer with the middle tape layer.
Additionally, layers of double-sided tape were placed on-top/underneath of the disk-
holding layers to attach them to the flow layers. The fabrication procedure is shown in
Figure 3.5 and the steps needed for fabrication are summarized as follows:
Pretreatment of Disks
Cutting Mask Disk holding layer
Assembly

59
Printing of 3 and 3.5 mm circles for hydrophobic and surfactant disks on filter
paper with wax
Heat treatment of disks in vacuum oven at 120⁰C for 60 s
Dilution of 35 Wt. % Tween 20 in Ethanol
Dilution of 50 μl/ml Allyltrichlorosilane in Perfluro-compound FC-72
Pretreatment of hydrophobic disks with 4 X 2 μl A3CS solution and surfactant
disks with 1 X 2 μl Tween 20 solution
Drying of disk holding layers at 60⁰C (at least 10 min)
Cutting of disk holding layers and double-sided tape using laser cutter
Assembly by stacking tape and paper layers
3.2.3 Surfactant Cellulose-Powder
This method is similar to the method described in section 3.2.2 but the number of
layers needed for fabrication is reduced. Instead of using disks made of surfactant
treated filter paper to fill the holes in the middle layer of the chips. The holes are filled
with a treated paste made from cellulose powder. Also the disks holding layers for the
hydrophobic part of the valve is replaced. In this method the hydrophobic layer is
prepared in the same way retaining the equivalent amount of Allyltrichlorosilane for
the disks as before but the disks are not cut out anymore.

60
Figure 3.6: Flowchart for valve fabrication using layers to hold and align disks
In the previous method flexibility of the disks and compression was used to
connect the hydrophobic disks to the next layer. In this method double-sided tape with
holes filled with untreated cellulose paste is used to connect the hydrophobic layer to
the flow layer.
The amount of surfactant per disks optimized for the method described earlier
(section 3.2.2) was maintained. To fill 2.2 mm holes in double-sided tape approximately
455 μg cellulose is needed. To reach the same amount of surfactant per disk a paste
with 154 mg/g surfactant modified cellulose was prepared and filled into the holes
using a spreader before removing the protective side of the tape. The preparation
procedure for this method is summarized as follows:
Printing of 3.5 mm circles for hydrophobic disks on filter paper with wax
Heat treatment of disks in vacuum oven at 120⁰C for 60 s
Dilution of 50 μl/ml Allyltrichlorosilane in Perfluro-compound FC-72
Pretreatment of Hydrophobic
DisksPre-Assembly
Filling Holes with Cellulose
PasteFinal Assembly
61
Pretreatment of hydrophobic disks with 4 X 2 μl A3CS solution
Dilution of 35 wt.% Tween 20 in Ethanol
Dilution of 0.25 ml/ml surfactant solution in ultra-pure water
Mixing of cellulose powder with the Water-Ethanol-Surfactant solution
(0.5 g/ml)
Mixing of cellulose powder with ultra-pure water (0.5 g/ml)
Pre-assembly of one tape to hydrophobic disk layer and one tape to bottom
flow layer
Filling of holes in double sided tape with cellulose powder (with or without
surfactant) using a spreader
Drying of layers at room temperature (approximately 10 min)
Final assembly of missing layers
3.2.4 Optimization of Surfactant
The amount of surfactant was optimized with the experimental setup shown in
Figure 3.7. Simple valves were fabricated with the preparation according to section
3.2.2 and different amounts of Tween 20 (40-286 μg) for the surfactant disks. The
amount of surfactant per disk was reached by treating the disks with surfactant
solutions between 10-60 wt.% Tween 20 in Ethanol. Each valve was wetted with 4 μl of
water with food coloring and the time was measured until the fluid was completely

62
absorbed by the hydrophilic area on the other side of the valve. The experiment was
repeated 18 times for each measured concentration of Tween 20.
Figure 3.7: Experimental setup for the optimization of the surfactant amount per disk in fluidic valves
3.3 Material Selection and Processing
Material was selected according to section 1.5 and knowledge gained during the
study. Filter paper (Grade 41, 20 µm, Whatman®) was chosen for printing the layers
because of good wax absorption and the common use as a sample pad in regular lateral
flow tests. Glass fiber was chosen for the conjugate pad material because of good hold-
up volumes and low nonspecific binding. Different glass fiber materials were studied
for the best conjugate release (vide infra). Absorption experiments (vide infra) were

63
conducted for different cellulose materials to estimate the hold-up volumes and the
absorption potential in order to select suitable materials for the absorption area.
Nitrocellulose (AE100, 12 µm, Whatman®) was chosen as a membrane.
Processing of the materials especially cutting and alignment were optimized
during the study. The cutting parameters of the Laser cutter (power, speed and fan-
support) were altered for all materials until a straight cut without burnt edges at the
highest possible cutting speed was achieved.
Specifications and the manufacturer for cellulose or adhesive materials used
during the study are listed below:
Table 3.1: Specifications and manufacturer for materials used during the study
Material Specification Vendor
Filter paper Grade 41, 20 µm Whatman®
Nitrocellulose membrane filters AE100, 12 µm Whatman®
Glass fiber membrane filters GA-55 Sterlitech®
Gel blot paper GB003 Whatman®
Double-sided tape n/a Ace®
3.4 3D Lateral Flow Test Strip Development
The 3D multi-fluid lateral flow tests presented in this study were developed by
modifying the common strip test design presented in section 1.5. Briefly, the basic
structure of a lateral flow test including membrane, sample pad, conjugate pad and
absorbent pad was maintained and the lateral flow test was transferred to a 3D PAD by
adding additional channels, inlets, and a valve mechanism.

64
3.4.1 One Valve two Inlets Design
As a base for the design preliminary test results for 3D lateral flow test conducted
by J. Cogswell at the laboratory of Prof. Faghri were used [15]. The preliminary design
(Figure 3.8) was based on two inlets and one valve fabricated in three layers. The valve
operates according to the previously described mechanism (section 2.5.4).
Figure 3.8: Two fluid lateral flow test based on fluidic valve
The first layer of the device consists of a 5 mm wide main channel and an input
pad for the second fluid. Two windows are cut into the first layer where the 5x8 mm
membrane and the 5x5 mm conjugate pad are placed. The windows above the
membrane or conjugate pad are needed to force the fluid through the material and in
case of the membrane are also necessary to allow a free view onto the signal. A double-

65
sided tape in which two holes were cut builds the second layer of this design. The hole
underneath the main channel is filled with a hydrophilic disk fabricated from filterpaper
to connect the main channel with the channel in the bottom layer. The second hole is
used for the valve and placed underneath the substrate input pad. The hydrophobic
side of the valve is placed on the upper side of the tape directly underneath the
substrate inlet to keep the substrate in the reservoir. The third layer consists of a trigger
channel connecting the valve with the hydrophilic disk. Once the sample is applied onto
the sample pad, the upper layer works like a common lateral flow test. The biggest
difference is that a part of the fluid is channeled through the hydrophilic disk into the
bottom layer where the fluid flows towards the valve. Once the fluid reaches the valve,
it opens the inlet and the substrate flows into the bottom channel traveling into the
opposite direction. The capillary force from the waste pad pulls the substrate into the
main channel where it moves through the strip like the sample before.
3.4.2 Two Valves two Inlets Design
Two main disadvantages were found for the design described in section 3.4.1.
Firstly the substrate has to travel back through the already wetted trigger channel, and
secondly the substrate has to flow through the conjugate pad. The test is slowed down
by the fact that the substrate has to travel in the already wetted channel and enzyme
labeled antibodies which may have remained in the conjugate pad can cross-
contaminate the substrate. To avoid these disadvantages a new design (Figure 3.9)
based on two valves was developed. The main geometries of the preliminary design

66
and the hydrophilic connection in the beginning of the strip where thereby maintained.
The substrate input pad with the first valve underneath was moved to the side of the
test close to the nitrocellulose membrane and a second valve (valve #2) was placed
before the nitrocellulose membrane underneath the main channel.
Figure 3.9: Two fluid lateral flow test based on two fluidic valves
The bottom layer of the new design contained three different areas in contrast to
the simple bottom layer of the old design: A trigger channel, a shortcut channel, and a
waste area. The trigger channel is directly connected to the sample pad through a
hydrophilic disk, which is placed in the first hole of the double sided tape. The trigger
channel length was determined in that way, that valve #1 opens when the entire
sample volume is consumed by the test. Once valve #1 is open and the substrate is

67
released, the fluid will flow through the shortcut channel and eventually open
valve #2. The bigger amount of fluid will flow through the shortcut into the main
channel where it passes the nitrocellulose membrane. In order to reduce the surface
area of the waste pad the unused space in the bottom layer was used as absorbent
pad. A relatively huge hole was cut out from the double sided tape and filled with glass
fiber as connection between the waste pad in the upper and in the bottom layer.
3.4.3 Four Valves three Inlets Design

68
Wash steps are commonly used in immunoassay procedures to wash away
unbound antibodies and increase the signal intensity by lowering the background noise
[8]. Because of this several researchers are working on methods to integrate wash steps
into lateral flow test devices. For example Fernández-Sánchez et. al. [9] reported a
significant improvement of the signal intensity using a wash step in a standard LFIA.
Using a wash step the group was able to lower their limit of detection to 2.4fm. Also
preliminary results at professor Faghri’s laboratory [15] showed that a wash step can
wash away unbound antibodies in cellulose substrates.
Because of this, the design presented in section 3.4.2 was extended to three inlets
including the sample a wash and the substrate. Two additional valves were added in
order to incorporate the third input into the strip test. The principle for the third input
is the same as described earlier. The difference is, that the fluid which vertically flows
into the trigger channel of the bottom layer divides into two separate channels. The
trigger channel is designed in that manner, that the fluid divides shortly before the first
two valves with a longer channel to the third and fourth valve. The length of the trigger
channel was determined so the second inlet opens after the sample is consumed and
the third inlet opens after the fluid from the second inlet traveled into the waste pad.
Additionally, a sheet of blotting paper was placed underneath the bottom layer using
another layer of double sided tape for attachment to extend the absorption area and
to stabilize the chip. To prevent bridging of the fluid the conjugate pad was placed
underneath the channel instead of above. The length of the main channel was kept as
short as possible in order to prevent fluid flow that was too slow.

69
3.5 Chip Optimization
Different trigger channel designs were used during the study (Figure 3.10). The
length of the trigger channels were calculated assuming paper wet-out (see section
2.6.1). The parameters for the fluid flow timings were found during the assay
development and material parameters were determined using flow experiments (vide
infra).
Figure 3.10: Trigger channel designs used during the study
The different trigger channel and valve fabrication methods configurations were
compared and evaluated for repeatability and reliability using water colored with food
coloring. The chip-yield and the valve opening deviation were determined in order to
compare the different methods and designs. Chips were failed under two conditions: a
leaking valve or a malfunctioned or delayed valve opening (+30 seconds).

70
Different materials were evaluated for their flow and absorption behavior, in order
to optimize the waste absorption and the fluid flow and to generate data to calculate
the channel length. To test the flow behavior, 70x6 mm strips were fabricated for each
tested cellulose material. The strips were continuously wetted with colored water from
an unlimited fluid source and the travel time until the fluid traveled 60 mm into the
strip was measured. The retention volume of the material was also determined by
measuring the necessary amount of fluid to completely wet a sheet of 20x20 mm of
the tested cellulose material.
The chip design was also optimized with regards to waste material, size
minimization, complexity of fabrication, and manufacturing time by changing the
geometry of the chip and fabrication batch.
3.6 Assay Development
The developed assay was built on the alkaline phosphatase based enzyme linked
imunnoabsorbent assay procedure.
The following section describes the procedure shown in Figure 3.11 in detail and
addresses the techniques used for preparation and implementation of the assay. Also
the optimizations conducted during the study are described. The section can further
be used as a manual for repeating the experiments.
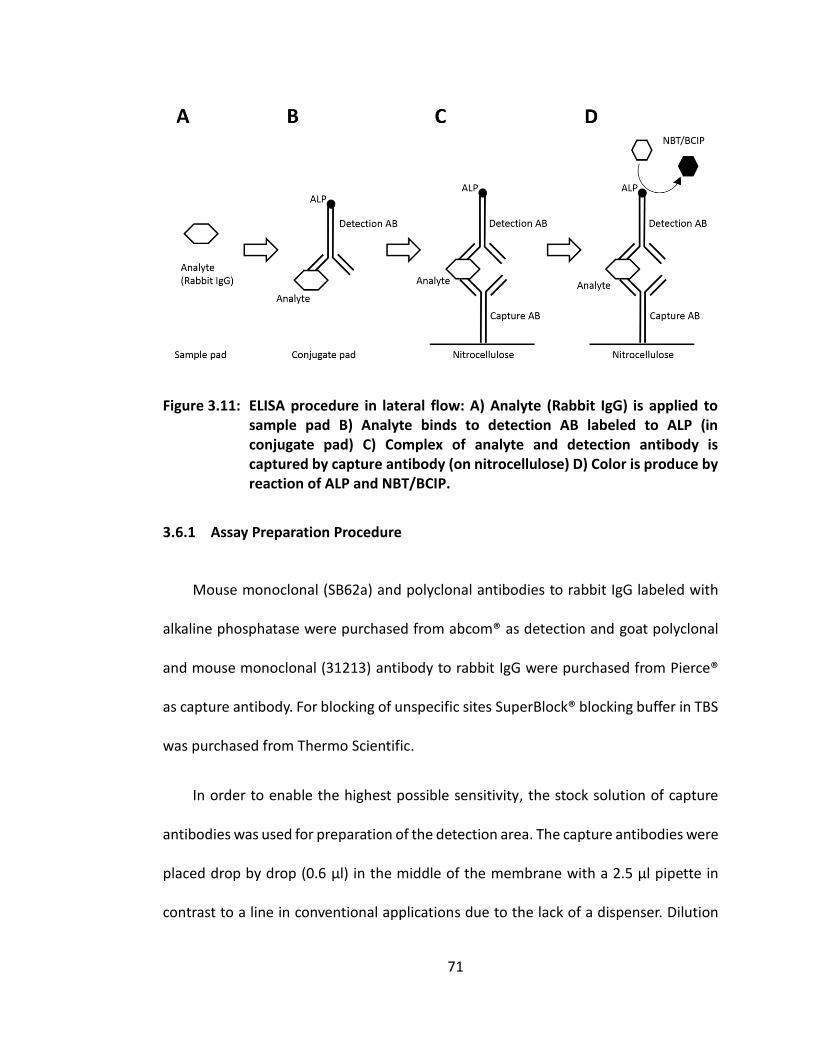
71
Figure 3.11: ELISA procedure in lateral flow: A) Analyte (Rabbit IgG) is applied to sample pad B) Analyte binds to detection AB labeled to ALP (in conjugate pad) C) Complex of analyte and detection antibody is captured by capture antibody (on nitrocellulose) D) Color is produce by reaction of ALP and NBT/BCIP.
3.6.1 Assay Preparation Procedure
Mouse monoclonal (SB62a) and polyclonal antibodies to rabbit IgG labeled with
alkaline phosphatase were purchased from abcom® as detection and goat polyclonal
and mouse monoclonal (31213) antibody to rabbit IgG were purchased from Pierce®
as capture antibody. For blocking of unspecific sites SuperBlock® blocking buffer in TBS
was purchased from Thermo Scientific.
In order to enable the highest possible sensitivity, the stock solution of capture
antibodies was used for preparation of the detection area. The capture antibodies were
placed drop by drop (0.6 μl) in the middle of the membrane with a 2.5 μl pipette in
contrast to a line in conventional applications due to the lack of a dispenser. Dilution
72
of all reagents was performed in a blocking buffer solution and the procedure for
preparation of the assay was conducted as follows:
Preparation of chip material (printing, cutting & treatment with reagents)
Blocking channels twice with Blocking Buffer Solution (fully wetted and dried
at 37 ⁰C on hotplate)
Dispensing 0.6 μl drop by drop at 1.8 mg/ml of monoclonal or polyclonal
capture antibody onto the membrane (dried at 37 ⁰C in covered petri dish)
Blocking of membrane for 8 minutes with blocking solution (fully wetted in
petri dish) dried at 37 ⁰C in covered petri dish
Treatment of conjugate pad with 10 μl of blocking reagent
Dilution of 20 wt.% (trehalose/sucrose) in blocking buffer
Treatment of conjugate pad with 10 ul at 40 μg/ml of goat polyclonal or
monoclonal anti-rabbit IgG labeled with alkaline phosphatase diluted in
blocking/sugar solution (dried at 37 ⁰C in covered petri dish)
Chip assembly (after drying of material)
3.6.2 Assay Implementation Procedure
Rabbit IgG was purchased from Thermo Scientific and diluted in blocking buffer
for the sample solution. Dilutions with antigen concentrations from 1 μg/ml to 1 ng/ml
were prepared and dilution factors covered three orders of magnitude (1 X 10³) to
reduce the deviation error. The solutions were vortexed in between each dilution step

73
for at least 60 seconds in order to ensure homogeneous distribution of the antigens.
Blocking buffer was used as sample fluid for negative controls.
BCIP®/NBT tablets2,3 were purchased from SIGMAFAST™ as specific substrate to
the alkaline phosphatase label and one tablet of BCIP®/NBT was dissolved in 10 ml
ultra-pure water to produce the substrate solution.
The first assay experiments were conducted with the two fluid design described in
section 3.4.2. The volume for the sample (80 μl) and the volume substrate (120 μl) was
adapted from preliminary results obtained at Professor Faghri’s laboratory. For the
assay experiments, first the substrate and the wash were applied to the reservoirs of
the test. Afterwards the test was started by applying the sample to the sample pad.
The experiments were used as proof of concept, to test the repeatability in particular
the reliability of the valves and to optimize variable parameters.
Optimization of the regents was conducted using the three fluid chip design
presented in section 3.4.3. Experiments including this design were performed with 130
μl of sample, 60 μl of wash and 120 μl of substrate. The volume for the sample was
adjusted for optimal conjugate release (vide infra), and the substrate volume was
2 BCIP = 5-Bromo-4-chloro-3-indolyl phosphate (artificial chromogenic substrate)
3 NBT = Nitro blue tetrazolium (oxidant)

74
adapted from the preliminary result. The amount of washing buffer was fixed at the
maximum possible amount of 60 μl to keep the test duration under 12 minutes.
To document the results of the experiments all tests were recorded using at least
600 dpi scans. The images were taken immediately after finishing of the tests. The
signal intensity was measured as mean grey value using the image processing program
ImageJ.
3.6.3 Optimization of Conjugate Release
The conjugate release was optimized by changing various parameters, such as
sugar concentration in the pad, geometry of the conjugate pad, blocking and materials.
The impact of sugar to the assay was investigated, in a parallel study in this topic and
the results showed that a sugar concentration of 20wt.% in the antibody dilution with
equal proportions of trehalose and sucrose leads to the optimal antibody release [10].
To achieve optimal antibody release, all conjugate pads for this study were prepared
using these previously determined amounts of sugar.
In addition, the conjugate release was optimized by valuating glass fiber material
with binders and without binders for the conjugate pad, blocking of conjugate pads
before applying antibodies, the amount of fluid needed to release the conjugate and
the size of the conjugate pad. In order to compare the release for different conjugate
pads, an experiment was designed where the conjugate pad was washed with
increasing amounts of fluid and the signal intensity of the release was measured.

75
Therefore, the tested conjugate pad was first prepared with the antibodies according
to section 3.6.1 and placed onto blotting paper. Afterwards the conjugate pad was
washed several times with steps in the range of 20-40 μl of fluid. After each washing
step the conjugate pad was moved to a different place on the blotting paper. Next,
10 μl of substrate was applied to each place where the conjugate pad was washed and
the signal intensity of the developed signal was observed.
3.6.4 Optimization of Detection Antibody
The detection antibody has an important impact on assay sensitivity and
background noise. To optimize this parameter the concentration of the anti-rabbit IgG
antibody in the conjugate pad was varied between 10 μg/ml to 80 μg/ml while all other
assay parameters were kept constant. The assay was run using triplicate 500 ng/ml
samples per detection antibody concentration. To further optimize the signal
polyclonal and monoclonal antibodies were evaluated as detection antibodies. To
compare the results the signal-to-noise ratio was determined by reading out the mean
grey value of the scans using ImageJ.
3.6.5 Optimization of Capture Antibody
In order to enable the highest possible sensitivity the stock solution of capture
antibodies were used for preparation of the detection area. To further optimize the
signal polyclonal and monoclonal antibodies were evaluated as capture antibodies.
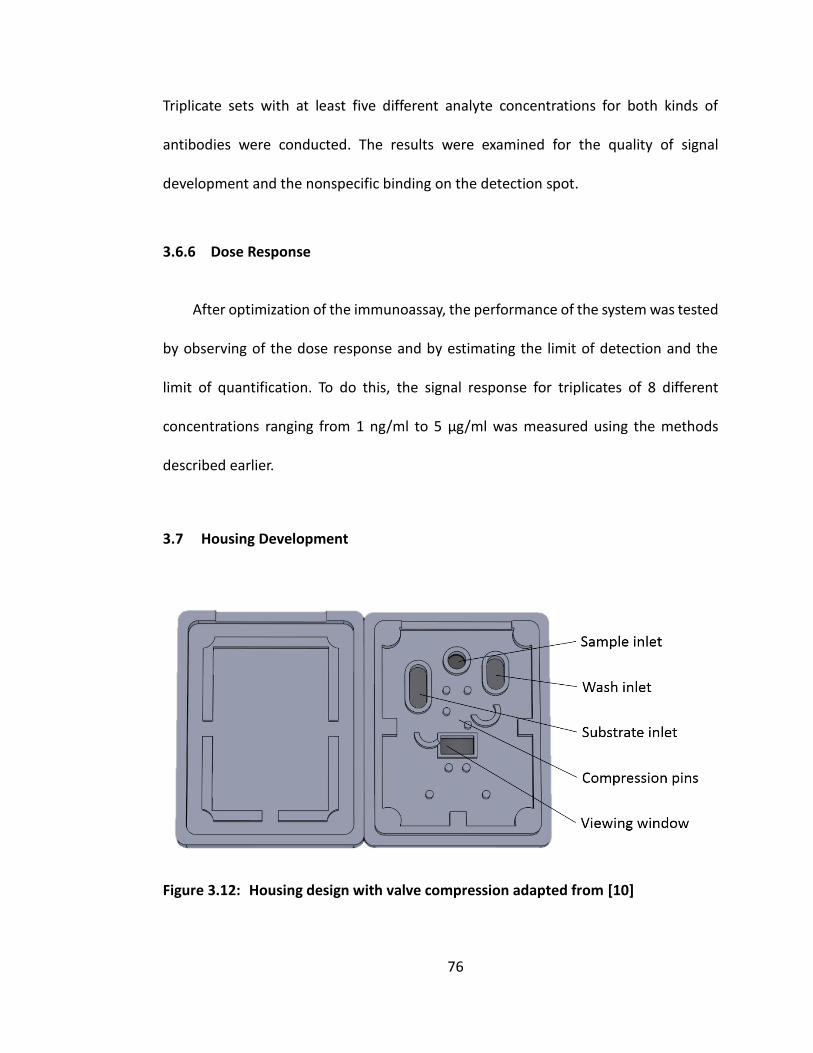
76
Triplicate sets with at least five different analyte concentrations for both kinds of
antibodies were conducted. The results were examined for the quality of signal
development and the nonspecific binding on the detection spot.
3.6.6 Dose Response
After optimization of the immunoassay, the performance of the system was tested
by observing of the dose response and by estimating the limit of detection and the
limit of quantification. To do this, the signal response for triplicates of 8 different
concentrations ranging from 1 ng/ml to 5 μg/ml was measured using the methods
described earlier.
3.7 Housing Development
Figure 3.12: Housing design with valve compression adapted from [10]

77
In order to develop a POC device a housing was needed to store the substrate and
wash solutions and according to section 1.5.5 a housing is also necessary to compress
different materials together and ensure consistent assay conditions. Experimental
results (vide infra) also showed that compression of material can increase the valve
performance particularly for the valve fabrication method described in section 3.2.2. A
basic housing design with compression for the valves and the connection between the
materials was developed by Föllscher [10]. The design was adapted and modified to be
compatible with the lateral flow test strip design presented in section 3.4.3 (Figure
3.12). The housing was designed with SolidWorks (Dassault Systèmes®) and the
fabrication was done using rapid prototyping with fused deposition modeling of ABS
(Stratasys - Dimension Elite).
3.7.1 Reagent Storing
Figure 3.13: CAD model for housing with reagent storing
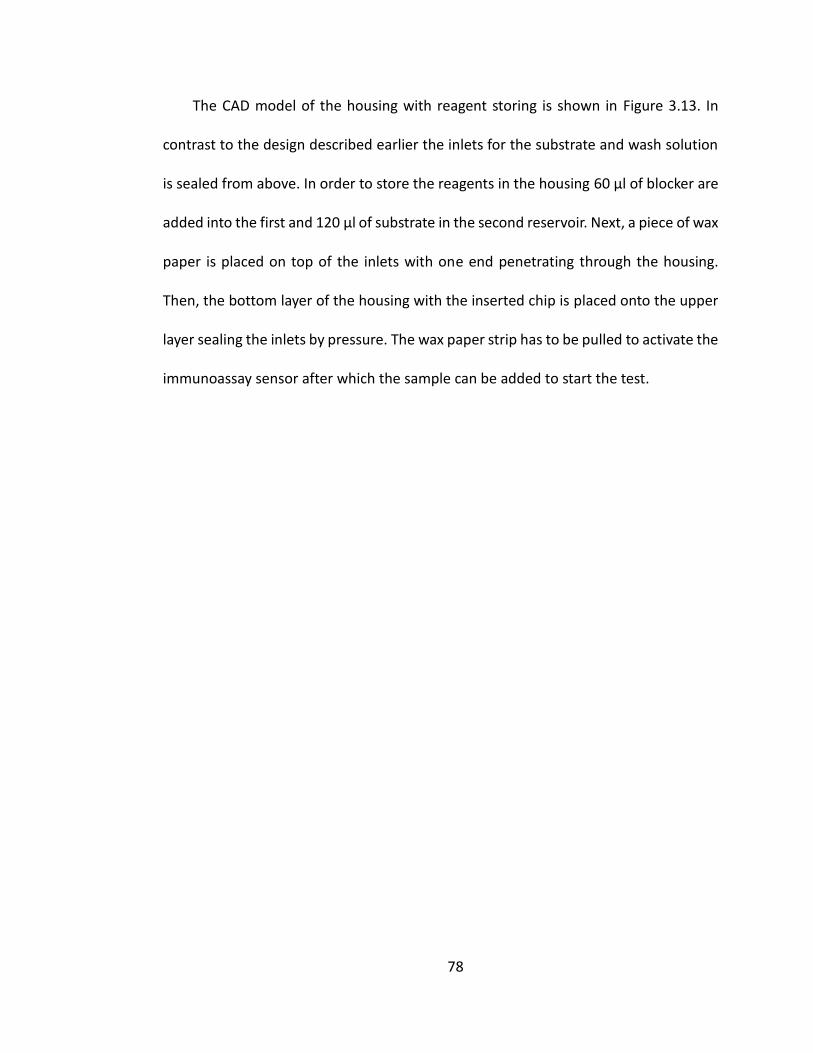
78
The CAD model of the housing with reagent storing is shown in Figure 3.13. In
contrast to the design described earlier the inlets for the substrate and wash solution
is sealed from above. In order to store the reagents in the housing 60 μl of blocker are
added into the first and 120 μl of substrate in the second reservoir. Next, a piece of wax
paper is placed on top of the inlets with one end penetrating through the housing.
Then, the bottom layer of the housing with the inserted chip is placed onto the upper
layer sealing the inlets by pressure. The wax paper strip has to be pulled to activate the
immunoassay sensor after which the sample can be added to start the test.

79
CHAPTER 4 – FINDINGS AND DISCUSSION
This chapter presents the knowledge gained during the development of a paper
based analytical devices, which uses fluidic valves to trigger multiple fluid flows in order
to autonomously conduct ELISA procedure. Different fabrication methods are
compared and the results of the immunoassay optimization are addressed.
4.1 Material Processing
Proper cutting parameters are very important for the fabrication process and the
lateral flow test itself. Cutting power that is too high or too low can lead to burned
edges of the material. Particles resulting from the burned material can be dissolved
from the fluid flow and be transferred into the channels or detection area leading to
discoloration. The various materials used in this study have a different tendency to
burn, for example, a relatively low cutting power (3%) is needed to cut nitrocellulose
membranes because of the high affinity to burn, whereas slightly different cutting
parameters (+2% cutting power) can cause nitrocellulose to burn. Also the cutting
speed is an important parameter for fabrication. Since many masks (channels,
absorption, membrane, tapes etc.) have to be cut and one cutting process can take up
to 15 minutes (e.g. cutting of disks holding layers) rapid cutting is preferable. On the
other hand, the accuracy decreases with increased cutting speed resulting in rough
edges. Fan support can help to prevent burning of material but it can also ruin the
cutting process and make it inaccurate due to shavings and particles that have been
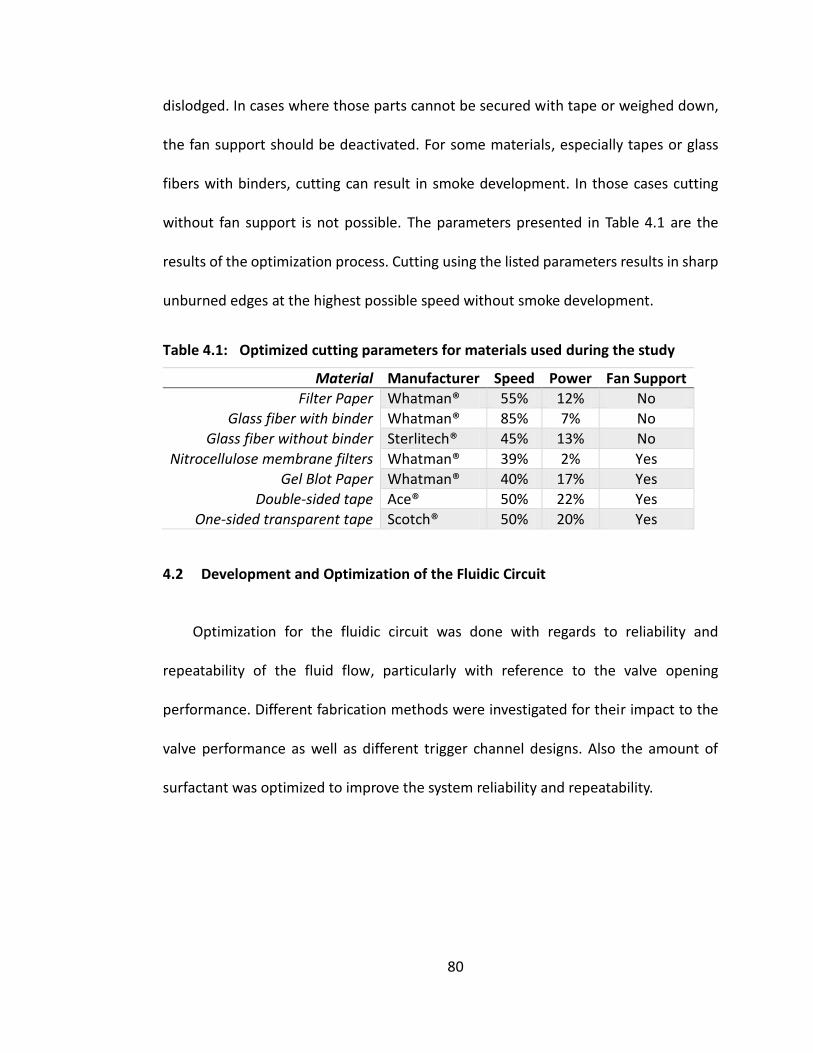
80
dislodged. In cases where those parts cannot be secured with tape or weighed down,
the fan support should be deactivated. For some materials, especially tapes or glass
fibers with binders, cutting can result in smoke development. In those cases cutting
without fan support is not possible. The parameters presented in Table 4.1 are the
results of the optimization process. Cutting using the listed parameters results in sharp
unburned edges at the highest possible speed without smoke development.
Table 4.1: Optimized cutting parameters for materials used during the study
Material Manufacturer Speed Power Fan Support
Filter Paper Whatman® 55% 12% No
Glass fiber with binder Whatman® 85% 7% No
Glass fiber without binder Sterlitech® 45% 13% No
Nitrocellulose membrane filters Whatman® 39% 2% Yes
Gel Blot Paper Whatman® 40% 17% Yes
Double-sided tape Ace® 50% 22% Yes
One-sided transparent tape Scotch® 50% 20% Yes
4.2 Development and Optimization of the Fluidic Circuit
Optimization for the fluidic circuit was done with regards to reliability and
repeatability of the fluid flow, particularly with reference to the valve opening
performance. Different fabrication methods were investigated for their impact to the
valve performance as well as different trigger channel designs. Also the amount of
surfactant was optimized to improve the system reliability and repeatability.

81
4.2.1 Comparison of Fabrication Methods
The methods for the production of valves presented in section 3.2 have different
advantages and disadvantages (Table 4.2) which will be discussed in the following.
Assembling a chip with four valves using the initial method by manually placing each
disk for the valves one after another takes about 50 minutes for a batch of 6 chips. The
accuracy of placing the disks is highly dependent on the experience of the constructor
and a consistent alignment over different chips is not possible. These circumstances
result in high deviations in the valve opening and therefore in high valve failure rates
(vide infra).
Table 4.2: Comparison of valve fabrication methods used during the study
Manual Disks-Punching Disk-Holding
Layers Cellulose
Disks
Layers needed (Paper/Tape)
3 (2/1)
3 (2/1)
7 (4/3)
5 (3/2)
Preparation Time (for 100 Valves)
30 min 30 min 60 min 45 min
Assembly Time (for 6 chips)
50 min 13 min 17 min 15 min
Advantages
Small waste Small waste Design changes easily possible
Less Cutting needed
Easy design & development
Good possibility of automating
Small reagent deviations
Very easy Alignment
Mass production of
valves
Mass production of
valves
Disadvantages
Very difficult alignment
Complicated design changes
Compression needed
Messy fabrication
High chip deviation
Time consuming
development High waste
Drying needed during
assembly
High reagent deviation
Brittle Layers

82
Also the manner of pretreating a whole paper with the reagents could lead to
variations of reagent concentration in the material itself resulting in poor valve opening
behavior. However, the design and preparation of the fluidic circuit design and valves
is quick, easy and very little waste is produced. Another benefit is that the valve disks
can be mass produced for future use.
Using the disk punching method for fabrication of valves is advantageous because
the chip design with three layers reduces the assembly time for a batch of 6 chips from
50 to 13 minutes. However, the valve placing with this method is still not accurate
enough. Assemblies done with this method sometimes resulted in misplaced disks or
the disks remained stuck to the tool. Possible explanations are a rough surface, low
fabrication tolerances for the tool, and insufficient alignment either of the disks in the
tool or the tool alignment itself. Even when those problems are solved the biggest
disadvantage for this method is the tool itself. Once the tool is designed and fabricated
it can only be used for one particular chip design. If the chip has to be changed the tool
has to be redeveloped and refabricated as well. Also it has been found, that the
fabrication with rapid prototyping is not satisfactory with respect to tolerance accuracy.
Although more layers are needed for the fabrication of valves with the “disk-
holding” method and the design for printing and cutting masks are more complicated,
it still offers the opportunity to place several valve disks in one assembly step without
the need of a specific tool. Once a chip design for this method is established, changes
to this design are easily possible. Since this methodology requires treatment of each

83
individual disk, it offers the opportunity to control the amount of reagents very
precisely. This approach was used to optimize the exact amount per disks needed for
optimal valve opening behavior (vide infra).
The major disadvantage of the “disk-holding” method is the relatively large gap
between the layers caused by the extra tape layers needed to connect the disk holding
layers to the channels. Because of these gaps no repeatable valve opening behavior
could be reached (vide infra). But in another study [10] it was found, that compression
of the layers using a housing can help to improve valve performance. The “disk-
holding” layers are also very brittle and difficult to handle and align. This can lead to
reduced chip yield due to broken disks. And compared to the methods presented
earlier, this fabricating uses a lot of hydrophobic ink and filterpaper.
The last developed method dispenses the conventional art of using disks for the
production of valves. No more cut outs are necessary and gaps between the layers are
filled completely with cellulose paste. The biggest advantage of this is, that no
additional compression is needed for reproducible valve opening behavior. It also
reduces the time needed for preparation because of less cutting and treatment with
reagents. On the other hand, fabrication is messy because of particles that result from
crumbling during drying of the cellulose paste. But those disadvantages are marginal
compared to the disadvantages of the other methods.
84
4.2.2 Impact of Fabrication on Reliability and Repeatability
Reliability and repeatability are important factors for analytical devices,
particularly for the market admission of medical products [47]. They can only be
assessed with constant assay results and without defective products. In order to have
consistent test results for paper based microfluidic analytical devices, constant flow
characteristics over all fabricated devices are required. Otherwise the results can lead
to high deviations in the signal intensity and background noise (vide infra), making it
impossible to have reliable results. For the developed paper based analytical device it
was found, that the fabrication of those devices and the preparation of the valves has
a great impact on the reliability and repeatability of the fluidic circuit. Alignment of the
different layers, valve disks, conjugate pad, or membrane is crucial. It was observed,
that small deviations in placing of the membrane or conjugate pad can result in an
assay duration deviation of about 1-2 minutes. This is because the fluid flow is blocked
when the above mentioned parts are not placed perfectly in the channel. Also, bridging
of fluid flow on the sides of the material was observed for misplaced conjugate pads
resulting in a much faster fluid flow than normal. An even greater impact on the
repeatability has the preparation and the alignment of disks for the valves. Misplaced
hydrophobic disks can cause the fluid to wick into a gap between the tape and the disk,
which results in a leaking valve. This leaking occurs more often when manually placing
the disks and could be prevented almost completely with the method where layers
with hydrophobic spots are used instead of disks (see Figure 4.1).
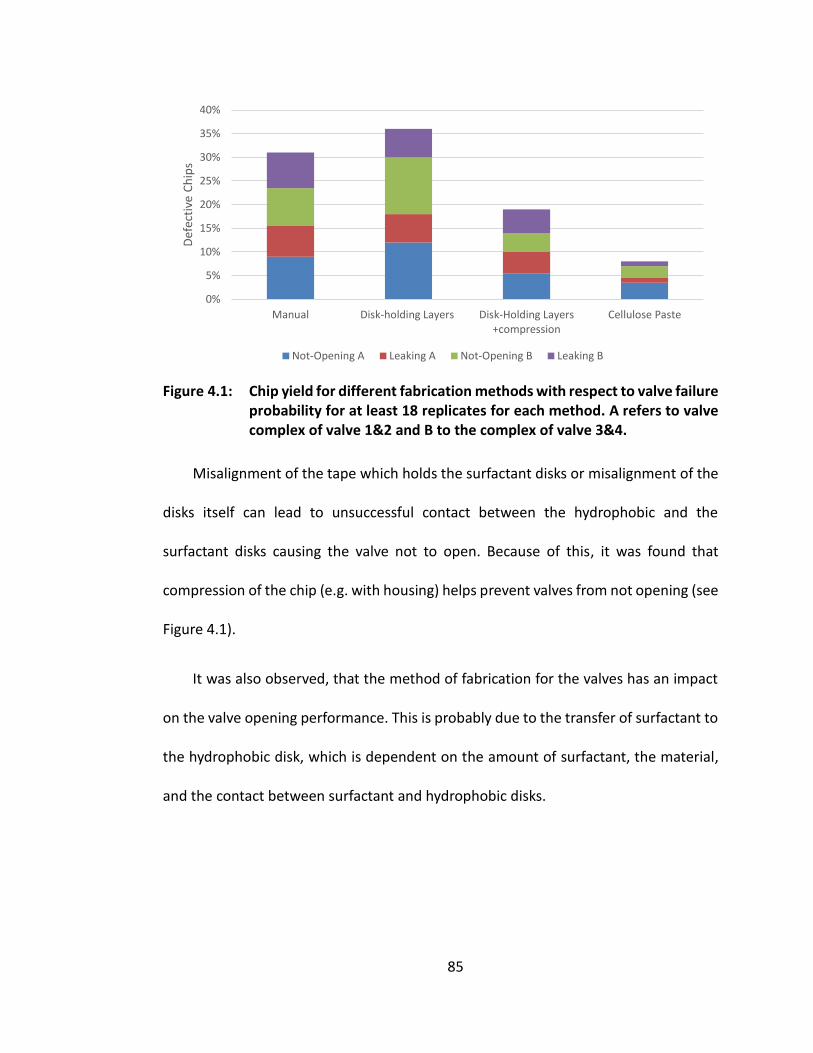
85
Figure 4.1: Chip yield for different fabrication methods with respect to valve failure probability for at least 18 replicates for each method. A refers to valve complex of valve 1&2 and B to the complex of valve 3&4.
Misalignment of the tape which holds the surfactant disks or misalignment of the
disks itself can lead to unsuccessful contact between the hydrophobic and the
surfactant disks causing the valve not to open. Because of this, it was found that
compression of the chip (e.g. with housing) helps prevent valves from not opening (see
Figure 4.1).
It was also observed, that the method of fabrication for the valves has an impact
on the valve opening performance. This is probably due to the transfer of surfactant to
the hydrophobic disk, which is dependent on the amount of surfactant, the material,
and the contact between surfactant and hydrophobic disks.
0%
5%
10%
15%
20%
25%
30%
35%
40%
Manual Disk-holding Layers Disk-Holding Layers+compression
Cellulose Paste
Def
ecti
ve C
hip
s
Not-Opening A Leaking A Not-Opening B Leaking B

86
Figure 4.2: Valve opening performance for different fabrication methods. Opening duration and standard deviation of opening for at least 18 replicates.
As presented in Figure 4.1, the worst valve opening behavior was achieved with
the manual method. It takes over 65 seconds with a standard deviation of ±45 seconds
for the average valve to open. The explanation for this is that only a limited amount of
surfactant can be used for this method, since amounts of surfactant that are >50 μg
per disk prevent the disks from sticking to the tape, making alignment almost
impossible.
For the other methods, the amount of surfactant per disk was optimized (vide
infra). As seen from Figure 4.1, this optimization results in faster valve opening with
smaller opening deviations. It was found that cellulose powder for the surfactant disks
results in the best valve opening behavior. A possible explanation for this is that there
are better contact or improved surfactant release characteristic for this material.
0 20 40 60 80 100 120
Cellulose Paste
Disk-Holding Layers w. compression
Manual
Opening Duration [s]

87
4.2.3 Optimization of Surfactant
Figure 4.3 shows the results of the surfactant optimization. It can be seen that a
minimum amount of surfactant per disk ( 20-35 μg) is needed to open the valves. It
should be noticed, that with decreasing amount of surfactant per disk the time to open
the disks exponentially increases. This is also true for the deviation of the valve
opening.
Figure 4.3: Average valve opening duration and standard deviation in dependence of the amount of surfactant per disk for at least 18 replicates. Rectangular indicates optimized amount.
A saturation point for the curve can be observed for approximately 220 μg
surfactant per disk. At this point the cellulose material is probably oversaturated with
the surfactant. A high deviation of the valve opening can decrease the reproducibility
of the immunoassay due to different incubation times or fluid flow conditions. Thus,
higher concentrations of surfactant can result in more consistent assay results.
However, it was also found that concentrations that were too high in surfactant load
0
50
100
150
200
250
300
0 50 100 150 200 250 300
Ave
rage
val
ve o
pen
ing
du
rati
on
[s]
Tween 20 per disk [µg]
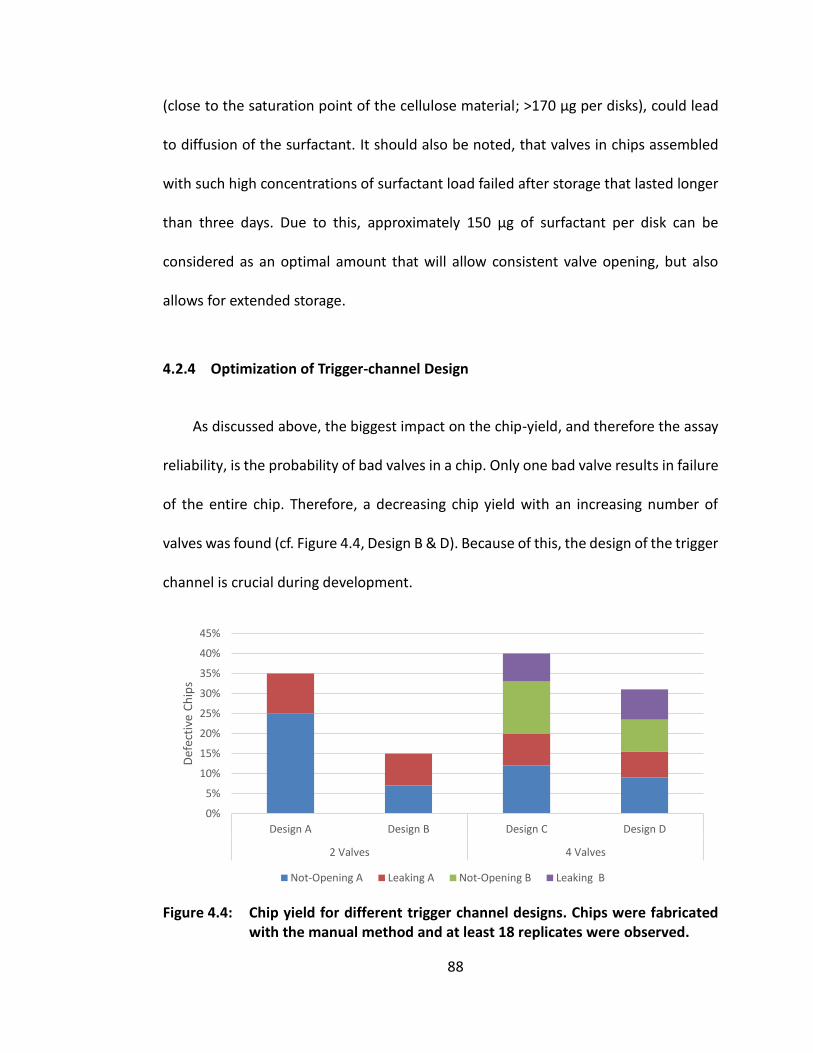
88
(close to the saturation point of the cellulose material; >170 μg per disks), could lead
to diffusion of the surfactant. It should also be noted, that valves in chips assembled
with such high concentrations of surfactant load failed after storage that lasted longer
than three days. Due to this, approximately 150 μg of surfactant per disk can be
considered as an optimal amount that will allow consistent valve opening, but also
allows for extended storage.
4.2.4 Optimization of Trigger-channel Design
As discussed above, the biggest impact on the chip-yield, and therefore the assay
reliability, is the probability of bad valves in a chip. Only one bad valve results in failure
of the entire chip. Therefore, a decreasing chip yield with an increasing number of
valves was found (cf. Figure 4.4, Design B & D). Because of this, the design of the trigger
channel is crucial during development.
Figure 4.4: Chip yield for different trigger channel designs. Chips were fabricated with the manual method and at least 18 replicates were observed.
0%
5%
10%
15%
20%
25%
30%
35%
40%
45%
Design A Design B Design C Design D
2 Valves 4 Valves
Def
ecti
ve C
hip
s
Not-Opening A Leaking A Not-Opening B Leaking B

89
During development of the two valve fluidic circuit, it was found that the
probability of a valve to open properly increases when the valve is located in a dead
end of the trigger channel. This is likely due to the fact that a minimum volume of fluid
is needed to open the valve and that the valve itself has a higher fluid flow resistance
than the flow channel. If the valve is placed in the middle of a flow channel the fluid
will more likely flow through the channel then into the valve and the valve will not
open. A similar effect was observed by comparing valve failure of the four fluid designs
(cf. Figure 4.4, Design C & D): valves that are placed in a dead end close to the flow will
be more likely to fail than valves that are placed in a separate channel.
4.3 Determination of Chip Geometry and Materials
The required trigger channel length has been determined to allow for the correct
valve timing and to reduce waste. In order to improve the fabrication time, the optimal
chip geometries were determined. Finally the developed fluidic circuit was tested with
water containing food coloring.
4.3.1 Trigger Channel Length
To calculate the trigger channel length assuming paper-wet out (see section 2.6.1)
the effective pore diameter of the used material has to be known. The effective pore
diameter for the materials used in the device are presented in Table 4.3. They were
derived by the conducted flow experiments and calculated according to section 2.6.

90
Table 4.3: Retention capacity and effective pore size for selected materials
Material Retention
capacity [ml/m2] Effective pore size
[10-7m]
Filter paper 110 3.2
Glass fiber 280 8.3
Blotting paper 630 6.6
The observed times for fluid wicking are 120 s for the sample and 180 s for the
wash. The deviation of the valve opening complicates the calculation of the trigger
channel length. Due to these circumstances and the fact that a specific amount of fluid
is needed to completely open the valve, the trigger channel has to be designed to be
shorter than calculated for the best-case scenario. Otherwise a valve may need too
long to open and the fluid is completely wicked into the main channel and the valve
does not open at all, resulting in chip failure. Due to this, the average valve opening
duration (50 s) was subtracted from the observed timings for reliable valve opening.
Including these parameters in the calculation, the trigger channel length to the first
valve should be 20 mm to the first valve and 27.5 mm to the second valve.
Values gained from this method are a good basis for determining the trigger
channel length but it was found, that additional experiments with fully assembled chips
are needed to optimize those parameters. This is due to the fact that the trigger
channel design used for the experiments diverges at some point and the Washburn
equation is limited for use in constant cross-sections, making it impossible to apply this
model in accurately determining the trigger channel length. Therefore the channel
length estimated with the experiments were slightly shorter than the calculated length.
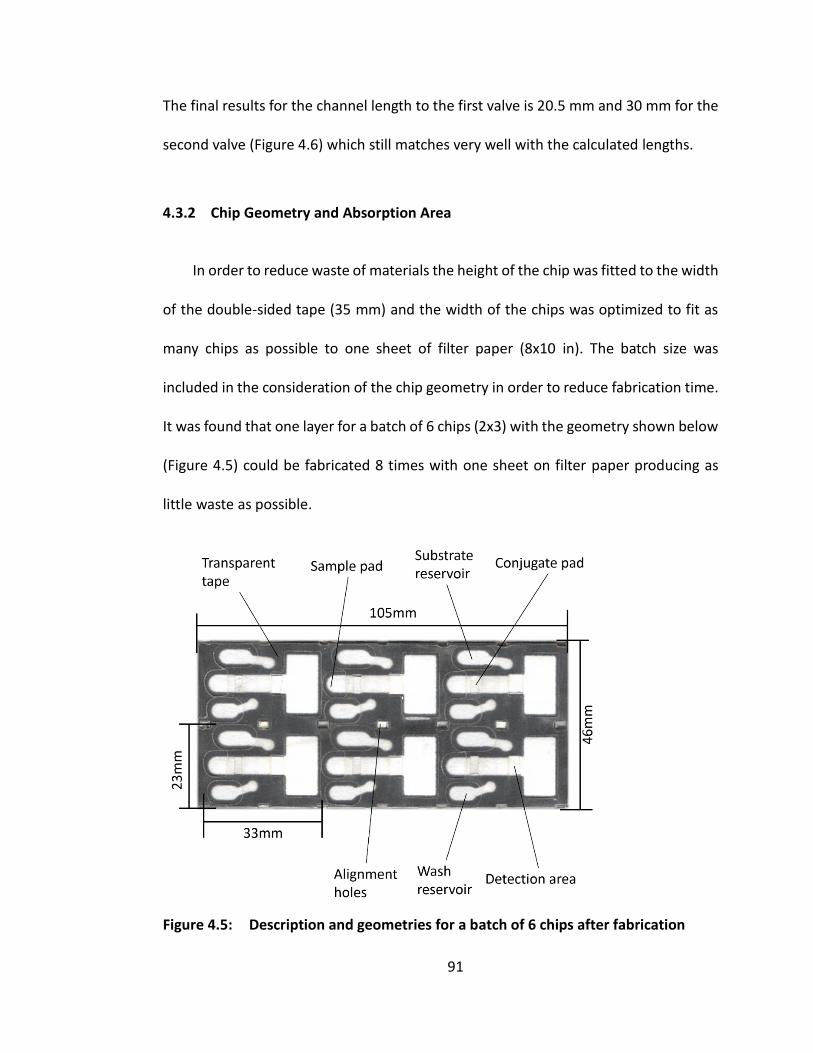
91
The final results for the channel length to the first valve is 20.5 mm and 30 mm for the
second valve (Figure 4.6) which still matches very well with the calculated lengths.
4.3.2 Chip Geometry and Absorption Area
In order to reduce waste of materials the height of the chip was fitted to the width
of the double-sided tape (35 mm) and the width of the chips was optimized to fit as
many chips as possible to one sheet of filter paper (8x10 in). The batch size was
included in the consideration of the chip geometry in order to reduce fabrication time.
It was found that one layer for a batch of 6 chips (2x3) with the geometry shown below
(Figure 4.5) could be fabricated 8 times with one sheet on filter paper producing as
little waste as possible.
Figure 4.5: Description and geometries for a batch of 6 chips after fabrication
92
Since the maximum chip height was determined by the width of the double sided
tape the unused space not taken up by the chip was used for the absorption area. The
tape between the various flow layers was cut out in the same geometry as the waste
pad and filled with cellulose material to increase the waste pad area. In order to keep
a constant fluid flow, fluid congestion at the waste pad has to be avoided. Therefore
rapid absorption from the main channel is essential and glass fiber was chosen as
material to fill up the gaps in the tape due to of the largest available pore size, which
results in the fastest absorption rate (Table 4.3).
Four layers of glass fiber are used to fill the gaps in the tape this results in a total
area of 646 mm2. The area of the filter paper for the chip, including the main channel,
trigger channel, and the inlets is about 610 mm2. For both materials together the
retention volume for the chip can be approximated to 245 μl.
Since this retention volume is not enough to hold the volume of 310 μl used during
the test, the waste pad is increased by a blotting paper underneath the chip (total area
of 760 mm2). This has two advantages, firstly the blotting paper provides for stability
of the chips and secondly blotting paper offers particularly high retention volumes (see
Table 4.3). The blotting paper increases the retention volume for the entire chip to
725 μl (+196%), allowing the sample to be captured and also preventing backflow of
fluid into the main channel.
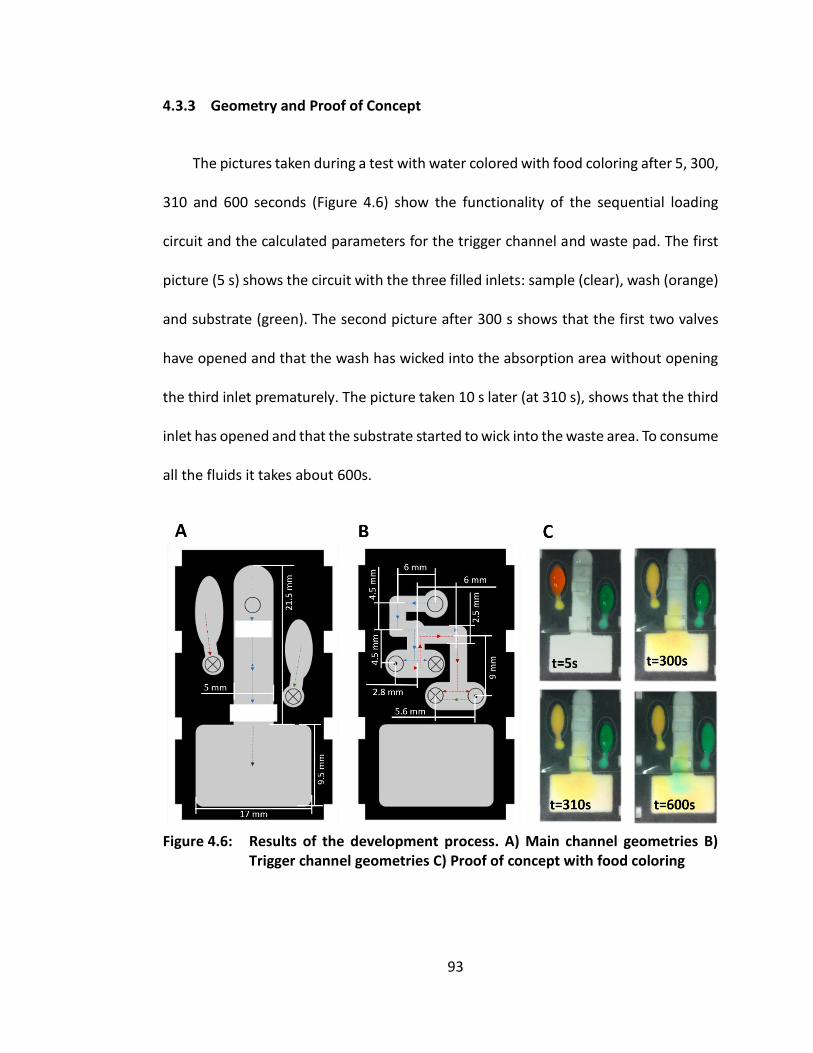
93
4.3.3 Geometry and Proof of Concept
The pictures taken during a test with water colored with food coloring after 5, 300,
310 and 600 seconds (Figure 4.6) show the functionality of the sequential loading
circuit and the calculated parameters for the trigger channel and waste pad. The first
picture (5 s) shows the circuit with the three filled inlets: sample (clear), wash (orange)
and substrate (green). The second picture after 300 s shows that the first two valves
have opened and that the wash has wicked into the absorption area without opening
the third inlet prematurely. The picture taken 10 s later (at 310 s), shows that the third
inlet has opened and that the substrate started to wick into the waste area. To consume
all the fluids it takes about 600s.
Figure 4.6: Results of the development process. A) Main channel geometries B) Trigger channel geometries C) Proof of concept with food coloring

94
4.4 Optimization of Assay Parameters
This section presents the results of the assay development and optimization
process. The overall goal was to achieve a particularly low limit of detection. Therefore
the conjugate release, the detection antibody concentration, and the kind of capture
antibody have been improved.
4.4.1 Optimization of Conjugate Release
Influence of sample pad blocking to conjugate release
Blocking the conjugate pads prior to adding the detection antibody solution
decreases the amount of fluid needed to wash out the conjugate. As can be seen from
Figure 4.7 the amount of fluid needed to wash out the conjugate from the blocked pad
is about 130 μl whereas 230 μl are still not enough to release the conjugate from the
unblocked pad.
Figure 4.7: Comparison of conjugate release for non-blocked glass fiber pads to blocked glass fiber pads
This may be due to less non-specific interaction between the cellulose fibers and
the antibodies for the blocked pad in comparison to the unblocked pad take place.

95
Conjugate Pad Size
The results (Figure 4.8) for conjugate pads with different sizes show that
antibodies can be released more easily from smaller conjugate pads. It can be also
seen, that 130 μl of fluid are needed to wash out the smaller conjugate pads and that
about 80-100 μl of extra fluid is needed to wash out the larger ones.
Figure 4.8: Comparison of conjugate release for 4x5 mm glass fiber pads to 5x5 mm glass fiber pads
This is probably due to non-specific interactions between the cellulose fibers and
the antibodies. In larger conjugate pads more surface area is available for the same
amount of antibodies resulting in a higher probability of non-specific interactions
causing more antibodies to stick to the fibers. But it should be noted that it is not
possible to reduce the size of the conjugate pad too much, as smaller conjugate pads
are more difficult to handle and align and the contact to other materials can be
problematic. An insufficient contact between the channel and the conjugate pad can
result in a slow fluid flow or prevent the conjugate release. Because of this, 4x5 mm
conjugate pads were assumed to be optimal for the developed test.

96
Conjugate Material
The comparison of glass fiber material with and without binder (Figure 4.9) for the
conjugate pad indicates that the choice of material has an important impact on the
conjugate release characteristics. From the evaluated materials it can be seen, that
glass fiber with binders offers better release properties than without. For the conjugate
pads containing glass fiber with binders the release is constantly higher than for the
ones without binder, resulting in a faster release (approximately after 130 μl of fluid)
of the entire amount of antibodies.
Figure 4.9: Comparison of conjugate release for glass fiber with and without binder
1
1.05
1.1
1.15
1.2
1.25
1.3
1.35
1.4
1.45
1.5
20 30 40 50 60 70 80 90 100 110 120
Sign
al t
o B
ackg
rou
nd
Rat
io
Flow through Conjugate Pad [μl]
With Binder Without Binder

97
4.4.2 Polyclonal vs. Monoclonal Antibodies
The use of polyclonal antibodies for the detection zone and the conjugate pad lead
to higher signal intensities for lower analyte concentrations than the monoclonal
antibodies (cf. Figure 4.10, 10 ng/ml & 1 μg/ml). But the usage of polyclonal antibodies
led to false positive results of the negative control (cf. Figure 4.10, NC). This could be
due to non-specific interactions of the polyclonal antibodies which each other. To avoid
non-specific interactions, monoclonal antibodies were used for preparation of the
capture zone and the conjugate pad for further experiments.
Figure 4.10: Comparison of signal intensities for monoclonal and polyclonal capture antibodies
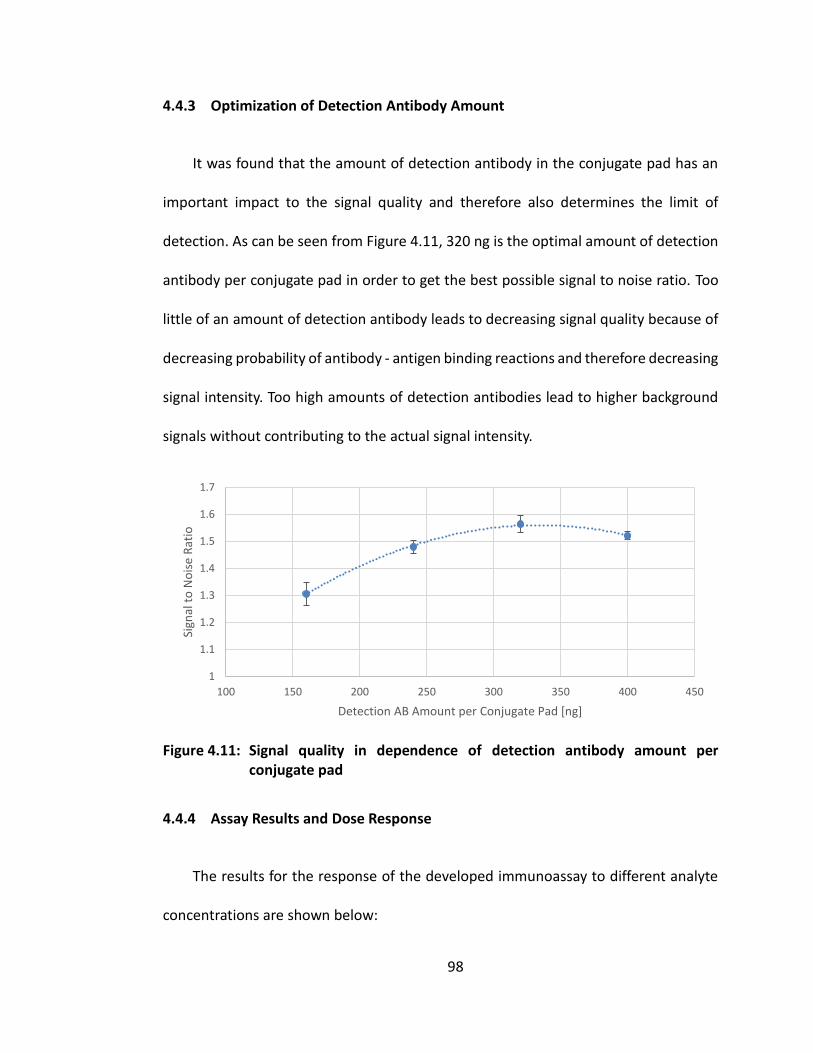
98
4.4.3 Optimization of Detection Antibody Amount
It was found that the amount of detection antibody in the conjugate pad has an
important impact to the signal quality and therefore also determines the limit of
detection. As can be seen from Figure 4.11, 320 ng is the optimal amount of detection
antibody per conjugate pad in order to get the best possible signal to noise ratio. Too
little of an amount of detection antibody leads to decreasing signal quality because of
decreasing probability of antibody - antigen binding reactions and therefore decreasing
signal intensity. Too high amounts of detection antibodies lead to higher background
signals without contributing to the actual signal intensity.
Figure 4.11: Signal quality in dependence of detection antibody amount per conjugate pad
4.4.4 Assay Results and Dose Response
The results for the response of the developed immunoassay to different analyte
concentrations are shown below:
1
1.1
1.2
1.3
1.4
1.5
1.6
1.7
100 150 200 250 300 350 400 450
Sign
al t
o N
ois
e R
atio
Detection AB Amount per Conjugate Pad [ng]

99
Figure 4.12: Assay response to different analyte concentrations
The lowest analyte concentration that that could still be discerned from human
observation was reached with 6 ng/ml. The next lower concentration that was carried
out was 2.5 ng/ml and no visible signal was achieved. It can be seen that the mean
intensity of the background varies. This is due to the fact that the fluid flow is not
uncompromisingly even, especially for the last fluid, the substrate. Since the substrate
contributes in equal proportions to the signal and the background intensity, it is
possible to smooth the results by calculating out the background signal. This was done
by computing the signal to background intensity ratio.
By plotting the signal to noise ratio, a curve was generated (Figure 4.13) that could
be fitted with good accuracy using the Weibull equation, a common sigmoid function
in biochemistry for dose response curves:

100
𝑦 = 𝑎 − 𝑏𝑒−𝑐𝑥𝑑 (4.1)
where the parameters for this curve iteratively calculate to a=2.55, b=1.54,
c=3.25x10⁶ and d=0.98. The linear range can be estimated between the response to
100 ng and 1 μg. None of the negative controls showed a false-positive signal therefore
the negative control is not shown in the graph.
Figure 4.13: Dose response for different analyte concentrations and three replicates fitted with the Weibull equation
1
1.2
1.4
1.6
1.8
2
2.2
2.4
2.6
2.8
0.001 0.01 0.1 1 10
Sign
al t
o N
ois
e R
atio
Analyte Concentration [μg/ml]
101
With the approach presented in section 2.1.4, which uses the standard deviation
of the blank (3%) the LOD is estimated to 5.5 ng, which match very well with the signal
that can still be discerned from human observation. Using the same approach the limit
of quantification is estimated to be 21 ng. Since Rabbit IgG has a molecular weight
about 150 kda [39] and 130 μl of sample were used for the assay, the detection limit
can be converted to a molarity about 4.8 fm.

102
CHAPTER 5 – CONCLUSION AND FUTURE WORK
The research demonstrated that automatic sequential loading of multiple fluids to
a detection area with enhanced lateral flow test devices was achieved. Using enzyme-
linked immunosorbent assay (ELISA) and Rabbit IgG as model analyte it was proved,
that complex diagnostic procedures can be proceeded autonomously in lateral flow. A
prototype of a low cost, time efficient and easy-to-operate point-of-care device based
on the developed test was achieved by storing the necessary reagents and the device
into a housing.
First, different designs and fabrication methods for paper based devices with
fluidic valves were developed and their influence to the valve performance explored.
Fabrication processes, reagent concentrations, materials and device geometries were
optimized and the valve opening deviation was reduced to 10 s. Also a Chip-Yield of
92% for devices with four valves was achieved.
Second, the developed methods were used to incorporate a three step ALP-based
enzyme-linked immunosorbent assay procedure with Rabitt IgG as model analyte into
a lateral flow test. Four fluidic valves were used to control the sequential loading of
sample, wash and substrate to the detection area. The feasibility was verified by visual
detection of signal development on nitrocellulose membrane after reaction of ALP with
NBT/BCIP. Immunoassay parameters were optimized including conjugate release,
amount of reagents, detection and capture antibodies.

103
Through optimization a proof-of-concept device with a good limit of detection at
4.8 fm was achieved. The results may not show as promising as expected since the
sensitivity is still limited in the range of common gold-nanoparticle based lateral flow
test devices (see section 2.2). But compared to other available methods based on ELISA
for example microtiterplates which can reach down to 4 fm [58], this system offers
resemblance in the detection limit with simplified operation.
5.1 Recommendations for Future Work
This section is used to propose several ideas to further improve the developed
system such as signal enhancement, signal amplification multiplexing, fabrication
methods or electrochemical detection.
5.1.1 Signal Enhancement
As first step the signal development due to background noise, signal deviation and
non-specific binding should be addressed. Further research should be performed for
different materials, blocking reagents and blocking duration. One promising material
that should be investigated is Fusion 5TM produced by Whatman [56] the material,
based on a single layer matrix technology, was developed to perform all the functions
of a lateral flow strip on a single substrate. The manufacturer advertises that this
material has outstanding non-specific binding properties resulting in conjugate release
of >94%. Therefore this material could be used to replace the conjugate pad and the

104
flow channels to attempt lower background noise and the loss of analyte and
antibodies in the conjugate pad or channels due to nonspecific binding. According to
Whatman their materials also acts as a membrane for striping antibodies as test and
control lines. The antibodies have to be conjugated to latex beads, in order to allow
binding of the antibodies to the membrane. With this method the upper layer of the
developed multifluid lateral flow test could be completely fabricated from one material
reducing fabrication time and fluid flow deviation due to insufficient alignment.
5.1.2 Signal Amplification
To improve the sensitivity and to lower the limit of detection gold nanoparticles
(GNP) could be used to amplify signal development. In the current Immunoassay
structure the signal development is limited by the restraint to label only one alkaline
phosphatase (ALP) enzyme to the detection antibody (Figure 5.1, A). Several
researchers are working on amplified systems for ELISA based immunoassays. For
example Munge et. al. [36] are using massively labeled superparamagnetic particles to
improve the sensitivity for their detection system based on Horseradish peroxidase
(HRP)-electrochemical ELISA. A similar setup to their detection system could be used
to improve the developed ELISA based optical immunosensor. Commonly used
nanometer sized gold particles could be labeled to the detection antibody and several
ALP-enzymes could be conjugated to the particle using the biotin-(strept)avidin system.
(Figure 5.1, B) Such a structure would have three advantages: it would keep the
benefits of common lateral flow tests with gold nanoparticles and signals for higher
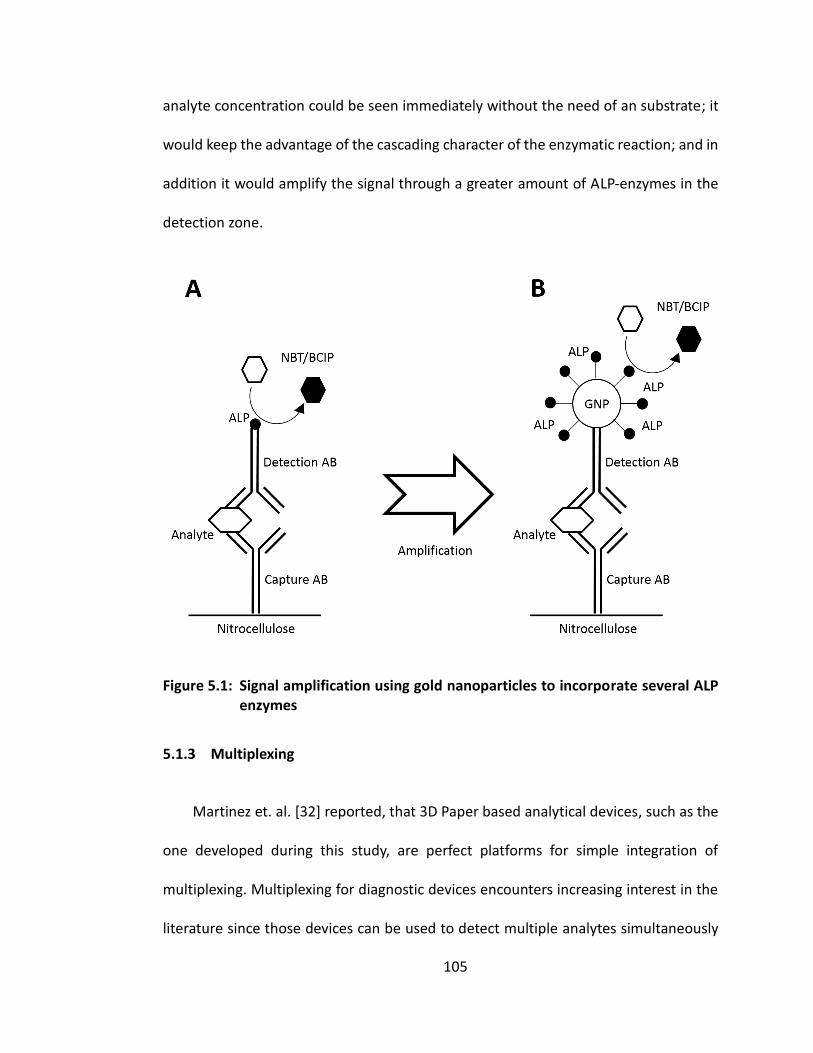
105
analyte concentration could be seen immediately without the need of an substrate; it
would keep the advantage of the cascading character of the enzymatic reaction; and in
addition it would amplify the signal through a greater amount of ALP-enzymes in the
detection zone.
Figure 5.1: Signal amplification using gold nanoparticles to incorporate several ALP enzymes
5.1.3 Multiplexing
Martinez et. al. [32] reported, that 3D Paper based analytical devices, such as the
one developed during this study, are perfect platforms for simple integration of
multiplexing. Multiplexing for diagnostic devices encounters increasing interest in the
literature since those devices can be used to detect multiple analytes simultaneously
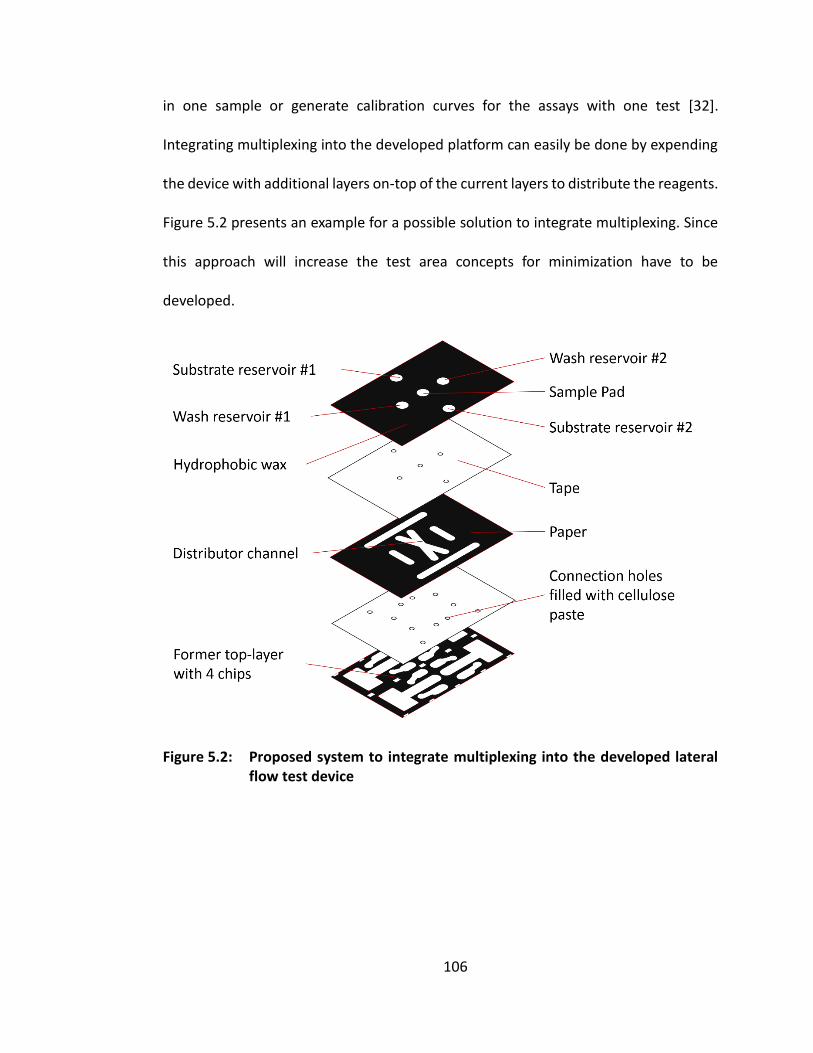
106
in one sample or generate calibration curves for the assays with one test [32].
Integrating multiplexing into the developed platform can easily be done by expending
the device with additional layers on-top of the current layers to distribute the reagents.
Figure 5.2 presents an example for a possible solution to integrate multiplexing. Since
this approach will increase the test area concepts for minimization have to be
developed.
Figure 5.2: Proposed system to integrate multiplexing into the developed lateral flow test device
107
5.1.4 Origami Fabrication Method
Although the fabrication for paper based devices with fluidic valves was optimized
and simplified during this study it still takes hours to fabricate a huge amount of
prototypes. Liu et. al. [27] developed a method for fabrication of paper based analytical
devices which they call origami approach and which does not require double-sided
tape to hold the various layers together. They fabricate their devices on only one layer
of paper, fold it and laminate it in order to obtain a 3D fluidic device (see section 2.4.1).
This fabrication method could be adapted for paper based devices with fluidic valves.
Disk layers for the valves could be fabricated with the approach presented in section
3.2.2 with the distinction that the disks are not cut out anymore. With this method
fabrication could be limited to four layers of paper for channels and disks leading to
further optimization of the fabrication time and decrease of the probability of
alignment defects.
5.1.5 Electrochemical Detection
By printing electrodes on paper electrochemical detection could be integrated to
enable quantification in a simple to operate paper based analytical device. For
fabrication of the electrodes screen-printing with conductive carbon ink as reported by
Liu et. al. [28] Dr. Constantine Anagnostopouloscould be used. The paper substrate
should be nitrocellulose because of the superior biding properties compared to other
materials [34]. This also would have the advantage that the developed lateral flow test
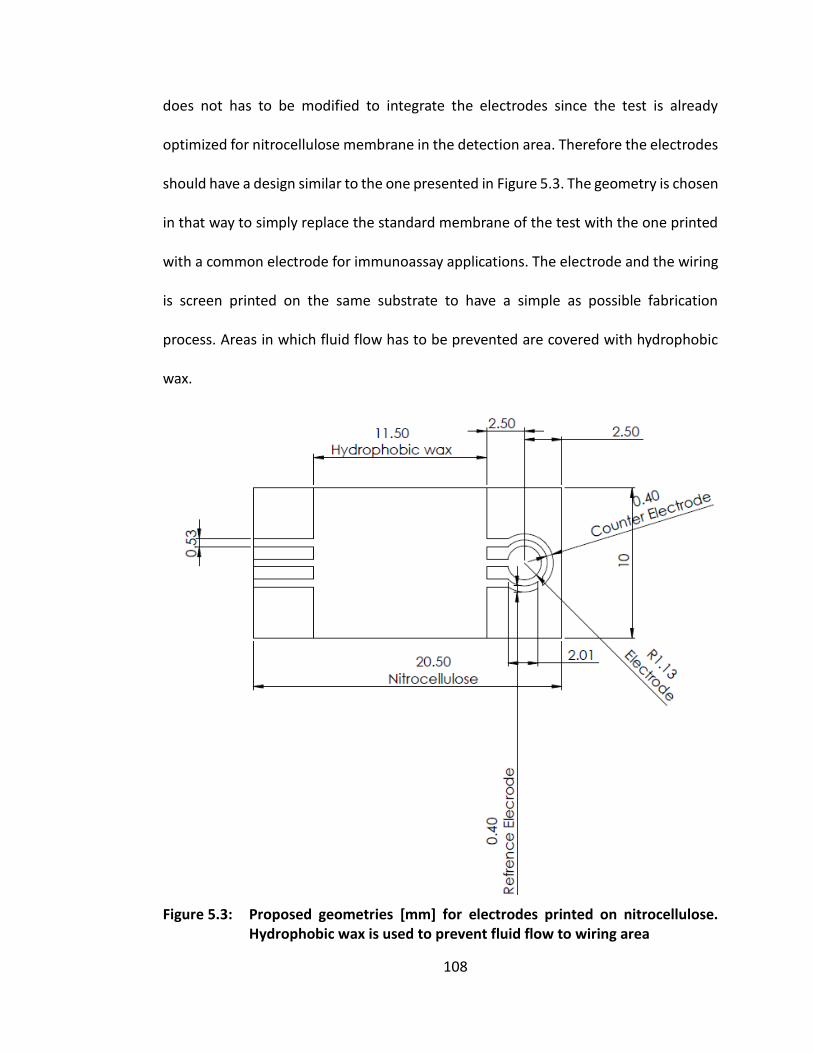
108
does not has to be modified to integrate the electrodes since the test is already
optimized for nitrocellulose membrane in the detection area. Therefore the electrodes
should have a design similar to the one presented in Figure 5.3. The geometry is chosen
in that way to simply replace the standard membrane of the test with the one printed
with a common electrode for immunoassay applications. The electrode and the wiring
is screen printed on the same substrate to have a simple as possible fabrication
process. Areas in which fluid flow has to be prevented are covered with hydrophobic
wax.
Figure 5.3: Proposed geometries [mm] for electrodes printed on nitrocellulose. Hydrophobic wax is used to prevent fluid flow to wiring area

109
APPENDICES
Figure A.1: Dimensions [mm] for fabrication tooling (Punch-out unit)
Figure A.2: Dimensions [mm] for fabrication tooling (Base-alignment unit)
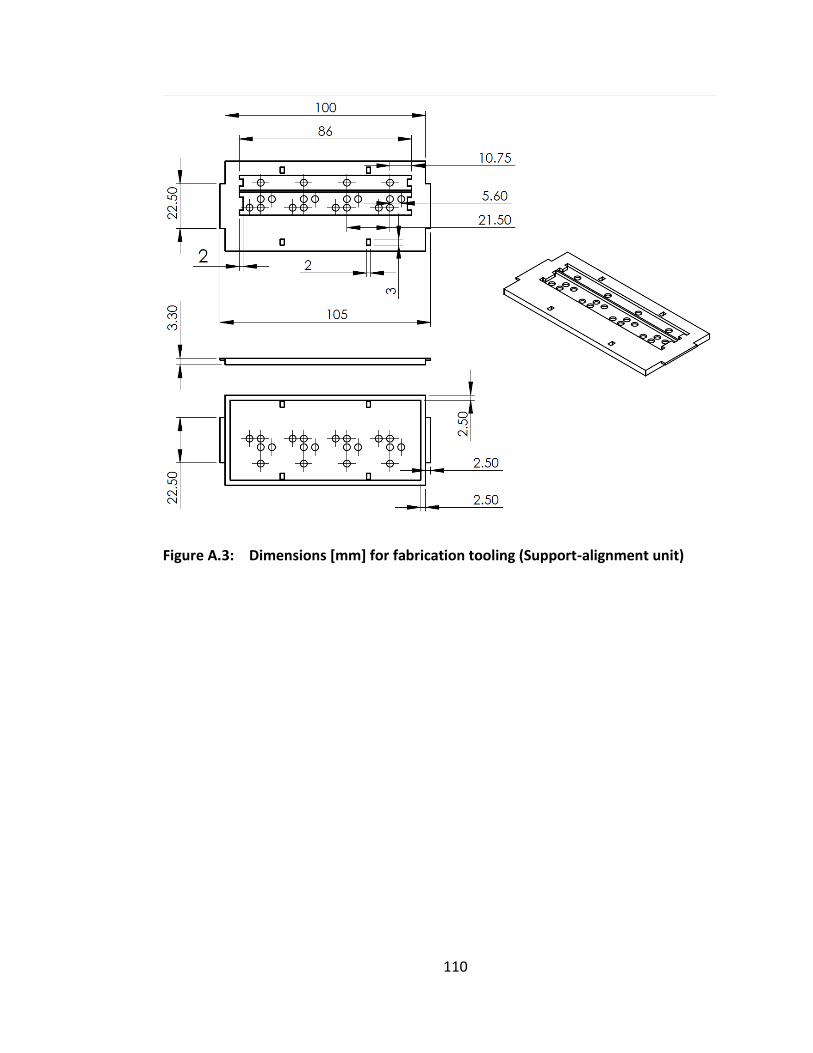
110
Figure A.3: Dimensions [mm] for fabrication tooling (Support-alignment unit)

111
Figure A.4: Dimensions [mm] for housing (Top with reagent storing)

112
Figure A.5: Dimensions [mm] for housing (Bottom)
113
BIBLIOGRAPHY
[1] Ahn-Yoon, S., DeCory, T. R., Baeumner, A. J., and Durst, R. A. 2003.
Ganglioside-Liposome Immunoassay for the Ultrasensitive Detection of Cholera
Toxin. Anal. Chem. 75, 10, 2256–2261.
[2] Bonenberger, J. and Doumanas, M. 2006. Overcoming sensitivity limitations of
lateral- flow with a novel labeling technique. IVD Technology, 5, 41–46.
[3] Chen, H., Cogswell, J., Anagnostopoulos, C., and Faghri, M. 2012. A fluidic
diode, valves, and a sequential-loading circuit fabricated on layered paper. Lab
Chip 12, 16, 2909–2913.
[4] Chen, X., Chen, J., Wang, F., Xiang, X., Luo, M., Ji, X., and He, Z. 2012.
Determination of glucose and uric acid with bienzyme colorimetry on microfluidic
paper-based analysis devices. Biosensors and Bioelectronics 35, 1, 363–368.
[5] Cheng, C.-M., Martinez, A. W., Gong, J., Mace, C. R., Phillips, S. T., Carrilho, E.,
Mirica, K. A., and Whitesides, G. M. 2010. Paper-Based ELISA. Angewandte
Chemie International Edition 49, 28, 4771–4774.
[6] Cole, S. P. C., Campling, B. G., Atlaw, T., Kozbor, D., and Roder, J. C. 1984.
Human monoclonal antibodies. Mol Cell Biochem 62, 2.
[7] Darcy, H. 1856. Les fontaines publiques de la ville de Dijon, Paris.
[8] Diamandis, E. P. 1990. Analytical methodology for immunoassays and DNA
hybridization assays — current status and selected systems — critical review.
Clinica Chimica Acta 194, 1, 19–50.

114
[9] Fernández-Sánchez, C., McNeil, C. J., Rawson, K., Nilsson, O., Leung, H. Y.,
and Gnanapragasam, V. 2005. One-step immunostrip test for the simultaneous
detection of free and total prostate specific antigen in serum. Journal of
Immunological Methods 307, 1-2, 1–12.
[10] Föllscher, W. 2013. Development of a Platform for Lateral Flow Test Devices with
the Capability of using Multiple Fluids.
[11] Frost & Sullivan. 2009. US point-of-care testing markets.
[12] Fu, E., Ramsey, S. A., Kauffman, P., Lutz, B., and Yager, P. 2011. Transport in
two-dimensional paper networks. Microfluid Nanofluid 10, 1, 29–35.
[13] Goldsby, R. A., Kindt, T. J., Osborne, B. A., and Kuby, J. 2003. Immunology -
Antigens (Chapter 3). W.H. Freeman, New York.
[14] Greg T. Hermanson. 1996. Bioconjugate Techniques.
[15] Hong Chen, Constantine Anagnostopoulos, Mohammad Faghri, Alex Pytka,
Manuel Muller, Wilke Foellscher, Roman Gerbers, Jeremy Cogswell, Mike
Franzblau. 2013. Microfluidics with Application to Point-of-Care Diagnostics.
[16] Horváth, I. T., Ed. 2012. Fluorous Chemistry. Topics in Current Chemistry.
Springer Berlin Heidelberg, Berlin, Heidelberg.
[17] Hossain, S. M. Z., Luckham, R. E., Smith, A. M., Lebert, J. M., Davies, L. M.,
Pelton, R. H., Filipe, C. D. M., and Brennan, J. D. 2009. Development of a
Bioactive Paper Sensor for Detection of Neurotoxins Using Piezoelectric Inkjet
Printing of Sol−Gel-Derived Bioinks. Anal. Chem. 81, 13, 5474–5483.
115
[18] Hossain, S. M. Z., Ozimok, C., Sicard, C., Aguirre, S. D., Ali, M. M., Li, Y., and
Brennan, J. D. 2012. Multiplexed paper test strip for quantitative bacterial
detection. Anal Bioanal Chem 403, 6, 1567–1576.
[19] Hu, C., Bai, X., Wang, Y., Jin, W., Zhang, X., and Hu, S. 2012. Inkjet Printing of
Nanoporous Gold Electrode Arrays on Cellulose Membranes for High-Sensitive
Paper-Like Electrochemical Oxygen Sensors Using Ionic Liquid Electrolytes.
Anal. Chem. 84, 8, 3745–3750.
[20] Janeway, C. op. 2001. Immunobiology. The immune system in health and
disease. Garland, New York [etc.].
[21] Janin, J. and Chothia, C. 1990. The structure of protein-protein recognition sites.
J. Biol. Chem. 265, 27, 16027–16030.
[22] Jokerst, J. C., Emory, J. M., and Henry, C. S. 2011. Advances in microfluidics for
environmental analysis. Analyst 137, 1, 24.
[23] Kasahara, Y. and Ashihara, Y. 1997. Simple devices and their possible
application in clinical laboratory downsizing. Clinica Chimica Acta 267, 1, 87–
102.
[24] Lankelma, J., Nie, Z., Carrilho, E., and Whitesides, G. M. 2012. Paper-Based
Analytical Device for Electrochemical Flow-Injection Analysis of Glucose in Urine.
Anal. Chem. 84, 9, 4147–4152.
[25] Lee, B. and Richards, F. M. 1971. The interpretation of protein structures:
Estimation of static accessibility. Journal of Molecular Biology 55, 3, 379–IN4.
116
[26] Lisowski, P. and Zarzycki, P. K. 2013. Microfluidic Paper-Based Analytical
Devices (μPADs) and Micro Total Analysis Systems (μTAS): Development,
Applications and Future Trends. Chromatographia.
[27] Liu, H. and Crooks, R. M. 2011. Three-Dimensional Paper Microfluidic Devices
Assembled Using the Principles of Origami. J. Am. Chem. Soc. 133, 44, 17564–
17566.
[28] Liu, H., Xiang, Y., Lu, Y., and Crooks, R. M. 2012. Aptamer-Based Origami Paper
Analytical Device for Electrochemical Detection of Adenosine. Angew. Chem. Int.
Ed. 51, 28, 6925–6928.
[29] Lode, P. von. 2005. Point-of-care immunotesting: approaching the analytical
performance of central laboratory methods. Clin. Biochem. 38, 7, 591–606.
[30] Lu, J., Ge, S., Ge, L., Yan, M., and Yu, J. 2012. Electrochemical DNA sensor
based on three-dimensional folding paper device for specific and sensitive point-
of-care testing. Electrochimica Acta 80, 334–341.
[31] Marie Dupuy, A., Lehmann, S., and Paul Cristol, J. 2005. Protein biochip systems
for the clinical laboratory. Clinical Chemical Laboratory Medicine 43, 12.
[32] Martinez, A. W., Phillips, S. T., Nie, Z., Cheng, C.-M., Carrilho, E., Wiley, B. J.,
and Whitesides, G. M. 2010. Programmable diagnostic devices made from paper
and tape. Lab Chip 10, 19, 2499.
[33] Martinez, A. W., Phillips, S. T., and Whitesides, G. M. 2008. Three-dimensional
microfluidic devices fabricated in layered paper and tape. Proceedings of the
National Academy of Sciences 105, 50, 19606–19611.

117
[34] Millipore. 2008. Rapid Lateral Flow Test Strips Considerations for Product
Development.
[35] Muller, R. H. and Clegg, D. L. 1949. Automatic Paper Chromatography. Anal.
Chem. 21, 9, 1123–1125.
[36] Munge, B. S., Coffey, A. L., Doucette, J. M., Somba, B. K., Malhotra, R., Patel,
V., Gutkind, J. S., and Rusling, J. F. 2011. Nanostructured Immunosensor for
Attomolar Detection of Cancer Biomarker Interleukin-8 Using Massively Labeled
Superparamagnetic Particles. Angew. Chem. Int. Ed. 50, 34, 7915–7918.
[37] Nery, E. W. and Kubota, L. T. 2013. Sensing approaches on paper-based
devices: a review. Anal Bioanal Chem.
[38] Noh, H. and Phillips, S. T. 2010. Fluidic Timers for Time-Dependent, Point-of-
Care Assays on Paper. Anal. Chem. 82, 19, 8071–8078.
[39] Piovan, E., Tosello, V., Indraccolo, S., Cabrelle, A., Baesso, I., Trentin, L.,
Zamarchi, R., Tamamura, H., Fujii, N., Semenzato, G., Chieco-Bianchi, L., and
Amadori, A. 2005. Chemokine receptor expression in EBV-associated
lymphoproliferation in hu/SCID mice: implications for CXCL12/CXCR4 axis in
lymphoma generation. Blood 105, 3, 931–939.
[40] Posthuma-Trumpie, G. A., Korf, J., and Amerongen, A. 2009. Lateral flow
(immuno)assay: its strengths, weaknesses, opportunities and threats. A literature
survey. Anal Bioanal Chem 393, 2, 569–582.
[41] Ramasamy, S. 1998. Oxygen sensor via the quenching of room-temperature
phosphorescence of perdeuterated phenanthrene adsorbed on Whatman 1PS
filter paper. Talanta 47, 4, 971–979.

118
[42] Rhoades, R. and Pflanzer, R. G. 2003. Human physiology. Thomson;
Brooks/Cole, Australia, Pacific Grove, Calif.
[43] Sarfraz, J., Tobjork, D., Osterbacka, R., and Linden, M. 2012. Low-Cost
Hydrogen Sulfide Gas Sensor on Paper Substrates: Fabrication and
Demonstration. IEEE Sensors J. 12, 6, 1973–1978.
[44] Seydack, M. 2008. Immunoassays: Basic Concepts, Physical Chemistry and
Validation. In Standardization and Quality Assurance in Fluorescence
Measurements II, U. Resch-Genger, Ed. Springer Series on Fluorescence.
Springer Berlin Heidelberg, Berlin, Heidelberg, 401–428.
[45] Shrivastava, A. and Gupta, V. 2011. Methods for the determination of limit of
detection and limit of quantitation of the analytical methods. Chron Young Sci 2,
1, 21.
[46] Szűcs, J. and Gyurcsányi, R. E. 2012. Towards Protein Assays on Paper
Platforms with Potentiometric Detection. Electroanalysis 24, 1, 146–152.
[47] The European Agency for the Evaluation of Medicinal Products. 1995. ICH Topic
Q 2 (R1) Validation of Analytical Procedures: Text and Methodology.
[48] The Food and Drug Administration, Center for Drug Evaluation. 2001. Guidance
for Industry – Bioanalytical Method Validation.
[49] Thom, N. K., Yeung, K., Pillion, M. B., and Phillips, S. T. 2012. “Fluidic batteries”
as low-cost sources of power in paper-based microfluidic devices. Lab Chip 12,
10, 1768.
[50] Tijssen P. 1985. Practice and theory of enzyme immunoassays. Elsevier, New
York.

119
[51] TriMark Publications, L. L. 2012. Point of Care Diagnostic Testing World Markets.
[52] Vella, S. J., Beattie, P., Cademartiri, R., Laromaine, A., Martinez, A. W., Phillips,
S. T., Mirica, K. A., and Whitesides, G. M. 2012. Measuring Markers of Liver
Function Using a Micropatterned Paper Device Designed for Blood from a
Fingerstick. Anal. Chem. 84, 6, 2883–2891.
[53] Wang, W., Wu, W.-Y., and Zhu, J.-J. 2010. Tree-shaped paper strip for
semiquantitative colorimetric detection of protein with self-calibration. Journal of
Chromatography A 1217, 24, 3896–3899.
[54] Warsinke, A. 2009. Point-of-care testing of proteins. Anal Bioanal Chem 393, 5,
1393–1405.
[55] Washburn, E. W. 1921. The Dynamics of Capillary Flow. Phys. Rev. 17, 3, 273–
283.
[56] Whatman. 2004. FUSION 5™ One Material, Five Functions.
[57] Wong, R. and Tse, H. 2009. Lateral Flow Immunoassay. Humana Press, Totowa,
NJ.
[58] X.J. Li, Z.H. Nie, C.-M. Cheng, A.B. Goodale, and G.M. Whitesides, Ed. 2010.
Paper-based electrochemical ELISA.
[59] Xu, M., Bunes, B. R., and Zang, L. 2011. Paper-Based Vapor Detection of
Hydrogen Peroxide: Colorimetric Sensing with Tunable Interface. ACS Appl.
Mater. Interfaces 3, 3, 642–647.
[60] Yager, P., Domingo, G. J., and Gerdes, J. 2008. Point-of-care diagnostics for
global health. Annu Rev Biomed Eng 10, 107–144.

120
[61] Yager, P., Edwards, T., Fu, E., Helton, K., Nelson, K., Tam, M. R., and Weigl, B.
H. 2006. Microfluidic diagnostic technologies for global public health. Nature 442,
7101, 412–418.
[62] Yu, J., Ge, L., Huang, J., Wang, S., and Ge, S. 2011. Microfluidic paper-based
chemiluminescence biosensor for simultaneous determination of glucose and
uric acid. Lab Chip 11, 7, 1286.
[63] Zhang, D. H., Li, P. W., Zhang, Q., Yang, Y., Zhang, W., Guan, D., and Ding, X.
X. 2012. Extract-free immunochromatographic assay for on-site tests of aflatoxin
M1 in milk. Anal. Methods 4, 10, 3307.
[64] Zhong, Z. W., Wang, Z. P., and Huang, G. X. D. 2012. Investigation of wax and
paper materials for the fabrication of paper-based microfluidic devices. Microsyst
Technol 18, 5, 649–659.
[65] Zhu, J., Zou, N., Zhu, D., Wang, J., Jin, Q., Zhao, J., and Mao, H. 2011.
Simultaneous Detection of High-Sensitivity Cardiac Troponin I and Myoglobin by
Modified Sandwich Lateral Flow Immunoassay: Proof of Principle. Clinical
Chemistry 57, 12, 1732–1738.