development of european ecolabel and green public ...susproc.jrc.ec.europa.eu/buildings/docs/market...
TRANSCRIPT
Development of European Ecolabel and Green Public Procurement Criteria
for Office BuildingsJRC IPTS Draft Report
Economical and market analysis
June 2011

Draft Report: Economic and Market analysis
2
Authors:
Dr. Josep Maria Raya (UPF)
MsC. Marina Isasa (GiGa-ESCI)
MsC. Cristina Gazulla (GiGa-ESCI)
Reviewers:
MsC. Oliver Wolf (IPTS)
Dra. Alicia Boyano (IPTS)
Dr. Ignacio Zabalza Bribián (CIRCE)
Dr. Alfonso Aranda Usón (CIRCE)
MsC. Oihane Santiuste Cardaño (CIRCE)
Dr. Patxi Hernández (TECNALIA)
MsC. Lara Mabe (TECNALIA)
Draft Report: Economic and Market analysis
3
Table of Contents
Executive summary ....................................................................................................................... 5
1. Introduction............................................................................................................................... 6
2. Generic Data.............................................................................................................................. 7
2.1 Buildings in general ............................................................................................................. 7
2.2 Office buildings.................................................................................................................. 12
3. Construction sector: Indicators, Evolution and Forecast ........................................................ 18
3.1 General economic Indicators ............................................................................................ 18
3.2 Structural construction indicators..................................................................................... 20
3.3 Short-term office building indicators ................................................................................ 25
3.4 Forecast ............................................................................................................................. 27
3.4.1. Estimate and forecast of existing, new and renovated office buildings in EU 27..... 31
4. Environmental Issues ............................................................................................................. 33
4.1. Environmental performance, market segmentation and penetration. ........................... 33
4.1.1. Market penetration................................................................................................... 34
4.2. Average duration of the economic life-cycle of buildings................................................ 36
4.2.1. Assumed working life of products and systems........................................................ 38
5. Public Activity ......................................................................................................................... 39
6. Conclusions.............................................................................................................................. 43
7. References............................................................................................................................... 47
Index of tables and figures
Table 1: Population in EU-27 (in millions of persons). .................................................................. 8
Table 2: Number of buildings by type ........................................................................................... 9
Table 3: Non-residential existing buildings by age. .................................................................... 10
Table 4: Non-residential existing buildings by age and climatic zone......................................... 11
Table 5: Office building stock ...................................................................................................... 13
Table 6: Stock of office buildings by age, size and location (million of m2) for 23 European
countries...................................................................................................................................... 15

Draft Report: Economic and Market analysis
4
Table 7: 2009 Key office market indicators for major centres of UE-27 countries .................... 17
Table 8: General Economic indicators......................................................................................... 19
Table 9: Structural indicators of the construction sector [Eurostat (2010)]............................... 22
Table 10: Short-term indicators of the construction sector. [Eurostat (2010)] ......................... .23
Table 11: Office building permits in 1,000m2 of usable area. [Eurostat (2010)]. Annual
percentage of change and Index................................................................................................. 26
Table 12: GDP forecast 2011-2015. GFCF forecast 2012 [Source:Eurostat (2010)]………………….28
Table 13: Office job forecast by 2015………………………………………………………………………………..……29
Table 14: Literature review occupancy ratio premium for ecolabelled commercial buildings…31
Table 15: 2011 estimate of existing, to be renovated and new office buildings………………………32
Table 16: Forecast of 2021 existing, to be renovated and new office buildings………………………33
Table 17: Energy consumption in offices by end use……………………………………………………………….34
Table 18: Assumed working life of construction products. Source: [EOTA, 1999]…………………..38
Table 19: Minimum design life of components [Source: ISO 15686-1]……………………………………38
Table 20: Design working life of components . Source: [EC, 2002] …………………………………………38
Table 21:Design working life of components Source: [Yang and Pen, 2001]…………………………..38
Table 22: Functional distribution of European governments Expenditure. Source: [Eurostat
(2010)] ……………………………………………………………………………………………………………………………….…40
Table 23: Government´s debt and deficit in EU-27. Source: [Eurostat 2010]............................. 43
Figure 1: % of residentialand non-residentialbuildigns .............................................................. 10
Figure 2: Non-residentialexisting building by age and climatic zone.......................................... 11
Figure 3: Distribution of non-residential building in the climatic zone ...................................... 12
Figure 4: Distribution of non-residential building by age. .......................................................... 12
Figure 5: Energyconsumptionin tertiary buildings...................................................................... 33

Draft Report: Economic and Market analysis
5
Executive summary
The aim of this task 2 was to describe the market for office buildings as well as to provide
information of expected demand for ecolabelled office buildings. In this sense, this task will
provide crucial information for next tasks, because it provides information on structural
characteristics of the office buildings market, recent trends and expected demand for
ecolabelled buildings.
With this objective in mind, firstly, the EU-27 construction sector is analyzed in order to
quantify the relative importance of the office building sector. Secondly, some indicators are
provided in order to characterize office building market and recent trends (stock, take-up,
etc.). General economic indicators as well as structural construction indicators are then
presented in order to emphasize the importance of the economic and construction sector
evolution for the office market. Thus, in order to do a more accurate forecast of the office
market, information on general economic indicators has to be forecasted. To complete the
analysis, some evidence to know whether demand for ecolabelled office buildings is likely to
be higher or lower than demand for non-ecolabelled office buildings is provided. Finally, the
analysis concludes providing Green Public Procurement (GPP) information and key
environmental aspects that will inform the selection of the best environmental performance
building.
Unfortunately, to the best of the authors´, there is no official data on office buildings stock in
EU-27. Only for few countries some estimates have been found from different sources.
Moreover, data on the office sector are often outdated and assembled from sector estimates,
as a result of which their statistical validity can be doubted. Furthermore, the comparability of
data between countries may be low because different definitions may have been used in the
different countries. To sum up, office building data are not official and rarely harmonized
between countries.
In terms of main results, first of all, office buildings are part of the non-residential buildings
which represent 1% of the total building sector. Most of them are concentrated in the
moderate climatic zones, are large office buildings and were mainly erected before 1975.
Secondly, office rents and vacancy ratios are basically obtained from changes in national Gross
Domestic Product (GDP), inflation and unemployment rates. In this sense, as economic growth
in the EU-27 is expected to be accelerated over the 2010-2015 period from the forecasted

Draft Report: Economic and Market analysis
6
1.7% (2011) to a 2.4% GDP annual growth , this will result in an increased office employment in
the EU-27 by an annual growth of 1.2%.
Demand for ecolabelled office buildings is likely to be higher than demand for non-ecolabelled
office buildings since a significant positive relationship between occupancy rate and the
ecolabel is found. Ecolabel premium in vacancy rates ranges from 2% to 18%.
Finally, public activity is a crucial element to be considered. The percentage of office buildings
from the government and municipalities for some EU-27 countries e.g: The Netherlands (3%),
Germany (20%), France (30%), Austria (17%) and Finland (11%). However, as a result of the
financial crisis, public deficit and deficit indicators have increased dramatically. Only when
economic recovery occurs and the crisis of confidence is over, the amount of money spent in
environmental policy will equal the one observed in the years before the financial crisis.
1. Introduction
This task aims to describe the market for office buildings as well as to provide information on
the expected demand for ecolabelled office buildings. In this sense, this task will provide
crucial information for the remaining tasks of the project, because it will highlight structural
characteristics of the office buildings market, recent trends and expected demand for
ecolabelled buildings.
With this objective in mind, firstly, the EU-27 construction sector is analyzed in order to
quantify the relative importance of the office building sector. Secondly, some indicators are
provided in order to characterize the office building market and recent trends (stock, take-up,
etc.). In particular, stock data will allow us to classify office buildings by climatic zone and age
according to the categorization developed in Task 1. Then, general economic indicators as well
as structural construction indicators are presented to emphasize the importance of the
economic and construction sector evolution for the office market. Thus, in order to undertake
an accurate forecast of the office market, it is needed to forecast information on general
economic indicators. To complete the analysis, some evidence is provided to determine
whether the demand for ecolabelled office buildings is likely to be higher or lower than the
demand for non-ecolabelled office buildings. Finally, the analysis concludes providing Green
Public Procurement (GPP) information and key environmental aspects that will help in the
selection of the Best Environmental Performance building

Draft Report: Economic and Market analysis
7
In terms of GPP information, one could argue that often public authorities try to fight
economic downturns through public investments, such us public construction procurement.
However, the possibilities to do so depend on budget constraints. In this sense, a final section
which examines government activity is needed. In this final section, the following information
is provided. Firstly, data on size of the EU-27 government expenditure as well as the
importance of environmental and construction expenditure in EU-27 government budget is
provided to finish with the consequences of financial crisis to governments budgets.
Methodologically, official data from, basically, Eurostat, has been used together with data
information from various Real Estate Companies in order to characterize and forecast the
evolution of the office building market as well as to provide information on the public sector.
In addition, information from some reports is used to provide and classify stock data. Finally,
information from peer-review academic Journals is also used in order to forecast the demand
for ecolabelled office buildings in comparison to non-ecolabelled office buildings.
2. Generic Data
2.1 Buildings in general
This section provides generic data in order to establish the basic elements of the construction
sector that will be studied in the following sections of this report. It has to be noted that the
main data source used is [Eurostat, 2010], although data from various Real Estate Companies
[BNP Paribas Real Estate, 2007-2010; Dtz Research, 2009-2010; Jones Lang Lasalle, 2010; King
Sturge, 2010; Knight Frank, 2010; Pike Research, 2011], among other reports [EURIMA, 2010a
and 2010b; OTB Research Institute for Housing, Urban and Mobility Study, 2008] are also used
for specific sections (mainly Tables 3 and 5). Some deviations exist between different data
sources. In particular, Table 1 lists population of the EU-27.
The main focus was to start with information on data related to "building in general". Two are
the main reasons for this approach. On the one hand, it allows approaching office buildings
gradually from general buildings. That is especially relevant considering that office buildings
are a very small part of the total building stock. In addition, behavior of the office building
market is to some extent related to behavior of the total building market, since both markets
Draft Report: Economic and Market analysis
8
depend on the evolution of the economy. Secondly, the lack of data related to office buildings
leaves no other option but to work with approximations.
With the availability of country specific data (basically from population and housing census1),
information on the number of buildings2 by type expressed in a measure of density (i.e.
buildings per 1,000 inhabitants) can be extracted for almost all EU-27 countries (see Table 2).
This density can be interpreted in terms of the relative importance of building total stock in
relation to population. In this sense, the highest building density is observed in Greece (500.97
buildings/ 1000 inhabitants), Finland (484.92) and Austria (481.65). A higher building density
can be caused by a higher density in residential buildings, by a higher density in non-residential
buildings, or both. In the case of Finland and Austria this fact is caused, in part, by the high
density of non-residential buildings in these countries, which is higher than 10 (per 1,000
inhabitants). Thus, Cyprus (31.32), Austria (13.20), Finland (12.90) and Belgium (12.18) are the
countries with the highest non-residential buildings for every 1,000 inhabitants.
Office buildings are, however, only a part of the amount of non-residential buildings. In fact, as
commented in Task 1, non-residential buildings can be: shopping centres, shopping malls,
department stores, detached shops and boutiques, indoor markets, warehouses, exhibition
halls, office buildings, bank buildings, air, rail or road transport terminals, parking garages and
petrol and service stations.
This report will focus on office buildings as defined in Task 1 “A building which contains
administrative, financial, technical and bureaucratic activities as core representative
activities. The office area must make up a vast majority of the total building´s gross area
dedicated to purpose providing a service to other companies or to individuals. Therefore, it
could have associated other type of spaces, like meeting rooms, training classes, staff
facilities, technical rooms, etc.”
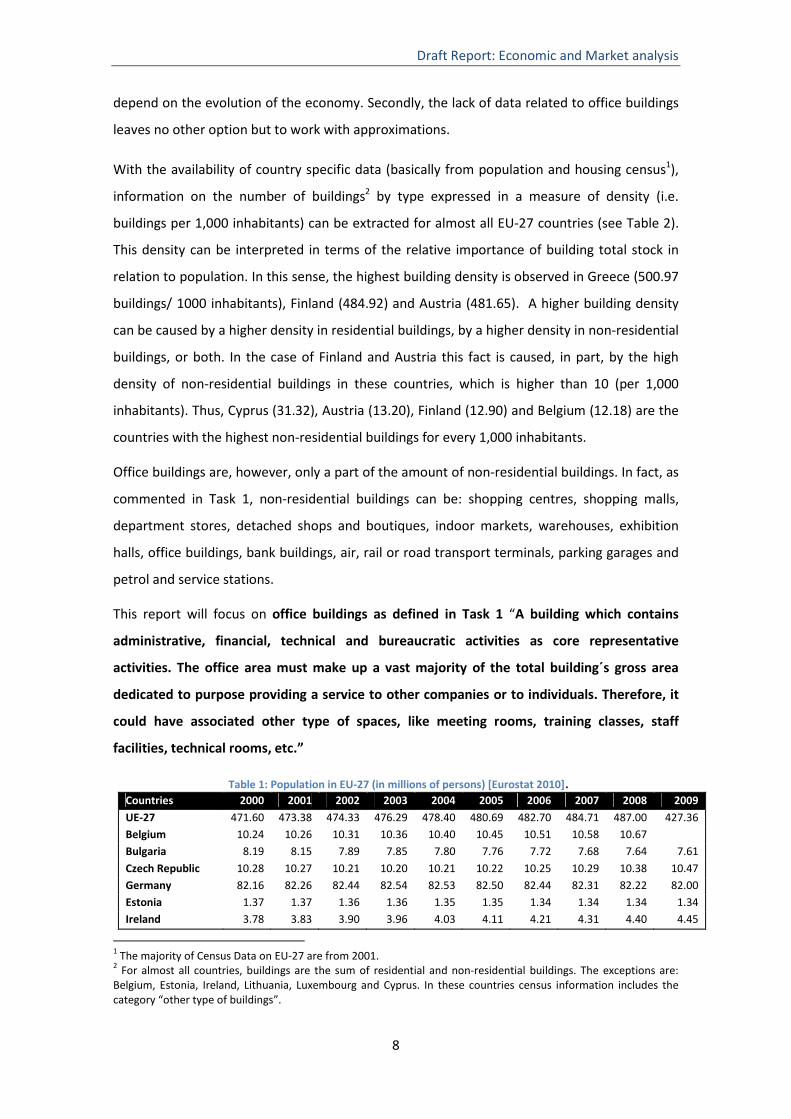
Table 1: Population in EU-27 (in millions of persons) [Eurostat 2010].Countries 2000 2001 2002 2003 2004 2005 2006 2007 2008 2009
UE-27 471.60 473.38 474.33 476.29 478.40 480.69 482.70 484.71 487.00 427.36 Belgium 10.24 10.26 10.31 10.36 10.40 10.45 10.51 10.58 10.67 Bulgaria 8.19 8.15 7.89 7.85 7.80 7.76 7.72 7.68 7.64 7.61
Czech Republic 10.28 10.27 10.21 10.20 10.21 10.22 10.25 10.29 10.38 10.47 Germany 82.16 82.26 82.44 82.54 82.53 82.50 82.44 82.31 82.22 82.00 Estonia 1.37 1.37 1.36 1.36 1.35 1.35 1.34 1.34 1.34 1.34 Ireland 3.78 3.83 3.90 3.96 4.03 4.11 4.21 4.31 4.40 4.45
1 The majority of Census Data on EU-27 are from 2001. 2 For almost all countries, buildings are the sum of residential and non-residential buildings. The exceptions are: Belgium, Estonia, Ireland, Lithuania, Luxembourg and Cyprus. In these countries census information includes the category “other type of buildings”.

Draft Report: Economic and Market analysis
9
Greece 10.90 10.93 10.97 11.01 11.04 11.08 11.13 11.17 11.21 11.26 Spain 40.05 40.48 40.96 41.66 42.35 43.04 43.76 44.47 45.28 45.83
France 60.55 60.98 61.42 61.86 62.29 62.77 63.23 63.65 64.01 64.37 Italy 56.93 56.97 56.99 57.32 57.89 58.46 58.75 59.13 59.62 60.05 Latvia 2.38 2.36 2.35 2.33 2.32 2.31 2.29 2.28 2.27 2.26 Lithuania 3.51 3.49 3.48 3.46 3.45 3.43 3.40 3.38 3.37 3.35
Luxembourg 0.43 0.44 0.44 0.45 0.45 0.46 0.47 0.48 0.48 0.49 Hungary 10.22 10.20 10.17 10.14 10.12 10.10 10.08 10.07 10.05 10.03 Netherlands 15.86 15.99 16.11 16.19 16.26 16.31 16.33 16.36 16.41 16.49 Austria 8.00 8.02 8.06 8.10 8.14 8.20 8.25 8.28 8.32 8.36
Poland 38.26 38.64 38.24 38.22 38.19 38.17 38.16 38.13 38.12 38.14 Portugal 10.20 10.26 10.33 10.41 10.47 10.53 10.57 10.60 10.62 10.63 Romania 21.91 21.88 21.83 21.77 21.71 21.66 21.61 21.57 21.53 21.50 Slovenia 1.99 1.99 1.99 2.00 2.00 2.00 2.00 2.01 2.01 2.03
Slovakia 5.40 5.38 5.38 5.38 5.38 5.38 5.39 5.39 5.40 5.41 Finland 5.17 5.18 5.19 5.21 5.22 5.24 5.26 5.28 5.30 5.33 Cyprus 0.69 0.70 0.71 0.72 0.73 0.75 0.77 0.78 0.79 0.80 Denmark 5.33 5.35 5.37 5.38 5.40 5.41 5.43 5.45 5.48 5.51
United Kingdom 58.79 59.00 59.22 59.44 59.70 60.04 60.41 60.78 61.18 Sweden 8.86 8.88 8.91 8.94 8.98 9.01 9.05 9.11 9.18 9.26 Malta 0.38 0.39 0.39 0.40 0.40 0.40 0.41 0.41 0.41 0.41
Table 2: Number of buildings by type [Eurostat (2010)].
Buildings Residential Buildings
Non-residential Buildings* Residential* Non-residential*Countries
(total amount) (*amount per 1,000 inhabitants)
Belgium 4,083,991 3,459,146 124,961 397.92 337.04 12.18
Bulgaria 3,680,126 3,677,618 2,508 451.58 451.27 0.31
Czech Republic 3,827,678 3,792,861 34,817 372.83 369.44 3.39
Germany 38,690,000 38,260,000 430,000 470.34 465.11 5.23
Estonia 617,399 607,629 2,508 451.66 444.51 1.83
Ireland 1,279,617 1,242,273 10,726 333.84 324.10 2.80
Greece 5,476,162 5,442,151 34,011 500.97 497.85 3.11
Spain 14,184,026 14,125,848 58,178 350.42 348.99 1.44
France 28,699,868 28,699,868 - 470.65 470.65 -
Italy 27,320,022 27,284,340 35,682 479.57 478.94 0.63
Latvia 795,700 795,700 - 336.55 336.55 0.00
Lithuania 1,292,336 1,265,339 3,895 370.62 362.87 1.12
Luxembourg 171,953 167,755 4,068 391.69 382.13 9.27
Hungary 4,064,653 4,042,829 21,824 398.48 396.34 2.14
Netherlands 6,456,036 6,456,036 - 403.83 403.83 -
Austria 3,863,262 3,757,409 105,853 481.65 468.45 13.20
Poland 12,523,583 12,475,349 48,234 324.07 322.83 1.25
Portugal 3,551,229 3,537,834 13,395 346.24 344.93 1.31
Romania 7,170,069 7,139,700 30,369 327.75 326.36 1.39
Slovenia 777,772 768,950 8,822 390.82 386.39 4.43
Slovakia 1,896,554 1,867,116 29,438 352.60 347.13 5.47
Draft Report: Economic and Market analysis
10
Finland 2,512,442 2,445,586 66,856 484.92 472.02 12.90
Cyprus 292,934 270,444 21,844 419.95 387.71 31.32
Note: There is no available data from Denmark, UK, Sweden and Malta.
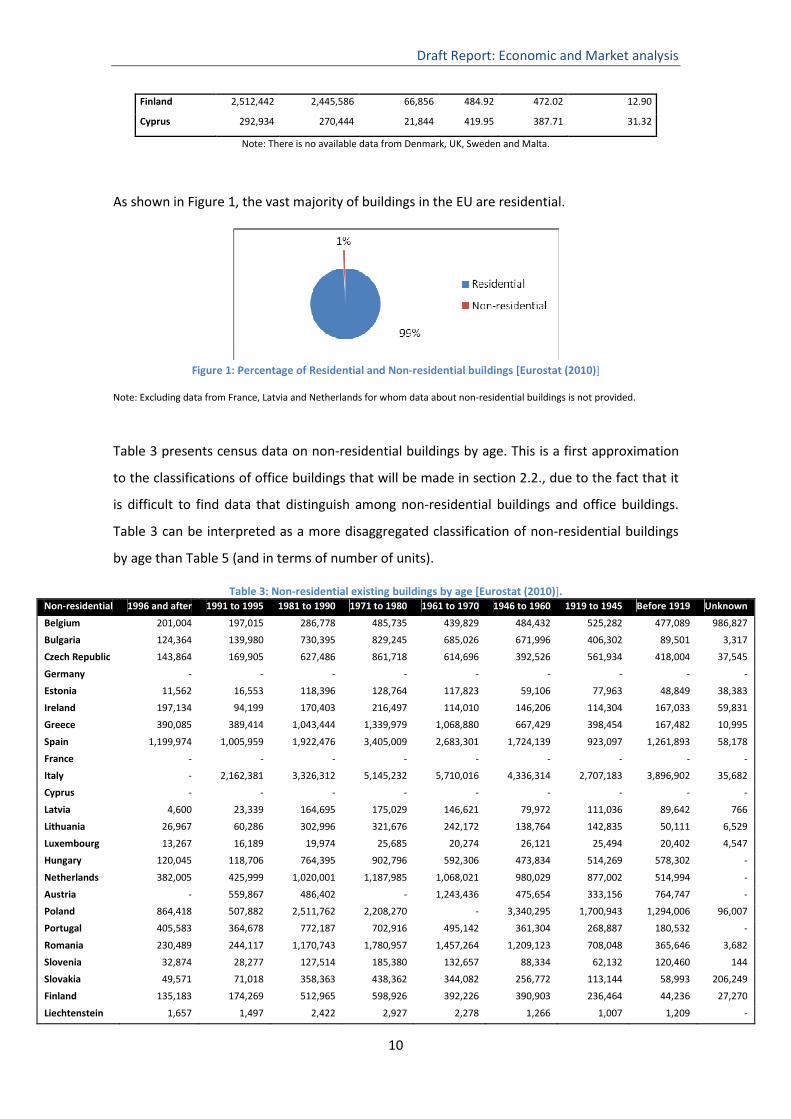
As shown in Figure 1, the vast majority of buildings in the EU are residential.
Figure 1: Percentage of Residential and Non-residential buildings [Eurostat (2010)]
Note: Excluding data from France, Latvia and Netherlands for whom data about non-residential buildings is not provided.
Table 3 presents census data on non-residential buildings by age. This is a first approximation
to the classifications of office buildings that will be made in section 2.2., due to the fact that it
is difficult to find data that distinguish among non-residential buildings and office buildings.
Table 3 can be interpreted as a more disaggregated classification of non-residential buildings
by age than Table 5 (and in terms of number of units).
Table 3: Non-residential existing buildings by age [Eurostat (2010)].Non-residential 1996 and after 1991 to 1995 1981 to 1990 1971 to 1980 1961 to 1970 1946 to 1960 1919 to 1945 Before 1919 Unknown
Belgium 201,004 197,015 286,778 485,735 439,829 484,432 525,282 477,089 986,827
Bulgaria 124,364 139,980 730,395 829,245 685,026 671,996 406,302 89,501 3,317
Czech Republic 143,864 169,905 627,486 861,718 614,696 392,526 561,934 418,004 37,545
Germany - - - - - - - - -
Estonia 11,562 16,553 118,396 128,764 117,823 59,106 77,963 48,849 38,383
Ireland 197,134 94,199 170,403 216,497 114,010 146,206 114,304 167,033 59,831
Greece 390,085 389,414 1,043,444 1,339,979 1,068,880 667,429 398,454 167,482 10,995
Spain 1,199,974 1,005,959 1,922,476 3,405,009 2,683,301 1,724,139 923,097 1,261,893 58,178
France - - - - - - - - -
Italy - 2,162,381 3,326,312 5,145,232 5,710,016 4,336,314 2,707,183 3,896,902 35,682
Cyprus - - - - - - - - -
Latvia 4,600 23,339 164,695 175,029 146,621 79,972 111,036 89,642 766
Lithuania 26,967 60,286 302,996 321,676 242,172 138,764 142,835 50,111 6,529
Luxembourg 13,267 16,189 19,974 25,685 20,274 26,121 25,494 20,402 4,547
Hungary 120,045 118,706 764,395 902,796 592,306 473,834 514,269 578,302 -
Netherlands 382,005 425,999 1,020,001 1,187,985 1,068,021 980,029 877,002 514,994 -
Austria - 559,867 486,402 - 1,243,436 475,654 333,156 764,747 -
Poland 864,418 507,882 2,511,762 2,208,270 - 3,340,295 1,700,943 1,294,006 96,007
Portugal 405,583 364,678 772,187 702,916 495,142 361,304 268,887 180,532 -
Romania 230,489 244,117 1,170,743 1,780,957 1,457,264 1,209,123 708,048 365,646 3,682
Slovenia 32,874 28,277 127,514 185,380 132,657 88,334 62,132 120,460 144
Slovakia 49,571 71,018 358,363 438,362 344,082 256,772 113,144 58,993 206,249
Finland 135,183 174,269 512,965 598,926 392,226 390,903 236,464 44,236 27,270
Liechtenstein 1,657 1,497 2,422 2,927 2,278 1,266 1,007 1,209 -
Draft Report: Economic and Market analysis
11
As follows, the information provided in Table 3 on non residential existing buildings is
regrouped into the climatic zones presented in task 1 (See Task 1, table7).
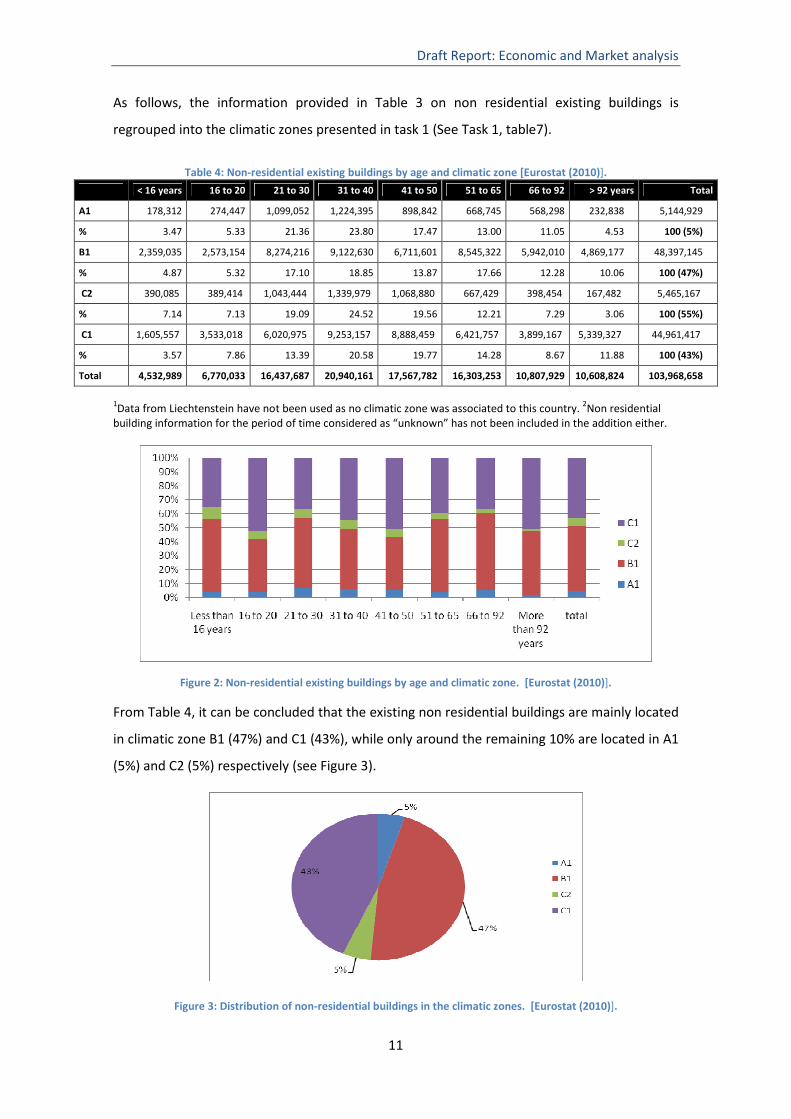
Table 4: Non-residential existing buildings by age and climatic zone [Eurostat (2010)].
< 16 years 16 to 20 21 to 30 31 to 40 41 to 50 51 to 65 66 to 92 > 92 years Total
A1 178,312 274,447 1,099,052 1,224,395 898,842 668,745 568,298 232,838 5,144,929
% 3.47 5.33 21.36 23.80 17.47 13.00 11.05 4.53 100 (5%)
B1 2,359,035 2,573,154 8,274,216 9,122,630 6,711,601 8,545,322 5,942,010 4,869,177 48,397,145
% 4.87 5.32 17.10 18.85 13.87 17.66 12.28 10.06 100 (47%)
C2 390,085 389,414 1,043,444 1,339,979 1,068,880 667,429 398,454 167,482 5,465,167
% 7.14 7.13 19.09 24.52 19.56 12.21 7.29 3.06 100 (55%)
C1 1,605,557 3,533,018 6,020,975 9,253,157 8,888,459 6,421,757 3,899,167 5,339,327 44,961,417
% 3.57 7.86 13.39 20.58 19.77 14.28 8.67 11.88 100 (43%)
Total 4,532,989 6,770,033 16,437,687 20,940,161 17,567,782 16,303,253 10,807,929 10,608,824 103,968,658
1Data from Liechtenstein have not been used as no climatic zone was associated to this country. 2Non residential building information for the period of time considered as “unknown” has not been included in the addition either.
Figure 2: Non-residential existing buildings by age and climatic zone. [Eurostat (2010)].
From Table 4, it can be concluded that the existing non residential buildings are mainly located
in climatic zone B1 (47%) and C1 (43%), while only around the remaining 10% are located in A1
(5%) and C2 (5%) respectively (see Figure 3).
Figure 3: Distribution of non-residential buildings in the climatic zones. [Eurostat (2010)].
Draft Report: Economic and Market analysis
12
From Table 4, it can be concluded that the existing non residential buildings are mainly located
in climatic zone B1 (47%) and C1 (43%), while only around the remaining 10% are located in A1
(5%) and C2 (5%) respectively (see Figure 3).
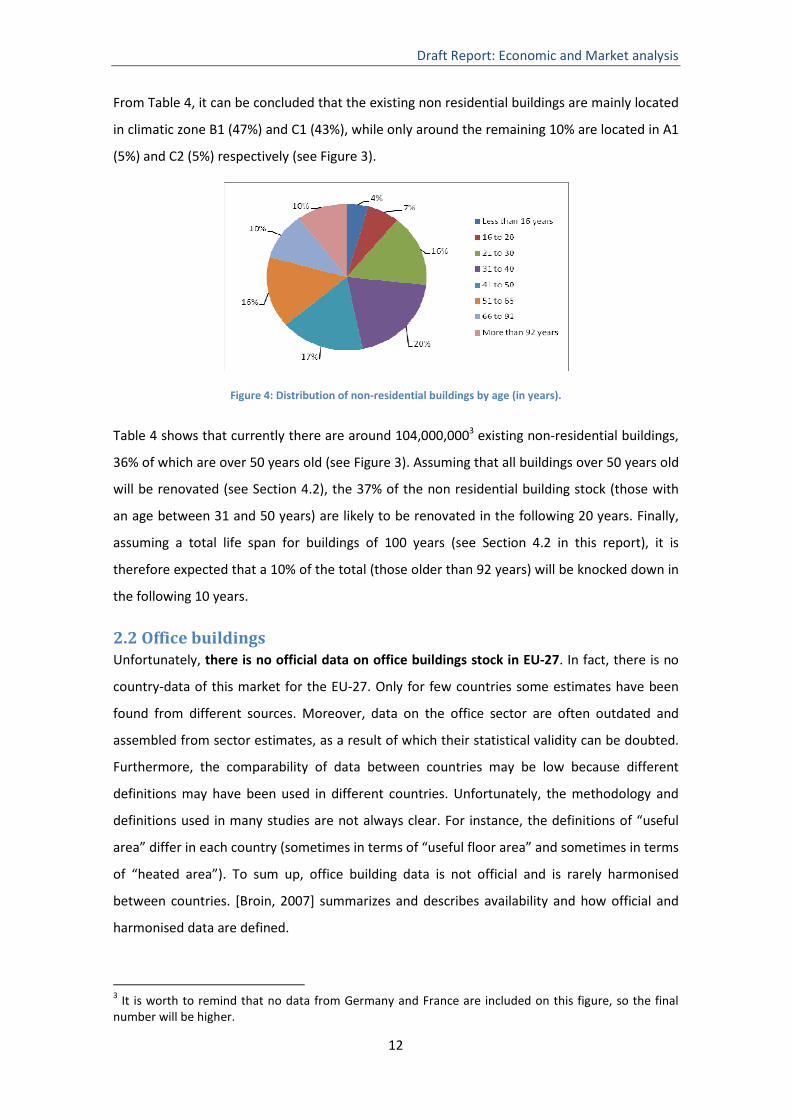
Figure 4: Distribution of non-residential buildings by age (in years).
Table 4 shows that currently there are around 104,000,0003 existing non-residential buildings,
36% of which are over 50 years old (see Figure 3). Assuming that all buildings over 50 years old
will be renovated (see Section 4.2), the 37% of the non residential building stock (those with
an age between 31 and 50 years) are likely to be renovated in the following 20 years. Finally,
assuming a total life span for buildings of 100 years (see Section 4.2 in this report), it is
therefore expected that a 10% of the total (those older than 92 years) will be knocked down in
the following 10 years.
2.2 Office buildings Unfortunately, there is no official data on office buildings stock in EU-27. In fact, there is no
country-data of this market for the EU-27. Only for few countries some estimates have been
found from different sources. Moreover, data on the office sector are often outdated and
assembled from sector estimates, as a result of which their statistical validity can be doubted.
Furthermore, the comparability of data between countries may be low because different
definitions may have been used in different countries. Unfortunately, the methodology and
definitions used in many studies are not always clear. For instance, the definitions of “useful
area” differ in each country (sometimes in terms of “useful floor area” and sometimes in terms
of “heated area”). To sum up, office building data is not official and is rarely harmonised
between countries. [Broin, 2007] summarizes and describes availability and how official and
harmonised data are defined.
3 It is worth to remind that no data from Germany and France are included on this figure, so the final number will be higher.

Draft Report: Economic and Market analysis
13
Table 5 reports the office building stock for the countries for which this information is
available. Basically, information comes from [EURIMA, 2005b]4 report and [OTB Research
Institute for Housing, Urban and Mobility Study, 2008] report. In this case, data are for
different years (from 2003 to 2006) and are expressed in floor area for all countries except for
Austria, Finland and the Netherlands expressed in terms of number of buildings. It is observed
that Poland is the country with highest floor area dedicated to office buildings (Netherlands
the country with the highest number of offices), while Latvia is the country with the highest
office building stock per person.
Table 5: Office building stock [OTB Research Institute for Housing, Urban and Mobility Study, 2008]1, [OTB Research Institute for Housing, Urban and Mobility Study, 2008 and Odyssee, 2007]2, [EURIMA, 2010]3
Countries Stock (millions of m2/Number of buildings) Stock per 1,000 inhabitants
Austria1 32,235 3,875.1Finland1 10,695 2,017.7France1 182 2.8 Germany2 202 2.5 Netherlands1 60,000 3,657.3Sweden1 34 3.7 UK2 106 1.7 Estonia3 13.9 10.4 Latvia3 27.3 12.0 Lithuania3 31.7 9.4 Poland3 286.3 7.5 Czech Republik3 105.2 10.1 Slovakia3 51.3 9.5 Hungary3 91.3 9.1 Slovenia3 18.3 9.1
The scope of this Task is to try to extrapolate the available information on office building stock
into each of the office building categories defined in report "Product definition and scope". In
doing so, Table 6 below is included providing an office stock categorization by building age,
size and climatic zone. It is worth noting that the climatic classification presented in Table 6
(cold, moderate and warm) is somewhat different to that presented in report "Product
definition and scope", which differentiates the climate zones by Heating and Cooling Degree
Days (HDD and CDD respectively). Acknowledging the fact that efforts should be made to
harmonise the climatic classification in both tasks, a decision was made to keep Table 6 in as it
provides relevant information on the distribution of office building stock in these climatic
zones that can not be segregated. In fact, this categorisation is the only one for which some
office stock data is available.
4 According to results of the stock per 1,000 persons, EURIMA data are, probably, data on non-residential buildings rather than office buildings. In the EURIMA report there is a contradiction between information on pages 66 (where it says literally “office buildings”) and 67 (where it says literally “non-residential buildings”)

Draft Report: Economic and Market analysis
14
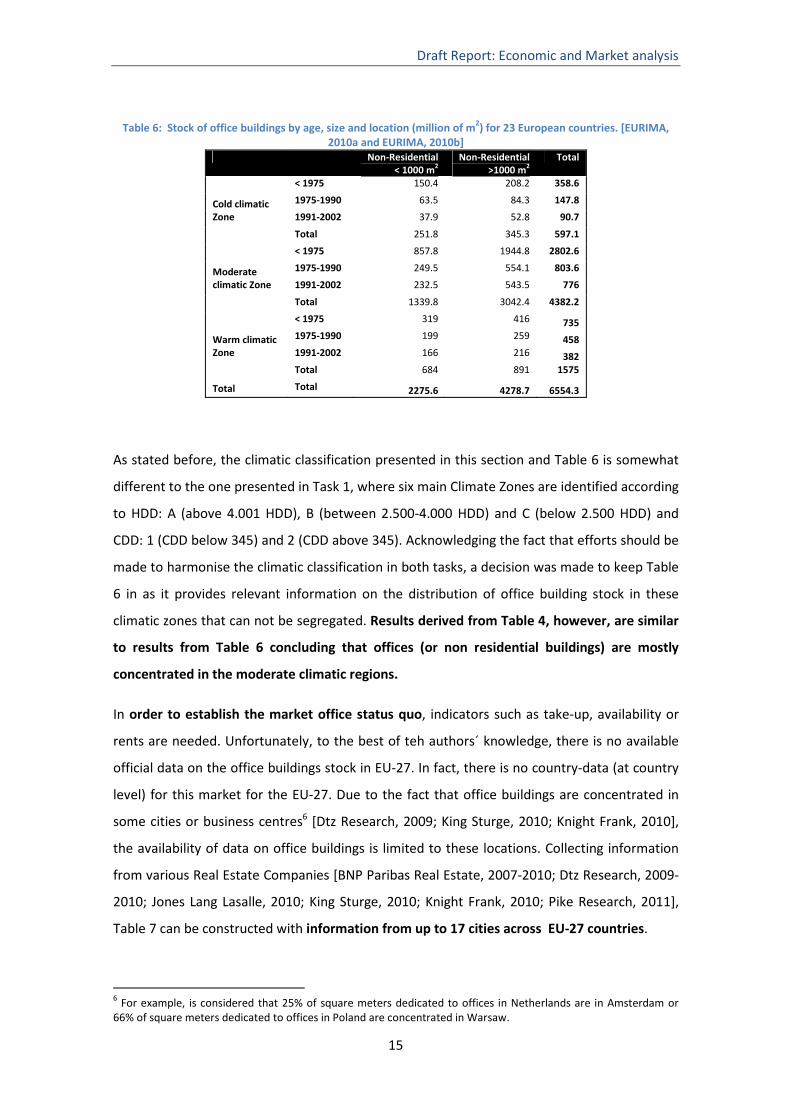
Table 6 shows data from [EURIMA, 2005a] and [EURIMA, 2005b] and distinguishes three
climatic zones according to HDD assumed by [STOA, 1998]: cold (4,500 Kd/a to 3,001 Kd/a),
moderate (3,000 Kd/a to 1,801 Kd/a), and warm (up to 1,800 Kd/a)5. Countries included by the
authors in each zone are:
- Cold: Finland, Sweden, Poland, Estonia, Latvia and Lithuania.
- Moderate: Austria, Belgium, Denmark, France, Germany, Ireland, Luxembourg,
Netherlands, UK, Czech Republic, Slovakia, Hungary and Slovenia.
- Warm: Greece, Italy, Portugal and Spain.
For every location, the stock can be classified by age (buildings erected before 1975, buildings
erected between 1976 and 1990 and buildings erected from 1990 to 2001) and building size
(small office building of less than 1,000m2 and large office buildings bigger than 1,000 m2).
Data covers up to 23 of the EU-27 countries (all EU-27 countries with the exception of:
Romania, Bulgaria, Cyprus and Malta).
As observed, most office buildings are concentrated in moderate climatic zone (4,382.2 million
of m2), are large office buildings (4,278.7 million of m2) and were erected before 1975 (6,277.2
million of m2). Comparing climatic zones, in moderate climatic zones the difference between
small and large size office buildings is maximum while in warm climatic zones is minimum.
Moreover, in moderate climatic zones, the percentage of buildings erected before 1975 is
almost 64%, while in warm climatic zone this percentage is only 46%.
5 Classification was originally made for EU-15. In order to incorporate 8 new EU countries, Central-Eastern European countries can be considered within the moderate climatic zone and Estonia, Latvia and Lithuania within the cold climatic zone.
Draft Report: Economic and Market analysis
15
Table 6: Stock of office buildings by age, size and location (million of m2) for 23 European countries. [EURIMA, 2010a and EURIMA, 2010b]
Non-Residential < 1000 m2
Non-Residential >1000 m2
Total
< 1975 150.4 208.2 358.6
1975-1990 63.5 84.3 147.8
1991-2002 37.9 52.8 90.7 Cold climatic Zone
Total 251.8 345.3 597.1
< 1975 857.8 1944.8 2802.6
1975-1990 249.5 554.1 803.6
1991-2002 232.5 543.5 776 Moderate climatic Zone
Total 1339.8 3042.4 4382.2
< 1975 319 416 735 1975-1990 199 259 458 1991-2002 166 216 382
Warm climatic Zone
Total 684 891 1575
Total Total 2275.6 4278.7 6554.3
As stated before, the climatic classification presented in this section and Table 6 is somewhat
different to the one presented in Task 1, where six main Climate Zones are identified according
to HDD: A (above 4.001 HDD), B (between 2.500-4.000 HDD) and C (below 2.500 HDD) and
CDD: 1 (CDD below 345) and 2 (CDD above 345). Acknowledging the fact that efforts should be
made to harmonise the climatic classification in both tasks, a decision was made to keep Table
6 in as it provides relevant information on the distribution of office building stock in these
climatic zones that can not be segregated. Results derived from Table 4, however, are similar
to results from Table 6 concluding that offices (or non residential buildings) are mostly
concentrated in the moderate climatic regions.
In order to establish the market office status quo, indicators such as take-up, availability or
rents are needed. Unfortunately, to the best of teh authors´ knowledge, there is no available
official data on the office buildings stock in EU-27. In fact, there is no country-data (at country
level) for this market for the EU-27. Due to the fact that office buildings are concentrated in
some cities or business centres6 [Dtz Research, 2009; King Sturge, 2010; Knight Frank, 2010],
the availability of data on office buildings is limited to these locations. Collecting information
from various Real Estate Companies [BNP Paribas Real Estate, 2007-2010; Dtz Research, 2009-
2010; Jones Lang Lasalle, 2010; King Sturge, 2010; Knight Frank, 2010; Pike Research, 2011],
Table 7 can be constructed with information from up to 17 cities across EU-27 countries.
6 For example, is considered that 25% of square meters dedicated to offices in Netherlands are in Amsterdam or 66% of square meters dedicated to offices in Poland are concentrated in Warsaw.
Draft Report: Economic and Market analysis
16
Table 7 shows the consequences of the economic situation in 2009, where there was
employment destruction in all these cities. Moreover, economic conditions are not yet back to
normal and employment destruction will still continue in the next months and even longer in
some countries [Baily and Okun, 1965]. Occupier markets across Europe continued to
deteriorate in 2009, with take-up falling significantly below the levels registered during 2008.
On an annual basis, the most substantial falls were registered in Stockholm (-212.23%), Dublin
(-57.33%), Bucharest (-56.14%), Luxembourg (-53.12%), Athens (-52%), Moscow (-68%) and
Warsaw (-51.89%). By contrast, there were some signs of recovery in the Central London
market (0.71%). Indeed, the most significant increases in demand are expected in the larger
global centres, notably Central London and Paris. These markets went into the downturn the
earliest and hardest as the financial crisis hit. But as the recovery in world demand has
gathered pace, led by emerging Asia, they have also experienced the quickest turnaround.
That is, these are the markets that first entered the crisis and also the first to recover from it.
Elsewhere, the upturn is more gradual. In general, leasing activity across Europe continues to
be driven by cost reduction and space rationalisation, with demand mainly concentrated in
smaller premises (around 1,000m2). Therefore, European net absorption rates in 2010 should
not be positive (at present, information is collected for some quarters of 2010, but not for the
whole year).
In this sense, availability continued to rise across the region with the average availability ratio
reaching 11.8%, up from 2008 data. The considerable increase in availability was due to a
combination of weak occupier demand and a surge in supply of new space (as well as in
second-hand available space as tenants released surplus space back onto the market). On an
annual basis, the most substantial availability ratios were registered in Dublin (22.9%),
Budapest (20.6%), Amsterdam (19.8%) and Bucharest (17.5%). This fact was particularly
worrying in Budapest and Bucharest, where the increase in the stock of offices´ square metres
rose up to 28.5% and 13.4% respectively.
As a result of rising availability and weak demand, widespread rental declines across Europe
were not surprising. In fact, this was the most positive news for occupiers, since the climate
was presenting tenants with good opportunities to secure rent reductions, more flexible lease
terms and other incentives as landlords look to avoid being left with vacant space on their
hands7 [King Sturge, 2010; Knight Frank, 2010]. At the end of 2009, rents finally stabilised after
7 Companies are also taking advantage of a contracting market to secure office space in good quality buildings. As a consequence, relocations were the main driving force of demand and transaction activity in 2009.

Draft Report: Economic and Market analysis
17
dropping by 18% over two years, reaching what looked like the bottom line. Indeed, demand
for prime offices rises since supply for these quality buildings remains limited. By contrast,
significant corrections in prime rents were registered in those markets where rents have been
slower to respond to changing market conditions. For example, rents drop in cities such as
Madrid where tenants still are in an advantaged position in negotiations. Moreover, rents
should continue to dip in most peripheral areas of European cities where vacancy rates remain
high and important developments took place in the last three years [King Sturge, 2010; Knight
Frank, 2010].
To sum up, as a consequence of the economic situation in 2009, where there was employment
destruction in all these cities, office market indicators from cities from up to 17 of the EU-27
countries show rising availability (higher than 10%), weak demand and widespread rental
declines (18%) across Europe since 2008.
Table 7: 2009 Key office market indicators for major centres of UE-27 countries [BNP Paribas Real Estate, 2007-2010; Dtz Research, 2009-2010; Lasalle, 2010; Sturge, 2010; Frank, 2010; Pike Research, 2011].
Take-up 20091
Take-up2
Growth Stock1 Stock2
Growth Available
space1Availability3 Rents4 Rents
Growth2
Paris (CBD) 1,483.0 -24.21 7,018.9 0 372.0 5.3 63 15.4 London (CBD) 997.0 0.71 88,000.0 3.2 6,952.0 7.9 56 23.0 Luxembourg 119.3 -53.12 3,200.0 2.8 222.4 7.0 40 0 Bratislava 87.0 -38.30 1,014.0 - - 10.7 - - Athens 60.0 -52.00 - - - 12.1 - - Dublin 95.8 -57.33 3,245.9 0.6 743.3 22.9 29 -7.2 Stockholm -156.0 -212.23 11,300.0 0.6 1,389.9 12.3 41 15.8 Madrid 298.0 -38.43 11,463.0 1.4 928.5 10.0 24 -10.7 Amsterdam 190.0 -38.51 6,504.1 -2.1 1,287.8 19.8 31 10.3 Warsaw 221.2 -51.89 3,400.0 5.5 244.8 7.2 24 0 Bucharest 131.5 -56.09 1,680.0 13.4 294.0 17.5 19 -9.5 Prague 246.3 -5.39 2,698.0 0.3 356.1 13.2 21 0 Brussels 407.8 -30.35 12,990.0 1.5 1,597.8 12.3 23 5.8 Budapest 260.0 -21.28 3,083.0 28.5 635.1 20.6 14 0 Vienna 295.0 -26.25 - - - 5.0 - - Berlin 429.5 -8.23 17,725.0 0.6 1,524.4 8.6 22 2.3 Milan 176.0 -35.06 12,000.0 2 870.0 8.8 41 2.1
Notes: 2 Growth (%), 3 % of stock, 4 €/ m2/month (%).
Glossary definition: Take-up growth represents the new total floor space (In 1000 m2) known to have been let or pre-let, sold or pre-sold to tenants or owner-occupiers during the survey period. Available space: is total floor space (In 1000 m2) remained unused (unsold unlet) during the survey period. Stock is total office building floor space (In 1000 m2) in this city

Draft Report: Economic and Market analysis
18
3. Construction sector: Indicators, Evolution and Forecast
3.1 General economic Indicators
Table 8 shows the main economic indicators for the EU-27: GDP (Gross Domestic Product),
inflation rate, GFCF (General Fixed Economic Formation) and unemployment rate. The
connection of these indicators with the construction and, especially, with the office building
market is as follows. The behaviour of the office market is a consequence of overall economic
performance. In an expanding economy (demand and investment growth, GDP growth,
inflationary pressures, unemployment rate decline), this economic performance will lead to
more demand for office buildings and, therefore, diminishing space availability and increasing
rents. In an economy in crisis (decline in demand and investment, decrease of GDP,
deflationary trend, increasing unemployment rate), this performance will result in decreased
demand for office buildings and, therefore, excess of space availability and decreasing rents.
In terms of GDP, last decade was one of economic stagnation. Thus, cumulative economic
growth only reached 5.9% from 2000 to 2010. On the one hand, this is due to the fact that the
higher obtained cumulative growth GDP rates were from countries with low participation in
European GDP (basically Eastern European countries). On the other hand, most Western
European countries with high participation in European GDP, obtained low (or even negative)
cumulative growth GDP rates. That is the case for Germany, Italy, Denmark and Ireland.
Analysing 2010 growth GDP rates, the scenario is of clear economic recovery from the bust
experienced in 2009. This economic recovery cannot be extended to all European countries.
Countries from the south of Europe (Portugal, Italy, Greece and Spain), Ireland and some
Eastern European countries (Bulgaria, Romania, Latvia, Lithuania, Hungary and Slovenia) have
been in economic recession or stagnation in 2010.
However, GFCF (investment component of the GDP) is still decreasing for the EU-27 (-0.6%). In
fact, only Germany, Italy, Luxembourg, Malta, Poland, Slovakia, Finland, Sweden and the
United Kingdom have clearly increased their GFCF in 2010 with respect to 2009. GFCF can be
understood as a sign of economic recovery consolidation. In this sense, most of these
countries have experienced significant economic growth in 2010 (Germany, Luxembourg,
Malta, Poland, Slovakia, Finland, and Sweden).

Draft Report: Economic and Market analysis
19
Inflation rate in 2010 is around 2% (2.1%), fulfilling the aim of price control from the European
Central Bank (ECB). Moreover, in 2010, the deflation risk has significantly decreased for almost
all European countries. Only Ireland, Latvia and, probably, the Netherlands and Slovakia are in
risk of deflation. The EU-27 as a whole has definitely removed deflation risk. Actions of ECB
(which includes maintaining interest rates at 1% and periodic injections of liquidity) have
significantly contributed to achieve this aim. Finally, and as a consequence of the intense
recession period experienced in 2008 and 2009, unemployment rate of the EU-27 has reached
9.6%. This rate of unemployment is concentrated in the following countries: Spain (20.1%),
Latvia (17.1%), Slovakia (14.5%), Estonia (13.8%), Lithuania (13.7%), Ireland (13.5%), Greece
(12.9%) and Portugal (10.9%). In all cases, these are countries whose economic models are
based in highly intensive labour force activities such as construction or tourism.
To sum up, and in order to connect with the office building market, economic indicators show
an scenario of clear economic recovery from the bust experienced in 2009 (since GDP growth
is positive and higher in 2010 with respect to 2009), which can be interpreted as a sign of short
term recovery of office building demand. However, the investment component, which is the
most related one to the still decreasing office building market, can be interpreted as an
absence of economic recovery consolidation. That is, recovery is unstable at this moment. The
absence of a clear inflationary pattern (although it seems EU-27 have avoided deflation risk)
and a higher and difficult to reduce unemployment rate, reinforce this point. Obviously, a
higher dispersion is found when countries are analysed individually. Thus, Germany,
Luxembourg, Malta, Poland, Slovakia, Finland, Sweden and the United Kingdom show a stable
economic recovery (that is a higher probability of demand for office buildings), while Portugal,
Italy, Greece, Spain, Ireland, Bulgaria, Romania, Latvia, Lithuania, Hungary and Slovenia show a
scenario of recession or stagnation (that is a lower probability of demand for office buildings).
Table 8: General Economic indicators. [Eurostat (2010)]
Countries %GDP1
2008 %GDP1
2009 %GDP1
2010 Cumulative2
2000-2010 %GFCF3, 1
2010 Inflation
rate 2010 Unemployment
rate 2010 EU-27 0.5 -4.2 1.8 105.9 -0.6 2.1 9.6
Belgium 1.0 -2.8 2.0 118.0 -1.1 2.3 8.4
Bulgaria 6.2 -4.9 -0.1 238.9 -9.8 3.0 9.9
Czech Republic
2.5 -4.1 2.4 126.9 -1.8 1.2 7.4
Denmark -1.1 -5.2 2.3 101.9 -3.8 2.2 7.5
Germany 1.0 -4.7 3.6 94.5 5.5 1.2 6.8
Estonia -5.1 -13.9 2.4 146.1 -6.6 2.7 13.84
Ireland -3.5 -7.6 -0.2 87.6 -21.1 -1.74 13.5
Greece 1.3 -2.3 -4.2 115.1 -17.4 4.7 12.9
Spain 0.9 -3.7 -0.2 115.7 -7.9 1.8 20.1
France 0.2 -2.6 1.6 114.7 -1.7 1.7 9.7

Draft Report: Economic and Market analysis
20
Italy -1.3 -5.0 1.1 95.8 2.4 1.6 7.84
Cyprus 3.6 -1.7 0.5 160.3 -12.9 2.6 6.8
Latvia -4.2 -18.0 -0.4 146.8 -24.8 -1.2 17.14
Lithuania 2.9 -14.7 0.4 153.0 -8.5 1.2 13.74
Luxembourg 1.4 -3.7 3.2 128.5 8.7 2.8 4.7
Hungary 0.8 -6.7 1.1 127.2 -1.9 4.7 11.2
Malta 2.7 -1.9 3.1 68.9 9.6 2.0 6.7
Netherlands
1.9 -3.9 1.7 100.0 -4.3 0.9 4.5
Austria 2.2 -3.9 2.0 100.7 -2.6 1.7 4.6
Poland 5.1 1.7 3.5 140.2 0.1 2.7 9.7
Portugal 0.0 -2.5 1.3 79.2 -4.1 1.4 10.9
Romania 7.3 -7.1 -1.9 224.9 -9.9 6.1 6.94
Slovenia 3.7 -8.1 1.1 126.8 -4.4 2.1 7.2
Slovakia 5.8 -4.8 4.1 130.7 1.7 0.7 14.5
Finland 0.9 -8.2 2.9 106.3 0.4 1.7 8.4
Sweden -0.6 -5.3 4.8 116.1 5.9 1.9 8.4
United Kingdom
-0.1 -4.9 1.4 106.7 2.8 2.24 7.64
Notes: 1Growth percentage from previous year; 2100 refers to the year 2000; 3Gross Fixed Capital Formation (GFCF); 4Data from 2009 (2010 is still unavailable)
3.2 Structural construction indicators
Once the general economic indicators and their influence in the office building market have
been commented, the analysis continues with the discussion about structural indicators of the
construction sector. As it has been stated previously, the office building sector is a part of the
non-residential building sector, which is also a part of the building sector. Although less
important quantitatively, the non-residential building sector (and also the office building
sector) shares certain trends and characteristics with the overall building sector. In addition,
knowing the future trends for the overall building/construction sector could provide some
clues in order to establish future trends for the office building sector (sharing its relationship in
both cases with the evolution of the overall economy, for example).
Historically, the European construction sector has experienced cyclical patterns to its
development. These may be linked to consumer confidence, the availability of credit (often in
the form of mortgages), political events (such as the construction boom in Germany following
reunification), or general economic cycles. As stated before, construction sector is intensive in
labour force and is a pro-cyclical sector, that is, peaks and troughs in construction activity tend
to be more amplified than those for the whole economy. This can perhaps be linked to a result
Draft Report: Economic and Market analysis
21
of large projects being postponed and/or cancelled during periods when economic output
slows or contracts [Muellbauer and Murphy , 1997; Ortalo-Magné and Rady, 1999].
In recent years, the European construction industry has been highly concentrated in Spain,
Ireland, Poland and Cyprus. As an example, almost 50% of the economic growth experienced in
Spain from 1998 to 2008 was related to the construction sector. Besides, around one quarter
of all persons employed in the Polish non-financial business economy were employed within
construction activities in 2007 [Rodriguez, 2008; Dtz Research, 2009; Sturge, 2010; Frank,
2010].
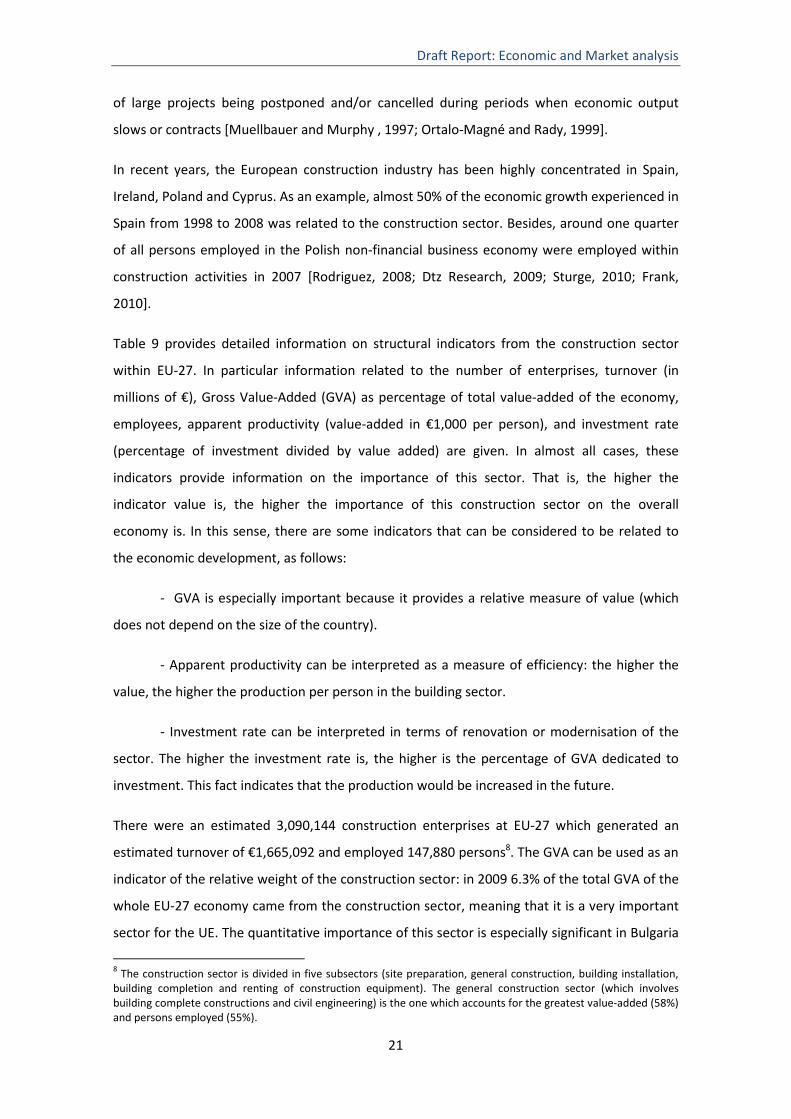
Table 9 provides detailed information on structural indicators from the construction sector
within EU-27. In particular information related to the number of enterprises, turnover (in
millions of €), Gross Value-Added (GVA) as percentage of total value-added of the economy,
employees, apparent productivity (value-added in €1,000 per person), and investment rate
(percentage of investment divided by value added) are given. In almost all cases, these
indicators provide information on the importance of this sector. That is, the higher the
indicator value is, the higher the importance of this construction sector on the overall
economy is. In this sense, there are some indicators that can be considered to be related to
the economic development, as follows:
- GVA is especially important because it provides a relative measure of value (which
does not depend on the size of the country).
- Apparent productivity can be interpreted as a measure of efficiency: the higher the
value, the higher the production per person in the building sector.
- Investment rate can be interpreted in terms of renovation or modernisation of the
sector. The higher the investment rate is, the higher is the percentage of GVA dedicated to
investment. This fact indicates that the production would be increased in the future.
There were an estimated 3,090,144 construction enterprises at EU-27 which generated an
estimated turnover of €1,665,092 and employed 147,880 persons8. The GVA can be used as an
indicator of the relative weight of the construction sector: in 2009 6.3% of the total GVA of the
whole EU-27 economy came from the construction sector, meaning that it is a very important
sector for the UE. The quantitative importance of this sector is especially significant in Bulgaria
8 The construction sector is divided in five subsectors (site preparation, general construction, building installation, building completion and renting of construction equipment). The general construction sector (which involves building complete constructions and civil engineering) is the one which accounts for the greatest value-added (58%) and persons employed (55%).

Draft Report: Economic and Market analysis
22
(8.6%), Ireland (8.5%), Spain (10.8%), Cyprus (9.0%), Romania (10.9%) and Slovakia (8.8%). At
this point, it is useful to remind that 2009 was the second year of the financial crisis and
therefore these percentages were higher in previous years (however, percentages in 2009
reflect better long-term trends for this sector in the UE). In 2007, the relative contribution
made by the construction sector to the GVA of the non-financial business economies of the
EU-27 was around 9.5%, being notably higher in Cyprus (19.4%), Poland (18.1%) and Spain
(17.6%). Apparent productivity within the EU-27 construction sector was, in average, €38,000.
That is, each person employed within the EU-27 construction sector generated an average
€38,000 of value added in 2007. This value is lower than in other sectors what indicates the
labour-intensive characteristic of this sector. This fact is seen from the lower percentage of
investment with respect to GVA, 12%, which is, around 25% for an average sector of the EU
economy. In fact, the bigger values observed in Romania and Bulgaria for the investment
indicator only shows that it is a non-developed sector. All these values characterise the
building sector in Europe as an important but not very productive sector (with the exception of
some East European countries in which this sector is underdeveloped). The office building
sector shares these characteristics. However, some innovations such as the development of an
ecolabel can be seen as an advantage to modernise, renovate or even increase the efficiency
of the sector.
Table 9: Structural indicators of the construction sector. Source: [Eurostat (2010)]
Countries Number Enterprises
Turnover GVA Persons employed
Apparent Productivity (1,000€)
Investment (%)
EU-27 3,090,144 1,665,092 6.3 147,880 38.0 12.0
Belgium 66,619 43369.3 5.4 271,782 45.3 25.3
Bulgaria 18,193 6716.7 8.6 221,176 7.9 92.2
Czech Republic 153,156 16187.3 7.4 401,661 15.1 13.5
Denmark 35,611 30655.8 5.0 206,829 53.6 10.2
Germany 220,663 139221.6 4.3 1,521,751 38.1 6.9
Estonia 6,431 4322.2 7.0 58,933 19.0 15.3
Ireland 1,344 - 8.5 70,971 112.1 10.4
Greece 108,830 15467.1 4.5 304,589 20.4 15.4
Spain 456,358 295272.0 10.8 2,880,513 35.1 9.1
France 435,326 213764.3 6.4 1,724,266 43.9 8.2
Italy 615,862 146991.2 6.3 1,964,195 36.0 16.0
Cyprus 5,987 2684.1 9.0 36,799 37.4 7.3
Latvia 5,974 5542.4 6.6 85,922 16.7 27.8
Lithuania 19,545 5382.4 6.3 139,197 13.0 19.2
Luxembourg 2,266 4156.6 5.8 37,628 45.0 3.4
Hungary 69,939 11912.3 4.8 242,794 10.8 16.8
Malta - - 3.4 - - -
Draft Report: Economic and Market analysis
23
Netherlands 85,910 82021.2 6.0 486,171 53.2 7.2
Austria 26,965 32681.3 7.3 261,861 52.1 6.1
Poland 205,440 40832.9 7.5 796,882 16.0 15.9
Portugal 122,487 33043.4 6.1 514,514 18.4 19.9
Romania 46,925 18073.0 10.9 513,355 10.2 139.1
Slovenia 17,176 - 7.9 79,853 22.1 25.3
Slovakia 4,981 5054.5 8.8 74,470 15.6 29.7
Finland 40,456 22324.6 7.0 146,692 54.5 11.0
Sweden 73,388 12166.5 5.4 298,460 49.7 -
United Kingdom 240,401 283412.2 5.9 1,430,515 75.5 8.7
Note: All data are from 2007 with the exception of Gross Value-Added values, which are for 2009.
It is expected, that statistics from 2008-2009 will show a significant reduction on the impact of
the economic downturn on these variables what will correspond to a reduction of the indicator
values shown in Table 9. Recent finance crisis and economic downturn have had some serious
implications for the EU-27 construction sector. As commented, employment ratios fell sharply
in many EU-27 countries, particularly in Spain and the Baltic countries [BNP Paribas, 2010; Dtz
Research, 2009; King 2010; Knight, 2010].
In this sense, once the importance of the recent downturn and its implications for the
construction sector is determined, some indicators in order to establish the short term
evolution of the construction sector are required. Table 10 shows detailed information on
short-term indicators for the construction sector within EU-27. This information is provided in
order to assess the current status quo of the sector. All information is from 2010. As previously
reported, major employment decreases are observed in: Latvia (37.68%), Spain (23.03%),
Lithuania (21.45%), Estonia (16.02%) and Romania (15.45%). The downsizing of the workforce
is reflected in a declining output [Baily and Okun, 1965], as the EU-27 Construction Production
Index fell by 14.2% in 2009 and 8.91% in 2010. Major decreases in this index are observed in:
Lithuania (48.49%), Ireland (36.42%), Bulgaria (34.76%) and Estonia (28.48%). As demand falls,
gross wages present negative growth rates for the EU-27 (-6.64%), especially in Lithuania (-
46.97%), Latvia (-45.15%), Estonia (-26.99%) and Spain (-25.78%) However, considering year
2005 as baseline (i.e. 100%), construction costs in EU-27 in 2010 are 13.34% higher than those
from 2005 (in real terms it can be assumed that costs have remained constant) with the
highest increases observed in Latvia (66.20%), Portugal (46.33%) and Latvia (42.20%). All this
information points out a sector with lower and decreasing demand (and, therefore wages).
In this sense, a continuous adjustment to the construction sector is expected for years 2011
and 2012 with an eventual recovery in year 2013 [BNP Paribas, 2010; Dtz Research, 2009; King

Draft Report: Economic and Market analysis
24
Sturge, 2010; Knight Frank, 2010]. This is the usual prediction included in the last Real Estate
and International Institutions Reports. The reason is that 2011 and 2012 are forecasted as the
years for the overall economic recovery. However, as already commented, the construction
sector is a procyclic sector with some lag with respect to overall economy [Muellbauer and
Murphy, 1997; Ortalo-Magné and Rady, 1999], and therefore the recovery of the construction
sector is expected to happen later on. In terms of the office building sector this fact implies
that the construction of new office buildings is also expected to grow from 2013 onwards,
what means that the lag of the construction section in relation to the overall activity, would be
lower for the office building sector. As a consequence of this evolution, it is expected that a
reduction of available space will start in 2011-2012 [Giussani et al, 1993; De Wit and Van Dijk,
2003; Kennedy, Lee and McAllister, 2007].
Table 10: Short-term indicators of the construction sector. [Eurostat (2010)]
Countries Construction production Index1
Employment1
(%) Gross wages1
(%) Construction cost
(2005�100%) EU-27 -8.91 -7.85 -6.64 113.34
Belgium -6.63 -0.12 -0.03 109.86
Bulgaria -34.76 -10.36 11.14 142.20
Czech Republic -0.46 -1.41 1.09 112.70
Denmark -17.78 -13.61 -13.05 114.10
Germany 0.05 1.25 1.38 109.50
Estonia -28.38 -16.02 -26.99 115.30
Ireland -36.42 - - 91.20
Greece -20.43 -1.28 0.55 114.90
Spain -11.27 -23.03 -25.78 119.60
France -5.86 -2.22 -1.36 117.00
Italy -11.49 - -3.49 -
Cyprus -11.10 -4.87 -1.67 119.69
Latvia -34.92 -37.68 -45.15 166.20
Lithuania -48.49 -21.45 -46.97 114.84
Luxembourg 0.97 -1.62 4.14 111.02
Hungary -4.35 -8.08 -3.95 127.10
Malta -6.71 -7.99 -2.56 111.40
Netherlands -5.93 -1.94 1.13 116.27
Austria -1.65 2.96 5.10 115.57
Poland 4.50 3.88 7.78 111.84
Portugal -6.63 -7.69 -8.28 146.33
Romania -15.21 -15.45 -10.44 116.50
Slovenia -20.92 -1.35 1.18 117.00
Slovakia -11.13 1.95 1.60 112.57
Finland -13.15 -5.72 -4.37 120.00
Sweden -3.46 1.03 0.04 103.30
United Kingdom -11.62 -6.75 -2.41 -
Notes: 1Growth percentage from previous year
Draft Report: Economic and Market analysis
25
3.3 Short-term office building indicators
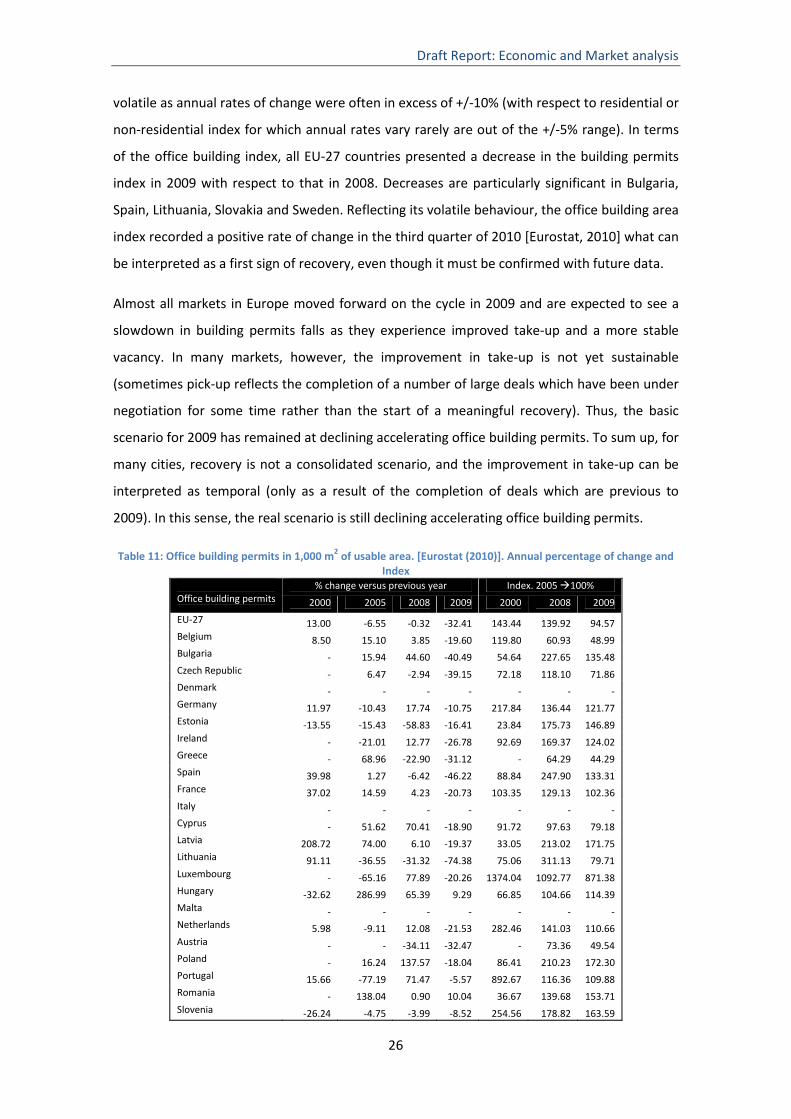
Focusing on the evolution of the office buildings, Table 11 presents detailed information on
the office building permits. A building permit is an authorisation to start working on a building
project and it can be considered as the final stage prior to starting the construction work. The
objective of building permits indices is to assess the development of construction activity9, that
means, it is a short-term activity indicator. In fact, building permits information is a so-called
“advanced indicator”, as it allows the prediction of future construction activity. Thus, a higher
level of current building permits can be interpreted as a higher level of construction activity.
Office buildings are a subsector of the construction sector which is particularly sensible to
economic evolution [Giussani et al, 1993; De Wit and Van Dijk, 2003; Kennedy et al, 2007)].
The depth of the downturn since 2007, where office buildings permits rose by 11.6% [Eurostat,
2010b], may be due to a combination of:
• such a previous oversupply of construction;
• a reduction of consumer and business confidence delaying investment plans;
• a constraint of finance from credit lenders during the crisis to finance building work;
• and cuts-off in public spending (public sector applied an expansionary-countercyclical
policy in 2008 and the beginning of 2009, however the increasing public deficit led to
the European countries to come back to restrictive fiscal policy, see section 5 of this
task for details).
As a consequence, an important decrease in the number of permits in the office building
sector in 2009 was observed (32.41%). This decreasing pattern was particularly significant in:
Lithuania (74.38%), Slovakia (50.81%), Spain (46.22%) and Bulgaria (40.89%).
Unlike the index for residential buildings, from 2000 to 2009 the index for non-residential
buildings was less regular [Eurostat, 2010], office building permits show frequent changes
between positive and negative rates of change. Although the rates of change for non-
residential buildings were generally smaller, the office buildings sub-index was relatively
9 The type of building permit used in office buildings relates to the authorised useful floor area which covers all types of buildings. The number of permits only covers residential units.
Draft Report: Economic and Market analysis
26
volatile as annual rates of change were often in excess of +/-10% (with respect to residential or
non-residential index for which annual rates vary rarely are out of the +/-5% range). In terms
of the office building index, all EU-27 countries presented a decrease in the building permits
index in 2009 with respect to that in 2008. Decreases are particularly significant in Bulgaria,
Spain, Lithuania, Slovakia and Sweden. Reflecting its volatile behaviour, the office building area
index recorded a positive rate of change in the third quarter of 2010 [Eurostat, 2010] what can
be interpreted as a first sign of recovery, even though it must be confirmed with future data.
Almost all markets in Europe moved forward on the cycle in 2009 and are expected to see a
slowdown in building permits falls as they experience improved take-up and a more stable
vacancy. In many markets, however, the improvement in take-up is not yet sustainable
(sometimes pick-up reflects the completion of a number of large deals which have been under
negotiation for some time rather than the start of a meaningful recovery). Thus, the basic
scenario for 2009 has remained at declining accelerating office building permits. To sum up, for
many cities, recovery is not a consolidated scenario, and the improvement in take-up can be
interpreted as temporal (only as a result of the completion of deals which are previous to
2009). In this sense, the real scenario is still declining accelerating office building permits.
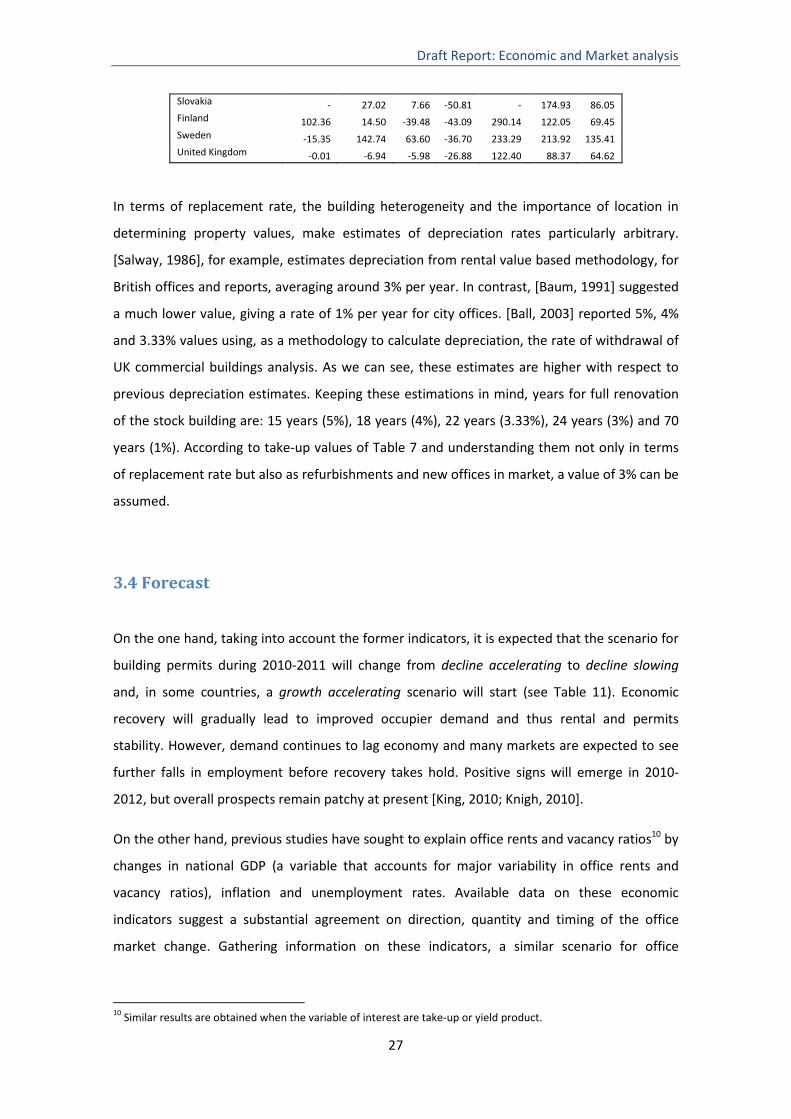
Table 11: Office building permits in 1,000 m2 of usable area. [Eurostat (2010)]. Annual percentage of change and Index
% change versus previous year Index. 2005 �100% Office building permits 2000 2005 2008 2009 2000 2008 2009
EU-27 13.00 -6.55 -0.32 -32.41 143.44 139.92 94.57 Belgium 8.50 15.10 3.85 -19.60 119.80 60.93 48.99 Bulgaria - 15.94 44.60 -40.49 54.64 227.65 135.48 Czech Republic - 6.47 -2.94 -39.15 72.18 118.10 71.86 Denmark - - - - - - -Germany 11.97 -10.43 17.74 -10.75 217.84 136.44 121.77 Estonia -13.55 -15.43 -58.83 -16.41 23.84 175.73 146.89 Ireland - -21.01 12.77 -26.78 92.69 169.37 124.02 Greece - 68.96 -22.90 -31.12 - 64.29 44.29 Spain 39.98 1.27 -6.42 -46.22 88.84 247.90 133.31 France 37.02 14.59 4.23 -20.73 103.35 129.13 102.36 Italy - - - - - - -Cyprus - 51.62 70.41 -18.90 91.72 97.63 79.18 Latvia 208.72 74.00 6.10 -19.37 33.05 213.02 171.75 Lithuania 91.11 -36.55 -31.32 -74.38 75.06 311.13 79.71 Luxembourg - -65.16 77.89 -20.26 1374.04 1092.77 871.38 Hungary -32.62 286.99 65.39 9.29 66.85 104.66 114.39 Malta - - - - - - -Netherlands 5.98 -9.11 12.08 -21.53 282.46 141.03 110.66 Austria - - -34.11 -32.47 - 73.36 49.54 Poland - 16.24 137.57 -18.04 86.41 210.23 172.30 Portugal 15.66 -77.19 71.47 -5.57 892.67 116.36 109.88 Romania - 138.04 0.90 10.04 36.67 139.68 153.71 Slovenia -26.24 -4.75 -3.99 -8.52 254.56 178.82 163.59
Draft Report: Economic and Market analysis
27
Slovakia - 27.02 7.66 -50.81 - 174.93 86.05 Finland 102.36 14.50 -39.48 -43.09 290.14 122.05 69.45 Sweden -15.35 142.74 63.60 -36.70 233.29 213.92 135.41 United Kingdom -0.01 -6.94 -5.98 -26.88 122.40 88.37 64.62
In terms of replacement rate, the building heterogeneity and the importance of location in
determining property values, make estimates of depreciation rates particularly arbitrary.
[Salway, 1986], for example, estimates depreciation from rental value based methodology, for
British offices and reports, averaging around 3% per year. In contrast, [Baum, 1991] suggested
a much lower value, giving a rate of 1% per year for city offices. [Ball, 2003] reported 5%, 4%
and 3.33% values using, as a methodology to calculate depreciation, the rate of withdrawal of
UK commercial buildings analysis. As we can see, these estimates are higher with respect to
previous depreciation estimates. Keeping these estimations in mind, years for full renovation
of the stock building are: 15 years (5%), 18 years (4%), 22 years (3.33%), 24 years (3%) and 70
years (1%). According to take-up values of Table 7 and understanding them not only in terms
of replacement rate but also as refurbishments and new offices in market, a value of 3% can be
assumed.
3.4 Forecast
On the one hand, taking into account the former indicators, it is expected that the scenario for
building permits during 2010-2011 will change from decline accelerating to decline slowing
and, in some countries, a growth accelerating scenario will start (see Table 11). Economic
recovery will gradually lead to improved occupier demand and thus rental and permits
stability. However, demand continues to lag economy and many markets are expected to see
further falls in employment before recovery takes hold. Positive signs will emerge in 2010-
2012, but overall prospects remain patchy at present [King, 2010; Knigh, 2010].
On the other hand, previous studies have sought to explain office rents and vacancy ratios10 by
changes in national GDP (a variable that accounts for major variability in office rents and
vacancy ratios), inflation and unemployment rates. Available data on these economic
indicators suggest a substantial agreement on direction, quantity and timing of the office
market change. Gathering information on these indicators, a similar scenario for office
10 Similar results are obtained when the variable of interest are take-up or yield product.
Draft Report: Economic and Market analysis
28
buildings can be predicted [Giussani, Hsia and Tsolacos, 1993; De Wit and Van Dijk, 2003;
Kennedy, Lee and McAllister, 2007].
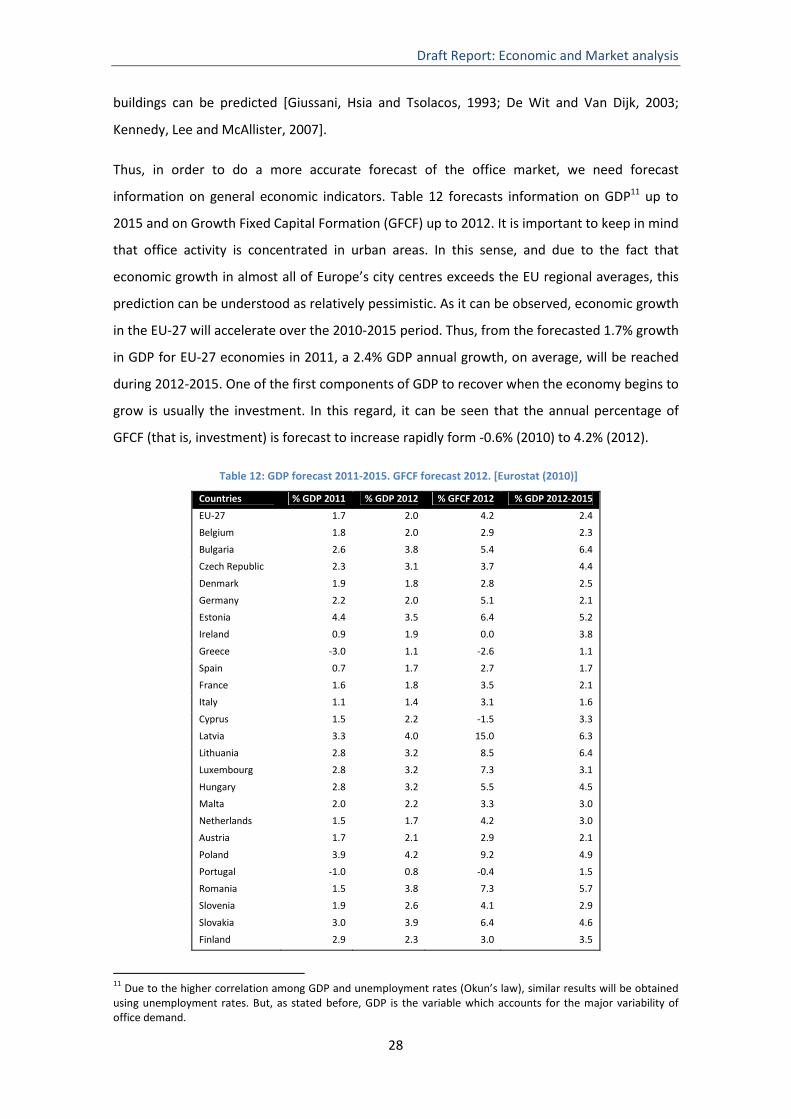
Thus, in order to do a more accurate forecast of the office market, we need forecast
information on general economic indicators. Table 12 forecasts information on GDP11 up to
2015 and on Growth Fixed Capital Formation (GFCF) up to 2012. It is important to keep in mind
that office activity is concentrated in urban areas. In this sense, and due to the fact that
economic growth in almost all of Europe’s city centres exceeds the EU regional averages, this
prediction can be understood as relatively pessimistic. As it can be observed, economic growth
in the EU-27 will accelerate over the 2010-2015 period. Thus, from the forecasted 1.7% growth
in GDP for EU-27 economies in 2011, a 2.4% GDP annual growth, on average, will be reached
during 2012-2015. One of the first components of GDP to recover when the economy begins to
grow is usually the investment. In this regard, it can be seen that the annual percentage of
GFCF (that is, investment) is forecast to increase rapidly form -0.6% (2010) to 4.2% (2012).
Table 12: GDP forecast 2011-2015. GFCF forecast 2012. [Eurostat (2010)]
Countries % GDP 2011 % GDP 2012 % GFCF 2012 % GDP 2012-2015
EU-27 1.7 2.0 4.2 2.4
Belgium 1.8 2.0 2.9 2.3
Bulgaria 2.6 3.8 5.4 6.4
Czech Republic 2.3 3.1 3.7 4.4
Denmark 1.9 1.8 2.8 2.5
Germany 2.2 2.0 5.1 2.1
Estonia 4.4 3.5 6.4 5.2
Ireland 0.9 1.9 0.0 3.8
Greece -3.0 1.1 -2.6 1.1
Spain 0.7 1.7 2.7 1.7
France 1.6 1.8 3.5 2.1
Italy 1.1 1.4 3.1 1.6
Cyprus 1.5 2.2 -1.5 3.3
Latvia 3.3 4.0 15.0 6.3
Lithuania 2.8 3.2 8.5 6.4
Luxembourg 2.8 3.2 7.3 3.1
Hungary 2.8 3.2 5.5 4.5
Malta 2.0 2.2 3.3 3.0
Netherlands 1.5 1.7 4.2 3.0
Austria 1.7 2.1 2.9 2.1
Poland 3.9 4.2 9.2 4.9
Portugal -1.0 0.8 -0.4 1.5
Romania 1.5 3.8 7.3 5.7
Slovenia 1.9 2.6 4.1 2.9
Slovakia 3.0 3.9 6.4 4.6
Finland 2.9 2.3 3.0 3.5
11 Due to the higher correlation among GDP and unemployment rates (Okun’s law), similar results will be obtained using unemployment rates. But, as stated before, GDP is the variable which accounts for the major variability of office demand.

Draft Report: Economic and Market analysis
29
Sweden 3.3 2.3 4.7 2.4
United Kingdom 2.2 2.5 6.5 3.2
Notes: 1 Growth percentage of change from previous year. 2 Average growth percentage of change from previous year from 2012 to 2015.
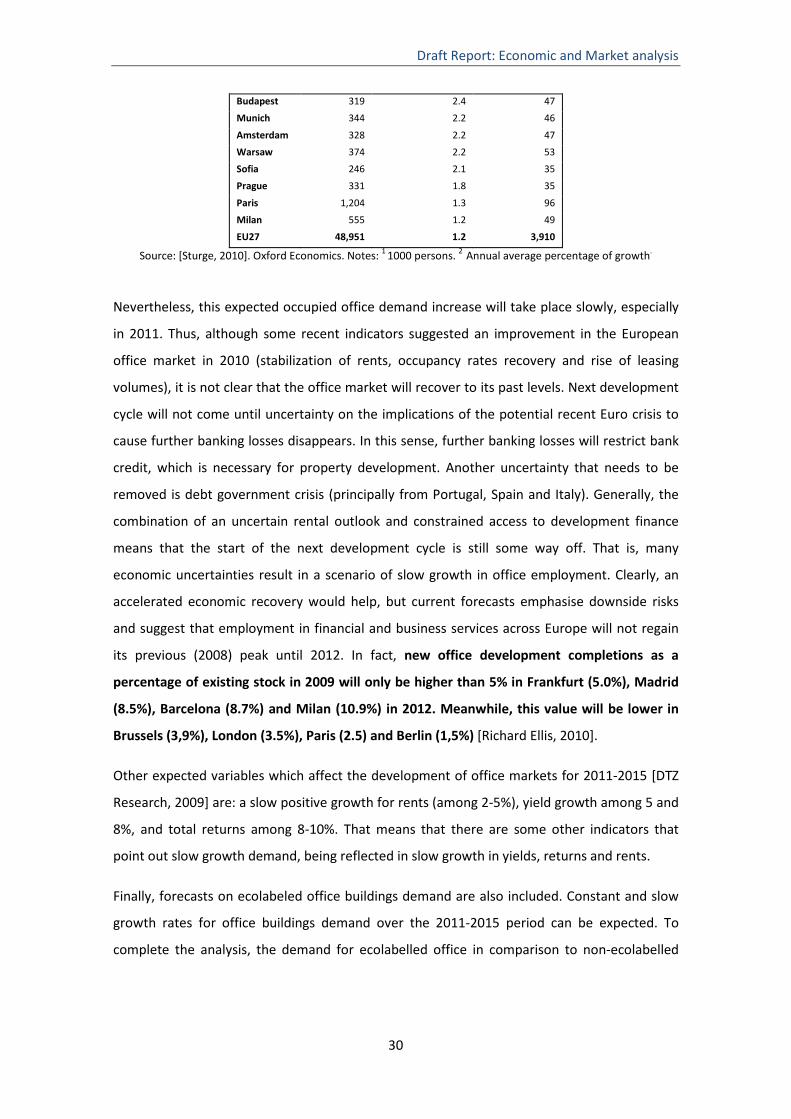
A similar office job growth can be forecasted (See Table 13) [King Sturge, 2010]. Thus,
previous evidence about economic growth will result in increased office employment by an
annual 1.2% in the EU-2712, indicating healthy fundamentals for occupier demand. Office job
growth will be higher in all forecasted cities than the EU-27 average value. In particular, the
major office job growth is forecasted in Bucharest (6.5%). Budapest, Warsaw, Sofia and Prague
will also present a significant growth. In East Europe, structural change means that the rapid
GDP growth has not always been translated into office jobs and consequently these cities still
have a higher office job growth potential: the highest office centre growth in the next decade
is expected to take place in Bucharest, albeit from a very low base. This expansion is mainly
driven by the strong growth in the underdeveloped business services sector.
Some traditional big business economic centres will also experience a significant office job
growth. In this way, London is the second fastest growing city and by far the largest creator of
office jobs. But Frankfurt, Paris, Amsterdam, Munich and Milan are also set to expand at
healthy rates, despite sluggish national performance. In general, larger international centres in
West Europe perform well, in line with recent market evidence. In f act, growth rates in West
Europe are higher than growth rates for the rest of EU countries (see Table 12). The key is the
global reach of these markets, allowing them to rise above an uncertain domestic outlook.
These forecasts are supported by the take-up indexes forecast from the main Real Estate
Agencies reports.
Table 13: Office job forecast by 2015.
Office jobsin 20091
Office job growth2010-15 (%)2
New office jobs created 20151
Bucharest 251 6.5 109
London 1,249 2.6 212
Helsinki 206 2.6 32
Frankfurt 268 2.4 37
12 Office employment in the EU-27 fell significantly in 2009 and 2010 as the financial crisis hit hard. Usually, office job employment growth is higher compared with the average of the whole economy (that is, the higher increases and the lower decreases).
Draft Report: Economic and Market analysis
30
Budapest 319 2.4 47
Munich 344 2.2 46
Amsterdam 328 2.2 47
Warsaw 374 2.2 53
Sofia 246 2.1 35
Prague 331 1.8 35
Paris 1,204 1.3 96
Milan 555 1.2 49
EU27 48,951 1.2 3,910
Source: [Sturge, 2010]. Oxford Economics. Notes: 1 1000 persons. 2 Annual average percentage of growth.
Nevertheless, this expected occupied office demand increase will take place slowly, especially
in 2011. Thus, although some recent indicators suggested an improvement in the European
office market in 2010 (stabilization of rents, occupancy rates recovery and rise of leasing
volumes), it is not clear that the office market will recover to its past levels. Next development
cycle will not come until uncertainty on the implications of the potential recent Euro crisis to
cause further banking losses disappears. In this sense, further banking losses will restrict bank
credit, which is necessary for property development. Another uncertainty that needs to be
removed is debt government crisis (principally from Portugal, Spain and Italy). Generally, the
combination of an uncertain rental outlook and constrained access to development finance
means that the start of the next development cycle is still some way off. That is, many
economic uncertainties result in a scenario of slow growth in office employment. Clearly, an
accelerated economic recovery would help, but current forecasts emphasise downside risks
and suggest that employment in financial and business services across Europe will not regain
its previous (2008) peak until 2012. In fact, new office development completions as a
percentage of existing stock in 2009 will only be higher than 5% in Frankfurt (5.0%), Madrid
(8.5%), Barcelona (8.7%) and Milan (10.9%) in 2012. Meanwhile, this value will be lower in
Brussels (3,9%), London (3.5%), Paris (2.5) and Berlin (1,5%) [Richard Ellis, 2010].
Other expected variables which affect the development of office markets for 2011-2015 [DTZ
Research, 2009] are: a slow positive growth for rents (among 2-5%), yield growth among 5 and
8%, and total returns among 8-10%. That means that there are some other indicators that
point out slow growth demand, being reflected in slow growth in yields, returns and rents.
Finally, forecasts on ecolabeled office buildings demand are also included. Constant and slow
growth rates for office buildings demand over the 2011-2015 period can be expected. To
complete the analysis, the demand for ecolabelled office in comparison to non-ecolabelled
Draft Report: Economic and Market analysis
31
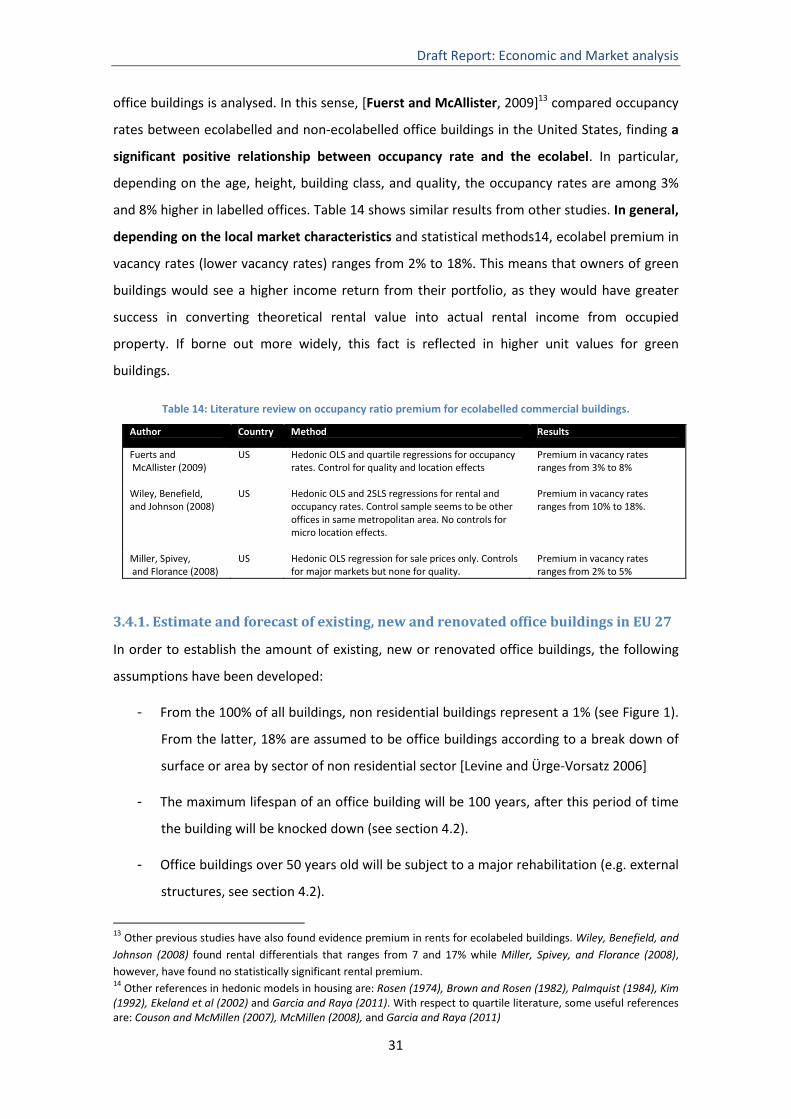
office buildings is analysed. In this sense, [Fuerst and McAllister, 2009]13 compared occupancy
rates between ecolabelled and non-ecolabelled office buildings in the United States, finding a
significant positive relationship between occupancy rate and the ecolabel. In particular,
depending on the age, height, building class, and quality, the occupancy rates are among 3%
and 8% higher in labelled offices. Table 14 shows similar results from other studies. In general,
depending on the local market characteristics and statistical methods14, ecolabel premium in
vacancy rates (lower vacancy rates) ranges from 2% to 18%. This means that owners of green
buildings would see a higher income return from their portfolio, as they would have greater
success in converting theoretical rental value into actual rental income from occupied
property. If borne out more widely, this fact is reflected in higher unit values for green
buildings.
Table 14: Literature review on occupancy ratio premium for ecolabelled commercial buildings.
Author Country Method Results
Fuerts and McAllister (2009)
US Hedonic OLS and quartile regressions for occupancy rates. Control for quality and location effects
Premium in vacancy rates ranges from 3% to 8%
Wiley, Benefield, and Johnson (2008)
US Hedonic OLS and 2SLS regressions for rental and occupancy rates. Control sample seems to be other offices in same metropolitan area. No controls for micro location effects.
Premium in vacancy rates ranges from 10% to 18%.
Miller, Spivey, and Florance (2008)
US Hedonic OLS regression for sale prices only. Controls for major markets but none for quality.
Premium in vacancy rates ranges from 2% to 5%
3.4.1. Estimate and forecast of existing, new and renovated office buildings in EU 27
In order to establish the amount of existing, new or renovated office buildings, the following
assumptions have been developed:
- From the 100% of all buildings, non residential buildings represent a 1% (see Figure 1).
From the latter, 18% are assumed to be office buildings according to a break down of
surface or area by sector of non residential sector [Levine and Ürge-Vorsatz 2006]
- The maximum lifespan of an office building will be 100 years, after this period of time
the building will be knocked down (see section 4.2).
- Office buildings over 50 years old will be subject to a major rehabilitation (e.g. external
structures, see section 4.2).
13 Other previous studies have also found evidence premium in rents for ecolabeled buildings. Wiley, Benefield, and Johnson (2008) found rental differentials that ranges from 7 and 17% while Miller, Spivey, and Florance (2008),however, have found no statistically significant rental premium. 14 Other references in hedonic models in housing are: Rosen (1974), Brown and Rosen (1982), Palmquist (1984), Kim (1992), Ekeland et al (2002) and Garcia and Raya (2011). With respect to quartile literature, some useful references are: Couson and McMillen (2007), McMillen (2008), and Garcia and Raya (2011)

Draft Report: Economic and Market analysis
32
- Knocked office buildings will be replaced by newly built office buildings in a year´s
period of time.
- Apart from the replacement of the knocked offices, a net generation of office buildings
is considered. Adopting a conservative scenario [Richard Ellis, 2010], a yearly 0.5% new
office building construction rate is assumed15.
- Two scenarios have been designed: one represents the current time being (2011) and
the other a future situation in 10 years.
Results are shown in Tables 15 and 16.
Table 15: 2011 estimate of existing, to be renovated and new office buildings
Climatic zone Existing To be renovated Newly built Total
A1 722,385 161,792 41,911 926,087
B1 6,626,946 1,208,088 876,452 8,711,486
C2 761,185 192,398 30,147 983,730
C1 5,532,054 1,599,923 961,079 8,093,055
Total 13,642,569 3,162,201 1,909,588 18,714,358
Note: All office buildings aged 41-50 suffer rehabilitation. All office buildings over 92 years are knocked down and replaced by the same number of new ones in the same year.
Table 16: Forecast of 2021 existing, to be renovated and new office buildings
Climatic zone Existing To be renovated Newly built Total
A1 654,549 220,391 97,451 972,392
B1 6,534,632 1,642,073 970,355 9,147,060
C2 706,673 241,196 85,047 1,032,917
C1 6,076,562 1,665,568 755,578 8,497,708
Total 13,972,416 3,769,229 1,908,432 19,650,076
Note: All office buildings aged 41-50 suffer rehabilitation, 50% of the office buildings aged 76-102 are knocked down and the rest remain as existing, New office buildings from the 2011 scenario are included as existing in the 2021 scenario, New office buildings are calculated from the knocked down office buildings (50% of the office buildings aged 76-102) and a yearly increase of 0.5% in relation to the 2011 stock.
15 Based on Berlin´s office development completion for the three year´s period of time.
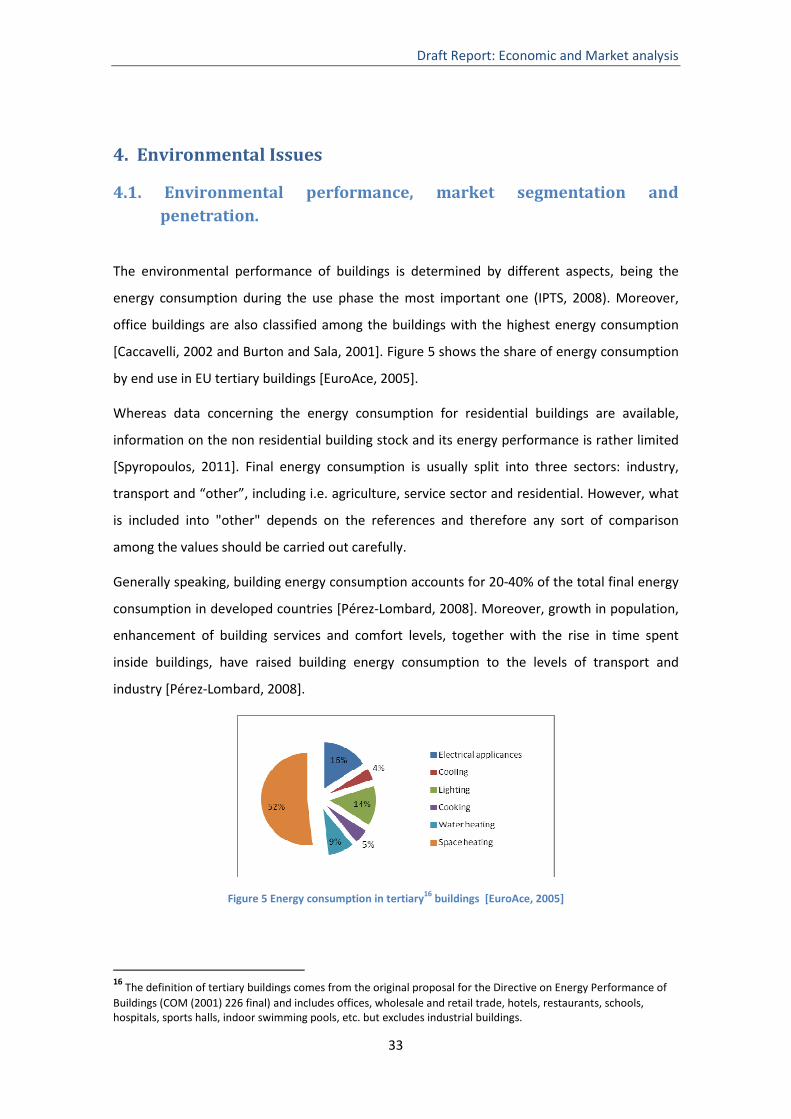
Draft Report: Economic and Market analysis
33
4. Environmental Issues
4.1. Environmental performance, market segmentation and penetration.
The environmental performance of buildings is determined by different aspects, being the
energy consumption during the use phase the most important one (IPTS, 2008). Moreover,
office buildings are also classified among the buildings with the highest energy consumption
[Caccavelli, 2002 and Burton and Sala, 2001]. Figure 5 shows the share of energy consumption
by end use in EU tertiary buildings [EuroAce, 2005].
Whereas data concerning the energy consumption for residential buildings are available,
information on the non residential building stock and its energy performance is rather limited
[Spyropoulos, 2011]. Final energy consumption is usually split into three sectors: industry,
transport and “other”, including i.e. agriculture, service sector and residential. However, what
is included into "other" depends on the references and therefore any sort of comparison
among the values should be carried out carefully.
Generally speaking, building energy consumption accounts for 20-40% of the total final energy
consumption in developed countries [Pérez-Lombard, 2008]. Moreover, growth in population,
enhancement of building services and comfort levels, together with the rise in time spent
inside buildings, have raised building energy consumption to the levels of transport and
industry [Pérez-Lombard, 2008].
Figure 5 Energy consumption in tertiary16 buildings [EuroAce, 2005]
16 The definition of tertiary buildings comes from the original proposal for the Directive on Energy Performance of Buildings (COM (2001) 226 final) and includes offices, wholesale and retail trade, hotels, restaurants, schools, hospitals, sports halls, indoor swimming pools, etc. but excludes industrial buildings.

Draft Report: Economic and Market analysis
34
Annual energy consumption in European office buildings varies from 100 to 1000 kWh/m2 of
conditioned floor space, depending on their location, construction, HVAC (heating, ventilation
and air-conditioning) systems, lighting installations, use and type of office equipment,
operating schedules, etc [Caccavelli, 2002]. More in detail, Table 17 shows energy
consumption in offices by end use [Pérez-Lombard, 2008] (based on data from EIA, BRE and
IDAE)17.
Table 17: Energy consumption in offices by end use
Energy end uses USA (%) UK (%) Spain (%) HVAC 48 55 52
Lighting 22 17 33
Equipment (appliances) 13 5 10
DHW18 4 10 -
Food preparation 1 5 -
Refrigeration 3 5 -
Others 10 4 5
Energy consumption during the use phase also represents an important economic cost in the
building life cycle. The energy costs of an urban office building in 2008 in the USA range from
15% to 25% of operating expenses [Ciochetti & McGowan, 2010]. This range is lower for office
buildings from the 1990´s vintage with costs averaging between 15% and 17% of total
operating expenses (excluding real estate taxes), while those buildings from the 1970´s
averaged 22% to 26%. Investment in energy efficiency improvements can increase net income
by 2%-3%, or even more considering the upward trend of energy prices [Ciochetti & McGowan,
2010].
4.1.1. Market penetration
Some relevant information related to the market penetration of buildings with an improved
environmental performance is:
- A survey carried out by the European Energy Network (EnR) in 2007 to review the status
and progress of the implementation of the EPBD [EPBD, 2002], showed that “energy
performance requirements are more widespread in the residential and public sector than
in the commercial sector, being stronger in new buildings than those covering renovations
17 EIA: Energy Information Administration, Commercial Buildings Energy Consumption Survey (CBECS), U.S. Department of Energy, 2003. BRE: Best Practice Programme Energy Consumption Guide 19, Energy use in offices, Carbon Trust, December 2000. IDAE: Instituto para la Diversificación y el Ahorro Energético, Eficiencia Energética y Energías Renovables (nº8), 2006. 18 Domestic Hot Water
Draft Report: Economic and Market analysis
35
of existing buildings” [EnR, 2008]. The EnR survey focused on those building sectors which
present the highest energy saving potential in all EU Member States: residential,
commercial19 and public buildings.
- In their investigation about the effects of the LEED program [LEED] for new constructions
(LEED-NC) and exiting buildings (LEED-EB) in the US market of office buildings, Ciochetti &
McGowan concluded that owner-occupiers were the early adopters of LEED-NC and LEED-
EB, since they were aware of the long term inherent benefits of the energy efficiency
improvements. Moreover, energy improvements triggered “higher employee productivity,
retention and recruitment, lower absenteeism, and lower operation costs”. However, the
authors pointed out that many of the new applicants for LEED-EB are investor-owners due
to, among other reasons:
− the threat of new green construction to compete with newly created stock,
− green is a new amenity (a new seal of approval that sets their buildings apart
from the rest),
− tenant demand for more energy efficient space20,
− investor demand for sustainability and responding to climate change.
- Finally, Ciochetti & McGowan analyzed the return on investment while carrying out energy
efficient improvements on six office buildings certified with LEED. Their initial research
suggested that “investment in these projects produce sufficient return on investment,
increase the predictability of energy consumption, and add value by decreasing operation
costs” [Ciochetti, 2010].
- In 2005, EuroAce [AuroAce, 2005] conducted a survey with the aim of finding out the
concerns of MS regarding very low energy and passive buildings among the
representatives from EU-27 plus Croatia, Norway, and Switzerland. The survey addressed
buildings in all sectors: residential, services (commercial and public) and industrial. One of
the main conclusions was that one way of promoting very low energy buildings is by direct
or indirect actions that make these buildings more attractive. The most popular measures
to promote low energy buildings are loans with low interest rates by means of either
19 Commercial buildings include all those uses which are not related to public or residential ones, that is: offices (private), education buildings (private), hotels and restaurants, and wholesale and retail trade services buildings. 20 These tenants tend to be companies that place a very high value on the recruitment and retention of their employees and that also see the importance of being able to point to a healthy and sustainable work environment [Ciochetti, 2010].

Draft Report: Economic and Market analysis
36
official subsidies or via private investment organisations and lower taxes or the
introduction of CO2 taxes. Furthermore, mandatory certification schemes are expected to
promote these buildings by introducing grades restrictions to buildings without very high
energy performance [Engelund, 2008].
- The main conclusion of the IMPRO-Building was that “the current situation of the
European residential buildings stock in terms of environmental performance is far from the
currently discussed low-energy standards and there lies a tremendous potential for
improvements” [IMPRO, 2008]. This conclusion can be tentatively extrapolated to office
buildings in general.
- The overall conclusion of Real Estate Research on the Greening of U.S. Investment Real
Estate is that “green building is fundamentally altering real estate market dynamics – the
nature of product demanded by tenants, constructed by developers, required by
governments and favored by capital providers” `[Nelson, 2007].
- In relation to the existing Ecolabel for office buildings in Catalunya (Distintiu de Garantia
de Qualitat Ambiental) it can be highlighted that since its establishment between 2005 and
2006 only 3 office buildings have been awarded with the ecolabel.
Studies undertaken in the US market office buildings [Ciochetti, 2010] demonstrate that
owners and occupiers of the offices were the early adopters of ecolabelling systems. This
trend, however, seems to be shifting towards investors-owners due to the associated return
on investment in an increasingly competitive “green” market for offices. The construction of
green buildings is also altering Real State market dynamics [Nelson, 2007], providing the base
case for the development of criteria for an office building ecolabel.
4.2. Average duration of the economic life-cycle of buildings
The working life of a product is defined by EC as “the period of time during which the
performance of a product will be maintained at a level that enables a properly designed and
executed work to fulfill the Essential Requirements (i.e. the essential characteristics of a
product meet or exceed minimum acceptable values, without incurring major costs for repair
or replacement)” [EC, 2004].
As Rimsjö points out “the time of use, or the service life, is of central interest for the outcome
of the calculations of LCA and LCC”. The forecasting of the service life of building components
Draft Report: Economic and Market analysis
37
allows estimating the timing and nature of the maintenance operations as well as the needs
for replacement of components [Rimsjö, 2003].
However, the duration of the economic life-cycle of a product, i.e. its service life or working
life, is difficult to estimate. A clear distinction has to be made between the “assumed” and the
“actual” economically reasonable working life for a product. The latter depends on many
factors beyond the control of the producer, such as design, location of use (exposure),
installation, use and maintenance [EC, 2004]. Moreover, the building components may get
obsolete due to changes in technical, economical, functional or aesthetical requirements
before its technical life is ended [Rimsjö, 2003].
The ISO 15686-8 establishes a method to estimate the service life of a product using the
reference service life (RSL) data of components or products as a starting point. In order to
calculate the estimated service life (ESL) of a product, the RSL needs to be modified by taking
into account the in-use conditions of the product, as for example: the exposure of the product
to indoor or outdoor agents of degradations and their severity, the maintenance level, etc.
[ISO 15686-8].
A design working life of 50 years for all type of building structures is indicated by EN 1990 (EC,
2002). The EPBD recast 2010 states that each MS should determine the estimated economic
lifecycle of a building or building element, taking into account current practices and experience
in defining typical economic lifecycles.
Another study focused on a sample of 8,182 office buildings for the US [Eichholtz, et al, 2009].
In this sample, the mean age is reported as 49.44 years and the standard deviation of 32.5
years. Looking at the statistic distribution, 53% of the office buildings are over 40 years old.
This percentage is similar to the EU share of non-residential buildings above 40 years (see
Table 3). Moreover, Ball et all found a similar share of office buildings over 40 years [Ball,
2003]. Thus, assuming a normal distribution for the office building age with a mean age of 45
years and a standard deviation of 30 years21, the maximum age of an office building in EU is
103.8 years, with 95% of probability.
Finally, a study of 24,479 office buildings in 643 submarkets in 81 metropolitan areas in US,
provides information on the “years from the last refurbishment” [Fuerst and McAllister, 2009].
The mean of this variable is 28.35 years with a standard deviation of 27.45 years. Considering a
normal distribution, the probability that an office building would be renovated after 50 years
is 78.23%. Similar results were reported by [Eichholtz et al, 2009].
21 The US mean and standard deviation has been reduced in order to estimated EU values.

Draft Report: Economic and Market analysis
38
4.2.1. Assumed working life of products and systems
The working life of construction products according to European guidelines and standards are
indicated in Table 18.
Table18: Assumed working life of construction products. Source: [EOTA, 1999] Assumed working life of
works (years) Working life of construction products to be assumed in ETAGs, ETAs
and HENs (years) Category Years Category
Repairable or easy replaceable
Repairable or replaceable with some more efforts
Lifelong2
Short 10 101 10 10 Medium 25 101 25 25 Normal 50 101 25 50 Long 100 101 25 100 1 In exceptional and justified cases, e.g. for certain repair products, a working life of 3 to 6 years may be envisaged (when agreed by EOTA TB or CEN respectively). 2 When not repairable or replaceable “easily” or “with some more efforts”.
ISO 15686-1 reference suggests minimum design lives of components for particular design lives
of buildings, based on their accessibility for maintenance (see Table 19).
Table 19: Minimum design life of components. [Source: ISO 15686-1] Design life of building Inaccessible or
structural components Components where
replacement is expensive or difficult
Major replaceable components
Building services
Unlimited Unlimited 100 40 25 150 150 100 40 25 100 100 100 40 25 60 60 60 40 25 25 25 25 25 25 15 15 15 15 15 10 10 10 10 10
EN 1990 [EC, 2002] also indicates the duration of design working life for particular structures of
all buildings:
Table 20: Design working life of components. Source: [EC, 2002] Design working life (years) Examples 10 Temporary structures 10- 25 Replaceable structural parts 15- 30 Agricultural and similar structures 50 Building structures and other common structures 100 Monumental buildings, bridges, other structures
The lifespan of components in all kind of buildings varies as follows:
Table 21:Design working life of components. Source: [Yang and Pen, 2001] Design working life (years) Examples
1-3 Information technology
5 Interior partition
10 Electrical systems
25 Mechanical systems
50 Skin (exterior)
100 Structure
Draft Report: Economic and Market analysis
39
Several studies undertaken on the energy performance of office buildings assume a service life
of 50 years [Kofoworola and Gheewala, 2009; Juan, Gao and Wang, 2010]. Taking into account
the variation amongst sources and in line with the information reported previously, the
maximum lifespan of an office building would be 100 years, after which period the building
will be knocked down. After 50 years the external structures of the office building will be
renovated. A periodic renovation of replaceable structural parts such as windows and
toilettes would happen every 25 years and other temporary structures such as internal
partitions would be renovated every 10 years, [ EN 1990].
5. Public Activity
In the case of ecolabel activity, public activity is a crucial element to be considered. In fact, in
economics, the concept of externality22 justifies that most of the environmental activities will
be developed by governments. The reason is that enterprises cannot grab many of the benefits
of such activities. In this sense, regulators should set incentives to internalise externalities
ideally through integrating them into market activities. For example, in 2007 while industry
environment expenditure represented 0.5% of EU-27 GDP, government environment
expenditure represented 0.7% [Eurostat, 2010]. The importance of the government activity to
promote ecolabelled office buildings can also be justified [OTB Research Institute for Housing,
Urban and Mobility Study, 2008]. This report provides information about the percentage of
office buildings that belong to the government and municipalities for some EU-27 countries
e.g, The Netherlands (3%), Germany (20%), France (30%), Austria (17%) and Finland (11%)23.
This section seeks to examine government activity. Firstly, the size of the EU-27 public
expenditure as well as the importance of environmental and construction expenditure in EU-
27 government budget is established. In this context, the evolution of the weight of these two
aggregates within EU-27 government expenditure will be analysed. Secondly, the recent
evolution of EU-27 national budget (that is, deficit and debt information) in order to obtain
next future trends will be analysed.
22 An externality occurs in economics when a decision (for example, to pollute the atmosphere) causes costs or benefits to individuals or groups other than the person making the decision. In other words, the decision-maker does not bear all of the costs or reap all of the gains from his or her action. 23 Some useful literature on the effects of public activity on housing prices are: Linneman and Voith (1982), Man and Bell (1996), Garcia et al (2010).
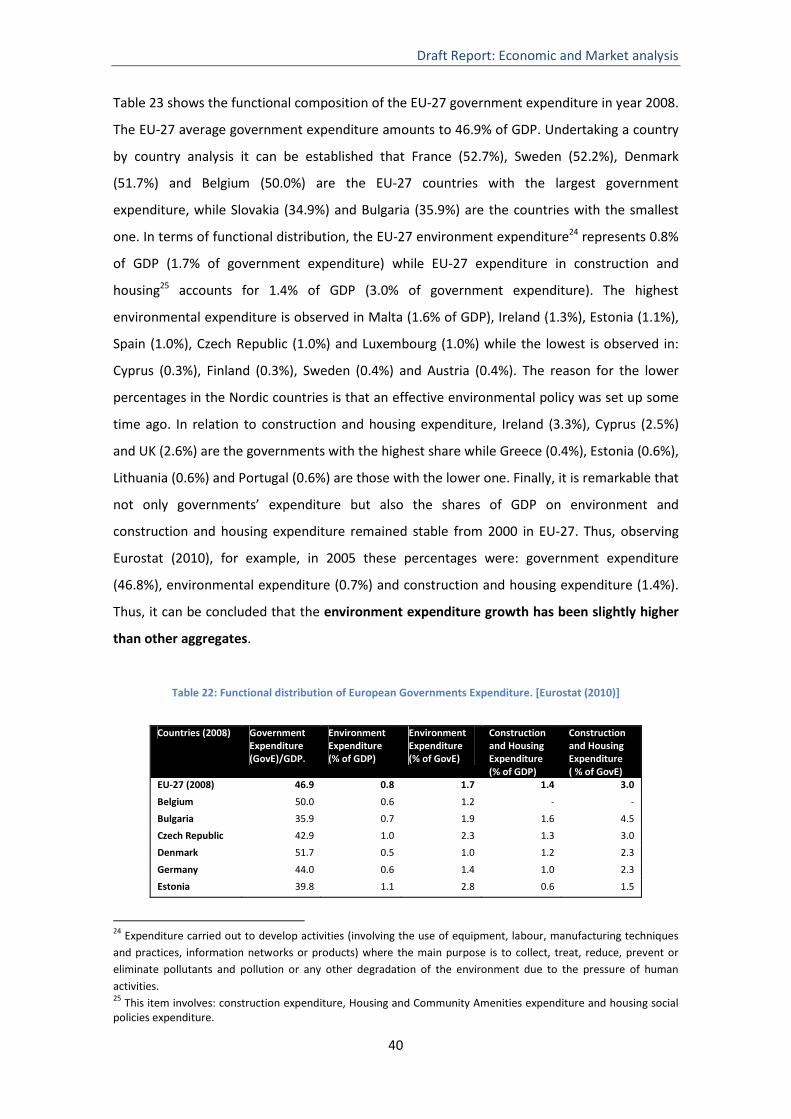
Draft Report: Economic and Market analysis
40
Table 23 shows the functional composition of the EU-27 government expenditure in year 2008.
The EU-27 average government expenditure amounts to 46.9% of GDP. Undertaking a country
by country analysis it can be established that France (52.7%), Sweden (52.2%), Denmark
(51.7%) and Belgium (50.0%) are the EU-27 countries with the largest government
expenditure, while Slovakia (34.9%) and Bulgaria (35.9%) are the countries with the smallest
one. In terms of functional distribution, the EU-27 environment expenditure24 represents 0.8%
of GDP (1.7% of government expenditure) while EU-27 expenditure in construction and
housing25 accounts for 1.4% of GDP (3.0% of government expenditure). The highest
environmental expenditure is observed in Malta (1.6% of GDP), Ireland (1.3%), Estonia (1.1%),
Spain (1.0%), Czech Republic (1.0%) and Luxembourg (1.0%) while the lowest is observed in:
Cyprus (0.3%), Finland (0.3%), Sweden (0.4%) and Austria (0.4%). The reason for the lower
percentages in the Nordic countries is that an effective environmental policy was set up some
time ago. In relation to construction and housing expenditure, Ireland (3.3%), Cyprus (2.5%)
and UK (2.6%) are the governments with the highest share while Greece (0.4%), Estonia (0.6%),
Lithuania (0.6%) and Portugal (0.6%) are those with the lower one. Finally, it is remarkable that
not only governments’ expenditure but also the shares of GDP on environment and
construction and housing expenditure remained stable from 2000 in EU-27. Thus, observing
Eurostat (2010), for example, in 2005 these percentages were: government expenditure
(46.8%), environmental expenditure (0.7%) and construction and housing expenditure (1.4%).
Thus, it can be concluded that the environment expenditure growth has been slightly higher
than other aggregates.
Table 22: Functional distribution of European Governments Expenditure. [Eurostat (2010)]
24 Expenditure carried out to develop activities (involving the use of equipment, labour, manufacturing techniques and practices, information networks or products) where the main purpose is to collect, treat, reduce, prevent or eliminate pollutants and pollution or any other degradation of the environment due to the pressure of human activities. 25 This item involves: construction expenditure, Housing and Community Amenities expenditure and housing social policies expenditure.
Countries (2008) Government Expenditure (GovE)/GDP.
Environment Expenditure (% of GDP)
Environment Expenditure (% of GovE)
Construction and Housing Expenditure (% of GDP)
Construction and Housing Expenditure ( % of GovE)
EU-27 (2008) 46.9 0.8 1.7 1.4 3.0
Belgium 50.0 0.6 1.2 - -
Bulgaria 35.9 0.7 1.9 1.6 4.5
Czech Republic 42.9 1.0 2.3 1.3 3.0
Denmark 51.7 0.5 1.0 1.2 2.3
Germany 44.0 0.6 1.4 1.0 2.3
Estonia 39.8 1.1 2.8 0.6 1.5

Draft Report: Economic and Market analysis
41
September 2008 was the beginning of the current financial crisis. In this sense, percentages
shown in Table 24 are valid to determine the importance of the environment and construction
sectors in the European government budgets. The financial crisis forced many European
governments to develop expansionary fiscal policies to smooth the effects of the crisis in terms
of unemployment. Also, several MS governments came to the rescue of the financial
institutions most affected by subprime assets and rising delinquencies. Thus, government
annual deficit in EU-27 grew from 0.9% in 2007 to 6.8% in 2009 . As a consequence, EU-27
government debt grew from 58.8% in 2007 to 74.0% in 2009. In 2007 EU-27 as a whole (except
Greece and Hungary), accomplished the Stability and Growth Pact which compromises
member states to keep the annual deficit budget under a 3% of the GDP and the total national
debt under 60% of GDP. In 2009, however, EU-27 did not accomplish these criteria and only
few member states (e.g. Germany, Estonia, Luxembourg, Finland and Sweden in terms of
deficit criteria) accomplished it individually. In 2009, the countries with the highest
government debt were Greece (126.8%), Italy (116.0%) and Belgium (96.8%) while the
countries experiencing the highest annual government deficit were: Greece (15.4%), Ireland
(14.4%), United Kingdom (11.4%), Spain (11.1%) and Latvia (10.2%).
In this sense, 2010 was the year of EU’s debt crisis. The European debt crisis initially began in
Greece, who adopted the Euro in 2001 despite being in violation of a requirement establishing
that a country’s annual deficit should be less than 3% of GDP before entering the Euro. Greece
had a deficit well above 3% of GDP in 2001. Goldman Sachs and other large banks lent U.S.
dollars to Greece in 2001 when their debt was manageable and agreed to be repaid in Euros so
Ireland 42.5 1.3 3.1 3.3 7.8
Greece 49.0 0.6 1.2 0.4 0.8
Spain 41.1 1.0 2.4 1.3 3.2
France 52.7 0.9 1.7 - -
Italy 48.9 0.8 1.6 1.2 2.5
Cyprus 42.5 0.3 0.7 2.5 5.9
Latvia 38.8 0.9 2.3 1.5 3.9
Lithuania 37.3 0.9 2.4 0.6 1.6
Luxembourg 36.9 1.0 2.7 0.7 1.9
Hungary 48.8 0.8 1.6 1.8 3.7
Malta 44.1 1.6 3.6 1.9 4.3
Netherlands 45.9 0.8 1.7 - -
Austria 48.7 0.4 0.8 0.6 1.2
Poland 43.2 0.6 1.4 1.4 3.2
Portugal 44.5 0.5 1.1 0.6 1.3
Romania 37.6 0.5 1.3 - -
Slovenia 44.0 0.8 1.8 0.8 1.8
Slovakia 34.9 0.6 1.7 - -
Finland 49.3 0.3 0.6 0.7 1.4
Sweden 52.2 0.4 0.8 1.9 3.6
United Kingdom 47.4 0.9 1.9 2.6 5.5

Draft Report: Economic and Market analysis
42
it could be classified as a currency trade as opposed to debt. They disguised the debt so the EU
would think Greece was below the 3% annual debt to GDP threshold, essentially making it
possible for a debt ridden country to legally circumvent safeguards against the instability of
the EU with sophisticated financing techniques. When Greece couldn’t refinance the €11
billion they owed to other European nations in May, much like the subprime borrowers of
2008, the entire European system was on the verge of breaking down. The solution adopted by
The European Central Bank was to create even more debt to finance the bad decisions of
broke countries and printed money to stimulate their economies.
In the case of Ireland the problem came from the housing crisis. Irish banks had estimated
losses that amounted 50% of the Irish GDP after housing prices dropped by 36% from their
2006 highs. With liquidity needs constraining their ability to lend money to a struggling
economy, it became clear that foreign assistance was required. This came after the
government had reportedly lent these institutions €120 billion, which impacted the status of
their sovereign debt. During 2010, many concerns about rising European government deficits
and debt levels, led to a crisis of confidence as well as the widening of bond yield spreads and
risk insurance on credit default swaps between these countries and other EU members, most
importantly Germany. As a solution, up to date, all these countries have developed intensive
fiscal austerity policies and EU's Finance Ministers have approved a comprehensive rescue
package worth almost a trillion dollars aimed at ensuring financial stability across Europe by
creating the European Financial Stability Facility.
To sum up, even though the importance (and slightly growth) of environmental expenditure in
EU-27 budget, next years are expected to be difficult to European governments and this
situation will influence environment expenditure assignments. Only when economic recovery
occurs and the crisis of confidence is over, the amount of money spent in environmental
policy will be the one observed in the years before the financial crisis.
Table 23: Government’s debt and deficit in EU-27. Source: [Eurostat, 2010]
Government Deficit (% of GDP) Government Debt (% of GDP)
Countries 2007 2008 2009 2007 2008 2009
EU27 -0.9 -2.3 -6.8 58.8 61.8 74.0
Belgium -0.3 -1.3 -6.0 84.2 89.6 96.2
Bulgaria 1.1 1.7 -4.7 17.2 13.7 14.7
Czech Republic -0.7 -2.7 -5.8 29.0 30.0 35.3
Denmark 4.8 3.4 -2.7 27.4 34.2 41.4
Germany 0.3 0.1 -3.0 64.9 66.3 73.4
Estonia 2.5 -2.8 -1.7 3.7 4.6 7.2
Ireland 0.0 -7.3 -14.4 25.0 44.3 65.5
Greece -6.4 -9.4 -15.4 105.0 110.3 126.8

Draft Report: Economic and Market analysis
43
Spain 1.9 -4.2 -11.1 36.1 39.8 53.2
France -2.7 -3.3 -7.5 63.8 67.5 78.1
Italy -1.5 -2.7 -5.3 103.6 106.3 116.0
Cyprus 3.4 0.9 -6.0 58.3 48.3 58.0
Latvia -0.3 -4.2 -10.2 9.0 19.7 36.7
Lithuania -1.0 -3.3 -9.2 16.9 15.6 29.5
Luxembourg 3.7 3.0 -0.7 6.7 13.6 14.5
Hungary -5.0 -3.7 -4.4 66.1 72.3 78.4
Malta -2.3 -4.8 -3.8 61.7 63.1 68.6
Netherlands 0.2 0.6 -5.4 45.3 58.2 60.8
Austria -0.4 -0.5 -3.5 59.3 62.5 67.5
Poland -1.9 -3.7 -7.2 45.0 47.1 50.9
Portugal -2.8 -2.9 -9.3 62.7 65.3 76.1
Romania -2.6 -5.7 -8.6 12.6 13.4 23.9
Slovenia 0.0 -1.8 -5.8 23.4 22.5 35.4
Slovakia -1.8 -2.1 -7.9 29.6 27.8 35.4
Finland 5.2 4.2 -2.5 35.2 34.1 43.8
Sweden 3.6 2.2 -0.9 40.0 38.2 41.9
United Kingdom -2.7 -5.0 -11.4 44.5 52.1 68.2
6. Conclusions
In relation to the importance of the office building with respect to overall buildings and their classification:
• The vast majority of buildings in the EU are residential (99%). Office buildings are a
part of the remaining 1% of non-residential buildings.
• Office buildings are concentrated in: moderate climatic zone (4,382.2 million of m2),
large office buildings (4,278.7 million of m2) and buildings erected before 1975
(6,277.2 million of m2).
In relation to recent office buildings market indicators and their relationship with general
economic indicators:
• Office rents and vacancy ratios can be explained by changes in each country´s
contemporaneous national GDP -basically-, inflation and the unemployment rate.
• Economic indicators show a scenario of clear economic recovery from the bust
experienced in 2009 (since GDP growth is positive and higher in 2010 with respect to
2009), which can be interpreted as a sign of short term recovery of office building
demand. However, investment component-which is the component more related to
the office building market- is still decreasing for the EU-27 (-0.6%), which can be
interpreted as an absence of economic recovery consolidation. That is, recovery is

Draft Report: Economic and Market analysis
44
unstable at this moment. The absence of a clear inflationary pattern (although it
seems that EU-27 has avoided deflation risk) and higher and difficult to reduce
unemployment rates, reinforce this point. Obviously, a higher dispersion is found
when individual countries are analyzed . Thus, Germany, Luxembourg, Malta, Poland,
Slovakia, Finland, Sweden and the United Kingdom show a stable economic recovery
(that is a higher probability of demand for office buildings), while Portugal, Italy,
Greece, Spain, Ireland, Bulgaria, Romania, Latvia, Lithuania, Hungary and Slovenia
show recession or stagnation scenario (that is a lower probability of demand for office
buildings).
• Office Market indicators from cities from up to 17 of the EU-27 countries show rising
availability (higher than 10%), weak demand and widespread rental declines (18%)
across Europe since 2008 for office buildings.
• Although quantitatively is less important, the non-residential building sector (and the
office building as well) shares certain trends and characteristics with the overall
building sector. In addition, knowing future trends for the overall building/construction
sector could provide us some clues in order to establish future trends for the office
building sector (in both cases shares its relationship with the evolution of the overall
economy, for example). The analyses characterises the building sector in the UE as an
important (especially for some countries) but not very productive sector (with the
exception of some East European countries in which this sector is underdeveloped).
The office building sector shares these characteristics, although some innovations such
as an ecolabel can be seen as a way to modernise, renovate or even increase the
efficiency of the sector.
• In terms of short-term indicators for the construction sector, the presented
information describes a sector with lower and decreasing demand (and, therefore
wages). In this sense, a continuous adjustment to the construction sector is expected
for years 2011 and 2012 with an eventual recovery in year 2013 because, as
forecasted, 2011 and 2012 will be the years for the overall economic recovery. The
construction sector is a procyclic sector with some lag with respect to overall
economy, so the recovery of the construction sector is expected to take place later on.
In terms of the office building sector, this fact implies that new office building
construction is also expected for 2013. That is, this lag in the construction sector in
relation to overall activity, is expected to be lower for the office building sector. Thus,

Draft Report: Economic and Market analysis
45
and due to its close relationship to economic evolution, it can be expected that the
reduction of availability of space will start in in 2011 and 2012.
• Finally, in terms of short-term indicators for, specifically, the office building sector, the
important decrease in the number of permits in the office building sector in 2009
(32.41%) can be observed. This decreasing pattern is particularly significant in:
Lithuania (74.38%), Slovakia (50.81%), Spain (46.22%) and Bulgaria (40.89%). It is
expected that during 2010-2011 the scenario for building permits will change from
decline accelerating to decline slowing and, for some countries, a growth accelerating
scenario will start.
In relation to the forecast for office building demand, in particular, ecolabelled office
building demand:
• Economic growth in the EU-27 will accelerate over the 2010-2015 period. Thus, from
the forecasted 1.7% growth in GDP for EU-27 economies in 2011, a 2.4% GDP annual
growth, on average, will be reached during 2012-2015. Usually, one of the first
components of GDP to recover when the economy begins to grow is investment. In
this regard, it can be seen that the annual percentage of Growth Gross Fixed Capital
formation increases rapidly form -0.6% (2010) to 4.2% (2012).
• Previous evidence about economic growth will result in increased office employment
by an annual 1.2% in the EU-27. Nevertheless, this expected increase for occupied
office demand, will be slow, especially in 2011, so the office market will not recover its
past levels immediately. In terms of other variables which affect office markets, DTZ
Research expects for 2011-2015: slow positive growth for rents (among 2-5%), yield
growth among 5 and 8%, and total returns among 8-10% [Dtz, 2009].
• Demand for ecolabelled office buildings is likely to be higher than demand for non-
ecolabelled office buildings. Fuerst and McAllister found a significant positive
relationship between occupancy rate and the ecolabel [Fuerst & McAllister, 2009].
Depending on local market characteristics and methods, ecolabel premium in vacancy
rates ranges from 2% to 18%. This would imply that owners of green buildings would
see a higher income return from their portfolio, as they would have greater success in
converting theoretical rental value into actual rental income from occupied property.
In relation to public activity importance and trends:

Draft Report: Economic and Market analysis
46
• Public activity is a crucial element to be considered. In fact, in economics, the concept
of externality justifies that most of the environmental activities will be developed by
governments. The percentage of office buildings from the government and
municipalities for some EU-27 countries e.g: The Netherlands (3%), Germany (20%),
France (30%), Austria (17%) and Finland (11%).
• The EU-27 average government expenditure size was 46.9% of GDP. In terms of
functional distribution, the EU-27 environment expenditure represents 0.8% of GDP
(1.7% of government expenditure) while EU-27 expenditure in construction and
housing accounts for 1.4% of GDP (3.0% of government expenditure). Finally, not only
governments’ expenditure but also percentages of GDP on environment and
construction and housing expenditure have remained stable from 2000 in EU-27,
although, environment expenditure growth has been slightly higher than other
aggregates.
• In this sense, one can also argue that often public authorities try to fight economic
downturns through public investments, which e.g. can be public construction
procurement. However, the possibilities to do so depend on budgets constraints.
• Financial crisis forced many European governments to develop expansionary fiscal
policies in order to smooth the effects of the crisis in terms of unemployment. Thus,
government annual deficit in EU-27 has grown from 0.9% in 2007 to 6.8% of GDP in
2009. As a consequence, EU-27 government debt has grown from 58.8% in 2007 to
74.0% in 2009. In 2009, EU-27 did not accomplish the Stability and Growth Pact and
only few member states (e.g. Germany, Estonia, Luxembourg, Finland and Sweden in
terms of deficit criteria) accomplished it individually.
• As a result, 2010 was the year of EU’s debt crisis. Some countries have developed
intensive fiscal austerity policies and EU's Finance Ministers have approved a
comprehensive rescue package worth almost a trillion dollars aimed at ensuring
financial stability across Europe by creating the European Financial Stability Facility.
Only when economic recovery occurs and the crisis of confidence is over, the amount
of money spent in environmental policy will be the one observed in the years before
the financial crisis. So, we can expect that in next years subsidies of the governments
to promote green buildings will be reduced, since even though environmental policies
will not loose relative importance, its importance will be reduce in absolute terms.
In relation with data availability:

Draft Report: Economic and Market analysis
47
• unfortunately, there is no official data on office buildings stock in EU-27, only for few
countries some estimates have been found from different sources.
• Moreover, data on the office sector are often outdated and assembled from sector
estimates, as a result of which their statistical validity can be doubted.
• Furthermore, the comparability of data between countries may be low because
different definitions may have been used in the different countries. To sum up, office
building data is not official and is rarely harmonized between countries.
7. References
ASIEPI Project. Assessment and Improvement of the EPBD Impact (for new buildings and building renovation). Comparison of Energy Performance Requirement Levels: Possibilities and Impossibilities. Summary report. ASIEPI is supported by Intelligent Energy Europe. 31 March 2010.
Baily, Martin Neil and Okun, Arthur M. (1965): The Battle Against Unemployment and Inflation: Problems of the Modern Economy. New York: W.W. Norton & Co.(1983; 3rd revised)
Ball, M. (2003): “Is there an office replacement cycle?”, Journal of Property Research, 20: 2,173-189
Baum, A. (1991): Property Investment, Depreciation and Obsolescence, Routledge, London.
BNP Paribas Real Estate (2007-2010). European Office Market, various.
Broin. E. (2007). Energy Demands of European Buildings: A Mapping of Available Data, Indicators and Models. Thesis for the Degree of Master of Science in Industrial Ecology from the Chalmers University of Technology (Göteborg, Sweden).
Brown, J.N. and Rosen, H.S. (1982). On the estimation of structural hedonic price models. Econometrica 50, 765-768.
Burton, S. and Sala, M. Energy Efficient Office Refurbishment, Earthscan, London (2001)
Caccavelli D, Gugerli H. TOBUS – a European diagnosis and decision-making tool for office building upgrading. Energy and Buildings 34 (2002) 113-119.
Ciochetti B, McGowan M. (2010). Energy Efficiency Improvements: Do They Pay? Journal of Sustainable Real Estate, vol. 2, No. 1-2010.
Couson, N. and McMillen, D. (2007). The dynamics of intraurban quantile house price indexes. Urban Studies 44: 8, 1517-1537.

Draft Report: Economic and Market analysis
48
De Wit, I. and van Dijk, R. (2003). The Global Determinants of Direct Office Real Estate Returns. Journal of Real Estate Finance and Economics 26, 27-45.
Dtz Research (2009-2010). Office Market. Pan European Up-date, various.
Eekeland, I., Heckman, J.J. and Nesheim, L.P. (2002). Identifying hedonic models. The American Economic Review 92, 304-309.
Eichholtz, P., N. Kok, and J.M. Quigley. “Doing Well by Doing Good? Green Office Buildings” Working paper, Fischer Center for Real Estate and Urban Economics, January, 2009.
Engelund K, Wittchen K and EuroACE. European national strategies to move towards very low energy buildings. Danish Building Research Institute, Aalborg University. SBi 2008:07. 2008.
EURIMA (2005a). Cost-Effective Climate Protection in the Building Stock of the New EU Member States.
EURIMA (2005b). Cost-Effective Climate Protection in the EU Building Stock.
EuroACE (The European Alliance of Companies for Energy Efficiency in Buildings) (2005). Towards Energy Efficient Buildings in Europe. Final Report. June 2004, with update of annexes July 2005.
European Commission (2000). EN 1990. Eurocode: Basis of structural design.
European Commission (2004). Enterprise and Industry Directorate-General. Guidance Paper F, concerning the Construction Products Directive – 89/106/ECC. Durability and the construction products directive (Revision December 2004).
European Energy Network (EnR) (2008). Implementation of the EU Energy Performance of Buildings Directive – a snapshot report. EnR lessons learned and recommendations for the future.
EPBD 2002. DIRECTIVE 2002/91/EC OF THE EUROPEAN PARLIAMENT AND OF THE COUNCIL of 16 December 2002 on the energy performance of buildings. EPBD 2010 (recast). Directive 2010/31/EU of the European Parliament and of the Council of 19 May 2010 on the Energy Performance of Buildings (recast). Official Journal of the European Union L 153/13, 18.6.2010.
European Organisation for Technical Approvals (EOTA) (1999). Assumption of working life of construction products in Guidelines for European Technical Approval, European Technical Approvals and Harmonized Standards. Guidance Document 002.
Eurostat (2008). Wide spread in construction prices across Europe in 2007. Eurostat statistical focus
Eurostat (2010). EU-27 construction sector: From bloom to gloom. Eurostat statistical focus.
Eurostat (2010b). An analysis of building construction based on building permits statistics. Eurostat statistical focus.
Draft Report: Economic and Market analysis
49
Fuerts, F, and McAllister, P. (2009). An Investigation of the Effect of Eco-Labeling on Office Occupancy Rates. The Journal of Sustainable Real Estate 1, 49-64.
Gallimore, P. and McAllister, P. (2005). Expert Judgement in the Processes of Commercial Property Market Forecasting. Journal of Property Research 21(4), 337-360.
Garcia, J. and Raya, J. (2011). Analysis of inequality in housing prices: a quantile approach. Journal of Housing Economics (forthcoming).
Garcia, J. and Raya, J. (2011). Price and Income Elasticities of Demand for Housing Characteristics in the City of Barcelona. Regional Studies (forthcoming, published first).
Garcia, J., Montolio, D. and Raya, J. (2010). Local Public Expenditure and Housing prices. Urban Studies 47 (7), 1501-1512.
Giussani, B, Hsia, M. and Tsolacos, S. (1993) A comparative analysis of the major determinants of office rental values in Europe, Journal of Property Investment and Valuation 11, 157-172.
Guilkey, D. (1999). How Good are MSA Forecasts? A Review of Major Supply- and Demand-Side Information Providers. Real Estate Finance 15, 4, 27-41.
Gva Grimley (2006). European Office Market Review.
Institute for Prospective Technological Studies (IPTS) (2008). Joint Research Centre, European Commission. Environmental Improvement Potentials of Residential Buildings (IMPRO-Building). 2008.
Institute for Prospective Technological Studies (IPTS) (2010). Joint Research Centre, European Commission. The application of the Ecolabel regulation (EC 66/2010) to buildings- Draft preliminary study Task 1 (Unpublished).
ISO 15686-1: 2000 Building and constructed assets – Service-life planning – Part 1: General principles.
ISO 15686-8: 2008 Building and constructed assets – Service-life planning – Part 8: Reference service life and service-life estimation.
Jones Lang Lasalle (2010). Pulse. The Jones Lang LaSalle Office Property Clock, various.
Juan, Y.K, Gao, P., Wang, J. 2010. A hybrid decision support system for sustainable office building renovation and energy performance improvement. Energy and Buildings, 42 (3) pp. 290-297.
Kennedy, P., Lee, K. and McAllister, P. (2007). Data Dilemmas in Forecasting European Office Market Rents. 14th Annual European Real Estate Society Conference, 27-30 June.
Kim, S. (1992). Search, hedonic prices and housing demand. The Review of Economics and Statistics, 503-508.
King Sturge (2010). European Office Property Markets 2010/2011.
Knight Frank (2010). Office report. Various.
Draft Report: Economic and Market analysis
50
Kofoworola, O.F., Gheewala, S.H. 2009. Life cycle energy assessment of a typical office building in Thailand. Energy and Buildings, 10, pp. 1076-1083.
[LEED] Leadership in Energy and Environmental Design, U.S. Green Building Council.
http://www.usgbc.org.
Levine and Ürge-Vorsatz 2006, Mitigation options for residential/commercial buildings,
http://www.ipcc-wg3.de/publications/assessment-reports/ar4/forth-assessment-review-
comments/sod/AR4-WG3-SOD-Ch06.pdf
Linneman, P. and Voith, R. (1989). Housing price functions and ownership capitalization rates. Journal of Urban Economics 30, pp.00-111.
Man, J.Y. and Bell, M.E. (1996). The impact of local sales tax on the value of owner-occupied housing, Journal of Urban Economics, 39, pp. 114-130.
McMillen, D. (2008). Changes in the distribution of house prices over time: structural characteristics, neighborhood, or coefficients? Journal of Urban Economics 64, 573-589.
Miller, N., Spivey, J. and Florance, A. (2008). Does Green Pay Off?. Journal of Real Estate Portfolio Management 14:4, 385–99
Mitchell, P. and McNamara, P. (1997). Issues in the Development and Application of Property Market Forecasting: the Investor’s Perspective. Journal of Property Finance 8, 4, 363- 376.
Muellbauer, J. and A. Murphy (1997): “Booms and Busts in the UK Housing Market”, The Economic Journal, 107, p. 1701-1727.
Nelson, A. (2007). The Greening of U.S. Investment Real Estate – Market Fundamentals, Prospects and Opportunities. Real Estate Research. Number 57, November 2007.
Nemry, F. and Uihlein, L. (2010): “Environmental Improvement Potentials of Residential Buildings (IMPRO-Building)”
Odyssee network (2007). Energy Indicators Database.
Ortalo-Magne, F.and S. Randy (1999), “Boom in, bust out: young households and the
housing price cycle” European Economic Review, 43, 4-6, 755-66.
OTB Research Institute for Housing, Urban and Mobility Study (2008). Building Renovation and Modernisation in Europe: State of the art review.
Palmquist, R.B. (1984). Estimating the demand for the characteristics of housing. Review of Economics and Statistics 64, 394-404.
Pérez-Lombard, L., Ortiz J., Pout, C. (2008). A review on buildings energy consumption information. Energy and Buildings 40 (2008) 394-398.
Pike Research (2011). Global building stock database: executive summary, Research Report.

Draft Report: Economic and Market analysis
51
Richard Ellis, CB. (2009). Who pays for green? The economics for sustainable buildings, EMEA Research.
Richard Ellis, CB. (2009-2010). Global Market view. Office Rental cycle.
Richard Ellis, CB. (2010). A new office development cycle? Not yet. EMEA View Point, July.
Rimsjö Å. (2003). Environmental Assessment of Building Products and Components in a Service Life Perspective. Licentiate thesis. KUNGL TEKNISKA HÖGSKOLAN. April, 2003.
RODRÍGUEZ, J. (2008): “La situación del mercado de la vivienda en España”, Boletín Económico del ICE 2951, 11-23.
Rosen, S. (1974). Hedonic prices and implicit markets: product differentiation in pure competition, Journal of Political Economy 1, 34-55.
Salway, F.W. (1986): The CALUS Report: Depreciation of Commercial Property, College of Estate Management, Reading.
Spyropoulos, G. N. and Balaras, C.A. (2011). Energy consumption and the potential of energy savings in Hellenic office buildings used as bank branches – A case study. Energy and Buildings 43 (2011) 770-778.
STOA; van Velsen, A.F.M., O. Stobbe, K. Blok, A. H. M. Struker, MTI and Ecofys (1998). Building regulations as a means of requiring energy saving and use of renewable energies. Scientific and technical options assessment (STOA) for European Parliament, Utrecht 1998.
United Nations, 1991. Central Product Classification
Wiley, J., Benefield, J. and Johnson, K (2008). Green Design and the Market for Commercial Office Space. Journal of Real Estate Finance and Economics.
Wilhelmson, M. (2002). Household expenditure patterns for housing attributes: a linear expenditure system with hedonic prices. Journal of Housing Economics 11, 75-93.
Yang, J. and Peng, H. 2001. Decision support to the application of intelligent building technologies, Renewable Energy 22 (1), pp. 67–77