development of genomic resources and whole- genome
TRANSCRIPT
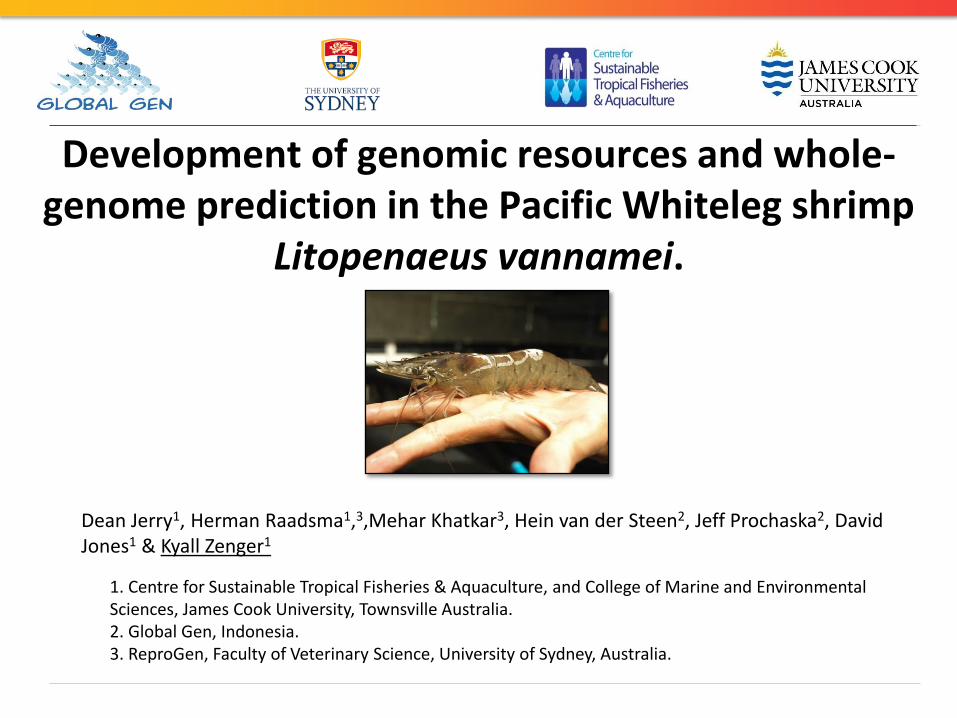
Development of genomic resources and whole-genome prediction in the Pacific Whiteleg shrimp
Litopenaeus vannamei.
Dean Jerry1, Herman Raadsma1,3,Mehar Khatkar3, Hein van der Steen2, Jeff Prochaska2, David Jones1 & Kyall Zenger1
1. Centre for Sustainable Tropical Fisheries & Aquaculture, and College of Marine and Environmental Sciences, James Cook University, Townsville Australia. 2. Global Gen, Indonesia. 3. ReproGen, Faculty of Veterinary Science, University of Sydney, Australia.
Traditional breeding programs
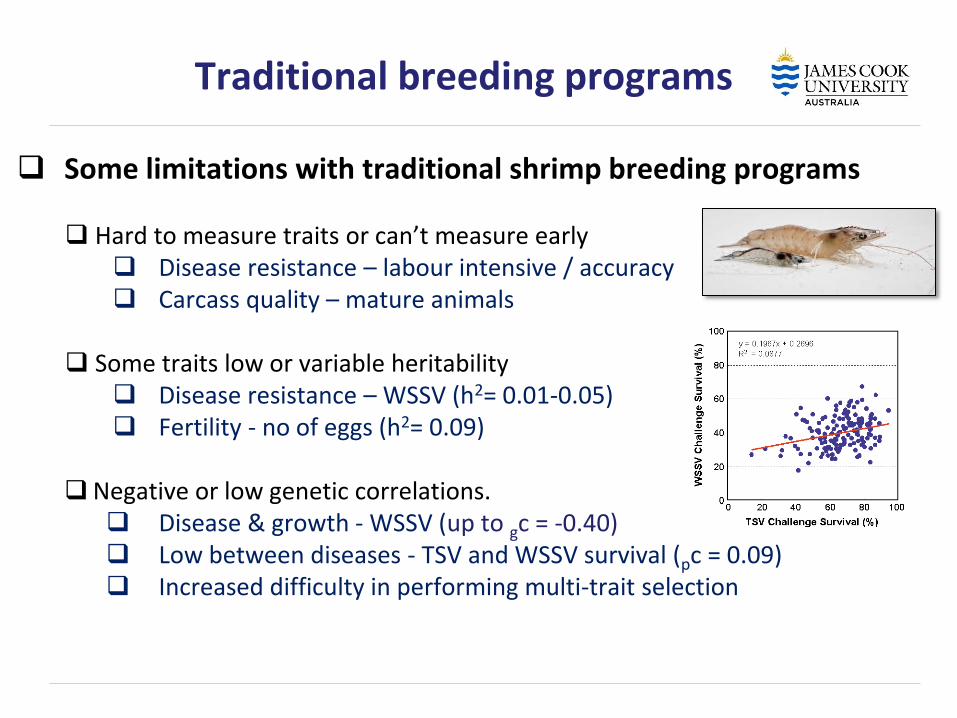
Some limitations with traditional shrimp breeding programs Hard to measure traits or can’t measure early Disease resistance – labour intensive / accuracy Carcass quality – mature animals
Some traits low or variable heritability Disease resistance – WSSV (h2= 0.01-0.05) Fertility - no of eggs (h2= 0.09)
Negative or low genetic correlations. Disease & growth - WSSV (up to gc = -0.40) Low between diseases - TSV and WSSV survival (pc = 0.09) Increased difficulty in performing multi-trait selection
Traditional breeding programs
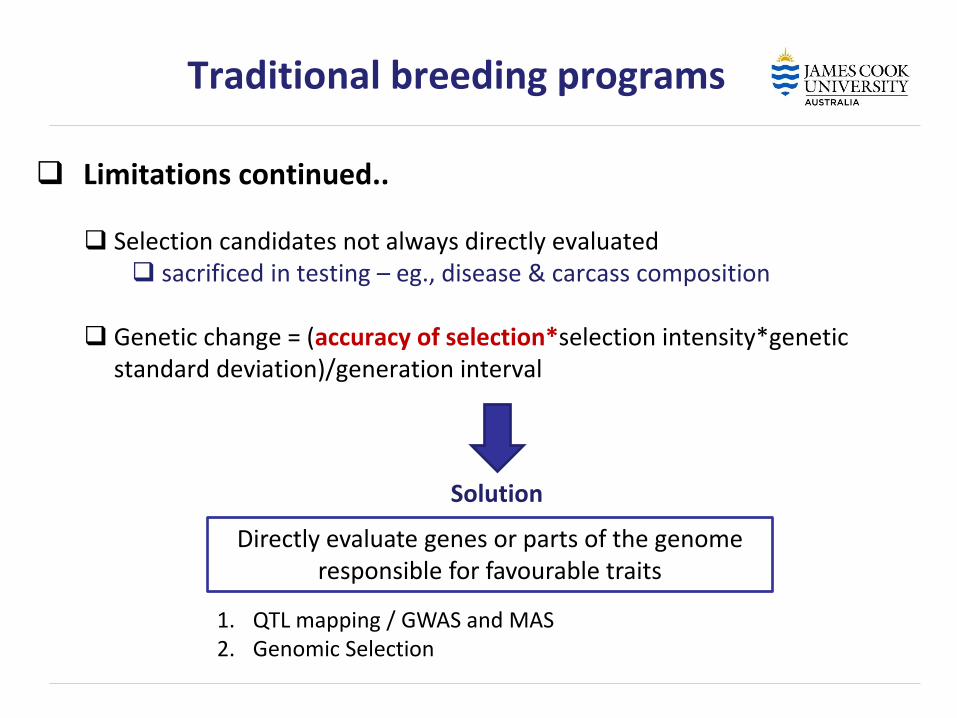
Limitations continued.. Selection candidates not always directly evaluated sacrificed in testing – eg., disease & carcass composition
Genetic change = (accuracy of selection*selection intensity*genetic
standard deviation)/generation interval
Directly evaluate genes or parts of the genome responsible for favourable traits
Solution
1. QTL mapping / GWAS and MAS 2. Genomic Selection
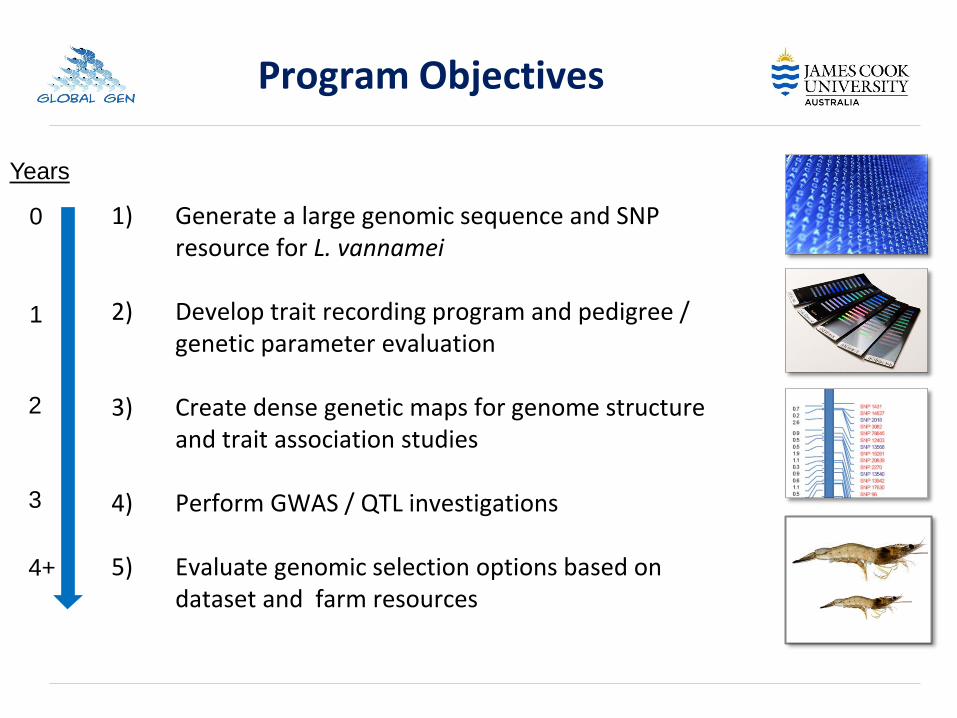
Program Objectives
1) Generate a large genomic sequence and SNP resource for L. vannamei
2) Develop trait recording program and pedigree / genetic parameter evaluation
3) Create dense genetic maps for genome structure and trait association studies
4) Perform GWAS / QTL investigations
5) Evaluate genomic selection options based on dataset and farm resources
0
1
2
3
4+
Years
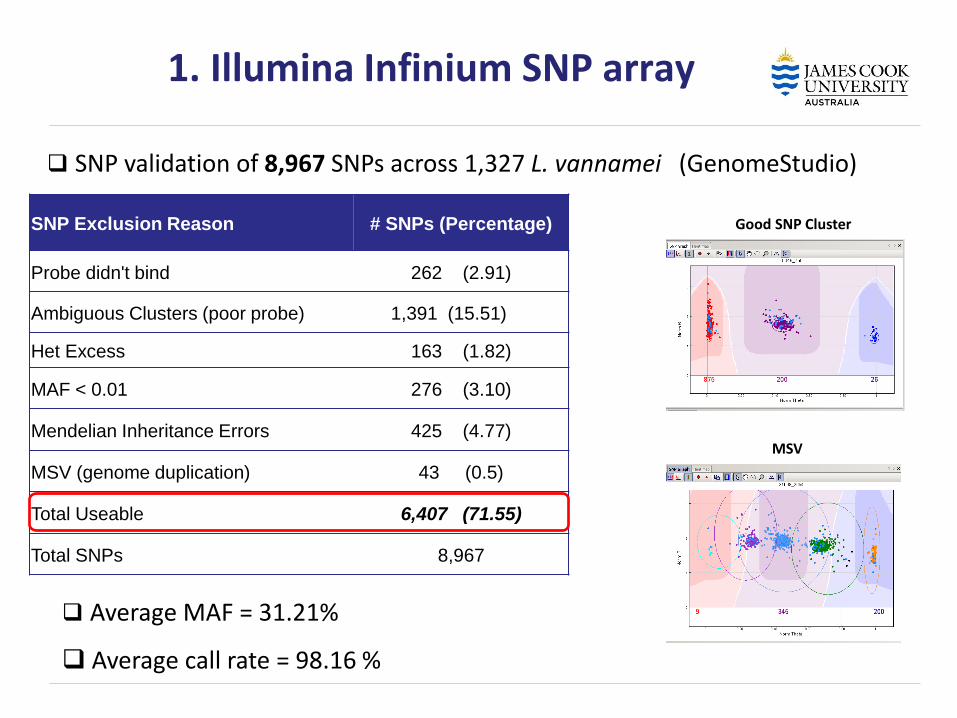
SNP Exclusion Reason # SNPs (Percentage)
Probe didn't bind 262 (2.91)
Ambiguous Clusters (poor probe) 1,391 (15.51)
Het Excess 163 (1.82)
MAF < 0.01 276 (3.10)
Mendelian Inheritance Errors 425 (4.77)
MSV (genome duplication) 43 (0.5)
Total Useable 6,407 (71.55)
Total SNPs 8,967
Average MAF = 31.21%
Average call rate = 98.16 %
1. Illumina Infinium SNP array
SNP validation of 8,967 SNPs across 1,327 L. vannamei (GenomeStudio)
Good SNP Cluster
MSV
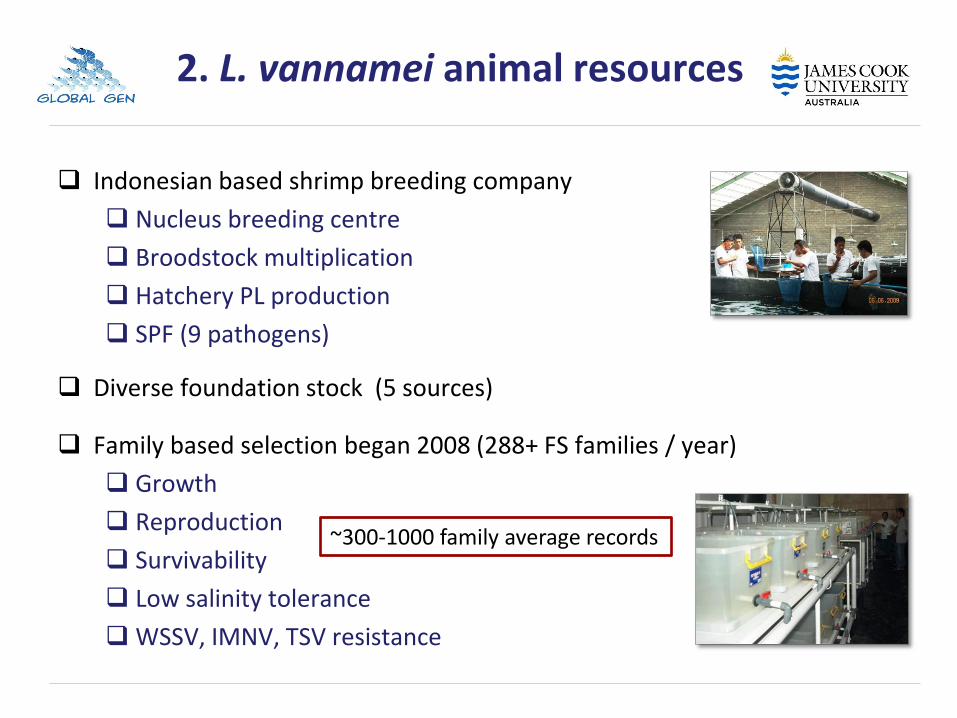
Indonesian based shrimp breeding company
Nucleus breeding centre
Broodstock multiplication
Hatchery PL production
SPF (9 pathogens)
Diverse foundation stock (5 sources)
Family based selection began 2008 (288+ FS families / year)
Growth
Reproduction
Survivability
Low salinity tolerance
WSSV, IMNV, TSV resistance
2. L. vannamei animal resources
~300-1000 family average records
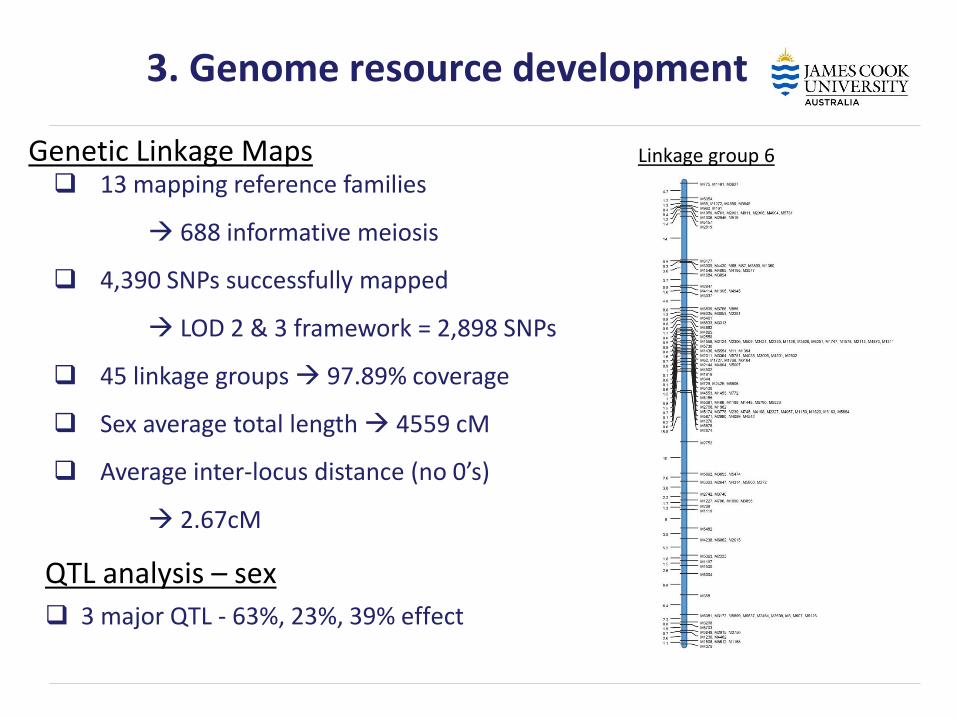
3. Genome resource development
Genetic Linkage Maps
13 mapping reference families
688 informative meiosis
4,390 SNPs successfully mapped
LOD 2 & 3 framework = 2,898 SNPs
45 linkage groups 97.89% coverage
Sex average total length 4559 cM
Average inter-locus distance (no 0’s)
2.67cM
Linkage group 6
QTL analysis – sex
3 major QTL - 63%, 23%, 39% effect
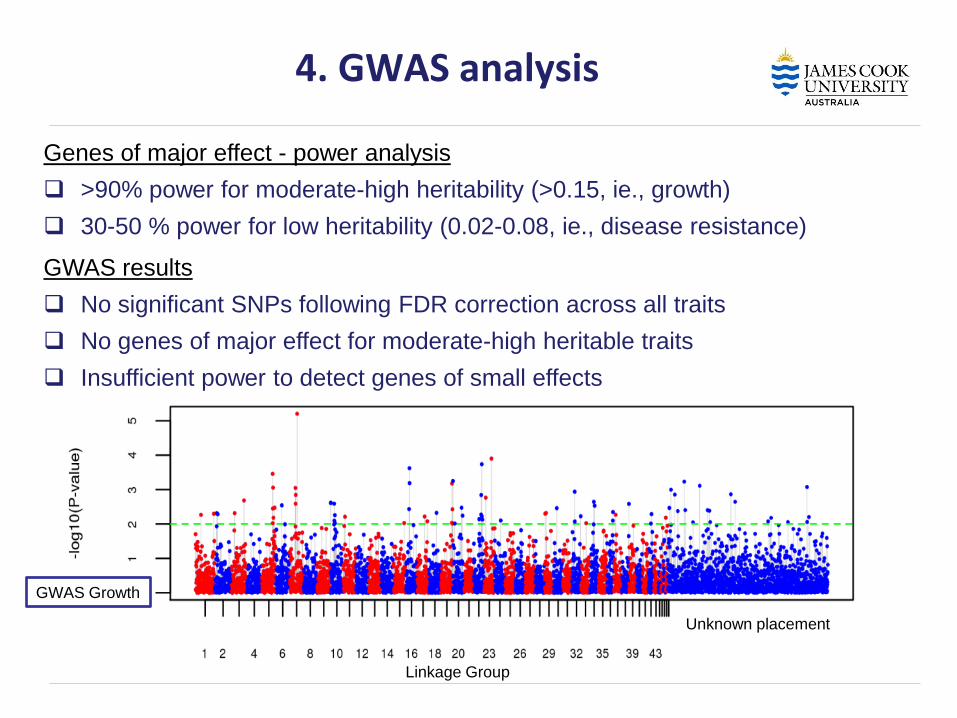
4. GWAS analysis
Genes of major effect - power analysis
>90% power for moderate-high heritability (>0.15, ie., growth)
30-50 % power for low heritability (0.02-0.08, ie., disease resistance)
GWAS results
No significant SNPs following FDR correction across all traits
No genes of major effect for moderate-high heritable traits
Insufficient power to detect genes of small effects
Linkage Group
Unknown placement
GWAS Growth
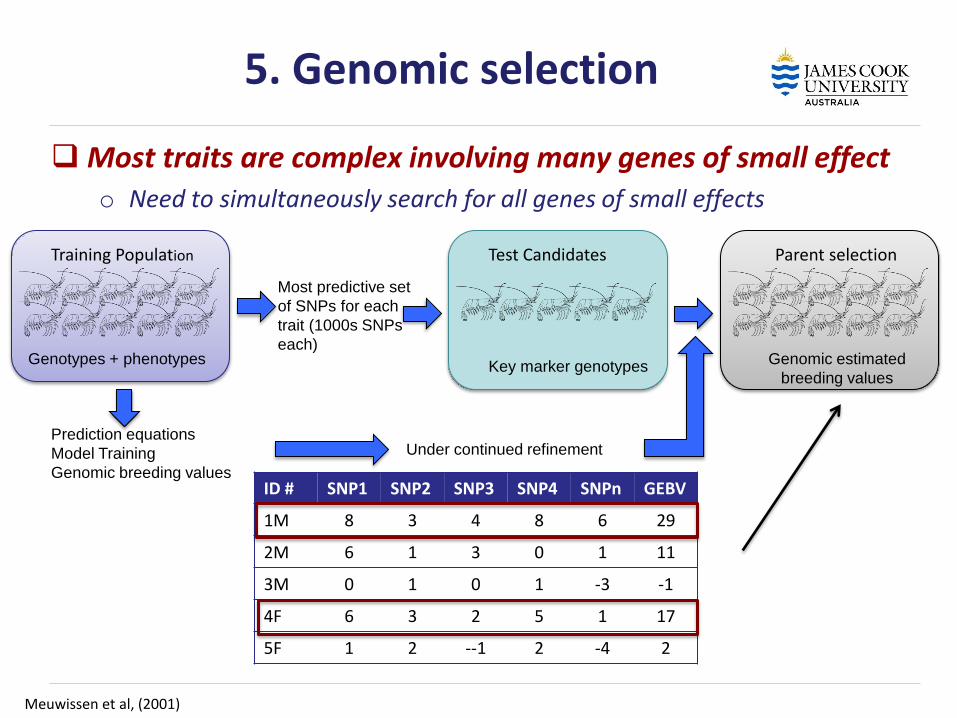
5. Genomic selection
Most traits are complex involving many genes of small effect o Need to simultaneously search for all genes of small effects
Meuwissen et al, (2001)
Training Population Test Candidates Parent selection
Genotypes + phenotypes Key marker genotypes
Genomic estimated
breeding values
Under continued refinement Prediction equations
Model Training
Genomic breeding values
Most predictive set
of SNPs for each
trait (1000s SNPs
each)
ID # SNP1 SNP2 SNP3 SNP4 SNPn GEBV
1M 8 3 4 8 6 29
2M 6 1 3 0 1 11
3M 0 1 0 1 -3 -1
4F 6 3 2 5 1 17
5F 1 2 --1 2 -4 2
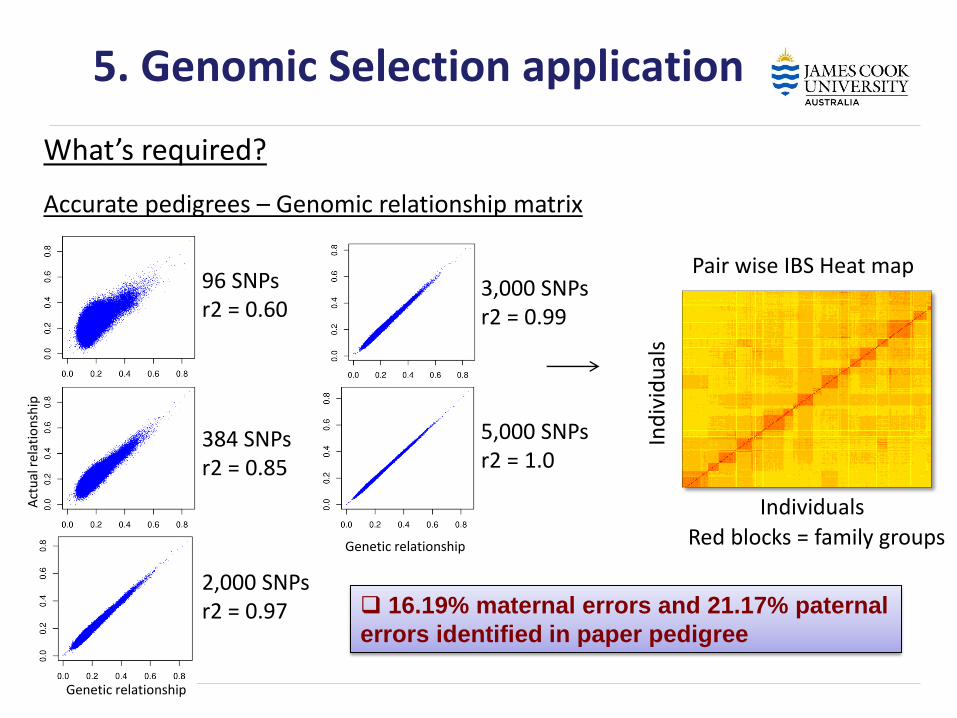
5. Genomic Selection application
What’s required?
Accurate pedigrees – Genomic relationship matrix
384 SNPs r2 = 0.85
2,000 SNPs r2 = 0.97
3,000 SNPs r2 = 0.99
5,000 SNPs r2 = 1.0
96 SNPs r2 = 0.60
Genetic relationship
Genetic relationship
Act
ual
rel
atio
nsh
ip
Pair wise IBS Heat map
Red blocks = family groups
Individuals
Ind
ivid
ual
s
16.19% maternal errors and 21.17% paternal
errors identified in paper pedigree
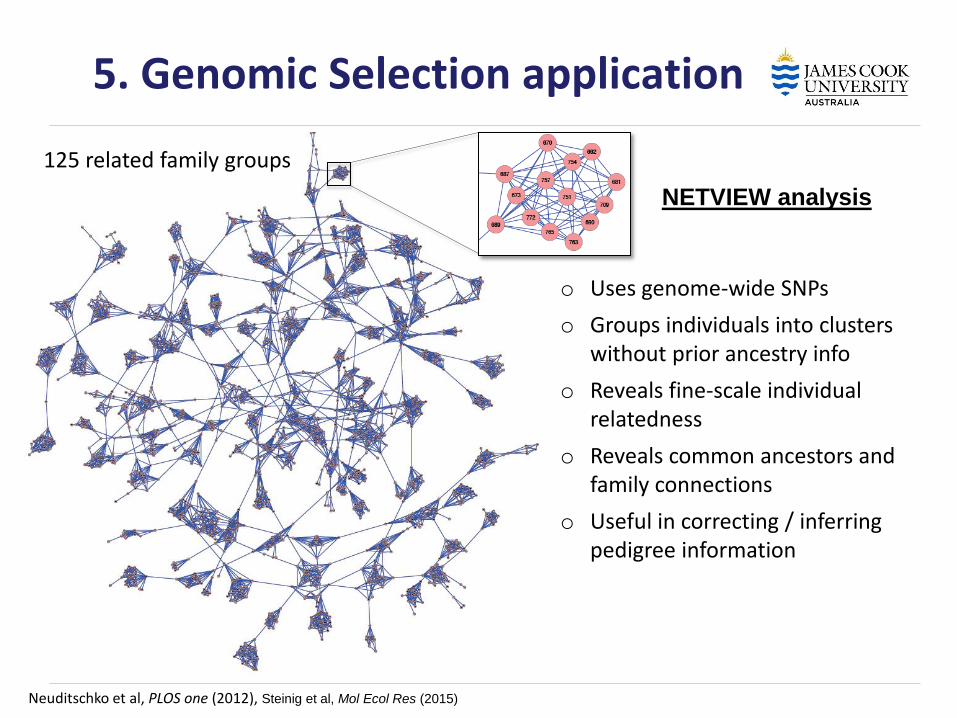
Neuditschko et al, PLOS one (2012), Steinig et al, Mol Ecol Res (2015)
o Uses genome-wide SNPs
o Groups individuals into clusters without prior ancestry info
o Reveals fine-scale individual relatedness
o Reveals common ancestors and family connections
o Useful in correcting / inferring pedigree information
125 related family groups
5. Genomic Selection application
NETVIEW analysis
5. Genomic Selection application
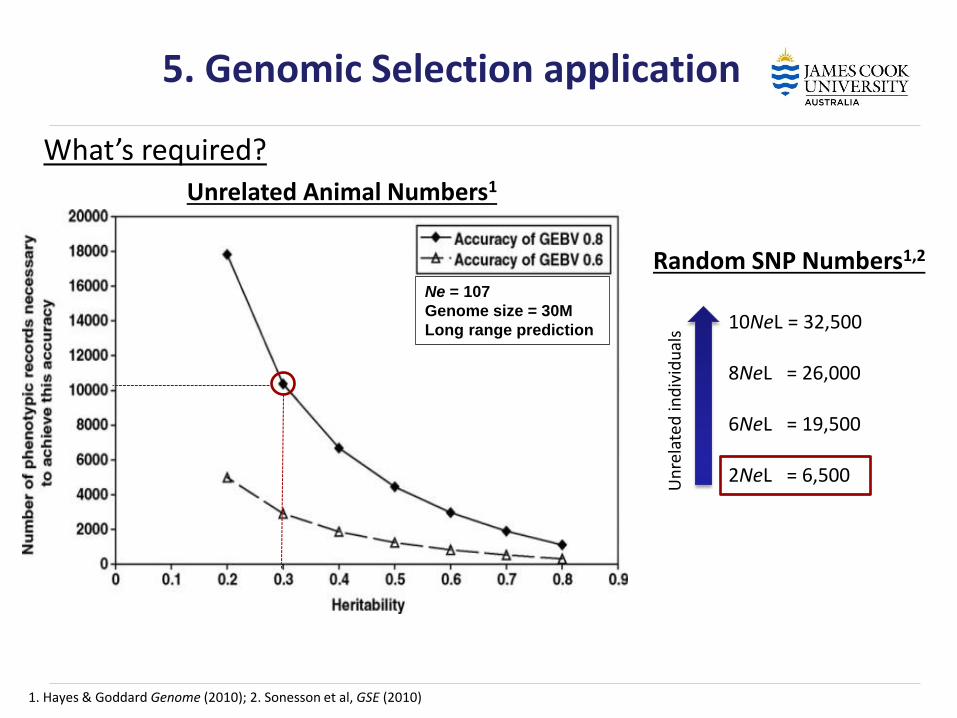
Random SNP Numbers1,2
10NeL = 32,500 8NeL = 26,000 6NeL = 19,500 2NeL = 6,500
Un
rela
ted
ind
ivid
ual
s 1. Hayes & Goddard Genome (2010); 2. Sonesson et al, GSE (2010)
Ne = 107
Genome size = 30M
Long range prediction
Unrelated Animal Numbers1
What’s required?
5. Genomic Selection application
What’s available ?
Large numbers of accurate phenotypic records required
Commercial farm data only
• Limited number of family average phenotypic records (~300-900)
• Both parents not always genotyped
• Needed to infer family parental allele frequencies
- Matching family average phenotype & genotype
- Used pooled genotyping approach on nauplii (300+) to reconstruct family parent allele frequencies (ie, 0, 0.25, 0.5, 0.75, 1)
- Pooled genotyping approach had 99.49% accuracy at reconstructing parental allele frequencies / genotypes
Although limited data – what's the GS results for growth and TSV resistance!
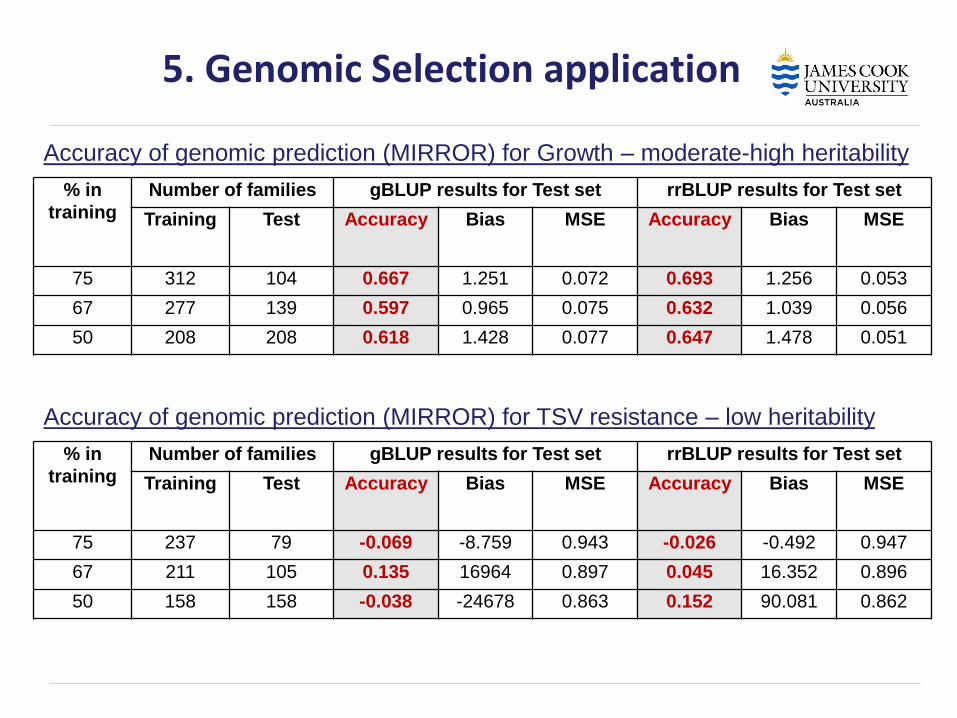
% in
training
Number of families gBLUP results for Test set rrBLUP results for Test set
Training Test Accuracy Bias MSE Accuracy Bias MSE
75 312 104 0.667 1.251 0.072 0.693 1.256 0.053
67 277 139 0.597 0.965 0.075 0.632 1.039 0.056
50 208 208 0.618 1.428 0.077 0.647 1.478 0.051
5. Genomic Selection application
Accuracy of genomic prediction (MIRROR) for Growth – moderate-high heritability
% in
training
Number of families gBLUP results for Test set rrBLUP results for Test set
Training Test Accuracy Bias MSE Accuracy Bias MSE
75 237 79 -0.069 -8.759 0.943 -0.026 -0.492 0.947
67 211 105 0.135 16964 0.897 0.045 16.352 0.896
50 158 158 -0.038 -24678 0.863 0.152 90.081 0.862
Accuracy of genomic prediction (MIRROR) for TSV resistance – low heritability
Final Comments
Comprehensive SNP and map resources developed
Family average phenotype and parent average allele frequency used (single record and genotype)
Genomic relationships used to replace pedigree matrix @ r2 = 0.97
• ~3000 SNPs required
Current SNP density appears to be sufficient for GS
• more required for GWAS analysis (small effect genes)
No indication of genes of major effect
Genomic Selection a real option in this commercial farm
• More phenotypic/genotypic data required for low heritable traits