development of improved connection details for … · development of improved connection details ....
TRANSCRIPT
Development of Improved Connection Details for Adjacent Prestressed Member Bridges
http://www.virginiadot.org/vtrc/main/online_reports/pdf/17-r20.pdf
KEDAR HALBE, Ph.D. Graduate Research Assistant PATRICK JOYCE, EIT Graduate Research Assistant CARIN L. ROBERTS-WOLLMANN, Ph.D., P.E. Professor THOMAS E. COUSINS, Ph.D., P.E. Professor Via Department of Civil and Environmental Engineering Virginia Polytechnic and State University
Final Report VTRC 17-R20

Standard Title Page—Report on State Project Report No.: VTRC 17-R20
Report Date: June 2017
No. Pages: 47
Type Report: Final Contract
Project No.: RC00061
Period Covered:
Contract No.:
Title: Development of Improved Connection Details for Adjacent Prestressed Member Bridges
Key Words: Adjacent, prestressed concrete, voided slab, box beam, shear key, UHPC, VHPC, grout
Author(s): Kedar Halbe, Ph.D., Patrick Joyce, EIT, Carin L. Roberts-Wollmann, Ph.D., P.E., and Thomas E. Cousins, Ph.D., P.E.
Performing Organization Name and Address: The Charles E. Via, Jr. Department of Civil and Environmental Engineering Virginia Polytechnic Institute and State University 200 Patton Hall Blacksburg, VA 24061-0105 Sponsoring Agencies’ Name and Address: Virginia Department of Transportation 1401 E. Broad Street Richmond, VA 23219
Supplementary Notes:
Abstract: Adjacent prestressed member girder bridges are economical systems for short spans and generally come in two types: adjacent box beam bridges and adjacent voided slab bridges. Each type provides the advantages of having low clearances because of their shallow section depths, accelerated construction times, and high torsional stiffness. The current longitudinal connection detail, a partial depth grouted shear key, has been known to fail in many of these bridges. The failure leads to reflective cracking in the wearing surface, which allows chloride-laden water to seep through the joint, where it can corrode the reinforcement and prestressing strand. Ultimately, the failed keys lead to costly repairs and bridge replacements sooner than their proposed lifespan. Failed keys also lead to poor load sharing, which in turn could result in beams carrying more load than that for which they were designed. This study was composed of three distinct phases: testing of in-service adjacent member bridges; finite element modeling of these bridges; and testing of adjacent box beam and voided slab sub-assemblages. The sub-assemblages were designed to replicate behavior in a full-sized adjacent member bridge and were constructed with five alternate connections (in each girder type) as well as a control specimen with the current joint detail. The objective was to compare the tested details and to find a connection that abated cracking in the shear key. The tested connections employed alternate connection shapes and two different mix designs of fiber-reinforced, high-strength concrete. The results showed that all alternative connections outperformed the current detail. The best performing connection included blocked out concrete at adjacent stirrups. A short reinforcing bar was placed in the blockout to lap the stirrups on adjacent beams. The blockout was filled with a fiber-reinforced, high-strength concrete. This connection survived 1 million load cycles mimicking an HL-93 truck with little or no cracking and no leakage.

FINAL REPORT
DEVELOPMENT OF IMPROVED CONNECTION DETAILS FOR ADJACENT PRESTRESSED MEMBER BRIDGES
Kedar Halbe, Ph.D.
Graduate Research Assistant
Patrick Joyce, EIT Graduate Research Assistant
Carin L. Roberts-Wollmann, Ph.D., P.E.
Professor
Thomas E. Cousins, Ph.D., P.E. Professor
Via Department of Civil and Environmental Engineering
Virginia Polytechnic and State University
VTRC Project Manager Bernard L. Kassner, Ph.D., P.E., Virginia Transportation Research Council
Virginia Transportation Research Council (A partnership of the Virginia Department of Transportation
and the University of Virginia since 1948)
Charlottesville, Virginia
June 2017 VTRC 17-R20

ii
DISCLAIMER
The project that is the subject of this report was done under contract for the Virginia Department of Transportation, Virginia Transportation Research Council. The contents of this report reflect the views of the authors, who are responsible for the facts and the accuracy of the data presented herein. The contents do not necessarily reflect the official views or policies of the Virginia Department of Transportation, the Commonwealth Transportation Board, or the Federal Highway Administration. This report does not constitute a standard, specification, or regulation. Any inclusion of manufacturer names, trade names, or trademarks is for identification purposes only and is not to be considered an endorsement.
Each contract report is peer reviewed and accepted for publication by staff of Virginia Transportation Research Council with expertise in related technical areas. Final editing and proofreading of the report are performed by the contractor.
Copyright 2017 by the Commonwealth of Virginia. All rights reserved.

iii
ABSTRACT
Adjacent prestressed member girder bridges are economical systems for short spans and generally come in two types: adjacent box beam bridges and adjacent voided slab bridges. Each type provides the advantages of having low clearances because of their shallow section depths, accelerated construction times, and high torsional stiffness. The current longitudinal connection detail, a partial depth grouted shear key, has been known to fail in many of these bridges. The failure leads to reflective cracking in the wearing surface, which allows chloride-laden water to seep through the joint, where it can corrode the reinforcement and prestressing strand. Ultimately, the failed keys lead to costly repairs and bridge replacements sooner than their proposed lifespan. Failed keys also lead to poor load sharing, which in turn could result in beams carrying more load than that for which they were designed.
This study was composed of three distinct phases: testing of in-service adjacent member bridges; finite element modeling of these bridges; and testing of adjacent box beam and voided slab sub-assemblages. The sub-assemblages were designed to replicate behavior in a full-sized adjacent member bridge and were constructed with five alternate connections (in each girder type) as well as a control specimen with the current joint detail. The objective was to compare the tested details and to find a connection that abated cracking in the shear key. The tested connections employed alternate connection shapes and two different mix designs of fiber-reinforced, high-strength concrete.
The results showed that all alternative connections outperformed the current detail. The best performing connection included blocked out concrete at adjacent stirrups. A short reinforcing bar was placed in the blockout to lap the stirrups on adjacent beams. The blockout was filled with a fiber-reinforced, high-strength concrete. This connection survived 1 million load cycles mimicking an HL-93 truck with little or no cracking and no leakage.

1
FINAL REPORT
DEVELOPMENT OF IMPROVED CONNECTION DETAILS FOR ADJACENT PRESTRESSED MEMBER BRIDGES
Kedar Halbe, Ph.D.
Graduate Research Assistant
Patrick Joyce, EIT Graduate Research Assistant
Carin L. Roberts-Wollmann, Ph.D., P.E.
Professor
Thomas E. Cousins, Ph.D., P.E. Professor
Via Department of Civil and Environmental Engineering
Virginia Polytechnic and State University
INTRODUCTION
Adjacent prestressed member bridges are comprised of rectangular beams with rectangular or circular voids. Like other adjacent member bridges, the beams are placed, touching, next to each other with a partial depth shear key continuously running longitudinally between the beams and transverse ties placed intermittently. Generally, there are two types of adjacent prestressed member bridges: ones with adjacent box beams and ones with adjacent voided slabs. Example cross sections are shown in Figure 1 and Figure 2, respectively. The partial depth shear key is generally filled with a high-strength, low-shrinkage grout as shown in Figures 1 and 2. Ties are generally placed at even intervals up to 20 ft apart. The ties are used to snug the adjacent members together before placing the grout in the key.
48in
typical partial depth keyfilled with non-shrink grout
27in
(also 36in width)
box heights 27in, 33in, 39in and 42in
Figure 1. Typical Adjacent Box Beam Bridge Cross Section

2
typical partial depth keyfilled with non-shrink grout
(also 36in width)
voided slab heights 15in, 18in, and 21in
48in
21in
Figure 2. Typical Voided Slabs Bridge Cross Section
Adjacent member bridges provide many advantages over other short-span bridge
systems. Adjacent member bridges have a relatively shallow section depth, which is beneficial as overhead clearance can be an important factor for bridge construction. Another advantage of this system is the high torsional stiffness provided by the cross section, which allows the shear key to be effective in distributing forces to adjacent beams. Perhaps the system’s best advantage is that it allows for accelerated construction.
The primary purpose of the shear key is to distribute vehicle loads transversely to
adjacent beams. This allows for adjacent beams to share load and provides for a stiffer, stronger bridge system. The key also provides a seal between the beams to prevent water from leaking between adjacent beams. Many adjacent member bridges show reflective cracking in the roadway surface as shown in Figure 3. Reflective cracking is typically attributed to failure of the bond between the grout in the shear key and the precast beam, which is why the reflective cracking in Figure 3 runs longitudinally along the bridge.
Figure 3. Longitudinal Reflective Cracking in Asphalt Overlay
A survey by Russell (2009) for an NCHRP Synthesis Report showed that roughly two
thirds of U.S. states used adjacent member bridges and most used partial depth shear keys filled with a high-strength, low-shrinkage grout acting as the longitudinal connection between the beams. A majority of the respondents to the survey said they had deterioration in the shear keys of their adjacent member bridges, which indicates that this is a prevalent problem across the nation.

3
The damage noted in the survey is most likely caused by cracking of the shear key, which is caused by a combination of tensile stresses induced by temperature gradients, shrinkage, and live loads (Russell, 2009). The cracking is usually the result of a bond failure between the concrete and the grout. In some inspections that have taken place after the topping and beam elements have been removed, there have been observations of the grouted shear key falling cleanly out of the keyway and leaving behind no parts bonded to the concrete (Gulyas et al., 1995). The structural shear key failure typically leads to relative displacements between adjacent girders, which cause failure of the waterproofing system above the joint (Huckelbridge et al., 1995). This allows salt-laden water to move down through the joint, these corrosive materials diffuse into the concrete to cause corrosion of the reinforcement and prestressing strands (Gulyas et al., 1995). It is corrosion of the prestressing strands and shear stirrups that causes concrete spalling on the underside of the member. Severe corrosion of the prestressing strands may lead to concerns for the structural integrity of the bridge. For the most part, the cracked shear key will continue to transfer load between beams as a result of mechanical interlock. However, in some severe cases, the deterioration in the key is so great that there is no load sharing between adjacent beams, which results in a single beam carrying a load that is significantly larger than the design load, which can lead to failure.
PURPOSE AND SCOPE
The purpose of this study was to develop durable and waterproof structural connections along the longitudinal joint to improve the performance of adjacent prestressed member bridges for the Virginia Department of Transportation (VDOT). Another related purpose was to create a connection design that will negate the need for transverse prestressed ties. Removing the transverse tie requirements will decrease the cost and time to construct these adjacent member bridges. This is of benefit for all adjacent member bridges, and particularly when constructing a skewed bridge because of the complications of lining up the diaphragms needed for the post-tensioning.
The study looked into alternate connections utilizing the advantages of alternative materials such as fiber-reinforced, high-performance concretes instead of grout to improve structural performance and Kevlar strips to improve water resistance. A total of six different connections were tested. Since it was not economically feasible to test full-size bridges, sub-assemblages were used to test the various connections. The goal was to mimic the transverse shear key stresses present in full-scale bridges in the sub-assemblages. Both cyclic and static loads were applied to the specimens to investigate the service load performance and the ultimate strength of each connection. The testing was performed in the Thomas M. Murray Structures Laboratory at Virginia Tech. Further details of this investigation are provided by Halbe (2014) and Joyce (2014).
4
METHODS
Test Methodology
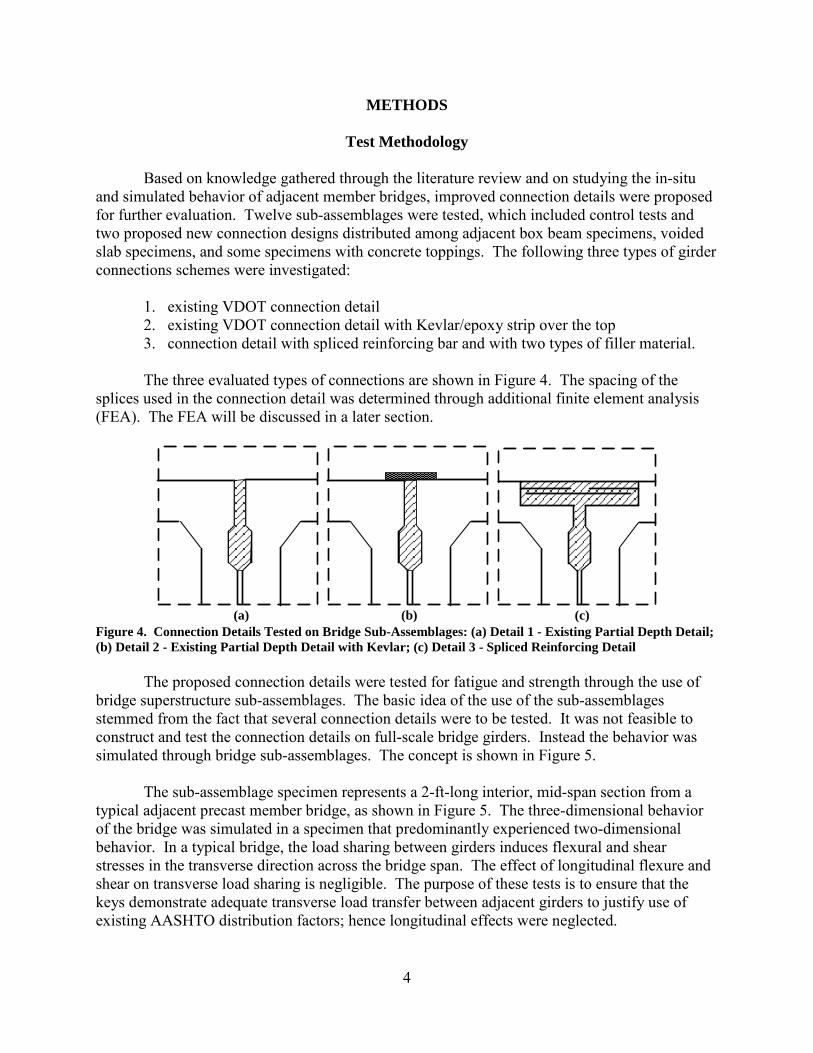
Based on knowledge gathered through the literature review and on studying the in-situ and simulated behavior of adjacent member bridges, improved connection details were proposed for further evaluation. Twelve sub-assemblages were tested, which included control tests and two proposed new connection designs distributed among adjacent box beam specimens, voided slab specimens, and some specimens with concrete toppings. The following three types of girder connections schemes were investigated:
1. existing VDOT connection detail 2. existing VDOT connection detail with Kevlar/epoxy strip over the top 3. connection detail with spliced reinforcing bar and with two types of filler material.
The three evaluated types of connections are shown in Figure 4. The spacing of the
splices used in the connection detail was determined through additional finite element analysis (FEA). The FEA will be discussed in a later section.
Figure 4. Connection Details Tested on Bridge Sub-Assemblages: (a) Detail 1 - Existing Partial Depth Detail; (b) Detail 2 - Existing Partial Depth Detail with Kevlar; (c) Detail 3 - Spliced Reinforcing Detail
The proposed connection details were tested for fatigue and strength through the use of bridge superstructure sub-assemblages. The basic idea of the use of the sub-assemblages stemmed from the fact that several connection details were to be tested. It was not feasible to construct and test the connection details on full-scale bridge girders. Instead the behavior was simulated through bridge sub-assemblages. The concept is shown in Figure 5.
The sub-assemblage specimen represents a 2-ft-long interior, mid-span section from a typical adjacent precast member bridge, as shown in Figure 5. The three-dimensional behavior of the bridge was simulated in a specimen that predominantly experienced two-dimensional behavior. In a typical bridge, the load sharing between girders induces flexural and shear stresses in the transverse direction across the bridge span. The effect of longitudinal flexure and shear on transverse load sharing is negligible. The purpose of these tests is to ensure that the keys demonstrate adequate transverse load transfer between adjacent girders to justify use of existing AASHTO distribution factors; hence longitudinal effects were neglected.
(a) (b) (c)

5
Figure 5. Test Sub-Assembly Extracted From a Full Bridge
Although the effect of longitudinal stresses was ignored, the three-dimensional behavior
of the bridge itself was not ignored in terms of girder stiffness. The specimen sub-assemblage sections were supported on small steel beams. The steel beams acted as flexible supports underneath the sub-assemblage girder sections. Essentially, the steel beams simulated the flexural stiffness of the portion of the bridge missing from the sub-assemblages. FEA models of a test bridge and the sub-assemblages were created and the behaviors of the two were compared to ensure that the states of stress in the joints and the relative displacements between girder sections of the sub-assemblages were similar to those observed in typical adjacent member bridges. A cross section of the sub-assemblage test set-up for an adjacent box girder bridge is shown in Figure 6. The test set-up for a voided slab bridge is identical except for the different girder type. Instrumentation was used to measure applied load, vertical deflection, joint opening, and concrete surface strain.
Figure 6. Schematic View of Sub-Assemblage Instrumentation (LVDT = Linear Variable Differential Transformer)
2 ft
Actuator
LoadCells
LVDTs LVDTs
Strain Gauge
Vertical LVDTs

6
Test Specimen and Fabrication
There are two types of adjacent prestressed member bridge used by VDOT: ones with adjacent box beams and ones with adjacent voided slabs. Both types were included in the testing program. The adjacent members tested as part of the sub-assemblages were 2 ft long, measured in the longitudinal direction of the member in the actual bridge. The sub-assemblage consisted of three 2-ft-long adjacent members (either adjacent box beams or voided slab sections), and the three adjacent members had two connections, or shear keys, per sub-assemblage. Lengths of 2 ft were chosen for two reasons: (1) with one detail, three sections and two connections per sub-assemblage, modeling showed that a longitudinal 2-ft spacing gave reasonable differential girder movements; and (2) because this was believed to be the smallest length that would adequately represent the behavior of the bridge while still being stable during testing. At lengths shorter than 2 ft, it was feared the specimens would easily topple during testing. Each beam section weighed roughly 1,600 lb, so the full-sub-assemblage test specimen, without topping slab, weighed almost 5,000 lb. The members were fabricated with VDOT Class A5 concrete (5,000 psi) and standard Grade 60 reinforcement. The adjacent members were not prestressed and did not contain any prestressing strand. Adjacent members are typically prestressed longitudinally for strength and serviceability, but this was not relevant for modeling the transverse behavior using the small 2-ft sections.
Adjacent member bridges typically are transversely tied together at discrete points along the bridge length. The sub-assemblages tested were not for the following reasons:
1. Due to the wide spacing of the ties, the tie force is only effective near the point of application, and the effect is negligible between the points of application.
2. One goal of the project is to develop a durable connection that would negate the need
for ties. 3. Hanna et al. (2011) ran tests on adjacent member box beams without post-tensioned
diaphragms and concluded that getting rid of the post-tensioning while using alternate connections designs could be structurally superior and more economical than the current design.
Adjacent Box Beam
VDOT uses a number of different reinforced concrete adjacent box beams that vary in depth, width, and in the number of voids. One commonly used cross section is the BI-48, which was tested for this research project. The BI-48 is a PCI/AASHTO standard shape that is essentially the same as the VDOT 48-in wide by 27-in deep box section. A dimensioned schematic of the BI-48 beam is provided in Figure 7. This beam has one rectangular void. The beam has an overall depth of 27 in and is 48 in wide. The beam’s shear key is a 12-in deep partial depth key, and the exact dimensions are provided in Figure 9.

7
48in
38in
5 1/2in
16in
5 1/2in
5in 5in
3in
3in
6in
6in
27in
Figure 7. Dimensioned AASHTO BI-48 Adjacent Box Beam
Voided Slab
VDOT uses a number of different reinforced concrete voided slab beams that vary in depth, width, and in the number of voids. One of VDOT’s more typical sections, based on AASHTO’s Voided Slab Type SIV-48, was tested for this research project. A dimensioned schematic of the type SIV-48 slab is provided in Figure 8. This voided slab has three circular voids with the outer two voids being 12 in in diameter and the center void is 10 in in diameter. The beam has an overall depth of 21 in and is 48 in wide. The beam’s shear key is a 7-in deep partial depth key, and the exact dimensions are provided in Figure 9.
21in
10 1/2in
48in
3in
4in
10in 10in14in 14in
Figure 8. Dimensioned AASHTO Voided Slab Type SIV-48

8
Figure 9. Detailed Shear Key Dimensions for Box Beam and Voided Slab
Specimen Fabrication
Ross Prestressed Concrete, Inc., fabricated the adjacent member sections at their prestressing plant located near Bristol, Tennessee. Internal voids were formed with either expanded polystyrene foam (for adjacent box beams) or wax-coated cardboard cylinders (for voided slabs). Each 2-ft section was formed between two pieces of plywood with threaded rods running through the voids to hold the plywood in-place. Figure 10 shows typical formwork with the tied reinforcement cage for a voided slab section. Any other blockouts were formed with expanded polystyrene that was wrapped with duct tape in order to prevent the polystyrene from absorbing water that was needed to hydrate the concrete. The forms were aligned in the prestressing beds as seen in Figure 11.
Figure 10. Voided Slab Formwork and Reinforcement Cage
1/4in3/4in
3/8in
3/8in
3/4in
3/8in
5/8in
6in
6in
3/4in
3/8in
5/8in
3in
4in
3/4in1/4in
Box Beam
Voided Slab
9
Figure 11. Voided Slab Forms Sitting in Prestressing Beds
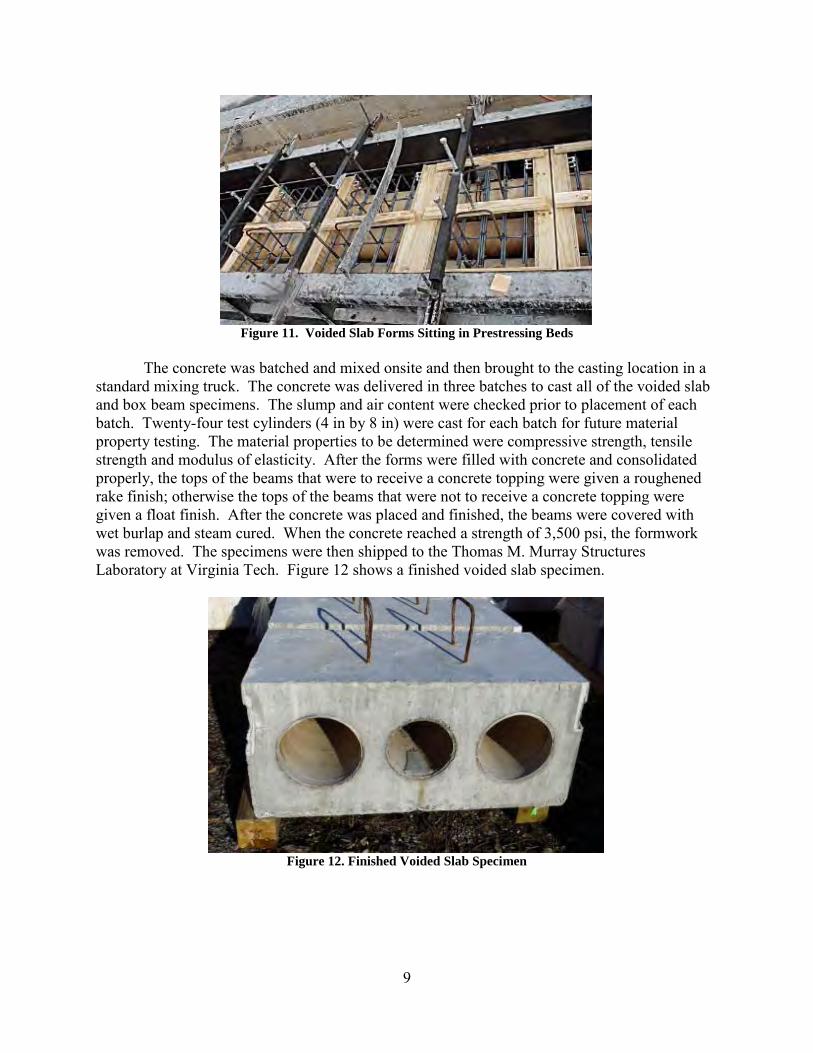
The concrete was batched and mixed onsite and then brought to the casting location in a
standard mixing truck. The concrete was delivered in three batches to cast all of the voided slab and box beam specimens. The slump and air content were checked prior to placement of each batch. Twenty-four test cylinders (4 in by 8 in) were cast for each batch for future material property testing. The material properties to be determined were compressive strength, tensile strength and modulus of elasticity. After the forms were filled with concrete and consolidated properly, the tops of the beams that were to receive a concrete topping were given a roughened rake finish; otherwise the tops of the beams that were not to receive a concrete topping were given a float finish. After the concrete was placed and finished, the beams were covered with wet burlap and steam cured. When the concrete reached a strength of 3,500 psi, the formwork was removed. The specimens were then shipped to the Thomas M. Murray Structures Laboratory at Virginia Tech. Figure 12 shows a finished voided slab specimen.
Figure 12. Finished Voided Slab Specimen

10
Sub-assemblage Connections
Twelve different connections were tested as part of this research project. The same six details were used for the box beam specimens and the voided slab specimens. For each type of cross-section, the first connection tested was the current VDOT connection detail consisting of the shear key filled with high strength non-shrink grout. The box beam shear key was 12 in deep and the voided slab shear key was 7 in deep. The second connection tested was the current grouted shear key detail with a Kevlar mesh placed in epoxy over the shear key on top of the beams across the joints. The third connection tested used an alternate connection shape and a proprietary ultra-high-performance concrete (UHPC), called Ductal made by Lafarge. The fourth used the same connection detail with a nonproprietary fiber-reinforced, very-high-performance concrete (VHPC) that was designed at Virginia Tech. The fifth and sixth details had the same details and connection filler materials as the third and fourth, but also had a concrete topping added. Table 1 is a test matrix for the testing program.
Table 1. Test Matrix Summarizing the Specimens Tested Specimen
No. Adjacent Box Beam Specimen
No. Voided Slab
Connection Detail Topping Connection Detail Topping 1-BB Typical Key with grout No 1-VS Typical Key with grout No 2-BB Typical key with grout
and Kevlar No 2-VS Typical key with grout and
Kevlar No
3-BB New detail with UHPC No 3-VS New detail with UHPC No 4-BB New detail with VHPC No 4-VS New detail with VHPC No 5-BB New detail with UHPC Yes 5-VS New detail with UHPC Yes 6-BB New detail with VHPC Yes 6-VS New detail with VHPC Yes
Typical Key With Grout
This detail is the standard VDOT adjacent member connection and was tested in order to assess the strength and behavior of the current detail. This connection used a 12-in deep shear key in adjacent box beam specimens (Figure 7) and a 7-in-deep shear key in voided slab specimens, which is shown in Figure 13. Prior to placing the joint, the keyways were sandblasted and kept moist at saturated surface-dry conditions in order to enhance the bond. This is standard VDOT practice and was carried out prior to each connection placement. The shear key was filled with a high-strength, non-shrinkage grout, which according to VDOT’s Road and Bridge Specifications (VDOT, 2007) must conform to the requirements of ASTM C 1107, Standard Specification for Packaged Dry, Hydraulic-Cement Grout (Nonshrink) (ASTM, 2013), and has to develop a 7-day compressive strength of at least 4,000 psi. Quikrete’s Non-shrink Precision Grout complies with ASTM standards (ASTM, 2013) and was used as the grout material. Cube samples of grout were pre-batched to make sure that the grout achieved a 7-day compressive strength of 4,000 psi. The sample cubes reached strengths in excess of 9,000 psi at 7 days, which confirmed the grout developed acceptable compressive strength. Figure 13 is a cross-section photograph of a completed connection detail.

11
Figure 13. Hardened Shear Key From First Specimen Tested
Typical Key With Grout and Kevlar
The second connection used the current shear key detail with a Kevlar mesh epoxied to the top of the joint. The Kevlar-epoxy system creates a seal to prevent water leakage, is assumed to be strong enough to transfer some load, and can allow temperature and stress-related deflections without cracking. These characteristics create a more durable, waterproof connection, which is an improvement over the standard VDOT connection detail. Not only can this connection be used for new construction, it can also be used for repairs. In a repair mode, the Kevlar-epoxy system can be placed over an existing shear key to improve its durability and to increase life of the connection. If the joint to be repaired is in relatively good condition, the Kevlar should waterproof the joint and help to maintain load transfer across the intact joint. If the joint to be repaired is in poor condition, with significant leaking and deteriorated joint material, the Kevlar will provide waterproofing, but is not expected to improve load transfer.
The Kevlar used is a product made by Fortec Stabilization called Fortec 5680-BD Kevlar. According to Fortec, the mesh is a bi-directional, highly durable material composed of dense Kevlar yarns. The ultimate tensile strength listed by Fortec is 100 ksi. The epoxy is a two-component mixture also developed by Fortec and called E-bond 256. The epoxy has a rapid set time and rapid strength development. When cured, the system has very low permeability. In order to construct this connection, the shear key was first grouted and then cured for at least 24 hours. Prior to placement of the Kevlar, the area surrounding the top of the shear key was sandblasted to enhance the bond with the epoxy. The next step was to mix the epoxy by placing a one-to-one ratio of the resin component and the hardener component into a clean container and mixing for at least 3 minutes using a low-speed drill with a mixing paddle. After thorough mixing of the epoxy, a layer, roughly as wide as the Kevlar mesh, was placed along the joint. The Kevlar mesh was then firmly pressed into the epoxy with a paint roller brush until the epoxy oozed through the Kevlar. Coarse sand was then sprinkled on top of the Kevlar and epoxy. After the first layer of epoxy cured, a second layer was placed on top and then more coarse sand was sprinkled on top of that layer. The curing time for each layer was roughly 2 hours. Figure 14 is a photograph of the completed Kevlar reinforced joint.

12
Figure 14. Photograph of Kevlar-Epoxy Joint With Coarse Sand
New Connection Detail With UHPC
For the new connection detail with UHPC, 6-in long, 6-in wide by 4-in deep blockouts were formed in the middle of the specimens at the top of the shear key at the casting yard. Each blockout exposed one shear stirrup, and each stirrup was lined up with a shear stirrup in the blockout of the adjacent member. The stirrups were connected across the joint by an 11-in long No. 4 Grade 60 reinforcing bar using at least a 5-in lap splice. In related research (Halbe, 2014) it has been shown that No. 4 reinforcing bars can be fully developed in UHPC and VHPC with a 5-in lap splice length. Figure 15 is a photograph of two adjacent blockouts with the tied stirrup splice reinforcing bar. The blockout connection is proposed because it is suited to handle the transverse tension stresses that occur across the joint. This connection should result in a composite connection between the adjacent beams and should reduce the likelihood of cracking of the shear key. The sub-assemblage represents a 2-ft section of a bridge, because the initial analysis indicated that a spacing for full-scale implementation of 2 ft on center is adequate to keep service stresses low. Additional research should be done to test further the efficiency of this spacing.
Figure 15. Blockout With Tied in Lap Splice Bar Before UHPC Placement
The partial depth shear key and the blockouts were filled with UHPC. UHPC is preferred
over grout for this connection for several reasons:
13
1. It provides short lap splice length so that a smaller blockout length can be used.
2. Higher bond stresses between the UHPC and adjacent member concrete can be developed.
3. It has higher tensile strength than grout and has post-cracking tensile capacity as well due to steel fiber reinforcement. The steel fibers also help to abate cracking caused by shrinkage and other stresses, which make it a durable material.
The UHPC used is a proprietary mix called Ductal and is manufactured by Lafarge.
Ductal comes in a premix bag consisting of portland cement, fine sand, silica fume, and ground quartz. The premix bag is mixed with water, a high-range water reducer, and steel fibers. The steel fibers used were undeformed straight fibers with a 0.008-in diameter and a 0.5-in length. The steel fibers have a specified minimum tensile strength of 377 ksi. Lafarge lists the average compressive and flexural strength of Ductal as 29 ksi and 6.5 ksi, respectively. Flexural strength is determined with a modulus of rupture bar, and the stress is calculated using the equation My/I. This equation is not valid for calculating the tensile stress after cracking occurs, but the resulting calculated stress, referred to as flexural strength, can be used for comparison purposes.
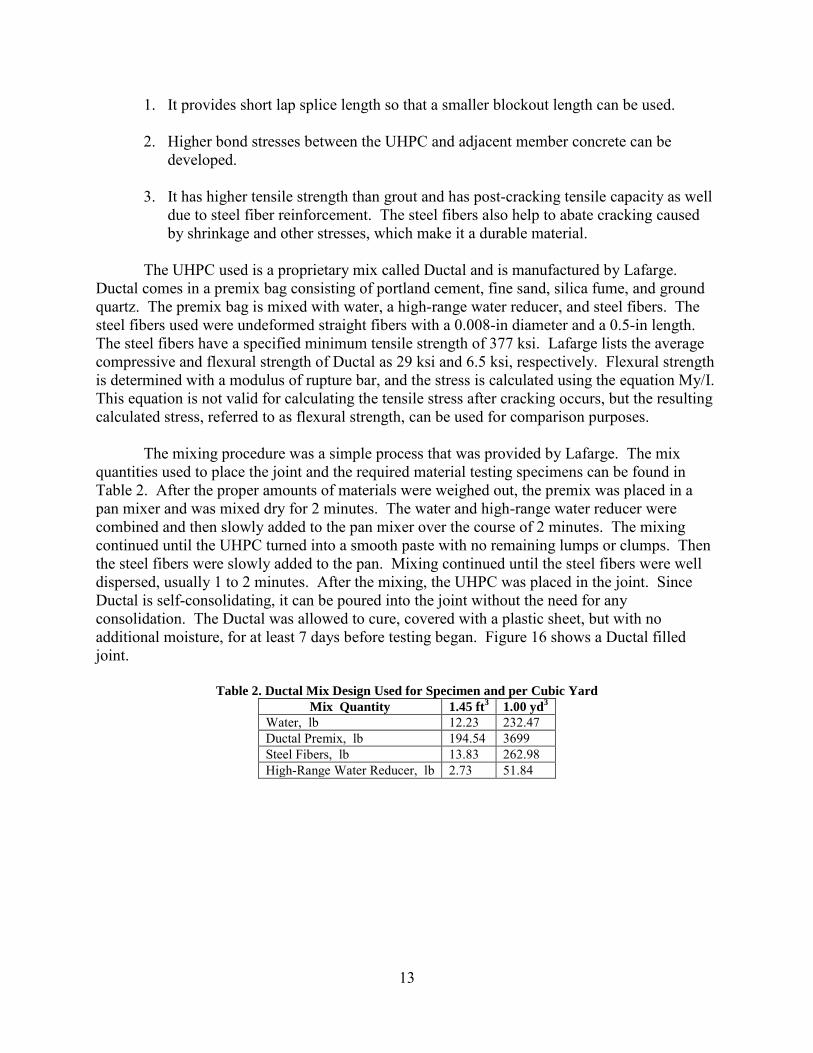
The mixing procedure was a simple process that was provided by Lafarge. The mix quantities used to place the joint and the required material testing specimens can be found in Table 2. After the proper amounts of materials were weighed out, the premix was placed in a pan mixer and was mixed dry for 2 minutes. The water and high-range water reducer were combined and then slowly added to the pan mixer over the course of 2 minutes. The mixing continued until the UHPC turned into a smooth paste with no remaining lumps or clumps. Then the steel fibers were slowly added to the pan. Mixing continued until the steel fibers were well dispersed, usually 1 to 2 minutes. After the mixing, the UHPC was placed in the joint. Since Ductal is self-consolidating, it can be poured into the joint without the need for any consolidation. The Ductal was allowed to cure, covered with a plastic sheet, but with no additional moisture, for at least 7 days before testing began. Figure 16 shows a Ductal filled joint.
Table 2. Ductal Mix Design Used for Specimen and per Cubic Yard Mix Quantity 1.45 ft3 1.00 yd3
Water, lb 12.23 232.47 Ductal Premix, lb 194.54 3699 Steel Fibers, lb 13.83 262.98 High-Range Water Reducer, lb 2.73 51.84

14
Figure 16. Photograph of Cured UHPC Joint
New Connection Detail With VHPC
The third connection type with VHPC used the same specimen configuration as used for the third connection with UHPC. The difference with this connection is that instead of using UHPC, a nonproprietary mix developed at Virginia Tech was used to fill the joint and blockout. This mix is denoted as a very-high-performance concrete (VHPC). This material substitution was made because Ductal is an expensive, proprietary, material. If the VHPC performed adequately, then it would be a more cost effective solution than UHPC. The VHPC mix consisted of water, portland cement, silica fume, fly ash, No.10 sand, ¼-in limestone, a high-range water reducer, and steel fibers. The steel fibers were Dramix ZP 305 hooked-end fibers manufactured by Bekaert. They are 1.18 in long and have a diameter of 0.02 in. From preliminary testing done at Virginia Tech, the average 28-day compressive strength and flexural tensile strength of the VHPC were 16 ksi and 2.3 ksi, respectively. The required volume for placing both the joints and material property specimens was 1.45 ft3. The mix design used for this volume and per cubic yard is provided in Table 3.
Table 3. VHPC Mix Design for Specimen and per Cubic Yard Mix Quantity 1.45 ft3 1.00 yd3
Water, lb 17.11 318.6 Type I/II Cement, lb 60.18 1120.5 Silica Fume, lb 12.91 240.3 Fly Ash, lb 12.91 240.3 No. 10 Sand, lb 77.87 1449.9 ¼ in Limestone, lb 33.35 621 Steel Fibers, lb 14.21 264.6 High-Range Water Reducer, ml 540 10000
After the materials were weighed, the sand and limestone were placed in the pan mixer
with a little bit of water in order to control the dust. The sand and limestone were mixed until the materials were dispersed evenly. Next the cement was added, and then half of the remaining water was slowly poured into the mixer. The silica fume and fly ash were slowly added, followed by the rest of the water. The high-range water reducer was added in increments until the desired consistency was achieved. Finally, the steel fibers were added to the mixture. The Dramix fibers do not come shipped as single fibers; instead a number are glued together with a water-soluble adhesive. Figure 17 is a photograph showing the fibers glued together. Mixing

15
continued until the fibers broke apart and dispersed evenly throughout the mixture. When the mixing was complete, the VHPC was placed in the joint. Like the Ductal mixture, the VHPC had a flowable consistency that allowed it to be placed into the joint without the need for consolidation.
Figure 17. Photograph Showing the Dramix Fibers, Which Come Glued Together
Specimen Toppings
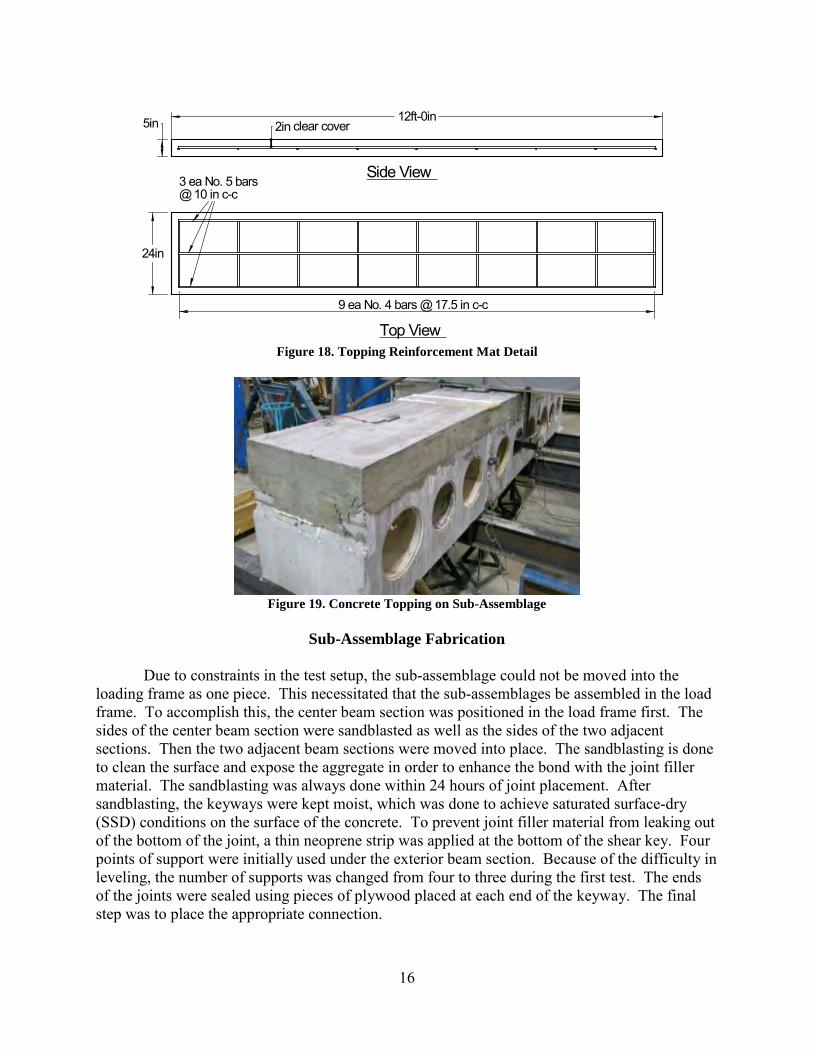
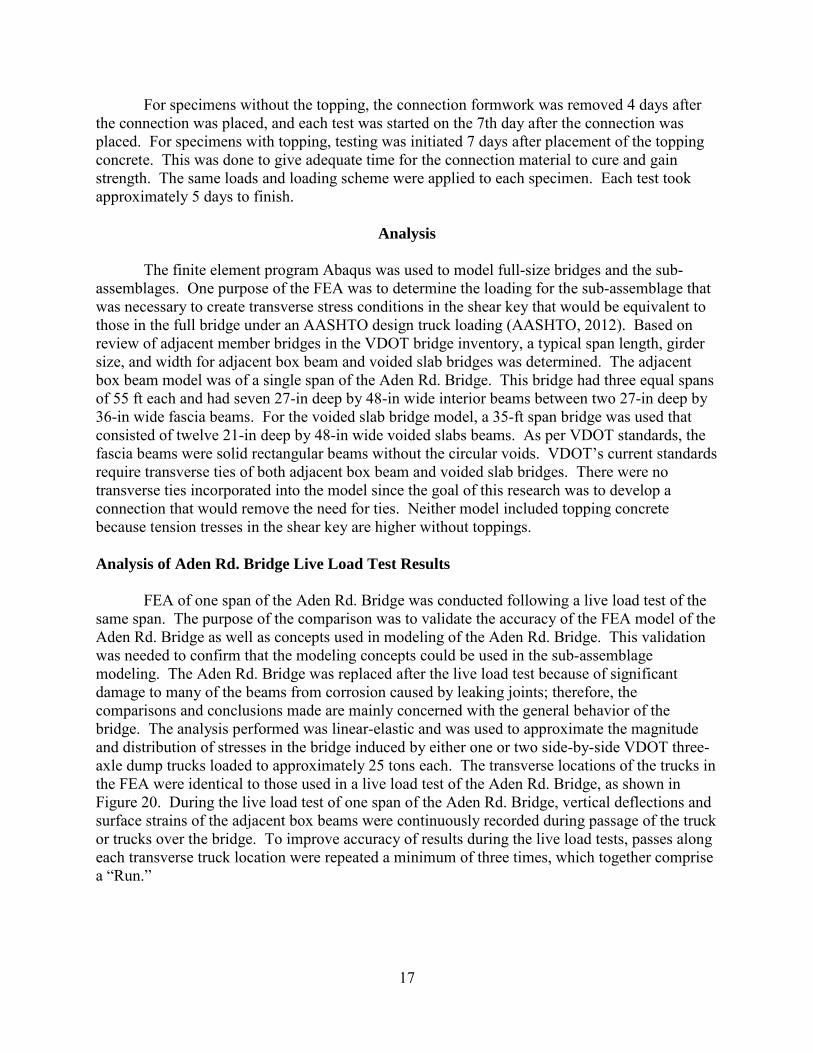
The connections with a topping were identical to the two connections previously described, with the exception that a 5-in concrete topping was added to the specimen. VDOT specifies that adjacent member bridges can have an asphalt topping, a 5-in thick concrete topping with two layers of reinforcing steel, or a 7.5-in concrete topping with four layers of reinforcing steel , depending on the average daily traffic (ADT) and the average daily truck traffic (ADTT) of the route that the bridge will carry. For relatively high traffic volumes (ADT > 4,000 and ADTT > 200), VDOT requires the 7.5-in topping. Bridges with relatively low traffic volumes (ADT < 4,000 and ADTT < 100) require only an asphalt overlay. For bridges with ADTT between 200 and 100, a 5-in topping is required by VDOT. It was not feasible to test both the 7.5-in and 5-in topping. The 5-in topping was chosen because voided slab bridges are usually only selected on bridges that receive a lower traffic volume because of the deterioration of the joint previously described. Figure 18 shows the reinforcement mat detail that was used for the topping. Seventy-two hours after the joint was placed with its respective UHPC or VHPC, the formwork for the joint was removed. Then the reinforcement mat was laid into place and the topping formwork built around it. A VDOT Class A4 (4,000-psi 28-day compressive strength) concrete, supplied by a local ready-mix plant, was used in the toppings. Once at the lab, the concrete’s slump was tested to make sure it was of the correct consistency. The concrete was then placed on the specimen and consolidated using a pencil vibrator. After the concrete had cured under wet burlap and plastic for 48 hours, the formwork for the topping was removed. Figure 19 shows the sub-assemblage with the topping in place.
16
Figure 18. Topping Reinforcement Mat Detail
Figure 19. Concrete Topping on Sub-Assemblage
Sub-Assemblage Fabrication
Due to constraints in the test setup, the sub-assemblage could not be moved into the
loading frame as one piece. This necessitated that the sub-assemblages be assembled in the load frame. To accomplish this, the center beam section was positioned in the load frame first. The sides of the center beam section were sandblasted as well as the sides of the two adjacent sections. Then the two adjacent beam sections were moved into place. The sandblasting is done to clean the surface and expose the aggregate in order to enhance the bond with the joint filler material. The sandblasting was always done within 24 hours of joint placement. After sandblasting, the keyways were kept moist, which was done to achieve saturated surface-dry (SSD) conditions on the surface of the concrete. To prevent joint filler material from leaking out of the bottom of the joint, a thin neoprene strip was applied at the bottom of the shear key. Four points of support were initially used under the exterior beam section. Because of the difficulty in leveling, the number of supports was changed from four to three during the first test. The ends of the joints were sealed using pieces of plywood placed at each end of the keyway. The final step was to place the appropriate connection.
5in 12ft-0in
2in clear cover
Side View
24in
3 ea No. 5 bars@ 10 in c-c
9 ea No. 4 bars @ 17.5 in c-c
Top View
17
For specimens without the topping, the connection formwork was removed 4 days after the connection was placed, and each test was started on the 7th day after the connection was placed. For specimens with topping, testing was initiated 7 days after placement of the topping concrete. This was done to give adequate time for the connection material to cure and gain strength. The same loads and loading scheme were applied to each specimen. Each test took approximately 5 days to finish.
Analysis
The finite element program Abaqus was used to model full-size bridges and the sub-
assemblages. One purpose of the FEA was to determine the loading for the sub-assemblage that was necessary to create transverse stress conditions in the shear key that would be equivalent to those in the full bridge under an AASHTO design truck loading (AASHTO, 2012). Based on review of adjacent member bridges in the VDOT bridge inventory, a typical span length, girder size, and width for adjacent box beam and voided slab bridges was determined. The adjacent box beam model was of a single span of the Aden Rd. Bridge. This bridge had three equal spans of 55 ft each and had seven 27-in deep by 48-in wide interior beams between two 27-in deep by 36-in wide fascia beams. For the voided slab bridge model, a 35-ft span bridge was used that consisted of twelve 21-in deep by 48-in wide voided slabs beams. As per VDOT standards, the fascia beams were solid rectangular beams without the circular voids. VDOT’s current standards require transverse ties of both adjacent box beam and voided slab bridges. There were no transverse ties incorporated into the model since the goal of this research was to develop a connection that would remove the need for ties. Neither model included topping concrete because tension tresses in the shear key are higher without toppings. Analysis of Aden Rd. Bridge Live Load Test Results
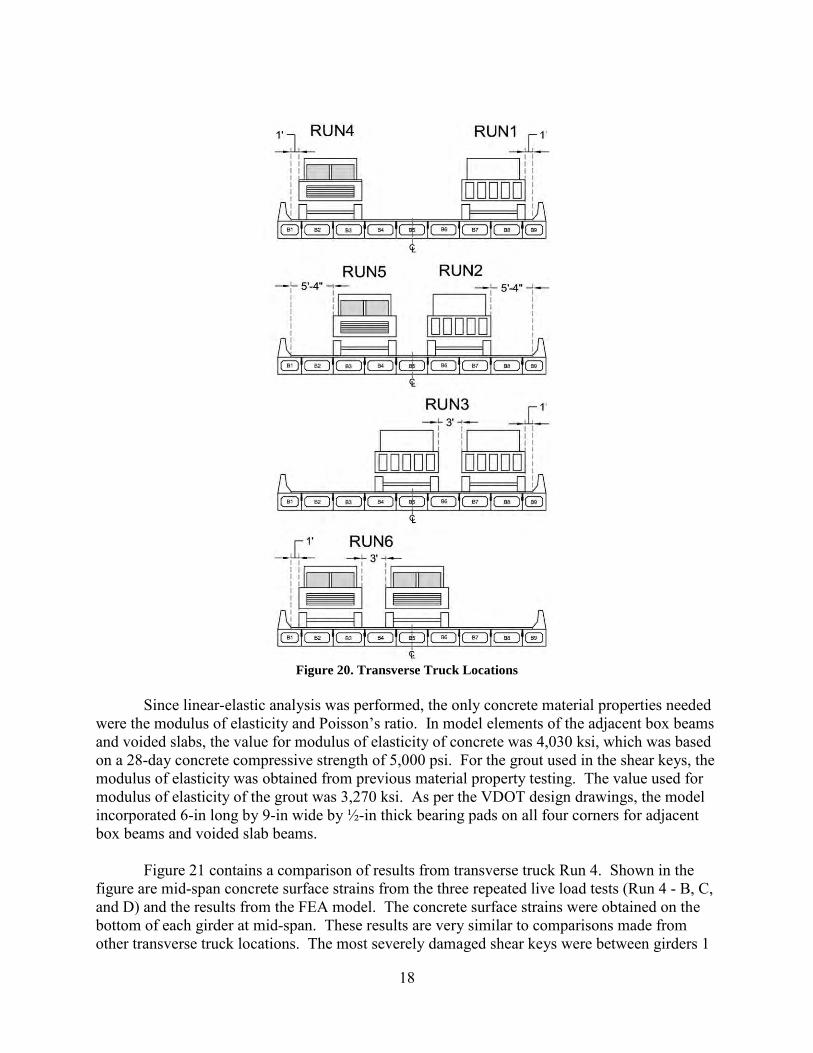
FEA of one span of the Aden Rd. Bridge was conducted following a live load test of the same span. The purpose of the comparison was to validate the accuracy of the FEA model of the Aden Rd. Bridge as well as concepts used in modeling of the Aden Rd. Bridge. This validation was needed to confirm that the modeling concepts could be used in the sub-assemblage modeling. The Aden Rd. Bridge was replaced after the live load test because of significant damage to many of the beams from corrosion caused by leaking joints; therefore, the comparisons and conclusions made are mainly concerned with the general behavior of the bridge. The analysis performed was linear-elastic and was used to approximate the magnitude and distribution of stresses in the bridge induced by either one or two side-by-side VDOT three-axle dump trucks loaded to approximately 25 tons each. The transverse locations of the trucks in the FEA were identical to those used in a live load test of the Aden Rd. Bridge, as shown in Figure 20. During the live load test of one span of the Aden Rd. Bridge, vertical deflections and surface strains of the adjacent box beams were continuously recorded during passage of the truck or trucks over the bridge. To improve accuracy of results during the live load tests, passes along each transverse truck location were repeated a minimum of three times, which together comprise a “Run.”
18
Figure 20. Transverse Truck Locations
Since linear-elastic analysis was performed, the only concrete material properties needed
were the modulus of elasticity and Poisson’s ratio. In model elements of the adjacent box beams and voided slabs, the value for modulus of elasticity of concrete was 4,030 ksi, which was based on a 28-day concrete compressive strength of 5,000 psi. For the grout used in the shear keys, the modulus of elasticity was obtained from previous material property testing. The value used for modulus of elasticity of the grout was 3,270 ksi. As per the VDOT design drawings, the model incorporated 6-in long by 9-in wide by ½-in thick bearing pads on all four corners for adjacent box beams and voided slab beams.
Figure 21 contains a comparison of results from transverse truck Run 4. Shown in the figure are mid-span concrete surface strains from the three repeated live load tests (Run 4 - B, C, and D) and the results from the FEA model. The concrete surface strains were obtained on the bottom of each girder at mid-span. These results are very similar to comparisons made from other transverse truck locations. The most severely damaged shear keys were between girders 1

19
and 2 and between girders 2 and 3. This damage was not included in the FEA model because of the difficulty in capturing the effects. The model and live load test results show similar behavior away from the severely damaged areas; however, in the area where the shear keys were showing significant signs of deterioration such as leaking and spalling, the two are quite different. The live load results in these areas are indicative of a significant loss of transverse load distribution, which would occur if the shear keys had failed. The FEA results show a best-case transverse load distribution that results from intact and properly functioning shear keys. In general, there is satisfactory agreement between the model and live load tests results to continue using the full bridge model for further analyses.
Figure 21. Analysis and Live Load Test Results Comparison
Extension of FEA Model to Sub-Assemblage
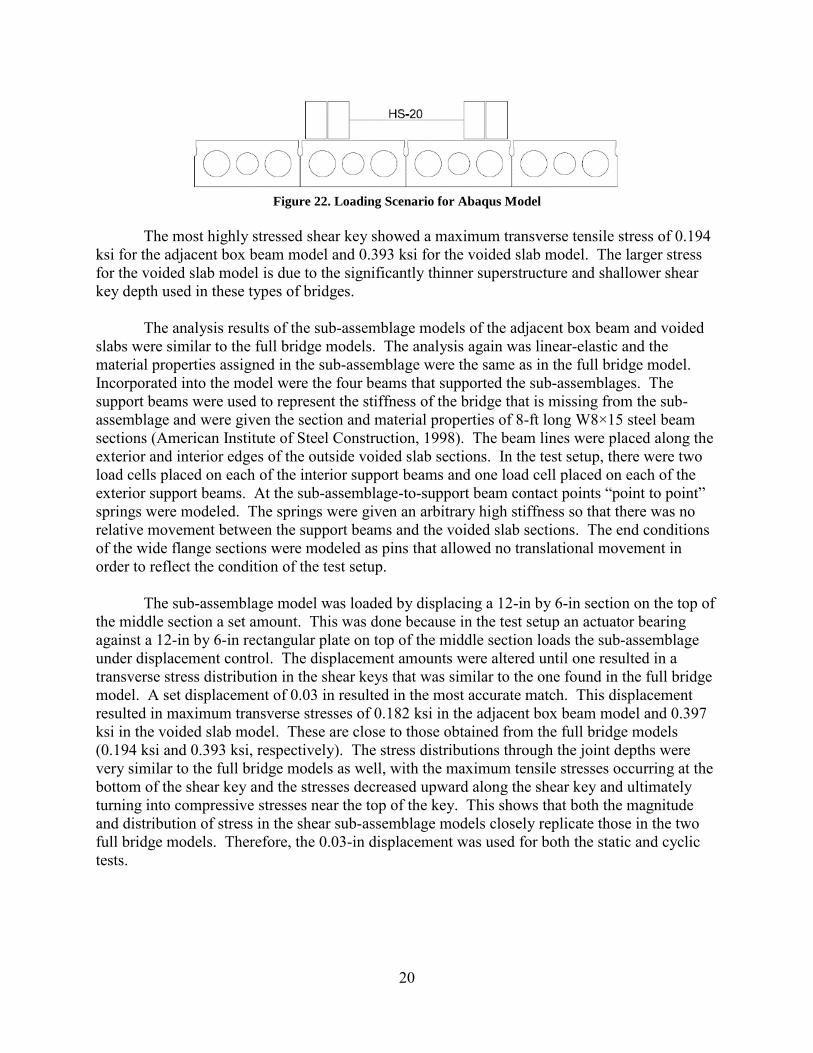
Subsequent to validation of the Aden Rd. Bridge model, the loading scenario was changed. Instead of using the actual size and weight of the truck used in the live load test, the truck loading was changed to the AASHTO HL-93 truck (AASHTO (2012)). The HL-93 truck has three axles, and a dynamic load allowance of 1.33 was used. Influence line calculations were completed to find the longitudinal position of the truck that produced the maximum service load moment. In order to cause worst-case transverse stresses in the shear key under HL-93 loading, the truck was transversely placed in the travel lane of the bridge where it was spanning one joint and thus had two tire loads directly adjacent to two other joints. A schematic showing this loading scenario is presented in Figure 22.
20
Figure 22. Loading Scenario for Abaqus Model
The most highly stressed shear key showed a maximum transverse tensile stress of 0.194
ksi for the adjacent box beam model and 0.393 ksi for the voided slab model. The larger stress for the voided slab model is due to the significantly thinner superstructure and shallower shear key depth used in these types of bridges.
The analysis results of the sub-assemblage models of the adjacent box beam and voided slabs were similar to the full bridge models. The analysis again was linear-elastic and the material properties assigned in the sub-assemblage were the same as in the full bridge model. Incorporated into the model were the four beams that supported the sub-assemblages. The support beams were used to represent the stiffness of the bridge that is missing from the sub-assemblage and were given the section and material properties of 8-ft long W8×15 steel beam sections (American Institute of Steel Construction, 1998). The beam lines were placed along the exterior and interior edges of the outside voided slab sections. In the test setup, there were two load cells placed on each of the interior support beams and one load cell placed on each of the exterior support beams. At the sub-assemblage-to-support beam contact points “point to point” springs were modeled. The springs were given an arbitrary high stiffness so that there was no relative movement between the support beams and the voided slab sections. The end conditions of the wide flange sections were modeled as pins that allowed no translational movement in order to reflect the condition of the test setup.
The sub-assemblage model was loaded by displacing a 12-in by 6-in section on the top of the middle section a set amount. This was done because in the test setup an actuator bearing against a 12-in by 6-in rectangular plate on top of the middle section loads the sub-assemblage under displacement control. The displacement amounts were altered until one resulted in a transverse stress distribution in the shear keys that was similar to the one found in the full bridge model. A set displacement of 0.03 in resulted in the most accurate match. This displacement resulted in maximum transverse stresses of 0.182 ksi in the adjacent box beam model and 0.397 ksi in the voided slab model. These are close to those obtained from the full bridge models (0.194 ksi and 0.393 ksi, respectively). The stress distributions through the joint depths were very similar to the full bridge models as well, with the maximum tensile stresses occurring at the bottom of the shear key and the stresses decreased upward along the shear key and ultimately turning into compressive stresses near the top of the key. This shows that both the magnitude and distribution of stress in the shear sub-assemblage models closely replicate those in the two full bridge models. Therefore, the 0.03-in displacement was used for both the static and cyclic tests.

21
Test Method
The 12 sub-assemblages that were fabricated and tested were designed to replicate the transverse bending found in mid-span sections of typical adjacent box beam and voided slab bridges. The specimens were subjected to static and cyclic loads in order to evaluate the relative performance of the new, proposed shear key concepts. Boundary conditions used in the tests mimicked those found in the sub-assemblage models. The loading frame consisted of two columns that were bolted to the reaction floor, and were spaced 8 ft apart. Connecting the columns, 10 ft above the reaction floor, were two cross beams that were bolted to both columns. The servo-controlled hydraulic actuator used to load the specimen was bolted to the center of the cross beams, and was positioned vertically so as to load the sub-assemblages in the center. The actuator system was capable of applying both static and cyclic loads under either load or displacement control. Figure 23 is a front view of the test setup.
Figure 23. Front View of Test Setup. HSS = Hollow Structural Section.
The testing protocol commenced with an initial static test meant to mimic an HL-93
design load. As discussed previously, FEA was used to determine that a vertical specimen deflection of 0.03 in corresponded to sub-assemblage deformation similar to that found in a full-size bridge. After the initial static test was complete, cyclic loads of the same magnitude as the initial static test were applied. The purpose of the cyclic loads was to determine the behavior of the different connections under repeated loads to mimic actual truck traffic. The frequency of displacement application was from 2 to 3 Hz for the cyclic tests and was applied in the form of a sine wave. The cyclic tests were periodically stopped in order to repeat static tests of the specimen. A total of 1 million cycles were planned to be applied to the specimen unless the joint failed prior to test completion. The purpose of the intermittent static tests was to observe the performance of the specimens during cyclic testing. The initial static tests measured the as-fabricated behavior of the specimens. The main focus of the intermittent static tests was to record any degradation of stiffness that would occur during repeated loads. The intermittent static tests were performed with a logarithmic frequency such that static tests were performed after 10, 100, 1,000, 10,000, and 100,000 cycles, with additional static tests after each 100,000

22
cycles following the first 100,000 cycles, until a total of 1 million cycles was reached. Finally, the specimens were loaded statically to failure at the conclusion of cyclic testing to measure the post-test specimen stiffness and ultimate strength.
Instrumentation
Instrumentation was used to measure joint openings, vertical deflection, concrete and steel strains, and applied loads. All of the instruments were connected to a high-speed data acquisition system, which collected data from each instrument at a rate of 50 scans per second.
Joint opening during testing was measured using Linear Variable Differential Transducers (LVDTs) in two locations at each joint face: at the bottom of the shear key and at the bottom of the adjacent beam sections as shown in Figure 24. The LVDT at the bottom of the shear key was important because a sudden change in deflections here would imply cracking in the shear key. There were eight of these horizontally placed LVDTs in total, since there were two at each joint face with two faces per joint.
Figure 24. Photograph Showing Instrumented Joint
Aside from the horizontally placed LVDTs, there were also six LVDTs used to measure
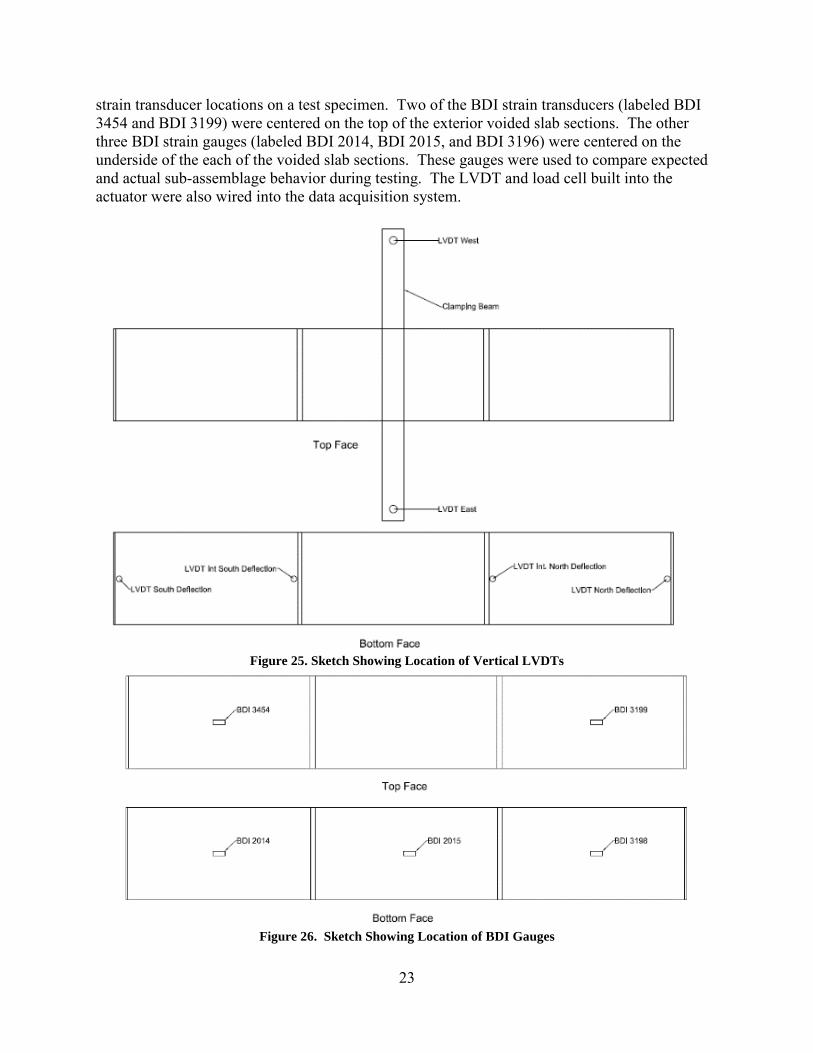
vertical movements. Figure 25 is a sketch showing the location of the six LVDTs used to measure vertical deflection. Two of these vertical LVDTs (labeled LVDT East and West) were placed on both ends of the spreader beam, which was attached to the actuator. These LVDTs served two purposes. First, these vertical LVDTs measured the deflection that the actuator directly imposed on the specimen. The second purpose was to make the sure the spreader beam remained level during testing. The other four vertical LVDTs (labeled LVDT South, LVDT Interior South, LVDT North, and LVDT Interior North) were placed under the two exterior voided slab specimens to measure vertical deflection of the specimen. These LVDTs were placed next to both of the supporting wide flange sections and longitudinally in the middle of the specimens. The other instruments used in this setup were five strain transducers from Bridge Diagnostics Inc. (BDI) that were used to measure concrete surface strain. Figure 26 shows BDI
23
strain transducer locations on a test specimen. Two of the BDI strain transducers (labeled BDI 3454 and BDI 3199) were centered on the top of the exterior voided slab sections. The other three BDI strain gauges (labeled BDI 2014, BDI 2015, and BDI 3196) were centered on the underside of the each of the voided slab sections. These gauges were used to compare expected and actual sub-assemblage behavior during testing. The LVDT and load cell built into the actuator were also wired into the data acquisition system.
Figure 25. Sketch Showing Location of Vertical LVDTs
Figure 26. Sketch Showing Location of BDI Gauges
24
Material Testing
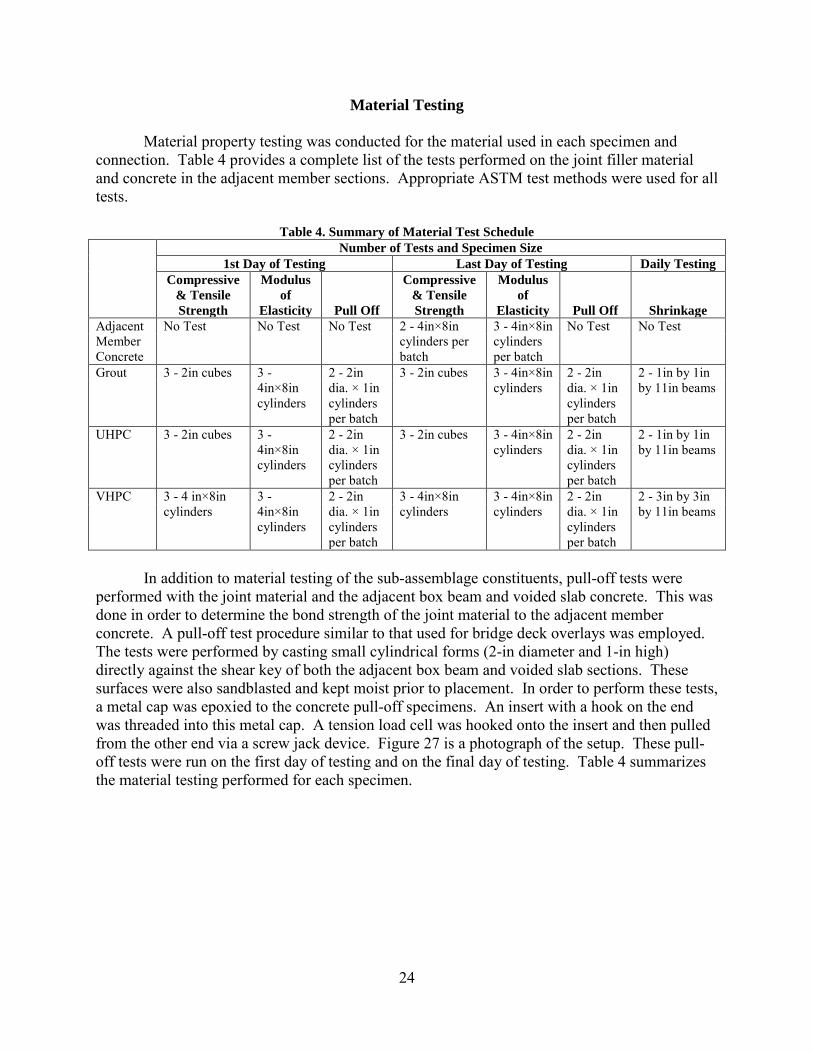
Material property testing was conducted for the material used in each specimen and connection. Table 4 provides a complete list of the tests performed on the joint filler material and concrete in the adjacent member sections. Appropriate ASTM test methods were used for all tests.
Table 4. Summary of Material Test Schedule
Number of Tests and Specimen Size 1st Day of Testing Last Day of Testing Daily Testing
Compressive & Tensile Strength
Modulus of
Elasticity
Pull Off
Compressive & Tensile Strength
Modulus of
Elasticity
Pull Off
Shrinkage Adjacent Member Concrete
No Test No Test No Test 2 - 4in×8in cylinders per batch
3 - 4in×8in cylinders per batch
No Test No Test
Grout 3 - 2in cubes 3 - 4in×8in cylinders
2 - 2in dia. × 1in cylinders per batch
3 - 2in cubes 3 - 4in×8in cylinders
2 - 2in dia. × 1in cylinders per batch
2 - 1in by 1in by 11in beams
UHPC 3 - 2in cubes 3 - 4in×8in cylinders
2 - 2in dia. × 1in cylinders per batch
3 - 2in cubes 3 - 4in×8in cylinders
2 - 2in dia. × 1in cylinders per batch
2 - 1in by 1in by 11in beams
VHPC 3 - 4 in×8in cylinders
3 - 4in×8in cylinders
2 - 2in dia. × 1in cylinders per batch
3 - 4in×8in cylinders
3 - 4in×8in cylinders
2 - 2in dia. × 1in cylinders per batch
2 - 3in by 3in by 11in beams
In addition to material testing of the sub-assemblage constituents, pull-off tests were
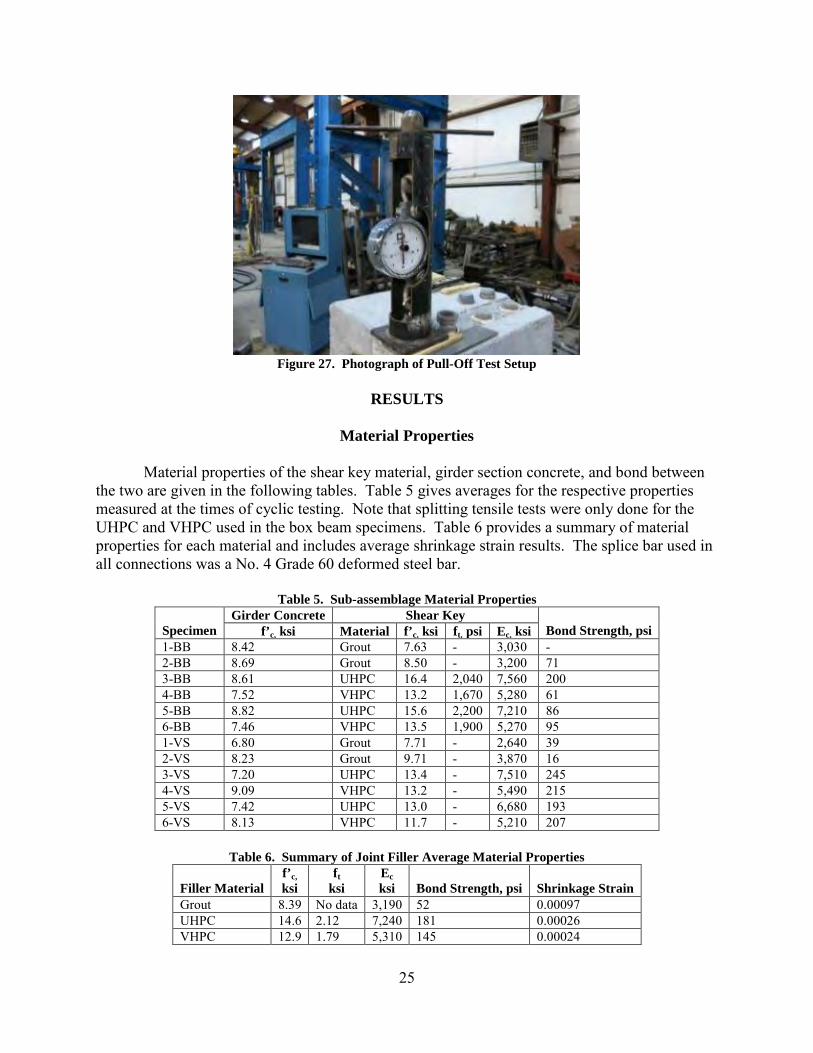
performed with the joint material and the adjacent box beam and voided slab concrete. This was done in order to determine the bond strength of the joint material to the adjacent member concrete. A pull-off test procedure similar to that used for bridge deck overlays was employed. The tests were performed by casting small cylindrical forms (2-in diameter and 1-in high) directly against the shear key of both the adjacent box beam and voided slab sections. These surfaces were also sandblasted and kept moist prior to placement. In order to perform these tests, a metal cap was epoxied to the concrete pull-off specimens. An insert with a hook on the end was threaded into this metal cap. A tension load cell was hooked onto the insert and then pulled from the other end via a screw jack device. Figure 27 is a photograph of the setup. These pull-off tests were run on the first day of testing and on the final day of testing. Table 4 summarizes the material testing performed for each specimen.
25
Figure 27. Photograph of Pull-Off Test Setup
RESULTS
Material Properties
Material properties of the shear key material, girder section concrete, and bond between
the two are given in the following tables. Table 5 gives averages for the respective properties measured at the times of cyclic testing. Note that splitting tensile tests were only done for the UHPC and VHPC used in the box beam specimens. Table 6 provides a summary of material properties for each material and includes average shrinkage strain results. The splice bar used in all connections was a No. 4 Grade 60 deformed steel bar.
Table 5. Sub-assemblage Material Properties
Specimen Girder Concrete Shear Key
Bond Strength, psi f’c, ksi Material f’c, ksi ft, psi Ec, ksi 1-BB 8.42 Grout 7.63 - 3,030 - 2-BB 8.69 Grout 8.50 - 3,200 71 3-BB 8.61 UHPC 16.4 2,040 7,560 200 4-BB 7.52 VHPC 13.2 1,670 5,280 61 5-BB 8.82 UHPC 15.6 2,200 7,210 86 6-BB 7.46 VHPC 13.5 1,900 5,270 95 1-VS 6.80 Grout 7.71 - 2,640 39 2-VS 8.23 Grout 9.71 - 3,870 16 3-VS 7.20 UHPC 13.4 - 7,510 245 4-VS 9.09 VHPC 13.2 - 5,490 215 5-VS 7.42 UHPC 13.0 - 6,680 193 6-VS 8.13 VHPC 11.7 - 5,210 207
Table 6. Summary of Joint Filler Average Material Properties
Filler Material
f’c, ksi
ft ksi
Ec ksi
Bond Strength, psi
Shrinkage Strain
Grout 8.39 No data 3,190 52 0.00097 UHPC 14.6 2.12 7,240 181 0.00026 VHPC 12.9 1.79 5,310 145 0.00024

26
Bond strength is an important property for a joint filler material. Table 6 shows that grout has relatively low bond strength, while both the UHPC and VHPC have high bond strength. Some UHPC and VHPC pull-off specimens failed in the substrate concrete, not at the UHPC or VHPC-substrate interface. This shows that the bond strengths were higher than the tensile strength of the substrate concrete. Consistent with the pull-off test results, the specimens with grouted connections developed full-length cracks in the shear key at relatively low loads, while the UHPC and VHPC connections took much higher loads before developing cracks. The low bond strength of the grout to the precast concrete resulted in debonding of the entire shear key, which could be removed, leaving no grout pieces bonded to the concrete. Figure 28 shows a post-cracking grouted shear key, which remained intact after fully debonding from the precast concrete.
Figure 28. Intact Shear Key After Failure of Bonded Connection
Table 6 shows that the shrinkage strains are almost four times higher in the grout
compared to both the UHPC and VHPC. Shrinkage is another important material property of the joint filler material because high shrinkage strains will lead to high transverse tensile stresses at the concrete–filler material interface. Other proof of the high shrinkage strains were early-age shrinkage cracks that developed at the grout-to-concrete interface seen in specimens containing grouted shear keys. There were no shrinkage cracks observed in either of the UHPC or VHPC specimens.
Table 6 shows that both the UHPC and VHPC had relatively high and comparable
compressive strengths. The grout had high compressive strengths when compared against the beam concrete, but not as high as the UHPC or VHPC. The table also shows that the grout had a relatively low modulus of elasticity value. The UHPC had the highest modulus value while the VHPC had a slightly lower modulus, but both were much higher than the grout’s modulus.
Table 7 gives the material costs per cubic yard of each material. The costs are estimated and will vary depending on the location where the material is being procured. The table shows
27
that UHPC is by far the most expensive of the three, while the grout and VHPC have comparable costs.
In summary, the material properties of the non-shrink grout are inferior to both the UHPC and VHPC. The grout has low bond strength and high shrinkage strains. The UHPC and VHPC have very comparable properties; however, the UHPC is more than twice the cost of the VHPC.
Table 7. Price Estimates for Filler Materials Material Price per Cubic Yard Grout $770 UHPC $2,500 VHPC $1,000
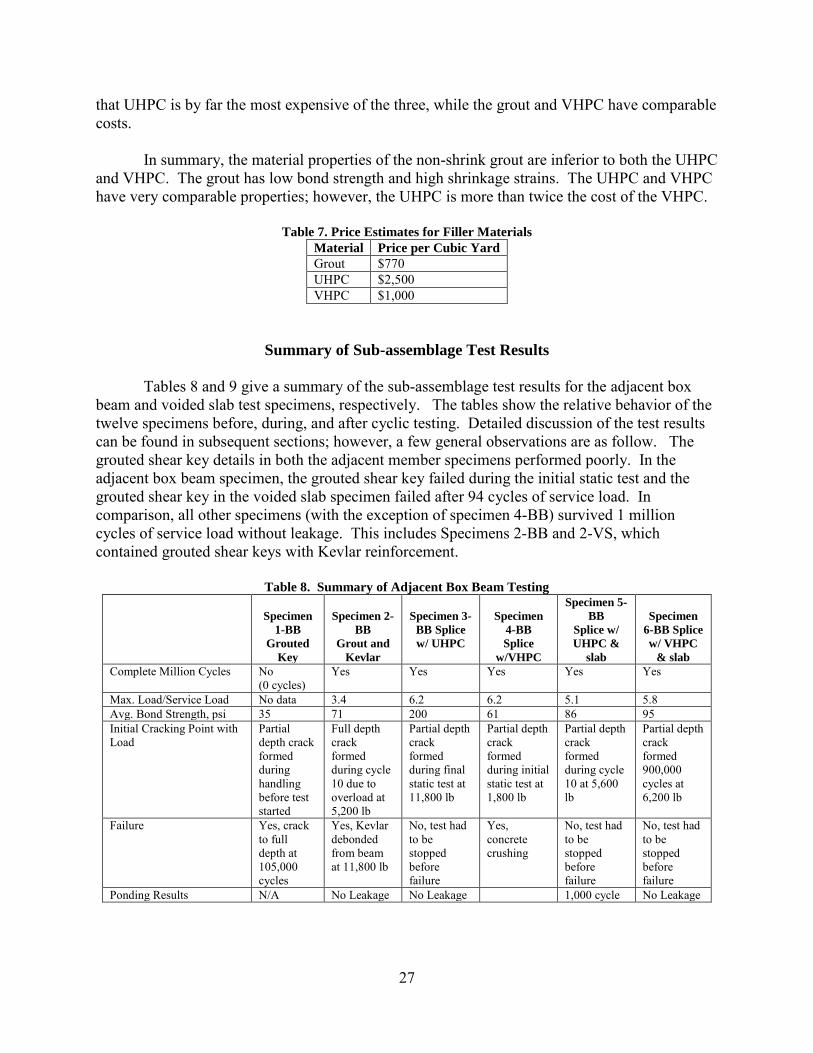
Summary of Sub-assemblage Test Results
Tables 8 and 9 give a summary of the sub-assemblage test results for the adjacent box beam and voided slab test specimens, respectively. The tables show the relative behavior of the twelve specimens before, during, and after cyclic testing. Detailed discussion of the test results can be found in subsequent sections; however, a few general observations are as follow. The grouted shear key details in both the adjacent member specimens performed poorly. In the adjacent box beam specimen, the grouted shear key failed during the initial static test and the grouted shear key in the voided slab specimen failed after 94 cycles of service load. In comparison, all other specimens (with the exception of specimen 4-BB) survived 1 million cycles of service load without leakage. This includes Specimens 2-BB and 2-VS, which contained grouted shear keys with Kevlar reinforcement.
Table 8. Summary of Adjacent Box Beam Testing
Specimen
1-BB Grouted
Key
Specimen 2-
BB Grout and
Kevlar
Specimen 3-
BB Splice w/ UHPC
Specimen
4-BB Splice
w/VHPC
Specimen 5-BB
Splice w/ UHPC &
slab
Specimen
6-BB Splice w/ VHPC
& slab Complete Million Cycles No
(0 cycles) Yes Yes Yes Yes Yes
Max. Load/Service Load No data 3.4 6.2 6.2 5.1 5.8 Avg. Bond Strength, psi 35 71 200 61 86 95 Initial Cracking Point with Load
Partial depth crack formed during handling before test started
Full depth crack formed during cycle 10 due to overload at 5,200 lb
Partial depth crack formed during final static test at 11,800 lb
Partial depth crack formed during initial static test at 1,800 lb
Partial depth crack formed during cycle 10 at 5,600 lb
Partial depth crack formed 900,000 cycles at 6,200 lb
Failure Yes, crack to full depth at 105,000 cycles
Yes, Kevlar debonded from beam at 11,800 lb
No, test had to be stopped before failure
Yes, concrete crushing
No, test had to be stopped before failure
No, test had to be stopped before failure
Ponding Results N/A No Leakage No Leakage 1,000 cycle No Leakage

28
Table 9. Summary of Voided Slab Testing
Specimen 1-VS
Grouted Key
Specimen 2-VS
Grout and
Kevlar
Specimen
3-VS Splice
w/UHPC
Specimen
4-VS Splice
w/VHPC
Specimen 5-VS
Splice w/ UHPC &
Slab
Specimen 6-VS
Splice w/ VHPC &
Slab Complete Million Cycles
No (94 cycles)
Yes Yes Yes Yes Yes
Max. Load/Service Load 1 4.4 7.2 8.5 7.7 8.1 Avg. Bond Strength, psi 35 17 260 230 240 230 Initial Cracking Point with Load
Partial depth crack formed during initial static test at 1,260 lb
Partial depth crack formed during initial static test at 2,330 lb
Partial depth crack formed during the 10,000 cycle regimen at 3,500 lb
Partial depth crack formed during final static test at 10,300 lb
Partial depth crack formed during final static test at 16,300 lb
Partial depth crack formed during final static test at 15,300 lb
Failure Yes, grouted north key debonded
Yes, both grouted keys and Kevlar debonded on S key
Yes, concrete crushing on south key
No, test had to be stopped before failure
No, test had to be stopped before failure
No, test had to be stopped before failure
Ponding Results N/A No Leakage
No Leakage
No Leakage
No Leakage
No Leakage
There were two main differences between the behaviors of specimens with Kevlar-
reinforced, grouted shear keys and the specimens containing UHPC or VHPC. One difference was the ratio of maximum load to service load. This was obtained during the post-cyclic test to failure and is an indication of overload strength of the connection. The Kevlar-reinforced, grouted specimens had ratios about half of those of the specimens with UHPC and VHPC. The second difference was the point at which first cracking occurred. In the Kevlar-reinforced, grouted specimens, initial cracking occurred very early in the cyclic testing and, due to the low bond strength between the grout and girder section, was a complete full-depth crack. However, in the specimens containing UHPC and VHPC, four of these eight specimens survived to 1 million cycles without visible cracks, and the ones that did crack only showed short tension cracks at the bottom of the shear key.
DISCUSSION
The following section compares the specimens’ behaviors during the initial static tests, cyclic testing, and final static tests.
Initial Static Tests
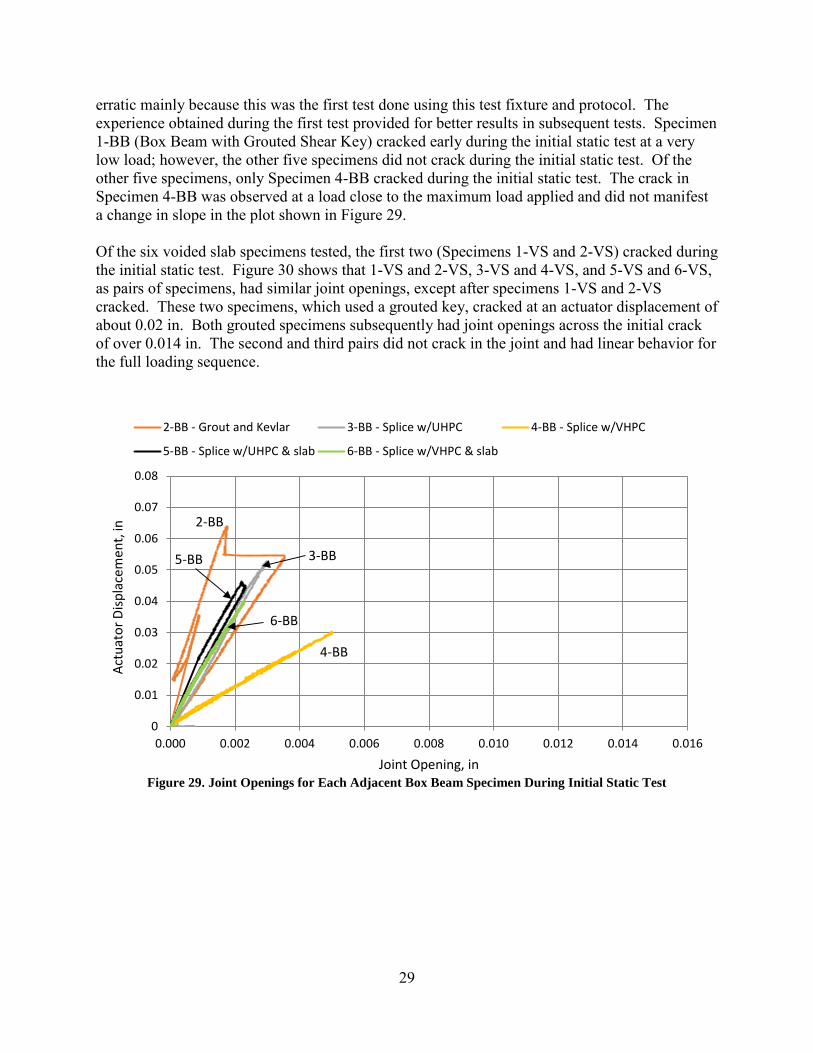
The initial static test was important because it showed how the “as fabricated” connection responded to a single service load. Figure 29 shows test results (applied load versus joint opening) for the adjacent box beam test specimens. The results for the first test specimen are
29
erratic mainly because this was the first test done using this test fixture and protocol. The experience obtained during the first test provided for better results in subsequent tests. Specimen 1-BB (Box Beam with Grouted Shear Key) cracked early during the initial static test at a very low load; however, the other five specimens did not crack during the initial static test. Of the other five specimens, only Specimen 4-BB cracked during the initial static test. The crack in Specimen 4-BB was observed at a load close to the maximum load applied and did not manifest a change in slope in the plot shown in Figure 29.
Of the six voided slab specimens tested, the first two (Specimens 1-VS and 2-VS) cracked during the initial static test. Figure 30 shows that 1-VS and 2-VS, 3-VS and 4-VS, and 5-VS and 6-VS, as pairs of specimens, had similar joint openings, except after specimens 1-VS and 2-VS cracked. These two specimens, which used a grouted key, cracked at an actuator displacement of about 0.02 in. Both grouted specimens subsequently had joint openings across the initial crack of over 0.014 in. The second and third pairs did not crack in the joint and had linear behavior for the full loading sequence.
Figure 29. Joint Openings for Each Adjacent Box Beam Specimen During Initial Static Test
0
0.01
0.02
0.03
0.04
0.05
0.06
0.07
0.08
0.000 0.002 0.004 0.006 0.008 0.010 0.012 0.014 0.016
Actu
ator
Disp
lace
men
t, in
Joint Opening, in
2-BB - Grout and Kevlar 3-BB - Splice w/UHPC 4-BB - Splice w/VHPC
5-BB - Splice w/UHPC & slab 6-BB - Splice w/VHPC & slab
4-BB
2-BB
3-BB5-BB
6-BB

30
Figure 30. Joint Openings for Each Voided Slab Specimen During Initial Static Test
Tables 10 and 11 provide the cracking loads for the north and south joint in each
specimen. With the initial joint crack, the test specimen boundary conditions changed. In other words, once one joint failed, stresses were relieved at the opposite joint. This is the reason that, for most tests, one joint failed at a much lower load than the other joint. In the tables, the first side of the specimen to crack (North or South joint) is in bold. In order to compare the cracking loads, the lower of the two cracking loads will be the focus of further discussion. As seen in the plots, the general behavior is that the initial crack for grouted shear keys occurred during the initial static test or early in the cyclic testing, whereas the initial crack in UHPC and VHPC shear keys occurred during the final static test.
Table 10. Adjacent Box Beam Cracking Loads Initial Cracking Load, lb
South Joint North Joint 1-BB Grouted Shear Key None Cracked during handling 2-BB Grouted Shear Key
w/Kevlar None 5,200
(Cracked during cycle 10) 3-BB Splice w/UHPC 11,800
(Cracked during final static test) 11,800 (Cracked during final static test)
4-BB Splice w/VHPC None 1,800 (Cracked during final static test)
5-BB Splice W/UHPC and Slab
25,000 (Cracked during final static test)
5,600 (Cracked during cycle 10)
6-BB Splice W/VHPC and Slab
6,200 (Cracked during cycle 900,000)
19,500 (Cracked during final static test)
The first side of the specimen to crack (North or South joint) is indicated in bold.
0
0.005
0.01
0.015
0.02
0.025
0.03
0.035
0.04
0 0.002 0.004 0.006 0.008 0.01 0.012 0.014 0.016
Actu
ator
Disp
lace
men
t, in
Joint Opening, in
1-VS - Grouted Key 2-VS - Grout and Kevlar 3-VS - Splice w/UHPC
4-VS - Splice w/VHPC 5-VS - Splice w/UHPC & slab 6-VS - Splice w/VHPC & slab
1-VS
3-VS &4-VS
5-VS &6-VS
2-VS

31
Table 11. Voided Slab Cracking Loads Initial Cracking Load, lb
South Joint North Joint 1-VS Grouted Shear Key No Results
1,260 (Cracked during initial static test)
2-VS Grouted Shear Key w/Kevlar
2330 (Cracked during cycling) 2,330 (Cracked at Cycle 10)
3-VS Splice w/UHPC 9,700 (Cracked during final static test)
3,500 (Cracked between cycles 1,000 and 10,000)
4-VS Splice w/VHPC 21,200 (Cracked during final static test)
10,300 (Cracked during final static test)
5-VS Splice W/UHPC and Slab
16,300 (Cracked during final static test)
16,300 (Cracked during final static test)
6-VS Splice W/VHPC and Slab
27,300 (Cracked during final static test)
15,300 (Cracked during final static test)
The first side of the specimen to crack (North or South joint) is indicated in bold.
Cyclic Tests
The purpose of the cyclic regimen was to determine the relative resistance of each
connection type to cyclic loading. It was important to determine if cracks would initiate under repeated simulated loadings of an AASHTO design truck. The propagation of formed cracks was also monitored to see whether cracks would stabilize at some point or continue to grow to the full depth of the cross section. Table 12 presents the results from cyclic testing. The load at which a particular specimen cracked and the ponding test results are included in the table. Note that both of the grouted shear key specimens (Specimens 1-BB and 1-VS) cracked very early. Specimen 1-BB partially cracked during handling and the initial crack extended to full depth during the initial static test. Specimen 1-VS partially cracked during the initial static test and the crack extended to full depth by cycle 94. Since these were both full-depth cracks and water easily flowed through the specimen, ponding tests were not needed to determine joint condition.
To summarize the cyclic testing results, Specimens 2-BB through 6-BB and 2-VS
through 6-VS were all durable enough to withstand one million load cycles of a simulated AASHTO design truck with no, or minimal, cracking. Specimens 2-BB through 6-BB and 2-VS through 6-VS passed the ponding tests (with the exception of Specimen 4-BB, which had some minor leakage after cycle 1,000) with no water leakage observed.

32
Table 12. Cyclic Testing Results
Specimen
Connection Type
Cyclic Response
Cracking Load Ponding Results
Adjacent Box Beam Specimen 1-BB Grouted Shear
Key Through crack during initial static test Cracked during
handling, No cyclic test
No Results
2-BB Grouted Shear Key w/Kevlar
Cracked during cycle 10 5,200 lb. No Leakage
3-BB Splice w/UHPC Cracked during final static testing 11,800 lb. No Leakage 4-BB Splice w/VHPC Cracked during initial static test 1,800 lb. Small Leak
after cycle 1000 5-BB Splice W/UHPC
and Slab Cracked during cycle 10 5,800 lb. No Leakage
6-BB Splice W/VHPC and Slab
Cracked during cycle 900,000 6,200 lb. No Leakage
Voided Slab Specimen 1-VS Grouted Shear
Key Cracked during initial static test, through crack at cycle 94 and cyclic test terminated
1,260 lb. No Results
2-VS Grouted Shear Key w/Kevlar
Cracked during initial static test 2,330 lb. No Leakage
3-VS Splice w/UHPC Cracked during cycle 10,000 3,500 lb. No Leakage 4-VS Splice w/VHPC Cracked during final static testing 10,300 lb. No Leakage 5-VS Splice W/UHPC
and Slab Cracked during final static testing 16,300 lb. No Leakage
6-VS Splice W/VHPC and Slab
Cracked during final static testing 15,300 lb. No Leakage
Final Static Tests
Figures 31 and 32 show the final static test results for adjacent box beam specimens and voided slab specimens, respectively. At the conclusion of cyclic testing, it was intended to load each specimen to failure. However, this was not possible for all specimens. The two specimens with grouted shear keys failed before or during cyclic testing. Six of the other ten specimens could not be loaded to failure because their resistance exceeded the capacity of the test fixture. These were specimens 3-BB, 5-BB, 6-BB, 4-VS, 5-VS, and 6-VS. However, all six of these specimens resisted loads well in excess of design service load.
The design service load used during cyclic testing corresponded to an actuator displacement of 0.03 in, and simulated the displacement caused by an AASHTO design truck on the full model of the bridge. Specimens 2-BB to 6-BB and 2-VS to 6-VS greatly exceeded this level of deflection before failure or termination of the test. Specimens 2-BB and 2-VS (which contained grout with Kevlar strip above) had significantly poorer performance during the final static tests as compared to the specimen containing UHPC or VHPC; however, each of these specimens exceeded service load by a factor of approximately 4.

33
Figure 31. Load vs. Displacement Plots for Adjacent Box Beam Specimens Final Static Tests
Figure 32. Load vs. Displacement Plots for Voided Slab Specimens Final Static Tests
0
5000
10000
15000
20000
25000
30000
35000
40000
0 0.1 0.2 0.3 0.4 0.5 0.6
Load
, lb
Actuator Displacement, in
2-BB - Grout and Kevlar 3-BB - Splice w/UHPC 4-BB - Splice w/VHPC
5-BB - Splice w/UHPC & slab 6-BB - Splice w/VHPC & Slab
2-BB
4-BB
6-BB
3-BB
5-BB
-40000
-35000
-30000
-25000
-20000
-15000
-10000
-5000
00 0.1 0.2 0.3 0.4 0.5 0.6
Load
, lb
Actuator Displacement, in
2-VS - Grout and Kevlar 3-VS - Splice w/UHPC 4-VS - Splice w/VHPC
5-VS - Splice w/ UHPC & slab 6-VS - Splice w/VHPC & slab
6-VS 5-VS
4-VS
3-VS
2-VS
34
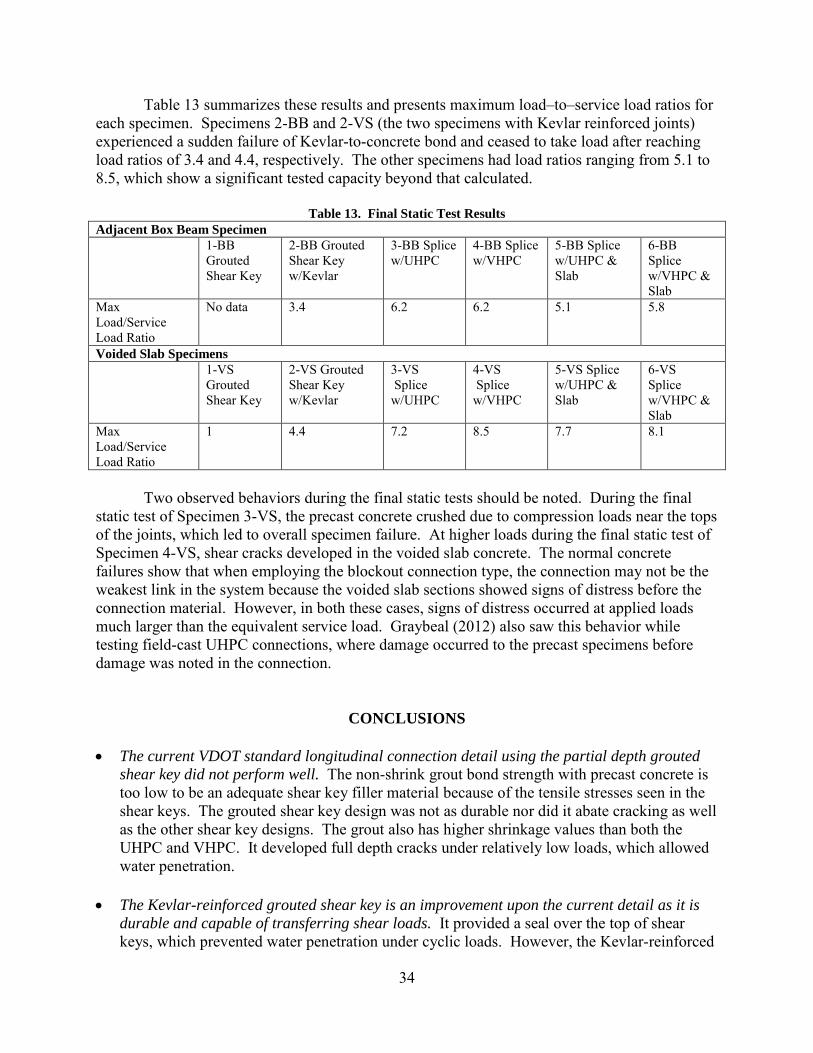
Table 13 summarizes these results and presents maximum load–to–service load ratios for each specimen. Specimens 2-BB and 2-VS (the two specimens with Kevlar reinforced joints) experienced a sudden failure of Kevlar-to-concrete bond and ceased to take load after reaching load ratios of 3.4 and 4.4, respectively. The other specimens had load ratios ranging from 5.1 to 8.5, which show a significant tested capacity beyond that calculated.
Table 13. Final Static Test Results Adjacent Box Beam Specimen 1-BB
Grouted Shear Key
2-BB Grouted Shear Key w/Kevlar
3-BB Splice w/UHPC
4-BB Splice w/VHPC
5-BB Splice w/UHPC & Slab
6-BB Splice w/VHPC & Slab
Max Load/Service Load Ratio
No data 3.4 6.2 6.2 5.1 5.8
Voided Slab Specimens 1-VS
Grouted Shear Key
2-VS Grouted Shear Key w/Kevlar
3-VS Splice w/UHPC
4-VS Splice w/VHPC
5-VS Splice w/UHPC & Slab
6-VS Splice w/VHPC & Slab
Max Load/Service Load Ratio
1 4.4 7.2 8.5 7.7 8.1
Two observed behaviors during the final static tests should be noted. During the final
static test of Specimen 3-VS, the precast concrete crushed due to compression loads near the tops of the joints, which led to overall specimen failure. At higher loads during the final static test of Specimen 4-VS, shear cracks developed in the voided slab concrete. The normal concrete failures show that when employing the blockout connection type, the connection may not be the weakest link in the system because the voided slab sections showed signs of distress before the connection material. However, in both these cases, signs of distress occurred at applied loads much larger than the equivalent service load. Graybeal (2012) also saw this behavior while testing field-cast UHPC connections, where damage occurred to the precast specimens before damage was noted in the connection.
CONCLUSIONS • The current VDOT standard longitudinal connection detail using the partial depth grouted
shear key did not perform well. The non-shrink grout bond strength with precast concrete is too low to be an adequate shear key filler material because of the tensile stresses seen in the shear keys. The grouted shear key design was not as durable nor did it abate cracking as well as the other shear key designs. The grout also has higher shrinkage values than both the UHPC and VHPC. It developed full depth cracks under relatively low loads, which allowed water penetration.
• The Kevlar-reinforced grouted shear key is an improvement upon the current detail as it is
durable and capable of transferring shear loads. It provided a seal over the top of shear keys, which prevented water penetration under cyclic loads. However, the Kevlar-reinforced
35
shear key did not prevent cracking in the key. The cracking reduces the load transferred across the key and most likely results in higher loads to beams directly under the wheel paths.
• Both UHPC and VHPC connection details performed well and proved to be very durable; all
lasted to 1 million cycles of service load without full-depth cracks. Seven specimens showed no leakage while one had small leaks attributed to poor consolidation of the VHPC in the key. The construction of these connections will require special attention to ensure they match up when cast at the precast fabrication plant. However, the use of continuous blockouts may alleviate some match up issues. The UHPC and VHPC specimens had similar material properties and behavior under all three loading scenarios.
• UHPC and VHPC proved to be much better joint filler materials than non-shrink grout for
adjacent voided slab systems as they develop much higher bond strengths with the precast concrete and have relatively low shrinkage.
• UHPC and VHPC connections with blockouts and lapped splice bars are the optimal
longitudinal connections as they abate cracking and successfully transfer both shear and moment across adjacent beams even under high loads. By abating cracks in the joint, the need for transverse ties is eliminated for the prestressed concrete members with a depth of less than or equal to 33 in.
• VHPC is a more viable option than UHPC as the joint filler material as it is a less expensive
material. In the field, VHPC will require more preparation time than UHPC because all dry constituent materials need to be weighed. UHPC comes with all dry ingredients pre-mixed. Other than this, mixing, placing and curing times are comparable.
RECOMMENDATIONS 1. VDOT’s Structure and Bridge Division should implement the blockout with lap splice
connection design using UHPC or VHPC as a filler material for the longitudinal connection detail in new adjacent member bridges. A 2-ft center-to-center spacing for the blockouts is recommended as a maximum. A recommended detail to be incorporated into the VDOT Standards is presented in the Appendix.
2. VDOT’s Structure and Bridge Division should not use transverse ties with the blockout type
connections for voided slabs and for box beams 27 in and 33 in deep. 3. VDOT districts should use VHPC in shear keys and cut outs for drop-in bars as part of a
repair method for significantly deteriorated adjacent member bridges with grouted shear keys.
4. VDOT districts should use Kevlar reinforcement as a part of the repair method for
significantly deteriorated adjacent member bridges with grouted shear keys.

36
5. VTRC should conduct further research to determine if the blockout spacing in the connection detail of 2-ft center-to-center can be optimized.
BENEFITS AND IMPLEMENTATION
Benefits
The improvement of shear key details to resist loss of bond or cracking will protect adjacent prestressed member structures from premature deterioration that results from loss of load distribution and leakage of chloride-contaminated runoff through failed longitudinal shear key joints. This will ensure longer service life and reduce maintenance and replacement costs for these types of structures.
Implementation
1. With regard to Recommendation 1, the Appendix presents suggested longitudinal shear key
and blockout details for adjacent box beams and voided slabs that could be adopted by VDOT’s Structure and Bridge Division. After additional discussion, the Structure and Bridge Division elected to use continuous longitudinal blockouts instead of discrete blockouts for ease of fabrication and construction without undermining the performance of the connection. The continuous longitudinal blockout accompanying the suggested details in the Appendix is named as the Virginia Adjacent Member Connection (VAMC). VAMC will be required for bridges that are skewed greater than 10 degrees and have asphalt overlays. The use of VAMC in all other cases of adjacent member structures will be left to the discretion of the District Bridge Engineer. After several bridges with VAMC have been fabricated, constructed, and evaluated, the Structure and Bridge Division will consider requiring the new details exclusively in VDOT’s Manual of the Structure and Bridge Division, Part 2, Chapter 12, and Part 5. VDOT’s Structure and Bridge Division has added the longitudinal shear key and blockout details for adjacent box beams and voided slabs to the Manual.
2. With regard to Recommendation 2, VDOT’s Structure and Bridge Division has revised
VDOT’s Manual of the Structure and Bridge Division, Part 5, such that transverse tendons are eliminated for all voided slabs and for box beams 27 in and 33 in deep using the newly approved connection details. For deeper box beam sections, the bottom transverse tendons will remain in place unless calculations show that these bottom tendons are not necessary.
3. With regard to Recommendations 3, 4, and 5, the applications are already being evaluated
under separate research efforts.
ACKNOWLEDGMENTS
The authors gratefully acknowledge the guidance and assistance of Michael Brown and Bernie Kassner of VTRC and Andy Zickler of VDOT’s Structure and Bridge Division. The
37
assistance of David Mokarem, Brett Farmer, Dennis Huffman, Jimmy Grant, and Carrie Field at the Thomas M. Murray Structures Laboratory at Virginia Tech is gratefully acknowledged. The additional financial support provided by the CAIT Tier I UTC Consortium led by Rutgers University is also gratefully acknowledged. The opinions in this report are those of the authors and not necessarily those of the sponsor.
REFERENCES Abaqus, I. Abaqus/Standard User's Manual. Dassaults Systèmes, Vélizy-Villacoublay, France,
2013. American Association of State Highway Transportation Officials. AASHTO LRFD
Bridge Design Specifications, 6th Edition. Washington, DC, 2012. American Institute of Steel Construction. Manual of Steel Construction: Load and Resistance
Factor Design, 2nd Ed., Vol. 1, Structural Members, Specifications, & Codes. Chicago, 1998.
ASTM International. ASTM Standard C1107: Standard Specification for Packaged Dry,
Hydraulic-Cement Grout (Nonshrink). West Conshohocken, PA, 2013. Field, C. VHPC Material Characterization and Recommendations for the Buffalo Branch Bridge
Rehabilitation. M.S. Thesis, Virginia Polytechnic and State University, Blacksburg, 2015.
Graybeal, B. Ultra-High Performance Concrete Composite Connections for Precast Concrete
Bride Decks. FHWA-HRT-12-042. Federal Highway Administration, McLean, VA, 2012.
Gulyas, R., Wirthlin, G., and Champa, J. Evaluation of Keyway Grout Test Methods for Precast
Concrete Bridges. PCI Journal, Vol. 40, No. 1, 1995, pp. 44-57. Halbe, K.R. New Approach to Connections Between Members of Adjacent Box Beam Bridges. Ph.D. Dissertation. Virginia Polytechnic Institute and State University, Blacksburg, 2014. Hanna, K. Morcous, G., and Tadros, M. Adjacent Box Girders Without Internal Diaphragms or
Post-Tensioned Joints. PCI Journal, Vol. 56, No. 4, 2011, pp. 51-64. Huckelbridge, A., El-Esnawi, H., and Moses, F. Shear Key Performance in Multibeam Box
Girder Bridges. Journal of Performance of Constructed Facilities, Vol. 9, No. 4, 1995, pp. 271-285.
Joyce, P.C. Development of Improved Connection Details for Voided Slab Bridges. Master’s
Thesis. Virginia Polytechnic Institute and State University, Blacksburg, 2014.

38
Russell, H. Adjacent Precast Concrete Box Beam Bridges: Connection Details. NCHRP Synthesis 393. Transportation Research Board, Washington, DC, 2009.
Virginia Department of Transportation. Road and Bridge Specifications. 2007
http://www.virginiadot.org/business/const/spec-default.asp. Accessed May 19, 2015.
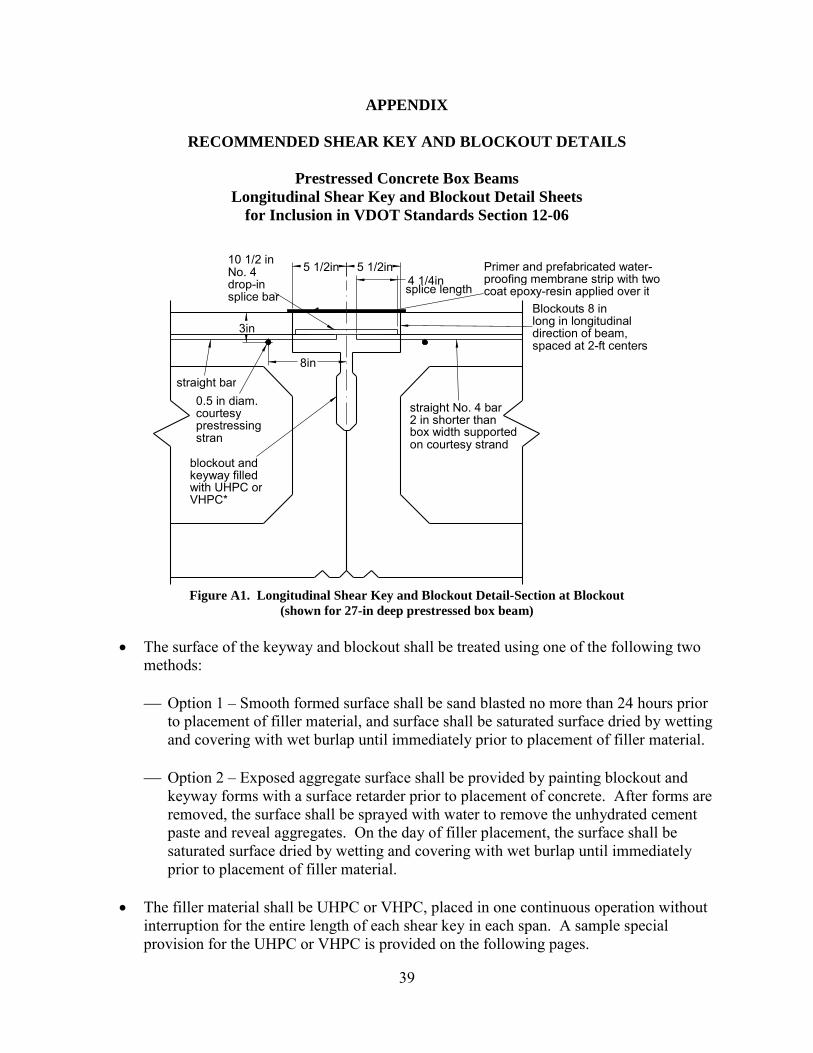
39
APPENDIX
RECOMMENDED SHEAR KEY AND BLOCKOUT DETAILS
Prestressed Concrete Box Beams Longitudinal Shear Key and Blockout Detail Sheets
for Inclusion in VDOT Standards Section 12-06
Figure A1. Longitudinal Shear Key and Blockout Detail-Section at Blockout
(shown for 27-in deep prestressed box beam)
• The surface of the keyway and blockout shall be treated using one of the following two methods: Option 1 – Smooth formed surface shall be sand blasted no more than 24 hours prior
to placement of filler material, and surface shall be saturated surface dried by wetting and covering with wet burlap until immediately prior to placement of filler material.
Option 2 – Exposed aggregate surface shall be provided by painting blockout and keyway forms with a surface retarder prior to placement of concrete. After forms are removed, the surface shall be sprayed with water to remove the unhydrated cement paste and reveal aggregates. On the day of filler placement, the surface shall be saturated surface dried by wetting and covering with wet burlap until immediately prior to placement of filler material.
• The filler material shall be UHPC or VHPC, placed in one continuous operation without interruption for the entire length of each shear key in each span. A sample special provision for the UHPC or VHPC is provided on the following pages.
5 1/2in 5 1/2in
straight No. 4 bar 2 in shorter than box width supported on courtesy strand
straight bar
10 1/2 in No. 4 drop-in splice bar
4 1/4in splice length
blockout and keyway filled with UHPC or VHPC*
3in
8in
0.5 in diam. courtesy prestressing stran
Blockouts 8 in long in longitudinal direction of beam, spaced at 2-ft centers
Primer and prefabricated water- proofing membrane strip with two coat epoxy-resin applied over it

40
Figure A2. Longitudinal Shear Key and Blockout Detail—Section Between Blockouts
• Waterproofing system for the longitudinal shear key shall not be applied until the UHPC
or VHPC has cured for 24 hours. Surfaces to receive the waterproofing system shall be prepared in accordance with the requirements of Section 416.03(b)(3) of VDOT’s Road and Bridge Specifications.
• FORTEC 5680-BD Kevlar may be used for the waterproofing membrane strip. This product has been added to the VDOT Special Products Evaluation List for acceptance. The procedure for installation of the Kevlar strip with modified Epoxy Type EP-5 is available from the Central Office Structure and Bridge Engineering Services Program Area.
S
12in
3/4in
4 7/8in
1/4in
3/4in
6in
5/8in
3/8in 3/8in
Primer and prefabricated water-proofing membrane strip with twocoat epoxy-resin applied over it
centerline oflongitudinalshear key
6in 6in
keyway filledwith UHPC orVHPC*
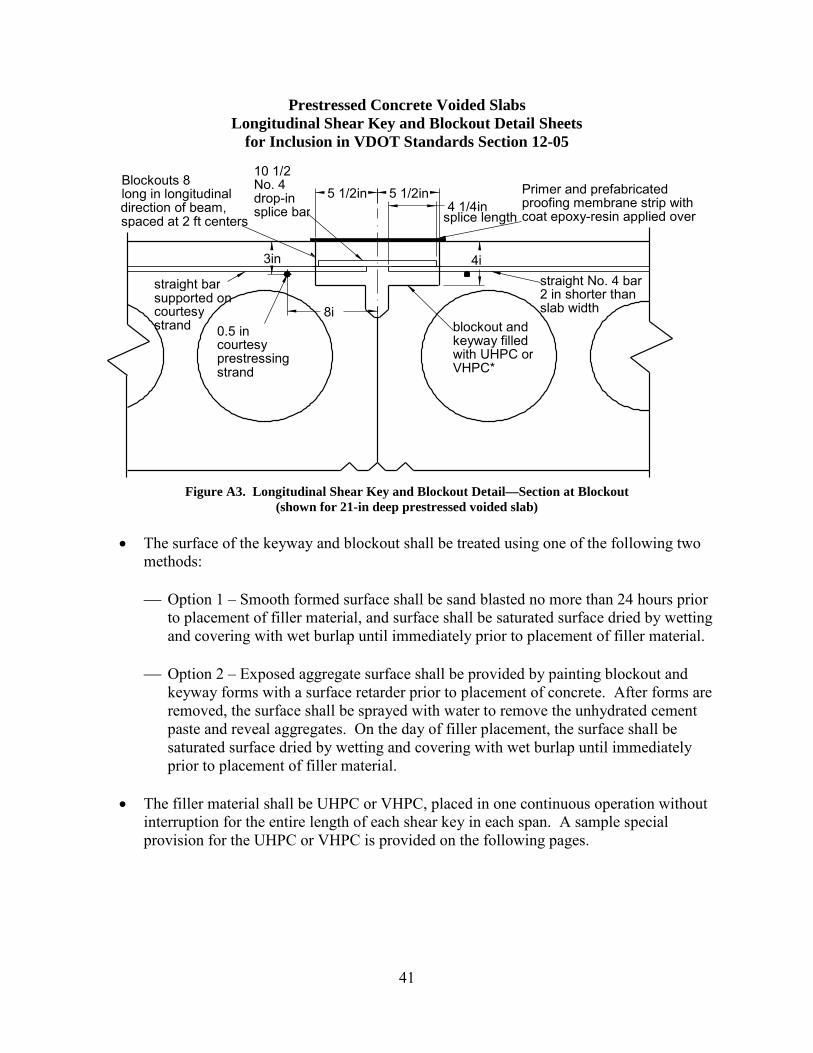
41
Prestressed Concrete Voided Slabs Longitudinal Shear Key and Blockout Detail Sheets
for Inclusion in VDOT Standards Section 12-05
Figure A3. Longitudinal Shear Key and Blockout Detail—Section at Blockout (shown for 21-in deep prestressed voided slab)
• The surface of the keyway and blockout shall be treated using one of the following two
methods: Option 1 – Smooth formed surface shall be sand blasted no more than 24 hours prior
to placement of filler material, and surface shall be saturated surface dried by wetting and covering with wet burlap until immediately prior to placement of filler material.
Option 2 – Exposed aggregate surface shall be provided by painting blockout and keyway forms with a surface retarder prior to placement of concrete. After forms are removed, the surface shall be sprayed with water to remove the unhydrated cement paste and reveal aggregates. On the day of filler placement, the surface shall be saturated surface dried by wetting and covering with wet burlap until immediately prior to placement of filler material.
• The filler material shall be UHPC or VHPC, placed in one continuous operation without interruption for the entire length of each shear key in each span. A sample special provision for the UHPC or VHPC is provided on the following pages.
5 1/2in
straight No. 4 bar 2 in shorter than slab width
straight bar supported on courtesy strand
10 1/2 No. 4 drop-in splice bar 4 1/4in
splice length
8i
3in 4i
0.5 in courtesy prestressing strand
blockout and keyway filled with UHPC or VHPC*
5 1/2in Primer and prefabricated proofing membrane strip with coat epoxy-resin applied over
Blockouts 8 long in longitudinal direction of beam, spaced at 2 ft centers

42
Figure A4. Longitudinal Shear Key and Blockout Detail—Section Between Blockouts
• Waterproofing system for the longitudinal shear key shall not be applied until the UHPC
or VHPC had cured for 24 hours. Surfaces to receive the waterproofing system shall be prepared in accordance with the requirements of Section 416.03(b)(3) of VDOT’s Road and Bridge Specifications.
• FORTEC 5680-BD Kevlar may be used for the waterproofing membrane strip. This product has been added to the VDOT Special Products Evaluation List for acceptance. The procedure for installation of the Kevlar strip with modified Epoxy Type EP-5 is available from the Central Office Structure and Bridge Engineering Services Program Area.
7in
3in
4in
5/8in
1/4in
3/4in
3/8in
3/4in
3/8in
Primer and prefabricated water-proofing membrane strip with twocoat epoxy-resin applied over it
6in 6in
centerline oflongitudinalshear key
keyway filledwith UHPC orVHPC*

43
Blockout Layout in Plan
Figure A5. Plan View of Squared-Ended Box Beam
• For bridges with no skew, the blockout pockets and No. 4 straight bars shall be laid out as shown in Figure A5. A blockout
pocket and bar shall be located at the mid-span of the beam, and then the remaining blockouts shall be spaced at 2-ft centers in either direction from mid-span. The final blockout pocket shall be no further than 3 ft from the end of the beam, but shall not be placed within the end diaphragm of the beam.
Figure A6. Schematic Showing 8-in Blockout Can Accommodate Up to a 5-in Misalignment of the Blockouts on Either Side of the Joint
2ft-0in
locate mid-span of beam and place firststraight bar with block-out forms here.Then, working each way from centerlineplace blockouts at 2 ft - 0 in on center
place final blockoutno more than 3 ft fromthe end of the beam
8in
5 in offset
8in

44
Figure A7. Schematic of Blockout Distribution on Skewed Bridge
• For skewed bridges, the blockouts shall be aligned perpendicular to the longitudinal axis
of the beams and bridge. Precise layout and quality control is imperative and blockout locations shall be clearly indicated on the shop drawings and approved by the engineer of record.
Required Material Properties of Filler Material
• Water–to–cementitious material ratio < 0.25 • 28-day compressive strength > 11,500 psi • 7-day compressive strength > 9,000 psi • Percent steel fibers by volume = 2% • Maximum aggregate size = 0.25 in • Minimum steel fiber length = 4 times maximum aggregate size • Shrinkage < 800 με at 28 days • Freeze thaw resistance - Relative Dynamic Modulus > 90 % after 300 cycles • Spread measured with inverted slump cone method between 19 in and 21 in.
The proprietary product Ductal meets these criteria, as does the mixture presented in
Table 3 of this report. The mixture named “VHPC Small” presented in Field (2015) is also acceptable.
Blockouts on 2 ft centerson skew bridges. Final blockouton each joint placed no further than4 ft from end of beam and no closerthan 2 ft from end of beam
Plan View of Skewed BridgePrecaster to locate blockouts on shop drawings