development of improved injury criteria for the...
TRANSCRIPT

Development of ImprovedInjury Criteria for the
Assessment of AdvancedAutomotive Restraint Systems - II
By
Rolf Eppinger, Emily Sun, Faris Bandak, Mark Haffner,Nopporn Khaewpong, Matt MalteseNational Highway Traffic Safety Administration
National Transportation Biomechanics Research Center (NTBRC)
Shashi Kuppa, Thuvan Nguyen, Erik Takhounts, Rabih Tannous, Anna Zhang
Conrad Technologies, Inc.
Roger SaulNational Highway Traffic Safety Administration
Vehicle Research & Test Center (VRTC)
November 1999

TABLE OF CONTENTS
LIST OF SYMBOLS . . . . . . . . . . . . . . . . . . . . . . . . . . . . . . . . . . . . . . . . . . . . . . . . . . . . . . . . . iv
EXECUTIVE SUMMARY . . . . . . . . . . . . . . . . . . . . . . . . . . . . . . . . . . . . . . . . . . . . . . . . . . . ES-1
Chapter 1Introduction1.1 SCALING TECHNIQUES . . . . . . . . . . . . . . . . . . . . . . . . . . . . . . . . . . . . . . . . . . . . . . . 1-11.2 STATISTICAL ANALYSIS TECHNIQUES . . . . . . . . . . . . . . . . . . . . . . . . . . . . . . . . . 1-3
Chapter 2Head Injury Criteria2.1 BACKGROUND . . . . . . . . . . . . . . . . . . . . . . . . . . . . . . . . . . . . . . . . . . . . . . . . . . . . . . 2-12.2 SCALING HIC TO VARIOUS OCCUPANT SIZES . . . . . . . . . . . . . . . . . . . . . . . . . . . 2-42.3 HEAD INJURY RISK ANALYSIS . . . . . . . . . . . . . . . . . . . . . . . . . . . . . . . . . . . . . . . . 2-92.4 APPLICATION OF HIC TO AVAILABLE TEST DATA . . . . . . . . . . . . . . . . . . . . . . 2-11
Chapter 3Neck Injury Criteria3.1 BACKGROUND . . . . . . . . . . . . . . . . . . . . . . . . . . . . . . . . . . . . . . . . . . . . . . . . . . . . . . 3-13.2 DEVELOPMENT OF Nij NECK INJURY CRITERIA . . . . . . . . . . . . . . . . . . . . . . . . . 3-23.3 DEVELOPMENT AND SCALING OF Nij CRITERIA TO VARIOUS
OCCUPANT SIZES . . . . . . . . . . . . . . . . . . . . . . . . . . . . . . . . . . . . . . . . . . . . . . . . . . . . 3-63.4 NECK INJURY RISK ANALYSIS . . . . . . . . . . . . . . . . . . . . . . . . . . . . . . . . . . . . . . . 3-113.5 APPLICATION OF PROPOSED Nij CRITERIA TO AVAILABLE TEST DATA . . . 3-143.6 RECOMMENDATIONS . . . . . . . . . . . . . . . . . . . . . . . . . . . . . . . . . . . . . . . . . . . . . . . 3-23
Chapter 4Thoracic Injury Criteria4.1 BACKGROUND . . . . . . . . . . . . . . . . . . . . . . . . . . . . . . . . . . . . . . . . . . . . . . . . . . . . . . 4-14.2 ANALYSIS OF HUMAN SURROGATE TEST DATA . . . . . . . . . . . . . . . . . . . . . . . . . 4-24.3 DEVELOPMENT OF COMBINED THORACIC INDEX (CTI) FOR THE 50%
ADULT MALE . . . . . . . . . . . . . . . . . . . . . . . . . . . . . . . . . . . . . . . . . . . . . . . . . . . . . . . 4-104.4 SCALING OF THORACIC INJURY CRITERIA TO VARIOUS OCCUPANT
SIZES . . . . . . . . . . . . . . . . . . . . . . . . . . . . . . . . . . . . . . . . . . . . . . . . . . . . . . . . . . . . . . 4-124.5 DEVELOPMENT OF PROBABILITY OF INJURY RISK CURVES FOR THE
THORAX . . . . . . . . . . . . . . . . . . . . . . . . . . . . . . . . . . . . . . . . . . . . . . . . . . . . . . . . . . . 4-154.6 RATE OF STERNAL DEFLECTION . . . . . . . . . . . . . . . . . . . . . . . . . . . . . . . . . . . . . 4-204.7 APPLICATION OF PROPOSED THORACIC INJURY CRITERIA TO
AVAILABLE TEST DATA . . . . . . . . . . . . . . . . . . . . . . . . . . . . . . . . . . . . . . . . . . . . . . 4-21

Chapter 5Lower Extremity Criteria5.1 FEMUR INJURY CRITERIA . . . . . . . . . . . . . . . . . . . . . . . . . . . . . . . . . . . . . . . . . . . . . 5-15.2 INJURY CRITERIA FOR THE LEG . . . . . . . . . . . . . . . . . . . . . . . . . . . . . . . . . . . . . . . 5-3
Chapter 6Recommendations . . . . . . . . . . . . . . . . . . . . . . . . . . . . . . . . . . . . . . . . . . . . . . . . . . . . . . . . . . . 6-1
References . . . . . . . . . . . . . . . . . . . . . . . . . . . . . . . . . . . . . . . . . . . . . . . . . . . . . . . . . . . . . . . . . . .
Appendix A: Public Comment on Proposed Injury Criteria . . . . . . . . . . . . . . . . . . . . . . . . A-1
Appendix B: Tabulated Results from Analyses of Available NHTSA Test Data . . . . . . . . B-1
Appendix C: Application of Proposed Nij Neck Injury Criteria to Available NHTSA TestData . . . . . . . . . . . . . . . . . . . . . . . . . . . . . . . . . . . . . . . . . . . . . . . . . . . . . . . . . C-1
Appendix D: Application of Proposed Thoracic Injury Criteria to Available NHTSA TestData . . . . . . . . . . . . . . . . . . . . . . . . . . . . . . . . . . . . . . . . . . . . . . . . . . . . . . . . . D-1
Appendix E: Statistical Analysis Procedures for Developing Injury Risk Curves fromBiomechanical Test Data . . . . . . . . . . . . . . . . . . . . . . . . . . . . . . . . . . . . . . . . . E-1
Appendix F: Age-Dependent Neck Scaling Factors . . . . . . . . . . . . . . . . . . . . . . . . . . . . . . . F-1
Appendix G: Software Program to Calculate Nij Neck Injury . . . . . . . . . . . . . . . . . . . . . . G-1

LIST OF SYMBOLS
Symbol Units Description
8 Dimensionless scaling factors which are ratios between fundamental properties(length, mass, modulus, etc.) which characterize the two systems that arecompared
E MPa Modulus of elasticity
Ff Mpa Failure stress of tissue
p Probability of injury
p-value Statistical measure of the appropriateness of the model from regressionanalyses
AIS Abbreviated Injury Scale
HIC36 Head injury criteria (eqn 2.1) where the time interval is limited to 36milliseconds
HIC15 Head injury criteria (eqn 2.1) where the time interval is limited to 15milliseconds
Fx N Shear load measured at the upper neck load cell as specified by SAE J211(March 1995)
Fz N Axial load (negative for compression, positive for tension) measured at theupper neck load cell as specified by SAE J211 (March 1995)
My Nm Bending moment (negative for extension, positive for flexion) at the occipitalcondyles as specified by SAE J211 (March 1995)
Fint N Intercept value for compression or tension for calculating Nij (eqn 3.1)
Mint Nm Intercept value for extension or flexion at the occipital condyles for calculatingNij (eqn 3.1)
Nij Normalized neck injury criteria (eqn 3.1)
dc Normalized central chest deflections for the human surrogate measured usingchestbands

dmax Normalized maximum chest deflections from five locations for the humansurrogate measured using chestbands
As G 3 millisecond clip value for thoracic spinal acceleration measured in the dummyor human surrogate
Aint G Intercept for spinal acceleration used to calculate CTI (eqn 4.2)
Ac G Critical acceleration limit for thoracic injury criteria
D mm Chest deflection measured in the dummy
Dint mm Intercept for dummy chest deflection used to calculate CTI (eqn 4.2)
Dc mm Critical deflection limit for thoracic injury criteria
UR Five chestband measurement locations (upper right, upper center, upperUC left, lower right, lower left) for deflection and velocity used in the statisticalUL analyses of thoracic injuryLRLL
V m/sec Velocity of the chest measured either at the five location sites (UR, UC, UL,LR, LL) for the human surrogate by the chestband or at the sternum for theanthorpometric test devices
V*C sec-1 Viscous criterion, which is the product of the chest velocity, V, and theVC normalized compression of the chest, D/Chest depth.
CTI Combined Thoracic Index (eqn 4.2)
Restraint system (Table 4.1)ABG Air bagDPL Padded dash panelKNEE Knee bolsterLAP Lap belt2PT 2 point belt (shoulder belt without lap belt)3PT 3 point belt
RIBFXR Number of rib fractures (Table 4.1)

ES-1
Development of Improved Injury Criteria for theAssessment of Advanced Automotive Restraint Systems - II
EXECUTIVE SUMMARY
INTRODUCTION
The National Highway Traffic Safety Administration’s (NHTSA) plans for upgrading the FederalMotor Vehicle Safety Standard (FMVSS) No. 208 frontal crash protection safety standard includeimproving protection requirements for the normally seated mid-sized adult male, as well as includingadditional requirements that will specify performance limits to minimize the risks from airbags to small-sized occupants and children in both normal and out-of-position seating locations. These new crashspecifications will require the use of additional dummies of various sizes as well as additionalperformance criteria that appropriately represent injury thresholds of these additional populationsegments.
Based on the agency’s analysis of comments received in response to the publication of the NPRM andthe accompanying technical reports, the agency has made modifications to the recommended injurycriteria and their associated performance limits. A detailed discussion of the comments received andthe agency’s analysis may be found in Appendix A. This report, which is a supplement to the previousreport, “Development of Improved Injury Criteria for the Assessment of Advanced AutomotiveRestraint Systems”, (Kleinberger, et. al, NHTSA Docket 98-4405-9) documents these modificationsand the rationale.
BACKGROUND
Injury criteria have been developed in terms that address the mechanical responses of crash testdummies in terms of risk to life or injury to a living human. They are based on an engineering principlethat states that the internal responses of a mechanical structure, no matter how big or small, or fromwhat material it is composed, are uniquely governed by the structure’s geometric and materialproperties and the forces and motions applied to its surface. The criteria have been derived fromexperimental efforts using human surrogates where both measurable engineering parameters and injuryconsequences are observed and the most meaningful relationships between forces/motions and resultinginjuries are determined using statistical techniques.
Development of human injury tolerance levels is difficult because of physical differences betweenhumans. It is further complicated by the need to obtain injury tolerance information through indirectmethods such as testing with human volunteers below the injury level, cadaver testing, animal testing,computer simulation, crash reconstructions, and utilization of crash test dummies. Each of these indirectmethods has limitations, but each provides valuable information regarding human tolerance levels. Due

ES-2
to the prohibitive number (and cost) of tests required to obtain a statistically significant sample size, itultimately becomes necessary to consolidate the available information each of these methods provides,and apply a judgement as to what best represents a reasonable tolerance level for a given risk of injury.
Human volunteer testing has the obvious shortcoming in that testing is done at sub-injurious exposurelevels. It also poses problems in that instrumentation measurements must be obtained through non-invasive attachments, volunteers are most often military personnel who may not be representative of theaverage adult population, and the effects of muscle tension and involuntary reflexes are difficult toascertain. While cadaver testing is essential to the development of human injury tolerances, it also has anumber of inherent variables. Cardiopulmonary pressurization, post mortem tissue degradation, muscletension, age, gender, anthropometry, and mass are all factors which produce considerable variability intest results. Animal testing also has this problem, along with the need to translate anatomy and injury tohuman scales, but has the advantage of providing tolerance information under physiologic conditions. Crash reconstructions provide injury data under normal human physiological conditions, however, theforces and accelerations associated with those injuries must be estimated. Computer simulation andtesting with crash test dummies provide valuable information, but these methods are dependent uponresponse information obtained through the other methods.
Frequently criteria are developed, based on extensive analysis, for one size dummy (e.g., an adult) andthese criteria are applied and translated to other size dummies (e.g., a child) through a process knownas scaling. Scaling techniques overcome the influence of geometric and material differences betweenexperimental subjects and the subjects of interest. This technique assumes that the experimental objectand the object of interest are scale models of each other and that their mass and material differencesvary by relatively simple mathematical relationships. If these assumptions are met, engineeringexperience shows that the scaled values are good approximations of the expected values. However,the more these assumptions are not valid, the more the translated physical measurements may bedistorted from their true levels.

ES-3
PROPOSED HEAD INJURY CRITERIA
Existing NHTSA regulations specify a Head Injury Criteria (HIC) for the 50th percentile male. Thebiomechanical basis for HIC for the 50th percentile adult male was reviewed and alternatives to thisfunction were sought. While considerable progress has been made in the capabilities of analytical finiteelement head/brain models to simulate the major injury mechanisms prevalent in brain injury, it was feltthat it would be premature for their results to be used in this current proposed rulemaking action.
The NPRM proposed to maintain the performance limit for HIC evaluated over a maximum timeinterval of 36 milliseconds for the 50th percentile male, and scaled values for the other dummy sizes. Many commenters suggested using the more conservative scaled values for the HIC limits for the childdummies. The AAMA suggested limiting the HIC evaluation interval to maximum of 15 millisecondswith a performance limit of 700 for the 50th percentile male and scaled limits for the other dummy sizes.
In a Federal Register Notice issued on October 17, 1986, NHTSA indicated that it planned to limit themaximum HIC time interval to 36 milliseconds. The agency recognized that available human volunteertests demonstrated that the probability of injury in long duration events was low, but reasoned that theagency should take a cautious approach and not significantly change the expected pass/fail ratios thatthe then unlimited HIC time interval provided. Evaluation, at the time, of the proposed 17 millisecondlimit against various test sets from NCAP and FMVSS 208 testing available at the time was found toreduce the failure rate from 46% to 35%. This fact contributed to the agency’s decision to reject theproposal of reducing the maximum HIC time interval to either 15 or 17 milliseconds without acommensurate reduction of the maximum HIC value. However, to somewhat accommodate theapparent over-stringency of the limited HIC for long duration events, the agency did propose limitingthe maximum time interval to 36 milliseconds. This provision allowed the maximum average longduration acceleration to rise to a limit of 60 G’s.
The agency is now proposing to evaluate the HIC over a maximum 15 millisecond time interval for alldummy sizes with a requirement that it not exceed a maximum of 700 for the adult dummies. This willsimultaneously provide a equally stringent evaluation of long duration events while providing increasedstringency for short duration events where biomechanical certainty is not as strong. We are proposingto change the HIC time interval to a maximum of 15 milliseconds for all dummy sizes and to revise theHIC limits by commensurate amounts, based on a scaling from the proposed new limit for the 50thpercentile adult male dummy.
Both geometric and material failure scaling, coupled with engineering judgement, were employed totranslate the critical HIC value to other occupant sizes. The recommended critical HIC levels for thevarious occupant sizes are given in Table ES.1. Although the large male Hybrid III dummy is notincluded in the proposed testing for the advanced air bag SNPRM, the HIC15 limit is listed forcompleteness.

ES-4
.Table ES.1: Proposed Head Injury Criterion for Various Dummy Sizes
Dummy Type Large §Male
Mid-SizedMale
SmallFemale
6 YearOld
Child
3 YearOld
Child
1 YearOld
Infant
Existing HIC 36 Limit NA 1000 N/A N/A N/A N/A
Proposed HIC15 Limit 700 700 700 700 570 390§ The Large Male (95th percentile Hybrid III) is not currently proposed for inclusion in the SNPRM, but theperformance limits are listed here for completeness.

ES-5
Nij = FF
+ MM
Z Y
int int(3.1)
PROPOSED NECK INJURY CRITERIA
Existing NHTSA regulations specify neck injury criteria for the 50th percentile male as part of theFMVSS No. 208 alternative test, S13.2. The previous biomechanics technical paper describes in detailthe derivation of the neck injury criteria, Nij, from biomechanical data (NHTSA Docket 1998-4405-9).
Comments received from various advocate groups suggested adopting conservative performance limitsfor the children in light of the real world injuries and deaths of children due to passenger air bags. Comments from the manufacturers in general supported the independent evaluation of neck forces andmoments, rather than the evaluation of combined loads used by Nij. Three commenters (twomanufacturers and one restraint manufacturer) supported Nij with a critical value of 1.4 based onpracticability arguments.
Based on the comments received and the discussions at the two public meetings (see summary inAppendix E), the agency has opted to continue its support of Nij with a modified formulation and aperformance limit of 1.0. The issue of neck injury, especially to out-of-position adults and children, isone of the priorities of this rulemaking and the agency would be remiss if it did not include the mostaccurate and up-to-date methods to assess what conditions are injurious and non-injurious. Theagency continues to believe that Nij has a strong foundation in biomechanics. Furthermore, testing hasshown that the performance limits proposed in the SNPRM are practicable given the time frame of thisrulemaking.
The agency has made slight modifications to the formulation of Nij, referred to as the SNPRM Nij, andthe scaling techniques used based upon the comments received. In general, the critical values for theSNPRM Nij are equal to or lower than the critical values proposed in the NPRM for the child testdummies. However, the SNPRM Nij critical values for the adult test dummies are about the same orslightly higher than that in the NPRM, but they are consistent with the higher performance limits (up to avalue of 1.4) as discussed in the NPRM Nij which better match real world estimates of adult neckinjury.
The resulting neck injury criteria, called “Nij”, propose critical limits for all four possible modes of neckloading; tension or compression combined with either flexion (forward) or extension (rearward) bendingmoment. The Nij is defined as the sum of the normalized loads and moments, i.e.,
where FZ is the axial load, Fint is the critical intercept value of load used for normalization, MY is theflexion/extension bending moment, and Mint is the critical intercept value for moment used fornormalization.
ES-6
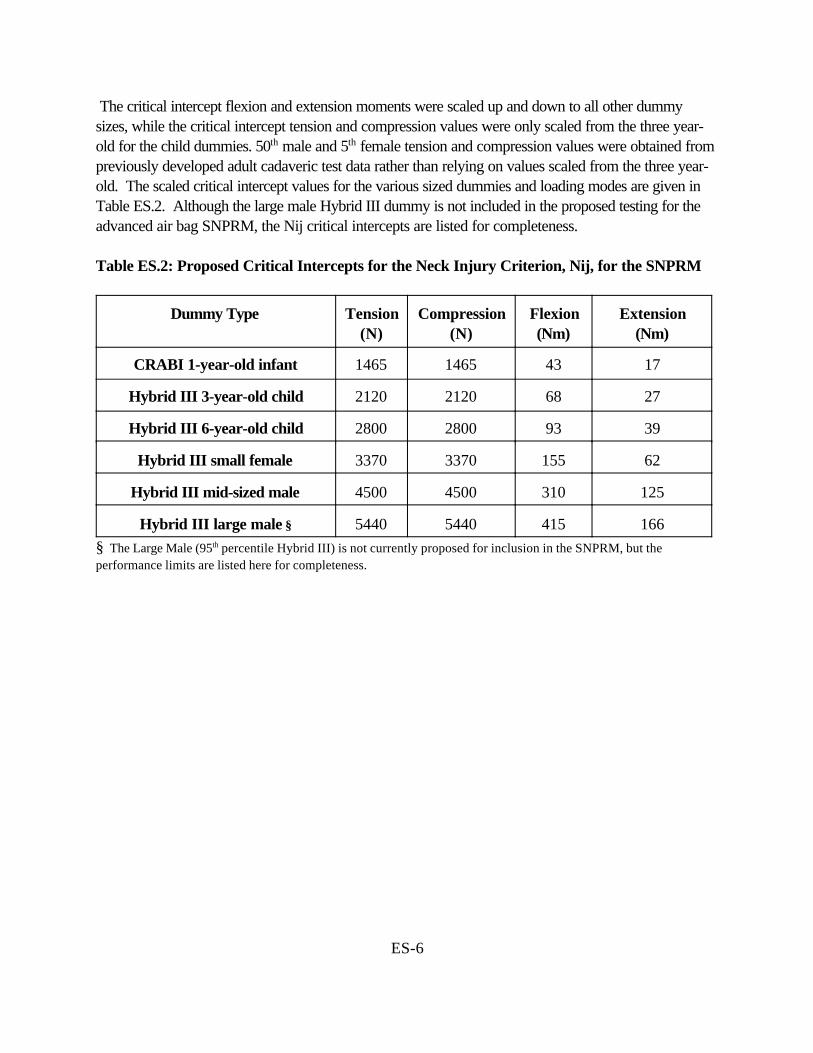
The critical intercept flexion and extension moments were scaled up and down to all other dummysizes, while the critical intercept tension and compression values were only scaled from the three year-old for the child dummies. 50th male and 5th female tension and compression values were obtained frompreviously developed adult cadaveric test data rather than relying on values scaled from the three year-old. The scaled critical intercept values for the various sized dummies and loading modes are given inTable ES.2. Although the large male Hybrid III dummy is not included in the proposed testing for theadvanced air bag SNPRM, the Nij critical intercepts are listed for completeness.
Table ES.2: Proposed Critical Intercepts for the Neck Injury Criterion, Nij, for the SNPRM
Dummy Type Tension(N)
Compression(N)
Flexion(Nm)
Extension(Nm)
CRABI 1-year-old infant 1465 1465 43 17
Hybrid III 3-year-old child 2120 2120 68 27
Hybrid III 6-year-old child 2800 2800 93 39
Hybrid III small female 3370 3370 155 62
Hybrid III mid-sized male 4500 4500 310 125
Hybrid III large male § 5440 5440 415 166§ The Large Male (95th percentile Hybrid III) is not currently proposed for inclusion in the SNPRM, but theperformance limits are listed here for completeness.

ES-7
CTIAA
DD
= +max
int
max
int(4.2)
PROPOSED THORACIC INJURY CRITERIA
NHTSA currently mandates regulatory limits of 60g for chest acceleration and 76 mm (3 inches) forchest deflection as measured on the Hybrid III 50th percentile male dummy. Considerablebiomechanical information developed since the 1950's was used to assess potential loading thresholdsfor chest injuries and this information has been the basis for the existing criteria. In the previous report,the agency presented analysis of a new series of 71 highly instrumented frontal impact tests using humansurrogates which were conducted over the last 5-6 years. This test series used five different restraintcombinations (3-point belt, 2-point belt/knee bolster, driver airbag and lap belt, driver airbag and kneebolster, and driver airbag and 3-point belt) with a variety of crash pulses and velocity changes. Thediverse capabilities of the instrumentation employed during this test series allowed the calculation andperformance comparison of currently effective and potentially revised chest injury measures with theobserved injury outcomes.
The analyses performed looked at a variety of statistical measures (log likelihood, p-value, gammafunction, and concordant/discordant percentages) to evaluate the ability of both individual and multipleresponse variables to explain the observed experimental injury results. Based on these statisticalmeasures, the analysis demonstrated that while single variables, such as peak chest acceleration, peakchest deflection, or the Viscous Criterion (V*C) advanced by one or more non-NHTSA researchers,provided a measure of prediction of injury outcome, a formulation that included both peak chestacceleration and maximum chest deflection, called the Combined Thoracic Index (CTI) appeared toprovide superior predictive capability compared to all others examined. The formulation of the CTI is:
where Amax and Dmax are the maximum observed acceleration and deflection,and Aint and Dint are the corresponding maximum allowable intercept values.
In response to the NPRM, many comments were received on the addition of CTI to the currentregulations limiting chest acceleration and chest deflection independently (Appendix E). On one hand,some commenters supported the inclusion of CTI. For instance one commenter stated that CTI seemsto be a more sophisticated and realistic means by which to measure chest injury. The NationalTransportation Safety Board (NTSB) suggested that it may be appropriate to use different CTI valuesfor belted and unbelted occupants. On the other hand, some commenters opposed CTI because theybelieve that the increased stringency of CTI will lead to more aggressive air bags and/or softer vehiclestructures, which would have a negative effect on real world benefits. The AAMA questioned theinclusion of a few of the data points which may be outliers in the analyses, analyzed various subsets ofbiomechanical data, and has reached conclusions that are different from NHTSA regarding CTI. Others recommend that further research and review are necessary.

ES-8
Though the agency believes that the combination of maximum chest acceleration and deflection is abetter predictor of injury than individual threshold limits for chest deflection and acceleration, there arestill some questions regarding the interpretation of data used in the development of CTI. Plans forfuture testing are focused on answering some of these questions and increasing the number ofobservations in the data set. Therefore, until more data is available and a reanalysis of the larger dataset is conducted to evaluate the efficacy of a CTI-based injury criteria, individual limits of maximumchest acceleration and deflection will be used for regulation purposes. However since CTI hasdemonstrated superior predictive capabilities than either deflection or acceleration alone, the agency hasproposed to use CTI to assess the probability of injury for its economic analyses. Thus, after thebiomechanical data set was modified by removing a few questionable data points and correcting datareporting errors in a few tests, a modified CTI was derived as described in Chapter 4. The revisedcritical CTI intercept values for the various sized occupants are shown in the Table ES.3. Although thelarge male Hybrid III dummy is not included in the proposed testing for the advanced air bag SNPRM,the CTI intercepts are listed for completeness.
Table ES.3: Deflection and Acceleration Intercepts for Modified CTI
Dummy Type LargeMale §
Mid-SizedMale
SmallFemale
6 YearOld
Child
3 YearOld
Child
1 YearOld
Infant
Chest Deflection Interceptfor CTI (Dint)
114 mm(4.5 in)
103 mm(4.0 in)
84 mm(3.3 in)
64 mm(2.5 in)
57 mm(2.2 in)
50 mm(2.0 in)
Chest AccelerationIntercept for CTI (Aint)
83 90 90 90 74 57
§ The Large Male (95th percentile Hybrid III) is not currently proposed for inclusion in the SNPRM, but theperformance limits are listed here for completeness.
After the publication of the previous report for the NPRM, AAMA provided an alternate thoracicinjury criteria which addresses AIS$4 thoracic injuries. The AAMA argued that since AIS$3 injuriesare predominantly associated with rib fractures and children, in general, seldom have rib fractures, itmay be more appropriate to consider AIS$4 thoracic injuries which constitute both soft tissue andbone injuries. Based on analysis using the Mertz/Weber method on the data published by Neathery(1975), AAMA recommended the chest deflection threshold in out-of-position and in-positionconditions to be 64 mm for the 50th percentile male which corresponds to a 5% probability of anAIS$4 thoracic injury.
Since this proposal is an increase in stringency from the current maximum of 76.2 mm of deflection forthe 50th percentile male and further research is needed to establish the efficacy of CTI, the agency isproposing to adopt a chest deflection limit of 63 mm (2.5 inches) for the 50th percentile male. Thiswould be in addition to the current performance limit of 60 g’s for the 3-msec clip value of resultant

ES-9
chest acceleration. These individual deflection and chest acceleration performance limits have beenscaled to the various dummy sizes and are shown in Table ES.4. Although the large male Hybrid IIIdummy is not included in the proposed testing for the advanced air bag SNPRM, the chestperformance limits are listed for completeness.
Table ES.4: Performance Limits for Chest Deflection and Chest Acceleration EvaluatedIndependently
Dummy Type LargeMale §
Mid-SizedMale
SmallFemale
6 YearOld
Child
3 YearOld
Child
1 YearOld
Infant
Chest Deflection Limit forThoracic Injury (Dc)
70 mm(2.8 in)
63 mm(2.5 in)
52 mm(2.0 in)
40 mm(1.6 in)
34 mm (1.4 in)
30mm**(1.2 in)
Chest Acceleration Limit forThoracic Injury Criteria (Ac)
55 60 60* 60 55 50
§ The Large Male (95th percentile Hybrid III) is not currently proposed for inclusion in the SNPRM, but theperformance limits are listed here for completeness.
* Although geometric scaling alone would predict higher Ac values for females, it is believed that lower bonemineral density would offset this effect. Therefore, the acceleration tolerance values for small females arekept the same as for mid-sized males.
** The CRABI 12 month old dummy is currently not capable of measuring chest deflection.

ES-10
PROPOSED LOWER EXTREMITY INJURY CRITERIA
While a great deal of research is currently underway both in experimental activities to determinebiomechanical tolerance criteria as well as developing enhanced lower extremities for the dummies,both sets of activities are not ready for inclusion in these recommendations. Because femoral fracturesin children are not a significant problem in automotive crashes, the NPRM recommended to use femurload only for the adult dummies. The 10 kN limit for the axial femur load on the Hybrid III 50th
percentile male dummy was maintained and NHTSA proposed a 6.8 kN limit, obtained by geometricscaling, for the 5th percentile female dummy.
In response to the NPRM, commenters supported the inclusion of performance limits forfemoral compressive loads for the 5th percentile female dummy specified in the NPRM in addition tomaintaining the currently specified value for the 50th percentile male dummy. Furthermore, AAMAproposed adding femoral compressive load performance criteria of 2310 N for the 6 year-old dummy. The National Transportation Safety Board (NTSB) recommended that tolerance levels of lowerextremities need to be further investigated and validated. NTSB also suggested that the NHTSAconsider dummies such as advanced lower extremity (ALEX, now renamed the THOR-LX) dummyfor future incorporation into the standards.
Although the NHTSA agrees with the AAMA that femoral compressive load limits for the sixyear-old dummy are important to consider, the SNPRM does not specify such limits because the testingconfigurations specified in the SNPRM for the six year-old dummy do not impose substantial loading onthe lower extremities. NHTSA is also continuing the development of an advanced lower extremity testdevice, the THOR-LX, and continues to sponsor experimental impact injury research to determine themechanisms and tolerances of the lower extremities, including the foot, ankle and leg. When this effortis complete, it is anticipated that this research will be incorporated into future safety standards.

ES-11
SUMMARY AND RECOMMENDATIONS
This report presents NHTSA’s analysis of available biomechanical data to define mathematicalrelationships that can discriminate the mechanical impact conditions under which various portions of thehuman body will or will not be injured. In those cases where the data were sparse or not directlyapplicable, accepted engineering techniques, such as scaling and engineering judgement, wereemployed to both develop and extend existing knowledge to all of the various occupant sizes beingconsidered for the proposed rulemaking action. Table ES.6 summarizes the proposals that are a resultof this effort, and are believed to represent the best characterization of injury criteria available at thistime. Although the large male Hybrid III dummy is not included in the proposed testing for theadvanced air bag SNPRM, the performance limits are listed for completeness.
Table ES.6: Summary of Recommended Injury Criteria for the SNPRM
RecommendedCriteria
Large§Male
Mid-SizedMale
SmallFemale
6 YOChild
3 YOChild
1 YOInfant
Head Criteria: HIC (15 msec) 700 700 700 700 570 390
Neck Criteria: SNPRM Nij
Critical Intercept ValuesTension and Compression (N)Flexion (Nm)Extension (Nm)
1.0
5440415166
1.0
4500310125
1.0
337015562
1.0
28009339
1.0
21206827
1.0
14654317
Thoracic Criteria1. Chest Acceleration (g)
2. Chest Deflection (mm)
55
70(2.8 in)
60
63(2.5 in)
60
52(2.0 in)
60
40(1.6 in)
55
34(1.4 in)
50
30*(1.2 in)
Lower Ext. Criteria:Femur Load (kN) 12.7 10.0 6.8 NA NA NA
§ The Large Male (95th percentile Hybrid III) is not currently proposed for inclusion in the SNPRM, but theperformance limits are listed here for completeness.
* The CRABI 12 month old dummy is not currently capable of measuring chest deflection.

ES-12
The following chapters delineate in much greater detail the available biomechanical data, its sources,and the procedures used to derive the proposed recommended performance limits for each major bodyarea and occupant size. Appendix A presents a summary of the responses to the Notice of ProposedRulemaking for FMVSS No. 208 and other opportunities for public comment on proposed injurycriteria. Appendices B, C, and D offer extensive examples of the application of the various proposedinjury criteria to available test data. Appendix E discusses statistical analysis procedures for developinginjury risk curves from biomechanical test data. Appendix F summarizes the development of age-dependent neck scale factors. Appendix G provides the source files for a software program to calculatethe Nij Neck Injury criteria.

1-1
Chapter 1Introduction
Many researchers from around the world have contributed to the current base of knowledge ofbiomechanics. Over a century ago, researchers conducted tests to determine the strength of variousbiological tissues. (Duncan, 1874 and Messerer, 1880) Research into the safety of automotiveoccupants has been actively pursued for decades. Current issues and experimental results are presentedevery year at international conferences dedicated to biomechanics research. One of these annualmeetings, the Stapp Car Crash Conference, has recently celebrated its 43rd anniversary. In developingthe proposed injury criteria, the NHTSA’s National Transportation Biomechanics Research Center(NTBRC) has drawn extensively from existing published research. Existing data from human cadavers,animal subjects, and to a limited degree live volunteers have been extensively analyzed during theprocess of developing the proposed injury criteria. Discussion of these previous experimental studieswill be included in the sections for each individual body region.
In this introduction, two techniques - scaling and statistical analysis - that are used in developing theproposed injury criteria are summarized.
1.1 SCALING TECHNIQUES
Often, data can be collected for a specific type of vehicle occupant under a given loading condition,(e.g., an adult male), but data cannot be collected on other types of occupants. This is clearlyevidenced by the paucity of biomechanical data available for children. Given these circumstances,biomechanics researchers must turn to scaling techniques and engineering judgement to develop injurycriteria for other size occupants (e.g., children).
The type of scaling most commonly used in automotive applications is dimensional analysis. Formechanical systems in which thermal and electrical effects are absent, this technique allows theunknown physical responses of a given system to be estimated from the known responses of a similarsystem by establishing three fundamental scaling factors that are based on ratios between fundamentalproperties that characterize the two systems.(Newton, 1687, Langhaar, 1951 and Taylor, 1974) Forstructural analysis, the three fundamental ratios are length, mass density, and modulus of elasticity orstiffness. The scaling ratios for other variables of interest are based on the fundamental ratios.(Melvin,1995) The three dimensionless fundamental ratios are defined as
Length Scale Ratio: 8L = L1 / L2
Mass Density Ratio: 8D = D1 / D2
Modulus of Elasticity Ratio: 8E = E1 / E2
1-2
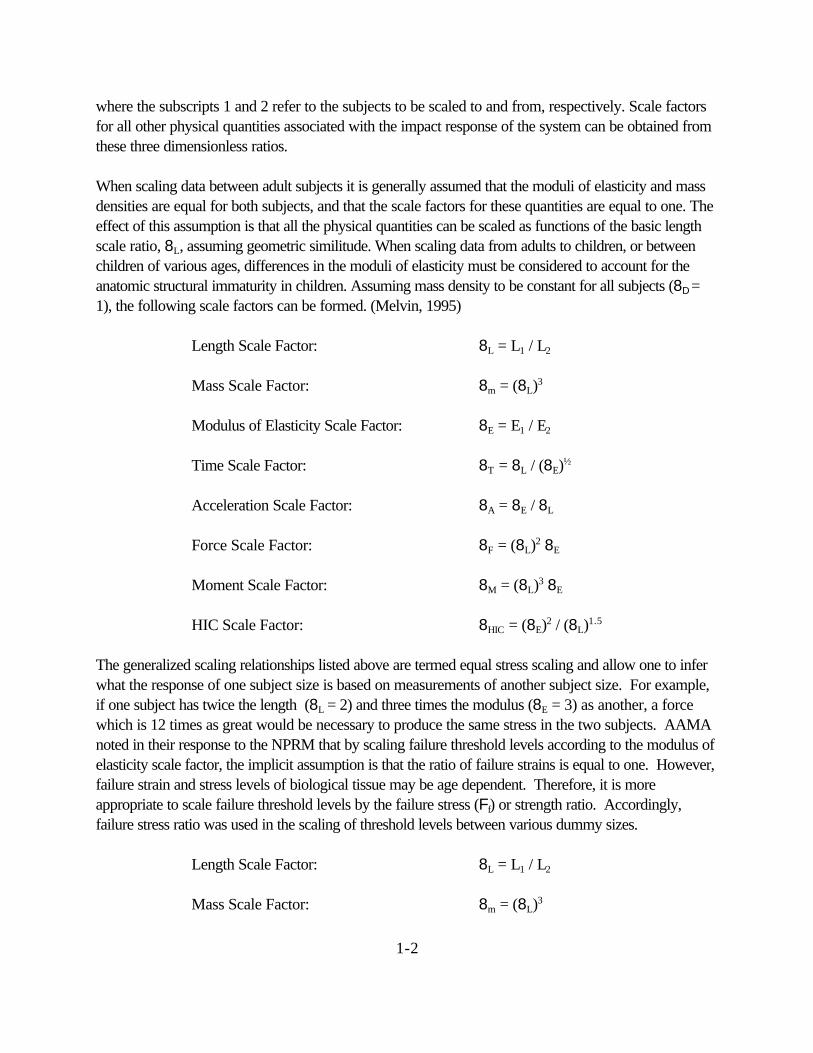
where the subscripts 1 and 2 refer to the subjects to be scaled to and from, respectively. Scale factorsfor all other physical quantities associated with the impact response of the system can be obtained fromthese three dimensionless ratios.
When scaling data between adult subjects it is generally assumed that the moduli of elasticity and massdensities are equal for both subjects, and that the scale factors for these quantities are equal to one. Theeffect of this assumption is that all the physical quantities can be scaled as functions of the basic lengthscale ratio, 8L, assuming geometric similitude. When scaling data from adults to children, or betweenchildren of various ages, differences in the moduli of elasticity must be considered to account for theanatomic structural immaturity in children. Assuming mass density to be constant for all subjects (8D =1), the following scale factors can be formed. (Melvin, 1995)
Length Scale Factor: 8L = L1 / L2
Mass Scale Factor: 8m = (8L)3
Modulus of Elasticity Scale Factor: 8E = E1 / E2
Time Scale Factor: 8T = 8L / (8E)½
Acceleration Scale Factor: 8A = 8E / 8L
Force Scale Factor: 8F = (8L)2 8E
Moment Scale Factor: 8M = (8L)3 8E
HIC Scale Factor: 8HIC = (8E)2 / (8L)1.5
The generalized scaling relationships listed above are termed equal stress scaling and allow one to inferwhat the response of one subject size is based on measurements of another subject size. For example,if one subject has twice the length (8L = 2) and three times the modulus (8E = 3) as another, a forcewhich is 12 times as great would be necessary to produce the same stress in the two subjects. AAMAnoted in their response to the NPRM that by scaling failure threshold levels according to the modulus ofelasticity scale factor, the implicit assumption is that the ratio of failure strains is equal to one. However,failure strain and stress levels of biological tissue may be age dependent. Therefore, it is moreappropriate to scale failure threshold levels by the failure stress (Ff) or strength ratio. Accordingly,failure stress ratio was used in the scaling of threshold levels between various dummy sizes.
Length Scale Factor: 8L = L1 / L2
Mass Scale Factor: 8m = (8L)3

1-3
Failure Strength Scale Factor: 8s f = F f1 / F f2
Acceleration Scale Factor: 8A = 8Ff / 8L
Force Scale Factor: 8F = (8L)2 8Ff
Moment Scale Factor: 8M = (8L)3 8 Ff
HIC Scale Factor: 8HIC = (8 Ff ) 2.5 / (λL) 1.5
1.2 STATISTICAL ANALYSIS TECHNIQUES
Because mechanical surrogates of humans (crash test dummies), rather than living humans, are used incrash tests to evaluate the safety attributes of vehicles, relationships between measurements ofengineering variables made on the dummy and the probability of a human sustaining a certain type andseverity of injuries are needed. The process to develop these relationships, commonly called injurycriteria, is to conduct a series of experimental tests on highly instrumented biologically realistic humansurrogates, such as cadavers, that expose them to crash conditions of interest. Measurements ofengineering variables, such as forces, velocities, deflections, and accelerations, are made tomechanically characterize each impact event. Necropsy results are used to document the concomitantinjuries. The data are entered into an appropriate database for analysis. The following procedures areconsidered by the NTBRC to provide the most meaningful relationships and thus were applied asindicated.
First, the level or severity of injury in each test was classified using the 1990 AIS manual. Each test inthe data set was then assigned to one of two categories: (1) “no injury” representing the absence ofinjuries or minor injuries of AIS<3, or (2) “injury” representing serious injuries of AIS$3. Logisticregression was then used to develop injury criteria models where the mathematical relationship betweenthe dichotomous dependent variable (“injury” or “no injury”) and various independent measured orcalculated variables such as spine acceleration were estimated. In logistic regression, a “null hypothesis”is initially made assuming that there is no relationship between the dependent injury variable and thecandidate independent variable under study. The goodness of fit of the model is determined byexamining the -2 log-Likelihood Ratio (-2log(LR)), which is a measure of the probability that theindependent variable(s) explains the available outcomes. The -2log (LR) is used to test the nullhypothesis and provide measures of rejection of the null hypothesis call “p-values”. Higher values of -2log(LR) and lower p-values indicate that the model provides a better fit to the data.
Model building strategies and goodness of fit measures outlined by Hosmer and Lemeshow (1989)were used to develop the injury criteria models as well as for comparing their relative predictive ability.The Goodman-Kruskal Gamma of rank correlation was used for assessing the predictive ability of the
1-4
model. Similar to R2 in regression analysis, a Gamma value of 1 indicates perfect predictive abilitywhile a value of 0 indicates no predictive ability of the model. The predictive ability of the model canalso be assessed by the percentage of concordance and discordance. A greater percentage ofconcordance indicates better predictive ability of the model.
Much of the data used in this analysis have been previously analyzed using the Mertz/Webermethod.(Mertz, 1996). This method uses only two data points from the available experimental data setto define the range of overlap region between “non-injury” and “injury”, that is, the lowest valueassociated with “injury” and the highest value associated with “non-injury”. Based on these two points,a modification of the “median rank” method is used to determine the mean and standard deviation of anassumed cumulative normal distribution function to explain the probability of an injurious eventoccurring. No statistical goodness of fit measures are used to guide the analysis or provide evaluationsof the resulting predictive relationships.
Because of the considerable methodological differences between these two methods, significantlydifferent functions can result from the data set depending on whether the Mertz/Weber method orlogistic regression technique was employed. Therefore, because logistic regression technique uses theentire available experimental data set, uses the widely accepted statistical concept of “maximumlikelihood” to obtain its results, and provides established statistical measures to evaluate absolute andrelative predictive capabilities of the resulting relationships, logistic regression was used for all analysesperformed in the development of cervical and thoracic injury criteria and tolerance limits discussed inthe previously published report on injury criteria.
In response to the previously published agency report, the AAMA commented that the statisticalmethods used by the agency are invalid and that “no significant mathematical or experimental foundationwas given”. The logistic regression methods used to develop CTI are well established methods used inepidemiological research and in drug studies which are well documented in many books and isexplained in detail by Kuppa (1998). Other references may be found in Hosmer and Lemeshaw(1989), Menard, and Kleinbaum, et al (1982). Methods of analyses using regression methods such asANOVA and logistic regression have already been proven to be effective methods for data where thedependent variable is nominal (such as injury outcome). Therefore, it was considered unnecessary togo into the mathematical details of this procedure. Logistic regression is extensively used in determiningappropriate dose levels in drug effectiveness studies. The process of determining injury threshold levelsusing sled test data follows a similar methodology.
The relative merits of the various statistical methods were discussed at the biomechanics public meetingheld on April 20, 1999. Simulation studies showed that logistic regression using the maximumlikelihood method is able to predict the population parameters more accurately than other methods suchas the Mertz-Weber median rank method or the Certainty Method, as shown in Appendix E. Thus, theagency continues to support logistic regression techniques as the most appropriate method of analysisand also uses this technique for the analyses discussed in the current report.
2-1
)()(1
max 12
5.2
12
2
1
ttdttatt
HICt
t
−
−= ∫
Chapter 2Head Injury Criteria
2.1 BACKGROUND
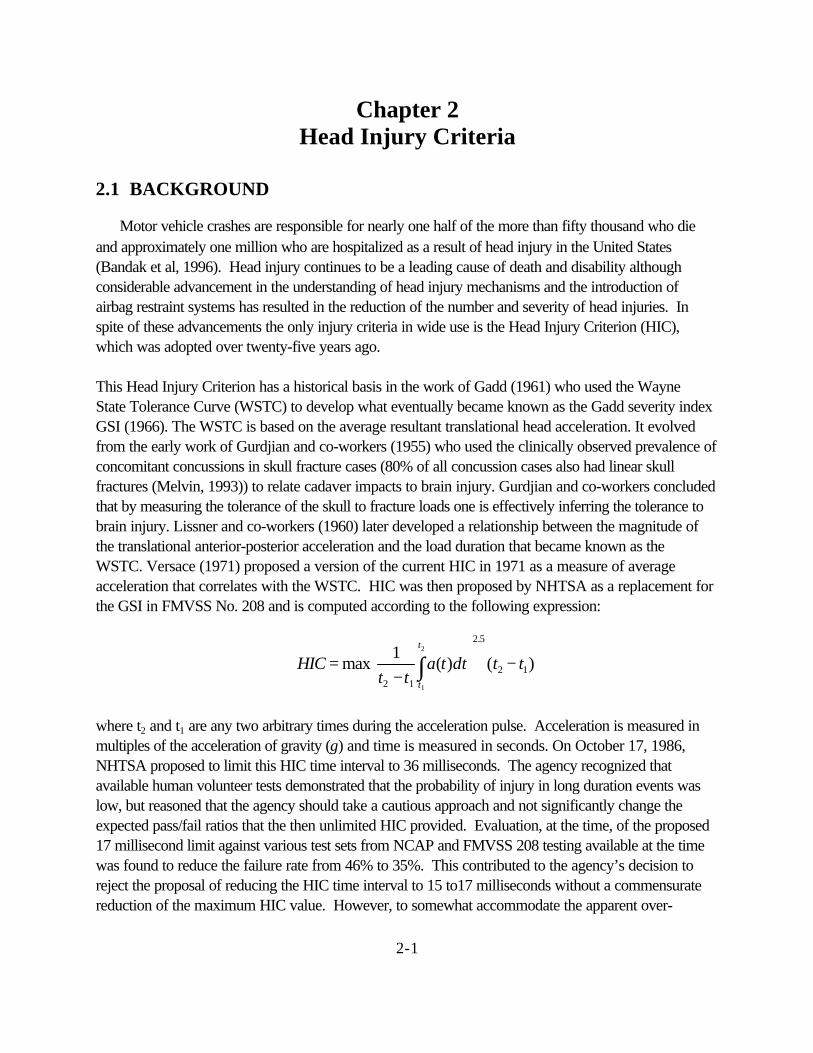
Motor vehicle crashes are responsible for nearly one half of the more than fifty thousand who dieand approximately one million who are hospitalized as a result of head injury in the United States(Bandak et al, 1996). Head injury continues to be a leading cause of death and disability althoughconsiderable advancement in the understanding of head injury mechanisms and the introduction ofairbag restraint systems has resulted in the reduction of the number and severity of head injuries. Inspite of these advancements the only injury criteria in wide use is the Head Injury Criterion (HIC),which was adopted over twenty-five years ago.
This Head Injury Criterion has a historical basis in the work of Gadd (1961) who used the WayneState Tolerance Curve (WSTC) to develop what eventually became known as the Gadd severity indexGSI (1966). The WSTC is based on the average resultant translational head acceleration. It evolvedfrom the early work of Gurdjian and co-workers (1955) who used the clinically observed prevalence ofconcomitant concussions in skull fracture cases (80% of all concussion cases also had linear skullfractures (Melvin, 1993)) to relate cadaver impacts to brain injury. Gurdjian and co-workers concludedthat by measuring the tolerance of the skull to fracture loads one is effectively inferring the tolerance tobrain injury. Lissner and co-workers (1960) later developed a relationship between the magnitude ofthe translational anterior-posterior acceleration and the load duration that became known as theWSTC. Versace (1971) proposed a version of the current HIC in 1971 as a measure of averageacceleration that correlates with the WSTC. HIC was then proposed by NHTSA as a replacement forthe GSI in FMVSS No. 208 and is computed according to the following expression:
where t2 and t1 are any two arbitrary times during the acceleration pulse. Acceleration is measured inmultiples of the acceleration of gravity (g) and time is measured in seconds. On October 17, 1986,NHTSA proposed to limit this HIC time interval to 36 milliseconds. The agency recognized thatavailable human volunteer tests demonstrated that the probability of injury in long duration events waslow, but reasoned that the agency should take a cautious approach and not significantly change theexpected pass/fail ratios that the then unlimited HIC provided. Evaluation, at the time, of the proposed17 millisecond limit against various test sets from NCAP and FMVSS 208 testing available at the timewas found to reduce the failure rate from 46% to 35%. This contributed to the agency’s decision toreject the proposal of reducing the HIC time interval to 15 to17 milliseconds without a commensuratereduction of the maximum HIC value. However, to somewhat accommodate the apparent over-

2-2
stringency of the limited HIC for long duration events, the agency did propose limiting the maximumtime interval to 36 milliseconds. This provision allowed the maximum average long durationacceleration to rise to a limit of 60 G’s.
The agency is proposing to evaluate the HIC over a maximum 15 millisecond time interval for alldummy sizes with a requirement that it not exceed a maximum of 700 for the 50th percentile male andthe 5th percentile female. This will simultaneously provide a equally stringent evaluation of long durationevents while providing increased stringency for short duration events where biomechanical certainty isnot as strong. We are proposing to change the HIC time interval to a maximum of 15 milliseconds forall dummy sizes and to revise the HIC limits by commensurate amounts, based on a scaling from theproposed new limit for the 50th percentile adult male dummy.
The HIC limits proposed in the NPRM reflected a scaling methodology that included bothgeometrical and material property scaling using the properties of the cranial sutures. This method wasbased on the assumption that the pediatric skull deformation is controlled by properties of the cranialsutures, rather than the skull bones. Comments received in response to the NPRM and at a publicmeeting held on April 20, 1999 focused primarily on two issues: (1) the time duration used for thecomputation of HIC and (2) the scaling of HIC for the child dummies. In general, commenters urgedthat more conservative values for HIC should be adopted for the child dummies and especially for the12-month-old CRABI infant dummy. Commenters cited differences in structure between the compliantinfant skull with soft cranial sutures and the adult skull in addition to the uncertain tolerances of theinfant’s brain. AAMA recommended that the duration for the HIC computations be limited to 15milliseconds with a limit of 700 for the 50th percentile adult male dummy, which is consistent withCanadian Motor Vehicle Safety Standard No. 208. The basis for AAMA’s recommended 15millisecond duration was that, in the original biomechanical skull fracture data from which HIC wasderived, no specimen experienced a skull fracture and/or brain damage with a HIC duration greaterthan 13 milliseconds. AAMA also argued that HIC36 overestimates the risk of injury for long-durationhead impacts with air bags. That organization cited a study where human volunteers who wererestrained by air bags experienced HIC36 greater than 1000 and did not experience brain injury orskull fracture.
Based on a recent analysis of 295 NCAP tests, shown in Figure 2-1, the stringency of HIC15 of700 and HIC36 of 1000 appear to be equivalent for long duration events because while HIC15
produces a lower numerical value for long duration events, its lower threshold, 700, compensates forthis reduction. Of the 295 NCAP tests examined, 260 passed and 18 failed both criteria, 10 tests thatfailed HIC15 passed HIC36, while 7 tests that failed HIC36 passed HIC15. Thus, the two criteria andassociated thresholds offer approximately the same stringency for long durations events. For shortduration events, where either criteria would produce the same numerical value, HIC15 with its proposed700 threshold is more stringent. The agency believes that this increased stringency (conservativeness)for short duration impacts is justified in light of the HIC function’s somewhat uncertain relationship withbrain injury and the extreme measures employed to scale the adult threshold of 700 to small children

2-3
and the 5th female. Thus, the agency proposes to employ a 15 millisecond time interval whenevercalculating the HIC function and limiting the maximum response of the adult dummies to a value of 700and suitably scaling the performance limits for the child dummies.
Figure 2-1: Comparison of HIC15 and HIC36 for NCAP data.
Comparisons were made between HIC15 and HIC36. For sinusoidal pulses (Figure 2-2),HIC15=700 gives lower peak acceleration limit for short duration pulses but higher peak accelerationfor long duration (>50ms) pulses. HIC15=500 gives lower peak acceleration limit for pulses withduration up to75ms and the same limit after that.
y = 0.6822x - 10.507
R2 = 0.8963
0
200
400
600
800
1000
1200
1400
0 200 400 600 800 1000 1200 1400 1600
HIC36
HIC
15
NHTSA DATA 328 samples

2-4
0
50
100
150
200
0 20 40 60 80 100
Duration (ms)
Max
imum
Acc
eler
atio
n (g
's) HIC15 =500
HIC15 =700HIC36 =1000
Figure 2-2: Comparison of HIC15 and HIC36 for theoretical head acceleration pulse which is ahalf-sine wave
2.2 SCALING HIC TO VARIOUS OCCUPANT SIZES
The head structure for the whole dummy family used in FMVSS 208 is essentially a padded rigidaluminum shell that does not deform as does the human skull under loading. The amount and type ofdeformation in the human skull, for a particular loading, varies significantly with age with markeddifference between very young children and adults. Scaling for these effects in various occupant sizesrequires knowledge of the geometric, material, and rate response differences in the populations. Thepaucity of available data on the properties and biomechanical response of the human head as a functionof age makes the scaling task very difficult. McPherson and Kriewall (1980) reported a study of themechanical properties of fetal cranial bone. The study included bending tests on samples of skull bonefrom fetuses and one six year old child. They obtained tensile moduli scaling factors, for the six yearold, of 0.59-0.79, depending on the direction, compared to the adult. Results reported by Melvin(1995) indicated that the stiffness ratio with respect to the adult value was 0.243 for the newborn skulland 0.667 for the six year old.

2-5
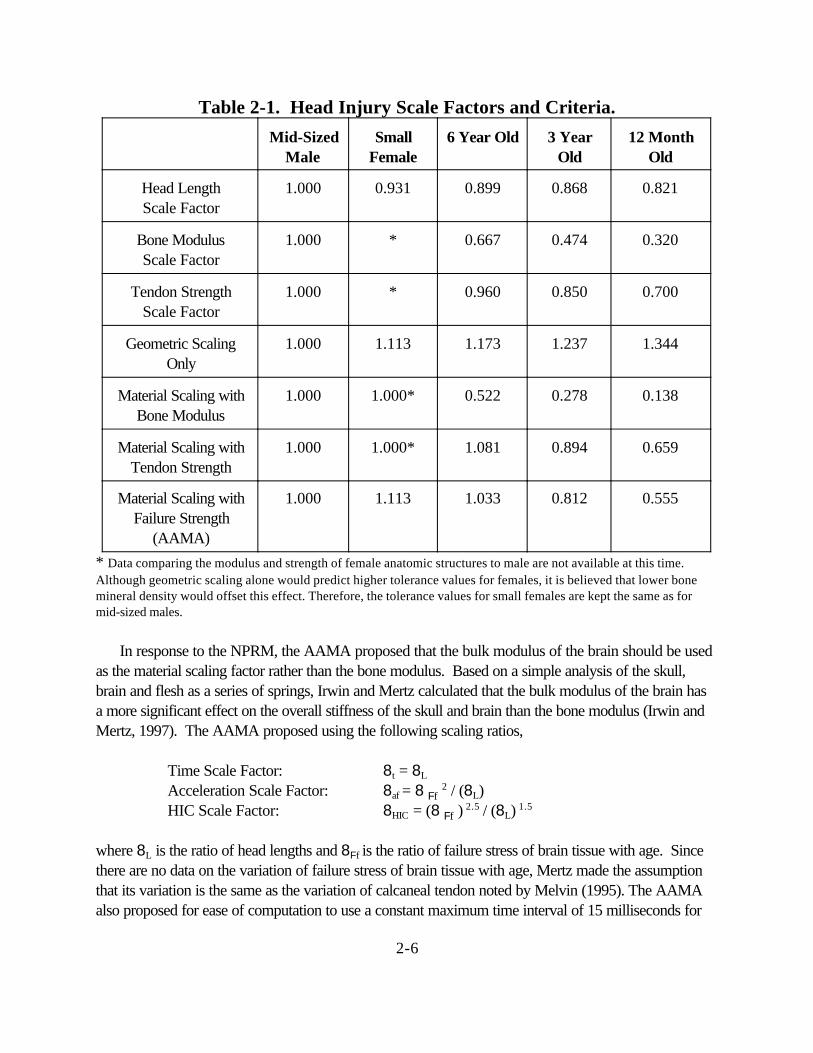
A scaling factor for HIC can be written as λHIC = (λE)2 / (λL)1.5 where λE is the material scalefactor and λL is the head length scale factor. To summarize the agency’s development of HIC scalingfactors presented in the previous report (NHTSA Docket 1998-4405-9), three different scalingmethods were investigated to obtain HIC values for the various occupant sizes. Results from thesescaling methods are shown in Table 2-1. Geometric scaling alone predicted higher tolerance to headacceleration for a child than for an adult. For example, the HIC36 scale factor for a 12 month olddummy, assuming λE = 1, would be 1.34. Thus, the scaled HIC36 limit for a 12 month old is 1344.Melvin (1995) used bone modulus as a scale factor in obtaining results that give relatively low HICvalues for children, for instance 138 for a 12 month old. Here, NHTSA’s used Melvin’s approach butwith a different head length scale factors obtained from a different source (NHTSA, 1996). The thirdmethod for scaling HIC used in the previous report (NHTSA Docket 1998-4405-9) assumes thatpediatric skull deformation is controlled by the properties of the cranial sutures, rather than the skullbones. Using tendon strength as a surrogate for suture stiffness leads to a HIC36 limit for a 12 month oldof 660, which falls in between the previous two methods. This method was used to scale the HIC36
limits proposed in the NPRM. Table 2-1 shows the proposed HIC36 values for each dummy size. Although a scaled HIC36 value of 1081 was obtained for the six year old, a value of 1000 wasmaintained to avoid having a higher threshold for a child than for an adult, given the uncertainties in thescaling process. The proposed limit for the three year old was rounded up from 894 to 900. The limitfor the 12 month old was rounded up from 659 to 660.
2-6
Table 2-1. Head Injury Scale Factors and Criteria.
Mid-SizedMale
SmallFemale
6 Year Old 3 YearOld
12 MonthOld
Head LengthScale Factor
1.000 0.931 0.899 0.868 0.821
Bone ModulusScale Factor
1.000 * 0.667 0.474 0.320
Tendon StrengthScale Factor
1.000 * 0.960 0.850 0.700
Geometric ScalingOnly
1.000 1.113 1.173 1.237 1.344
Material Scaling withBone Modulus
1.000 1.000* 0.522 0.278 0.138
Material Scaling withTendon Strength
1.000 1.000* 1.081 0.894 0.659
Material Scaling withFailure Strength
(AAMA)
1.000 1.113 1.033 0.812 0.555
* Data comparing the modulus and strength of female anatomic structures to male are not available at this time.Although geometric scaling alone would predict higher tolerance values for females, it is believed that lower bonemineral density would offset this effect. Therefore, the tolerance values for small females are kept the same as formid-sized males.
In response to the NPRM, the AAMA proposed that the bulk modulus of the brain should be usedas the material scaling factor rather than the bone modulus. Based on a simple analysis of the skull,brain and flesh as a series of springs, Irwin and Mertz calculated that the bulk modulus of the brain hasa more significant effect on the overall stiffness of the skull and brain than the bone modulus (Irwin andMertz, 1997). The AAMA proposed using the following scaling ratios,
Time Scale Factor: 8t = 8L
Acceleration Scale Factor: 8af = 8 Ff 2 / (8L)
HIC Scale Factor: 8HIC = (8 Ff ) 2.5 / (8L) 1.5
where 8L is the ratio of head lengths and 8Ff is the ratio of failure stress of brain tissue with age. Sincethere are no data on the variation of failure stress of brain tissue with age, Mertz made the assumptionthat its variation is the same as the variation of calcaneal tendon noted by Melvin (1995). The AAMAalso proposed for ease of computation to use a constant maximum time interval of 15 milliseconds for

2-7
the evalution of HIC, although the scaling techniques would suggest that the maximum time intervalwould also be different for the various dummy sizes, ranging from 12.3 to 15 milliseconds. Theresulting scale factors, shown in Table 2-1 are very similar to that obtained by using the tendon strengthas the material property.
After review of the various comments received, the agency conducted further analyses using thefinite element method as the basis for an alternate approach to the aforementioned techniques to scaleHIC values for different sized occupants. This approach utilized salient geometric and materialcharacteristics and features specific to 3 year old, 6 year old, and adult head approximations. Skullstrain response was used as the biomechanical basis for determining the different HIC values for thevarious occupant sizes. This process is inherently approximate and is highly dependent on material andfailure descriptions for the various bone types. The availability of such values in the literature is sparsein the case of adult cranial bone and nearly nonexistent for pediatric bone and suture tissue.
The approach involved the construction of two idealized spherical finite element models for eachage. The first is a proportionally layered deformable model of the head and the second is a rigid modelrepresenting the dummy head equivalent for that age. The deformable model was dropped until somebiomechanical threshold was exceeded. The dummy head model was then dropped from the sameheight to obtain the associated HIC value noting that the dummy models were calibrated against droprequirements for physical dummy heads. Each model was based on actual human dimensions andweights for that age. The thickness of the skull, and scalp layers were not scaled from size to size butrather chosen to represent actual dimensions reported for the various sized occupants. The materialparameters were also chosen to represent specific reported values from the literature and were notscaled by a generalized scaling relationship to the various occupant sizes. The bones of the skull arejoined together by joints called sutures. For the first year and a half after birth these sutures developinto fibrous connective tissue tying the bones together and by the end of this period closing skullopenings such as the fontanelle. Between the ages of 3 and six these joints go through an ossificationprocess that essentially transforms them from connective tissue to bone. The effect of these sutures onthe breaking strain of 1 year old skull is not considered explicitly in the models but is accounted for inthe overall stiffness of the skull. This is an important point since variations in the threshold strain valuesresult in large variations in the resulting HIC. More data on child skull stiffness and breaking strain isneeded. The failure level for the deformable models was determined based on a value of maximumprinciple strain in the skull. The value for this strain in the adult has been reported to be about 0.5%(Wood, 1971). An estimation for the same value in the 6 year old skull was taken to be 0.5% and thebreaking strain values for the 3 and 1 year old children were taken as 1% and 2% respectively. Thesevalues are summarized in Table 2-2.

2-8
Table 2-2: Finite Element Analysis (FEA) Based Scaling Techniques for HIC 15.
BreakingStrain
Dummy Based HIC 15 Range Based on FEA
Scaled HIC 15 Using AAMA Techniques
1 YO 2% 200-300 390
3 YO 1% 300-400 570
6 YO 0.5% 500-600 723
Adult 0.5% 700 700
Small Female 0.5% 700 779
Mid-SizedMale
0.5% 700 700
The agency has considered the proposal by the AAMA for scaling HIC15 according to tissue failurestresses and has found it to be approximately equivalent to both the scaled HIC15 values determinedthrough finite element analysis and the scaling technique employed in the NPRM which uses tendonstrength. In addition since there was a consensus among the members of the AAMA to adopt thescaling technique based on tissue failure stresses, the agency proposes to use this method for scaling theHIC15 performance limits. However, the AAMA proposed performance limits higher than 700 for thesix year old child and for the 5th percentile female. In light of the uncertainties in the scaling techniques,the agency believes it would not be prudent to allow a higher limit for a child than for an adult, and thuspropose that the performance limit for the six year old be set at a value of 700 for HIC15. Furthermore,since the biomechanical data used to develop HIC consisted of both male and female skulls of varioussizes and since head size is not well correlated to body size, the agency is proposing a single value forHIC15 of 700 for all all adult dummies. The agency’s recommended performance limits are summarizedin Table 2-3. Although the large male Hybrid III dummy is not included in the proposed testing for theadvanced air bag SNPRM, the HIC15 limit is listed for completeness.
Table 2-3: Proposed Head Injury Criterion for Various Dummy Sizes
Dummy Type Large §Male
Mid-SizedMale
SmallFemale
6 YearOld
Child
3 YearOld
Child
1 YearOld
Infant
Proposed HIC15 Limit 700 700 700 700 570 390§ The Large Male (95th percentile Hybrid III) is not currently proposed for inclusion in the SNPRM, but theperformance limits are listed here for completeness.

2-9
2.3 HEAD INJURY RISK ANALYSIS
Prasad and Mertz (1985) analyzed available test data from human surrogates to determine therelationship between HIC and injuries to the skull and brain. Methodologies used to analyze the braininjury data had a number of limitations, and resulted in a risk curve nearly identical to the skull fractureinjury risk. Skull fracture data consisted of head drop tests on both rigid and padded flat surfaces(Hodgson, 1977), sled tests against windshields (Hodgson, 1973), and helmeted drop tests (Got 1978,Tarriere 1982). The combined set of data consisted of 54 head impacts, with HIC values ranging from175 to 3400. HIC durations ranged from 0.9 to 10.1 msec. The lowest HIC value associated with askull fracture was 450, and the highest HIC value associated with a non-fracture was 2351.
These data were analyzed by Hertz (1993) fitting normal, log normal, and two-parameter Weibullcumulative distributions to the data set, using the Maximum Likelihood method to achieve the best fit foreach function. The best fit of the data was achieved with the log normal curve, shown in Figure 2-3. Since the data consists of short duration impacts which were typically less than 12 milliseconds, theHIC curve would be applicable to both HIC15 and HIC36 . The probability of skull fracture (MAIS≥2) associated with a HIC15 limit values of 700 for a mid-sized male is 31 percent. Based on scalingprocedures, injury risk levels associated with the proposed HIC15 performance limits for each dummyare assumed to be equivalent to the risk for a HIC15 value of 700 for a mid-sized adult male.

2-10
p fracture NHIC
( )ln( )
=−
µσ
0
0.2
0.4
0.6
0.8
1
P (F
ract
ure)
0 500 1000 1500 2000 2500 3000 HIC
Figure 2-3. Injury risk curve for the Head Injury Criterion (HIC).
The probability of skull fracture (AIS≥2) is given by the formula,
where N( ) is the cumulative normal distribution, µ = 6.96352 and σ = 0.84664.

2-11
2.4 APPLICATION OF HIC TO AVAILABLE TEST DATA
Calculations of HIC15 and HIC36 were made for a wide variety of test data available in the NHTSAdatabase (Tables B1 thru B25). Analyses were conducted for data from 35 mph NCAP tests, 30 mphFMVSS No. 208 compliance tests, 48 kmph (30 mph) rigid barrier and 40 kmph (25 mph) offset testswith 5th percentile adult female dummies, and out-of-position tests with the 3 year old, 6 year old and5th percentile adult female dummies. The percentage of vehicles that passed the newly proposedcriteria of HIC15 ≤700 for the adult dummies and the six year old dummy is discussed below. Asexpected from initial regression analysis of the NCAP vehicle tests that showed the the two criteria andassociated thresholds offer the same stringency for long durations events (Figure 2-2), HIC15 ≤ 700 forthe adults shows very similar pass rates as HIC36≤ 1000 for all vehicle tests analyzed including thosewith the 5th percentile female dummy. The equivalency of the two criteria is also demonstrated fordirect air bag loading to the head in the out-of-position tests. In these tests, the pass rates of the 5th
percentile female and 6 year old child dummy are very simliar for HIC15 and HIC36.
Data from a total of 124 NCAP crash tests from 1997 to 1999 model year vehicles were analyzedwith ATD’s in both the driver and passenger position to determine how the new proposal of HIC15 ≤700 would perform if it were adopted. In these tests, about 94% of the drivers and 92% of thepassengers had a value of HIC15 ≤700.
Data from a total of 40 FMVSS No. 208 compliance tests for 1996-1999 vehicles were analyzedwith ATD’s in both the driver and passenger positions. All drivers had a value of HIC15 ≤700. Allpassengers in the 1998-1999 model year vehicles had a value of HIC15 ≤700. 93% of the passengersin the 1996-1997 model year vehicles had a value of HIC15 ≤700. The averages of HIC15 for alldrivers and passengers are 222 and 239, respectively.
Data from tests conducted at Transport Canada using the Hybrid III 5th percentile adult femaledummy in 1998-1999 model year vehicles were also analyzed. In these tests, the 5th percentile femaledummies were belted and seated in a fully forward position. For the seventeen 208 tests conducted at48 kmph, all drivers and passengers had a value of HIC15 ≤700, with an average value of HIC15 equalto 205 and 206, respectively. For the twenty-nine 40% offset frontal tests conducted at 40 kmph, alldrivers and all but one passenger had a value of HIC15 ≤700, with an average value of HIC15 equal to182 and 114, respectively.
Data from four NHTSA 208 tests with unbelted 5th percentile female dummies in 1999 cars wereanalyzed. All passengers and drivers had a value of HIC15 ≤700. The averages for drivers andpassengers are 169 and 299, respectively.
The 14 tests with the 5th percentile adult female dummy in the driver position 1 and position 2 using1998-1999 model vehicles were also analyzed. The position 1 driver test condition with the 5th
percentile female dummy is intended to maximize head and neck loading from airbag deployment while

2-12
the position 2 test condition is intended to maximize chest loading due to air bag deployment. For theposition 1 tests, 14 out of 14 tests had a value of HIC15 ≤700, with an average value of HIC15 equal to79. For the position 2 tests, 14 out of 14 tests had a value of HIC15 ≤700, with an average value ofHIC15 equal to 39.
The final set of data analyzed for this report were from Hybrid III 6 year old dummy out-of-positiontests using 1996 to 1999 model year vehicles. Out-of-position tests were conducted to investigate thetrauma induced when the child dummy is in close proximity to the deploying airbag. Two out-of-position test conditions were considered for the 6 year-old Hybrid III dummy. The child position 1 isdesigned primarily to evaluate contact forces of the deploying airbag on the head and chest. Thisposition is intended to represent a standardized worst case condition in which the child has been thrownagainst the frontal structure of the vehicle’s interior due to pre-impact braking and/or vehicle impact. The child position 2 is designed to primarily address the contact forces and loading forces of thedeploying airbag on the head and neck. This position is intended to represent a worst case scenario inwhich the child slides forward or is sitting forward on the seat while the upper torso jack-knifes forwardtoward the instrument panel. 7 out of 7 tests in position 2 using the 1999 model vehicles had a value ofHIC15 ≤700, with an average value of HIC15 equal to 246. 15 out of 19 tests in position 1 had a valueof HIC15 ≤700, with an average value of HIC15 of 510. 9 out of 12 tests in position 1 with a 4 inchdistance from the chest to the instrument panel had a value of HIC15 ≤700, with an average value ofHIC15 of 546. 10 out of 11 tests in position 1 with an 8 inch distance from the chest to the instrumentpanel had a value of HIC15 ≤700, with an average value of HIC15 of 345.
In summary, almost all the NCAP tests, FMVSS No. 208 compliance tests, Transport Canadaoffset and rigid barrier tests using the 5th percentile adult female, and out-of-position tests using the 5th
percentile adult female passed the proposed injury criteria of HIC15 ≤700. However, for out-of-position tests using the 6 year-old, some baseline airbag systems failed the proposed head injurycriteria.

3-1
Chapter 3Neck Injury Criteria
3.1 BACKGROUND
The current FMVSS No. 208 alternative sled test includes injury criteria for the neck consisting ofindividual tolerance limits for compression (compression of the neck), tension (force stretching theneck), shear (force perpendicular to the neck column), flexion moment (forward bending of the neck),and extension moment (rearward bending of the neck). Tolerance values are based on a select numberof volunteer, cadaver, and dummy tests. Limits are typically set at minimal threshold levels, but arebased on small sample sizes.
The current tolerance level for axial compression was developed by Mertz et al (1978). They useda Hybrid III 50% male dummy to investigate the neck reaction loads when struck by a tackling blockthat had reportedly produced serious head and neck injuries in football players. The compressiontolerance varied with the duration of the load application, with a peak value of 4000 Newtons.
Current tolerance levels for tension and shear loads were developed by Nyquist et al (1980). Theyused the Hybrid III 50% male dummy to reconstruct real-world collisions, and correlated field injurieswith dummy responses for 3-point belted occupants in frontal collisions. Limits for tension and shearwere set at 3300 N and 3000 N, respectively.
Tolerance levels for flexion and extension bending moments were based on sled tests conducted onvolunteers and cadaver subjects.( Mertz, 1971) Volunteer tests provided data up to the pain threshold,and cadaver tests extended the limits for serious injuries. Ligamentous damage occurred in a smallstature cadaver subject at an extension moment of 35 ft-lbs (47.5 Nm). This value was scaled up to anequivalent 50% male level of 42 ft-lbs (57 Nm). No injuries were produced during flexion testing, sothe maximum measured value of 140 ft-lbs (190 Nm) was taken as the injury assessment referencevalue (IARV). It should be noted that these moment tolerance levels are based on human limits, ratherthan from dummy measurements. Tolerance limits are therefore dependent on the biofidelity of thedummy neck in bending.
Experimental tension tests on cadaveric specimens consist of a small number of studies.Yoganandan et al (1996) tested isolated and intact cadaveric specimens in axial tension under bothquasistatic and dynamic conditions. Isolated specimens failed at a mean tension value of 1555 N. Intactspecimens failed at a higher mean tension value of 3373 N. Shea et al (1992) investigated the tensiontolerance of the neck with a fixed extension angle of 30 degrees. Under this combined loadingcondition, ligamentous cervical spine specimens failed at a mean tension value of 499 N. These resultsindicate that the presence of an extension moment would have a significant effect on the tensiletolerance of the cervical spine. One additional test conducted on a live baboon demonstrated thatphysiological failure of the spinal cord occurs at approximately half the distraction load which causesstructural failure of the cervical column (Lenox, 1982).
3-2
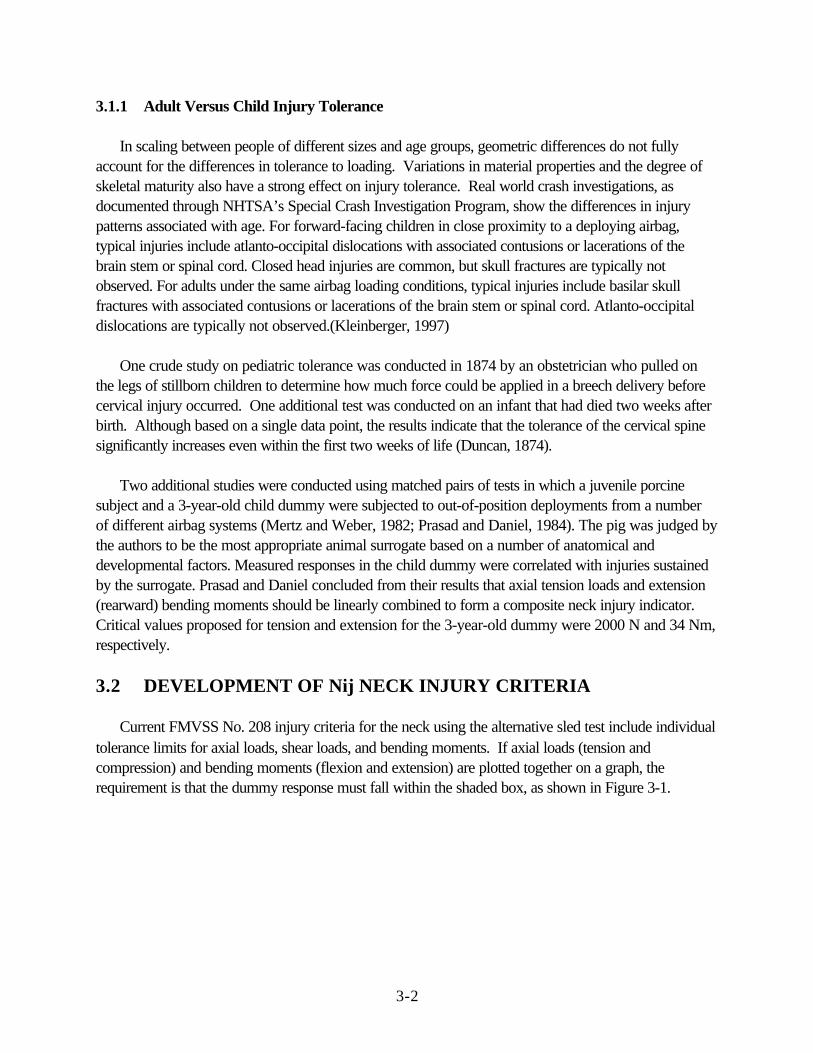
3.1.1 Adult Versus Child Injury Tolerance
In scaling between people of different sizes and age groups, geometric differences do not fullyaccount for the differences in tolerance to loading. Variations in material properties and the degree ofskeletal maturity also have a strong effect on injury tolerance. Real world crash investigations, asdocumented through NHTSA’s Special Crash Investigation Program, show the differences in injurypatterns associated with age. For forward-facing children in close proximity to a deploying airbag,typical injuries include atlanto-occipital dislocations with associated contusions or lacerations of thebrain stem or spinal cord. Closed head injuries are common, but skull fractures are typically notobserved. For adults under the same airbag loading conditions, typical injuries include basilar skullfractures with associated contusions or lacerations of the brain stem or spinal cord. Atlanto-occipitaldislocations are typically not observed.(Kleinberger, 1997)
One crude study on pediatric tolerance was conducted in 1874 by an obstetrician who pulled onthe legs of stillborn children to determine how much force could be applied in a breech delivery beforecervical injury occurred. One additional test was conducted on an infant that had died two weeks afterbirth. Although based on a single data point, the results indicate that the tolerance of the cervical spinesignificantly increases even within the first two weeks of life (Duncan, 1874).
Two additional studies were conducted using matched pairs of tests in which a juvenile porcinesubject and a 3-year-old child dummy were subjected to out-of-position deployments from a numberof different airbag systems (Mertz and Weber, 1982; Prasad and Daniel, 1984). The pig was judged bythe authors to be the most appropriate animal surrogate based on a number of anatomical anddevelopmental factors. Measured responses in the child dummy were correlated with injuries sustainedby the surrogate. Prasad and Daniel concluded from their results that axial tension loads and extension(rearward) bending moments should be linearly combined to form a composite neck injury indicator.Critical values proposed for tension and extension for the 3-year-old dummy were 2000 N and 34 Nm,respectively.
3.2 DEVELOPMENT OF Nij NECK INJURY CRITERIA
Current FMVSS No. 208 injury criteria for the neck using the alternative sled test include individualtolerance limits for axial loads, shear loads, and bending moments. If axial loads (tension andcompression) and bending moments (flexion and extension) are plotted together on a graph, therequirement is that the dummy response must fall within the shaded box, as shown in Figure 3-1.

3-3
Tension
Compression
FlexionExtension19057
3300
4000
Tension (N)
Extension (Nm)34
2000
Figure 3-1: Current sled test alternative neck injury criteria.
Using this formulation, if the mid-sized male dummy measures less than 3300 N of tension alongwith less than 57 Nm of extension moment, it would pass the current criteria. This formulation does notconsider the combined effect of extension and tension.
The concept that a composite neck injury indicator based on a linear combination of axial tensionloads and extension (rearward) bending moments was developed by Prasad and Daniel (1984) usingtheir results from experimental tests on porcine subjects. Based on their formulation for a 3 year olddummy, the allowable region in the tension/extension quadrant of the plot becomes the shaded areashown in Figure 3-1. Any test falling above the diagonal line in this plot would exceed the tolerancelevels.
Figure 3-2: Linear combination of axial and tension loads for porcine subjects representingthe size of a three year old child (Prasad and Daniel, 1984).
Next, the concept of neck criteria based on a linear combination of loads and moments, assuggested by Prasad and Daniel, was expanded to include the four major classifications of combinedneck loading modes; namely tension-extension, tension-flexion, compression-extension, andcompression-flexion. Proposed critical intercept values for tension load, compression load, extensionmoment, and flexion moment were established and are discussed later in section 3-3.
The resulting criteria are referred to as Nij, where “ij” represents indices for the four injurymechanisms; namely NTE, NTF, NCE, and NCF. The first index represents the axial load (tension or

3-4
Extension (Nm) 125
4500Compression (N)
Flexion (Nm)310
Tension (N) 4500
FlexionExtension11
Tension
Compression
1
1
compression) and the second index represents the sagittal plane bending moment (flexion or extension).This Nij concept was first presented in NHTSA’s report on child injury protection (Klinich, 1996).Graphically, the shaded region of the plot in Figure 3-3 shows the region for all four modes of loadingwhich would pass the performance requirements for Nij. The intercept values shown are thoseproposed for the Hybrid III mid-sized male dummy.
Figure 3-3: SNPRM neck injury criteria for the 50th percentile male dummy. The shaded region represents combinations of neck forces and moments which would pass the criteriaof Nij #1.0.
Since each specific dummy has a unique set of critical intercept values, for subsequent scaling thisplot has been normalized by dividing each semi-axis by its critical intercept value for a specific dummy. The resulting plot becomes symmetric about the origin and has maximum allowable values of unity. Graphically, the shaded box shown in Figure 3-4 designates the allowable values of loads and momentsrepresented by this normalized calculation.
Figure 3-4: Normalized SNPRM neck injury criteria for all dummy sizes.The shaded region represents combinations of neck forces and moments which would pass the criteriaof Nij #1.0.

3-5
N = F
F
M
Mij z y
int int+ (3.1)
N = + TE10004500
50125
−−
= 0.62 (3.2)
Real-world cervical injuries resulting from airbag interaction often are classified as tension-extensioninjuries. A tensile load applied to the neck results in stretching of both the anterior (front) and posterior(rear) soft tissues of the neck. If an extension (rearward) bending moment is superimposed upon thetensile load, the anterior soft tissues will be further stretched while the posterior tissues will become lessstretched. Under this loading scenario, a tension-extension injury is more likely to occur than a tension-flexion, compression-extension, or compression-flexion injury. Accordingly, the value for NTE would beexpected to be the maximum of the four Nij values.
3.2.1 Method of Calculation of Nij Criteria
In developing the Nij criteria, information produced in crash tests using dummies, and thesignificance of that information are considered. For any given loading of the dummy, the standard 6-axisupper neck load cell dynamically records the loads and moments in all three directions at the top of theneck. For a frontal collision, primary motion and measured neck reactions occur in the sagittal plane.Out of plane motion and reactions are typically of secondary importance. As a result, only the twomeasurements associated with sagittal plane motion are used in the current formulation of the Nij neckinjury criteria, namely axial load (FZ) and flexion/extension bending moment at the occipital condyles(MY). Shear load (Fx) is only used to calculate the effective moment at the occipital condyles. Usingthe neck cell polarities established by SAE (SAE J1733, 1994) this is accomplished by multiplying theshear load by the height of the load cell above the condyles and subtracting this value from the Y-axismoment measured by the load cell.
Loads and moments at each instance in time are normalized with respect to the correspondingcritical intercept values defined for tension, compression, extension, and flexion. The normalized flexionand extension moments are added to the normalized axial load to account for the superposition of loadand moment. The proposed neck injury criteria can thus be written as the sum of the normalized loadsand moments.
where FZ is the axial load, Fint is the corresponding critical intercept value of load used fornormalization, MY is the flexion/extension bending moment computed at the occipital condyles, and Mint
is the corresponding critical intercept value for moment used for normalization. At each instance intime, Fz and My lie in one of the four quadrants shown in Figures 3-3 and 3-4 which correspond to thefour loading modes of tension-extension, tension-flexion, compression-flexion, and compression-extension. Nij is computed at each instance in time for only that quadrant where Fz and My lie. Forexample, if at one instance in time the axial force is +1000 N (i.e., tension) and the bending moment atthe occipital condyle is -50 N-m (i.e., extension),
The maximum Nij in time for each of the four loading modes, represented by the four quadrants in

3-6
Figure 3-4, is computed from which the maximum Nij for all the four loading modes is determined. The values for calculating the Nij are uniquely specified for each dummy, and are defined in Table
3.6 for the CRABI 12-month-old dummy and the Hybrid III 3-year-old, 6-year-old, small female, andmid-sized male dummies. Source code for a C++ program to calculate the Nij criteria using standardtest data is included in Appendix G. This source code, as well as an executable version of the program,is also available from the NHTSA web site at http://www.nhtsa.dot.gov.

3-7
3.3 DEVELOPMENT AND SCALING OF Nij CRITERIA TO VARIOUSOCCUPANT SIZES
Initial critical intercept values for tension load and extension moment were calculated for the 3 yearold dummy based on the Mertz/Prasad experimental test data. As noted at the beginning of section 3.2,previously published tolerance levels were based on individual tolerance limits. These independentlimits, which do not account for the complex combined loading, were published in context of the short-term alternative sled test. Critical intercept values for axial load and sagittal plane bending werepreviously determined by assuming that each measurement was independently linked to the resultinginjury. Tension limits were set assuming that no extension moment was applied. Similarly, bending limitswere set assuming that no tension was present.
In the previous report (NHTSA Docket 98-4405-9), engineering judgement of the tolerences ofthe adult human neck was used to determine the weighting of the relative importance of the tension andextension in the Nij formulation, which is hereafter referred to the NPRM Nij. Then, the Mertz/Prasadpaired pig and dummy data were re-analyzed using a multi-variate logistic regression to determine thepredictive ability for the combination of tension and extension in the NPRM Nij formulation. Theresulting critical values in the NPRM Nij formulation were 2500 N for tension and 30 N-m forextension for the three-year old. In their response to the NPRM, the AAMA suggested a slightlydifferent linear combination of the axial forces and bending moments in the neck to predict the failure ofthe anterior-longitudinal ligament (ALL). This combination assumed that the force in the ALL would beequal to one-half the measured tensile force and that the additional tensile force due to extension wouldbe equal to the measured extension moment divided by the distance from the anterior surface of theatlas to the posterior surface of the ALL. Based on these assumptions, the resulting critical values forthe three-year old are 2120 N for tension and 26.8 N-m for extension. In light of the largebiomechanical variability in humans, the proposal by NHTSA and the AAMA for the critical values areessentially the same and NHTSA has adopted the AAMA limits for the three-year old as the basis forthe formulation of the Nij which is used in the SNPRM. However, it is important to note, that due todifferent statistical techniques used by the AAMA and the agency which are discussed in detail inChapter 1, the probability of AIS 2+ risk associated with a value of SNPRM Nij = 1.0 is 5%according to the AAMA’s techniques and 22% according to the agency’s techniques.
Critical intercept tension and extension values for other dummy sizes were scaled from the 3 yearold dummy using the scaling techniques presented in Chapter 1 and include the effect of age dependentfailure stress. The AAMA proposed using the failure stress of the calcaneal tendon for the determiningthe failure stress ratio. Forces were scaled according to cross-sectional area of the neck, representedby the circumference squared, multiplied by the failure stress of the ligaments (8Ff 8L
2). Bendingmoments were scaled according to the third power of the characteristic neck length, represented by thecircumference cubed, multiplied by the failure stress of the ligaments (8Ff 8L
3). Circumferencemeasurements are used to quantify characteristic neck length because it is a simple measurement torecord. Circumference measurements, failure strength of the calcaneus tendon, and the associated scalefactors for each dummy size are shown in Table 3.1. Values included in this table were selected fromseveral anthropometric studies conducted on adults and children (Snyder 1977, Schneider 1983, and
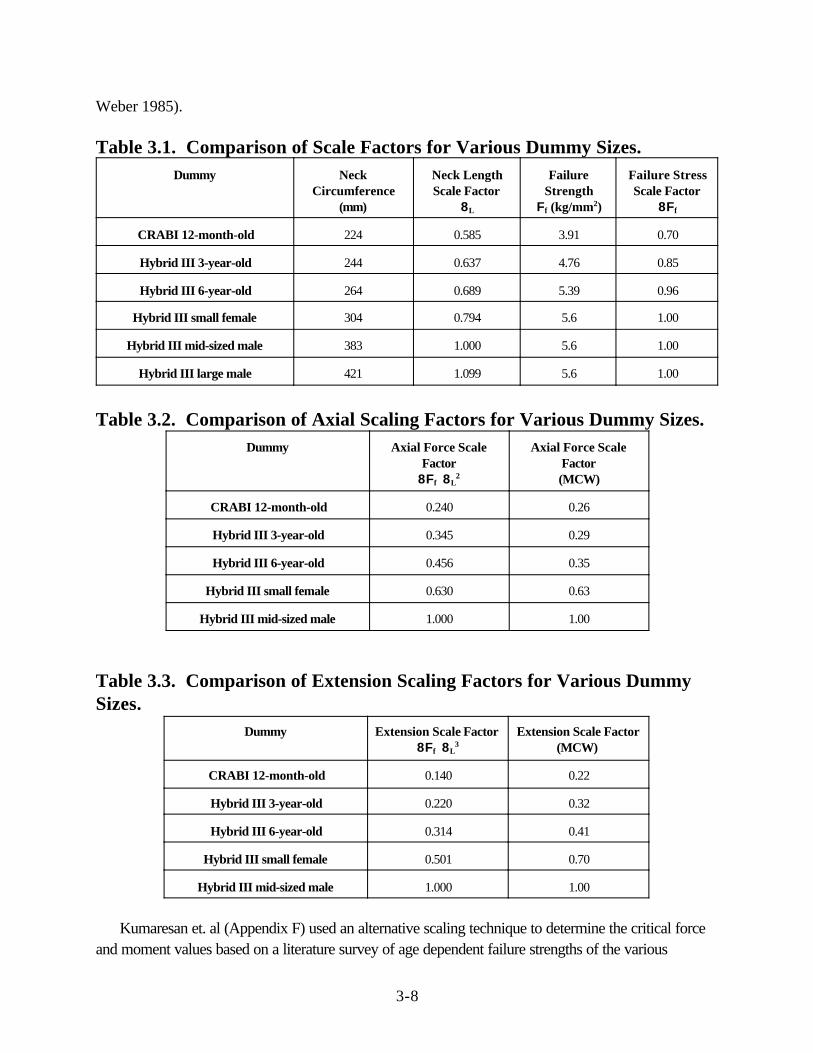
3-8
Weber 1985).
Table 3.1. Comparison of Scale Factors for Various Dummy Sizes. Dummy Neck
Circumference(mm)
Neck LengthScale Factor
8L
FailureStrength
Ff (kg/mm2)
Failure StressScale Factor
8Ff
CRABI 12-month-old 224 0.585 3.91 0.70
Hybrid III 3-year-old 244 0.637 4.76 0.85
Hybrid III 6-year-old 264 0.689 5.39 0.96
Hybrid III small female 304 0.794 5.6 1.00
Hybrid III mid-sized male 383 1.000 5.6 1.00
Hybrid III large male 421 1.099 5.6 1.00
Table 3.2. Comparison of Axial Scaling Factors for Various Dummy Sizes. Dummy Axial Force Scale
Factor8Ff 8L
2
Axial Force ScaleFactor(MCW)
CRABI 12-month-old 0.240 0.26
Hybrid III 3-year-old 0.345 0.29
Hybrid III 6-year-old 0.456 0.35
Hybrid III small female 0.630 0.63
Hybrid III mid-sized male 1.000 1.00
Table 3.3. Comparison of Extension Scaling Factors for Various DummySizes.
Dummy Extension Scale Factor 8Ff 8L
3Extension Scale Factor
(MCW)
CRABI 12-month-old 0.140 0.22
Hybrid III 3-year-old 0.220 0.32
Hybrid III 6-year-old 0.314 0.41
Hybrid III small female 0.501 0.70
Hybrid III mid-sized male 1.000 1.00
Kumaresan et. al (Appendix F) used an alternative scaling technique to determine the critical forceand moment values based on a literature survey of age dependent failure strengths of the various

3-9
ligaments in the neck. This alternative technique shows similar scaling factors as those based on thecalcaneal tendon failure strength (Tables 3.2 and 3.3).
Applying the scale factors from Table 3.1 to the critical intercept tension and extension limits for the3 year old dummy yields the critical intercept values for all dummy sizes shown in Table 3.4. Values forcritical intercept compression and flexion were established by setting fixed ratios between tension andcompression loads, and between extension and flexion moments.
Table 3.4. Scaled Critical Intercept Values for Tension and Extension.
Dummy Tension (N) Extension (Nm)
CRABI 12-month-old 1465 17
Hybrid III 3-year-old 2120 27
Hybrid III 6-year-old 2800 39
Hybrid III small female 3880* 62
Hybrid III mid-sized male 6170* 125* Proposed axial load limits for adult dummies are based on experimental data and are lower than the scaled valuespresented in this table.
To better understand the relationship between dummy and human responses to loading, a modelingstudy was conducted using MADYMO to determine a scale factor between human and dummy neckloads and moments (Nightingale, 1998). In addition to the standard MADYMO model of the HybridIII dummy provided with the software, a second model was created to represent a human occupant.Axial stiffness of the neck and rotational stiffness of the occipital condyle joint were modifiedindividually and in combination to determine their effect on measured loads. A generic airbag modelwas deployed into an out-of-position driver model initially placed in an ISO 1 position, which isintended to maximize loading on the head and neck. A summary of the results is presented in Table 3.5.These results indicate that the measured extension moments for the 50th percentile male dummy wereapproximately 2.4 times higher than for a human, whereas the tension and shear measurements did notchange dramatically. This supports the recommended critical intercept extension moment value of 125Nm suggested above for the mid-sized male dummy, although it is slightly more than double theprevious human-based value of 57 Nm (Mertz, 1971).
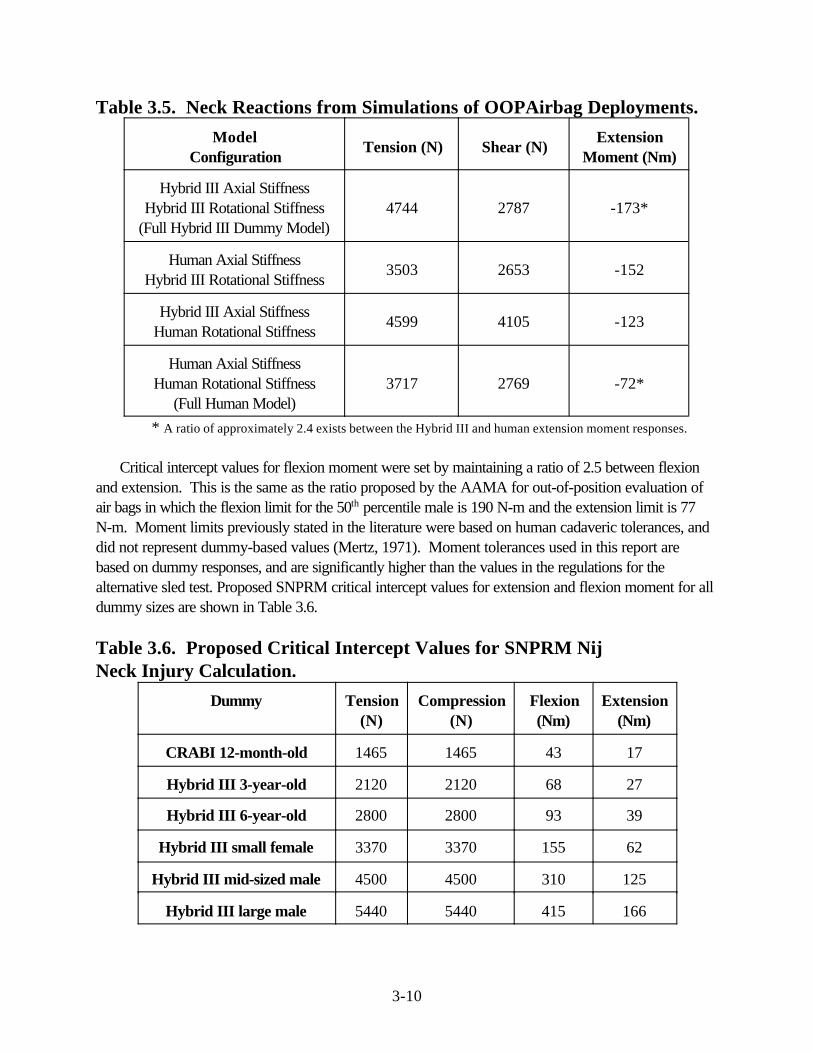
3-10
Table 3.5. Neck Reactions from Simulations of OOPAirbag Deployments.
ModelConfiguration
Tension (N) Shear (N)Extension
Moment (Nm)
Hybrid III Axial StiffnessHybrid III Rotational Stiffness
(Full Hybrid III Dummy Model)4744 2787 -173*
Human Axial StiffnessHybrid III Rotational Stiffness
3503 2653 -152
Hybrid III Axial StiffnessHuman Rotational Stiffness
4599 4105 -123
Human Axial StiffnessHuman Rotational Stiffness
(Full Human Model)3717 2769 -72*
* A ratio of approximately 2.4 exists between the Hybrid III and human extension moment responses.
Critical intercept values for flexion moment were set by maintaining a ratio of 2.5 between flexionand extension. This is the same as the ratio proposed by the AAMA for out-of-position evaluation ofair bags in which the flexion limit for the 50th percentile male is 190 N-m and the extension limit is 77N-m. Moment limits previously stated in the literature were based on human cadaveric tolerances, anddid not represent dummy-based values (Mertz, 1971). Moment tolerances used in this report arebased on dummy responses, and are significantly higher than the values in the regulations for thealternative sled test. Proposed SNPRM critical intercept values for extension and flexion moment for alldummy sizes are shown in Table 3.6.
Table 3.6. Proposed Critical Intercept Values for SNPRM NijNeck Injury Calculation.
Dummy Tension(N)
Compression(N)
Flexion(Nm)
Extension(Nm)
CRABI 12-month-old 1465 1465 43 17
Hybrid III 3-year-old 2120 2120 68 27
Hybrid III 6-year-old 2800 2800 93 39
Hybrid III small female 3370 3370 155 62
Hybrid III mid-sized male 4500 4500 310 125
Hybrid III large male 5440 5440 415 166

3-11
Axial loading of the adult neck is a test condition for which there is significant experimental data.Proposed critical intercept values of tension and compression for adult dummies are therefore based onexperimental data rather than on scaling. Pintar and Yoganandan (Pintar et al., 1998) conducteddynamic compression tests to the head/neck complex with impact velocities ranging from 0.25 cm/s to800 cm/s. Measured loads and accelerations on the specimens were correlated with documentedinjuries sustained by the specimens. The natural lordosis in the cervical spine was removed by forcingit to be in a straight column which approximates a pure axial compressive load to the cervical spine. Thecompressive tolerance level of the cadaveric specimens varied from 7 kN for the young to 2 kN for thevery old. Based on regression analysis of the data, a compressive tolerance level of about 4500 Nunder dynamic loading conditions was estimated for males in the age range of 30-35 years. Using adrop track system, Nightingale et al. (1997) conducted similar dynamic compression tests on 22cadaveric head/neck specimens in which the natural lordosis of the cervical spine was maintained. Thus, the specimen had a combination of axial load and moment which contributes to failure. The meancompressive force to failure in the Nightingale et al. study was signficantly lower than that in the Pintaret al. study for male specimens of similar mean age. The lower injury tolerance in the Nightingale studyis due to the additional bending moment present, which is minimized in the Pintar study by removing thelordosis. This is consistent with the biomechanical basis of Nij. The axial failure force in these twostudies is in about the same range as the previously published injury assessment reference values of3300 N for tension (Nyquist 1980) and 4000 N for compression (Mertz 1978).
Based on the experimental data discussed above with axial tolerances of the human neck of rangingfrom 3300 to 4500 N depending on test conditions, the scaled values of 3880 and 6170 N for thesmall female and mid-sized male appear to be too high. This discrepancy can be expected due to thelarge size differences and structural differences between the neck of an adult and the neck of the threeyear old subject from which the Nij formulation was derived. Thus, based on the experimental data ofPintar (1995) which most closely represents a pure axial compression of the cervical spine, an axial limitfor the mid-sized male dummy of 4500 N is proposed. The axial limit proposed for the small female is3370 N, which is based on the interpolating the tension value for the 6 year old and the mid-sized maleaccording to the scaling ratios presented in Table 3.1. Preliminary NHTSA-sponsored tests oncadaveric head/neck specimens indicate that the tolerance of the neck to compression is notsignificantly different from the tolerance for tension (Nightingale, unpublished). As a result, the axial loadlimit in tension is assumed to be equal to that in compression. The axial limits for the adult dummies areslightly higher than those proposed in the NPRM and are consistent with the option in the NPRM toallow a performance limit of Nij up to a value of 1.4. Based on the agency’s analysis of comments bymany groups to adopt conservative values of neck injury criteria, especially for children, the Nij criticalvalues presented in Table 3.6 for the child dummies are lower than those proposed in the NPRM. Thisconservativeness is warranted until sufficient data is available to support higher tolerances for thepediatric neck.

3-12
3.4 NECK INJURY RISK ANALYSIS
Risk curves previously presented by Mertz (1997) were calculated based on the Mertz/Webermodified Median Rank method using experimental data from porcine subjects.(Mertz, 1982; Prasad,1984) These data using the linear combination of forces and moments suggested by Mertz asdescribed in the section 3.3 were re-analyzed using logistic regression, yielding the porcine risk curveshown in Figure 3-5. This curve represents the probability of injury to a porcine subject as a function ofthe measured loads and moments on a 3 year old child dummy placed in the same conditions, such as inclose proximity to a deploying airbag. An Nij value of 1.0 on this curve is associated withapproximately a 22% risk of an AIS$3 injury.
In order to establish the corresponding risk curve for a live human subject, a comparison was madebetween the injury rates predicted using Nij calculations from experimental dummy test data and realworld injury rates estimated from the National Automotive Sampling System (NASS) database. Datafrom 1997, 1998, and 1999 New Car Assessment Program (NCAP) crash tests were analyzed andcompared with NASS cases from similar crash conditions. NCAP tests involve a 56 kmph (35 mph)full rigid barrier impact with belted mid-sized male dummies in both the driver and passenger seatingpositions. It is important to note that NCAP tests use a 56 kmph (35 mph) impact velocity and belteddummies, whereas FMVSS No. 208 compliance tests at 48 kmph (30mph) use both belted andunbelted dummies. Therefore, it is not a requirement that NCAP tests meet FMVSS No. 208 injurycriteria.
The probability of neck injury, given that a crash occurred, was examined for real world non-rollover frontal crashes in various delta-V ranges. Neck injuries included vertebral fractures, contusions,lacerations, and transections of the cord, as well as brain stem injuries and basilar skull fractures thatoccur as a result of loading to the neck. Although the biomechanical tolerance curves were based onAIS$3 neck injuries, AIS$2 NASS data was examined because there are a number of fatal injuriescoded as AIS 2 “broken neck, only information available.” Generally, these injuries represent onlyabout 1-3% of all AIS 2+ cases, and in the case of airbag vehicles there was only one AIS 2 case inthe data between 25 and 30 mph delta V, which is not considered in the final analysis when only higherdelta V crashes are considered.
Results from this risk comparison indicate that for New Car Assessment Program (NCAP) crashconditions, NASS data show about a 3 to 7 percent probability of neck injury for belted occupants ofairbag equipped vehicles compared to about a 12 percent probability of neck injury predicted using theNij critical values listed in Table 3-4. For unbelted occupants with air bags, the probability of neckinjury estimated from NASS is about 1 to 7 percent compared to about a 9 percent probability of neckinjury from unbelted crash tests at 30 mph.
In the previous report which used the NPRM critical values, an adjustment was made to the originalporcine risk curve to establish a human curve to account for differences between estimates of neckinjury rates based on NASS and experimental test data. By contrast, using the critical valuesdeveloped in this document, an adjustment to the original porcine risk curve was not necessary because

3-13
p AIS
p AIS
p AIS
p AIS
Nij
Nij
Nij
Nij
( )
( ) ( . )
( )
( )
.054 .
.227 .969
.693 .
. .
≥ =+
≥ =+
≥ =+
≥ =+
−
−
−
−
21
1
31
13 2
41
1
51
1
2 1 195
3 1
2 1195
3 817 1 195
e
e
e
e
0 0.1 0.2 0.3 0.4 0.5 0.6 0.7 0.8 0.9
1
Prob
abili
ty o
f AIS
>=3
Nec
k In
jury
0 1 2 3 4 5 6 Nij
the NASS estimates were reasonably close to the experimental estimates of neck injury rates. Sincethe Nij criteria are defined as normalized injury measures, an Nij value of 1.0 represents a 22% risk ofAIS 3+ injury for all occupant sizes. The original porcine data from Mertz (1982) and Prasad (1984)were also used to calculate a risk curve for AIS$2, 4, and 5 injuries using logistic regression and arepresented in Equation 3.2.
Figure 3-5. Injury Risk Curve for Nij Neck Injury Criteria.

3-14
0
0.2
0.4
0.6
0.8
1
Prob
abili
ty o
f AIS
>=3
Inju
ry
0 1 2 3 4 5 6 Nij
AIS>=3 AIS>=2 AIS>=4 AIS>=5
Figure 3-6. Nij Risk Curves for AIS 2+ to AIS 5+ Injuries.
3.5 APPLICATION OF PROPOSED Nij CRITERIA TO AVAILABLETEST DATA
Calculations of Nij were made for a wide variety of test data available in the NHTSA database.Analyses were conducted for data from NCAP tests for both drivers and passengers, FMVSS 208 30mph rigid barrier crash tests with 1998 vehicles, 25 mph offset tests with 5th percentile female driversand passengers, 30 mph rigid barrier tests with 5th percentile female drivers, and out-of-position tests for6 year old and 5th percentile female dummies. Results from these tests are presented graphically inAppendix A, and are included in tabular format in Appendix C.
Comparisons between the Nij combined neck injury criteria and the suggested performance limitssubmitted by the AAMA for out-of-position occupants are shown for the different types of dataanalyzed. Two points are plotted for each test, corresponding to each set of injury criteria. A typicalplot is shown in Figure 3-7.

3-15
Moment (N-m)
-250 -200 -150 -100 -50 0 50 100 150 200 250 300 350 400
Axi
al L
oad
(N)
-5000
-4000
-3000
-2000
-1000
0
1000
2000
3000
4000
5000
Flexion
Compression
Extension
Nij Maxima
Independent Maxima
AAMA Independent Corridor
SNPRM Nij Corridor
Tension
Figure 3-7. Typical Plot Comparing Nij with Current Injury Criteria.
The point corresponding to the Nij criteria, labeled with a é, is located at the values of axial load(FZ) and flexion/extension bending moment (MY) which yield the maximum value for Nij. It is importantto realize that these values for FZ and MY are concurrent in time and are not necessarily equal to themaxima during the entire event. The point corresponding to the AAMA proposed values for out-of-position, labeled with a ï, is located at the overall maximum values of axial load and bending moment.The two values that determine this point are independent of time, and do not necessarily occur at thesame time. It is also important to notice that shear load is not included on this plot.
Since the AAMA independent point always represents the overall maxima while the Nij point doesnot, it is impossible for the Nij point to be located further from the origin than the 208 point. To helpidentify the matched sets of points, they have been joined together by a line. If the line segment is short,and the points lie essentially on top of one another, it implies that the Nij maximum value occurs close tothe same time as the independent maxima. If the line segment is long, this indicates that the Nij maximumoccurs at a much different time than the independent maxima.
The thick broken rectangle in Figure 3-3 represents the AAMA proposal for neck injury criteria foraxial load and bending moment in out-of-position testing. The AAMA’s suggested independent limits fortension, compression, flexion and extension which are the same as those used currently for the 50th
percentile male in the alternative sled test option, with the exception of the extension value. TheAAMA’s proposed a limit in extension for the 50th percentile male is 77 N-m for out-of-position testingand 96 N-m for in-position testing, which are higher than the 57 N-m used currently for the sled test. The AAMA reasoned that for in-position testing because the occupant would be aware of the crash andwould tense the neck muscles, the performance limits could be raised for tension and extension.

3-16
91
97
94 94
100
86
88
90
92
94
96
98
100
NCAP 1996 NCAP 1997 NCAP 1998 NCAP 1999 2081998&1999
Nij
Dri
ve
r P
as
s R
ate
, %
However, the agency has determined that it is not prudent to raise these limits because not all occupants,especially passengers, may be aware of an impending crash and furthermore because there was littlescientific data to support the large increase in the extension tolerance to 96 N-m. Thus, the limit of 77N-m is plotted for the extension limit for the 50th percentile male. The solid “kite” shape represents theNij = 1.0 criteria, corresponding to a 22% risk of an AIS$3 injury. The vertices for each region shownon the plot are scaled for each different dummy size. Data points lying within either the box or kite areconsidered to pass the corresponding criteria.
3.5.1 Vehicle Crash Testing with the 50th Percentile Male Dummy
NCAP data from 1996 through1999 were analyzed for both drivers and passengers. A total of 307occupants from 154 tests conducted from 1996 to 1999 were analyzed. Results are summarized inFigures 3-8 and 3-9 and also in Appendix Figures C.1 through C.4. In each year, more than 90% ofthe occupants in the driver or passenger position passed SNPRM Nij performance limit of 1.0, with amaximum value 1.42 for the driver in a model year 1996 vehicle with an airbag and a maximum value of1.55 for one passenger in a model year 1996 vehicle with an airbag.
Limited crash test data are available for the analysis of neck injury risk in unbelted frontal collisionsbecause neck load cells were not required in compliance tests prior to the 1997 adoption of criteria inthe sled test alternative under FMVSS 208. A series of thirteen tests conducted under FMVSS 208barrier crash conditions with 1998 and 1999 vehicles was conducted by the agency using the 50th
percentile male dummy. Results from these tests are shown in Figure 3-9 and in Appendix Figures C.5and C.6. All thirteen tests, both drivers and passengers, easily fall within the allowable range for theSNPRM Nij criteria.
Figure 3-8: SNPRM Nij Pass Rates for the 50th percentile male dummy in the driver positionBelted NCAP at 35 mph into flat, rigid barrier, and unbelted 208 tests at 30 mph into flat, rigid barrier.

3-17
94 94
92
97
100
88
90
92
94
96
98
100
NCAP 1996 NCAP 1997 NCAP 1998 NCAP 1999 2081998&1999
Nij
Pa
ss
en
ge
r P
as
s R
ate
, %
Figure 3-9: SNPRM Nij Pass Rates for the 50th percentile male dummy in the passengerposition Belted NCAP at 35 mph into flat, rigid barrier, and unbelted 208 tests at 30 mph into flat, rigidbarrier.

3-18
66 65
75
0
10
20
30
40
50
60
70
80
A B C
Nij
Pa
ss
Ra
te,
%
3.5.2 Vehicle Crash Testing with the 5th Percentile Female Dummy
Data from recent tests conducted at Transport Canada using belted Hybrid III 5th percentile femaledummy in model year 1998 and 1999 vehicles were also analyzed. In these tests, the 5th percentilefemale dummies were belted with the seat positioned as far forward as possible and the seatbackadjusted slightly more upright. Due to the far forward seating position and potential for late deploymentsfor the offset tests, these conditions are quite severe and are somewhat similar to dynamic out-of-position tests.
Results from 48 kph (30 mph) rigid barrier tests and low speed tests into an offset deformable barrierare presented in Figures 3-10and 3-11and in Appendix Figures C.7 thru C.10. For the twenty-six rigidbarrier tests which were conducted, 65% of the drivers and 92% of the passengers passed the Nijperformance limit of 1.0. For the twenty-nine 40 percent offset frontal tests conducted at speeds varyingfrom 20 to 25 mph in which the air bag deployed, 66% of drivers and 90% of passengers passed the Nij= 1.0 criteria. In some of the lower speed offset tests, the air bag did not deploy and are indicated inAppendix Tables B.15 and B.16 with an asterisk.
These results using current air bag system demonstrate that testing with the belted 5th percentile female inthe full forward position at speeds up to 30 mph in a rigid barrier or up to 25 mph into an offsetdeformable barrier is a practicable test which is being met by over 50% of the vehicles. Similar testingof the unbelted 5th percentile female dummy in a 30 mph rigid barrier test showed similar performancewith 3 out of 4 vehicles passing on the driver and passenger side (Appendix Figures C.11 and C.12). However, this testing indicates that some vehicles will need to be redesigned to ensure safety for alloccupant sizes at all available seating positions in the vehicles.
Figure 3-10:Nij Pass Rates for the 5th percentile female dummy in the driver positionA - belted tests at 25 mph into an offset deformable barrier, B - belted tests at 30 mph into flat, rigidbarrier, and C - unbelted 208 tests at 30 mph into flat, rigid barrier

3-19
9290
75
0
10
20
30
40
50
60
70
80
90
100
A B C
Nij
Pa
ss
Ra
te,
%
Figure 3-11 Nij Pass Rates for the 5th percentile female dummy in the passenger positionA - belted tests at 25 mph into an offset deformable barrier, B - belted tests at 30 mph into flat, rigidbarrier, and C - unbelted 208 tests at 30 mph into flat, rigid barrier
3.5.3 Out-of-position Testing with the 5th Percentile Female Dummy and Child Dummies
Out-of-position tests for different sized dummies were also conducted and analyzed by NHTSA. Driver position 1 for adult dummies places the chin just above the airbag module; position 2 centers thesternum on the module. Driver position 1 tests for adults are intended to maximize loading to the headand neck, resulting in higher risk of neck injuries. For children, the position 2 places the chin above theairbag module. Thus, position 2 tests for children are intended to maximize loading to the head and neck,resulting in higher risk of neck injuries. Since these tests represent the worst case scenarios involvingairbag deployments, dummy measurements are expected to be relatively high.
Results from the 5th percentile female tests using 1996, 1998 and 1999 model year air bag systemsare shown in Figure 3-12 and in Appendix Figures C.13 and C.14. For the 5th percentile femaledummy, 5 of 15 tests (33%) in position 1 and 10 of 15 tests (67%) in the position 2 passed the Nijperformance limit.

3-20
67
33
0
10
20
30
40
50
60
70
80
Position 1 Position 2
Nij
Pa
ss
Ra
tes
, %
Figure 3-12: Nij Pass Rates for the 5th percentile female dummy in driver position 1 andposition 2
Out-of-position data for the six year-old dummy in position 1 and position 2 were also conducted. In addition, to quantify the effect of proximity of the dummy to the air bag module on neck injury, aseries of tests in modified position1 in which the dummy is placed 4 and 8 inches away from the air bagwere conducted on 1998 model year air bag systems. For the position 1 tests using 1996, 1998 and1999 model year air bag systems, 2 of 18 tests (11%) passed the Nij criteria of 1.0. For the position 2tests using a series of air bags from 1999 model year vehicles, 2 of 7 tests (29%) passed (Figure 3-13). The 1999 Acura RL, which has dual-stage passenger air bag, was tested in position 1 and position 2positions in two ways: (1) firing only the first stage and (2) firing the both stages with a 40 ms delaybetween the two stages. For the first stage only firing, the Nij values were 0.91 and 0.83 for positions 1and 2, respectively. For the two stage firing with delay, the Nij values were 1.26 and 0.94 for positions1 and 2, respectively. Thus, the first stage Acura RL was the only air bag system which passed Nij forboth positions.

3-21
Moment (N-m)
-250 -200 -150 -100 -50 0 50 100 150 200
Axi
al L
oad
(N)
-4000
-3000
-2000
-1000
0
1000
2000
3000
4000
5000
6000
7000
Flexion
Compression
Extension
Tension
Nij Maxima
Independent Maxima
AAMA independent
SNPRM Nij Corridor
MAIS=5
MAIS=5
MAIS=3
MAIS=1
MAIS=1
29
11
0
5
10
15
20
25
30
35
Position 1 Position 2
Nij
Pa
ss
Ra
tes
, %
Figure 3-13: Nij Pass Rates for the 6 year-old dummy in child positions 1 and 2
3.5.4 Vehicle Crash Reconstruction Testing
The final set of test data analyzed for this report was from a series of crash reconstructionsconducted with a Hybrid III 6-year-old dummy. Three cases involving serious and fatal injuries to a childof approximately 6 years of age were selected from reports prepared by NHTSA’s Special CrashInvestigation Team. An additional two cases involving only minor injuries were selected from NASS.The three cases involving serious and fatal injuries fail Nij by a wide margin, as demonstrated by theirlocation well outside of the allowable kite shape (Figure 3-14). The two cases involving only minorinjuries pass Nij and are within the allowable kite shape.
Figure 3-14: Nij for Crash Reconstruction using the 6 year-old dummy

3-22
3.5.5 Comparison of Nij with Independent Evalution of Neck Forces and Moments
The AAMA supported the independent evaluation of neck forces and moments, rather than theevaluation of combined loads used by Nij. Thus, the AAMA proposed separate performance limits fortension, compression, flexion, and extension. The pass rates for the various data sets described aboveusing the AAMA independent method are also presented in Appendix C. Overall, the proposed neckinjury criteria, Nij, and the independent performance limits show very similar pass rates for all dummysizes. Moreover, if a vehicle fails Nij it typically fails at least one of the independent performance limitsand vice versa. Since the two criteria appear to be equally stringent and the agency believes that thesuperposition of forces and moments has a better biomechanical basis, Nij will remain as the proposalfor the SNPRM.
3.5.6 Issues
There have been crash test situations where the agency has observed high neck moments beinggenerated at the upper load cell of the Hybrid III dummy within 20 milliseconds of the initiation of largeneck shear loads without observing substantial angular deformation of the dummy neck. While webelieve that these are true loads being generated by the restraint system and not artifacts of aninappropriately designed neck transducer, we are uncertain whether this loading condition isbiomechanically realistic. That is, the current Hybrid III neck exhibits considerable bending resistance(i.e., inflexibility) at its occipital condyle joint. The inflexibility may allow large moments to be transmittedto the neck by the head without much relative motion. This, in turn, can create a situation in which theangular deflection due to the applied moment is opposed and even sometimes nullified by thesuperimposed angular deflection induced by the neck’s shear force. Thus, high moments can beproduced with little observable rotational deformation of the neck. In contrast to this, the humanoccipital condyle joint appears to have considerable laxity which requires it to experience significantrotation ( ± 20 degrees of the head with respect to C1) before it can sustain a substantial moment acrossit. This would suggest that rapid, high moments generated on a dummy without any concomitanthead/neck rotation are possibly an artifact of Hybrid III’s neck design and not necessarily a real loadthat contribute to the potential for neck injury.
We seek comment on whether anyone else using the Hybrid III dummy has experienced this rapidlyproduced high moment/low angular deflection condition, whether they agree or disagree with ouranalysis of the mechanics and possible consequences of the situation, and whether they have anybiomechanical data supporting either maintaining the current neck design or justifying its modification.
We note that it would not be possible to modify in any significant way the current neck design withinthe time frame of this rulemaking, i.e., before the March 1, 2000 deadline for a final rule. Moreover, webelieve that dummies with the current neck are adequate for measuring risk of neck injury in theproposed tests. To the extent that commenters advocate modifying the neck, we ask them to addresshow dummies with the current neck should be used in the final rule to measure risk of neck injury.

3-23
There is another technical issue related to the Hybrid III dummy neck for which we are seekingpublic comment. On the selection of data channel, SAE J 211, paragraph 5, states "that selection offrequency response class is dependent upon many considerations, some of which may be unique to aparticular test." Further, SAE J211 notes that "(t)he channel class recommendations for a particularapplication should not be considered to imply that all the frequencies passed by that channel aresignificant for the application." In the case of head-to-air bag interaction, the agency observed that thespecified channel frequency class (CFC) for the neck at 1,000 for force and 600 for the bendingmoment admits neck data that has spikes of very short duration that may not be appropriate forevaluating the potential for neck injury to the human. Preliminary evidence indicates that the human neckresponse under similar impact would respond with considerably lower frequency response class data,which implies that the neck response data when processed for injury assessment should be filtered to alower CFC level than suggested by SAE J211. Accordingly, the agency seeks comments on anappropriate CFC for evaluating data from neck load cells for injury assessment purposes and whetherthat CFC should depend on the impact environment (e.g., vehicle crash tests, out-of-position tests, etc.)
3.6 RECOMMENDATIONS
Taking into consideration all of the experimental data for the various crash test conditions presentedin this section, and comparing the results with real world injury statistics, the recommended neck injurycriteria reasonably predict the occurrence of injuries in these types of crashes. Based upon the foregoinganalysis, the Nij criteria have been demonstrated to be a reasonable injury criteria for use with theproposed upgrade to the FMVSS 208 frontal impact protection standard.

4-1
Chapter 4Thoracic Injury Criteria
4.1 BACKGROUND
Classic work by Stapp (1970) and Mertz and Gadd (1968) led to the development of the injurythreshold for chest acceleration of 60G’s. The first injury assessment recommendation for the rib cageand underlying organs using chest deflection was developed by Neathery et al. (1975) for blunt frontalloading. Neathery et al. recommended a chest injury assessment value of three inches maximum sternalcompression for a 50th percentile male in blunt frontal impact. This recommendation represented a50% risk of an AIS $3 thoracic injury for a 45 year old human.
Viano and Lau (1988) re-analyzed the data Neathery used and provided a recommendation of35% external chest compression to avoid rib cage collapse due to multiple rib fractures and crush tointernal organs. Assuming a chest depth of 229 mm for the 50th percentile male, this corresponds to achest deflection of 65 mm. Based on this study, Mertz (1984) revised his original maximum chestdeflection requirement from 75 mm to 65 mm for blunt impact.
Mertz et al. (1991) developed thoracic injury risk curves based on Hybrid III chest compressionresponse with shoulder belt loading by comparing the chest compression response of the Hybrid IIIdummy with injuries to car occupants in similar exposures. According to Mertz’s injury risk curve forbelt restrained occupants, 2 inches of chest compression in the Hybrid III dummy is associated with a40% risk of injury while 3 inches is associated with a 95% risk of injury.
Horsch (1991) demonstrated that the location of the belt on the shoulder and pelvis of the dummyinfluenced the measured chest deflection. As a result, the actual chest deflection of a car occupantunder similar conditions was underestimated using the Hybrid III dummy in many instances. Horsch etal. (1991) analyzed field data and equivalent tests with Hybrid III dummy and determined that 40 mmof Hybrid III chest deflection for belt restrained occupants was associated with a 25% risk of anAIS$3 thoracic injury.
Horsch and Schneider (1988) reported that the Hybrid III dummy demonstrates biofidelity at andabove 4.6 m/s impact velocity but it may be stiffer than the human chest at lower impact velocities. Sled tests at 30 mph using the Hybrid III dummy with belt restraints or airbag restraints suggested thatthe chest compression velocity was approximately 2 to 3.5 m/sec and so the dummy chest wouldbehave stiffer than a human chest under belt or airbag restraint environments. Therefore, injuryassessment based on chest deflection measured in the Hybrid III chest under belt or airbag restraints ina 30 mph crash would under predict the actual injury outcome. Hence, this suggests that even therecommended injury criteria of 65 mm maximum chest deflection may be high.

4-2
4.2 ANALYSIS OF HUMAN SURROGATE TEST DATA
Data available in NHTSA’s Biomechanics database from sled tests using human surrogates wereanalyzed to establish a thoracic injury criterion with improved injury predictive capabilities over otherexisting criteria. A total of seventy one frontal impact sled tests from three different impact traumalaboratories were examined and analyzed using logistic regression as discussed in Chapter 1. Datafrom fifty-four of these sled tests have previously been published. (Morgan, 1994). In each test, thehuman surrogate was restrained by one of five possible system configurations at the driver’s position:(1) 3-point belt, (2) 2-point belt/knee bolster, (3) driver airbag and lap belt, (4) driver airbag and kneebolster, and (5) combined driver airbag and 3-point belt. The change in velocity ()V) of these testsranged from 23 to 56 km/h. Following the tests, the surrogates were radiographed and necropsied todelineate any trauma that occurred during the impact event. The level or severity of injury was codedusing the 1990 AIS manual. All AIS$3 injury in these tests involved rib fractures or associated softtissue lacerations. The mean age of the human surrogates was 60 years and the mean mass was about70 kg. After the publication of the biomechanics report with the NPRM (Docket 98-4405-9)(Kleinberger, et al., 1998), minor errors in the data set were identified and subsequently corrected. The sled test data is presented in Table 4-1 with the shaded cells representing corrected values.
Human surrogates were fitted with tri-axial accelerometers at the first thoracic vertebrae. Chestbands (Eppinger, 1989) were wrapped around the chest at the location of the fourth and theeighth rib to obtain continuous measurements of chest deformations during impact. Chest deflections atfive different locations UL, UC, UR, LL, and LR on the chest (Figure 4-1) were obtained by trackingthe distance between pairs of points on the periphery. Chest deflections were then normalized by thechest depth of the specimen. Chest deflection was differentiated to obtain rate of deflection, fromwhich velocity V and V*C were computed. The chest deflection and rate of deflection obtained fromchestband data are external measurements which include the deflection and rate of deflection of the skinand flesh as well as those of the ribs.
Figure 4-1. Location of five chest deflection measurement sites.Table 4.1

4-3
MAX. V*CMAX. INSTANT. EXTERNAL VEL. (m/s)MAX. NORMALIZED DEFLECTION ARIBAISMASSSEXAGERESTRAINTVELOCITY TESTID(m/sec)LRLLURUCULLRLLURUCULg'sFX(kg)TYPE(kph)
0.291.580.741.731.531.660.150.000.260.210.151166M653PT33.50ASTS470.641.721.112.642.773.980.070.000.390.310.2538.0721361F612PT/KNE34.90ASTS530.972.864.863.123.782.690.330.290.260.300.2342.5823466M623PT/DPL46.70ASTS610.502.591.452.321.973.710.210.110.260.280.28 20351M533PT/DPL48.30ASTS660.712.450.952.342.742.790.320.040.220.350.3642.3619466M683PT/DPL48.00ASTS792.285.554.969.027.335.910.320.270.380.320.2666.9925489M66ABG/KNE48.80ASTS931.415.413.582.002.462.710.340.230.260.260.2588.1720562F66ABG/KNE49.60ASTS940.061.371.302.151.732.020.070.050.050.050.05111.5414497F58ABG/KNE34.00ASTS960.261.783.011.551.511.380.130.130.140.130.1170.4214574M67ABG/KNE33.50ASTS971.302.231.334.494.984.000.180.060.320.300.2225.2719595M602PT/KNE33.20ASTS1020.382.282.035.915.193.560.080.060.160.120.11 135102M572PT/KNE32.50ASTS1031.032.420.623.343.232.300.310.000.430.520.4028.22115104F662PT/KNE32.30ASTS1040.531.651.891.421.961.650.200.120.290.400.3343.3712557F242PT/KNE47.30ASTS1130.971.000.662.943.212.510.030.010.330.330.2429.7412361F573PT/KNE25.90ASTS1740.641.750.672.252.992.680.180.060.250.320.2528.3332116M583PT/KNE25.70ASTS1750.771.570.562.153.102.600.170.000.300.450.4047.3013461M512PT/KNE54.90ASTS2230.901.563.983.182.922.230.160.080.440.340.2242.3016465M582PT/KNE54.30ASTS2241.044.770.872.443.594.130.310.020.130.220.3243.1016472M362PT/KNE53.90ASTS2252.211.911.105.758.008.510.190.010.370.390.3650.7312370M532PT/KNE53.50ASTS2272.952.872.309.947.896.240.200.040.420.340.2243.2816484M472PT/KNE54.70ASTS2281.003.551.122.062.883.560.360.060.130.190.2746.9417460M372PT/KNE54.00ASTS2290.340.650.662.412.642.680.090.040.100.130.1754.0412450M392PT/KNE54.90ASTS2500.822.711.314.553.672.850.190.050.310.270.2054.3114364M692PT/KNE55.40ASTS2580.230.770.462.601.961.380.060.000.170.130.0980.8315477F642PT/KNE56.40ASTS2590.942.725.363.082.662.920.260.260.380.310.2262.0010455F683PT/KNE56.80ASTS2941.132.670.873.273.522.950.250.040.360.410.2961.6026473M593PT/KNE59.80ASTS2960.131.560.441.431.702.610.110.000.080.120.1651.944250M643PT/ABG57.50ASTS3030.853.240.993.193.753.110.160.010.250.340.3067.6215457M653PT/ABG59.40ASTS3040.772.220.902.603.033.300.190.020.290.370.4067.6412458F663PT/ABG59.40ASTS3050.280.940.541.441.821.720.070.000.140.190.1878.706364M503PT/ABG58.20UVA3330.301.701.141.441.361.380.130.010.240.230.2372.895379M473PT/ABG58.20UVA3340.110.820.622.522.611.890.100.020.080.120.1552.132266M693PT/ABG58.60UVA3351.043.736.164.224.374.630.280.320.250.230.2060.0730474M64ABG/KNE57.20UVA3560.644.234.483.744.053.630.310.310.230.230.2175.9519580M48ABG/KNE57.20UVA3570.483.352.781.511.571.290.270.200.150.150.1356.6017481M40ABG/KNE59.00UVA358
Details of The 71 Sled Tests Using Human Surrogates

4-4
MAX. V*CMAX. INSTANT. EXTERNAL VEL. (m/s)MAX. NORMALIZED DEFLECTIONARIBAISMASSSEXAGERESTRAINTVELOCITY TESTID (m/sec)LRLLURUCULLRLLURUCULg'sFX(kg)TYPE(kph)
1.331.836.513.074.154.080.090.090.320.440.4027.230071M343PT/KNE48.00H90130.191.592.051.291.491.150.140.110.120.110.0848.540074M25ABG/KNE48.60H92070.232.022.412.112.242.050.070.130.140.160.1445.650079M38ABG/KNE48.00H92120.471.001.042.172.642.300.050.010.100.180.2533.680286M203PT/KNE48.00H92160.401.380.781.532.012.340.130.020.190.270.3028.781268F523PT/KNE48.00H93100.391.371.012.152.561.830.190.040.190.240.1731.280276F47ABG/3PT48.00H93110.201.631.361.682.142.060.170.010.140.160.1431.543285M32ABG/3PT48.00H93121.234.052.534.033.452.970.340.110.110.120.1039.9210485M583PT49.90RC1011.173.191.413.303.873.530.490.140.160.220.1789.5312473M583PT48.30RC102
0.182.612.22 0.110.090.430.510.42 8376M663PT48.30RC1030.413.381.212.281.771.850.160.030.170.130.0440.4713370M583PT48.30RC1043.143.771.395.119.2810.510.290.090.400.430.4072.8919373M673PT48.30RC1052.282.421.979.6112.4611.980.070.000.310.340.3253.009490M443PT48.30RC1060.913.702.232.512.692.790.280.170.260.370.3946.5822477F633PT48.30RC1072.191.321.474.226.097.900.030.080.120.220.3554.878473M573PT48.30RC1082.053.416.625.155.404.960.220.140.460.360.2732.3312391M593PT48.30RC1091.734.661.057.917.068.060.350.050.340.240.1156.4024461F633PT48.30RC1100.370.831.012.992.702.130.000.010.180.160.1243.963250F67ABG/LAP48.30RC1120.782.772.483.503.753.530.080.040.300.330.3643.273270M64ABG/LAP48.30RC1130.582.453.284.375.074.910.140.210.200.230.2459.660073M58ABG/LAP48.30RC1140.763.613.573.495.623.850.280.170.330.290.23 13357F67ABG/3PT48.30RC1150.642.312.462.442.533.050.100.100.220.260.3128.8010459M68ABG/3PT48.30RC1160.831.810.413.594.063.140.170.010.260.250.1923.519358M763PT23.20RC1170.353.291.252.332.251.410.270.150.190.210.1944.040041F29ABG/KNE46.50RC1183.059.4811.8711.069.547.660.410.350.280.240.2053.7111481M71ABG/KNE45.40RC1190.852.342.242.322.532.510.220.260.280.360.4021.738366M513PT23.50RC1200.401.140.571.701.872.060.090.030.180.230.2616.210066M673PT24.50RC1210.191.240.731.281.491.280.130.040.200.240.2115.174260F813PT23.70RC122
0.271.470.441.181.631.750.160.010.150.220.2615.841268F673PT23.70RC1230.442.673.713.165.316.160.200.240.190.190.1618.400080M76ABG/KNE31.60RC1241.013.513.693.483.001.640.310.320.270.260.2345.5510385F75ABG/KNE43.80RC1251.085.114.911.351.371.160.370.270.150.180.1826.856354F64ABG/KNE34.70RC1260.332.511.511.291.352.050.180.140.110.110.1220.613262M81ABG/KNE34.40RC1270.482.090.542.012.372.320.200.050.260.340.3423.103246F67ABG/3PT29.90RC1280.633.424.692.162.271.990.100.190.170.170.158378M59ABG/LAP32.80RC1290.251.490.681.461.721.460.120.040.130.190.174263M56ABG/3PT32.70RC130
Table 4.1 (Continued)

4-5
After the publication of the previous report, comments from AAMA and Ford Motor Co.suggested that some tests in the data set appear to be outliers in terms of restraint performance. Inparticular, in four sled tests conducted at the University of Virginia with air bag/knee bolster restraints(ASTS93, ASTS94, ASTS96, and ASTS97), the occupant’s head hit the sun visor resulting in veryhigh spinal acceleration to the occupant. Since the large spinal acceleration were not due to chestloading but due to head contact, these four tests were not considered for further analysis. Further, infour tests using 2-point belt restraints conducted at an impact velocity of 33 kph (ASTS102,ASTS103, ASTS104, and ASTS113), the occupant sustained AIS 5 injuries while in similar tests athigher velocities the occupant sustained less than AIS 5 injuries. The higher AIS values for these testsmay be due to difference in autopsy reporting. Due to this unexplained discrepancy, these four testswere also not considered in further analysis. Therefore, out of 71 sled tests, 63 tests were used for therevised analysis presented in this report.
Statistical analyses were conducted using the 3 millisecond clip value of thoracic spine resultantacceleration (As), maximum normalized central chest deflection (dc) corresponding tothe location of chest deflection measurement on the Hybrid III dummy, maximum normalized chestdeflection at any one of the five locations on the chest (dmax), maximum chest velocity (V), and themaximum Viscous Criterion (VC) at any one of the five locations on the chest. The statistical analyseswere also repeated using the 3 millisecond clip value of thoracic spine resultant acceleration which wasnormalized by length based on the cube root of the cadaver mass. Since the difference between theresults using the unscaled and scaled spinal accelerations was not significant and the unscaledaccelerations produced a slightly better fit to the data, the analyses presented use the unscaled spinalaccelerations.
Thoracic injury outcomes classified using the AIS scale were reclassified into three categories: alltests with thoracic AIS<3, AIS=3, and AIS>3. Logistic regression was used to develop the variousinjury criteria models. Model building strategies and goodness of fit measures outlined by Hosmer andLemeshow (1989) were used to develop the models as well as for comparing their relative predictiveability. The goodness of fit of the model was determined by examining the -2log-likelihood ratio (-2log(LR)) which is a measure of the probability that the independent variables explain the availableoutcome. The -2 log(LR) is used to test the null hypothesis that the coefficient associated with theindependent variable is zero. Under the null hypothesis, -2log(LR) has a chi-square distribution and SAS tests this null hypothesis and provides p-values. Higher values of -2log(LR) and lower p-valuesindicate that the model provides a better fit to the data. Assuming the null hypothesis is true, thedifference in the -2log LR value between one model and another where an extra independent variable isadded is a chi-square distribution with one degree of freedom. The null hypothesis that the coefficientassociated with the additional variable was tested using this chi-square distribution.
The Goodman-Kruskal Gamma of rank correlation was used for assessing the predictive ability ofthe model. Similar to R2 in regression analysis, a Gamma value of 1 indicates perfect predictive abilitywhile a value of 0 indicates no predictive ability of the model. Predictive ability of the model can alsobe assessed by the percentage of concordance and discordance. The greater the percentage ofconcordance, the better the predictive ability of the model.
The probability of injury from a logistic regression model is given by p=(1+e-(a+ß*x))-1, where x is the
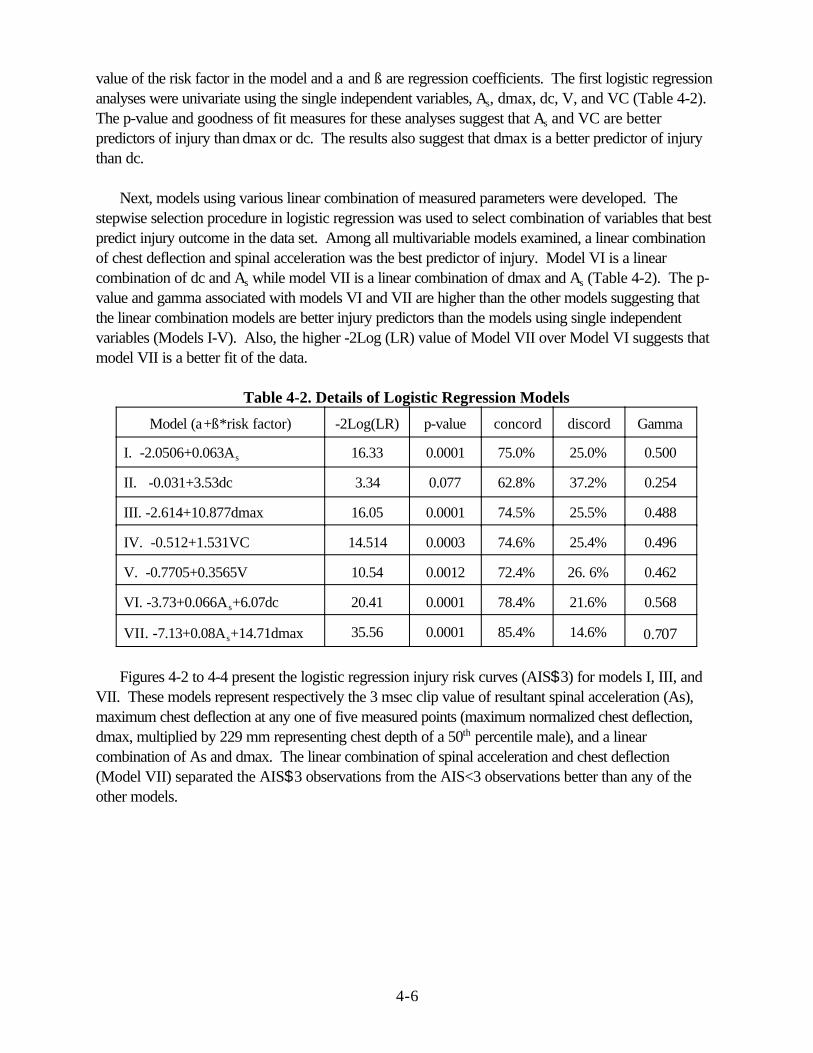
4-6
value of the risk factor in the model and a and ß are regression coefficients. The first logistic regressionanalyses were univariate using the single independent variables, As, dmax, dc, V, and VC (Table 4-2). The p-value and goodness of fit measures for these analyses suggest that As and VC are betterpredictors of injury than dmax or dc. The results also suggest that dmax is a better predictor of injurythan dc.
Next, models using various linear combination of measured parameters were developed. Thestepwise selection procedure in logistic regression was used to select combination of variables that bestpredict injury outcome in the data set. Among all multivariable models examined, a linear combinationof chest deflection and spinal acceleration was the best predictor of injury. Model VI is a linearcombination of dc and As while model VII is a linear combination of dmax and As (Table 4-2). The p-value and gamma associated with models VI and VII are higher than the other models suggesting thatthe linear combination models are better injury predictors than the models using single independentvariables (Models I-V). Also, the higher -2Log (LR) value of Model VII over Model VI suggests thatmodel VII is a better fit of the data.
Table 4-2. Details of Logistic Regression Models
Model (a+ß*risk factor) -2Log(LR) p-value concord discord Gamma
I. -2.0506+0.063As 16.33 0.0001 75.0% 25.0% 0.500
II. -0.031+3.53dc 3.34 0.077 62.8% 37.2% 0.254
III. -2.614+10.877dmax 16.05 0.0001 74.5% 25.5% 0.488
IV. -0.512+1.531VC 14.514 0.0003 74.6% 25.4% 0.496
V. -0.7705+0.3565V 10.54 0.0012 72.4% 26. 6% 0.462
VI. -3.73+0.066As+6.07dc 20.41 0.0001 78.4% 21.6% 0.568
VII. -7.13+0.08As+14.71dmax 35.56 0.0001 85.4% 14.6% 0.707
Figures 4-2 to 4-4 present the logistic regression injury risk curves (AIS$3) for models I, III, andVII. These models represent respectively the 3 msec clip value of resultant spinal acceleration (As),maximum chest deflection at any one of five measured points (maximum normalized chest deflection,dmax, multiplied by 229 mm representing chest depth of a 50th percentile male), and a linearcombination of As and dmax. The linear combination of spinal acceleration and chest deflection(Model VII) separated the AIS$3 observations from the AIS<3 observations better than any of theother models.

4-7
0
0.2
0.4
0.6
0.8
1 Pr
ob. o
f AIS
>=3
Inju
ry
0 20 40 60 80 100 Thoracic Spine Acceleration (g's)
0
0.2
0.4
0.6
0.8
1
Prob
. of A
IS>=
3 In
jury
0 20 40 60 80 100 Max. Chest Deflection (mm)
Figure 4-2. Probability of injury using 3-msec clip value of resultant spinal acceleration (As) asrisk factor (model I). Filled in circles represent 63 sled test data categorized as AIS$3 injury(=1) and AIS<3 injury (=0).
Figure 4-3. Probability of injury using maximum chest deflection (dmax*299 mm) as riskfactor (model III).

4-8
0
0.2
0.4
0.6
0.8
1
Prob
. of A
IS>=
3 In
jury
-8 -6 -4 -2 0 2 4 6 8 -7.125+0.08*As+14.712dmax
Figure 4-4. Probability of injury using linear combination of dmax and As as risk factor (modelVII).
The improved predictive abilities of models using dmax over models using dc can be explained bythe distribution of the location of maximum deflections. Table 4-3 presents the location of maximumdeflection among the five locations on the chest. Maximum chest deflection occurs at the upper centralchest location in only 25% of the sled tests. The central chest deflection (dc) versus maximum chestdeflection (dmax) for the cadaver sled tests, sorted by the restraint system, is shown in Figure 4-5. Thedifference between dc and dmax is quite high in some 2 and 3 point belt restrained tests. In these tests,dmax was at the lower chest location of LR while dc is computed at location UC (Figure 4-1). Thedifference between dc and dmax is also quite high in some airbag restraint tests where the steeringwheel rim penetrated into the lower chest resulting in maximum chest deflection at the lower chestlocation (LL or LR).
Table 4-3 Location of Maximum Deflection in Belt and Airbag Sled Tests
Restraint Type UL UC UR LL LR
Belt 15 15 11 0 8
Airbag 1 1 1 4 7
Total 16 16 12 4 15

4-9
0
20
40
60
80
100
120
Cen
tral
Ch
est D
efle
ctio
n (m
m)
0 20 40 60 80 100 120 Max. Chest Deflection (mm)
-4
-2
0
2
4
6
8
-7.1
25+0
.08A
s+14
.7dc
-4 -2 0 2 4 6 8 -7.125+0.08As+14.7dmax
Figure 4-5. Plot of dmax versus dc. Maximum chest deflection occurs at the central chestlocation in only 25% of the tests.
Figure 4-6. Model VII using dmax versus Model VII using dc as an estimator of dmax. Thelarge differences in dmax and dc noted in Figure 4-5 are diminished due to the effect of spinalacceleration.
For the 63 human surrogate tests used in the revised analyses, a 3-msec clip value of spinal

4-10
p e As D=
+ − − + + 1
1 7 125 0 08 0 064( . . . )(4.1)
acceleration (As) has been shown to correlate well with injury since it represents the overall severity ofthe loading on the subject. For example, in some cadaver sled tests used in the analysis, there wassignificant steering wheel rim penetration into the lower thorax which resulted in significant injury butpresented low chest deflection at the upper thorax. The spinal acceleration in these tests werereasonably high and therefore the linear combination of As and dmax proved to be a good predictor ofinjury. An injury criteria using chest deflection alone may not have predicted the correct injury levelunder such circumstances as well as the linear combination of deflection and acceleration. The HybridIII dummy has only one chest deflection gage and it has been noted by various researchers (Backaitis etal., 1986), (Cesari, et al., 1990) that the maximum deflection may be missed in some instances. Forthese reasons, it is believed that the linear combination model using dmax and As is the mostappropriate injury criteria for assessing thoracic trauma. However, since only one deflectionmeasurement is available on most dummies, the central chest deflection will be used with thisformulation. This will result in slightly lower calculated values for Model VII since dc equals dmax inroughly 20 percent of the tests as described above and shown in Figure 4-6. It is intended that themaximum deflection from multiple points on the chest will be incorporated into the standard when all ofthe dummies have multiple measurement capabilities.
4.3 DEVELOPMENT OF COMBINED THORACIC INDEX (CTI) FORTHE 50% ADULT MALE
Since the analyses were conducted using normalized deflections, the chest deflections in Model VII,dmax, were multiplied by 229 mm which represents the chest depth of a 50% adult male. Theprobability of injury function for Model VII can be re-written using the maximum external chestdeflection, D, with the following equation,
Using this probability of injury equation, lines of equal probability of injury (iso-injury lines) for thelinear combination of deflection and spinal acceleration (Model VII) were generated (Figure 4-7).

4-11
CTIAA
DD
= +max
int
max
int(4.2)
25%
50% 75%
0
20
40
60
80
100
120
140
max
imum
che
st d
efle
ctio
n (m
m)
0 20 40 60 80 100 120 A (g's) thoracic spine acceleration
bag no injury bag injury belt no injury belt injury
Figure 4-7. Lines of equal probability of AIS$3 injury using the linear combination ofmaximum deflection and spinal acceleration (Model VII). The test data categorized intorestraint condition and injury outcome is also presented on the graph.
The 50% probability of injury line for the population of human surrogates examined in this data setwas used as the injury assessment reference line since it corresponds to about a 25% probability ofinjury for the live human subjects, as will be discussed in detail in Section 4.5.
Model VII used the normalized external chest deflections, the sum of the deflection of the ribs andskin, measured on cadavers using chest bands. However, the chest deflections measured on thedummy represent only the internal chest deflections of the ribs. To account for the difference betweencadaver and dummy deflection measurements, 8 mm was subtracted from the external chest deflectionin the 50% probability iso-injury line to represent internal rib deflection measurements. The equation ofthe 50% probability of injury line using the deflections adjusted for the skin thickness is mathematicallyequivalent to a line which has intercepts on the vertical and horizontal axes of Dint= 103 mm and Aint =90g, respectively. Thus, the combined thoracic injury criteria, CTI, is defined with the followingequation,
where Amax is the maximum value of 3 ms clip spinal acceleration (As), Dmax is the maximum value ofthe dummy deflection (D), and Aint and Dint are the respective intercepts as defined above.
After the publication of the biomechanics report published with the NPRM (4405-9), AAMA

4-12
D D
A A
L male
E
Lmale
Depth
Mass
=
=
λ
λλ
,
,
50%
50%
(4.3)
provided an alternate thoracic injury criteria which addresses AIS$4 thoracic injuries. They arguedthat since AIS$3 injuries are predominantly associated with rib fractures and children, in general,seldom have rib fractures, it may be more appropriate to consider AIS$4 thoracic injuries whichconstitute both soft tissue and bone injuries. Based on analysis using the Mertz/Weber method on thedata published by Neathery (1975), AAMA recommended the chest deflection injury assessmentreference value (IARV) in out-of-position and in-position conditions to be 65 mm for the 50th
percentile male which corresponds to a 5% probability of an AIS$4 thoracic injury. Though the agency believes that the combination of maximum chest acceleration and deflection is a
better predictor of injury than individual IARV for chest deflection and acceleration, there are still somequestions regarding the interpretation of data used in the development of CTI. Plans for future testingare directed towards answering some of these questions and increasing the number of observations inthe data set. Therefore, until more data is available and a reanalysis of the larger data set is conductedto evaluate the efficacy of a CTI based injury criteria, the individual limits of maximum chestacceleration (Ac) and deflection (Dc) will be used for regulation purposes.
In order to harmonize with the IARV used by Transport Canada, the chest deflection limit for the50% male was taken to be 63 mm (2.5 inches) and 3-msec clip value of resultant chest accelerationlimit was taken to be 60 g’s. Therefore, the recommended performance limits are Ac=60 g’s andDc=63 mm for the 50% male. The proposed CTI injury criteria from the NPRM will be used forestimating the probability of injury.
4.4 SCALING OF THORACIC INJURY CRITERIA TO VARIOUSOCCUPANT SIZES
As discussed in Chapter 1, scaling techniques are necessary to obtain injury assessment referencevalues for the various dummy sizes. Thoracic performance limit lines have been scaled using techniquessimilar to those used by Melvin for the CRABI 6-month infant dummy (Melvin, 1995). Geometric scalefactors were taken from Mertz’s paper on Injury Assessment Reference Values (Mertz, 1997). In hispaper, Melvin discusses the importance of scaling, not only by geometric size, but also by the materialstiffness of the biological structures. Dummy chests were designed with varying stiffness to account forchanges in material bending properties for different aged occupants. Deflection criteria can thus bescaled using only geometric factors, assuming 8E = 1, while acceleration criteria use both geometric and material scaling factors. The relevant scalefactors presented in the paper are given in Table 4-4 for reference. Thus, deflections for various dummysizes, D, or accelerations, A, can be found by scaling as follows:
where the IARV for the 50% male dummy are D 50%male and A 50%male.

4-13
Table 4-4. Thoracic Scaling Factors for Various Occupant Sizes
Scale Factor 95th %ilemale
50th %ileMale
5th %ileFemale
6 YearOld child
3 YearOld Child
12 MonthOld Infant
Length Based onChest Depth (?L, Depth)
1.107 1.000 0.817 0.617 0.557 0.485
Length Based onMass (?L, Mass)
1.090 1.000 0.862 0.650 0.578 0.504
Bone ModulusScale Factor (?E)
1.000 1.000 * 0.667 0.474 0.320
* Data comparing the modulus and strength of female anatomic structures to male are not available atthis time.
The deflection and acceleration intercepts (Aint=90 and Dint=103) for the Combined ThoracicIndex for the 50% adult male and the proposed deflection and acceleration performance limits (Ac=60and Dc=63) were all scaled according to equation 4.3. Melvin (1995) conducted a thorough analysisby examining various scaling techniques and proposed 50 g’s as the chest acceleration IARV for the sixmonth old CRABI. However, the scaled chest acceleration for the 12 month old CRABI dummy usingEquation 4.3 is only 40 g’s. Since we expect the 12 month old to have at least the same, if not agreater, chest acceleration IARV than the 6 month old, the chest acceleration performance limit for the12 month old was raised from its scaled value to 50 g’s. Mertz proposed a chest acceleration IARV of55 g’s for the 3-year old which corresponds to 1% probability of AIS$3 thoracic injury based on ananalysis (Mertz/Weber method) of the combined pig data of Prasad/Daniels (1984) and Mertz et al.(1979). However, the scaled acceleration limit of the 3-year old using Equation 4.3 is 50 g’s. Since thescaled six year old chest acceleration IARV is 60 g’s and we expect the 3 year old IARV to bebetween the 12 month old and the six year old, chest acceleration performance limit of 55 g’srecommended by Mertz was used for the 3-year old dummy. The scaled chest accelerationperformance limit for the 5% female dummy is 73 g’s. However, it is believed that the lower bonedensity of the female bone will lower this limit somewhat and so the chest acceleration performance limitfor 5th percentile female was taken to be the same as the fiftieth percentile male and equal to 60 g’s.

4-14
Table 4-5. Scaled Deflection and Acceleration Values for Various Occupant Sizes
Value 95th %ilemale
50th %ileMale
5th %ileFemale
6 YearOld Child
3 YearOld Child
12 MonthOld Infant
Chest DeflectionIntercept for CTI(Dint) --for analysispurposes only
114 103 mm(4.0 in)
84 mm(3.3 in)
64 mm(2.47 in)
57 mm(2.2 in)
50 mm (2.0in)
Chest AccelerationIntercept for CTI(Aint)--for analysispurposes only
83 90 90 90 74 57
Chest DeflectionLimit for ThoracicInjury (Dc)
70 63 mm(2.5 in)
52 mm(2.0 in)
40 mm(1.6 in)
34 mm (1.3 in)
30 mm**(1.2 in)
Chest Accelerationlimit for ThoracicInjury (Ac)
55 60 60* 60 55+ 50*+
*Although geometric scaling alone would predict higher Ac values for females, it is believed that lowerbone mineral density would offset this effect. Therefore, the acceleration tolerance values for smallfemales are kept the same as for mid-sized males.** The CRABI 12 month old dummy is currently not capable of measuring chest deflection. + The scaled chest acceleration threshold of 50 g’s was raised to 55 g’s according to analysis byMertz on the pig data.*+ The scaled chest acceleration for the 12 month old CRABI was raised to 50 g’s to be consistent withthat proposed by Melvin for the 6 month old CRABI
Only the individual deflection (Dc) and chest acceleration (Ac) have been proposed for regulationproposes in the SNPRM. The CTI injury criteria proposed in the NPRM (CTI #1.0 and slightlymodified Critical Intercept Values) will be used to estimate the probability of injury for analysispurposes only. Figure 4-8 presents the proposed performance limits for acceleration and deflectionfor the five dummy sizes in the SNPRM.

4-15
0 10 20
30 40 50 60 70 80
Che
st D
efle
ctio
n (m
m)
0 10 20 30 40 50 60 70 Chest Acceleration (G's)
95% male 50% male 5% female6 yr old 3 yr old 1 yr old
Figure 4-8. Proposed chest acceleration and deflection performance limits for all dummysizes.
4.5 DEVELOPMENT OF PROBABILITY OF INJURY RISK CURVESFOR THE THORAX
4.5.1 Adjustment of Risk Curves for Live Human Subjects
Viano et al. (1977) observed statistically significant differences in biomechanical responses andinjuries between live and postmortem animals. On an average, the live animals demonstrated 26%lower rib fractures than the postmortem animals for the same level of chest deflection. Horsch et al.(1991) noted that human surrogates are more easily injured than car occupants for similar exposures. This apparent difference in tolerance between car occupants and human surrogate data was also notedby Foret Bruno et al. (1978). Yoganandan et al. (1991) noted that in human surrogate sled tests, therewas consistently higher reporting of rib fractures from detailed autopsy than from radiography alone. They noted that for the same crash severity, greater severity injury was reported in human surrogatesled tests than in field data. They attributed these differences to the method of identifying rib fracturesand the differences in the dynamic response characteristics of the living human and the surrogate.

4-16
0
5
10
15
20
25
30
Freq
uenc
y P
erce
ntag
e
16-20 21-30 31-40 41-50 51-60 61-70 71-80 81-90 91 +Age Categorization
0 0.1 0.2 0.3 0.4 0.5 0.6 0.7 0.8 0.9
1
Pro
b. o
f AIS
>=3
Inju
ry
0 0.2 0.4 0.6 0.8 1 1.2 1.4 1.6 1.8 2 CTI
original
adjusted
Figure 4-9. Age distribution of the USA driving population exposed to frontal collisions.
The 50% probability of injury line used in the development of the Combined Thoracic Index (Figure4-7) would represent a significantly lower probability of injury for a car occupant. Figure 4-9 presentsthe age distribution of the USA population exposed to frontal collisions based on NASS files. Theweighted average age of the driving population is approximately 30 years. The average age of the 71surrogates used in the sled tests is 58 years. Thus, there was a nearly thirty year difference in averageage of the surrogate data as compared to that of the average driving population. This thirty year agedifference, the increased fragility of cadavers, and the over reporting of injury in experimental testssuggested an adjustment in the probability of injury to represent the probability of AIS$3 thoracic injuryfor the average live human driving population. Based on all these factors, the 50% probability of injuryline in Figure 4-7 was adjusted to represent a 25% probability of injury level for the live human drivingpopulation. The adjusted probability of injury curve written in terms of CTI (defined in Equation 4.2)and the original unadjusted curve are shown in Figure 4-10.
Figure 4-10. Reduced probability of injury using Model VII as the risk factor to relate sledtest data to real world crashes. A value of one corresponds to 25% probability of injury.

4-17
p(AIS 2) 1
1 e
p(AIS 3) 1
1 e(4.4)
p(AIS 4) 1
1 e
p(AIS 5) 1
1 e
(1.8706 0.04439Dmax)
( .7124-0.0475Dmax)
( .0952-0.0475Dmax)
( -0.0459Dmax)
≥ =+
≥ =+
≥ =+
≥ =+
−
3
5
8.8274
0 0.1 0.2 0.3 0.4 0.5 0.6 0.7 0.8 0.9
1
Pro
b. o
f Inj
ury
0 20 40 60 80 100 120 140 160 180 Maximum Deflection (mm)
AIS>=2 AIS>=3 AIS>=4 AIS>=5
Data from the 63 human surrogate tests were also reanalyzed using logistic regression todetermine the probability of AIS$2, 3, 4, and 5 thoracic injury using chest deflection alone, chestacceleration alone, and the combined CTI.. The resulting AIS$2, 3, 4, and 5 curves were shifted thesame amount as the corresponding AIS$3 curve in each case to account for differences between thesurrogate test subjects and the average driving population. The probability of injury equations for theadjusted AIS$2, 3, 4, and 5 injury risk curves using maximum chest deflection (Dmax) as illustrated inFigure 4-11, are presented in Equation 4.4. The probability of injury equations for the adjustedAIS$2, 3, 4, and 5 injury risk curves using maximum 3-msec clip value of resultant spinal acceleration(Amax) as illustrated in Figure 4-12, are presented in Equation 4.5. The probability of injury equationsfor the adjusted AIS$2, 3, 4, and 5 injury risk curves using CTI as illustrated in Figure 4-13, arepresented in Equation 4.6. The probability of AIS$5 injury is not very reliable since there was only onetest with an AIS=5 in the sled test data of 63 observations.
Figure 4-11: AIS 2+, 3+, 4+, and 5+ injury adjusted risk curves for for the Hybrid III 50th
percentile male dummy using maximum chest deflection (Dmax).

4-18
p(AIS 2) 1
1 e
p(AIS 3) 1
1 e(4.5)
p(AIS 4) 11 e
p(AIS 5) 1
1 e
(1.2324 0.0576Ac)
( .1493-0.0630Ac)
( .3425-0.0630Ac)
( -0.0659Ac)
≥ =+
≥ =+
≥ =+
≥ =+
−
3
4
8.7652
p(AIS 2) 11 e
p(AIS 3) 1
1 e(4.6)
p(AIS 4) 1
1 e
p(AIS 5) 1
1 e
(4.847 6.036CTI)
(8.224 7.125CTI)
(9.872 7.125CTI)
(14.242 6.589CTI)
≥ =+
≥ =+
≥ =+
≥ =+
−
−
−
−
0 0.1 0.2 0.3 0.4 0.5 0.6 0.7 0.8 0.9
1
Pro
b. o
f In
jury
0 20 40 60 80 100 120 max. 3ms clip of result. spinal accel.
AIS>=2 AIS>=3 AIS>=4 AIS>=5
Figure 4-12: AIS 2+ to 5+ adjusted injury risk curves for the 50th percentile Hybrid III dummyusing maximum 3-msec clip value of resultant spinal acceleration (Amax).

4-19
0 0.1 0.2 0.3 0.4 0.5 0.6 0.7 0.8 0.9
1
Pro
b. o
f In
jury
0 0.2 0.4 0.6 0.8 1 1.2 1.4 1.6 1.8 2 CTI
AIS>=3 AIS>=2 AIS>=4 AIS>=5
Figure 4-12: Adjusted Risk curves for AIS 2+, 3+, 4+, and 5+ injury using CTI (for alldummies).
To verify that the thoracic injury risk curve was reasonable, comparisons were made between theinjury rates predicted using CTI calculations from experimental test data and real world injury ratesestimated from the NASS database. NASS data for front seat outboard occupants involved in frontal,non-rollover crashes from 1988 to 1996 were analyzed to determine whether weighted injuryprobabilities estimated from NASS were reasonably close to those predicted by CTI and the individualperformance limit using vehicle crash test data gathered from FMVSS No. 208 compliance testing andNCAP testing.
Results of the NASS data analysis suggested that for unbelted occupants in similar crash conditionsas the FMVSS 208 tests (delta-V $ 30), the weighted percentage of front seat occupants with AIS 3+chest injuries is 25 to 37%. For the 1996-1999 model year vehicles in the FMVSS 208 compliancetest data base, the weighted average (weighted by sales volume of each vehicle) percentage probabilityof AIS$3 thoracic injury estimated using CTI for the driver was 18% and for the passenger 4.5%. Taking into account that 75 percent of all front seat occupants are drivers, the weighted percentageprobability of AIS 3+ injuries to front seat occupants, estimated using CTI, is approximately 15%. Thus, for unbelted front seat occupants in high speed crashes, CTI somewhat underestimates the risk ofAIS$3 injury based on NASS data.
In contrast, the weighted percentage probability of AIS 3+ injuries estimated using maximum 3-msec clip value of resultant chest acceleration (Amax) alone is 45% for the driver and passenger whilethat estimated using maximum chest deflection (Dmax) alone is 14.5% for the driver and 6% for thepassenger. The joint probability of AIS 3+ injury (assuming independence of events) is 53% for thedriver and 48% for the passenger. Taking into account that 75% of front seat occupants are drivers,the weighted percentage probability of front seat occupants, estimated from the individual injury criteriausing Dmax and Amax is 52%. Therefore, the individual injury criteria grossly overestimate the risk ofAIS$3 injury for unbelted front seat occupants in high speed crashes based on NASS data.
For crashes comparable to NCAP test conditions, NASS data indicates a weighted percentage offront seat occupants with AIS$3 injury of 16 to 17 percent. A similar analysis procedure was applied

4-20
0
0.1
0.2
0.3
0.4
0.5
0.6
0.7
0.8
0.9
1
prob
abili
ty o
f inj
ury
0 2 4 6 8 10 12 14 rate of chest compression (m/s)
AIS>=3
AIS>=4
Figure 4.13: Probability of AIS$3 and AIS$4 thoracic injury versus rate of sternaldeflection. - developed using Mertz et al. (1979) and Prasad et al. (1984) pig data.
to the 1996-1999 NCAP test data as that conducted using the FMVSS 208 compliance test datadescribed above. The analysis of NCAP test data suggests that the weighted percentage probability ofAIS 3+ injuries for front seat occupants, estimated using CTI, is 16%. In contrast the weightedpercentage probability of AIS 3+ injury for front seat occupants, estimated using the individual chestdeflection and acceleration injury criteria, is 55%. The individual injury criteria grossly overestimate therisk of AIS$3 injury for belted front seat occupants in high speed crashes while CTI provides areasonable estimate of AIS 3+ injury based on NASS data.
Looking at both belted and unbelted vehicle occupants, the adjusted probability of injury curvedeveloped for the Combined Thoracic Index (CTI)seems to reasonably represent the injury frequencyin real world crashes, while the individual performance limits of chest deflection and accelerationgrossly overestimate the risk of AIS$3 injury in real world crashes.
4.6 RATE OF STERNAL DEFLECTION
After the publication of the biomechanics report with the NPRM (4405-9), AAMA recommendedsternal deflection rate as an appropriate injury predictor for assessing the risk of heart and/or aorticinjuries in out-of-position conditions. The AAMA analyzed the combined Prasad/Daniel (1984) andMertz (1979) pig data using the Mertz/Weber technique to develop an injury risk curve for AIS$4heart and lung injuries for the 3-year old dummy using the rate of sternal deflection as the risk factor. Based on this analysis, AAMA recommended an IARVof 8 m/s rate of sternal deflection whichcorresponds to a 5% probability of AIS$4 thoracic injury for the 3-year old. The data was reanalyzedusing logistic regression, the results of which correspond to nearly 15% probability of AIS$4 thoracicinjury at 8 m/s rate of sternal deflection Figure (4.13).

4-21
The AAMA applied scaling techniques to determine threshold levels for 5% probability of AIS$4thoracic injury for the other dummy sizes. AAMA recommended an IARV for rate of sternal deflectionof 8.2 m/s for the adult dummies. In out-of-position tests conducted at the University of Virginia usingthe fifth percentile female Hybrid III dummy (Crandall, 1997), the less aggressive bag registered 8 m/srate of sternal loading while the more aggressive bag registered approximately 12 m/s. In out ofposition tests using female cadaveric subjects (Crandall, 1997), the less aggressive air bag causedAIS=3 injury while the more aggressive air bag caused AIS$4 thoracic injury. However, chestdeflection was found to correlate better with thoracic injury (r=0.82) than rate of sternal deflection(r=0.49). It should be noted that none of the cadaveric subjects sustained thoracic soft tissue injuries inthis series of out-of-position tests which may explain the poor correlation of rate of deflection withinjury. Further research is needed to better understand the mechanisms of severe soft tissue injury andto determine soft tissue injury criteria. Due to the limited data available regarding thoracic soft tissueinjury, an injury assessment reference value for rate of sternal deflection will not be recommended at thepresent time. The agency believes that rate of sternal deflection is a good candidate for prediction ofheart and aortic injuries and will monitor it in future tests.
4.7 APPLICATION OF PROPOSED THORACIC PERFORMANCELIMITS TO AVAILABLE TEST DATA
The proposed thoracic injury criteria requires each test to satisfy two performance requirements. These are (1) the 3 ms clip acceleration is less than or equal to Ac, and (2) the maximum chestdeflection is less than or equal to Dc. The thoracic injury criteria were calculated for a wide variety oftests available in the NHTSA database. Analyses were conducted for data from 30 mph FMVSS No.208 compliance tests, 35 mph NCAP tests, 48 kmph rigid barrier and 40 kmph offset tests with 5th
percentile female dummies, and out-of-position test with the 6 year-old and 5th percentile femaledummies. The accompanying graphs and data for all the tests presented here are provided in detail inAppendices B and D.
4.7.1 Application of Proposed Thoracic Injury Criteria to FMVSS No. 208 Barrier andNCAP Tests
Data from 1996-1999 NCAP crash tests and 1996-1999 FMVSS No. 208 full barrier crash testswere analyzed to determine how various production vehicles performed using the proposed thoracicinjury criteria. Figures D.1 - D.4 present the 3 msec clip value of chest acceleration and maximum chestdeflection of drivers and passengers in pre-1998 and 1998-1999 vehicles in NCAP and FMVSS No.208 crash tests along with the thoracic performance limits for the 50th percentile male. Theaccompanying details of these tests are provided in tables B.1 - B.12.
For the NCAP tests with 1996-1999 model year vehicles, 90% of the drivers and 93% of thepassengers passed the chest acceleration performance limit while all the dummies passed the chestdeflection performance limit. The percentage of vehicles among the 1996-1999 NCAP tests that passthe chest acceleration and deflection performance limits in each year are presented in Figure 4-14.

4-22
0%10%20%30%40%50%60%70%80%90%
100%
Pass
ing
Rat
e of
Veh
icle
s
1996 1997 1998 1999Model Year
Driver passenger
Figure 4.14. Percentage of vehicles passing both the proposed performance limits in NCAPtests by seating position.
For the 1996 - 1999 FMVSS No. 208 barrier tests using the 50th percentile Hybrid III dummy,98% of the drivers and 93% of the passengers passed the chest acceleration performance limit of 60g’s while all the drivers and passengers passed the chest deflection performance limit of 63 mm. Thevehicles which fail the 208 rigid barrier tests for the 1998-1999 years were certified by the sled testoption in FMVSS 208.
4.7.2 Application of the Proposed Thoracic Performance Limits to Vehicle Crash Tests withthe 5th Percentile Female Dummy
Data from tests conducted at Transport Canada using the Hybrid III 5th percentile female dummy inmodel year 1998-1999 vehicles were also analyzed. In these tests, the dummy in the driver andpassenger position were belt restrained and the seat was adjusted to the full forward position. FiguresD.5 - D.8 present the 3 msec clip value of chest acceleration and maximum chest deflection for thevarious Transport Canada tests along with the thoracic performance limits for the 5th percentile femaledummy. The details of these tests are provided in Tables B.13 - B.16.
A series of 48 kmph (30 mph) vehicle crashes of model year 1998-1999 vehicles into a rigidbarrier were conducted using the belted 5th percentile adult female dummies in the driver and passengerposition seated in the full frontal seat track position. All the drivers and passengers passed the chestdeflection and acceleration performance limits except for one passenger whose chest accelerationexceeded 60 g’s. The percentage of drivers passing the chest deflection and acceleration performancelimits is 100%, while that for passengers is 96%.
Vehicle crash tests into the European deformable barrier at 40 kmph (25 mph) closing speed and a40% offset were conducted with belted 5th percentile female dummies in model year 1998-1999vehicles. Such a vehicle crash involves a soft crash pulse which may result in late deployment of theairbag in some vehicles. All dummies in the driver and passenger position passed the thoracicperformance limits for chest acceleration (=60 g’s) and chest deflection (=52 mm) due to the soft crashpulse.

4-23
4.7.3 Application of Proposed Thoracic Performance Limits to Out-of-Position TestConditions Using the 5th Percentile Adult Female Dummy
Out-of-position tests were conducted to investigate the trauma induced when the vehicle occupantis in close proximity to the deploying airbag. Since fatalities due to airbag interaction have been notedin real world crashes to mainly involve children and small female occupants, out-of-position tests wereconducted using the 5th percentile female dummy and the Hybrid III 6-year old dummy.
The driver out of position 1 test condition with the 5th percentile female dummy is intended tomaximize head and neck loading from airbag deployment while the out-of-position 2 test condition isintended to maximize chest loading due to air bag deployment. Position 1 and Position 2 out-of-position tests using the 5th percentile female dummy were conducted using 1996-1999 vehicle air bagsand the results are presented in Figures D.9 and D.10 and Tables B.19 and B.20. The dummy passedthe performance limits of 60 g’s chest acceleration and 52 mm chest deflection in all the tests.
4.7.4 Application of Proposed Thoracic Performance Limits to Out-of-Position TestConditions Using 6-Year Old Dummy
Out-of-position tests were conducted to investigate the trauma induced when the child dummy is inclose proximity to the deploying airbag. Two out-of-position test conditions were considered for the 6year-old Hybrid III dummy. The child OOP position 1 is designed primarily to evaluate contact forcesof the deploying airbag on the chest. This position is intended to represent a standardized worst casecondition in which the child has been thrown against the frontal structure of the vehicle’s interior due topre-impact braking and/or vehicle impact. The child OOP Position 2 is designed to primarily addressthe contact forces and loading forces of the deploying airbag on the head and neck. This position isintended to represent a worst case scenario in which the child slides forward or is sitting forward on theseat while the upper torso jack-knifes forward toward the instrument panel.
In the first series of the Position-1 out-of-position tests, 1996-1999 production year air bags wereused with zero clearance between the dummy chest and the instrument panel, the results of which arepresented in Figure D-11. The chest acceleration performance limit of 60 g’s was met in 84% of thetests while the chest deflection performance limit of 40 mm was met in 26% of the tests. In the secondseries of Position-1 OOP tests, 1996-1998 production year air bags were used with 4 inches ofclearance between the dummy chest and the instrument panel, the results of which are presented inFigure D-12. The chest acceleration performance limit of 60 g’s was met in all of the tests while thechest deflection performance limit of 40 mm was met in 75% of the tests. In the third series of Position-1 OOP tests, 1996-1998 year air bags were used with 8 inches of clearance between the dummy chestand the instrument panel, the results of which are presented in Figure D-13. The chest accelerationperformance limit of 60 g’s was met in all of the tests while the chest deflection performance limit of 40mm was met in 90% of the tests.
Position-2 out-of-position tests with the head of the 6 year old dummy on the instrument panel wereconducted, the results of which are presented in Figure D-14. Only 1999 production year air bagswere used in these tests. The chest acceleration performance limit of 60 g’s was met in 57% of thetests while the chest deflection performance limit of 40 mm was met in 71% of the tests. Details of thePosition-1 and Position-2 out-of-position tests are presented in Tables B.21-B.24.

5-1
P AISe F
( ) (5. )( .795 * )
≥ =+ −
2 11
15 0.5196
where F = femur force in kN
Chapter 5Lower Extremity Criteria
5.1 FEMUR INJURY CRITERIA
A vast amount of research is currently being conducted to better understand the complexmechanisms of foot and ankle injuries. New dummy legs and associated injury criteria are underdevelopment, but are not yet available for use with this standard. Current recommendations are tocontinue using femur load for the adult dummies, but not for the child dummies. The existing IARV forfemur load used in FMVSS 208 is 10 kN for the 50th percentile male. The femur tolerance loads forthe 5th percentile female and the 95th percentile male were determined by scaling the 50th percentilemale IARV by the femur cross-sectional area scale factor, (Mertz, 1989) presented in Table 5.1. Thescale factor for the failure strength and the modulus of elasticity for all three adult sizes is assumed to be1.
Table 5.1 Femur load IARV and associated scale factor for different size adult dummies
Hybrid III 5thpercentile female
Hybrid III 50thpercentile male
Hybrid III 95thpercentile male§
Femur Cross-sectionalarea scale factor
0.682 1.0 1.272
Femur axial force IARV(kN)
6.8 10 12.7
§ The Large Male (95th percentile Hybrid III) is not currently proposed for inclusion in the SNPRM, but theperformance limits are listed here for completeness.
Figure 5-1 and Equation 5.1 present the injury risk curve associated with femur loads. A femurload of 10 kN for the mid-sized male dummy represents a 35 percent risk of sustaining an AIS$2injury. Injury risk values for the small female are assumed to be equivalent to the male risk afterapplication of the scale factor.

5-2
0 0.1 0.2 0.3 0.4 0.5 0.6 0.7 0.8 0.9
1
Pro
babi
lity
of I
njur
y (A
IS>=
2)
0 2 4 6 8 10 12 14 16 18 20 Maximum Femur Force (kN)
Figure 5-1. Injury risk curve for femur loads.
In response to the NPRM (NHTSA Docket, 4405-9), commenters supported the inclusion ofperformance limits for femoral compressive loads for the 5th percentile female dummy specified in theNPRM (4405-9) in addition to maintaining the currently specified value for the 50th percentile maledummy. Furthermore, AAMA proposed adding femoral compressive load performance criteria of2310 N for the 6 YO dummy. The National Transportation Safety Board (NTSB) recommends thattolerance levels of lower extremities need to be further investigated and validated. NTSB also suggeststhat the NHTSA consider dummies such as advanced lower extremity (ALEX, now called the THOR-LX) dummy for future incorporation into the standards.
Although the NHTSA agrees with the AAMA that femoral compressive load limits for the sixyear-old dummy are important to consider, the SNPRM does not specify such limits because the testingconfigurations specified in the SNPRM for the six year-old dummy do not impose substantial loading onthe lower extremities. NHTSA is also continuing the development of an advanced lower extremity testdevice, the THOR-LX, and continues to sponsor experimental impact injury research to determine themechanisms and tolerances of the lower extremities, including the foot, ankle and leg. When this effortis complete, it is anticipated that this research will be incorporated into future safety standards.

5-3
TI 'FFC
%MMC
# 1.3
5.2 INJURY CRITERIA FOR THE LEG
Although not proposed in the NPRM (4405-9) or the SNPRM, a modified version of the Tibia Indexcurrently in use by EEVC (Hobbs, 1997) was used for analysis purposes in the regulatory evaluationand is briefly described below. The tibia index was originally proposed by Mertz (Mertz,1993) as aninjury tolerance criterion for the leg which combines bending moment and axial compressive loads onthe leg as measured by the Hybrid III tibia load cell. The modified version of the tibia index (TI)adopted by EEVC is given by
where F is the measured compressive axial force (kN) in the superior-inferior direction. M is theresultant moment of the medial-lateral and the anterior-posterior moments. MC and FC are the criticalbending moment and critical axial compressive force and are presented in the following table:
Hybrid III 5thpercentile female
Hybrid III 50thpercentile male
Hybrid III 95thpercentile male
MC 115 Nm 225 Nm 307 Nm
FC 22.9 kN 35.9 kN 44.2 kN
The values of MC and FC for the 50th percentile male are based on human bone tolerance valuesobtained from (Yamada, 1970). The critical values for the 5th percentile female and the 95th percentilemale were obtained by using scaling relations proposed by Mertz et al. (1989). A TI threshold of 1.3was recommended and adopted by EEVC (Hobbs, 1997) based on analysis of crash test data.
The Tibia Index assumes that failure of the tibia occurs in compression. However, 3-point bendingtests with superimposed axial compression conducted at the University of Virginia suggested that thetibia can fracture in compression or in tension (Schreiber, 1997). Also, Schreiber noted that the criticalbending moment used in TI is conservative and underestimates the failure threshold of the leg in bendingsince the contibution of the fibula and associated leg soft tissue in bending was not taken intoconsideration.. The magnitude of FC used in TI is based on the compressive strength of the tibia mid-diaphysis bone segments which is the strongest part of the bone. The distal third region of the tibia hasthe smallest cross-section and the thinnest cortex and so is more susceptible to failure in compressionthan the mid-diaphysis. Therefore, the critical compressive force used in the tibia index overestimatesthe strength of the leg in compression. Another assumption in the application of TI to the Hybrid IIIdummy is that the Hybrid III leg accurately measures the mid-shaft bending moment and forces thatwould occur in the human tibia during axial compression of the leg. Crandall et al. (1996)demonstrated that the mass, moment of inertia, and stiffness of the leg and foot of the Hybrid III dummyare quite different from those of the human leg and foot. The structural geometry of the Hybrid III legand the alignment of the leg shaft with respect to the joint centers is not the same as that of the human. Therefore, the response of the Hybrid III leg is different than that of a human under similar impactconditions.

6-1
Chapter 6Recommendations
Summarizing all of the discussion presented in this paper, Table 6-1 shows the injury criteria and criticalvalues recommended for each body region. HIC15 is currently being recommended for headprotection, scaled appropriately for all dummy sizes. A neck criteria of SNPRM Nij#1.0 is beingrecommended, with critical values defined for all dummies. For the chest, the individual limits on chestdeflection and spinal acceleration are recommended for regulation with the CTI used for predictinginjury probability rates. Femur load is recommended only for the adult dummies.
Table 6-1. Recommended Injury Criteria for FMVSS No. 208 SNPRM
RecommendedCriteria
Large§Male
Mid-SizedMale
SmallFemale
6 YOChild
3 YOChild
1 YOInfant
Head Criteria: HIC15 700 700 700 700 570 390
Neck Criteria: SNPRM Nij
Critical Intercept ValuesTension and Compression (N)Flexion (Nm)Extension (Nm)
1.0
5440415166
1.0
4500310125
1.0
337015562
1.0
28009339
1.0
21206827
1.0
14654317
Thoracic Criteria1. Spine Acceleration (g)
2. Chest Deflection (mm)
55
70(2.8 in)
60
63(2.5 in)
60
52(2.0 in)
60
40(1.6 in)
55
34(1.4 in)
50
30*(1.2 in)
Lower Ext. Criteria:Femur Load (kN) 12.7 10.0 6.8 NA NA NA
§ The Large Male (95th percentile Hybrid III) is not currently proposed for inclusion in the SNPRM, but theperformance limits are listed here for completeness.
* The CRABI 12 month old dummy is not currently capable of measuring chest deflection.

References
Backaitis SH and St. Laurent A. (1986) Chest Deflection Characteristics of Volunteers and Hybrid III Dummies. Proceedings of the Thirtieth Stapp Car Crash Conference, pp 157-166. SAE Paper No. 861884.
Bandak, F. A., Eppinger, R. H. and Ommaya A. K.(eds.) (1996) Traumatic brain injury: Bioscience and Mechanics.Mary Ann Liebert Publishers.
Cesari D and Bouquet R. (1990) Behavior of Human Surrogates under Belt Loading. Proceedings of the Thirty-Fourth Stapp Car Crash Conference, pp 73-82. SAE Paper No. 902310.
Crandall JR, et al. (1997) Thoracic Response and Trauma of Out-of-Position Drivers Resulting From Air BagDeployment. Forty-First Annual Proceedings of the Association for the Advancement of Automotive Medicine.
Crandall, et al., “Biomechanical Response and Physical Properties of the Leg, Foot, and Ankle, (962424),”Proceedings of the Fortieth Stapp Car Crash Conference, Albuquerque, New Mexico, November, 1996.
Duncan JM. (1874) Laboratory Note: On the Tensile Strength of the Fresh Adult Foetus. The British MedicalJournal, Vol. 2, pp. 763-764, December 19, 1874.
Eiband AM (1959) Human Tolerance to Rapidly Applied Accelerations: A Summary of the Literature. NASAMemorandum, Lewis Research Center, Cleveland, Ohio, June 1959.
Eppinger RH. (1989) On the Development of a Deformation Measurement System and its Application TowardDeveloping Mechanically Based Injury Indices. Proceedings of the Thirty-Third Stapp Car Crash Conference, pp. 21-28, SAE Paper No. 892426.
Foret-Bruno J, et al. (1978) Correlation Between Thoracic Lesions and Force Values Measured at the Shoulder of 92Belted Occupants Involved in Real Accidents. Proceedings of the Twenty-Second Stapp Car Crash Conference, pp.271-292, SAE Paper No. 780892.
Gadd CW and Patrick LM. (1968) System Versus Laboratory Impact Tests for Estimating Injury Hazard. SAE PaperNo. 680053, SAE International Congress and Exposition, SAE Paper No. 680053.
Gadd CW. (1961) National Research Council Publication No. 977, pp. 141 –144.
Gadd CW. (1966) Use of a Weighted-Impulse Criterion for Estimating Injury Hazard. Proceedings of the Tenth StappCar Crash Conference, SAE Paper 660793.
Got C, et al. (1978) Results of Experimental Head Impacts on Cadavers: The Various Data Obtained and TheirRelations to Some Measured Physical Parameters. Proceedings of the Twenty-Second Stapp Car Crash Conference,SAE Paper No. 780887.
Gray H. (1977) Anatomy, Descriptive and Surgical. Ed. by Pick TP and Howden R, Gramercy Books, New York.
Gurdjian ES, et al. (1963) Concussion - Mechanism and Pathology, Proceeding of the Seventh Stapp Car CrashConference.
Gurdjian, E.S., J.E. Webster, and H.R. Lissner (1955) Observations on the Mechanism of Brain Concussion,Contusion, and Laceration. Surg., Gynec., & Obstet. 101: 680-690.

Hertz (1993) A Note on the Head Injury Criteria (HIC) as a Predictor of the Risk of Skull Fracture. 37th AnnualProceedings of the Association for the Advancement of Automotive Medicine.
Hobbs, C., Gloyns, P., “European New Car Assessment Program (EURO-NCAP)”, Version 1.0, January 1997,(Unpublished Project Report).
Hodgson VR and Thomas LM. (1977) Breaking Strength of the Human Skull Versus Impact Surface Curvature.Wayne State University, DOT Report No. DOT-HS-146-2-230.
Hodgson VR, Thomas LR, and Brinn J. (1973) Concussion Levels Determined by HPR Windshield Impacts.Proceedings of the Seventeenth Stapp Car Crash Conference, SAE Paper No. 730970.
Horsch JD and Schneider D. (1988) Biofidelity of the Hybrid III Thorax in High velocity Frontal Impact. SAEInternational Congress and Exposition, SAE Paper No. 880718.
Horsch JD, et al.(1991) Thoracic Injury Assessment of Belt Restraint Systems Based on Hybrid III ChestCompression. SAE Paper No. 912895, Thirty-Fifth Stapp car Crash Conference, pp 85-108.
Hosmer DW and Lemeshow S. (1989) Applied Logistic Regression, John Wiley and Sons, New York.
Kleinbaum, D., Kupper, L., Morgenstern, H. (1982) Epidemiological Research,” Van Nostrand Reinhold.
Kleinberger M and Summers L. (1997) Mechanisms of Injuries for Adults and Children Resulting from AirbagInteraction,” 41st Annual Proceedings of the Association for the Advancement of Automotive Medicine, pp. 405-420.
Kleinberger M, Sun E, Eppinger R, Kuppa S, Saul R. (1998) Development of Improved Injury Criteria for theAssessment of Advanced Automotive Restraint Systems. NHTSA Docket No 1998-4405-9, September, 1998.
Klinich KD, et al. (1996) NHTSA Child Injury Protection Team. Techniques for Developing Child Dummy ProtectionReference Values. NHTSA Docket No. 74-14, Notice 97, Item 069, October, 1996.
Kroell CK, Schneider DC, and Nahum AM. (1972) Impact Tolerance and Response of the Human Thorax. Proceedings of the Fifteenth Stapp Car Crash Conference, SAE Paper No. 710851.
Kroell CK, Schneider DC, and Nahum AM.. (1974) Impact Tolerance and Response of the Human Thorax II. Proceedings of the Eighteenth Stapp Car Crash Conference, SAE Paper No. 741187.
Kroell CK, Pope ME, and Viano DC. (1981) Interrelationship of Velocity and Chest Compression in Blunt ThoracicImpact. Proceedings of the Twenty-Fifth Stapp Car Crash Conference. SAE Paper No. 811016. Kuppa, S., Eppinger, R.. (1998) Development of an Improved Thoracic Injury Criterion,” Proceedings of the 42nd
Stapp Car Crash Conference, SAE No. 983153.
Langhaar, H. L. (1951) Dimensional Analysis and Theory of Models, John Wiley and Sons, New York.
Lau IV and Viano DC. (1981) Influence of Impact Velocity and Chest Compression on Experimental Pulmonary InjurySeverity in an Animal Model. Journal of Trauma, Vol. 21, pp 1022-1028.
Lau IV and Viano DC. (1986) The Viscous Criterion – Bases and Applications of an Injury Severity Index for SoftTissue. Proceedings of the Thirtieth Stapp Car Crash Conference, pp 123-142, SAE Paper No. 861882.
Lau IV and Viano DC. (1988) How and When Blunt Injury Occurs: Implications to Frontal and Side ImpactProtection. Proceedings of the Thirty-Second Stapp Car Crash Conference, pp. 81-100, SAE No. 881714.

Lenox JB, et al. (1982) Development of Neck Injury Tolerance Criteria in Human Surrogates. I. Static Tensile Loadingin the Baboon Neck: Preliminary Observations. Proceedings of the Ninth International Technical Conference on theEnhanced Safety of Vehicles, pp. 279-286.
Lissner, H.R., Lebow, M., and Evans, F.G.; "Experimental Studies on the Relation Between Acceleration andIntracranial Pressure Changes in Man," Surgery, Gynecology, and Obstetrics, Volume III, p. 329-338, 1960.
Malliaris, AC, et al. (1982) A Search for Priorities in Crash Protection. SAE International Congress and Exposition,SAE Paper No. 820242.
McPherson GK and Kriewall TJ. (1980) The Elastic Modulus of Fetal Cranial Bone: A First Step Towards anUnderstanding of the Biomechanics of Fetal Head Molding. Journal of Biomechanics, Vol. 13, No. 1, pp. 9-16.
Melvin JW. (1995) Injury Assessment Reference Values for the CRABI 6-Month Infant Dummy in a Rear-FacingInfant Restraint with Air Bag Deployment. SAE International Congress and Exposition, SAE Paper No. 950872.
Melvin, J.W., J.W. Lighthall, and K. Ueno. (1993) Brain Injury Biomechanics, in Accidental Injury: Biomechanics andPrevention, A.M. Nahum and J.W. Melvin, Editors. 1993, Springer-Verlag: New York. p. 268-291.
Menard, Scott, “Applied Logistic Regression Analysis,” Sage University Press No. 106. Mertz HJ, Prasad P, and Nusholtz G. (1996) Head Injury Risk Assessment for Forehead Impacts. SAE InternationalCongress and Exposition, SAE Paper No. 960099.
Mertz HJ, et al. (1991) Hybrid III Sternal Deflection Associated with Thoracic Injury Severities of OccupantsRestrained with Force-Limiting Shoulder Belts. SAE International Congress and Exposition, SAE Paper No. 910812.
Mertz HJ, et al. (1997) Injury Risk Curves for Children and Adults in Frontal and Rear Collisions. Proceedings of theForty-First Stapp Car Crash Conference, SAE Paper No. 973318.
Mertz H and Gadd CW. (1994) Thoracic Tolerance to Whole-Body Deceleration. SAE Paper No. 710852, InBiomechanics of Impact Injury and Injury Tolerances of the Thorax-Shoulder Complex, ed. Stanley Backaitis, SAEPublication PT-45, Society of Automotive Engineers, Inc., Warrendale, PA, 1994.
Mertz H., “Anthropomorphic Test Devices,” Accidental Injury, Biomechanics, and Prevention, edited by Nahum, A.,Melvin, J., Springer-Verlag, 1993.
Mertz HJ and Patrick LM. (1971) Strength and Response of the Human Neck, Proceedings of the Fifteenth Stapp CarCrash Conference, SAE Paper No. 710855.
Mertz HJ, et al. (1989) Size, Weight, and Biomechanical Impact Response Requirements for Adult Size Small Femaleand Large Male Dummies. SAE International Congress and Exposition, SAE Paper No. 890756.
Mertz HJ, et al. (1982) Responses of Animals Exposed to Deployment of Various Passenger Inflatable RestraintSystem Concepts for a Variety of Collision Severities and Animal Positions. Proceedings of the Ninth InternationalTechnical Conference on Experimental Safety Vehicles, pp. 352-368.
Mertz HJ, et al. (1978) An Assessment of Compressive Neck Loads Under Injury-Producing Conditions. Physicianand Sports Medicine, Vol. 6, No. 11, pp. 95-106.
Messerer O. (1880) Uber elasticitat und festigkeit der menschlichen knochen. Verlag der J.G. Cotta’schenBuchlandlung, Stuttgart.

Morgan RM, et al. (1994) Thoracic Trauma Assessment Formulations for Restrained Drivers in Simulated FrontalImpacts. Proceedings of the Thirty-Eighth Stapp Car Crash Conference, SAE Paper No. 942206.
Neathery RF, et al. (1975) Prediction of Thoracic Injury from Dummy Responses,” Proceedings of the NineteenthStapp Car Crash Conference, pp. 295 - 316, SAE Paper No. 751151.
Newton, I. (1687) Philosophiae Naturalis Principia Mathematica. London, 1687.
NHTSA Child Injury Protection Team. (1996) Techniques for Developing Child Dummy Protection Reference Values. Docket #74-14 Notice 96 Item 69, October, 1996.
Nightingale RW, Kleinberger M, and Myers BS. (1998) Effects of Upper Neck Joint Stiffness on Measured Momentsin the Hybrid III Dummy During Airbag Loading. NHTSA Docket. (Under Review)
Nightingale RW, et al. (1997) The Dynamic Responses of the Cervical Spine: Buckling, End Conditions, andTolerance in Compression Impacts. Proceedings of the Forty-First Stapp Car Crash Conference, SAE Paper No.973344, pp. 451-471.
Nyquist G, et al. (1980) Correlation of Field Injuries and GM Hybrid III Dummy Responses for Lap-Shoulder BeltRestraint. Journal of Biomechanical Engineering, Vol. 102, pp. 487-493.
Patrick LM, et al. (1963) Survival by Design - Head Protection, Proceedings of the Seventh Stapp Car CrashConference .
Prasad P and Mertz H. (1985) The Position of the United States Delegation to the ISO Working Group 6 on the Use foHIC in the Automotive Environment. SAE Government/Industry Meeting and Exposition, SAE paper no. 851246.
Prasad P and Daniel RP. (1984) A Biomechanical Analysis of Head, Neck, and Torso Injuries to Child SurrogatesDue to Sudden Torso Acceleration. SAE Paper No. 841656.
SAE J1733, Sign Convention for Vehicle Crash Testing, Surface Vehicle Information Report, Society of AutomotiveEngineers, 1994.
Sances A, et al. (1981) Experimental Studies of Brain and Neck Injury. Proceedings of the Twenty-Fifth Stapp CarCrash Conference, SAE Paper No. 811032.
Schneider LW, et al. (1983) Development of anthropometrically based design specification for an advanced adultanthropomorphic dummy family. UMTRI, Report No. UMTRI-83-53-1, Vol. 1.
Schreiber, P., et al., “Static and Dynamic Strength of the Leg,” Proceedings of the 1997 IRCOBI Conference, Germany,September, 1997.
Shea M, et al. (1992) In Vitro Hyperextension Injuries in the Human Cadaveric Cervical Spine. Journal of OrthopaedicResearch , Vol. 10, pp. 911-916.
Snyder RG, et al. (1977) Anthropometry of Infants, Children, and Youths to Age 18 for Product Safety Design.Highway Safety Research Institute, Univ. of Michigan, Report UM-HSRI-77-17.
Stapp JP. (1970) Voluntary Human Tolerance Levels. In Impact Injury and Crash Protection, ed. Gurdjian, Lange,Patrick, and Thomas, published by Charles C. Thomas.
Tarriere C, et al. (1982) Acceleration, Jerk and Neck Flexion Angle: Their Respective Influences on the Occurrence ofBrain Injury. ISO, TC 22, SC 12, GT-6 (USA-13), Doc. No. 118.

Taylor ES. (1974) Dimensional Analysis for Engineers. Clarendon Press, Oxford.
Versace J. (1971) A Review of the Severity Index. Proceedings of the Fifteenth Stapp Car Crash Conference SAEPaper No. 710881.
Weber K and Lehman RJ. (1985) Child Anthropometry for Restraint System Design. University of MichiganTransportation Research Institute, Report No. UMTRI-85-23.
Wood, J. L. (1971). Dynamic Response of Human Cranial Bone. J. Biomech., Vol. 4, pp. 1-12, Pergamon Press.
Yoganandan N, et al. (1991) Thoracic Deformation Contours in a Frontal Impact. Proceedings of the Thirty-FifthStapp Car Crash Conference, SAE Paper No. 912891.
Yoganandan N, et al. (1996) Human Head-Neck Biomechanics Under Axial Tension. Med. Eng. Phys., Vol. 18, pp.289-294.
Appendix A
Public Comments on Proposed InjuryCriteria

A-1
APPENDIX A: Opportunities for Public Comment on Injury Criteria Proposed in the Sept 30,1998 Publication of the Notice of Proposed Rulemaking for FMVSS No. 208
NHTSA has provided numerous opportunities for all interested parties to submit comments on theproposed injury criteria for review. These include:
1. Written comments submitted to Docket #4405 of the Department of Transportation DocumentManagement System, which may be viewed in Room 401 of the Department of Transportation,400 7th Street, S.W., Washington, D.C. 20590 or at www.dms.dot.gov.
2. A public meeting held on November 23, 1998 in which technical presentations were made bythe agency to describe the basis for the various injury criteria proposed, Mr. Vann Wilber,Director of Vehicle Safety for the American Automobile Manufacturers’ Association (AAMA), made a presentation on their views of the proposed rulemaking, and a discussion was held. Asummary of this meeting may be found in submission number 89 to Docket #4405.
3. A public meeting held on April 20, 1999 in which additional technical presentations were madeby the agency to describe the basis for the various injury criteria proposed and offer additionalanalyses performed by the agency in response to the comments received. Dr. Harold Mertz ofGeneral Motors presented technical material on head injury and neck injury; Dr. Priya Prasadof Ford Motor Company presented a technical analysis on chest injury criteria; and Dr. GuyNuschultz presented an analysis on statistical analysis techniques. The transcript of this meetingwill be submitted to Docket #4405 shortly.
The agency has weighed the relative merit of these comments and has proposed some modified injurycriteria in the SNPRM. The following is a detailed summary of the comments received and theagency’s response to those comments.

A-2
Appendix A: Summary of Comments Submitted to Docket #4405 and Agency Analysis
A.1 General Injury Criteria NHSTA has proposed to add a new set of requirements to prevent air bags from causing injuries andto expand the existing set of requirements intended to ensure that air bags cushion and protectoccupants in frontal crashes. The agency has proposed injury criteria and performance limits that itbelieves are appropriate for each dummy size, including the 12-month CRABI, 3-year-old, 6-year-old,5th percentile adult female, and 50th percentile adult male Hybrid III dummies.
Comments Received:
In general, all commenters including manufacturers (BMW, GM, Ford, Mazda), manufacturingassociations (AIAM), associations (IIHS, Advocates for Highway Safety, Public Citizens) andcitizens (Byron Bloch) strongly supported NHTSA’s effort to minimize risks associated with airbag systems by adopting additional anthropometric test devices (ATD) of different sizes withappropriate injury criteria. Commenters’ specific remarks on each injury criteria are discussedin the following sections. The following statements summarize the comments on injury criteria ingeneral.
BMW commends NHTSA’s efforts to establish new injury criteria. GM, Ford and Mazdasupport the addition of appropriate injury criteria and additional ATD sizes. A few commenters(AIAM, IIHS, Consumer’s Union, Advocates for Highway Safety) emphasized the need forneck injury criteria in the proposed regulation. AIAM believes that the current injury criteria,with the addition of neck criteria, are adequate to ensure the protection of occupants in real-world collisions. IIHS states that based on real-world neck injuries to children, the addition ofneck injury criteria are welcome and crucial. The National Transportation Safety Board statesthat side impact requirements and the corresponding injury criteria need to be reviewed andmay need to be addressed in the new standards. The NTSB states that many manufacturersare developing side air bags for the front and rear seats.

A-3
A.2 Consensus of International Community and Delayed Introduction of New Injury Criteria The NPRM proposes two new injury criteria, the neck injury criteria, Nij and the Combined ThoracicIndex (CTI), and performance limits for all dummy sizes for in-position and out-of-position testing . Since the current regulation uses only the 50th percentile male dummy, the NPRM specifiesperformance limits for the existing injury criteria (chest acceleration, chest deflection, HIC, femur loads)for the various dummy sizes. Finally, as an alternative to using Nij, performance limits for current neckinjury criteria which are currently used only for the temporary sled test alternative are also specified forthe various dummy sizes in both in-position and out-of-position testing. Many comments received,especially regarding the newly proposed injury criteria and the scaling of the injury criteria to variousdummy sizes suggested that further discussion and the consensus of the international scientificcommunity was necessary before adopting these criteria and performance limits in a Final Rule.
Comments Received:A number of commenters (BMW, AIAM, Nissan, Subaru, Mazda, AORC) recommended thata consensus within the international scientific community needs to be reached before new injurycriteria are adopted and used as regulatory compliance measures. BMW recommends that theagency follow the recommendations of working group 6 (ISO TC22/SC12), which iscomprised of internationally-recognized biomechanics experts. AIAM recommends that theagency convene an international panel of biomechanics experts to review and critique the newcriteria before they are adopted, with priority given to scaled criteria for the new dummy sizes. AIAM stated that since it is not critical to include CTI and Nij in the final rule, they recommendpostponing their inclusion until the biomechanics community can thoroughly consider theirappropriateness. Nissan is concerned that CTI has not been peer-reviewed or otherwisevalidated by the scientific community. Subaru is concerned that the new injury criteria have notyet been proven by the biomechanics community. Mazda believes that CTI and Nij have notbeen sufficiently evaluated by the international biomechanics community to be used inregulation. The AORC states that the foundation for all the injury criteria proposed in theNPRM may not have the agreement of biomechanics experts.
Other commenters recommended the inclusion of the new injury criteria with the currentrulemaking. Advocates stated that Nij should be included since it offers a more realistic meansof measuring neck injury and should offer a more stringent means of preventing significant riskof neck injury. The Center for Auto Safety supports the inclusion of CTI with continuedresearch and Nij with a limit of 1.0. Public Citizens supports the use of new, moresophisticated and realistic means to measure neck and chest injury, specifically Nij with a limitof 1.0 and CTI.
A few commenters, including Subaru, Volvo, Nissan, recommended addressing new injurycriteria separately (CTI and/or Nij) from the final rule for FMVSS No. 208. Subarurecommends continued research on the newly proposed injury criteria and review of the newcriteria separate from the Final Rule. Volvo believes that chest injury should be evaluated

A-4
separately from this rulemaking. Nissan recommends directing priority toward the reduction ofadverse effects of air bags and the introduction of new injury criteria on a separate basis.
Response to Comments:
The pressing need to minimize the risk to occupants of all sizes in a variety of crash conditionprecludes the time consuming process of convening a panel of international biomechanicsexperts and obtaining the consensus of the biomechanics community on the proposed newinjury criteria. As an alternative, the agency has provided numerous opportunities for interestedparties to submit comments for the agency’s review and had considered the viewpoints of eachresponder. The rationale for maintaining or changing each of the proposed injury criteria will bediscussed individually.
NHTSA is continuing to sponsor cooperative research agreements with many of the leadinguniversities in the field of automotive biomechanics to further our knowledge on the mechanismsand tolerance of the human body and to improve scaling procedures to ensure the safety ofoccupants of all sizes.

A-5
A.3: Overview of Comments on Head Injury CriterionThe NPRM proposes that the Head Injury Criterion evaluated over an interval of 36 ms be maintainedfor the 50th percentile male dummy and scaled for the various sized dummies. The agency requestscomments on the proposed injury criterion and performance limits.
Comments Received:
Two commenters, Volvo and Autoliv, support the performance limits for HIC evaluated over a36 ms interval for all dummy sizes as proposed in the NPRM. Autoliv accepts the Head InjuryCriterion as proposed for all dummy sizes since they appear to be consistent with current risklevels. Autoliv also mentioned that further research on rotational brain injury mechanism mightbe beneficial. Volvo does not oppose the HIC values for the various dummy sizes proposed inthe NPRM, although the reduction for child dummies does not appear to be thoroughlyinvestigated and is lacking biomechanical data to support it.
Two commenters, IIHS and Advocates for Highway Safety, recommend performance limits forHIC that are lower than 660 for the 12 month CRABI dummy. The IIHS recommends athreshold for the 12 month CRABI dummy that is closer to the lowest HIC value of 138 basedon different scaling techniques presented in Chapter 3. They state that “adopting the lowervalue increases the certainty that, if the manufacturers choose to deploy airbags in the presenceof rear-facing infant restraints, the airbags would not cause serious brain injury”. Advocatesstates that infants are far more likely to be susceptible to internal organ damage, especially braintrauma and brain swelling, from seemingly benign impacts including those at injury levels belowthat established for adults.
The National Transportation Safety Board suggested that the NPRM should provide a factor ofsafety in the HIC performance limits for all child dummies to account for uncertainties in thepediatric skull. The NTSB also states that the NPRM did not provide sufficient informationregarding the source or assumptions underlying the HIC scaling factor to allow evaluation of theappropriateness of the HIC scaling factor.
The AAMA proposed evaluating the Head Injury Criterion with a 15 ms interval as is used inthe Canadian Federal Motor Vehicle Safety Standard, rather than the 36 ms interval which iscurrently regulated in the US. In addition, the AAMA proposes using a different statisticaltechnique to analyze the data and using different scaling technique for the various dummy sizes. The HIC values proposed by the AAMA for both in-position and out-of-position testing aresummarized in Table A3.1.
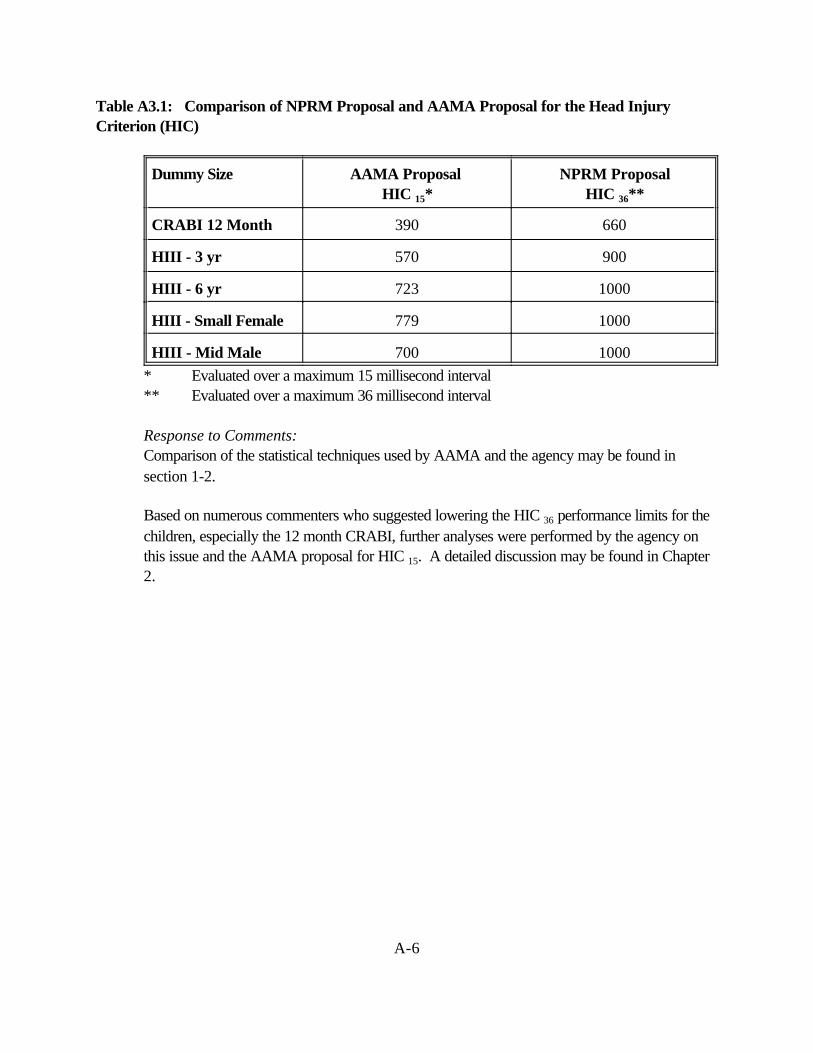
A-6
Table A3.1: Comparison of NPRM Proposal and AAMA Proposal for the Head InjuryCriterion (HIC)
Dummy Size AAMA Proposal HIC 15*
NPRM ProposalHIC 36**
CRABI 12 Month 390 660
HIII - 3 yr 570 900
HIII - 6 yr 723 1000
HIII - Small Female 779 1000
HIII - Mid Male 700 1000 * Evaluated over a maximum 15 millisecond interval
** Evaluated over a maximum 36 millisecond interval
Response to Comments:Comparison of the statistical techniques used by AAMA and the agency may be found insection 1-2.
Based on numerous commenters who suggested lowering the HIC 36 performance limits for thechildren, especially the 12 month CRABI, further analyses were performed by the agency onthis issue and the AAMA proposal for HIC 15. A detailed discussion may be found in Chapter2.

A-7
A.4: Overview of Comments on the Neck Injury CriteriaThe current FMVSS No. 208 alternative sled test includes injury criteria for Th neck consisting ofindividual tolerance limits for tension (force stretching the neck), shear (force perpendicular to the neckcolumn), compression (force compressing the neck), flexion moment (forward bending of the neck) andextension moment (rearward bending of the neck). Due to the incidence of neck injuries in the realworld data gathered by the National Automotive Sampling System and NHTSA’s Special CrashInvestigations, the NPRM proposed two alternative methods for assessing the risk of neck injury for thevarious dummy sizes: (1) Nij, with a value of either 1.0 or 1.4, and (2) independent evaluation of thetension, compression, flexion, extension, forward and rearward shear on the neck. The NPRMrequested comments on the two proposed criteria, including the proposed performance limits.
Comments Received:
A number of commenters (AAMA, DaimlerChrysler, Ford, General Motors, Isuzu, Toyota,Subaru, Mazda, AIAM) strongly oppose the inclusion of Nij in the proposed regulation. TheAAMA supports the independent evaluation of neck loads and moments and proposes twoseparate levels for in-position and out-of-position testing levels based on the protective aspectsof passive neck muscle tension (Tables A4.1 and A4.2). A technical discussion of themethodology used by the AAMA to obtain these performance limits is presented in Section5.2.3. Subaru believes that Nij is not an appropriate injury measure for the wide range of testsproposed in the NPRM, but does not offer further explanation. Although Porsche does notstate that they oppose Nij, Porsche points out that Nij is sensitive to small differences inoccupants’ forward displacement, especially with angled (30 degree) crash tests.
Table A4.1: AAMA Proposed Independent Neck Values for Out-of-Position
Dummy Size Tension(N)
Compression(N)
Flexion(N-m)
Extension (N-m)
CRABI 12 Month 780 960 27 11
HIII - 3 yr 1130 1380 42 17
HIII - 6 yr 1490 1820 60 24
HIII - Small Female 2070 2520 95 39
HIII - Mid Male 3290 4000 190 77

A-8
Table A4.2: AAMA Proposed Independent Neck Values for In-Position
Dummy Size Tension(N)
Compression(N)
Flexion(N-m)
Extension (N-m)
CRABI 12 Month 780 960 27 11
HIII - 3 yr 1480 1380 42 22
HIII - 6 yr 1910 1820 60 30
HIII - Small Female 2620 2520 95 49
HIII - Mid Male 4170 4000 190 96
Honda, Volvo, and Autoliv support Nij with a preferred maximum of 1.4 at the present time,rather than the independent regulation of neck loads and moments. Based on reasons ofpracticality, Autoliv states that if a lower value were initially selected, there would be a delay inintroduction of advanced safety systems due to more complicated design iterations. Hondasupports the performance limit of 1.4, which includes “worst case” tests, due to numerousuncertainties including the appropriate values, the biofidelity of the necks of the variousdummies, and the scaling procedures. Honda states that overly severe criteria in one crashscenario could lead to reduced protection in another crash scenario. Volvo states that researchindicates that neck injuries is dependent upon a combination (superposition) of the differentindividual criterion, which justifies the inclusion of Nij as proposed in the NPRM. Volvo statesthat the proposed individual performance limits for neck injuries, in particular the momentsspecified for the child dummies, appear to by unjustifiably low and do not appear supported bybiomechanical data. Volvo also states that adopting criteria of this stringency without adequatebiomechanical data may hamper development of new air bag designs and thus manymanufacturers may chose suppression rather than low-risk deployment.
IIHS, Public Citizens, and Advocates for Highway Safety support the neck injury criterion, Nij. IIHS strongly recommends 1.0 as the performance limit to ensure little or no harm to out-of-position occupants. Public Citizens states that Nij seems to be a more sophisticated andrealistic way to measure neck injury. Public Citizens supports Nij so long as the forces whencombined in the Nij formulation do not exceed the individual performance limits specified in thecurrent sled test alternative in FMVSS No. 208. Furthermore, Public Citizens believes thatNHTSA should adopt a more stringent Nij value of 1.0 because it represents significantlyreduced risk of serious neck injury and several manufacturers have demonstrated that such astandard is indeed feasible. Advocates for Highway Safety favors the adoption of Nij becauseit offers a more realistic means of measuring neck injury and should offer a more stringentmeans of preventing significant risk of neck injury, especially for unbelted children. Advocatessupports the introduction of Nij so long as the maximum value of the combination of neck

A-9
forces and moments do not exceed the limits for the neck criteria when evaluatedindependently.
Although the National Transportation Safety Board (NTSB) states that there was insufficientdetails in the NPRM to evaluate the appropriateness of Nij, the NTSB states that a value of Nijequal to 1.0 seems appropriately cautious for children due to uncertainties in the interaction atthe occipital condyles of a child, adult, and a porcine model from which the criterion wasdeveloped. The NTSB also recommends inclusion of shear and rotational criteria to addressneck injury in frontal, side, and combined angle impacts.
The Consumers Union supports the addition of new injury criteria, especially regarding neckinjury. The Consumer Union states that their review of films and reports from NHTSA’s NewCar Assessment Program has shown some “troubling neck motions in some test dummies.”
Mazda believes that some type of neck injury criteria are needed for the various dummy sizesbased on the nature of the airbag induced injury patterns that are appearing in the field. However, Mazda believes Nij has not been sufficiently evaluated by the internationalbiomechanics community to be used in regulation.
Response to Comments:
Based on the comments received and the discussions at the two public meetings (see summaryE-2 and E-3), the agency has opted to continue its support of Nij with a modified formulation. The issue of neck injury, especially to out-of-position adults and children, is one of the prioritiesof this rulemaking and the agency would be remiss if it did not include the most accurate andup-to-date methods to assess what conditions are injurious and non-injurious. The agencycontinues to believe that Nij has a strong foundation in biomechanics and testing has shown thatthe performance limits are practicable or that alternative options, such as suppression systems,are practicable. Although some commenters have suggested that the Nij = 1.0 may be tooconservative leading manufacturer’s to choose suppression rather than low-risk deployment forthe small female and out-of-position children, the agency believes that this stringency iswarranted until biomechanical data and field data become available to change this performancelimit. The agency also believes that there has been sufficient time and precedence for theevaluation of a formulation of combined loads and moments, similar to Nij. The twoparameters, axial force and bending moment at the occipital condyles have long been used toevaluate neck injury. As early as 1984, Prasad and Daniel published a report demonstratingthat linear combination of neck loads and moments was a good predictor of neck injury for aseries of piglets exposed to air bag deployments. Furthermore in 1996, the agency issued areport describing techniques for developing injury reference value for child dummies whichincluded a combination of neck loads and moments to assess injury. Thus, a modified Nij willremain as the proposal for the SNPRM.

A-10
A.5: Overview of Comments on Chest Injury Criteria For chest injury, NHTSA proposed two alternatives in the NPRM. Under the first alternative, theagency would add the new chest injury criterion, the Combined Thoracic Index (CTI) for use in all testprocedures for all dummy sizes. The formulation of CTI is a linear combination of two parameters,chest acceleration and chest deflection, that are currently used independently in FMVSS No. 208. Thelinear combination of acceleration and deflection was shown in Chapter 4 to be a better predictor ofinjury in simulated frontal impact conditions than chest acceleration of chest deflection alone. Under thesecond alternative for chest injury, the agency would simply continue to maintain separate limits onchest acceleration and chest deflection for all dummy sizes. NHTSA requested comments on the twoproposed alternative, on how they are calculated, and on the proposed performance limits. In addition,the agency requested comments on whether the same limits should be established for all testrequirements, e.g., out-of-position, low speed tests, high speed tests.
Comments Received:BMW, Isuzu, Daimler Chrysler, Ford, General Motors, Honda, Toyota, Subaru, Volvo,Mazda, Autoliv, AIAM, AAMA, and the Alliance for Automobile Manufacturers oppose theinclusion of CTI. BMW and Honda opposed CTI because they believe that the increasedstringency of CTI will lead to more aggressive air bags and/or softer vehicle structures, whichwould have a negative effect on real world benefits. Honda stated that the addition of CTI forthe testing of the unbelted 50th percentile male dummy and other sized dummies requires atremendous amount of development work that will dilute and delay the development ofadvanced air bags. Subaru states that the industry has no experience on the appropriateness ofCTI and that new injury criteria may hinder the development of new technologies. Isuzuopposed CTI based on unknown correlation with real world injury data, unknownbiomechanical integrity, and opposition against establishing US specific criteria. Mazda statesthat there is no evidence that CTI is a valid measure of thoracic injury.
The AAMA whose members are Ford, General Motors and DaimlerChrysler, opposed theinclusion of CTI. The AAMA has presented a different interpretation of the data and hasquestioned the inclusion of a few of the data points which may be outliers in the analyses. As analternative to CTI, the AAMA proposed using chest acceleration, chest deflection, and chestdeflection rate for all dummy sizes in out-of-position testing and in-position testing for a severityequal to or less than the 30 mph generic sled test currently specified in FMVSS No. 208 (TableA5.1). The chest acceleration limit proposed for the 50th percentile male is consistent with thecurrent requirements of FMVSS No. 208. The chest deflection limits for the 50th percentilemale is lower than that currently required. The deflection, acceleration, and deflection rate limitsproposed for the other dummy sizes are scaled from the values for the 50th percentile male.
The Alliance of Automobile Manufacturers, which is the newly formed association whosemembers are BMW, DaimlerChrysler, Ford, General Motors, Mazda, Nissan, Toyota,

A-11
Volkswagen, and Volvo supports further public comment on the comprehensive injury criteriarecommended by AAMA and requires additional evaluation before the Alliance can endorse allthe specific values in the AAMA submission.
Honda, Toyota, Volvo, Mazda, Autoliv, AIAM proposed to maintain the current criteria thatlimit chest acceleration and chest deflection independently for the 50th percentile male dummyand add similar criteria for the other dummy sizes. However, Toyota opposed the chestacceleration and chest deflection criteria for the 5th percentile female dummy, although Toyotaoffered no rationale for this opposition. Autoliv stated that the approach presented by CTIlooks promising, but needs more evaluation.
Toyota and Volvo believe that since the maximum chest deflection and maximum chestacceleration do not occur simultaneously in a crash, the formulation for CIT should evaluate thecombined loading at every instant in time, following the pattern used for Nij.
The Tri-Lateral Working Group, which is made up of major motor vehicle manufacturers fromEurope, Japan and the United States who are members of ACEA, JAMA, and AAMA,expressed its concern about the application of new, untried test measures such as CTI and Nij. In addition, the combination of a multitude of tests, test variations, dummy positions, and newinjury criteria presents an impossible task for manufacturers.
Honda, IIHS, Advocates for Highway Safety, Center for Auto Safety, Toyota, Takata, AIAM,Autoliv, and Alliance of Automobile Manufacturers recommend further research and review. Honda recommended further consideration by NHTSA of the regions of the surrogate datawhere chest acceleration is greater than 60 g and there is low deflections and regions where thechest deflection is greater than 75 mm and there are low accelerations. Honda suggestsconsidering modifying the Hybrid III dummy in the future to be capable of measuring more than75 mm of deflection. The IIHS urged NHTSA to continue its research to secure reasonableanswers to some technical questions that were regarding CTI at the recent 42nd Stapp meeting. Advocates for Highway Safety supports more research and a public discussion of CTI beforeit is adopted. Advocates believes that other thoracic injury measures also have potential, andthe existing chest injury criteria are well understood and well established even if their relativemerits are subject to debate. Toyota states that CTI is not yet well established and is not readyfor used in the development of vehicle safety systems nor for inclusion in a legal requirement.
Center for Auto Safety, Public Citizens supported the inclusion of CTI. Public Citizens statesthat CTI seems to be a more sophisticated and realistic means by which to measure chestinjury.
Volkswagen commented that it did not have sufficient time to conduct testing with the variousdummies and the proposed injury criteria. Volkswagen will submit comments on the proposed
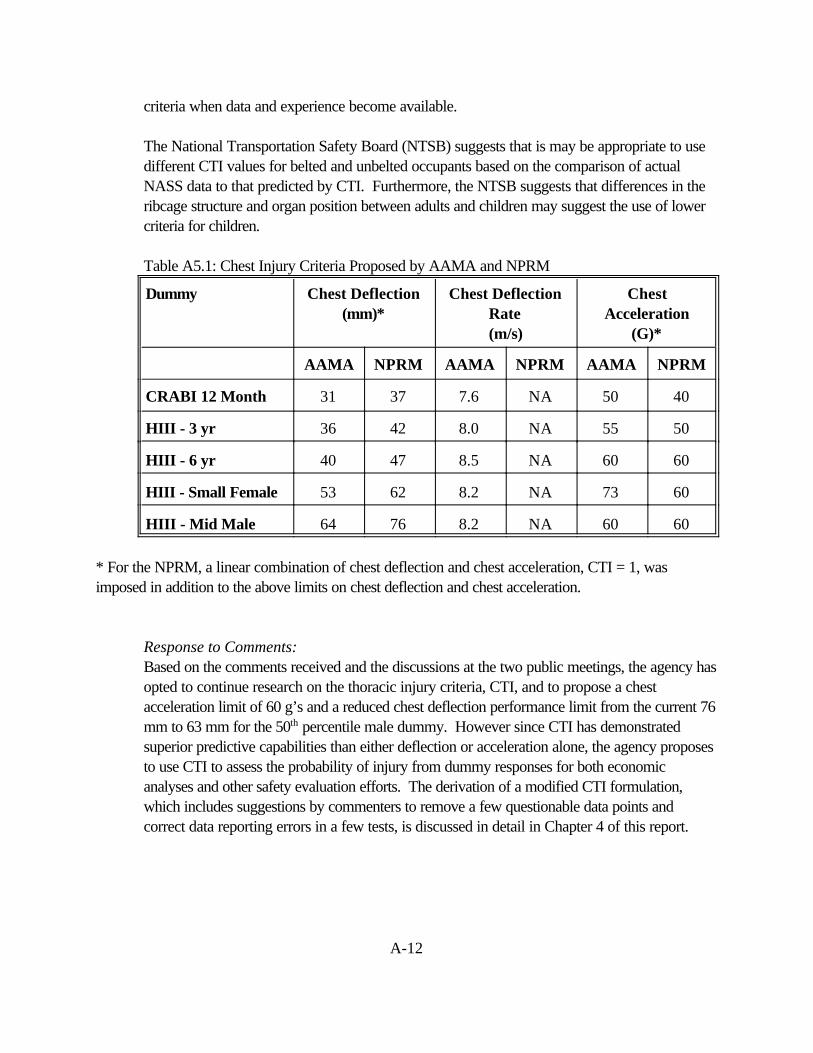
A-12
criteria when data and experience become available.
The National Transportation Safety Board (NTSB) suggests that is may be appropriate to usedifferent CTI values for belted and unbelted occupants based on the comparison of actualNASS data to that predicted by CTI. Furthermore, the NTSB suggests that differences in theribcage structure and organ position between adults and children may suggest the use of lowercriteria for children.
Table A5.1: Chest Injury Criteria Proposed by AAMA and NPRM
Dummy Chest Deflection(mm)*
Chest DeflectionRate(m/s)
ChestAcceleration
(G)*
AAMA NPRM AAMA NPRM AAMA NPRM
CRABI 12 Month 31 37 7.6 NA 50 40
HIII - 3 yr 36 42 8.0 NA 55 50
HIII - 6 yr 40 47 8.5 NA 60 60
HIII - Small Female 53 62 8.2 NA 73 60
HIII - Mid Male 64 76 8.2 NA 60 60
* For the NPRM, a linear combination of chest deflection and chest acceleration, CTI = 1, wasimposed in addition to the above limits on chest deflection and chest acceleration.
Response to Comments: Based on the comments received and the discussions at the two public meetings, the agency hasopted to continue research on the thoracic injury criteria, CTI, and to propose a chestacceleration limit of 60 g’s and a reduced chest deflection performance limit from the current 76mm to 63 mm for the 50th percentile male dummy. However since CTI has demonstratedsuperior predictive capabilities than either deflection or acceleration alone, the agency proposesto use CTI to assess the probability of injury from dummy responses for both economicanalyses and other safety evaluation efforts. The derivation of a modified CTI formulation,which includes suggestions by commenters to remove a few questionable data points andcorrect data reporting errors in a few tests, is discussed in detail in Chapter 4 of this report.

A-13
A.6 : Lower Extremity Injury CriteriaCurrently, FMVSS 208 specifies an axial load limit of 10kN (2250 pounds) for the 50th percentile maleHybrid III dummy, as measured by a load cell at the location of the mid-shaft of the femur. Thepurpose of the axial load limit on the femur is to reduce the probability of fracture of the femur and alsosurrounding structures in the thigh, such as the patella and pelvis. The crash configuration currentlyspecified in standard 208 is a frontal impact at speeds up to 30 mph and at an angle up to 30 degreesfrom the perpendicular with an unbelted or belted 50th percentile male dummy. Because the NPRMproposes to also require testing for the 5th percentile female in the same test configuration, it isappropriate to include an axial load limit for the 5th percentile female dummy. The axial load limitproposed in the NPRM was scaled down based on cross sectional area of the femur to 6.8 kN toaccount for the smaller bone size of the 5th percentile female.
Comments Received:AAMA, Ford, and Autoliv support the inclusion of performance limits for femoral compressiveloads for the 5th percentile female dummy specified in the NPRM in addition to maintaining thecurrently specified value for the 50th percentile male dummy. Furthermore, AAMA proposesadding femoral compressive load performance criteria of 2310 N for the 6 YO dummy.
The National Transportation Safety Board (NTSB) recommends that tolerance levels of lowerextremities need to be further investigated and validated. NTSB also suggests that the NHTSAconsider dummies such as advanced lower extremity (ALEX) dummy for future incorporationinto the standards.
Response to Comments:Although the NHTSA agrees with the AAMA that femoral compressive load limits for the sixyear-old dummy are important to consider, the NPRM does not specify such limits because thetesting configurations specified in the NPRM for the six year-old dummy do not imposesubstantial loading on the lower extremities. For instance, NPRM positions 1 and 2 for the sixyear-old specify chest loading and neck loading positions associated with the deployment of thepassenger’s side air bag at close proximity. The pre-impact breaking test specified in theNPRM with an unbelted six year-old dummy could result in loading to the femur, but there is alow risk of femoral injury at the specified speed of – kph. The NHTSA is continuing thedevelopment of an advanced lower extremity test device, the THOR-LX, and continues tosponsor experimental impact injury research to determine the mechanisms and tolerances of thelower extremities, including the foot, ankle and leg. When this effort is complete, it isanticipated that this research will be incorporated into future safety standards.

A-14
A.7: Real world problem/ Real world benefits of the proposed injury criteria
Comments Received:A number of commenters (Nissan, Porsche, Toyota, Mazda) state that there has not beensufficient real world data to suggest that new injury criteria are needed. Nissan states that therehas not been sufficient real world data to suggest that the existing chest and neck criteria areinappropriate, inadequate, or otherwise require improvement. Porsche states that there existsno evidence justifying an increase in the stringency of the thoracic injury criteria. Toyotabelieves that the real world accident data do not demonstrate a need for new injury criteria.Mazda states that CTI seems to be focused on improving the effectiveness of airbags in highspeed crashes, an area where there is no demonstrated problem.
A number of commenters (Isuzu, Nissan, Mazda, BMW, AORC) question the real worldbenefits of adopting the new injury criteria, CTI and Nij. Isuzu states that the correlation ofCTI and Nij with real world crash injury data is unknown. Nissan states that it has not beenshown that the adoption of CTI or Nij will lead to the reduction of injuries in the real world. Nissan expressed it’s concern about whether CTI is an appropriate injury measure for all testconditions. Mazda also states that NHTSA’s own preliminary economic analysis suggests thatthere are at best, minimal benefits from the application of CTI.
BMW do not support adopting CTI or any other new injury criteria until the full effects of thecriteria on real world occupant protection are well understood. The AORC believes each ofthe injury criteria must be shown to have a scientific foundation and that it must be shown thatcompliance with the criteria will in fact provide measurable safety benefits.
IIHS states that real-world crash data indicate that children are particularly at risk of seriousand fatal neck injuries from deploying airbags.
Response to Comments: Based on comments received, NHTSA has reconsidered its original proposal for using the CTIfor regulatory purposes. Instead, it has opted to employ individual limits for chest acceleration(60g) and chest deflection (63 mm) for the 50th percentile male and scaled values for thevarious dummy sizes. However, the agency continues to propose to use the CTI to assessprobability of injury from dummy responses for both its economic and other safety evaluationefforts. Details are presented in Chapter 4 along with efforts to link performance limits with realworld problems.

A-15
A.8: Other Injury CriteriaNHTSA proposed injury criteria and performance limits for the head/brain, neck, chest (except the 12month CRABI dummy), and femur (adult dummy only) for all dummy sizes. In addition to receivingcomments on the proposed injury criteria, the agency received comments on comments on two areas ofpossible injury associated with air bags which are not specified in the NPRM.
Comments Received:
The Center for Automobile Safety expressed concern that the NPRM did not proposed injurycriteria for the upper extremities. The Center stated that although a broken arm or hand maynot be as traumatic as a severed spinal cord or a cardiac failures, these types of injuries stillpose a hazzard to drivers who are the intended beneficiaries of air bag deployment.
The American Academy of Otolaryngology and Head and Neck Surgery, Inc. states that therehave been 60 documented cases of patients as of December 15, 1998, seeking medicalassistance because of hearing loss, tinnitus, and/or vertigo after exposure to airbag deployment. Out of 51 patients who underwent objective hearing evaluations, 43 showed evidence ofhearing loss, 42 experienced tinnitus, 13 complained of dizziness, and 6 patients sustainedruptured ear drums, four of whom required surgery. The Academy states that these reports arein contrast to previous statements by NHTSA and others denying the potential for injury tooccur after exposure to air bag deployment. The Academy wishes to balance the benefits of airbags with risks of noise exposure and permanent hearing loss during air bag deployment,particularly during non-threatening crashes.
The American Academy of Pediatrics recommends testing of pregnant dummy and assessmentof fetal injury.
Response to Comments:The agency acknowledges that drivers’ side air bags may pose a risk to the upper extremitiesand fully supports the efforts of the SAE to develop an instrumented arm the approximate sizeand weight of the arm of a 5th percentile female. This instrumented arm will allowmanufacturers to measure the forces, moments, rotations and accelerations of the arm and tominimize the potential for upper extremity injury. Preliminary research sponsored by theNHTSA has provided provisional injury criteria performance limits for the bending strength ofthe forearm (Bass, Stapp 1997) and research by others have provided provisional limits basedon the acceleration of the wrist (Hardy, Stapp 1997). Since the agency’s primary focus of therulemaking is to eliminate the serious risks associated with the deployment of air bags, at thepresent time the agency will not be proposing injury criteria for the upper extremities. However, the agency will continue to monitor the incidence and severity of upper extremityinjuries.

A-16
The agency is aware of the possible risks of hearing loss and tinnitus following exposure to airbag deployments and is conducting research in this area. Since the agency’s primary focus ofthe rulemaking is to eliminate the serious risks associated with the deployment of air bags, at thepresent time the agency will not be proposing injury criteria associated with the noise of thedeploying air bag. However, the agency will continue to monitor the incidence and severity ofhearing loss and tinnitus.
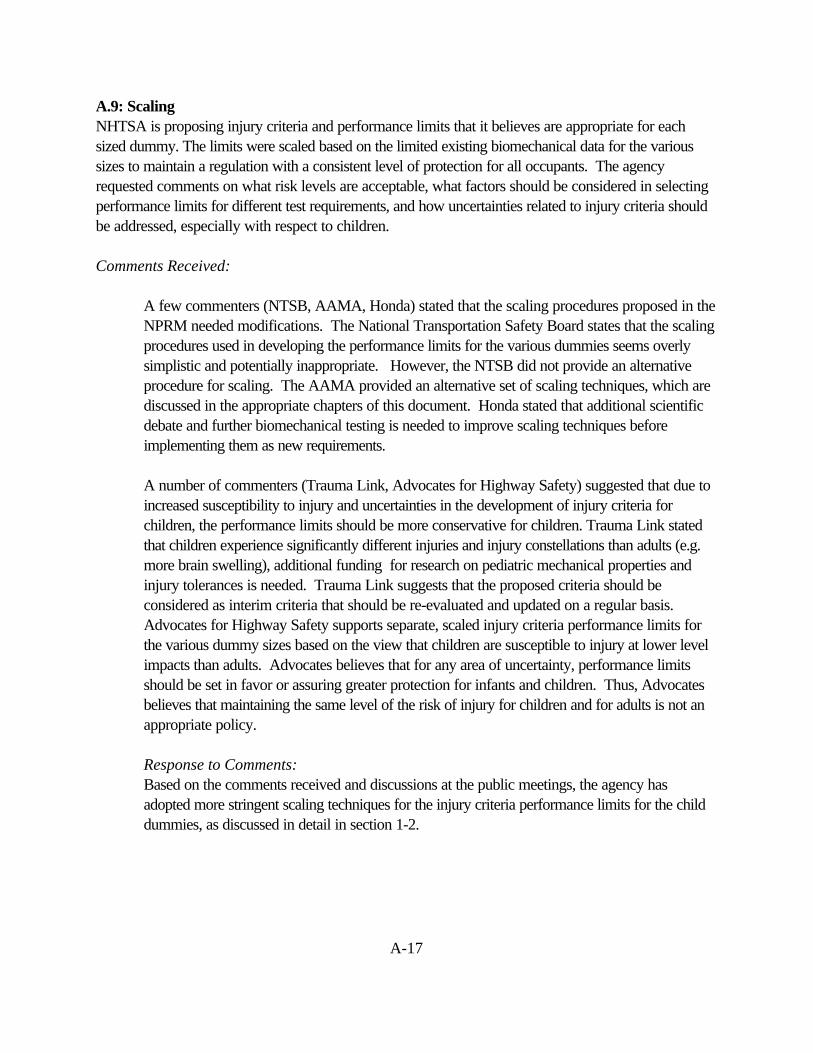
A-17
A.9: ScalingNHTSA is proposing injury criteria and performance limits that it believes are appropriate for eachsized dummy. The limits were scaled based on the limited existing biomechanical data for the varioussizes to maintain a regulation with a consistent level of protection for all occupants. The agencyrequested comments on what risk levels are acceptable, what factors should be considered in selectingperformance limits for different test requirements, and how uncertainties related to injury criteria shouldbe addressed, especially with respect to children.
Comments Received:
A few commenters (NTSB, AAMA, Honda) stated that the scaling procedures proposed in theNPRM needed modifications. The National Transportation Safety Board states that the scalingprocedures used in developing the performance limits for the various dummies seems overlysimplistic and potentially inappropriate. However, the NTSB did not provide an alternativeprocedure for scaling. The AAMA provided an alternative set of scaling techniques, which arediscussed in the appropriate chapters of this document. Honda stated that additional scientificdebate and further biomechanical testing is needed to improve scaling techniques beforeimplementing them as new requirements.
A number of commenters (Trauma Link, Advocates for Highway Safety) suggested that due toincreased susceptibility to injury and uncertainties in the development of injury criteria forchildren, the performance limits should be more conservative for children. Trauma Link statedthat children experience significantly different injuries and injury constellations than adults (e.g.more brain swelling), additional funding for research on pediatric mechanical properties andinjury tolerances is needed. Trauma Link suggests that the proposed criteria should beconsidered as interim criteria that should be re-evaluated and updated on a regular basis. Advocates for Highway Safety supports separate, scaled injury criteria performance limits forthe various dummy sizes based on the view that children are susceptible to injury at lower levelimpacts than adults. Advocates believes that for any area of uncertainty, performance limitsshould be set in favor or assuring greater protection for infants and children. Thus, Advocatesbelieves that maintaining the same level of the risk of injury for children and for adults is not anappropriate policy.
Response to Comments:Based on the comments received and discussions at the public meetings, the agency hasadopted more stringent scaling techniques for the injury criteria performance limits for the childdummies, as discussed in detail in section 1-2.

Appendix B
Tabulated Results from Analyses of AvailableNHTSA Test Data

The injury measures for each body region were calculated and compared for a wide variety oftests available in the NHTSA database. Analyses were conducted for data from 30 mph FMVSS No.208 compliance tests, 35 mph NCAP tests, 48 kmph rigid barrier and 40 kmph offset deformable barriertests with 5th percentile female dummies, and out-of-position tests with the 6-year old and 5th percentilefemale dummies. The test data are listed in the following tables according to the test type and the occupantposition (driver or front seat passenger).
For the head region, HIC15 injury criteria proposed in this SNPRM and HIC36 proposed in theNPRM (Docket 98 4405-9) are listed for each test. For the neck, the maximum SNPRM Nij (proposedin this SNPRM) and the maximum NPRM Nij (proposed in the NPRM NHTSA Docket 1998-4405-9)are listed. Also listed for the neck region are the maximum tension, compression and shear forces inNewtons and the maximum extension and flexion moments in Newton-meters. For the chest region, themaximum chest deflection in millimeters, the 3-msec clip value of resultant chest acceleration in g’s,maximum chest velocity in m/s, and CTI-V2 (Version of CTI presented in this SNPRM: Equation 4.2 andTable 4-5) are listed. For the lower extremities, the maximum right and left femur force in Newtons arelisted, where applicable.
The performance limits for the injury measures corresponding to the ATD under consideration arepresented above each column. The performance limits for HIC15, SNPRM Nij, chest acceleration, chestcompression, and femur force for different dummy sizes are those recommended in this SNPRM forregulation purpose and are listed in Table 6-1. The performance limit for HIC36 and NPRM Nij fordifferent dummy sizes are as presented in NPRM NHTSA Docket 1998-4405-9. Although CTI-V2 hasnot been recommended for regulation purpose in this SNPRM, it is used as a comparison to the individualchest deflection and chest acceleration performance limits for analysis purposes. The individualperformance limits for maximum neck tension, compression, flexion, and extension for the 50th percentilemale are from the current FMVSS No. 208 neck injury performance limits using the alternative sled test,while those for other dummy sizes are from AAMA recommendations for out-of-position occupants.
A vehicle is said to pass a certain injury measure if the performance limit for the injury measure isgreater or equal to the maximum computed value of the injury measure. In each table, summary statisticsare presented for each injury measure such as average value of the injury measure, number of vehicles intable with computed injury measures, the number of vehicles that pass the injury measure performancelimit, and the percentage passing rate of the vehicles for that injury measure. The summary statistics areused to compare the performance of the different injury measures for each body region.


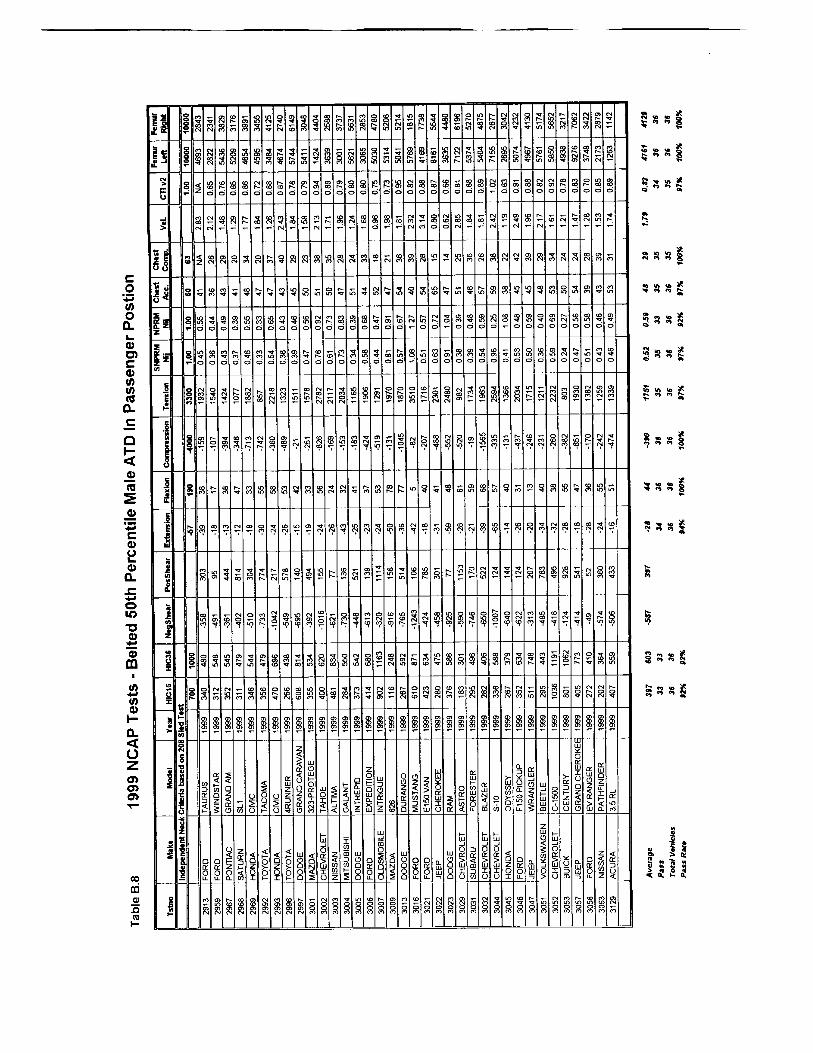


Appendix C
Application of Proposed Nij Neck InjuryCriteria to Available NHTSA Test Data

C-1
Calculations of Nij were made for a wide variety of test data available in the NHTSA database.Analyses were conducted for data from NCAP tests for both drivers and passengers, FMVSS 208unbelted 30 mph rigid barrier crash tests with 1998 and 1999 model year vehicles, 25 mph offset testswith 5th percentile female drivers and passengers, 30 mph rigid barrier tests with 5th percentile femaledrivers, and out-of-position tests for 6 year old and 5th percentile female dummies. Results from thesetests are presented here and are included in tabular format in Appendix B.
Comparisons between the Nij combined neck injury criteria and the suggested performance limitssubmitted by the AAMA for out-of-position occupants are shown for the different types of dataanalyzed. Two points are plotted for each test, corresponding to each set of injury criteria. The pointcorresponding to the Nij criteria, labeled with a é, is located at the values of axial load (FZ) andflexion/extension bending moment (MY) which yield the maximum value for Nij. It is important to realizethat these values for FZ and MY are concurrent in time and are not necessarily equal to the maximaduring the entire event. The point corresponding to the AAMA proposed values for out-of-position,labeled with a ï, is located at the overall maximum values of axial load and bending moment. The twovalues that determine this point are independent of time, and do not necessarily occur at the same time.It is also important to notice that shear load is not included on this plot.
Since the AAMA independent point always represents the overall maxima while the Nij point doesnot, it is impossible for the Nij point to be located further from the origin than the AAMA independentpoint. To help identify the matched sets of points, they have been joined together by a line. If the linesegment is short, and the points lie essentially on top of one another, it implies that the Nij maximumvalue occurs close to the same time as the independent maxima. If the line segment is long, this indicatesthat the Nij maximum occurs at a much different time than the independent maxima.
The thick broken rectangle in the figures represents the AAMA proposal for neck injury criteria foraxial load and bending moment in out-of-position testing. The AAMA’s suggested independent limitsfor tension, compression, flexion and extension which are the same as those used currently for the 50th
percentile male in the alternative sled test option, with the exception of the extension value. TheAAMA’s proposed a limit in extension for the 50th percentile male is 77 N-m for out-of-position testingand 96 N-m for in-position testing, which are higher than the 57 N-m used currently for the sled test. The AAMA reasoned that for in-position testing because the occupant would be aware of the crashand would tense the neck muscles, the performance limits could be raised for tension and extension. However, the agency has determined that it is not prudent to raise these limits because not alloccupants, especially passengers, may be aware of an impending crash and furthermore because therewas little scientific data to support the large increase in the extension tolerance to 96 N-m. Thus, thelimit of 77 N-m is plotted for the extension limit for the 50th percentile male. The solid “kite” shaperepresents the Nij = 1.0 criteria, corresponding to a 22% risk of an AIS$3 injury. The vertices for eachregion shown on the plot are scaled for each different dummy size. Data points lying within either thebox or kite are considered to pass the corresponding criteria.
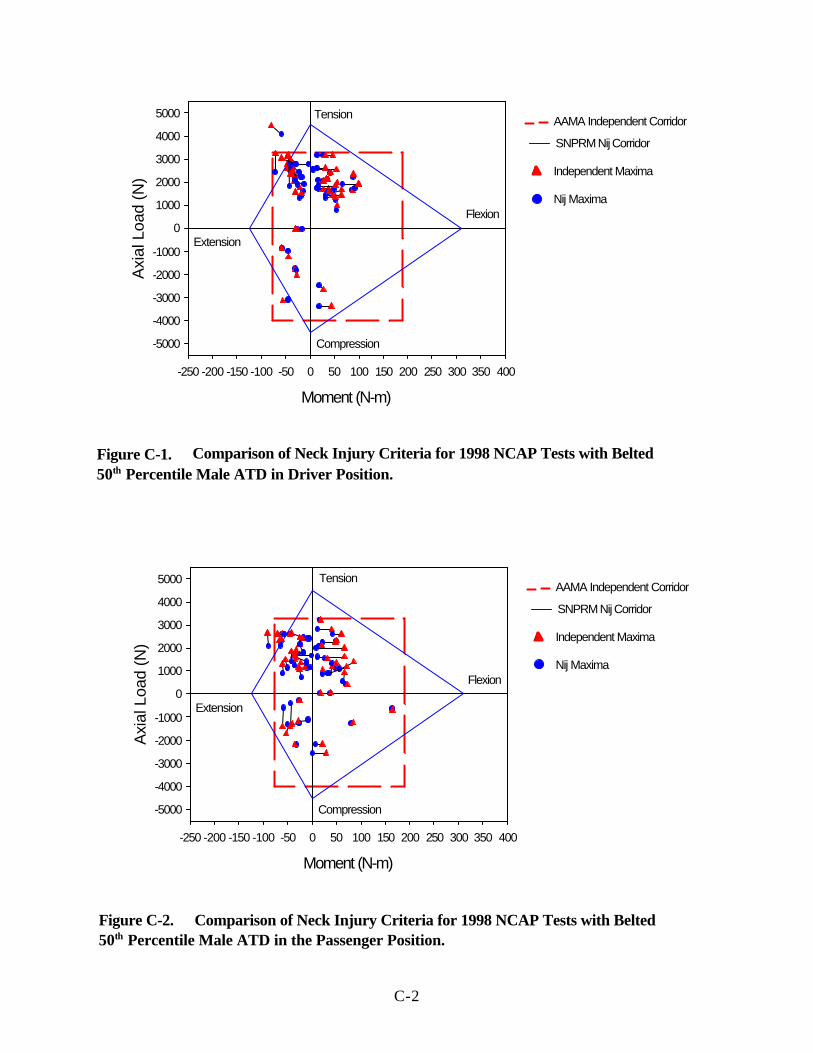
C-2
Moment (N-m)
-250 -200 -150 -100 -50 0 50 100 150 200 250 300 350 400
Axi
al L
oad
(N)
-5000
-4000
-3000
-2000
-1000
0
1000
2000
3000
4000
5000
Flexion
Compression
Extension
Nij Maxima
Independent Maxima
AAMA Independent Corridor
SNPRM Nij Corridor
Tension
Figure C-1. Comparison of Neck Injury Criteria for 1998 NCAP Tests with Belted 50th Percentile Male ATD in Driver Position.
Moment (N-m)
-250 -200 -150 -100 -50 0 50 100 150 200 250 300 350 400
Axi
al L
oad
(N)
-5000
-4000
-3000
-2000
-1000
0
1000
2000
3000
4000
5000
Flexion
Compression
Extension
Nij Maxima
Independent Maxima
AAMA Independent Corridor
SNPRM Nij Corridor
Tension
Figure C-2. Comparison of Neck Injury Criteria for 1998 NCAP Tests with Belted 50th Percentile Male ATD in the Passenger Position.

C-3
Moment (N-m)
-250 -200 -150 -100 -50 0 50 100 150 200 250 300 350 400
Axi
al L
oad
(N)
-5000
-4000
-3000
-2000
-1000
0
1000
2000
3000
4000
5000
Flexion
Compression
Extension
Nij Maxima
Independent Maxima
AAMA Independent Corridor
SNPRM Nij Corridor
Tension
Figure C-3. Comparison of Neck Injury Criteria for 1999 NCAP Tests with Belted 50th Percentile Male ATD in the Driver Position.
Moment (N-m)
-250 -200 -150 -100 -50 0 50 100 150 200 250 300 350 400
Axi
al L
oad
(N)
-5000
-4000
-3000
-2000
-1000
0
1000
2000
3000
4000
5000
Flexion
Compression
Extension
Nij Maxima
Independent Maxima
AAMA Independent Corridor
SNPRM Nij Corridor
Tension
Figure C-4. Comparison of Neck Injury Criteria for 1999 NCAP Tests with Belted 50th Percentile Male ATD in the Passenger Position.

C-4
Moment (N-m)
-250 -200 -150 -100 -50 0 50 100 150 200 250 300 350 400
Axi
al L
oad
(N)
-5000
-4000
-3000
-2000
-1000
0
1000
2000
3000
4000
5000
Flexion
Compression
Extension
Nij Maxima
Independent Maxima
AAMA Independent Corridor
SNPRM Nij Corridor
Tension
Figure C-6. Comparison of Neck Injury Criteria for 1998-1999 Unbelted 208 Barrier Crash Tests for Vehicles using 50th Percentile Male ATD in the Passenger Position.
Moment (N-m)
-250 -200 -150 -100 -50 0 50 100 150 200 250 300 350 400
Axi
al L
oad
(N)
-5000
-4000
-3000
-2000
-1000
0
1000
2000
3000
4000
5000
Flexion
Compression
Extension
Nij Maxima
Independent Maxima
AAMA Independent Corridor
SNPRM Nij Corridor
Tension
Figure C-5. Comparison of Neck Injury Criteria for 1998-1999 Unbelted 208 Barrier Crash Tests for Vehicles using 50th Percentile Male ATD in the Driver Position.

C-5
Figure C-7. Comparison of Neck Injury Criteria for Transport Canada 48 KMPH for 1998-1999 Vehicles Belted with 5th Percentile Female ATD in the Driver Position.
Figure C-8. Comparison of Neck Injury Criteria for Transport Canada 48 KMPH for 1998-1999 Vehicles Belted with 5th Percentile Female ATD in the Passenger Position.

C-6
Moment (N-m)
-150 -100 -50 0 50 100 150 200
Axi
al L
oad
(N)
-5000
-4000
-3000
-2000
-1000
0
1000
2000
3000
4000
5000
Flexion
Compression
Extension
Nij Maxima
Independent Maxima
AAMA Independent Corridor
SNPRM Nij Corridor
Tension
Figure C-9. Comparison of Neck Injury Criteria for Transport Canada 40% Offset Tests for 1998-1999 Vehicles Belted with 5th Percentile Female ATD in the Driver Position.
Moment (N-m)
-150 -100 -50 0 50 100 150 200
Axi
al L
oad
(N)
-5000
-4000
-3000
-2000
-1000
0
1000
2000
3000
4000
5000
Flexion
Compression
Extension
Nij Maxima
Independent Maxima
AAMA Independent Corridor
SNPRM Nij Corridor
Tension
Figure C-10. Comparison of Neck Injury Criteria for Transport Canada 40% Offset Tests for 1998-1999 Vehicles Belted with 5th Percentile Female ATD in the Passenger Position.

C-7
Moment (N-m)
-150 -100 -50 0 50 100 150 200
Axi
al L
oad
(N)
-5000
-4000
-3000
-2000
-1000
0
1000
2000
3000
4000
5000
Flexion
Compression
Extension
Nij Maxima
Independent Maxima
AAMA Independent Corridor
SNPRM Nij Corridor
Tension
Figure C-11. Comparison of Neck Injury Criteria for 1999 NHTSA Unbelted 208 with 5th Percentile Female ATD in the Driver Position.
Moment (N-m)
-150 -100 -50 0 50 100 150 200
Axi
al L
oad
(N)
-5000
-4000
-3000
-2000
-1000
0
1000
2000
3000
4000
5000
Flexion
Compression
Extension
Nij Maxima
Independent Maxima
AAMA Independent Corridor
SNPRM Nij Corridor
Tension
Figure C-12. Comparison of Neck Injury Criteria for 1999 NHTSA Unbelted 208 with 5th Percentile Female ATD in the Passenger Position.

C-8
Moment (N-m)
-150 -100 -50 0 50 100 150 200
Axi
al L
oad
(N)
-5000
-4000
-3000
-2000
-1000
0
1000
2000
3000
4000
5000
Flexion
Compression
Extension
Nij Maxima
Independent Maxima
AAMA Independent Corridor
SNPRM Nij Corridor
Tension
Figure C-13. Comparison of Neck Injury Criteria for Out-of-Position Tests with 5th Percentile Female Hybrid III Dummy in Position-1 Driver Position.
Moment (N-m)
-150 -100 -50 0 50 100 150 200
Axi
al L
oad
(N)
-5000
-4000
-3000
-2000
-1000
0
1000
2000
3000
4000
5000
Flexion
Compression
Extension
Nij Maxima
Independent Maxima
AAMA Independent Corridor
New Nij Corridor
Tension
Figure C-14. Comparison of Neck Injury Criteria for Out-of-Position Tests with 5th Percentile Female Hybrid III Dummy in Position-2 Driver Position.

C-9
Moment (N-m)
-150 -100 -50 0 50 100 150 200
Axi
al L
oad
(N)
-6000
-5000
-4000
-3000
-2000
-1000
0
1000
2000
3000
4000
5000
Flexion
Compression
Extension
Nij Maxima
Independent Maxima
AAMA Independent Corridor
SNPRM Nij Corridor
Tension
Figure C-16. Comparison of Neck Injury Criteria for Out-of-Position Tests for 1996-1999 with Hybrid III 6YO Dummy in Position-2 at 0 inches
Moment (N-m)
-300 -250 -200 -150 -100 -50 0 50 100 150 200
Axi
al L
oad
(N)
-7000-6000
-5000-4000-3000-2000-1000
01000200030004000
500060007000
Flexion
Compression
Extension
Nij Maxima
Independent Maxima
AAMA Independent Corridor
SNPRM Nij Corridor
Tension
Figure C-15. Comparison of Neck Injury Criteria for Out-of-Position Tests for 1996-1999 with Hybrid III 6YO Dummy in Position-1 at 0 inches

C-10
Moment (N-m)
-250 -200 -150 -100 -50 0 50 100 150 200
Axi
al L
oad
(N)
-4000
-3000
-2000
-1000
0
1000
2000
3000
4000
5000
6000
7000
Flexion
Compression
Extension
Tension
Nij Maxima
Independent Maxima
AAMA independent
SNPRM Nij Corridor
MAIS=5
MAIS=5
MAIS=3
MAIS=1
MAIS=1
Figure C-17. Comparison of Neck Injury Criteria for Hybrid III 6YO Dummy Data from NASS and SCI Case Reconstructions.

Appendix D
Application of Proposed Thoracic InjuryCriteria to Available NHTSA Test Data

D-1
The thoracic injury criteria were calculated for a wide variety of tests available in the NHTSA database. Analyses were conducted for data from 30 mph FMVSS No. 208 compliance tests, 35 mph NCAPtests, 48 kmph rigid barrier and 40 kmph offset tests with 5th percentile female dummies, and out-of-position test with the 6 year-old, and 5th percentile female dummies. The results are presented in atablular form in Appendix B.
In the following figures, the 3 msec clip chest acceleration and the maximum sternal chest deflectionmeasured by the dummy are plotted on the x and y axes, respectively. The solid lines represent thelimits for the two proposed thoracic injury critieria. These are (1) the 3 ms clip acceleration is less thanor equal to Ac and (2) the maximum chest deflection is less than or equal to Dc, where Ac and Dc arelisted in Table D.1.
Table D.1. Scaled Deflection and Acceleration Values for Various Occupant Sizes
Value Mid-SizedMale
SmallFemale
6 Year Old 3 YearOld
12 MonthOld
Chest DeflectionLimit for ThoracicInjury (Dc)
63 mm(2.5 in)
52 mm(2.0 in)
40 mm(1.6 in)
34 mm (1.3 in)
30 mm**(1.2 in)
Chest AccelerationLimit for ThoracicInjury Criteria (Ac)
60 60* 60 55+ 50*+
* Although geometric scaling alone would predict higher A c values for females, it is believed that lower bone mineraldensity would offset this effect. Therefore, the acceleration tolerance values for small females are kept the same asfor mid-sized males.** The CRABI 12 month old dummy is currently not capable of measuring chest deflection.

D-2
0
20
40
60
80
ches
t def
lect
ion
(mm
)
0 20 40 60 80 3 msec clip chest acceleration (g's)
pre-1998 vehicles 1998-99 vehicles
0
10
20
30
40
50
60
70
ches
t def
lect
ion
(mm
)
0 20 40 60 80 3 msec clip chest acceleration (g's)
pre-1998 vehicles 1998-99 vehicles
Figure D-1. 1996 to 1999 NCAP crash tests with the ATD in the driver position andperformance limits for chest acceleration and deflection for the 50th percentilemale dummy. The passing rate for the dummy in the driver position is 90%.
Figure D-2. 1996 to 1999 NCAP crash tests with the ATD in the passenger position andperformance limits for chest acceleration and deflection for the 50th percentilemale dummy. The passing rate for the dummy in the driver position is 93%.

D-3
0
10
20
30
40
50
60
70
ches
t def
lect
ion
(mm
)
0 10 20 30 40 50 60 70 3 msec clip chest acceleration (g's)
pre-1998 vehicles 1998-99 vehicles
0
10
20
30
40
50
60
70
ches
t def
lect
ion
(mm
)
0 10 20 30 40 50 60 70 3 msec clip chest acceleration (g's)
pre-1998 vehicles 1998-99 vehicles
Figure D-3. 1996 to 1999 FMVSS 208 crash tests with the ATD in the driver position andperformance limits for chest acceleration and deflection for the 50th percentilemale dummy. The passing rate for the dummy in the driver position is 98%.
Figure D-4. 1996 to 1999 FMVSS 208 crash tests with the ATD in the driver position andperformance limits for chest acceleration and deflection for the 50th percentilemale dummy. The passing rate for the dummy in the driver position is 93%.

D-4
0
10
20
30
40
50
60
Che
st D
efle
ctio
n (m
m)
0 10 20 30 40 50 60 70 Chest Acceleration (g's)
0
10
20
30
40
50
60
Che
st D
efle
ctio
n (m
m)
0 10 20 30 40 50 60 70 Chest Acceleration (g's)
Figure D-5. 1998 - 1999 FMVSS 208 type crash tests with the belted 5th percentile femaleHybrid III dummy in the driver position and the performance limits for chestacceleration and deflection for the 5th percentile female dummy. The passing ratefor the dummy in the driver position is 100%.
Figure D-6. 1998 - 1999 FMVSS 208 type crash tests with the belted 5th percentile femaleHybrid III dummy in the passenger position and the performance limits for chestacceleration and deflection for the 5th percentile female dummy. The passing ratefor the dummy in the passenger position is 96%.

D-5
0
10
20
30
40
50
60
Che
st D
efle
ctio
n (m
m)
0 10 20 30 40 50 60 70 Chest Acceleration (g's)
0
10
20
30
40
50
60
Che
st D
efle
ctio
n (m
m)
0 10 20 30 40 50 60 70 Chest Acceleration (g's)
Figure D-7. 1998 - 1999 vehicle offset crash tests with the 5th percentile female dummy inthe driver position and the performance limits for chest acceleration anddeflection for the 5th percentile female dummy. The passing rate for the dummy inthe driver position is 100%.
Figure D-8. 1998 - 1999 vehicle offset crash tests with the 5th percentile female dummy inthe passenger position and the performance limits for chest acceleration anddeflection for the 5th percentile female dummy. The passing rate for the dummy inthe passenger position is 100%.

D-6
0
10
20
30
40
50
60
ches
t def
lect
ion
(mm
)
0 10 20 30 40 50 60 70 3 msec clip chest acceleration (g's)
0
10
20
30
40
50
60
ches
t def
lect
ion
(mm
)
0 10 20 30 40 50 60 70 3 msec clip chest acceleration (g's)
Figure D-9. 1996 - 1999 air bag systems with the 5th percentile female dummy in the OOPPosition-1 Condition and the performance limits for chest acceleration anddeflection for the 5th percentile female dummy. The passing rate for the dummy inthe OOP Position 1 condition is 100%.
Figure D-10. 1996 - 1999 air bag systems with the 5th percentile female dummy in the OOPPosition 2 Condition and the performance limits for chest acceleration anddeflection for the 5th percentile female dummy. The passing rate for the dummy inthe OOP Position-2 condition is 100%.

D-7
0
10
20
30
40
50
60
70
ches
t def
lect
ion
(mm
)
0 20 40 60 80 100 3 msec clip chest acceleration (g's)
0
10
20
30
40
50
60
70
ches
t def
lect
ion
(mm
)
0 10 20 30 40 50 60 70 3 msec clip chest acceleration (g's)
Figure D-11. 1996 -1999 air bag systems with the 6-year old Hybrid III dummy in the OOPPosition 1 tests and the performance limits for chest acceleration and deflectionfor the 6 year-old dummy. The chest has zero clearance from the instrumentpanel. The passing rate for the dummy in this OOP condition is 26%.
Figure D-12. 1996 -1998 air bag systems with the 6-year old Hybrid III dummy in the OOPPosition 2 tests and the performance limits for chest acceleration and deflectionfor the 6 year-old dummy. The chest has a 4 inch clearance from the instrumentpanel. The passing rate for the dummy in this OOP condition is 75%.

D-8
0
10
20
30
40
50
60
70
ches
t def
lect
ion
(mm
)
0 10 20 30 40 50 60 70 3 msec clip chest acceleration (g's)
0
10
20
30
40
50
ches
t def
lect
ion
(mm
)
0 20 40 60 80 100 3 msec clip chest acceleration (g's)
Figure D-13. 1996 -1998 air bag systems with the 6-year old Hybrid III dummy in the OOPposition 1 tests and the performance limits for chest acceleration and deflectionfor the 6 year-old dummy. The chest has an eight inch clearance from theinstrument panel. The passing rate for the dummy in this OOP condition is 90%.
Figure D-14. 1999 air bag systems with the 6-year old Hybrid III dummy in the OOP Position2 tests and the performance limits for chest acceleration and deflection for the 6year-old dummy. The head has zero clearance from the instrument panel. Thepassing rate for the dummy in this OOP condition is 43%.

Appendix E
Statistical Analysis Procedures forDeveloping Injury Risk Curves from
Biomechanical Test Data

E-1
Statistical Analysis Procedures for Developing Injury Risk Curves fromBiomechanical Test Data
IntroductionIn impact biomechanics tests, the injury outcome, which is in general nominal, is the dependent
variable and the independent variables are the impact levels and other response variables. Specimencharacteristics and test conditions are the confounders. For conditions where the specimen sustains aninjury, the injury threshold of the specimen is lower than the applied risk factor level and vice versa. The objective of analysis procedures are to (1) identify a risk factor or a combination of risk factorswhich have the highest injury predictive ability among all other factors; (2) identify confounders andcontrol for them; and (3) estimate the cumulative probability of injury curve of the population using theidentified risk factors.
Analysis ProceduresThree popular methods of analysis of biomechanical test data are (1) Logistic Regression, (2)
Mertz-Weber method, and (3) Certainty method. A brief description of each procedure is providedbelow:
Logistic Regression: This procedure uses the maximum likelihood method to estimate theparameters of the assumed distribution so that the probability of getting the values of thedependent variable in the data sample is as high as possible. Regression methods are versatile,well established procedures where it is easy to handle different types of data simultaneously. This method provides good diagnostics on the goodness of fit and predictive ability of models. The method allows good control of confounders and interaction effects. The method requiresthe assumption of a distribution which may result in loss of statistical power.
Mertz-Weber Method: The Mertz-Weber method assumes that the injury threshold levels arenormally distributed. The injured specimen with the lowest applied risk factor is defined as theweakest specimen and the uninjured specimen with the highest applied risk factor is defined asthe strongest specimen. The mean of the threshold level distribution is the average of the riskfactor associated with the weakest and strongest specimens. The standard deviation of thedistribution is estimated using a median rank table where the number of observations betweenthe weakest and strongest specimen associated risk levels are taken into consideration. TheMertz-Weber method essentially uses only two observations from a data sample. Therefore,there is significant loss of statistical power. The method provides no diagnostics on goodness offit or predictive ability of models. The method only works with one continuous variable at atime so it offers no control of confounding or interaction effects.
Certainty Method: The Certainty Method is an empirical technique where data is categorized into two groups. At a prescribed level of the risk factor, injured data with associated risk factorbelow the prescribed level and uninjured data with associated risk factor above the prescribed

E-2
level are categorized in the “certainty group” . The rest of the data is categorized in the“uncertainty group”. The probability of injury at the prescribed threshold level is obtained usingonly the data in the certainty group. Since this method discards information in the uncertaintygroup, there is loss in statistical power. This method also offers no diagnostics on the goodnessof fit and predictive ability of the model. It is difficult to control for confounding and interactioneffects using this method.
Simulation Study:A simulation was conducted to compare the performance of the three analysis procedures:
logistic regression, Mertz-Weber method, and the certainty method. For these simulations, specimenswere randomly selected from a population with a Gaussian failure threshold distribution (µ=65 ands =25) as shown in Figure E-1. Each specimen was then subjected to a risk factor level (applied force)which was selected randomly from a uniform distribution ranging between 20 and 120, as shown inFigure E-2. If the applied force level for a specimen exceeded its failure threshold level, then thatspecimen was considered to have failed. If the applied force for a specimen did not exceed its failurethreshold level, then that specimen was considered to have not failed. Left and right censoredobservations were obtained in this manner. Table E.1 presents one such data set where the appliedforce, the specimen failure threshold level, and the failure outcome (failure=1 and non-failure=0) areprovided. In this data set, the failure data point with the lowest dose level is not the “weakestspecimen” as noted in the Mertz/Weber method. Also, the non-failure data point with the highest doselevel is not the “strongest specimen”.
Initially, samples with 100 observations were simulated. Figures E-3 to E-8 are the results ofthree such simulations. In each case, the probability of injury curve from logistic regression moreclosely reflects the actual failure threshold curve of the population than does the curve generated usingthe Mertz-Weber method and the certainty method. The Mertz-Weber and certainty methods alwaysunderestimate the variance in the data. Note that in simulation 4 (Figure E-4), the Mertz-Weberderived probability curve is significantly different from the actual probability of injury and the logisticregression and certainty method derived probability curve. Since the Mertz-Weber method uses onlytwo data points, it is significantly influenced by outliers as in this data set, where there is a failure at alow applied force of 29.
Next, the effect of sample size on the estimate of the population failure threshold levels wasexamined by changing the size of the sample. The sample size was changed from 50 to 200observations by adding or removing random observations from the sample from simulation 5. For asample size of 50 observations, all three methods of analysis are not accurate (Figure E-6) thoughlogistic regression still is the closest estimate of the population parameters at low applied force level. The logistic regression curve is a better estimate of the population threshold curve than the certainty andMertz-Weber methods for a sample size of 100 observations (Figure E-7). For a sample size of 200observations, the curve derived from logistic regression is almost identical to the population cumulativedistribution of failure threshold (Figure E-8). There is not much change in the probability of injurycurves derived from the Mertz-Weber and Certainty methods as the sample size is increased. Sincethe Mertz-Weber and Certainty methods do not employ all the observations in estimating the

E-3
population parameters, there is not much effect of sample size on their parameter estimates.The log-likelihood value (the log of the probability of getting the data in the sample) is an
estimate of the goodness of fit of the data. This log-likelihood or LogL value is the highest for thelogistic regression curve (Table E-2) for each of the simulations. This suggests that the logisticregression curve best represents the data in the sample. Note that the actual threshold curve has alower likelihood value than the logistic regression curve. This is because the sample size is small and thedistribution of injury threshold levels in the sample is not the same as that of the population.
Estimation of Failure Threshold Levels:Consider the situation where an applied force level corresponding to a 20% probability of
failure of the population is of interest. The applied force corresponding to a 20% probability of failureobtained from logistic regression and the Mertz-Weber method for each of the simulation is shown inTable E-3. The average dose level at 20% probability of failure for the first six simulations (100observations) from the Mertz-Weber method is 52.48 and for the certainty method is 52.2. This isconsiderably higher than the dose level of 43.95 for a 20% probability of failure of the population inconsideration. The dose level at 20% probability of failure from logistic regression for the first 6simulations is 45.87 which is closer to that of the population than the Mertz-Weber method.
The average of the population probability of failure which corresponds to the dose level at 20%probability of failure from the Mertz-Weber and certainty methods is 31% as compared to 22.3% fromlogistic regression. This implies that the Mertz-Weber and certainty methods grossly underpredicts theprobability of failure at lower dose levels and so threshold levels selected at low probability of failureusing the Mertz-Weber method may not offer adequate protection.
Only six simulations were considered here. It is expected that as the number of simulations isincreased, the average dose level at 20% probability of failure from logistic regression would be almostthe same as that of the population. However, the corresponding dose level from the Mertz-Webermethod will still be higher than that of the population.
When the sample size is increased to 200 observations (simulation 7), the dose level at 20%probability of failure from logistic regression is almost the same as that of the population while theMertz-Weber method still has a higher corresponding dose level.
Table E.1: Data from Simulation 5
dose actual threshold
failure outcome
117.662 61.836 1 38.385 85.666 0 23.816 96.762 0 41.878 11.237 1 Z weakest specimen
100.504 79.528 1 43.168 101.644 0
119.029 47.284 1 105.454 57.293 1 48.495 43.334 1

E-4
51.547 62.907 0 118.615 88.910 1 119.070 66.904 1 37.392 49.398 0 37.529 68.925 0 88.043 69.840 1
113.657 56.224 1 61.720 69.801 0 51.463 74.760 0 90.040 70.918 1
107.490 83.041 1 71.091 85.642 0 60.352 79.601 0 59.199 59.946 0 61.864 39.564 1 57.267 83.311 0
100.067 44.686 1 64.669 97.837 0 74.527 84.110 0 69.013 71.581 0
103.141 47.896 1 86.849 51.151 1 38.870 99.016 0 60.836 116.968 0
105.344 121.826 0 Mertz defined strongest specimen28.105 63.425 0 64.678 77.452 0
117.050 38.974 1 25.761 110.173 0 93.706 101.713 0 35.692 76.699 0 96.843 17.697 1
111.121 90.813 1 52.397 71.339 0
102.822 49.575 1 119.454 118.224 1 96.582 59.973 1 96.440 75.849 1 58.997 38.696 1 48.978 68.314 0 69.296 54.083 1 59.823 57.468 1
102.777 76.403 1 45.092 47.939 0 87.985 97.208 0 70.341 44.000 1
115.085 103.438 1 23.810 66.824 0 95.661 32.636 1 35.471 33.959 1 Mertz defined weakest specimen33.781 87.519 0

E-5
45.987 77.327 0 63.021 75.814 0 86.050 97.745 0 49.383 49.846 0 58.681 73.547 0 59.710 53.660 1 48.557 77.516 0
107.655 82.580 1 20.873 70.497 0 98.853 79.540 1 41.600 76.241 0 76.213 105.321 0 28.694 78.560 0 87.152 49.821 1
104.419 45.165 1 117.950 68.108 1 28.737 93.466 0
113.396 24.117 1 66.884 78.924 0
112.471 43.332 1 79.955 100.935 0 97.764 56.058 1 40.733 16.129 1 47.371 33.388 1 39.570 42.536 0 71.309 74.224 0 45.738 70.984 0 28.553 95.541 0 41.627 85.186 0 92.658 124.640 0 Z strongest specimen95.623 24.022 1
105.921 57.262 1 45.929 64.692 0
113.825 53.071 1 33.966 62.577 0 28.637 69.669 0 83.246 63.893 1 70.058 57.108 1 72.312 69.651 1 29.696 110.722 0

E-6
Table E.2: Log-likelihood values for the sample in each simulation.
Simulation No. samplesize n
actualthreshold
Logistic Mertz-weber Certainty
simulation 1 100 -51.29 -50.51 -57.64 -59.73
simulation 2 100 -39.61 -39.37 -42.08 -41.75
simulation 3 100 -43.55 -43.26 -52.42 -48.41
simulation 4 100 -37.47 -36.06 -47.03 -36.97
simulation 5 100 -44.52 -43.08 -50.79 -46.35
simulation 6 100 -35.29 -34.05 -39.2 -37.12
simulation 5 50 -21.2 -19.83 -22.13 -21.21
simulation 5 75 -33.38 -31.87 -36.49 -34.08
simulation 5 150 -64.36 -64.37 -76.76 -69.61
simulation 5 200 -87.37 -87.96 -107.39 -97.04
Table E.3: Dose levels at 20 % probability of failure from Mertz-Weber method and logisticregression and the probability of failure of the population at the dose levels corresponding to 20%probability of failure from the Mertz-Weber method and logistic regression.
Force at 20% Probability of Failure Actual Probability of Injury from Forces inColumns 2, 3, and 4
Column 2M-W
Column 3Logistic
column 4certainty
M-W Logistic Certainty
Simulation 1 57.83 41.61 55.8 0.387 0.175 0.36
Simulation 2 51.63 46.99 54.0 0.296 0.235 0.33
Simulation 3 52.96 38.12 46.3 0.315 0.141 0.23
Simulation 4 46.78 52.47 55.0 0.233 0.308 0.34
Simulation 5 57.87 50.93 54.5 0.388 0.287 0.34
Simulation 6 47.80 45.12 47.8 0.246 0.213 0.25
Average 52.48 45.87 52.2 0.311 0.223 0.31
Simulation 7 57.21 44.0 52.2 0.377 0.2 0.3
* The dose level at 20% probability of failure of the population under consideration (µ=65 and s =25) is 43.95.

E-7
0
0.002
0.004
0.006
0.008
0.01
0.012
0.014
0.016
Prob
abili
ty
0 20 40 60 80 100 120 140 Failure Threshold
Figure E-1. Probability distribution of failure threshold levels in the population
0
0.002
0.004
0.006
0.008
0.01
0.012
0.014
0.016
Pro
babi
lity
0 20 40 60 80 100 120 140 Applied force
Figure E-2. Probability distribution of applied risk factor

E-8
0 0.1 0.2 0.3 0.4 0.5 0.6 0.7 0.8 0.9
1
prob
abili
ty o
f inj
ury
0 20 40 60 80 100 120 risk factor
logistic actual strength certainty mertz
Figure E-4. Results of analysis of data set from simulation 4 with 100 observations.
0 0.1 0.2 0.3 0.4 0.5 0.6 0.7 0.8 0.9
1
prob
abili
ty o
f in
jury
0 10 20 30 40 50 60 70 80 90 100 110 120 risk factor
Logistic actual Mertz certainty
Figure E-3. Results of analysis of data set from simulation 1 with 100 observations.
E-9
0 0.1 0.2 0.3 0.4 0.5 0.6 0.7 0.8 0.9
1
prob
abili
ty o
f inj
ury
0 20 40 60 80 100 120 risk factor
logistic actual strength certainty mertz
Figure E-6 . Results of analysis of data set from simulation 5 with 100 observations.
0 0.1 0.2 0.3 0.4 0.5 0.6 0.7 0.8 0.9
1
prob
abili
ty o
f inj
ury
0 20 40 60 80 100 120 risk factor
actual logistic Mertz certainty
Figure E-5. Results of analysis of data set from simulation 5 with 50 observations.
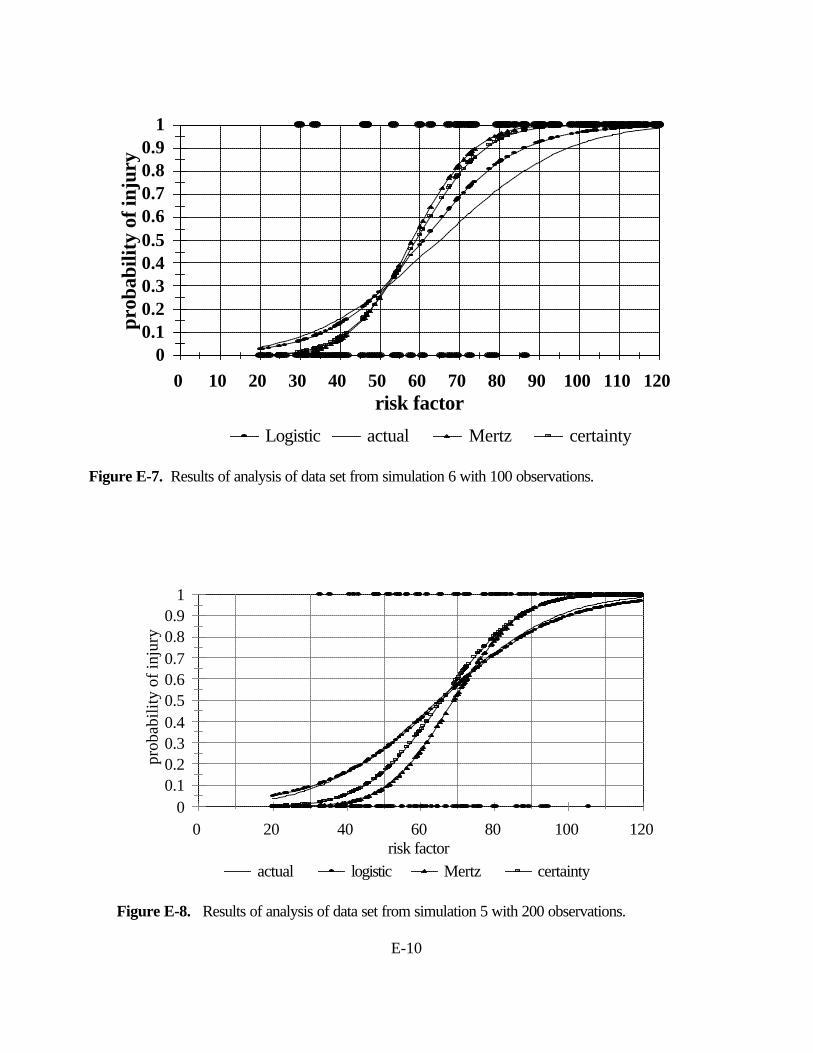
E-10
0 0.1 0.2 0.3 0.4 0.5 0.6 0.7 0.8 0.9
1 pr
obab
ility
of i
njur
y
0 10 20 30 40 50 60 70 80 90 100 110 120 risk factor
Logistic actual Mertz certainty
Figure E-7. Results of analysis of data set from simulation 6 with 100 observations.
0 0.1 0.2 0.3 0.4 0.5 0.6 0.7 0.8 0.9
1
prob
abili
ty o
f inj
ury
0 20 40 60 80 100 120 risk factor
actual logistic Mertz certainty
Figure E-8. Results of analysis of data set from simulation 5 with 200 observations.
E-11
Conclusion:Results of the simulation study showed that1. Logistic regression is more accurate in estimating the population threshold levels than the
certainty method or the Mertz-Weber method. 2. The accuracy of the estimates using logistic regression increased with increase in sample size.
Sample size did not have much effect on the other two methods of analysis.3. Mertz-Weber and the Certainty methods result in a significant loss of power due to loss of
information. Therefore, the population parameters were not estimated accurately even for largesample size.
4. The Mertz-Weber and the certainty methods underestimate the standard deviation of thepopulation distribution. Therefore, at low levels of risk factor, these methods underestimate theprobability of injury.
5. The estimated risk factor levels at low probability of injury (<40%) using the Mertz-Weber andthe Certainty methods is always higher than the actual levels in the population. Therefore, thesemethods overestimate the population injury threshold levels.
6. Due to the improved accuracy of estimation of population parameters and the greater versatilityof logistic regression to handle different types of variables, to control for confounding, toaccount for interaction between independent variable, and to provide better diagnostics, logisticregression is the choice of analysis of biomechanical impact test data.

Appendix F
Age-dependent Neck Scale Factors

F-1
Appendix F: Age-dependent Neck Scale Factors Based on Geometrical andSpine Component Data under Tension, Extension, Compression, andFlexion
Srirangam Kumaresan, Narayan Yoganandan, Frank A. Pintar Department of Neurosurgery, Medical College of Wisconsin
and the Department of Veterans Affairs Medical CenterMilwaukee, WI
This document presents the method used to calculate the scale factors for the neck of one,three, and six year old children, and 5th percentile adult female and 50th percentile adult male undertension, extension, compression, and flexion. The variations in the mechanical properties of each spinalcomponent (e.g., vertebra, discs, ligaments, cartilage, spinal cord, and muscles) were combined withthe neck overall geometrical parameters [1-12]. Material property data were obtained from literatureand in-house tests conducted at the MCW under each load vector. The active components of the spinewere identified, and a statistically based relationship was established for each component that related itsmaterial property to age. The data were normalized with respect to the adult, and a mean valuerepresenting the material scale factor was obtained. This material scale factor was combined with thegeometrical scale factors (Appendix F(a)). For example, at a specific age, under compression, materialproperties of the vertebra, disc, and cartilage were averaged to obtain a materially scaled factor usingthe adult male as standard. The overall neck cross-sectional area factor for this age was multiplied bythe above-determined material factor to obtain the combined scaling factor. Similar procedures wereadopted for tension, extension, and flexion. The derived scale factors using this combined spinalmaterial and geometrical approach as a function of age and loading mode are given in Table F-1. Thespinal component material property data for the 5th percentile adult female and 50th percentile adultmale were considered standard because skeletal maturity is completely achieved for these adult groups.
Table F.1: Scale factors as a function of loading mode derived from combined spinal componentmaterial and geometrical analysis.
Age/Group Tension Extension Compression Flexion1 year 0.26 0.22 0.26 0.233 years 0.29 0.32 0.28 0.336 years 0.35 0.41 0.34 0.42
5th female 0.63 0.70 0.63 0.7050th male 1.00 1.00 1.00 1.00

F-2
References:1. Breig A. Biomechanics of the central nervous system. Some basic normal and pathological
phenomena. Stockholm: Almqvist & Wiksell International, 1960.2. Duncan J: "Laboratory note: On tensile strength of fresh adult foetus." Brit Med J. 2:763-764,
1874.3. Galante J: "Tensile properties of human lumbar anulus fibrosus." Acta Ortho Scand :100, 1967.4. Gilsanz V, Varterasian M, Senac M, Cann C: "Quantitative spinal mineral analysis in children."
Ann Radiol. 29(3/4):380-382, 1986.5. Myklebust JB, Pintar FA, Yoganandan N, Cusick JF, Maiman DJ, et al.: "Tensile strength of spinal
ligaments." Spine. 13(5):526-531, 1988.6. Nachemson A, Evans J: "Some mechanical properties of third lumbar inter-laminar ligament
(ligamentum flavum)." J Biomech. 1:211-217, 1968.7. Pintar F, Yoganandan N, Gennarelli T. Head and neck tension biomechanical models for pediatric
and small female populations. 43rd AAAM. Barcelona, Spain, 1999:357-366.8. Pintar FA. Biomechanics of Spinal Elements [Doctoral Dissertation]. Milwaukee, WI: Marquette
University, 1986. 222 pp.9. Scher A: "Trauma of spinal cord in children." S Afr Med J. 50:2023-2025, 1976.10. Tkaczuk H: "Tensile properties of human lumbar longitudinal ligaments." Acta Orthop Scand.:
115, 1968.11. Yamada H. Strength of Biological Materials. Baltimore, MD: Williams & Wilkins, F.G. Evans, ed.
1970.12. Yoganandan N, Kumaresan S, Pintar F, Genneralli T. "Pediatric biomechanics." In: Accidental
Injury, A. Nahum and J. Melvin, eds.. New York: Springler-Verlag, In press.
Acknowledgment: This study was supported in part by DOT NHTSA Grant DTNH22-93-Y-17028, and the Department
of Veterans Affairs Medical Center Research.

F-3
APPENDIX F(a)
Scale Factors under Tension (λΤ)
Table F(a).1: Material Effect of Active Spinal Component (λ M)
1 year 3 years 6 years 5th female 50th maleVertebrae 0.79 0.77 0.77 1.0 1.0Disc 0.68 0.7 0.73 1.0 1.0Cartilage 0.79 0.81 0.84 1.0 1.0Ligament - ALL (AAOM) 0.84 0.87 0.89 1.0 1.0
- PLL (TM) 0.84 0.87 0.89 1.0 1.0- ISL 0.84 0.87 0.89 1.0 1.0- CL 0.84 0.87 0.89 1.0 1.0- LF (AOM) 0.76 0.78 0.81 1.0 1.0
Spinal cord 0.41 0.44 0.49 1.0 1.0Neck muscles 0.54 0.58 0.63 1.0 1.0Average 0.733 0.756 0.783 1.0 1.0
Table F(a).2 : Geometrical Effect of Overall neck cross-sectional area ratio (λ G)λG
1 year 0.353 years 0.396 years 0.455th female 0.6350th male 1.0
Table F(a).3 : Combined Material and Geometry Effect (λ T = λM x λG)λT
1 year 0.263 years 0.296 years 0.355th female 0.6350th male 1.0

F-4
Scale Factors under Extension (λE)
Table F(a).4 : Material Effect of Active Spinal Component (λM)
1 year 3 year 6 years 5th female 50th maleVertebrae 0.79 0.77 0.77 1.0 1.0Disc 0.68 0.70 0.73 1.0 1.0Cartilage 0.79 0.81 0.84 1.0 1.0Ligament - ALL 0.84 0.87 0.89 1.0 1.0
- PLL 0.84 0.87 0.89 1.0 1.0Spinal cord 0.41 0.44 0.49 1.0 1.0Neck muscles 0.54 0.58 0.63 1.0 1.0Average 0.699 0.72 0.749 1.0 1.0
Table F(a).5:Geometrical Effect of Overall neck cross-sectional area and length ratio (λG)
area neck length Average (λ G)1 year 0.35 0.29 0.323 years 0.39 0.50 0.456 years 0.45 0.66 0.565th female 0.63 0.76 0.6350th male 1.0 1.0 1.0
Table F(a).6 : Combined Material and Geometry Effect (λE = λM x λG)λE
1 year 0.223 years 0.326 years 0.415th female 0.750th male 1.0

F-5
Scale Factors under Compression (λC)
Table F(a).7 : Material Effect of Active Spinal Component (λM)1 year 3 years 6 years 5th female 50th male
Vertebrae 0.79 0.77 0.77 1.0 1.0Disc 0.68 0.70 0.73 1.0 1.0Cartilage 0.67 0.70 0.74 1.0 1.0Average 0.71 0.72 0.75 1.0 1.0
Table F(a).8 : Geometrical Effect of Overall neck cross-sectional area ratio (λG)λ G
1 year 0.353 years 0.396 years 0.455th female 0.6350th male 1.0
Table F(a).9 : Combined Material and Geometry Effect (λC = λM x λG)λ C
1 year 0.253 years 0.286 years 0.345th female 0.6350th male 1.0

F-6
Scale Factors under Flexion (λF)
Table F(a).10 : Material Effect of Active Spinal Component (λM)
1 year 3 years 6 years 5th female 50th maleVertebrae 0.79 0.77 0.77 1.0 1.0Disc 0.68 0.7 0.73 1.0 1.0Cartilage 0.79 0.81 0.84 1.0 1.0Ligament - ISL 0.84 0.87 0.89 1.0 1.0
- CL 0.84 0.87 0.89 1.0 1.0- LF 0.76 0.78 0.81 1.0 1.0
Spinal cord 0.41 0.44 0.49 1.0 1.0Neck muscles 0.54 0.58 0.63 1.0 1.0Average 0.706 0.728 0.756 1.0 1.0
Table F(a).11:Geometrical Effect of Overall neck cross-sectional area and length ratio (λG) Area Length Average (λ G)
1 year 0.35 0.29 0.323 years 0.39 0.50 0.456 years 0.45 0.66 0.565th female 0.63 0.76 0.750th male 1.0 1.0 1.0
Table F(a).12 : Combined Material and Geometry Effect (λF = λM x λG)λF
1 year 0.233 years 0.336 years 0.425th female 0.750th male 1.0

Appendix G
SNPRM Nij Program Listing

G-1
// nij_v9.cpp//--------------------------------------------------------------// SNPRM Nij (Version 9) Reference Implementation//// This code is a reference implementation of the SNPRM Nij injury criteria// this was written for purposes of clarity and no consideration has been made for speed. style,// or efficiency. The Standard C++ library was used to avoid any confusion due to c-style// memory allocation.//// Program Input:// This program requires input of three ascii x-y files, where each line of the input// file contains two floating point values, one for the time and one for the y value//// *** All three files must have the same number of points and the same time data ***// *** All input data must be unfiltered and will be filtered within this program//// Additionally, the program queries for the dummy size and whether the condyle correction factor // is to be applied//// Program Output:// The Nij injury criteria, the time of Peak injury//--------------------------------------------------------------#include <iostream>#include <fstream>#include <vector>#include <ctype.h>
using namespace std;typedef vector <double> DBLVECTOR;
#include "bwfilt.h" // bwfilt implementation
// declarationsbool ReadAsciiFile ( char *filename, DBLVECTOR &x, DBLVECTOR &y);void VectorMax( float &Max, float &MaxTime, DBLVECTOR &time, DBLVECTOR &fVector);void VectorMin( float &Min, float &MinTime, DBLVECTOR &time, DBLVECTOR &fVector);double FindTimeStep( DBLVECTOR &time );
int main( int argv, char *argc[]){
DBLVECTOR tx, ty, tz, xForce, yMoment, zForce;char szbuf[255];
// read in the filename for the x axiscout << "Enter file Name for X axis Force Data: "<< endl;cin >> szbuf;if ( !ReadAsciiFile(szbuf, tx, xForce) ){
cout << "Error X axis data File" << endl;exit (0);
}

G-2
// read in the filename for the y axiscout << "Enter file Name for Y axis Moment Data: "<< endl;cin >> szbuf;if ( !ReadAsciiFile(szbuf, ty, yMoment) ){
cout << "Error Y axis data File" << endl;exit (0);
}
// read in the filename for the x axiscout << "Enter file Name for Z axis Force Data: "<< endl;cin >> szbuf;if ( !ReadAsciiFile(szbuf, tz, zForce) ){
cout << "Error Z axis data File" << endl;exit (0);
}
// make sure all three files have identical time dataif ( (tx.size() != ty.size()) || (tx.size() != tz.size()) ){
cout << "Time data does not match between Axes" << endl;exit (0);
}int i;for (i=0; i<tx.size(); i++){
if ( (tx[i]!=ty[i]) || (tx[i]!=tz[i]) ){
cout << "Time data does not match between Axes" << endl;exit (0);
}}
// clear two of the time arrays - not needed any longerty.erase(ty.begin(), ty.end() );tz.erase( tz.begin(), tz.end() );
// find the time step, and make sure that it is constant (within 1%)double del = FindTimeStep( tx );if (del<=0.0){
cout << "Could not find a constant time step for the data" << endl;exit(0);
}
// Filter the data - assume unfiltered databwfilt( xForce, del, 600);bwfilt( zForce, del, 1000);bwfilt( yMoment, del, 600);

G-3
// Select the dummy typeint nDummyType=0;cout << "1 - CRABI 12 month old Dummy" << endl;cout << "2 - Hybrid III - 3 Year old Dummy" << endl;cout << "3 - Hybrid III - 6 Year old Dummy" << endl;cout << "4 - Hybrid III - 5th % female Dummy" << endl;cout << "5 - Hybrid III - 50th % male Dummy" << endl;cout << "6 - Hybrid III - 95th % male Dummy" << endl;cout << endl << "Enter Dummy Type :";cin >> nDummyType;if ( (nDummyType <=0) || (nDummyType > 6) ){
exit( 0 );}
// set the critical values based on the dummy typedouble CVt, CVc, mCVf, mCVe, fCondyle;switch (nDummyType){case 1: // CRABI 12 month old Dummy
CVt = 1465.0;CVc = 1465.0;mCVf = 43.0;mCVe = 17.0;fCondyle = 0.0058;break;
case 2: // Hybrid III - 3 Year old DummyCVt = 2120.0;CVc = 2120.0;mCVf = 68.0;mCVe = 27.0;fCondyle = 0.0;break;
case 3: // Hybrid III - 6 Year old DummyCVt = 2800.0;CVc = 2800.0;mCVf = 93.0;mCVe = 39.0;fCondyle = 0.01778;break;
case 4: // Hybrid III - 5th % female DummyCVt = 3370.0;CVc = 3370.0;mCVf = 155.0;mCVe = 62.0;fCondyle = 0.01778;break;
case 5: // Hybrid III - 50th % male DummyCVt = 4500.0;CVc = 4500.0;mCVf = 310.0;

G-4
mCVe = 125.0;fCondyle = 0.01778;break;
case 6: // Hybrid III - 95th % male DummyCVt = 5400.0;CVc = 5400.0;mCVf = 415.0;mCVe = 166.0;fCondyle = 0.01778;break;
}
// prompt for Condyle Correctioncout << "Correct for Occipital Condyle Offset (" << fCondyle << ") Y / N ?" << endl;char yesNo;cin >> yesNo;yesNo = toupper( yesNo );
// compute the normalized dataDBLVECTOR Tension, Compression, Flexion, Extension;for (i=0; i<tx.size(); i++){
if (zForce[i] > 0 ){
Tension.push_back( zForce[i] / CVt ); // TensionCompression.push_back( 0.0f );
}else{
Compression.push_back( -zForce[i] / CVc ); // CompressionTension.push_back( 0.0f );
}
// Condyle Correctionif (yesNo == 'Y'){
yMoment[i] -= xForce[i] * fCondyle;}
if (yMoment[i] > 0 ){
Flexion.push_back( yMoment[i] / mCVf ); // FlexionExtension.push_back( 0.0f );
}else{
Extension.push_back( -yMoment[i] / mCVe ); // ExtensionFlexion.push_back( 0.0f );
}}

G-5
// find the maximums and the time of the maximumfloat maxTension, maxCompression, maxShear, minShear;float maxFlexion, maxExtension;float tTension, tCompression, tShearmax, tShearmin;float tFlexion, tExtension;VectorMax( maxTension, tTension, tx, Tension);VectorMax( maxCompression, tCompression, tx, Compression);VectorMax( maxShear, tShearmax, tx, xForce);VectorMin( minShear, tShearmin, tx, xForce);VectorMax( maxFlexion, tFlexion, tx, Flexion);VectorMax( maxExtension, tExtension, tx, Extension);
// Output the Maximumscout << "Maximum Shear \t" << maxShear << "\tat " << tShearmax << " ms" << endl;cout << "Minimum Shear \t" << minShear << "\tat " << tShearmin << " ms" << endl;cout << "Maximum Tension \t" << maxTension*CVt << "\tat " << tTension << " ms" << endl;cout << "Maximum Compression\t"<<maxCompression*CVc <<"\tat "<<tCompression<<" ms" << endl;cout << "Maximum Flexion \t" << maxFlexion*mCVf << "\tat " << tFlexion << " ms" << endl;cout << "Maximum Extension \t" << maxExtension*mCVe<< "\tat " << tExtension << " ms" << endl;cout << endl;
// Compute the Nij ValuesDBLVECTOR Ntf, Nte, Ncf, Nce;for (i=0; i<tx.size(); i++){
if ( (Tension[i] > 0.0) && (Flexion[i]>0.0) )Ntf.push_back( Tension[i] + Flexion[i] );
elseNtf.push_back( 0.0 );
if ( (Tension[i] > 0.0) && (Extension[i]>0.0) )Nte.push_back( Tension[i] + Extension[i] );
elseNte.push_back( 0.0 );
if ( (Compression[i] > 0.0) && (Flexion[i]>0.0) )Ncf.push_back( Compression[i] + Flexion[i] );
elseNcf.push_back( 0.0 );
if ( (Compression[i] > 0.0) && (Extension[i]>0.0) )Nce.push_back( Compression[i] + Extension[i] );
elseNce.push_back( 0.0 );
}
// save the Max Value and the Time of the Max Valuefloat maxNtf, maxNte, maxNcf, maxNce;float tNtf, tNte, tNcf, tNce;VectorMax( maxNtf, tNtf, tx, Ntf );VectorMax( maxNte, tNte, tx, Nte );

G-6
VectorMax( maxNcf, tNcf, tx, Ncf );VectorMax( maxNce, tNce, tx, Nce );
// Output the resultscout << "Maximum Ntf\t" << maxNtf << "\tat " << tNtf << " ms" << endl;cout << "Maximum Nte\t" << maxNte << "\tat " << tNte << " ms" << endl;cout << "Maximum Ncf\t" << maxNcf << "\tat " << tNcf << " ms" << endl;cout << "Maximum Nce\t" << maxNce << "\tat " << tNce << " ms" << endl;cout << endl;
return 0;}
bool ReadAsciiFile ( char *szFilename, DBLVECTOR &x, DBLVECTOR &y){
ifstream inFile;
inFile.open( szFilename );if (inFile.fail() ){
return false;}
double xTemp, yTemp;while ( !inFile.eof() ){
inFile >> xTemp >> yTemp;// check for errorsif (inFile.fail() ){
// input failed - save the data we already have and return;if (x.size() > 0)
break;// no data was read - return an errorreturn false;
}x.push_back( xTemp );y.push_back( yTemp );
}// close the fileinFile.close();return true;
}
void VectorMax( float &Max, float &timeMax, DBLVECTOR &time, DBLVECTOR &fVector){
Max = timeMax = 0.0f;for (int i=0; i<fVector.size(); i++){
if (fVector[i] > Max){

G-7
Max = fVector[i];timeMax = time[i]*1000.0f;
}}
}
void VectorMin( float &Min, float &timeMin, DBLVECTOR &time, DBLVECTOR &fVector){
Min = timeMin = 0.0f;for (int i=0; i<fVector.size(); i++){
if (fVector[i] < Min){
Min = fVector[i];timeMin = time[i]*1000.0f;
}}
}
double FindTimeStep( DBLVECTOR &time ){
// make sure there is dataif ( time.size()<=2)
return 0.0;
double del = time[1]-time[0];double test;double tError = 0.01*del; // allow a 1% deviation in time stepfor (int i=2; i<time.size(); ++i){
test = time[i] - time[i-1];if ( test<=0)
// check for errors - time must be monotonically increasingreturn 0.0;
else if ( abs(test-del) > tError)return 0.0;
}return del;
}
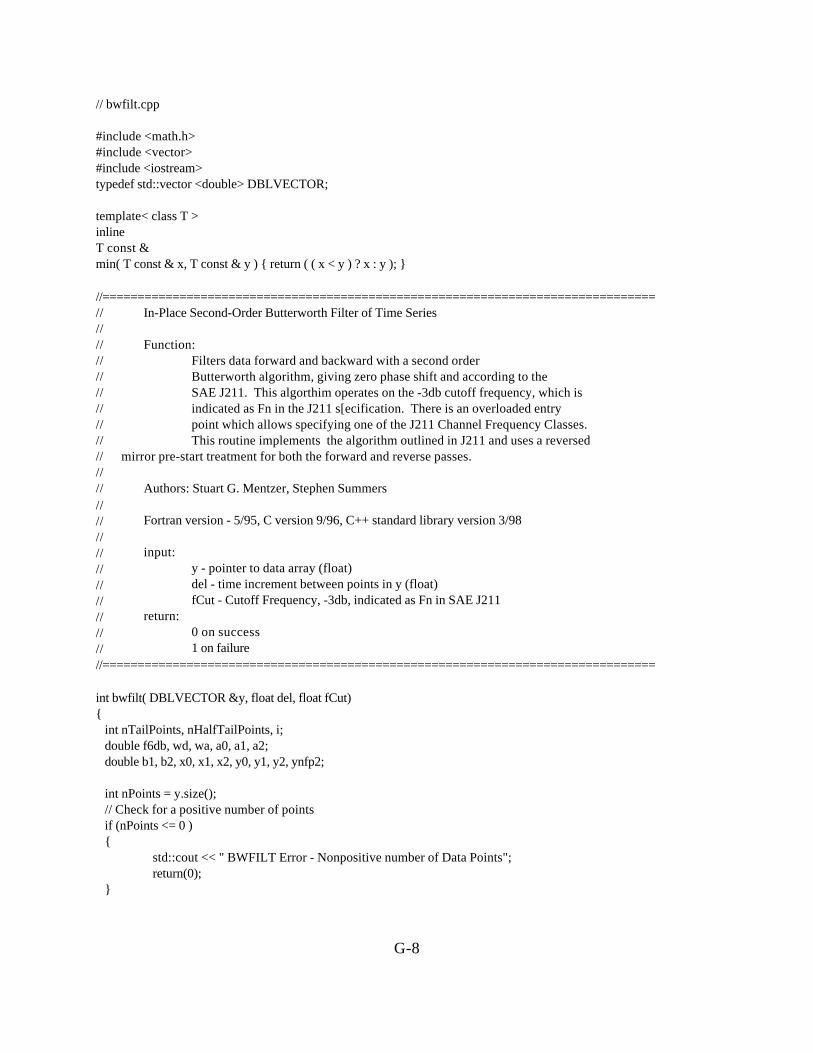
G-8
// bwfilt.cpp
#include <math.h>#include <vector>#include <iostream>typedef std::vector <double> DBLVECTOR;
template< class T >inlineT const &min( T const & x, T const & y ) { return ( ( x < y ) ? x : y ); }
//===============================================================================// In-Place Second-Order Butterworth Filter of Time Series//// Function:// Filters data forward and backward with a second order// Butterworth algorithm, giving zero phase shift and according to the// SAE J211. This algorthim operates on the -3db cutoff frequency, which is // indicated as Fn in the J211 s[ecification. There is an overloaded entry // point which allows specifying one of the J211 Channel Frequency Classes.// This routine implements the algorithm outlined in J211 and uses a reversed // mirror pre-start treatment for both the forward and reverse passes.//// Authors: Stuart G. Mentzer, Stephen Summers//// Fortran version - 5/95, C version 9/96, C++ standard library version 3/98//// input:// y - pointer to data array (float)// del - time increment between points in y (float)// fCut - Cutoff Frequency, -3db, indicated as Fn in SAE J211// return:// 0 on success// 1 on failure//===============================================================================
int bwfilt( DBLVECTOR &y, float del, float fCut){ int nTailPoints, nHalfTailPoints, i; double f6db, wd, wa, a0, a1, a2; double b1, b2, x0, x1, x2, y0, y1, y2, ynfp2;
int nPoints = y.size(); // Check for a positive number of points if (nPoints <= 0 ) {
std::cout << " BWFILT Error - Nonpositive number of Data Points"; return(0);
}

G-9
// Check positive time step if (del <= 0 ) {
std::cout << " BWFILT Error - Nonpositive time step"; return(0); } // Check positive cutoff frequency if (fCut <= 0 ) {
std::cout << " BWFILT Error - Nonpositive Cutoff Frequency"; return(0); } if ( fCut > (0.5f/del*0.775) ) {
// sampling rate is lower than the cutoff frequency - return true // BwFilt goes unstable as fCut approaches 0.5/del return 1;
} // Set 6dB attenuation frequency f6db = fCut * 1.2465;
// Compute filter coefficients per J211 wd = 6.2831853L * f6db; wa = sin(wd * del * 0.5) / cos(wd * del * 0.5); a0 = wa*wa / (1. + sqrt(2.0)*wa + wa*wa); a1 = 2 * a0; a2 = a0; b1 = -2.0*(wa*wa - 1.0) / (1.0 + sqrt(2.0)*wa + wa*wa); b2 = (-1.0 + sqrt(2.0)*wa - wa*wa) / (1.0 + sqrt(2.0)*wa + wa*wa);
// Set the number of tail points to use nTailPoints = (int)(0.01 / ( min(fCut*0.01, 1.0) * del) + 0.5);
//SAE J211 reccomends at least 10 ms, increase if necessary i = (int) (0.01 / del + 0.5); if (nTailPoints < i)
nTailPoints = i; // regardless of time step and Frequency spec, use at least one point if (nTailPoints < 1) nTailPoints = 1;
// Make sure that enough data points exist for the tail, else cut back tail if (nTailPoints > nPoints) {
//cout << "BWFILT tail length < 10 ms, does not satisfy SAE J211 reccomendation"; nTailPoints = nPoints;
}

G-10
// Set up pre-start array - Inverted mirror ynfp2 = 2 * y[0]; x1 = ynfp2 - y[nTailPoints]; x0 = ynfp2 - y[nTailPoints-1]; y1 = 0.0; nHalfTailPoints = ( nTailPoints / 2 ) + 1; for (i=nHalfTailPoints; i<=nTailPoints; i++) { y1 = y1 + y[i]; } y1 = ynfp2 - ( y1 / ( nTailPoints - nHalfTailPoints + 1 ) ); y0 = y1; for (i=-nTailPoints+2; i<=-1; i++) { x2 = x1; x1 = x0; x0 = ynfp2 - y[-i]; y2 = y1; y1 = y0; y0 = a0*x0 + a1*x1 + a2*x2 + b1*y1 + b2*y2; }
// Filter forward for (i=0; i<nPoints; i++) { x2 = x1; x1 = x0; x0 = y[i]; y2 = y1; y1 = y0; y0 = a0*x0 + a1*x1 + a2*x2 + b1*y1 + b2*y2; y[i] = (float) y0; }
// setup the pre-start array for the backward filter ynfp2 = 2 * y[nPoints-1]; x1 = ynfp2 - y[nPoints -1 -nTailPoints]; x0 = ynfp2 - y[nPoints -2 -nTailPoints]; y1 = 0.0; for (i=nHalfTailPoints; i<=nTailPoints; i++) { y1 = y1 + y[nPoints -1 -i]; } y1 = ynfp2 - ( y1 / ( nTailPoints - nHalfTailPoints + 1 ) ); y0 = y1; for (i=nPoints-nTailPoints+3; i<=nPoints-2; i++) { x2 = x1; x1 = x0; x0 = ynfp2 - y[i]; y2 = y1;

G-11
y1 = y0; y0 = a0*x0 + a1*x1 + a2*x2 + b1*y1 + b2*y2; }
// Filter backwards for (i=nPoints-1; i>=0; i--) { x2 = x1; x1 = x0; x0 = y[i]; y2 = y1; y1 = y0; y0 = a0*x0 + a1*x1 + a2*x2 + b1*y1 + b2*y2; y[i] = (float) y0; }
return(1);}
//// optional entry routine to BWFILT using a channel frequency class.// This routines translates the J211 Channel Frequency Class into // specified cutoff frequency (Fn). //int bwfilt( DBLVECTOR &y, float del, int nClass){
if ( (nClass!= 60) && (nClass!=180) && (nClass!=600) && (nClass!=1000) )std::cout << "Frequency Channel Class is not specified in SAE J211";
return(bwfilt( y, del, (float)(nClass*1.666667) ));}
//// overloaded function definition to allow calling with separate array// pointers so that the original displacement data is not overwritten//int bwfilt( DBLVECTOR &y, DBLVECTOR &yf, float del, float fCut){
for (int i=0; i<y.size(); i++)yf[i] = y[i];
return(bwfilt( yf, del, fCut ));}
// bwfilt.h// butterworth filtering function prototypes//int bwfilt( DBLVECTOR &y, float del, float fCut); // cutoff frequencyint bwfilt( DBLVECTOR &y, float del, int nClass); // channel classint bwfilt( DBLVECTOR &y, DBLVECTOR &yf, float del, float fCut); // no overwrite