development of laser ablation direct analysis in real time ... · development of a laser...
TRANSCRIPT

Development of “Laser Ablation Direct Analysis in Real TimeImaging” Mass Spectrometry: Application to Spatial DistributionMapping of Metabolites Along the Biosynthetic Cascade Leading toSynthesis of Atropine and Scopolamine in Plant TissueKristen L. Fowble,† Kanae Teramoto,‡ Robert B. Cody,§ David Edwards,§ Donna Guarrera,§
and Rabi A. Musah*,†
†State University of New York at Albany, Department of Chemistry, 1400 Washington Avenue, Albany, New York 12222, UnitedStates‡JEOL Ltd., 3-1-2 Musashino, Akishima, Tokyo, Japan 196-8558§JEOL USA Inc., 11 Dearborn Road, Peabody, Massachusetts 01960, United States
*S Supporting Information
ABSTRACT: Methods for the accomplishment of small-molecule imagingby mass spectrometry are challenged by the need for sample pretreatmentsteps, such as cryo-sectioning, dehydration, chemical fixation, or applicationof a matrix or solvent, that must be performed to obtain interpretable spatialdistribution data. Furthermore, these steps along with requirements of themass analyzer such as high vacuum, can severely limit the range of sampletypes that can be analyzed by this powerful method. Here, we report thedevelopment of a laser ablation-direct analysis in real time imaging massspectrometry approach which couples a 213 nm Nd:YAG solid state UV laserto a direct analysis in a real time ion source and high-resolution time-of-flightmass spectrometer. This platform enables facile determination of the spatialdistribution of small-molecules spanning a range of polarities in a diversity ofsample types and requires no matrix, vacuum, solvent, or complicated samplepretreatment steps. It furnishes high-resolution data, can be performed underambient conditions on samples in their native form, and results in little to no fragmentation of analytes. We demonstrate itsapplication through determination of the spatial distribution of molecules involved in the biosynthetic cascade leading toformation of the clinically relevant alkaloids atropine and scopolamine in Datura leichhardtii seed tissue.
Recent significant advancements in imaging mass spec-trometry (IMS) have provided a means whereby spatial
distribution mapping of molecules within plant, animal andhuman tissues can be accomplished.1 In this regard, much ofthe progress has been made in detecting macromolecules suchas proteins, nucleic acids and other polymers, rather than small-molecules. The most well-established methods utilize a matrix-assisted laser desorption ionization (MALDI) source, althoughothers such as secondary ion mass spectrometry (SIMS), liquidextraction surface analysis (LESA), laser ablation inductivelycoupled plasma (LA-ICP), desorption electrospray ionization(DESI), nano-DESI, laser ablation electrospray ionization(LAESI),2 and their derivatives have also been successfullyused for IMS. These approaches are complementary and, ingeneral, each technique has specific sample pretreatment stepsthat if conducted improperly could dramatically impact theamount of useable data that can be acquired.3 For this reason,successful experiments usually involve significant and oftentime-consuming methods development, and this in turn definesthe sample types that can be analyzed. Until recently, the
mapping of small-molecule distributions in biological matrixeswas not easily achieved by these methods for a variety ofreasons.4 Imaging by MALDI was initially challenged by highbackground contributions from the matrix. In DESI analysis,the size of the charged droplet beam was too large relative tothe area analyzed, and the data were poorly resolved. Some ofthese deficiencies have been overcome through advances inmatrix deposition methods, mass analyzer enhancements, andcharged droplet beam size reductions among other develop-ments.4 The continued need for high vacuum (SIMS, MALDI),the requirement of a matrix (MALDI), the need for a solvent(DESI, LAESI) which can be problematic in cases where thesample is sensitive to surface wetting, the optimization ofmultiple experimental parameters associated with ion sourceoperation, ion suppression effects, limitations on the dielectricconstant range of the compounds detected, and the require-
Received: October 21, 2016Accepted: February 24, 2017Published: February 24, 2017
Article
pubs.acs.org/ac
© 2017 American Chemical Society 3421 DOI: 10.1021/acs.analchem.6b04137Anal. Chem. 2017, 89, 3421−3429
ment for sophisticated sample preparation steps such asdehydration, chemical fixation and cryo-sectioning amongothers, present challenges to small-molecule imaging by thesetechniques. Even in cases such as matrix-free laser desorptionionization mass spectrometry (LDI-MS) or SIMS, thesignificant fragmentation of the analytes that occurs limitstheir application.2,5 Although high mass measurementsconducted by these techniques are extremely useful inbiological studies, the need for a technique to routinely mapthe spatial distributions of small-molecules remains. Features ofthis technique could include the ability to (1) analyze thesample under ambient conditions with minimal to no samplepretreatment or need for solvent; (2) image irregular surfaces;(3) obtain high spatial resolution; (4) routinely detect a rangeof molecules of varying polarities; and (5) easily set up theexperiment. In the case of plant tissue in particular, the abilityof the technique to penetrate barriers, such as the cell wall,cuticle, or waxy surfaces, as well as to analyze both fresh anddried samples, would also be highly desirable.We report here the development of a laser ablation direct
analysis in real time imaging mass spectrometry (LADI-MS)platform that features several of the aforementioned advantages,and which can be used for the imaging of tissue distributions ofsmall-molecules in both biological and nonbiological matrixes.The approach couples a UV laser with an ambient ionizationdirect analysis in real time (DART) ion source, interfaced witha time-of-flight (TOF) mass analyzer. Salient advantageousfeatures of the method include little to no sample preparationsteps, the ability to conduct the analysis under ambientconditions, good spatial resolution, the absence of the need forsolvent, the ability to analyze irregularly shaped samples, andthe ability to detect a broad range of molecules spanning thedielectric constant spectrum. The utility of the technique isdemonstrated through illustration for the first time of thedistribution within plant tissue, specifically Datura leichhardtiiseed, of small-molecules related by their involvement in thesequential reactions leading to the production of the clinicallyrelevant alkaloids atropine and scopolamine. The detectedcompounds, several of which have not been previously reportedto be present in the species, are members of the tropanealkaloid class, and are biosynthesized by several members of theSolanaceae family, including Atropa, Brugmansia, Datura,Duboisia, Hyoscyamus, and Mandragora.6−15
■ EXPERIMENTAL SECTIONSeeds. Fifty Datura leichhardtii seeds were purchased from J.
L Hudson, Seedsman (La Honda, CA).Chemicals. High-purity helium was obtained from Airgas
(Albany, NY). Phenylpyruvic acid, phenyllactic acid, andornithine hydrochloride standards were purchased fromKrackeler Scientific (Albany, NY). Scopolamine hydrobromide,atropine, tropinone, phenylalanine, arginine, and 2,5-dihydrox-ybenzoic acid (DHB) were purchased from Sigma-Aldrich (St.Louis, MO). Tropine was purchased from Alfa Aesar(Tewksbury, MA). Trifluoroacetic acid was purchased fromAcros Organics (NJ).Microscopy. A Nikon stereozoom SMZ800 microscope
equipped with a Nikon DS Fi2 microscope camera was used toimage the sagittal and transverse cross sections. Scanningelectron microscopy was achieved using a JSM-IT300LVscanning electron microscope (JEOL USA, Peabody, MA).The seed cross sections were affixed to carbon glue on an SEMsampling block (JEOL USA, Peabody, MA) for imaging.
Sample Preparation for MALDI-MS/MS. An aqueousextract was prepared by slicing three D. leichhardtii seeds in halfusing a razor blade and submerging them in 50 μL of distilledwater. The mixture was sonicated for 30 min. Solutions ofauthentic standards at a concentration of 10 mg/mL were madeusing 1% trifluoroacetic acid in water−acetonitrile (1:1).
MALDI-MS/MS Analysis. A matrix solution comprised of10 mg/mL DHB in acetonitrile and 0.5% trifluoroacetic acid inwater (1:1) was used. A mixture of 1 μL of aqueous seed extractin 10 μL of matrix solution was pipetted onto a stainless steeltarget plate. The sample was then allowed to dry in air. A JMS-S3000 SpiralTOF (JEOL, Tokyo, Japan) equipped with theTOF/TOF option was used for observation of MALDI massspectra. Ions generated by irradiation with a 349 nm Nd:YLFlaser were accelerated at 20 kV. Mass calibration of the seedextract was carried out by internal calibration using 5 peaks ofPEG 200 ([M + Na]+).
Sample Preparation for LADI-MS. A D. leichhardtii seedwas cut in half, transverse wise, using a razor blade. The seedwas deposited on a bed of LOCTITE silicone putty (Westlake,OH) to keep it stable, with the cut face exposed. The putty towhich the seed had been affixed was then mounted on thesample plate within the laser system sample chamber.
LADI-MS Analysis. Ion images were acquired using an ESINWR213 laser imaging system (ESI, Portland, OR) coupledwith a direct analysis in real time (DART)-SVP ion source(IonSense, Saugus, MA) and JEOL AccuTOF mass spectrom-eter (JEOL USA, Peabody, MA). Spectra were collected at arate of 2 scans/s. Spectra in the mass range of 60−800 m/zwere acquired in positive ion mode at 350 °C. The ambientconditions set for the analyses included an orifice 1 voltage of20 V and orifice 2 and ring lens voltages of 5 V each. The ionguide voltage was set to 600 V to allow for the analysis of ionsover m/z 60. The mass spectrometer has a resolving power of6000 fwhm. The rate of helium flow for the DART-SVP ionsource was 2.0 L/min. Calibration was achieved usingpolyethylene glycol (PEG) as a reference standard. Thedimensions of the area to be ablated were selected and thesample surface was ablated from left to right one line scan at atime at a constant velocity. At the end of each row there was awashout delay which served to prevent carry over of ions. It wasarbitrarily set to 10 s, much longer than the actual washout timeof 0.7 s. This was followed by an additional 10 s to allow thelaser to reach the required fluence. TSSPro3 software (ShraderSoftware Solutions) was used for peak calibration anddetermining the peak centroid. Reconstructed ion chromato-grams were created for each of the ions of interest and thenexported to Excel files. The headings of the exported files weremodified to correspond to the Agilent file format. Specifically,the scan numbers were removed and the time labels wereconverted from min to s. These updated Excel files were thenimported into Iolite imaging software (University ofMelbourne, Australia) (https://iolite-software.com/). Thissoftware enabled the coupling of the data file from the massspectrometer to the text file created by the laser system togenerate the ion images shown. Mass spectral analysis,elemental composition determination, and isotope analysiswere performed using Mass Mountaineer software (Mass-spec-software.com, RBC Software, Portsmouth, NH).
Laser Ablation System and LADI-MS Seed Analysis.An ESI NWR213 computer-controlled solid state laser ablationsystem, which included a 213 nm Nd:YAG laser with a spot sizerange of 4−250 μm and a 100 mm × 10 mm, high performance
Analytical Chemistry Article
DOI: 10.1021/acs.analchem.6b04137Anal. Chem. 2017, 89, 3421−3429
3422

TwoVol ablation chamber and high precision x,y-stage wasused. The D. leichhardtii seed cross-section was placed in thesystem’s airtight 800 mL sample chamber, which is mounted ona motorized, computer-controlled x,y-moveable stage. Thestage platform can attain a depth of approximately 2 in.,allowing for thick and irregularly shaped samples to be ablated.The window of the sample chamber is made of glass with anoptical coating to minimize energy loss before the laser beamreaches the surface of the sample. The ESI NWR213 ablationsystem is equipped with a 1 mL ablation cup into which theablation plume is directed from the sample chamber. Transportof the plume to the open air gap between the DART ion sourceand JEOL AccuTOF mass spectrometer inlet was accomplishedusing ultrahigh purity helium flowing at a constant rate into thesample chamber and out through Tygon tubing. Appended tothe tubing was an open ended Corning Pyrex melting pointcapillary tube (VWR, Radnor, PA) positioned at the massspectrometer inlet. The experimental setup is as depicted inFigure 1. Multiple laser parameters were optimized to achievethe strongest MS signals. These included laser beam energydensity (fluence) = 21 J/cm3; frequency = 20 Hz; scan speed =50 μm/s; spot size = 50 × 50 μm2; line width = 45 μm; and Heflow rate = 600 mL/min. The fluence and spot size usedrepresent the minimum values that permitted a sufficientenough amount of the seed to be ablated to detect a strong MSsignal. The spot size was kept as small as possible to provideenough ablated seed material to the inlet, while maintaininggood resolution. The scan rate was chosen to avoidoversampling of a given area on the one hand, while notrastering so quickly as to result in unablated areas. On the basisof the experimental parameters used, the spatial resolutionattained was 110 × 50 μm2 (i.e., [x-spot size + (cell washouttime (0.7 s) × scan speed) + (DART-MS scan rate (1 s/2scans) × scan speed)] × y-spot size).
■ RESULTS AND DISCUSSIONMicroscopy of the Imaged Tissue. To assist with
visualization of the spatial localization of observed masses,light and scanning electron microscopy (SEM) micrographs ofboth sagittal and transverse cross sections of D. leichhardtiiseeds are presented in Figure 2. The mature seed is discoid inshape. The embryo, which is linear, adopts a loop (annular)configuration and is embedded within the endosperm. The seedcoat (testa) is thickened in the region immediately surroundingthe endosperm (an area known as the micropylar endosperm),and there is a cavity between the seed coat and micropylarendosperm. The curvature of the embryo results in theobservation of two circles that are apparent in the transversecross-section, representing the embryonic root (radical) and thestem between the radical and the cotyledon (i.e., thehypocotyl).16 In these representations, the seed is oriented sothat the micropylar testa appears at the top. For the LADI-MSanalysis, a transverse cross-section of the seed was surveyed.
Tropane Alkaloid Biosynthesis. The comprehensivenessof the data set acquired in our experiments (described below),can be appreciated through consideration of what is knownabout the steps in atropine and scopolamine alkaloidbiosynthesis in Solanaceae genera such as Atropa, Brugmansia,Datura, Duboisia, Hyoscyamus and Mandragora. It is believed toproceed by a common pathway that features the steps shown inFigure 3. Either ornithine or arginine can serve as the precursorfrom which putrescine is derived.11,17,18 Transformation ofarginine to putrescine involves the intermediacy of agmatine,18
while formation of putrescine from ornithine is direct.17
Putrescine is converted to N-methylputrescine via the actionof putrescine N-methyltransferase.12 The N-methylated amineis acted upon by N-methylputrescine oxidase which yields 4-methylaminobutanal, an aldehyde that undergoes spontaneouscyclization to form the N-methyl-Δ1-pyrrolium cation.19
Figure 1. LADI mass spectrometry setup. A sample suspended in silicone putty is placed within the sample chamber of an ESI 213 Nd:YAG laserimaging platform. The chamber rests on an automated computer-controlled x,y-stage. Rastering the sample at constant speed beneath the laser pulseresults in an ablation plume, which is transported via helium gas through tubing and directed to the open air space between the DART ion sourceand the inlet of the mass spectrometer.
Analytical Chemistry Article
DOI: 10.1021/acs.analchem.6b04137Anal. Chem. 2017, 89, 3421−3429
3423

Complexation of the cation with acetoacetic acid furnishes 4-(1-methyl-2-pyrrolidinyl)-3-oxobutanoate,15 the immediate pre-cursor of both hygrine6 and tropinone.15,14 Tropinone thenundergoes either tropinone reductase I catalyzed conversion totropine or transformation to pseudotropine,20 which serves asthe precursor to the polyhydroxylated calystegine21 alkaloidsA3, B1, or B2. Condensation of tropine with phenyllactic acidgives littorine.22 Phenyllactic acid is biosynthesized fromphenylalanine via phenylpyruvic acid.23 Through the action ofCYP80F1, littorine is converted into hyoscyamine aldehyde,which serves as the direct precursor of atropine (akahyoscyamine).13 Atropine then undergoes hyoscyamine 6-β-hydroxylase-mediated conversion to scopolamine via 6-β-hydroxyhyoscyamine.24
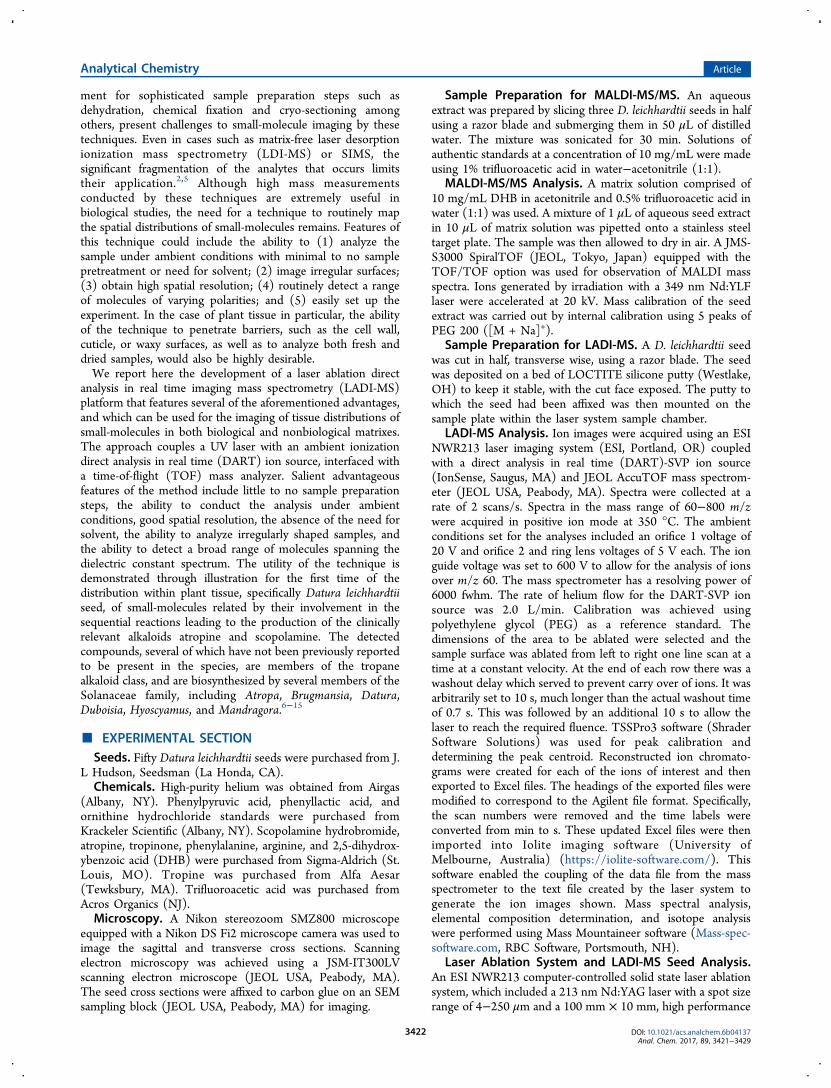
Ion Images Acquired by LADI-MS. Figure 4 shows coloroverlaid ion images acquired from analysis of a transversesection of a D. leichhardtii seed. These thumbnail renderingsshow the spatial distribution of the specified masses with theirassigned molecular identities. They are arranged to emphasizethe relationship to one another of the compounds theyrepresent in the proposed biosynthetic cascade leading to theformation of atropine and scopolamine. The dashed linesurrounding each image indicates the outer edge of the seed
coat, and the 1 mm scale bar shown for arginine applies to allthe ion images. The bar shown at the bottom of each ion imageis a color spectrum (based on the empirical cumulativedistribution function) ranging from black or dark red to yellow,indicating a low or zero intensity to a high relative intensity ofthe indicated ion. The ionization mechanism of DART-MSinvolves proton transfer to the analyte from protonated waterclusters formed through the interaction of DART-derivedmetastable helium with atmospheric water. Thus, moleculeswith proton affinities greater than that of water can be ionizedby this means. Furthermore, all things being equal, the greaterthe proton affinity of a given analyte, the greater will be theintensity of the detected ion. For this reason, relative ionintensities may not necessarily reflect the relative amounts ofdetected species. For example, one analyte may be of lowerconcentration than another, but if the former has a much higherproton affinity than the latter, its peak intensity will be greater.It is for this reason that the ion images shown in Figure 4 arenot presented using the same color scale, as would usually bedone in cases where the relative ion counts reflect the relativeamounts of the detected ions. Thus, the color intensity scale foreach ion image is independent of the others and only representsthe relative intensity of the indicated ion throughout the seedhalf.The mass spectrum depicted in the inset is representative of
the micropylar endosperm, an area dominated by the presenceof the ions represented in the gray panel in Figure 4. Otherareas of the seed, such as the seed coat or embryo, producedspectra whose chemical fingerprint profiles were different fromthose of the micropylar endosperm (data not shown). Themass measurement data for the ions featured in this study areshown in Supporting Information Table S1. With the exceptionof the thumbnail which is enclosed in the black box(representing nominal m/z 381), the images that appear inthe shaded area in Figure 4 represent high-intensity masses ofunknown identity. That which appears in the box features anion that is highly concentrated in the embryo, although it is ofrelatively low intensity. High-resolution masses correspondingto formulas consistent with the presence of protonatedatropine, scopolamine, and the protonated forms of some ofthe intermediates so far reported to be involved in theirbiosynthesis in the Solanaceae (Figure 3) were observed. Insome cases, the availability of authentic standards made itpossible to confirm the tentative structural assignments by high-energy collision induced dissociation MS/MS experimentsconducted using a JMS-S3000 JEOL SpiralTOF massspectrometer (JEOL, Tokyo, Japan). These included theprecursor arginine, the intermediates tropinone and tropine,and the end products atropine and scopolamine. These data arepresented in Supporting Information Figures S1−S6. The ionimages for the molecules confirmed to be present showed thatthey were compartmentalized within the seed tissue. High-resolution masses consistent with the presence of a number ofother compounds known to be associated with tropane alkaloidbiosynthesis such as N-methyl-Δ1-pyrrolium cation, acetoaceticacid, 4-(1-methyl-2-pyrrolidinyl)-3-oxobutanoate, hygrine,pseudotropine, calystegines A3, B1, and B2, littorine, andhyoscyamine aldehyde were also observed. However, theabsence of authentic standards precluded confirmation oftheir presence by MS/MS analysis. High-resolution massesconsistent with ornithine, phenylalanine, phenylpyruvic acid,and phenyllactic acid were also observed. The identities of thesemasses could not be confirmed, however, because their
Figure 2. Light (A and C) and scanning electron microscopy (SEM)micrographs (B and D) of Datura leichhardtii seeds. Sagittal (top) andtransverse (bottom) cross sections are presented. The scale bar shownin white corresponds to 500 μm in both cases.
Analytical Chemistry Article
DOI: 10.1021/acs.analchem.6b04137Anal. Chem. 2017, 89, 3421−3429
3424

intensities, even when using purified authentic standards with avariety of matrixes, were too weak to conduct MS/MSexperiments. Thus, the ion images shown in the top panelare only of those compounds whose identities were confirmedby MS/MS analysis (Supporting Information Figures S1−S6).Figure 5 utilizes artificially shaded SEM micrographs to
provide a color-coded key that highlights the spatial distributionrelationships between the observed masses. In these images,darker colors reflect higher levels of the detected masses.Several compounds were distributed throughout the tissue(indicated by red and pink shading in Figure 5A) including inthe seed coat, all parts of the endosperm, and the visibleembryo (i.e., radical and hypocotyl). Among the ionsrepresented were the end product scopolamine (nominal m/z304.1549) and its precursor atropine (m/z 290.1756). Littorineis a constitutional isomer of atropine. The absence of ananalytical standard of littorine precluded definitive determi-nation of its presence. The orange shading in Figure 5B showsthe area of the amino acid arginine (m/z 175.1195). Itsdistribution was similar to that represented in Figure 5A, withthe exception that it did not appear in the seed coat area thatwas proximal to the nonmicropylar endosperm. Tropine, theprecursor to littorine, was more narrowly distributed, appearingas shown by blue shading in Figure 5C. It was concentrated inthe micropylar testa, micropylar endosperm, and along theperiphery of the endosperm to its midpoint. Tropinone (m/z
140.1075), the precursor of tropine, was distributed similarly(Figure 5, panel C).There were several prominent masses of unknown identity
that were also differentially distributed (see mass spectrum inFigure 4). These included one which appeared in theendosperm perimeter and the micropylar testa (m/z163.0753, Figure 5D), some that were localized to themicropylar testa and the endosperm periphery, with smallamounts in the radical (m/z 131.0492 and 179.0705, Figure5E), one that was distributed throughout the endosperm andhalf of the seed coat (m/z 124.1116, Figure 5F), and one thatwas distributed throughout the tissue except in testa areasbeyond the micropylar region (m/z 197.0812, Figure 5G). Thecompound represented by mass m/z 174.1113, which has thedistribution shown in Figure 5B is also unknown. A mass ofunknown identity at m/z 381.3340 was found to be locatedmostly in the embryo as well as surrounding endosperm andhalf of the seed coat (Figure 5H).Within the past 5 years, a number of reports of MS-based
imaging of seeds have appeared. These include spatial mappingof (1) lipids in Camelina sativa embryos,25 rice grains26 andcotton seeds;27 (2) anthocyanins in black rice grains;28 (3) asubset of amino acids and sugars in wheat;29,30 and (4)hordatines in barley.31 These studies were accomplished byMALDI- or DESI-MS imaging. The method described here isdistinguished from these in that it does not require a matrix,
Figure 3. Proposed pathway for the biosynthesis of atropine and scopolamine in Solanaceae family plants. The enzymes known to be involved in thevarious steps are as follows: a = arginine decarboxylase, b = ornithine decarboxylase, c = agmatine ureohydrolase, d = putrescine N-methyltransferase;e = N-methylputrescine oxidase; f = spontaneous reaction, g = unknown enzyme, h = tropinone reductase I, i = tropinone reductase II, j =phenylalanine deaminase, k = lactate dehydrogenase, l = CYP80F1, m = alcohol dehydrogenase, and n = 6-β-hydroxylase.
Analytical Chemistry Article
DOI: 10.1021/acs.analchem.6b04137Anal. Chem. 2017, 89, 3421−3429
3425
vacuum, or sample pretreatment steps such as cryosectioning,drying, or fixation in gelatin, carboxymethyl cellulose, orpolyethylene glycol.32 Recently, indirect DESI-IMS methodswere used to detect atropine and scopolamine in D. stramoniumleaf tissue,33 malabaricone C in Myristica malabarica seed,34 androhitukline in Dysoxylum binectariferum seed.35 This was doneby creating an imprint of a leaf on a porous surface andscanning the imprint. Although these analyses were accom-plished by an ambient ionization method, the approachcontrasts with ours in that (1) the technique described herecan be used to analyze dry sample surfaces directly with noneed for solvent; and (2) the spot size achieved here was 50 μmand could be reduced to 10 μm. Furthermore, our methodallowed direct analysis of the tissue and did not require solvent.This enabled detection of a much broader range of compounds,including several involved in a common metabolic cascade. IMShas also been accomplished under ambient conditions using anIR-laser coupled to a DART source, in contrast to the UV laserused in this work.36 Another IMS ambient ionization method
that features a low-temperature plasma probe has beenreported.37 Our technique contrasts with theirs in that thelaser spot size used here defines the spatial resolution that canbe achieved, while in their approach, the spatial resolutionattainable is a function of the size of the probe.37 Zhang et al.38
have demonstrated that a platform comprised of a multi-wavelength laser and a DART source, coupled to a massspectrometer can be used to detect dye and drug samplesdirectly from TLC plates. However, its potential imagingcapabilities were not reported.MALDI-MS/MS was used to confirm the identities of several
of the observed masses. However, this technique was notoptimal for the imaging study described here because althoughseveral MALDI matrix compounds were evaluated, the ioncurrent from specific target molecules measured by MALDIdirectly from the seed was too low to obtain high-quality MS/MS data. In addition, it was nearly impossible to consistentlyobtain thin homogeneous slices from the very hard seeds topermit high-quality imaging with the MALDI-TOF/TOF
Figure 4. Color-overlaid ion images acquired from analysis of a transverse section of a D. leichhardtii seed by LADI-MS. The renderings show thespatial distribution of the specified masses. Assignments were confirmed by MS/MS analysis. The images are arranged to emphasize the relationshipto one another of the compounds they represent in the biosynthetic cascade leading to the formation of atropine and scopolamine. The dashed linesurrounding each image marks the outer edge of the seed coat, and the 1 mm scale bar shown for arginine applies to all the ion images. A typicalDART mass spectrum representative of the area dominated by the unknown species (gray panel) is also presented. The mass measurement data forthe ions featured are listed in Supporting Table S1. With the exception of the thumbnail which is enclosed in the black box, the images that appear inthe gray-shaded area represent high-intensity masses of unknown identity. That which appears in the box features an ion (nominal m/z 381), whichunlike the others featured, is highly concentrated in the embryo, although it is of relatively low intensity.
Analytical Chemistry Article
DOI: 10.1021/acs.analchem.6b04137Anal. Chem. 2017, 89, 3421−3429
3426

system. While it may be possible to overcome these limitationswith sufficient effort, we were able to circumvent these andother challenges often encountered with small-moleculeimaging by conventional IMS approaches, by transporting theablation plume created by the laser under atmosphericconditions, through tubing to a DART ion source in openair, and directing the ionized sample to the MS inlet. We choseto use MALDI-MS/MS to confirm the presence of thecompounds of interest from seed extracts, which were muchmore conveniently analyzed by this method and whichprovided higher analyte concentrations and better spectralquality.The assignments made for the compounds represented by
the observed masses are based not only on the observationspresented in this study but also on the very well-establishedchemistry associated with tropane alkaloid biosynthesis inplants, including Datura species.6−15 However, the detailsregarding localization of tropane alkaloid-related compounds inplant tissue is poorly understood. The LADI-MS derived datanot only show that compounds with exact masses consistentwith those established in the literature to be observed in Daturaseeds are present, but it also indicates their specific spatialdistributions in the seed. In addition, the MALDI-MS/MSmeasurements furnished results that were consistent with theassignments for a number of specific compounds in the seedswhose involvement in tropane alkaloid biosynthesis is well-known.
Cell-specific accumulation of alkaloids in plants, a phenom-enon proposed to protect tissues from the often cytotoxiceffects of these compounds, is a well-known occurrence,39,40,9,41
and compartmentalization of scopolamine, atropine, and otherrelated alkaloids in both roots and aerial tissues has beenobserved.42,43 However, visual demonstration of differentialtissue distribution of this range of small-molecules related bytheir involvement in a common metabolic cascade in seeds orother plant tissues has not been reported. The intermediates,enzymes and end products in alkaloid synthesis are thought tobe translocated within cells as well as between different celltypes located in various tissues.44 In Atropa belladonna andHysocyamus muticus plants, the enzymes required for thebiosynthesis of the alkaloids atropine and scopolamine arelocated differentially throughout the plant tissue.41 The twoenzymes located at the first and last steps of the biosyntheticcascade are found in the plant roots, while enzymes involved inintermediate steps are located within different cell types. Thus,their alkaloid substrates are accordingly differentially distrib-uted, and some trafficking must occur between tissues and celltypes in order for the biosynthetic cascade leading to alkaloidend products to progress. Previous reports have demonstratedthat tropane alkaloid biosynthesis occurs in the roots10 and thatthe compounds are subsequently translocated to other plantparts in low amounts. Since they appeared in highconcentrations in the seeds, they are either transported thereduring seed development, synthesized within the seed during its
Figure 5. Illustration of differential distribution of detected ions as color overlays on the SEM micrograph of the transverse cross-section of the D.leichhardtii seed shown in Figure 2. The scale bar shown in white represents 500 μm and corresponds to all panels. The shading in each case showsthe spatial distribution of various ions, with darker colors indicating greater ion intensity. (Panel A) m/z 290.1756 (atropine and/or littorine), m/z304.1549 (scopolamine); (Panel B) m/z 174.1113 (unknown), m/z 175.1195 (arginine); (Panel C) m/z 140.1075 (tropinone), m/z 142.1232(tropine); (Panel D) m/z 163.0753 (unknown); (Panel E) m/z 131.0492 (unknown), m/z 179.0705 (unknown); (Panel F) m/z 124.1116(unknown); (Panel G) m/z 381.3340 (unknown); (Panel H) m/z 197.0812 (unknown).
Analytical Chemistry Article
DOI: 10.1021/acs.analchem.6b04137Anal. Chem. 2017, 89, 3421−3429
3427

development, or perhaps both. Although it has been postulatedthat the alkaloids have a chemical defense function,7,45 oneintriguing possibility is that they are required for seedgermination. In support of this hypothesis, it has been observedthat during germination of D. stramonium seeds, the amounts ofatropine and scopolamine decrease immediately after the seedsare moistened with water and drop to undetectable levels until4 days after germination, at which point the levels increasedramatically.46 Since neither compound was detected in thegermination medium, it was suggested that these alkaloids werein some way utilized in metabolic processes related to thegrowth of the cotyledon. Further studies will be required toinvestigate this hypothesis.
■ CONCLUSIONS
The method described here permits access to small-moleculeion images of tissues in a fashion that circumvents some of theinherent challenges of other IMS methods. Because of thecapabilities of the DART source, no vacuum, solvent, fixatives,matrix, or ion beam was required. Flat samples could be affixedto carbon tape for analysis, and oddly shaped samples such asthe seeds that were surveyed here could be suspended insilicone putty to keep them level and immovable. The lowerlimit of the laser spot size for which the molecules of interestwere readily detected by the mass analyzer used here was 10μm (data not shown). The setup was comprised entirely ofcommercially available components, and it was easy toassemble.The observed spatial distribution profiles of the analyzed
seeds imply the presence of highly refined inter- andintracellular small-molecule transport machinery in order toaccomplish and retain compartmentalization as well as trafficsubstrates to locations where they can react with other partnersor serve as precursors to form other molecules. Furthermore,the results hint at the likely locales of the enzymes involved inthe biosynthesis of the observed compounds. Of potentialpractical utility is the identification of tissues in whicheconomically important natural products are concentrated.This information could be exploited for the development ofefficient and streamlined isolations protocols that might proveto be more economically viable than current approaches. Themethod is broadly applicable and could be used to interrogate arange of sample types.
■ ASSOCIATED CONTENT
*S Supporting InformationThe Supporting Information is available free of charge on theACS Publications website at DOI: 10.1021/acs.anal-chem.6b04137.
Mass measurement data for a D. leichhardtii seed andMALDI-MS/MS confirmation of featured ions (PDF)
■ AUTHOR INFORMATION
Corresponding Author*E-mail: [email protected].
ORCIDRabi A. Musah: 0000-0002-3135-4130NotesThe authors declare the following competing financialinterest(s): K.T., R.B.C., D.E., and D.G. are employed by
JEOL, the manufacturer of the scanning electron microscopeand mass spectrometers used in this study.
■ ACKNOWLEDGMENTSThe financial support of the National Science Foundation(NSF) to R.A.M. and R.B.C. (Grant 1310350), Grant 1429329from the NSF to R.A.M., and a grant to R.A.M. from theNational Institute of Justice (Grant 2015-DN-BX-K057) aregratefully acknowledged. Thanks are extended to ElectroScientific Industries for use of the Nd:YAG laser. This projectwas supported by Award No. 2015-DN-BX-K057, awarded bythe National Institute of Justice, Office of Justice Programs,U.S. Department of Justice. The opinions, findings, andconclusions or recommendations expressed in this publica-tion/program/exhibition are those of the author(s) and do notnecessarily reflect those of the Department of Justice.
■ REFERENCES(1) Bodzon-Kulakowska, A.; Suder, P. Mass Spectrom. Rev. 2016, 35,147−169.(2) Kiss, A.; Hopfgartner, G. Methods 2016, 104, 142−153.(3) Dong, Y.; Li, B.; Malitsky, S.; Rogachev, I.; Aharoni, A.; Kaftan,F.; Svatos, A.; Franceschi, P. Front. Plant Sci. 2016, DOI: 10.3389/fpls.2016.00060.(4) Brown, V. L.; He, L. In Mass Spectrometry Imaging of SmallMolecules; He, L., Ed.; Springer: New York, 2015; pp 1−7.(5) Heeren, R. M. A.; McDonnell, L. A.; Amstalden, E.; Luxembourg,S. L.; Altelaar, A. F. M.; Piersma, S. R. Appl. Surf. Sci. 2006, 252, 6827−6835.(6) Abraham, T. W.; Leete, E. J. Am. Chem. Soc. 1995, 117, 8100−8105.(7) Alves, M. N.; Sartoratto, A.; Trigo, J. R. J. Chem. Ecol. 2007, 33,297−309.(8) Berkov, S.; Philipov, S. Pharm. Biol. 2002, 40, 617−621.(9) Berkov, S.; Zayed, R.; Doncheva, T. Fitoterapia 2006, 77, 179−182.(10) Hashimoto, T.; Hayashi, A.; Amano, Y.; Kohno, J.; Iwanari, H.;Usuda, S.; Yamada, Y. J. Biol. Chem. 1991, 266, 4648−4653.(11) Hashimoto, T.; Yukimune, Y.; Yamada, Y. Planta 1989, 178,131−137.(12) Hibi, N.; Fujita, T.; Hatano, M.; Hashimoto, T.; Yamada, Y.Plant Physiol. 1992, 100, 826−835.(13) Li, R.; Reed, D. W.; Liu, E.; Nowak, J.; Pelcher, L. E.; Page, J. E.;Covello, P. S. Chem. Biol. 2006, 13, 513−520.(14) Portsteffen, A.; Draeger, B.; Nahrstedt, A. Phytochemistry 1992,31, 1135−1138.(15) Robins, R. J.; Abraham, T. W.; Parr, A. J.; Eagles, J.; Walton, N.J. J. Am. Chem. Soc. 1997, 119, 10929−10934.(16) Gunn, C. R., Gaffney, F. B. Seed Characteristics of 42Economically Important Species of Solanaceae in the United States,United States Department of Agriculture Technical Bulletin 1471;United States Department of Agriculture: Washington, DC, 1974.(17) Leete, E. J. Am. Chem. Soc. 1962, 84, 55−57.(18) Walton, N. J.; Robins, R. J.; Peerless, A. C. J. Planta 1990, 182,136−141.(19) Katoh, A.; Shoji, T.; Hashimoto, T. Plant Cell Physiol. 2007, 48,550−554.(20) Hashimoto, T.; Nakajima, K.; Ongena, G.; Yamada, Y. PlantPhysiol. 1992, 100, 836−845.(21) Scholl, Y.; Schneider, B.; Drager, B. Phytochemistry 2003, 62,325−332.(22) Bedewitz, M. A.; Gongora-Castillo, E.; Uebler, J. B.; Gonzales-Vigil, E.; Wiegert-Rininger, K. E.; Childs, K. L.; Hamilton, J. P.;Vaillancourt, B.; Yeo, Y.-S.; Chappell, J.; DellaPenna, D.; Jones, A. D.;Buell, C. R.; Barry, C. S. Plant Cell 2014, 26, 3745−3762.(23) Lakshmi Prasuna, M.; Mujahid, M.; Sasikala, C.; Ramana, C. V.Microbiol. Res. 2012, 167, 526−531.
Analytical Chemistry Article
DOI: 10.1021/acs.analchem.6b04137Anal. Chem. 2017, 89, 3421−3429
3428

(24) Hashimoto, T.; Matsuda, J.; Yamada, Y. FEBS Lett. 1993, 329,35−39.(25) Horn, P. J.; Silva, J. E.; Anderson, D.; Fuchs, J.; Borisjuk, L.;Nazarenus, T. J.; Shulaev, V.; Cahoon, E. B.; Chapman, K. D. Plant J.2013, 76, 138−150.(26) Zaima, N.; Goto-Inoue, N.; Hayasaka, T.; Setou, M. RapidCommun. Mass Spectrom. 2010, 24, 2723−2729.(27) Horn, P. J.; Korte, A. R.; Neogi, P. B.; Love, E.; Fuchs, J.;Strupat, K.; Borisjuk, L.; Shulaev, V.; Lee, Y.-J.; Chapman, K. D. PlantCell 2012, 24, 622−636.(28) Yoshimura, Y.; Zaima, N.; Moriyama, T.; Kawamura, Y. PLoSOne 2012, 7, e31285.(29) Burrell, M.; Earnshaw, C.; Clench, M. J. Exp. Bot. 2007, 58,757−763.(30) Walker, H. J.; Steels, C.; Bendell, L.; Clench, M. R.; Read, D. J.;Cameron, D. D.; Burrell, M. M. Proteomics 2016, 16, 1690−1694.(31) Gorzolka, K.; Bednarz, H.; Niehaus, K. Planta 2014, 239, 1321−1335.(32) Peukert, M.; Matros, A.; Lattanzio, G.; Kaspar, S.; Abadía, J.;Mock, H.-P. New Phytol. 2012, 193, 806−815.(33) Thunig, J.; Hansen, S. H.; Janfelt, C. Anal. Chem. 2011, 83,3256−3259.(34) Ifa, D. R.; Srimany, A.; Eberlin, L. S.; Naik, H. R.; Bhat, V.;Cooks, R. G.; Pradeep, T. Anal. Methods 2011, 3, 1910−1912.(35) Mohana Kumara, P.; Srimany, A.; Ravikanth, G.; Uma Shaanker,R.; Pradeep, T. Phytochemistry 2015, 116, 104−110.(36) Galhena, A. S.; Harris, G. A.; Nyadong, L.; Murray, K. K.;Fernandez, F. M. Anal. Chem. 2010, 82, 2178−2181.(37) Liu, Y.; Ma, X.; Lin, Z.; He, M.; Han, G.; Yang, C.; Xing, Z.;Zhang, S.; Zhang, X. Angew. Chem., Int. Ed. 2010, 49, 4435−4437.(38) Zhang, J.; Zhou, Z.; Yang, J.; Zhang, W.; Bai, Y.; Liu, H. Anal.Chem. 2012, 84, 1496−1503.(39) St-Pierre, B.; Vazquez-Flota, F. A.; De Luca, V. Plant Cell 1999,11, 887−900.(40) Bird, D. A.; Franceschi, V. R.; Facchini, P. J. Plant Cell 2003, 15,2626−2635.(41) Ziegler, J.; Facchini, P. J. Annu. Rev. Plant Biol. 2008, 59, 735−769.(42) Berkov, S.; Philipov, S. Pharm. Biol. 2002, 40, 617−621.(43) Zayed, R.; Wink, M.; El-Shamy, H. Z. Naturforsch., C: J. Biosci.2006, 61, 560.(44) Roze, L. V.; Chanda, A.; Linz, J. E. Fungal Genet. Biol. 2011, 48,35−48.(45) Karinho-Betancourt, E.; Agrawal, A. A.; Halitschke, R.; Nunez-Farfan, J. New Phytol. 2015, 206, 796−806.(46) Yoneda, K.; Suzuki, S.; Kusu, H. Shoyakugaku Zasshi 1992, 46,352−357.
Analytical Chemistry Article
DOI: 10.1021/acs.analchem.6b04137Anal. Chem. 2017, 89, 3421−3429
3429