development of mash tl-3 transition between guardrail and
TRANSCRIPT
Research Project Number SPR-P1(13)M326
DEVELOPMENT OF A MASH TL-3
TRANSITION BETWEEN GUARDRAIL
AND PORTABLE CONCRETE BARRIERS Submitted by
David A. Gutierrez, B.S.C.E., E.I.T.
Graduate Research Assistant
Ronald K. Faller, Ph.D., P.E.
Research Associate Professor
MwRSF Director
Robert W. Bielenberg, M.S.M.E., E.I.T.
Research Associate Engineer
John D. Reid, Ph.D., P.E.
Professor
Karla A. Lechtenberg, M.S.M.E., E.I.T.
Research Associate Engineer
MIDWEST ROADSIDE SAFETY FACILITY Nebraska Transportation Center
University of Nebraska-Lincoln
130 Whittier Research Center
2200 Vine Street
Lincoln, Nebraska 68583-0853
(402) 472-0965
Submitted to
NEBRASKA DEPARTMENT OF ROADS
1500 Nebraska Highway 2
Lincoln, Nebraska 68502
SMART WORK ZONE DEYLOYMENT
INITIATIVE
Iowa State University
2711 S. Loop Drive, Suite 4700
Ames, Iowa 50010-8664
Sponsored by
NEBRASKA DEPARTMENT OF ROADS
Research Project No. SPR-P1(13)M326
SMART WORK ZONE DEYLOYMENT
INITIATIVE
(TPF-5(081))
Federal Highway Administration
(InTrans Project 06-277)
MwRSF Research Report No. TRP-03-300-14
June 26, 2014
i
TECHNICAL REPORT DOCUMENTATION PAGE
1. Report No. 2. 3. Recipient’s Accession No.
TRP-03-300-14
4. Title and Subtitle 5. Report Date
Development of MASH TL-3 Transition Between Guardrail and
Portable Concrete Barriers
June 26, 2014
6.
7. Author(s) 8. Performing Organization Report No.
Gutierrez, D.A., Bielenberg, R.W., Faller, R.K., Reid, J.D., and
Lechtenberg, K.A.
TRP-03-300-14
9. Performing Organization Name and Address 10. Project/Task/Work Unit No.
Midwest Roadside Safety Facility (MwRSF)
Nebraska Transportation Center
University of Nebraska-Lincoln
130 Whittier Research Center
2200 Vine Street
Lincoln, Nebraska 68583-0853
11. Contract © or Grant (G) No.
12. Sponsoring Organization Name and Address 13. Type of Report and Period Covered
Nebraska Department of Roads
1500 Nebraska Highway 2
Lincoln, Nebraska 68502
Federal Highway Administration
U.S. Department of Transportation
1200 New Jersey Avenue SE
Washington, DC 20590
Smart Work Zone Deployment
Initiative
Iowa Department of Transportation
800 Lincoln Way
Ames, Iowa 50010
Draft Report – 2012-2014
14. Sponsoring Agency Code
NDOR: SPR-P1(13)M326
SWZDI Contract No. 14074
FHWA Pooled Fund Study TPF-5(081)
15. Supplementary Notes
Prepared in cooperation with U.S. Department of Transportation, Federal Highway Administration.
Visit www.intrans.iastate.edu/smartwz/ for color pdfs of this and other Smart Work Zone Deployment Initiative research reports.
16. Abstract (Limit: 200 words)
Often, road construction causes the need to create a work zone. In these scenarios, portable concrete barriers (PCBs)
are typically installed to shield workers and equipment from errant vehicles as well as prevent motorists from striking other
roadside hazards. For an existing W-beam guardrail system installed adjacent to the roadway and near the work zone,
guardrail sections are removed in order to place the portable concrete barrier system. The focus of this research study was to
develop a proper stiffness transition between W-beam guardrail and portable concrete barrier systems. This research effort
was accomplished through development and refinement of design concepts using computer simulation with LS-DYNA.
Several design concepts were simulated, and design metrics were used to evaluate and refine each concept. These
concepts were then analyzed and ranked based on feasibility, likelihood of success, and ease of installation. The rankings
were presented to the Technical Advisory Committee (TAC) for selection of a preferred design alternative. Next, a Critical
Impact Point (CIP) study was conducted, while additional analyses were performed to determine the critical attachment
location and a reduced installation length for the portable concrete barriers. Finally, an additional simulation effort was
conducted in order to evaluate the safety performance of the transition system under reverse-direction impact scenarios as
well as to select the CIP.
Recommendations were also provided for conducting a Phase II study and evaluating the nested MGS configuration
using three Test Level 3 (TL-3) full-scale crash tests according to the criteria provided in the Manual for Assessing Safety
Hardware, as published by the American Association of Safety Highway and Transportation Officials (AASHTO).
17. Document Analysis/Descriptors 18. Availability Statement
No restrictions. Document available from:
National Technical Information Services,
Springfield, Virginia 22161
Highway Safety, Crash Test, Roadside Appurtenances,
Compliance Test, MASH, Transition, W-Beam Guardrail,
G4(1S), MGS, F-Shape Portable Concrete Barrier, and LS-
DYNA Simulation
9. Security Class (this report) 20. Security Class (this page) 21. No. of Pages 22. Price
Unclassified Unclassified 231
June 26, 2014
MwRSF Report No. TRP-03-300-14
ii
DISCLAIMER STATEMENT
This report was completed with funding from the Federal Highway Administration, U.S.
Department of Transportation as well as the Nebraska Department of Roads. The contents of this
report reflect the views and opinions of the authors who are responsible for the facts and the
accuracy of the data presented herein. The contents do not necessarily reflect the official views
or policies of the Nebraska Departments of Roads or the Federal Highway Administration, U.S.
Department of Transportation. This report does not constitute a standard, specification,
regulation, product endorsement, or an endorsement of manufacturers.
About SWZDI
Iowa, Kansas, Missouri, and Nebraska created the Midwest States Smart Work Zone
Deployment Initiative (SWZDI) in 1999 and Wisconsin joined in 2001. Through this pooled-
fund study, researchers investigate better ways of controlling traffic through work zones. Their
goal is to improve the safety and efficiency of traffic operations and highway work. The project
is now administered by Iowa State University’s Institute for Transportation.

June 26, 2014
MwRSF Report No. TRP-03-300-14
iii
ACKNOWLEDGMENTS
The authors wish to acknowledge several sources that made a contribution to this project:
(1) Nebraska Department of Roads and the Smart Work Zone Deployment Initiative for
sponsoring this project and (2) MwRSF personnel for assisting in the completion of this project.
This research was conducted under the Smart Work Zone Deployment Initiative
(SWZDI) and Federal Highway Administration (FHWA) Pooled Fund Study TPF-5(081),
involving the following state departments of transportation:
Iowa (lead state)
Kansas
Missouri
Nebraska
Wisconsin
The authors would like to thank the FHWA, the Iowa Department of Transportation
(DOT), and the other pooled fund state partners for their financial support and technical
assistance.
Acknowledgement is also given to the following individuals who made a contribution to
the completion of this research project.
Midwest Roadside Safety Facility S.K. Rosenbaugh, M.S.C.E., E.I.T., Research Associate Engineer
C.S. Stolle, Ph.D., Post-Doctoral Research Assistant
J.D. Schmidt, Ph.D., Post-Doctoral Research Assistant
Undergraduate and Graduate Research Assistants
Nebraska Department of Roads Amy Starr, P.E., Research Engineer
Phil TenHulzen, P.E., Design Standards Engineer
Jodi Gibson, Research Coordinator
Mark Osborn, Secondary Roads Engineer
Jim Knott, Roadway Design Engineer
Dan Waddle, Traffic Engineer/Division Manager
June 26, 2014
MwRSF Report No. TRP-03-300-14
iv
Matt Neemann, Traffic Control Engineer
Iowa State University
Keith Knapp, Iowa LTAP Director, Smart Work Zone Deployment Initiative (SWZDI)
Thomas J. McDonald, Program Manager, Smart Work Zone Deployment Initiative (SWZDI)
June 26, 2014
MwRSF Report No. TRP-03-300-14
v
EXECUTIVE SUMMARY
Often, road construction causes the need to create a work zone. In these scenarios,
portable concrete barriers (PCBs) are typically installed to shield workers and equipment from
errant vehicles as well as prevent motorists from striking other roadside hazards. For an existing
W-beam guardrail system installed adjacent to the roadway and near the work zone, guardrail
sections are removed in order to place the portable concrete barrier system. The focus of this
research study was to develop a proper stiffness transition between W-beam guardrail and
portable concrete barrier systems. The research objectives were to determine performance and
design constraints and to develop a stiffness transition between PCBs and W-beam guardrail that
will significantly improve safety for the motoring public and workers within construction zones.
The stiffness transition was designed and simulated according to the AASHTO MASH Test
Level 3 (TL-3) impact safety standards. This research effort was accomplished through
development and refinement of design concepts using computer simulation with LS-DYNA.
The research methodology began with a literature review performed on PCB and
transition designs. Next, performance and design criteria were developed to allow the researchers
to evaluate design concepts. Design concepts for guardrail-to-PCB transitions were developed,
discussed, and prioritized. A computer simulation effort was undertaken to analyze, refine, and
evaluate the design concepts under TL-3 impact scenarios. Finally, conclusions pertaining to the
potential success of each proposed design were made, and recommendations for full-scale crash
testing were provided.
Two preferred design concepts with a total of fourteen different transition configurations
were evaluated using LS-DYNA computer simulation to determine the optimal transition design
for evaluation through full-scale testing. These design variations included overlapping and
offsetting of the PCB segments relative to the guardrail, attachment of the guardrail to the
June 26, 2014
MwRSF Report No. TRP-03-300-14
vi
PCB’s, use of kicker beam to initiate motion of the PCBs, and use of thrie beam in lieu of W-
beam guardrail. Each design configuration was simulated at a variety of impact points and
compared based on specific safety performance criteria for the transition, including vehicle snag,
barrier pocketing, vehicle stability, and occupant risk criteria. Following the analysis, the design
configurations were ranked based on their potential safety performance and presented to the
Technical Advisory Committee (TAC). The TAC selected a preferred design configuration that
used Midwest Guardrail System (MGS) guardrail with nested W-beam for the transition.
After selection of the preferred design, the researchers used simulation analysis to
determine Critical Impact Points (CIPs) for full-scale testing, evaluate additional impacts along
the transition, and analyze impacts on the transition from opposing traffic. This information was
combined with the previous analysis to develop the final transition design and recommendations
for full-scale testing and evaluation of the transition.
Based on this research, the nested-MGS configuration was recommended for evaluation
using a full-scale crash testing program. The nested-MGS configuration connected the barrier
systems with the W-beam end-shoe attached to the upstream end of the fourth PCB segment with
a minimum of three PCB segments extending behind the nested MGS. A minimum of five 12-ft
6-in. long, W-beam sections should be nested upstream from the end-shoe. For testing purposes,
the transition should consist of at least a twenty-five post MGS system and an eleven segment
PCB system at a 15H:1V flare. The critical impact point should occur at the centerline of the
fifth guardrail post upstream from the end-shoe attachment for test designation no. 3-21. The
reverse-direction test scenario should use an impact location 12 ft – 6 in. longitudinally upstream
from the end-shoe attachment for test designation no. 3-21.
A simulation effort involving impacts with the 1100C small car was not conducted. The
2270P test vehicle was deemed more critical than the 1100C small car for the concept

June 26, 2014
MwRSF Report No. TRP-03-300-14
vii
development phase, due to the likelihood of increased barrier deflections, rail and anchor loads,
rail pocketing, and wheel snag. Therefore, test designation no. 3-20 for the full-scale crash
testing program should use MASH procedures for determining a critical impact point.
June 26, 2014
MwRSF Report No. TRP-03-300-14
viii
TABLE OF CONTENTS
TECHNICAL REPORT DOCUMENTATION PAGE ................................................................... i
DISCLAIMER STATEMENT ....................................................................................................... ii
ACKNOWLEDGMENTS ............................................................................................................. iii
EXECUTIVE SUMMARY ............................................................................................................ v
TABLE OF CONTENTS ............................................................................................................. viii
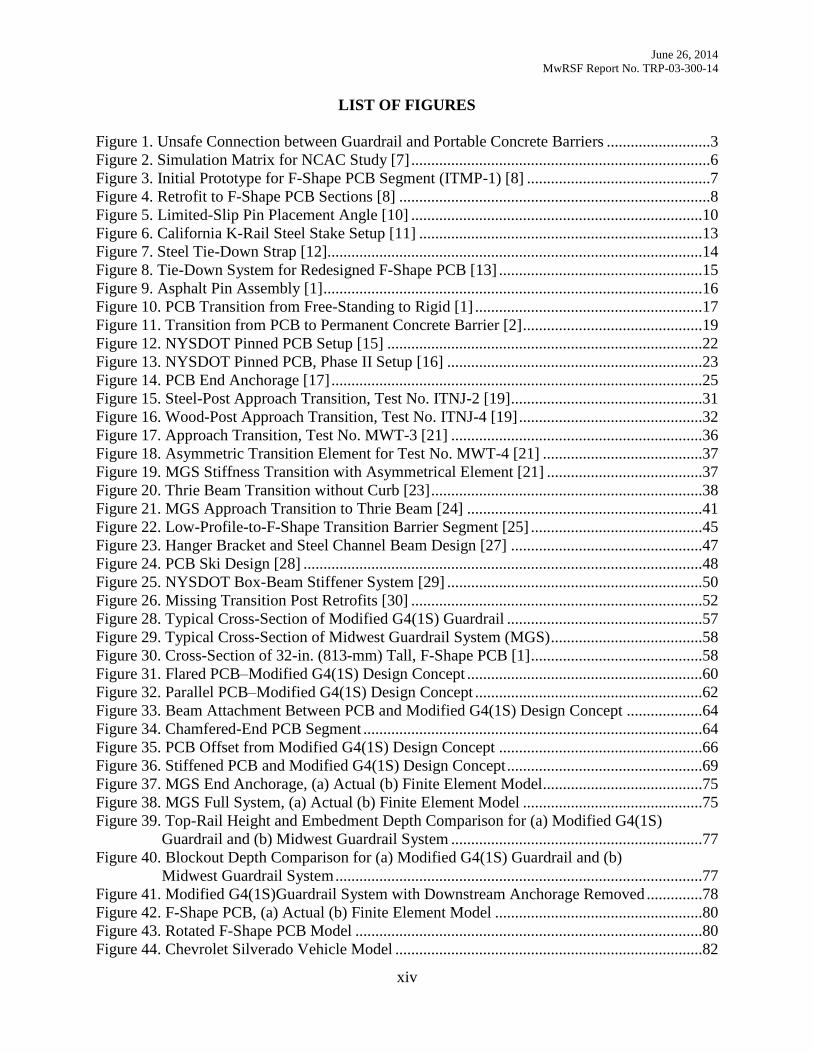
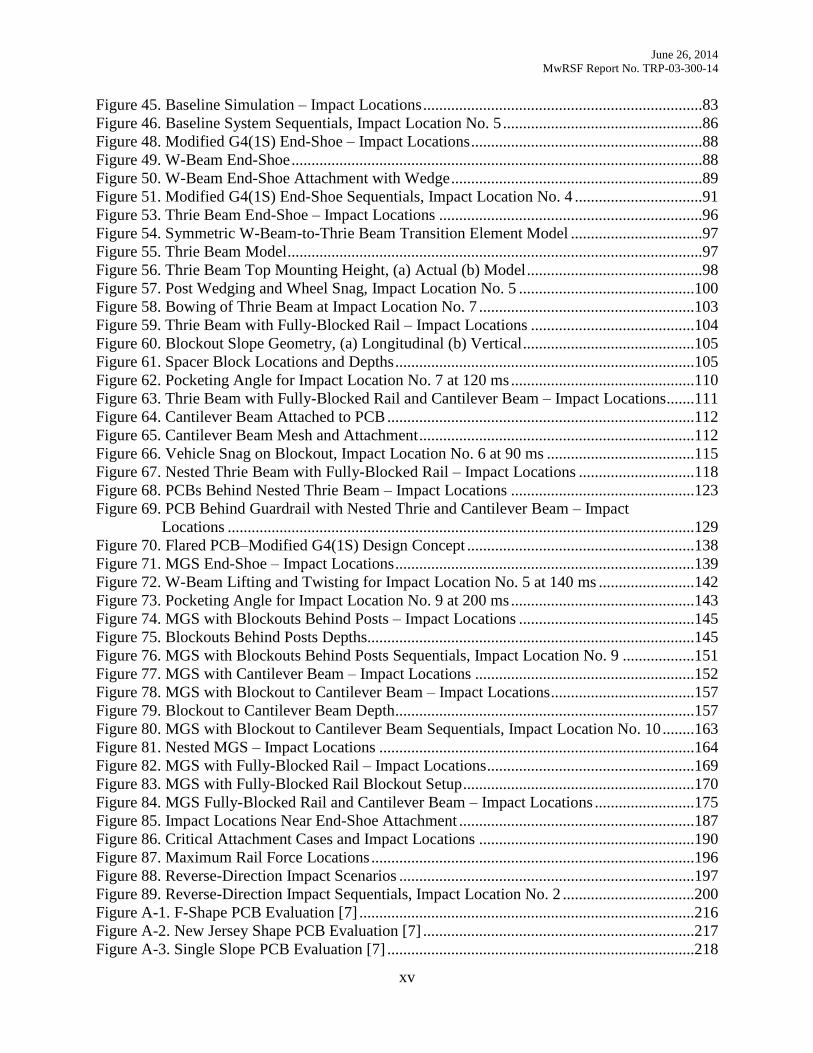
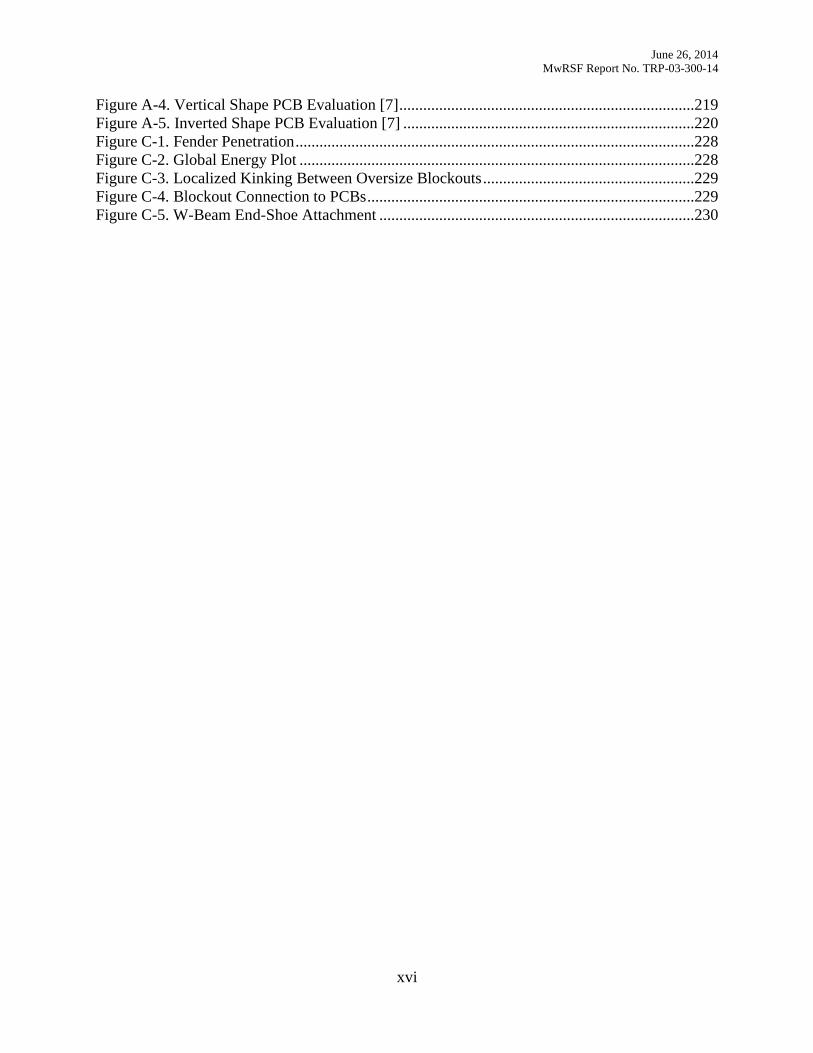
LIST OF FIGURES ..................................................................................................................... xiv
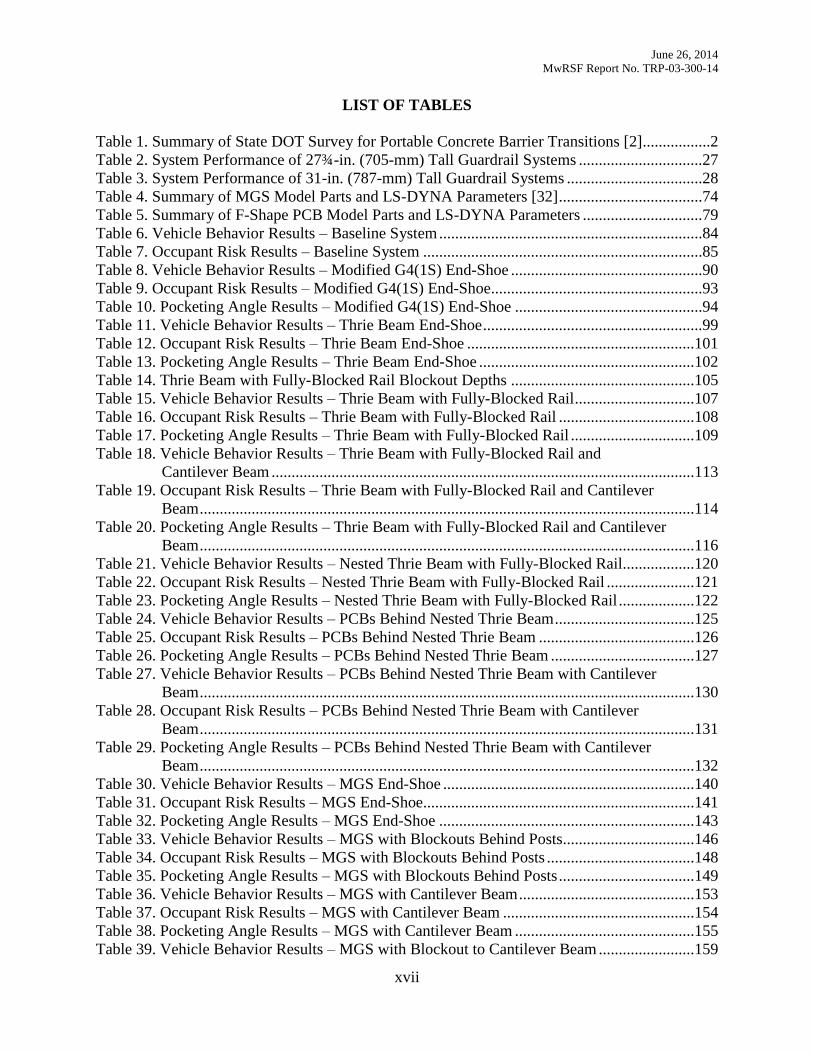
LIST OF TABLES ...................................................................................................................... xvii
ACRONYMS, ABBREVIATIONS, AND SYMBOLS .............................................................. xix
INTRODUCTION ....................................................................................................................... 1 1
1.1 Problem Statement .........................................................................................................1
1.2 Research Objectives .......................................................................................................3 1.3 Scope ..............................................................................................................................4
LITERATURE REVIEW ............................................................................................................ 5 2
2.1 Introduction ....................................................................................................................5 2.2 Crash Testing and Simulation Studies on Free-Standing PCBs ....................................5
2.2.1 National Crash Analysis Center Finite Element Study ..................................... 5 2.2.2 Development of MwRSF F-Shape PCB ........................................................... 6
2.2.3 F-Shape PCB Evaluation under Update to NCHRP Report No. 350 ............... 8 2.3 Testing of Pinned and Anchored PCBs .........................................................................9
2.3.1 Limited-Slip PCB Connection .......................................................................... 9 2.3.2 K-Rail Used in Semi-Permanent Installations ................................................ 12
2.3.3 Development of a Tie-Down System for F-Shape PCBs ................................ 13 2.3.4 Development of Tie-Down System for Redesigned F-Shape PCB ................ 14 2.3.5 Tie-Down and Transition for PCBs on Asphalt Road Surfaces ..................... 16 2.3.6 PCB Transition to Tall Permanent Concrete Median Barrier ......................... 18 2.3.7 Evaluation of 12-ft 6-in. Pinned F-Shape PCB ............................................... 20
2.3.8 Pinned Anchorage System for New York State’s PCBs ................................. 21 2.3.9 Pinned Anchorage System for New York State’s PCBs – Phase II ................ 22
2.3.10 Termination and Anchorage of PCBs ........................................................... 23 2.4 Testing of W-Beam Guardrail Systems .......................................................................26
2.4.1 Guardrail Deflection Analysis – Phase I ......................................................... 26 2.5 Testing of Transitions Between Different Barrier Types ............................................29
2.5.1 Two Approach Guardrail Transitions for Concrete Safety Shape Barriers .... 29
2.5.2 Evaluation of Guardrail-to-Concrete Barrier Transition ................................. 33 2.5.3 Stiffness Transition Between W-Beam Guardrail and Thrie Beam................ 33 2.5.4 Evaluation of Thrie Beam Transition without Curb ....................................... 35
June 26, 2014
MwRSF Report No. TRP-03-300-14
ix
2.5.5 MGS Approach Guardrail Transition Using Standardized Steel Posts .......... 38
2.5.6 Roadside Barriers for Bridge-Pier Protection ................................................. 42 2.5.7 Development of Low-Profile-to-F-Shape Transition Barrier Segment .......... 44
2.6 Testing of Various Barrier Stiffening Techniques .......................................................45
2.6.1 Concrete Median Barriers with Corrugated Ends and Tensioned Cables ....... 45 2.6.2 Channel Beams Spanning a Gap in Continuous Concrete Median Barrier .... 46 2.6.3 PCB System for Off-Road Applications ......................................................... 47 2.6.4 Box-Beam Stiffening of Unanchored PCBs ................................................... 48 2.6.5 Retrofit of Existing Approach Guardrail Transitions ..................................... 51
DEVELOPMENT OF DESIGN CONCEPTS ........................................................................... 55 3
3.1 Design Constraints .......................................................................................................55 3.1.1 W-Beam Guardrail Systems ........................................................................... 56
3.1.1.1 Modified G4(1S) Guardrail................................................................. 56 3.1.1.2 Midwest Guardrail System (MGS) ..................................................... 57
3.1.2 F-Shape Portable Concrete Barrier ................................................................. 58
3.2 Design Concepts ..........................................................................................................59 3.2.1 Flared PCB–Modified G4(1S) ........................................................................ 59
3.2.2 Parallel PCB–Modified G4(1S) ...................................................................... 61 3.2.3 Beam Attachment Between PCB and Modified G4(1S)................................. 63 3.2.4 PCB Offset From Modified G4(1S) ................................................................ 65
3.2.5 Stiffened PCB and Modified G4(1S) .............................................................. 68 3.3 Design Concept Summary ...........................................................................................70
TEST CONDITIONS AND EVALUATION CRITERIA ........................................................ 71 4
4.1 MASH TL-3 Simulated Test Conditions .....................................................................71
4.2 Evaluation Criteria .......................................................................................................71 4.2.1 Vehicle Behavior ............................................................................................ 71
4.2.2 Occupant Risk ................................................................................................. 72 4.2.3 Pocketing Angle .............................................................................................. 72
FINITE ELEMENT BARRIER AND VEHICLE MODELS .................................................... 73 5
5.1 Introduction ..................................................................................................................73 5.2 Midwest Guardrail System (MGS) Model ...................................................................73 5.3 Modified G4(1S) Guardrail Model ..............................................................................76
5.3.1 Downstream Anchorage Removal .................................................................. 77
5.4 F-Shape PCB Model ....................................................................................................78 5.4.1 F-Shape PCB Rotation .................................................................................... 80
5.5 Chevrolet Silverado Vehicle Model.............................................................................81
BASELINE SIMULATION – MODIFIED G4(1S) GUARDRAIL ACROSS PCBs ............... 83 6
6.1 Introduction ..................................................................................................................83 6.2 Vehicle Behavior .........................................................................................................83 6.3 Occupant Risk ..............................................................................................................84
6.4 Pocketing Angle ...........................................................................................................87 6.5 Discussion ....................................................................................................................87
MODIFIED G4(1S) END-SHOE .............................................................................................. 88 7
June 26, 2014
MwRSF Report No. TRP-03-300-14
x
7.1 Introduction ..................................................................................................................88
7.2 Model Modifications ....................................................................................................88 7.3 Vehicle Behavior .........................................................................................................89 7.4 Occupant Risk ..............................................................................................................93
7.5 Pocketing Angle ...........................................................................................................94 7.6 Discussion ....................................................................................................................94
THRIE BEAM END-SHOE ...................................................................................................... 96 8
8.1 Introduction ..................................................................................................................96 8.2 Model Modifications ....................................................................................................96
8.2.1 Symmetric W-Beam-to-Thrie Beam Transition Element ............................... 96 8.2.2 Thrie Beam...................................................................................................... 97 8.2.3 Increased Nominal Rail Height ....................................................................... 97
8.3 Vehicle Behavior .........................................................................................................98 8.4 Occupant Risk ............................................................................................................101 8.5 Pocketing Angle .........................................................................................................102
8.6 Discussion ..................................................................................................................103
THRIE BEAM WITH FULLY-BLOCKED RAIL ................................................................. 104 9
9.1 Introduction ................................................................................................................104 9.2 Model Modifications ..................................................................................................104
9.2.1 Post Removal and Spacer Block Implementation ......................................... 104
9.3 Vehicle Behavior .......................................................................................................106 9.4 Occupant Risk ............................................................................................................107
9.5 Pocketing Angle .........................................................................................................108 9.6 Discussion ..................................................................................................................110
THRIE BEAM WITH FULLY-BLOCKED RAIL AND CANTILEVER BEAM ............... 111 10
10.1 Introduction ..............................................................................................................111
10.2 Model Modifications ................................................................................................111 10.2.1 Cantilever Beam.......................................................................................... 111
10.3 Vehicle Behavior .....................................................................................................113
10.4 Occupant Risk ..........................................................................................................114 10.5 Pocketing Angle .......................................................................................................115 10.6 Discussion ................................................................................................................116
NESTED THRIE BEAM WITH FULLY-BLOCKED RAIL ............................................... 118 11
11.1 Introduction ..............................................................................................................118 11.2 Model Modification .................................................................................................118
11.2.1 Nested Thrie Beam ..................................................................................... 118 11.3 Vehicle Behavior .....................................................................................................119 11.4 Occupant Risk ..........................................................................................................120 11.5 Pocketing Angle .......................................................................................................121 11.6 Discussion ................................................................................................................122
PCBs BEHIND NESTED THRIE BEAM ............................................................................. 123 12
12.1 Introduction ..............................................................................................................123 12.2 Vehicle Behavior .....................................................................................................124
June 26, 2014
MwRSF Report No. TRP-03-300-14
xi
12.3 Occupant Risk ..........................................................................................................125
12.4 Pocketing Angle .......................................................................................................126 12.5 Discussion ................................................................................................................127
PCBs BEHIND NESTED THRIE BEAM WITH CANTILEVER BEAM........................... 129 13
13.1 Introduction ..............................................................................................................129 13.2 Vehicle Behavior .....................................................................................................129 13.3 Occupant Risk ..........................................................................................................130 13.4 Pocketing Angle .......................................................................................................132 13.5 Discussion ................................................................................................................133
SIMULATION RESULTS DISCUSSION ............................................................................ 134 14
14.1 Introduction ..............................................................................................................134 14.2 Flared PCB–Modified G4(1S) Design Concept ......................................................134
14.3 Parallel PCB–Modified G4(1S) Design Concept ....................................................135 14.4 Transition Design Discussion ..................................................................................136 14.5 Flared PCB–MGS Design Concept .........................................................................137
MIDWEST GUARDRAIL SYSTEM (MGS) END-SHOE .................................................. 139 15
15.1 Introduction ..............................................................................................................139
15.2 Vehicle Behavior .....................................................................................................139 15.3 Occupant Risk ..........................................................................................................140 15.4 Pocketing Angle .......................................................................................................142
15.5 Discussion ................................................................................................................144
MGS WITH BLOCKOUTS BEHIND POSTS ..................................................................... 145 16
16.1 Introduction ..............................................................................................................145 16.2 Model Modifications ................................................................................................145
16.2.1 Blockouts behind Posts ............................................................................... 145 16.3 Vehicle Behavior .....................................................................................................146
16.4 Occupant Risk ..........................................................................................................147 16.5 Pocketing Angle .......................................................................................................148
16.6 Discussion ................................................................................................................150
MGS WITH CANTILEVER BEAM ..................................................................................... 152 17
17.1 Introduction ..............................................................................................................152 17.2 Vehicle Behavior .....................................................................................................152 17.3 Occupant Risk ..........................................................................................................153
17.4 Pocketing Angle .......................................................................................................154
17.5 Discussion ................................................................................................................155
MGS WITH BLOCKOUT TO CANTILEVER BEAM ........................................................ 157 18
18.1 Introduction ..............................................................................................................157 18.2 Model Modifications ................................................................................................157
18.2.1 Blockout to Cantilever Beam ...................................................................... 157 18.3 Vehicle Behavior .....................................................................................................158 18.4 Occupant Risk ..........................................................................................................159 18.5 Pocketing Angle .......................................................................................................160
June 26, 2014
MwRSF Report No. TRP-03-300-14
xii
18.6 Discussion ................................................................................................................162
NESTED MGS....................................................................................................................... 164 19
19.1 Introduction ..............................................................................................................164 19.2 Vehicle Behavior .....................................................................................................164
19.3 Occupant Risk ..........................................................................................................165 19.4 Pocketing Angle .......................................................................................................166 19.5 Discussion ................................................................................................................167
MGS WITH FULLY-BLOCKED RAIL ............................................................................... 169 20
20.1 Introduction ..............................................................................................................169
20.2 Model Modifications ................................................................................................169 20.2.1 Post Removal and Blocked Connection ...................................................... 169
20.3 Vehicle Behavior .....................................................................................................170
20.4 Occupant Risk ..........................................................................................................171 20.5 Pocketing Angle .......................................................................................................172 20.6 Discussion ................................................................................................................173
MGS WITH FULLY-BLOCKED RAIL AND CANTILEVER BEAM ............................... 175 21
21.1 Introduction ..............................................................................................................175
21.2 Vehicle Behavior .....................................................................................................175 21.3 Occupant Risk ..........................................................................................................176 21.4 Pocketing Angle .......................................................................................................177
21.5 Discussion ................................................................................................................178
FLARED PCB–MGS DESIGN CONCEPT SUMMARY .................................................... 180 22
22.1 Introduction ..............................................................................................................180 22.2 Flared PCB–MGS Design Concept .........................................................................180
SELECTION OF PREFERRED DESIGN ALTERNATIVES ............................................. 183 23
23.1 Introduction ..............................................................................................................183
23.2 Design Summary and Selection ...............................................................................183
CRITICAL IMPACT POINT (CIP) STUDY ........................................................................ 187 24
24.1 Impacts Near End-Shoe Attachment ........................................................................187 24.2 Critical Attachment Location ...................................................................................189 24.3 Critical Impact Location ..........................................................................................192 24.4 Minimum Length for PCB Installation ....................................................................194 24.5 Reverse-Direction Impact Scenarios ........................................................................197
24.5.1 Simulation Results ...................................................................................... 197
SUMMARY, CONCLUSIONS, AND RECOMMENDATIONS ........................................ 201 25
25.1 Summary and Conclusions ......................................................................................201 25.1.1 Design Concept Development .................................................................... 201 25.1.2 Flared PCB–Modified G4(1S) .................................................................... 202 25.1.3 Parallel PCB–Modified G4(1S) .................................................................. 203 25.1.4 Design Concept Summary .......................................................................... 204 25.1.5 Flared PCB–MGS ....................................................................................... 204
June 26, 2014
MwRSF Report No. TRP-03-300-14
xiii
25.1.6 Design Selection ......................................................................................... 205
25.1.7 CIP Study .................................................................................................... 205 25.2 Recommendations ....................................................................................................207
25.2.1 Future Research .......................................................................................... 209
REFERENCES ...................................................................................................................... 210 26
APPENDICES ....................................................................................................................... 214 27
Appendix A. PCB Evaluation Results...........................................................................215 Appendix B. W-Beam Guardrail Deflections ...............................................................221 Appendix C. Modeling Difficulties ...............................................................................228
June 26, 2014
MwRSF Report No. TRP-03-300-14
xiv
LIST OF FIGURES
Figure 1. Unsafe Connection between Guardrail and Portable Concrete Barriers ..........................3 Figure 2. Simulation Matrix for NCAC Study [7] ...........................................................................6
Figure 3. Initial Prototype for F-Shape PCB Segment (ITMP-1) [8] ..............................................7 Figure 4. Retrofit to F-Shape PCB Sections [8] ..............................................................................8 Figure 5. Limited-Slip Pin Placement Angle [10] .........................................................................10 Figure 6. California K-Rail Steel Stake Setup [11] .......................................................................13 Figure 7. Steel Tie-Down Strap [12]..............................................................................................14
Figure 8. Tie-Down System for Redesigned F-Shape PCB [13] ...................................................15 Figure 9. Asphalt Pin Assembly [1] ...............................................................................................16 Figure 10. PCB Transition from Free-Standing to Rigid [1] .........................................................17 Figure 11. Transition from PCB to Permanent Concrete Barrier [2] .............................................19
Figure 12. NYSDOT Pinned PCB Setup [15] ...............................................................................22 Figure 13. NYSDOT Pinned PCB, Phase II Setup [16] ................................................................23
Figure 14. PCB End Anchorage [17] .............................................................................................25 Figure 15. Steel-Post Approach Transition, Test No. ITNJ-2 [19] ................................................31
Figure 16. Wood-Post Approach Transition, Test No. ITNJ-4 [19] ..............................................32 Figure 17. Approach Transition, Test No. MWT-3 [21] ...............................................................36 Figure 18. Asymmetric Transition Element for Test No. MWT-4 [21] ........................................37
Figure 19. MGS Stiffness Transition with Asymmetrical Element [21] .......................................37 Figure 20. Thrie Beam Transition without Curb [23] ....................................................................38
Figure 21. MGS Approach Transition to Thrie Beam [24] ...........................................................41 Figure 22. Low-Profile-to-F-Shape Transition Barrier Segment [25] ...........................................45 Figure 23. Hanger Bracket and Steel Channel Beam Design [27] ................................................47
Figure 24. PCB Ski Design [28] ....................................................................................................48
Figure 25. NYSDOT Box-Beam Stiffener System [29] ................................................................50 Figure 26. Missing Transition Post Retrofits [30] .........................................................................52 Figure 28. Typical Cross-Section of Modified G4(1S) Guardrail .................................................57
Figure 29. Typical Cross-Section of Midwest Guardrail System (MGS) ......................................58 Figure 30. Cross-Section of 32-in. (813-mm) Tall, F-Shape PCB [1] ...........................................58
Figure 31. Flared PCB–Modified G4(1S) Design Concept ...........................................................60 Figure 32. Parallel PCB–Modified G4(1S) Design Concept .........................................................62
Figure 33. Beam Attachment Between PCB and Modified G4(1S) Design Concept ...................64 Figure 34. Chamfered-End PCB Segment .....................................................................................64 Figure 35. PCB Offset from Modified G4(1S) Design Concept ...................................................66 Figure 36. Stiffened PCB and Modified G4(1S) Design Concept .................................................69 Figure 37. MGS End Anchorage, (a) Actual (b) Finite Element Model ........................................75
Figure 38. MGS Full System, (a) Actual (b) Finite Element Model .............................................75 Figure 39. Top-Rail Height and Embedment Depth Comparison for (a) Modified G4(1S)
Guardrail and (b) Midwest Guardrail System ...............................................................77 Figure 40. Blockout Depth Comparison for (a) Modified G4(1S) Guardrail and (b)
Midwest Guardrail System ............................................................................................77 Figure 41. Modified G4(1S)Guardrail System with Downstream Anchorage Removed ..............78 Figure 42. F-Shape PCB, (a) Actual (b) Finite Element Model ....................................................80 Figure 43. Rotated F-Shape PCB Model .......................................................................................80 Figure 44. Chevrolet Silverado Vehicle Model .............................................................................82
June 26, 2014
MwRSF Report No. TRP-03-300-14
xv
Figure 45. Baseline Simulation – Impact Locations ......................................................................83
Figure 46. Baseline System Sequentials, Impact Location No. 5 ..................................................86 Figure 48. Modified G4(1S) End-Shoe – Impact Locations ..........................................................88 Figure 49. W-Beam End-Shoe .......................................................................................................88
Figure 50. W-Beam End-Shoe Attachment with Wedge ...............................................................89 Figure 51. Modified G4(1S) End-Shoe Sequentials, Impact Location No. 4 ................................91 Figure 53. Thrie Beam End-Shoe – Impact Locations ..................................................................96 Figure 54. Symmetric W-Beam-to-Thrie Beam Transition Element Model .................................97 Figure 55. Thrie Beam Model ........................................................................................................97
Figure 56. Thrie Beam Top Mounting Height, (a) Actual (b) Model ............................................98 Figure 57. Post Wedging and Wheel Snag, Impact Location No. 5 ............................................100 Figure 58. Bowing of Thrie Beam at Impact Location No. 7 ......................................................103 Figure 59. Thrie Beam with Fully-Blocked Rail – Impact Locations .........................................104
Figure 60. Blockout Slope Geometry, (a) Longitudinal (b) Vertical ...........................................105 Figure 61. Spacer Block Locations and Depths ...........................................................................105
Figure 62. Pocketing Angle for Impact Location No. 7 at 120 ms ..............................................110 Figure 63. Thrie Beam with Fully-Blocked Rail and Cantilever Beam – Impact Locations .......111
Figure 64. Cantilever Beam Attached to PCB .............................................................................112 Figure 65. Cantilever Beam Mesh and Attachment .....................................................................112 Figure 66. Vehicle Snag on Blockout, Impact Location No. 6 at 90 ms .....................................115
Figure 67. Nested Thrie Beam with Fully-Blocked Rail – Impact Locations .............................118 Figure 68. PCBs Behind Nested Thrie Beam – Impact Locations ..............................................123
Figure 69. PCB Behind Guardrail with Nested Thrie and Cantilever Beam – Impact
Locations .....................................................................................................................129 Figure 70. Flared PCB–Modified G4(1S) Design Concept .........................................................138
Figure 71. MGS End-Shoe – Impact Locations ...........................................................................139
Figure 72. W-Beam Lifting and Twisting for Impact Location No. 5 at 140 ms ........................142 Figure 73. Pocketing Angle for Impact Location No. 9 at 200 ms ..............................................143 Figure 74. MGS with Blockouts Behind Posts – Impact Locations ............................................145
Figure 75. Blockouts Behind Posts Depths..................................................................................145 Figure 76. MGS with Blockouts Behind Posts Sequentials, Impact Location No. 9 ..................151
Figure 77. MGS with Cantilever Beam – Impact Locations .......................................................152 Figure 78. MGS with Blockout to Cantilever Beam – Impact Locations ....................................157
Figure 79. Blockout to Cantilever Beam Depth...........................................................................157 Figure 80. MGS with Blockout to Cantilever Beam Sequentials, Impact Location No. 10 ........163 Figure 81. Nested MGS – Impact Locations ...............................................................................164 Figure 82. MGS with Fully-Blocked Rail – Impact Locations ....................................................169 Figure 83. MGS with Fully-Blocked Rail Blockout Setup ..........................................................170
Figure 84. MGS Fully-Blocked Rail and Cantilever Beam – Impact Locations .........................175 Figure 85. Impact Locations Near End-Shoe Attachment ...........................................................187
Figure 86. Critical Attachment Cases and Impact Locations ......................................................190 Figure 87. Maximum Rail Force Locations .................................................................................196 Figure 88. Reverse-Direction Impact Scenarios ..........................................................................197 Figure 89. Reverse-Direction Impact Sequentials, Impact Location No. 2 .................................200 Figure A-1. F-Shape PCB Evaluation [7] ....................................................................................216 Figure A-2. New Jersey Shape PCB Evaluation [7] ....................................................................217 Figure A-3. Single Slope PCB Evaluation [7] .............................................................................218
June 26, 2014
MwRSF Report No. TRP-03-300-14
xvi
Figure A-4. Vertical Shape PCB Evaluation [7] ..........................................................................219
Figure A-5. Inverted Shape PCB Evaluation [7] .........................................................................220 Figure C-1. Fender Penetration ....................................................................................................228 Figure C-2. Global Energy Plot ...................................................................................................228
Figure C-3. Localized Kinking Between Oversize Blockouts .....................................................229 Figure C-4. Blockout Connection to PCBs ..................................................................................229 Figure C-5. W-Beam End-Shoe Attachment ...............................................................................230
June 26, 2014
MwRSF Report No. TRP-03-300-14
xvii
LIST OF TABLES
Table 1. Summary of State DOT Survey for Portable Concrete Barrier Transitions [2].................2 Table 2. System Performance of 27¾-in. (705-mm) Tall Guardrail Systems ...............................27
Table 3. System Performance of 31-in. (787-mm) Tall Guardrail Systems ..................................28 Table 4. Summary of MGS Model Parts and LS-DYNA Parameters [32] ....................................74 Table 5. Summary of F-Shape PCB Model Parts and LS-DYNA Parameters ..............................79 Table 6. Vehicle Behavior Results – Baseline System ..................................................................84 Table 7. Occupant Risk Results – Baseline System ......................................................................85
Table 8. Vehicle Behavior Results – Modified G4(1S) End-Shoe ................................................90 Table 9. Occupant Risk Results – Modified G4(1S) End-Shoe .....................................................93 Table 10. Pocketing Angle Results – Modified G4(1S) End-Shoe ...............................................94 Table 11. Vehicle Behavior Results – Thrie Beam End-Shoe .......................................................99
Table 12. Occupant Risk Results – Thrie Beam End-Shoe .........................................................101 Table 13. Pocketing Angle Results – Thrie Beam End-Shoe ......................................................102
Table 14. Thrie Beam with Fully-Blocked Rail Blockout Depths ..............................................105 Table 15. Vehicle Behavior Results – Thrie Beam with Fully-Blocked Rail ..............................107
Table 16. Occupant Risk Results – Thrie Beam with Fully-Blocked Rail ..................................108 Table 17. Pocketing Angle Results – Thrie Beam with Fully-Blocked Rail ...............................109 Table 18. Vehicle Behavior Results – Thrie Beam with Fully-Blocked Rail and
Cantilever Beam ..........................................................................................................113 Table 19. Occupant Risk Results – Thrie Beam with Fully-Blocked Rail and Cantilever
Beam ............................................................................................................................114 Table 20. Pocketing Angle Results – Thrie Beam with Fully-Blocked Rail and Cantilever
Beam ............................................................................................................................116
Table 21. Vehicle Behavior Results – Nested Thrie Beam with Fully-Blocked Rail..................120
Table 22. Occupant Risk Results – Nested Thrie Beam with Fully-Blocked Rail ......................121 Table 23. Pocketing Angle Results – Nested Thrie Beam with Fully-Blocked Rail ...................122 Table 24. Vehicle Behavior Results – PCBs Behind Nested Thrie Beam ...................................125
Table 25. Occupant Risk Results – PCBs Behind Nested Thrie Beam .......................................126 Table 26. Pocketing Angle Results – PCBs Behind Nested Thrie Beam ....................................127
Table 27. Vehicle Behavior Results – PCBs Behind Nested Thrie Beam with Cantilever
Beam ............................................................................................................................130
Table 28. Occupant Risk Results – PCBs Behind Nested Thrie Beam with Cantilever
Beam ............................................................................................................................131 Table 29. Pocketing Angle Results – PCBs Behind Nested Thrie Beam with Cantilever
Beam ............................................................................................................................132 Table 30. Vehicle Behavior Results – MGS End-Shoe ...............................................................140
Table 31. Occupant Risk Results – MGS End-Shoe ....................................................................141 Table 32. Pocketing Angle Results – MGS End-Shoe ................................................................143
Table 33. Vehicle Behavior Results – MGS with Blockouts Behind Posts.................................146 Table 34. Occupant Risk Results – MGS with Blockouts Behind Posts .....................................148 Table 35. Pocketing Angle Results – MGS with Blockouts Behind Posts ..................................149 Table 36. Vehicle Behavior Results – MGS with Cantilever Beam ............................................153 Table 37. Occupant Risk Results – MGS with Cantilever Beam ................................................154 Table 38. Pocketing Angle Results – MGS with Cantilever Beam .............................................155 Table 39. Vehicle Behavior Results – MGS with Blockout to Cantilever Beam ........................159
June 26, 2014
MwRSF Report No. TRP-03-300-14
xviii
Table 40. Occupant Risk Results – MGS with Blockout to Cantilever Beam ............................160
Table 41. Pocketing Angle Results – MGS with Blockout to Cantilever Beam .........................161 Table 42. Vehicle Behavior Results – Nested MGS ....................................................................165 Table 43. Occupant Risk Results – Nested MGS ........................................................................166
Table 44. Pocketing Angle Results – Nested MGS .....................................................................167 Table 45. MGS with Fully-Blocked Rail Blockout Depths .........................................................170 Table 46. Vehicle Behavior Results – MGS with Fully-Blocked Rail ........................................171 Table 47. Occupant Risk Results – MGS with Fully-Blocked Rail ............................................172 Table 48. Pocketing Angle Results – MGS with Fully-Blocked Rail .........................................173
Table 49. Vehicle Behavior Results – MGS with Fully-Blocked Rail and Cantilever
Beam ............................................................................................................................176 Table 50. Occupant Risk Results – MGS with Fully-Blocked Rail and Cantilever Beam ..........177 Table 51. Pocketing Angle Results – MGS with Fully-Blocked Rail and Cantilever Beam.......178
Table 52. Summary of Design Concepts and Configurations......................................................184 Table 53. Summary of Design Concepts and Configurations (cont.) ..........................................185
Table 54. Ranking of Design Configurations ..............................................................................186 Table 55. Results for Impacts Near the End-Shoe Attachment ...................................................188
Table 56. Simulation Results – Critical Attachment Location ....................................................191 Table 57. Simulation Results – Additional Critical Impact Point Investigation..........................193 Table 58. Simulation Results – CIP Investigation with 11 PCBs – Impact Location No. 9 .......194
Table 60. Simulation Results – Reverse-Direction Impact Scenarios .........................................199 Table B-1. W-Beam Guardrail Deflections [18] ..........................................................................222
Table B-2. W-Beam Guardrail Deflections, Cont. [18] ...............................................................223 Table B-3. W-Beam Guardrail Deflections, Cont. [18] ...............................................................224 Table B-4. W-Beam Guardrail Deflections, Cont. [18] ...............................................................225
Table B-5. W-Beam Guardrail Deflections, Cont. [18] ...............................................................226
Table B-6. W-Beam Guardrail Deflections, Cont. [18] ...............................................................227

June 26, 2014
MwRSF Report No. TRP-03-300-14
xix
ACRONYMS, ABBREVIATIONS, AND SYMBOLS
Acronym
Definition
AASHTO
- American Association of State Highway and Transportation Officials
AOS
- AOS Technologies AG
ASI
- Acceleration Severity Index
ASTM
- American Society for Testing and Materials
B.S.B.A.
- Bachelor of Science in Business Administration
B.S.M.A.
- Bachelor of Science in Management Accounting
BCT
- Breakaway Cable Terminal
c.g.
- center of gravity
CFL Central Federal Lands
CFLHD
- Central Federal Lands Highway Department
CIP - Critical Impact Point
deg
- degree
DM-1
- DynaMax 1
DOT
- Department of Transportation
DTS
- Diversified Technical Systems, Incorporated
EDR Event Data Recorder
E.I.T.
- Engineer in Training
FHWA
- Federal Highway Administration
FLHD
- Federal Lands Highway Division
ft
- foot
ft/s
- feet per second
g
- gram
g's
- g-force, acceleration due to gravity at the Earth's surface
h hour
H
- Horizontal
Hz
- Hertz
IAA
- Independent Approving Authority
in.
- inch
IST
- Instrumented Sensor Technology, Incorporated
JVC
- Victor Company of Japan, Limited
kB
- kilobyte
kg
- kilogram
kip-in.
- thousand pounds-force inches
kips
- thousand pounds-force
kJ
- kilojoules
km
- kilometer
km/h
- kilometers per hour

June 26, 2014
MwRSF Report No. TRP-03-300-14
xx
kN
- kilonewton
lb
- pound(s)
m
- meter
m/s - meters per second
MASH
- Manual for Assessing Safety Hardware
MB
- megabyte
MGS
- Midwest Guardrail System
mm
- millimeter
mph
- miles per hour
M.S.C.E. - Master of Science in Civil Engineering
MSE
- Mechanically-Stabilized Earth
M.S.M.E. - Master of Science in Mechanical Engineering
MwRSF
- Midwest Roadside Safety Facility
N
- Newton
NA
- not applicable
NCHRP
- National Cooperative Highway Research Program
NHS
- National Highway System
no.
- number
nos.
- numbers
OIVs
- occupant impact velocities
ORAs
- occupant ridedown accelerations
PCB - Portable Concrete Barrier
P.E.
- Professional Engineer
Ph.D.
- Doctor of Philosophy
PHD
- Post-Impact Head Deceleration
pm
- post meridiem
R&D
- research and development
RAM
- random-access memory
s
- second
SAE
- Society of Automotive Engineers
SBP
- slope break point
sec
- second
SIM
- Sensor Input Module
SRAM
- static random-access memory
SUV
- sport utility vehicle
SYP
- Southern Yellow Pine
THIV
- Theoretical Head Impact Velocity
TL
- Test Level
U.S.
- United States
V
- Vertical
vs.
- versus

June 26, 2014
MwRSF Report No. TRP-03-300-14
xxi
° F
- degrees Fahrenheit
‘
- foot
“
- inch
%
- percent
σw
- yield strength of W-beam rail
tw
- thickness of W-beam rail
Db
- bolt diameter
Fv
- shear force
June 26, 2014
MwRSF Report No. TRP-03-300-14
1
INTRODUCTION 1
1.1 Problem Statement
In practice, portable concrete barriers (PCBs) must be connected and transitioned to
many types of barriers. Sometimes these portable concrete barriers are connected to similarly-
shaped permanent concrete barriers. At other times, portable concrete barriers must be connected
to dissimilar barriers, such as vertical concrete barriers, tubular steel bridge railings, W-beam
guardrail, thrie beam guardrail, and open concrete bridge railings. Unfortunately, very little
research has been devoted to this transition need. The only previously-developed PCB transitions
have involved attachment to permanent, safety-shape concrete roadside barriers and permanent
concrete median barriers [1-4].
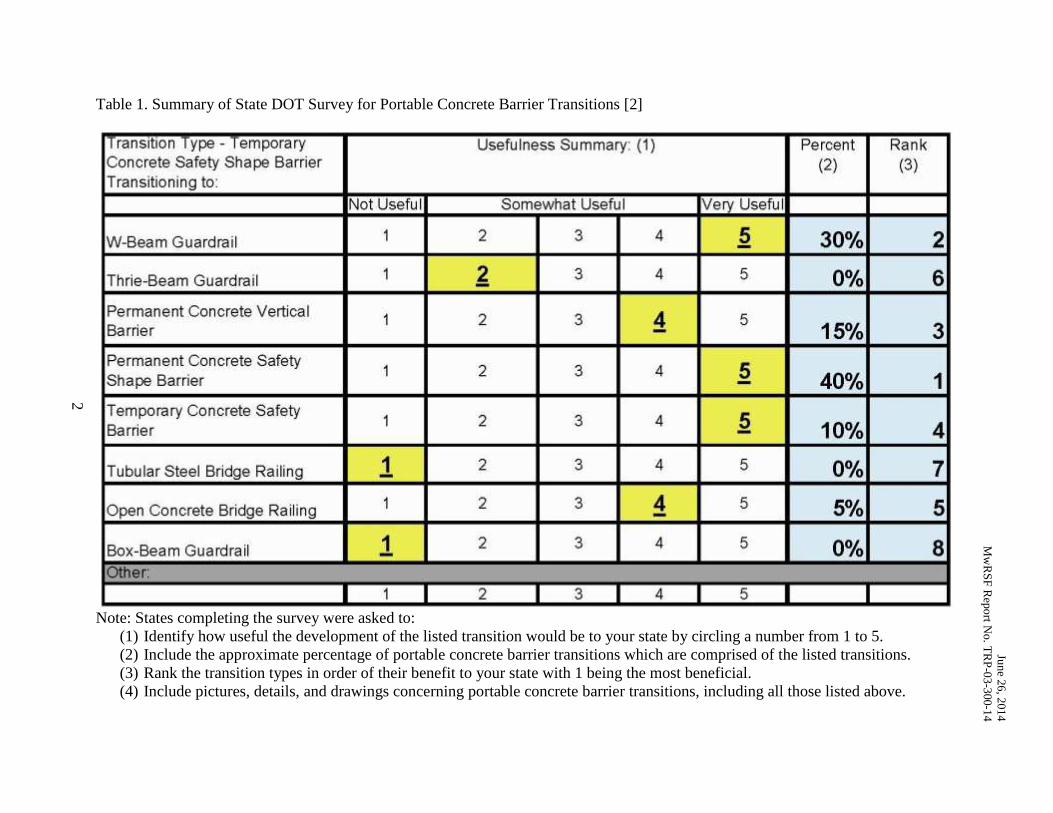
Previously, researchers at the Midwest Roadside Safety Facility (MwRSF) conducted a
survey of the members participating in the Midwest States Regional Pooled Fund program in
order to identify the most prominent transition needs involving portable concrete barriers. The
results, as shown in Table 1, identified a transition between portable concrete barriers and W-
beam guardrail as the second highest need. As noted above, a transition from portable concrete
barriers to permanent concrete safety-shape barriers has been previously developed. Thus, the
focus of this research study was to investigate stiffness transitions between portable concrete
barriers and W-beam guardrail.
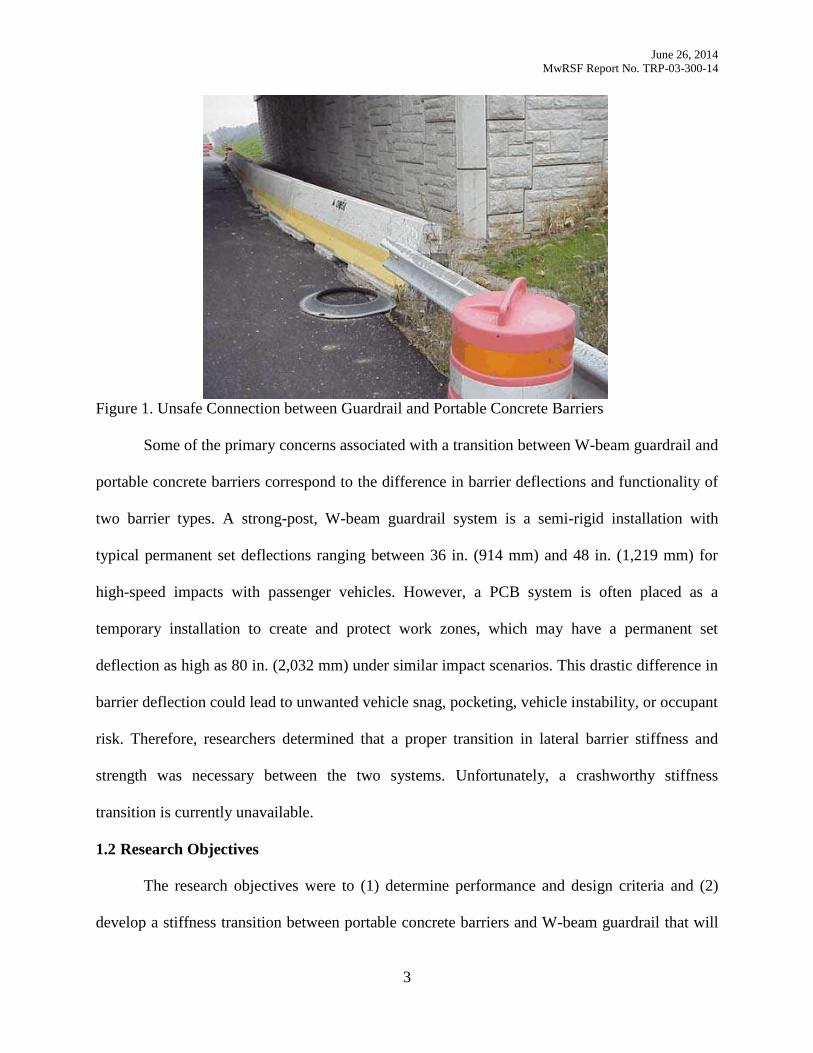
A transition between portable concrete barriers and W-beam guardrail is necessary when
roadway construction creates a work zone in an area with existing W-beam guardrail. In this
situation, a portion of the W-beam guardrail is often removed, and portable concrete barriers
would be installed to create a work zone. The area where these two barriers meet can create a
potential hazard, especially if a proper transition is not installed, as shown in Figure 1.
Jun
e 26
, 201
4
Mw
RS
F R
epo
rt No. T
RP
-03
-300-1
4
2
Table 1. Summary of State DOT Survey for Portable Concrete Barrier Transitions [2]
Note: States completing the survey were asked to:
(1) Identify how useful the development of the listed transition would be to your state by circling a number from 1 to 5.
(2) Include the approximate percentage of portable concrete barrier transitions which are comprised of the listed transitions.
(3) Rank the transition types in order of their benefit to your state with 1 being the most beneficial.
(4) Include pictures, details, and drawings concerning portable concrete barrier transitions, including all those listed above.
June 26, 2014
MwRSF Report No. TRP-03-300-14
3
Figure 1. Unsafe Connection between Guardrail and Portable Concrete Barriers
Some of the primary concerns associated with a transition between W-beam guardrail and
portable concrete barriers correspond to the difference in barrier deflections and functionality of
two barrier types. A strong-post, W-beam guardrail system is a semi-rigid installation with
typical permanent set deflections ranging between 36 in. (914 mm) and 48 in. (1,219 mm) for
high-speed impacts with passenger vehicles. However, a PCB system is often placed as a
temporary installation to create and protect work zones, which may have a permanent set
deflection as high as 80 in. (2,032 mm) under similar impact scenarios. This drastic difference in
barrier deflection could lead to unwanted vehicle snag, pocketing, vehicle instability, or occupant
risk. Therefore, researchers determined that a proper transition in lateral barrier stiffness and
strength was necessary between the two systems. Unfortunately, a crashworthy stiffness
transition is currently unavailable.
1.2 Research Objectives
The research objectives were to (1) determine performance and design criteria and (2)
develop a stiffness transition between portable concrete barriers and W-beam guardrail that will
June 26, 2014
MwRSF Report No. TRP-03-300-14
4
significantly improve safety for the motoring public and workers within construction zones. The
transition system was designed to meet the Test Level 3 (TL-3) safety performance criteria set
forth in the American Association of State Highway and Transportation Officials (AASHTO)
Manual for Assessing Safety Hardware (MASH) [5].
1.3 Scope
The research objectives were achieved through the completion of several tasks. First, a
literature review was performed on previous testing of free-standing PCB systems, pinned and
anchored portable concrete barriers, W-beam guardrail, transitions between different barrier
types, and various barrier-stiffening techniques. Next, performance and design criteria were
developed that would allow the researchers to determine the likelihood of success for each
design concept. Then, several design concepts for guardrail-to-PCB transitions were developed,
discussed, and prioritized. A computer simulation effort was undertaken to analyze, refine, and
evaluate several of the design concepts using LS-DYNA, a 3-D nonlinear finite element code [6].
Since ease of installation was a desired trait of the transition system, the simplest design concepts
were simulated first. Based on the simulation results, complexity was later added on an
incremental basis in order to meet the performance and design criteria. For each selected
transition design concept, an FEA model was configured. Subsequently, an LS-DYNA analysis
and design effort was conducted in order to evaluate the transition concepts under MASH TL-3
impact scenarios, modify the configurations, and determine the Critical Impact Points (CIPs) for
the transition. Finally, conclusions pertaining to the potential success of each proposed design
were made, and recommendations for full-scale crash testing were provided.
June 26, 2014
MwRSF Report No. TRP-03-300-14
5
LITERATURE REVIEW 2
2.1 Introduction
Before transition design concepts were formulated and simulated, a literature search was
conducted in order to review (1) prior guardrail-to-PCB and PCB-to-permanent barrier transition
configurations, (2) barrier deflections, and (3) other barrier stiffening techniques. A brief
summary for the relevant research studies are provided below and include test descriptions, test
conditions, and dynamic and permanent set deflections for actual and simulated tests. These
results aided in the formulation of design concepts for the transition between W-beam guardrail
and portable concrete barriers. Please note that the purpose of this literature review was to
identify similar research and gain knowledge of barrier deflections and transition-stiffening
techniques. However, a historical summary for all barrier transitions is not included herein.
2.2 Crash Testing and Simulation Studies on Free-Standing PCBs
2.2.1 National Crash Analysis Center Finite Element Study
In 2007, the National Crash Analysis Center (NCAC) conducted an extensive LS-DYNA
computer simulation study to evaluate the performance of portable concrete barriers, including
different combinations of PCB shapes, lengths, and connection types [7]. As illustrated by the
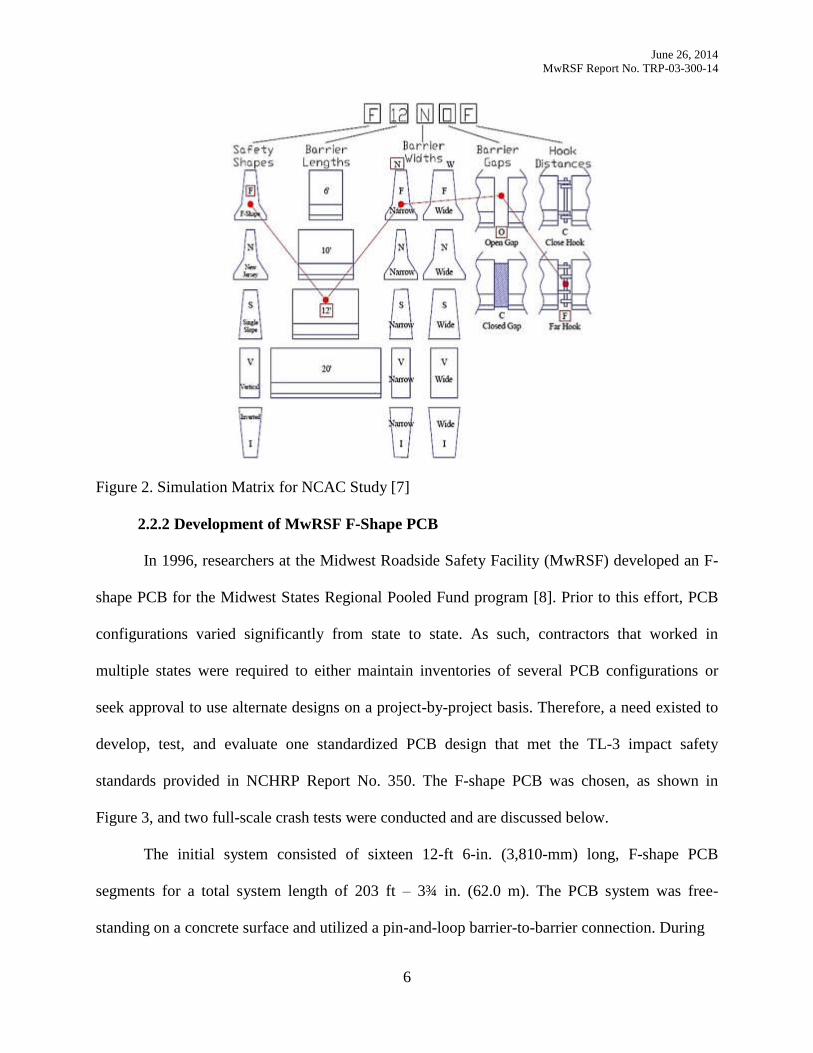
simulation matrix in Figure 2, 160 different combinations were examined under the National
Cooperative Highway Research Program (NCHRP) Report No. 350 safety guidelines for Test
Level 3 (TL-3). This investigation required that each simulation be set up for an impact with a
4,409-lb (2,000-kg) pickup truck at an angle of 25 degrees and an impact velocity of 62.1 mph
(100 km/h). For this effort, full-scale crash test results and findings from previous studies were
used to develop and validate the computer models. Each PCB system was evaluated for occupant
ridedown acceleration, occupant impact velocity, barrier displacement, and rotation angle. Full
results of the study can be found in the charts located in Appendix A.
June 26, 2014
MwRSF Report No. TRP-03-300-14
6
Figure 2. Simulation Matrix for NCAC Study [7]
2.2.2 Development of MwRSF F-Shape PCB
In 1996, researchers at the Midwest Roadside Safety Facility (MwRSF) developed an F-
shape PCB for the Midwest States Regional Pooled Fund program [8]. Prior to this effort, PCB
configurations varied significantly from state to state. As such, contractors that worked in
multiple states were required to either maintain inventories of several PCB configurations or
seek approval to use alternate designs on a project-by-project basis. Therefore, a need existed to
develop, test, and evaluate one standardized PCB design that met the TL-3 impact safety
standards provided in NCHRP Report No. 350. The F-shape PCB was chosen, as shown in
Figure 3, and two full-scale crash tests were conducted and are discussed below.
The initial system consisted of sixteen 12-ft 6-in. (3,810-mm) long, F-shape PCB
segments for a total system length of 203 ft – 3¾ in. (62.0 m). The PCB system was free-
standing on a concrete surface and utilized a pin-and-loop barrier-to-barrier connection. During
June 26, 2014
MwRSF Report No. TRP-03-300-14
7
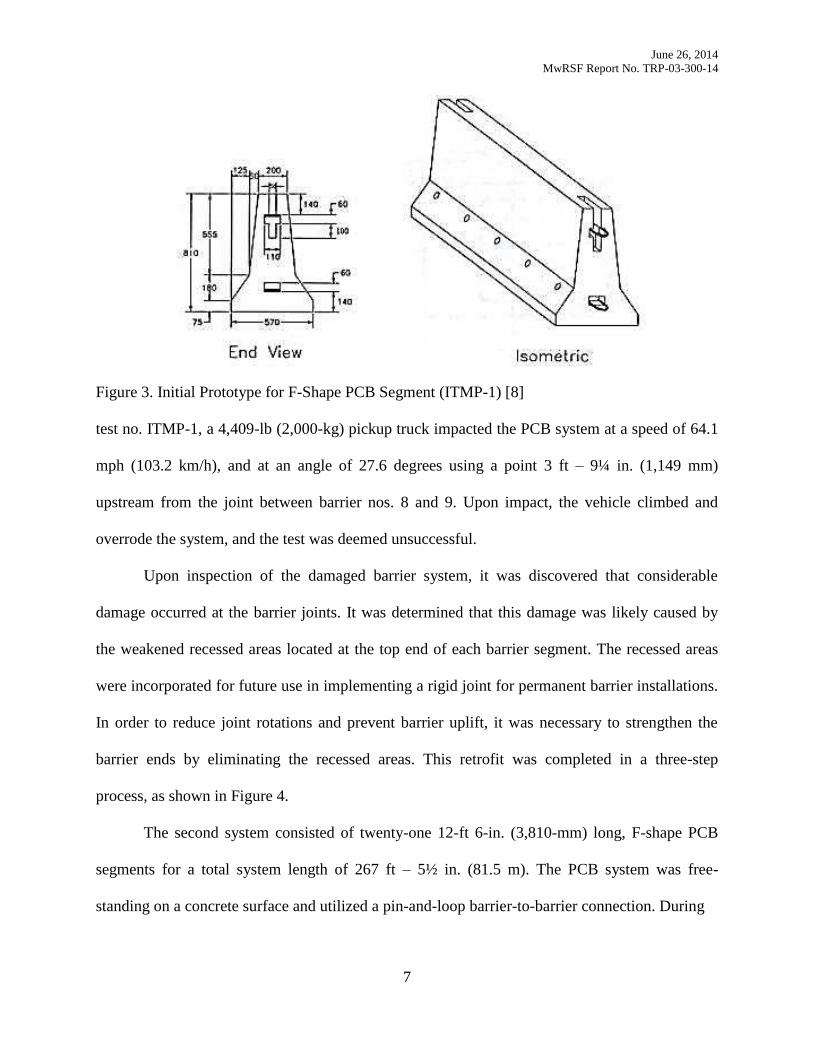
Figure 3. Initial Prototype for F-Shape PCB Segment (ITMP-1) [8]
test no. ITMP-1, a 4,409-lb (2,000-kg) pickup truck impacted the PCB system at a speed of 64.1
mph (103.2 km/h), and at an angle of 27.6 degrees using a point 3 ft – 9¼ in. (1,149 mm)
upstream from the joint between barrier nos. 8 and 9. Upon impact, the vehicle climbed and
overrode the system, and the test was deemed unsuccessful.
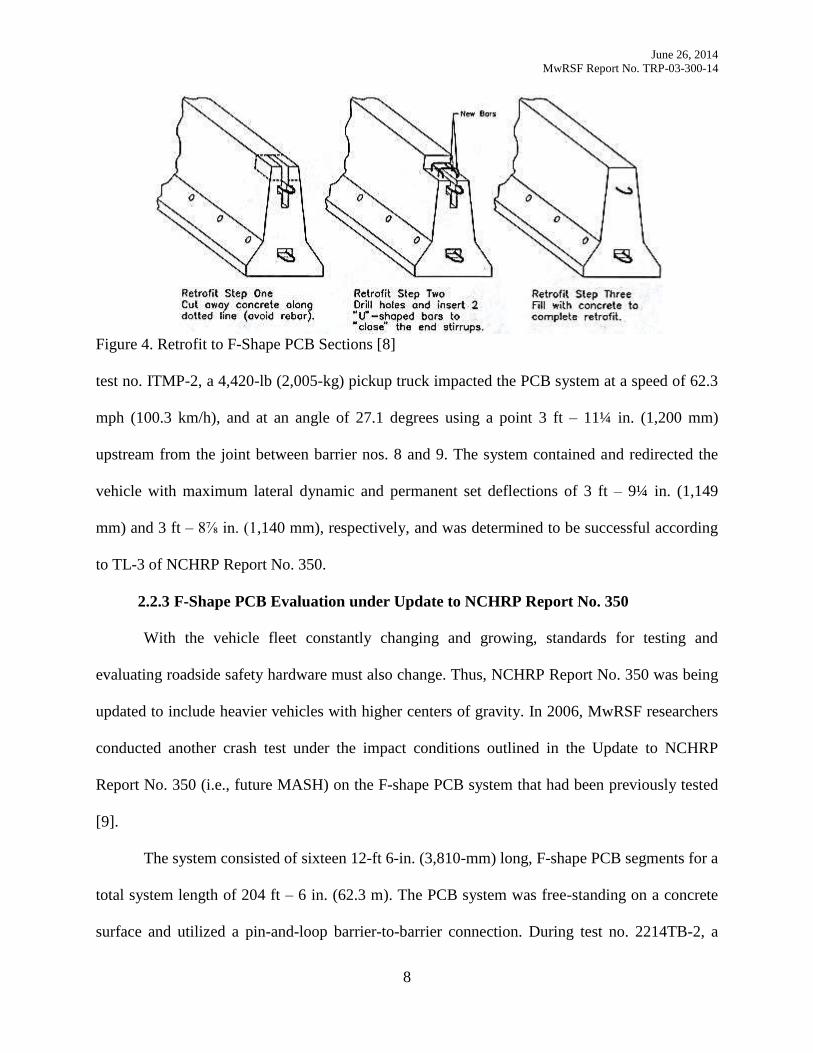
Upon inspection of the damaged barrier system, it was discovered that considerable
damage occurred at the barrier joints. It was determined that this damage was likely caused by
the weakened recessed areas located at the top end of each barrier segment. The recessed areas
were incorporated for future use in implementing a rigid joint for permanent barrier installations.
In order to reduce joint rotations and prevent barrier uplift, it was necessary to strengthen the
barrier ends by eliminating the recessed areas. This retrofit was completed in a three-step
process, as shown in Figure 4.
The second system consisted of twenty-one 12-ft 6-in. (3,810-mm) long, F-shape PCB
segments for a total system length of 267 ft – 5½ in. (81.5 m). The PCB system was free-
standing on a concrete surface and utilized a pin-and-loop barrier-to-barrier connection. During
June 26, 2014
MwRSF Report No. TRP-03-300-14
8
Figure 4. Retrofit to F-Shape PCB Sections [8]
test no. ITMP-2, a 4,420-lb (2,005-kg) pickup truck impacted the PCB system at a speed of 62.3
mph (100.3 km/h), and at an angle of 27.1 degrees using a point 3 ft – 11¼ in. (1,200 mm)
upstream from the joint between barrier nos. 8 and 9. The system contained and redirected the
vehicle with maximum lateral dynamic and permanent set deflections of 3 ft – 9¼ in. (1,149
mm) and 3 ft – 8⅞ in. (1,140 mm), respectively, and was determined to be successful according
to TL-3 of NCHRP Report No. 350.
2.2.3 F-Shape PCB Evaluation under Update to NCHRP Report No. 350
With the vehicle fleet constantly changing and growing, standards for testing and
evaluating roadside safety hardware must also change. Thus, NCHRP Report No. 350 was being
updated to include heavier vehicles with higher centers of gravity. In 2006, MwRSF researchers
conducted another crash test under the impact conditions outlined in the Update to NCHRP
Report No. 350 (i.e., future MASH) on the F-shape PCB system that had been previously tested
[9].
The system consisted of sixteen 12-ft 6-in. (3,810-mm) long, F-shape PCB segments for a
total system length of 204 ft – 6 in. (62.3 m). The PCB system was free-standing on a concrete
surface and utilized a pin-and-loop barrier-to-barrier connection. During test no. 2214TB-2, a
June 26, 2014
MwRSF Report No. TRP-03-300-14
9
5,000-lb (2,268-kg) pickup truck impacted the system 48 in. (1,219 mm) upstream from the joint
between barrier nos. 8 and 9 at a speed of 61.9 mph (99.6 km/h), and at an angle of 25.4 degrees.
The system contained and redirected the vehicle with maximum lateral dynamic and permanent
set deflections of 6 ft – 7⅝ in. (2,022 mm) and 6 ft – 1 in. (1,854 mm), respectively, and was
found to be successful according to the TL-3 criteria published in the Update to NCHRP Report
No. 350.
2.3 Testing of Pinned and Anchored PCBs
2.3.1 Limited-Slip PCB Connection
In 1993, researchers at TTI conducted a study into limited-displacement PCB systems
immediately adjacent to vertical drop-offs for the Texas Department of Transportation (TxDOT)
[10]. There are circumstances that require PCB systems to be positioned immediately adjacent to
vertical drop-offs in temporary work zones. During these cases, there is insufficient lateral space
for displacement of free-standing PCB systems during crash events. Two different barrier-to-
barrier connection types were used in this study, and test results from free-standing and anchored
configurations were compared. The two different barrier-to-barrier connection types included a
channel/angle-splice connection and a grid-slot connection. Five full-scale tests were conducted
using 30-ft (9.1-m) long, New Jersey safety-shape PCB segments, and are discussed below.
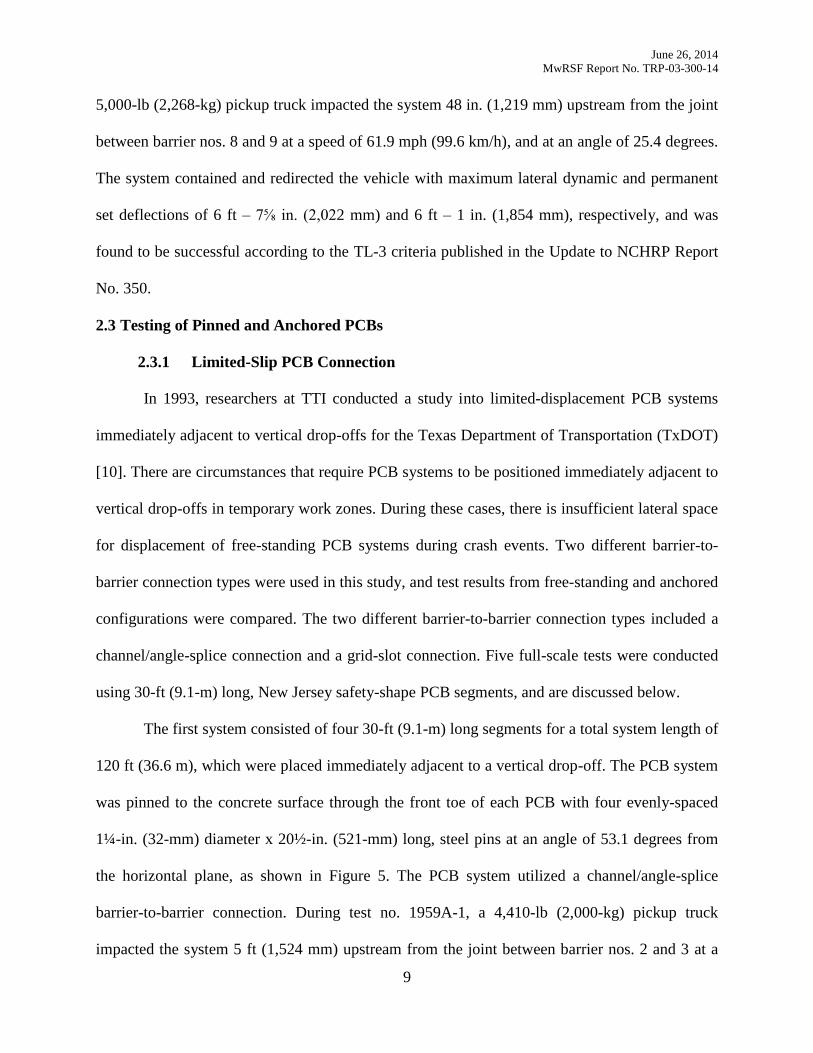
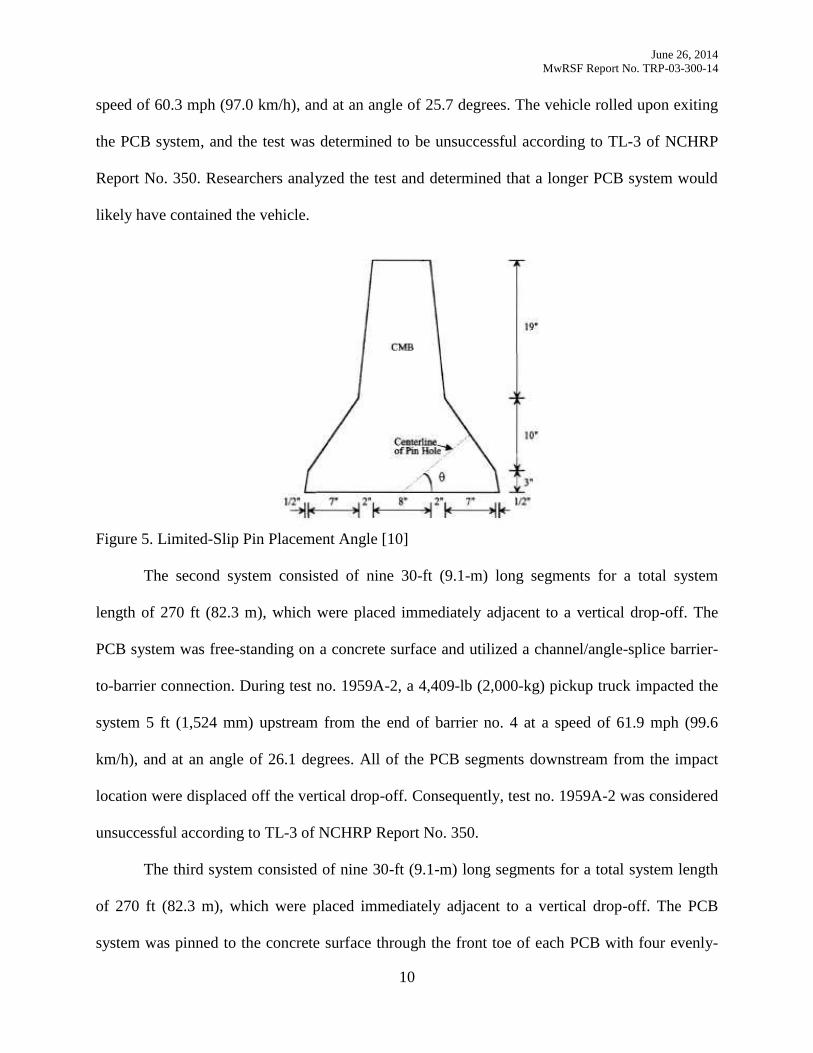
The first system consisted of four 30-ft (9.1-m) long segments for a total system length of
120 ft (36.6 m), which were placed immediately adjacent to a vertical drop-off. The PCB system
was pinned to the concrete surface through the front toe of each PCB with four evenly-spaced
1¼-in. (32-mm) diameter x 20½-in. (521-mm) long, steel pins at an angle of 53.1 degrees from
the horizontal plane, as shown in Figure 5. The PCB system utilized a channel/angle-splice
barrier-to-barrier connection. During test no. 1959A-1, a 4,410-lb (2,000-kg) pickup truck
impacted the system 5 ft (1,524 mm) upstream from the joint between barrier nos. 2 and 3 at a
June 26, 2014
MwRSF Report No. TRP-03-300-14
10
speed of 60.3 mph (97.0 km/h), and at an angle of 25.7 degrees. The vehicle rolled upon exiting
the PCB system, and the test was determined to be unsuccessful according to TL-3 of NCHRP
Report No. 350. Researchers analyzed the test and determined that a longer PCB system would
likely have contained the vehicle.
Figure 5. Limited-Slip Pin Placement Angle [10]
The second system consisted of nine 30-ft (9.1-m) long segments for a total system
length of 270 ft (82.3 m), which were placed immediately adjacent to a vertical drop-off. The
PCB system was free-standing on a concrete surface and utilized a channel/angle-splice barrier-
to-barrier connection. During test no. 1959A-2, a 4,409-lb (2,000-kg) pickup truck impacted the
system 5 ft (1,524 mm) upstream from the end of barrier no. 4 at a speed of 61.9 mph (99.6
km/h), and at an angle of 26.1 degrees. All of the PCB segments downstream from the impact
location were displaced off the vertical drop-off. Consequently, test no. 1959A-2 was considered
unsuccessful according to TL-3 of NCHRP Report No. 350.
The third system consisted of nine 30-ft (9.1-m) long segments for a total system length
of 270 ft (82.3 m), which were placed immediately adjacent to a vertical drop-off. The PCB
system was pinned to the concrete surface through the front toe of each PCB with four evenly-
June 26, 2014
MwRSF Report No. TRP-03-300-14
11
spaced 1¼-in. (32-mm) diameter x 20½-in. (521-mm) long, steel pins at an angle of 40.1 degrees
from the horizontal plane. The PCB system utilized a channel/angle-splice barrier-to-barrier
connection. During test no. 1959A-3, a 4,409-lb (2,000-kg) pickup truck impacted the system 5
ft (1,524 mm) upstream from the end of barrier no. 4 at a speed of 60.6 mph (97.5 km/h), and at
an angle of 26.2 degrees. The system contained and redirected the vehicle with a maximum
lateral permanent set deflection of 5 in. (127 mm) and was considered successful according to
TL-3 of NCHRP Report No. 350.
The fourth system consisted of nine 30-ft (9.1-m) long segments for a total system length
of 270 ft (82.3 m), which were placed immediately adjacent to a vertical drop-off. The PCB
system was pinned to the concrete surface through the front toe of each PCB with four, evenly-
spaced, 1¼-in. (32-mm) diameter x 20½-in. (521-mm) long, steel pins at an angle of 40.1
degrees from the horizontal plane. The PCB system utilized a grid-slot barrier-to-barrier
connection. During test no. 1959A-4, a 4,409-lb (2,000-kg) pickup truck impacted the system 5
ft (1,524 mm) upstream from the end of barrier no. 2 at a speed of 60.9 mph (98.0 km/h), and at
an angle of 23.7 degrees. The vehicle came to a rest on top of the PCB system with a maximum
lateral permanent set barrier deflection of 9 in. (229 mm) and was considered successful
according to TL-3 of NCHRP Report No. 350.
The fifth system consisted of nine 30-ft (9.1-m) long segments for a total system length
of 270 ft (82.3 m), which were placed immediately adjacent to a vertical drop-off. The PCB
system was free-standing on a concrete surface and utilized a grid-slot connection. During test
no. 1959A-5, a 4,409-lb (2,000-kg) pickup truck impacted the system 4 ft – 6 in. (1,372 mm)
upstream from the end of barrier no. 2 at a speed of 44.6 mph (71.8 km/h), and at an angle of
25.0 degrees. Two PCB segments were displaced off the vertical drop-off, and the vehicle rolled
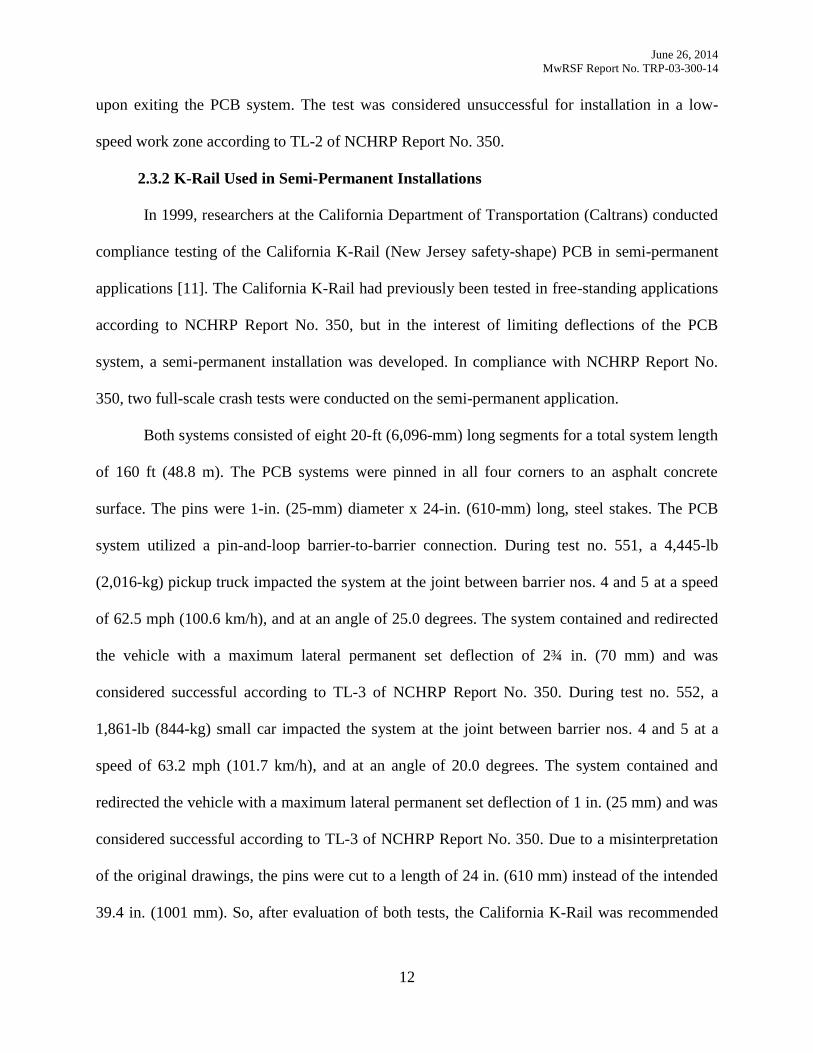
June 26, 2014
MwRSF Report No. TRP-03-300-14
12
upon exiting the PCB system. The test was considered unsuccessful for installation in a low-
speed work zone according to TL-2 of NCHRP Report No. 350.
2.3.2 K-Rail Used in Semi-Permanent Installations
In 1999, researchers at the California Department of Transportation (Caltrans) conducted
compliance testing of the California K-Rail (New Jersey safety-shape) PCB in semi-permanent
applications [11]. The California K-Rail had previously been tested in free-standing applications
according to NCHRP Report No. 350, but in the interest of limiting deflections of the PCB
system, a semi-permanent installation was developed. In compliance with NCHRP Report No.
350, two full-scale crash tests were conducted on the semi-permanent application.
Both systems consisted of eight 20-ft (6,096-mm) long segments for a total system length
of 160 ft (48.8 m). The PCB systems were pinned in all four corners to an asphalt concrete
surface. The pins were 1-in. (25-mm) diameter x 24-in. (610-mm) long, steel stakes. The PCB
system utilized a pin-and-loop barrier-to-barrier connection. During test no. 551, a 4,445-lb
(2,016-kg) pickup truck impacted the system at the joint between barrier nos. 4 and 5 at a speed
of 62.5 mph (100.6 km/h), and at an angle of 25.0 degrees. The system contained and redirected
the vehicle with a maximum lateral permanent set deflection of 2¾ in. (70 mm) and was
considered successful according to TL-3 of NCHRP Report No. 350. During test no. 552, a
1,861-lb (844-kg) small car impacted the system at the joint between barrier nos. 4 and 5 at a
speed of 63.2 mph (101.7 km/h), and at an angle of 20.0 degrees. The system contained and
redirected the vehicle with a maximum lateral permanent set deflection of 1 in. (25 mm) and was
considered successful according to TL-3 of NCHRP Report No. 350. Due to a misinterpretation
of the original drawings, the pins were cut to a length of 24 in. (610 mm) instead of the intended
39.4 in. (1001 mm). So, after evaluation of both tests, the California K-Rail was recommended
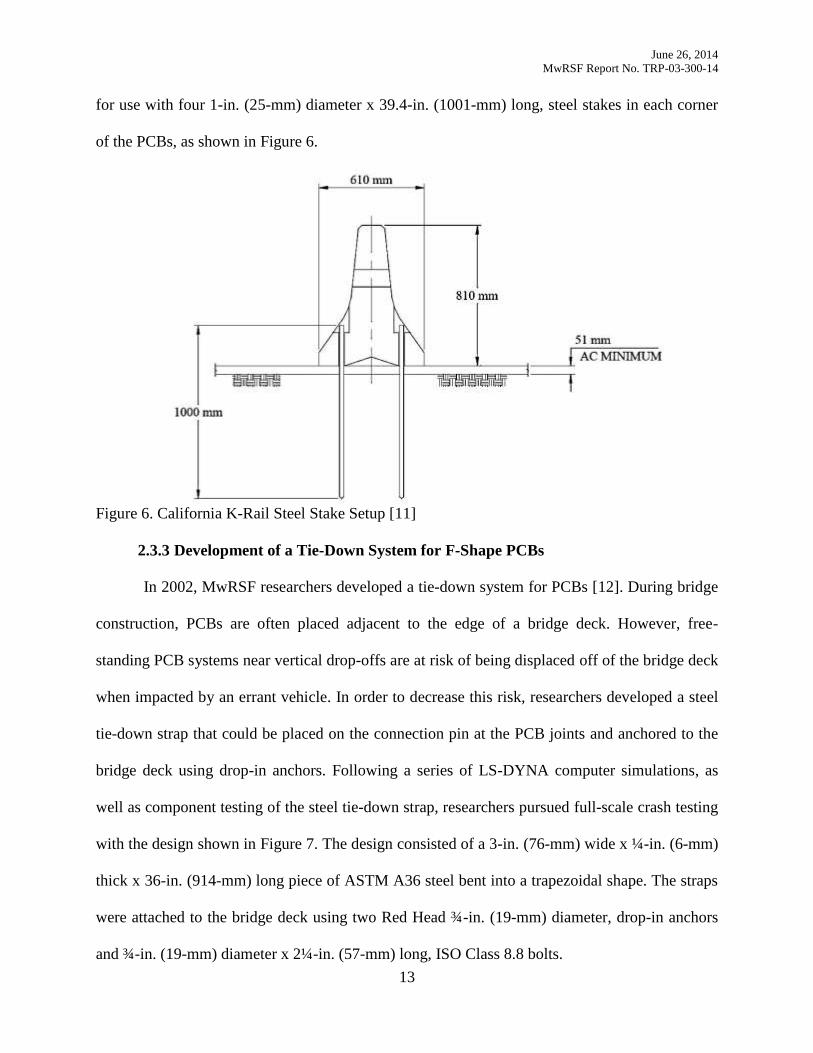
June 26, 2014
MwRSF Report No. TRP-03-300-14
13
for use with four 1-in. (25-mm) diameter x 39.4-in. (1001-mm) long, steel stakes in each corner
of the PCBs, as shown in Figure 6.
Figure 6. California K-Rail Steel Stake Setup [11]
2.3.3 Development of a Tie-Down System for F-Shape PCBs
In 2002, MwRSF researchers developed a tie-down system for PCBs [12]. During bridge
construction, PCBs are often placed adjacent to the edge of a bridge deck. However, free-
standing PCB systems near vertical drop-offs are at risk of being displaced off of the bridge deck
when impacted by an errant vehicle. In order to decrease this risk, researchers developed a steel
tie-down strap that could be placed on the connection pin at the PCB joints and anchored to the
bridge deck using drop-in anchors. Following a series of LS-DYNA computer simulations, as
well as component testing of the steel tie-down strap, researchers pursued full-scale crash testing
with the design shown in Figure 7. The design consisted of a 3-in. (76-mm) wide x ¼-in. (6-mm)
thick x 36-in. (914-mm) long piece of ASTM A36 steel bent into a trapezoidal shape. The straps
were attached to the bridge deck using two Red Head ¾-in. (19-mm) diameter, drop-in anchors
and ¾-in. (19-mm) diameter x 2¼-in. (57-mm) long, ISO Class 8.8 bolts.
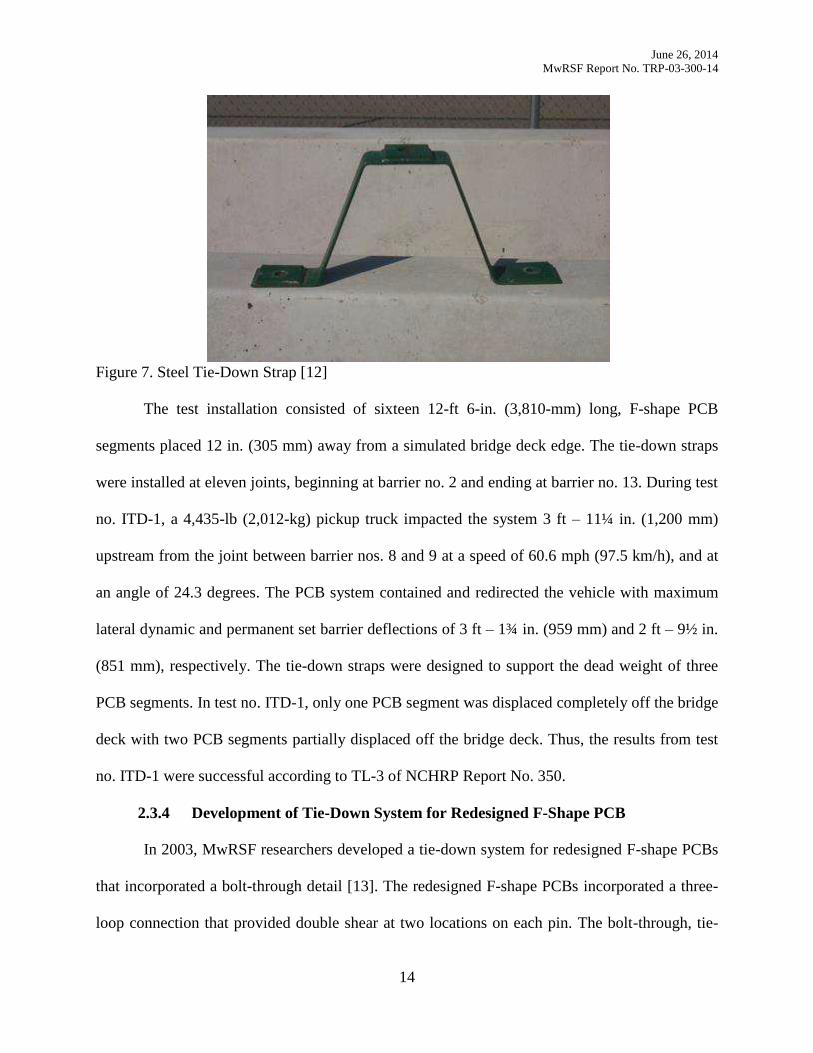
June 26, 2014
MwRSF Report No. TRP-03-300-14
14
Figure 7. Steel Tie-Down Strap [12]
The test installation consisted of sixteen 12-ft 6-in. (3,810-mm) long, F-shape PCB
segments placed 12 in. (305 mm) away from a simulated bridge deck edge. The tie-down straps
were installed at eleven joints, beginning at barrier no. 2 and ending at barrier no. 13. During test
no. ITD-1, a 4,435-lb (2,012-kg) pickup truck impacted the system 3 ft – 11¼ in. (1,200 mm)
upstream from the joint between barrier nos. 8 and 9 at a speed of 60.6 mph (97.5 km/h), and at
an angle of 24.3 degrees. The PCB system contained and redirected the vehicle with maximum
lateral dynamic and permanent set barrier deflections of 3 ft – 1¾ in. (959 mm) and 2 ft – 9½ in.
(851 mm), respectively. The tie-down straps were designed to support the dead weight of three
PCB segments. In test no. ITD-1, only one PCB segment was displaced completely off the bridge
deck with two PCB segments partially displaced off the bridge deck. Thus, the results from test
no. ITD-1 were successful according to TL-3 of NCHRP Report No. 350.
2.3.4 Development of Tie-Down System for Redesigned F-Shape PCB
In 2003, MwRSF researchers developed a tie-down system for redesigned F-shape PCBs
that incorporated a bolt-through detail [13]. The redesigned F-shape PCBs incorporated a three-
loop connection that provided double shear at two locations on each pin. The bolt-through, tie-
June 26, 2014
MwRSF Report No. TRP-03-300-14
15
down system consisted of three 1⅛-in. (29-mm) diameter, ASTM A307 anchor bolts with heavy
hex nuts and 3-in. (76-mm) x 3-in. (76-mm) x ½-in. (13-mm) thick washers spaced evenly across
the traffic side of each PCB segment, as shown in Figure 8. Each anchor bolt was epoxied into
the concrete with an embedment depth of 12 in. (305 mm).
The test installation consisted of sixteen 12-ft 6-in. (3,810-mm) long, redesigned F-shape
PCB segments placed adjacent to a simulated bridge deck edge with a total system length of 204
ft (62.2 m). During test no. KTB-1, a 4,448-lb (2,018-kg) pickup truck impacted the system 5 ft –
5 in. (1,651 mm) upstream from the joint between barrier nos. 8 and 9 at a speed of 62.0 mph
(99.8 km/h), and at an angle of 25.3 degrees. The system contained and redirected the vehicle
with maximum lateral dynamic and permanent set deflections of 11.3 in. (287 mm) and 3½ in.
(89 mm), respectively, and was considered successful according to TL-3 of NCHRP Report No.
350.
Figure 8. Tie-Down System for Redesigned F-Shape PCB [13]
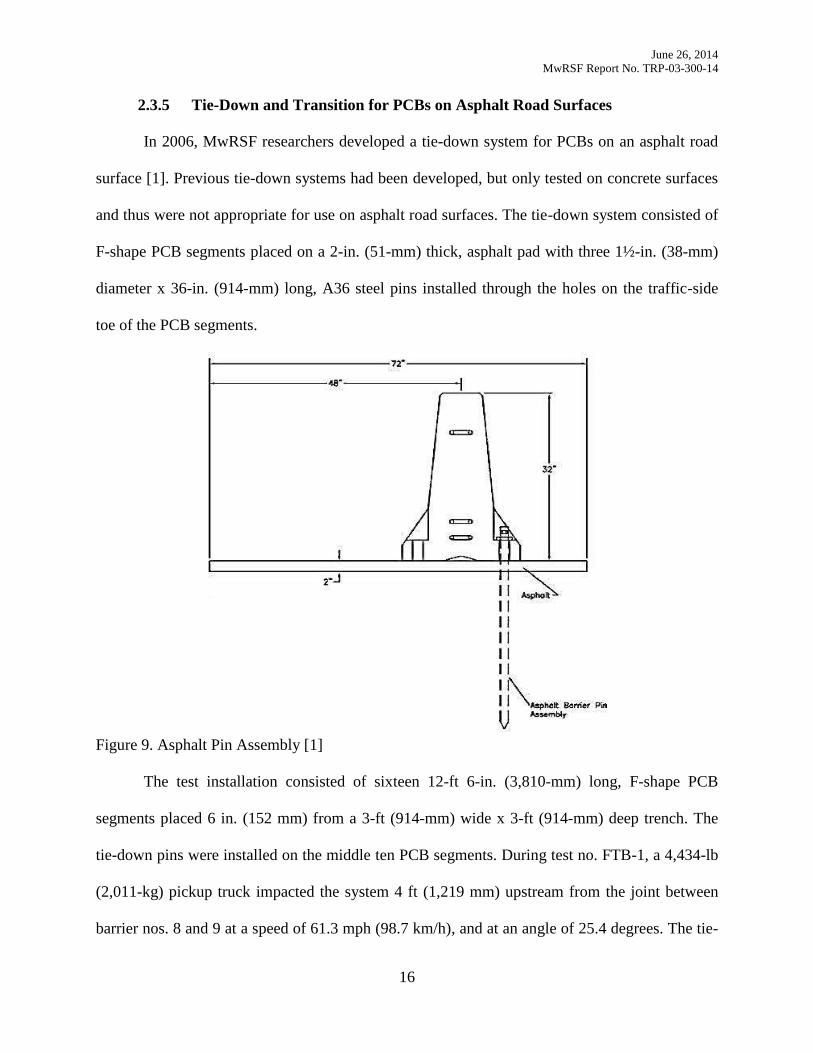
June 26, 2014
MwRSF Report No. TRP-03-300-14
16
2.3.5 Tie-Down and Transition for PCBs on Asphalt Road Surfaces
In 2006, MwRSF researchers developed a tie-down system for PCBs on an asphalt road
surface [1]. Previous tie-down systems had been developed, but only tested on concrete surfaces
and thus were not appropriate for use on asphalt road surfaces. The tie-down system consisted of
F-shape PCB segments placed on a 2-in. (51-mm) thick, asphalt pad with three 1½-in. (38-mm)
diameter x 36-in. (914-mm) long, A36 steel pins installed through the holes on the traffic-side
toe of the PCB segments.
Figure 9. Asphalt Pin Assembly [1]
The test installation consisted of sixteen 12-ft 6-in. (3,810-mm) long, F-shape PCB
segments placed 6 in. (152 mm) from a 3-ft (914-mm) wide x 3-ft (914-mm) deep trench. The
tie-down pins were installed on the middle ten PCB segments. During test no. FTB-1, a 4,434-lb
(2,011-kg) pickup truck impacted the system 4 ft (1,219 mm) upstream from the joint between
barrier nos. 8 and 9 at a speed of 61.3 mph (98.7 km/h), and at an angle of 25.4 degrees. The tie-
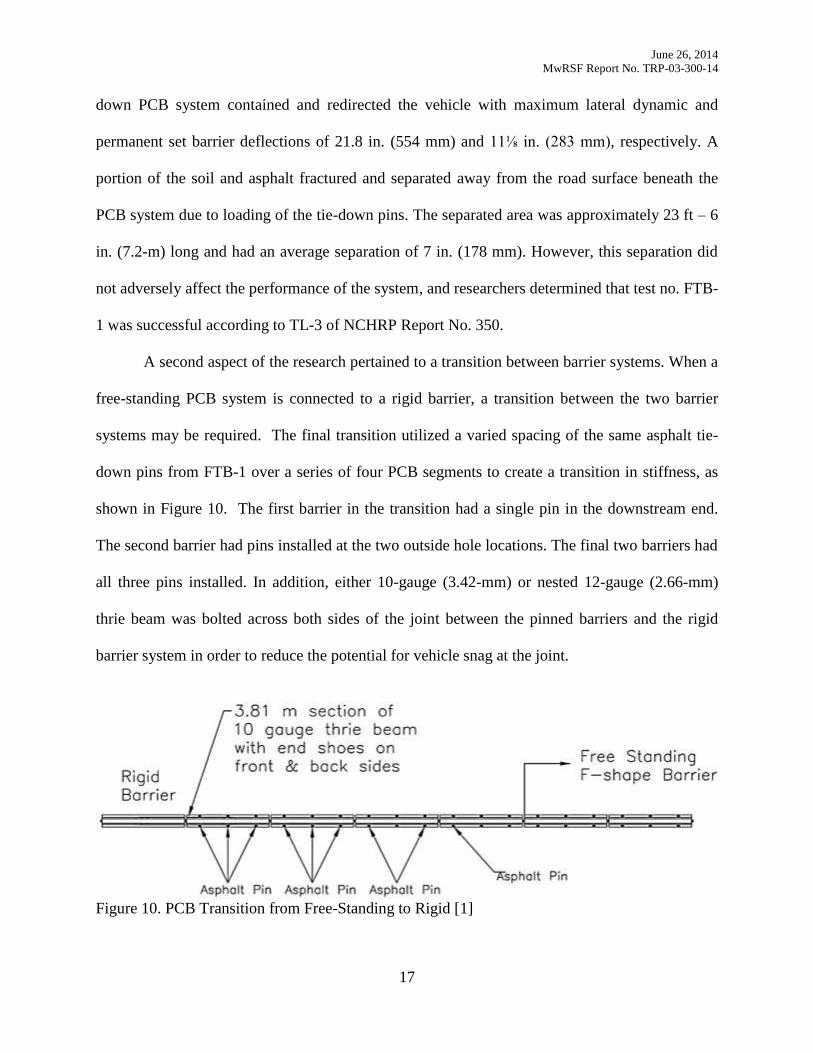
June 26, 2014
MwRSF Report No. TRP-03-300-14
17
down PCB system contained and redirected the vehicle with maximum lateral dynamic and
permanent set barrier deflections of 21.8 in. (554 mm) and 11⅛ in. (283 mm), respectively. A
portion of the soil and asphalt fractured and separated away from the road surface beneath the
PCB system due to loading of the tie-down pins. The separated area was approximately 23 ft – 6
in. (7.2-m) long and had an average separation of 7 in. (178 mm). However, this separation did
not adversely affect the performance of the system, and researchers determined that test no. FTB-
1 was successful according to TL-3 of NCHRP Report No. 350.
A second aspect of the research pertained to a transition between barrier systems. When a
free-standing PCB system is connected to a rigid barrier, a transition between the two barrier
systems may be required. The final transition utilized a varied spacing of the same asphalt tie-
down pins from FTB-1 over a series of four PCB segments to create a transition in stiffness, as
shown in Figure 10. The first barrier in the transition had a single pin in the downstream end.
The second barrier had pins installed at the two outside hole locations. The final two barriers had
all three pins installed. In addition, either 10-gauge (3.42-mm) or nested 12-gauge (2.66-mm)
thrie beam was bolted across both sides of the joint between the pinned barriers and the rigid
barrier system in order to reduce the potential for vehicle snag at the joint.
Figure 10. PCB Transition from Free-Standing to Rigid [1]
June 26, 2014
MwRSF Report No. TRP-03-300-14
18
The test installation consisted of twenty-two 12-ft 6-in. (3,810-mm) long, F-shape PCB
segments: five rigidly constrained barriers, four transition barriers, and thirteen free-standing
barriers. All four transition barriers and twelve of the free-standing barriers were installed on a 2-
in. (51-mm) thick, asphalt pad, while the five rigidly-constrained barriers and one free-standing
barrier were installed on a concrete surface. During test no. FTB-2, a 4,475-lb (2,030-kg) pickup
truck impacted the system 4 ft (1,219 mm) upstream from the joint between barrier nos. 8 and 9
at a speed of 63.8 mph (102.7 km/h), and at an angle of 26.1 degrees. The tie-down PCB
transition system contained and redirected the vehicle with maximum lateral dynamic and
permanent set barrier deflections of 18⅜ in. (467 mm) and 5¼ in. (133 mm), respectively, and
was determined to be successful according to TL-3 of NCHRP Report No. 350.
2.3.6 PCB Transition to Tall Permanent Concrete Median Barrier
In 2010, MwRSF researchers developed a transition between a free-standing PCB system
and a permanent concrete barrier for median applications [2]. The permanent concrete barrier
chosen for testing was the 42-in. (1,067-mm) tall, single-slope median barrier, while the PCB
was a 32-in. (813-mm) tall, F-shape barrier. The system consisted of eight free-standing barriers,
four transition barriers, and a rigid parapet. The free-standing and transition barriers were
installed on a 3-in. (76-mm) thick, asphalt pad. The transition barriers used a varied spacing of
asphalt pins to create a transition in stiffness over four barriers. The asphalt pins used were 1½-
in. (38-mm) diameter x 38½-in. (978-mm) long, ASTM A36 steel pins with a steel cap plate on
the top. The first barrier in the transition (adjacent to the free-standing barrier) had a single pin at
the downstream end through both the front- and back-side toes. The second barrier had pins
installed at the two outermost hole locations on both the front- and back-side toes. The third and
fourth transition barriers had all three pins installed on both the front- and back-side toes. In
order to prevent vehicle snag, nested 12-gauge (2.66-mm) thrie beam sections were installed on
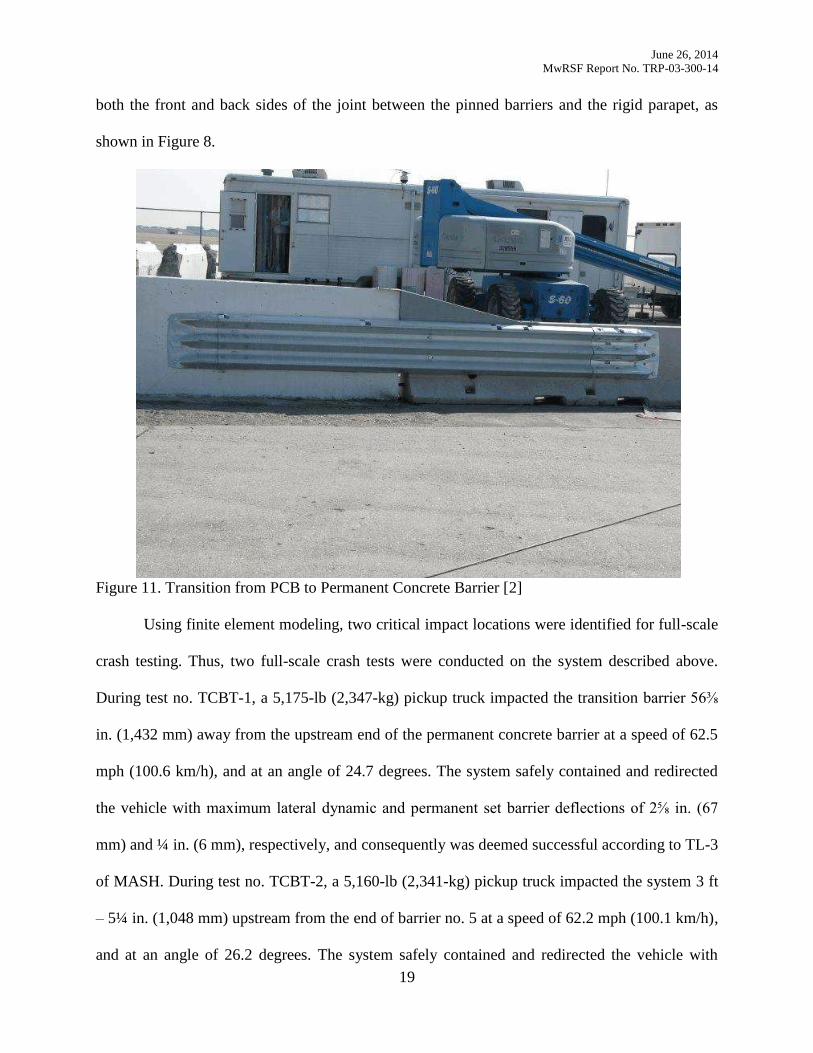
June 26, 2014
MwRSF Report No. TRP-03-300-14
19
both the front and back sides of the joint between the pinned barriers and the rigid parapet, as
shown in Figure 8.
Figure 11. Transition from PCB to Permanent Concrete Barrier [2]
Using finite element modeling, two critical impact locations were identified for full-scale
crash testing. Thus, two full-scale crash tests were conducted on the system described above.
During test no. TCBT-1, a 5,175-lb (2,347-kg) pickup truck impacted the transition barrier 56⅜
in. (1,432 mm) away from the upstream end of the permanent concrete barrier at a speed of 62.5
mph (100.6 km/h), and at an angle of 24.7 degrees. The system safely contained and redirected
the vehicle with maximum lateral dynamic and permanent set barrier deflections of 2⅝ in. (67
mm) and ¼ in. (6 mm), respectively, and consequently was deemed successful according to TL-3
of MASH. During test no. TCBT-2, a 5,160-lb (2,341-kg) pickup truck impacted the system 3 ft
– 5¼ in. (1,048 mm) upstream from the end of barrier no. 5 at a speed of 62.2 mph (100.1 km/h),
and at an angle of 26.2 degrees. The system safely contained and redirected the vehicle with
June 26, 2014
MwRSF Report No. TRP-03-300-14
20
maximum lateral dynamic and permanent set barrier deflections of 34 in. (864 mm) and 34 in.
(864 mm), respectively, and consequently was deemed successful according to TL-3 of MASH.
2.3.7 Evaluation of 12-ft 6-in. Pinned F-Shape PCB
In 2006, TTI researchers evaluated mechanisms for limiting deflections of 12-ft 6-in.
(3,810-mm) long, F-shape PCB systems installed near extreme drop-offs [14]. From the
currently available PCB-restraining or -anchoring mechanisms, most designs required through-
deck bolting, anchor bolts with adhesive bonding, or other constraining straps. The goal of this
research was to develop an easy-to-install restraining mechanism to limit PCB deflections while
minimizing the damage to the bridge deck. The design incorporated two 1½-in. (38-mm)
diameter × 21¼-in. (540-mm) long, ASTM A36 steel drop-pins placed into 1⅞-in. (48-mm)
diameter holes cast into the toe of each PCB segment at an angle of 40 degrees from the
horizontal. The embedment depth of the drop-pins was 6¼ in. (159 mm), when measured
vertically. Each of the holes for the drop-pins was located 16 in. (406 mm) away from the ends
of the barrier segments on the traffic-side of the PCBs.
The test installation consisted of eight 12-ft 6-in. (3,810-mm) long, pinned F-shape PCB
segments placed adjacent to a simulated bridge deck edge with a total system length of 100 ft
(30.5 m). During test no. 405160-3-2a, a 4,674-lb (2,120-kg) pickup truck impacted the system 4
ft (1,219 mm) upstream from the joint between barrier nos. 3 and 4 at a speed of 62.7 mph (100.9
km/h), and at an angle of 25.4 degrees. The tie-down PCB transition system contained and
redirected the vehicle with maximum lateral dynamic and permanent set barrier deflections of
11½ in. (292 mm) and 5¾ in. (146 mm), respectively, and was determined to be successful
according to TL-3 of NCHRP Report No. 350.
June 26, 2014
MwRSF Report No. TRP-03-300-14
21
2.3.8 Pinned Anchorage System for New York State’s PCBs
In 2009, MwRSF researchers evaluated mechanisms for limiting deflections of New York
State’s New Jersey safety-shape PCB system [15]. For PCBs located adjacent to vertical drop-
offs, NYSDOT found it desirable to utilize vertical pins through the back-side toe of the PCBs in
order to reduce barrier deflections as well as to reduce the need for workers to be positioned on
the traffic-side face of the system when installing anchors. In an attempt to reduce construction
costs and damage to bridge decks, vertical pins were placed in every other PCB segment in order
to evaluate whether the barrier deflections would be maintained to reasonable levels. Four 1-in.
(25-mm) diameter x 15½-in. (394-mm) long, hot rolled ASTM A36 steel rods were used to pin
the PCB segments to the concrete surface through the back-side toe. Each anchor rod was
inserted into a 1⅛-in. (29-mm) diameter, drilled hole in the rigid concrete surface using an
embedment depth of 5 in. (127 mm), as shown in Figure 12.
The full-scale crash test consisted of ten 20-ft (6,096-mm) long, New Jersey safety-shape
PCB segments with a total system length of 200 ft (61.0 m). The PCB system utilized an I-beam
key connector barrier-to-barrier connection and only PCB segment nos. 1, 3, 5, 7, and 9 were
pinned to the concrete surface. During test no. NYTCB-4, a 5,172-lb (2,346-kg) pickup truck
impacted the system 513/16 in. (1,300 mm) upstream from the joint between barrier nos. 4 and 5
at a speed of 62.3 mph (100.3 km/h), and at an angle of 24.3 degrees. The pinned PCB system
contained and redirected the vehicle with maximum lateral dynamic and permanent set barrier
deflections of 64.8 in. (1,646 mm) and 53½ in. (1,359 mm), respectively, and was determined to
be successful according to TL-3 of MASH.
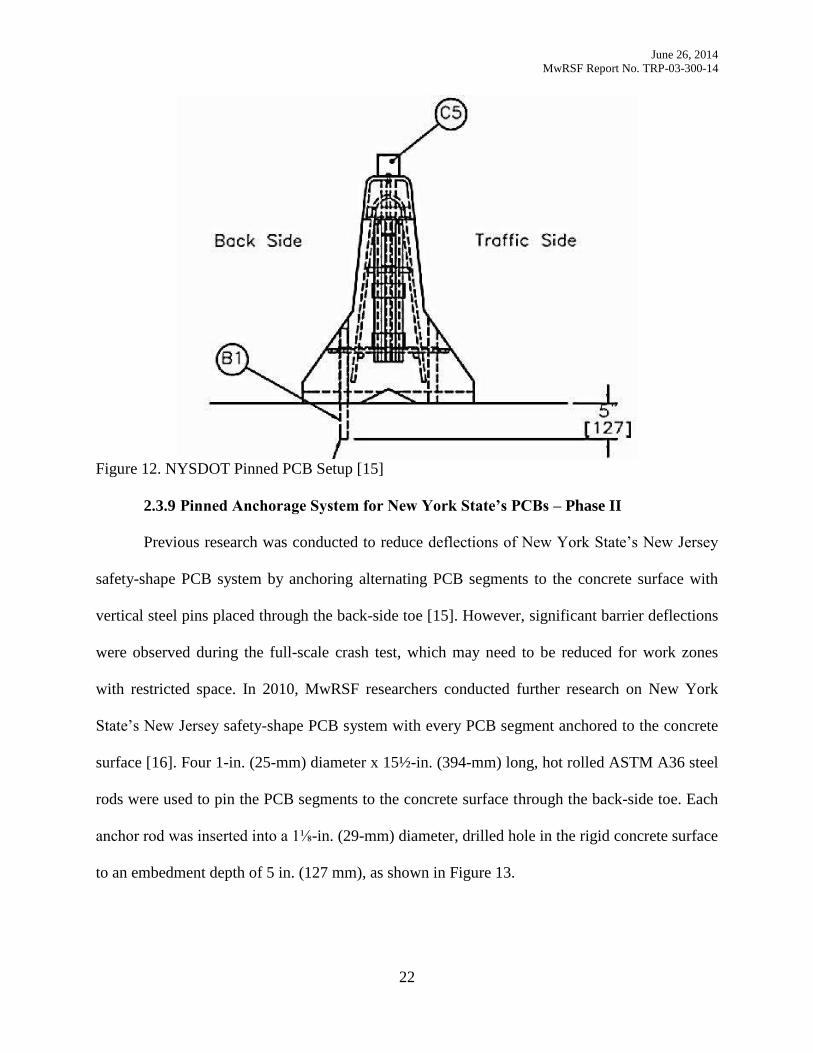
June 26, 2014
MwRSF Report No. TRP-03-300-14
22
Figure 12. NYSDOT Pinned PCB Setup [15]
2.3.9 Pinned Anchorage System for New York State’s PCBs – Phase II
Previous research was conducted to reduce deflections of New York State’s New Jersey
safety-shape PCB system by anchoring alternating PCB segments to the concrete surface with
vertical steel pins placed through the back-side toe [15]. However, significant barrier deflections
were observed during the full-scale crash test, which may need to be reduced for work zones
with restricted space. In 2010, MwRSF researchers conducted further research on New York
State’s New Jersey safety-shape PCB system with every PCB segment anchored to the concrete
surface [16]. Four 1-in. (25-mm) diameter x 15½-in. (394-mm) long, hot rolled ASTM A36 steel
rods were used to pin the PCB segments to the concrete surface through the back-side toe. Each
anchor rod was inserted into a 1⅛-in. (29-mm) diameter, drilled hole in the rigid concrete surface
to an embedment depth of 5 in. (127 mm), as shown in Figure 13.
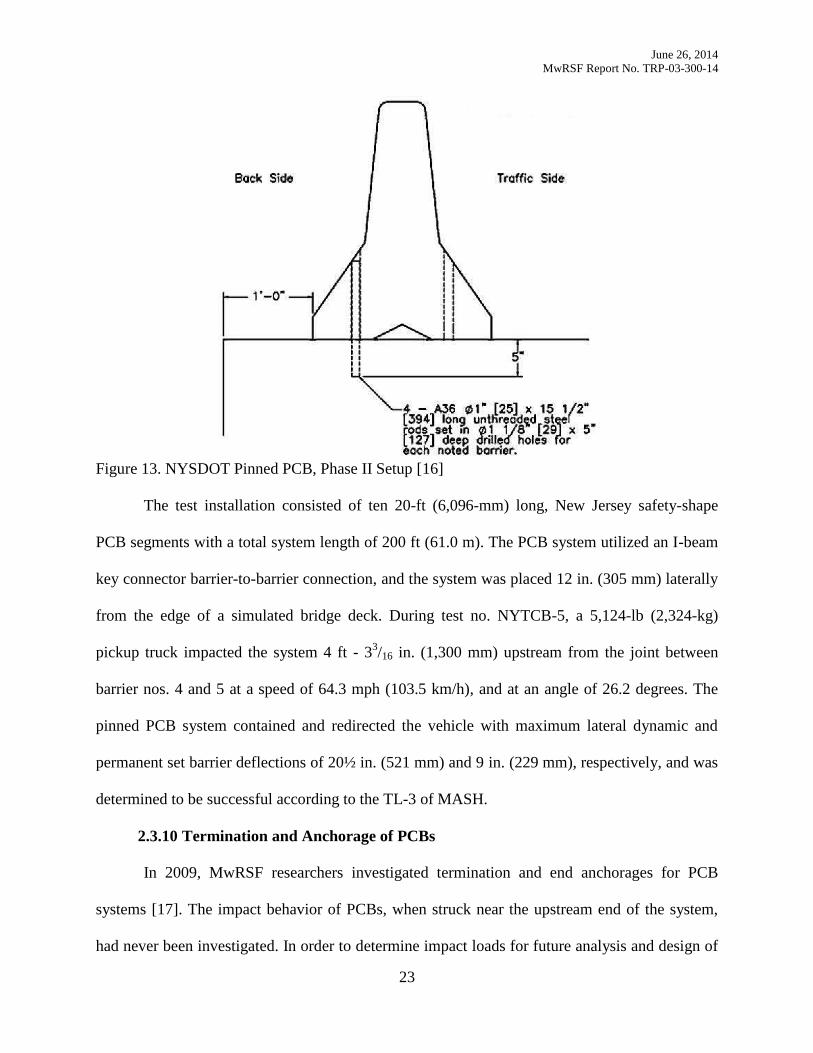
June 26, 2014
MwRSF Report No. TRP-03-300-14
23
Figure 13. NYSDOT Pinned PCB, Phase II Setup [16]
The test installation consisted of ten 20-ft (6,096-mm) long, New Jersey safety-shape
PCB segments with a total system length of 200 ft (61.0 m). The PCB system utilized an I-beam
key connector barrier-to-barrier connection, and the system was placed 12 in. (305 mm) laterally
from the edge of a simulated bridge deck. During test no. NYTCB-5, a 5,124-lb (2,324-kg)
pickup truck impacted the system 4 ft - 33/16 in. (1,300 mm) upstream from the joint between
barrier nos. 4 and 5 at a speed of 64.3 mph (103.5 km/h), and at an angle of 26.2 degrees. The
pinned PCB system contained and redirected the vehicle with maximum lateral dynamic and
permanent set barrier deflections of 20½ in. (521 mm) and 9 in. (229 mm), respectively, and was
determined to be successful according to the TL-3 of MASH.
2.3.10 Termination and Anchorage of PCBs
In 2009, MwRSF researchers investigated termination and end anchorages for PCB
systems [17]. The impact behavior of PCBs, when struck near the upstream end of the system,
had never been investigated. In order to determine impact loads for future analysis and design of
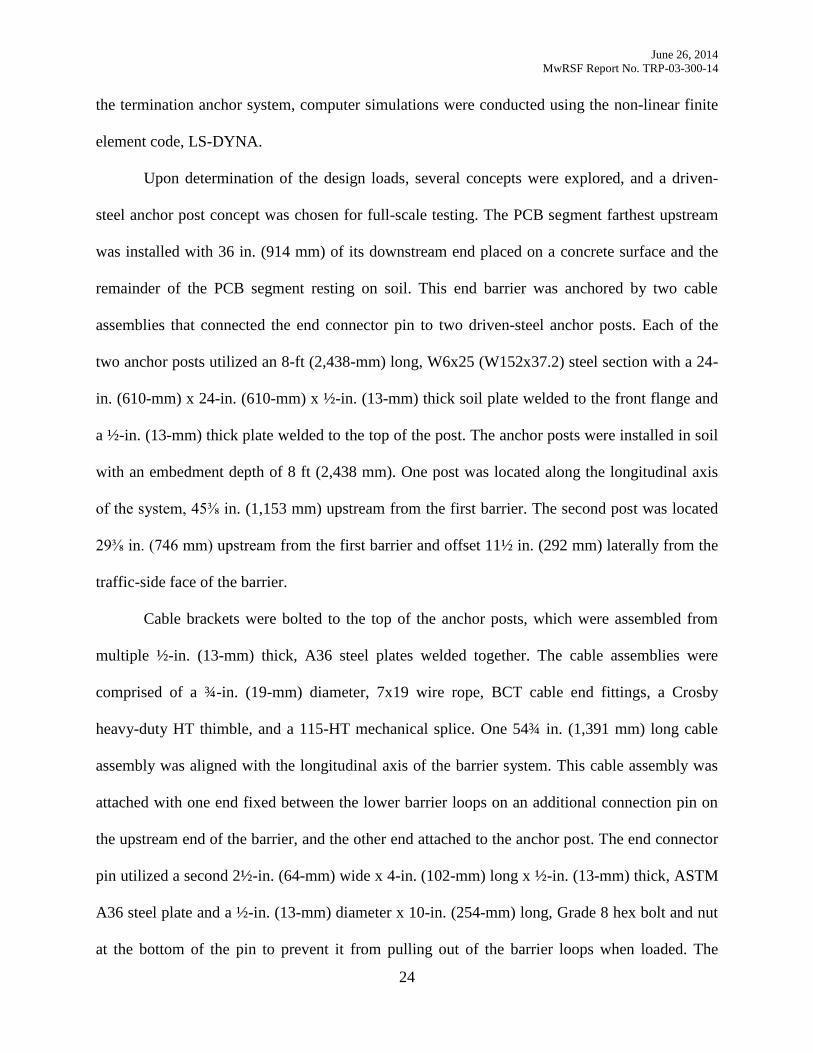
June 26, 2014
MwRSF Report No. TRP-03-300-14
24
the termination anchor system, computer simulations were conducted using the non-linear finite
element code, LS-DYNA.
Upon determination of the design loads, several concepts were explored, and a driven-
steel anchor post concept was chosen for full-scale testing. The PCB segment farthest upstream
was installed with 36 in. (914 mm) of its downstream end placed on a concrete surface and the
remainder of the PCB segment resting on soil. This end barrier was anchored by two cable
assemblies that connected the end connector pin to two driven-steel anchor posts. Each of the
two anchor posts utilized an 8-ft (2,438-mm) long, W6x25 (W152x37.2) steel section with a 24-
in. (610-mm) x 24-in. (610-mm) x ½-in. (13-mm) thick soil plate welded to the front flange and
a ½-in. (13-mm) thick plate welded to the top of the post. The anchor posts were installed in soil
with an embedment depth of 8 ft (2,438 mm). One post was located along the longitudinal axis
of the system, 45⅜ in. (1,153 mm) upstream from the first barrier. The second post was located
29⅜ in. (746 mm) upstream from the first barrier and offset 11½ in. (292 mm) laterally from the
traffic-side face of the barrier.
Cable brackets were bolted to the top of the anchor posts, which were assembled from
multiple ½-in. (13-mm) thick, A36 steel plates welded together. The cable assemblies were
comprised of a ¾-in. (19-mm) diameter, 7x19 wire rope, BCT cable end fittings, a Crosby
heavy-duty HT thimble, and a 115-HT mechanical splice. One 54¾ in. (1,391 mm) long cable
assembly was aligned with the longitudinal axis of the barrier system. This cable assembly was
attached with one end fixed between the lower barrier loops on an additional connection pin on
the upstream end of the barrier, and the other end attached to the anchor post. The end connector
pin utilized a second 2½-in. (64-mm) wide x 4-in. (102-mm) long x ½-in. (13-mm) thick, ASTM
A36 steel plate and a ½-in. (13-mm) diameter x 10-in. (254-mm) long, Grade 8 hex bolt and nut
at the bottom of the pin to prevent it from pulling out of the barrier loops when loaded. The
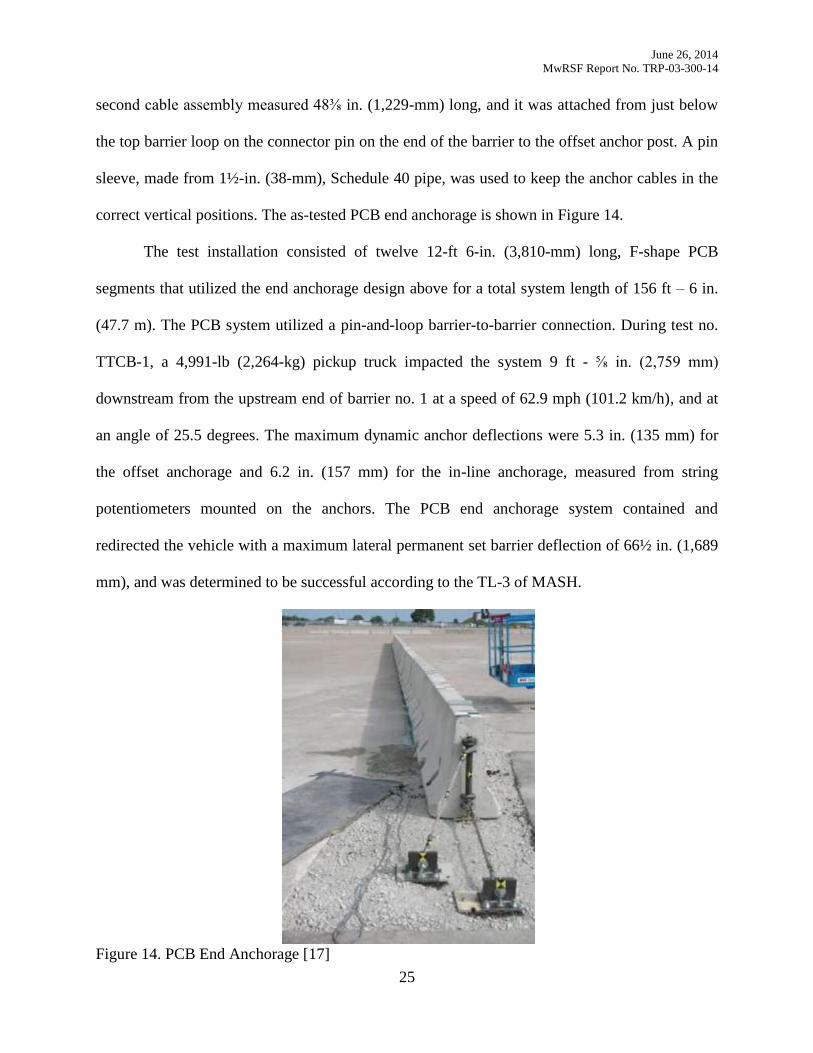
June 26, 2014
MwRSF Report No. TRP-03-300-14
25
second cable assembly measured 48⅜ in. (1,229-mm) long, and it was attached from just below
the top barrier loop on the connector pin on the end of the barrier to the offset anchor post. A pin
sleeve, made from 1½-in. (38-mm), Schedule 40 pipe, was used to keep the anchor cables in the
correct vertical positions. The as-tested PCB end anchorage is shown in Figure 14.
The test installation consisted of twelve 12-ft 6-in. (3,810-mm) long, F-shape PCB
segments that utilized the end anchorage design above for a total system length of 156 ft – 6 in.
(47.7 m). The PCB system utilized a pin-and-loop barrier-to-barrier connection. During test no.
TTCB-1, a 4,991-lb (2,264-kg) pickup truck impacted the system 9 ft - ⅝ in. (2,759 mm)
downstream from the upstream end of barrier no. 1 at a speed of 62.9 mph (101.2 km/h), and at
an angle of 25.5 degrees. The maximum dynamic anchor deflections were 5.3 in. (135 mm) for
the offset anchorage and 6.2 in. (157 mm) for the in-line anchorage, measured from string
potentiometers mounted on the anchors. The PCB end anchorage system contained and
redirected the vehicle with a maximum lateral permanent set barrier deflection of 66½ in. (1,689
mm), and was determined to be successful according to the TL-3 of MASH.
Figure 14. PCB End Anchorage [17]
June 26, 2014
MwRSF Report No. TRP-03-300-14
26
2.4 Testing of W-Beam Guardrail Systems
2.4.1 Guardrail Deflection Analysis – Phase I
In 2011, TTI researchers reviewed literature on previous full-scale crash tests of beam
guardrails tested in accordance with the criteria set forth in National Cooperative Highway
Research Program (NCHRP) Report No. 350 and Manual for Assessing Safety Hardware
(MASH) test no. 3-11 [18]. The guardrail systems were divided into one of five categories:
single 12-gauge (2.66-mm) W-beam rail, thrie beam rail, nested W-beam rail, 13-gauge (2.28-
mm) Buffalo W-beam rail, and W-beam rail designed for special applications. The single 12-
gauge (2.66-mm) W-beam rail category was of particular interest for this research, and the TTI
findings can be found in Appendix B. A performance summary of the 27¾-in. (705-mm) and 31-
in. (787-mm) tall guardrail systems can be found in Tables 2 and 3, respectively. Based on this
information, an average dynamic deflection of 39.7 in. (1,008 mm) and 41.4 in. (1,052 mm) was
calculated for the 27¾-in. (705-mm) and 31-in. (787-mm) tall guardrail systems, respectively.
An average permanent set deflection of 24.3 in. (617 mm) and 28.4 in. (721 mm) was also
calculated for the 27¾-in. (705-mm) and 31-in. (787-mm) tall guardrail systems, respectively.
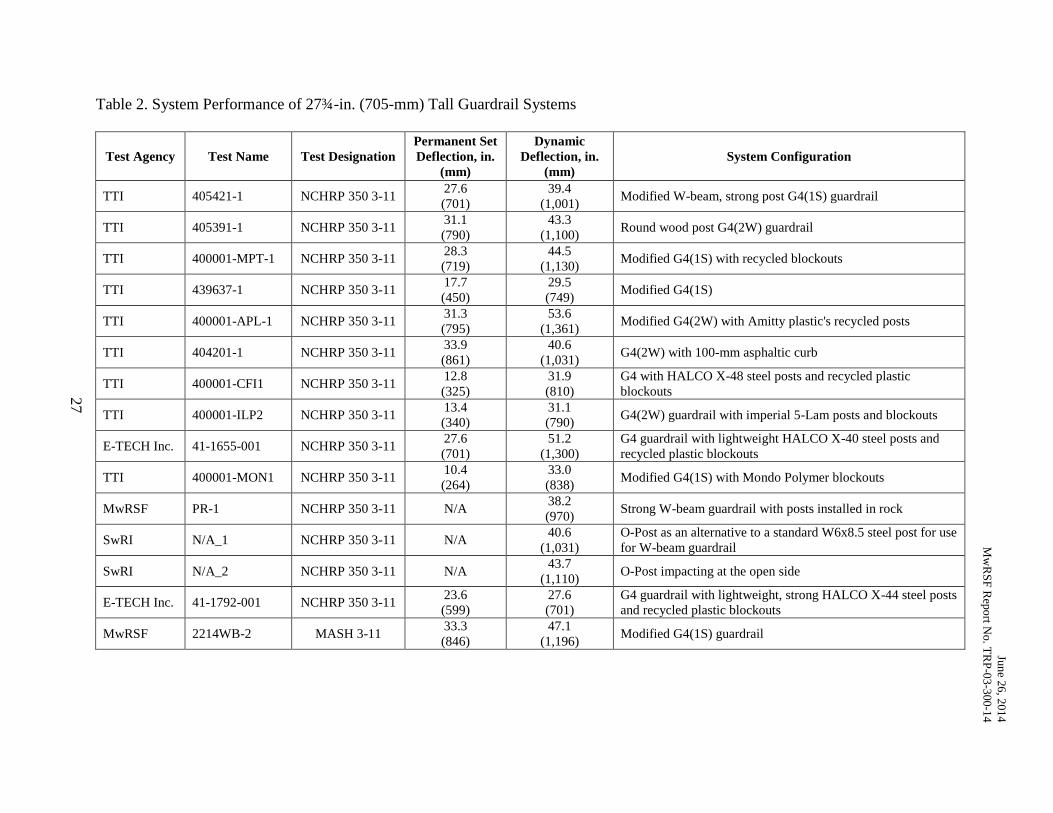
Jun
e 26
, 201
4
Mw
RS
F R
epo
rt No. T
RP
-03
-300-1
4
27
Table 2. System Performance of 27¾-in. (705-mm) Tall Guardrail Systems
Test Agency Test Name Test Designation
Permanent Set
Deflection, in.
(mm)
Dynamic
Deflection, in.
(mm)
System Configuration
TTI 405421-1 NCHRP 350 3-11 27.6
(701)
39.4
(1,001) Modified W-beam, strong post G4(1S) guardrail
TTI 405391-1 NCHRP 350 3-11 31.1
(790)
43.3
(1,100) Round wood post G4(2W) guardrail
TTI 400001-MPT-1 NCHRP 350 3-11 28.3
(719)
44.5
(1,130) Modified G4(1S) with recycled blockouts
TTI 439637-1 NCHRP 350 3-11 17.7
(450)
29.5
(749) Modified G4(1S)
TTI 400001-APL-1 NCHRP 350 3-11 31.3
(795)
53.6
(1,361) Modified G4(2W) with Amitty plastic's recycled posts
TTI 404201-1 NCHRP 350 3-11 33.9
(861)
40.6
(1,031) G4(2W) with 100-mm asphaltic curb
TTI 400001-CFI1 NCHRP 350 3-11 12.8
(325)
31.9
(810)
G4 with HALCO X-48 steel posts and recycled plastic
blockouts
TTI 400001-ILP2 NCHRP 350 3-11 13.4
(340)
31.1
(790) G4(2W) guardrail with imperial 5-Lam posts and blockouts
E-TECH Inc. 41-1655-001 NCHRP 350 3-11 27.6
(701)
51.2
(1,300)
G4 guardrail with lightweight HALCO X-40 steel posts and
recycled plastic blockouts
TTI 400001-MON1 NCHRP 350 3-11 10.4
(264)
33.0
(838) Modified G4(1S) with Mondo Polymer blockouts
MwRSF PR-1 NCHRP 350 3-11 N/A 38.2
(970) Strong W-beam guardrail with posts installed in rock
SwRI N/A_1 NCHRP 350 3-11 N/A 40.6
(1,031)
O-Post as an alternative to a standard W6x8.5 steel post for use
for W-beam guardrail
SwRI N/A_2 NCHRP 350 3-11 N/A 43.7
(1,110) O-Post impacting at the open side
E-TECH Inc. 41-1792-001 NCHRP 350 3-11 23.6
(599)
27.6
(701)
G4 guardrail with lightweight, strong HALCO X-44 steel posts
and recycled plastic blockouts
MwRSF 2214WB-2 MASH 3-11 33.3
(846)
47.1
(1,196) Modified G4(1S) guardrail
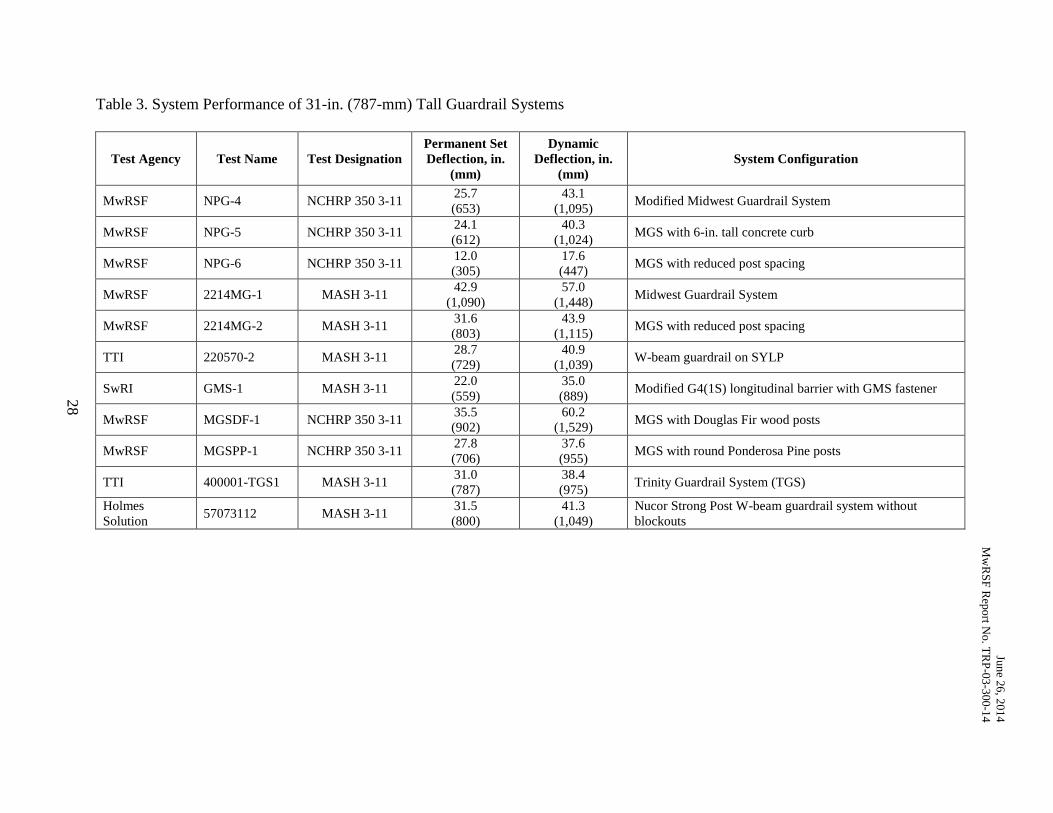
Jun
e 26
, 201
4
Mw
RS
F R
epo
rt No. T
RP
-03
-300-1
4
28
Table 3. System Performance of 31-in. (787-mm) Tall Guardrail Systems
Test Agency Test Name Test Designation
Permanent Set
Deflection, in.
(mm)
Dynamic
Deflection, in.
(mm)
System Configuration
MwRSF NPG-4 NCHRP 350 3-11 25.7
(653)
43.1
(1,095) Modified Midwest Guardrail System
MwRSF NPG-5 NCHRP 350 3-11 24.1
(612)
40.3
(1,024) MGS with 6-in. tall concrete curb
MwRSF NPG-6 NCHRP 350 3-11 12.0
(305)
17.6
(447) MGS with reduced post spacing
MwRSF 2214MG-1 MASH 3-11 42.9
(1,090)
57.0
(1,448) Midwest Guardrail System
MwRSF 2214MG-2 MASH 3-11 31.6
(803)
43.9
(1,115) MGS with reduced post spacing
TTI 220570-2 MASH 3-11 28.7
(729)
40.9
(1,039) W-beam guardrail on SYLP
SwRI GMS-1 MASH 3-11 22.0
(559)
35.0
(889) Modified G4(1S) longitudinal barrier with GMS fastener
MwRSF MGSDF-1 NCHRP 350 3-11 35.5
(902)
60.2
(1,529) MGS with Douglas Fir wood posts
MwRSF MGSPP-1 NCHRP 350 3-11 27.8
(706)
37.6
(955) MGS with round Ponderosa Pine posts
TTI 400001-TGS1 MASH 3-11 31.0
(787)
38.4
(975) Trinity Guardrail System (TGS)
Holmes
Solution 57073112 MASH 3-11
31.5
(800)
41.3
(1,049)
Nucor Strong Post W-beam guardrail system without
blockouts
June 26, 2014
MwRSF Report No. TRP-03-300-14
29
2.5 Testing of Transitions Between Different Barrier Types
2.5.1 Two Approach Guardrail Transitions for Concrete Safety Shape Barriers
In 1996, MwRSF researchers developed two guardrail-to-concrete safety-shape barrier
transitions [19]. One transition design was constructed using W6x9 (W152x13.4) steel posts, and
the other system was constructed using 6-in. x 8-in. (152-mm x 203-mm) wood posts. For both
systems, a varied post spacing consisted of one post at 11½ in. (292 mm), five at 18¾ in. (476
mm), and three at 37½ in. (953 mm). The steel- and wood-post versions of the approach
transition are shown in Figures 15 and 16, respectively. Two full-scale crash tests were
conducted on each approach transition design for a total of four tests.
The first full-scale crash test utilized steel posts with an embedment depth of 43 in.
(1,092 mm) in the thrie beam area. During test no. ITNJ-1, a 4,396-lb (1,994-kg) pickup truck
impacted the system 7 ft – 11⅞ in. (2,435 mm) upstream from the end of the concrete barrier at a
speed of 62.1 mph (99.9 km/h), and at an angle of 25.0 degrees. The system experienced larger
than expected deflections, which caused pocketing upstream of the bridge rail end. The
pocketing caused a high exit angle and eventually resulted in vehicle rollover. Consequently, the
performance of test no. ITNJ-1 was deemed unsuccessful according to TL-3 of NCHRP Report
No. 350.
Upon investigation of the results from test no. ITNJ-1, it was determined that the system
was not stiff enough near the bridge end. In order to increase the stiffness and strength, the post
embedment depth in the thrie beam area was increased to 49 in. (1,245 mm). Also, the upstream
corner on the traffic-side of the concrete bridge rail was chamfered in order to mitigate vehicle
snag. During test no. ITNJ-2, a 4,359-lb (1,977-kg) pickup truck impacted the system 7 ft – 11⅞
in. (2,435 mm) upstream from the end of the concrete barrier at a speed of 63.1 mph (101.5
km/h), and at an angle of 25.7 degrees. The modified steel-post transition system contained and
June 26, 2014
MwRSF Report No. TRP-03-300-14
30
smoothly redirected the vehicle with maximum lateral dynamic and permanent set barrier
deflections of 5¼ in. (133 mm) and 3⅝ in. (92 mm), respectively, and was determined to be a
success according to TL-3 of NCHRP Report No. 350.
The third full-scale crash test utilized wood posts with an embedment depth of 43 in.
(1,092 mm) in the thrie beam area. During test no. ITNJ-3, a 4,381-lb (1,987-kg) pickup truck
impacted the system 7 ft – 11⅞ in. (2,435 mm) upstream from the end of the concrete barrier at a
speed of 63.4 mph (102.0 km/h), and at an angle of 26.9 degrees. Similar to test no. ITNJ-1, the
system experienced larger-than-expected deflections, which caused vehicle instabilities and
eventually rollover. Consequently, the performance of test no. ITNJ-3 was deemed unsuccessful
according to TL-3 of NCHRP Report No. 350.
In order to lower deflections of the transition system with wood-post configuration, the
post embedment depth in the thrie beam area was increased to 52 in. (1,321 mm). During test no.
ITNJ-4, a 4,407-lb (1,999-kg) pickup truck impacted the system 7 ft – 11⅞ in. (2,435 mm)
upstream from the end of the concrete barrier at a speed of 63.6 mph (102.4 km/h), and at an
angle of 24.6 degrees. The wood-post transition system contained and smoothly redirected the
vehicle with maximum lateral dynamic and permanent set barrier deflections of 3.8 in. (97 mm)
and 1¼ in. (32 mm), respectively, and was determined to be a success according to TL-3 of
NCHRP Report No. 350.
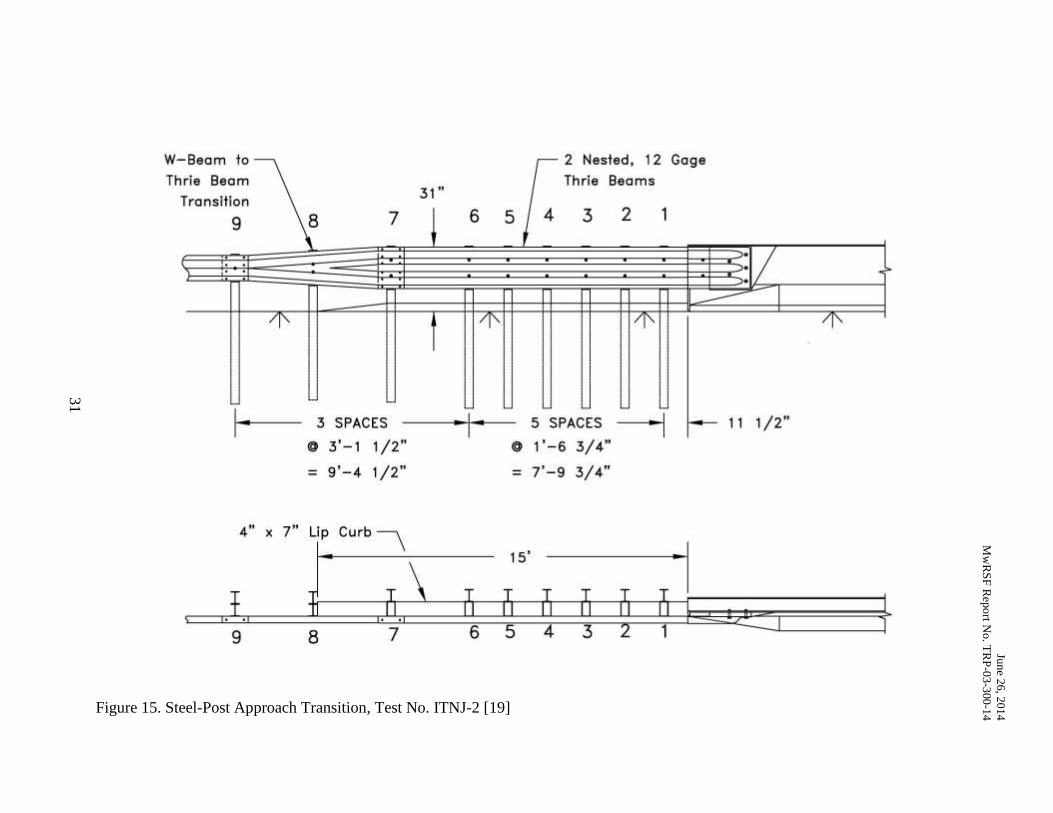
Jun
e 26
, 201
4
Mw
RS
F R
epo
rt No. T
RP
-03
-300-1
4
31
Figure 15. Steel-Post Approach Transition, Test No. ITNJ-2 [19]
Vi-Beom Th rie Beam
Transition g 7
J SPACES
o 3'-1 1/2 K
= 9'-4 1/2 K
4" ~ 7" Up Curb ,
g 8
lO-
6
2 Ne~ted. 12 Gage Thrl, Beams
5 4 3
5 SPACES
o 1'-6 J/4K
= ]'-9 3/ 4"
2 1
11 1/2K
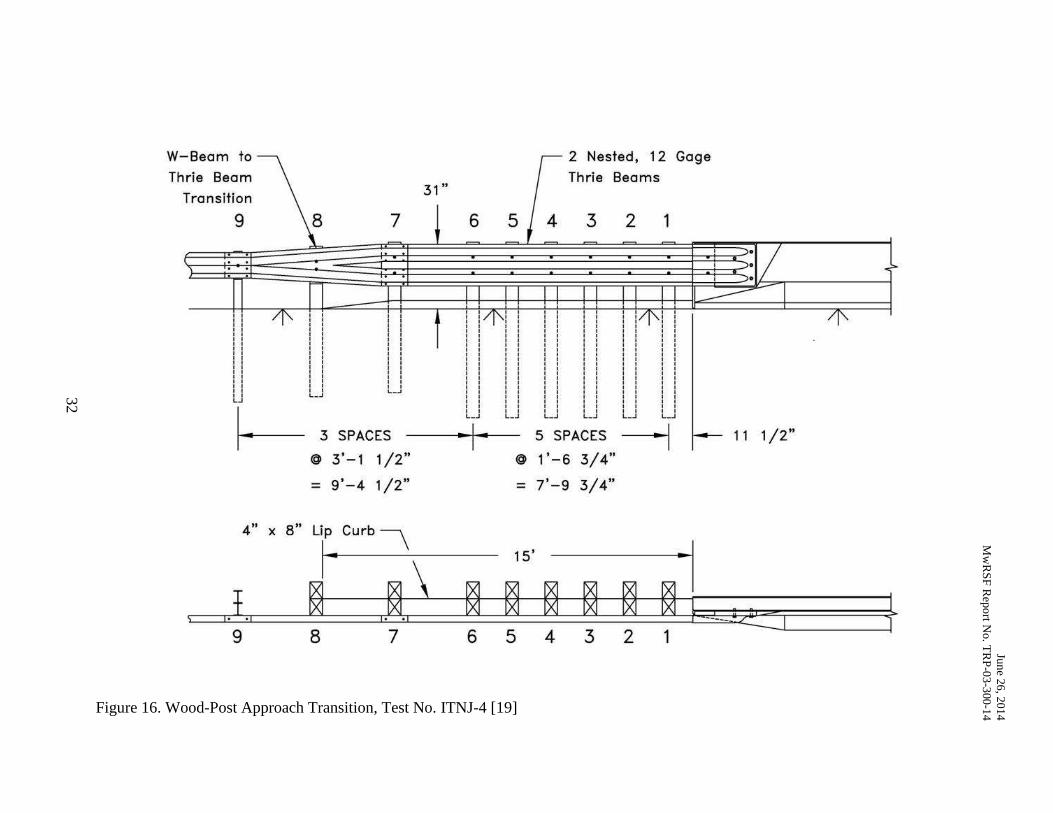
Jun
e 26
, 201
4
Mw
RS
F R
epo
rt No. T
RP
-03
-300-1
4
32
Figure 16. Wood-Post Approach Transition, Test No. ITNJ-4 [19]
W-8eam to
Thrie 8eam
Transition
!
!
9
! l.
8
! ! ! ! ! _.
7
f-- 3 SPACES
4" x
I . .1
9
@ 3'-1 1/2"
= 9'-4 1/2"
8" Lip Curb \
I' 1 • .1
8 7
31"
~ 2 Nested, 12 Gage
Thrie Beams
654321
-~ -~
I
-I- 5 SPACES I- 11 1/2"
@ 1'-6 3/4"
= 7'-9 3/4"
1 S' I
~ ~ ~ ~ ~ ~' I _J_-- 'C:J 65432 1
1·
June 26, 2014
MwRSF Report No. TRP-03-300-14
33
2.5.2 Evaluation of Guardrail-to-Concrete Barrier Transition
With the vehicle fleet constantly changing and growing, standards for testing roadside
safety hardware must also change. Thus, NCHRP Report No. 350 was updated to include heavier
vehicles with higher centers of gravity. In 2006, MwRSF researchers conducted another crash
test under the impact conditions outlined in the Update to NCHRP Report No. 350 on the
guardrail-to-concrete barrier transition system that had been previously tested [20].
The transition design was constructed using W6x9 (W152x13.4) steel posts with a length
of 6 ft (1,829 mm) for post nos. 3 through 10 and 6 ft – 6 in. (1,981) for post nos. 11-17 [20]. A
varied post spacing consisted of one post at 10½ in. (267 mm), five at 18¾ in. (476 mm), and
three at 37½ in. (953 mm). During test no. 2241T-1, a 5,083-lb (2,306-kg) pickup truck impacted
the system at 7 ft – 11⅞ in. (2,435 mm) upstream from the end of the concrete barrier at a speed
of 60.3 mph (97.0 km/h), and at an angle of 24.8 degrees. The steel-post transition system
contained and smoothly redirected the vehicle with maximum lateral dynamic and permanent set
barrier deflections of 11.4 in. (290 mm) and 7⅝ in. (194 mm), respectively, and was determined
to be a success according to TL-3 found in the Update to NCHRP Report No. 350.
2.5.3 Stiffness Transition Between W-Beam Guardrail and Thrie Beam
In 2007, MwRSF researchers investigated stiffness transitions from W-beam guardrail to
thrie beam approach guardrail transitions [21]. Prior testing of symmetric W-beam-to-thrie beam
transition elements had been conducted according the guidelines set forth in NCHRP Report No.
350, but the system did not successfully pass the 2000P light pickup truck test [22]. This study
was conducted to alleviate some of the stiffness concerns associated with the previously-tested
transition design. This study included four full-scale crash tests that utilized a varied post spacing
that consisted of post nos. 1 through 7 spaced 75 in. (1,905 mm), post nos. 7 through 19 spaced
37.5 in. (953 mm), and post nos. 19 through 21 spaced 75 in. (1,905 mm).
June 26, 2014
MwRSF Report No. TRP-03-300-14
34
For the first full-scale crash test, the W-beam rail had a nominal top-rail height of 27¾ in.
(705 mm), while the thrie beam had a nominal top-rail height of 31⅝ in. (803 mm). The
approach transition is shown in Figure 17. During test no. MWT-3, a 4,456-lb (2,021-kg) pickup
truck impacted the system 8 in. (203 mm) upstream from the centerline of post no. 9 at a speed
of 63.9 mph (102.8 km/h), and at an angle of 24.8 degrees. The transition system contained but
did not safely redirect the vehicle, since the vehicle rolled over upon exiting the system.
Therefore, test no. MWT-3 was determined to be unsuccessful according to TL-3 of NCHRP
Report No. 350.
Upon investigation of the results from test no. MWT-3, researchers concluded that the
roll behavior was due to the relatively higher center of gravity of the 2000P vehicle combined
with the relatively low rail height for the 27¾-in. (705-mm) tall, standard guardrail. The
proposed solution was to switch the approach guardrail to the 31-in. (787-mm) tall Midwest
Guardrail System (MGS). Since the MGS utilized a 31-in. (787-mm) rail height, a new
asymmetric transition element was needed. The new transition element was fabricated by cutting
a triangular piece out of the bottom of a standard 12-gauge (2.66-mm) thrie beam rail, as shown
in Figure 18. During test no. MWT-4, a 4,448-lb (2,018-kg) pickup truck impacted the system 9
in. (229 mm) upstream from the centerline of post no. 9 at a speed of 61.0 mph (98.2 km/h), and
at an angle of 25.3 degrees. The system did not safely contain or redirect the vehicle, since the
vehicle penetrated the system due to rail rupture. Consequently, test no. MWT-4 was deemed
unsuccessful according to TL-3 of NCHRP Report No. 350.
Upon investigation of the results of test no. MWT-4, researchers concluded that
increasing the post size and embedment depth of posts within the transition region would
eliminate pocketing. For test no. MWT-5, post nos. 9 through 15 were W6x12 (W152x17.9)
sections measuring 7 ft – 6 in. (2,286-mm) long. Additionally, the post embedment depth for
June 26, 2014
MwRSF Report No. TRP-03-300-14
35
post nos. 9 through 15 was 58 in. (1,473 mm). The fabricated asymmetrical W-beam-to-thrie
beam transition was also replaced with a new 10-gauge (3.42-mm) MGS asymmetrical transition
element, shown in Figure 19. During test no. MWT-5, a 4,431-lb (2,010-kg) pickup truck
traveling at 61.5 mph (99.0 km/h) impacted the system 13 in. (330 mm) upstream from the
centerline of post no. 9, at an angle of 24.9 degrees. The system safely contained and redirected
the vehicle with maximum lateral dynamic and permanent set barrier deflections of 23⅞ in. (606
mm) and 14¾ in. (375 mm), respectively, and consequently was deemed successful according to
NCHRP Report No. 350.
The fourth full-scale crash test utilized the same system setup used for test no. MWT-5,
but now tested with a small car. During test no. MWT-6, a 1,992-lb (904-kg) small car impacted
the system 12½ in. (318 mm) upstream from the centerline of post no. 10 at a speed of 65.5 mph
(105.4 km/h), and at an angle of 20.4 degrees. The system safely contained and redirected the
vehicle with maximum lateral dynamic and permanent set barrier deflections of 23⅞ in. (606
mm) and 14¾ in. (375 mm), respectively, and consequently was deemed successful according to
NCHRP Report No. 350.
2.5.4 Evaluation of Thrie Beam Transition without Curb
In 2013, TTI researchers conducted a performance evaluation of a modified thrie beam
transition to rigid concrete barrier without a curb element below the transition rail [23]. The rigid
concrete barrier was a 36-in. (914-mm) tall, single-slope traffic rail that was 7½-in. (191-mm)
wide at the top and 14½-in. (368-mm) wide at the bottom. The approach guardrail transition
consisted of nineteen W6x8.5 (W152x12.6) posts with lengths of 72 in. (1,829 mm) for post nos.
3-13 and 84 in. (2,134 mm) for post nos. 14 to 19. The 12-gauge (2.66-mm) W-beam guardrail
was positioned from post no. 1 to post no. 11, and then an asymmetric W-to-thrie transition
element spanned from post no. 11 to post no. 13. Then, nested 12-gauge (2.66-mm)
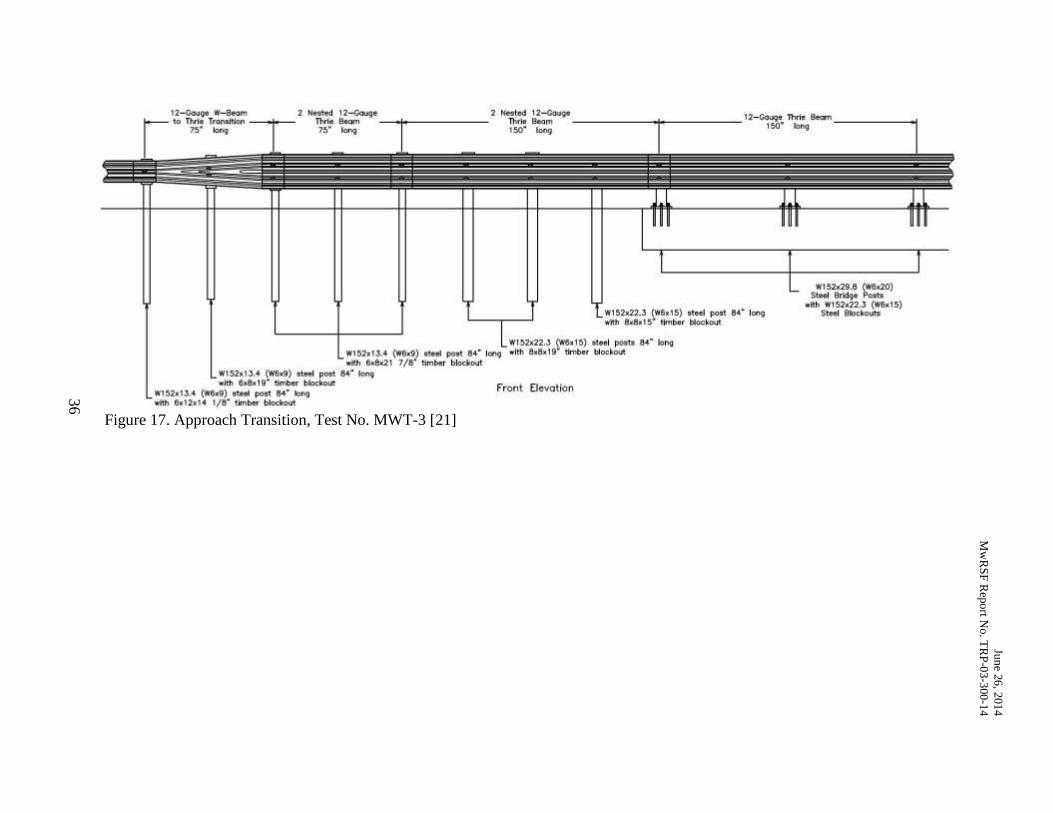
Jun
e 26
, 201
4
Mw
RS
F R
epo
rt No. T
RP
-03
-300-1
4
36
Figure 17. Approach Transition, Test No. MWT-3 [21]
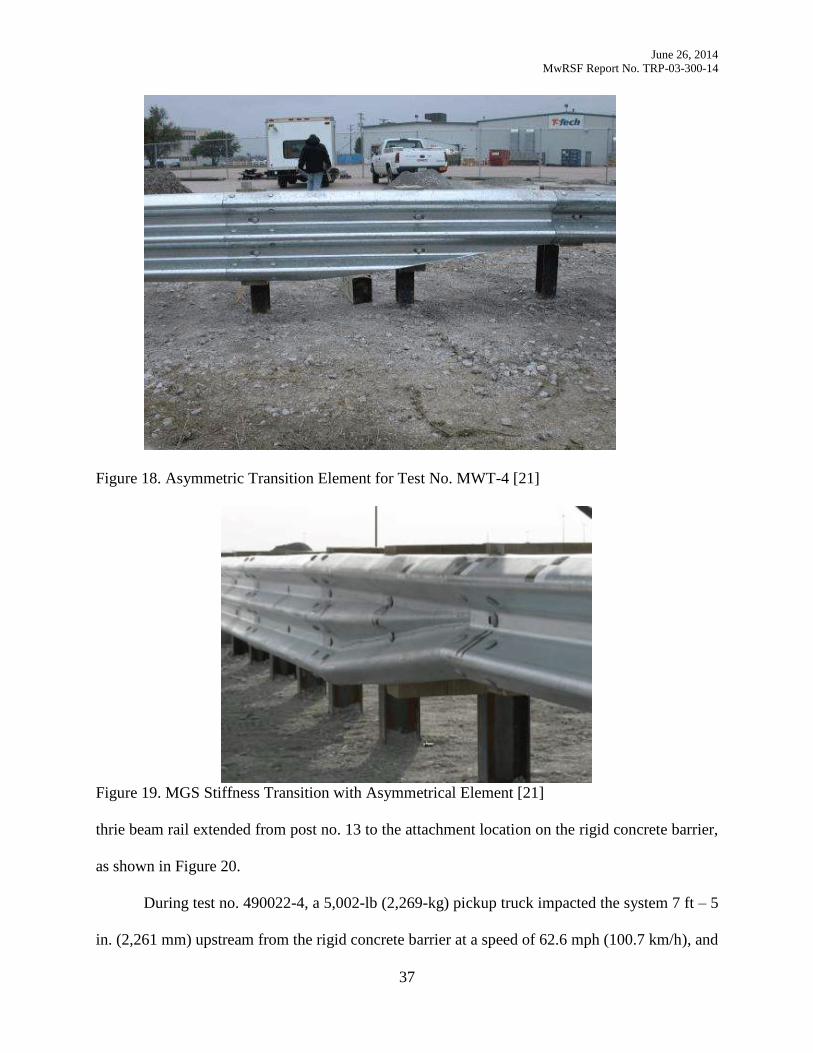
June 26, 2014
MwRSF Report No. TRP-03-300-14
37
Figure 18. Asymmetric Transition Element for Test No. MWT-4 [21]
Figure 19. MGS Stiffness Transition with Asymmetrical Element [21]
thrie beam rail extended from post no. 13 to the attachment location on the rigid concrete barrier,
as shown in Figure 20.
During test no. 490022-4, a 5,002-lb (2,269-kg) pickup truck impacted the system 7 ft – 5
in. (2,261 mm) upstream from the rigid concrete barrier at a speed of 62.6 mph (100.7 km/h), and
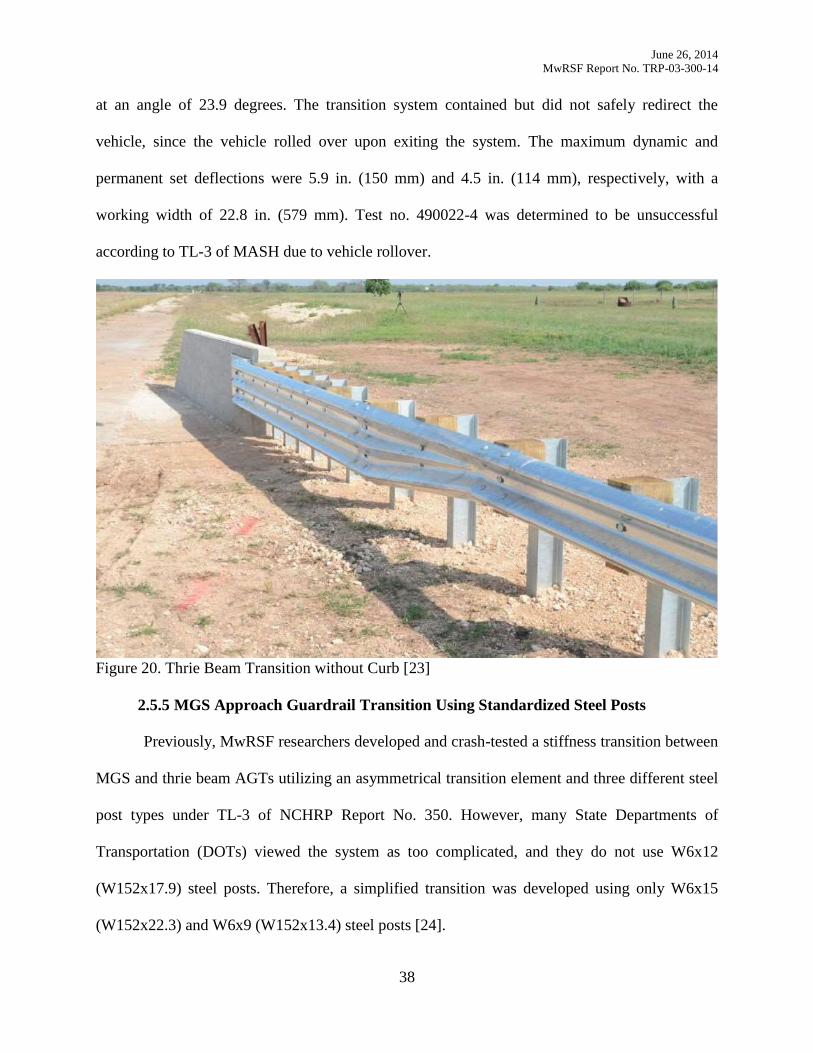
June 26, 2014
MwRSF Report No. TRP-03-300-14
38
at an angle of 23.9 degrees. The transition system contained but did not safely redirect the
vehicle, since the vehicle rolled over upon exiting the system. The maximum dynamic and
permanent set deflections were 5.9 in. (150 mm) and 4.5 in. (114 mm), respectively, with a
working width of 22.8 in. (579 mm). Test no. 490022-4 was determined to be unsuccessful
according to TL-3 of MASH due to vehicle rollover.
Figure 20. Thrie Beam Transition without Curb [23]
2.5.5 MGS Approach Guardrail Transition Using Standardized Steel Posts
Previously, MwRSF researchers developed and crash-tested a stiffness transition between
MGS and thrie beam AGTs utilizing an asymmetrical transition element and three different steel
post types under TL-3 of NCHRP Report No. 350. However, many State Departments of
Transportation (DOTs) viewed the system as too complicated, and they do not use W6x12
(W152x17.9) steel posts. Therefore, a simplified transition was developed using only W6x15
(W152x22.3) and W6x9 (W152x13.4) steel posts [24].
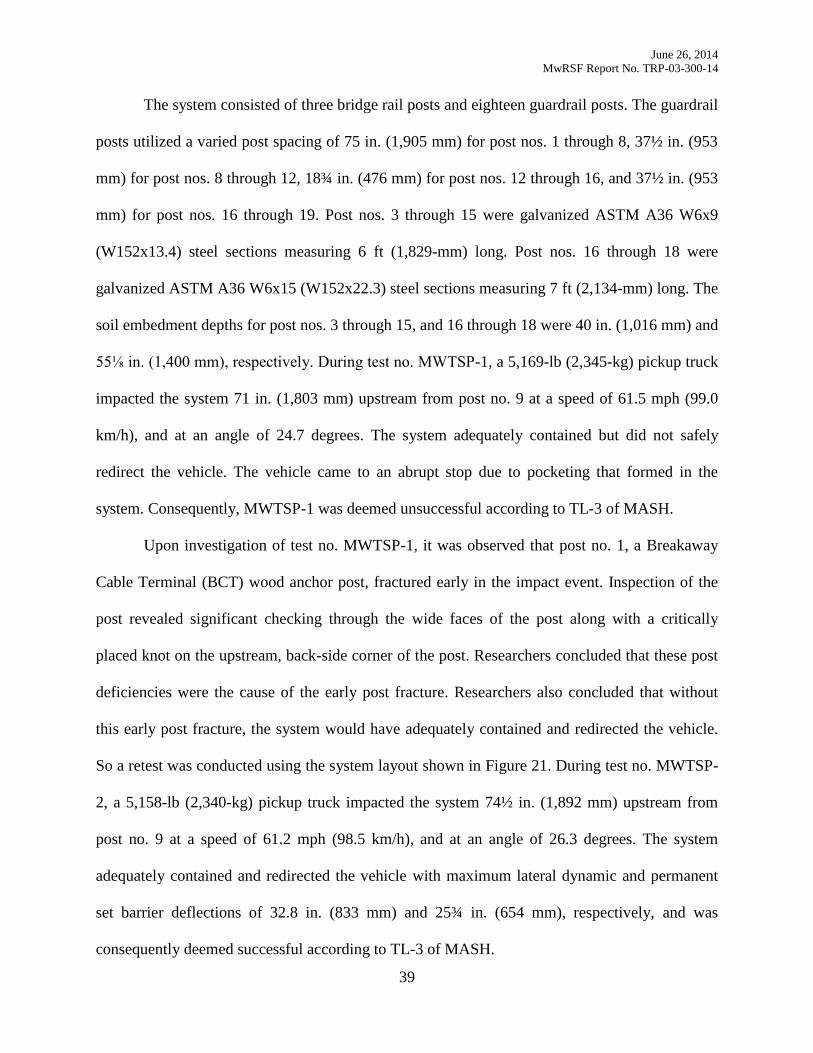
June 26, 2014
MwRSF Report No. TRP-03-300-14
39
The system consisted of three bridge rail posts and eighteen guardrail posts. The guardrail
posts utilized a varied post spacing of 75 in. (1,905 mm) for post nos. 1 through 8, 37½ in. (953
mm) for post nos. 8 through 12, 18¾ in. (476 mm) for post nos. 12 through 16, and 37½ in. (953
mm) for post nos. 16 through 19. Post nos. 3 through 15 were galvanized ASTM A36 W6x9
(W152x13.4) steel sections measuring 6 ft (1,829-mm) long. Post nos. 16 through 18 were
galvanized ASTM A36 W6x15 (W152x22.3) steel sections measuring 7 ft (2,134-mm) long. The
soil embedment depths for post nos. 3 through 15, and 16 through 18 were 40 in. (1,016 mm) and
55⅛ in. (1,400 mm), respectively. During test no. MWTSP-1, a 5,169-lb (2,345-kg) pickup truck
impacted the system 71 in. (1,803 mm) upstream from post no. 9 at a speed of 61.5 mph (99.0
km/h), and at an angle of 24.7 degrees. The system adequately contained but did not safely
redirect the vehicle. The vehicle came to an abrupt stop due to pocketing that formed in the
system. Consequently, MWTSP-1 was deemed unsuccessful according to TL-3 of MASH.
Upon investigation of test no. MWTSP-1, it was observed that post no. 1, a Breakaway
Cable Terminal (BCT) wood anchor post, fractured early in the impact event. Inspection of the
post revealed significant checking through the wide faces of the post along with a critically
placed knot on the upstream, back-side corner of the post. Researchers concluded that these post
deficiencies were the cause of the early post fracture. Researchers also concluded that without
this early post fracture, the system would have adequately contained and redirected the vehicle.
So a retest was conducted using the system layout shown in Figure 21. During test no. MWTSP-
2, a 5,158-lb (2,340-kg) pickup truck impacted the system 74½ in. (1,892 mm) upstream from
post no. 9 at a speed of 61.2 mph (98.5 km/h), and at an angle of 26.3 degrees. The system
adequately contained and redirected the vehicle with maximum lateral dynamic and permanent
set barrier deflections of 32.8 in. (833 mm) and 25¾ in. (654 mm), respectively, and was
consequently deemed successful according to TL-3 of MASH.
June 26, 2014
MwRSF Report No. TRP-03-300-14
40
The MGS stiffness transition to thrie beam AGTs was also subjected to crash testing with
a 1100C small car according to MASH in order to investigate potential underride tendencies.
During test no. MWTSP-3, a 2,591-lb (1,175-kg) small car impacted the system 93¾ in. (2,381
mm) upstream from post no. 9 at a speed of 61.0 mph (98.2 km/h), and at an angle of 25.7
degrees. The system adequately contained and redirected the vehicle with maximum lateral
dynamic and permanent set barrier deflections of 34.8 in. (884 mm) and 27 in. (686 mm),
respectively, and was consequently deemed successful according to TL-3 of MASH.
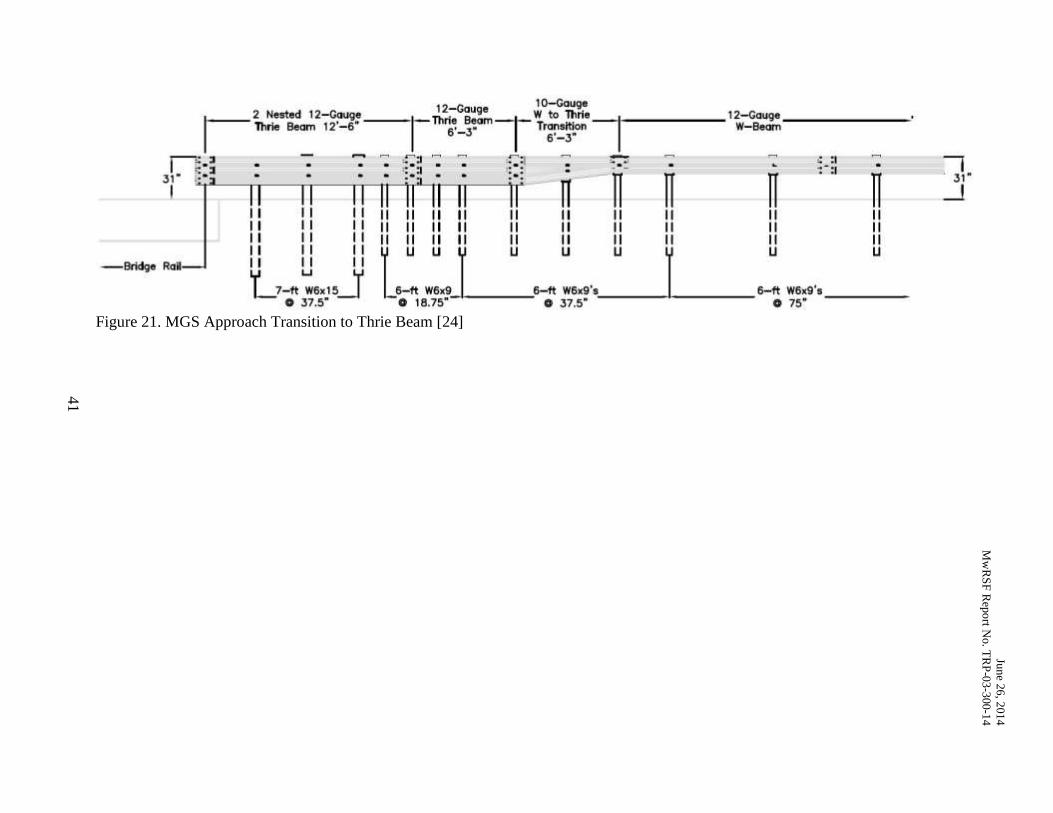
Jun
e 26
, 201
4
Mw
RS
F R
epo
rt No. T
RP
-03
-300-1
4
41
Figure 21. MGS Approach Transition to Thrie Beam [24]
June 26, 2014
MwRSF Report No. TRP-03-300-14
42
2.5.6 Roadside Barriers for Bridge-Pier Protection
In 1983, the New York State Department of Transportation developed a roadside barrier
for the protection of concrete bridge piers near the pavement edge [3-4]. Seven full-scale crash
tests were conducted following the evaluation guidelines found in NCHRP Report No. 230. The
barrier system consisted of four 15-ft (4,572-mm) long, half-section, safety-shape concrete
barriers and 6-in. (152-mm) x 6-in. (152-mm) x 3/16-in. (4.76-mm) box-beam guiderail. One
concrete barrier was installed in front of and parallel to two simulated bridge piers. The
remaining three concrete barriers were installed at an 8H:1V flare rate away from the roadway
upstream from the bridge piers. The concrete barriers were rigidly installed with continuity
connectors at barrier joints, and driven steel backup posts for the first four full-scale tests and
soil-backfill for the final three full-scale tests.
For the first four full-scale tests, the box-beam guiderail was attached to the face of the
second concrete barrier with a total system length of 130 ft – 6 in. (39.8 m). During test no. 60, a
4,450-lb (2,018-kg) sedan impacted the box-beam guiderail 55 ft – 6 in. (16.9 m) downstream
from its end at a speed of 55.7 mph (89.6 km/h), and at an angle of 25.0 degrees. The system
safely contained and redirected the vehicle with maximum lateral dynamic and permanent set
barrier deflections of 2.6 ft (792 mm) and 1.7 ft (518 mm), respectively, and consequently was
deemed successful according to NCHRP Report No. 230. During test no. 61, a 1,600-lb (726-kg)
sedan impacted 12.2 ft (3,719 mm) upstream from the box-beam attachment to the concrete
barrier at a speed of 59.0 mph (95.0 km/h), and at an angle of 14.0 degrees. The system safely
contained and redirected the vehicle with maximum lateral dynamic deflection of 6 in. (152 mm)
and no permanent set barrier deflection, and consequently was deemed successful according to
NCHRP Report No. 230. During test no. 62, a 4,500-lb (2,041-kg) sedan impacted 12.2 ft (3,719
mm) upstream from the box-beam attachment to the concrete barrier at a speed of 54.3 mph
June 26, 2014
MwRSF Report No. TRP-03-300-14
43
(87.4 km/h), and at an angle of 29.0 degrees. The system safely contained and redirected the
vehicle with maximum lateral dynamic and permanent set barrier deflections of 0.25 ft (76 mm)
and 0.19 ft (58 mm), respectively, and subsequently was deemed successful according to
NCHRP Report No. 230. During test no. 63, a 4,730-lb (2,145-kg) sedan impacted 7.7 ft (2,347
mm) upstream from the joint between barrier nos. 1 and 2 at a speed of 57.1 mph (91.9 km/h),
and at an angle of 26.0 degrees. The vehicle climbed the face of the concrete barrier and rolled
upon exiting the system and was deemed unsuccessful according to NCHRP Report No. 230.
In order to prevent vehicle climb on the concrete barriers, the box-beam guiderail was
installed across the face of the most downstream concrete barrier, and continuing past the
simulated bridge piers. During test no. 76, a 1,800-lb (816-kg) sedan impacted 4.3 ft (1,311 mm)
upstream from the joint between barrier nos. 1 and 2 at a speed of 58.3 mph (93.8 km/h), and at
an angle of 20.0 degrees. The system safely contained and redirected the vehicle with no lateral
dynamic or permanent set barrier deflections and consequently was deemed successful according
to NCHRP Report No. 230. During test no. 77, a 4,650-lb (2,109-kg) sedan impacted 4.3 ft
(1,311 mm) upstream from the joint between barrier nos. 1 and 2 at a speed of 61.2 mph (98.5
km/h), and at an angle of 29.0 degrees. The system safely contained and redirected the vehicle
with no lateral dynamic deflection and a permanent set barrier deflection of 0.19 ft (58 mm), and
consequently was deemed successful according to NCHRP Report No. 230.
For the final full-scale crash test, the box-beam installed in front of the most downstream
concrete barrier was removed, and test no. 63 was repeated with full-height bridge piers to
evaluate the severity of vehicle contact with the bridge piers. During test no. 78, a 4,500-lb
(2,041-kg) sedan impacted 3.2 ft (975 mm) upstream from the joint between barrier nos. 1 and 2
at a speed of 63.7 mph (102.5 km/h), and at an angle of 30.0 degrees. The vehicle climbed the
face of the concrete barriers and impacted both simulated bridge piers, and rolled upon exiting
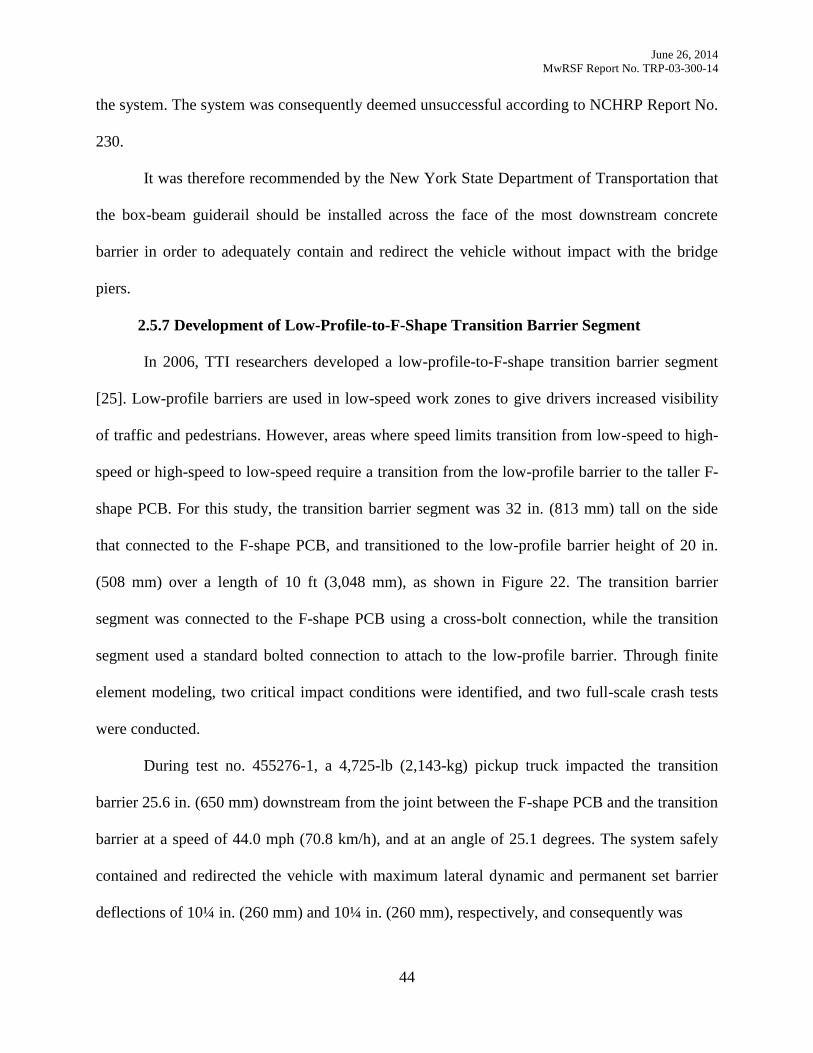
June 26, 2014
MwRSF Report No. TRP-03-300-14
44
the system. The system was consequently deemed unsuccessful according to NCHRP Report No.
230.
It was therefore recommended by the New York State Department of Transportation that
the box-beam guiderail should be installed across the face of the most downstream concrete
barrier in order to adequately contain and redirect the vehicle without impact with the bridge
piers.
2.5.7 Development of Low-Profile-to-F-Shape Transition Barrier Segment
In 2006, TTI researchers developed a low-profile-to-F-shape transition barrier segment
[25]. Low-profile barriers are used in low-speed work zones to give drivers increased visibility
of traffic and pedestrians. However, areas where speed limits transition from low-speed to high-
speed or high-speed to low-speed require a transition from the low-profile barrier to the taller F-
shape PCB. For this study, the transition barrier segment was 32 in. (813 mm) tall on the side
that connected to the F-shape PCB, and transitioned to the low-profile barrier height of 20 in.
(508 mm) over a length of 10 ft (3,048 mm), as shown in Figure 22. The transition barrier
segment was connected to the F-shape PCB using a cross-bolt connection, while the transition
segment used a standard bolted connection to attach to the low-profile barrier. Through finite
element modeling, two critical impact conditions were identified, and two full-scale crash tests
were conducted.
During test no. 455276-1, a 4,725-lb (2,143-kg) pickup truck impacted the transition
barrier 25.6 in. (650 mm) downstream from the joint between the F-shape PCB and the transition
barrier at a speed of 44.0 mph (70.8 km/h), and at an angle of 25.1 degrees. The system safely
contained and redirected the vehicle with maximum lateral dynamic and permanent set barrier
deflections of 10¼ in. (260 mm) and 10¼ in. (260 mm), respectively, and consequently was
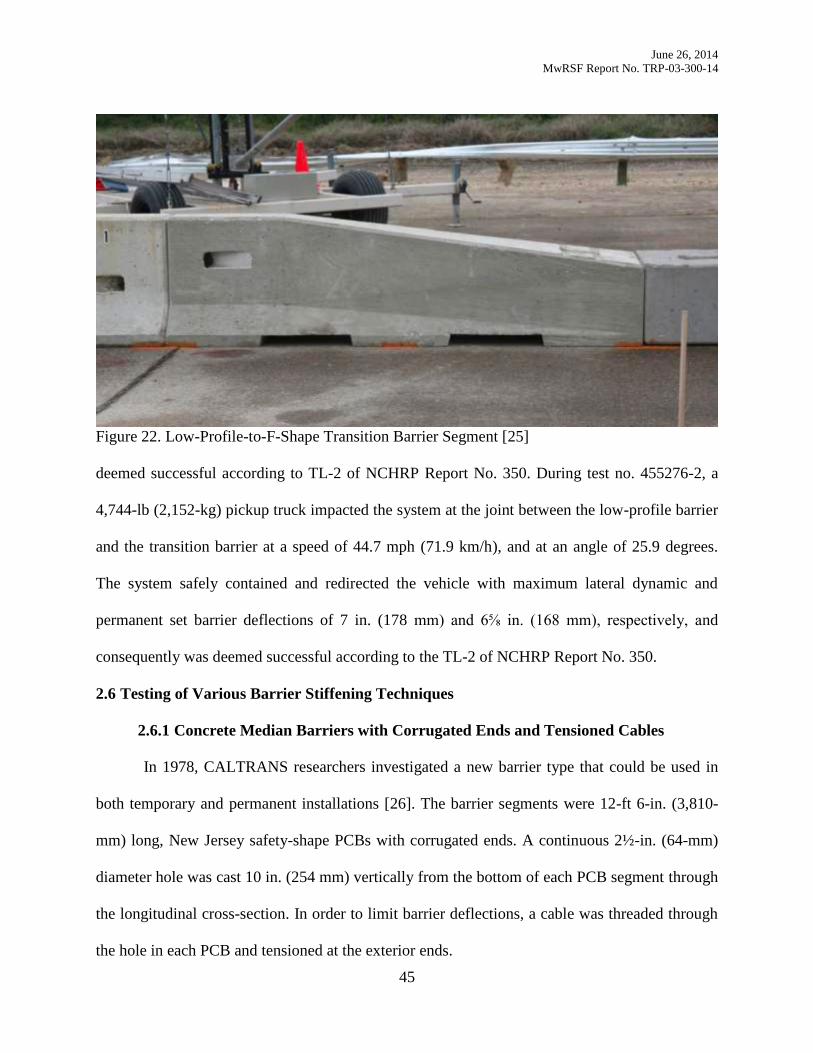
June 26, 2014
MwRSF Report No. TRP-03-300-14
45
Figure 22. Low-Profile-to-F-Shape Transition Barrier Segment [25]
deemed successful according to TL-2 of NCHRP Report No. 350. During test no. 455276-2, a
4,744-lb (2,152-kg) pickup truck impacted the system at the joint between the low-profile barrier
and the transition barrier at a speed of 44.7 mph (71.9 km/h), and at an angle of 25.9 degrees.
The system safely contained and redirected the vehicle with maximum lateral dynamic and
permanent set barrier deflections of 7 in. (178 mm) and 6⅝ in. (168 mm), respectively, and
consequently was deemed successful according to the TL-2 of NCHRP Report No. 350.
2.6 Testing of Various Barrier Stiffening Techniques
2.6.1 Concrete Median Barriers with Corrugated Ends and Tensioned Cables
In 1978, CALTRANS researchers investigated a new barrier type that could be used in
both temporary and permanent installations [26]. The barrier segments were 12-ft 6-in. (3,810-
mm) long, New Jersey safety-shape PCBs with corrugated ends. A continuous 2½-in. (64-mm)
diameter hole was cast 10 in. (254 mm) vertically from the bottom of each PCB segment through
the longitudinal cross-section. In order to limit barrier deflections, a cable was threaded through
the hole in each PCB and tensioned at the exterior ends.
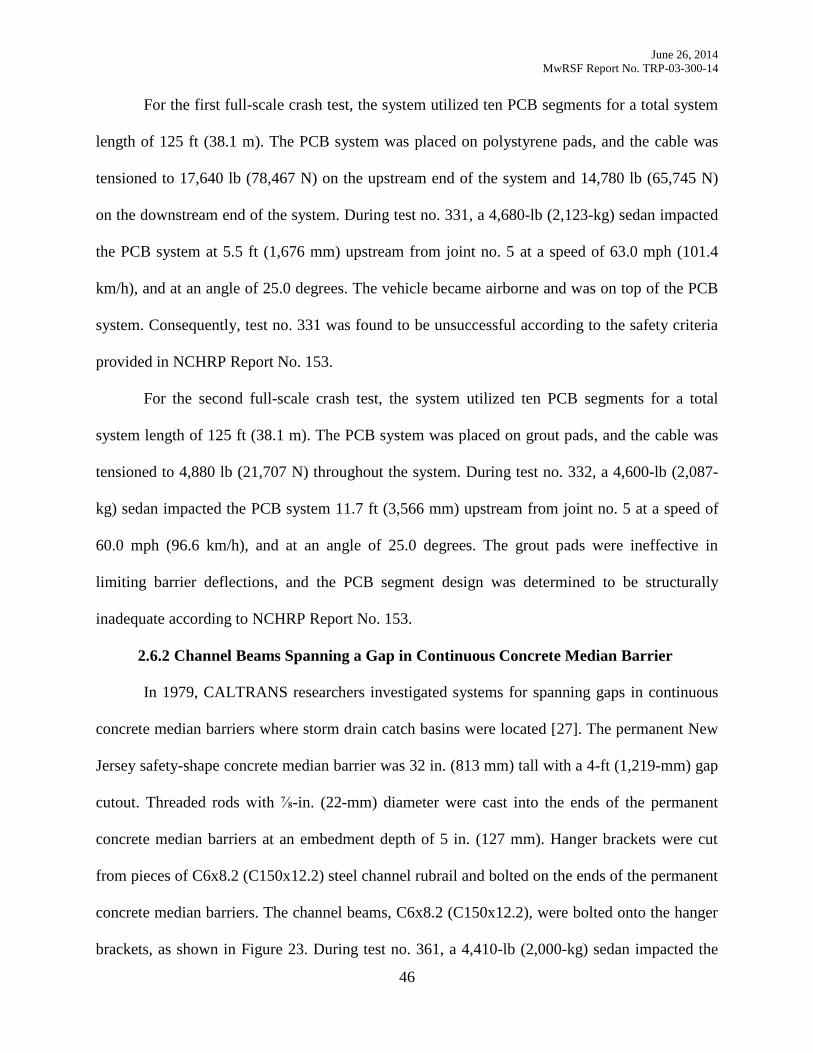
June 26, 2014
MwRSF Report No. TRP-03-300-14
46
For the first full-scale crash test, the system utilized ten PCB segments for a total system
length of 125 ft (38.1 m). The PCB system was placed on polystyrene pads, and the cable was
tensioned to 17,640 lb (78,467 N) on the upstream end of the system and 14,780 lb (65,745 N)
on the downstream end of the system. During test no. 331, a 4,680-lb (2,123-kg) sedan impacted
the PCB system at 5.5 ft (1,676 mm) upstream from joint no. 5 at a speed of 63.0 mph (101.4
km/h), and at an angle of 25.0 degrees. The vehicle became airborne and was on top of the PCB
system. Consequently, test no. 331 was found to be unsuccessful according to the safety criteria
provided in NCHRP Report No. 153.
For the second full-scale crash test, the system utilized ten PCB segments for a total
system length of 125 ft (38.1 m). The PCB system was placed on grout pads, and the cable was
tensioned to 4,880 lb (21,707 N) throughout the system. During test no. 332, a 4,600-lb (2,087-
kg) sedan impacted the PCB system 11.7 ft (3,566 mm) upstream from joint no. 5 at a speed of
60.0 mph (96.6 km/h), and at an angle of 25.0 degrees. The grout pads were ineffective in
limiting barrier deflections, and the PCB segment design was determined to be structurally
inadequate according to NCHRP Report No. 153.
2.6.2 Channel Beams Spanning a Gap in Continuous Concrete Median Barrier
In 1979, CALTRANS researchers investigated systems for spanning gaps in continuous
concrete median barriers where storm drain catch basins were located [27]. The permanent New
Jersey safety-shape concrete median barrier was 32 in. (813 mm) tall with a 4-ft (1,219-mm) gap
cutout. Threaded rods with ⅞-in. (22-mm) diameter were cast into the ends of the permanent
concrete median barriers at an embedment depth of 5 in. (127 mm). Hanger brackets were cut
from pieces of C6x8.2 (C150x12.2) steel channel rubrail and bolted on the ends of the permanent
concrete median barriers. The channel beams, C6x8.2 (C150x12.2), were bolted onto the hanger
brackets, as shown in Figure 23. During test no. 361, a 4,410-lb (2,000-kg) sedan impacted the
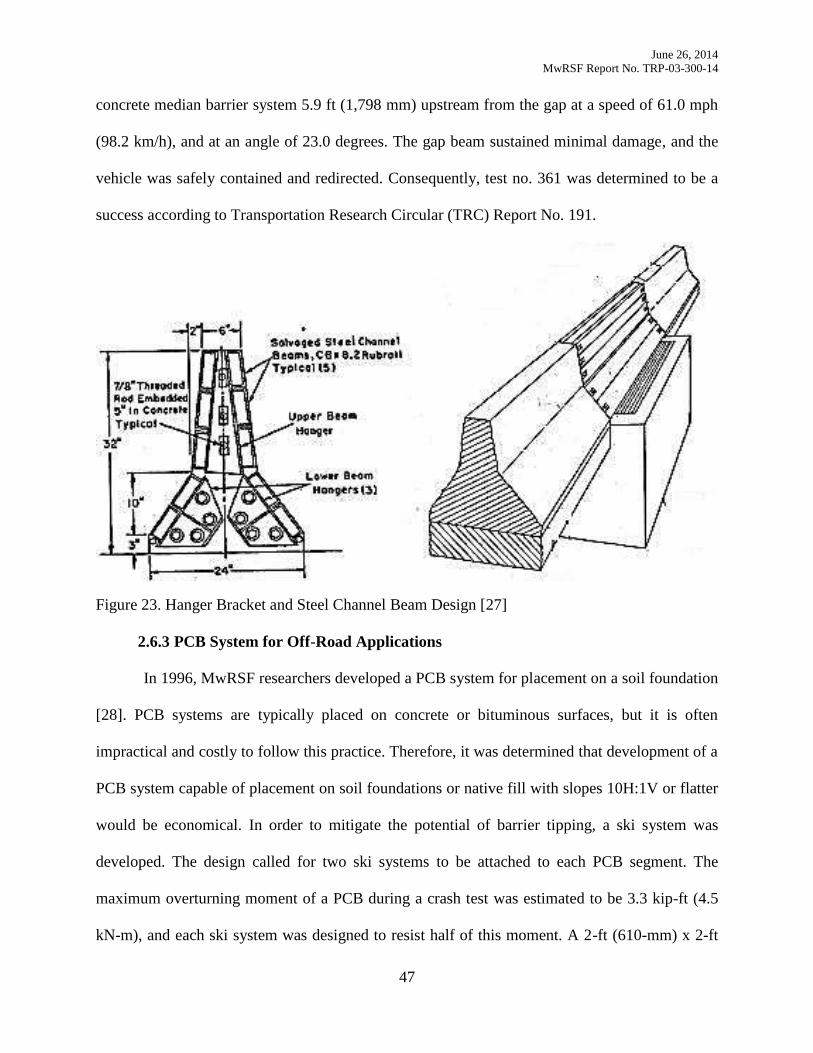
June 26, 2014
MwRSF Report No. TRP-03-300-14
47
concrete median barrier system 5.9 ft (1,798 mm) upstream from the gap at a speed of 61.0 mph
(98.2 km/h), and at an angle of 23.0 degrees. The gap beam sustained minimal damage, and the
vehicle was safely contained and redirected. Consequently, test no. 361 was determined to be a
success according to Transportation Research Circular (TRC) Report No. 191.
Figure 23. Hanger Bracket and Steel Channel Beam Design [27]
2.6.3 PCB System for Off-Road Applications
In 1996, MwRSF researchers developed a PCB system for placement on a soil foundation
[28]. PCB systems are typically placed on concrete or bituminous surfaces, but it is often
impractical and costly to follow this practice. Therefore, it was determined that development of a
PCB system capable of placement on soil foundations or native fill with slopes 10H:1V or flatter
would be economical. In order to mitigate the potential of barrier tipping, a ski system was
developed. The design called for two ski systems to be attached to each PCB segment. The
maximum overturning moment of a PCB during a crash test was estimated to be 3.3 kip-ft (4.5
kN-m), and each ski system was designed to resist half of this moment. A 2-ft (610-mm) x 2-ft
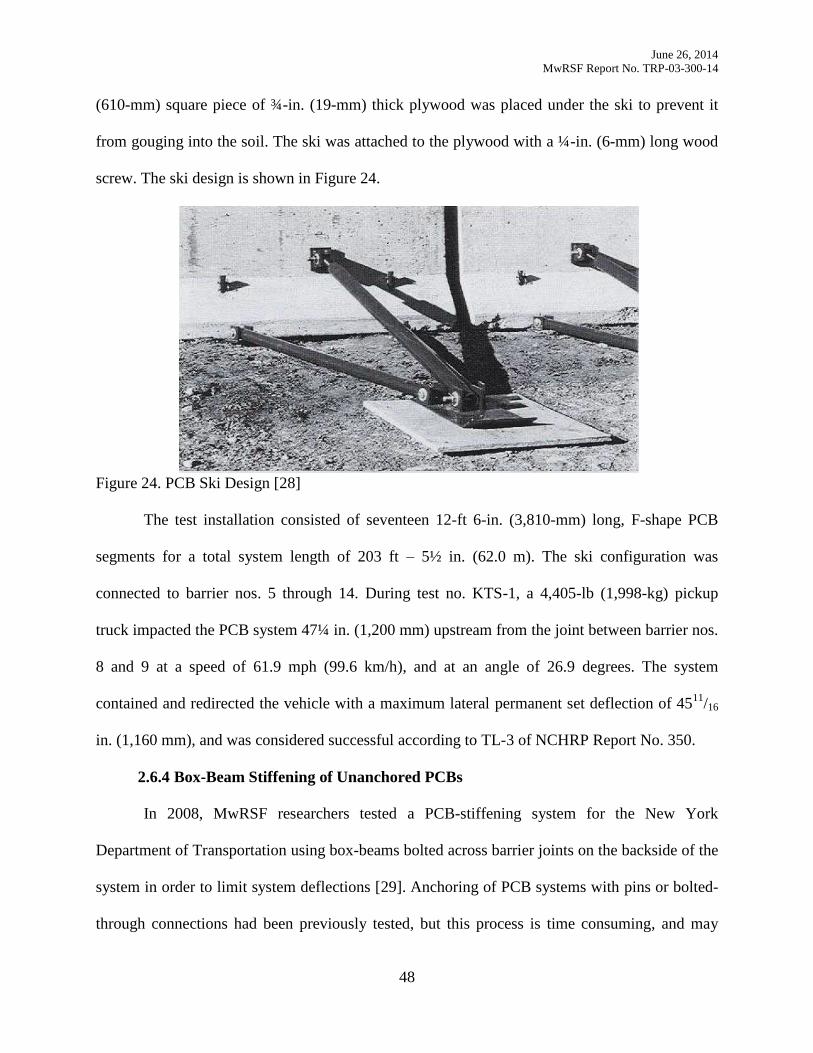
June 26, 2014
MwRSF Report No. TRP-03-300-14
48
(610-mm) square piece of ¾-in. (19-mm) thick plywood was placed under the ski to prevent it
from gouging into the soil. The ski was attached to the plywood with a ¼-in. (6-mm) long wood
screw. The ski design is shown in Figure 24.
Figure 24. PCB Ski Design [28]
The test installation consisted of seventeen 12-ft 6-in. (3,810-mm) long, F-shape PCB
segments for a total system length of 203 ft – 5½ in. (62.0 m). The ski configuration was
connected to barrier nos. 5 through 14. During test no. KTS-1, a 4,405-lb (1,998-kg) pickup
truck impacted the PCB system 47¼ in. (1,200 mm) upstream from the joint between barrier nos.
8 and 9 at a speed of 61.9 mph (99.6 km/h), and at an angle of 26.9 degrees. The system
contained and redirected the vehicle with a maximum lateral permanent set deflection of 4511
/16
in. (1,160 mm), and was considered successful according to TL-3 of NCHRP Report No. 350.
2.6.4 Box-Beam Stiffening of Unanchored PCBs
In 2008, MwRSF researchers tested a PCB-stiffening system for the New York
Department of Transportation using box-beams bolted across barrier joints on the backside of the
system in order to limit system deflections [29]. Anchoring of PCB systems with pins or bolted-
through connections had been previously tested, but this process is time consuming, and may
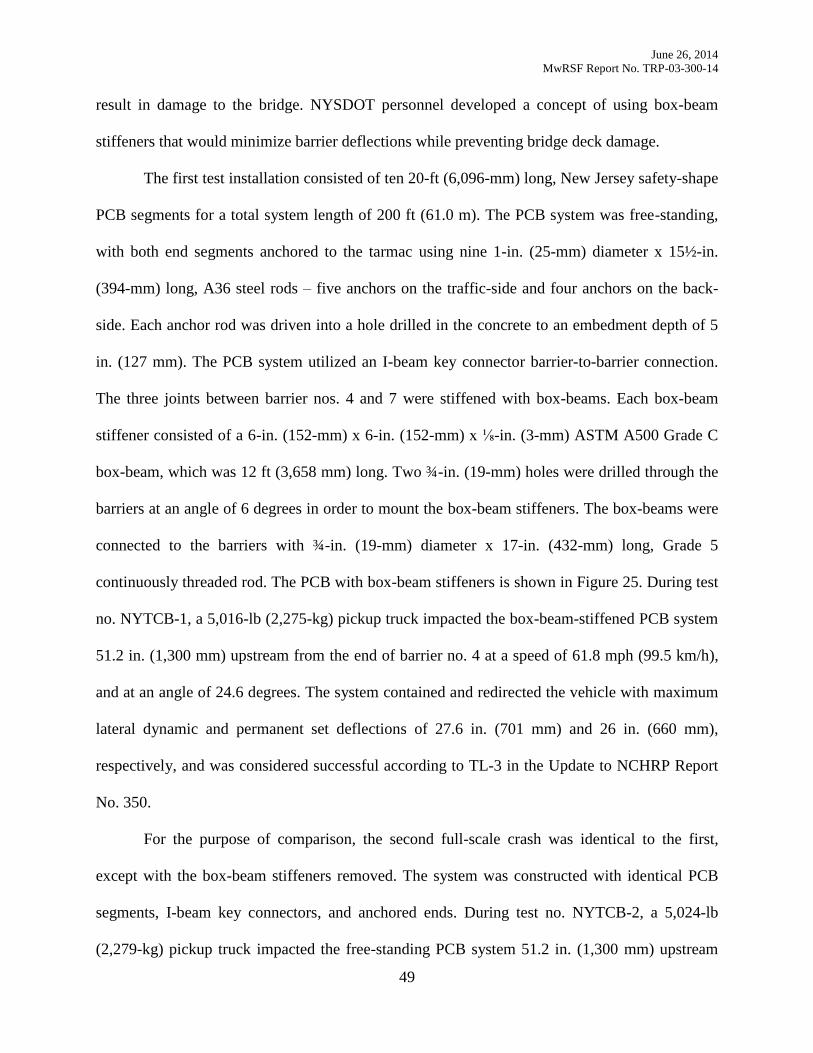
June 26, 2014
MwRSF Report No. TRP-03-300-14
49
result in damage to the bridge. NYSDOT personnel developed a concept of using box-beam
stiffeners that would minimize barrier deflections while preventing bridge deck damage.
The first test installation consisted of ten 20-ft (6,096-mm) long, New Jersey safety-shape
PCB segments for a total system length of 200 ft (61.0 m). The PCB system was free-standing,
with both end segments anchored to the tarmac using nine 1-in. (25-mm) diameter x 15½-in.
(394-mm) long, A36 steel rods – five anchors on the traffic-side and four anchors on the back-
side. Each anchor rod was driven into a hole drilled in the concrete to an embedment depth of 5
in. (127 mm). The PCB system utilized an I-beam key connector barrier-to-barrier connection.
The three joints between barrier nos. 4 and 7 were stiffened with box-beams. Each box-beam
stiffener consisted of a 6-in. (152-mm) x 6-in. (152-mm) x ⅛-in. (3-mm) ASTM A500 Grade C
box-beam, which was 12 ft (3,658 mm) long. Two ¾-in. (19-mm) holes were drilled through the
barriers at an angle of 6 degrees in order to mount the box-beam stiffeners. The box-beams were
connected to the barriers with ¾-in. (19-mm) diameter x 17-in. (432-mm) long, Grade 5
continuously threaded rod. The PCB with box-beam stiffeners is shown in Figure 25. During test
no. NYTCB-1, a 5,016-lb (2,275-kg) pickup truck impacted the box-beam-stiffened PCB system
51.2 in. (1,300 mm) upstream from the end of barrier no. 4 at a speed of 61.8 mph (99.5 km/h),
and at an angle of 24.6 degrees. The system contained and redirected the vehicle with maximum
lateral dynamic and permanent set deflections of 27.6 in. (701 mm) and 26 in. (660 mm),
respectively, and was considered successful according to TL-3 in the Update to NCHRP Report
No. 350.
For the purpose of comparison, the second full-scale crash was identical to the first,
except with the box-beam stiffeners removed. The system was constructed with identical PCB
segments, I-beam key connectors, and anchored ends. During test no. NYTCB-2, a 5,024-lb
(2,279-kg) pickup truck impacted the free-standing PCB system 51.2 in. (1,300 mm) upstream
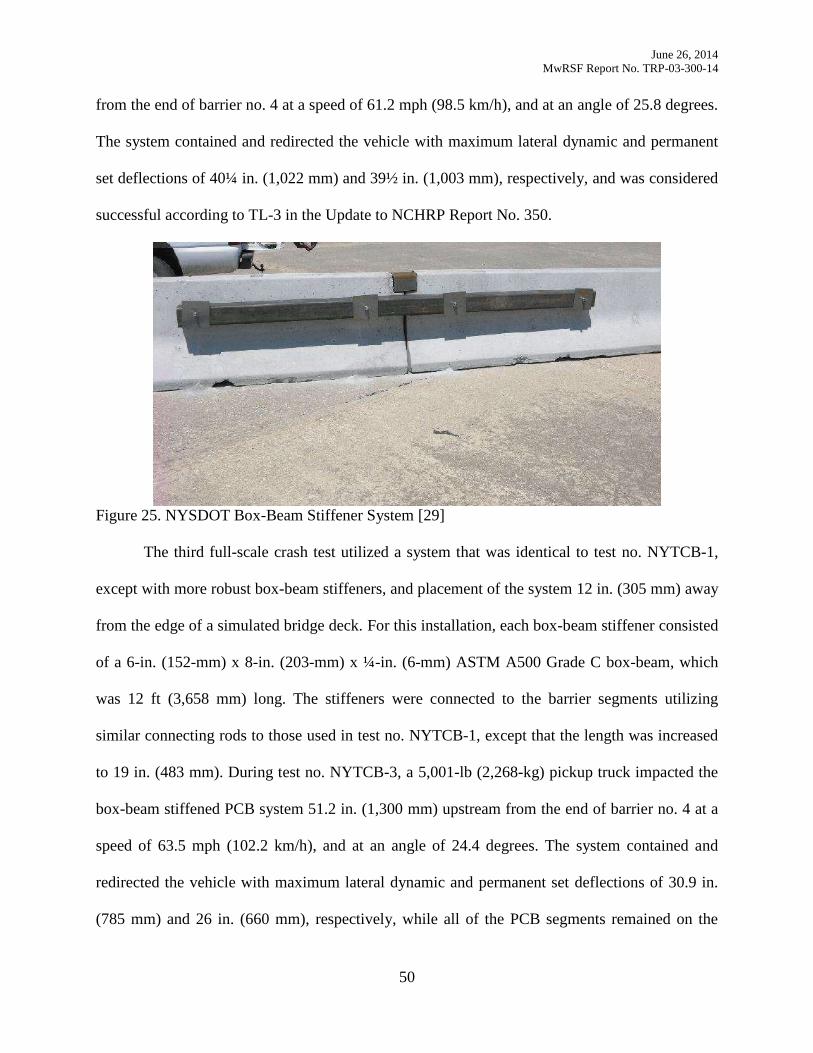
June 26, 2014
MwRSF Report No. TRP-03-300-14
50
from the end of barrier no. 4 at a speed of 61.2 mph (98.5 km/h), and at an angle of 25.8 degrees.
The system contained and redirected the vehicle with maximum lateral dynamic and permanent
set deflections of 40¼ in. (1,022 mm) and 39½ in. (1,003 mm), respectively, and was considered
successful according to TL-3 in the Update to NCHRP Report No. 350.
Figure 25. NYSDOT Box-Beam Stiffener System [29]
The third full-scale crash test utilized a system that was identical to test no. NYTCB-1,
except with more robust box-beam stiffeners, and placement of the system 12 in. (305 mm) away
from the edge of a simulated bridge deck. For this installation, each box-beam stiffener consisted
of a 6-in. (152-mm) x 8-in. (203-mm) x ¼-in. (6-mm) ASTM A500 Grade C box-beam, which
was 12 ft (3,658 mm) long. The stiffeners were connected to the barrier segments utilizing
similar connecting rods to those used in test no. NYTCB-1, except that the length was increased
to 19 in. (483 mm). During test no. NYTCB-3, a 5,001-lb (2,268-kg) pickup truck impacted the
box-beam stiffened PCB system 51.2 in. (1,300 mm) upstream from the end of barrier no. 4 at a
speed of 63.5 mph (102.2 km/h), and at an angle of 24.4 degrees. The system contained and
redirected the vehicle with maximum lateral dynamic and permanent set deflections of 30.9 in.
(785 mm) and 26 in. (660 mm), respectively, while all of the PCB segments remained on the
June 26, 2014
MwRSF Report No. TRP-03-300-14
51
simulated bridge deck. Consequently, test no. NYTCB-3 was considered successful according to
TL-3 in the Update to NCHRP Report No. 350.
2.6.5 Retrofit of Existing Approach Guardrail Transitions
In 2012, MwRSF researchers established guidance for retrofitting existing approach
guardrail transitions for the State of Wisconsin [30]. A survey determined that several transition
systems were installed in a manner that deviated from the as-tested design details. These
deviations included: missing transition posts, transition posts installed near or at the slope break
point of the fill slope, insufficient soil backfill/grading behind transition posts, wood posts
installed in asphalt surfacing, and the presence of drainage structures below the rail. The purpose
of the research was to determine if these deficiencies degraded the performance of the 18-ft 9-in.
(5,715-mm) long and the 31-ft 3-in. (9,525-mm) long, approach guardrail transitions.
Missing transition posts were believed to have the potential to cause system failure and
allow a vehicle to snag on the upstream end of the bridge rail. Whenever possible, the best option
for repairing this deficiency is to re-install an appropriate post in the prescribed location.
However, for some cases where this is not possible, three retrofit designs were developed. The
first retrofit corresponded to a missing post near a blunt-end parapet, which consisted of a
horizontal cantilever beam off of the back-side of the bridge rail that would be vertically
centered with the thrie beam at a height of 21.7 in. (551 mm). The second retrofit corresponded
to a missing post near a sloped-end parapet, which was similar to the first retrofit, with
modifications to the blockout and anchor plate. The third retrofit corresponded to missing posts
not adjacent to a parapet, which consisted of two surrogate posts linked by a horizontally-
mounted beam. The horizontally-mounted beam attached at the mid-span to the thrie beam
transition at the location of the missing post with the use of several blockouts. The three missing
transition post retrofits are shown in Figure 26.
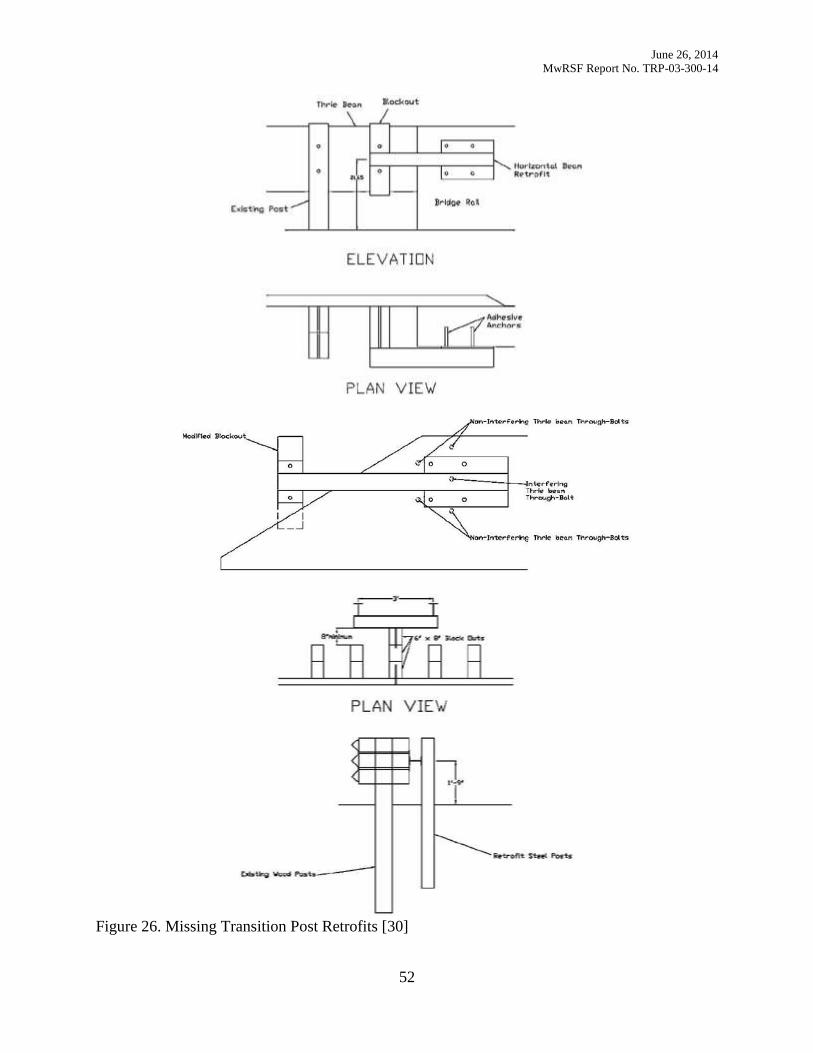
June 26, 2014
MwRSF Report No. TRP-03-300-14
52
Figure 26. Missing Transition Post Retrofits [30]
\
• • 1 • • • ' 1 • •
t ....... ~.~ _ •.
ELEVATION
PLAN VIEW'
• • -• •
PLAN VIE\,,!
-_ .. _--
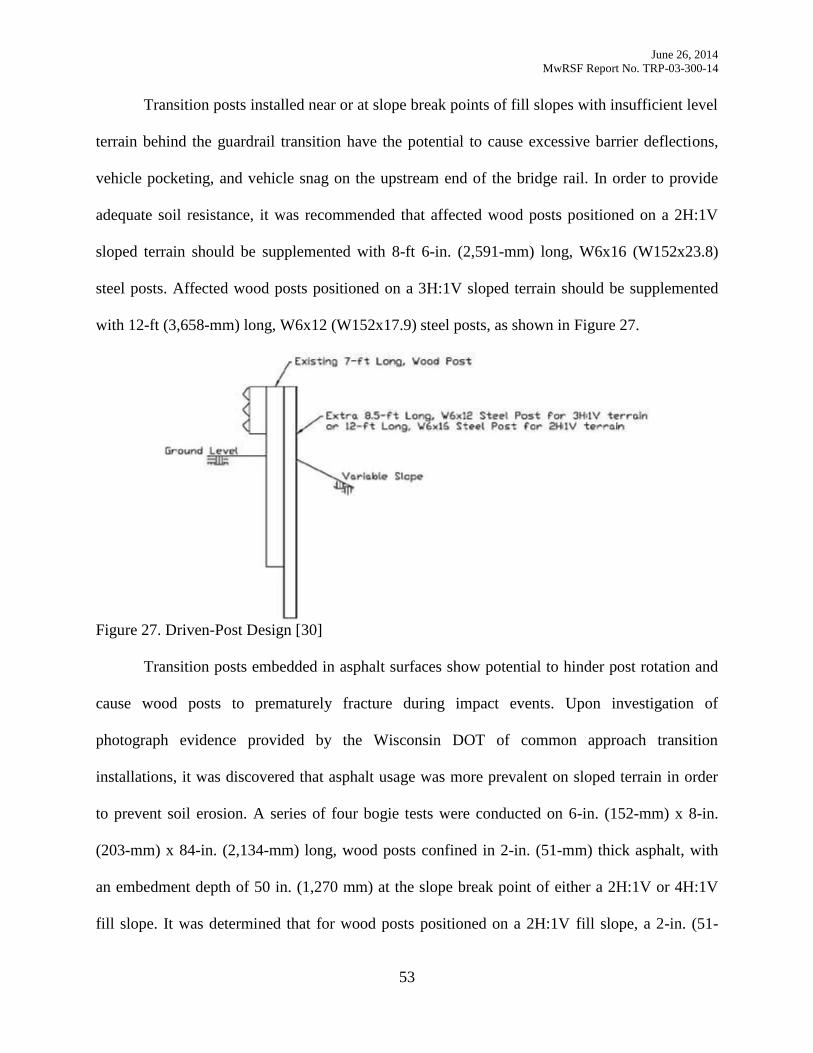
June 26, 2014
MwRSF Report No. TRP-03-300-14
53
Transition posts installed near or at slope break points of fill slopes with insufficient level
terrain behind the guardrail transition have the potential to cause excessive barrier deflections,
vehicle pocketing, and vehicle snag on the upstream end of the bridge rail. In order to provide
adequate soil resistance, it was recommended that affected wood posts positioned on a 2H:1V
sloped terrain should be supplemented with 8-ft 6-in. (2,591-mm) long, W6x16 (W152x23.8)
steel posts. Affected wood posts positioned on a 3H:1V sloped terrain should be supplemented
with 12-ft (3,658-mm) long, W6x12 (W152x17.9) steel posts, as shown in Figure 27.
Figure 27. Driven-Post Design [30]
Transition posts embedded in asphalt surfaces show potential to hinder post rotation and
cause wood posts to prematurely fracture during impact events. Upon investigation of
photograph evidence provided by the Wisconsin DOT of common approach transition
installations, it was discovered that asphalt usage was more prevalent on sloped terrain in order
to prevent soil erosion. A series of four bogie tests were conducted on 6-in. (152-mm) x 8-in.
(203-mm) x 84-in. (2,134-mm) long, wood posts confined in 2-in. (51-mm) thick asphalt, with
an embedment depth of 50 in. (1,270 mm) at the slope break point of either a 2H:1V or 4H:1V
fill slope. It was determined that for wood posts positioned on a 2H:1V fill slope, a 2-in. (51-
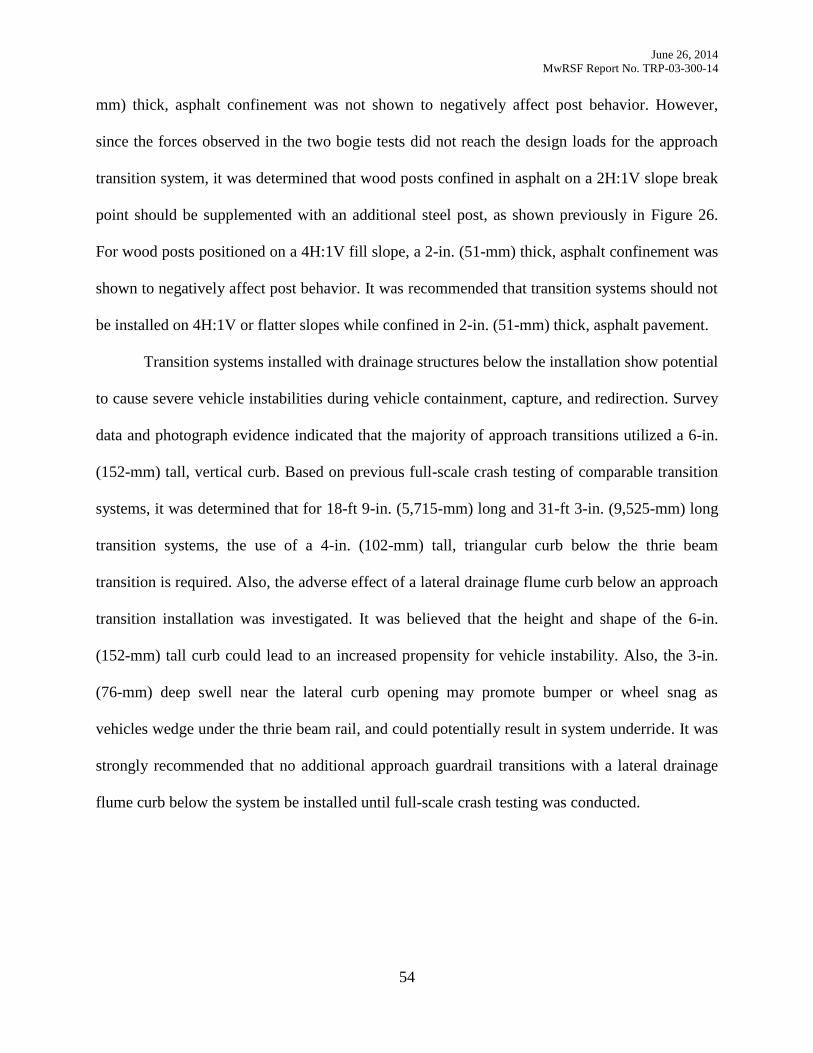
June 26, 2014
MwRSF Report No. TRP-03-300-14
54
mm) thick, asphalt confinement was not shown to negatively affect post behavior. However,
since the forces observed in the two bogie tests did not reach the design loads for the approach
transition system, it was determined that wood posts confined in asphalt on a 2H:1V slope break
point should be supplemented with an additional steel post, as shown previously in Figure 26.
For wood posts positioned on a 4H:1V fill slope, a 2-in. (51-mm) thick, asphalt confinement was
shown to negatively affect post behavior. It was recommended that transition systems should not
be installed on 4H:1V or flatter slopes while confined in 2-in. (51-mm) thick, asphalt pavement.
Transition systems installed with drainage structures below the installation show potential
to cause severe vehicle instabilities during vehicle containment, capture, and redirection. Survey
data and photograph evidence indicated that the majority of approach transitions utilized a 6-in.
(152-mm) tall, vertical curb. Based on previous full-scale crash testing of comparable transition
systems, it was determined that for 18-ft 9-in. (5,715-mm) long and 31-ft 3-in. (9,525-mm) long
transition systems, the use of a 4-in. (102-mm) tall, triangular curb below the thrie beam
transition is required. Also, the adverse effect of a lateral drainage flume curb below an approach
transition installation was investigated. It was believed that the height and shape of the 6-in.
(152-mm) tall curb could lead to an increased propensity for vehicle instability. Also, the 3-in.
(76-mm) deep swell near the lateral curb opening may promote bumper or wheel snag as
vehicles wedge under the thrie beam rail, and could potentially result in system underride. It was
strongly recommended that no additional approach guardrail transitions with a lateral drainage
flume curb below the system be installed until full-scale crash testing was conducted.
June 26, 2014
MwRSF Report No. TRP-03-300-14
55
DEVELOPMENT OF DESIGN CONCEPTS 3
3.1 Design Constraints
Upon consultation with the Technical Advisory Committee (TAC) members, it was
determined that the TL-3 transition was necessary for situations where road construction created
a work zone adjacent to existing W-beam guardrail systems. In this scenario, a portion of the W-
beam guardrail would need to be removed. Subsequently, PCBs would be used to shield the
work zone and installed at a 15H:1V flare rate. In order to limit damage to the roadway surface
and reduce installation time, it was preferred that none of the PCBs be anchored or pinned to the
roadway surface. Although the primary configuration considered a transition from W-beam
guardrail to PCBs, there was potential for reverse-direction impacts, which should be
investigated during a critical impact point (CIP) study.
Soil grading and roadside terrain were also considered, since several transition design
concepts would require that PCBs be installed behind the existing W-beam guardrail system.
When PCBs are installed on native soil, they may settle or gouge into the soil, potentially
resulting in a large overturning moment and/or barrier tipping upon impact. For these situations,
a compacted, crushed limestone base, or similar, would be required for a minimum lateral width
of 4 ft (1,219 mm) and at a 10V:1H cross slope behind the transition installation. Since the
transition could likely be installed on a concrete, asphalt, or compacted crushed limestone base,
all three foundations needed to be considered during the concept development and full-scale
crash testing phases of the study.
Two different W-beam guardrail systems were considered in this research: the modified
G4(1S) guardrail system and the Midwest Guardrail System (MGS). The PCBs consisted of 32-
in. (813-mm) tall, F-shape PCBs that were developed through the Midwest Pooled Fund Program
[1].
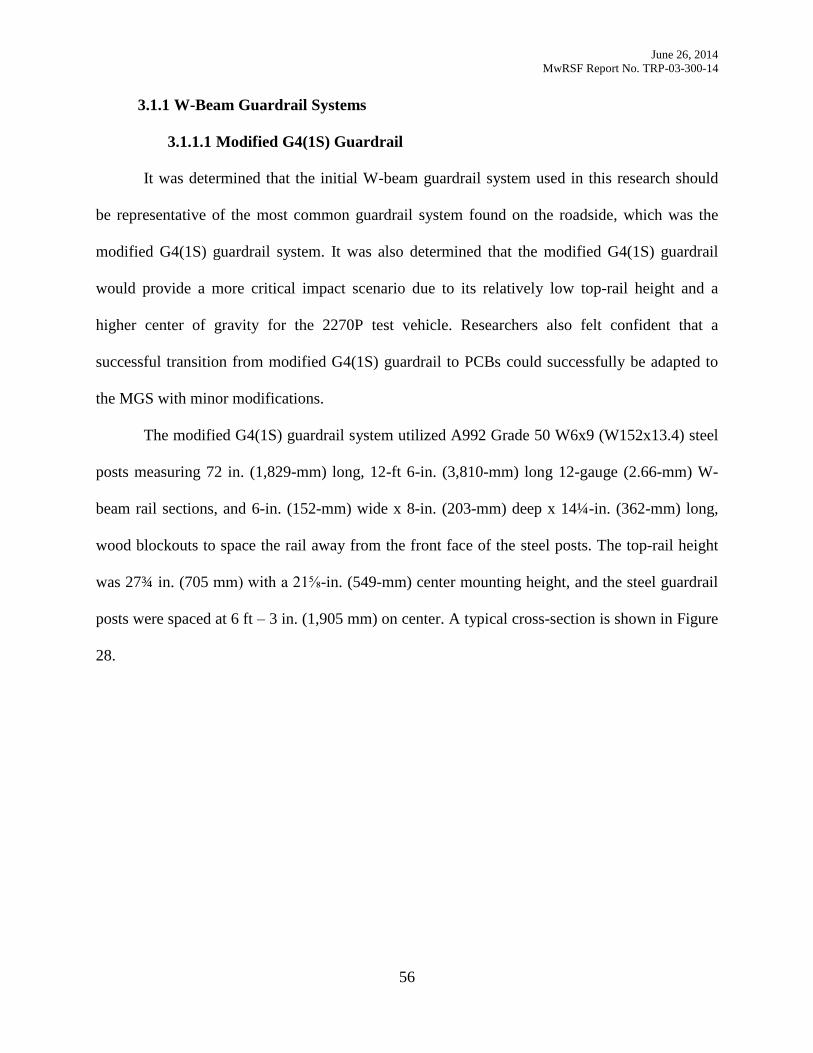
June 26, 2014
MwRSF Report No. TRP-03-300-14
56
3.1.1 W-Beam Guardrail Systems
3.1.1.1 Modified G4(1S) Guardrail
It was determined that the initial W-beam guardrail system used in this research should
be representative of the most common guardrail system found on the roadside, which was the
modified G4(1S) guardrail system. It was also determined that the modified G4(1S) guardrail
would provide a more critical impact scenario due to its relatively low top-rail height and a
higher center of gravity for the 2270P test vehicle. Researchers also felt confident that a
successful transition from modified G4(1S) guardrail to PCBs could successfully be adapted to
the MGS with minor modifications.
The modified G4(1S) guardrail system utilized A992 Grade 50 W6x9 (W152x13.4) steel
posts measuring 72 in. (1,829-mm) long, 12-ft 6-in. (3,810-mm) long 12-gauge (2.66-mm) W-
beam rail sections, and 6-in. (152-mm) wide x 8-in. (203-mm) deep x 14¼-in. (362-mm) long,
wood blockouts to space the rail away from the front face of the steel posts. The top-rail height
was 27¾ in. (705 mm) with a 21⅝-in. (549-mm) center mounting height, and the steel guardrail
posts were spaced at 6 ft – 3 in. (1,905 mm) on center. A typical cross-section is shown in Figure
28.
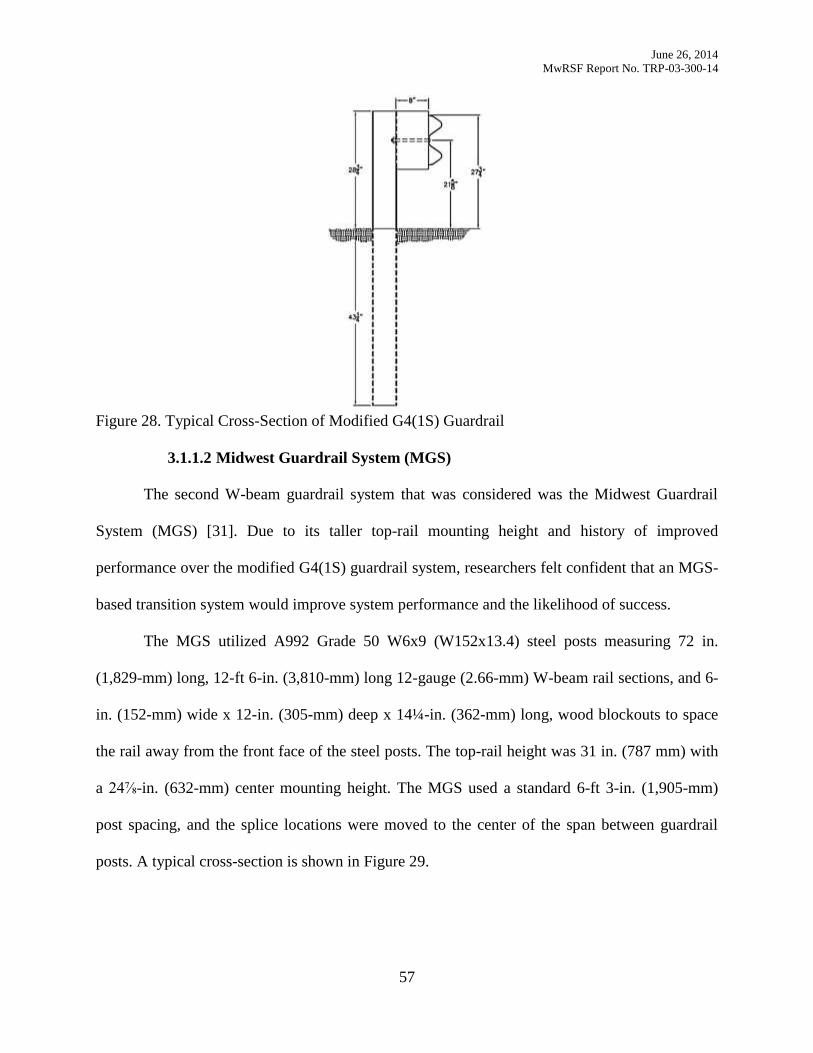
June 26, 2014
MwRSF Report No. TRP-03-300-14
57
Figure 28. Typical Cross-Section of Modified G4(1S) Guardrail
3.1.1.2 Midwest Guardrail System (MGS)
The second W-beam guardrail system that was considered was the Midwest Guardrail
System (MGS) [31]. Due to its taller top-rail mounting height and history of improved
performance over the modified G4(1S) guardrail system, researchers felt confident that an MGS-
based transition system would improve system performance and the likelihood of success.
The MGS utilized A992 Grade 50 W6x9 (W152x13.4) steel posts measuring 72 in.
(1,829-mm) long, 12-ft 6-in. (3,810-mm) long 12-gauge (2.66-mm) W-beam rail sections, and 6-
in. (152-mm) wide x 12-in. (305-mm) deep x 14¼-in. (362-mm) long, wood blockouts to space
the rail away from the front face of the steel posts. The top-rail height was 31 in. (787 mm) with
a 24⅞-in. (632-mm) center mounting height. The MGS used a standard 6-ft 3-in. (1,905-mm)
post spacing, and the splice locations were moved to the center of the span between guardrail
posts. A typical cross-section is shown in Figure 29.
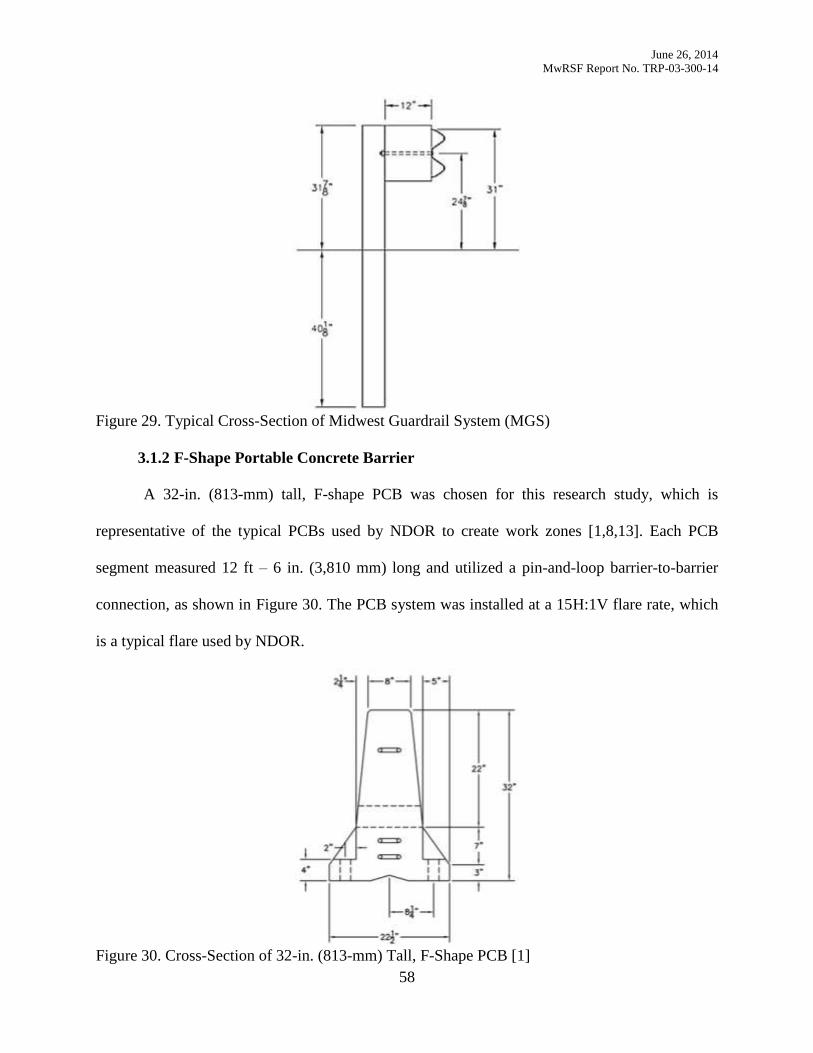
June 26, 2014
MwRSF Report No. TRP-03-300-14
58
Figure 29. Typical Cross-Section of Midwest Guardrail System (MGS)
3.1.2 F-Shape Portable Concrete Barrier
A 32-in. (813-mm) tall, F-shape PCB was chosen for this research study, which is
representative of the typical PCBs used by NDOR to create work zones [1,8,13]. Each PCB
segment measured 12 ft – 6 in. (3,810 mm) long and utilized a pin-and-loop barrier-to-barrier
connection, as shown in Figure 30. The PCB system was installed at a 15H:1V flare rate, which
is a typical flare used by NDOR.
Figure 30. Cross-Section of 32-in. (813-mm) Tall, F-Shape PCB [1]
June 26, 2014
MwRSF Report No. TRP-03-300-14
59
3.2 Design Concepts
Taking into account all of the design considerations, several design concepts were
brainstormed and discussed. The top five design concepts were formulated, and drawings were
developed and presented to the TAC members for consideration. Following discussion, the
concepts were ranked by feasibility, likelihood of success, and ease of installation. The rankings
were to provide guidance through concept evaluation and the simulation process. A description
of each design concept along with pros and cons are presented below. The TAC members
advised that the simplest transition in regards to installation time and number of components was
considered a high priority. Therefore, each design concept was presented in its simplest form,
and complexity was added as needed based on the simulation results to improve the safety
performance of the transition system.
3.2.1 Flared PCB–Modified G4(1S)
The first design concept was comprised of three components: modified G4(1S) guardrail,
W-beam end-shoe connection, and F-shape PCBs. The modified G4(1S) guardrail attached to a
15H:1V flared F-shape PCB system using a W-beam end-shoe connection to the third PCB
segment. Three 15H:1V flared PCB segments extended behind the modified G4(1S) guardrail
system, and the posts that interfered with the installation of the PCBs were removed, as shown in
Figure 31. The two posts that remained in front of the PCB system would aid in the displacement
of the PCB system. Upon impact, the remaining two posts would rotate backward into the PCBs
and initiate displacement of the PCB system, which could reduce vehicle climb and instabilities.
Based on the simulation results, several modifications could be made to the transition system to
improve its likelihood of success. These modifications included: a transition to thrie beam,
removal of posts in front of PCB system, installation of blockouts between the rail and PCBs,
installation of a cantilever beam to the front face of the most upstream PCB, and nesting of rail.
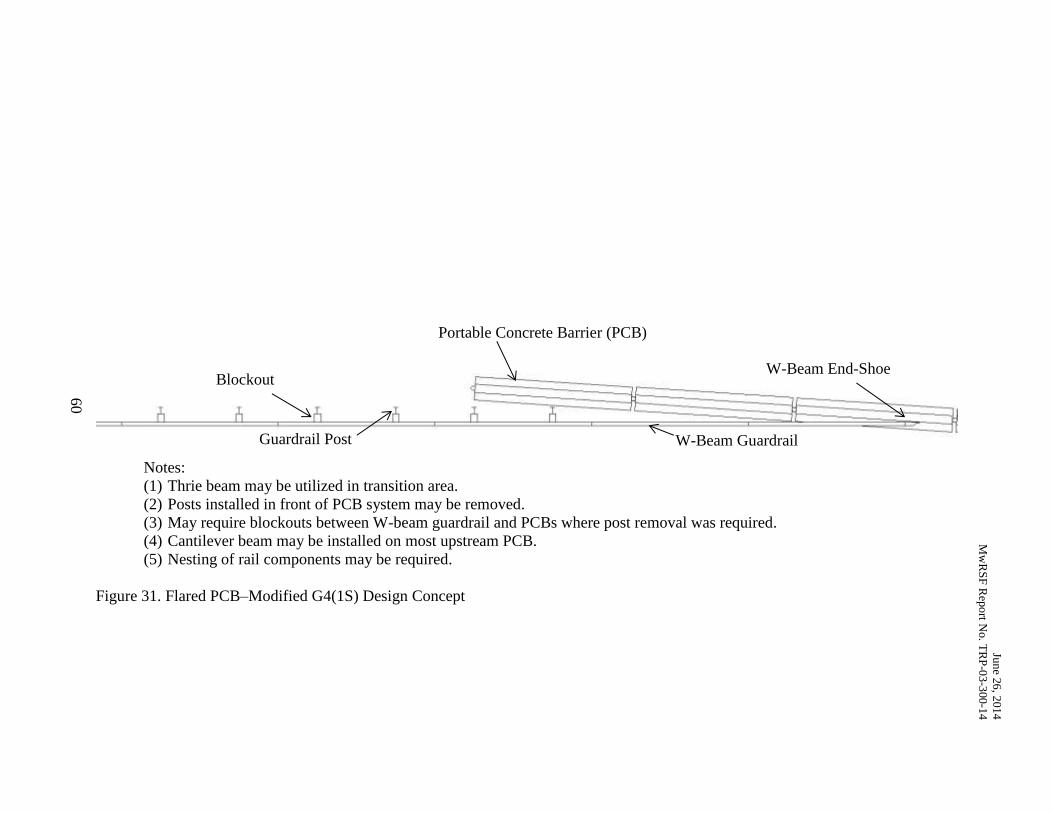
60
Jun
e 26
, 201
4
Mw
RS
F R
epo
rt No. T
RP
-03
-300-1
4
Notes:
(1) Thrie beam may be utilized in transition area.
(2) Posts installed in front of PCB system may be removed.
(3) May require blockouts between W-beam guardrail and PCBs where post removal was required.
(4) Cantilever beam may be installed on most upstream PCB.
(5) Nesting of rail components may be required.
Figure 31. Flared PCB–Modified G4(1S) Design Concept
Blockout
Guardrail Post
Portable Concrete Barrier (PCB)
W-Beam End-Shoe
W-Beam Guardrail
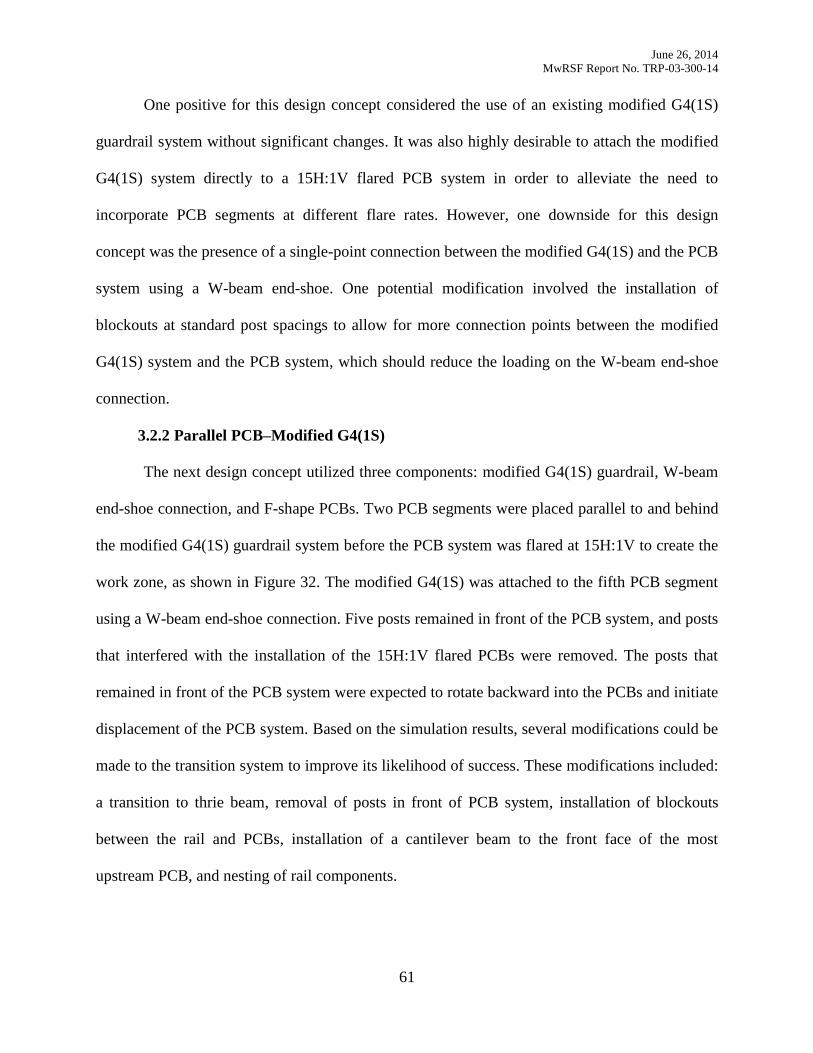
June 26, 2014
MwRSF Report No. TRP-03-300-14
61
One positive for this design concept considered the use of an existing modified G4(1S)
guardrail system without significant changes. It was also highly desirable to attach the modified
G4(1S) system directly to a 15H:1V flared PCB system in order to alleviate the need to
incorporate PCB segments at different flare rates. However, one downside for this design
concept was the presence of a single-point connection between the modified G4(1S) and the PCB
system using a W-beam end-shoe. One potential modification involved the installation of
blockouts at standard post spacings to allow for more connection points between the modified
G4(1S) system and the PCB system, which should reduce the loading on the W-beam end-shoe
connection.
3.2.2 Parallel PCB–Modified G4(1S)
The next design concept utilized three components: modified G4(1S) guardrail, W-beam
end-shoe connection, and F-shape PCBs. Two PCB segments were placed parallel to and behind
the modified G4(1S) guardrail system before the PCB system was flared at 15H:1V to create the
work zone, as shown in Figure 32. The modified G4(1S) was attached to the fifth PCB segment
using a W-beam end-shoe connection. Five posts remained in front of the PCB system, and posts
that interfered with the installation of the 15H:1V flared PCBs were removed. The posts that
remained in front of the PCB system were expected to rotate backward into the PCBs and initiate
displacement of the PCB system. Based on the simulation results, several modifications could be
made to the transition system to improve its likelihood of success. These modifications included:
a transition to thrie beam, removal of posts in front of PCB system, installation of blockouts
between the rail and PCBs, installation of a cantilever beam to the front face of the most
upstream PCB, and nesting of rail components.
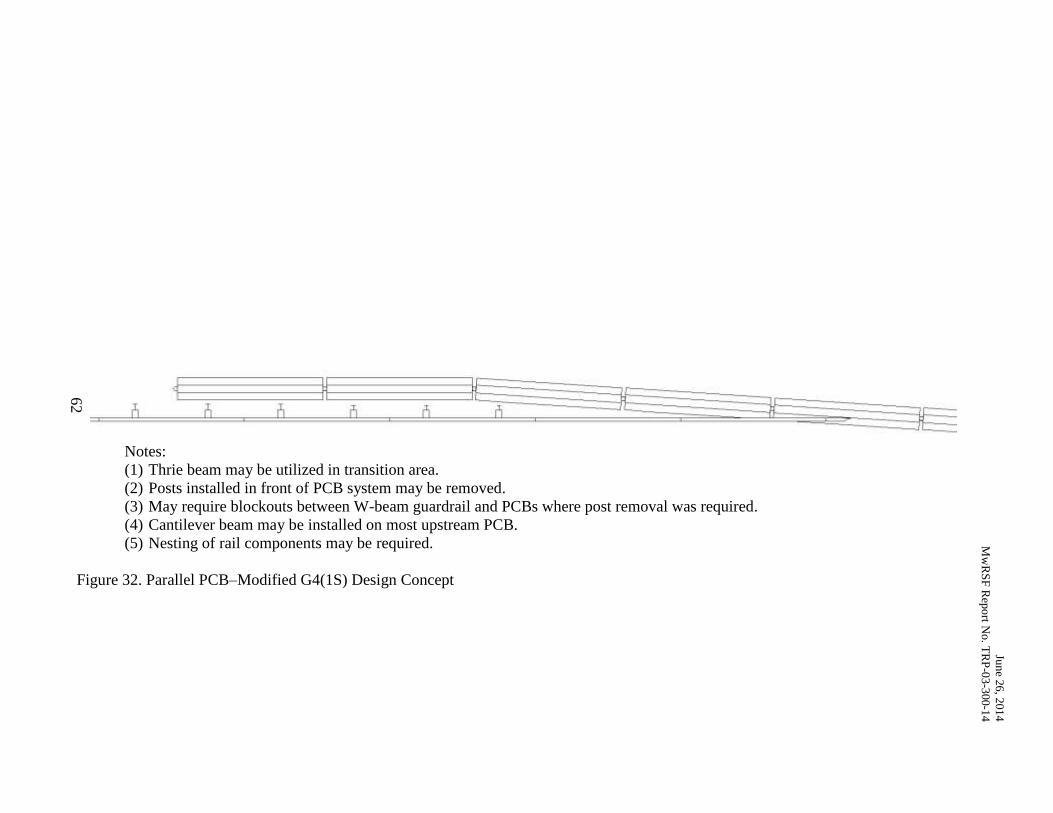
Jun
e 26
, 201
4
Mw
RS
F R
epo
rt No. T
RP
-03
-300-1
4
62
Notes:
(1) Thrie beam may be utilized in transition area.
(2) Posts installed in front of PCB system may be removed.
(3) May require blockouts between W-beam guardrail and PCBs where post removal was required.
(4) Cantilever beam may be installed on most upstream PCB.
(5) Nesting of rail components may be required.
Figure 32. Parallel PCB–Modified G4(1S) Design Concept
June 26, 2014
MwRSF Report No. TRP-03-300-14
63
One concern for this design concept was that placing PCBs segments parallel to and
behind the modified G4(1S) may accentuate wheel snag on the end of the PCB system during
vehicle impacts upstream from the PCB system. Along with wheel snag, rail pocketing was a
concern upstream from the end of the PCB system due to the inertial force required to initiate
PCB displacement. Further, the attachment location may vary based on the actual location of the
PCB system relative to the guardrail system. An alternative attachment location will alter the
distance between the PCB segments placed parallel to and behind the modified G4(1S) system,
thus affecting system performance. One positive for this design concept was that it would allow
for the use of an existing modified G4(1S) W-beam guardrail system without significant
changes.
3.2.3 Beam Attachment Between PCB and Modified G4(1S)
The third design concept utilized four components: modified G4(1S) guardrail, W-beam
end-shoe connection, F-shape PCBs, and either a box-beam or horizontal post. This design
concept explored the use of an end-to-end connection between the two systems. In order to
encourage the two systems to displace together, the systems would be connected to one another.
This behavior would be achieved by attaching a box-beam rail to the backside of the most
upstream PCB and extending it to the backside of the most downstream guardrail post.
Alternatively, a horizontal post could be attached to the backside of the most upstream PCB and
extend to the web of the most downstream guardrail post. Both designs are shown in Figure 33.
Researchers also took note of the high probability for wheel snag on the upstream end of
the PCB system, which could accentuate vehicle instabilities and elevated occupant risk values.
Researchers decided that the best way to mitigate wheel snag concerns would be to design and
fabricate a special chamfered-end, PCB segment, as shown in Figure 34. Based on the simulation
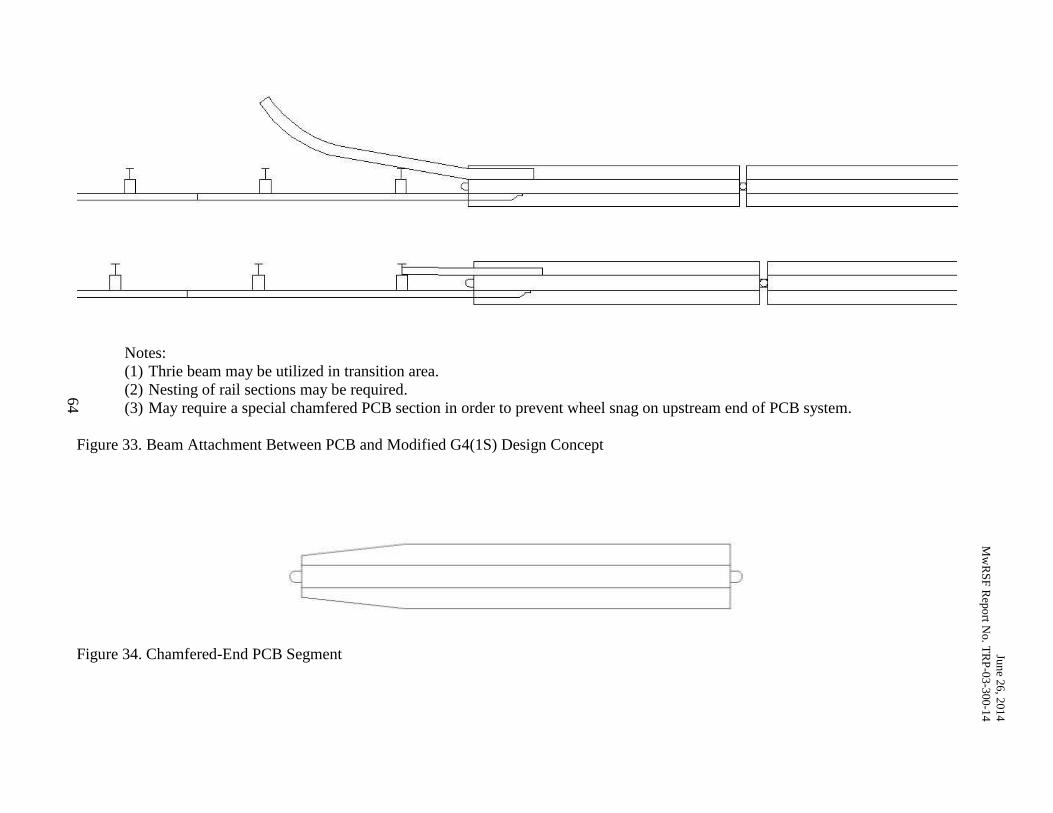
Jun
e 26
, 201
4
Mw
RS
F R
epo
rt No. T
RP
-03
-300-1
4
64
Notes:
(1) Thrie beam may be utilized in transition area.
(2) Nesting of rail sections may be required.
(3) May require a special chamfered PCB section in order to prevent wheel snag on upstream end of PCB system.
Figure 33. Beam Attachment Between PCB and Modified G4(1S) Design Concept
Figure 34. Chamfered-End PCB Segment
June 26, 2014
MwRSF Report No. TRP-03-300-14
65
results, several modifications could be made to the transition system to improve its likelihood of
success. These modifications included: a transition to thrie beam, nesting of the rail components,
and installation of a chamfered-end PCB segment. Note that this design does not incorporate the
15H:1V flare rate, often used to create a work zone. However, it was decided that the PCB
system could run parallel to the modified G4(1S) guardrail system for a distance and then
transition to the 15H:1V flared PCB system.
One concern with this design concept was the cost associated with designing and
fabricating a special chamfered-end PCB segment. Similar to the previous design concept, the
attachment location may vary based on the actual location of the PCB system relative to the
guardrail system, which may affect performance. One positive for this design concept was that it
would likely be the shortest system and easiest to install for all of the transition design concepts.
It also includes the existing modified G4(1S) guardrail system with no significant modifications,
which reduces the complexity of the transition design.
3.2.4 PCB Offset From Modified G4(1S)
The fourth design concept utilized three components: modified G4(1S) guardrail, W-
beam end-shoe connection, and F-shape PCBs. This design concept is similar to the Parallel
PCB–Modified G4(1S) design concept. In this design concept, the PCB segments located behind
the modified G4(1S) guardrail are installed to replace the guardrail posts that would be installed
in front of the PCB system. The PCB segments are installed behind the modified G4(1S)
guardrail system and blocked away from the rail using spacers at locations where guardrail posts
were removed. This design concept is shown in Figure 35. The primary reasoning behind
guardrail post removal and blockout installation was to allow for the blockouts to initiate PCB
displacement, and provide a smooth transition in lateral stiffness from the modified G4(1S)
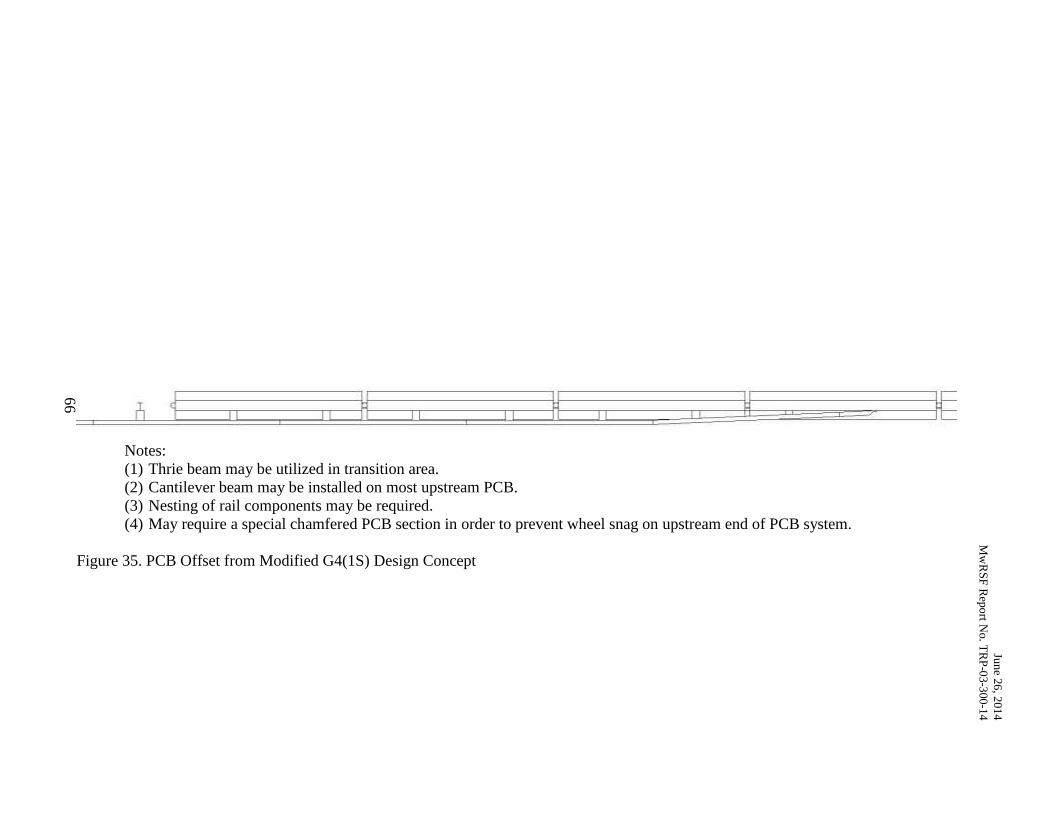
Jun
e 26
, 201
4
Mw
RS
F R
epo
rt No. T
RP
-03
-300-1
4
66
Notes:
(1) Thrie beam may be utilized in transition area.
(2) Cantilever beam may be installed on most upstream PCB.
(3) Nesting of rail components may be required.
(4) May require a special chamfered PCB section in order to prevent wheel snag on upstream end of PCB system.
Figure 35. PCB Offset from Modified G4(1S) Design Concept
June 26, 2014
MwRSF Report No. TRP-03-300-14
67
to the PCBs. The blockout depths would remain 8 in. (203 mm) with a slight taper to fit the
sloped face of the F-shape PCBs. Since the PCBs would be installed to replace the guardrail
posts and would be blocked away from the guardrail, the attachment to the PCB system would be
different from the previous design concepts. The rail would need to taper back toward the face of
the PCB system over one rail section, and smaller tapered blockouts would be required in the
attachment area. Based on the simulation results, several modifications could be made to the
transition system to improve its likelihood of success. These modifications included: a transition
to thrie beam, installation of a cantilever beam off of the most upstream PCB segment, nesting of
rail components, or installation of a special chamfered-end PCB segment. Note that this design
does not incorporate a 15H:1V flare that is often used to create a work zone. However, it was
decided that the PCB system could run parallel to and behind the modified G4(1S) guardrail
system for a distance and then transition to the 15H:1V flared PCB system.
One concern associated with this design concept was the potential for wheel snag on the
upstream end of the PCB system, which may require the use of a special chamfered-end, PCB
segment. The cost associated with the design and fabrication of a chamfered-end PCB segment
also made this design concept less desirable. Also, similar to previous design concepts, the
attachment location may vary based on the actual location of the PCB system relative to the
guardrail system, which may affect performance. One positive for this design concept is that it
would use standard 8-in. (203-mm) deep blockouts instead of oversized blockouts, which may be
required to attach W-beam to flared PCB segments. It also includes the existing modified G4(1S)
guardrail system with no significant changes, which reduces the complexity of the transition
design.
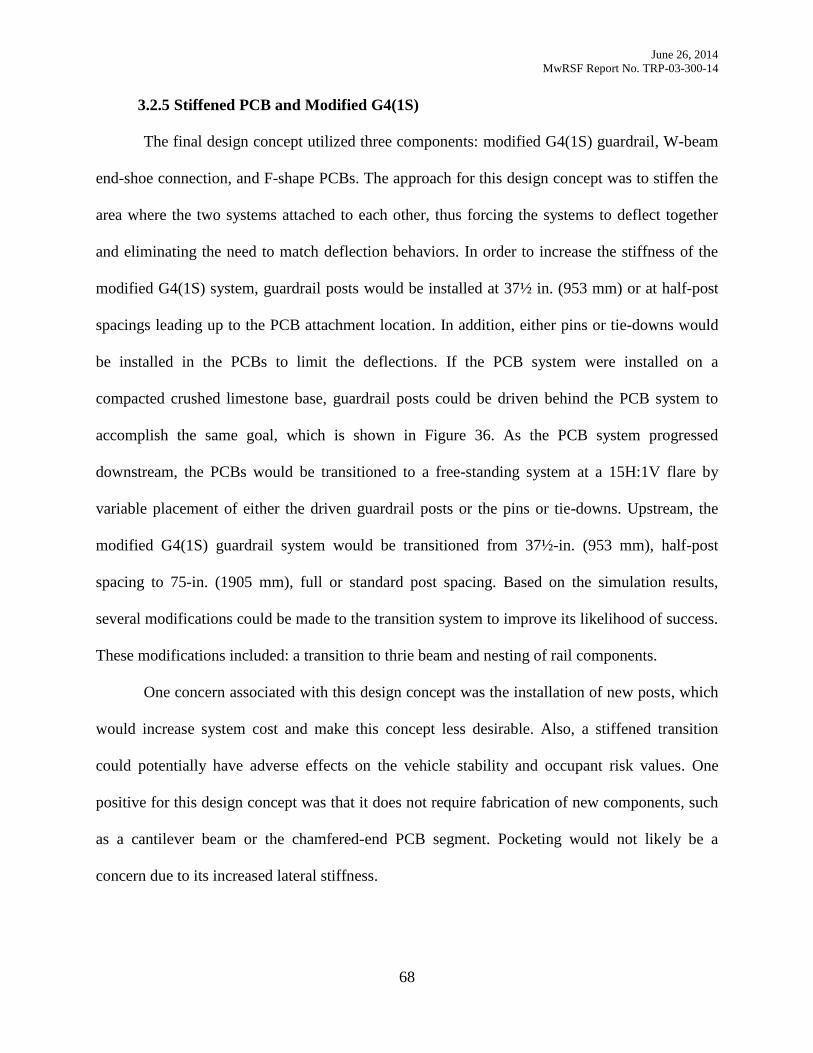
June 26, 2014
MwRSF Report No. TRP-03-300-14
68
3.2.5 Stiffened PCB and Modified G4(1S)
The final design concept utilized three components: modified G4(1S) guardrail, W-beam
end-shoe connection, and F-shape PCBs. The approach for this design concept was to stiffen the
area where the two systems attached to each other, thus forcing the systems to deflect together
and eliminating the need to match deflection behaviors. In order to increase the stiffness of the
modified G4(1S) system, guardrail posts would be installed at 37½ in. (953 mm) or at half-post
spacings leading up to the PCB attachment location. In addition, either pins or tie-downs would
be installed in the PCBs to limit the deflections. If the PCB system were installed on a
compacted crushed limestone base, guardrail posts could be driven behind the PCB system to
accomplish the same goal, which is shown in Figure 36. As the PCB system progressed
downstream, the PCBs would be transitioned to a free-standing system at a 15H:1V flare by
variable placement of either the driven guardrail posts or the pins or tie-downs. Upstream, the
modified G4(1S) guardrail system would be transitioned from 37½-in. (953 mm), half-post
spacing to 75-in. (1905 mm), full or standard post spacing. Based on the simulation results,
several modifications could be made to the transition system to improve its likelihood of success.
These modifications included: a transition to thrie beam and nesting of rail components.
One concern associated with this design concept was the installation of new posts, which
would increase system cost and make this concept less desirable. Also, a stiffened transition
could potentially have adverse effects on the vehicle stability and occupant risk values. One
positive for this design concept was that it does not require fabrication of new components, such
as a cantilever beam or the chamfered-end PCB segment. Pocketing would not likely be a
concern due to its increased lateral stiffness.
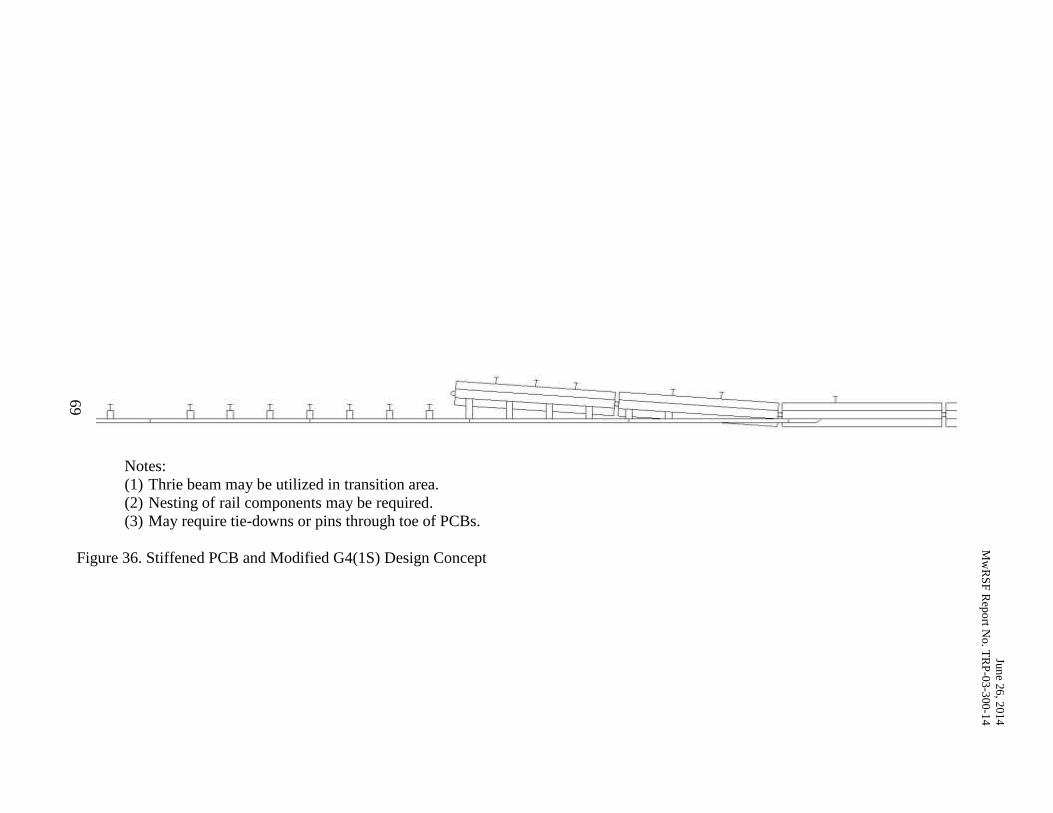
Jun
e 26
, 201
4
Mw
RS
F R
epo
rt No. T
RP
-03
-300-1
4
69
Notes:
(1) Thrie beam may be utilized in transition area.
(2) Nesting of rail components may be required.
(3) May require tie-downs or pins through toe of PCBs.
Figure 36. Stiffened PCB and Modified G4(1S) Design Concept
June 26, 2014
MwRSF Report No. TRP-03-300-14
70
3.3 Design Concept Summary
Once all of the design concepts were presented to the Nebraska TAC members, the pros
and cons for each design concept were discussed and weighed. The TAC members determined
that the use of the modified G4(1S) guardrail was preferred. However, a transition to thrie beam
would be feasible and would not require extensive time or effort to install. Thus, design concepts
that utilize a transition to thrie beam may be considered. The fabrication of a cantilever beam
was also determined to be favorable based on the idea that the safety improvements would
outweigh the cost of fabrication. However, the design and fabrication of a chamfered-end PCB
segment would be far too extensive and expensive. Thus, design concepts that would potentially
use it were deemed less desirable. The installation of new guardrail posts, and pinning or
anchoring PCB segments would require significant time and extra equipment. These design
concepts were also deemed less desirable. Based on the feasibility, likelihood of success, ease of
installation and component fabrication, all design concepts were ranked and simulated in this
order:
(1) Flared PCB–Modified G4(1S),
(2) Parallel PCB–Modified G4(1S),
(3) Beam Attachment Between PCB and Modified G4(1S),
(4) PCB Offset From Modified G4(1S), and
(5) Stiffened PCB and Modified G4(1S).
Due to project constraints, only the first two design concepts were simulated in the initial
investigation.
June 26, 2014
MwRSF Report No. TRP-03-300-14
71
TEST CONDITIONS AND EVALUATION CRITERIA 4
4.1 MASH TL-3 Simulated Test Conditions
Transition systems must satisfy impact safety standards defined in MASH in order to be
accepted by the Federal Highway Administration (FHWA) for use on the roadside. According to
TL-3 of MASH, longitudinal barriers must be impacted at a nominal speed and angle of 62.1
mph (100 km/hr) and 25 degrees, respectively. Therefore, each candidate design was subjected to
simulated impacts according to these parameters and at several impact locations ranging from the
connection point between the guardrail and the PCB system, to four posts upstream of the PCB
system. The design concepts were simulated using LS-DYNA. Each simulation was subjected to
a MASH TL-3 impact scenario, and metrics were extracted, compiled, and compared.
4.2 Evaluation Criteria
It was necessary to determine evaluation criteria for which to properly analyze and rank
the concepts as well as determine the likelihood of success. The evaluation criteria included
vehicle behavior, occupant risk, and rail pocketing, which are described in greater detail below.
4.2.1 Vehicle Behavior
Vehicle behavior is examined to evaluate the potential for safe vehicle containment and
redirection without excessive roll or complete rollover. The transition system should capture and
smoothly redirect the vehicle. Also, the vehicle should not penetrate, underride, or override the
transition system, while remaining upright during and after the impact event. Vehicle behavior
was evaluated after calculating of several parameters, including maximum roll, pitch, and yaw
angles. According to MASH, the maximum roll and pitch angles are not to exceed 75 degrees
[5]. It was also determined that wheel snag on the upstream end of the PCB system could affect
vehicle behavior and cause rapid deceleration, so it was documented for each simulation.
June 26, 2014
MwRSF Report No. TRP-03-300-14
72
4.2.2 Occupant Risk
Occupant risk evaluates the degree of hazard to occupants in the impacting vehicle. In
order to quantify this hazard, maximum longitudinal and lateral occupant impact velocities
(OIVs) as well as maximum longitudinal and lateral occupant ridedown accelerations (ORAs)
were calculated for each simulation. According to MASH, longitudinal and lateral OIVs should
fall below the maximum allowable value of 40.0 ft/s (12.2 m/s). MASH also states that
longitudinal and lateral ORAs should fall below the maximum allowable value of 20.49 g’s [5].
Occupant compartment damage was not measured in this study. To date, there have been no
extensive validation efforts that have focused on the occupant compartment of the Chevrolet
Silverado pickup model.
4.2.3 Pocketing Angle
Maximum pocketing angles are a primary concern for the transition design due to the
relatively high initial deflection of the guardrail system and the relatively low initial deflection of
the PCB system. Excessive pocketing angles can affect a system’s capability to safely contain
and redirect a test vehicle without rupture of the rail components. The maximum pocketing angle
for each simulation was calculated by tracking adjacent nodes on the rail to determine barrier
deflections as well as to calculate maximum slopes in advance of the vehicle. The maximum
pocketing angle should fall below 23 degrees, which has previously been shown to be associated
with degraded barrier performance, including rail rupture [22].
June 26, 2014
MwRSF Report No. TRP-03-300-14
73
FINITE ELEMENT BARRIER AND VEHICLE MODELS 5
5.1 Introduction
Finite element modeling is a very robust tool that is used to evaluate roadside safety
hardware. Accurate finite element modeling can be used to preliminarily evaluate potential
design concepts prior to conducting expensive full-scale vehicle crash testing. Four finite
element models were used to evaluate potential design concepts for the transition between W-
beam guardrail and PCBs. A previously-developed MGS model [32] was used to configure
several design concepts. The MGS model was altered to configure a model of the modified
G4(1S) guardrail system. A previously-developed F-shape PCB model [1] was used to configure
both tangent and 15H:1V flared PCBs within a work-zone environment. A Chevrolet Silverado
vehicle model was chosen to be representative of 2270P pickup truck test vehicles.
5.2 Midwest Guardrail System (MGS) Model
A second generation MGS LS-DYNA model was developed by researchers at MwRSF.
The goals of the new model were to: improve end anchorage design to better match full-scale
system construction and results, refine system mesh for improved barrier deflection performance,
and improve vehicle-to-barrier interaction and results. The second generation model has been
shown to improve model performance in simulating full-scale vehicle crash tests [32]. A list of
MGS model parts and associated LS-DYNA modeling parameters are shown in Table 4. A
comparison between the actual and finite element model end anchorage and full MGS system is
shown in Figures 37 and 38, respectively.
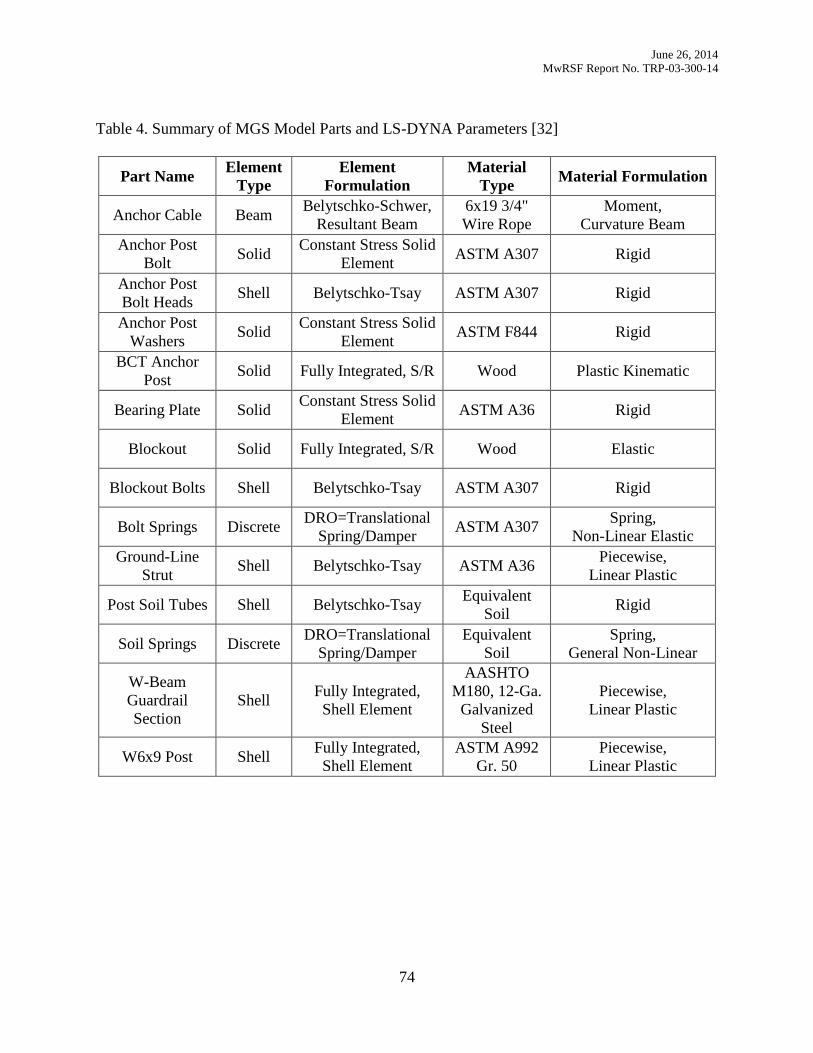
June 26, 2014
MwRSF Report No. TRP-03-300-14
74
Table 4. Summary of MGS Model Parts and LS-DYNA Parameters [32]
Part Name Element
Type
Element
Formulation
Material
Type Material Formulation
Anchor Cable Beam Belytschko-Schwer,
Resultant Beam
6x19 3/4"
Wire Rope
Moment,
Curvature Beam
Anchor Post
Bolt Solid
Constant Stress Solid
Element ASTM A307 Rigid
Anchor Post
Bolt Heads Shell Belytschko-Tsay ASTM A307 Rigid
Anchor Post
Washers Solid
Constant Stress Solid
Element ASTM F844 Rigid
BCT Anchor
Post Solid Fully Integrated, S/R Wood Plastic Kinematic
Bearing Plate Solid Constant Stress Solid
Element ASTM A36 Rigid
Blockout Solid Fully Integrated, S/R Wood Elastic
Blockout Bolts Shell Belytschko-Tsay ASTM A307 Rigid
Bolt Springs Discrete DRO=Translational
Spring/Damper ASTM A307
Spring,
Non-Linear Elastic
Ground-Line
Strut Shell Belytschko-Tsay ASTM A36
Piecewise,
Linear Plastic
Post Soil Tubes Shell Belytschko-Tsay Equivalent
Soil Rigid
Soil Springs Discrete DRO=Translational
Spring/Damper
Equivalent
Soil
Spring,
General Non-Linear
W-Beam
Guardrail
Section
Shell Fully Integrated,
Shell Element
AASHTO
M180, 12-Ga.
Galvanized
Steel
Piecewise,
Linear Plastic
W6x9 Post Shell Fully Integrated,
Shell Element
ASTM A992
Gr. 50
Piecewise,
Linear Plastic
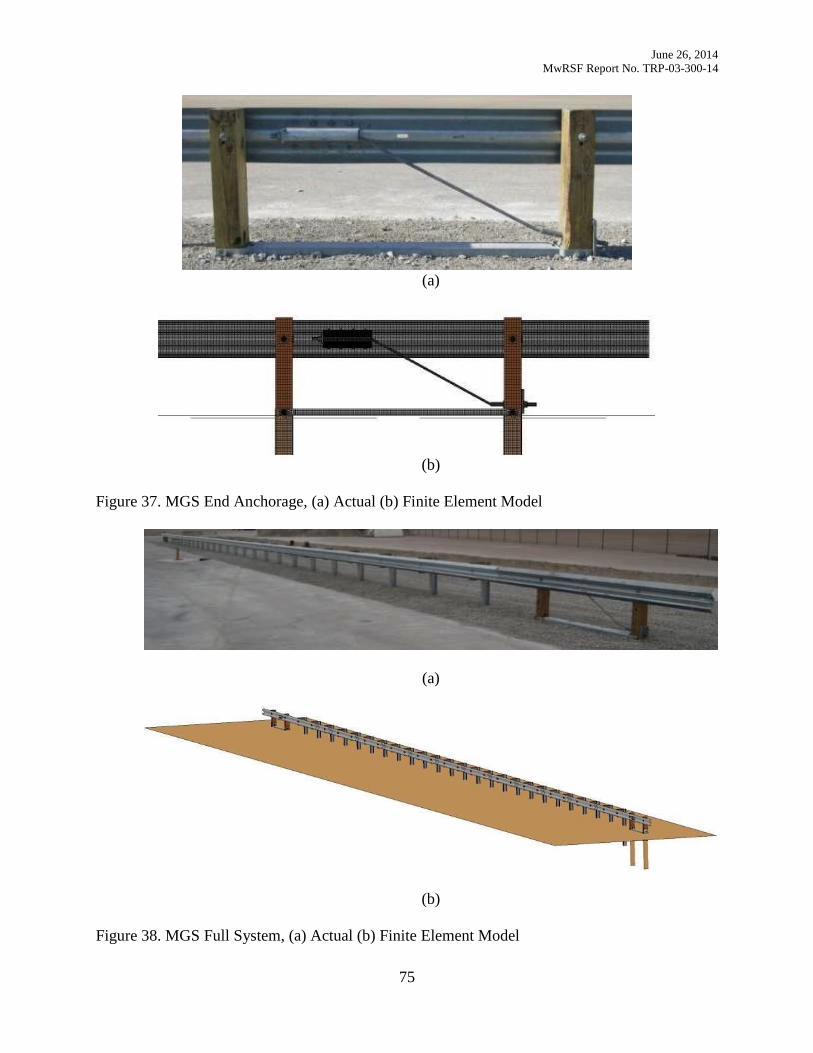
June 26, 2014
MwRSF Report No. TRP-03-300-14
75
(a)
(b)
Figure 37. MGS End Anchorage, (a) Actual (b) Finite Element Model
(a)
(b)
Figure 38. MGS Full System, (a) Actual (b) Finite Element Model
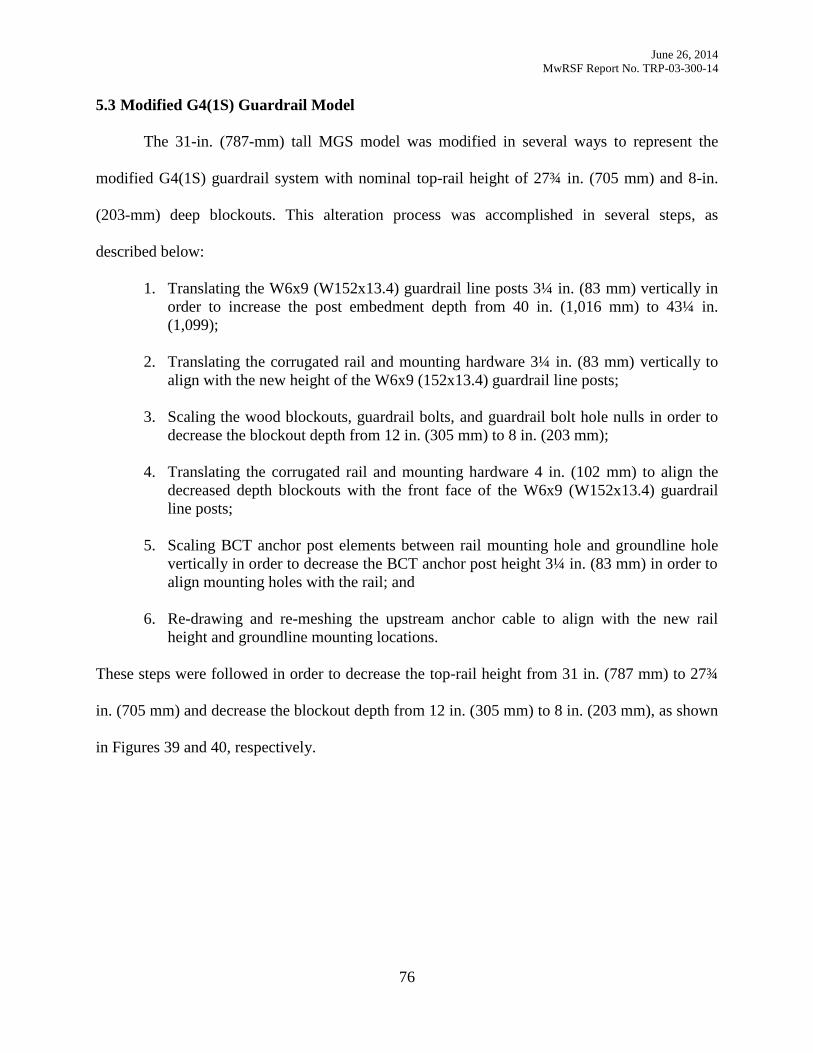
June 26, 2014
MwRSF Report No. TRP-03-300-14
76
5.3 Modified G4(1S) Guardrail Model
The 31-in. (787-mm) tall MGS model was modified in several ways to represent the
modified G4(1S) guardrail system with nominal top-rail height of 27¾ in. (705 mm) and 8-in.
(203-mm) deep blockouts. This alteration process was accomplished in several steps, as
described below:
1. Translating the W6x9 (W152x13.4) guardrail line posts 3¼ in. (83 mm) vertically in
order to increase the post embedment depth from 40 in. (1,016 mm) to 43¼ in.
(1,099);
2. Translating the corrugated rail and mounting hardware 3¼ in. (83 mm) vertically to
align with the new height of the W6x9 (152x13.4) guardrail line posts;
3. Scaling the wood blockouts, guardrail bolts, and guardrail bolt hole nulls in order to
decrease the blockout depth from 12 in. (305 mm) to 8 in. (203 mm);
4. Translating the corrugated rail and mounting hardware 4 in. (102 mm) to align the
decreased depth blockouts with the front face of the W6x9 (W152x13.4) guardrail
line posts;
5. Scaling BCT anchor post elements between rail mounting hole and groundline hole
vertically in order to decrease the BCT anchor post height 3¼ in. (83 mm) in order to
align mounting holes with the rail; and
6. Re-drawing and re-meshing the upstream anchor cable to align with the new rail
height and groundline mounting locations.
These steps were followed in order to decrease the top-rail height from 31 in. (787 mm) to 27¾
in. (705 mm) and decrease the blockout depth from 12 in. (305 mm) to 8 in. (203 mm), as shown
in Figures 39 and 40, respectively.
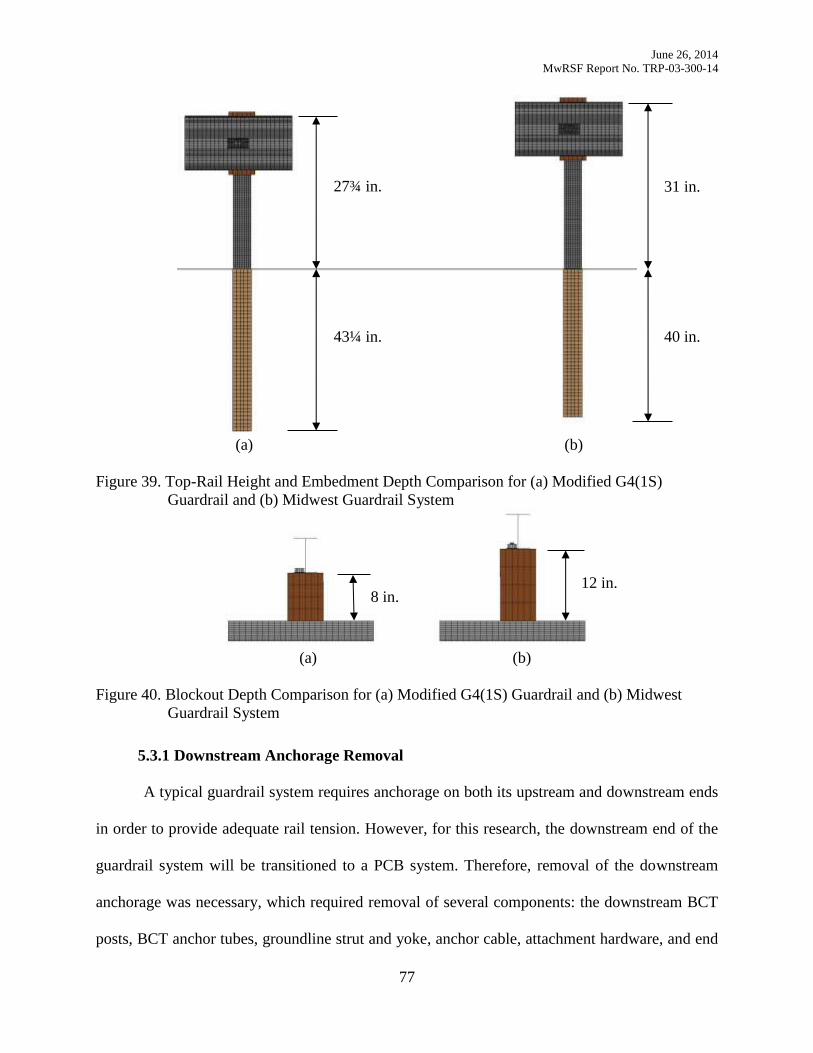
June 26, 2014
MwRSF Report No. TRP-03-300-14
77
(a) (b)
Figure 39. Top-Rail Height and Embedment Depth Comparison for (a) Modified G4(1S)
Guardrail and (b) Midwest Guardrail System
(a) (b)
Figure 40. Blockout Depth Comparison for (a) Modified G4(1S) Guardrail and (b) Midwest
Guardrail System
5.3.1 Downstream Anchorage Removal
A typical guardrail system requires anchorage on both its upstream and downstream ends
in order to provide adequate rail tension. However, for this research, the downstream end of the
guardrail system will be transitioned to a PCB system. Therefore, removal of the downstream
anchorage was necessary, which required removal of several components: the downstream BCT
posts, BCT anchor tubes, groundline strut and yoke, anchor cable, attachment hardware, and end
43¼ in.
27¾ in. 31 in.
40 in.
8 in. 12 in.
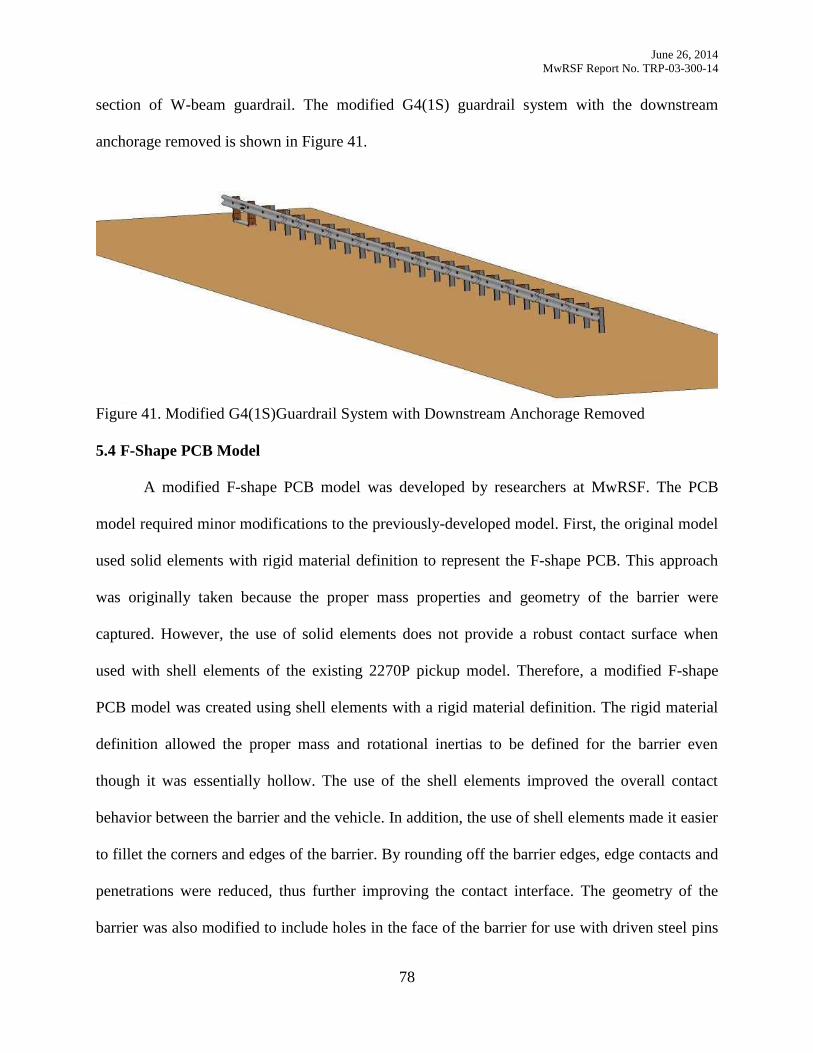
June 26, 2014
MwRSF Report No. TRP-03-300-14
78
section of W-beam guardrail. The modified G4(1S) guardrail system with the downstream
anchorage removed is shown in Figure 41.
Figure 41. Modified G4(1S)Guardrail System with Downstream Anchorage Removed
5.4 F-Shape PCB Model
A modified F-shape PCB model was developed by researchers at MwRSF. The PCB
model required minor modifications to the previously-developed model. First, the original model
used solid elements with rigid material definition to represent the F-shape PCB. This approach
was originally taken because the proper mass properties and geometry of the barrier were
captured. However, the use of solid elements does not provide a robust contact surface when
used with shell elements of the existing 2270P pickup model. Therefore, a modified F-shape
PCB model was created using shell elements with a rigid material definition. The rigid material
definition allowed the proper mass and rotational inertias to be defined for the barrier even
though it was essentially hollow. The use of the shell elements improved the overall contact
behavior between the barrier and the vehicle. In addition, the use of shell elements made it easier
to fillet the corners and edges of the barrier. By rounding off the barrier edges, edge contacts and
penetrations were reduced, thus further improving the contact interface. The geometry of the
barrier was also modified to include holes in the face of the barrier for use with driven steel pins
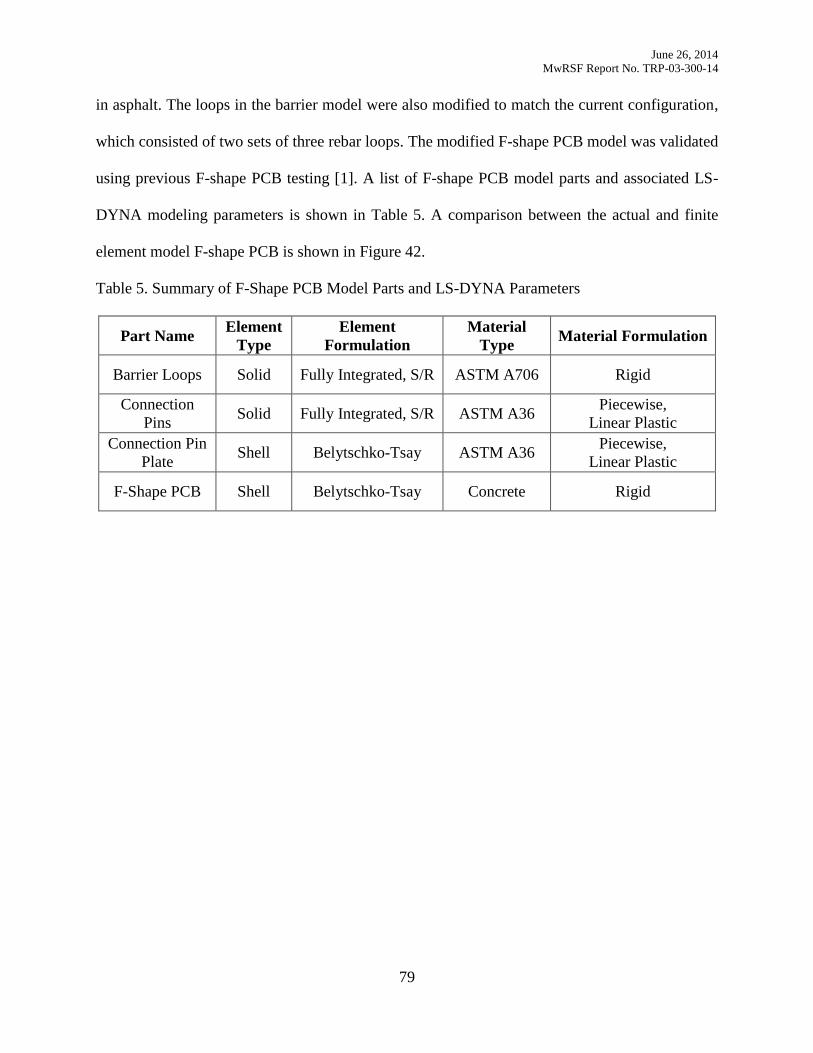
June 26, 2014
MwRSF Report No. TRP-03-300-14
79
in asphalt. The loops in the barrier model were also modified to match the current configuration,
which consisted of two sets of three rebar loops. The modified F-shape PCB model was validated
using previous F-shape PCB testing [1]. A list of F-shape PCB model parts and associated LS-
DYNA modeling parameters is shown in Table 5. A comparison between the actual and finite
element model F-shape PCB is shown in Figure 42.
Table 5. Summary of F-Shape PCB Model Parts and LS-DYNA Parameters
Part Name Element
Type
Element
Formulation
Material
Type Material Formulation
Barrier Loops Solid Fully Integrated, S/R ASTM A706 Rigid
Connection
Pins Solid Fully Integrated, S/R ASTM A36
Piecewise,
Linear Plastic
Connection Pin
Plate Shell Belytschko-Tsay ASTM A36
Piecewise,
Linear Plastic
F-Shape PCB Shell Belytschko-Tsay Concrete Rigid
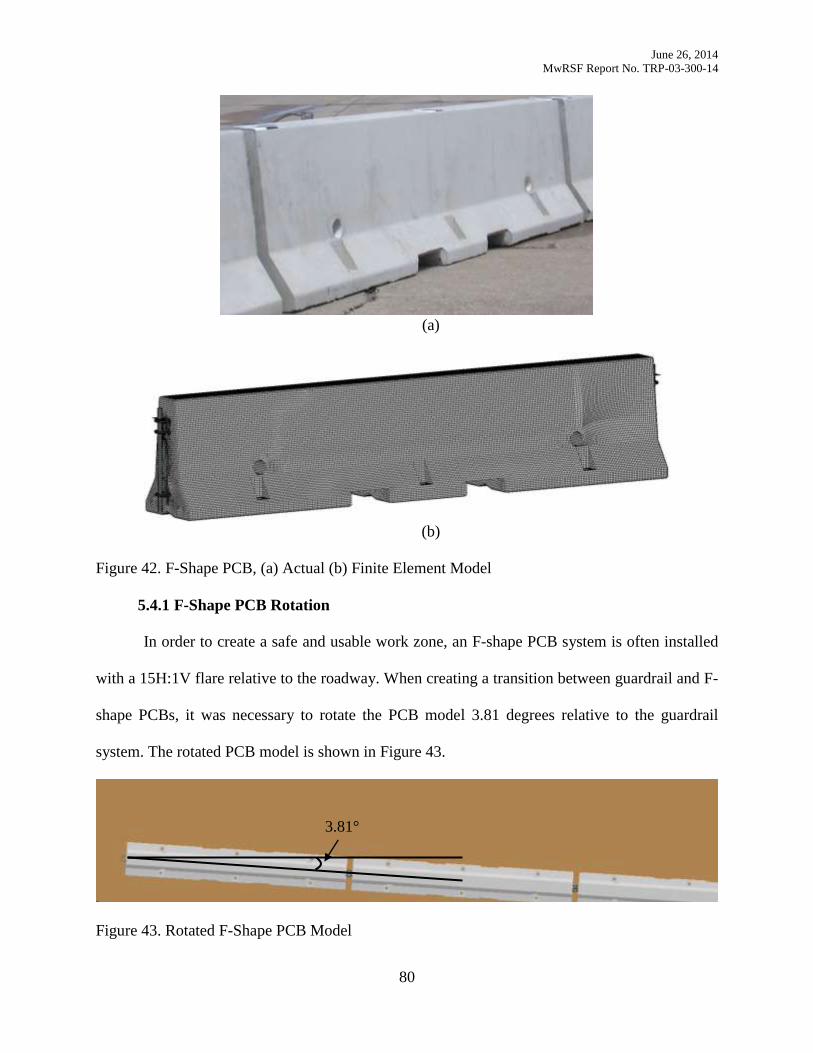
June 26, 2014
MwRSF Report No. TRP-03-300-14
80
(a)
(b)
Figure 42. F-Shape PCB, (a) Actual (b) Finite Element Model
5.4.1 F-Shape PCB Rotation
In order to create a safe and usable work zone, an F-shape PCB system is often installed
with a 15H:1V flare relative to the roadway. When creating a transition between guardrail and F-
shape PCBs, it was necessary to rotate the PCB model 3.81 degrees relative to the guardrail
system. The rotated PCB model is shown in Figure 43.
Figure 43. Rotated F-Shape PCB Model
3.81°
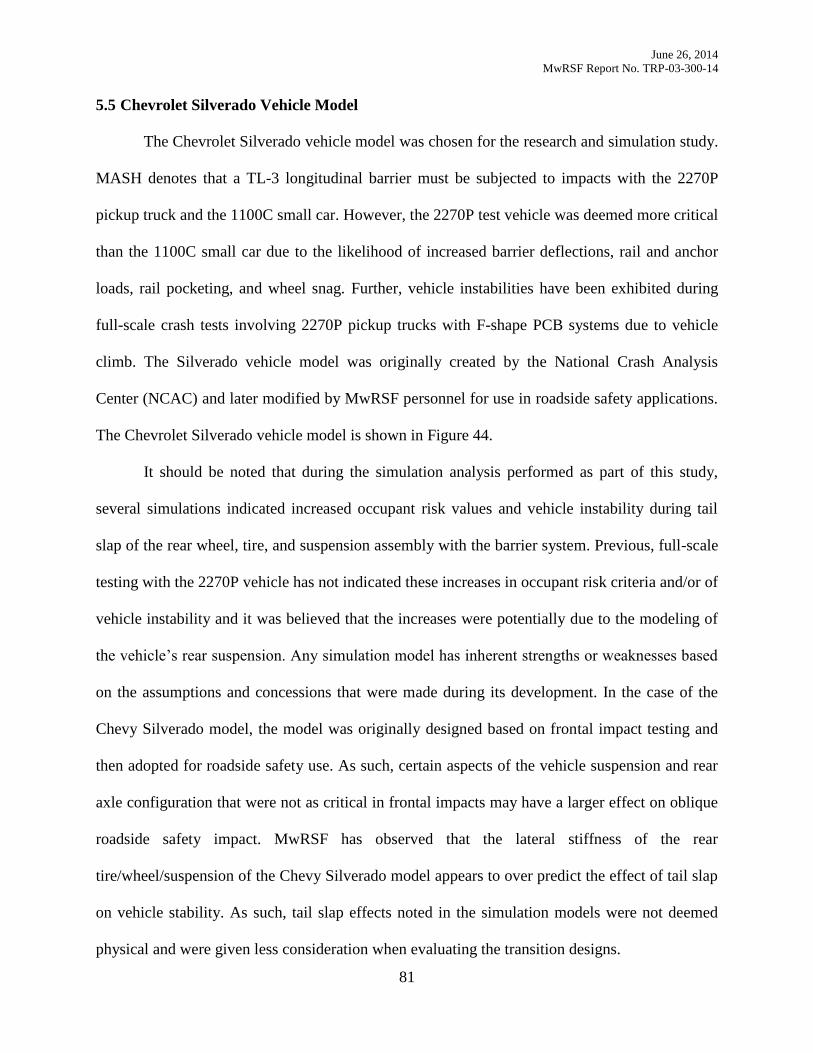
June 26, 2014
MwRSF Report No. TRP-03-300-14
81
5.5 Chevrolet Silverado Vehicle Model
The Chevrolet Silverado vehicle model was chosen for the research and simulation study.
MASH denotes that a TL-3 longitudinal barrier must be subjected to impacts with the 2270P
pickup truck and the 1100C small car. However, the 2270P test vehicle was deemed more critical
than the 1100C small car due to the likelihood of increased barrier deflections, rail and anchor
loads, rail pocketing, and wheel snag. Further, vehicle instabilities have been exhibited during
full-scale crash tests involving 2270P pickup trucks with F-shape PCB systems due to vehicle
climb. The Silverado vehicle model was originally created by the National Crash Analysis
Center (NCAC) and later modified by MwRSF personnel for use in roadside safety applications.
The Chevrolet Silverado vehicle model is shown in Figure 44.
It should be noted that during the simulation analysis performed as part of this study,
several simulations indicated increased occupant risk values and vehicle instability during tail
slap of the rear wheel, tire, and suspension assembly with the barrier system. Previous, full-scale
testing with the 2270P vehicle has not indicated these increases in occupant risk criteria and/or of
vehicle instability and it was believed that the increases were potentially due to the modeling of
the vehicle’s rear suspension. Any simulation model has inherent strengths or weaknesses based
on the assumptions and concessions that were made during its development. In the case of the
Chevy Silverado model, the model was originally designed based on frontal impact testing and
then adopted for roadside safety use. As such, certain aspects of the vehicle suspension and rear
axle configuration that were not as critical in frontal impacts may have a larger effect on oblique
roadside safety impact. MwRSF has observed that the lateral stiffness of the rear
tire/wheel/suspension of the Chevy Silverado model appears to over predict the effect of tail slap
on vehicle stability. As such, tail slap effects noted in the simulation models were not deemed
physical and were given less consideration when evaluating the transition designs.
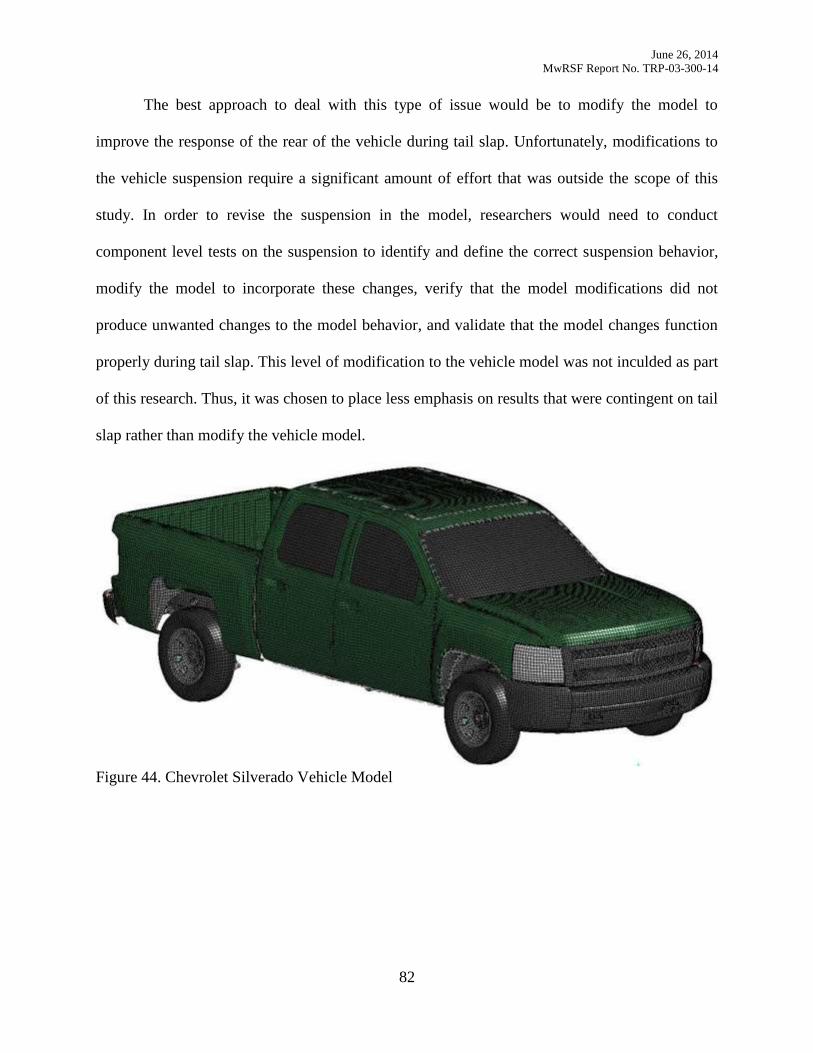
June 26, 2014
MwRSF Report No. TRP-03-300-14
82
The best approach to deal with this type of issue would be to modify the model to
improve the response of the rear of the vehicle during tail slap. Unfortunately, modifications to
the vehicle suspension require a significant amount of effort that was outside the scope of this
study. In order to revise the suspension in the model, researchers would need to conduct
component level tests on the suspension to identify and define the correct suspension behavior,
modify the model to incorporate these changes, verify that the model modifications did not
produce unwanted changes to the model behavior, and validate that the model changes function
properly during tail slap. This level of modification to the vehicle model was not inculded as part
of this research. Thus, it was chosen to place less emphasis on results that were contingent on tail
slap rather than modify the vehicle model.
Figure 44. Chevrolet Silverado Vehicle Model
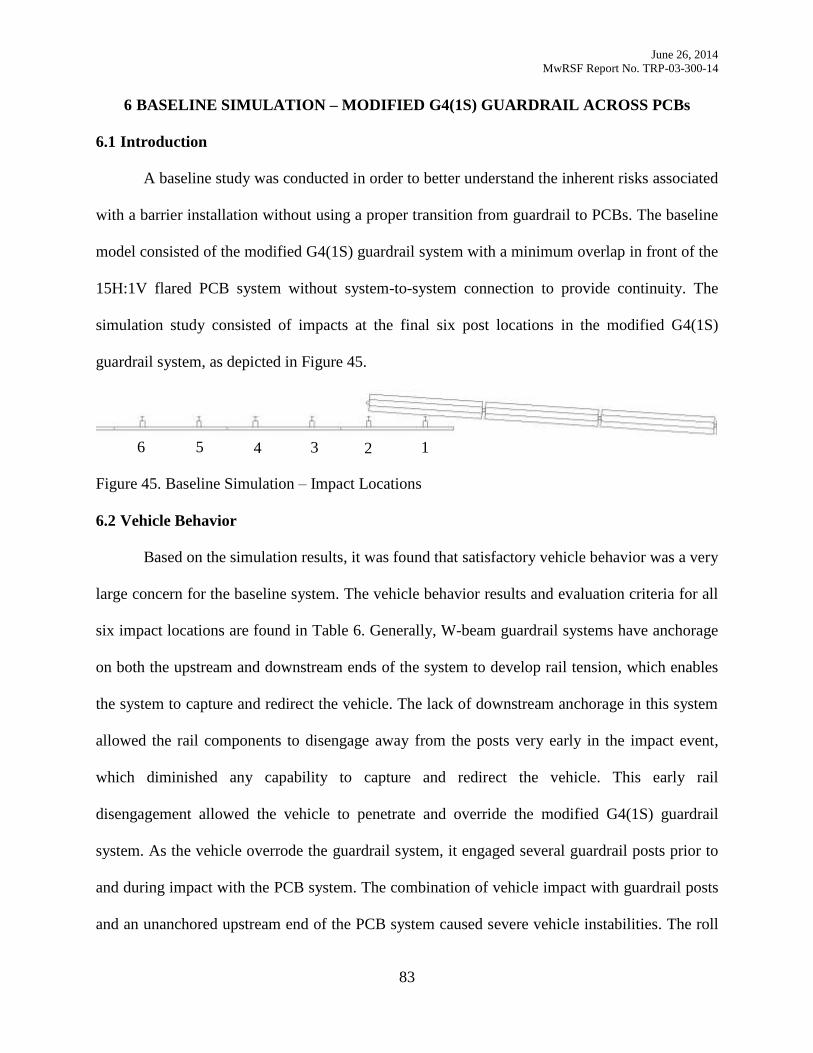
June 26, 2014
MwRSF Report No. TRP-03-300-14
83
BASELINE SIMULATION – MODIFIED G4(1S) GUARDRAIL ACROSS PCBs 6
6.1 Introduction
A baseline study was conducted in order to better understand the inherent risks associated
with a barrier installation without using a proper transition from guardrail to PCBs. The baseline
model consisted of the modified G4(1S) guardrail system with a minimum overlap in front of the
15H:1V flared PCB system without system-to-system connection to provide continuity. The
simulation study consisted of impacts at the final six post locations in the modified G4(1S)
guardrail system, as depicted in Figure 45.
Figure 45. Baseline Simulation – Impact Locations
6.2 Vehicle Behavior
Based on the simulation results, it was found that satisfactory vehicle behavior was a very
large concern for the baseline system. The vehicle behavior results and evaluation criteria for all
six impact locations are found in Table 6. Generally, W-beam guardrail systems have anchorage
on both the upstream and downstream ends of the system to develop rail tension, which enables
the system to capture and redirect the vehicle. The lack of downstream anchorage in this system
allowed the rail components to disengage away from the posts very early in the impact event,
which diminished any capability to capture and redirect the vehicle. This early rail
disengagement allowed the vehicle to penetrate and override the modified G4(1S) guardrail
system. As the vehicle overrode the guardrail system, it engaged several guardrail posts prior to
and during impact with the PCB system. The combination of vehicle impact with guardrail posts
and an unanchored upstream end of the PCB system caused severe vehicle instabilities. The roll
1 2 3 4 5 6
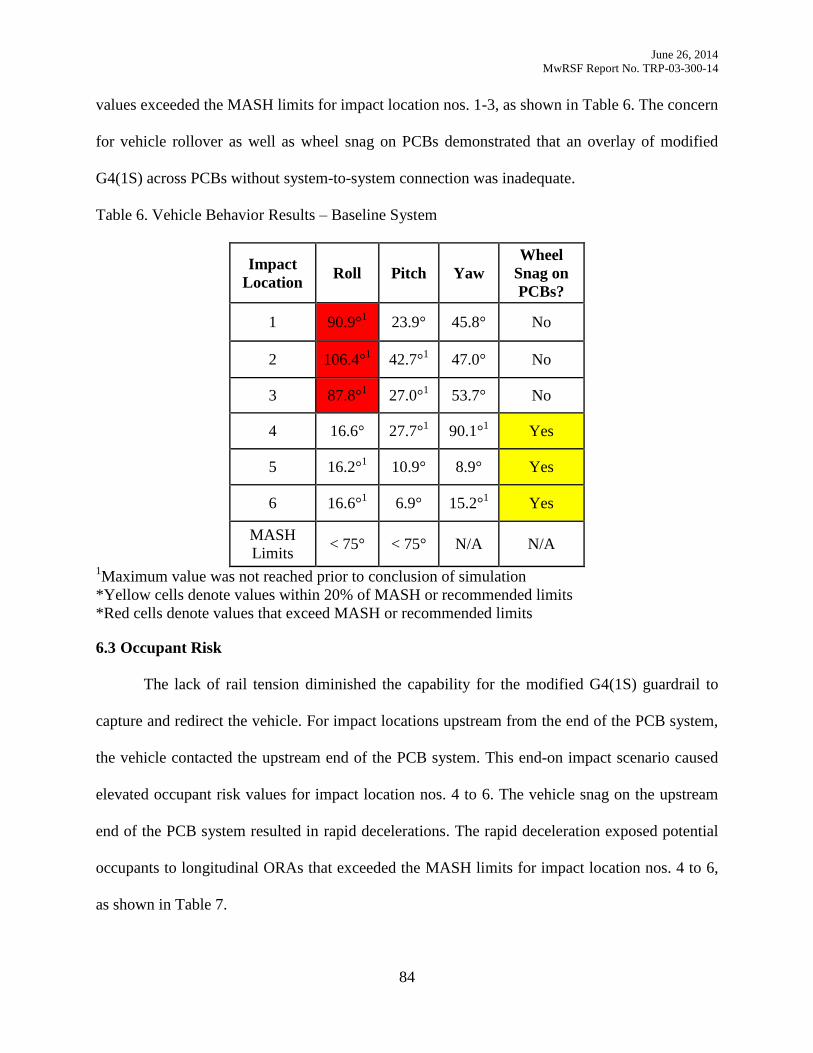
June 26, 2014
MwRSF Report No. TRP-03-300-14
84
values exceeded the MASH limits for impact location nos. 1-3, as shown in Table 6. The concern
for vehicle rollover as well as wheel snag on PCBs demonstrated that an overlay of modified
G4(1S) across PCBs without system-to-system connection was inadequate.
Table 6. Vehicle Behavior Results – Baseline System
Impact
Location Roll Pitch Yaw
Wheel
Snag on
PCBs?
1 90.9°1 23.9° 45.8° No
2 106.4°1 42.7°
1 47.0° No
3 87.8°1 27.0°
1 53.7° No
4 16.6° 27.7°1 90.1°
1 Yes
5 16.2°1 10.9° 8.9° Yes
6 16.6°1 6.9° 15.2°
1 Yes
MASH
Limits < 75° < 75° N/A N/A
1Maximum value was not reached prior to conclusion of simulation
*Yellow cells denote values within 20% of MASH or recommended limits
*Red cells denote values that exceed MASH or recommended limits
6.3 Occupant Risk
The lack of rail tension diminished the capability for the modified G4(1S) guardrail to
capture and redirect the vehicle. For impact locations upstream from the end of the PCB system,
the vehicle contacted the upstream end of the PCB system. This end-on impact scenario caused
elevated occupant risk values for impact location nos. 4 to 6. The vehicle snag on the upstream
end of the PCB system resulted in rapid decelerations. The rapid deceleration exposed potential
occupants to longitudinal ORAs that exceeded the MASH limits for impact location nos. 4 to 6,
as shown in Table 7.
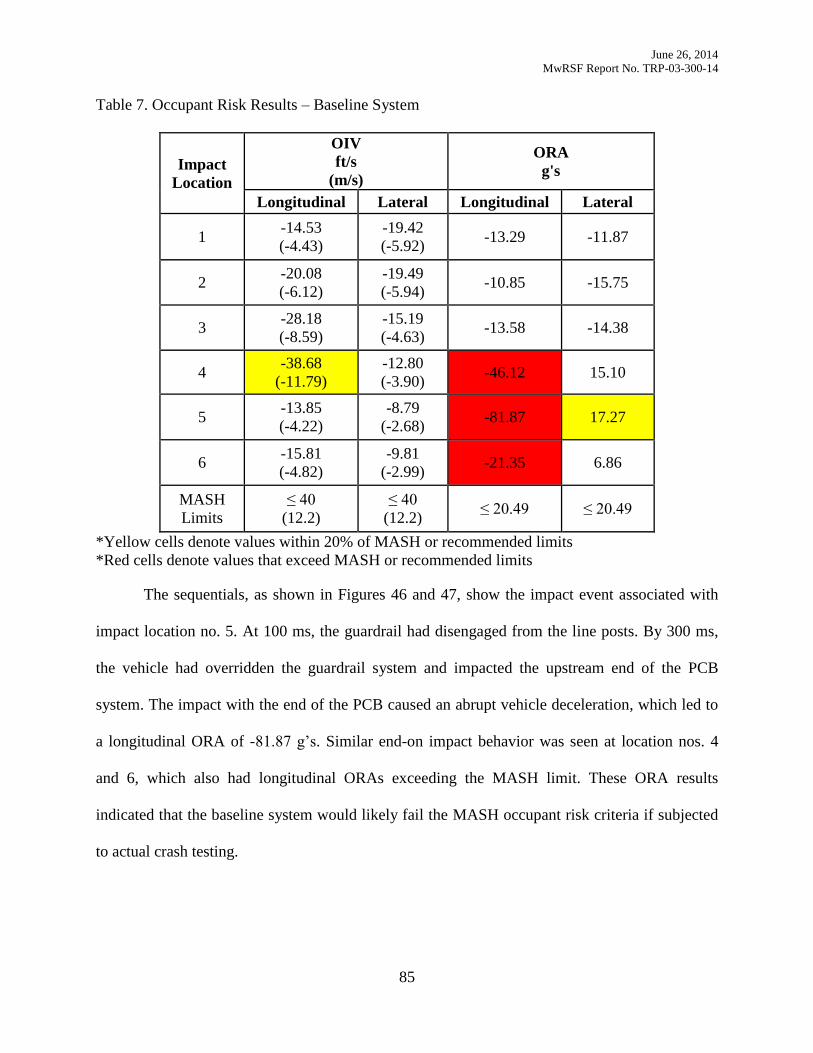
June 26, 2014
MwRSF Report No. TRP-03-300-14
85
Table 7. Occupant Risk Results – Baseline System
Impact
Location
OIV
ft/s
(m/s)
ORA
g's
Longitudinal Lateral Longitudinal Lateral
1 -14.53
(-4.43)
-19.42
(-5.92) -13.29 -11.87
2 -20.08
(-6.12)
-19.49
(-5.94) -10.85 -15.75
3 -28.18
(-8.59)
-15.19
(-4.63) -13.58 -14.38
4 -38.68
(-11.79)
-12.80
(-3.90) -46.12 15.10
5 -13.85
(-4.22)
-8.79
(-2.68) -81.87 17.27
6 -15.81
(-4.82)
-9.81
(-2.99) -21.35 6.86
MASH
Limits
≤ 40
(12.2)
≤ 40
(12.2) ≤ 20.49 ≤ 20.49
*Yellow cells denote values within 20% of MASH or recommended limits
*Red cells denote values that exceed MASH or recommended limits
The sequentials, as shown in Figures 46 and 47, show the impact event associated with
impact location no. 5. At 100 ms, the guardrail had disengaged from the line posts. By 300 ms,
the vehicle had overridden the guardrail system and impacted the upstream end of the PCB
system. The impact with the end of the PCB caused an abrupt vehicle deceleration, which led to
a longitudinal ORA of -81.87 g’s. Similar end-on impact behavior was seen at location nos. 4
and 6, which also had longitudinal ORAs exceeding the MASH limit. These ORA results
indicated that the baseline system would likely fail the MASH occupant risk criteria if subjected
to actual crash testing.
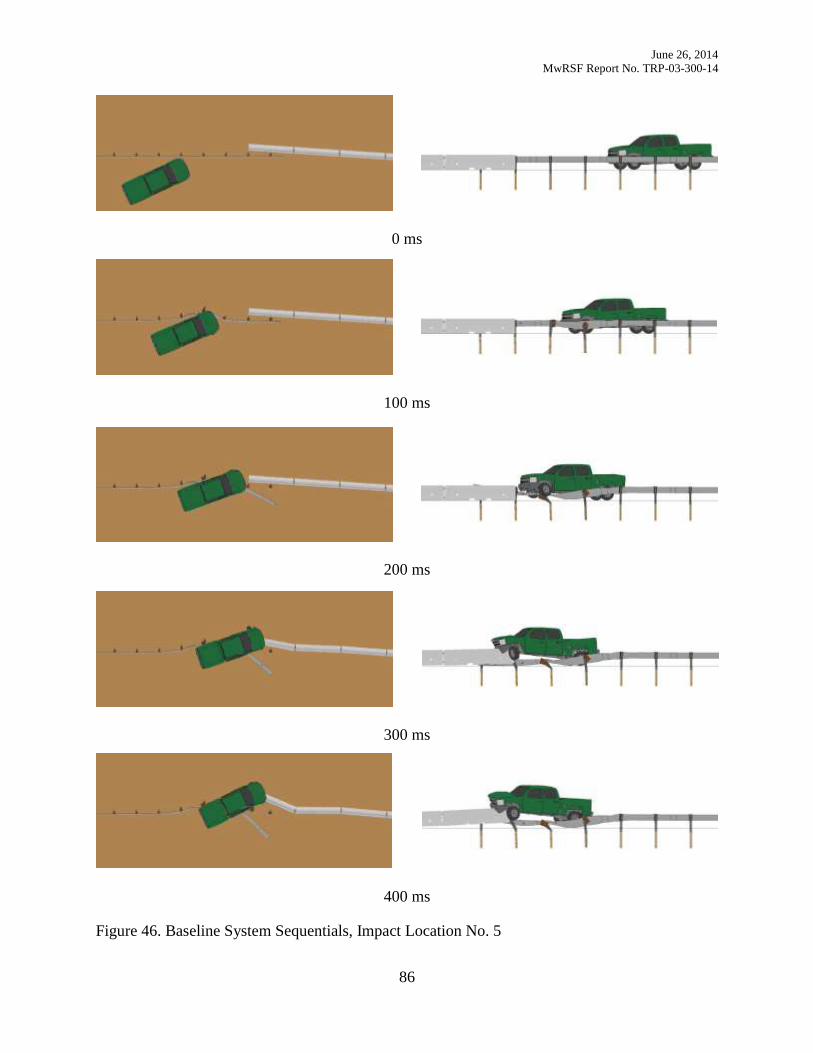
June 26, 2014
MwRSF Report No. TRP-03-300-14
86
0 ms
100 ms
200 ms
300 ms
400 ms
Figure 46. Baseline System Sequentials, Impact Location No. 5
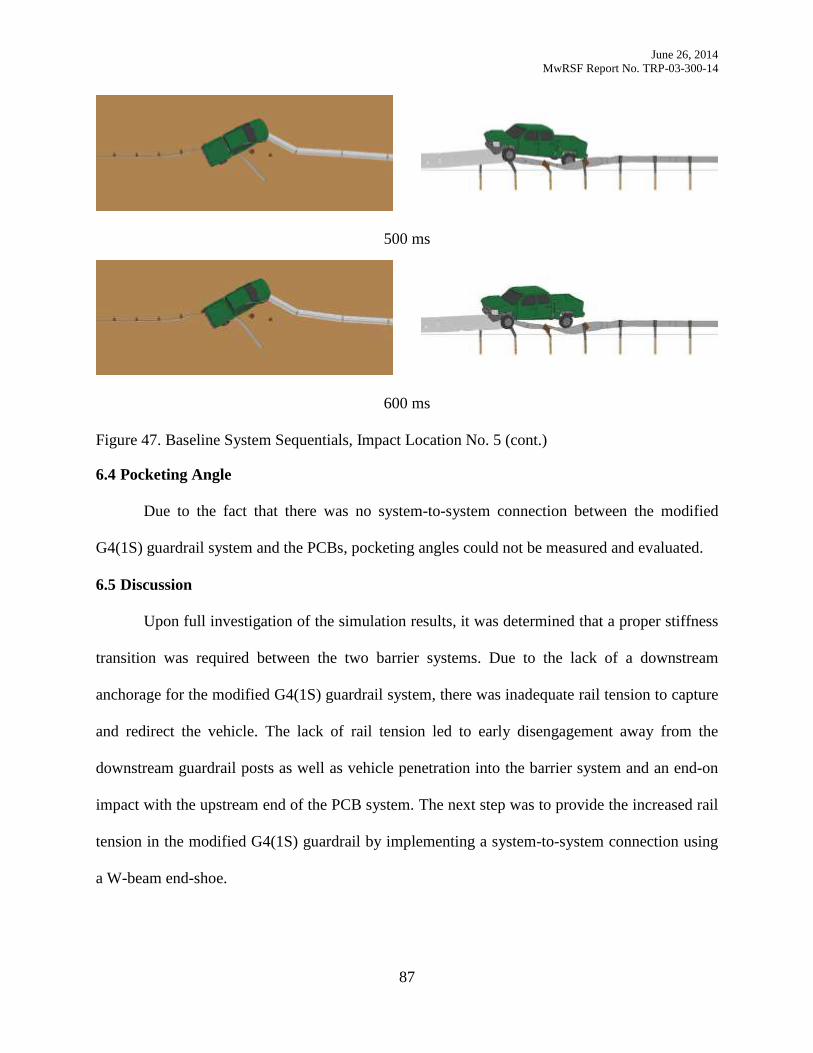
June 26, 2014
MwRSF Report No. TRP-03-300-14
87
500 ms
600 ms
Figure 47. Baseline System Sequentials, Impact Location No. 5 (cont.)
6.4 Pocketing Angle
Due to the fact that there was no system-to-system connection between the modified
G4(1S) guardrail system and the PCBs, pocketing angles could not be measured and evaluated.
6.5 Discussion
Upon full investigation of the simulation results, it was determined that a proper stiffness
transition was required between the two barrier systems. Due to the lack of a downstream
anchorage for the modified G4(1S) guardrail system, there was inadequate rail tension to capture
and redirect the vehicle. The lack of rail tension led to early disengagement away from the
downstream guardrail posts as well as vehicle penetration into the barrier system and an end-on
impact with the upstream end of the PCB system. The next step was to provide the increased rail
tension in the modified G4(1S) guardrail by implementing a system-to-system connection using
a W-beam end-shoe.
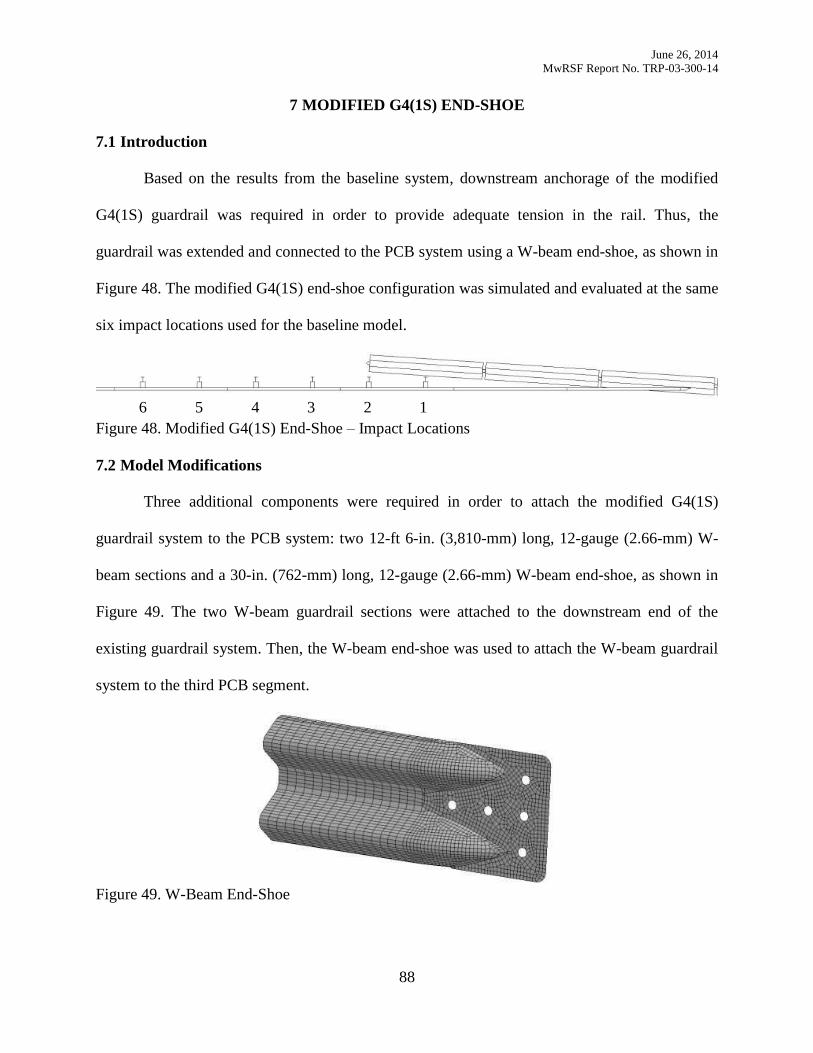
June 26, 2014
MwRSF Report No. TRP-03-300-14
88
MODIFIED G4(1S) END-SHOE 7
7.1 Introduction
Based on the results from the baseline system, downstream anchorage of the modified
G4(1S) guardrail was required in order to provide adequate tension in the rail. Thus, the
guardrail was extended and connected to the PCB system using a W-beam end-shoe, as shown in
Figure 48. The modified G4(1S) end-shoe configuration was simulated and evaluated at the same
six impact locations used for the baseline model.
Figure 48. Modified G4(1S) End-Shoe – Impact Locations
7.2 Model Modifications
Three additional components were required in order to attach the modified G4(1S)
guardrail system to the PCB system: two 12-ft 6-in. (3,810-mm) long, 12-gauge (2.66-mm) W-
beam sections and a 30-in. (762-mm) long, 12-gauge (2.66-mm) W-beam end-shoe, as shown in
Figure 49. The two W-beam guardrail sections were attached to the downstream end of the
existing guardrail system. Then, the W-beam end-shoe was used to attach the W-beam guardrail
system to the third PCB segment.
Figure 49. W-Beam End-Shoe
1 2 3 4 5 6
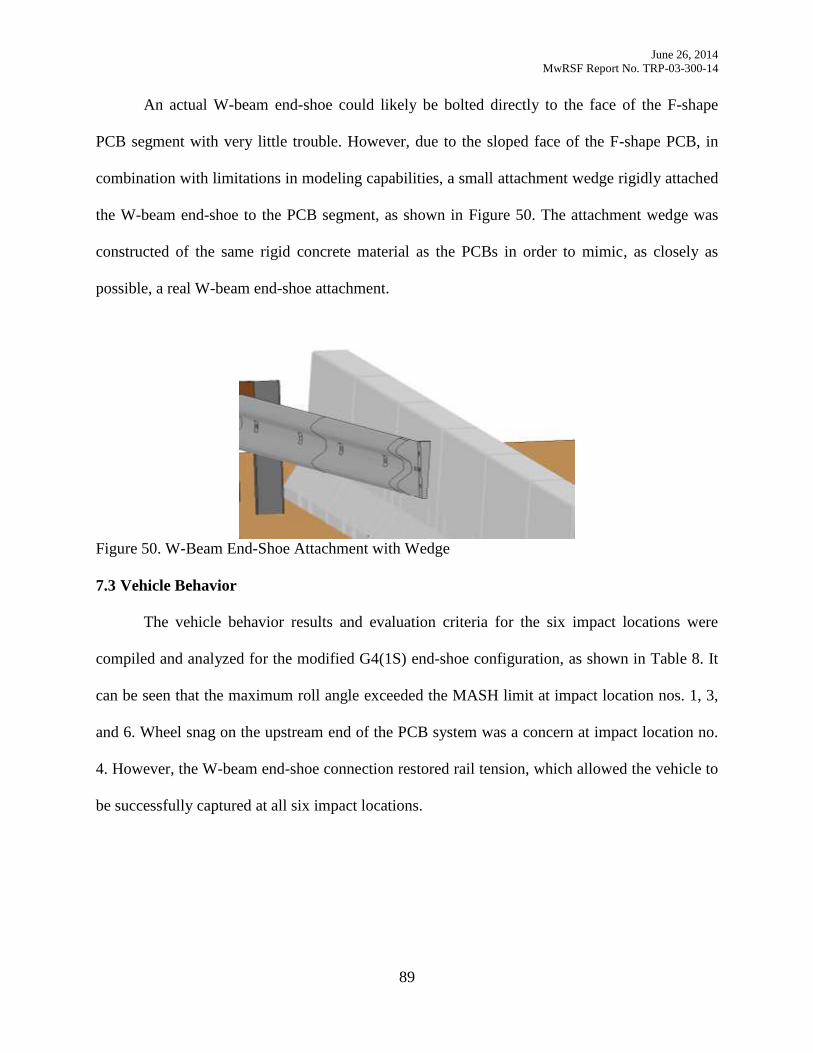
June 26, 2014
MwRSF Report No. TRP-03-300-14
89
An actual W-beam end-shoe could likely be bolted directly to the face of the F-shape
PCB segment with very little trouble. However, due to the sloped face of the F-shape PCB, in
combination with limitations in modeling capabilities, a small attachment wedge rigidly attached
the W-beam end-shoe to the PCB segment, as shown in Figure 50. The attachment wedge was
constructed of the same rigid concrete material as the PCBs in order to mimic, as closely as
possible, a real W-beam end-shoe attachment.
Figure 50. W-Beam End-Shoe Attachment with Wedge
7.3 Vehicle Behavior
The vehicle behavior results and evaluation criteria for the six impact locations were
compiled and analyzed for the modified G4(1S) end-shoe configuration, as shown in Table 8. It
can be seen that the maximum roll angle exceeded the MASH limit at impact location nos. 1, 3,
and 6. Wheel snag on the upstream end of the PCB system was a concern at impact location no.
4. However, the W-beam end-shoe connection restored rail tension, which allowed the vehicle to
be successfully captured at all six impact locations.
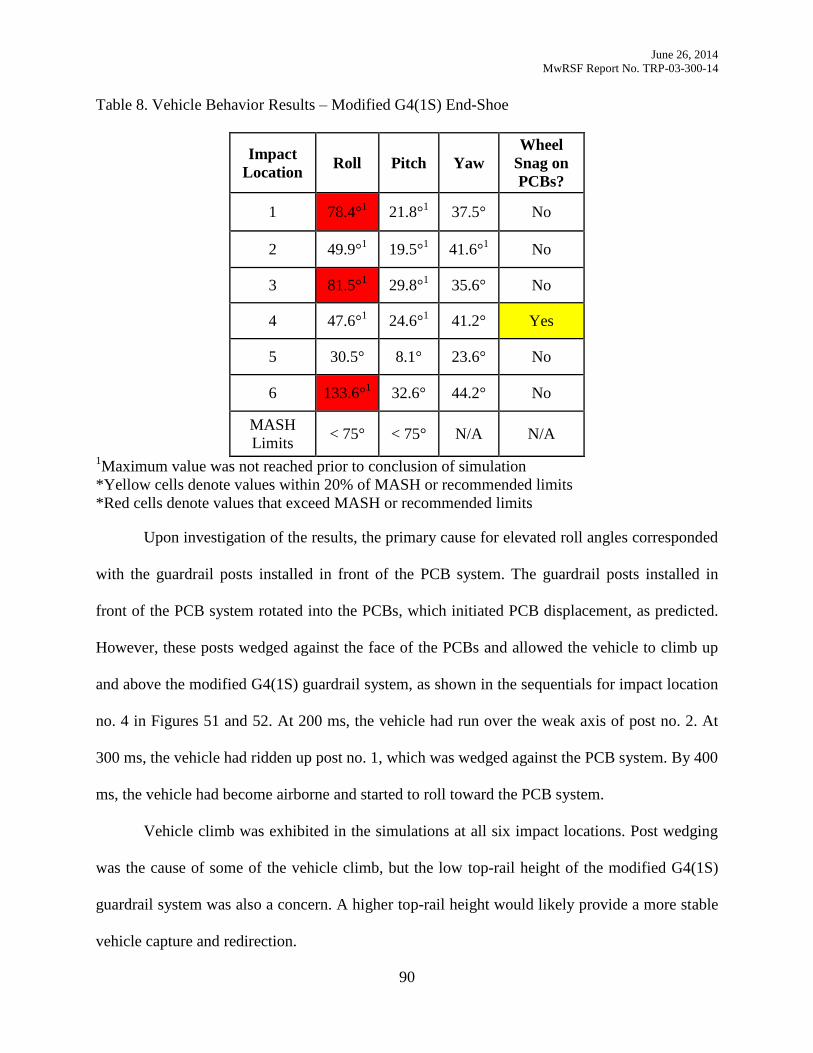
June 26, 2014
MwRSF Report No. TRP-03-300-14
90
Table 8. Vehicle Behavior Results – Modified G4(1S) End-Shoe
Impact
Location Roll Pitch Yaw
Wheel
Snag on
PCBs?
1 78.4°1 21.8°
1 37.5° No
2 49.9°1 19.5°
1 41.6°
1 No
3 81.5°1 29.8°
1 35.6° No
4 47.6°1
24.6°1 41.2° Yes
5 30.5° 8.1° 23.6° No
6 133.6°1 32.6° 44.2° No
MASH
Limits < 75° < 75° N/A N/A
1Maximum value was not reached prior to conclusion of simulation
*Yellow cells denote values within 20% of MASH or recommended limits
*Red cells denote values that exceed MASH or recommended limits
Upon investigation of the results, the primary cause for elevated roll angles corresponded
with the guardrail posts installed in front of the PCB system. The guardrail posts installed in
front of the PCB system rotated into the PCBs, which initiated PCB displacement, as predicted.
However, these posts wedged against the face of the PCBs and allowed the vehicle to climb up
and above the modified G4(1S) guardrail system, as shown in the sequentials for impact location
no. 4 in Figures 51 and 52. At 200 ms, the vehicle had run over the weak axis of post no. 2. At
300 ms, the vehicle had ridden up post no. 1, which was wedged against the PCB system. By 400
ms, the vehicle had become airborne and started to roll toward the PCB system.
Vehicle climb was exhibited in the simulations at all six impact locations. Post wedging
was the cause of some of the vehicle climb, but the low top-rail height of the modified G4(1S)
guardrail system was also a concern. A higher top-rail height would likely provide a more stable
vehicle capture and redirection.
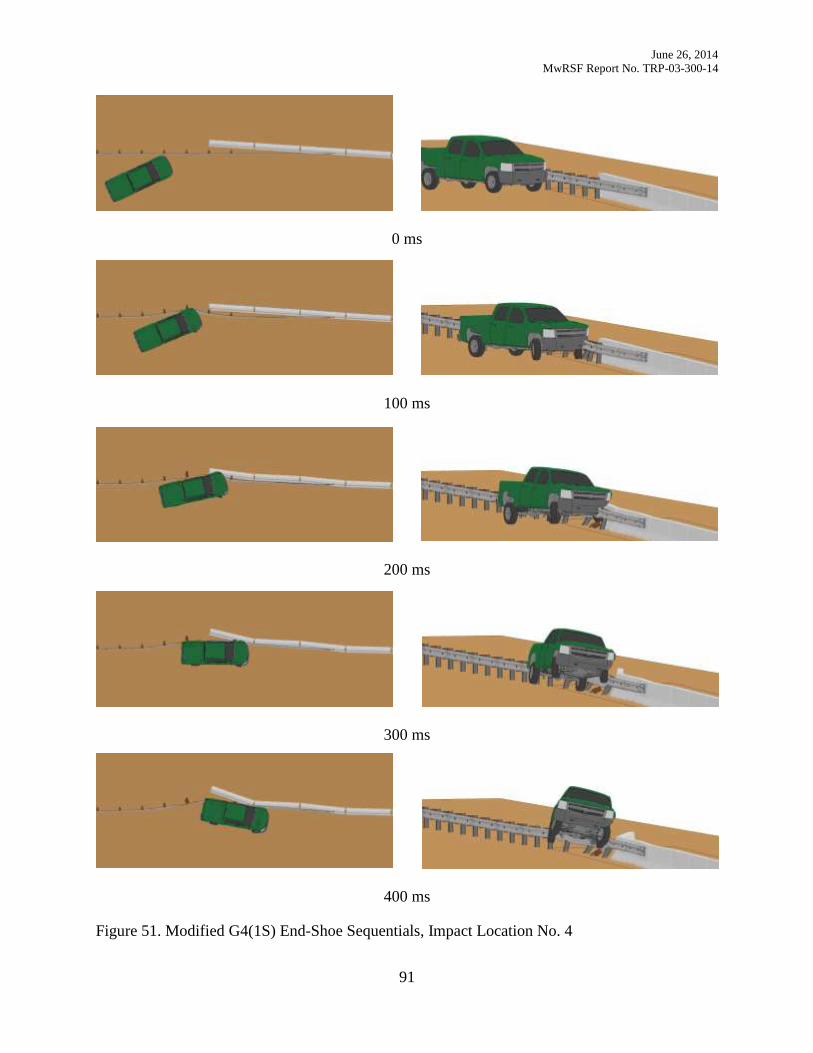
June 26, 2014
MwRSF Report No. TRP-03-300-14
91
0 ms
100 ms
200 ms
300 ms
400 ms
Figure 51. Modified G4(1S) End-Shoe Sequentials, Impact Location No. 4
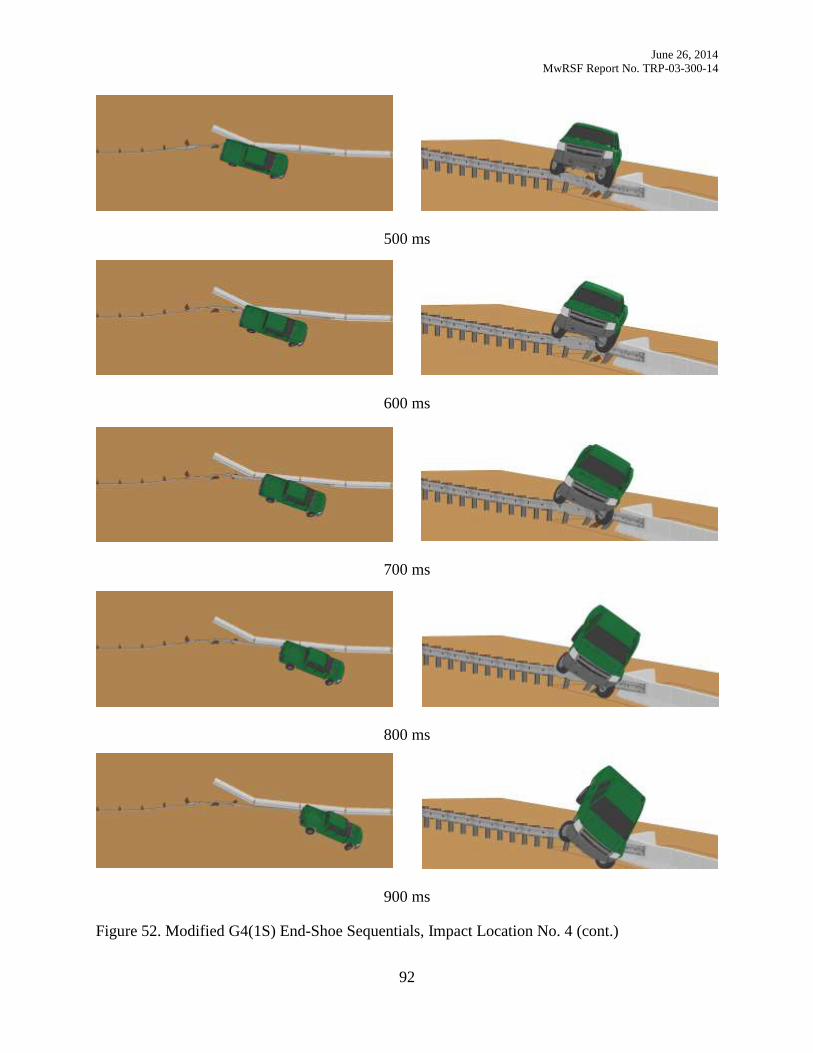
June 26, 2014
MwRSF Report No. TRP-03-300-14
92
500 ms
600 ms
700 ms
800 ms
900 ms
Figure 52. Modified G4(1S) End-Shoe Sequentials, Impact Location No. 4 (cont.)
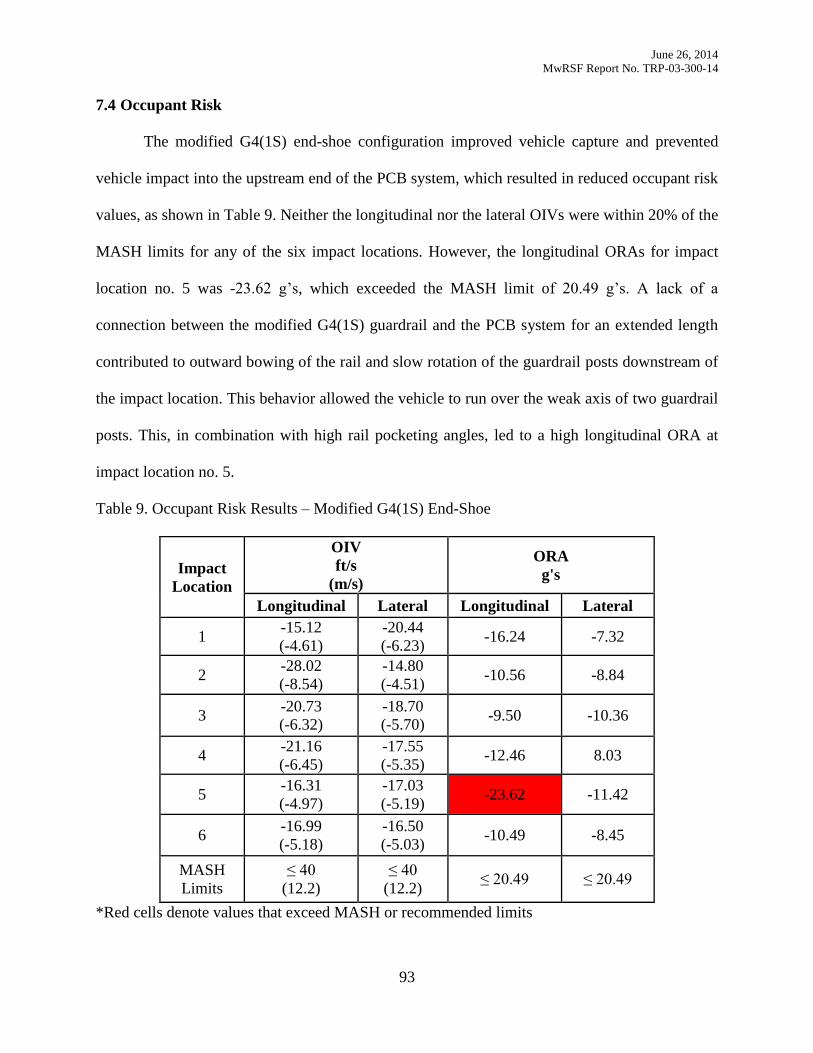
June 26, 2014
MwRSF Report No. TRP-03-300-14
93
7.4 Occupant Risk
The modified G4(1S) end-shoe configuration improved vehicle capture and prevented
vehicle impact into the upstream end of the PCB system, which resulted in reduced occupant risk
values, as shown in Table 9. Neither the longitudinal nor the lateral OIVs were within 20% of the
MASH limits for any of the six impact locations. However, the longitudinal ORAs for impact
location no. 5 was -23.62 g’s, which exceeded the MASH limit of 20.49 g’s. A lack of a
connection between the modified G4(1S) guardrail and the PCB system for an extended length
contributed to outward bowing of the rail and slow rotation of the guardrail posts downstream of
the impact location. This behavior allowed the vehicle to run over the weak axis of two guardrail
posts. This, in combination with high rail pocketing angles, led to a high longitudinal ORA at
impact location no. 5.
Table 9. Occupant Risk Results – Modified G4(1S) End-Shoe
Impact
Location
OIV
ft/s
(m/s)
ORA
g's
Longitudinal Lateral Longitudinal Lateral
1 -15.12
(-4.61)
-20.44
(-6.23) -16.24 -7.32
2 -28.02
(-8.54)
-14.80
(-4.51) -10.56 -8.84
3 -20.73
(-6.32)
-18.70
(-5.70) -9.50 -10.36
4 -21.16
(-6.45)
-17.55
(-5.35) -12.46 8.03
5 -16.31
(-4.97)
-17.03
(-5.19) -23.62 -11.42
6 -16.99
(-5.18)
-16.50
(-5.03) -10.49 -8.45
MASH
Limits
≤ 40
(12.2)
≤ 40
(12.2) ≤ 20.49 ≤ 20.49
*Red cells denote values that exceed MASH or recommended limits
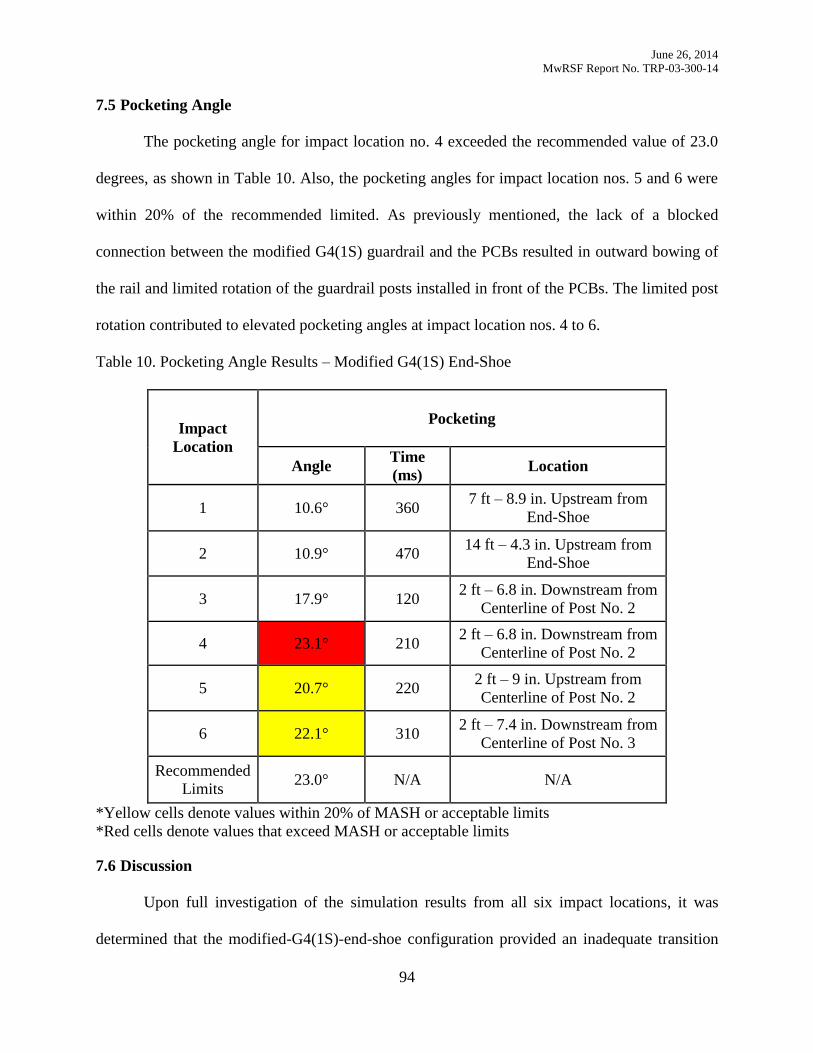
June 26, 2014
MwRSF Report No. TRP-03-300-14
94
7.5 Pocketing Angle
The pocketing angle for impact location no. 4 exceeded the recommended value of 23.0
degrees, as shown in Table 10. Also, the pocketing angles for impact location nos. 5 and 6 were
within 20% of the recommended limited. As previously mentioned, the lack of a blocked
connection between the modified G4(1S) guardrail and the PCBs resulted in outward bowing of
the rail and limited rotation of the guardrail posts installed in front of the PCBs. The limited post
rotation contributed to elevated pocketing angles at impact location nos. 4 to 6.
Table 10. Pocketing Angle Results – Modified G4(1S) End-Shoe
Impact
Location
Pocketing
Angle Time
(ms) Location
1 10.6° 360 7 ft – 8.9 in. Upstream from
End-Shoe
2 10.9° 470 14 ft – 4.3 in. Upstream from
End-Shoe
3 17.9° 120 2 ft – 6.8 in. Downstream from
Centerline of Post No. 2
4 23.1° 210 2 ft – 6.8 in. Downstream from
Centerline of Post No. 2
5 20.7° 220 2 ft – 9 in. Upstream from
Centerline of Post No. 2
6 22.1° 310 2 ft – 7.4 in. Downstream from
Centerline of Post No. 3
Recommended
Limits 23.0° N/A N/A
*Yellow cells denote values within 20% of MASH or acceptable limits
*Red cells denote values that exceed MASH or acceptable limits
7.6 Discussion
Upon full investigation of the simulation results from all six impact locations, it was
determined that the modified-G4(1S)-end-shoe configuration provided an inadequate transition
June 26, 2014
MwRSF Report No. TRP-03-300-14
95
system. Wedging of posts against the PCBs increased the propensity for vehicle climb and
generated vehicle instability. Also, vehicle climb concerns were attributed to the low top
mounting height of the W-beam guardrail and less effective vehicle capture of the modified
G4(1S) guardrail. Pocketing was also observed at impact location nos. 4 to 6 due to limited post
rotation caused by outward bowing of the rail. Due to concerns for vehicle climb, inadequate
guardrail height, and pocketing, researchers determined that the modified-G4(1S)-end-shoe
configuration had a low likelihood of successfully meeting the TL-3 MASH full-scale crash
testing criteria. In order to mitigate these problems, researchers decided to utilize and investigate
the stiffer and taller thrie beam rail section.
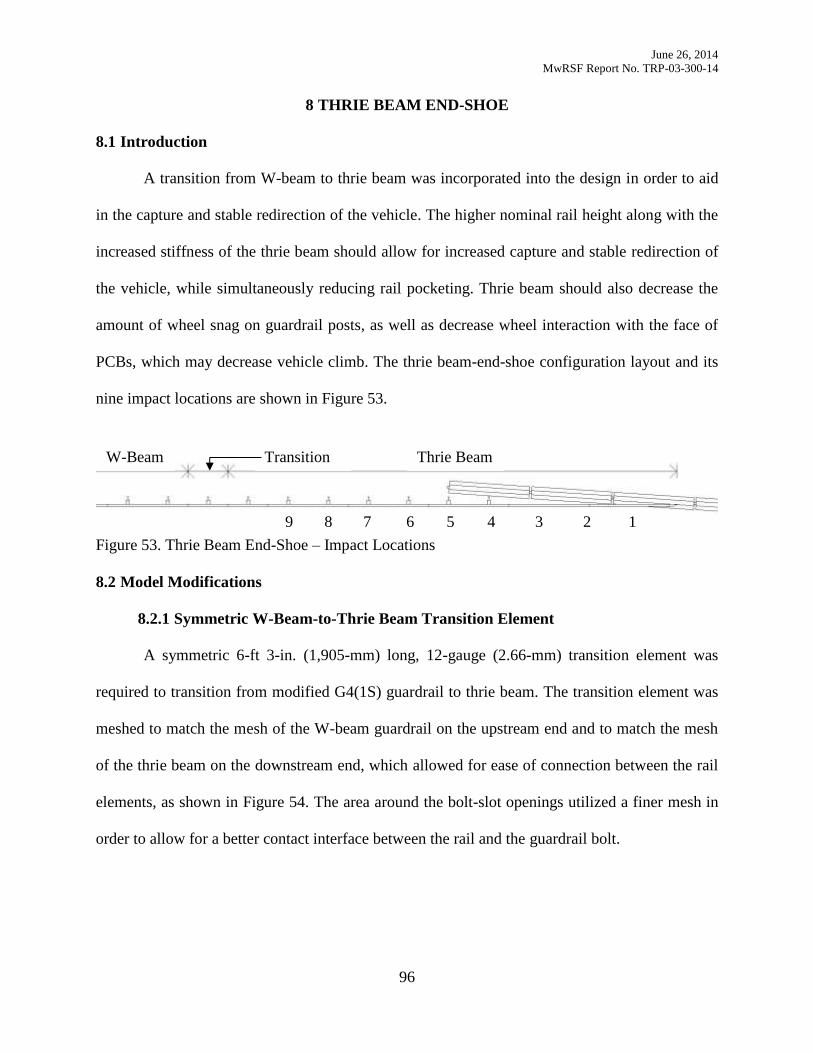
June 26, 2014
MwRSF Report No. TRP-03-300-14
96
THRIE BEAM END-SHOE 8
8.1 Introduction
A transition from W-beam to thrie beam was incorporated into the design in order to aid
in the capture and stable redirection of the vehicle. The higher nominal rail height along with the
increased stiffness of the thrie beam should allow for increased capture and stable redirection of
the vehicle, while simultaneously reducing rail pocketing. Thrie beam should also decrease the
amount of wheel snag on guardrail posts, as well as decrease wheel interaction with the face of
PCBs, which may decrease vehicle climb. The thrie beam-end-shoe configuration layout and its
nine impact locations are shown in Figure 53.
Figure 53. Thrie Beam End-Shoe – Impact Locations
8.2 Model Modifications
8.2.1 Symmetric W-Beam-to-Thrie Beam Transition Element
A symmetric 6-ft 3-in. (1,905-mm) long, 12-gauge (2.66-mm) transition element was
required to transition from modified G4(1S) guardrail to thrie beam. The transition element was
meshed to match the mesh of the W-beam guardrail on the upstream end and to match the mesh
of the thrie beam on the downstream end, which allowed for ease of connection between the rail
elements, as shown in Figure 54. The area around the bolt-slot openings utilized a finer mesh in
order to allow for a better contact interface between the rail and the guardrail bolt.
1 2 3 4 5 7 6 8 9
Thrie Beam Transition W-Beam
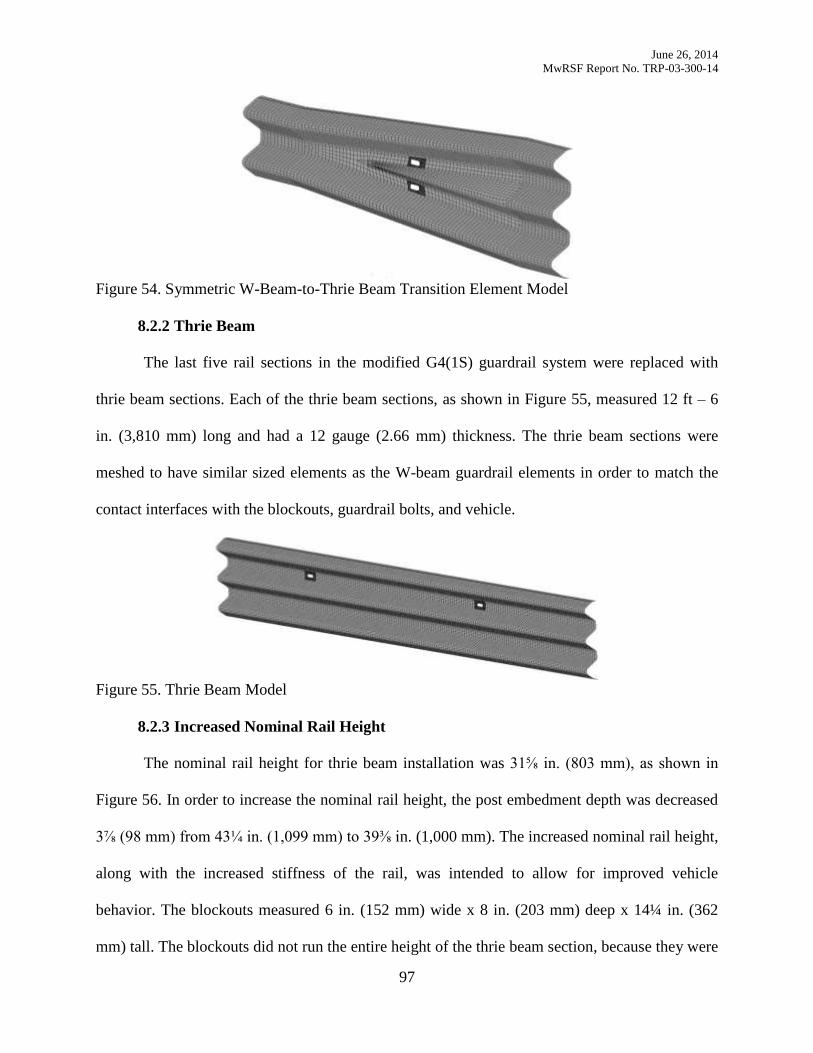
June 26, 2014
MwRSF Report No. TRP-03-300-14
97
Figure 54. Symmetric W-Beam-to-Thrie Beam Transition Element Model
8.2.2 Thrie Beam
The last five rail sections in the modified G4(1S) guardrail system were replaced with
thrie beam sections. Each of the thrie beam sections, as shown in Figure 55, measured 12 ft – 6
in. (3,810 mm) long and had a 12 gauge (2.66 mm) thickness. The thrie beam sections were
meshed to have similar sized elements as the W-beam guardrail elements in order to match the
contact interfaces with the blockouts, guardrail bolts, and vehicle.
Figure 55. Thrie Beam Model
8.2.3 Increased Nominal Rail Height
The nominal rail height for thrie beam installation was 31⅝ in. (803 mm), as shown in
Figure 56. In order to increase the nominal rail height, the post embedment depth was decreased
3⅞ (98 mm) from 43¼ in. (1,099 mm) to 39⅜ in. (1,000 mm). The increased nominal rail height,
along with the increased stiffness of the rail, was intended to allow for improved vehicle
behavior. The blockouts measured 6 in. (152 mm) wide x 8 in. (203 mm) deep x 14¼ in. (362
mm) tall. The blockouts did not run the entire height of the thrie beam section, because they were
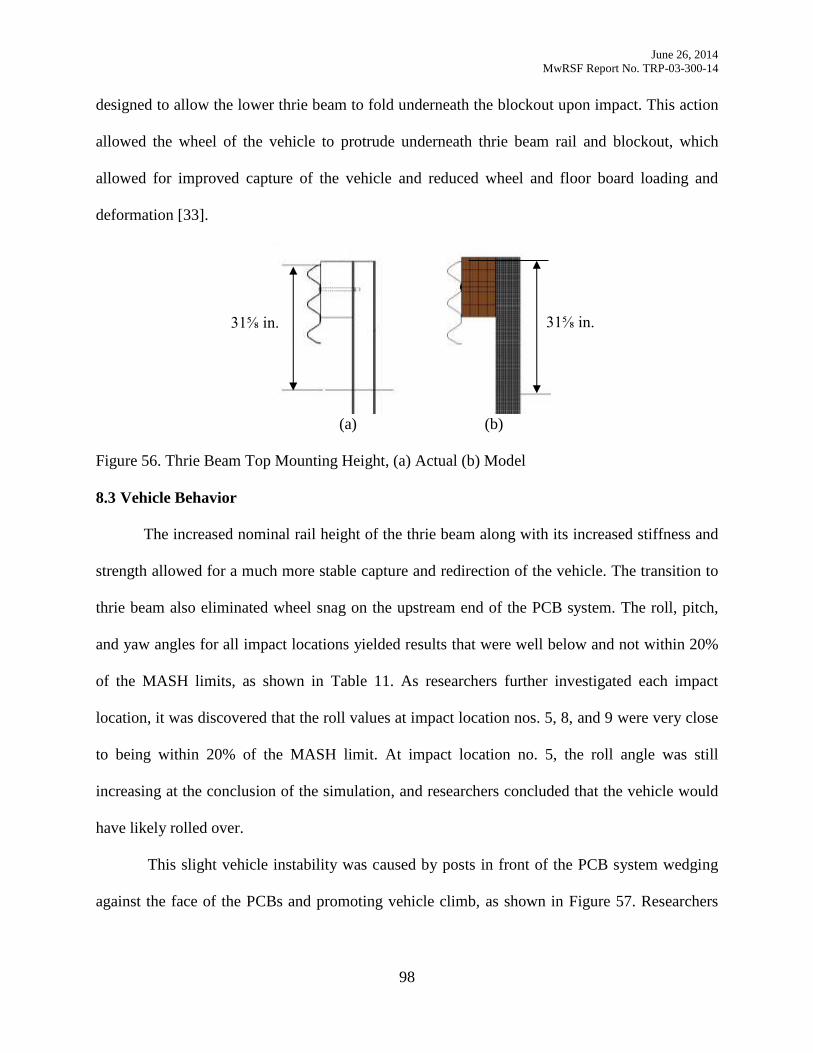
June 26, 2014
MwRSF Report No. TRP-03-300-14
98
designed to allow the lower thrie beam to fold underneath the blockout upon impact. This action
allowed the wheel of the vehicle to protrude underneath thrie beam rail and blockout, which
allowed for improved capture of the vehicle and reduced wheel and floor board loading and
deformation [33].
(a) (b)
Figure 56. Thrie Beam Top Mounting Height, (a) Actual (b) Model
8.3 Vehicle Behavior
The increased nominal rail height of the thrie beam along with its increased stiffness and
strength allowed for a much more stable capture and redirection of the vehicle. The transition to
thrie beam also eliminated wheel snag on the upstream end of the PCB system. The roll, pitch,
and yaw angles for all impact locations yielded results that were well below and not within 20%
of the MASH limits, as shown in Table 11. As researchers further investigated each impact
location, it was discovered that the roll values at impact location nos. 5, 8, and 9 were very close
to being within 20% of the MASH limit. At impact location no. 5, the roll angle was still
increasing at the conclusion of the simulation, and researchers concluded that the vehicle would
have likely rolled over.
This slight vehicle instability was caused by posts in front of the PCB system wedging
against the face of the PCBs and promoting vehicle climb, as shown in Figure 57. Researchers
31⅝ in. 31⅝ in.
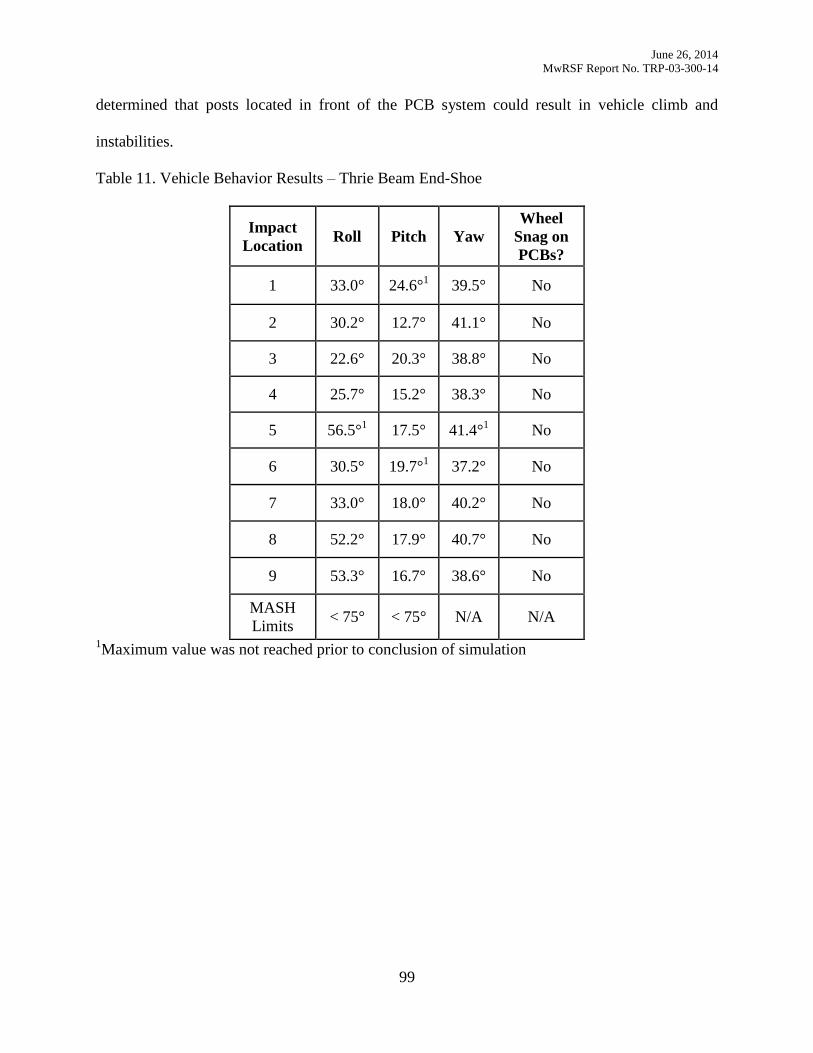
June 26, 2014
MwRSF Report No. TRP-03-300-14
99
determined that posts located in front of the PCB system could result in vehicle climb and
instabilities.
Table 11. Vehicle Behavior Results – Thrie Beam End-Shoe
Impact
Location Roll Pitch Yaw
Wheel
Snag on
PCBs?
1 33.0° 24.6°1
39.5° No
2 30.2° 12.7° 41.1°
No
3 22.6° 20.3° 38.8° No
4 25.7°
15.2° 38.3° No
5 56.5°1
17.5° 41.4°1
No
6 30.5° 19.7°1
37.2° No
7 33.0° 18.0° 40.2° No
8 52.2° 17.9° 40.7° No
9 53.3° 16.7° 38.6° No
MASH
Limits < 75° < 75° N/A N/A
1Maximum value was not reached prior to conclusion of simulation
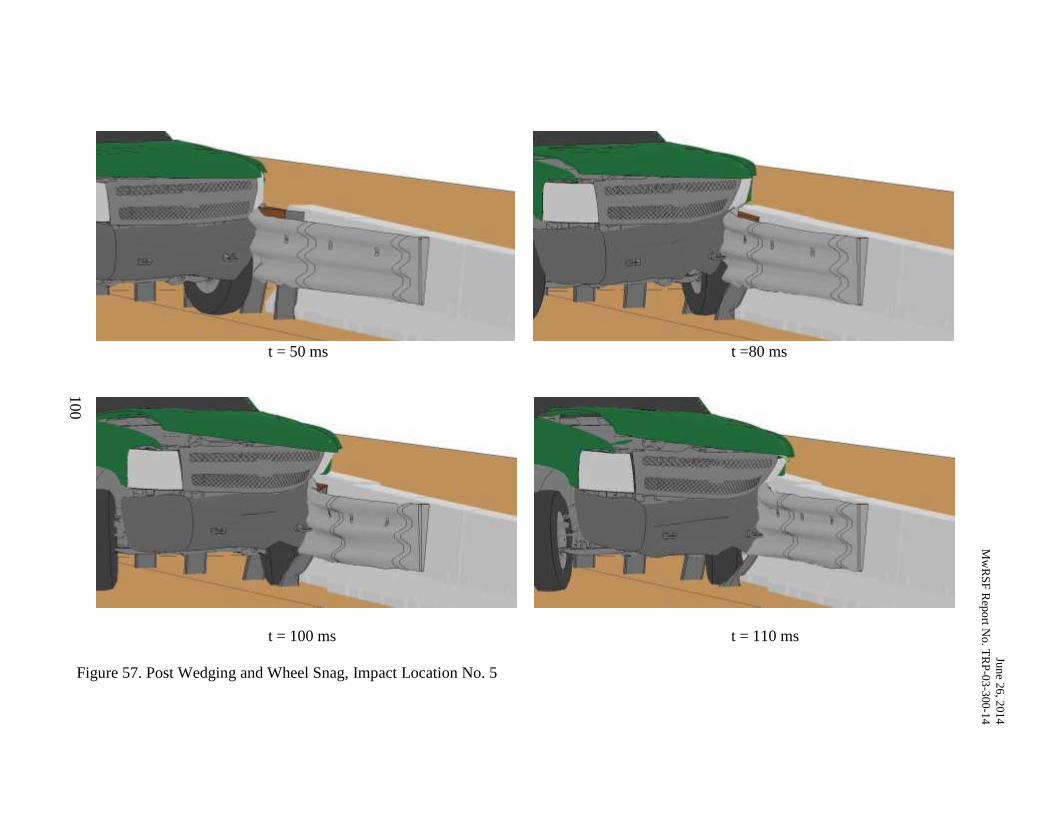
Jun
e 26
, 201
4
Mw
RS
F R
epo
rt No. T
RP
-03
-300-1
4
100
t = 50 ms t =80 ms
t = 100 ms t = 110 ms
Figure 57. Post Wedging and Wheel Snag, Impact Location No. 5
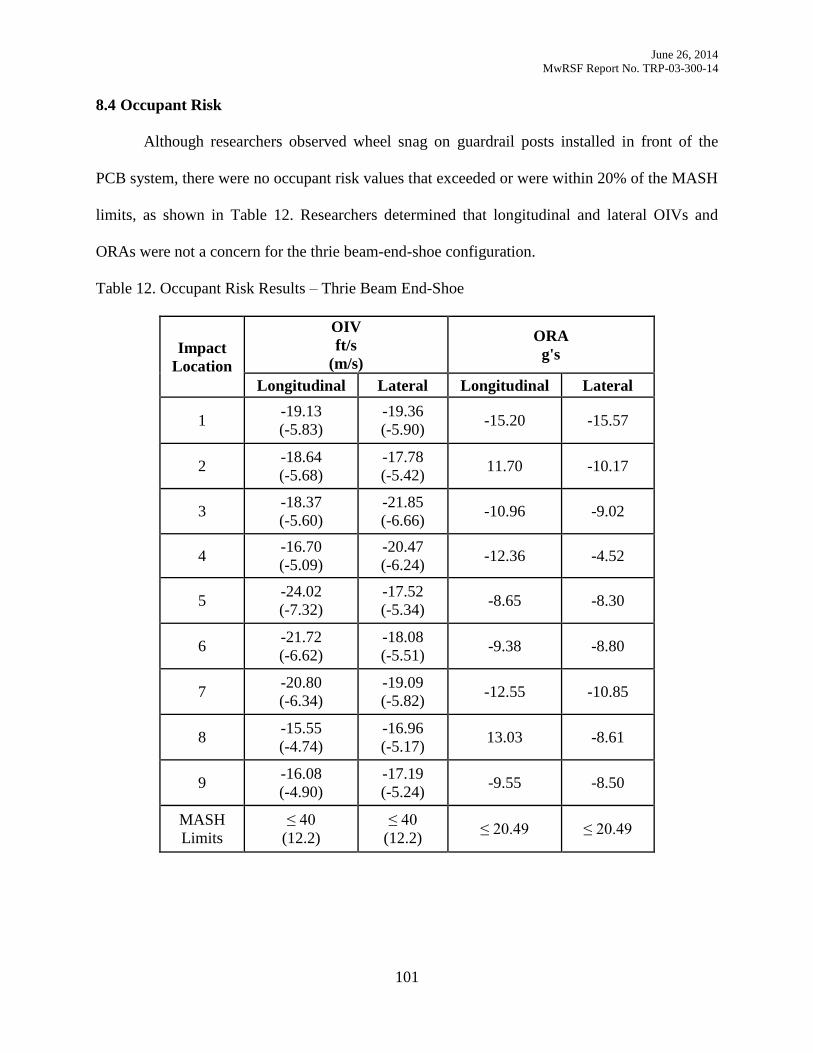
June 26, 2014
MwRSF Report No. TRP-03-300-14
101
8.4 Occupant Risk
Although researchers observed wheel snag on guardrail posts installed in front of the
PCB system, there were no occupant risk values that exceeded or were within 20% of the MASH
limits, as shown in Table 12. Researchers determined that longitudinal and lateral OIVs and
ORAs were not a concern for the thrie beam-end-shoe configuration.
Table 12. Occupant Risk Results – Thrie Beam End-Shoe
Impact
Location
OIV
ft/s
(m/s)
ORA
g's
Longitudinal Lateral Longitudinal Lateral
1 -19.13
(-5.83)
-19.36
(-5.90) -15.20 -15.57
2 -18.64
(-5.68)
-17.78
(-5.42) 11.70 -10.17
3 -18.37
(-5.60)
-21.85
(-6.66) -10.96 -9.02
4 -16.70
(-5.09)
-20.47
(-6.24) -12.36 -4.52
5 -24.02
(-7.32)
-17.52
(-5.34) -8.65 -8.30
6 -21.72
(-6.62)
-18.08
(-5.51) -9.38 -8.80
7 -20.80
(-6.34)
-19.09
(-5.82) -12.55 -10.85
8 -15.55
(-4.74)
-16.96
(-5.17) 13.03 -8.61
9 -16.08
(-4.90)
-17.19
(-5.24) -9.55 -8.50
MASH
Limits
≤ 40
(12.2)
≤ 40
(12.2) ≤ 20.49 ≤ 20.49
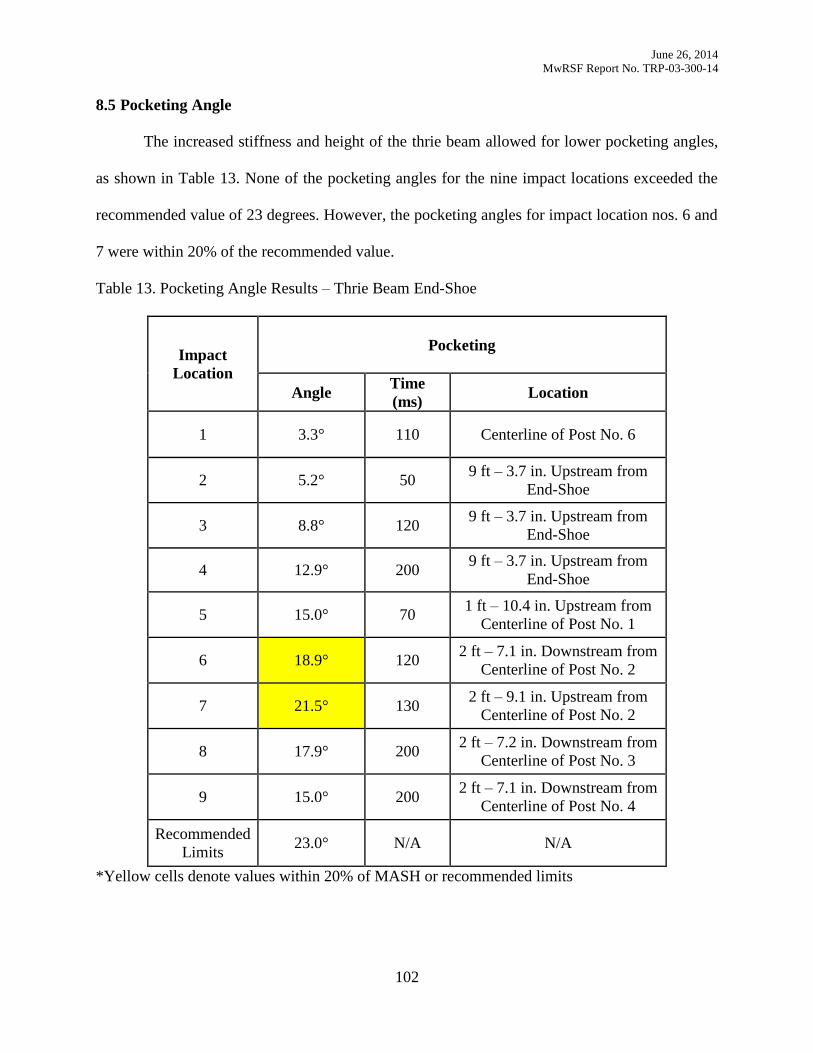
June 26, 2014
MwRSF Report No. TRP-03-300-14
102
8.5 Pocketing Angle
The increased stiffness and height of the thrie beam allowed for lower pocketing angles,
as shown in Table 13. None of the pocketing angles for the nine impact locations exceeded the
recommended value of 23 degrees. However, the pocketing angles for impact location nos. 6 and
7 were within 20% of the recommended value.
Table 13. Pocketing Angle Results – Thrie Beam End-Shoe
Impact
Location
Pocketing
Angle Time
(ms) Location
1 3.3° 110 Centerline of Post No. 6
2 5.2° 50 9 ft – 3.7 in. Upstream from
End-Shoe
3 8.8° 120 9 ft – 3.7 in. Upstream from
End-Shoe
4 12.9° 200 9 ft – 3.7 in. Upstream from
End-Shoe
5 15.0° 70 1 ft – 10.4 in. Upstream from
Centerline of Post No. 1
6 18.9° 120 2 ft – 7.1 in. Downstream from
Centerline of Post No. 2
7 21.5° 130 2 ft – 9.1 in. Upstream from
Centerline of Post No. 2
8 17.9° 200 2 ft – 7.2 in. Downstream from
Centerline of Post No. 3
9 15.0° 200 2 ft – 7.1 in. Downstream from
Centerline of Post No. 4
Recommended
Limits 23.0° N/A N/A
*Yellow cells denote values within 20% of MASH or recommended limits
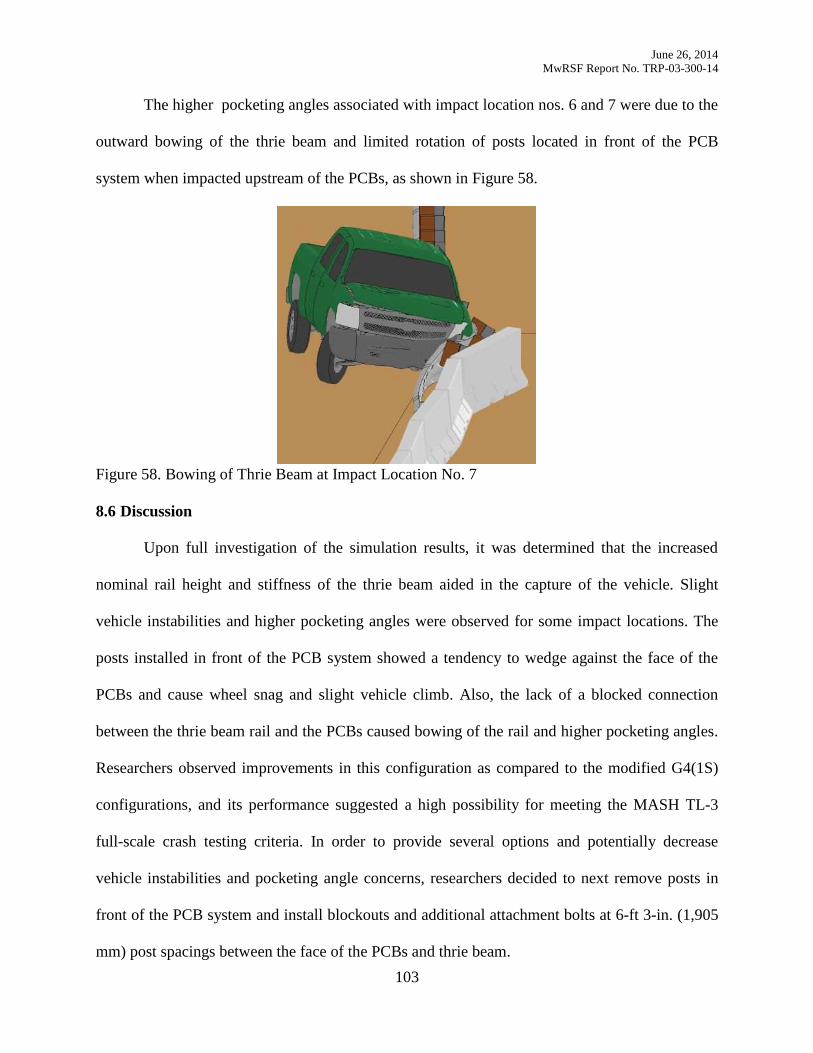
June 26, 2014
MwRSF Report No. TRP-03-300-14
103
The higher pocketing angles associated with impact location nos. 6 and 7 were due to the
outward bowing of the thrie beam and limited rotation of posts located in front of the PCB
system when impacted upstream of the PCBs, as shown in Figure 58.
Figure 58. Bowing of Thrie Beam at Impact Location No. 7
8.6 Discussion
Upon full investigation of the simulation results, it was determined that the increased
nominal rail height and stiffness of the thrie beam aided in the capture of the vehicle. Slight
vehicle instabilities and higher pocketing angles were observed for some impact locations. The
posts installed in front of the PCB system showed a tendency to wedge against the face of the
PCBs and cause wheel snag and slight vehicle climb. Also, the lack of a blocked connection
between the thrie beam rail and the PCBs caused bowing of the rail and higher pocketing angles.
Researchers observed improvements in this configuration as compared to the modified G4(1S)
configurations, and its performance suggested a high possibility for meeting the MASH TL-3
full-scale crash testing criteria. In order to provide several options and potentially decrease
vehicle instabilities and pocketing angle concerns, researchers decided to next remove posts in
front of the PCB system and install blockouts and additional attachment bolts at 6-ft 3-in. (1,905
mm) post spacings between the face of the PCBs and thrie beam.
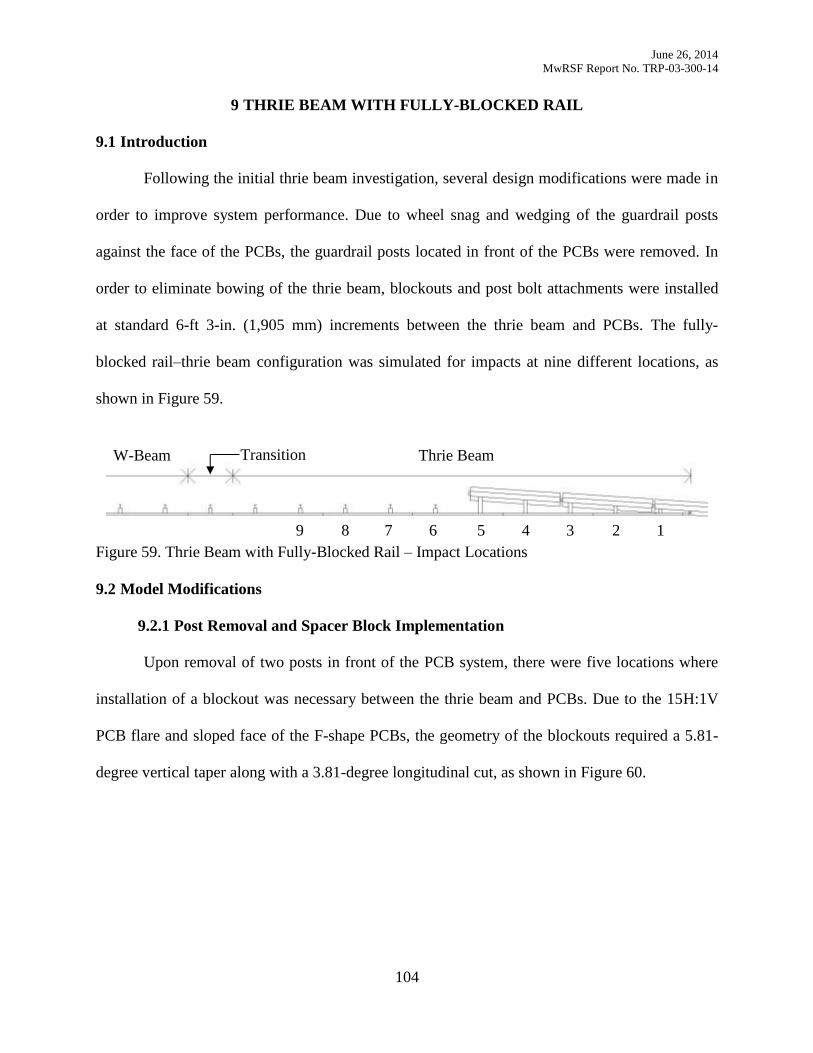
June 26, 2014
MwRSF Report No. TRP-03-300-14
104
THRIE BEAM WITH FULLY-BLOCKED RAIL 9
9.1 Introduction
Following the initial thrie beam investigation, several design modifications were made in
order to improve system performance. Due to wheel snag and wedging of the guardrail posts
against the face of the PCBs, the guardrail posts located in front of the PCBs were removed. In
order to eliminate bowing of the thrie beam, blockouts and post bolt attachments were installed
at standard 6-ft 3-in. (1,905 mm) increments between the thrie beam and PCBs. The fully-
blocked rail–thrie beam configuration was simulated for impacts at nine different locations, as
shown in Figure 59.
Figure 59. Thrie Beam with Fully-Blocked Rail – Impact Locations
9.2 Model Modifications
9.2.1 Post Removal and Spacer Block Implementation
Upon removal of two posts in front of the PCB system, there were five locations where
installation of a blockout was necessary between the thrie beam and PCBs. Due to the 15H:1V
PCB flare and sloped face of the F-shape PCBs, the geometry of the blockouts required a 5.81-
degree vertical taper along with a 3.81-degree longitudinal cut, as shown in Figure 60.
1 6 5 4 3 2 7 8 9
Thrie Beam Transition W-Beam
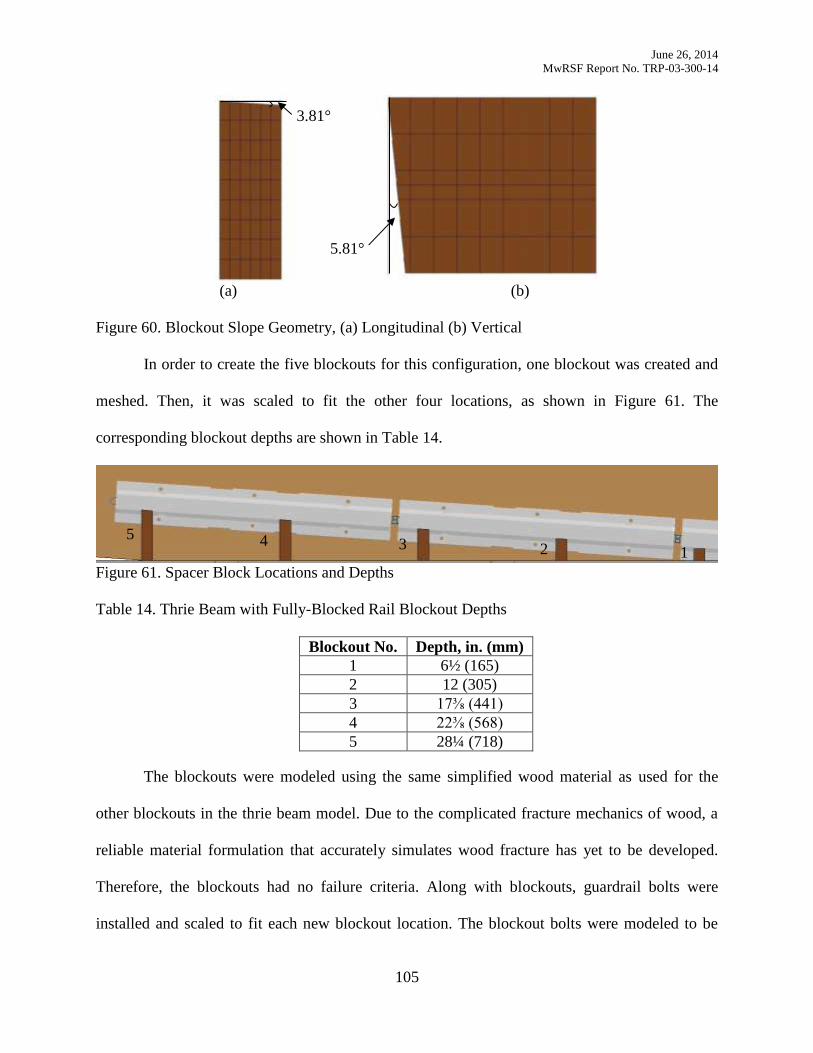
June 26, 2014
MwRSF Report No. TRP-03-300-14
105
(a) (b)
Figure 60. Blockout Slope Geometry, (a) Longitudinal (b) Vertical
In order to create the five blockouts for this configuration, one blockout was created and
meshed. Then, it was scaled to fit the other four locations, as shown in Figure 61. The
corresponding blockout depths are shown in Table 14.
Figure 61. Spacer Block Locations and Depths
Table 14. Thrie Beam with Fully-Blocked Rail Blockout Depths
Blockout No. Depth, in. (mm)
1 6½ (165)
2 12 (305)
3 17⅜ (441)
4 22⅜ (568)
5 28¼ (718)
The blockouts were modeled using the same simplified wood material as used for the
other blockouts in the thrie beam model. Due to the complicated fracture mechanics of wood, a
reliable material formulation that accurately simulates wood fracture has yet to be developed.
Therefore, the blockouts had no failure criteria. Along with blockouts, guardrail bolts were
installed and scaled to fit each new blockout location. The blockout bolts were modeled to be
3.81°
5.81°
5
1 2 3 4
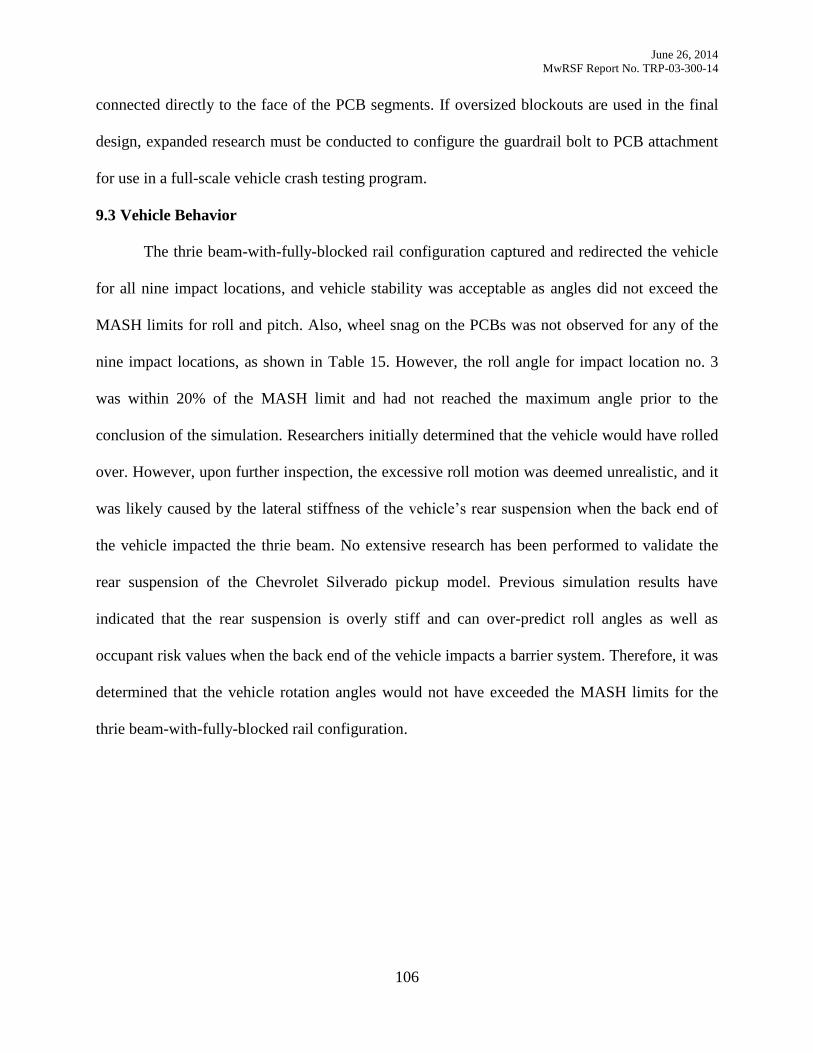
June 26, 2014
MwRSF Report No. TRP-03-300-14
106
connected directly to the face of the PCB segments. If oversized blockouts are used in the final
design, expanded research must be conducted to configure the guardrail bolt to PCB attachment
for use in a full-scale vehicle crash testing program.
9.3 Vehicle Behavior
The thrie beam-with-fully-blocked rail configuration captured and redirected the vehicle
for all nine impact locations, and vehicle stability was acceptable as angles did not exceed the
MASH limits for roll and pitch. Also, wheel snag on the PCBs was not observed for any of the
nine impact locations, as shown in Table 15. However, the roll angle for impact location no. 3
was within 20% of the MASH limit and had not reached the maximum angle prior to the
conclusion of the simulation. Researchers initially determined that the vehicle would have rolled
over. However, upon further inspection, the excessive roll motion was deemed unrealistic, and it
was likely caused by the lateral stiffness of the vehicle’s rear suspension when the back end of
the vehicle impacted the thrie beam. No extensive research has been performed to validate the
rear suspension of the Chevrolet Silverado pickup model. Previous simulation results have
indicated that the rear suspension is overly stiff and can over-predict roll angles as well as
occupant risk values when the back end of the vehicle impacts a barrier system. Therefore, it was
determined that the vehicle rotation angles would not have exceeded the MASH limits for the
thrie beam-with-fully-blocked rail configuration.
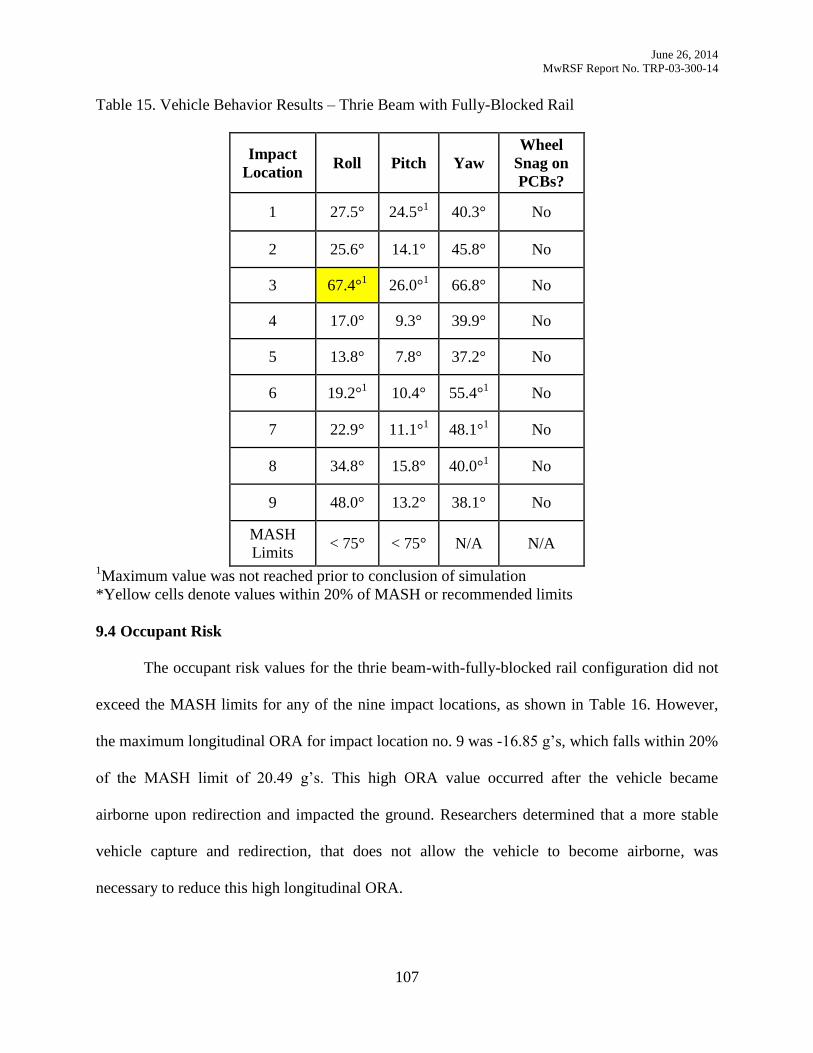
June 26, 2014
MwRSF Report No. TRP-03-300-14
107
Table 15. Vehicle Behavior Results – Thrie Beam with Fully-Blocked Rail
Impact
Location Roll Pitch Yaw
Wheel
Snag on
PCBs?
1 27.5° 24.5°1
40.3° No
2 25.6° 14.1° 45.8°
No
3 67.4°1
26.0°1
66.8° No
4 17.0°
9.3° 39.9° No
5 13.8°
7.8° 37.2°
No
6 19.2°1
10.4°
55.4°1
No
7 22.9° 11.1°1
48.1°1
No
8 34.8° 15.8° 40.0°1
No
9 48.0°
13.2° 38.1° No
MASH
Limits < 75° < 75° N/A N/A
1Maximum value was not reached prior to conclusion of simulation
*Yellow cells denote values within 20% of MASH or recommended limits
9.4 Occupant Risk
The occupant risk values for the thrie beam-with-fully-blocked rail configuration did not
exceed the MASH limits for any of the nine impact locations, as shown in Table 16. However,
the maximum longitudinal ORA for impact location no. 9 was -16.85 g’s, which falls within 20%
of the MASH limit of 20.49 g’s. This high ORA value occurred after the vehicle became
airborne upon redirection and impacted the ground. Researchers determined that a more stable
vehicle capture and redirection, that does not allow the vehicle to become airborne, was
necessary to reduce this high longitudinal ORA.
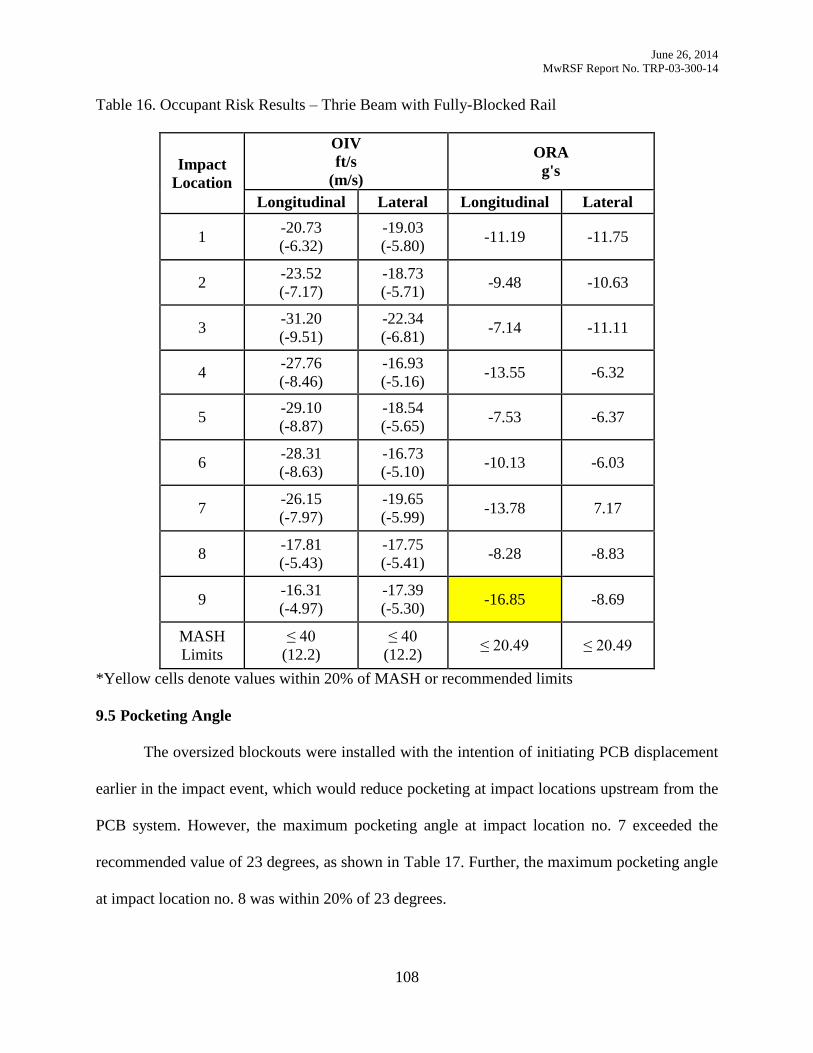
June 26, 2014
MwRSF Report No. TRP-03-300-14
108
Table 16. Occupant Risk Results – Thrie Beam with Fully-Blocked Rail
Impact
Location
OIV
ft/s
(m/s)
ORA
g's
Longitudinal Lateral Longitudinal Lateral
1 -20.73
(-6.32)
-19.03
(-5.80) -11.19 -11.75
2 -23.52
(-7.17)
-18.73
(-5.71) -9.48 -10.63
3 -31.20
(-9.51)
-22.34
(-6.81) -7.14 -11.11
4 -27.76
(-8.46)
-16.93
(-5.16) -13.55 -6.32
5 -29.10
(-8.87)
-18.54
(-5.65) -7.53 -6.37
6 -28.31
(-8.63)
-16.73
(-5.10) -10.13 -6.03
7 -26.15
(-7.97)
-19.65
(-5.99) -13.78 7.17
8 -17.81
(-5.43)
-17.75
(-5.41) -8.28 -8.83
9 -16.31
(-4.97)
-17.39
(-5.30) -16.85 -8.69
MASH
Limits
≤ 40
(12.2)
≤ 40
(12.2) ≤ 20.49 ≤ 20.49
*Yellow cells denote values within 20% of MASH or recommended limits
9.5 Pocketing Angle
The oversized blockouts were installed with the intention of initiating PCB displacement
earlier in the impact event, which would reduce pocketing at impact locations upstream from the
PCB system. However, the maximum pocketing angle at impact location no. 7 exceeded the
recommended value of 23 degrees, as shown in Table 17. Further, the maximum pocketing angle
at impact location no. 8 was within 20% of 23 degrees.
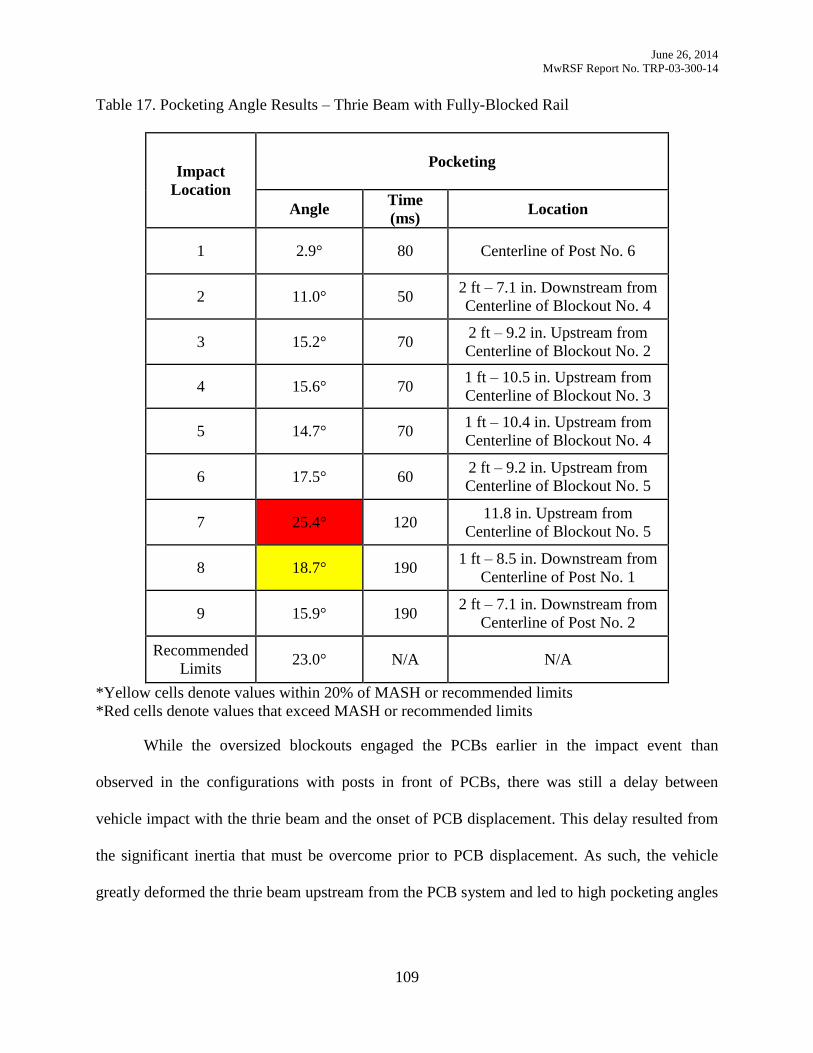
June 26, 2014
MwRSF Report No. TRP-03-300-14
109
Table 17. Pocketing Angle Results – Thrie Beam with Fully-Blocked Rail
Impact
Location
Pocketing
Angle Time
(ms) Location
1 2.9° 80 Centerline of Post No. 6
2 11.0° 50 2 ft – 7.1 in. Downstream from
Centerline of Blockout No. 4
3 15.2° 70 2 ft – 9.2 in. Upstream from
Centerline of Blockout No. 2
4 15.6° 70 1 ft – 10.5 in. Upstream from
Centerline of Blockout No. 3
5 14.7° 70 1 ft – 10.4 in. Upstream from
Centerline of Blockout No. 4
6 17.5° 60 2 ft – 9.2 in. Upstream from
Centerline of Blockout No. 5
7 25.4° 120 11.8 in. Upstream from
Centerline of Blockout No. 5
8 18.7° 190 1 ft – 8.5 in. Downstream from
Centerline of Post No. 1
9 15.9° 190 2 ft – 7.1 in. Downstream from
Centerline of Post No. 2
Recommended
Limits 23.0° N/A N/A
*Yellow cells denote values within 20% of MASH or recommended limits
*Red cells denote values that exceed MASH or recommended limits
While the oversized blockouts engaged the PCBs earlier in the impact event than
observed in the configurations with posts in front of PCBs, there was still a delay between
vehicle impact with the thrie beam and the onset of PCB displacement. This delay resulted from
the significant inertia that must be overcome prior to PCB displacement. As such, the vehicle
greatly deformed the thrie beam upstream from the PCB system and led to high pocketing angles
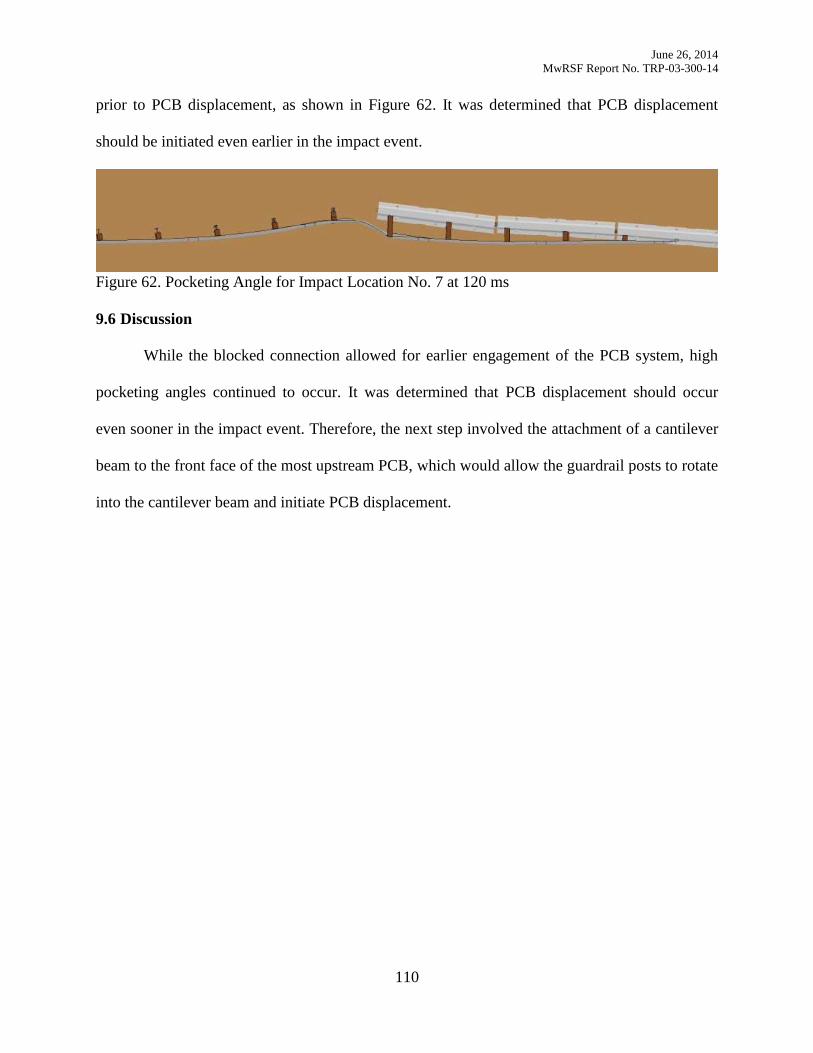
June 26, 2014
MwRSF Report No. TRP-03-300-14
110
prior to PCB displacement, as shown in Figure 62. It was determined that PCB displacement
should be initiated even earlier in the impact event.
Figure 62. Pocketing Angle for Impact Location No. 7 at 120 ms
9.6 Discussion
While the blocked connection allowed for earlier engagement of the PCB system, high
pocketing angles continued to occur. It was determined that PCB displacement should occur
even sooner in the impact event. Therefore, the next step involved the attachment of a cantilever
beam to the front face of the most upstream PCB, which would allow the guardrail posts to rotate
into the cantilever beam and initiate PCB displacement.
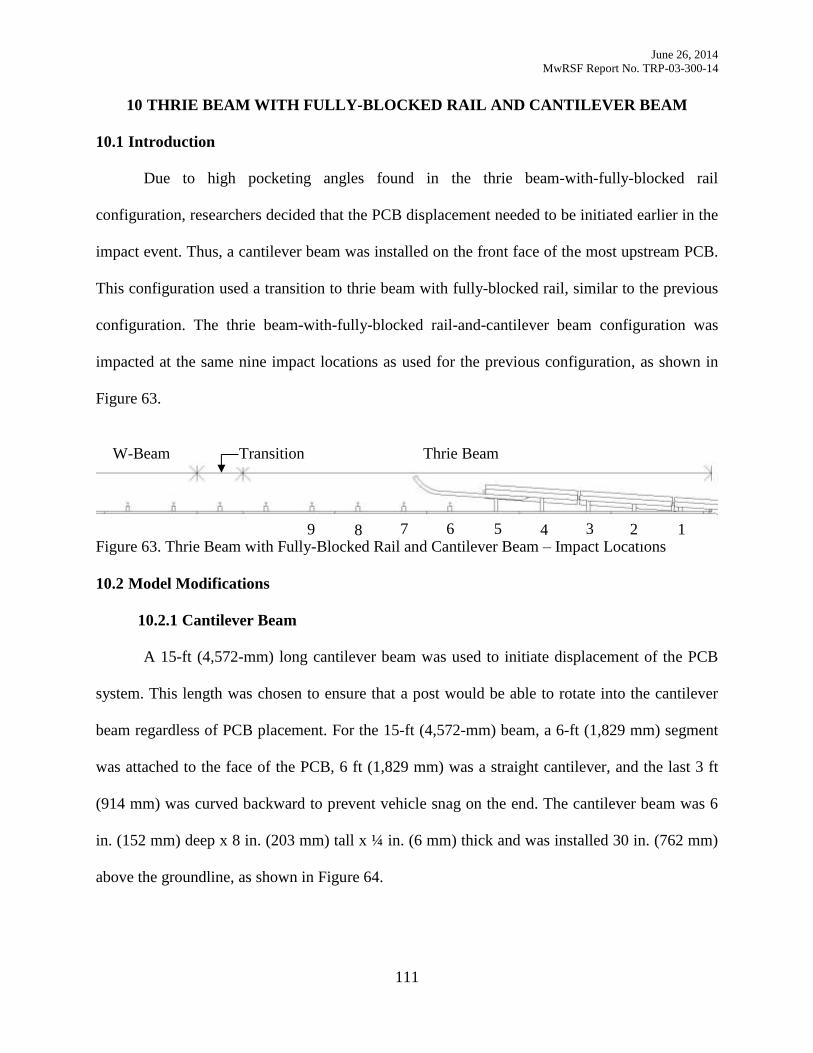
June 26, 2014
MwRSF Report No. TRP-03-300-14
111
THRIE BEAM WITH FULLY-BLOCKED RAIL AND CANTILEVER BEAM 10
10.1 Introduction
Due to high pocketing angles found in the thrie beam-with-fully-blocked rail
configuration, researchers decided that the PCB displacement needed to be initiated earlier in the
impact event. Thus, a cantilever beam was installed on the front face of the most upstream PCB.
This configuration used a transition to thrie beam with fully-blocked rail, similar to the previous
configuration. The thrie beam-with-fully-blocked rail-and-cantilever beam configuration was
impacted at the same nine impact locations as used for the previous configuration, as shown in
Figure 63.
Figure 63. Thrie Beam with Fully-Blocked Rail and Cantilever Beam – Impact Locations
10.2 Model Modifications
10.2.1 Cantilever Beam
A 15-ft (4,572-mm) long cantilever beam was used to initiate displacement of the PCB
system. This length was chosen to ensure that a post would be able to rotate into the cantilever
beam regardless of PCB placement. For the 15-ft (4,572-mm) beam, a 6-ft (1,829 mm) segment
was attached to the face of the PCB, 6 ft (1,829 mm) was a straight cantilever, and the last 3 ft
(914 mm) was curved backward to prevent vehicle snag on the end. The cantilever beam was 6
in. (152 mm) deep x 8 in. (203 mm) tall x ¼ in. (6 mm) thick and was installed 30 in. (762 mm)
above the groundline, as shown in Figure 64.
1 2 3 5 4 6 7 8 9
Thrie Beam Transition W-Beam
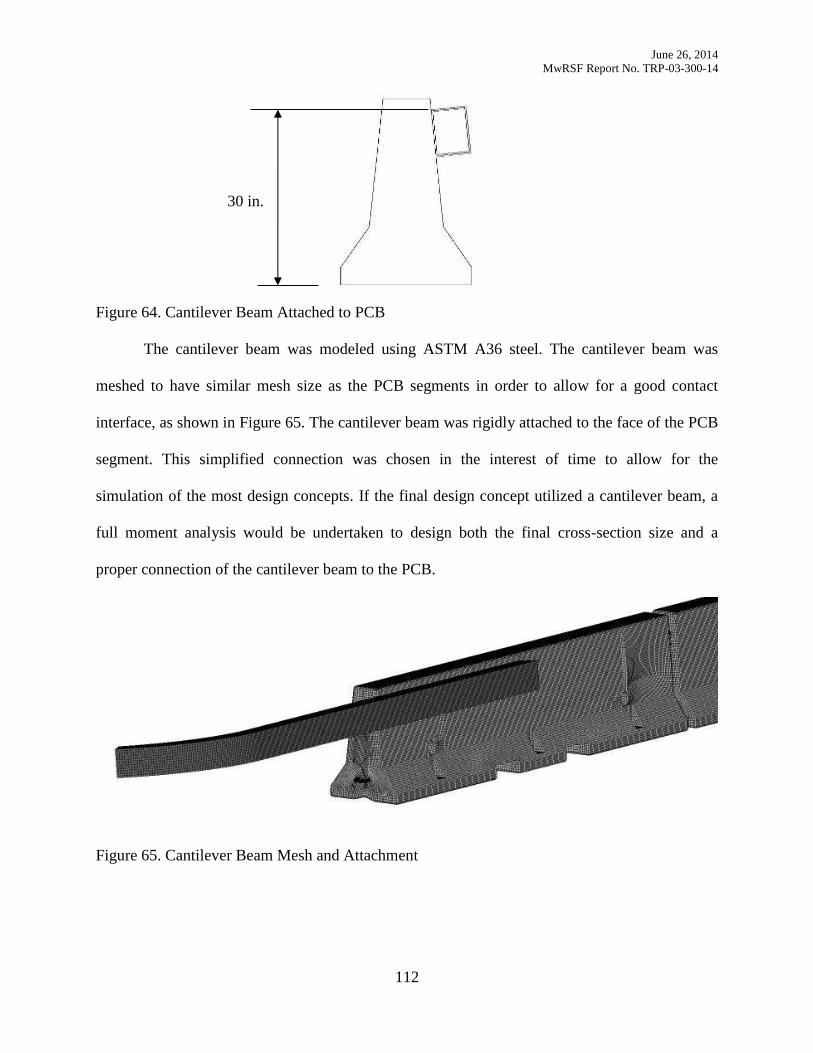
June 26, 2014
MwRSF Report No. TRP-03-300-14
112
Figure 64. Cantilever Beam Attached to PCB
The cantilever beam was modeled using ASTM A36 steel. The cantilever beam was
meshed to have similar mesh size as the PCB segments in order to allow for a good contact
interface, as shown in Figure 65. The cantilever beam was rigidly attached to the face of the PCB
segment. This simplified connection was chosen in the interest of time to allow for the
simulation of the most design concepts. If the final design concept utilized a cantilever beam, a
full moment analysis would be undertaken to design both the final cross-section size and a
proper connection of the cantilever beam to the PCB.
Figure 65. Cantilever Beam Mesh and Attachment
30 in.
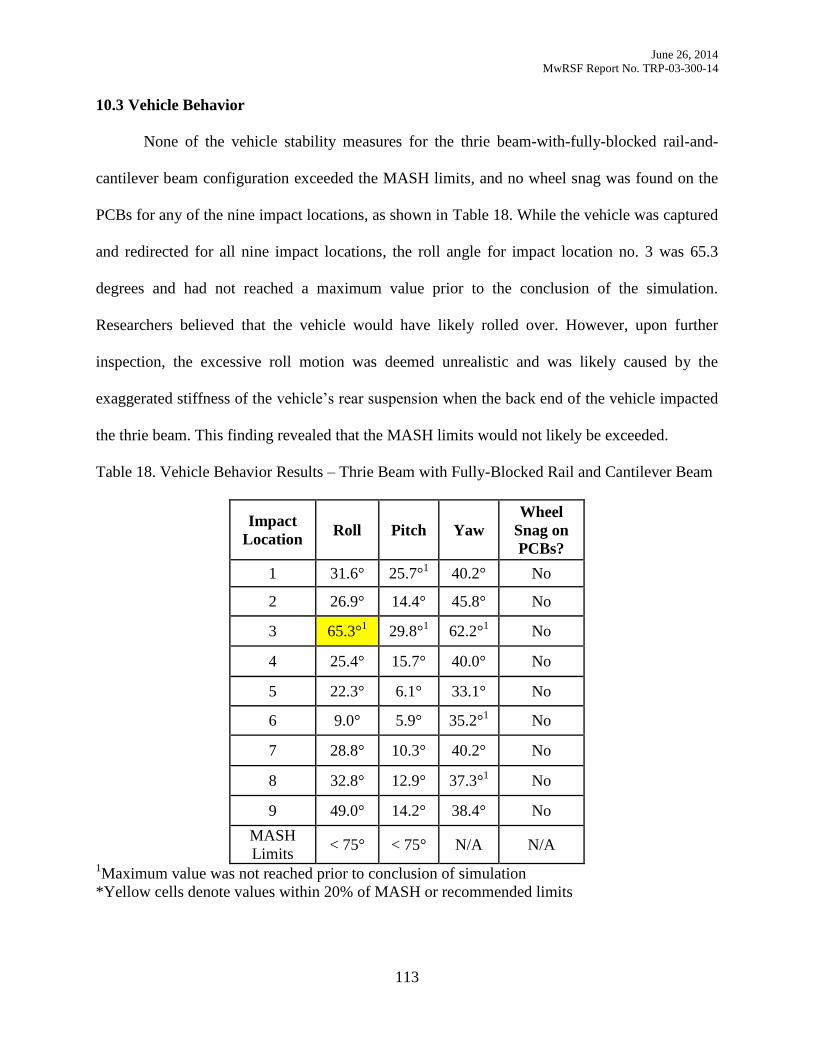
June 26, 2014
MwRSF Report No. TRP-03-300-14
113
10.3 Vehicle Behavior
None of the vehicle stability measures for the thrie beam-with-fully-blocked rail-and-
cantilever beam configuration exceeded the MASH limits, and no wheel snag was found on the
PCBs for any of the nine impact locations, as shown in Table 18. While the vehicle was captured
and redirected for all nine impact locations, the roll angle for impact location no. 3 was 65.3
degrees and had not reached a maximum value prior to the conclusion of the simulation.
Researchers believed that the vehicle would have likely rolled over. However, upon further
inspection, the excessive roll motion was deemed unrealistic and was likely caused by the
exaggerated stiffness of the vehicle’s rear suspension when the back end of the vehicle impacted
the thrie beam. This finding revealed that the MASH limits would not likely be exceeded.
Table 18. Vehicle Behavior Results – Thrie Beam with Fully-Blocked Rail and Cantilever Beam
Impact
Location Roll Pitch Yaw
Wheel
Snag on
PCBs?
1 31.6° 25.7°1
40.2° No
2 26.9° 14.4° 45.8°
No
3 65.3°1
29.8°1
62.2°1
No
4 25.4°
15.7° 40.0° No
5 22.3°
6.1° 33.1°
No
6 9.0°
5.9°
35.2°1
No
7 28.8° 10.3°
40.2°
No
8 32.8° 12.9° 37.3°1
No
9 49.0°
14.2° 38.4° No
MASH
Limits < 75° < 75° N/A N/A
1Maximum value was not reached prior to conclusion of simulation
*Yellow cells denote values within 20% of MASH or recommended limits
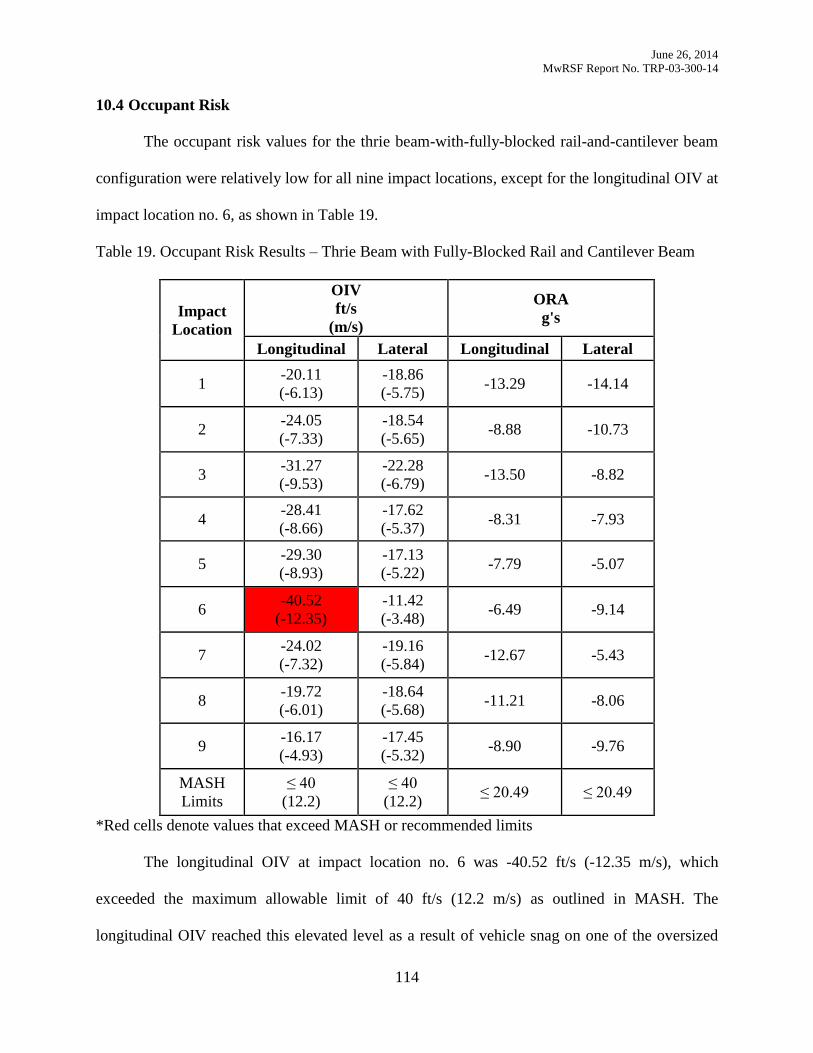
June 26, 2014
MwRSF Report No. TRP-03-300-14
114
10.4 Occupant Risk
The occupant risk values for the thrie beam-with-fully-blocked rail-and-cantilever beam
configuration were relatively low for all nine impact locations, except for the longitudinal OIV at
impact location no. 6, as shown in Table 19.
Table 19. Occupant Risk Results – Thrie Beam with Fully-Blocked Rail and Cantilever Beam
Impact
Location
OIV
ft/s
(m/s)
ORA
g's
Longitudinal Lateral Longitudinal Lateral
1 -20.11
(-6.13)
-18.86
(-5.75) -13.29 -14.14
2 -24.05
(-7.33)
-18.54
(-5.65) -8.88 -10.73
3 -31.27
(-9.53)
-22.28
(-6.79) -13.50 -8.82
4 -28.41
(-8.66)
-17.62
(-5.37) -8.31 -7.93
5 -29.30
(-8.93)
-17.13
(-5.22) -7.79 -5.07
6 -40.52
(-12.35)
-11.42
(-3.48) -6.49 -9.14
7 -24.02
(-7.32)
-19.16
(-5.84) -12.67 -5.43
8 -19.72
(-6.01)
-18.64
(-5.68) -11.21 -8.06
9 -16.17
(-4.93)
-17.45
(-5.32) -8.90 -9.76
MASH
Limits
≤ 40
(12.2)
≤ 40
(12.2) ≤ 20.49 ≤ 20.49
*Red cells denote values that exceed MASH or recommended limits
The longitudinal OIV at impact location no. 6 was -40.52 ft/s (-12.35 m/s), which
exceeded the maximum allowable limit of 40 ft/s (12.2 m/s) as outlined in MASH. The
longitudinal OIV reached this elevated level as a result of vehicle snag on one of the oversized
June 26, 2014
MwRSF Report No. TRP-03-300-14
115
blockouts, as shown in Figure 66. While these oversized blockouts eliminate the bowing of the
rail, they also present an opportunity for vehicle snag. Wood blockouts in full-scale crash testing
would likely fracture upon impact, but the blockouts in the LS-DYNA model have no failure
criteria due to wood modeling limitations. Therefore, researchers determined that the vehicle
snag on the blockout was not a physical phenomenon and likely would not occur in a full-scale
crash testing program.
Figure 66. Vehicle Snag on Blockout, Impact Location No. 6 at 90 ms
10.5 Pocketing Angle
The cantilever beam was implemented in order to initiate PCB displacement earlier in the
impact event and reduce pocketing angles. The maximum pocketing angles, as found in Table
20, do not exceed the recommended value of 23 degrees. However, impact location nos. 7 and 8
yielded maximum pocketing angles within 20% of 23 degrees. As compared to the previous
configuration without the cantilever beam, the pocketing angle for impact location no. 7 was
reduced from 25.4 degrees to 20.5 degrees, which led researchers to determine that the
installation of the cantilever beam helped reduce pocketing angles.
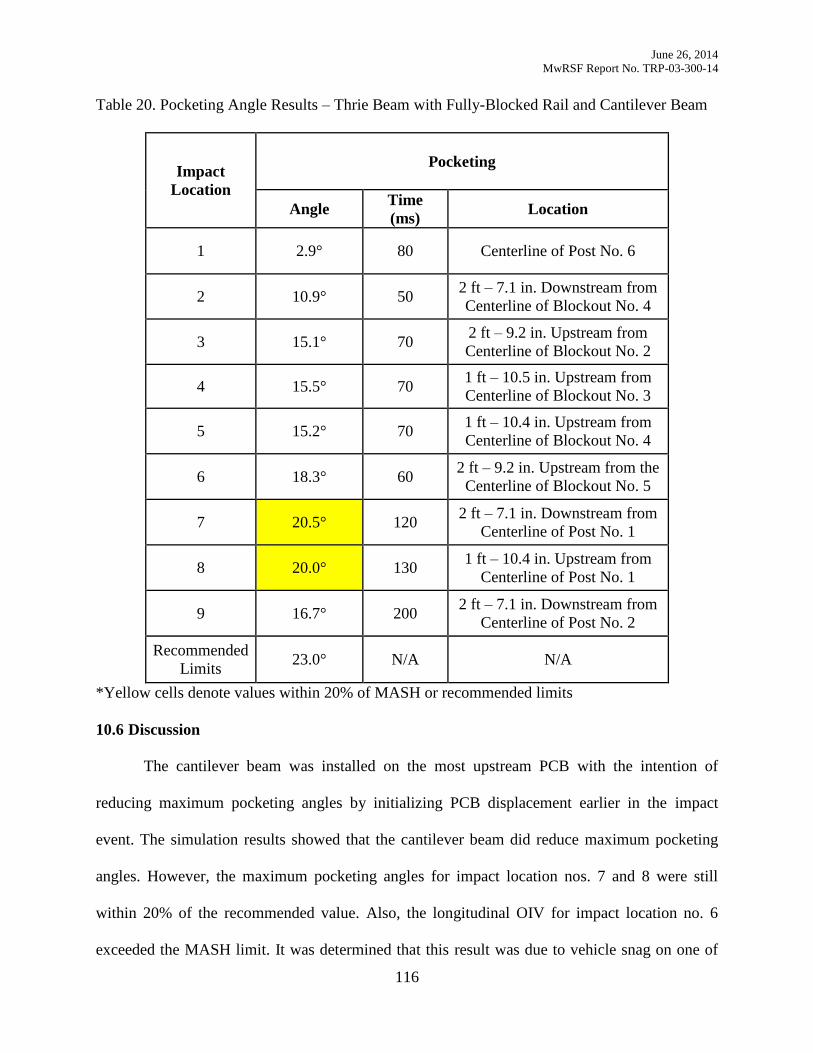
June 26, 2014
MwRSF Report No. TRP-03-300-14
116
Table 20. Pocketing Angle Results – Thrie Beam with Fully-Blocked Rail and Cantilever Beam
Impact
Location
Pocketing
Angle Time
(ms) Location
1 2.9° 80 Centerline of Post No. 6
2 10.9° 50 2 ft – 7.1 in. Downstream from
Centerline of Blockout No. 4
3 15.1° 70 2 ft – 9.2 in. Upstream from
Centerline of Blockout No. 2
4 15.5° 70 1 ft – 10.5 in. Upstream from
Centerline of Blockout No. 3
5 15.2° 70 1 ft – 10.4 in. Upstream from
Centerline of Blockout No. 4
6 18.3° 60 2 ft – 9.2 in. Upstream from the
Centerline of Blockout No. 5
7 20.5° 120 2 ft – 7.1 in. Downstream from
Centerline of Post No. 1
8 20.0° 130 1 ft – 10.4 in. Upstream from
Centerline of Post No. 1
9 16.7° 200 2 ft – 7.1 in. Downstream from
Centerline of Post No. 2
Recommended
Limits 23.0° N/A N/A
*Yellow cells denote values within 20% of MASH or recommended limits
10.6 Discussion
The cantilever beam was installed on the most upstream PCB with the intention of
reducing maximum pocketing angles by initializing PCB displacement earlier in the impact
event. The simulation results showed that the cantilever beam did reduce maximum pocketing
angles. However, the maximum pocketing angles for impact location nos. 7 and 8 were still
within 20% of the recommended value. Also, the longitudinal OIV for impact location no. 6
exceeded the MASH limit. It was determined that this result was due to vehicle snag on one of

June 26, 2014
MwRSF Report No. TRP-03-300-14
117
the oversized blockouts installed between the thrie beam and PCBs. This value was likely due to
the lack of failure criteria for the blockouts in the model. These blockouts would likely fracture
in full-scale crash testing, and the longitudinal OIV would likely be much lower. Based on the
results of the thrie beam with fully-blocked rail and cantilever beam, this configuration likely
demonstrated the highest probability of meeting the MASH testing criteria for any system
investigated so far. However, pocketing was still the primary concern, and researchers continued
to explore ways to reduce maximum pocketing angles.
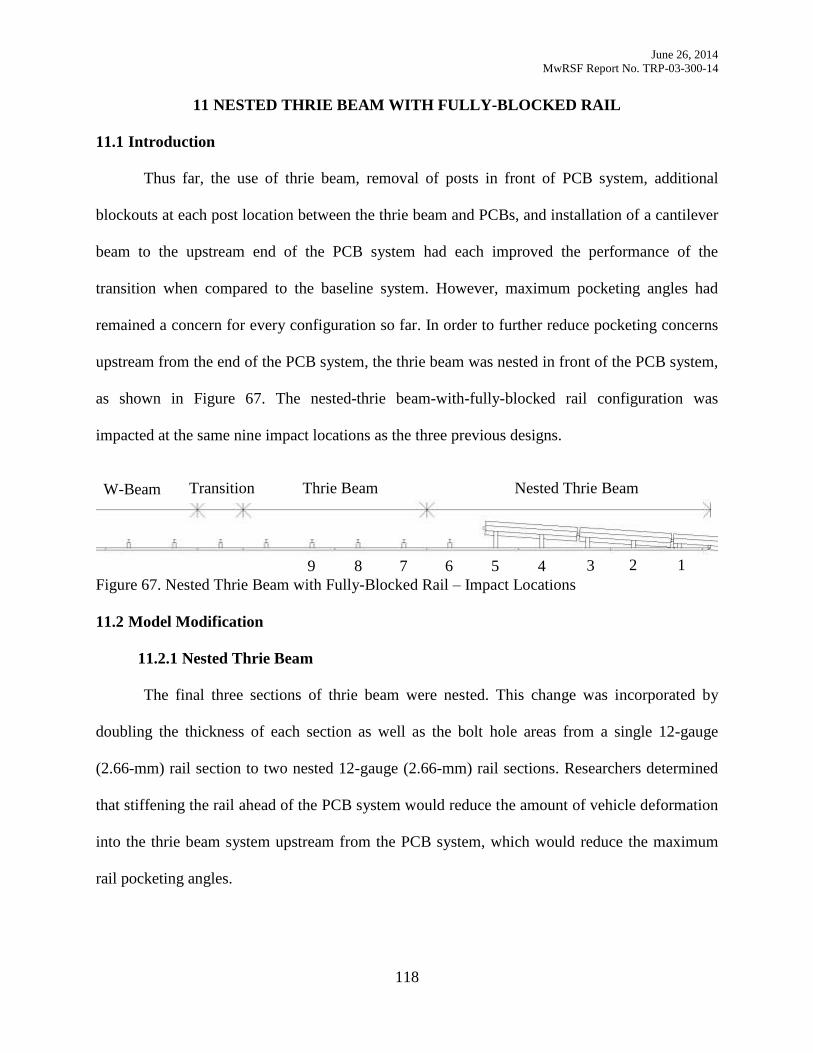
June 26, 2014
MwRSF Report No. TRP-03-300-14
118
NESTED THRIE BEAM WITH FULLY-BLOCKED RAIL 11
11.1 Introduction
Thus far, the use of thrie beam, removal of posts in front of PCB system, additional
blockouts at each post location between the thrie beam and PCBs, and installation of a cantilever
beam to the upstream end of the PCB system had each improved the performance of the
transition when compared to the baseline system. However, maximum pocketing angles had
remained a concern for every configuration so far. In order to further reduce pocketing concerns
upstream from the end of the PCB system, the thrie beam was nested in front of the PCB system,
as shown in Figure 67. The nested-thrie beam-with-fully-blocked rail configuration was
impacted at the same nine impact locations as the three previous designs.
Figure 67. Nested Thrie Beam with Fully-Blocked Rail – Impact Locations
11.2 Model Modification
11.2.1 Nested Thrie Beam
The final three sections of thrie beam were nested. This change was incorporated by
doubling the thickness of each section as well as the bolt hole areas from a single 12-gauge
(2.66-mm) rail section to two nested 12-gauge (2.66-mm) rail sections. Researchers determined
that stiffening the rail ahead of the PCB system would reduce the amount of vehicle deformation
into the thrie beam system upstream from the PCB system, which would reduce the maximum
rail pocketing angles.
1 2 3 4 5 6 7 8 9
Nested Thrie Beam Thrie Beam W-Beam Transition
June 26, 2014
MwRSF Report No. TRP-03-300-14
119
11.3 Vehicle Behavior
The simulation results for the nested-thrie beam-with-fully-blocked rail configuration
indicated that the vehicle was captured and redirected for all nine impact locations. However,
vehicle stability degraded with this modification, as shown in Table 21. The roll angle for impact
location no. 2 was 96.9 degrees and had not reached a maximum value prior to conclusion of the
simulation. Also, the roll angle for impact location no. 1 was within 20% of the MASH limit and
had not reached a maximum value prior to conclusion of the simulation. Researchers felt the
vehicle would have likely rolled over at both impact locations. However, upon further inspection,
the excessive roll motion was deemed unrealistic and was likely caused by the exaggerated
stiffness of the vehicle’s rear suspension when the back end of the vehicle impacted the nested
thrie beam. The increased stiffness of the nested thrie beam further accentuated the response of
the vehicle’s rear suspension, which caused even higher roll angles than were seen in previous
designs. This finding led researchers to determine that the MASH limits would not likely be
exceeded.
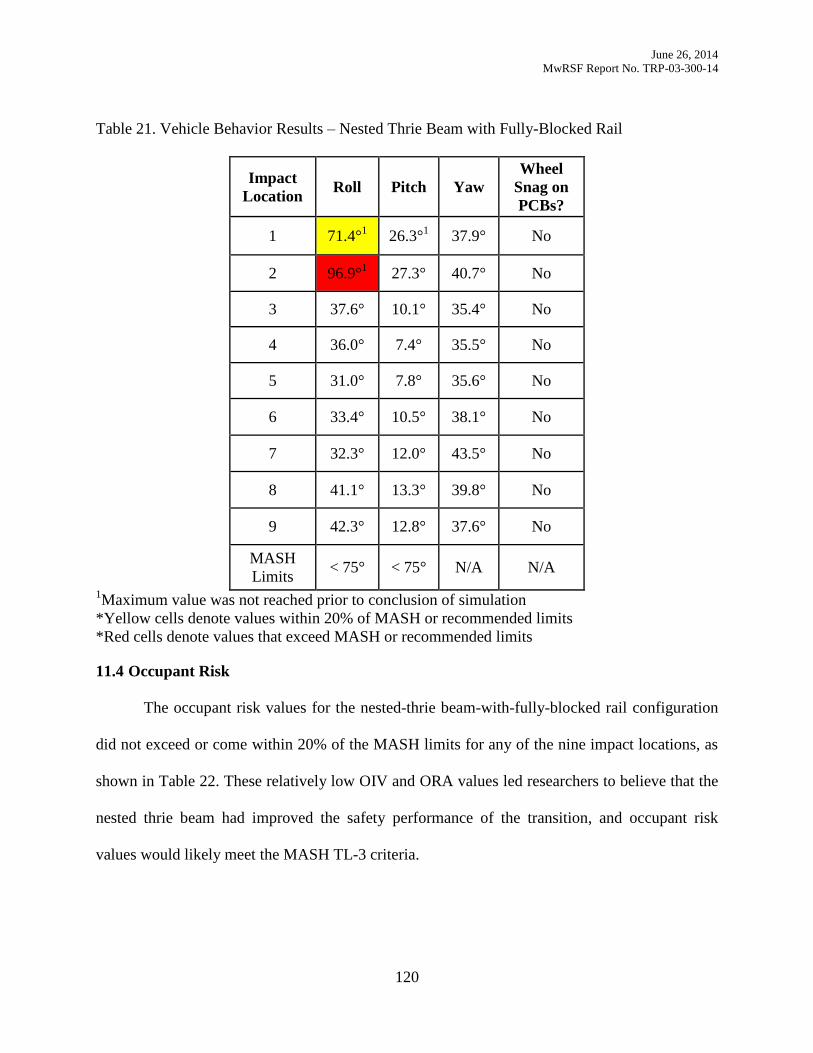
June 26, 2014
MwRSF Report No. TRP-03-300-14
120
Table 21. Vehicle Behavior Results – Nested Thrie Beam with Fully-Blocked Rail
Impact
Location Roll Pitch Yaw
Wheel
Snag on
PCBs?
1 71.4°1
26.3°1
37.9° No
2 96.9°1
27.3° 40.7°
No
3 37.6°
10.1°
35.4°
No
4 36.0°
7.4° 35.5° No
5 31.0°
7.8° 35.6°
No
6 33.4°
10.5°
38.1°
No
7 32.3° 12.0°
43.5°
No
8 41.1° 13.3° 39.8°
No
9 42.3°
12.8° 37.6° No
MASH
Limits < 75° < 75° N/A N/A
1Maximum value was not reached prior to conclusion of simulation
*Yellow cells denote values within 20% of MASH or recommended limits
*Red cells denote values that exceed MASH or recommended limits
11.4 Occupant Risk
The occupant risk values for the nested-thrie beam-with-fully-blocked rail configuration
did not exceed or come within 20% of the MASH limits for any of the nine impact locations, as
shown in Table 22. These relatively low OIV and ORA values led researchers to believe that the
nested thrie beam had improved the safety performance of the transition, and occupant risk
values would likely meet the MASH TL-3 criteria.
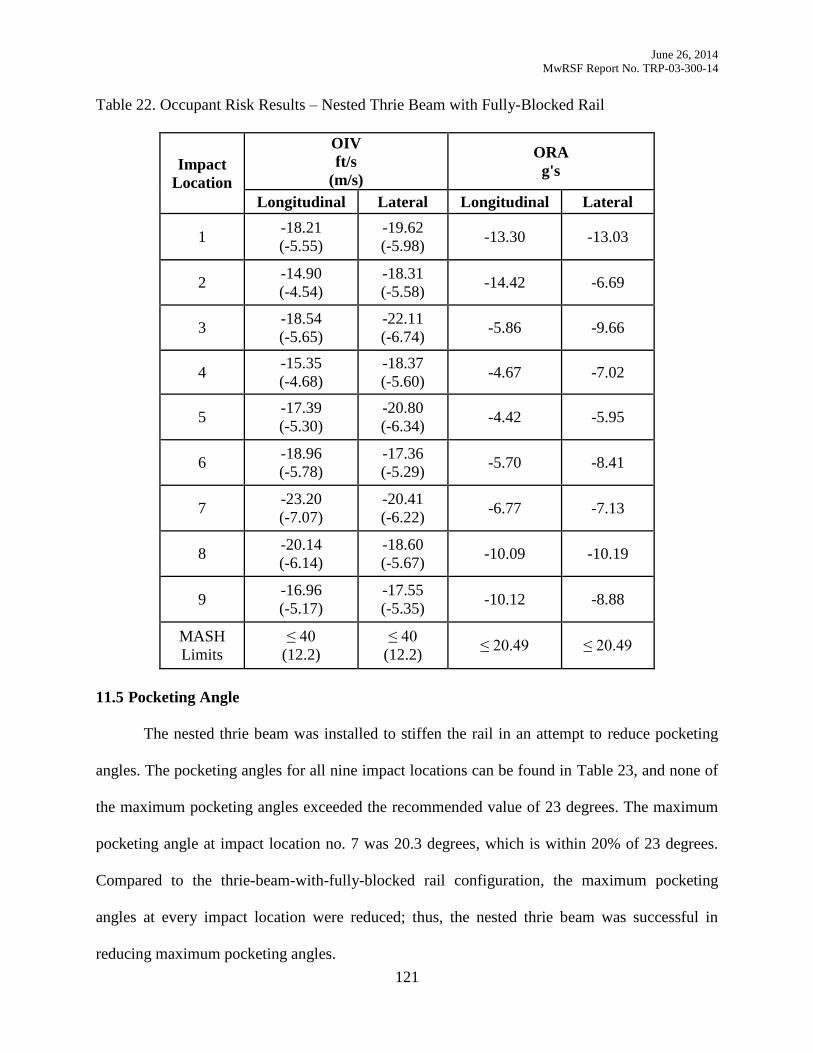
June 26, 2014
MwRSF Report No. TRP-03-300-14
121
Table 22. Occupant Risk Results – Nested Thrie Beam with Fully-Blocked Rail
Impact
Location
OIV
ft/s
(m/s)
ORA
g's
Longitudinal Lateral Longitudinal Lateral
1 -18.21
(-5.55)
-19.62
(-5.98) -13.30 -13.03
2 -14.90
(-4.54)
-18.31
(-5.58) -14.42 -6.69
3 -18.54
(-5.65)
-22.11
(-6.74) -5.86 -9.66
4 -15.35
(-4.68)
-18.37
(-5.60) -4.67 -7.02
5 -17.39
(-5.30)
-20.80
(-6.34) -4.42 -5.95
6 -18.96
(-5.78)
-17.36
(-5.29) -5.70 -8.41
7 -23.20
(-7.07)
-20.41
(-6.22) -6.77 -7.13
8 -20.14
(-6.14)
-18.60
(-5.67) -10.09 -10.19
9 -16.96
(-5.17)
-17.55
(-5.35) -10.12 -8.88
MASH
Limits
≤ 40
(12.2)
≤ 40
(12.2) ≤ 20.49 ≤ 20.49
11.5 Pocketing Angle
The nested thrie beam was installed to stiffen the rail in an attempt to reduce pocketing
angles. The pocketing angles for all nine impact locations can be found in Table 23, and none of
the maximum pocketing angles exceeded the recommended value of 23 degrees. The maximum
pocketing angle at impact location no. 7 was 20.3 degrees, which is within 20% of 23 degrees.
Compared to the thrie-beam-with-fully-blocked rail configuration, the maximum pocketing
angles at every impact location were reduced; thus, the nested thrie beam was successful in
reducing maximum pocketing angles.
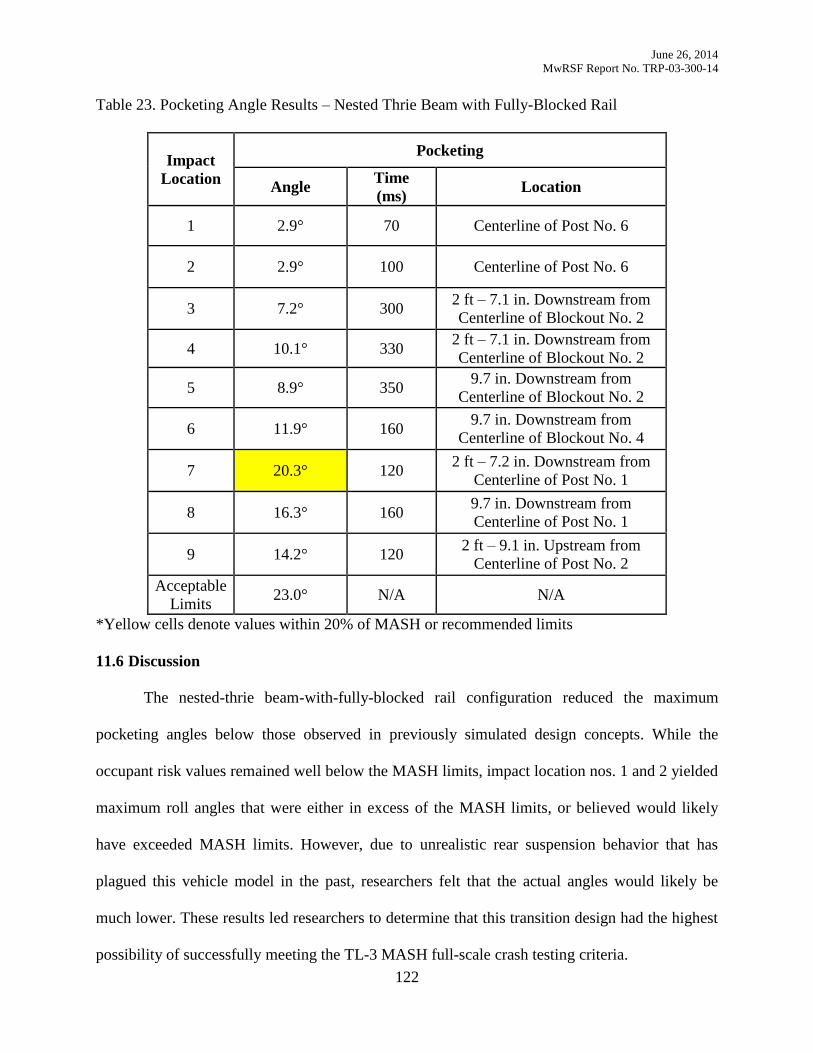
June 26, 2014
MwRSF Report No. TRP-03-300-14
122
Table 23. Pocketing Angle Results – Nested Thrie Beam with Fully-Blocked Rail
Impact
Location
Pocketing
Angle Time
(ms) Location
1 2.9° 70 Centerline of Post No. 6
2 2.9° 100 Centerline of Post No. 6
3 7.2° 300 2 ft – 7.1 in. Downstream from
Centerline of Blockout No. 2
4 10.1° 330 2 ft – 7.1 in. Downstream from
Centerline of Blockout No. 2
5 8.9° 350 9.7 in. Downstream from
Centerline of Blockout No. 2
6 11.9° 160 9.7 in. Downstream from
Centerline of Blockout No. 4
7 20.3° 120 2 ft – 7.2 in. Downstream from
Centerline of Post No. 1
8 16.3° 160 9.7 in. Downstream from
Centerline of Post No. 1
9 14.2° 120 2 ft – 9.1 in. Upstream from
Centerline of Post No. 2
Acceptable
Limits 23.0° N/A N/A
*Yellow cells denote values within 20% of MASH or recommended limits
11.6 Discussion
The nested-thrie beam-with-fully-blocked rail configuration reduced the maximum
pocketing angles below those observed in previously simulated design concepts. While the
occupant risk values remained well below the MASH limits, impact location nos. 1 and 2 yielded
maximum roll angles that were either in excess of the MASH limits, or believed would likely
have exceeded MASH limits. However, due to unrealistic rear suspension behavior that has
plagued this vehicle model in the past, researchers felt that the actual angles would likely be
much lower. These results led researchers to determine that this transition design had the highest
possibility of successfully meeting the TL-3 MASH full-scale crash testing criteria.
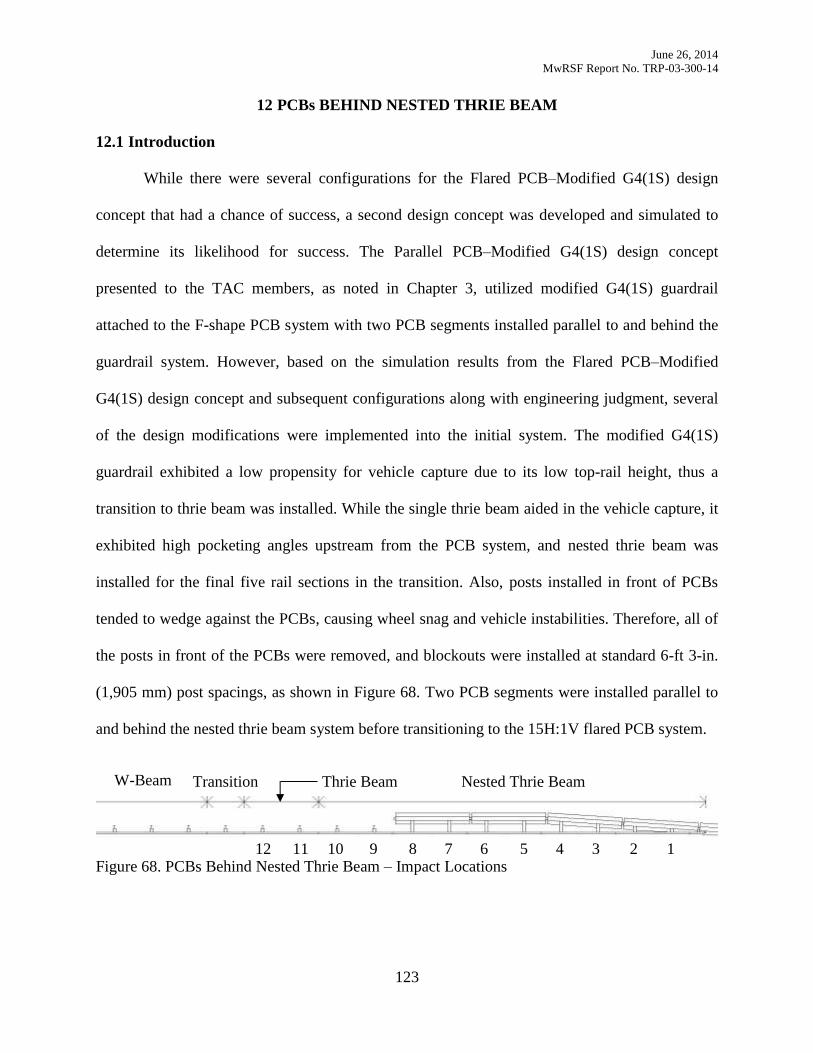
June 26, 2014
MwRSF Report No. TRP-03-300-14
123
PCBs BEHIND NESTED THRIE BEAM 12
12.1 Introduction
While there were several configurations for the Flared PCB–Modified G4(1S) design
concept that had a chance of success, a second design concept was developed and simulated to
determine its likelihood for success. The Parallel PCB–Modified G4(1S) design concept
presented to the TAC members, as noted in Chapter 3, utilized modified G4(1S) guardrail
attached to the F-shape PCB system with two PCB segments installed parallel to and behind the
guardrail system. However, based on the simulation results from the Flared PCB–Modified
G4(1S) design concept and subsequent configurations along with engineering judgment, several
of the design modifications were implemented into the initial system. The modified G4(1S)
guardrail exhibited a low propensity for vehicle capture due to its low top-rail height, thus a
transition to thrie beam was installed. While the single thrie beam aided in the vehicle capture, it
exhibited high pocketing angles upstream from the PCB system, and nested thrie beam was
installed for the final five rail sections in the transition. Also, posts installed in front of PCBs
tended to wedge against the PCBs, causing wheel snag and vehicle instabilities. Therefore, all of
the posts in front of the PCBs were removed, and blockouts were installed at standard 6-ft 3-in.
(1,905 mm) post spacings, as shown in Figure 68. Two PCB segments were installed parallel to
and behind the nested thrie beam system before transitioning to the 15H:1V flared PCB system.
Figure 68. PCBs Behind Nested Thrie Beam – Impact Locations 1 2 3 4 5 6 7 8 9 10 11 12
Nested Thrie Beam Thrie Beam Transition W-Beam
June 26, 2014
MwRSF Report No. TRP-03-300-14
124
12.2 Vehicle Behavior
The PCBs-behind-nested thrie beam configuration captured and redirected the vehicle
with no wheel snag on the PCBs for all twelve impact locations, as shown in Table 24. However,
the roll angle for impact location no. 11 exceeded the MASH limit and had not reached a
maximum value prior to conclusion of the simulation. Also, the roll angle for impact location no.
12 was within 20% of the MASH limit. Upon further inspection, the excessive roll motion was
deemed unrealistic and was likely caused by the exaggerated stiffness of the vehicle’s rear
suspension when the back end of the vehicle impacted the nested thrie beam. For this reason,
researchers determined that the MASH limits would not likely be exceeded at these two impact
locations, and the vehicle would likely have been safely redirected.
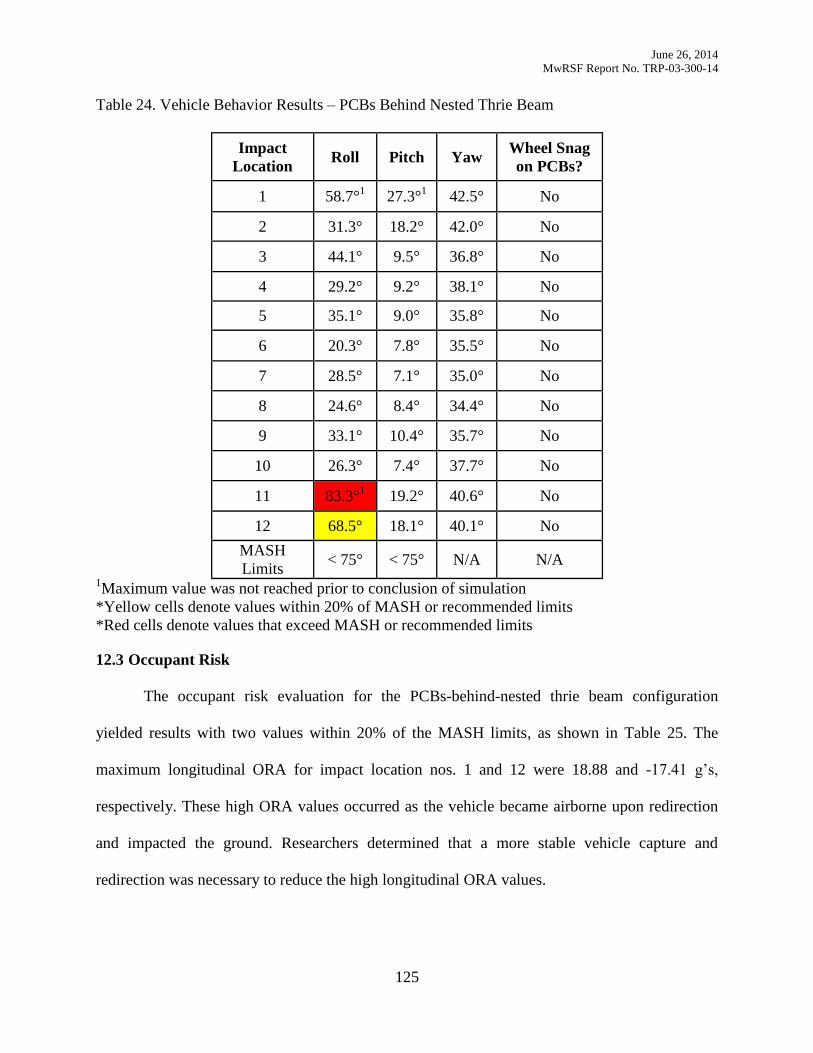
June 26, 2014
MwRSF Report No. TRP-03-300-14
125
Table 24. Vehicle Behavior Results – PCBs Behind Nested Thrie Beam
Impact
Location Roll Pitch Yaw
Wheel Snag
on PCBs?
1 58.7°1
27.3°1
42.5° No
2 31.3°
18.2° 42.0°
No
3 44.1°
9.5°
36.8°
No
4 29.2°
9.2° 38.1° No
5 35.1°
9.0° 35.8°
No
6 20.3°
7.8°
35.5°
No
7 28.5° 7.1°
35.0°
No
8 24.6° 8.4° 34.4°
No
9 33.1°
10.4° 35.7° No
10 26.3° 7.4° 37.7° No
11 83.3°1
19.2° 40.6° No
12 68.5° 18.1° 40.1° No
MASH
Limits < 75° < 75° N/A N/A
1Maximum value was not reached prior to conclusion of simulation
*Yellow cells denote values within 20% of MASH or recommended limits
*Red cells denote values that exceed MASH or recommended limits
12.3 Occupant Risk
The occupant risk evaluation for the PCBs-behind-nested thrie beam configuration
yielded results with two values within 20% of the MASH limits, as shown in Table 25. The
maximum longitudinal ORA for impact location nos. 1 and 12 were 18.88 and -17.41 g’s,
respectively. These high ORA values occurred as the vehicle became airborne upon redirection
and impacted the ground. Researchers determined that a more stable vehicle capture and
redirection was necessary to reduce the high longitudinal ORA values.
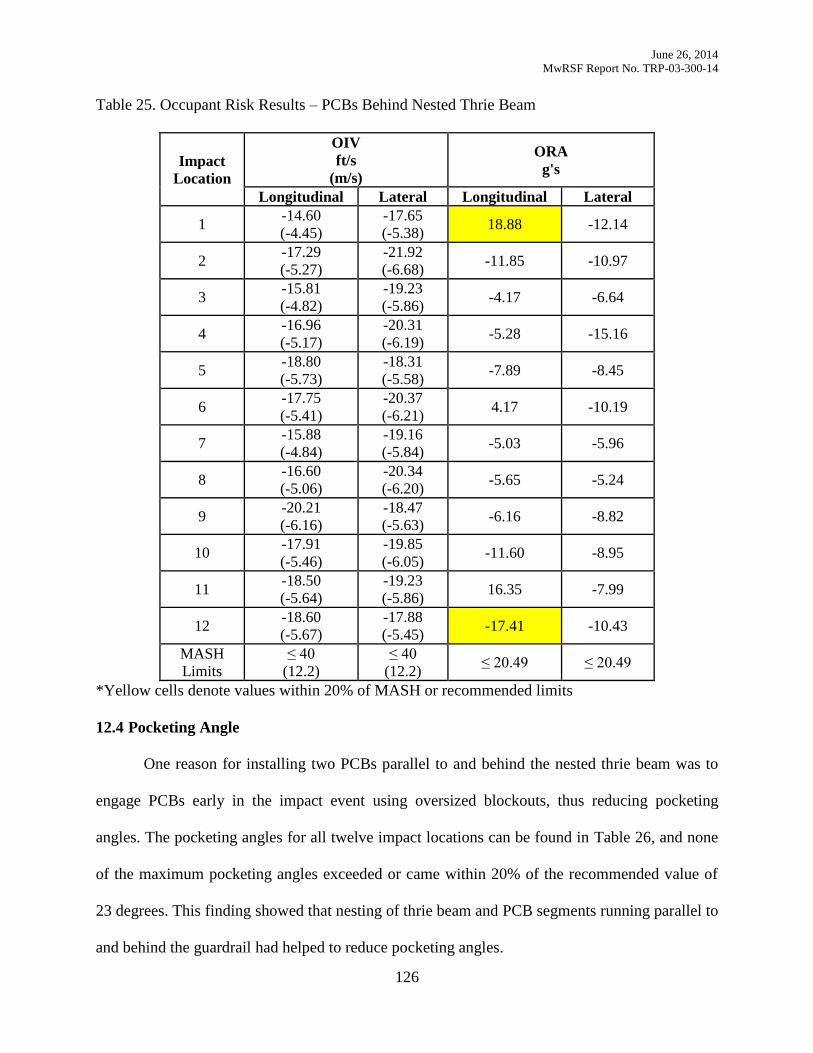
June 26, 2014
MwRSF Report No. TRP-03-300-14
126
Table 25. Occupant Risk Results – PCBs Behind Nested Thrie Beam
Impact
Location
OIV
ft/s
(m/s)
ORA
g's
Longitudinal Lateral Longitudinal Lateral
1 -14.60
(-4.45)
-17.65
(-5.38) 18.88 -12.14
2 -17.29
(-5.27)
-21.92
(-6.68) -11.85 -10.97
3 -15.81
(-4.82)
-19.23
(-5.86) -4.17 -6.64
4 -16.96
(-5.17)
-20.31
(-6.19) -5.28 -15.16
5 -18.80
(-5.73)
-18.31
(-5.58) -7.89 -8.45
6 -17.75
(-5.41)
-20.37
(-6.21) 4.17 -10.19
7 -15.88
(-4.84)
-19.16
(-5.84) -5.03 -5.96
8 -16.60
(-5.06)
-20.34
(-6.20) -5.65 -5.24
9 -20.21
(-6.16)
-18.47
(-5.63) -6.16 -8.82
10 -17.91
(-5.46)
-19.85
(-6.05) -11.60 -8.95
11 -18.50
(-5.64)
-19.23
(-5.86) 16.35 -7.99
12 -18.60
(-5.67)
-17.88
(-5.45) -17.41 -10.43
MASH
Limits
≤ 40
(12.2)
≤ 40
(12.2) ≤ 20.49 ≤ 20.49
*Yellow cells denote values within 20% of MASH or recommended limits
12.4 Pocketing Angle
One reason for installing two PCBs parallel to and behind the nested thrie beam was to
engage PCBs early in the impact event using oversized blockouts, thus reducing pocketing
angles. The pocketing angles for all twelve impact locations can be found in Table 26, and none
of the maximum pocketing angles exceeded or came within 20% of the recommended value of
23 degrees. This finding showed that nesting of thrie beam and PCB segments running parallel to
and behind the guardrail had helped to reduce pocketing angles.
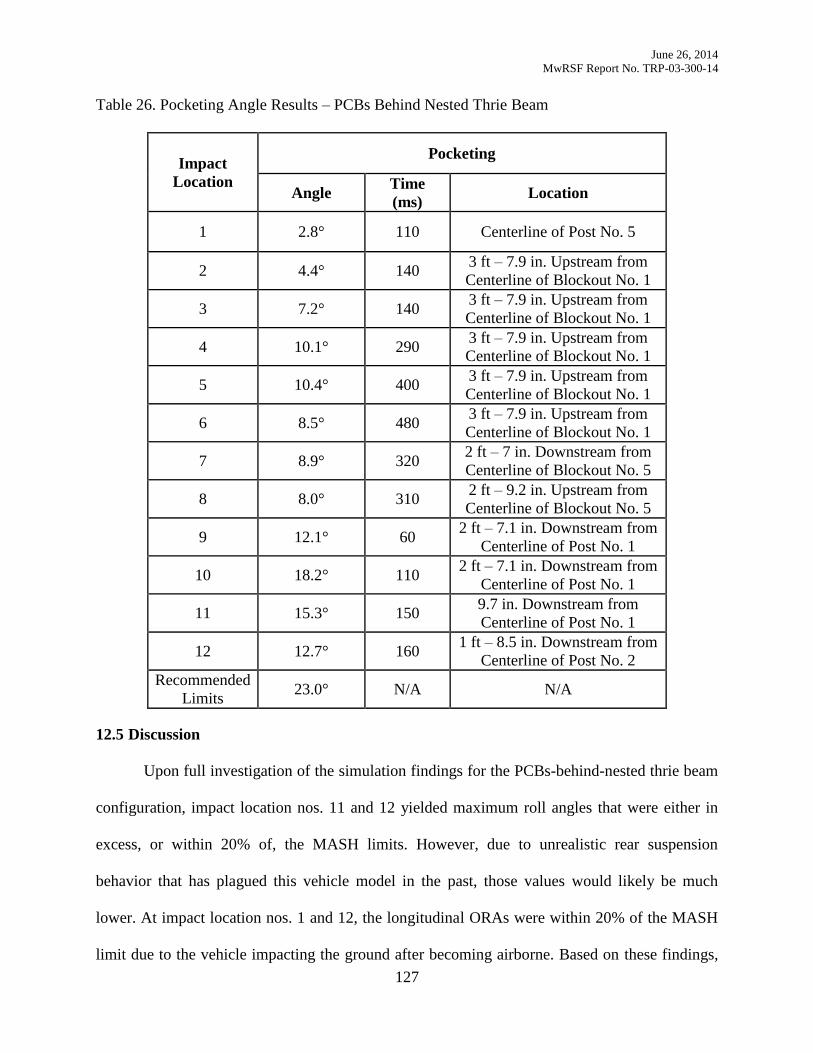
June 26, 2014
MwRSF Report No. TRP-03-300-14
127
Table 26. Pocketing Angle Results – PCBs Behind Nested Thrie Beam
Impact
Location
Pocketing
Angle Time
(ms) Location
1 2.8° 110 Centerline of Post No. 5
2 4.4° 140 3 ft – 7.9 in. Upstream from
Centerline of Blockout No. 1
3 7.2° 140 3 ft – 7.9 in. Upstream from
Centerline of Blockout No. 1
4 10.1° 290 3 ft – 7.9 in. Upstream from
Centerline of Blockout No. 1
5 10.4° 400 3 ft – 7.9 in. Upstream from
Centerline of Blockout No. 1
6 8.5° 480 3 ft – 7.9 in. Upstream from
Centerline of Blockout No. 1
7 8.9° 320 2 ft – 7 in. Downstream from
Centerline of Blockout No. 5
8 8.0° 310 2 ft – 9.2 in. Upstream from
Centerline of Blockout No. 5
9 12.1° 60 2 ft – 7.1 in. Downstream from
Centerline of Post No. 1
10 18.2° 110 2 ft – 7.1 in. Downstream from
Centerline of Post No. 1
11 15.3° 150 9.7 in. Downstream from
Centerline of Post No. 1
12 12.7° 160 1 ft – 8.5 in. Downstream from
Centerline of Post No. 2
Recommended
Limits 23.0° N/A N/A
12.5 Discussion
Upon full investigation of the simulation findings for the PCBs-behind-nested thrie beam
configuration, impact location nos. 11 and 12 yielded maximum roll angles that were either in
excess, or within 20% of, the MASH limits. However, due to unrealistic rear suspension
behavior that has plagued this vehicle model in the past, those values would likely be much
lower. At impact location nos. 1 and 12, the longitudinal ORAs were within 20% of the MASH
limit due to the vehicle impacting the ground after becoming airborne. Based on these findings,
June 26, 2014
MwRSF Report No. TRP-03-300-14
128
researchers had a high amount of confidence that the PCB-behind-guardrail-with-nested thrie
beam configuration would successfully pass MASH criterion. Based on the results found for the
cantilever beam configuration, researchers decided to install a cantilever beam and further
investigate its safety performance.
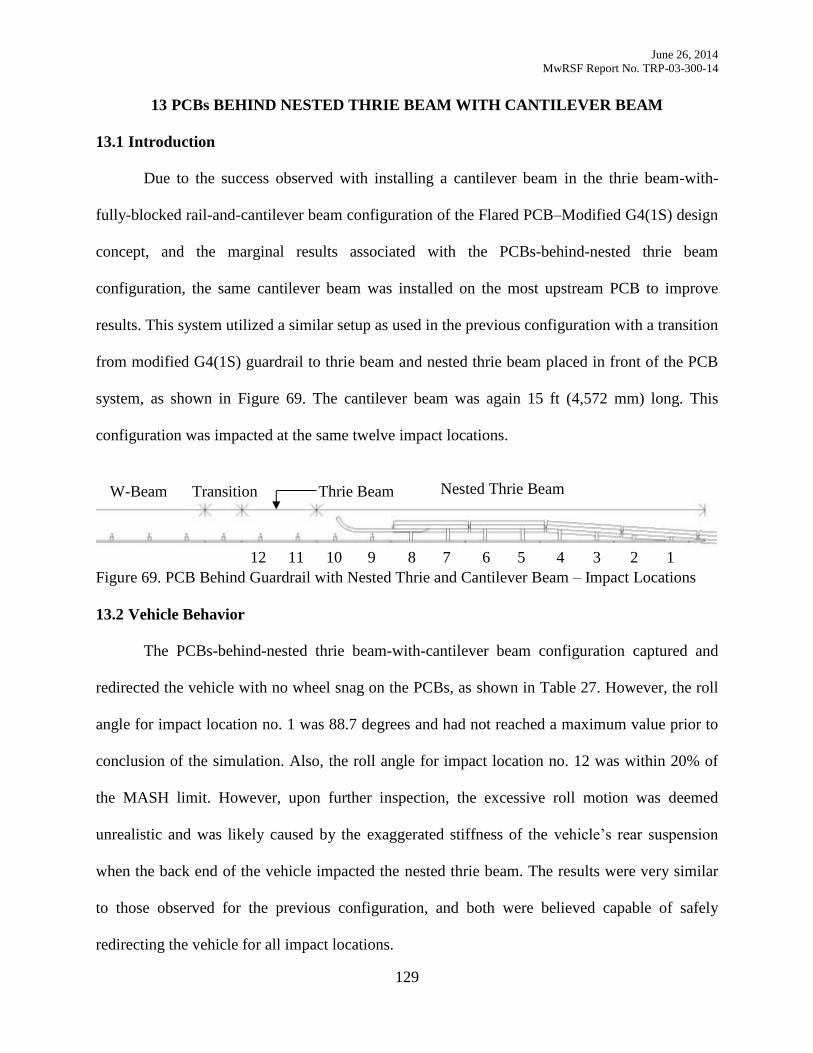
June 26, 2014
MwRSF Report No. TRP-03-300-14
129
PCBs BEHIND NESTED THRIE BEAM WITH CANTILEVER BEAM 13
13.1 Introduction
Due to the success observed with installing a cantilever beam in the thrie beam-with-
fully-blocked rail-and-cantilever beam configuration of the Flared PCB–Modified G4(1S) design
concept, and the marginal results associated with the PCBs-behind-nested thrie beam
configuration, the same cantilever beam was installed on the most upstream PCB to improve
results. This system utilized a similar setup as used in the previous configuration with a transition
from modified G4(1S) guardrail to thrie beam and nested thrie beam placed in front of the PCB
system, as shown in Figure 69. The cantilever beam was again 15 ft (4,572 mm) long. This
configuration was impacted at the same twelve impact locations.
Figure 69. PCB Behind Guardrail with Nested Thrie and Cantilever Beam – Impact Locations
13.2 Vehicle Behavior
The PCBs-behind-nested thrie beam-with-cantilever beam configuration captured and
redirected the vehicle with no wheel snag on the PCBs, as shown in Table 27. However, the roll
angle for impact location no. 1 was 88.7 degrees and had not reached a maximum value prior to
conclusion of the simulation. Also, the roll angle for impact location no. 12 was within 20% of
the MASH limit. However, upon further inspection, the excessive roll motion was deemed
unrealistic and was likely caused by the exaggerated stiffness of the vehicle’s rear suspension
when the back end of the vehicle impacted the nested thrie beam. The results were very similar
to those observed for the previous configuration, and both were believed capable of safely
redirecting the vehicle for all impact locations.
1 2 3 4 5 6 7 8 9 10 11 12
W-Beam Transition Thrie Beam Nested Thrie Beam
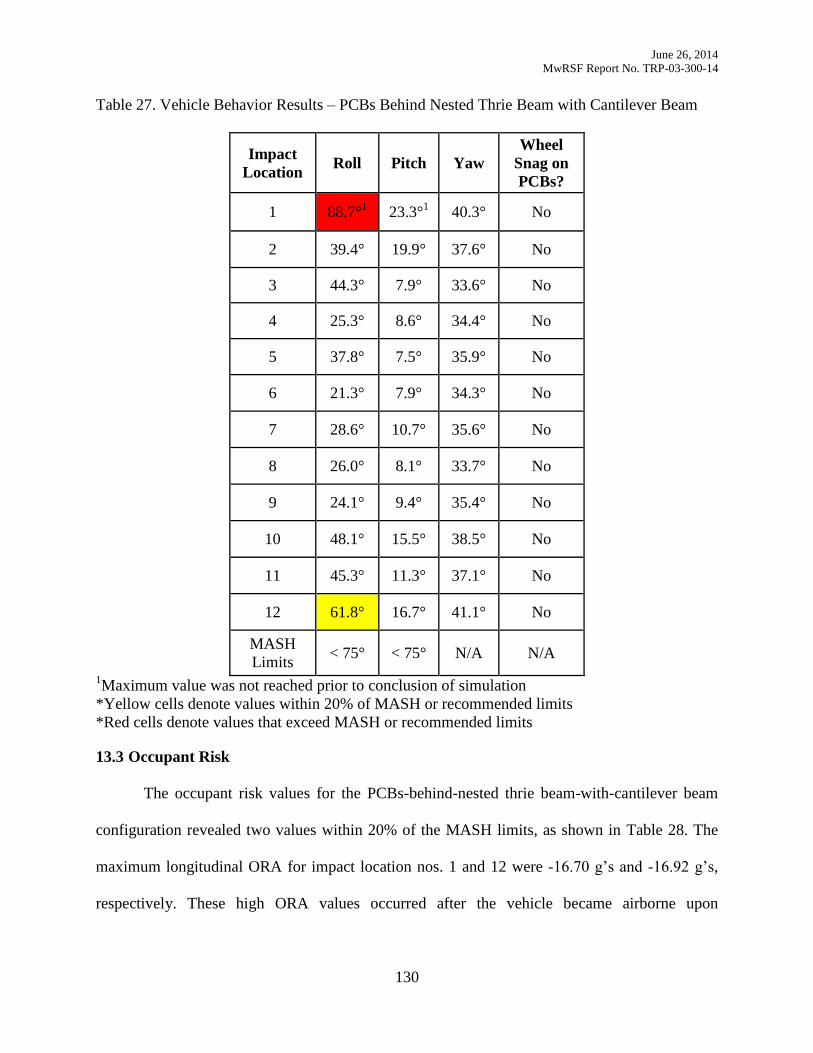
June 26, 2014
MwRSF Report No. TRP-03-300-14
130
Table 27. Vehicle Behavior Results – PCBs Behind Nested Thrie Beam with Cantilever Beam
Impact
Location Roll Pitch Yaw
Wheel
Snag on
PCBs?
1 88.7°1
23.3°1
40.3° No
2 39.4°
19.9° 37.6°
No
3 44.3°
7.9°
33.6°
No
4 25.3°
8.6° 34.4° No
5 37.8°
7.5° 35.9°
No
6 21.3°
7.9°
34.3°
No
7 28.6° 10.7°
35.6°
No
8 26.0° 8.1° 33.7°
No
9 24.1°
9.4° 35.4° No
10 48.1° 15.5° 38.5° No
11 45.3°
11.3° 37.1° No
12 61.8° 16.7° 41.1° No
MASH
Limits < 75° < 75° N/A N/A
1Maximum value was not reached prior to conclusion of simulation
*Yellow cells denote values within 20% of MASH or recommended limits
*Red cells denote values that exceed MASH or recommended limits
13.3 Occupant Risk
The occupant risk values for the PCBs-behind-nested thrie beam-with-cantilever beam
configuration revealed two values within 20% of the MASH limits, as shown in Table 28. The
maximum longitudinal ORA for impact location nos. 1 and 12 were -16.70 g’s and -16.92 g’s,
respectively. These high ORA values occurred after the vehicle became airborne upon
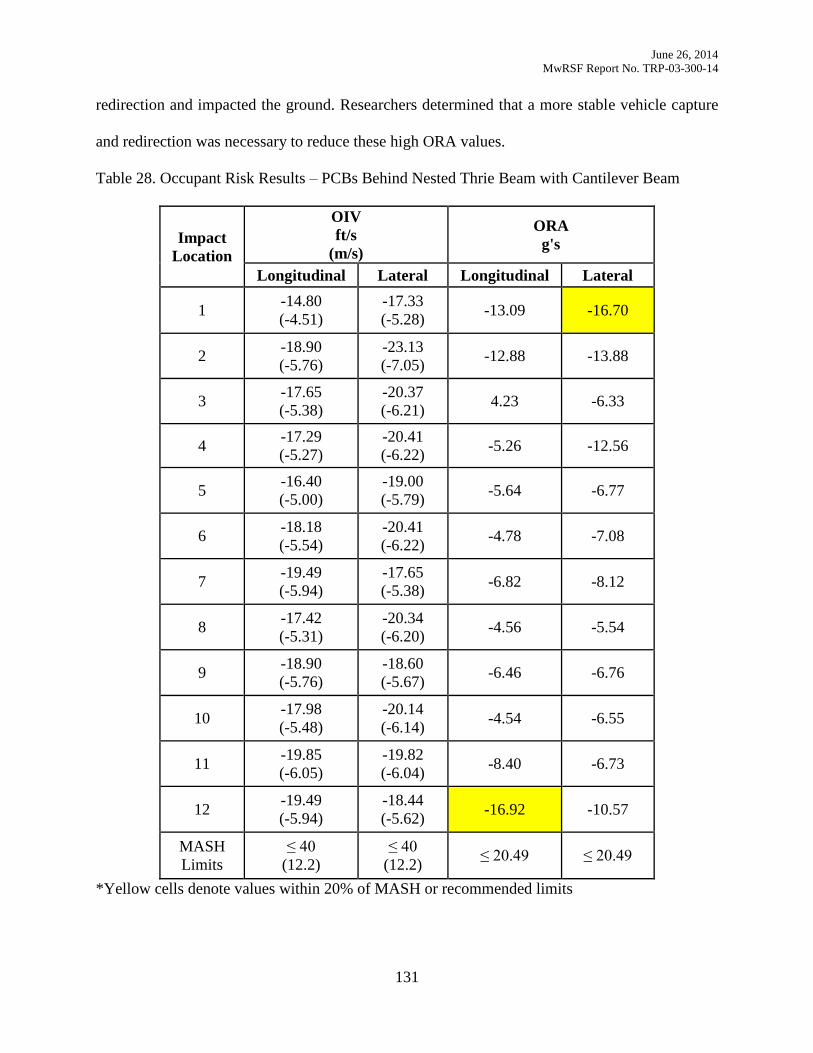
June 26, 2014
MwRSF Report No. TRP-03-300-14
131
redirection and impacted the ground. Researchers determined that a more stable vehicle capture
and redirection was necessary to reduce these high ORA values.
Table 28. Occupant Risk Results – PCBs Behind Nested Thrie Beam with Cantilever Beam
Impact
Location
OIV
ft/s
(m/s)
ORA
g's
Longitudinal Lateral Longitudinal Lateral
1 -14.80
(-4.51)
-17.33
(-5.28) -13.09 -16.70
2 -18.90
(-5.76)
-23.13
(-7.05) -12.88 -13.88
3 -17.65
(-5.38)
-20.37
(-6.21) 4.23 -6.33
4 -17.29
(-5.27)
-20.41
(-6.22) -5.26 -12.56
5 -16.40
(-5.00)
-19.00
(-5.79) -5.64 -6.77
6 -18.18
(-5.54)
-20.41
(-6.22) -4.78 -7.08
7 -19.49
(-5.94)
-17.65
(-5.38) -6.82 -8.12
8 -17.42
(-5.31)
-20.34
(-6.20) -4.56 -5.54
9 -18.90
(-5.76)
-18.60
(-5.67) -6.46 -6.76
10 -17.98
(-5.48)
-20.14
(-6.14) -4.54 -6.55
11 -19.85
(-6.05)
-19.82
(-6.04) -8.40 -6.73
12 -19.49
(-5.94)
-18.44
(-5.62) -16.92 -10.57
MASH
Limits
≤ 40
(12.2)
≤ 40
(12.2) ≤ 20.49 ≤ 20.49
*Yellow cells denote values within 20% of MASH or recommended limits
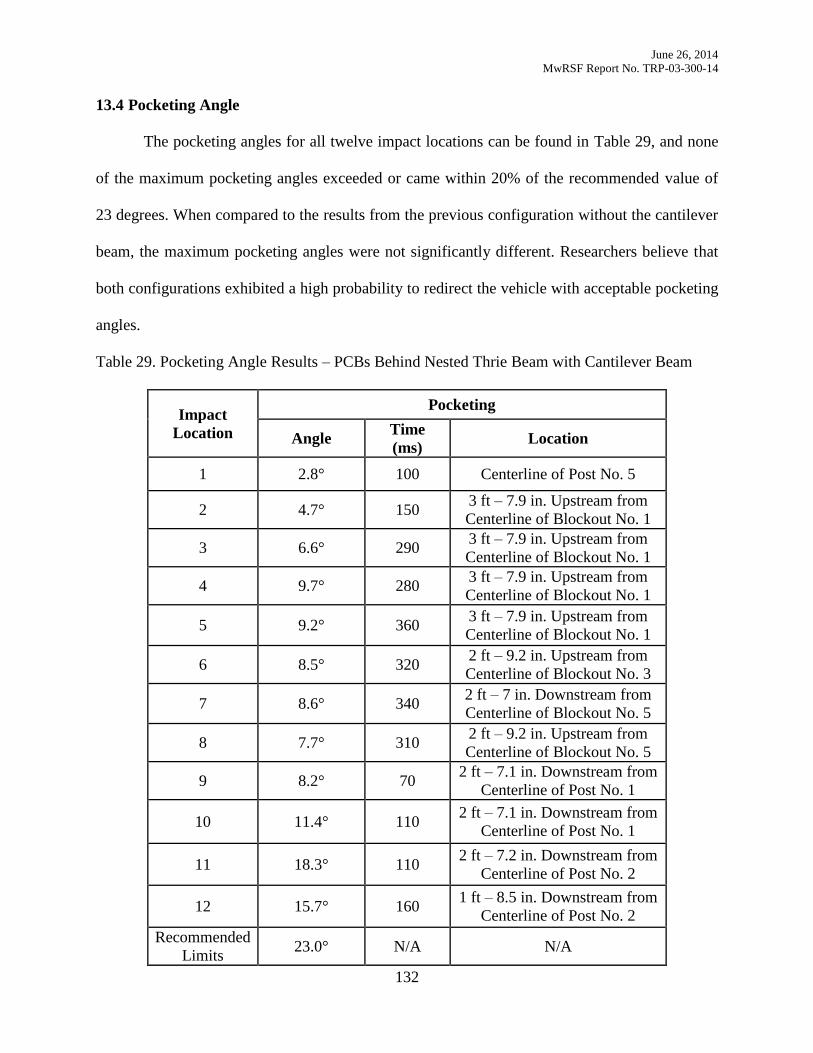
June 26, 2014
MwRSF Report No. TRP-03-300-14
132
13.4 Pocketing Angle
The pocketing angles for all twelve impact locations can be found in Table 29, and none
of the maximum pocketing angles exceeded or came within 20% of the recommended value of
23 degrees. When compared to the results from the previous configuration without the cantilever
beam, the maximum pocketing angles were not significantly different. Researchers believe that
both configurations exhibited a high probability to redirect the vehicle with acceptable pocketing
angles.
Table 29. Pocketing Angle Results – PCBs Behind Nested Thrie Beam with Cantilever Beam
Impact
Location
Pocketing
Angle Time
(ms) Location
1 2.8° 100 Centerline of Post No. 5
2 4.7° 150 3 ft – 7.9 in. Upstream from
Centerline of Blockout No. 1
3 6.6° 290 3 ft – 7.9 in. Upstream from
Centerline of Blockout No. 1
4 9.7° 280 3 ft – 7.9 in. Upstream from
Centerline of Blockout No. 1
5 9.2° 360 3 ft – 7.9 in. Upstream from
Centerline of Blockout No. 1
6 8.5° 320 2 ft – 9.2 in. Upstream from
Centerline of Blockout No. 3
7 8.6° 340 2 ft – 7 in. Downstream from
Centerline of Blockout No. 5
8 7.7° 310 2 ft – 9.2 in. Upstream from
Centerline of Blockout No. 5
9 8.2° 70 2 ft – 7.1 in. Downstream from
Centerline of Post No. 1
10 11.4° 110 2 ft – 7.1 in. Downstream from
Centerline of Post No. 1
11 18.3° 110 2 ft – 7.2 in. Downstream from
Centerline of Post No. 2
12 15.7° 160 1 ft – 8.5 in. Downstream from
Centerline of Post No. 2
Recommended
Limits 23.0° N/A N/A
June 26, 2014
MwRSF Report No. TRP-03-300-14
133
13.5 Discussion
Upon full investigation of the simulation findings for the PCBs-behind-nested thrie
beam-with-cantilever beam configuration, impact location nos. 1 and 12 yielded maximum roll
angles that were either in excess of or within 20% of the MASH limits. However, due to
unrealistic rear suspension behavior that has plagued this vehicle model in the past, those values
would likely be much lower. At impact location nos. 1 and 12, the longitudinal ORA were within
20% of the MASH limit due to the vehicle impacting the ground after becoming airborne. The
maximum pocketing angles for all twelve impact locations were very comparable to the results
observed for the previous configuration. Thus, the installation of the cantilever beam did not
significantly improve the results of the transition and was an unnecessary addition.
June 26, 2014
MwRSF Report No. TRP-03-300-14
134
SIMULATION RESULTS DISCUSSION 14
14.1 Introduction
Following simulation of the Flared PCB–Modified G4(1S) design concept, the Parallel
PCB–Modified G4(1S) design concept, and subsequent configurations, MwRSF researchers
reviewed and ranked each configuration within each design concept based on metrics for vehicle
behavior, occupant risk, and rail pocketing. These rankings were presented to and discussed with
the TAC for future consideration.
14.2 Flared PCB–Modified G4(1S) Design Concept
The Flared PCB–Modified G4(1S) design concept utilized an attachment of the modified
G4(1S) directly to the 15H:1V flared F-shape PCB system using a W-beam end-shoe connection.
Researchers quickly realized that the modified G4(1S) system lacked the height and stiffness to
safely capture and redirect the vehicle without rail pocketing concerns. Thus, a transition to thrie
beam was included in the design, which yielded improved vehicle stability. However, posts had a
tendency to wedge against the PCBs and caused elevated occupant risk values, and rail pocketing
angles were also high. Posts were removed due to their tendency to wedge against PCBs.
Blockouts were installed at a standard 6-ft 3-in. (1,905 mm) post spacing in the next
configuration.
The thrie beam-with-fully-blocked rail configuration yielded results with improved
vehicle stability and occupant risk values but with high rail pocketing values. The pocketing
behavior was caused by slow displacement of the PCBs at the beginning of the simulation.
Therefore, the next configuration included a cantilever beam that was attached to the front face
of the PCB system, which was intended to initiate PCB displacement when impacted by rotated
posts within the thrie beam system. This configuration yielded similar vehicle stability and
occupant risk values to the configuration without the cantilever beam, but the cantilever beam
June 26, 2014
MwRSF Report No. TRP-03-300-14
135
helped to improve pocketing angles. However, there were still two impact locations that yielded
marginal pocketing angles. Thus, researchers nested the thrie beam in front of the PCBs. The
nesting of the rail was intended to stiffen the guardrail system ahead of the PCB system and
lower the rail pocketing angles.
The nested thrie beam-with-fully-blocked rail configuration yielded improved pocketing
angles, and only one impact location had a pocketing angle of marginal concern. Based on these
results, the Flared PCB–Modified G4(1S) configurations were ranked, as shown below:
(1) Nested Thrie Beam with Fully-Blocked Rail,
(2) Thrie Beam with Fully-Blocked Rail and Cantilever Beam,
(3) Thrie Beam End-Shoe,
(4) Thrie Beam with Fully-Blocked Rail, and
(5) Modified G4(1S) End-Shoe.
14.3 Parallel PCB–Modified G4(1S) Design Concept
The Parallel PCB–Modified G4(1S) design concept involved the modified G4(1S)
guardrail system attaching to the 15H:1V flared PCB system with two PCB segments placed
parallel to and behind the modified G4(1S) system. The guardrail posts within the modified
G4(1S) system remained in front of PCB segments placed parallel to and behind the guardrail
and were intended to initiate PCB displacement after rotation. Based on findings obtained for the
first design concept and using engineering judgment, modifications were implemented into the
initial configuration. The rail height of the modified G4(1S) guardrail system proved incapable
of vehicle capture and redirection, and it was transitioned to thrie beam. Also, the single thrie
beam yielded high rail pocketing angles, so nested thrie beam was installed in front of the PCB
system. Also, guardrail posts installed in front of the PCB system showed a tendency to wedge
against PCBs and cause vehicle instabilities as well as elevated occupant risk values. Therefore,
June 26, 2014
MwRSF Report No. TRP-03-300-14
136
all of the guardrail posts installed in front of PCBs were removed, and blockouts were installed
behind the nested thrie beam at standard 6-ft 3-in. (1,905 mm) centers. The nested thrie beam-
with-fully-blocked rail configuration yielded two marginal longitudinal ORA values but with
acceptable vehicle stability and rail pocketing angles. In an attempt to improve the simulation
results, a cantilever beam was installed to the front face of the most upstream PCB. This
configuration yielded similar results for the vehicle behavior, occupant risk, and rail pocketing.
Thus, it was concluded that the cantilever beam did not significantly improve the transition
system and should not be used. Therefore, the Parallel PCB–Modified G4(1S) configurations
were ranked in this order:
(1) PCBs Behind Nested Thrie Beam and
(2) PCBs Behind Nested Thrie Beam with Cantilever Beam
14.4 Transition Design Discussion
These findings were presented to the TAC members. It was recommended that both the
nested-thrie beam-with-fully-blocked rail configuration and the PCBs behind nested thrie beam
configuration would have the highest likelihood of successfully meeting TL-3 of MASH. It was
also noted that the thrie beam-with-fully-blocked rail and cantilever beam-and-thrie beam-end-
shoe connection configurations, along with the PCBs-behind-nested thrie beam-with-cantilever
beam configuration also had a high likelihood of meeting TL-3 of MASH. The thrie beam-with-
fully-blocked rail configuration had a marginal likelihood of meeting TL-3 of MASH. Finally,
the modified G4(1S) end-shoe configuration had a low likelihood of meeting TL-3 of MASH.
Once the simulation results for the first two design concepts were presented to the TAC
members with rankings and recommendations, a discussion about feasibility and complexity
followed. Concerns were raised by the TAC members that the some of the configurations were
overly complex and labor intensive. Therefore, the TAC members recommended that the
June 26, 2014
MwRSF Report No. TRP-03-300-14
137
modified G4(1S) be replaced with MGS. It was predicted that the taller top mounting height of
the MGS would aid in vehicle capture and redirection and not require a transition to thrie beam.
Other TAC recommendations included the installation of blockouts to the back of the guardrail
posts installed in front of the PCB system in order to engage the PCBs earlier in the impact event
and initiate PCB displacement. Another TAC recommendation was to install a blockout from the
back of the guardrail post to the front of the cantilever beam. Therefore, a simulation study was
conducted on a transition system that included MGS instead of modified G4(1S) guardrail.
14.5 Flared PCB–MGS Design Concept
Based on the concern that was expressed about the complexity of installing thrie beam,
nested rail, and a cantilever beam in the first two design concepts, researchers explored the
option of using the 31-in. (787-mm) tall MGS. Researchers believed that an increased top-rail
height would improve vehicle capture and redirection. Similar to the Flared PCB–Modified
G4(1S) design concept, the MGS was attached to the 15H:1V flared F-shape PCB system using a
W-beam end-shoe connection. The 15H:1V flared PCB system extended behind the guardrail
system, as shown in Figure 70. The two posts that remained in front of the PCBs were intended
to aid in PCB displacement. Upon impact, the posts were expected to rotate backward into the
PCBs and initiate PCB displacement, which would reduce vehicle climb and instabilities. Based
on the results, several modifications could be made to the transition system to improve its
likelihood of success. These modifications included: blockouts installed from the back of
guardrail posts to PCBs, installation of a cantilever beam on the front face of the most upstream
PCB, blockouts installed from the back of guardrail posts to the cantilever beam, nesting of rail
components, removal of posts in front of PCBs, and installation of blockouts between rail and
PCBs.
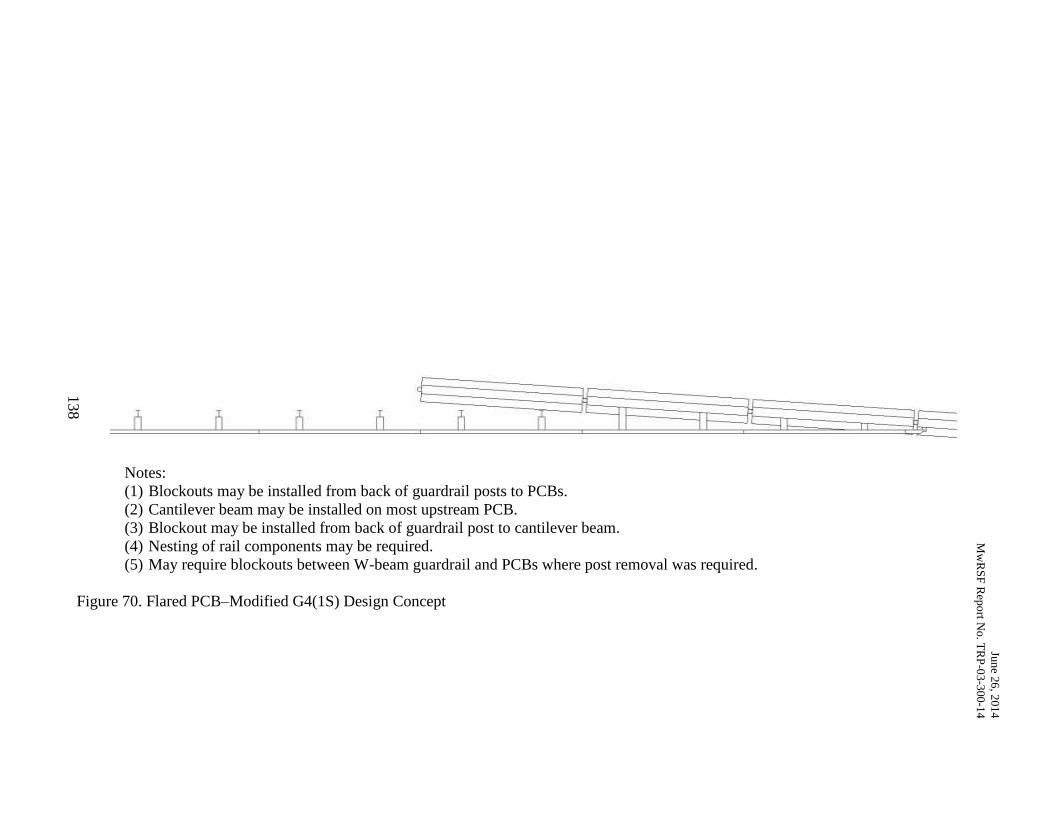
Jun
e 26
, 201
4
Mw
RS
F R
epo
rt No. T
RP
-03
-300-1
4
138
Notes:
(1) Blockouts may be installed from back of guardrail posts to PCBs.
(2) Cantilever beam may be installed on most upstream PCB.
(3) Blockout may be installed from back of guardrail post to cantilever beam.
(4) Nesting of rail components may be required.
(5) May require blockouts between W-beam guardrail and PCBs where post removal was required.
Figure 70. Flared PCB–Modified G4(1S) Design Concept
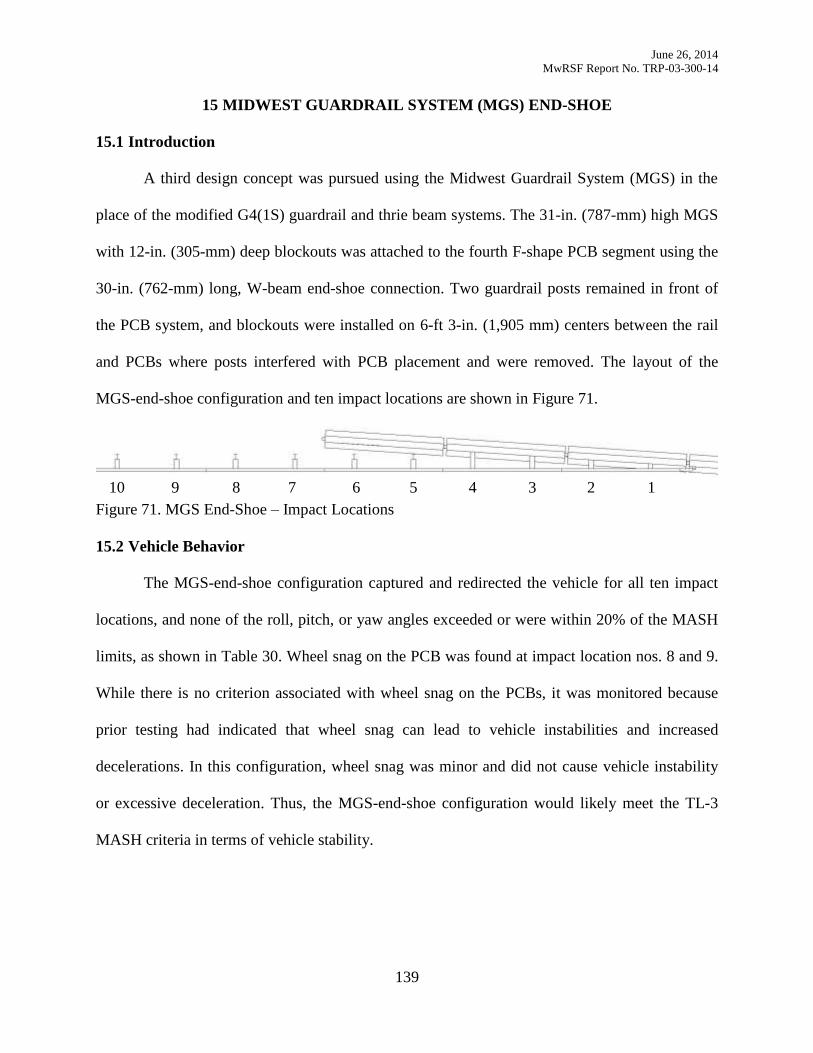
June 26, 2014
MwRSF Report No. TRP-03-300-14
139
MIDWEST GUARDRAIL SYSTEM (MGS) END-SHOE 15
15.1 Introduction
A third design concept was pursued using the Midwest Guardrail System (MGS) in the
place of the modified G4(1S) guardrail and thrie beam systems. The 31-in. (787-mm) high MGS
with 12-in. (305-mm) deep blockouts was attached to the fourth F-shape PCB segment using the
30-in. (762-mm) long, W-beam end-shoe connection. Two guardrail posts remained in front of
the PCB system, and blockouts were installed on 6-ft 3-in. (1,905 mm) centers between the rail
and PCBs where posts interfered with PCB placement and were removed. The layout of the
MGS-end-shoe configuration and ten impact locations are shown in Figure 71.
Figure 71. MGS End-Shoe – Impact Locations
15.2 Vehicle Behavior
The MGS-end-shoe configuration captured and redirected the vehicle for all ten impact
locations, and none of the roll, pitch, or yaw angles exceeded or were within 20% of the MASH
limits, as shown in Table 30. Wheel snag on the PCB was found at impact location nos. 8 and 9.
While there is no criterion associated with wheel snag on the PCBs, it was monitored because
prior testing had indicated that wheel snag can lead to vehicle instabilities and increased
decelerations. In this configuration, wheel snag was minor and did not cause vehicle instability
or excessive deceleration. Thus, the MGS-end-shoe configuration would likely meet the TL-3
MASH criteria in terms of vehicle stability.
1 2 3 4 5 6 7 8 9 10
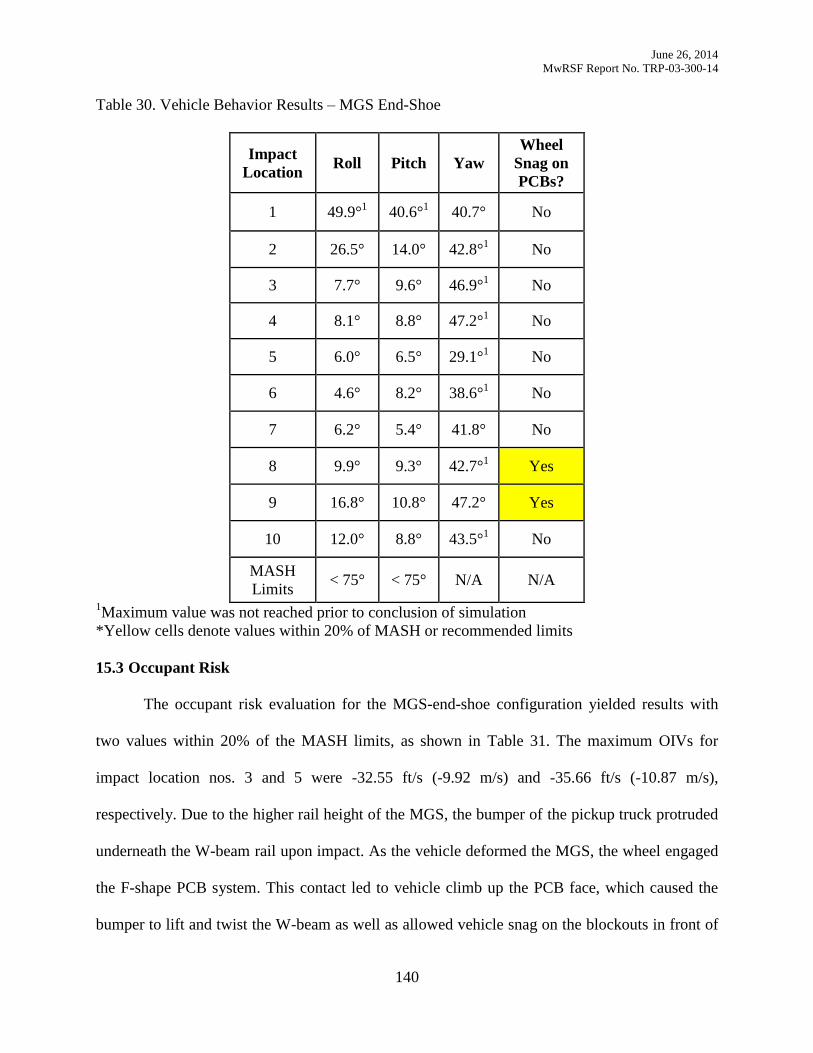
June 26, 2014
MwRSF Report No. TRP-03-300-14
140
Table 30. Vehicle Behavior Results – MGS End-Shoe
Impact
Location Roll Pitch Yaw
Wheel
Snag on
PCBs?
1 49.9°1
40.6°1
40.7° No
2 26.5°
14.0° 42.8°1
No
3 7.7°
9.6°
46.9°1
No
4 8.1°
8.8° 47.2°1
No
5 6.0°
6.5° 29.1°1
No
6 4.6°
8.2°
38.6°1
No
7 6.2° 5.4°
41.8°
No
8 9.9° 9.3° 42.7°1
Yes
9 16.8°
10.8° 47.2° Yes
10 12.0° 8.8° 43.5°1
No
MASH
Limits < 75° < 75° N/A N/A
1Maximum value was not reached prior to conclusion of simulation
*Yellow cells denote values within 20% of MASH or recommended limits
15.3 Occupant Risk
The occupant risk evaluation for the MGS-end-shoe configuration yielded results with
two values within 20% of the MASH limits, as shown in Table 31. The maximum OIVs for
impact location nos. 3 and 5 were -32.55 ft/s (-9.92 m/s) and -35.66 ft/s (-10.87 m/s),
respectively. Due to the higher rail height of the MGS, the bumper of the pickup truck protruded
underneath the W-beam rail upon impact. As the vehicle deformed the MGS, the wheel engaged
the F-shape PCB system. This contact led to vehicle climb up the PCB face, which caused the
bumper to lift and twist the W-beam as well as allowed vehicle snag on the blockouts in front of
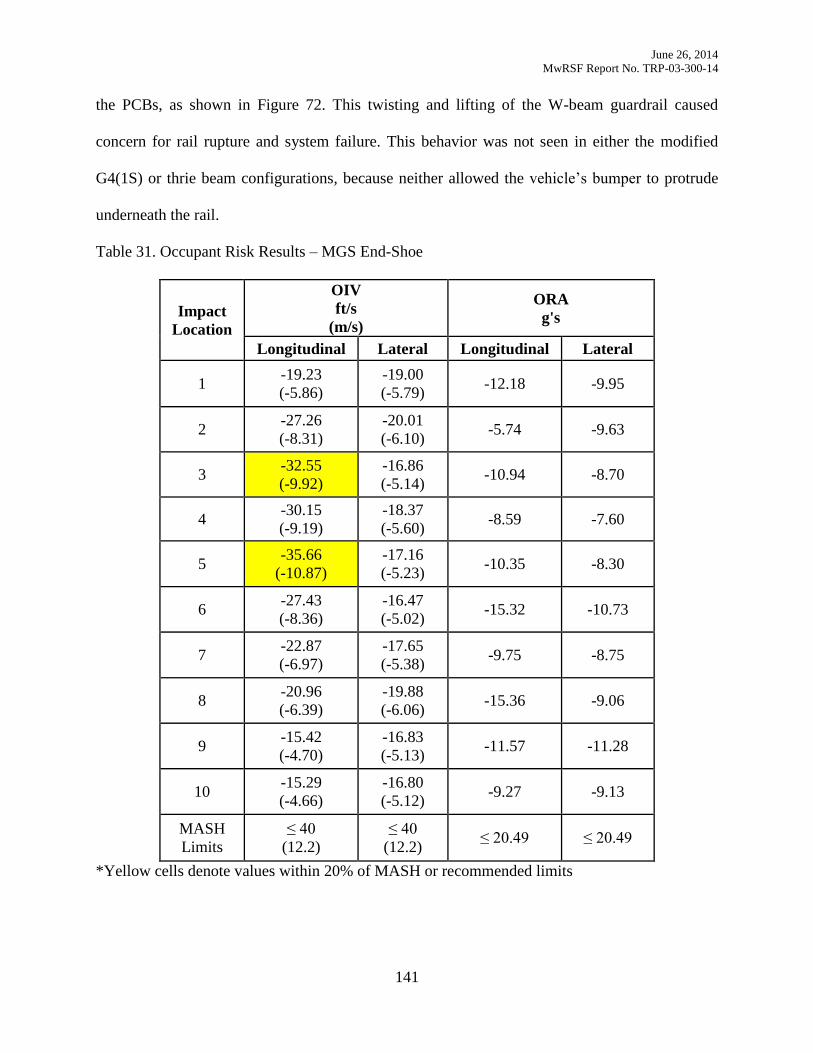
June 26, 2014
MwRSF Report No. TRP-03-300-14
141
the PCBs, as shown in Figure 72. This twisting and lifting of the W-beam guardrail caused
concern for rail rupture and system failure. This behavior was not seen in either the modified
G4(1S) or thrie beam configurations, because neither allowed the vehicle’s bumper to protrude
underneath the rail.
Table 31. Occupant Risk Results – MGS End-Shoe
Impact
Location
OIV
ft/s
(m/s)
ORA
g's
Longitudinal Lateral Longitudinal Lateral
1 -19.23
(-5.86)
-19.00
(-5.79) -12.18 -9.95
2 -27.26
(-8.31)
-20.01
(-6.10) -5.74 -9.63
3 -32.55
(-9.92)
-16.86
(-5.14) -10.94 -8.70
4 -30.15
(-9.19)
-18.37
(-5.60) -8.59 -7.60
5 -35.66
(-10.87)
-17.16
(-5.23) -10.35 -8.30
6 -27.43
(-8.36)
-16.47
(-5.02) -15.32 -10.73
7 -22.87
(-6.97)
-17.65
(-5.38) -9.75 -8.75
8 -20.96
(-6.39)
-19.88
(-6.06) -15.36 -9.06
9 -15.42
(-4.70)
-16.83
(-5.13) -11.57 -11.28
10 -15.29
(-4.66)
-16.80
(-5.12) -9.27 -9.13
MASH
Limits
≤ 40
(12.2)
≤ 40
(12.2) ≤ 20.49 ≤ 20.49
*Yellow cells denote values within 20% of MASH or recommended limits
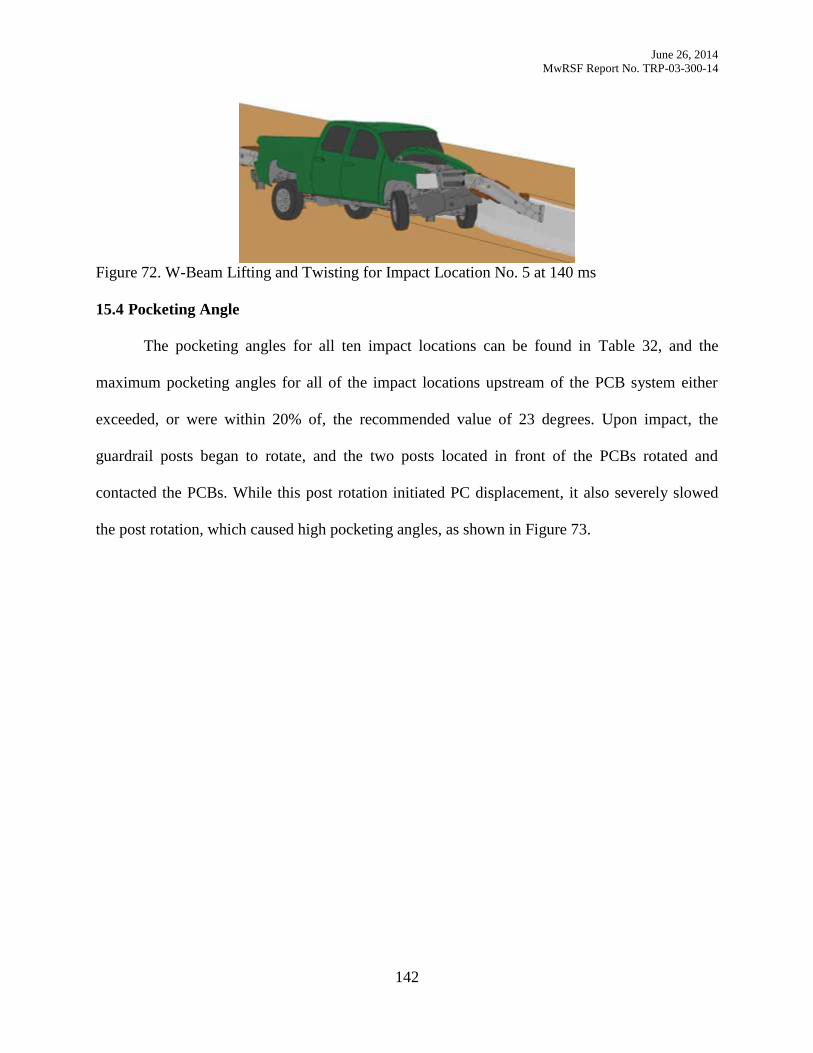
June 26, 2014
MwRSF Report No. TRP-03-300-14
142
Figure 72. W-Beam Lifting and Twisting for Impact Location No. 5 at 140 ms
15.4 Pocketing Angle
The pocketing angles for all ten impact locations can be found in Table 32, and the
maximum pocketing angles for all of the impact locations upstream of the PCB system either
exceeded, or were within 20% of, the recommended value of 23 degrees. Upon impact, the
guardrail posts began to rotate, and the two posts located in front of the PCBs rotated and
contacted the PCBs. While this post rotation initiated PC displacement, it also severely slowed
the post rotation, which caused high pocketing angles, as shown in Figure 73.
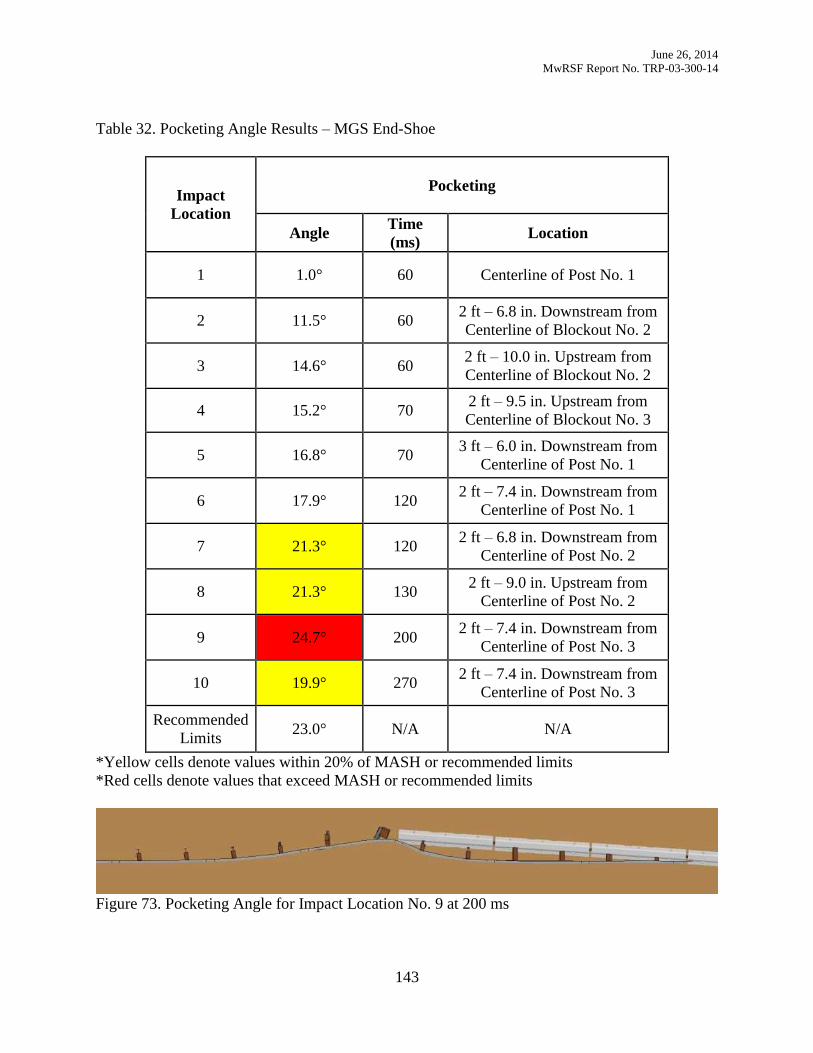
June 26, 2014
MwRSF Report No. TRP-03-300-14
143
Table 32. Pocketing Angle Results – MGS End-Shoe
Impact
Location
Pocketing
Angle Time
(ms) Location
1 1.0° 60 Centerline of Post No. 1
2 11.5° 60 2 ft – 6.8 in. Downstream from
Centerline of Blockout No. 2
3 14.6° 60 2 ft – 10.0 in. Upstream from
Centerline of Blockout No. 2
4 15.2° 70 2 ft – 9.5 in. Upstream from
Centerline of Blockout No. 3
5 16.8° 70 3 ft – 6.0 in. Downstream from
Centerline of Post No. 1
6 17.9° 120 2 ft – 7.4 in. Downstream from
Centerline of Post No. 1
7 21.3° 120 2 ft – 6.8 in. Downstream from
Centerline of Post No. 2
8 21.3° 130 2 ft – 9.0 in. Upstream from
Centerline of Post No. 2
9 24.7° 200 2 ft – 7.4 in. Downstream from
Centerline of Post No. 3
10 19.9° 270 2 ft – 7.4 in. Downstream from
Centerline of Post No. 3
Recommended
Limits 23.0° N/A N/A
*Yellow cells denote values within 20% of MASH or recommended limits
*Red cells denote values that exceed MASH or recommended limits
Figure 73. Pocketing Angle for Impact Location No. 9 at 200 ms
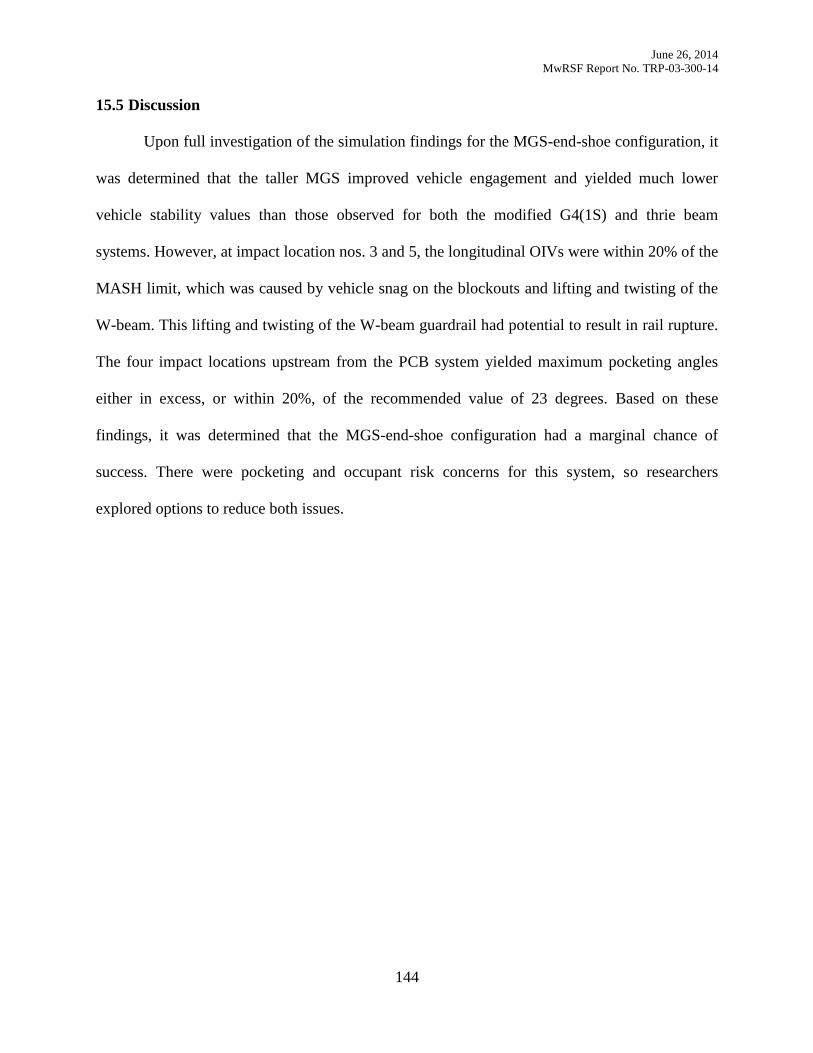
June 26, 2014
MwRSF Report No. TRP-03-300-14
144
15.5 Discussion
Upon full investigation of the simulation findings for the MGS-end-shoe configuration, it
was determined that the taller MGS improved vehicle engagement and yielded much lower
vehicle stability values than those observed for both the modified G4(1S) and thrie beam
systems. However, at impact location nos. 3 and 5, the longitudinal OIVs were within 20% of the
MASH limit, which was caused by vehicle snag on the blockouts and lifting and twisting of the
W-beam. This lifting and twisting of the W-beam guardrail had potential to result in rail rupture.
The four impact locations upstream from the PCB system yielded maximum pocketing angles
either in excess, or within 20%, of the recommended value of 23 degrees. Based on these
findings, it was determined that the MGS-end-shoe configuration had a marginal chance of
success. There were pocketing and occupant risk concerns for this system, so researchers
explored options to reduce both issues.
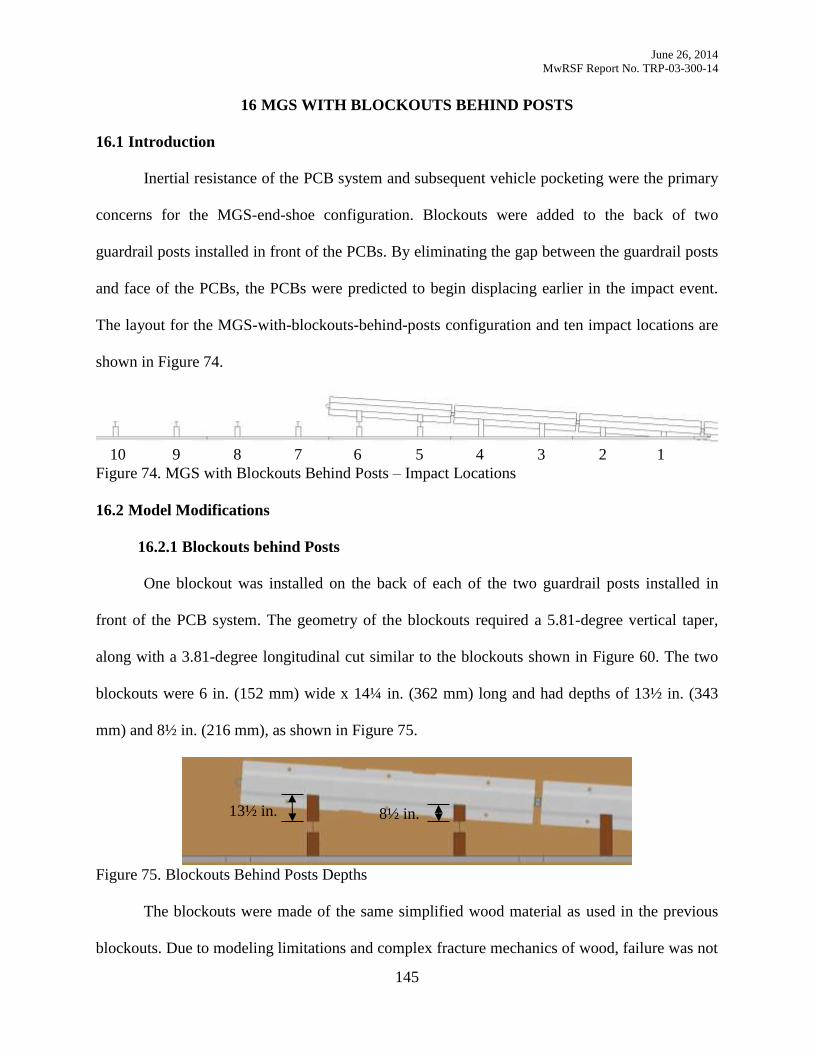
June 26, 2014
MwRSF Report No. TRP-03-300-14
145
MGS WITH BLOCKOUTS BEHIND POSTS 16
16.1 Introduction
Inertial resistance of the PCB system and subsequent vehicle pocketing were the primary
concerns for the MGS-end-shoe configuration. Blockouts were added to the back of two
guardrail posts installed in front of the PCBs. By eliminating the gap between the guardrail posts
and face of the PCBs, the PCBs were predicted to begin displacing earlier in the impact event.
The layout for the MGS-with-blockouts-behind-posts configuration and ten impact locations are
shown in Figure 74.
Figure 74. MGS with Blockouts Behind Posts – Impact Locations
16.2 Model Modifications
16.2.1 Blockouts behind Posts
One blockout was installed on the back of each of the two guardrail posts installed in
front of the PCB system. The geometry of the blockouts required a 5.81-degree vertical taper,
along with a 3.81-degree longitudinal cut similar to the blockouts shown in Figure 60. The two
blockouts were 6 in. (152 mm) wide x 14¼ in. (362 mm) long and had depths of 13½ in. (343
mm) and 8½ in. (216 mm), as shown in Figure 75.
Figure 75. Blockouts Behind Posts Depths
The blockouts were made of the same simplified wood material as used in the previous
blockouts. Due to modeling limitations and complex fracture mechanics of wood, failure was not
1 2 3 4 5 6 7 8 9 10
13½ in. 8½ in.
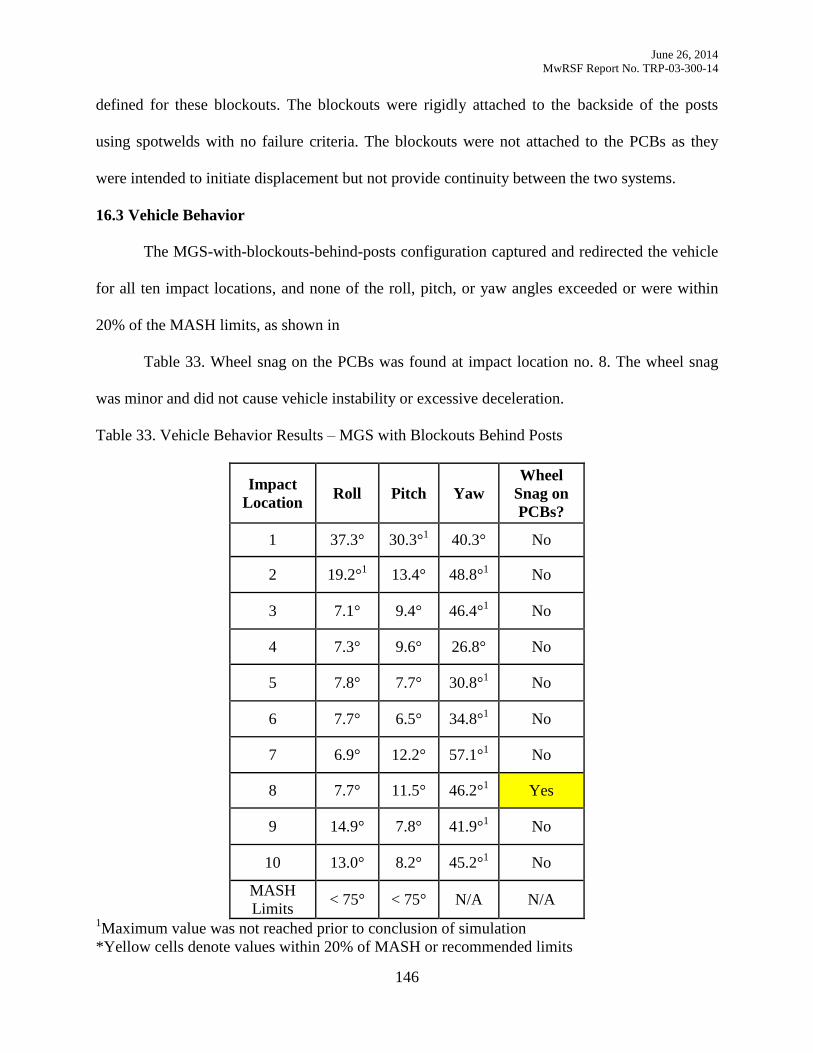
June 26, 2014
MwRSF Report No. TRP-03-300-14
146
defined for these blockouts. The blockouts were rigidly attached to the backside of the posts
using spotwelds with no failure criteria. The blockouts were not attached to the PCBs as they
were intended to initiate displacement but not provide continuity between the two systems.
16.3 Vehicle Behavior
The MGS-with-blockouts-behind-posts configuration captured and redirected the vehicle
for all ten impact locations, and none of the roll, pitch, or yaw angles exceeded or were within
20% of the MASH limits, as shown in
Table 33. Wheel snag on the PCBs was found at impact location no. 8. The wheel snag
was minor and did not cause vehicle instability or excessive deceleration.
Table 33. Vehicle Behavior Results – MGS with Blockouts Behind Posts
Impact
Location Roll Pitch Yaw
Wheel
Snag on
PCBs?
1 37.3°
30.3°1
40.3° No
2 19.2°1
13.4° 48.8°1
No
3 7.1°
9.4°
46.4°1
No
4 7.3°
9.6° 26.8°
No
5 7.8°
7.7° 30.8°1
No
6 7.7°
6.5°
34.8°1
No
7 6.9° 12.2°
57.1°1
No
8 7.7° 11.5° 46.2°1
Yes
9 14.9°
7.8° 41.9°1
No
10 13.0° 8.2° 45.2°1
No
MASH
Limits < 75° < 75° N/A N/A
1Maximum value was not reached prior to conclusion of simulation
*Yellow cells denote values within 20% of MASH or recommended limits
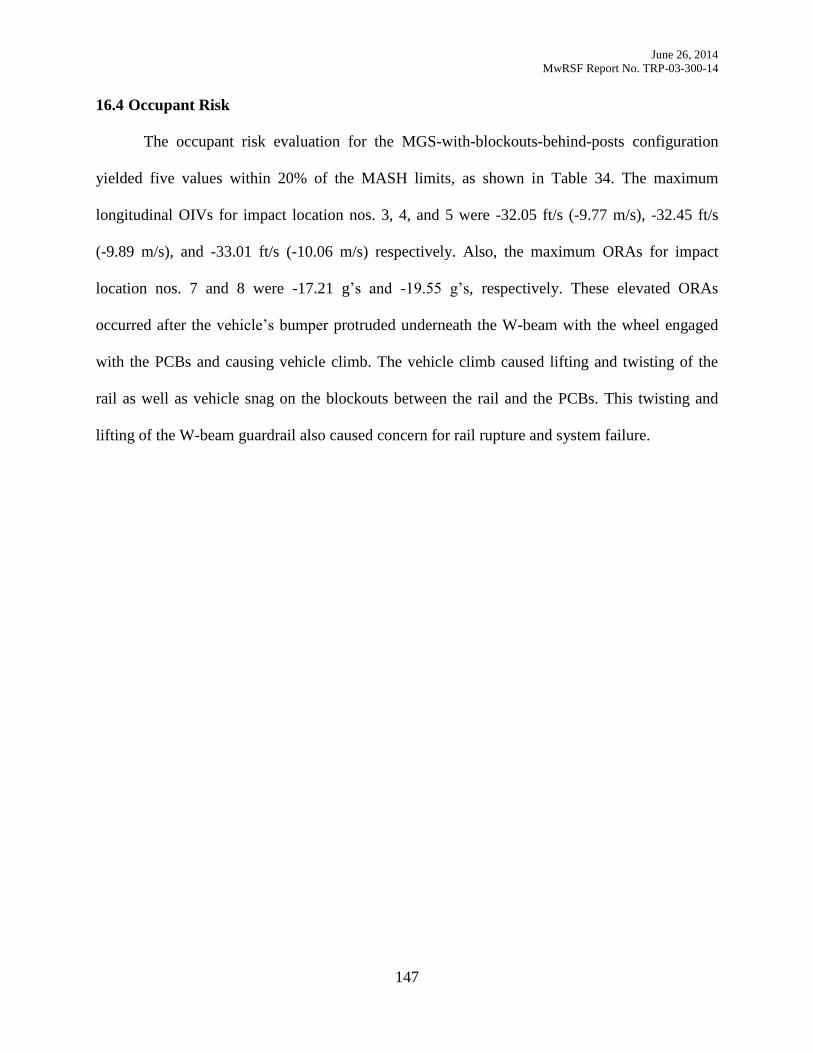
June 26, 2014
MwRSF Report No. TRP-03-300-14
147
16.4 Occupant Risk
The occupant risk evaluation for the MGS-with-blockouts-behind-posts configuration
yielded five values within 20% of the MASH limits, as shown in Table 34. The maximum
longitudinal OIVs for impact location nos. 3, 4, and 5 were -32.05 ft/s (-9.77 m/s), -32.45 ft/s
(-9.89 m/s), and -33.01 ft/s (-10.06 m/s) respectively. Also, the maximum ORAs for impact
location nos. 7 and 8 were -17.21 g’s and -19.55 g’s, respectively. These elevated ORAs
occurred after the vehicle’s bumper protruded underneath the W-beam with the wheel engaged
with the PCBs and causing vehicle climb. The vehicle climb caused lifting and twisting of the
rail as well as vehicle snag on the blockouts between the rail and the PCBs. This twisting and
lifting of the W-beam guardrail also caused concern for rail rupture and system failure.
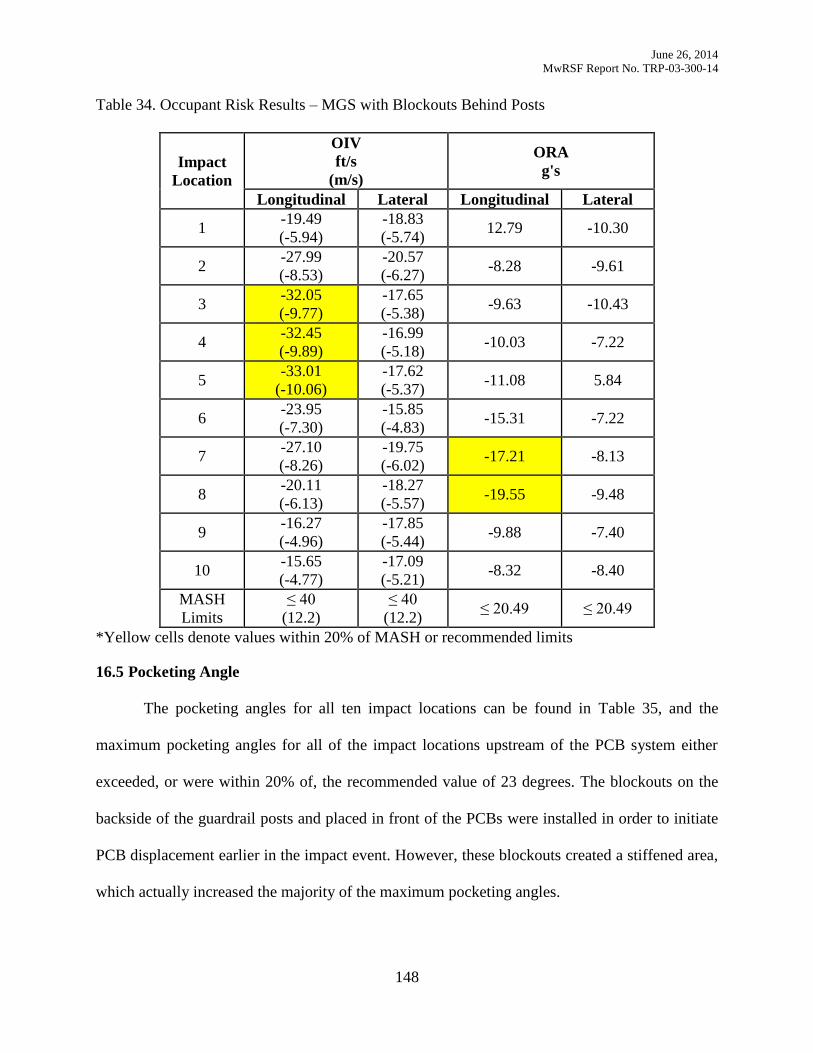
June 26, 2014
MwRSF Report No. TRP-03-300-14
148
Table 34. Occupant Risk Results – MGS with Blockouts Behind Posts
Impact
Location
OIV
ft/s
(m/s)
ORA
g's
Longitudinal Lateral Longitudinal Lateral
1 -19.49
(-5.94)
-18.83
(-5.74) 12.79 -10.30
2 -27.99
(-8.53)
-20.57
(-6.27) -8.28 -9.61
3 -32.05
(-9.77)
-17.65
(-5.38) -9.63 -10.43
4 -32.45
(-9.89)
-16.99
(-5.18) -10.03 -7.22
5 -33.01
(-10.06)
-17.62
(-5.37) -11.08 5.84
6 -23.95
(-7.30)
-15.85
(-4.83) -15.31 -7.22
7 -27.10
(-8.26)
-19.75
(-6.02) -17.21 -8.13
8 -20.11
(-6.13)
-18.27
(-5.57) -19.55 -9.48
9 -16.27
(-4.96)
-17.85
(-5.44) -9.88 -7.40
10 -15.65
(-4.77)
-17.09
(-5.21) -8.32 -8.40
MASH
Limits
≤ 40
(12.2)
≤ 40
(12.2) ≤ 20.49 ≤ 20.49
*Yellow cells denote values within 20% of MASH or recommended limits
16.5 Pocketing Angle
The pocketing angles for all ten impact locations can be found in Table 35, and the
maximum pocketing angles for all of the impact locations upstream of the PCB system either
exceeded, or were within 20% of, the recommended value of 23 degrees. The blockouts on the
backside of the guardrail posts and placed in front of the PCBs were installed in order to initiate
PCB displacement earlier in the impact event. However, these blockouts created a stiffened area,
which actually increased the majority of the maximum pocketing angles.
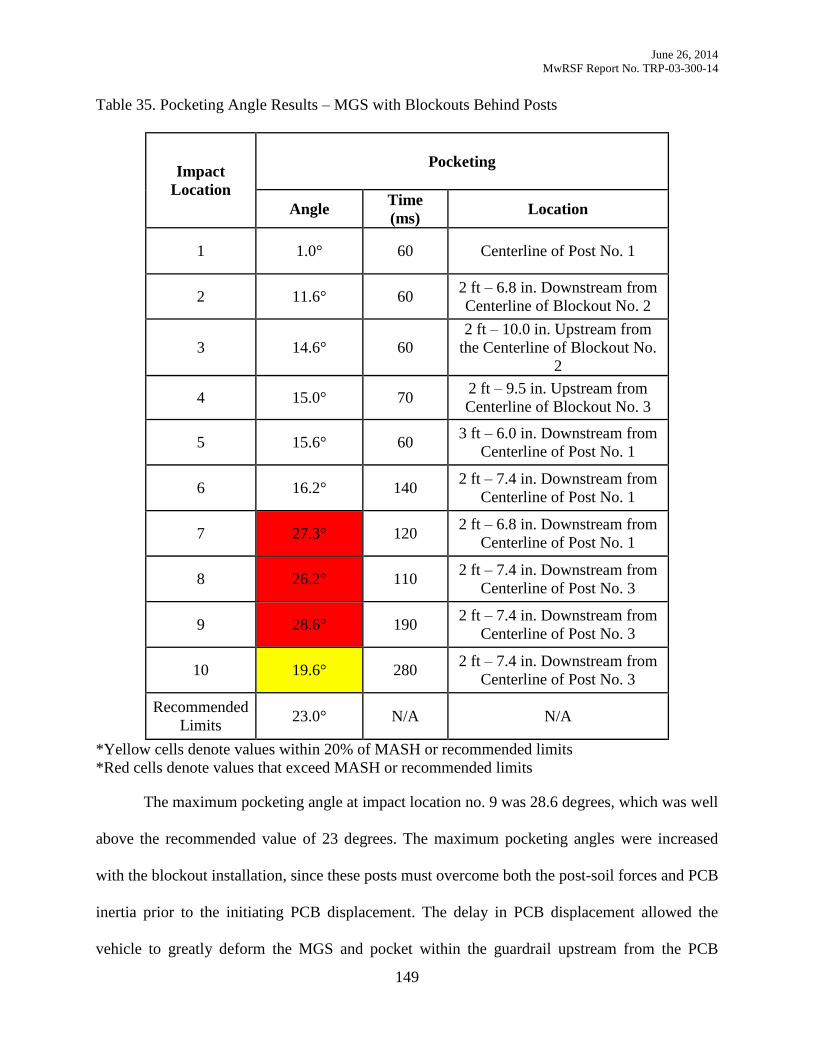
June 26, 2014
MwRSF Report No. TRP-03-300-14
149
Table 35. Pocketing Angle Results – MGS with Blockouts Behind Posts
Impact
Location
Pocketing
Angle Time
(ms) Location
1 1.0° 60 Centerline of Post No. 1
2 11.6° 60 2 ft – 6.8 in. Downstream from
Centerline of Blockout No. 2
3 14.6° 60
2 ft – 10.0 in. Upstream from
the Centerline of Blockout No.
2
4 15.0° 70 2 ft – 9.5 in. Upstream from
Centerline of Blockout No. 3
5 15.6° 60 3 ft – 6.0 in. Downstream from
Centerline of Post No. 1
6 16.2° 140 2 ft – 7.4 in. Downstream from
Centerline of Post No. 1
7 27.3° 120 2 ft – 6.8 in. Downstream from
Centerline of Post No. 1
8 26.2° 110 2 ft – 7.4 in. Downstream from
Centerline of Post No. 3
9 28.6° 190 2 ft – 7.4 in. Downstream from
Centerline of Post No. 3
10 19.6° 280 2 ft – 7.4 in. Downstream from
Centerline of Post No. 3
Recommended
Limits 23.0° N/A N/A
*Yellow cells denote values within 20% of MASH or recommended limits
*Red cells denote values that exceed MASH or recommended limits
The maximum pocketing angle at impact location no. 9 was 28.6 degrees, which was well
above the recommended value of 23 degrees. The maximum pocketing angles were increased
with the blockout installation, since these posts must overcome both the post-soil forces and PCB
inertia prior to the initiating PCB displacement. The delay in PCB displacement allowed the
vehicle to greatly deform the MGS and pocket within the guardrail upstream from the PCB
June 26, 2014
MwRSF Report No. TRP-03-300-14
150
system before the PCBs began to displace. The sequentials of impact location no. 9, as shown in
Figure 76, indicate that the PCBs had not begun to displace at 100 ms after impact. By 200 ms,
the vehicle was near the upstream end of the PCB system, and the maximum vehicle pocketing
had occurred, while the PCBs had just begun displacing.
16.6 Discussion
Upon full investigation of the simulation findings for the MGS-with-blockouts-behind-
posts configuration, it was determined that blockout installation between the backside of
guardrail posts and the PCBs increased occupant risk values as well as maximum pocketing
angles. At impact location nos. 3, 4, and 5, the longitudinal OIVs were within 20% of the MASH
limit. Also, at impact location nos. 7 and 8, the longitudinal ORAs were within 20% of the
MASH limits. The four impact locations upstream from the PCB system yielded maximum
pocketing angles either in excess, or within 20%, of the recommended value of 23 degrees.
Based on these findings, it was determined that blockouts placed behind posts increased the
likelihood of failure for the transition and thus were not recommended. Researchers continued to
explore other options to initiate PCB displacement earlier in the impact event.

June 26, 2014
MwRSF Report No. TRP-03-300-14
151
0 ms 500 ms
100 ms 600 ms
200 ms 700 ms
300 ms 800 ms
400 ms 900 ms
Figure 76. MGS with Blockouts Behind Posts Sequentials, Impact Location No. 9
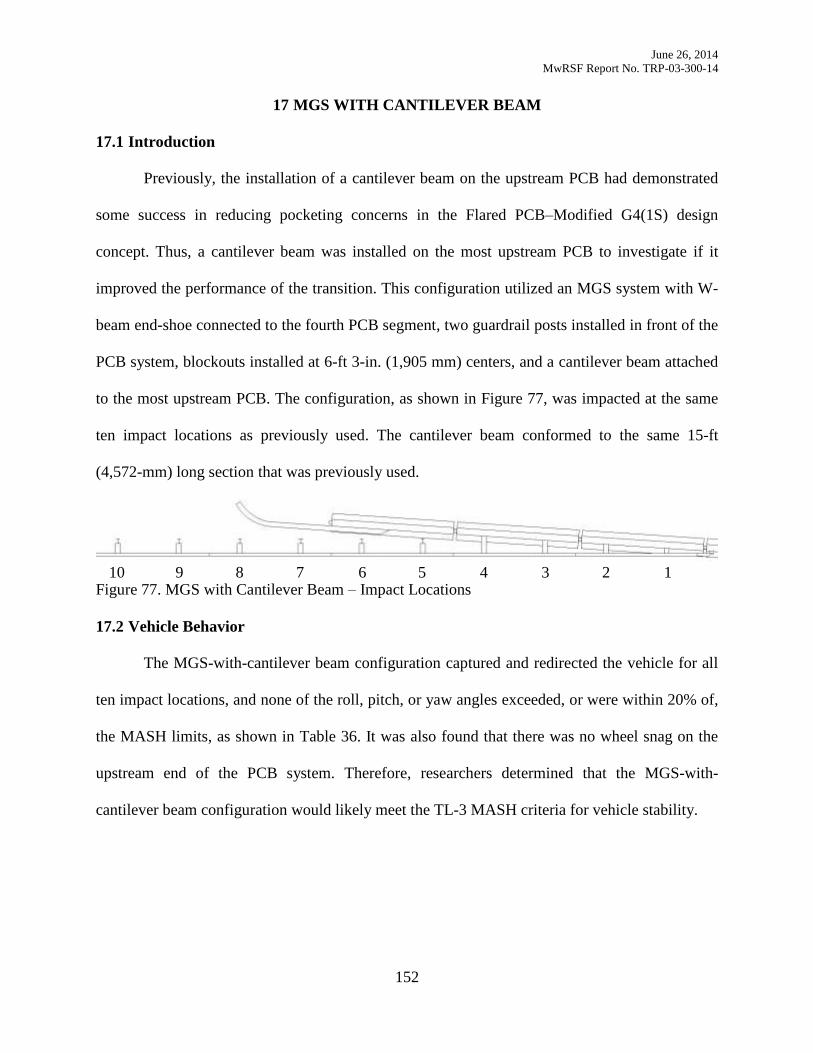
June 26, 2014
MwRSF Report No. TRP-03-300-14
152
MGS WITH CANTILEVER BEAM 17
17.1 Introduction
Previously, the installation of a cantilever beam on the upstream PCB had demonstrated
some success in reducing pocketing concerns in the Flared PCB–Modified G4(1S) design
concept. Thus, a cantilever beam was installed on the most upstream PCB to investigate if it
improved the performance of the transition. This configuration utilized an MGS system with W-
beam end-shoe connected to the fourth PCB segment, two guardrail posts installed in front of the
PCB system, blockouts installed at 6-ft 3-in. (1,905 mm) centers, and a cantilever beam attached
to the most upstream PCB. The configuration, as shown in Figure 77, was impacted at the same
ten impact locations as previously used. The cantilever beam conformed to the same 15-ft
(4,572-mm) long section that was previously used.
Figure 77. MGS with Cantilever Beam – Impact Locations
17.2 Vehicle Behavior
The MGS-with-cantilever beam configuration captured and redirected the vehicle for all
ten impact locations, and none of the roll, pitch, or yaw angles exceeded, or were within 20% of,
the MASH limits, as shown in Table 36. It was also found that there was no wheel snag on the
upstream end of the PCB system. Therefore, researchers determined that the MGS-with-
cantilever beam configuration would likely meet the TL-3 MASH criteria for vehicle stability.
1 2 3 4 5 6 7 8 9 10
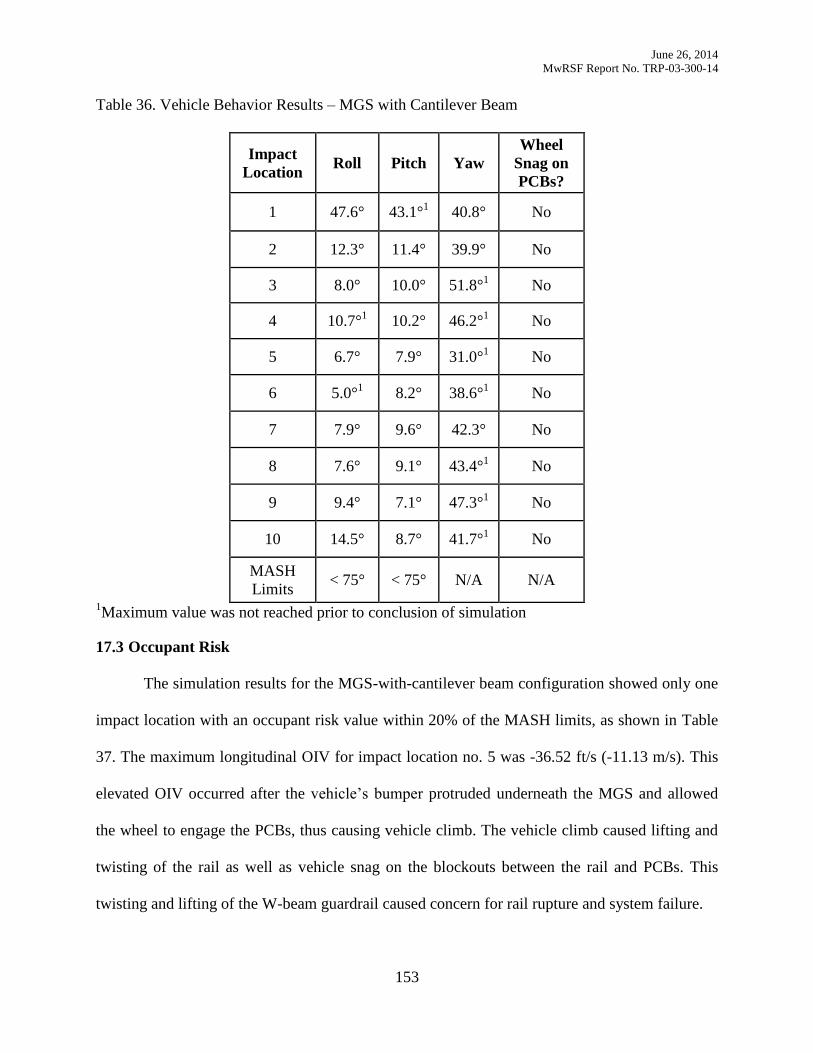
June 26, 2014
MwRSF Report No. TRP-03-300-14
153
Table 36. Vehicle Behavior Results – MGS with Cantilever Beam
Impact
Location Roll Pitch Yaw
Wheel
Snag on
PCBs?
1 47.6°
43.1°1
40.8° No
2 12.3°
11.4° 39.9°
No
3 8.0°
10.0°
51.8°1
No
4 10.7°1
10.2° 46.2°1
No
5 6.7°
7.9° 31.0°1
No
6 5.0°1
8.2°
38.6°1
No
7 7.9° 9.6°
42.3°
No
8 7.6° 9.1° 43.4°1
No
9 9.4°
7.1° 47.3°1
No
10 14.5° 8.7° 41.7°1
No
MASH
Limits < 75° < 75° N/A N/A
1Maximum value was not reached prior to conclusion of simulation
17.3 Occupant Risk
The simulation results for the MGS-with-cantilever beam configuration showed only one
impact location with an occupant risk value within 20% of the MASH limits, as shown in Table
37. The maximum longitudinal OIV for impact location no. 5 was -36.52 ft/s (-11.13 m/s). This
elevated OIV occurred after the vehicle’s bumper protruded underneath the MGS and allowed
the wheel to engage the PCBs, thus causing vehicle climb. The vehicle climb caused lifting and
twisting of the rail as well as vehicle snag on the blockouts between the rail and PCBs. This
twisting and lifting of the W-beam guardrail caused concern for rail rupture and system failure.
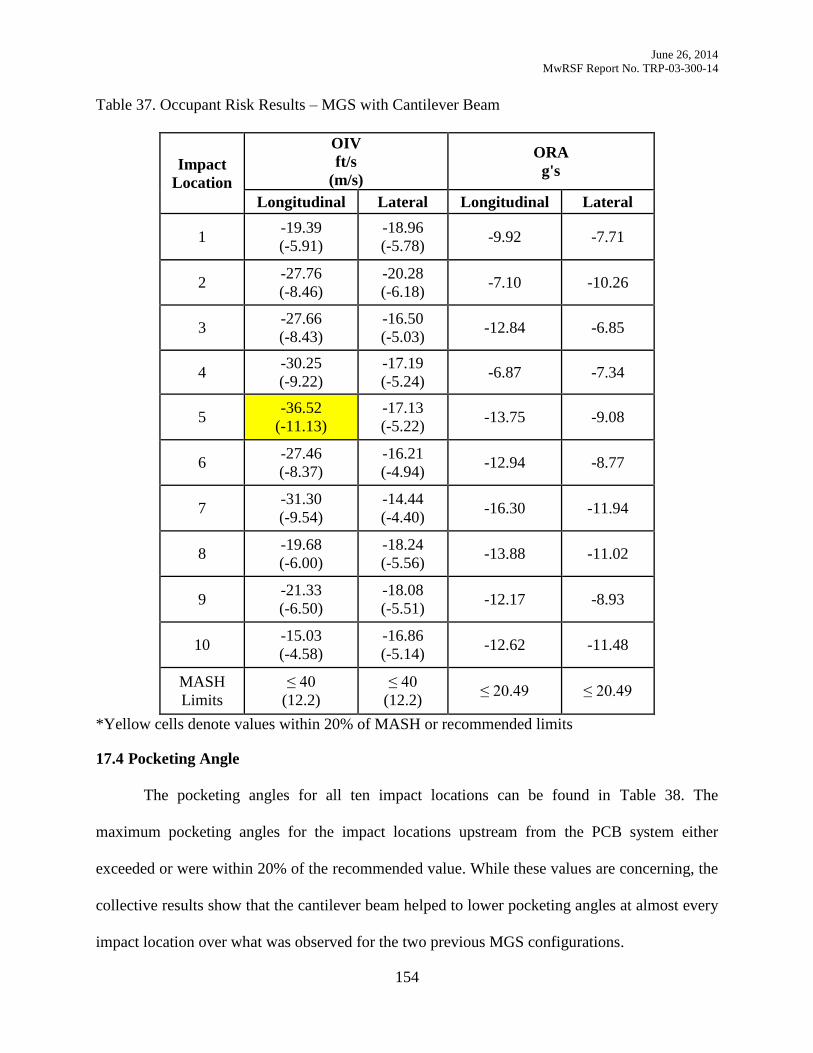
June 26, 2014
MwRSF Report No. TRP-03-300-14
154
Table 37. Occupant Risk Results – MGS with Cantilever Beam
Impact
Location
OIV
ft/s
(m/s)
ORA
g's
Longitudinal Lateral Longitudinal Lateral
1 -19.39
(-5.91)
-18.96
(-5.78) -9.92 -7.71
2 -27.76
(-8.46)
-20.28
(-6.18) -7.10 -10.26
3 -27.66
(-8.43)
-16.50
(-5.03) -12.84 -6.85
4 -30.25
(-9.22)
-17.19
(-5.24) -6.87 -7.34
5 -36.52
(-11.13)
-17.13
(-5.22) -13.75 -9.08
6 -27.46
(-8.37)
-16.21
(-4.94) -12.94 -8.77
7 -31.30
(-9.54)
-14.44
(-4.40) -16.30 -11.94
8 -19.68
(-6.00)
-18.24
(-5.56) -13.88 -11.02
9 -21.33
(-6.50)
-18.08
(-5.51) -12.17 -8.93
10 -15.03
(-4.58)
-16.86
(-5.14) -12.62 -11.48
MASH
Limits
≤ 40
(12.2)
≤ 40
(12.2) ≤ 20.49 ≤ 20.49
*Yellow cells denote values within 20% of MASH or recommended limits
17.4 Pocketing Angle
The pocketing angles for all ten impact locations can be found in Table 38. The
maximum pocketing angles for the impact locations upstream from the PCB system either
exceeded or were within 20% of the recommended value. While these values are concerning, the
collective results show that the cantilever beam helped to lower pocketing angles at almost every
impact location over what was observed for the two previous MGS configurations.
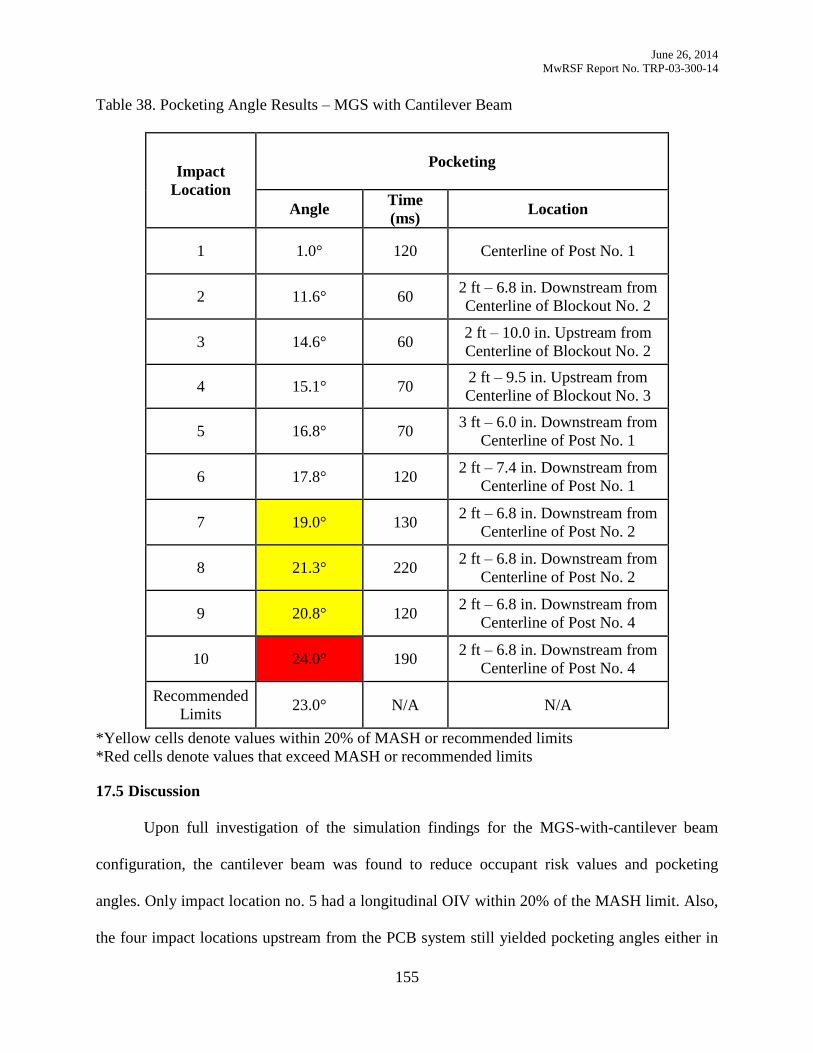
June 26, 2014
MwRSF Report No. TRP-03-300-14
155
Table 38. Pocketing Angle Results – MGS with Cantilever Beam
Impact
Location
Pocketing
Angle Time
(ms) Location
1 1.0° 120 Centerline of Post No. 1
2 11.6° 60 2 ft – 6.8 in. Downstream from
Centerline of Blockout No. 2
3 14.6° 60 2 ft – 10.0 in. Upstream from
Centerline of Blockout No. 2
4 15.1° 70 2 ft – 9.5 in. Upstream from
Centerline of Blockout No. 3
5 16.8° 70 3 ft – 6.0 in. Downstream from
Centerline of Post No. 1
6 17.8° 120 2 ft – 7.4 in. Downstream from
Centerline of Post No. 1
7 19.0° 130 2 ft – 6.8 in. Downstream from
Centerline of Post No. 2
8 21.3° 220 2 ft – 6.8 in. Downstream from
Centerline of Post No. 2
9 20.8° 120 2 ft – 6.8 in. Downstream from
Centerline of Post No. 4
10 24.0° 190 2 ft – 6.8 in. Downstream from
Centerline of Post No. 4
Recommended
Limits 23.0° N/A N/A
*Yellow cells denote values within 20% of MASH or recommended limits
*Red cells denote values that exceed MASH or recommended limits
17.5 Discussion
Upon full investigation of the simulation findings for the MGS-with-cantilever beam
configuration, the cantilever beam was found to reduce occupant risk values and pocketing
angles. Only impact location no. 5 had a longitudinal OIV within 20% of the MASH limit. Also,
the four impact locations upstream from the PCB system still yielded pocketing angles either in

June 26, 2014
MwRSF Report No. TRP-03-300-14
156
excess, or within 20%, of the recommended value of 23 degrees. Based on these findings, the
MGS-with-cantilever beam configuration had the highest propensity for successfully meeting
TL-3 of MASH out of the MGS configurations thus far. However, other options were explored to
initiate PCB displacement earlier in the impact event and reduce pocketing angles.
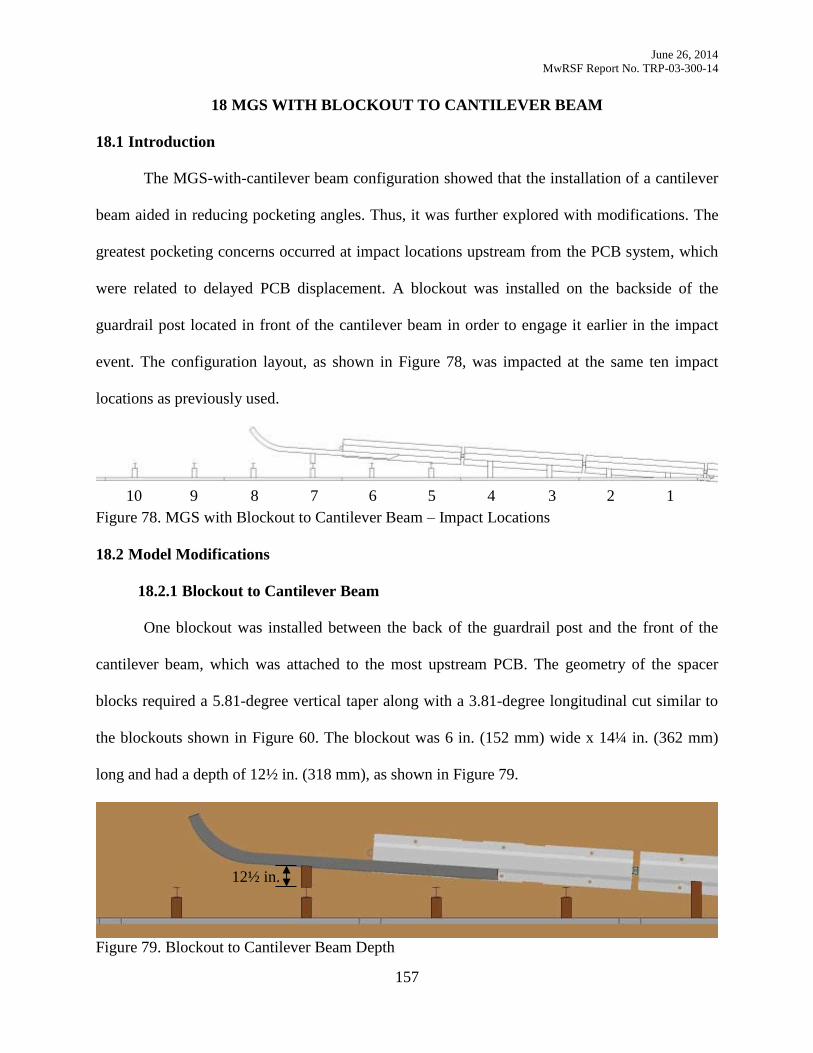
June 26, 2014
MwRSF Report No. TRP-03-300-14
157
MGS WITH BLOCKOUT TO CANTILEVER BEAM 18
18.1 Introduction
The MGS-with-cantilever beam configuration showed that the installation of a cantilever
beam aided in reducing pocketing angles. Thus, it was further explored with modifications. The
greatest pocketing concerns occurred at impact locations upstream from the PCB system, which
were related to delayed PCB displacement. A blockout was installed on the backside of the
guardrail post located in front of the cantilever beam in order to engage it earlier in the impact
event. The configuration layout, as shown in Figure 78, was impacted at the same ten impact
locations as previously used.
Figure 78. MGS with Blockout to Cantilever Beam – Impact Locations
18.2 Model Modifications
18.2.1 Blockout to Cantilever Beam
One blockout was installed between the back of the guardrail post and the front of the
cantilever beam, which was attached to the most upstream PCB. The geometry of the spacer
blocks required a 5.81-degree vertical taper along with a 3.81-degree longitudinal cut similar to
the blockouts shown in Figure 60. The blockout was 6 in. (152 mm) wide x 14¼ in. (362 mm)
long and had a depth of 12½ in. (318 mm), as shown in Figure 79.
Figure 79. Blockout to Cantilever Beam Depth
1 2 3 4 5 6 7 8 9 10
12½ in.
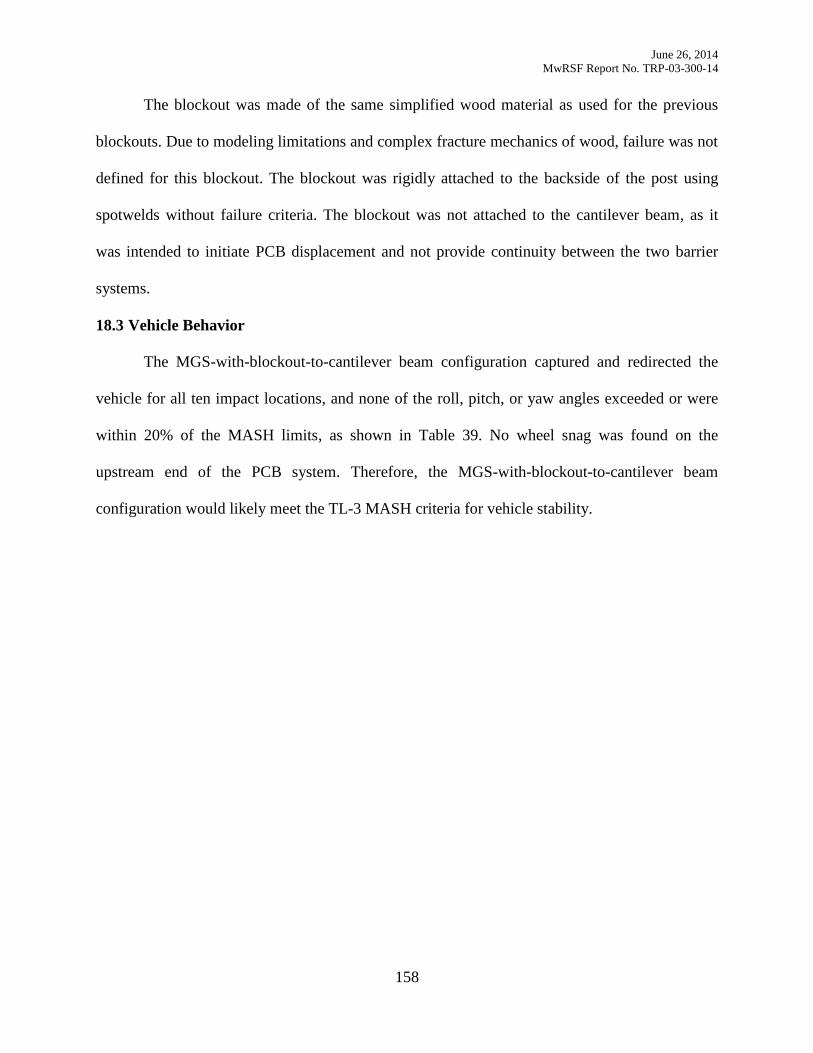
June 26, 2014
MwRSF Report No. TRP-03-300-14
158
The blockout was made of the same simplified wood material as used for the previous
blockouts. Due to modeling limitations and complex fracture mechanics of wood, failure was not
defined for this blockout. The blockout was rigidly attached to the backside of the post using
spotwelds without failure criteria. The blockout was not attached to the cantilever beam, as it
was intended to initiate PCB displacement and not provide continuity between the two barrier
systems.
18.3 Vehicle Behavior
The MGS-with-blockout-to-cantilever beam configuration captured and redirected the
vehicle for all ten impact locations, and none of the roll, pitch, or yaw angles exceeded or were
within 20% of the MASH limits, as shown in Table 39. No wheel snag was found on the
upstream end of the PCB system. Therefore, the MGS-with-blockout-to-cantilever beam
configuration would likely meet the TL-3 MASH criteria for vehicle stability.
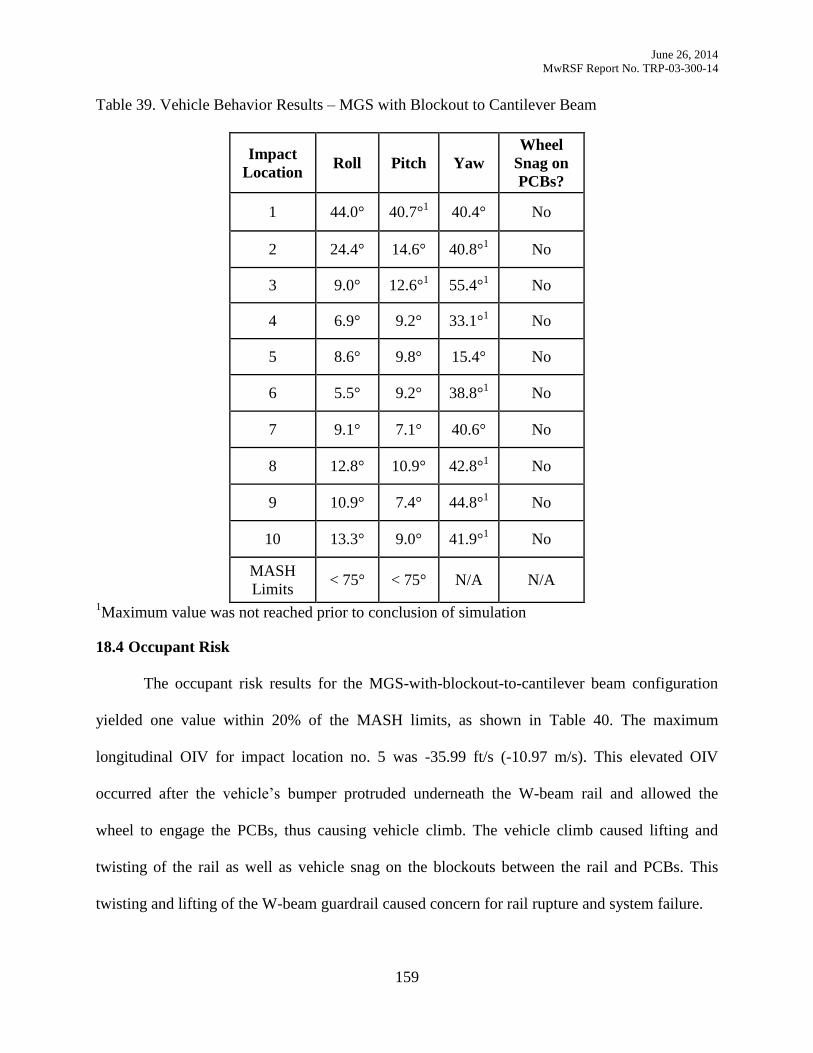
June 26, 2014
MwRSF Report No. TRP-03-300-14
159
Table 39. Vehicle Behavior Results – MGS with Blockout to Cantilever Beam
Impact
Location Roll Pitch Yaw
Wheel
Snag on
PCBs?
1 44.0°
40.7°1
40.4° No
2 24.4°
14.6° 40.8°1
No
3 9.0°
12.6°1
55.4°1
No
4 6.9°
9.2° 33.1°1
No
5 8.6°
9.8° 15.4°
No
6 5.5°
9.2°
38.8°1
No
7 9.1° 7.1°
40.6°
No
8 12.8° 10.9° 42.8°1
No
9 10.9°
7.4° 44.8°1
No
10 13.3° 9.0° 41.9°1
No
MASH
Limits < 75° < 75° N/A N/A
1Maximum value was not reached prior to conclusion of simulation
18.4 Occupant Risk
The occupant risk results for the MGS-with-blockout-to-cantilever beam configuration
yielded one value within 20% of the MASH limits, as shown in Table 40. The maximum
longitudinal OIV for impact location no. 5 was -35.99 ft/s (-10.97 m/s). This elevated OIV
occurred after the vehicle’s bumper protruded underneath the W-beam rail and allowed the
wheel to engage the PCBs, thus causing vehicle climb. The vehicle climb caused lifting and
twisting of the rail as well as vehicle snag on the blockouts between the rail and PCBs. This
twisting and lifting of the W-beam guardrail caused concern for rail rupture and system failure.
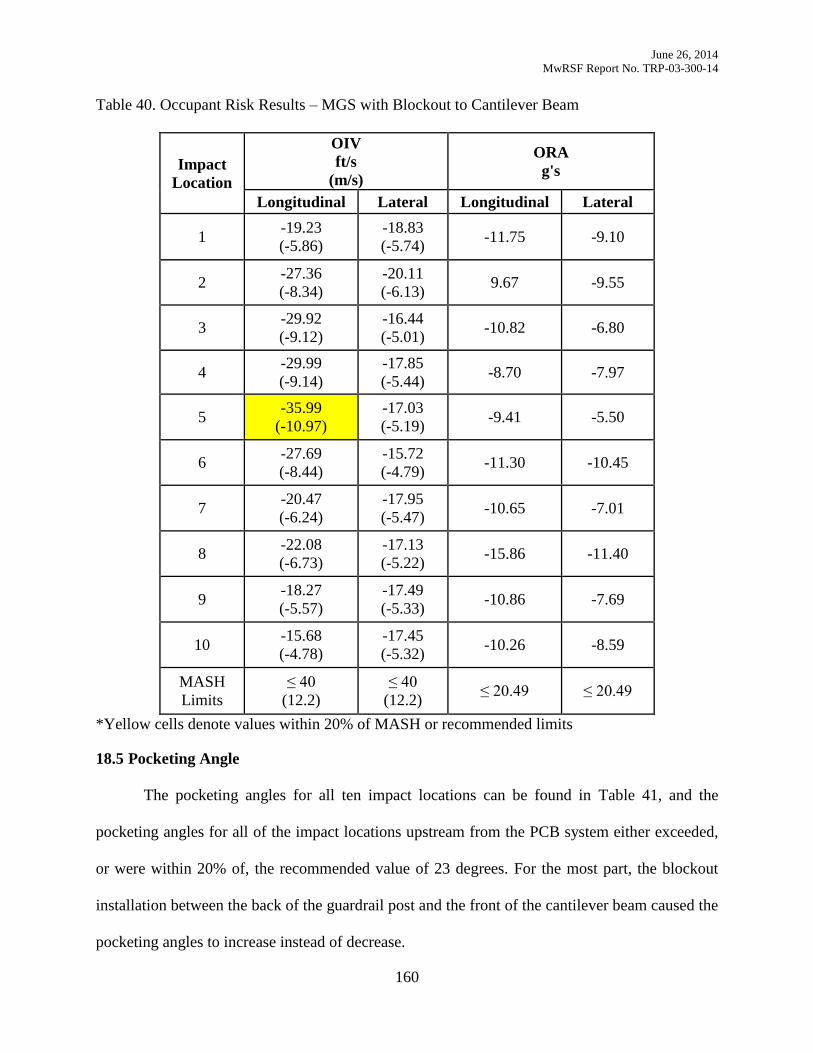
June 26, 2014
MwRSF Report No. TRP-03-300-14
160
Table 40. Occupant Risk Results – MGS with Blockout to Cantilever Beam
Impact
Location
OIV
ft/s
(m/s)
ORA
g's
Longitudinal Lateral Longitudinal Lateral
1 -19.23
(-5.86)
-18.83
(-5.74) -11.75 -9.10
2 -27.36
(-8.34)
-20.11
(-6.13) 9.67 -9.55
3 -29.92
(-9.12)
-16.44
(-5.01) -10.82 -6.80
4 -29.99
(-9.14)
-17.85
(-5.44) -8.70 -7.97
5 -35.99
(-10.97)
-17.03
(-5.19) -9.41 -5.50
6 -27.69
(-8.44)
-15.72
(-4.79) -11.30 -10.45
7 -20.47
(-6.24)
-17.95
(-5.47) -10.65 -7.01
8 -22.08
(-6.73)
-17.13
(-5.22) -15.86 -11.40
9 -18.27
(-5.57)
-17.49
(-5.33) -10.86 -7.69
10 -15.68
(-4.78)
-17.45
(-5.32) -10.26 -8.59
MASH
Limits
≤ 40
(12.2)
≤ 40
(12.2) ≤ 20.49 ≤ 20.49
*Yellow cells denote values within 20% of MASH or recommended limits
18.5 Pocketing Angle
The pocketing angles for all ten impact locations can be found in Table 41, and the
pocketing angles for all of the impact locations upstream from the PCB system either exceeded,
or were within 20% of, the recommended value of 23 degrees. For the most part, the blockout
installation between the back of the guardrail post and the front of the cantilever beam caused the
pocketing angles to increase instead of decrease.
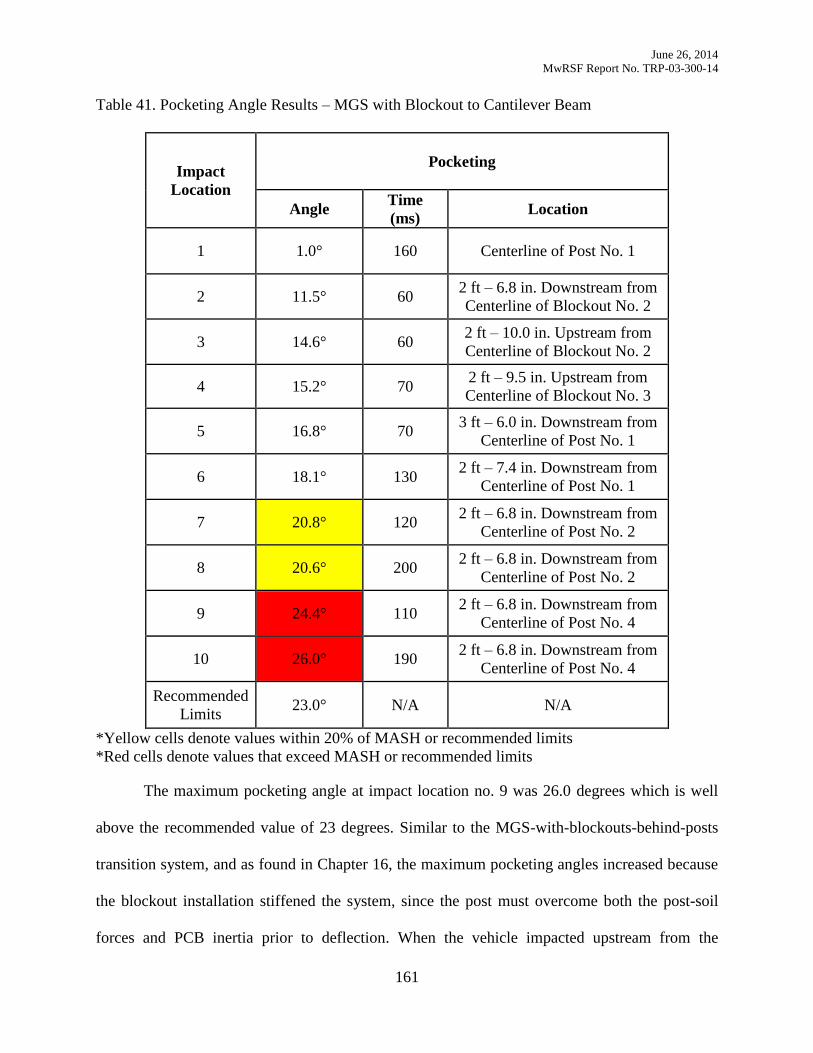
June 26, 2014
MwRSF Report No. TRP-03-300-14
161
Table 41. Pocketing Angle Results – MGS with Blockout to Cantilever Beam
Impact
Location
Pocketing
Angle Time
(ms) Location
1 1.0° 160 Centerline of Post No. 1
2 11.5° 60 2 ft – 6.8 in. Downstream from
Centerline of Blockout No. 2
3 14.6° 60 2 ft – 10.0 in. Upstream from
Centerline of Blockout No. 2
4 15.2° 70 2 ft – 9.5 in. Upstream from
Centerline of Blockout No. 3
5 16.8° 70 3 ft – 6.0 in. Downstream from
Centerline of Post No. 1
6 18.1° 130 2 ft – 7.4 in. Downstream from
Centerline of Post No. 1
7 20.8° 120 2 ft – 6.8 in. Downstream from
Centerline of Post No. 2
8 20.6° 200 2 ft – 6.8 in. Downstream from
Centerline of Post No. 2
9 24.4° 110 2 ft – 6.8 in. Downstream from
Centerline of Post No. 4
10 26.0° 190 2 ft – 6.8 in. Downstream from
Centerline of Post No. 4
Recommended
Limits 23.0° N/A N/A
*Yellow cells denote values within 20% of MASH or recommended limits
*Red cells denote values that exceed MASH or recommended limits
The maximum pocketing angle at impact location no. 9 was 26.0 degrees which is well
above the recommended value of 23 degrees. Similar to the MGS-with-blockouts-behind-posts
transition system, and as found in Chapter 16, the maximum pocketing angles increased because
the blockout installation stiffened the system, since the post must overcome both the post-soil
forces and PCB inertia prior to deflection. When the vehicle impacted upstream from the
June 26, 2014
MwRSF Report No. TRP-03-300-14
162
blockout that was attached to the cantilever beam, the rotation of the guardrail post was slowed
or resisted. The sequentials for impact location no. 10, as shown in Figure 80, indicate that the
PCBs had not begun to displace at 100 ms after impact. By 200 ms, the vehicle was just
upstream from the cantilever beam, PCBs had just begun to displace, and the maximum
pocketing angle of 26.0 degrees had occurred.
18.6 Discussion
Upon full investigation of the simulation findings for the MGS-with-blockout-to-
cantilever beam configuration, the addition of the blockout had a negative effect on performance
even though the cantilever beam helped reduce occupant risk values and pocketing angles. Three
of the four impact locations upstream from the PCB system yielded higher pocketing angles than
observed with the cantilever beam alone. Based on these findings, the blockout installation
between the back of a guardrail post and the front of the cantilever beam was not recommended
for further testing and evaluation. Therefore, other options were explored to initiate PCB
displacement earlier in the impact event and reduce pocketing angles.
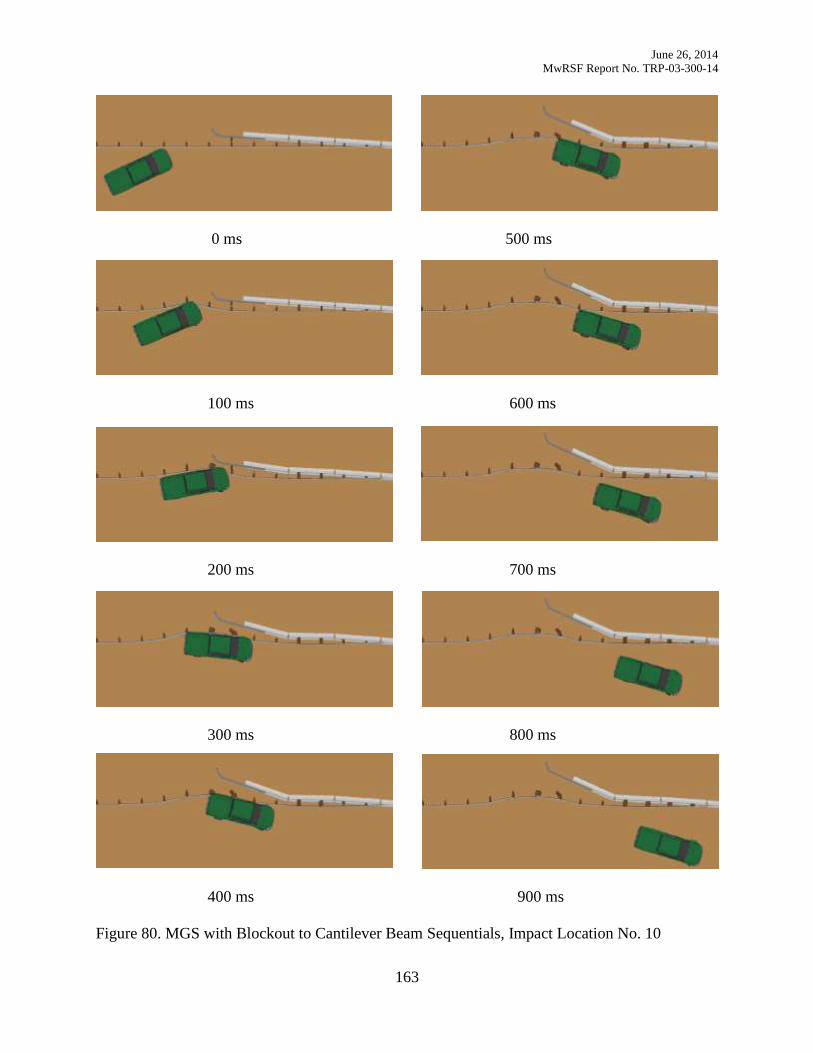
June 26, 2014
MwRSF Report No. TRP-03-300-14
163
0 ms 500 ms
100 ms 600 ms
200 ms 700 ms
300 ms 800 ms
400 ms 900 ms
Figure 80. MGS with Blockout to Cantilever Beam Sequentials, Impact Location No. 10
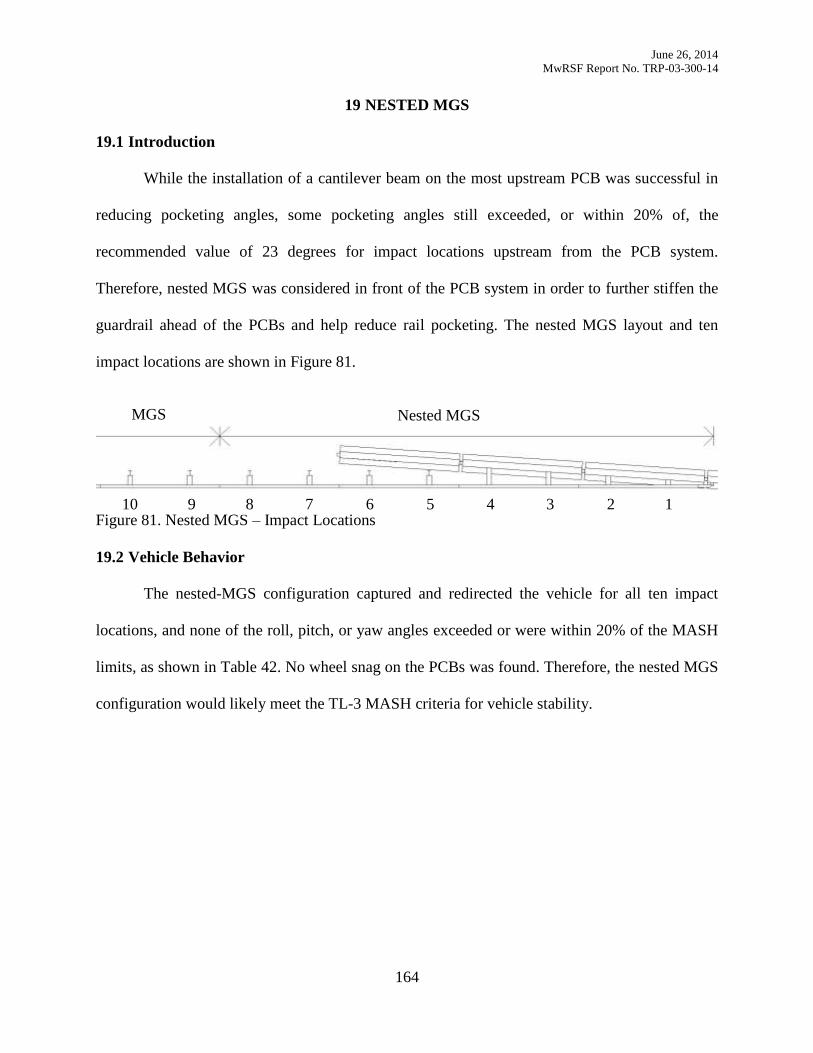
June 26, 2014
MwRSF Report No. TRP-03-300-14
164
NESTED MGS 19
19.1 Introduction
While the installation of a cantilever beam on the most upstream PCB was successful in
reducing pocketing angles, some pocketing angles still exceeded, or within 20% of, the
recommended value of 23 degrees for impact locations upstream from the PCB system.
Therefore, nested MGS was considered in front of the PCB system in order to further stiffen the
guardrail ahead of the PCBs and help reduce rail pocketing. The nested MGS layout and ten
impact locations are shown in Figure 81.
Figure 81. Nested MGS – Impact Locations
19.2 Vehicle Behavior
The nested-MGS configuration captured and redirected the vehicle for all ten impact
locations, and none of the roll, pitch, or yaw angles exceeded or were within 20% of the MASH
limits, as shown in Table 42. No wheel snag on the PCBs was found. Therefore, the nested MGS
configuration would likely meet the TL-3 MASH criteria for vehicle stability.
1 2 3 4 5 6 7 8 9 10
Nested MGS MGS
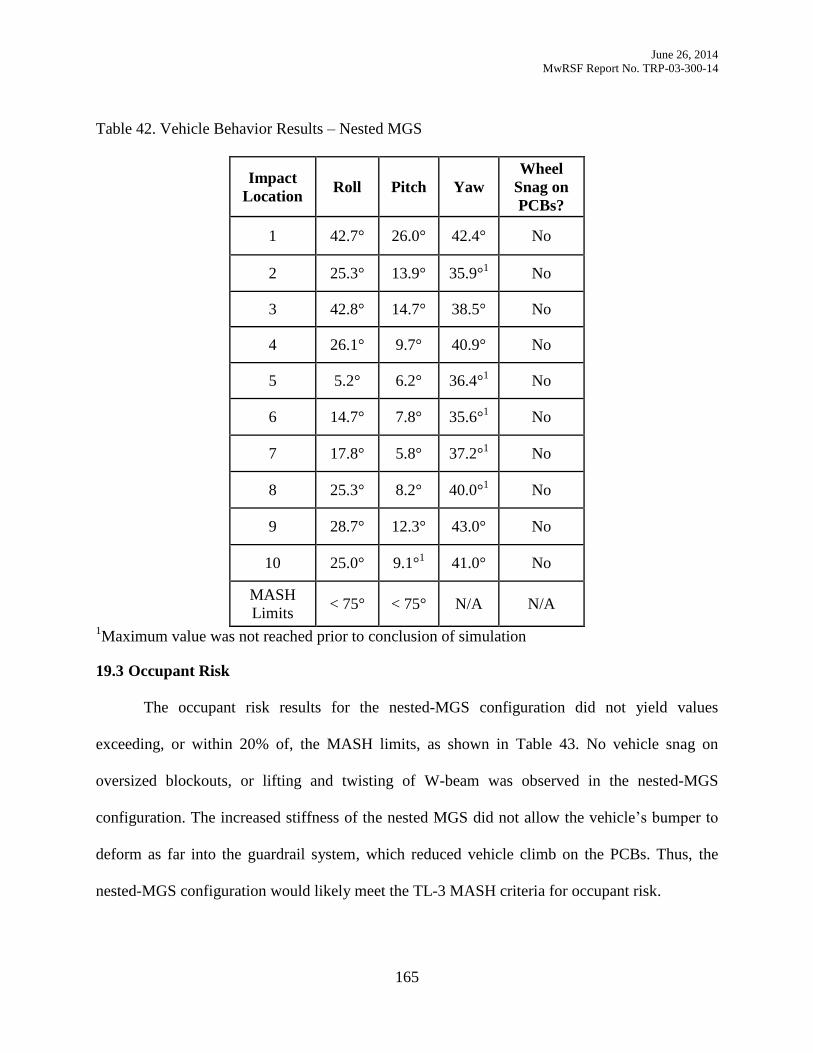
June 26, 2014
MwRSF Report No. TRP-03-300-14
165
Table 42. Vehicle Behavior Results – Nested MGS
Impact
Location Roll Pitch Yaw
Wheel
Snag on
PCBs?
1 42.7°
26.0°
42.4° No
2 25.3°
13.9° 35.9°1
No
3 42.8°
14.7°
38.5°
No
4 26.1°
9.7° 40.9°
No
5 5.2°
6.2° 36.4°1
No
6 14.7°
7.8°
35.6°1
No
7 17.8° 5.8°
37.2°1
No
8 25.3° 8.2° 40.0°1
No
9 28.7°
12.3° 43.0°
No
10 25.0° 9.1°1
41.0°
No
MASH
Limits < 75° < 75° N/A N/A
1Maximum value was not reached prior to conclusion of simulation
19.3 Occupant Risk
The occupant risk results for the nested-MGS configuration did not yield values
exceeding, or within 20% of, the MASH limits, as shown in Table 43. No vehicle snag on
oversized blockouts, or lifting and twisting of W-beam was observed in the nested-MGS
configuration. The increased stiffness of the nested MGS did not allow the vehicle’s bumper to
deform as far into the guardrail system, which reduced vehicle climb on the PCBs. Thus, the
nested-MGS configuration would likely meet the TL-3 MASH criteria for occupant risk.
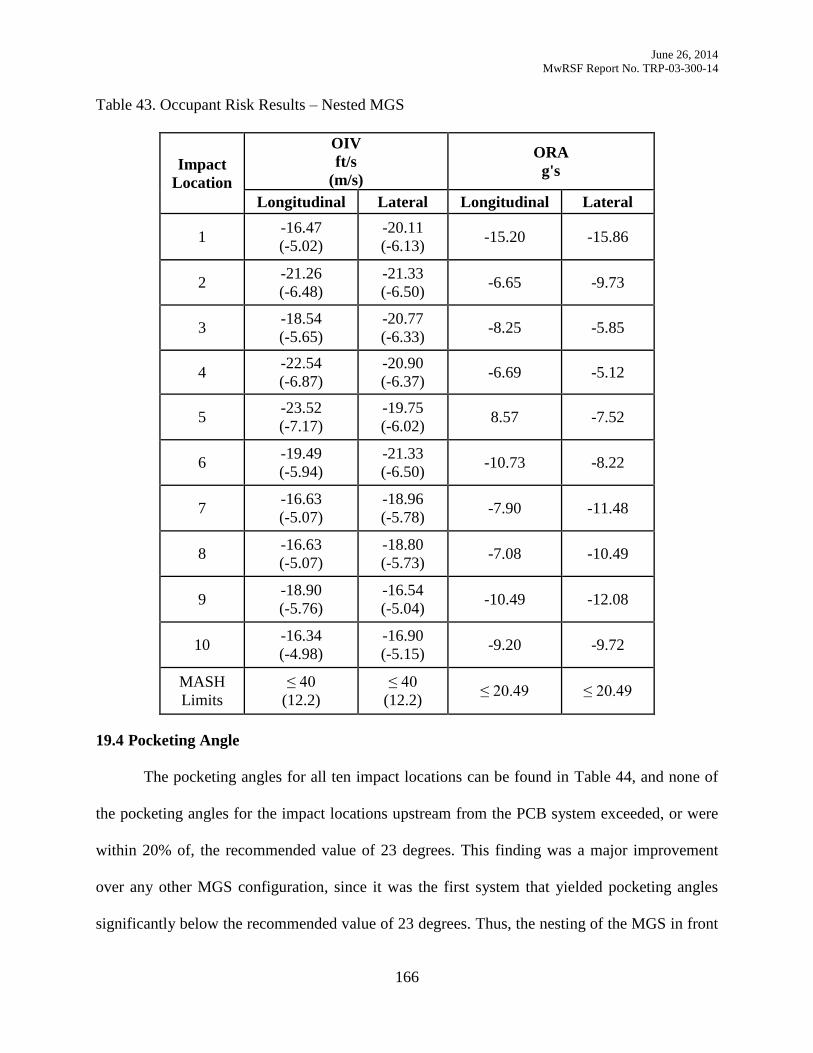
June 26, 2014
MwRSF Report No. TRP-03-300-14
166
Table 43. Occupant Risk Results – Nested MGS
Impact
Location
OIV
ft/s
(m/s)
ORA
g's
Longitudinal Lateral Longitudinal Lateral
1 -16.47
(-5.02)
-20.11
(-6.13) -15.20 -15.86
2 -21.26
(-6.48)
-21.33
(-6.50) -6.65 -9.73
3 -18.54
(-5.65)
-20.77
(-6.33) -8.25 -5.85
4 -22.54
(-6.87)
-20.90
(-6.37) -6.69 -5.12
5 -23.52
(-7.17)
-19.75
(-6.02) 8.57 -7.52
6 -19.49
(-5.94)
-21.33
(-6.50) -10.73 -8.22
7 -16.63
(-5.07)
-18.96
(-5.78) -7.90 -11.48
8 -16.63
(-5.07)
-18.80
(-5.73) -7.08 -10.49
9 -18.90
(-5.76)
-16.54
(-5.04) -10.49 -12.08
10 -16.34
(-4.98)
-16.90
(-5.15) -9.20 -9.72
MASH
Limits
≤ 40
(12.2)
≤ 40
(12.2) ≤ 20.49 ≤ 20.49
19.4 Pocketing Angle
The pocketing angles for all ten impact locations can be found in Table 44, and none of
the pocketing angles for the impact locations upstream from the PCB system exceeded, or were
within 20% of, the recommended value of 23 degrees. This finding was a major improvement
over any other MGS configuration, since it was the first system that yielded pocketing angles
significantly below the recommended value of 23 degrees. Thus, the nesting of the MGS in front
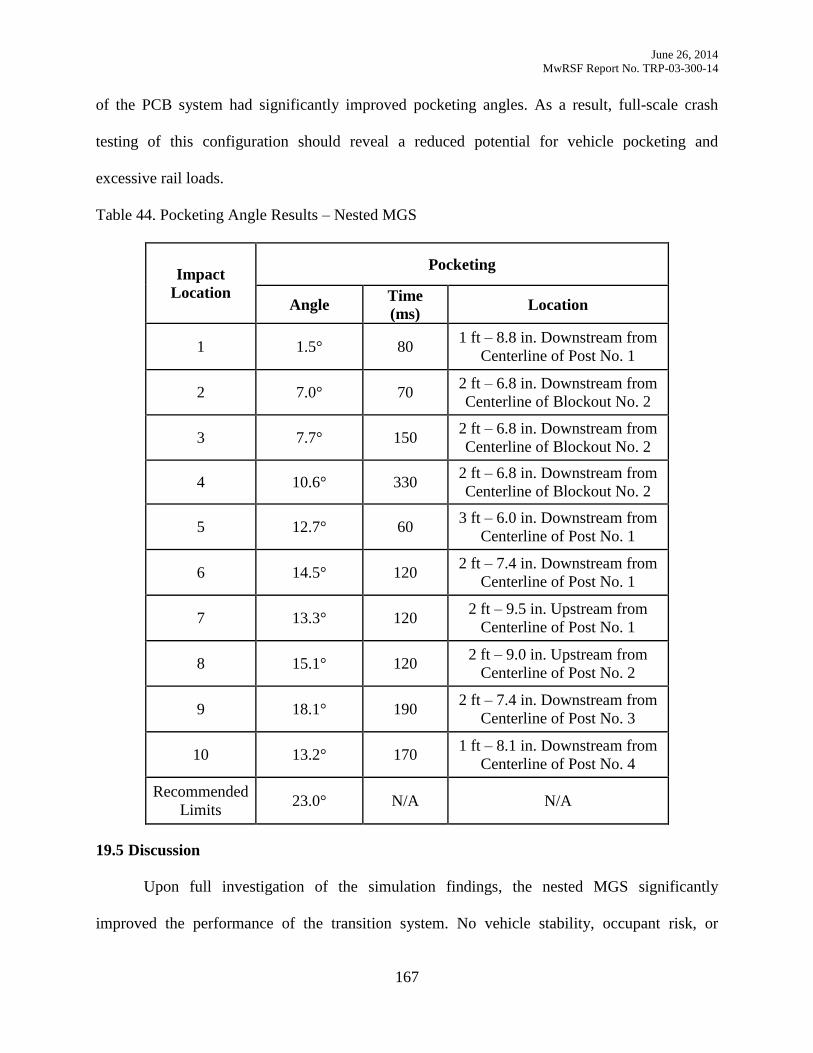
June 26, 2014
MwRSF Report No. TRP-03-300-14
167
of the PCB system had significantly improved pocketing angles. As a result, full-scale crash
testing of this configuration should reveal a reduced potential for vehicle pocketing and
excessive rail loads.
Table 44. Pocketing Angle Results – Nested MGS
Impact
Location
Pocketing
Angle Time
(ms) Location
1 1.5° 80 1 ft – 8.8 in. Downstream from
Centerline of Post No. 1
2 7.0° 70 2 ft – 6.8 in. Downstream from
Centerline of Blockout No. 2
3 7.7° 150 2 ft – 6.8 in. Downstream from
Centerline of Blockout No. 2
4 10.6° 330 2 ft – 6.8 in. Downstream from
Centerline of Blockout No. 2
5 12.7° 60 3 ft – 6.0 in. Downstream from
Centerline of Post No. 1
6 14.5° 120 2 ft – 7.4 in. Downstream from
Centerline of Post No. 1
7 13.3° 120 2 ft – 9.5 in. Upstream from
Centerline of Post No. 1
8 15.1° 120 2 ft – 9.0 in. Upstream from
Centerline of Post No. 2
9 18.1° 190 2 ft – 7.4 in. Downstream from
Centerline of Post No. 3
10 13.2° 170 1 ft – 8.1 in. Downstream from
Centerline of Post No. 4
Recommended
Limits 23.0° N/A N/A
19.5 Discussion
Upon full investigation of the simulation findings, the nested MGS significantly
improved the performance of the transition system. No vehicle stability, occupant risk, or

June 26, 2014
MwRSF Report No. TRP-03-300-14
168
pocketing angles exceeded, or were within 20% of, the MASH limits or recommended values.
These findings demonstrated that the nested-MGS configuration had a high likelihood to meet
the MASH TL-3 full-scale crash test criteria.
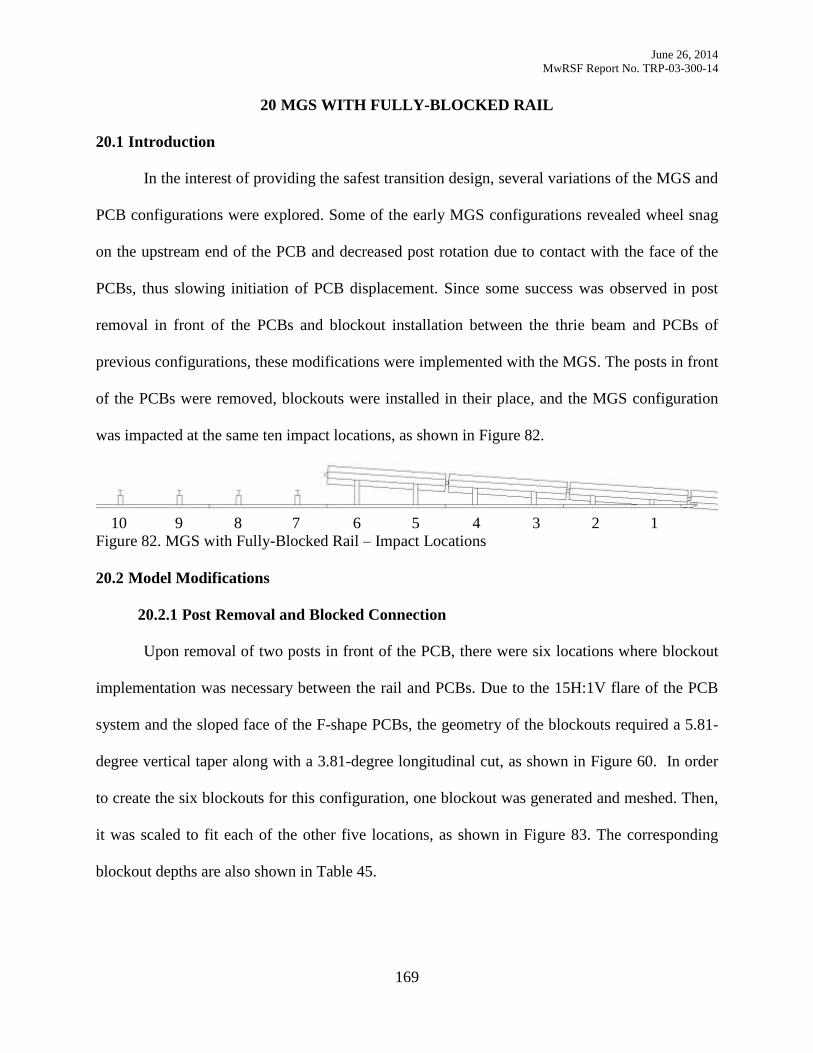
June 26, 2014
MwRSF Report No. TRP-03-300-14
169
MGS WITH FULLY-BLOCKED RAIL 20
20.1 Introduction
In the interest of providing the safest transition design, several variations of the MGS and
PCB configurations were explored. Some of the early MGS configurations revealed wheel snag
on the upstream end of the PCB and decreased post rotation due to contact with the face of the
PCBs, thus slowing initiation of PCB displacement. Since some success was observed in post
removal in front of the PCBs and blockout installation between the thrie beam and PCBs of
previous configurations, these modifications were implemented with the MGS. The posts in front
of the PCBs were removed, blockouts were installed in their place, and the MGS configuration
was impacted at the same ten impact locations, as shown in Figure 82.
Figure 82. MGS with Fully-Blocked Rail – Impact Locations
20.2 Model Modifications
20.2.1 Post Removal and Blocked Connection
Upon removal of two posts in front of the PCB, there were six locations where blockout
implementation was necessary between the rail and PCBs. Due to the 15H:1V flare of the PCB
system and the sloped face of the F-shape PCBs, the geometry of the blockouts required a 5.81-
degree vertical taper along with a 3.81-degree longitudinal cut, as shown in Figure 60. In order
to create the six blockouts for this configuration, one blockout was generated and meshed. Then,
it was scaled to fit each of the other five locations, as shown in Figure 83. The corresponding
blockout depths are also shown in Table 45.
1 2 3 4 5 6 7 8 9 10
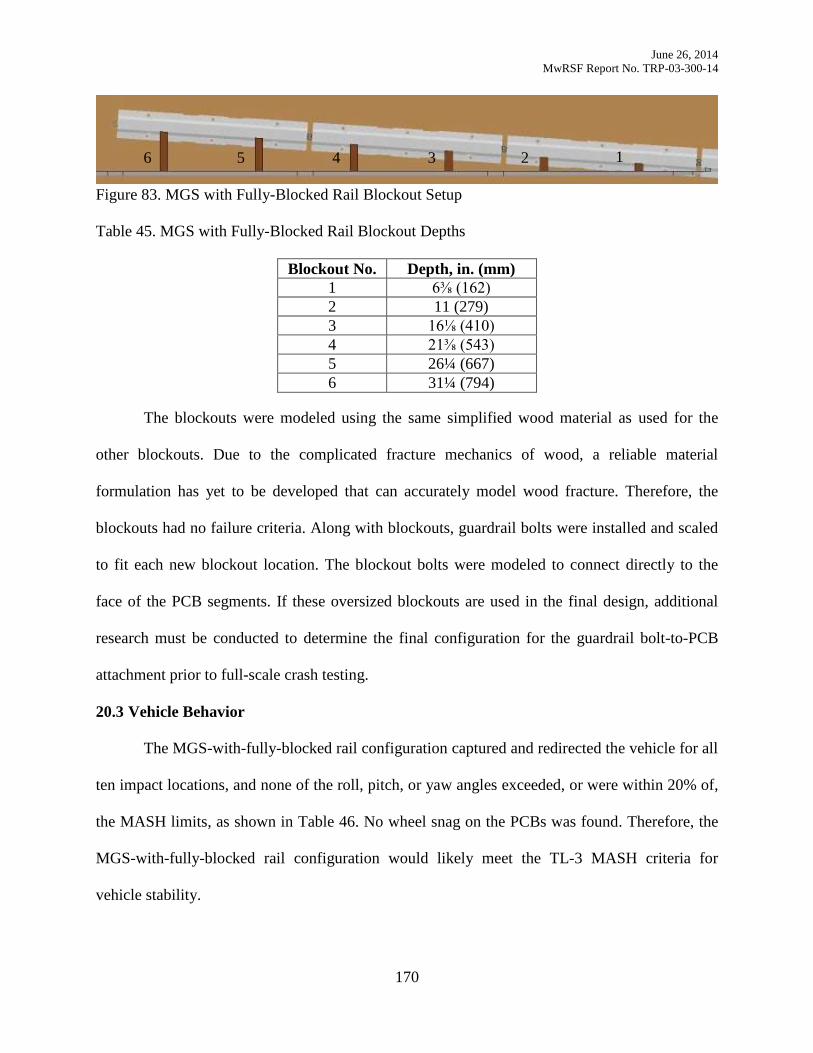
June 26, 2014
MwRSF Report No. TRP-03-300-14
170
Figure 83. MGS with Fully-Blocked Rail Blockout Setup
Table 45. MGS with Fully-Blocked Rail Blockout Depths
Blockout No. Depth, in. (mm)
1 6⅜ (162)
2 11 (279)
3 16⅛ (410)
4 21⅜ (543)
5 26¼ (667)
6 31¼ (794)
The blockouts were modeled using the same simplified wood material as used for the
other blockouts. Due to the complicated fracture mechanics of wood, a reliable material
formulation has yet to be developed that can accurately model wood fracture. Therefore, the
blockouts had no failure criteria. Along with blockouts, guardrail bolts were installed and scaled
to fit each new blockout location. The blockout bolts were modeled to connect directly to the
face of the PCB segments. If these oversized blockouts are used in the final design, additional
research must be conducted to determine the final configuration for the guardrail bolt-to-PCB
attachment prior to full-scale crash testing.
20.3 Vehicle Behavior
The MGS-with-fully-blocked rail configuration captured and redirected the vehicle for all
ten impact locations, and none of the roll, pitch, or yaw angles exceeded, or were within 20% of,
the MASH limits, as shown in Table 46. No wheel snag on the PCBs was found. Therefore, the
MGS-with-fully-blocked rail configuration would likely meet the TL-3 MASH criteria for
vehicle stability.
1 2 3 4 5 6
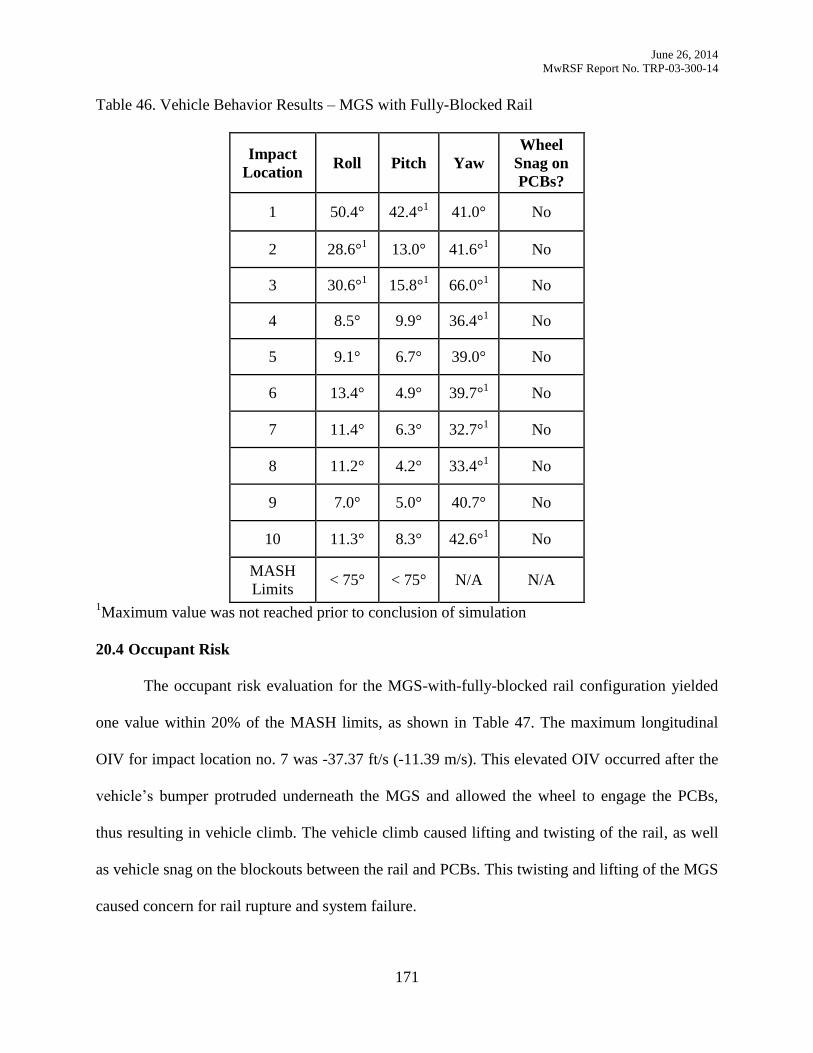
June 26, 2014
MwRSF Report No. TRP-03-300-14
171
Table 46. Vehicle Behavior Results – MGS with Fully-Blocked Rail
Impact
Location Roll Pitch Yaw
Wheel
Snag on
PCBs?
1 50.4°
42.4°1
41.0° No
2 28.6°1
13.0° 41.6°1
No
3 30.6°1
15.8°1
66.0°1
No
4 8.5°
9.9° 36.4°1
No
5 9.1°
6.7° 39.0°
No
6 13.4°
4.9°
39.7°1
No
7 11.4° 6.3°
32.7°1
No
8 11.2° 4.2° 33.4°1
No
9 7.0°
5.0° 40.7°
No
10 11.3° 8.3°
42.6°1
No
MASH
Limits < 75° < 75° N/A N/A
1Maximum value was not reached prior to conclusion of simulation
20.4 Occupant Risk
The occupant risk evaluation for the MGS-with-fully-blocked rail configuration yielded
one value within 20% of the MASH limits, as shown in Table 47. The maximum longitudinal
OIV for impact location no. 7 was -37.37 ft/s (-11.39 m/s). This elevated OIV occurred after the
vehicle’s bumper protruded underneath the MGS and allowed the wheel to engage the PCBs,
thus resulting in vehicle climb. The vehicle climb caused lifting and twisting of the rail, as well
as vehicle snag on the blockouts between the rail and PCBs. This twisting and lifting of the MGS
caused concern for rail rupture and system failure.
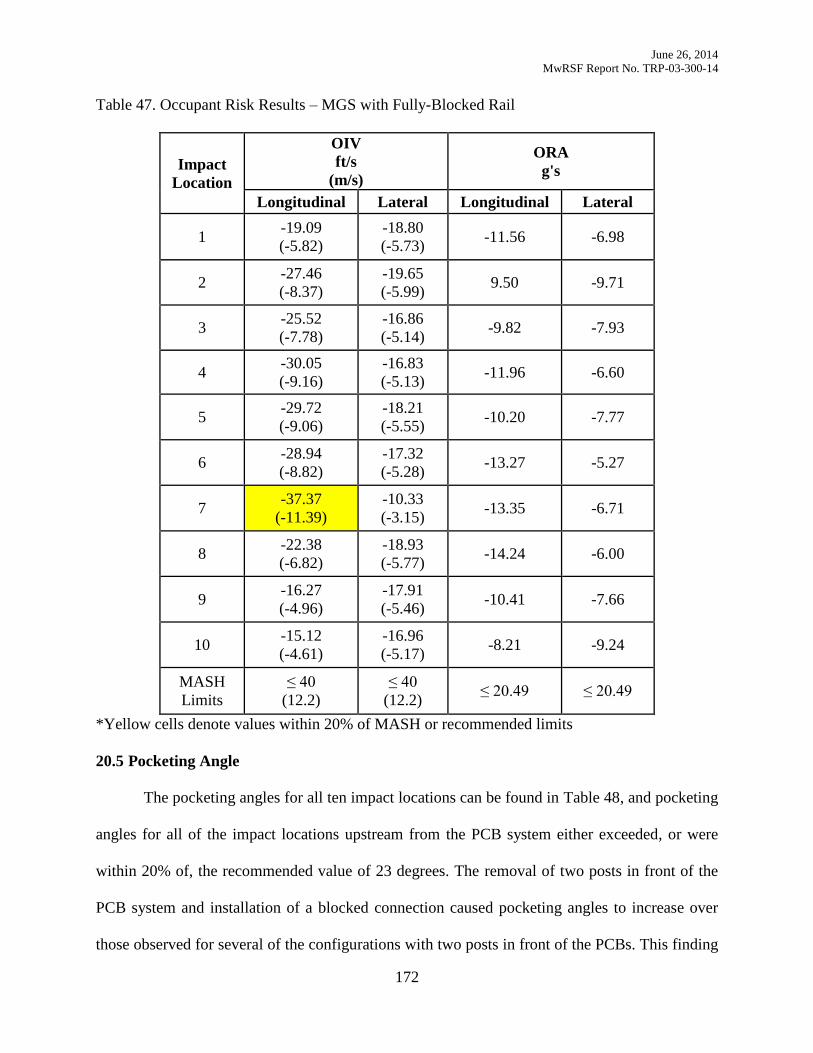
June 26, 2014
MwRSF Report No. TRP-03-300-14
172
Table 47. Occupant Risk Results – MGS with Fully-Blocked Rail
Impact
Location
OIV
ft/s
(m/s)
ORA
g's
Longitudinal Lateral Longitudinal Lateral
1 -19.09
(-5.82)
-18.80
(-5.73) -11.56 -6.98
2 -27.46
(-8.37)
-19.65
(-5.99) 9.50 -9.71
3 -25.52
(-7.78)
-16.86
(-5.14) -9.82 -7.93
4 -30.05
(-9.16)
-16.83
(-5.13) -11.96 -6.60
5 -29.72
(-9.06)
-18.21
(-5.55) -10.20 -7.77
6 -28.94
(-8.82)
-17.32
(-5.28) -13.27 -5.27
7 -37.37
(-11.39)
-10.33
(-3.15) -13.35 -6.71
8 -22.38
(-6.82)
-18.93
(-5.77) -14.24 -6.00
9 -16.27
(-4.96)
-17.91
(-5.46) -10.41 -7.66
10 -15.12
(-4.61)
-16.96
(-5.17) -8.21 -9.24
MASH
Limits
≤ 40
(12.2)
≤ 40
(12.2) ≤ 20.49 ≤ 20.49
*Yellow cells denote values within 20% of MASH or recommended limits
20.5 Pocketing Angle
The pocketing angles for all ten impact locations can be found in Table 48, and pocketing
angles for all of the impact locations upstream from the PCB system either exceeded, or were
within 20% of, the recommended value of 23 degrees. The removal of two posts in front of the
PCB system and installation of a blocked connection caused pocketing angles to increase over
those observed for several of the configurations with two posts in front of the PCBs. This finding
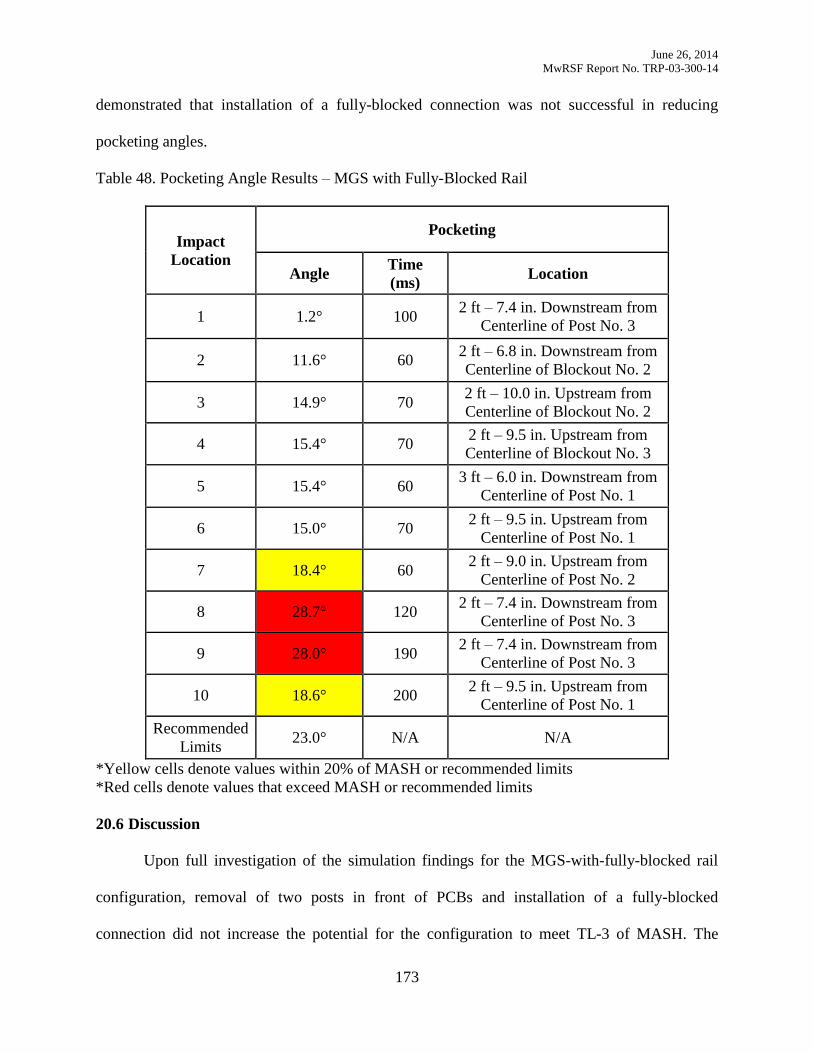
June 26, 2014
MwRSF Report No. TRP-03-300-14
173
demonstrated that installation of a fully-blocked connection was not successful in reducing
pocketing angles.
Table 48. Pocketing Angle Results – MGS with Fully-Blocked Rail
Impact
Location
Pocketing
Angle Time
(ms) Location
1 1.2° 100 2 ft – 7.4 in. Downstream from
Centerline of Post No. 3
2 11.6° 60 2 ft – 6.8 in. Downstream from
Centerline of Blockout No. 2
3 14.9° 70 2 ft – 10.0 in. Upstream from
Centerline of Blockout No. 2
4 15.4° 70 2 ft – 9.5 in. Upstream from
Centerline of Blockout No. 3
5 15.4° 60 3 ft – 6.0 in. Downstream from
Centerline of Post No. 1
6 15.0° 70 2 ft – 9.5 in. Upstream from
Centerline of Post No. 1
7 18.4° 60 2 ft – 9.0 in. Upstream from
Centerline of Post No. 2
8 28.7° 120 2 ft – 7.4 in. Downstream from
Centerline of Post No. 3
9 28.0° 190 2 ft – 7.4 in. Downstream from
Centerline of Post No. 3
10 18.6° 200 2 ft – 9.5 in. Upstream from
Centerline of Post No. 1
Recommended
Limits 23.0° N/A N/A
*Yellow cells denote values within 20% of MASH or recommended limits
*Red cells denote values that exceed MASH or recommended limits
20.6 Discussion
Upon full investigation of the simulation findings for the MGS-with-fully-blocked rail
configuration, removal of two posts in front of PCBs and installation of a fully-blocked
connection did not increase the potential for the configuration to meet TL-3 of MASH. The

June 26, 2014
MwRSF Report No. TRP-03-300-14
174
longitudinal OIV for impact location no. 7 was within 20% of the MASH limits. Also, pocketing
angles for all four impact locations upstream from the PCB system either exceeded, or were
within 20% of, the recommended value of 23 degrees. Therefore, other options were explored to
create a safe transition design.
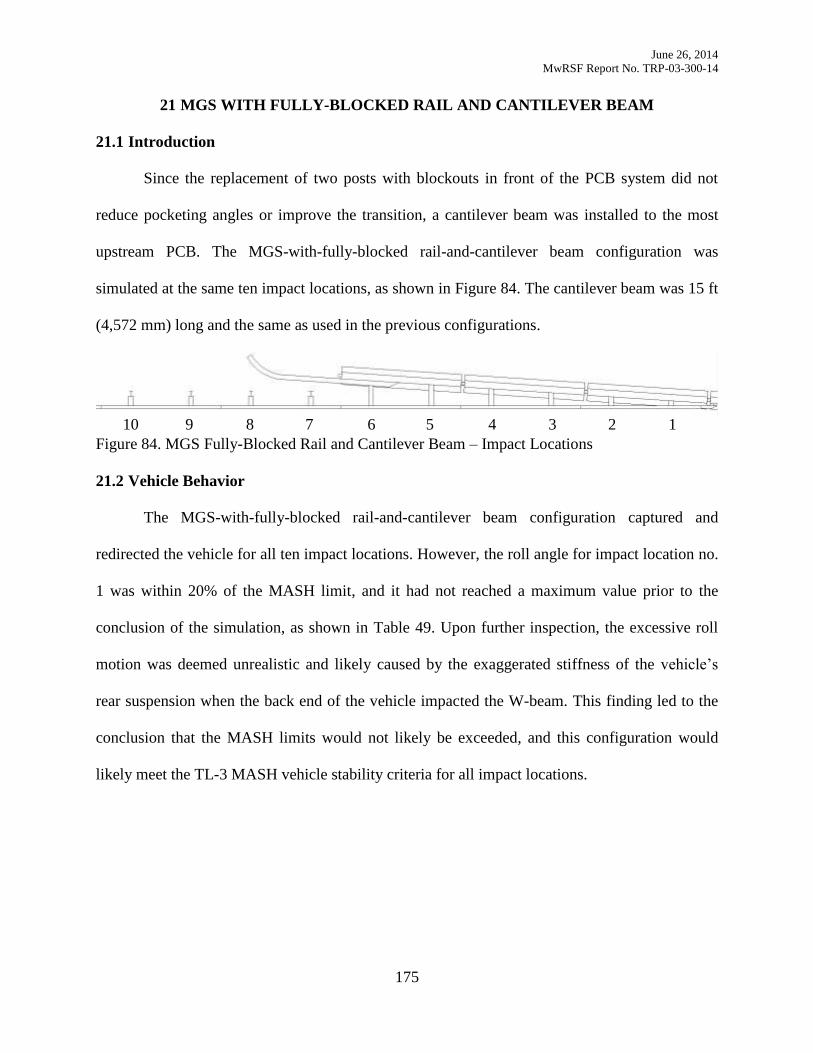
June 26, 2014
MwRSF Report No. TRP-03-300-14
175
MGS WITH FULLY-BLOCKED RAIL AND CANTILEVER BEAM 21
21.1 Introduction
Since the replacement of two posts with blockouts in front of the PCB system did not
reduce pocketing angles or improve the transition, a cantilever beam was installed to the most
upstream PCB. The MGS-with-fully-blocked rail-and-cantilever beam configuration was
simulated at the same ten impact locations, as shown in Figure 84. The cantilever beam was 15 ft
(4,572 mm) long and the same as used in the previous configurations.
Figure 84. MGS Fully-Blocked Rail and Cantilever Beam – Impact Locations
21.2 Vehicle Behavior
The MGS-with-fully-blocked rail-and-cantilever beam configuration captured and
redirected the vehicle for all ten impact locations. However, the roll angle for impact location no.
1 was within 20% of the MASH limit, and it had not reached a maximum value prior to the
conclusion of the simulation, as shown in Table 49. Upon further inspection, the excessive roll
motion was deemed unrealistic and likely caused by the exaggerated stiffness of the vehicle’s
rear suspension when the back end of the vehicle impacted the W-beam. This finding led to the
conclusion that the MASH limits would not likely be exceeded, and this configuration would
likely meet the TL-3 MASH vehicle stability criteria for all impact locations.
1 2 3 4 5 6 7 8 9 10
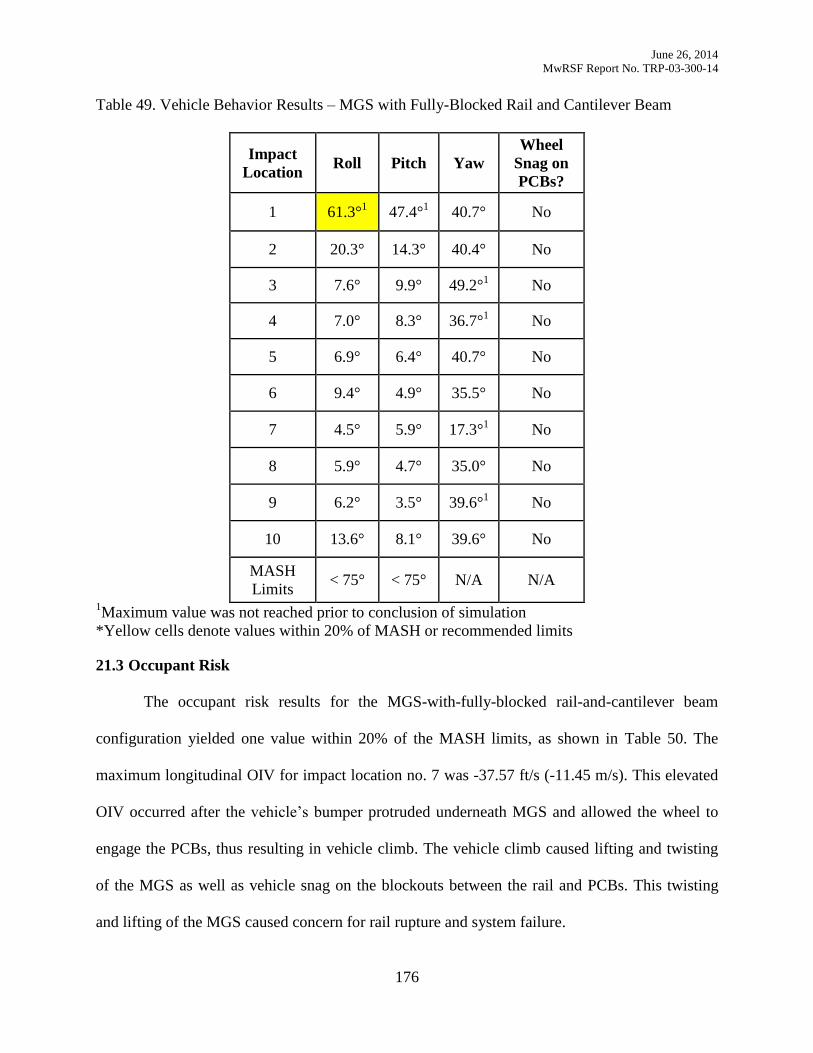
June 26, 2014
MwRSF Report No. TRP-03-300-14
176
Table 49. Vehicle Behavior Results – MGS with Fully-Blocked Rail and Cantilever Beam
Impact
Location Roll Pitch Yaw
Wheel
Snag on
PCBs?
1 61.3°1
47.4°1
40.7° No
2 20.3°
14.3° 40.4°
No
3 7.6°
9.9°
49.2°1
No
4 7.0°
8.3° 36.7°1
No
5 6.9°
6.4° 40.7°
No
6 9.4°
4.9°
35.5°
No
7 4.5° 5.9°
17.3°1
No
8 5.9° 4.7° 35.0°
No
9 6.2°
3.5° 39.6°1
No
10 13.6° 8.1°
39.6°
No
MASH
Limits < 75° < 75° N/A N/A
1Maximum value was not reached prior to conclusion of simulation
*Yellow cells denote values within 20% of MASH or recommended limits
21.3 Occupant Risk
The occupant risk results for the MGS-with-fully-blocked rail-and-cantilever beam
configuration yielded one value within 20% of the MASH limits, as shown in Table 50. The
maximum longitudinal OIV for impact location no. 7 was -37.57 ft/s (-11.45 m/s). This elevated
OIV occurred after the vehicle’s bumper protruded underneath MGS and allowed the wheel to
engage the PCBs, thus resulting in vehicle climb. The vehicle climb caused lifting and twisting
of the MGS as well as vehicle snag on the blockouts between the rail and PCBs. This twisting
and lifting of the MGS caused concern for rail rupture and system failure.
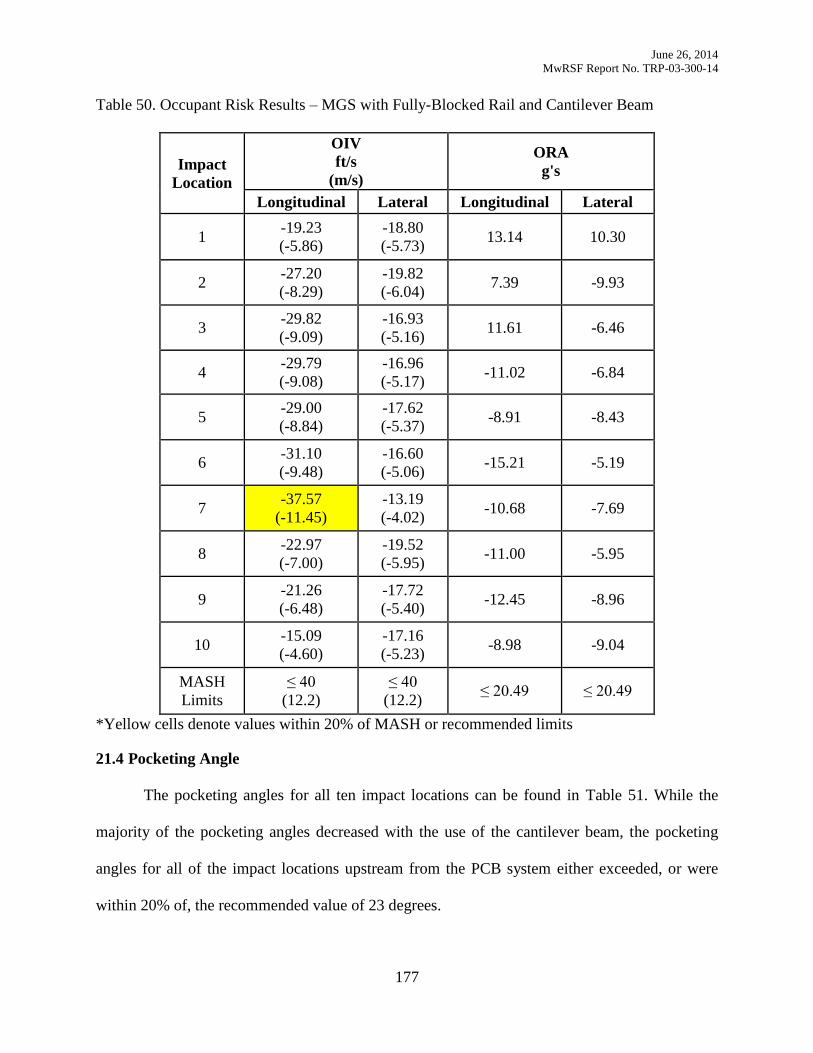
June 26, 2014
MwRSF Report No. TRP-03-300-14
177
Table 50. Occupant Risk Results – MGS with Fully-Blocked Rail and Cantilever Beam
Impact
Location
OIV
ft/s
(m/s)
ORA
g's
Longitudinal Lateral Longitudinal Lateral
1 -19.23
(-5.86)
-18.80
(-5.73) 13.14 10.30
2 -27.20
(-8.29)
-19.82
(-6.04) 7.39 -9.93
3 -29.82
(-9.09)
-16.93
(-5.16) 11.61 -6.46
4 -29.79
(-9.08)
-16.96
(-5.17) -11.02 -6.84
5 -29.00
(-8.84)
-17.62
(-5.37) -8.91 -8.43
6 -31.10
(-9.48)
-16.60
(-5.06) -15.21 -5.19
7 -37.57
(-11.45)
-13.19
(-4.02) -10.68 -7.69
8 -22.97
(-7.00)
-19.52
(-5.95) -11.00 -5.95
9 -21.26
(-6.48)
-17.72
(-5.40) -12.45 -8.96
10 -15.09
(-4.60)
-17.16
(-5.23) -8.98 -9.04
MASH
Limits
≤ 40
(12.2)
≤ 40
(12.2) ≤ 20.49 ≤ 20.49
*Yellow cells denote values within 20% of MASH or recommended limits
21.4 Pocketing Angle
The pocketing angles for all ten impact locations can be found in Table 51. While the
majority of the pocketing angles decreased with the use of the cantilever beam, the pocketing
angles for all of the impact locations upstream from the PCB system either exceeded, or were
within 20% of, the recommended value of 23 degrees.
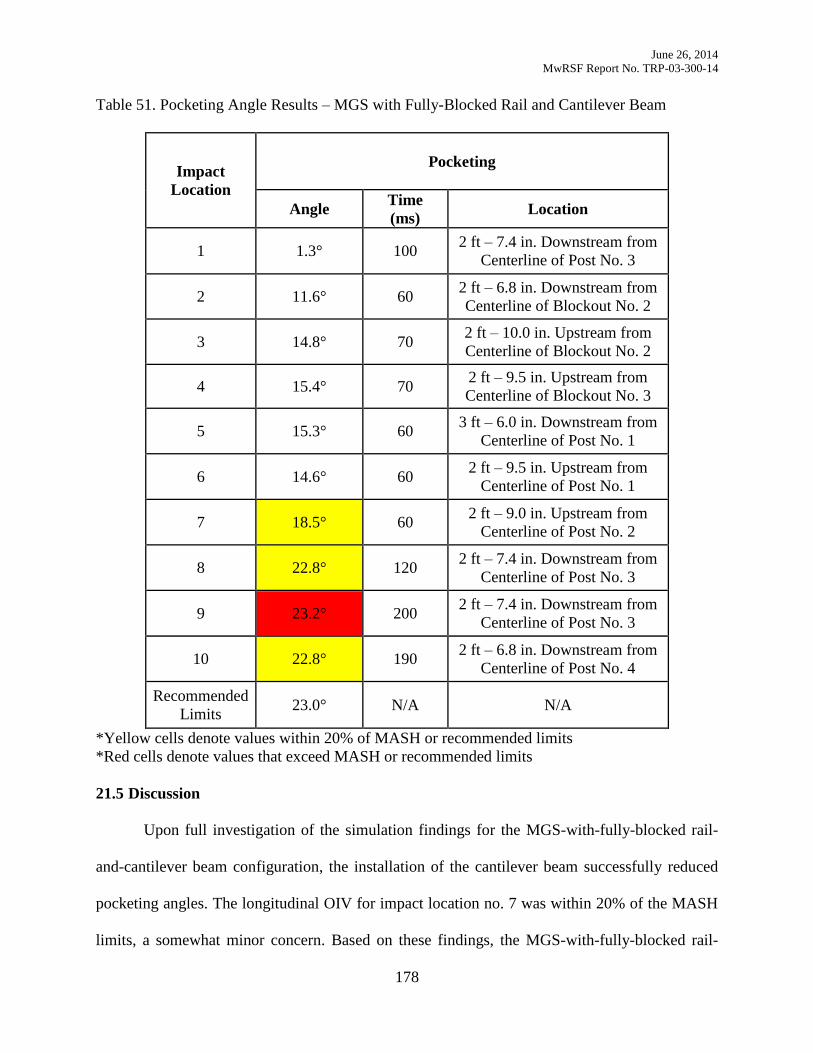
June 26, 2014
MwRSF Report No. TRP-03-300-14
178
Table 51. Pocketing Angle Results – MGS with Fully-Blocked Rail and Cantilever Beam
Impact
Location
Pocketing
Angle Time
(ms) Location
1 1.3° 100 2 ft – 7.4 in. Downstream from
Centerline of Post No. 3
2 11.6° 60 2 ft – 6.8 in. Downstream from
Centerline of Blockout No. 2
3 14.8° 70 2 ft – 10.0 in. Upstream from
Centerline of Blockout No. 2
4 15.4° 70 2 ft – 9.5 in. Upstream from
Centerline of Blockout No. 3
5 15.3° 60 3 ft – 6.0 in. Downstream from
Centerline of Post No. 1
6 14.6° 60 2 ft – 9.5 in. Upstream from
Centerline of Post No. 1
7 18.5° 60 2 ft – 9.0 in. Upstream from
Centerline of Post No. 2
8 22.8° 120 2 ft – 7.4 in. Downstream from
Centerline of Post No. 3
9 23.2° 200 2 ft – 7.4 in. Downstream from
Centerline of Post No. 3
10 22.8° 190 2 ft – 6.8 in. Downstream from
Centerline of Post No. 4
Recommended
Limits 23.0° N/A N/A
*Yellow cells denote values within 20% of MASH or recommended limits
*Red cells denote values that exceed MASH or recommended limits
21.5 Discussion
Upon full investigation of the simulation findings for the MGS-with-fully-blocked rail-
and-cantilever beam configuration, the installation of the cantilever beam successfully reduced
pocketing angles. The longitudinal OIV for impact location no. 7 was within 20% of the MASH
limits, a somewhat minor concern. Based on these findings, the MGS-with-fully-blocked rail-

June 26, 2014
MwRSF Report No. TRP-03-300-14
179
and-cantilever beam configuration had the second highest probability of successfully meeting the
TL-3 criteria outlined in MASH, just behind the nested-MGS configuration.
June 26, 2014
MwRSF Report No. TRP-03-300-14
180
FLARED PCB–MGS DESIGN CONCEPT SUMMARY 22
22.1 Introduction
Upon completion of the simulation study for the Flared PCB–MGS design concept, the
results were reviewed and compared, as was previously completed for the Flared PCB–Modified
G4(1S) and the Parallel PCB–Modified G4(1S) design concepts in Chapter 14.
22.2 Flared PCB–MGS Design Concept
The Flared PCB–MGS design concept was similar to the Flared PCB–Modified G4(1S)
design concept, except MGS was connected to the 15H:1V flared PCB system in lieu of
modified G4(1S). The MGS was connected to the upstream end of the fourth PCB segment with
three PCBs extending behind the rail. Although simulation results for the modified G4(1S)
indicated that posts in front of PCBs would deform and wedge against the face of PCBs, the
higher MGS was believed capable to capture and redirect the 2270P vehicle with reduced
instabilities. Thus, two posts remained in front of the PCB system. Posts were removed when
they interfered with placement of the PCB system, but blockouts were installed in their place.
Simulation results for the MGS-end-shoe configuration yielded high occupant risk values
due to vehicle snag, and pocketing angles were a concern for impacts upstream from the PCB
system. To initiate PCB displacement earlier in the event, blockouts were installed from the back
of the posts to the face of the PCBs. Simulation results for the MGS-with-blockouts-behind-posts
configuration indicated that the additional blockouts stiffened the barrier system, as the posts had
to overcome post-soil resistance, PCB inertial resistance, and barrier friction. This increased
resistance resulted in high pocketing angles upstream from the PCB system and elevated
occupant risk values, which led to the conclusion that blockouts from posts to PCBs should not
be used.
June 26, 2014
MwRSF Report No. TRP-03-300-14
181
The next configuration utilized a cantilever beam on the upstream PCB to allow specific
posts to rotate into and contact the cantilever beam in order to initiate PCB displacement. The
simulation results for the MGS-with-cantilever beam configuration indicated that pocketing
angles were reduced for impacts upstream from the PCB system, but they were still too high.
For the next configuration, a blockout was installed between a post and the cantilever
beam, which could initiate PCB displacement earlier in the event. However, simulation results
for the MGS-with-blockout-to-cantilever beam configuration indicated that the blockout to the
cantilever beam stiffened the barrier system, as the post had to overcome post-soil resistance,
PCB inertial resistance, and barrier friction. As such, a blockout between the cantilever beam
should not be used.
In the next configuration, the MGS was nested upstream and in front of the PCB system,
which would stiffen the barrier system and lower pocketing angles. The simulation results for the
nested-MGS configuration showed that occupant risk values and pocketing angles were reduced
to acceptable levels for all impact locations. Some of the early configurations indicated that
vehicle snag occurred on PCBs, and the next configuration attempted to alleviate snag by
removal of posts in front of PCBs but with blockouts installed in their place.
The simulation results for the MGS-with-fully-blocked rail configuration indicated that
vehicle snag on PCBs was eliminated, but pocketing angles were significantly higher for impacts
upstream from the PCB system. Therefore, a final configuration utilized a cantilever beam on the
most upstream PCB. The simulation results for the MGS-with-fully-blocked rail-and-cantilever
beam configuration indicated that vehicle snag on PCBs did not occur. Although pocketing
angles decreased, they were still marginal. Based on these results, the Flared PCB–MGS
configurations were ranked, as shown below:
(1) Nested MGS,
June 26, 2014
MwRSF Report No. TRP-03-300-14
182
(2) MGS with Fully-Blocked Rail and Cantilever Beam,
(3) MGS with Cantilever Beam,
(4) MGS with Blockout to Cantilever Beam,
(5) MGS End-Shoe,
(6) MGS with Fully-Blocked Rail, and
(7) MGS with Blockouts Behind Posts.
June 26, 2014
MwRSF Report No. TRP-03-300-14
183
SELECTION OF PREFERRED DESIGN ALTERNATIVES 23
23.1 Introduction
Previously, the Flared PCB–Modified G4(1S), Parallel PCB–Modified G4(1S), and
Flared PCB–MGS design concepts were simulated with several configurations. These
configurations were summarized within their respective design concept. Now, all three design
concepts with their respective configurations will be summarized and ranked together in order to
select preferred design alternatives.
23.2 Design Summary and Selection
In order to select preferred design alternatives, a summary of results for all three design
concepts with subsequent configurations was prepared, as shown in Tables 52 and 53. The
maximum value for each evaluation metric was tabulated at each configuration. The minimum
value for each metric was then highlighted within each design concept in order to better
understand which configurations represented the safest transition design. Several metrics were
also noted, including number of impact locations with values exceeding the MASH or
recommended limit, number of impact locations with values within 20 percent of the MASH or
recommended limit, and number of values that were deemed realistic or likely representative of a
physical phenomenon. As previously explained, several high roll angles and occupant risk values
were attributed to an overly stiff rear suspension in the Chevrolet Silverado pickup truck model.
They were not deemed accurate and thus should not be heavily considered when selecting
preferred design alternatives.
As each design concept was discussed, the configurations were weighed by the number of
highlighted cells that each possessed, the number of values that exceeded or were within 20% of
MASH or recommend limits, amount of vehicle snag, practicality, and ease of installation.
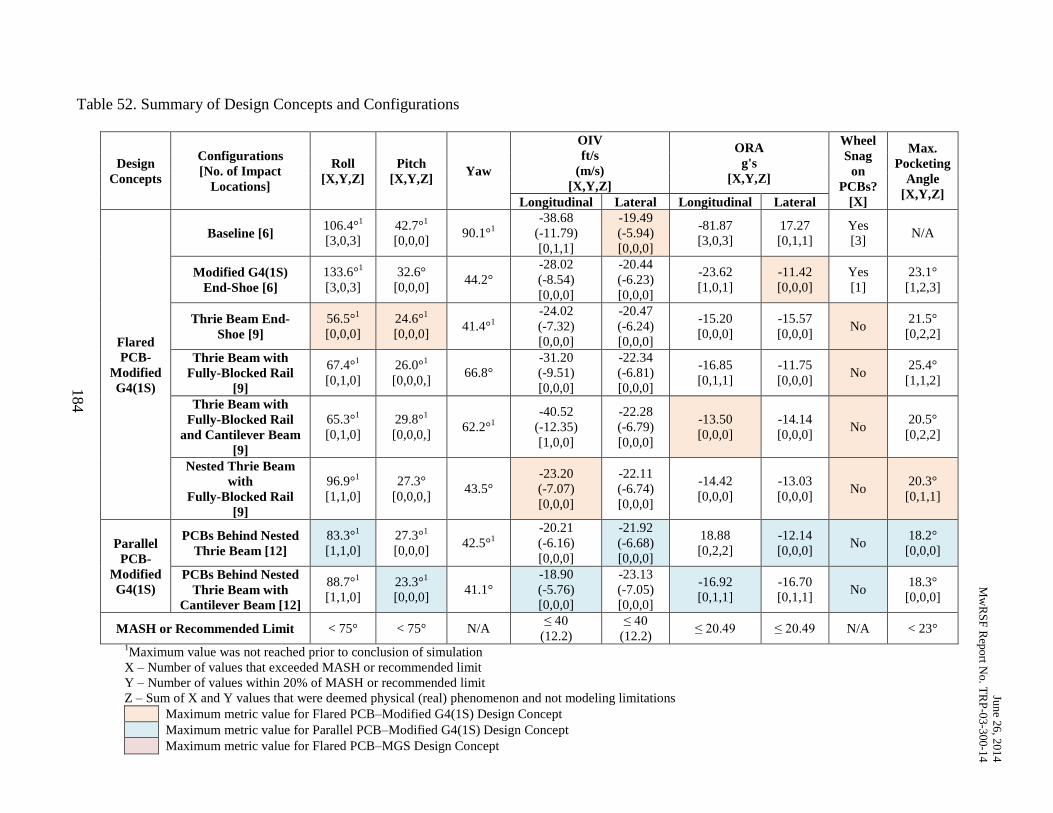
Jun
e 26
, 201
4
Mw
RS
F R
epo
rt No. T
RP
-03
-300-1
4
184
Table 52. Summary of Design Concepts and Configurations
Design
Concepts
Configurations
[No. of Impact
Locations]
Roll
[X,Y,Z]
Pitch
[X,Y,Z] Yaw
OIV
ft/s
(m/s)
[X,Y,Z]
ORA
g's
[X,Y,Z]
Wheel
Snag
on
PCBs?
[X]
Max.
Pocketing
Angle
[X,Y,Z] Longitudinal Lateral Longitudinal Lateral
Flared
PCB-
Modified
G4(1S)
Baseline [6] 106.4°
1
[3,0,3]
42.7°1
[0,0,0] 90.1°
1
-38.68
(-11.79)
[0,1,1]
-19.49
(-5.94)
[0,0,0]
-81.87
[3,0,3]
17.27
[0,1,1]
Yes
[3] N/A
Modified G4(1S)
End-Shoe [6]
133.6°1
[3,0,3]
32.6°
[0,0,0] 44.2°
-28.02
(-8.54)
[0,0,0]
-20.44
(-6.23)
[0,0,0]
-23.62
[1,0,1]
-11.42
[0,0,0]
Yes
[1]
23.1°
[1,2,3]
Thrie Beam End-
Shoe [9]
56.5°1
[0,0,0]
24.6°1
[0,0,0] 41.4°
1
-24.02
(-7.32)
[0,0,0]
-20.47
(-6.24)
[0,0,0]
-15.20
[0,0,0]
-15.57
[0,0,0] No
21.5°
[0,2,2]
Thrie Beam with
Fully-Blocked Rail
[9]
67.4°1
[0,1,0]
26.0°1
[0,0,0,] 66.8°
-31.20
(-9.51)
[0,0,0]
-22.34
(-6.81)
[0,0,0]
-16.85
[0,1,1]
-11.75
[0,0,0] No
25.4°
[1,1,2]
Thrie Beam with
Fully-Blocked Rail
and Cantilever Beam
[9]
65.3°1
[0,1,0]
29.8°1
[0,0,0,] 62.2°
1
-40.52
(-12.35)
[1,0,0]
-22.28
(-6.79)
[0,0,0]
-13.50
[0,0,0]
-14.14
[0,0,0] No
20.5°
[0,2,2]
Nested Thrie Beam
with
Fully-Blocked Rail
[9]
96.9°1
[1,1,0]
27.3°
[0,0,0,] 43.5°
-23.20
(-7.07)
[0,0,0]
-22.11
(-6.74)
[0,0,0]
-14.42
[0,0,0]
-13.03
[0,0,0] No
20.3°
[0,1,1]
Parallel
PCB-
Modified
G4(1S)
PCBs Behind Nested
Thrie Beam [12]
83.3°1
[1,1,0]
27.3°1
[0,0,0] 42.5°
1
-20.21
(-6.16)
[0,0,0]
-21.92
(-6.68)
[0,0,0]
18.88
[0,2,2]
-12.14
[0,0,0] No
18.2°
[0,0,0]
PCBs Behind Nested
Thrie Beam with
Cantilever Beam [12]
88.7°1
[1,1,0]
23.3°1
[0,0,0] 41.1°
-18.90
(-5.76)
[0,0,0]
-23.13
(-7.05)
[0,0,0]
-16.92
[0,1,1]
-16.70
[0,1,1] No
18.3°
[0,0,0]
MASH or Recommended Limit < 75° < 75° N/A ≤ 40
(12.2)
≤ 40
(12.2) ≤ 20.49 ≤ 20.49 N/A < 23°
1Maximum value was not reached prior to conclusion of simulation
X – Number of values that exceeded MASH or recommended limit
Y – Number of values within 20% of MASH or recommended limit
Z – Sum of X and Y values that were deemed physical (real) phenomenon and not modeling limitations Maximum metric value for Flared PCB–Modified G4(1S) Design Concept Maximum metric value for Parallel PCB–Modified G4(1S) Design Concept Maximum metric value for Flared PCB–MGS Design Concept
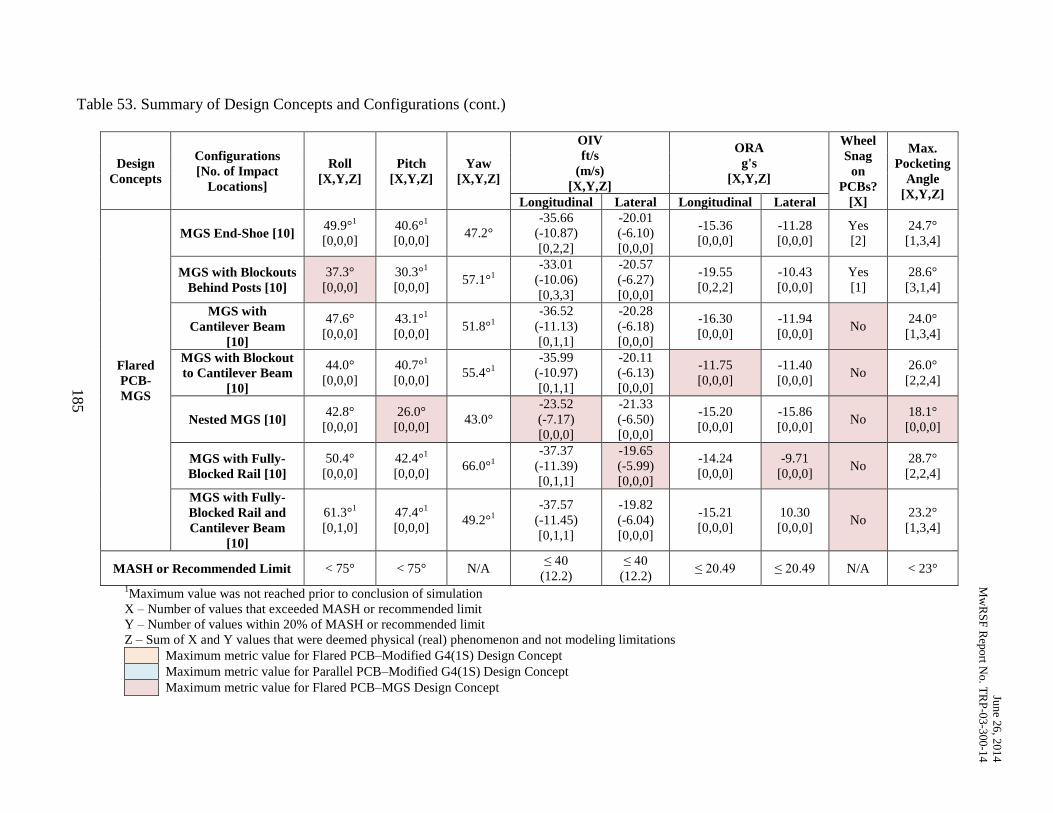
Jun
e 26
, 201
4
Mw
RS
F R
epo
rt No. T
RP
-03
-300-1
4
185
Table 53. Summary of Design Concepts and Configurations (cont.)
Design
Concepts
Configurations
[No. of Impact
Locations]
Roll
[X,Y,Z]
Pitch
[X,Y,Z]
Yaw
[X,Y,Z]
OIV
ft/s
(m/s)
[X,Y,Z]
ORA
g's
[X,Y,Z]
Wheel
Snag
on
PCBs?
[X]
Max.
Pocketing
Angle
[X,Y,Z] Longitudinal Lateral Longitudinal Lateral
Flared
PCB-
MGS
MGS End-Shoe [10] 49.9°
1
[0,0,0]
40.6°1
[0,0,0] 47.2°
-35.66
(-10.87)
[0,2,2]
-20.01
(-6.10)
[0,0,0]
-15.36
[0,0,0]
-11.28
[0,0,0]
Yes
[2]
24.7°
[1,3,4]
MGS with Blockouts
Behind Posts [10]
37.3°
[0,0,0]
30.3°1
[0,0,0] 57.1°
1
-33.01
(-10.06)
[0,3,3]
-20.57
(-6.27)
[0,0,0]
-19.55
[0,2,2]
-10.43
[0,0,0]
Yes
[1]
28.6°
[3,1,4]
MGS with
Cantilever Beam
[10]
47.6°
[0,0,0]
43.1°1
[0,0,0] 51.8°
1
-36.52
(-11.13)
[0,1,1]
-20.28
(-6.18)
[0,0,0]
-16.30
[0,0,0]
-11.94
[0,0,0] No
24.0°
[1,3,4]
MGS with Blockout
to Cantilever Beam
[10]
44.0°
[0,0,0]
40.7°1
[0,0,0] 55.4°
1
-35.99
(-10.97)
[0,1,1]
-20.11
(-6.13)
[0,0,0]
-11.75
[0,0,0]
-11.40
[0,0,0] No
26.0°
[2,2,4]
Nested MGS [10] 42.8°
[0,0,0]
26.0°
[0,0,0] 43.0°
-23.52
(-7.17)
[0,0,0]
-21.33
(-6.50)
[0,0,0]
-15.20
[0,0,0]
-15.86
[0,0,0] No
18.1°
[0,0,0]
MGS with Fully-
Blocked Rail [10]
50.4°
[0,0,0]
42.4°1
[0,0,0] 66.0°
1
-37.37
(-11.39)
[0,1,1]
-19.65
(-5.99)
[0,0,0]
-14.24
[0,0,0]
-9.71
[0,0,0] No
28.7°
[2,2,4]
MGS with Fully-
Blocked Rail and
Cantilever Beam
[10]
61.3°1
[0,1,0]
47.4°1
[0,0,0] 49.2°
1
-37.57
(-11.45)
[0,1,1]
-19.82
(-6.04)
[0,0,0]
-15.21
[0,0,0]
10.30
[0,0,0] No
23.2°
[1,3,4]
MASH or Recommended Limit < 75° < 75° N/A ≤ 40
(12.2)
≤ 40
(12.2) ≤ 20.49 ≤ 20.49 N/A < 23°
1Maximum value was not reached prior to conclusion of simulation
X – Number of values that exceeded MASH or recommended limit
Y – Number of values within 20% of MASH or recommended limit
Z – Sum of X and Y values that were deemed physical (real) phenomenon and not modeling limitations Maximum metric value for Flared PCB–Modified G4(1S) Design Concept Maximum metric value for Parallel PCB–Modified G4(1S) Design Concept Maximum metric value for Flared PCB–MGS Design Concept
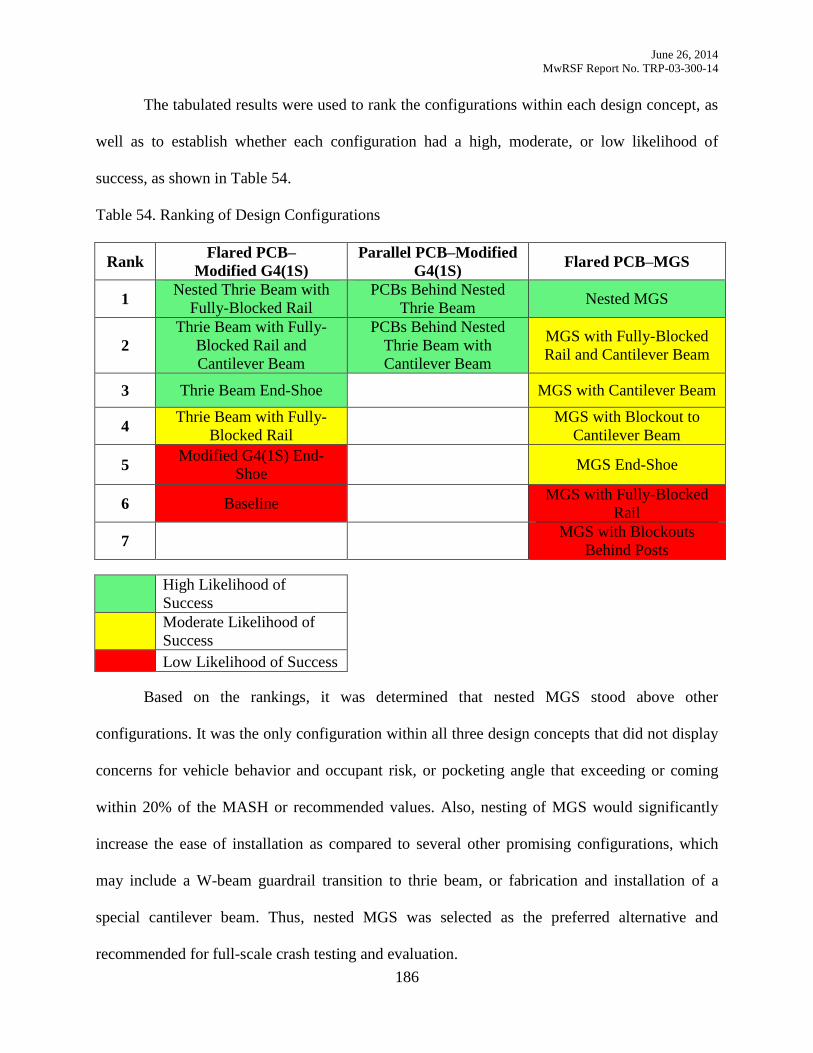
June 26, 2014
MwRSF Report No. TRP-03-300-14
186
The tabulated results were used to rank the configurations within each design concept, as
well as to establish whether each configuration had a high, moderate, or low likelihood of
success, as shown in Table 54.
Table 54. Ranking of Design Configurations
Rank Flared PCB–
Modified G4(1S)
Parallel PCB–Modified
G4(1S) Flared PCB–MGS
1 Nested Thrie Beam with
Fully-Blocked Rail
PCBs Behind Nested
Thrie Beam Nested MGS
2
Thrie Beam with Fully-
Blocked Rail and
Cantilever Beam
PCBs Behind Nested
Thrie Beam with
Cantilever Beam
MGS with Fully-Blocked
Rail and Cantilever Beam
3 Thrie Beam End-Shoe MGS with Cantilever Beam
4 Thrie Beam with Fully-
Blocked Rail
MGS with Blockout to
Cantilever Beam
5 Modified G4(1S) End-
Shoe MGS End-Shoe
6 Baseline MGS with Fully-Blocked
Rail
7 MGS with Blockouts
Behind Posts
High Likelihood of
Success
Moderate Likelihood of
Success Low Likelihood of Success
Based on the rankings, it was determined that nested MGS stood above other
configurations. It was the only configuration within all three design concepts that did not display
concerns for vehicle behavior and occupant risk, or pocketing angle that exceeding or coming
within 20% of the MASH or recommended values. Also, nesting of MGS would significantly
increase the ease of installation as compared to several other promising configurations, which
may include a W-beam guardrail transition to thrie beam, or fabrication and installation of a
special cantilever beam. Thus, nested MGS was selected as the preferred alternative and
recommended for full-scale crash testing and evaluation.
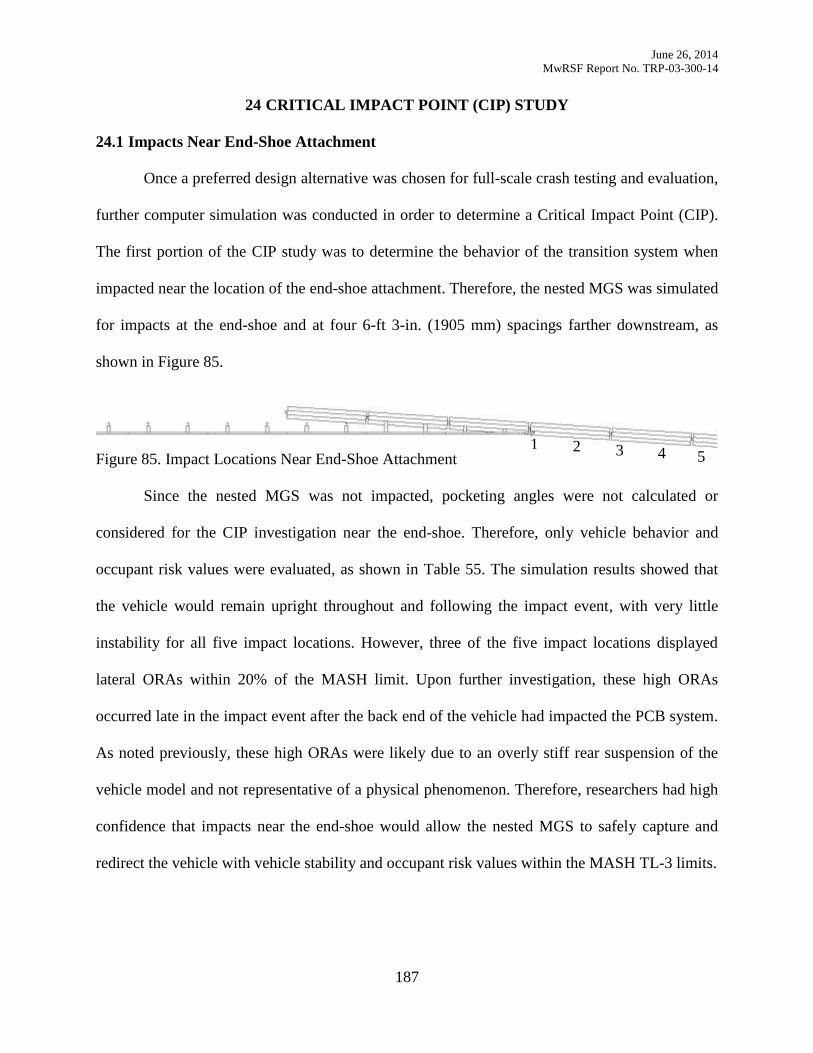
June 26, 2014
MwRSF Report No. TRP-03-300-14
187
CRITICAL IMPACT POINT (CIP) STUDY 24
24.1 Impacts Near End-Shoe Attachment
Once a preferred design alternative was chosen for full-scale crash testing and evaluation,
further computer simulation was conducted in order to determine a Critical Impact Point (CIP).
The first portion of the CIP study was to determine the behavior of the transition system when
impacted near the location of the end-shoe attachment. Therefore, the nested MGS was simulated
for impacts at the end-shoe and at four 6-ft 3-in. (1905 mm) spacings farther downstream, as
shown in Figure 85.
Figure 85. Impact Locations Near End-Shoe Attachment
Since the nested MGS was not impacted, pocketing angles were not calculated or
considered for the CIP investigation near the end-shoe. Therefore, only vehicle behavior and
occupant risk values were evaluated, as shown in Table 55. The simulation results showed that
the vehicle would remain upright throughout and following the impact event, with very little
instability for all five impact locations. However, three of the five impact locations displayed
lateral ORAs within 20% of the MASH limit. Upon further investigation, these high ORAs
occurred late in the impact event after the back end of the vehicle had impacted the PCB system.
As noted previously, these high ORAs were likely due to an overly stiff rear suspension of the
vehicle model and not representative of a physical phenomenon. Therefore, researchers had high
confidence that impacts near the end-shoe would allow the nested MGS to safely capture and
redirect the vehicle with vehicle stability and occupant risk values within the MASH TL-3 limits.
1 2 3 4 5
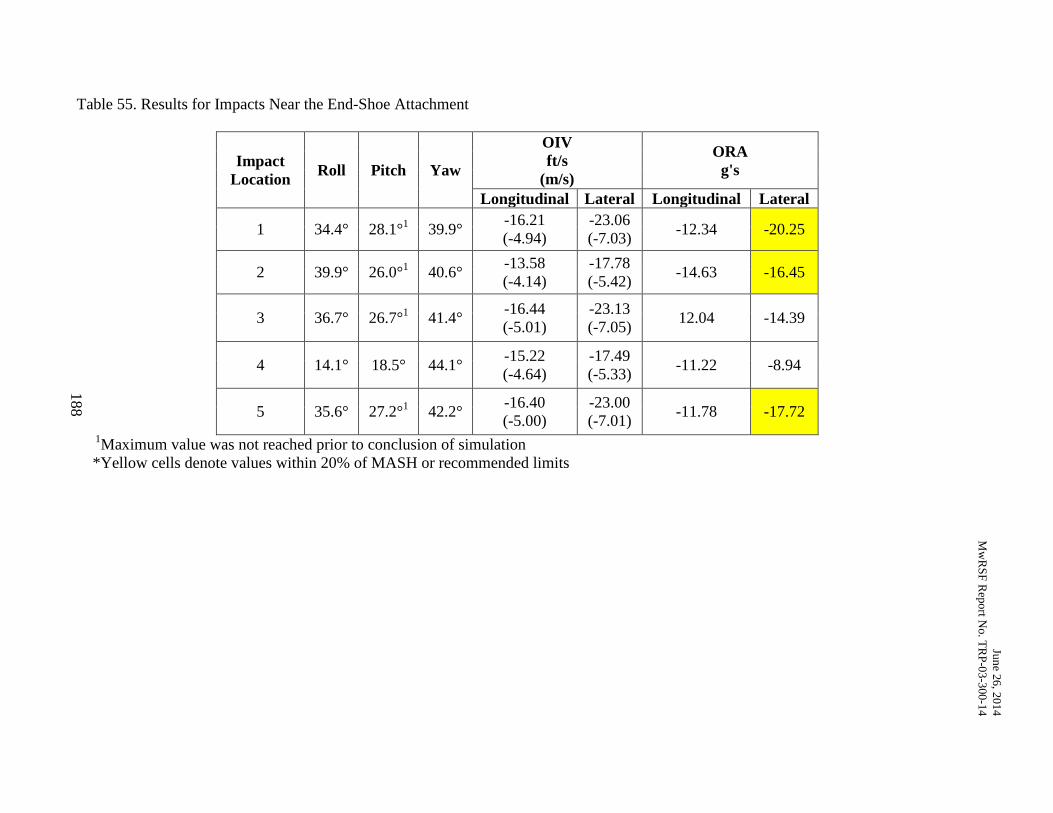
Jun
e 26
, 201
4
Mw
RS
F R
epo
rt No. T
RP
-03
-300-1
4
188
Table 55. Results for Impacts Near the End-Shoe Attachment
Impact
Location Roll Pitch Yaw
OIV
ft/s
(m/s)
ORA
g's
Longitudinal Lateral Longitudinal Lateral
1 34.4° 28.1°1 39.9°
-16.21
(-4.94)
-23.06
(-7.03) -12.34 -20.25
2 39.9° 26.0°1 40.6°
-13.58
(-4.14)
-17.78
(-5.42) -14.63 -16.45
3 36.7° 26.7°1 41.4°
-16.44
(-5.01)
-23.13
(-7.05) 12.04 -14.39
4 14.1° 18.5° 44.1° -15.22
(-4.64)
-17.49
(-5.33) -11.22 -8.94
5 35.6° 27.2°1 42.2°
-16.40
(-5.00)
-23.00
(-7.01) -11.78 -17.72
1Maximum value was not reached prior to conclusion of simulation
*Yellow cells denote values within 20% of MASH or recommended limits
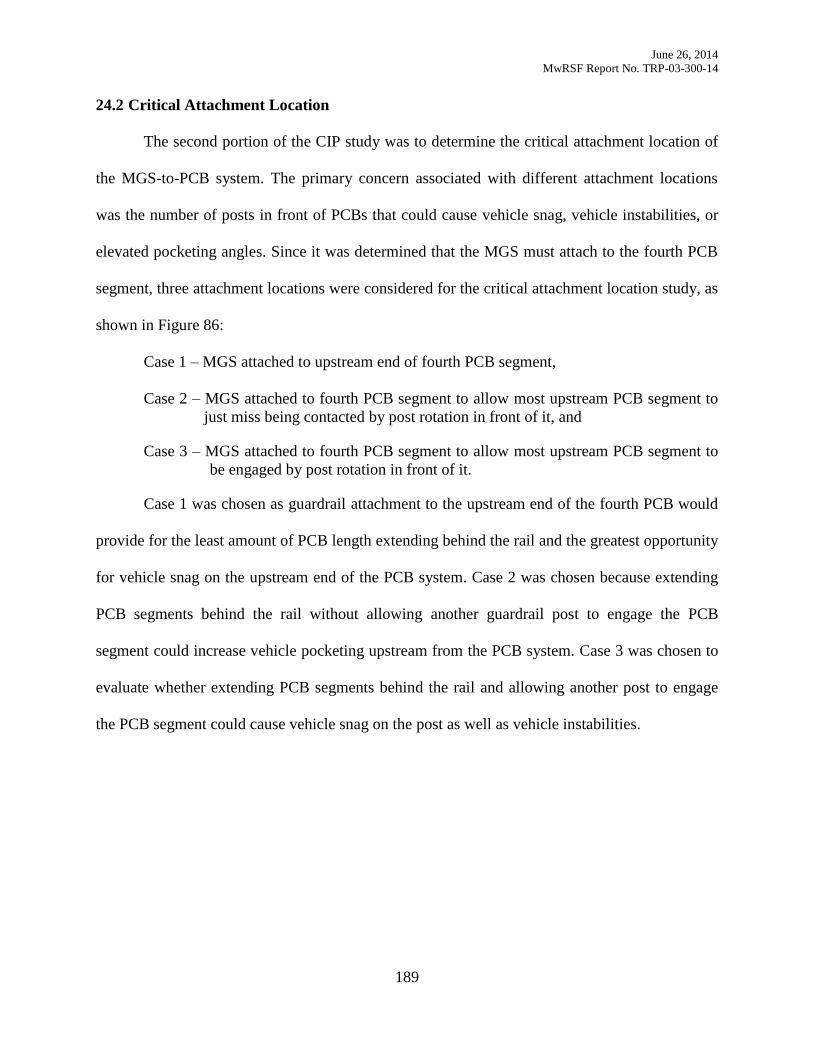
June 26, 2014
MwRSF Report No. TRP-03-300-14
189
24.2 Critical Attachment Location
The second portion of the CIP study was to determine the critical attachment location of
the MGS-to-PCB system. The primary concern associated with different attachment locations
was the number of posts in front of PCBs that could cause vehicle snag, vehicle instabilities, or
elevated pocketing angles. Since it was determined that the MGS must attach to the fourth PCB
segment, three attachment locations were considered for the critical attachment location study, as
shown in Figure 86:
Case 1 – MGS attached to upstream end of fourth PCB segment,
Case 2 – MGS attached to fourth PCB segment to allow most upstream PCB segment to
just miss being contacted by post rotation in front of it, and
Case 3 – MGS attached to fourth PCB segment to allow most upstream PCB segment to
be engaged by post rotation in front of it.
Case 1 was chosen as guardrail attachment to the upstream end of the fourth PCB would
provide for the least amount of PCB length extending behind the rail and the greatest opportunity
for vehicle snag on the upstream end of the PCB system. Case 2 was chosen because extending
PCB segments behind the rail without allowing another guardrail post to engage the PCB
segment could increase vehicle pocketing upstream from the PCB system. Case 3 was chosen to
evaluate whether extending PCB segments behind the rail and allowing another post to engage
the PCB segment could cause vehicle snag on the post as well as vehicle instabilities.
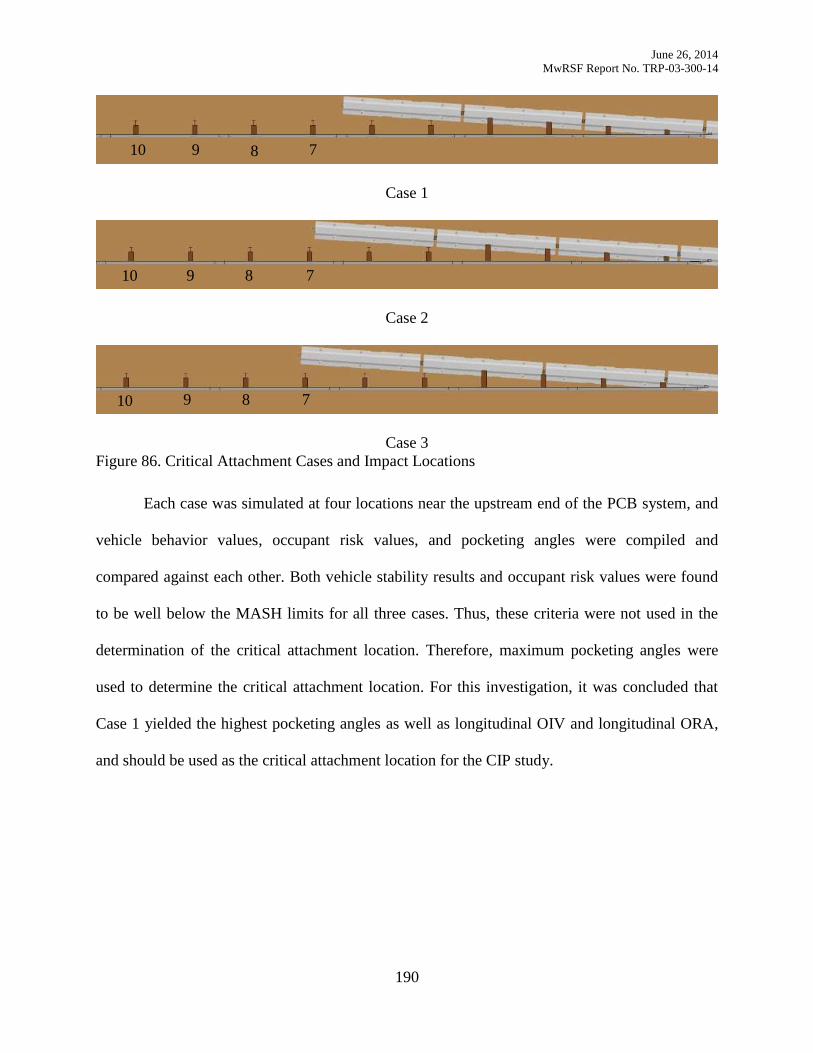
June 26, 2014
MwRSF Report No. TRP-03-300-14
190
Case 1
Case 2
Case 3
Figure 86. Critical Attachment Cases and Impact Locations
Each case was simulated at four locations near the upstream end of the PCB system, and
vehicle behavior values, occupant risk values, and pocketing angles were compiled and
compared against each other. Both vehicle stability results and occupant risk values were found
to be well below the MASH limits for all three cases. Thus, these criteria were not used in the
determination of the critical attachment location. Therefore, maximum pocketing angles were
used to determine the critical attachment location. For this investigation, it was concluded that
Case 1 yielded the highest pocketing angles as well as longitudinal OIV and longitudinal ORA,
and should be used as the critical attachment location for the CIP study.
7 8 9 10
7 8 9 10
10 9 8 7
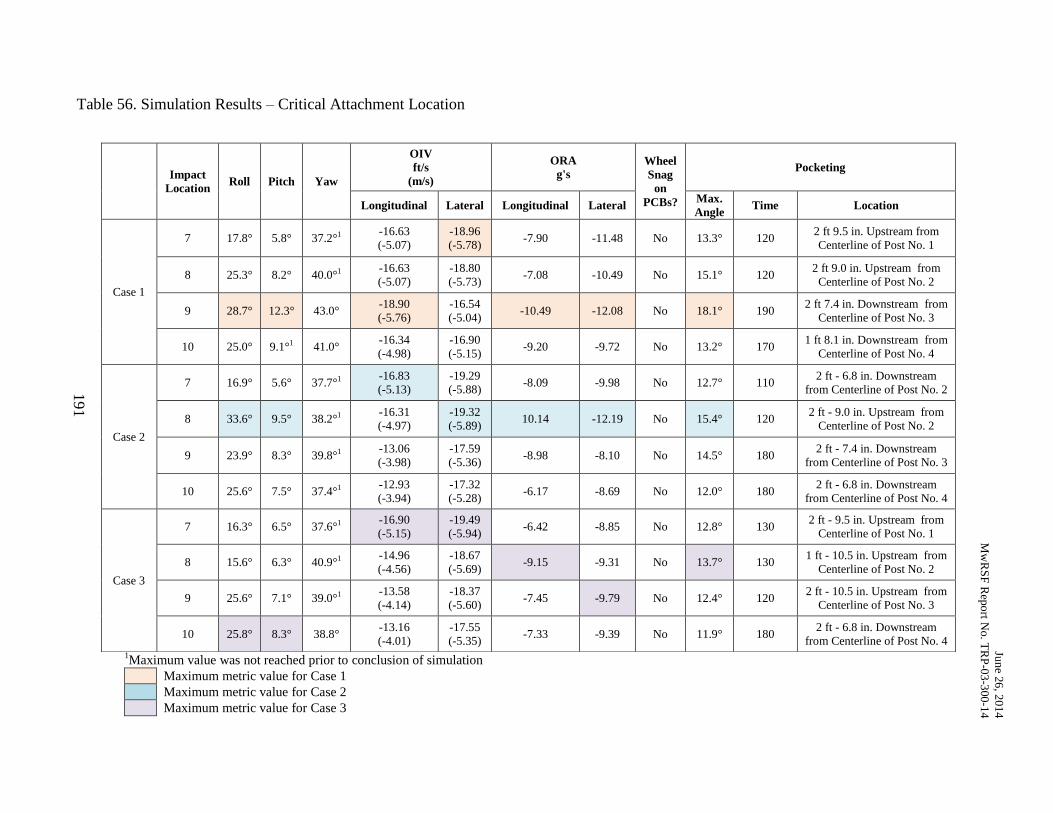
Jun
e 26
, 201
4
Mw
RS
F R
epo
rt No. T
RP
-03
-300-1
4
191
Table 56. Simulation Results – Critical Attachment Location
1Maximum value was not reached prior to conclusion of simulation Maximum metric value for Case 1 Maximum metric value for Case 2 Maximum metric value for Case 3
Impact
Location Roll Pitch Yaw
OIV
ft/s
(m/s)
ORA
g's
Wheel
Snag
on
PCBs?
Pocketing
Longitudinal Lateral Longitudinal Lateral Max.
Angle Time Location
Case 1
7 17.8° 5.8° 37.2°1 -16.63
(-5.07)
-18.96
(-5.78) -7.90 -11.48 No 13.3° 120
2 ft 9.5 in. Upstream from
Centerline of Post No. 1
8 25.3° 8.2° 40.0°1 -16.63
(-5.07)
-18.80
(-5.73) -7.08 -10.49 No 15.1° 120
2 ft 9.0 in. Upstream from
Centerline of Post No. 2
9 28.7° 12.3° 43.0° -18.90
(-5.76)
-16.54
(-5.04) -10.49 -12.08 No 18.1° 190
2 ft 7.4 in. Downstream from
Centerline of Post No. 3
10 25.0° 9.1°1 41.0° -16.34
(-4.98)
-16.90
(-5.15) -9.20 -9.72 No 13.2° 170
1 ft 8.1 in. Downstream from
Centerline of Post No. 4
Case 2
7 16.9° 5.6° 37.7°1 -16.83
(-5.13)
-19.29
(-5.88) -8.09 -9.98 No 12.7° 110
2 ft - 6.8 in. Downstream
from Centerline of Post No. 2
8 33.6° 9.5° 38.2°1 -16.31
(-4.97)
-19.32
(-5.89) 10.14 -12.19 No 15.4° 120
2 ft - 9.0 in. Upstream from
Centerline of Post No. 2
9 23.9° 8.3° 39.8°1 -13.06
(-3.98)
-17.59
(-5.36) -8.98 -8.10 No 14.5° 180
2 ft - 7.4 in. Downstream
from Centerline of Post No. 3
10 25.6° 7.5° 37.4°1 -12.93
(-3.94)
-17.32
(-5.28) -6.17 -8.69 No 12.0° 180
2 ft - 6.8 in. Downstream
from Centerline of Post No. 4
Case 3
7 16.3° 6.5° 37.6°1 -16.90
(-5.15)
-19.49
(-5.94) -6.42 -8.85 No 12.8° 130
2 ft - 9.5 in. Upstream from
Centerline of Post No. 1
8 15.6° 6.3° 40.9°1 -14.96
(-4.56)
-18.67
(-5.69) -9.15 -9.31 No 13.7° 130
1 ft - 10.5 in. Upstream from
Centerline of Post No. 2
9 25.6° 7.1° 39.0°1 -13.58
(-4.14)
-18.37
(-5.60) -7.45 -9.79 No 12.4° 120
2 ft - 10.5 in. Upstream from
Centerline of Post No. 3
10 25.8° 8.3° 38.8° -13.16
(-4.01)
-17.55
(-5.35) -7.33 -9.39 No 11.9° 180
2 ft - 6.8 in. Downstream
from Centerline of Post No. 4
June 26, 2014
MwRSF Report No. TRP-03-300-14
192
24.3 Critical Impact Location
Once a critical attachment location was determined, the final portion of the CIP study
was to find the worst-case impact location for use in a full-scale crash testing and evaluation
program. Case 1 was chosen as the worst-case attachment location and was actually used in
simulating the ten impacts for the nested-MGS configuration in Chapter 19. Therefore, the
simulation results from the original ten impact locations were reviewed again to determine the
CIP. Due to the vehicle behavior and occupant risk values being well below the MASH limits,
maximum pocketing angles were primarily evaluated for the nested-MGS configuration. Impact
location no. 9 had the highest pocketing angle of 18.1 degrees. Therefore, the general CIP region
was selected near impact location no. 9, and further simulations were conducted at 18¾-in. (476
mm) intervals (i.e., quarter-post spacings) between impact location nos. 8 and 10. The vehicle
stability, occupant risk, and pocketing angle results for these additional impact locations are
shown in Table 57.
It was found that impact location no. 9 had the highest roll, pitch, yaw, longitudinal OIV,
lateral ORA, and pocketing angle. Therefore, future full-scale crash testing of the nested-MGS
configuration should utilize impact location no. 9 as the CIP.
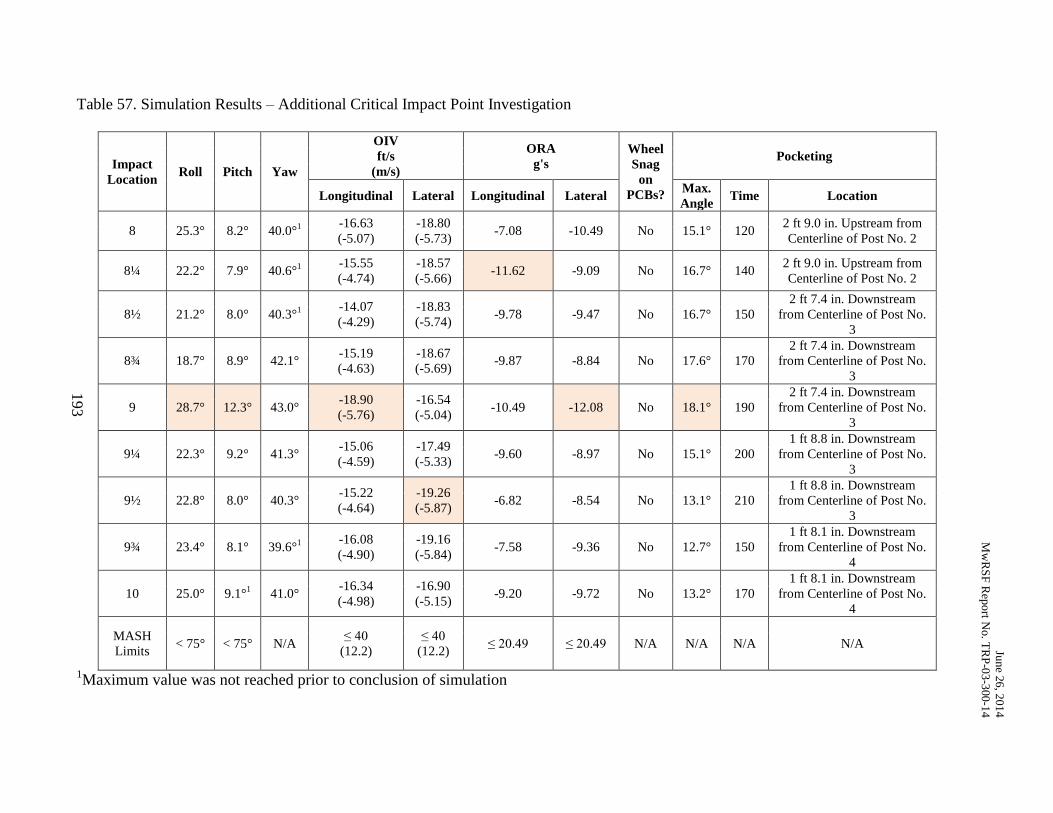
Jun
e 26
, 201
4
Mw
RS
F R
epo
rt No. T
RP
-03
-300-1
4
193
Table 57. Simulation Results – Additional Critical Impact Point Investigation
Impact
Location Roll Pitch Yaw
OIV
ft/s
(m/s)
ORA
g's
Wheel
Snag
on
PCBs?
Pocketing
Longitudinal Lateral Longitudinal Lateral Max.
Angle Time Location
8 25.3° 8.2° 40.0°1
-16.63
(-5.07)
-18.80
(-5.73) -7.08 -10.49 No 15.1° 120
2 ft 9.0 in. Upstream from
Centerline of Post No. 2
8¼ 22.2° 7.9° 40.6°1
-15.55
(-4.74)
-18.57
(-5.66) -11.62 -9.09 No 16.7° 140
2 ft 9.0 in. Upstream from
Centerline of Post No. 2
8½ 21.2° 8.0° 40.3°1
-14.07
(-4.29)
-18.83
(-5.74) -9.78 -9.47 No 16.7° 150
2 ft 7.4 in. Downstream
from Centerline of Post No.
3
8¾ 18.7° 8.9° 42.1° -15.19
(-4.63)
-18.67
(-5.69) -9.87 -8.84 No 17.6° 170
2 ft 7.4 in. Downstream
from Centerline of Post No.
3
9 28.7° 12.3° 43.0° -18.90
(-5.76)
-16.54
(-5.04) -10.49 -12.08 No 18.1° 190
2 ft 7.4 in. Downstream
from Centerline of Post No.
3
9¼ 22.3° 9.2° 41.3° -15.06
(-4.59)
-17.49
(-5.33) -9.60 -8.97 No 15.1° 200
1 ft 8.8 in. Downstream
from Centerline of Post No.
3
9½ 22.8° 8.0° 40.3° -15.22
(-4.64)
-19.26
(-5.87) -6.82 -8.54 No 13.1° 210
1 ft 8.8 in. Downstream
from Centerline of Post No.
3
9¾ 23.4° 8.1° 39.6°1
-16.08
(-4.90)
-19.16
(-5.84) -7.58 -9.36 No 12.7° 150
1 ft 8.1 in. Downstream
from Centerline of Post No.
4
10 25.0° 9.1°1 41.0°
-16.34
(-4.98)
-16.90
(-5.15) -9.20 -9.72 No 13.2° 170
1 ft 8.1 in. Downstream
from Centerline of Post No.
4
MASH
Limits < 75° < 75° N/A
≤ 40
(12.2)
≤ 40
(12.2) ≤ 20.49 ≤ 20.49 N/A N/A N/A N/A
1Maximum value was not reached prior to conclusion of simulation
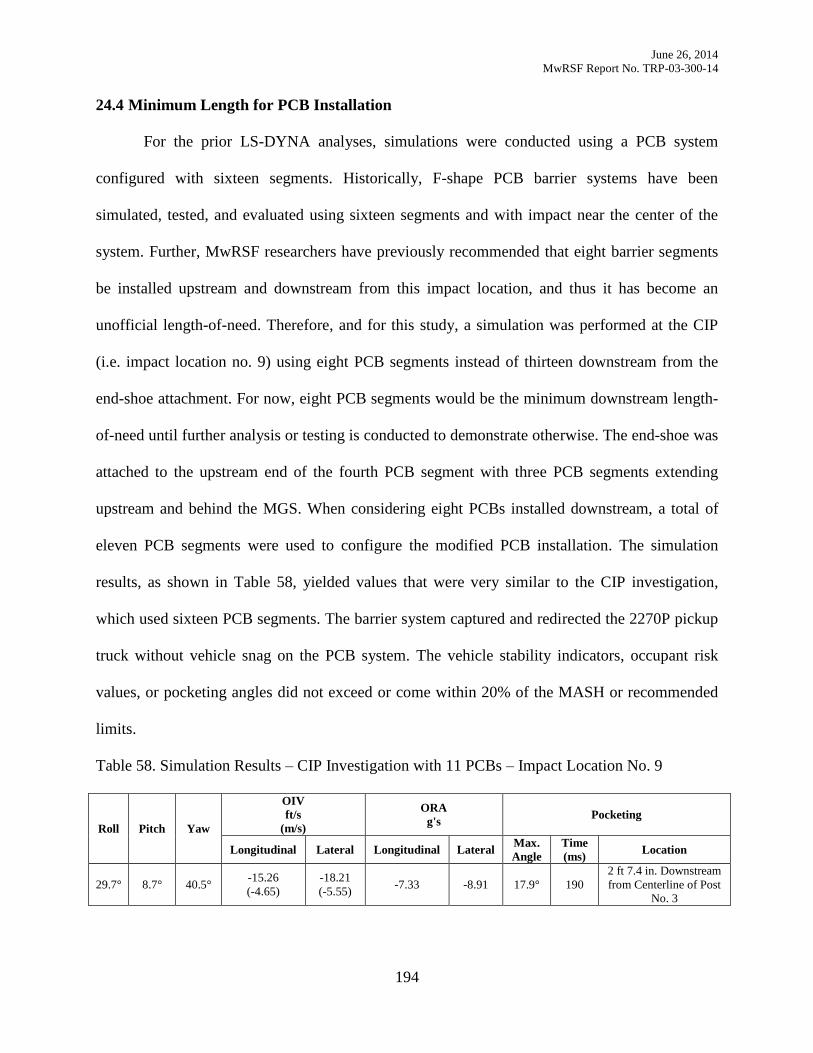
June 26, 2014
MwRSF Report No. TRP-03-300-14
194
24.4 Minimum Length for PCB Installation
For the prior LS-DYNA analyses, simulations were conducted using a PCB system
configured with sixteen segments. Historically, F-shape PCB barrier systems have been
simulated, tested, and evaluated using sixteen segments and with impact near the center of the
system. Further, MwRSF researchers have previously recommended that eight barrier segments
be installed upstream and downstream from this impact location, and thus it has become an
unofficial length-of-need. Therefore, and for this study, a simulation was performed at the CIP
(i.e. impact location no. 9) using eight PCB segments instead of thirteen downstream from the
end-shoe attachment. For now, eight PCB segments would be the minimum downstream length-
of-need until further analysis or testing is conducted to demonstrate otherwise. The end-shoe was
attached to the upstream end of the fourth PCB segment with three PCB segments extending
upstream and behind the MGS. When considering eight PCBs installed downstream, a total of
eleven PCB segments were used to configure the modified PCB installation. The simulation
results, as shown in Table 58, yielded values that were very similar to the CIP investigation,
which used sixteen PCB segments. The barrier system captured and redirected the 2270P pickup
truck without vehicle snag on the PCB system. The vehicle stability indicators, occupant risk
values, or pocketing angles did not exceed or come within 20% of the MASH or recommended
limits.
Table 58. Simulation Results – CIP Investigation with 11 PCBs – Impact Location No. 9
Roll Pitch Yaw
OIV
ft/s
(m/s)
ORA
g's Pocketing
Longitudinal Lateral Longitudinal Lateral Max.
Angle
Time
(ms) Location
29.7° 8.7° 40.5° -15.26
(-4.65)
-18.21
(-5.55) -7.33 -8.91 17.9° 190
2 ft 7.4 in. Downstream
from Centerline of Post
No. 3
June 26, 2014
MwRSF Report No. TRP-03-300-14
195
For the study, the longitudinal displacement of the eleventh and last (i.e. downstream)
PCB segment in the eleven- and sixteen-PCB systems were recorded. The eleventh PCB segment
displaced 1.7 in. (43 mm) longitudinally, while the sixteenth PCB segment displaced 2.7 in. (69
mm) longitudinally in the sixteen PCB system. The eleventh PCB segment displaced 4.3 in. (109
mm) longitudinally, in the eleven PCB system. This increased longitudinal displacement was not
believed to adversely affect the performance of the nested-MGS transition system. Thus, an
eleven PCB system was deemed suitable for future full-scale crash testing.
Also considered for this study were the maximum rail forces at several locations
throughout the length of the MGS. The locations and corresponding maximum rail forces are
shown in Figure 87 and Table 59, respectively. The maximum rail force throughout the system
was 60.9 kips (270.9 kN), which occurred just downstream of the impact location. The maximum
rail force near the end-shoe attachment location was 51.2 kips (227.9 kN). These rail forces were
tracked in order to aid in future connection design for blockouts to PCBs and for W-beam end-
shoes to PCBs.
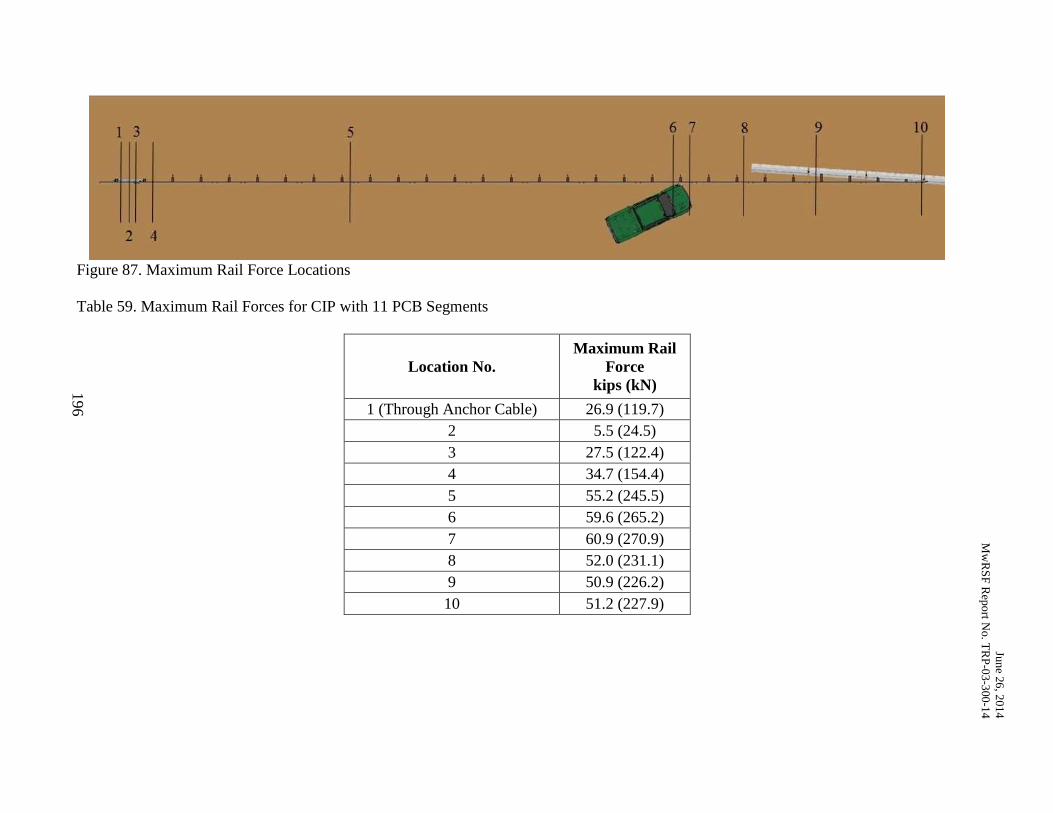
Jun
e 26
, 201
4
Mw
RS
F R
epo
rt No. T
RP
-03
-300-1
4
196
Figure 87. Maximum Rail Force Locations
Table 59. Maximum Rail Forces for CIP with 11 PCB Segments
Location No.
Maximum Rail
Force
kips (kN)
1 (Through Anchor Cable) 26.9 (119.7)
2 5.5 (24.5)
3 27.5 (122.4)
4 34.7 (154.4)
5 55.2 (245.5)
6 59.6 (265.2)
7 60.9 (270.9)
8 52.0 (231.1)
9 50.9 (226.2)
10 51.2 (227.9)
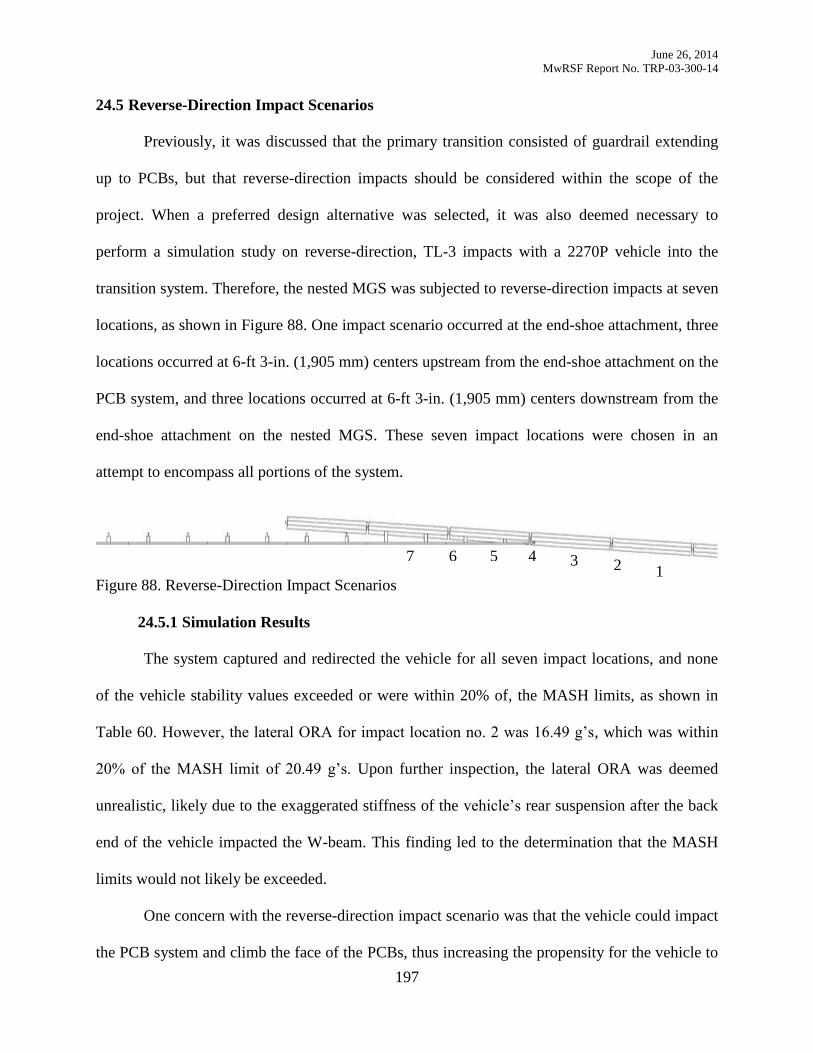
June 26, 2014
MwRSF Report No. TRP-03-300-14
197
24.5 Reverse-Direction Impact Scenarios
Previously, it was discussed that the primary transition consisted of guardrail extending
up to PCBs, but that reverse-direction impacts should be considered within the scope of the
project. When a preferred design alternative was selected, it was also deemed necessary to
perform a simulation study on reverse-direction, TL-3 impacts with a 2270P vehicle into the
transition system. Therefore, the nested MGS was subjected to reverse-direction impacts at seven
locations, as shown in Figure 88. One impact scenario occurred at the end-shoe attachment, three
locations occurred at 6-ft 3-in. (1,905 mm) centers upstream from the end-shoe attachment on the
PCB system, and three locations occurred at 6-ft 3-in. (1,905 mm) centers downstream from the
end-shoe attachment on the nested MGS. These seven impact locations were chosen in an
attempt to encompass all portions of the system.
Figure 88. Reverse-Direction Impact Scenarios
24.5.1 Simulation Results
The system captured and redirected the vehicle for all seven impact locations, and none
of the vehicle stability values exceeded or were within 20% of, the MASH limits, as shown in
Table 60. However, the lateral ORA for impact location no. 2 was 16.49 g’s, which was within
20% of the MASH limit of 20.49 g’s. Upon further inspection, the lateral ORA was deemed
unrealistic, likely due to the exaggerated stiffness of the vehicle’s rear suspension after the back
end of the vehicle impacted the W-beam. This finding led to the determination that the MASH
limits would not likely be exceeded.
One concern with the reverse-direction impact scenario was that the vehicle could impact
the PCB system and climb the face of the PCBs, thus increasing the propensity for the vehicle to
4 3 2 1 5 6 7
June 26, 2014
MwRSF Report No. TRP-03-300-14
198
override the MGS or become unstable and roll over. While the vehicle did not override the MGS
in any of the seven simulated impact locations, the time sequentials for impact location no. 2, as
shown in Figure 89, depicted that this concern was not unfounded. At 100 ms, the vehicle had
impacted the transition system and begun to climb the face of the PCB. By 200 ms, the vehicle
had begun to interact with the MGS, and the bottom of the wheel was approximately at the
height of the bottom of the nested MGS. However, by 300 ms, the vehicle had redirected, and
MGS override was no longer a concern. These findings led to the determination that the nested-
MGS configuration would likely contain and redirect the test vehicle and meet TL-3 of MASH.
Full-scale crash testing should be conducted in the reverse direction at impact location no. 2 due
to the concern for system override.
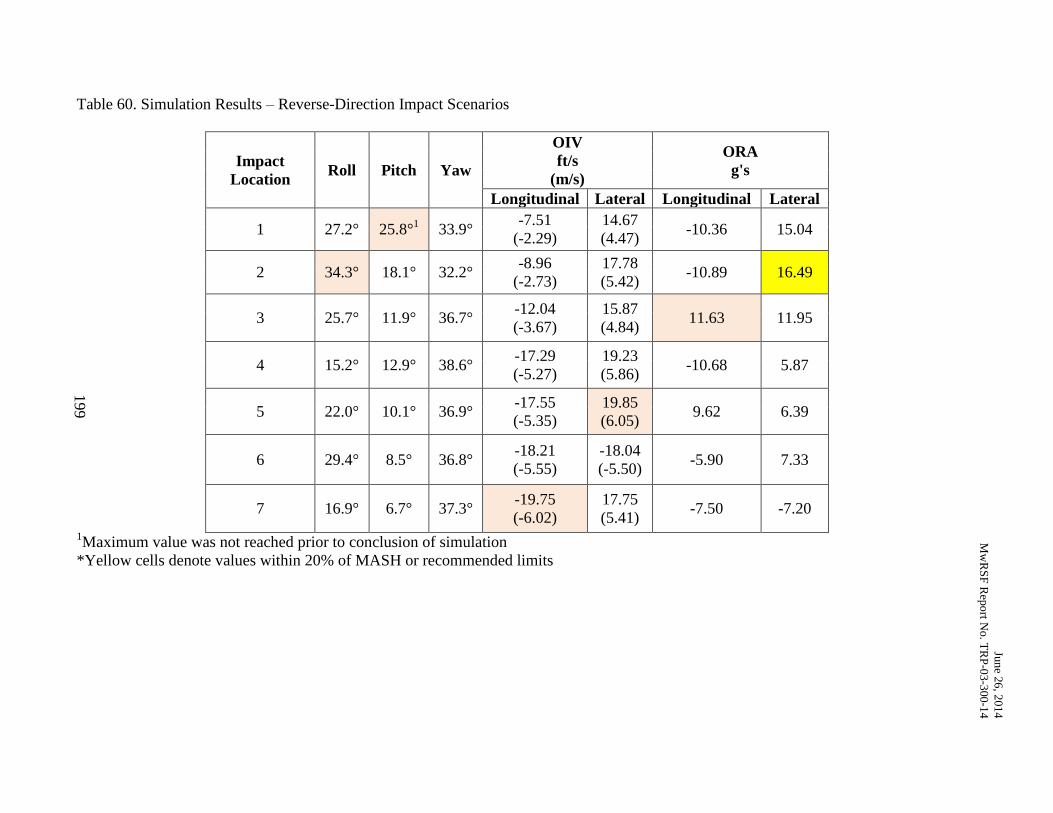
Jun
e 26
, 201
4
Mw
RS
F R
epo
rt No. T
RP
-03
-300-1
4
199
Table 60. Simulation Results – Reverse-Direction Impact Scenarios
Impact
Location Roll Pitch Yaw
OIV
ft/s
(m/s)
ORA
g's
Longitudinal Lateral Longitudinal Lateral
1 27.2° 25.8°1 33.9°
-7.51
(-2.29)
14.67
(4.47) -10.36 15.04
2 34.3° 18.1° 32.2° -8.96
(-2.73)
17.78
(5.42) -10.89 16.49
3 25.7° 11.9° 36.7° -12.04
(-3.67)
15.87
(4.84) 11.63 11.95
4 15.2° 12.9° 38.6° -17.29
(-5.27)
19.23
(5.86) -10.68 5.87
5 22.0° 10.1° 36.9° -17.55
(-5.35)
19.85
(6.05) 9.62 6.39
6 29.4° 8.5° 36.8° -18.21
(-5.55)
-18.04
(-5.50) -5.90 7.33
7 16.9° 6.7° 37.3° -19.75
(-6.02)
17.75
(5.41) -7.50 -7.20
1Maximum value was not reached prior to conclusion of simulation
*Yellow cells denote values within 20% of MASH or recommended limits
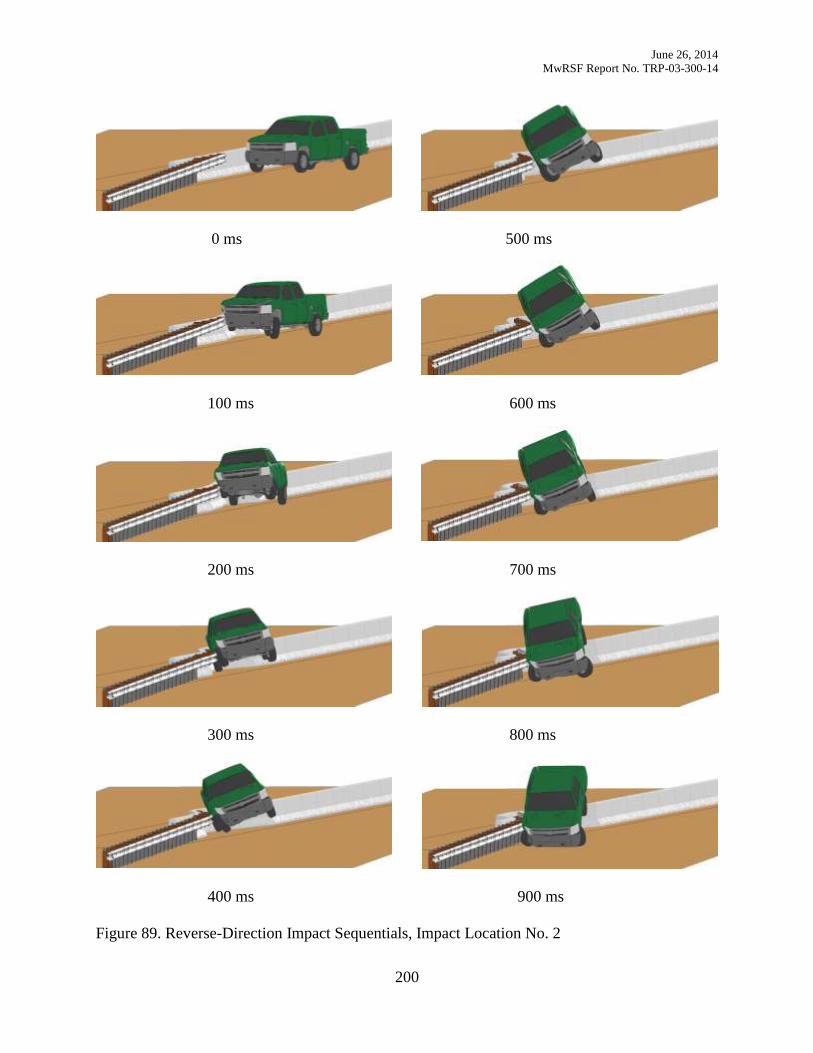
June 26, 2014
MwRSF Report No. TRP-03-300-14
200
0 ms 500 ms
100 ms 600 ms
200 ms 700 ms
300 ms 800 ms
400 ms 900 ms
Figure 89. Reverse-Direction Impact Sequentials, Impact Location No. 2
June 26, 2014
MwRSF Report No. TRP-03-300-14
201
SUMMARY, CONCLUSIONS, AND RECOMMENDATIONS 25
25.1 Summary and Conclusions
The research objectives were to determine performance and design constraints and to
develop a stiffness transition between PCBs and W-beam guardrail that will significantly
improve safety for the motoring public and workers within construction zones. The stiffness
transition was designed and simulated according to the AASHTO MASH Test Level 3 impact
safety standards. Design concepts were developed and refined through the use of LS-DYNA
computer simulation.
Prior to conducting the simulation effort, TAC members provided several design
constraints for which the transition should be configured. The modified G4(1S) guardrail was
preferred for use, since it represented the current guardrail standard in Nebraska, which would
allow for a simpler retrofit to PCBs. In order to limit damage to the roadway surface and reduce
installation time, it was preferred that the PCBs remain free-standing and not be anchored or
pinned to the roadway surface. Since PCB placement may occur on compacted, crushed
limestone, concrete, or asphalt, all three base conditions deserve to be considered for the design
concepts and subjected to a full-scale crash testing program. Soil grading and terrain were also
considered. If PCBs were to be placed on native soil, a minimum lateral width of 4 ft (1,219 mm)
of compacted, crushed limestone should be used, or similar, behind the PCB installation due to
concerns of PCBs settling or gouging into soft or saturated, native soil.
25.1.1 Design Concept Development
Within these constraints, design concepts were developed and presented to the TAC
members. Ease of installation and simplicity were high on the list of priorities. Thus, all of the
design concepts were presented in their simplest form, although several potential configurations
were presented and may be required in order to improve system performance. The potential
June 26, 2014
MwRSF Report No. TRP-03-300-14
202
configurations included: a transition to thrie beam, removal of posts in front of PCBs, a blocked
connection between rail and PCBs, a cantilever beam attached to the most upstream PCB,
nesting of rail, blockouts from the back of posts to the PCBs, and blockouts from the back of
posts to a cantilever beam. Five design concepts were originally presented to the TAC members
for consideration, as denoted in Chapter 3. The pros and cons for each concept were weighed,
and design concepts were ranked based on feasibility, ease of installation, and likelihood of
success, as denoted below:
(1) Flared PCB–Modified G4(1S),
(2) Parallel PCB–Modified G4(1S),
(3) Beam Attachment Between PCB and Modified G4(1S),
(4) PCB Offset from Modified G4(1S), and
(5) Stiffened PCB and Modified G4(1S).
These rankings served as a guide for making system decisions during the simulation
process. Due to project constraints and sponsor priorities, only the first two design concepts and
subsequent configurations for each were simulated in the initial study. The results are discussed
below.
25.1.2 Flared PCB–Modified G4(1S)
The Flared PCB–Modified G4(1S) design concept used a W-beam end-shoe to attach the
modified G4(1S) directly to the 15H:1V flared F-shape PCB system. Simulation results quickly
showed that the rail height of the modified G4(1S) was inadequate to safely capture and redirect
the vehicle. Thus, a transition to thrie beam was utilized in all of the following configurations,
which showed a higher propensity for vehicle capture and redirection. Other configurations were
considered to alleviate post wedging against PCBs, slow initiation of PCB displacement, and
June 26, 2014
MwRSF Report No. TRP-03-300-14
203
high pocketing angles. Five configurations were simulated for the Flared PCB–Modified G4(1S)
design concept, and the results were analyzed, compared, and ranked, as shown below:
(1) Nested Thrie Beam with Fully-Blocked Rail,
(2) Thrie Beam with Fully-Blocked Rail and Cantilever Beam,
(3) Thrie Beam End-Shoe,
(4) Thrie Beam with Fully-Blocked Rail, and
(5) W-Beam End-Shoe.
25.1.3 Parallel PCB–Modified G4(1S)
When the Parallel PCB–Modified G4(1S) design concept was presented to the TAC
members, it depicted the modified G4(1S) guardrail attached to the 15H:1V flared PCB system,
with two PCB segments placed parallel to and behind the modified G4(1S). The posts of the
modified G4(1S) remained in front of the PCBs. These posts were intended to initiate PCB
displacement through rotation. Based on the results from the Flared PCB–Modified G4(1S)
design concept, and using engineering judgment, modifications were made to this design. The
rail height of the modified G4(1S) proved incapable of vehicle capture and redirection, and it
was transitioned to thrie beam. Also, the single thrie beam yielded high pocketing angles, and
nested thrie beam was installed ahead of the PCB system. Also, posts in front of the PCBs
showed a tendency to wedge against the PCBs and cause vehicle instabilities and elevated
occupant risk values. Thus, all of the posts in front of the PCBs were removed, and blockouts
were installed in their place. The PCBs-behind-nested thrie beam configuration yielded two
longitudinal ORAs that were marginal but with acceptable vehicle stability and pocketing angles.
A cantilever beam was installed on the most upstream PCB to investigate if it would improve
safety performance. The PCBs-behind-nested thrie beam-with-cantilever beam configuration
yielded values similar to the previous configuration in vehicle behavior, occupant risk, and
June 26, 2014
MwRSF Report No. TRP-03-300-14
204
pocketing angles. Based on these results, the Parallel PCB–Modified G4(1S) configurations were
analyzed and ranked, as shown below:
(1) PCBs Behind Nested Thrie Beam and
(2) PCBs Behind Nested Thrie Beam with Cantilever Beam
25.1.4 Design Concept Summary
The results from the Flared PCB–Modified G4(1S) and the Parallel PCB–Modified
G4(1S) design concepts and subsequent configurations were presented to the TAC members for
consideration. The pros and cons for each configuration were considered, and TAC members
determined that several of the configurations were too complex with a transition to thrie beam,
installation and fabrication of a cantilever beam, and/or nesting of the rail. Based on the
simulation finding that the rail height of the modified G4(1S) was inadequate to capture the
vehicle, TAC members advised the use of the Midwest Guardrail System (MGS) in lieu of the
modified G4(1S). It was predicted that the taller MGS would improve vehicle capture and
redirection without the need to transition from W-beam to thrie beam.
25.1.5 Flared PCB–MGS
The Flared PCB–MGS design concept was similar to the Flared PCB–Modified G4(1S)
design concept, except that a taller MGS system was now attached to the 15H:1V flared PCB
system. Although the modified G4(1S) had indicated that posts in front of PCBs would lead to
wedging of posts against PCBs, the taller rail height of the MGS was believed capable of
capturing the vehicle and reduce vehicle instabilities, so two posts remained in front of the PCBs.
Posts were removed when they interfered with placement of PCBs, and blockouts were installed
in their place. Simulation results for the MGS-end-shoe configuration indicated that occupant
risk values were high due to vehicle snag, and pocketing angles were high for impact locations
upstream from the PCB system. Several configurations were considered to alleviate high
June 26, 2014
MwRSF Report No. TRP-03-300-14
205
occupant risk values, pocketing angles, and slow initiation of PCB displacement. Seven
configurations were simulated for the Flared PCB–MGS design concept, and the results were
analyzed, compared, and ranked, as shown below:
(1) MGS with Nested W-Beam,
(2) MGS with Fully-Blocked Rail and Cantilever Beam,
(3) MGS with Cantilever Beam,
(4) MGS End-Shoe Connection,
(5) MGS with Blockout to Cantilever Beam,
(6) MGS with Fully-Blocked Rail, and
(7) MGS with Blockouts Behind Posts.
25.1.6 Design Selection
After simulation of the three design concepts, the results were compared against each
other, and the configurations were ranked within each design concept. These rankings were
presented to the TAC members for consideration, and a unanimous decision was reached to
move forward with the nested-MGS configuration. This decision was made based on the
simulation results, which indicated that all of the vehicle behavior values, occupant risk values,
and pocketing angles were well below the MASH or recommended limits for all impact
locations. No other configuration yielded similar results, which provided confidence that the
nested MGS would meet the MASH TL-3 impact safety standards. Also, the TAC members were
pleased with the ease of installation as it would not require any new components other than a few
brackets for supporting or attaching blockouts to the face of the PCBs.
25.1.7 CIP Study
The final portion of this study was to conduct a simulation effort to find the CIP for the
selected design alternative for later use in the full-scale crash testing program. This process was
June 26, 2014
MwRSF Report No. TRP-03-300-14
206
completed through a number of steps. First, the nested MGS was subjected to impacts near the
end-shoe connection to ensure that the vehicle would be safely captured and redirected for
impacts on the 15H:1V flared PCB system alone. The results indicated that the vehicle was
safely captured and redirected for all five impact locations near the end-shoe.
The next portion of the CIP study was to determine the critical attachment location
between the nested MGS and the PCB system. It was determined that a minimum of three PCB
segments should be installed behind and upstream from the nested MGS that is attached to the
PCB system in order to provide adequate longitudinal barrier tension to capture and redirect the
vehicle, as well as to prevent vehicle snag on the upstream end of the PCB system. Thus, the
critical attachment location should occur on the fourth PCB segment. Three attachment locations
were simulated for investigating the critical attachment location. These locations included: (1)
the end-shoe attached to the upstream end of the fourth PCB to allow for the minimum PCB
length behind the MGS; (2) the end-shoe attached toward the center of the fourth PCB segment,
such that one more post upstream of the PCB system would just miss the most upstream PCB
segment upon rotation; and (3) the end-shoe attached toward the center of the fourth PCB
segment, but such that the one more post upstream of the PCB system would impact the most
upstream PCB upon rotation. Each attachment location was simulated at four impact locations
near the upstream end of the PCB system. The results indicated that the first attachment location,
corresponding to a minimum PCB length behind the MGS, provided the most critical attachment
location.
The next part of the CIP study was to find the critical impact location. The simulation
results presented in Chapter 19 indicated that impact location no. 9 yielded some of the higher
occupant risk values and the highest pocketing angle. Thus, it was determined that the CIP would
be near impact location no. 9, and the nested-MGS configuration was subjected to impacts at
June 26, 2014
MwRSF Report No. TRP-03-300-14
207
18¾-in. (476 mm) centers between impact location nos. 8 and 10. Based on the simulation
results, impact location no. 9 still yielded the highest pocketing angle and several of the occupant
risk values. Therefore, the CIP was determined to occur at impact location no. 9.
Researchers wanted to refine the system even further to recommend the shortest design.
Therefore, a simulation effort was conducted to investigate a reduced-length PCB installation.
The original configuration for testing and evaluation of the F-shape PCB system used a sixteen-
PCB system with impacts near the center of the installation. In order to investigate a reduced
length, three PCBs were upstream and eight PCBs were installed downstream from the end-shoe
attachment to the PCB system, thus resulting in a total of eleven PCBs. This nested-MGS-with-
reduced-length PCB installation was impacted at the CIP location. Results indicated that the
nested-MGS configuration was not adversely affected with the minimum PCB installation.
The final portion of the CIP study was to investigate reverse-direction impacts into the
nested-MGS transition system. The nested MGS was subjected to reverse-direction impacts at
seven locations spaced on 6-ft 3-in. (1,905 mm) centers upstream from the end-shoe attachment
through 6-ft 3-in. (1,905 mm) centers downstream from the end-shoe attachment, including one
impact at the end-shoe attachment. The simulation results indicated that the vehicle was safely
captured and redirected for all seven impact locations. However, the reverse-direction
simulations indicated that a future full-scale crash testing program should include an evaluation
at impact location no. 2. First, it showed the most vehicle climb on the PCB system. Second, a
vehicle wheel was near the top of the MGS and could lead to MGS override.
25.2 Recommendations
A second phase of the research project will focus on the final design, fabrication, and
full-scale crash testing of the TL-3 transition between MGS guardrail and F-shaped PCBs. It is
anticipated that three full-scale crash tests would be required to fully evaluate the transition
June 26, 2014
MwRSF Report No. TRP-03-300-14
208
system. These crash tests would include MASH test designation nos. 3-20 and 3-21, which are
used to evaluate the barrier transition with a 1100C small car and a 2270P pickup truck,
respectively. In addition, it is anticipated that a reverse-direction impact according to test
designation no. 3-21 would be used with the 2270P test vehicle to evaluate the transition when
installed in two-way traffic applications.
Based on this research, the nested-MGS configuration was recommended for evaluation
using a full-scale crash testing program. In addition, the nested MGS should use an attachment
location configured per Case 1, which represented the minimum PCB length behind the MGS.
Also, the W-beam end-shoe should be attached to the upstream end of the fourth PCB segment
with three PCB segments extending behind the nested MGS. A minimum of five 12-ft 6-in.
(3,810 mm) long, W-beam sections should be nested upstream from the end-shoe. For testing
purposes, the transition should consist of at least a twenty-five post MGS system and an eleven
segment PCB system at a 15H:1V flare. The critical impact point should occur at impact location
no. 9 (i.e., the centerline of the fifth guardrail post upstream from the end-shoe attachment) for
test designation no. 3-21. The reverse-direction test scenario should use impact location no. 2
(i.e., 12 ft – 6 in. (3,810 mm) longitudinally upstream from the end-shoe attachment) for test
designation no. 3-21.
A simulation effort involving impacts with the 1100C small car was not conducted. As
noted in Chapter 5, the 2270P test vehicle was deemed more critical than the 1100C small car for
the concept development phase, due to the likelihood of increased barrier deflections, rail and
anchor loads, rail pocketing, and wheel snag. Therefore, test designation no. 3-20 for the full-
scale crash testing program should use MASH procedures for determining a critical impact point.
June 26, 2014
MwRSF Report No. TRP-03-300-14
209
25.2.1 Future Research
The current nested-MGS model utilized simplified connections between the blockouts
and PCBs. The blockout bolts were attached directly to the face of the PCB segments, which
would not be possible in the actual configuration. Thus, design of the actual connection must be
completed in order to properly attach the blockouts to the PCBs. Also, an attachment wedge was
used to rigidly attach the W-beam end-shoe to the face of the PCB, which may be challenging in
the actual configuration. Thus, a connection must be designed between the W-beam end-shoe
and the PCB.
Upon completion of a full-scale vehicle crash testing program, further validation and
refinement of the nested-MGS model is recommended. While this overall transition
configuration utilized two different systems that had been separately validated using results from
full-scale crash testing, their dynamic impact behaviors when connected to one another have not
been validated. When this physical test data becomes available, an opportunity will exist to
improve the accuracy of the FEA barrier model.
Throughout the simulation process, a number of modeling difficulties were encountered.
These difficulties, along with remedies, were documented and compiled. Examples and a further
explanation may be found in Appendix C.
June 26, 2014
MwRSF Report No. TRP-03-300-14
210
REFERENCES 26
1. Bielenberg, B.W., Faller, R.K., Rohde, J.R., Reid, J.D., Sicking, D.L., and Holloway,
J.C., Development of Tie-Down and Transition Systems for Temporary Concrete Barrier
on Asphalt Road Surfaces, MwRSF Report No. TRP-03-180-06, Midwest Roadside
Safety Facility, University of Nebraska-Lincoln, February 2007.
2. Wiebelhaus, M.J., Terpsma, R.J., Lechtenberg, K.A., Reid, J.D., Faller, R.K., Bielenberg,
R.W., Rohde, J.R., and Sicking, D.L., Development of a Temporary Concrete Barrier to
Permanent Concrete Median Barrier Approach Transition, MwRSF Report No. TRP-03-
208-10, Midwest Roadside Safety Facility, University of Nebraska-Lincoln, July 2010.
3. Bryden, J.E., and Phillips, R.G., Roadside Barriers for Bridge-Pier Protection, Research
Report No. 117, Engineering Research and Development Bureau, New York State
Department of Transportation, Albany, Dec. 1984.
4. Bryden, J.E., and Phillips, R.G., Roadside Barriers for Bridge-Pier Protection,
Transportation Research Record 1024, Washington, D.C., 1985
5. Manual for Assessing Safety Hardware (MASH), American Association of State Highway
and Transportation Officials (AASHTO), Washington, D.C., 2009.
6. Hallquist, J.O., LS-DYNA Keyword User’s Manual, Volume I, Livermore Software
Technology Corporation, Livermore, CA, 2007.
7. Marzougui, D., Buyuk, M., and Kan, S., Performance Evaluation of Portable Concrete
Barriers, NCAC Report No. 2007-R-004, National Crash Analysis Center (NCAC),
January 2007.
8. Faller, R.K., Rohde, J.R., Rosson, B.T., Smith, R.P., and Addink, K.H., Development of a
TL-3 F-Shape Temporary Concrete Median Barrier, MwRSF Report No. TRP-03-64-96,
Midwest Roadside Safety Facility, University of Nebraska-Lincoln, December 1996.
9. Polivka, K.A., Faller, R.K., Sicking, D.L., Rohde, J.R., Bielenberg, B.W., Reid, J.D., and
Coon, B.A., Performance Evaluation of the Free-Standing Temporary Barrier – Update
to NCHRP 350 Test No. 3-11 with 28” C.G. Height (2214TB-2), MwRSF Report No.
TRP-03-174-06, Midwest Roadside Safety Facility, University of Nebraska-Lincoln,
October 2006.
10. Beason, W.L., and Bullard, D.L., Jr., Development of a Limited-Slip Portable Concrete
Barrier Connection, Research Report No. 1959-1, Texas Transportation Institute, College
Station, TX, November 1993.
11. Jewell, J., Weldon, G., and Peter, R., Compliance Crash Testing of K-Rail Used in Semi-
Permanent Installations, Final Report No. FWHA/CA/OR-99/07, State of California
Department of Transportation, October 1999.
June 26, 2014
MwRSF Report No. TRP-03-300-14
211
12. Bielenberg, B.W., Faller, R.K., Reid, J.D., Holloway, J.C., Rohde, J.R., and Sicking,
D.L., Development of a Tie-Down System for Temporary Concrete Barriers, MwRSF
Report No. TRP-03-115-02, Midwest Roadside Safety Facility, University of Nebraska-
Lincoln, August 2002.
13. Polivka, K.A., Faller, R.K., Rohde, J.R., Holloway, J.C., Bielenberg, B.W., and Sicking,
D.L., Development and Evaluation of a Tie-Down System for the Redesigned F-Shape
Concrete Temporary Barrier, MwRSF Report No. TRP-03-134-03, Midwest Roadside
Safety Facility, University of Nebraska-Lincoln, August 2003.
14. Sheikh, N.M., Bligh, R.P., and Menges, W.L, Crash Testing and Evaluation of the 12 ft
Pinned F-Shape Temporary Barrier, Research Report 405160-3-1, Texas Transportation
Institute, College Station, TX, April 2008.
15. Howard, C.N., Stolle, C.J., Lechtenberg, K.A., Faller, R.K., Reid, J.D., and Sicking, D.L.,
Dynamic Evaluation of a Pinned Anchoring System for New York State’s Temporary
Concrete Barriers, MwRSF Report No. TRP-03-216-09, Midwest Roadside Safety
Facility, University of Nebraska-Lincoln, September 2009.
16. Lechtenberg, K.A., Faller, R.K., Reid, J.D., and Sicking, D.L., Dynamic Evaluation of a
Pinned Anchoring System for New York State’s Temporary Concrete Barriers – Phase II,
MwRSF Report No. TRP-03-224-10, Midwest Roadside Safety Facility, University of
Nebraska-Lincoln, January 2010.
17. Rosenbaugh, S.K., Bielenberg, R.W., Faller, R.K., Reid, J.D., Rohde, J.R., Sicking, D.L.,
Lechtenberg, K.A., and Holloway, J.C., Termination and Anchorage of Temporary
Concrete Barriers, MwRSF Report No. TRP-03-209-09, Midwest Roadside Safety
Facility, University of Nebraska-Lincoln, October 2009.
18. Abu-Odeh, A.Y., Kim, K.M., and Bligh, R.P, Guardrail Deflection Analysis, Phase I:
(2010-2011), Research Report No. 405160-24, Texas Transportation Institute, College
Station, TX, August 2011.
19. Faller, R.K., Reid, J.D., Rohde, J.R., Sicking, D.L., and Keller, E.A., Two Approach
Guardrail Transitions for Concrete Safety Shape Barriers, MwRSF Report No. TRP-03-
69-98, Midwest Roadside Safety Facility, University of Nebraska-Lincoln, May 1998.
20. Polivka, K.A., Faller, R.K., Sicking, D.L., Rohde, J.R., Bielenberg, B.W., Reid, J.D., and
Coon, B.A., Performance Evaluation of the Guardrail to Concrete Barrier Transition –
Update to NCHRP 350 Test No. 3-21 with 28” C.G. Height (2214T-1), MwRSF Report
No. TRP-03-175-06, Midwest Roadside Safety Facility, University of Nebraska-Lincoln,
October 2006.
21. Eller, C.M., Polivka, K.A., Faller, R.K., Sicking, D.L., Rohde, J.R., Reid, J.D.,
Bielenberg, R.B., and Allison, E.M., Development of the Midwest Guardrail System
(MGS) W-Beam to Thrie Beam Transition Element, MwRSF Report No. TRP-03-167-07,
Midwest Roadside Safety Facility, University of Nebraska-Lincoln, November 2007.
June 26, 2014
MwRSF Report No. TRP-03-300-14
212
22. Polivka, K.A., Faller, R.K., Reid, J.D., Sicking, D.L., Rohde, J.R., and Holloway, J.C.,
Crash Testing of Missouri’s W-Beam to Thrie Beam Transition Element, MwRSF Report
No. TRP-03-93-00, Midwest Roadside Safety Facility, University of Nebraska-Lincoln,
September 2000.
23. Arrington, D.R., Bligh, R.P., and Menges, W.L., MASH Test 3-21 on TL-3 Thrie Beam
Transition without Curb, Research Report No. 9-1002-12-3, Texas Transportation
Institute, College Station, TX, July 2013.
24. Rosenbaugh, S.K., Lechtenberg, K.A., Faller, R.K., Sicking, D.L., Bielenberg, R.W., and
Reid, J.D., Development of the MGS Approach Guardrail Transition Using Standardized
Steel Posts, MwRSF Report No. TRP-03-210-10, Midwest Roadside Safety Facility,
University of Nebraska-Lincoln, December 2010.
25. Beason, W.L., Sheikh, N.M., Bligh, R.P., and Menges, W.L., Development of a Low-
Profile to F-Shape Transition Barrier Segment, Research Report No. 0-5527-1, Texas
Transportation Institute, College Station, TX, September 2006.
26. Stoughton, R.L., Parks, D.M., Stoker, J.R., Nordlin, E.F., Vehicular Impact Tests of
Precast Concrete Median Barriers with Corrugated Ends and Tensioned Cables, Final
Report No. FWHA-CA-TL-78-13, State of California Department of Transportation, June
1978.
27. Van Kirk, J.L., Stoughton, R.L., Stoker, J.R., and Nordlin, E.F., Vehicular Impact Test on
Steel Channel-Beams Spanning a Gap in a Continuous Concrete Median Barrier, Final
Report No. CA-TL-79-01, State of California Department of Transportation, February
1979.
28. Addink, K.H., Pfeifer, B.G., and Rohde, J.R., Development of a Temporary Barrier
System for Off-Road Applications, MwRSF Report No. TRP-03-66-98, Midwest
Roadside Safety Facility, University of Nebraska-Lincoln, March 1998.
29. Stolle, C.J., Polivka, K.A., Faller, R.K., Sicking, D.L., Bielenberg, R.W., Reid, J.D.,
Rohde, J.R., Allison, E.M., and Terpsma, R.J., Evaluation of Box Beam Stiffening of
Unanchored Temporary Concrete Barriers, MwRSF Report No. TRP-03-202-08,
Midwest Roadside Safety Facility, University of Nebraska-Lincoln, March 2008.
30. Jowsa, E.R., Faller, R.K., Rosenbaugh, S.K., Sicking, D.L., and Reid, J.D., Safety
Investigation and Guidance for Retrofitting Existing Approach Guardrail Transitions,
MwRSF Report No. TRP-03-266-12, Midwest Roadside Safety Facility, University of
Nebraska-Lincoln, August, 2012.
31. Polivka, K.A., Faller, R.K., Sicking, D.L., Reid, J.D., Rohde, J.R., Holloway, J.C.,
Bielenberg, R.W., and Kuipers, B.D., Development of the Midwest Guardrail System
(MGS) for Standard and Reduced Post Spacing and in Combination with Curbs, MwRSF
Research Report No. TRP-03-139-04, Midwest Roadside Safety Facility, University of
Nebraska-Lincoln, September 2004.
June 26, 2014
MwRSF Report No. TRP-03-300-14
213
32. Julin, R.D., Reid, J.D., Faller, R.K., and Mongiardini, M., Determination of the Maximum
MGS Mounting Height – Phase II Detailed Analysis Using LS-DYNA, MwRSF Report
No. TRP-03-274-12, Midwest Roadside Safety Facility, University of Nebraska-Lincoln,
December 2012.
33. Soyland, K., Faller, R.K., Holloway, J.C., and Sicking, D.L., Development and Testing of
an Approach Guardrail Transition to a Single Slope Concrete Median Barrier, MwRSF
Report No. TRP-03-47-95, Midwest Roadside Safety Facility, University of Nebraska-
Lincoln, November 1995.

June 26, 2014
MwRSF Report No. TRP-03-300-14
214
APPENDICES 27
June 26, 2014
MwRSF Report No. TRP-03-300-14
215
Appendix A. PCB Evaluation Results
The results from NCAC’s computer simulation study that were used to evaluate the
performance of PCB systems are found in this appendix. The results include ride-down
acceleration, ride-down velocity, barrier rotation angle, and barrier displacement. The results are
compiled by barrier type: F-shape, New Jersey safety-shape, single slope, vertical shape, and
inverted shape.
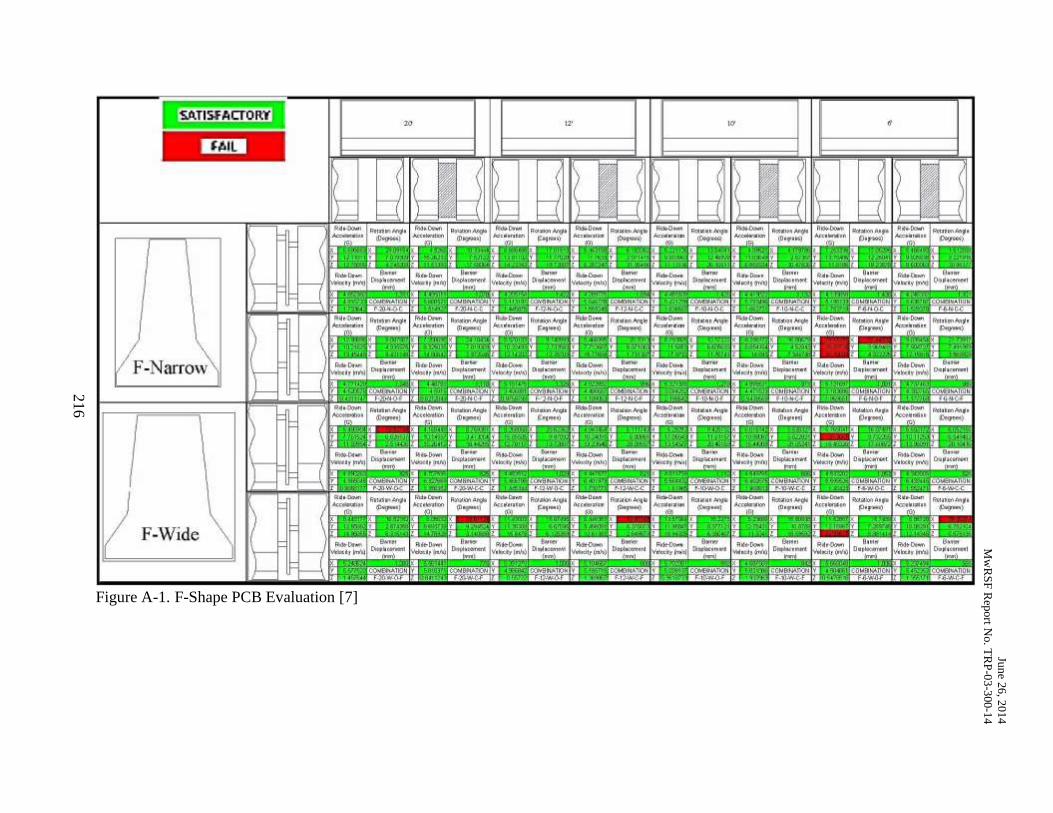
Jun
e 26
, 201
4
Mw
RS
F R
epo
rt No. T
RP
-03
-300-1
4
216
Figure A-1. F-Shape PCB Evaluation [7]
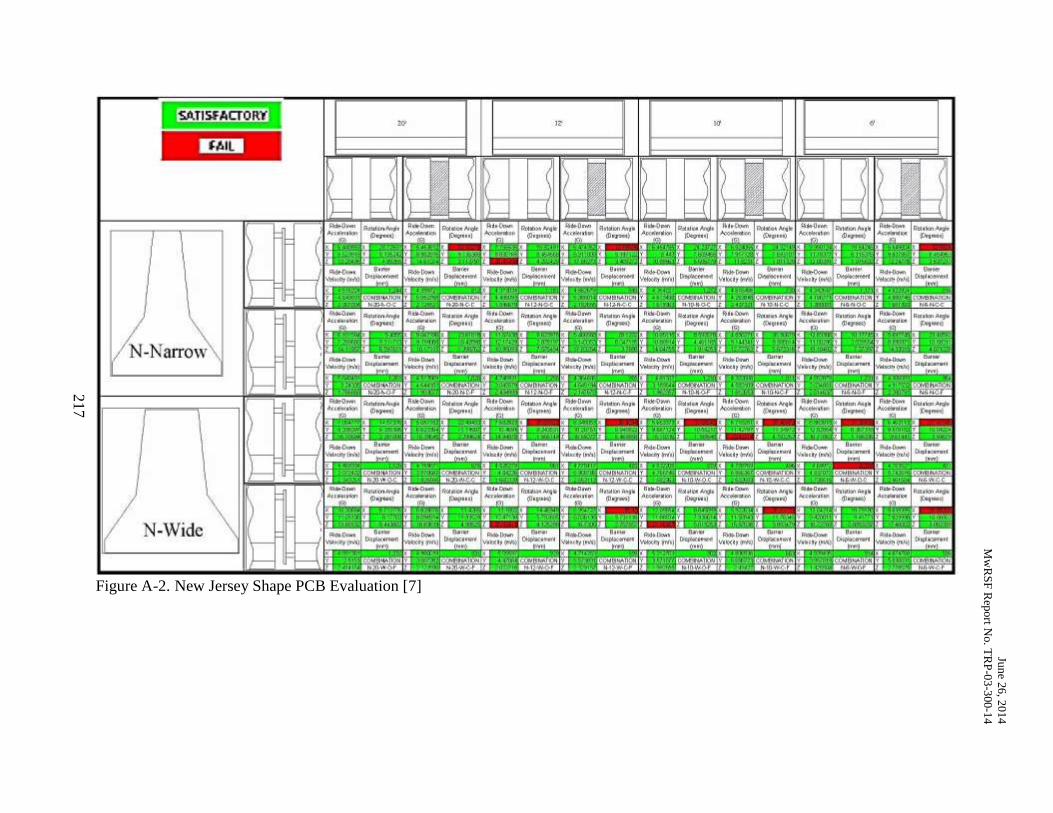
Jun
e 26
, 201
4
Mw
RS
F R
epo
rt No. T
RP
-03
-300-1
4
217
Figure A-2. New Jersey Shape PCB Evaluation [7]
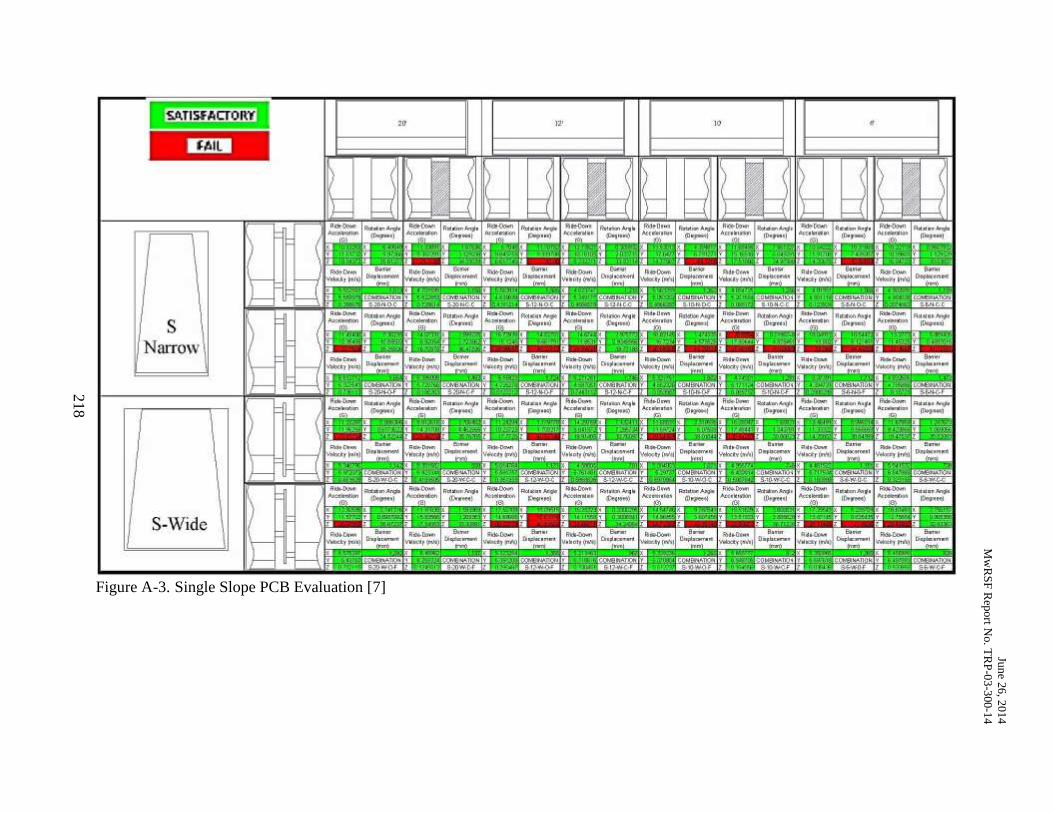
Jun
e 26
, 201
4
Mw
RS
F R
epo
rt No. T
RP
-03
-300-1
4
218
Figure A-3. Single Slope PCB Evaluation [7]
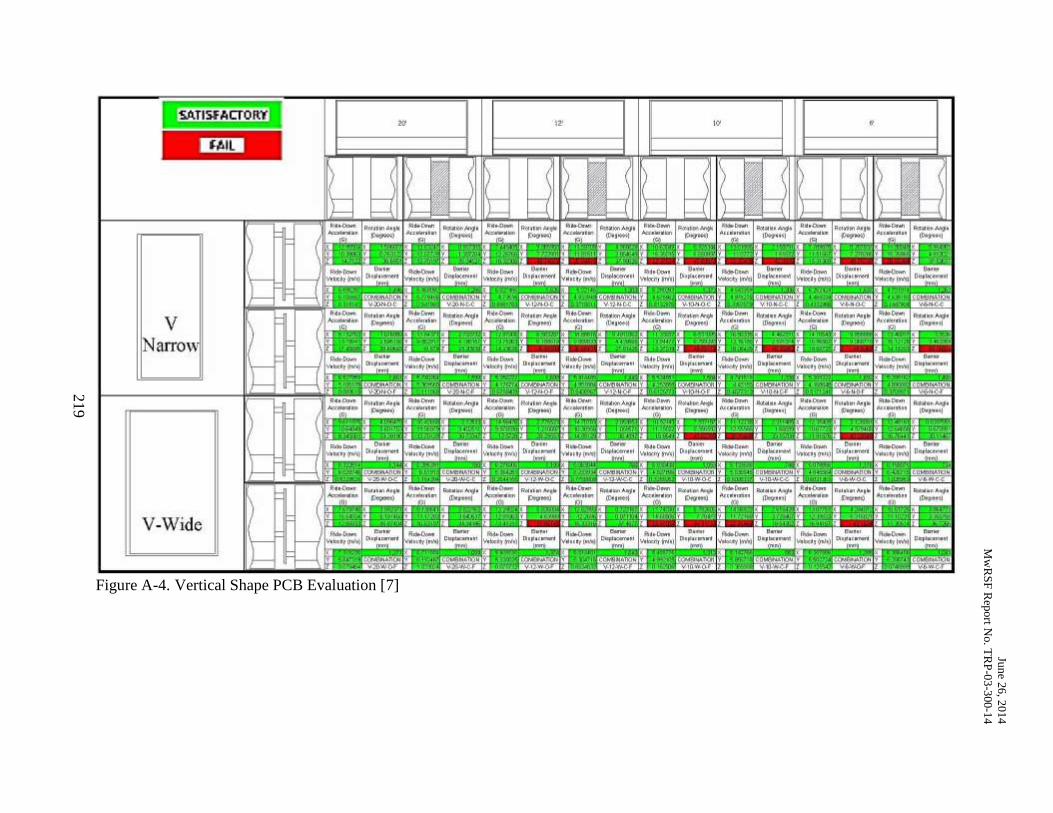
Jun
e 26
, 201
4
Mw
RS
F R
epo
rt No. T
RP
-03
-300-1
4
219
Figure A-4. Vertical Shape PCB Evaluation [7]
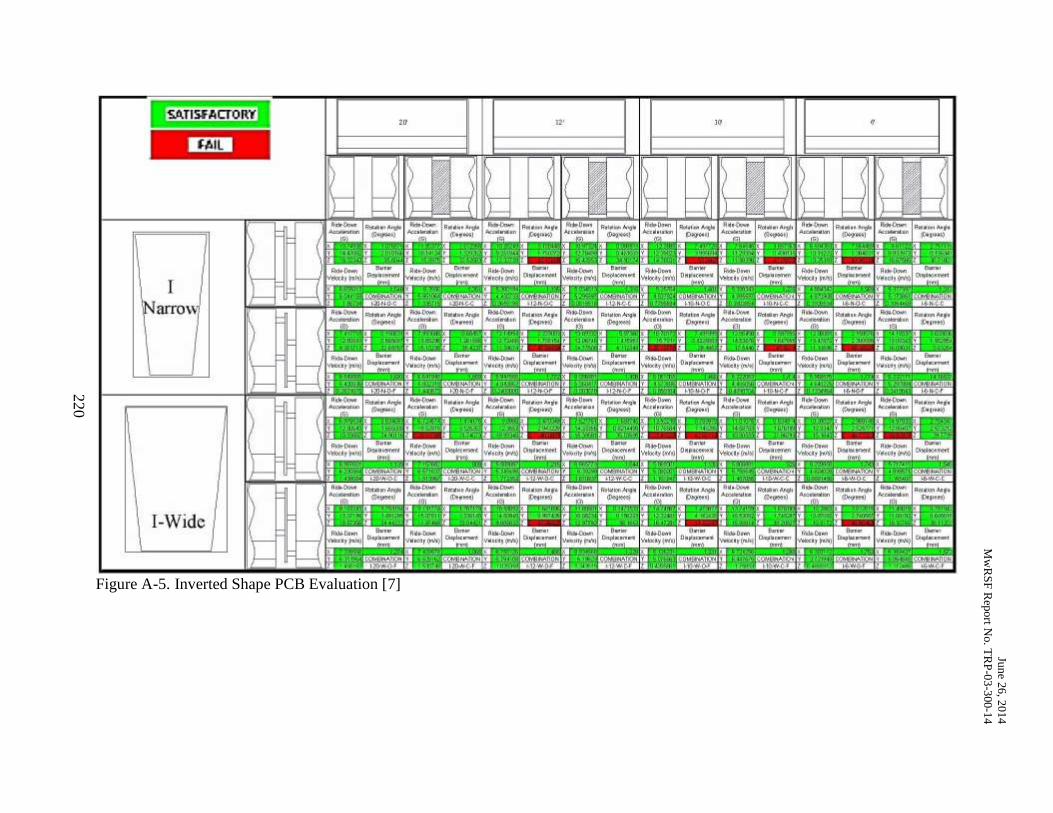
Jun
e 26
, 201
4
Mw
RS
F R
epo
rt No. T
RP
-03
-300-1
4
220
Figure A-5. Inverted Shape PCB Evaluation [7]

June 26, 2014
MwRSF Report No. TRP-03-300-14
221
Appendix B. W-Beam Guardrail Deflections
The results from TTI’s guardrail deflection study are found in this appendix. The results
include testing agency, system description, maximum permanent and dynamic deflections, and
working width.
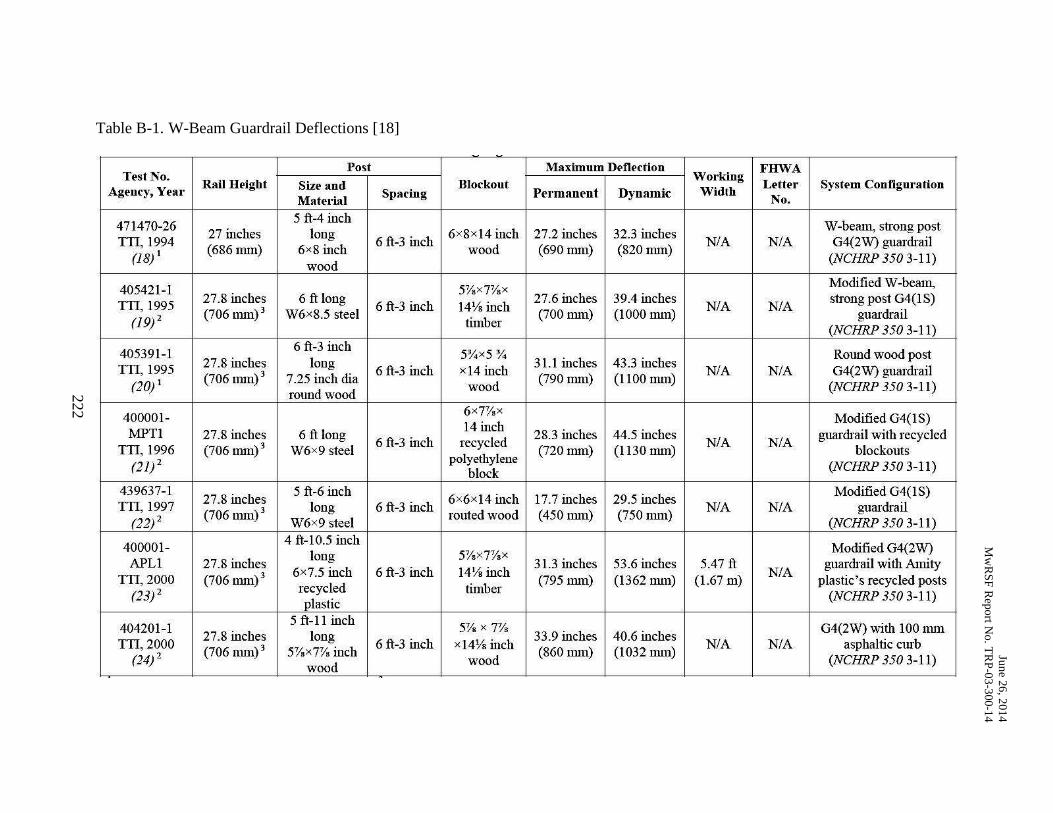
Jun
e 26
, 201
4
Mw
RS
F R
epo
rt No. T
RP
-03
-300-1
4
222
Table B-1. W-Beam Guardrail Deflections [18]
Post Maximum D{'flection FHWA T{'st No. Rllil Hl'ight Blockout
Working L{'tt{'r Systl'm Configurlltion Ag{'ncy, Yl'ar Siz{' lind Spacing Pumllu{'ut Dyullmic Width
MIlt{'l'ial No.
471470-26 5 ft-4 inch W-beam, stroug post TTI, 1994
27 inches long 6 ft-3 inch 6x8x14 inch 27.2 inches 32.3 inches
NIA NlA G4(2W) guardrail (18) 1
(686 mm) 6x8 inch wood (690 lIlln) (820 mm) (NCHRP 350 3-11)
wood
405421-1 5Y.x7Y. x Modified W -beanl,
lTI,I995 27.8 inches 6 ft long 6 ft-3 inch 14Ys inch 27.6 inches 39.4 inches
NIA NlA strong post G4(IS)
(19)' (706 mm)3 W6xS.5 steel
timber (700 mm) (1000 mm) guardrail
(NCHRP 350 3-11)
405391-1 6 ft-3 inch 5%x5 ~4 Round wood post 27.8 inches long 31.1 inches 43.3 inches lTI, 1995 (706 mm)3 7.25 inch dia
6 ft-3 inch x14 inch (790 nlln) (1100 mm)
NIA NlA G4(2W) guardrail (20) •
round wood wood (NCHRP 350 3-11)
400001- 6x7Y.x Modified G4(IS)
14 inch MPTI 27.8 inches 6 ft long 6 ft-3 inch recycled 28.3 inches 44.5 inches
NIA NIA guardrail with recycled
TI1, 1996 (706 nllll) ] W6x9 steel (720 mm) (1130 mm) blackouts (21) , polyethylene
(NCHRP 350 3-11) block
439637-1 27.8 inches
5 ft-6 inch 6x6x14 inch 17.7 inches 29.5 inches
Modified G4(IS) TTI,I997 (706 nllll) 3
long 6 ft-3 inch routed wood (450 mm) (750 mm)
NIA NIA guardrail (22f W6x9 steel (NCHRP 350 3-11)
400001- 4 fi-IO.5 inch Modified G4(2W)
APLl 27.S inches long 5Y. x7Y.x
31.3 inches 53.6 inches 5.47 ft guardrail with Amity lTI,2000 (706 mm) J
6x7.5 inch 6 ft-3 inch 14Ys inch (795 mm) (1362 mm) (1.67 m)
NlA plastic's recycled posts recycled timber (23)' plastic
(NCHRP 350 3-11)
404201-1 5ft-Ilinch 5Yo x 7Y. G4(2W) vtith 100 mm
27.8 inches long 33.9 inches 40.6 inches lTI,2000 (706 nun) ] 5Yax7Y. inch
6 ft-3 inch x14Ys inch (S60 mm) (1032 mm)
NIA NlA asphaltic curb (24)2
wood wood (NCHRP 350 3-11)
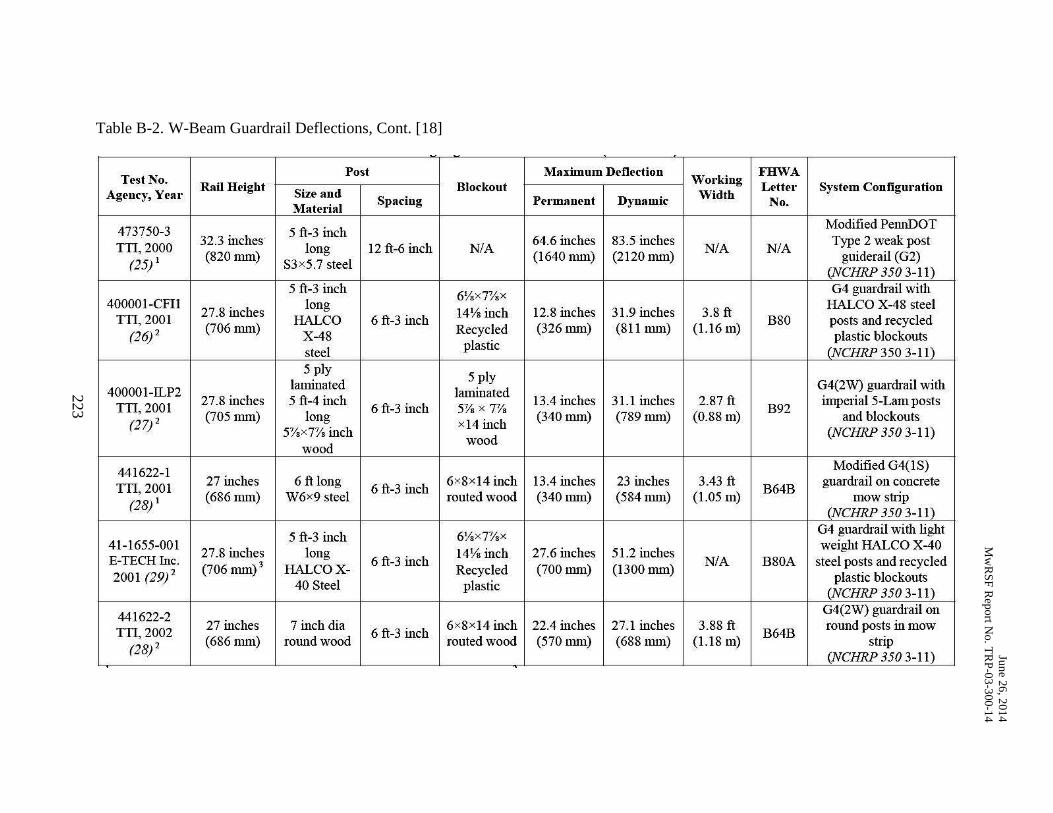
Jun
e 26
, 201
4
Mw
RS
F R
epo
rt No. T
RP
-03
-300-1
4
223
Table B-2. W-Beam Guardrail Deflections, Cont. [18]
Test No. Post Maximum Deflection
Working FHWA
Agency, Year Rail Hpight
Size and BIockout Width
Letter System Configuration
Material Spacing Permanent Dynamic No.
473750-3 5 ft-3 inch Modified PennDOT
TTI,2000 32.3 inches
long 12 ft-6 inch NiA 64.6 inches 83.5 inches
NIA NiA Type 2 weak post
(25) • (820 mm) S3x5.7 steel
(1640 mm) (2120 mm) guiderail (G2) (NCHRP3503-11)
5 ft-3 inch 6Ya x7Y. x G4 guardrail with
400001-CFIl 27.8 inches
long 14'18 inch 12.8 inches 31.9 inches 3.8 ft
HALC'O X-4R steel TI1,2001
(706 mm) HALCO 6 ft-3 inch
Recycled (326 mm) (811 rum) (l.l6m) B80 posts and recycled
(26)' X-48 plastic blockouts steel
plastic GVCHRP3503-1I) 5 ply
5 ply 400001-ILP2 laminated
laminated G4(2W) guardrail with
TTI, 2001 27.8 inches 5 ft-4 inch
6 ft-3 inch 5Vo x 7% 13.4 inches 3l.l inches 2.87 ft.
B92 imperial5-Lamposts
(27)' (705 Illm) long
x14 inch (340 mm) (789 mIll) (0.88 m) and blockouts
5%x7Y. inch (NCHRP 350 3-11) wood
wood
441622-1 Modified G4(1 S)
TI1,2001 27 inches 6 ft long
6 ft.-3 inch 6x8x14 inch 13.4 inches 23 inches 3.43 ft.
B64B guardrail on concrete
(28) • (686 mm) W6x9 steel routed wood (340 mIll) (584 rum) (1.05 m) mow strip (NCHRP 350 3-11)
5 ft-3 inch 6Yax7%x G4 guardrail with light 41-1655-001
27.8 inches long 14'18 inch 27.6 inches 51.2 inches weight HALCD X-40
E-TECH Inc. 6 ft.-3 inch NIA B80A steel posts and recycled 2001 (29)2 (706 nun) 3 HALCDX- Recycled (700 mill) (1300 llllll)
plastic blockouts 40 Steel plastic (NCHRP 350 3-11)
441622-2 G4(2W) guardrail on
TTI,2002 27 inches 7 inch dia
6 ft.-3 inch 6x8x14 inch 22.4 inches 27.1 inches 3.88 ft
B64B romld posts in mow
(28)' (686 mm) rolUld wood routed wood (570 mill) (688 rum) (l.l8 m) strip
(NCHRP 350 3-11)
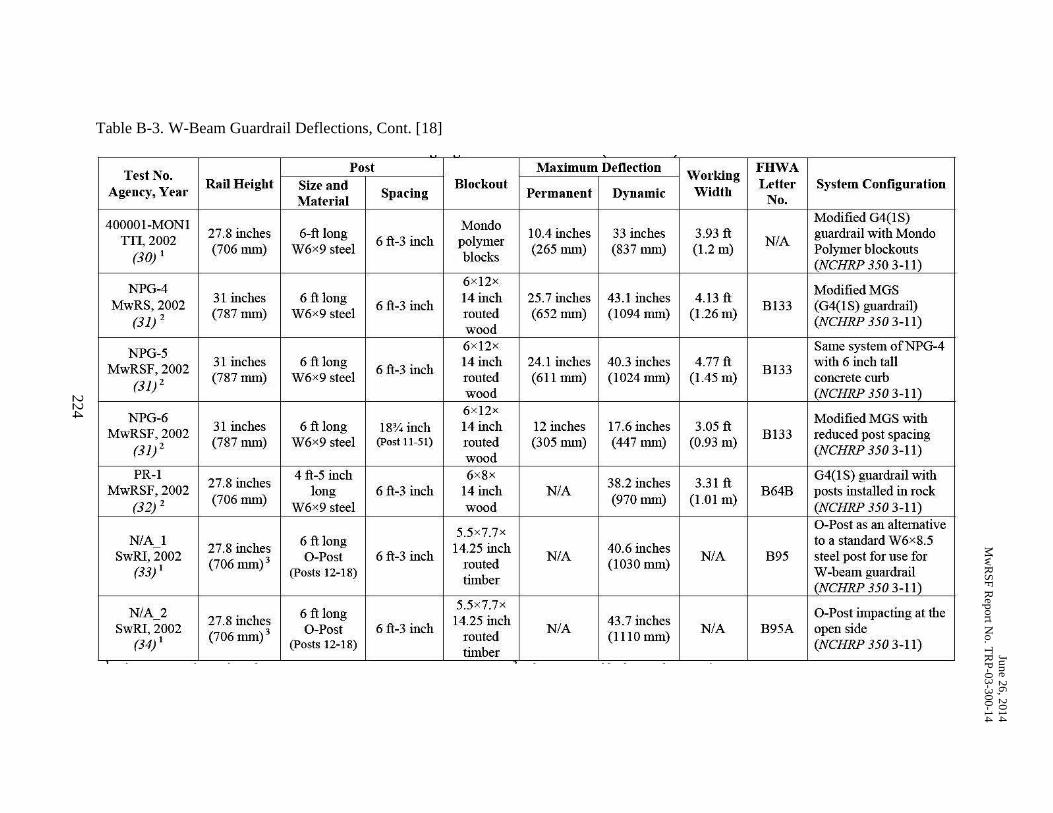
Jun
e 26
, 201
4
Mw
RS
F R
epo
rt No. T
RP
-03
-300-1
4
224
Table B-3. W-Beam Guardrail Deflections, Cont. [18]
n'st No. Post Maximum Dt'flt'dion
Working FHWA
Rail Ht'ight Sizt' and Blockout Lt'ttt'r Systt'm Configuration Agt'ncy, Yt'ar Sparing Pt'l'mant'nt Dynamic Width
Matt'rial No.
400001-MaNI Mondo Modified G4(IS)
TTI,2002 27.8 inches 6-ft long 6 ft-3 inch polymer
10.4 inches 33 inches 3.93 ft N/A
guardrail .... 'ith Mondo (706 mm) W6x9 steel (265 mm) (837 mIll) (1.2 m) Polymer blockouts (30) , blocks I (NCHRP3503-1I)
NPG-4 6x12x
Modified MGS MwRS,2002 31 inches 6 ft long 6 ft-3 inch 14 inch 25.7 inches 43.1 inches 4.13 ft B133 (04(IS) guardrail)
(31) , (787 mm) W6x9 steel routed (652 mm) (1094 mm) (1.26 m) (NCHRP3503-11)
wood
NPG-5 6x12x Same system ofNPG-4
MwRSF, 2002 31 inches 6 ft long 6 ft-3 inch 14 inch 24.1 inches 40.3 inches 4.77 ft B133
with 6 inch tall
(31)2 (787 mm) W6x9 steel routed (611 mm) (1024 mm) (l.45 m) concrete curb
wood I (NCHRP 350 3-11)
NPG-6 6x12x
Modified MGS .... 'ith MwRSF,2002 31 inches 6 ft long 18~ inch 14 inch 12 inches 17.6 inches 3.05 ft
B133 reduced post spacing (31)'
(787 rum) W6x9 steel (post 11-51) routed (305 mm) (447 lIlln) (0.93 m) (NCHRP3503-11)
wood PR-I
27.8 inches 4 ft-5 inch 6x8x
38.2 inches 3.31 ft G4(1S) guardrail .... 'ith
MwRSF, 2002 (706 rum)
long 6 ft-3 inch 14 inch NlA (970 mIll) (1.01 m)
B64B posts installed in rock (32) 2 W6x9 steel wood (NCHRP3503-11)
5.5x7.7x a-post as an altemative
N/A 1 27.8 inches 6 ft long 14.25 inch 40.6 inches
to a standard W6x8.5 SwRI, 2002 (706 mm)3 a-post 6 ft-3 inch
routed NlA
(1030 mm) N/A 895 steel post for use for
(33) 1 (Posts 12-18) W-beam guardrail timber
(NCHRP 350 3-11)
N/A 2 6 ft long 5.5x7.7x
a-post impacting at the 27.8 inches 14.25 inch 43.7 inches
SwRI, 2002 (706 mm)3 a-post 6 ft-3 inch routed
NlA (1110 mm)
N/A B95A open side (34) 1 (p{'J.~ts 12-1 R)
timber (NCHRP 350 3-11)
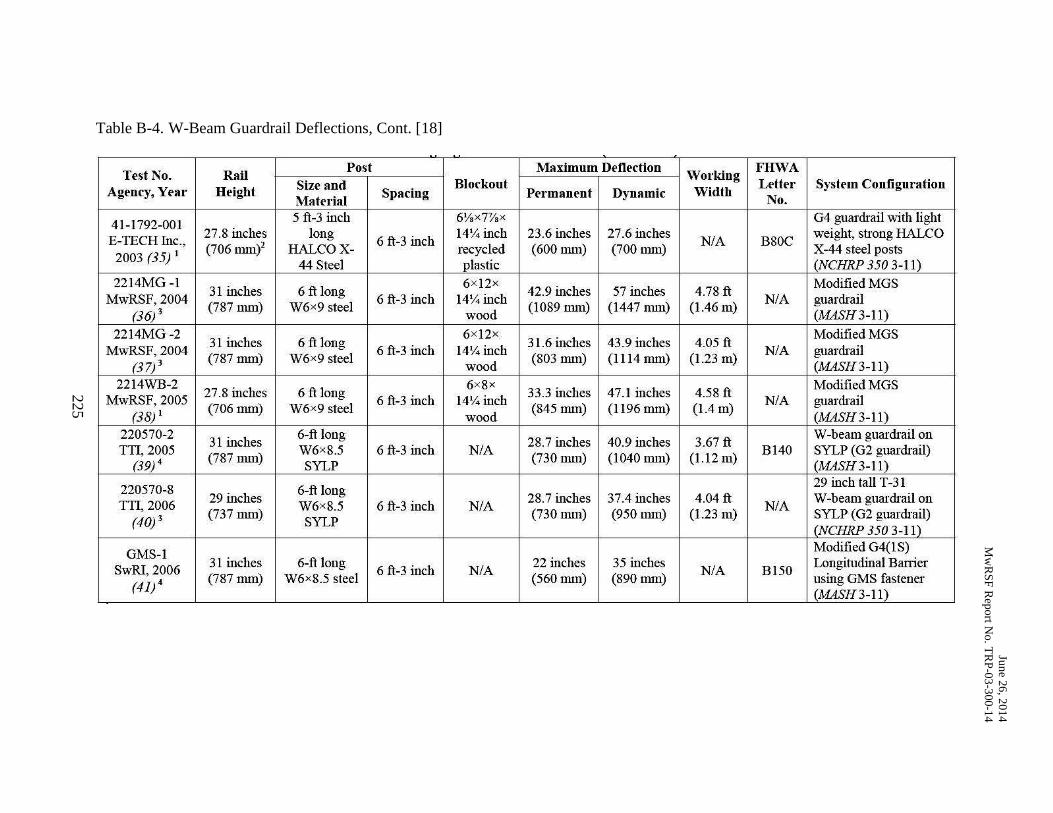
Jun
e 26
, 201
4
Mw
RS
F R
epo
rt No. T
RP
-03
-300-1
4
225
Table B-4. W-Beam Guardrail Deflections, Cont. [18]
Test No. Rail Post Maximum Defledion
Working FHWA
Size and Blockout Letter System Configumtion Agency, Year Height Spacing Per'manent Dynamic Width
Material No.
41-1792-001 5 ft-3 inch 6'!.x7Y.x G4 guardrail \1tith light
E-lECH Inc., 27.8 inches long 6 ft-3 inch 14'1. inch 23.6 inches 27.6 inches NiA B80C
weight, strong HALCO
2003 (35) 1 (706 nllnl HALCOX- recycled (600 llm) (700 lIlln) X-44 steel posts
44 Steel plastic I (NCHRP3503-1l) 2214MG -1
31 inches 6 ft long 6xl2x
42.9 inches 57 inches 4.78 ft Modified MGS
MwRSF,2004 6 ft-3 inch 14V4 inch NiA guardrail (36)3
(787 mm) W6x9 steel wood
(1089 lIlln) (1447 mll) (1.46 m) (MASH3-1l)
2214MG -2 31 inches 6 ft long
6xl2x 31.6 inches 43.9 inches 4.05 ft
Modified MGS MwRSF,2004 6 ft-3 inch 14Y4 inch NiA guardrail
(37)3 (787 mm) W6x9 steel
wood (803 llm) (1114 mm) (1.23 m)
(MASH3-1l) 2214WB-2
27.8 inches 6 ft long 6x8x
33.3 inches 47.1 inches 458ft Modified MGS
MwRSF,2005 6 ft-3 inch 14'1. inch NiA guardrail (38) 1
(706 mm) W6x9 steel wood
(S45 llm) (1196 lll1ll) (1.4 m) (MASH3-1l)
220570-2 31 inches
6-ft long 2S.7 inches 40.9 inches 3.67 ft
W-beam guardrail on TTI,2005
(787 mm) W6xS.5 6 ft-3 inch NiA
(730 llm) (1040 mm) (1.12 m) Bl40 SYLP (G2 guardrail)
(39) 4 SYLP I (MASH3-1l)
220570-8 6-ft long 29 inch tall T-31
TTI,2006 29 inches W6x8.5 6 ft-3 inch NiA 2S.7 inches 37.4 inches 4.04 ft NiA
W-beam guardrail on
(40)' (737 mm)
SYLP (730 llm) (9501111n) (1.23 m) SYLP (G2 guardrail)
I (NCHRP 350 3-11)
GMS-l Modified G4(IS)
SwRI,2006 31 inches 6-ft long 6 ft-3 inch NiA
22 inches 35 inches NiA Bl50
Longittuiinal Barrier
(41)' (787 mm) W6xS.5 steel (560 llm) (890 mill) using GMS fastener
I (MASH3-1l)
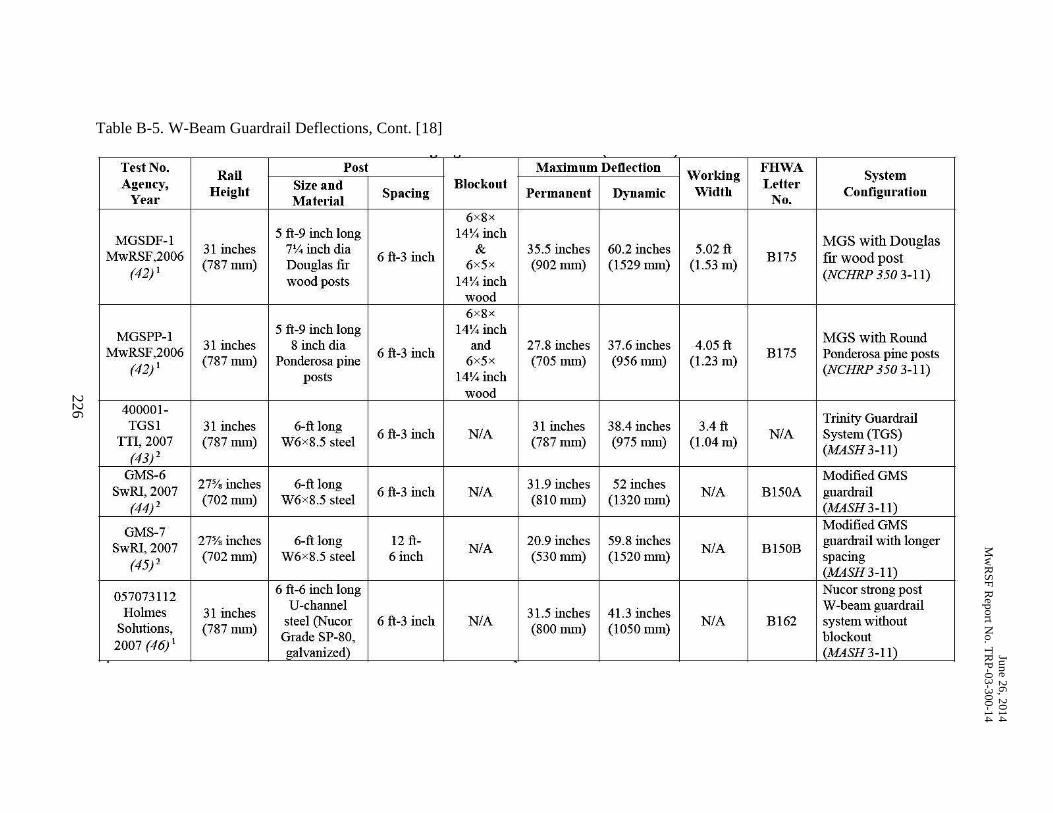
Jun
e 26
, 201
4
Mw
RS
F R
epo
rt No. T
RP
-03
-300-1
4
226
Table B-5. W-Beam Guardrail Deflections, Cont. [18]
n·stNo. Rail
Post Maximum Dt'Ot'ction Working
FHWA S)'stt'm
Agt'ncy, Sizt' and Blockout Lt'ttt'r Ht'ight Spacing Pt'l'mant'nt Dynamic \Vidth Configuration
Yt'ar Matt'rial No. 6x8x
MGSDF-l 5 ft-9 inch long 14'l.4 inch
MGS with Douglas 31 inches 7'l.4 inch dia & 35.5 inches 60.2 inches 5.02 ft MwRSF,2006 (787 mm) Douglas tir
6 ft_3 inch 6x5x (902 mm) (1529 lllm) (1.53 m)
B175 fir wood post (42)1
wood posts 14'l.4 inch (NCHRP 350 3-11)
wood 6x8 x
MGSPP-l 5 ft-9 inch long 14'l.4 inch
MGS with ROlmd MwRSF,2006
31 inches 8 inch dia 6 ft-3 inch "nd 27.8 inches 37.6 inches 4.05 ft
B175 Ponderosa pine posts (787 mm) Ponderosa pine 6x5x (705 mm) (956 lllm) (1.23 m)
(42)1 posts 14'l.4 inch
(NCHRP 350 3-11)
wood 400001-
Trinity Guardrail TGSI 31 inches 6-ft long 31 inches 38.4 inches 3.4 ft
TTI,2007 (787 mm) W6x8.5 steel 6 ft-3 inch N/A
(787 mm) (975 nun) (1.04 m) N/A System (TGS)
(43)' (MASH3-11)
GMS-6 27Ys inches 6-ft long 31.9 inches 52 inches
Modified GMS SwRl,2007 6 ft-3 inch N/A NiA B150A guardrail
(44)2 (702 mm) W6x8.5 steel (810 mIll) (1320 lllIll) (MASH3-11)
GMS-7 Modified GMS
SwRl,2007 27% inches 6-ft long 12 ft-
N/A 20.9 inches 59.8 inches
NiA B150B guardrail with longer
(45)' (702 mm) W6x8.5 steel 6 inch (530 rum) (1520 lllIll) spacmg
(MASH3-11)
057073112 6 ft-6 inch long Nucor shang post
Holmes 31 inches V-channel
31.5 inches 41.3 inches W -beam guardrail
Solutions, (787 mm) steel (Nucor 6 ft-3 inch N/A
(800 mm) (1050 lllm) NiA B162 system without
Grade SP-80, blackout 2007 (46) I galvanized) . (MASH3-11)
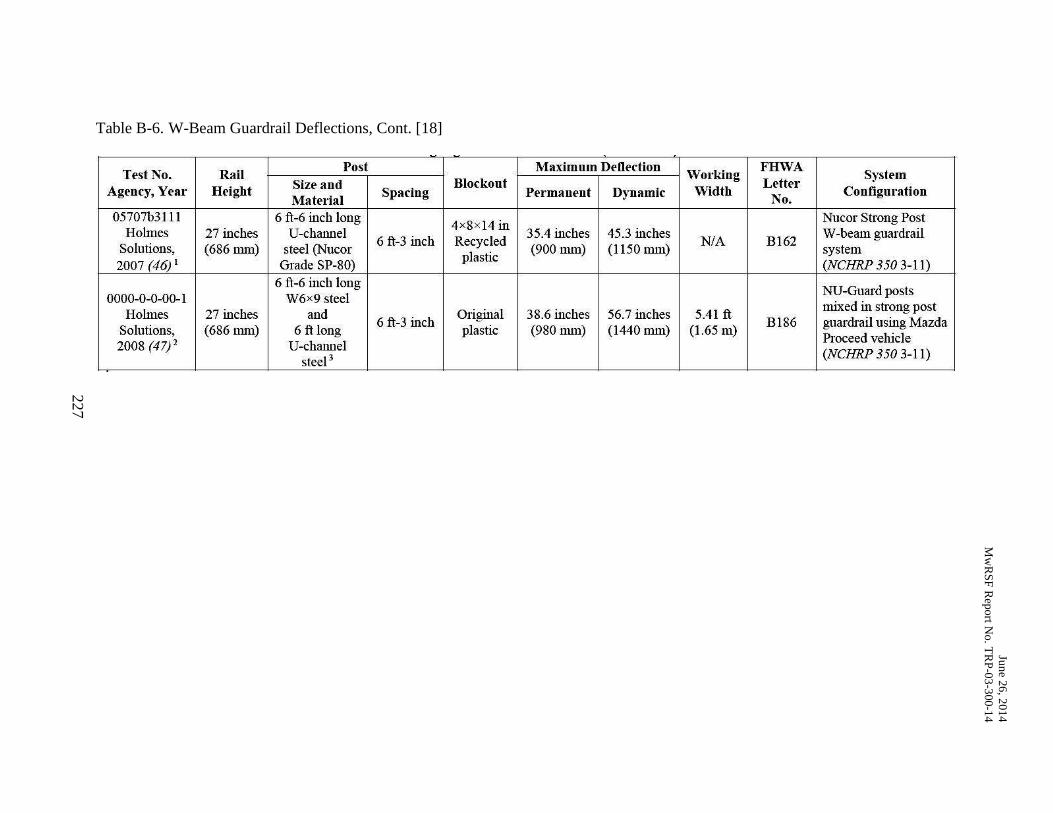
Jun
e 26
, 201
4
Mw
RS
F R
epo
rt No. T
RP
-03
-300-1
4
227
Table B-6. W-Beam Guardrail Deflections, Cont. [18]
Tt'st No. Rail Post Maximum Dt'Ot'dion
Working FHWA
Systt'm Blockout Lt'ttt'r
Agt'nQ', Yt'ar Ht'ight Sizt' and Spacing P('l'mant'nt Dynamic Width Configuration
Matt'rial No. 05707b3111 6 ft-6 inch long
4x8x14 in Nucor Strong: Post Holmes 27 inches U-channel 6 ft-3 inch Recycled
35.4 inches 45.3 inches NiA B162
W -beam guardrail Solutions. (686 rum) steel (Nucor
plastic (900 mm) (1150 mm) system
2007 (46) 1 Grade SP-SO) (NCHRP 350 3-11) 6 ft-6 inch long
NU-Guard posts 0000-0-0-00-1 W6x9 steel
Holmes 27 inches ",d Original 3S,6 inches 56.7 inches 5.41ft mixed in strong post
Solutions, (6S6 mm) 6 ft long 6 ft-3 inch
plastic (980 mm) (1440 mm) (1.65 Ill) BlS6 guardrail using Mazda
200S (47)2 U-channel Proceed vehicle
steel 3 (NCHRP 350 3-11)
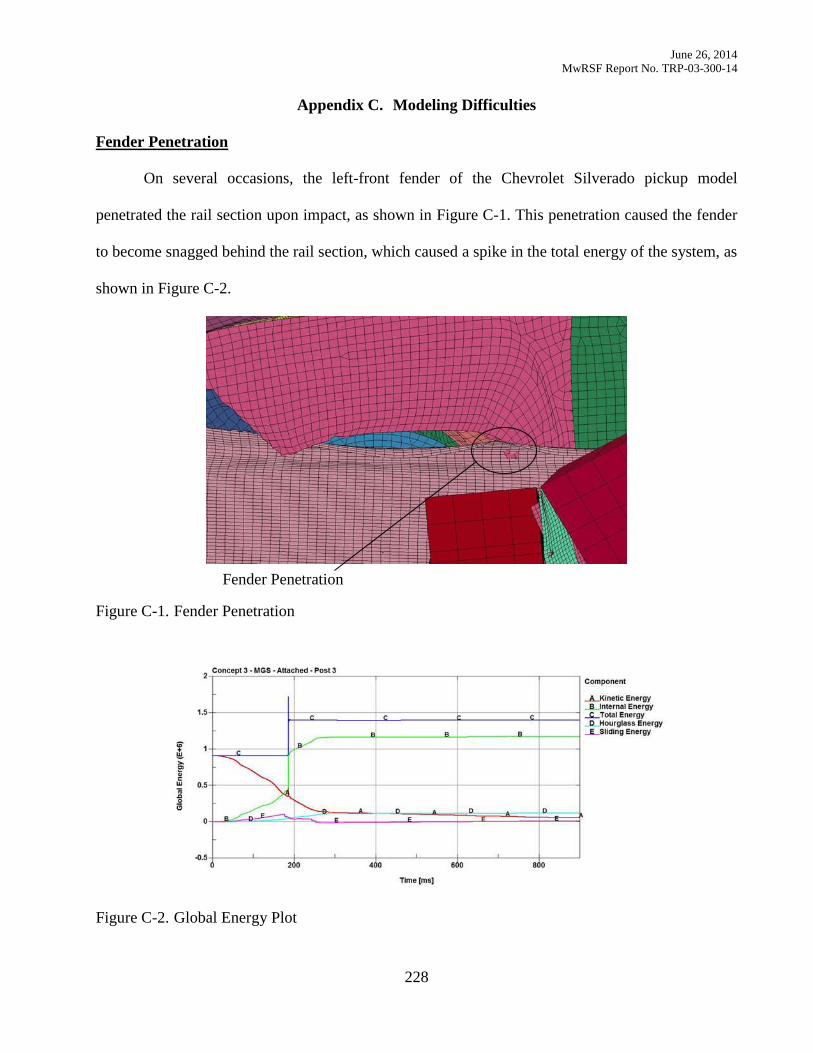
June 26, 2014
MwRSF Report No. TRP-03-300-14
228
Jun
e 26
, 201
4
Mw
RS
F R
epo
rt No. T
RP
-03
-300-1
4
Appendix C. Modeling Difficulties
Fender Penetration
On several occasions, the left-front fender of the Chevrolet Silverado pickup model
penetrated the rail section upon impact, as shown in Figure C-1. This penetration caused the fender
to become snagged behind the rail section, which caused a spike in the total energy of the system, as
shown in Figure C-2.
Figure C-1. Fender Penetration
Figure C-2. Global Energy Plot
Fender Penetration
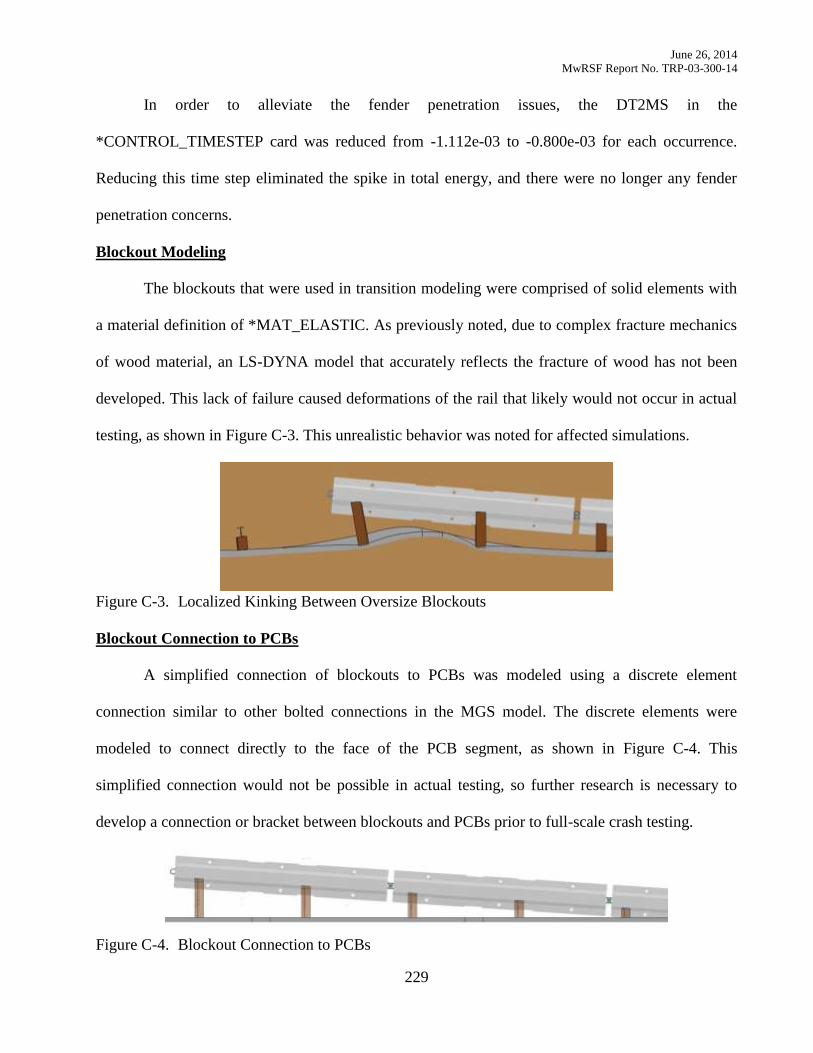
June 26, 2014
MwRSF Report No. TRP-03-300-14
229
Jun
e 26
, 201
4
Mw
RS
F R
epo
rt No. T
RP
-03
-300-1
4
In order to alleviate the fender penetration issues, the DT2MS in the
*CONTROL_TIMESTEP card was reduced from -1.112e-03 to -0.800e-03 for each occurrence.
Reducing this time step eliminated the spike in total energy, and there were no longer any fender
penetration concerns.
Blockout Modeling
The blockouts that were used in transition modeling were comprised of solid elements with
a material definition of *MAT_ELASTIC. As previously noted, due to complex fracture mechanics
of wood material, an LS-DYNA model that accurately reflects the fracture of wood has not been
developed. This lack of failure caused deformations of the rail that likely would not occur in actual
testing, as shown in Figure C-3. This unrealistic behavior was noted for affected simulations.
Figure C-3. Localized Kinking Between Oversize Blockouts
Blockout Connection to PCBs
A simplified connection of blockouts to PCBs was modeled using a discrete element
connection similar to other bolted connections in the MGS model. The discrete elements were
modeled to connect directly to the face of the PCB segment, as shown in Figure C-4. This
simplified connection would not be possible in actual testing, so further research is necessary to
develop a connection or bracket between blockouts and PCBs prior to full-scale crash testing.
Figure C-4. Blockout Connection to PCBs
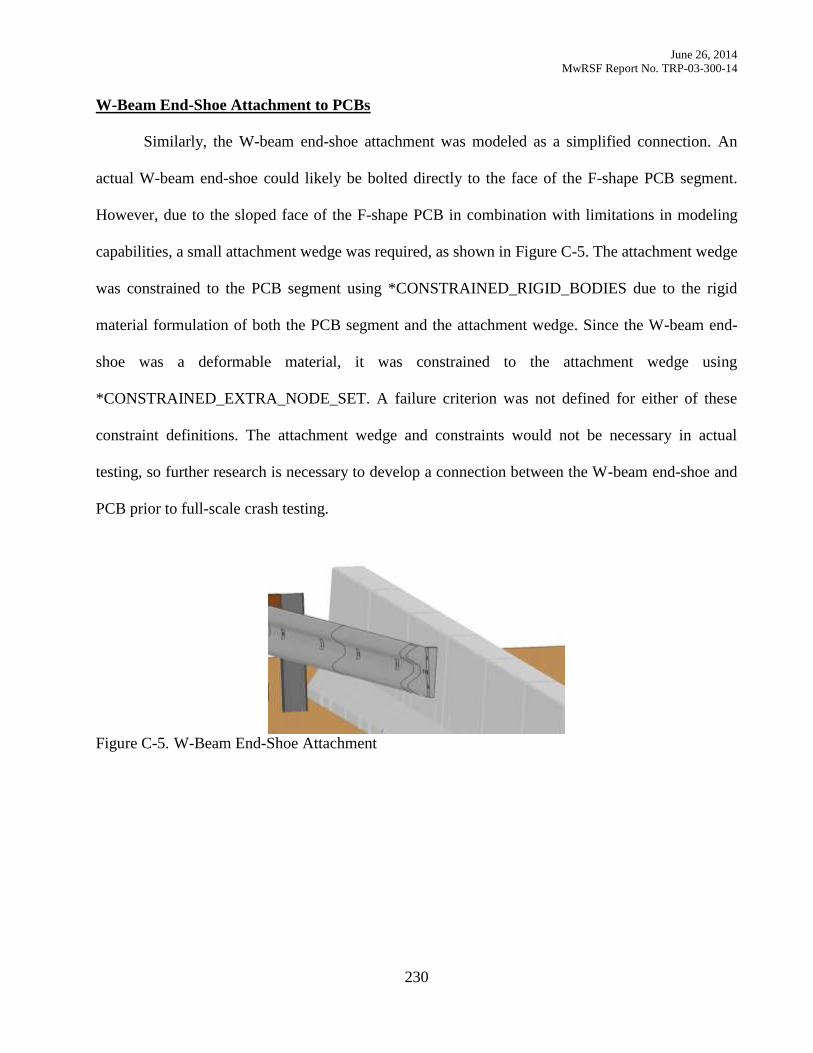
June 26, 2014
MwRSF Report No. TRP-03-300-14
230
Jun
e 26
, 201
4
Mw
RS
F R
epo
rt No. T
RP
-03
-300-1
4
W-Beam End-Shoe Attachment to PCBs
Similarly, the W-beam end-shoe attachment was modeled as a simplified connection. An
actual W-beam end-shoe could likely be bolted directly to the face of the F-shape PCB segment.
However, due to the sloped face of the F-shape PCB in combination with limitations in modeling
capabilities, a small attachment wedge was required, as shown in Figure C-5. The attachment wedge
was constrained to the PCB segment using *CONSTRAINED_RIGID_BODIES due to the rigid
material formulation of both the PCB segment and the attachment wedge. Since the W-beam end-
shoe was a deformable material, it was constrained to the attachment wedge using
*CONSTRAINED_EXTRA_NODE_SET. A failure criterion was not defined for either of these
constraint definitions. The attachment wedge and constraints would not be necessary in actual
testing, so further research is necessary to develop a connection between the W-beam end-shoe and
PCB prior to full-scale crash testing.
Figure C-5. W-Beam End-Shoe Attachment

June 26, 2014
MwRSF Report No. TRP-03-300-14
231
END OF DOCUMENT

June 26, 2014
MwRSF Report No. TRP-03-300-14
232