development of performance measurement for freight .... 19, 2013 4 project objectives • to develop...
TRANSCRIPT

Development of Performance Measurement for Freight Transportation
Dr. Peter Kelle
Information Systems and Decision Sciences
Louisiana State University
Drs. Mingzhou Jin and Xiaoyan Zhu
Industrial and Systems Engineering
University of Tennessee at Knoxville
At 2013 Louisiana Transportation Conference
Feb 19, 2013
Feb. 19, 2013 2
Outline
• Introduction
• Review of Literature and Practice
– USDOT
– State DOTs
– Other Literature
• Preliminary Performance Measure Development
– User Needs
– Transportation Goals
– Preliminary Freight Performance Measures
• Work Plan

Feb. 19, 2013 3
Landmarks of Intermodal Freight Transportation
• ISTEA (1991)
• TEA-21 (1998)
• MAP-21 (2012)
– Requests the national freight network to “incorporate concepts of
performance, …, and accountability into the operation and
maintenance of the national freight network”
– Requires the U.S. Department of Transportation (USDOT) and all
states to “establish performance measures for freight movement”

Feb. 19, 2013 4
Project Objectives
• To develop a systematic, scalable, calculable, effective, and user-
oriented performance measure system for intermodal freight
transportation systems.
• Measures can be integrated into other models such as Intermodal
Freight Simulation Model to answer the following questions:
– For a transportation system, intermodal or single mode, how well it
is designed and operated;
– For a specific industry in a specific area, what kinds of modes or
their combination should be chosen;
– For local, state wide, national governments, what kind of intermodal
transportation system is the best choice
– To provide guidelines for performance measures-based intermodal
transportation decision making.

Feb. 19, 2013 5
2011 USDOT Performance Measures
• Safety
• Reduced congestion
• Global connectivity
• Environmental stewardship
• Security, preparedness, and response; and
• Organizational excellence.

Feb. 19, 2013 6
2011 USDOT Performance Measures
•Safety
– Passenger vehicle occupant highway fatality rate per 100 million
passenger vehicle miles traveled (VMT);
– Large truck and bus fatality rate per 100 million total VMT;
– Motorcyclist fatality rate per 100,000 motorcycle registrations;
– Non-occupant fatality rate per 100million VMT;
– Number of commercial air carrier fatalities per 100 million persons
onboard;
– Fatal accidents per 100,000 flight hours in general aviation;
– Rail-related accidents and incidents per million train miles;
– Transit fatalities per 100 million passenger-miles traveled;
– Number of natural gas and hazardous liquid pipeline incidents with death
or major injury; and
– Number of hazardous materials transportation incidents with death or
major injury.
Mode-Specific

Feb. 19, 2013 7
2011 USDOT Performance Measures
•Congestion Reduction
– Percentage of travel on the National Highway System (NHS) meeting
pavement performance standards for “good” rated ride;
– Percentage of deck area on National Highway System (NHS) bridges
rated deficient
– Percentage of total annual urban area travel occurring in congested
conditions;
– Average percent change in transit boardings per transit market (150
largest transit agencies);
– Percent of transit bus fleets compliant with the Americans with Disabilities
Act (ADA);
– Percent of key transit rail stations compliant with the ADA; and
– Percent of all flights arriving within 15 minutes of schedule at the 35
Operational Evolution Partnership airports due to National Airspace
System related delays.
Mode-Specific

Feb. 19, 2013 8
2011 USDOT Performance Measures
• Environmental stewardship, security, and organizational excellence – Number of areas in conformity lapse;
– Number of hazardous liquid pipeline spills with environmental consequences;
– Number of Exemplary Human Environmental Initiatives undertaken;
– Median time in months to complete environmental impact statements for DOT funded
infrastructure projects;
– Percentage of DoD-required shipping capacity complete with crews available within
mobilization timelines;
– Percentage of DoD-designated commercial ports available for military use within DoD
established readiness timelines;
– Percent of DOT personnel with emergency management responsibilities who are prepared to
respond to disasters and emergencies;
– Percent of DOT agencies meeting annual response requirements;
– Percent of major federally funded transportation infrastructure projects with less than 2 percent
annual growth in the project completion milestone as reported in the finance plan;
– Percent of finance plan cost estimated for major federally funded transportation infrastructure
projects with less than 2 percent annual growth in project completion cost;
– For major DOT aviation systems, percentage of cost goals established in the acquisitions
project baselines that are met; and
– For major DOT aviation systems, percentage of scheduled milestones established in
acquisition project baselines that are met.
Feb. 19, 2013 9
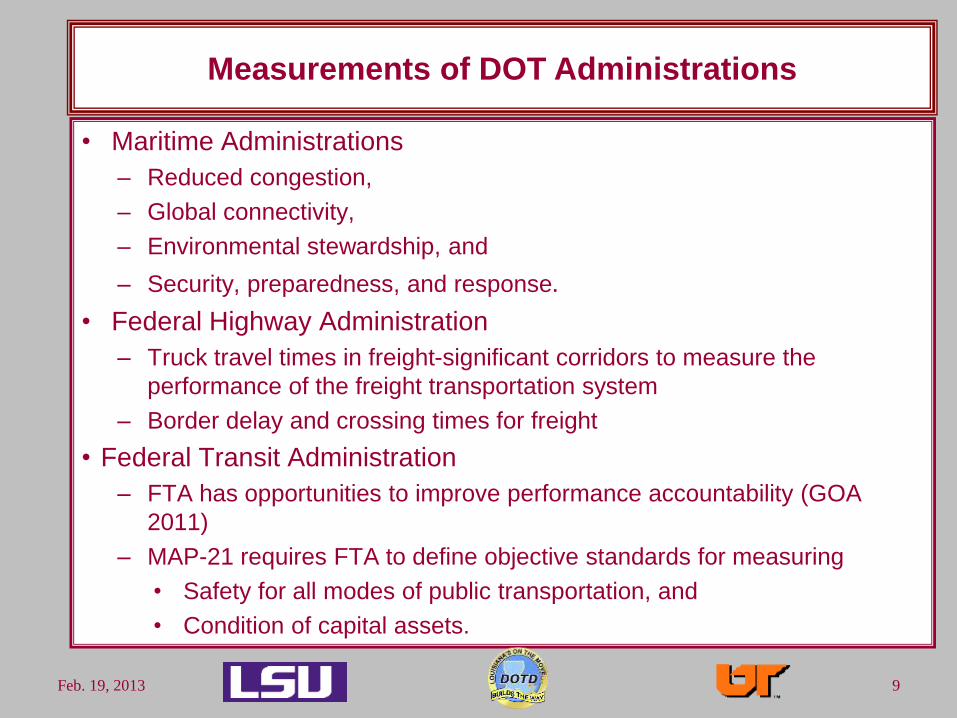
Measurements of DOT Administrations
• Maritime Administrations
– Reduced congestion,
– Global connectivity,
– Environmental stewardship, and
– Security, preparedness, and response.
• Federal Highway Administration
– Truck travel times in freight-significant corridors to measure the
performance of the freight transportation system
– Border delay and crossing times for freight
• Federal Transit Administration
– FTA has opportunities to improve performance accountability (GOA
2011)
– MAP-21 requires FTA to define objective standards for measuring
• Safety for all modes of public transportation, and
• Condition of capital assets.

Feb. 19, 2013 10
Measures of DOT Administrations
• Federal Railroad Administration reports rail service metrics and
performance of intercity passenger train operations regarding
finance, on-time, delays, other service quality, and public benefit.
• Seven Class-I railroad report three freight rail performance at
www.railroadpm.org.
– Cars on Line,
– Train Speed (miles per hour), and
– Terminal Dwell (Hours).
The railroads actually use different ways to calculate those measures
and it is difficult to compare them on a railroad-by-railroad basis
(Vantuono)

Feb. 19, 2013 11
Measures Used by State DOTs (Missouri)
• MoDOT is using a comprehensive tool called Tracker to track 19 categories of
performance – Uninterrupted Traffic Flow;
– Smooth and Unrestricted Roads and Bridges;
– Safe Transportation System;
– Roadway Visibility;
– Outstanding Customer Service;
– Partner with Others to Deliver Transportation Services;
– Advance Economic Development;
– Innovative Transportation Solutions;
– Fat Projects That Are of Great Value;
– Environmentally Responsible;
– Great Workplace, Great Employees;
– Efficient Movement of Goods;
– Easily Accessible Modal Choices;
– Customer Involvement in Transportation Decision Making;
– Accommodating Roadsides;
– Best Value for Every Dollar Spent;
– Advocate for Transportation Issues; and
– Proactive Transportation Information.

Feb. 19, 2013 12
MoDOT Metrics for Uninterrupted Traffic Flow
Metrics Unit/Calculation
Relevant
to
Freight
Average travel times on
selected freeway
sections
10-mile travel time (minutes) =10 miles/ Average Speed
Free flow speed H
Average rate of travel on
signalized routes
High: speeds at 80 percent of the speed limit; medium: 50 to
79 percent; low: less than 50 percent. H
Average time to clear
traffic incident
Minutes M
Traffic impact closures
on major interstate
routes
Total closure minutes for events with an actual or expected
duration of one hour or more closure at selected mile
markers at major highways H
Work zone (WZ) impacts
to traveling public
Number of WZ with major and moderate impact. An impact is
defined as the additional time added to the public’s normal
travel: Minor: less than 10 minutes, moderate:10 to 14
minutes, and major: 15 minutes or greater.
H
Time to meet winter
storm event performance
objectives
Average time (hours) involved in road clearance during
winter weather on continuous and non-continuous operations
routes. H

Feb. 19, 2013 13
MoDOT Metrics for Uninterrupted Traffic Flow
Metrics Unit/Calculation
Relevant
to
Freight
Percent of major highways in
good condition
On high-speed routes (> 50 mph), the International Roughness
Index (IRI) is used to measure good conditions. For lower-speed
routes (mostly urban areas) where smoothness is less critical, a
condition rating is used in with the smoothness component.
H
Percent of minor highways in
good condition
Smoothness is evaluated using the IRI. Pavements below the
prescribed threshold are considered good. A condition rating of
visual distress is also evaluated and if those criteria are met, the
roadway is considered good.
H
Percent of vehicle miles
traveled on major highways
in good condition
An annual measure based on VMT estimation on major highways.
H
Percent of bridges in good
condition
A bridge is considered “good” if it is not either “structurally
deficient” or “functionally obsolete” H
Percent of major bridges in
good condition
A major bridge is one with a length greater than 1,000 feet. H

Feb. 19, 2013 14
MnDOT Performance Metrics
Category Measure with Definition Relevant
to Freight
Traveler Safety Total traffic fatalities and serious injuries H
Infrastructure
Percent of bridges whose conditions are good or satisfactory H
Percent of bridges whose conditions are poor (structurally deficient or
functionally deficient) H
Percent of state highway miles in poor pavement condition H
Percent of state principal arterials miles in poor pavement condition H
Percent of state principal arterials miles in good pavement condition H
Maintenance
Frequency of achieving bare lane within target hours, all storms and
routes H
Percent of bridge safety inspections that were inspected within the
required time period H
Customer satisfaction with state highway maintenance from 1 to 10 based
on a survey H
National and
Global
Connections
Airline annual available seat miles on scheduled commercial flights I
Annual tonnage of shipments to and from MN Great Lakes & river ports H
Annual tonnage of shipments on Minnesota Railroads: from, to and
through Minnesota H

Feb. 19, 2013 15
MnDOT Performance Metrics
Category Measure with Definition Relevant
to Freight
Statewide
Connection
Percent of major interregional routes can be driven within 2 mph of the
corridor target speed H
Percent of Minnesota population within 30 minute drive time of an
airport with paved and lighted runway H
Twin Cities
Mobility
Percent of miles below 45 mph in AM or PM peak M
Average clearance time for metro urban freeway incidents H
Annual rail and express bus transit ridership I
MN Metro and
Regional Mobility
Annual Greater Minnesota bus service hours I
Community
Development and
Transportation
Percent of state highway intersections with Accessible Pedestrian
Signals L
Percent of commuter trips with bicycle commuting, walking and public
transit in major metropolitan areas I
Energy and the
Environment
Annual billions of gallons sold in Minnesota H

Feb. 19, 2013 16
MnDOT Performance Scorecard

Feb. 19, 2013 17
NCDOT Performance Metrics
Measure Definition Relevant
to Freight
Fatality Rate Total number of statewide fatalities on NC roads per 100 million vehicle H
Incident Duration Average time it takes to clear a major accident (i.e. one that causes
significant or unusual delays) from a North Carolina highway H
Infrastructure
Health
Bridge health index: Percent of bridges in good condition. A bridge is
considered to be in good condition if the Level of Service (LOS) for the
Deck, Sub-Structure and Super Structure are all greater than or equal to
6 (on a 1 to 9 scale)
H
Pavement condition rating: Percent of lane miles in good condition. A
good condition for pavement is defined as a Pavement Condition Rating
(PCR) value of 80 or higher (on a 0 to 100 scale).
H
Roadside feature condition score: H
Delivery Rate
Percent of plans completed and bids opened on time M Percent of right of way plans completed on time M Percent of construction projects completed on schedule M Percent of construction projects completed on budget M Environmental compliance index. M
Employee
Engagement
Employee emotional and rational commitment indices derived from the
employee engagement survey I
Employee discretionary effort index derived from the employee
engagement survey I
Intent to stay index derived from the employee engagement survey I

Feb. 19, 2013 18
NCDOT Performance Dashboard

Feb. 19, 2013 19
A Freight Performance Study by MnDOT (2008)
• 19 Categories with total 247 Performance Metrics under Them (some
overlaps)
network and infrastructure safety or damage
access capacity
travel time reliability
market share modal share
modal costs freight productivity
freight security shipment rates
pricing agency cost
carrier cost shipper cost
externalities and community cost transportation indices
external factors
Too Many ?

Feb. 19, 2013 20
National Cooperative Freight Research Program Report 10:
Performance Measures for Freight Transportation (2012)
• Major Findings
– A reporting framework is possible.
– The impediments to creating a Freight System Report Card are
numerous and there is no entity and no budget to develop a Freight
System Report Card.
– A coalition of interested parties will need to coalesce around the concept
of producing a Freight System Report Card.
• 29 Metrics under 6 Categories
Freight Demand Freight Efficiency
Freight System Condition Freight Environmental Impacts
Freight Safety Adequacy of Investment in Freight System
Those metrics describe the facts of performance on each mode and lacks
system-level performance measures for intermodal transportation
Feb. 19, 2013 21
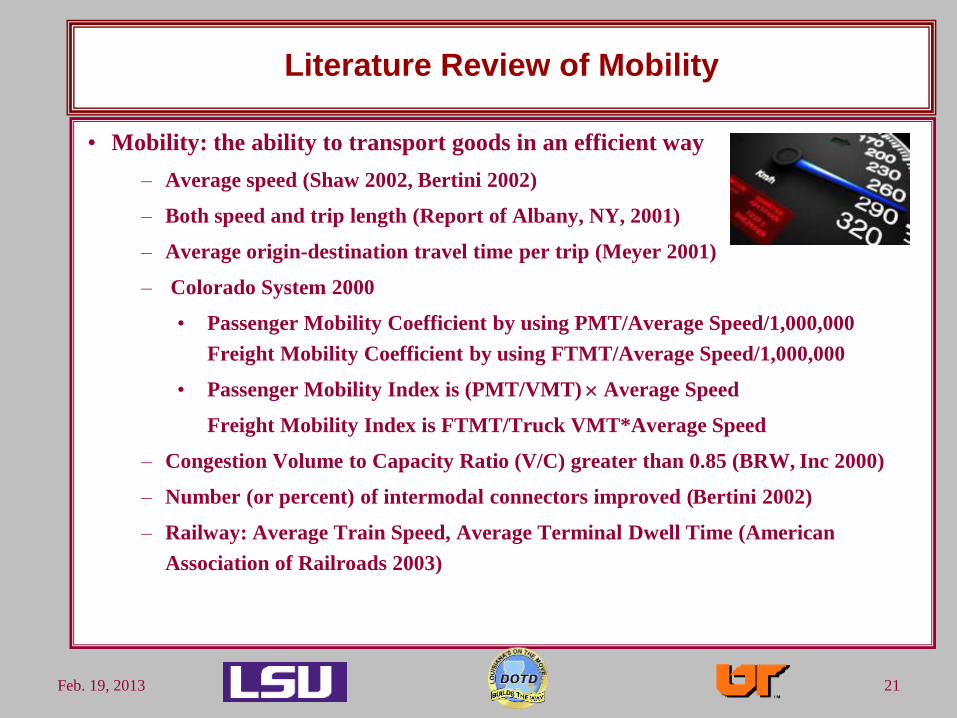
Literature Review of Mobility
• Mobility: the ability to transport goods in an efficient way
– Average speed (Shaw 2002, Bertini 2002)
– Both speed and trip length (Report of Albany, NY, 2001)
– Average origin-destination travel time per trip (Meyer 2001)
– Colorado System 2000
• Passenger Mobility Coefficient by using PMT/Average Speed/1,000,000
Freight Mobility Coefficient by using FTMT/Average Speed/1,000,000
• Passenger Mobility Index is (PMT/VMT) Average Speed
Freight Mobility Index is FTMT/Truck VMT*Average Speed
– Congestion Volume to Capacity Ratio (V/C) greater than 0.85 (BRW, Inc 2000)
– Number (or percent) of intermodal connectors improved (Bertini 2002)
– Railway: Average Train Speed, Average Terminal Dwell Time (American
Association of Railroads 2003)
Feb. 19, 2013 22
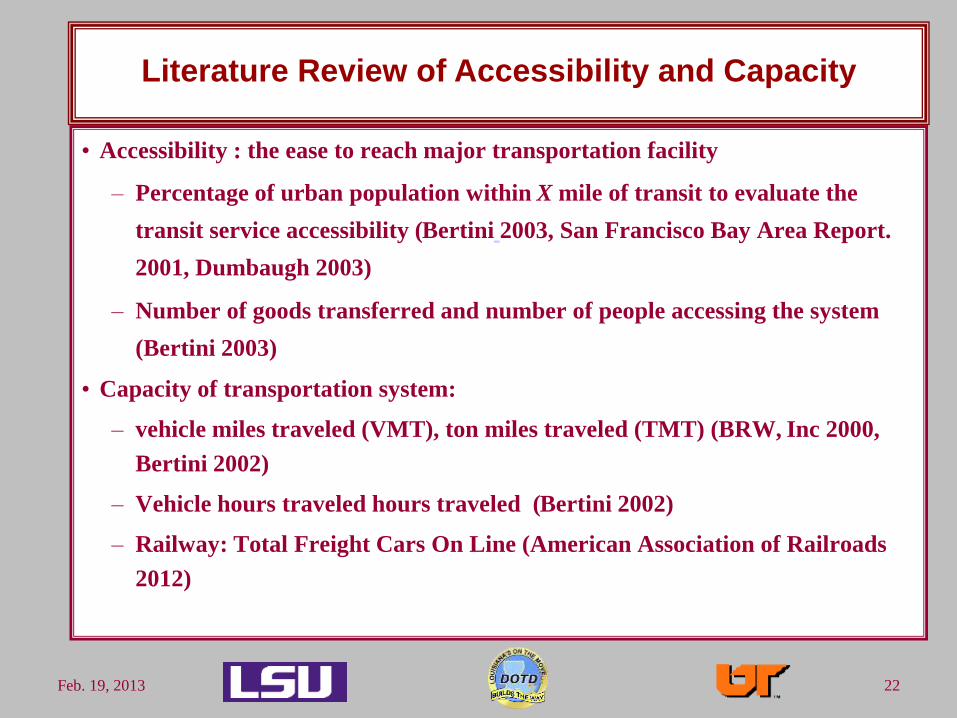
Literature Review of Accessibility and Capacity
• Accessibility : the ease to reach major transportation facility
– Percentage of urban population within X mile of transit to evaluate the
transit service accessibility (Bertini 2003, San Francisco Bay Area Report.
2001, Dumbaugh 2003)
– Number of goods transferred and number of people accessing the system
(Bertini 2003)
• Capacity of transportation system:
– vehicle miles traveled (VMT), ton miles traveled (TMT) (BRW, Inc 2000,
Bertini 2002)
– Vehicle hours traveled hours traveled (Bertini 2002)
– Railway: Total Freight Cars On Line (American Association of Railroads
2012)

Feb. 19, 2013 23
Literature Review of Reliability
• Reliability: the delay caused by some unusual events or incidents
• Measures:
– Transfer time between modes (Bertini, 2003, Czerniak 1996)
– Delays per ton-mile, lost time or delay time, and congested highway miles divided by
total highway miles (BRW, Inc 2000)
– How ships know the schedule well and accurately estimate the dwell time (DOT 1999)
• Problem: How to define delay and “on time”?

Feb. 19, 2013 24
Literature Review of Safety
• From “Combined Performance Plan and Report”
– Highway: fatalities per 100 million vehicle-mile of travel and number of
accidents per 100 million vehicle-miles of travel
– Airborne: fatal aviation accidents per 100,000 departures
– Maritime: number of calls received for help by coast guard and percent of
all mariners in imminent danger who are rescued.
– Railway: train accidents per million train-miles and rail related fatalities
per million train-miles
• Problems: hard to compare

Feb. 19, 2013 25
Literature Review of Cost Effectiveness
• Cost is direct costs associated with transportation planning,
construction and operation
– Cost per ton-mile identified by (Hagler Bailly Services, Inc 2001,
Hickling Lewis Brod, Inc 1998, and the State of Florida 1998)
• Fuel consumption cost
• Truck technology and drivers’ wages
– Cost per vehicle hour (Hagler Bailly Services, Inc 2001)
– Maintenance cost on facilities (the State of Florida 1998)
• The higher the better?

Feb. 19, 2013 26
Literature Review Infrastructure Condition
• Number of bridges per 100 miles (BRW Inc 2002)
• Number of deficient bridges per 100 mile (BRW Inc 2002)
• Lane-miles of high-level highway requiring rehabilitation (California,
1998)
• Percentage of miles of state trunk lines with surface condition classified
as good and the number bridges rated as good (Michigan, 1999 and
many state DOTs)
Is infrastructure condition a necessary performance measure?
It influences mobility, reliability, safety, comfortability

Feb. 19, 2013 27
Literature Review of Economic Impact
• Number of direct and indirect jobs created (Indianapolis Study 2000,
St. Louis Region MPO 1998)
• Contribution of investment to GDP growth presented (Hickling Lewis
Brod, Inc 1998)
• Revenue per ton-mile by mode (Florida, 1998)
• The value of the freight that is moved from, to and within the region
(St. Louis Region MPO 1998)
• Problems
– Hard to compare
– Hard to measure

Feb. 19, 2013 28
Literature Review of Industry Productivity
• Industry productivity: the efficiency of the industry instead of the
transportation system
• Measures in the literature
– Vehicle miles per capita and revenue hours per employee. (Thompson, 2001)
– Empty/loaded ratio for truck moves, annual miles per truck, and average
length of haul by vehicle (FHWA)
• Not direct reflection of transportation system efficiency
Feb. 19, 2013 29
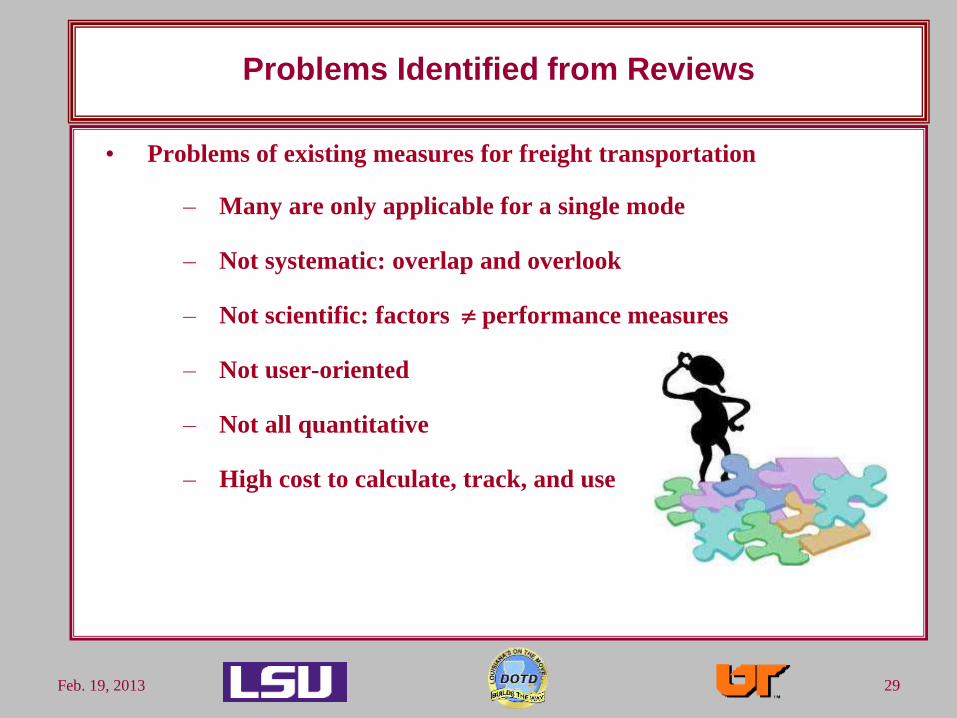
Problems Identified from Reviews
• Problems of existing measures for freight transportation
– Many are only applicable for a single mode
– Not systematic: overlap and overlook
– Not scientific: factors performance measures
– Not user-oriented
– Not all quantitative
– High cost to calculate, track, and use

Feb. 19, 2013 30
What is a Good Measurement Systems?
• It should be based on user needs. Transportation systems are built
for their users rather than others.
• It should be applicable for all modes and their combinations.
• It should be scalable to compare systems of different sizes.
• It should be scientific and systematic. A good performance measure
system should be a hierarchy with system and sub system
measures. At the system level, there should be no overlaps or
oversights.
• It should be as quantitative as possible.
• It should be cost effective to calculate, track, and use.
Feb. 19, 2013 31
Freight Transportation User Needs
• Users : all agencies and participants in freight transportation systems, who have
diverse purposes, preferences and requirements for the transportation facilities.
– Investors include transportation investors and stakeholders (sometimes they
are government agencies). Their major concerns would be how to develop a
cost effective system and how to get the investment return as soon as
possible.
– Industries include public and private industries. Their major concerns are
to transport the goods in a quick, safe, cheap, reliable and efficient manner.
– Society users’ major concerns are located in economic impact, community
impact, and environment consideration.

Feb. 19, 2013 32
Transportation Goals
Goals Users
• Mobility: less time for trips (Industry)
• Reliability: more predictable, less delay (Industry)
• Safety and security: less accidents, fatalities, risks
(Industry, Society)
• Environmental impact: less amount of transportation related
pollutants released into the environment, higher community
livability near major transportation infrastructures, and less
energy consumption (Society)
• Long-term cost efficiency: more cost efficient system, lower
cost/benefit ratio and higher sustainability (Investors)
• Economic growth: more jobs and revenue created by
transportation system (Society)
DOT Metrics
• Reduced
congestion
• Global
connectivity
• Safety
• Security,
preparedness,
and response
• Environmental
stewardship
• Organizational
excellence.
Feb. 19, 2013 33
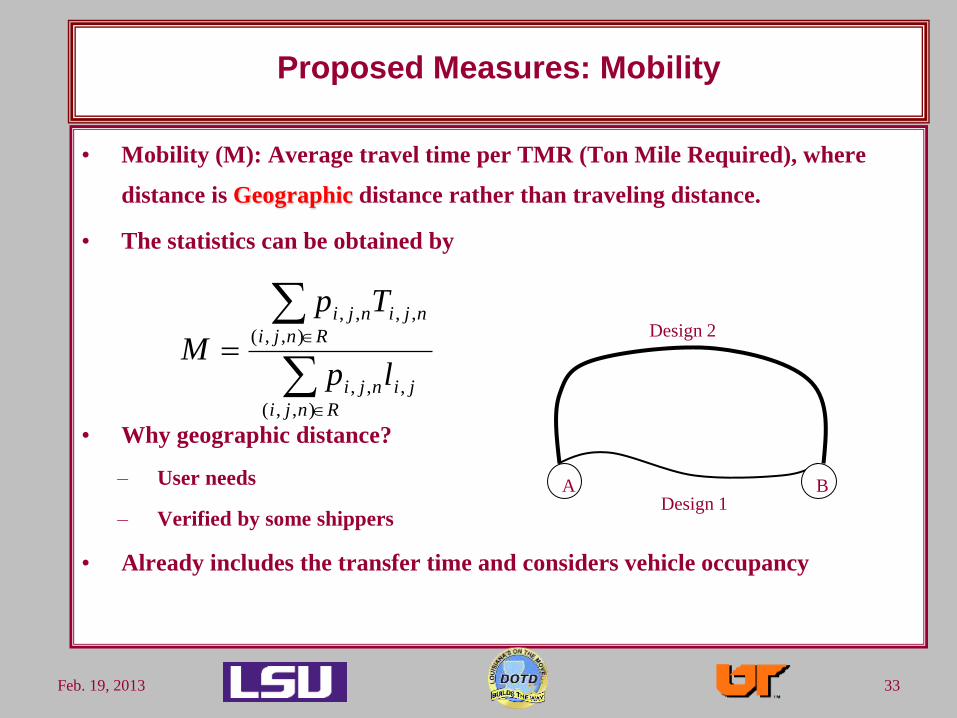
Proposed Measures: Mobility
• Mobility (M): Average travel time per TMR (Ton Mile Required), where
distance is Geographic distance rather than traveling distance.
• The statistics can be obtained by
• Why geographic distance?
– User needs
– Verified by some shippers
• Already includes the transfer time and considers vehicle occupancy
Rnji
jinji
Rnji
njinji
lp
Tp
M
),,(
,,,
),,(
,,,,
A B Design 1
Design 2
Feb. 19, 2013 34
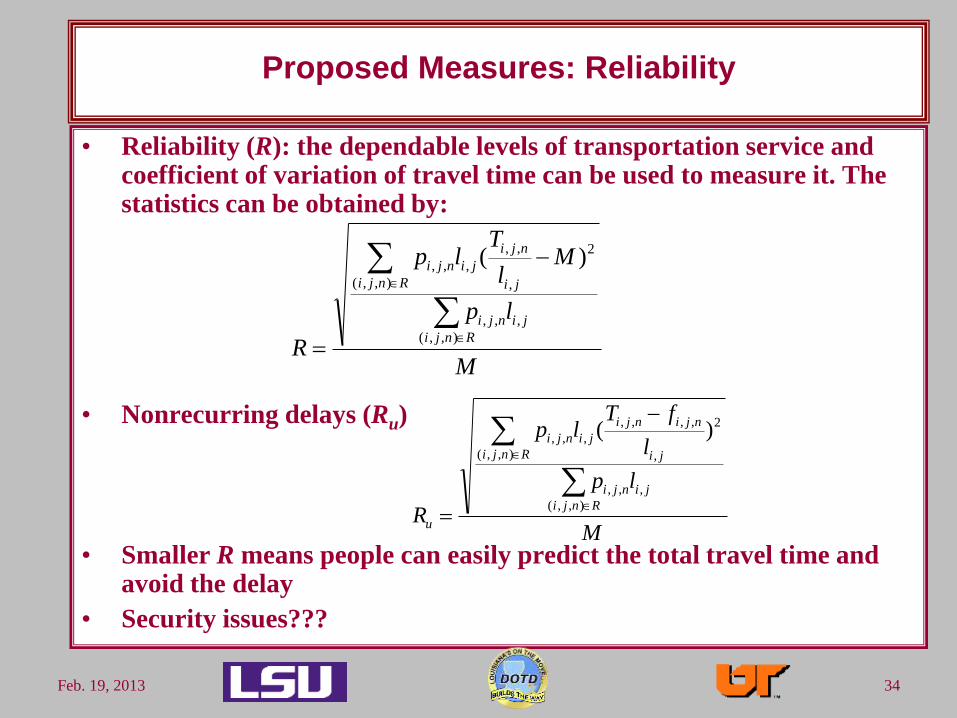
Proposed Measures: Reliability
• Reliability (R): the dependable levels of transportation service and coefficient of variation of travel time can be used to measure it. The statistics can be obtained by:
• Nonrecurring delays (Ru)
• Smaller R means people can easily predict the total travel time and avoid the delay
• Security issues???
M
lp
Ml
Tlp
RRnji
jinji
Rnji ji
nji
jinji
),,(
,,,
),,(
2
,
,,
,,, )(
M
lp
l
fTlp
RRnji
jinji
Rnji ji
njinji
jinji
u
),,(
,,,
),,(
2
,
,,,,
,,, )(

Feb. 19, 2013 35
Proposed Measures: Safety
• Fatality (SF): number of fatality per TMR
• Injury rate (SI): number of injuries per TMR
• Property damage (Sp) cost per TMR
• Accident detection and response efficiency influence the outcomes of accidents, but
they are already covered by mobility and reliability.
Rnji
jinji
Rnji
nji
Flp
F
S
),,(
,,,
),,(
,,
Rnji
jinji
Rnji
nji
Ilp
I
S
),,(
,,,
),,(
,,
Rnji
jinji
Rnji
nji
plp
D
S
),,(
,,,
),,(
,,
Feb. 19, 2013 36
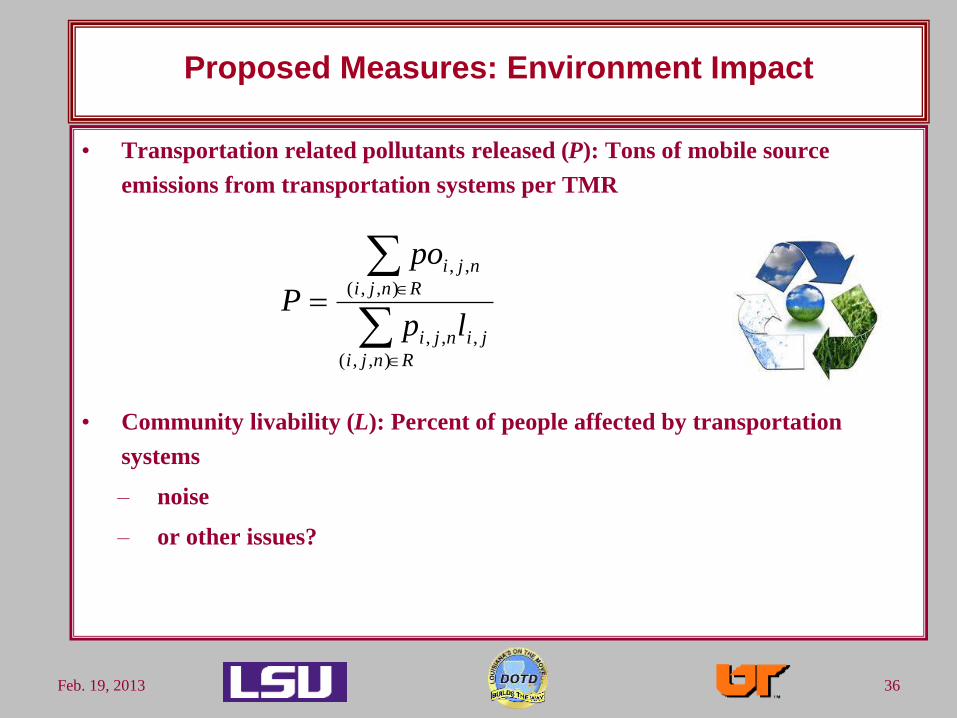
Proposed Measures: Environment Impact
• Transportation related pollutants released (P): Tons of mobile source
emissions from transportation systems per TMR
• Community livability (L): Percent of people affected by transportation
systems
– noise
– or other issues?
Rnji
jinji
Rnji
nji
lp
po
P
),,(
,,,
),,(
,,

Feb. 19, 2013 37
Proposed Measures: Direct Cost Efficiency
• The direct cost includes vehicle operation cost, construction,
operation, maintenance and disposal cost for transportation facilities
– Vehicle Operation Cost (VC): vehicle operation cost mainly includes cost of fuel
consumption, cost for vehicle insurance, cost for vehicle maintenance, cost for
vehicle aging per TMR, and other cost.
– Transportation Facility Cost (FC): the cost of transportation facility per TMR.
(money flow diagram and interest issues)
Rnji
jinji
Rnji
njinjinjinjinji
lp
VOVAVMVIGC
VC
),,(
,,,
),,(
,,,,,,,,,, )(
1 2 3 4 5 17 18 19 20
15M
50M 50M
5M 5M 5M 5M 5M 5M
10M

Feb. 19, 2013 38
Proposed Measures: Economic Growth
• Transportation system investment can improve business sale and
employment of the region
– Economic growth (EG): the direct business sale increasing directly
caused by one million dollar transportation investment, which
includes initial capital investment and operating and maintenance
investment.
– Regional Employment Improvement (J): Number of job year
opportunities created by a transportation system per 1 million
dollar investment.
TI
TEGEG

Feb. 19, 2013 39
Work Plan
• Further modify metrics for freight transportation
• Investigate data availability for calculating metrics
• Study the calculation procedures for the metrics
• A case study to demonstrate the usage of proposed performance
measurement system

Feb. 19, 2013 40
Questions and Answers
Thanks