development of regime map for continuous...
TRANSCRIPT

GHENT UNIVERSITY
FACULTY OF PHARMACEUTICAL SCIENCES
Department of Pharmaceutical Analysis
Laboratory of Pharmaceutical Process Analytical Technology
Academic year 2013-2014
DEVELOPMENT OF REGIME MAP FOR CONTINUOUS HIGH SHEAR
WET GRANULATION USING TWIN SCREW GRANULATOR
Jens DHONDT
First Master of Drug Development
Promoter
Prof. Dr. T. De Beer
Commissioners
Prof. Dr. B. De Spiegeleer
Dr. S. Mortier

COPYRIGHT
"The author and the promoter give the authorization to consult and to copy parts of this
thesis for personal use only. Any other use is limited by the laws of copyright, especially
concerning the obligation to refer to the source whenever results from this thesis are cited."
May 16, 2014
Promoter Author
Prof. Dr. T. De Beer Jens Dhondt
Resume
Twin-screw granulation is an emerging continuous granulation technique in the
pharmaceutical industry. Due to several advantages over batch-to-batch granulation. The
twin-screw granulator, present in the ConsiGmaTM-25 production line, allows easy
modifications of multiple parameters making twin-screw granulation an interesting
technique to study relating possibilities. At this moment, the available information about the
use of this technique is limited. The equipment allows the manipulation of size and
properties of the granules by adjusting binder addition method, screw configuration, stagger
angle of the kneading elements, granulation barrel temperature, liquid addition, powder
feed rate and screw speed. For each configuration, there is a different torque requirement
for the rotation of the screws and hence resulting different particle size distribution. By using
the torque information generated through the system, it is possible to calculate the specific
mechanical energy applied on the granules during each run. This data can be used to
compose a granulation regime map, creating the possibility to use this information as a
guidance for process understanding and optimization in a scale-independent manner.
To enable utilization of this technique on a large scale, there is a need for an in-line
quality monitoring and control considering the fact that taking samples out of a closed
production line is difficult. For particle size distribution analysis the EyeconTM has been
developed using 3D imaging techniques. The use of this device looks promising, although
tests revealed some problems concerning detection of large amounts of small particles.
The screening test and regime map experiments showed that wet binder addition,
2x6 screw configuration, 30° stagger angle (for this formulation), intermediate SME
(resulting from intermediate powder feed rate and -screw speed) and approximately 9%
liquid addition should be optimal condition to get a high yield of granules suited for
tabletting. The friability using this kind of configuration also appears to be satisfying. Further
experiments are desired in the near future such as testing other screw configurations, the
effect of the stagger angle and use of higher barrel temperatures. This should also be tested
for other formulation using different excipients, binders and active pharmaceutical
ingredients.
Samenvatting
Twin-screw granulatie is een relatief nieuwe techniek betreffende continue
granulatie in de farmaceutische industrie. Wegens meerdere voordelen tegenover batch-to-
batch granulatie is er hiervoor een groeiende interesse. De twin-screw granulator aanwezig
in de ConsiGmaTM-25 productielijn, laat het toe om makkelijke meerdere parameters aan te
passen wat hiervan een interessante techniek maakt om te bestuderen. Momenteel is de
beschikbare informatie betreffende deze techniek echter beperkt. Dit toestel laat toe om de
grootte en eigenschappen van de granules te manipuleren door het aanpassen van de
methode van binder toevoeging, schroef configuratie, hoek tussen de kneedelementen,
temperatuur van het granulatievat, vloeistofadditie, toevoersnelheid van poeder en
schroefsnelheid. Voor elke configuratie is er een ander krachtmoment nodig voor de rotatie
van de schroeven, dit levert verschillende deeltjesgroottedistributies op. Door gebruik te
maken van de informatie over het krachtmoment, die door het systeem bijgehouden werd,
tijdens elke test is het mogelijk om de specifiek mechanische energie te berekenen. Deze
data kan gebruikt worden om een granulatie "regime map" samen te stellen, dit creëert de
mogelijkheid om deze informatie te gebruiken als hulpmiddel om het proces beter te
begrijpen en te optimaliseren gebruik makende van een schaalonafhankelijke methode.
Om deze techniek op grote schaal toe te passen is er nood aan continue
kwaliteitscontrole aangezien staalname uit gesloten productielijnen moeilijk is. Voor de
analyse van de deeltjesgroottedistributie werd de EyeconTM ontwikkeld die gebruik maakt
van 3D beeldvorming. Het gebruik van dit toestel lijkt veelbelovend alhoewel de tests
problemen blootlegden bij de detectie van grote hoeveelheden kleine deeltjes.
De screening test en regime map experimenten toonden aan dat natte toevoeging
van binder, 2x6 schroef configuratie, 30° hoek tussen kneedelementen (voor deze
formulatie), gemiddelde SME (afkomstig van gemiddelde toevoersnelheid van poeder en
schroefsnelheid) en ongeveer 9% toevoeging van vloeistof optimale condities zouden zijn om
hoge hoeveelheden bruikbare granulaten te produceren. De friabiliteit lijkt ook te voldoen
bij deze condities. Extra experimenten zijn gewenst om het effect te bestuderen van andere
schroefconfiguraties, de hoek tussen de kneedelementen en het gebruik van hogere
temperaturen tijdens granulatie. Dit zou ook getest moeten worden voor andere formulaties
gebruik makend van andere excipiënten, binders en actieve bestanddelen.

Acknowledgements
I would like to thank Professor De Beer for the opportunity to work at his laboratory and
valuable tips during the design of the experiments. Special thanks to my supervisor Ashish
Kumar for the pleasant cooperation during my thesis period and expanding my
interdisciplinary knowledge! Thanks to Fien, Jurgen and Valerie from the laboratory of
pharmaceutical process analytical technology and the laboratory of pharmaceutical
technology for the help during experimental set-ups. Thanks to the staff of BIOMATH for the
warm welcome during my modelling work at their department. Thanks to family and friends
for support, and occasional distractions during this period.
TABLE OF CONTENTS
1. INTRODUCTION .................................................................................................................. 1
1.1. DEFINITION OF GRANULATION .................................................................................... 1
1.2. APPLICATIONS .............................................................................................................. 2
1.3. CURRENT GRANULATION TECHNIQUES ...................................................................... 3
1.4. GRANULE GROWTH DURING WET GRANULATION PROCESS ...................................... 4
1.4.1. Wetting and Nucleation ....................................................................................... 5
1.4.2. Growth and Consolidation ................................................................................... 6
1.4.3. Attrition and Breakage ......................................................................................... 6
1.5. CONTINUOUS GRANULATION ..................................................................................... 6
1.6. TWIN-SCREW GRANULATION ...................................................................................... 7
1.6.1. ConsiGmaTM-25 system ........................................................................................ 8
1.6.2. Screw configuration ............................................................................................. 9
1.6.3. Granule growth during twin screw granulation ................................................... 9
1.6.4. Influence of equipment parameters on granule quality .................................... 10
1.6.5. Quality by Design ................................................................................................ 11
1.7. REGIME MAP THEORY ............................................................................................... 11
2. OBJECTIVES ....................................................................................................................... 13
3. MATERIALS AND METHODS ............................................................................................. 14
3.1. PREPARATION OF GRANULES .................................................................................... 14
3.1.1. Granulation process ........................................................................................... 14
3.1.2. Experimental design ........................................................................................... 15
3.2. GRANULE EVALUTION ................................................................................................ 16
3.2.1. Real-time PSD analysis ....................................................................................... 16
3.2.2. Determination of torque and specific mechanical energy ................................. 17
3.2.3. Sieve analysis ...................................................................................................... 18
3.2.4. Friability .............................................................................................................. 18
3.2.5. Flowability .......................................................................................................... 19
3.3. EVALUATION OF RESPONSES ..................................................................................... 20
4. RESULTS AND DISCUSSION ............................................................................................... 21
4.1. USE OF EYECONTM DATA ............................................................................................ 21
4.2. INFLUENCE OF PROCESS VARIABLES ON PSD ............................................................ 23
4.2.1. Fines (<150µm) ................................................................................................... 24
4.2.2. Oversized fraction (>1400µm) ........................................................................... 26
4.2.3. Yield fraction (150-1400µm) .............................................................................. 29
4.2.4. Overview............................................................................................................. 30
4.3. GRANULE PROPERTIES ............................................................................................... 33
4.3.1. Friability .............................................................................................................. 33
4.4. GRANULATION REGIME MAP .................................................................................... 35
5. CONCLUSIONS .................................................................................................................. 39
6. REFERENCES ..................................................................................................................... 40
LIST OF ABBREVIATIONS
API Active Pharmaceutical Ingredient
DOE Design of Experiments
ICH International Conference on Harmonization
LED Light-Emitting Diode
L/S-ratio Liquid-to-Solid ratio
NIR Near Infrared
PAT Process Analytical Technology
PLS Partial Least Squares
PSD Particle Size Distribution
PVP Polyvinylpyrrolidone
QbD Quality by Design
RGB Red Green Blue
rpm Rotations per minute
1
1. INTRODUCTION
1.1. DEFINITION OF GRANULATION
Granules can be described as grains of agglomerated powder particles. Granule
preparations consist of dry powder particles that are combined into larger units in which the
primary particles are still distinguishable. The granules consist of the active substance and
the excipients. When applying wet granulation, granulation liquid is used to bond the
individual particles. The use of dry granulation is also possible, in this case the granules are
formed through heat treatment, pressurisation or the cohesive characteristics of the
materials itself. After the granulation process, the obtained granules should provide
sufficient resistance to possible segregation of ingredients in further processing. Granules
can be used as such or as an intermediate to make tablets or capsules. [1,2]
This report will mainly discuss twin-screw granulation which is a wet granulation
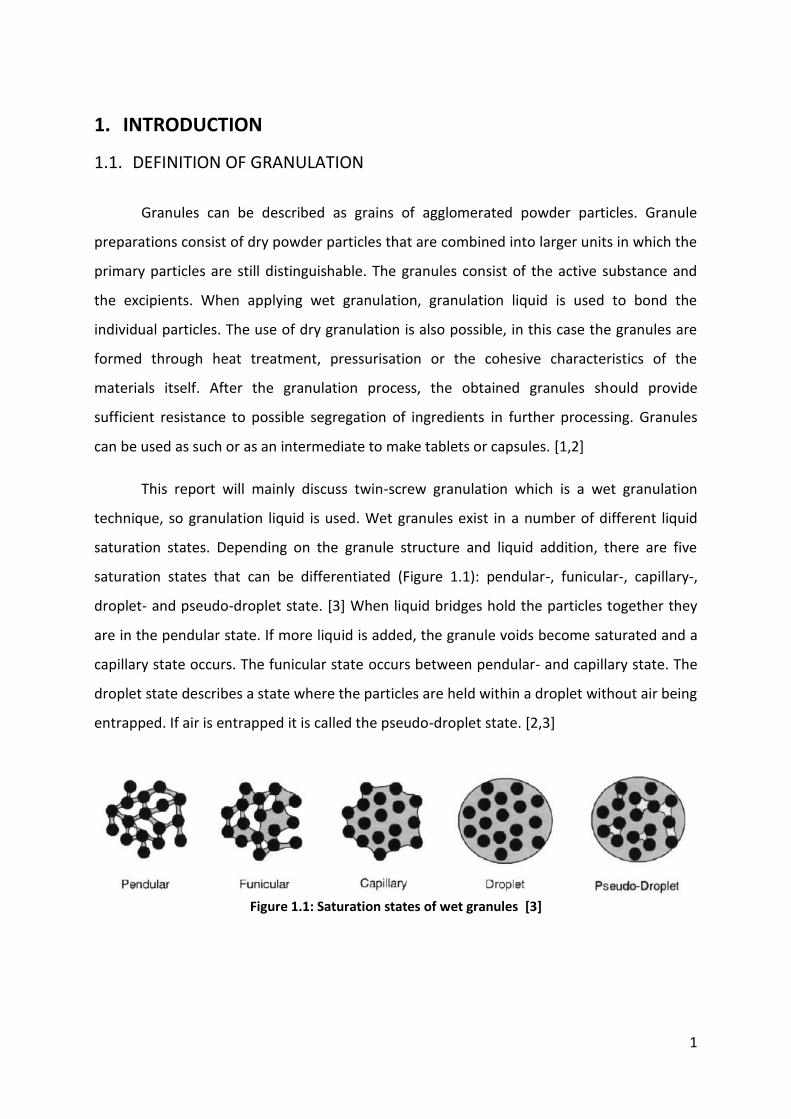
technique, so granulation liquid is used. Wet granules exist in a number of different liquid
saturation states. Depending on the granule structure and liquid addition, there are five
saturation states that can be differentiated (Figure 1.1): pendular-, funicular-, capillary-,
droplet- and pseudo-droplet state. [3] When liquid bridges hold the particles together they
are in the pendular state. If more liquid is added, the granule voids become saturated and a
capillary state occurs. The funicular state occurs between pendular- and capillary state. The
droplet state describes a state where the particles are held within a droplet without air being
entrapped. If air is entrapped it is called the pseudo-droplet state. [2,3]
Figure 1.1: Saturation states of wet granules [3]
2
1.2. APPLICATIONS
As mentioned above, granules are often used as an intermediate product before
tabletting. Wet granulation techniques are applied in various industries like the
pharmaceutical industry, food manufacturing, agricultural product manufacturing and
plastic industry. [4] Some of the advantages that granulation provides are listed below:
Improved flow properties:
When using granulation as an intermediate step in tabletting, a homogenous
distribution of the particles is very important. In that way it improves the mass
distribution of the tablets. [5]
Less segregation:
In continuous processes, a flow of powder occurs through the production transfer
lines. A segregation pattern is often observed when using a free-flowing powder mixture
somewhere in the production line. Agglomeration prevents segregation of a mixture by
creating approximately equally sized particles.[6]
Increased porosity of particles:
This results into a better dissolution rate.
Reduced dustiness
Dust causes problems in mass distribution and wastage of material. There is also a
risk for the operators at the production line. The product can be inhaled and there is
even a dust explosion risk. Granulation "captures" the dust into larger particles. [2]
Thus, granulation is a key step in solid-dosage manufacturing process in the
pharmaceutical industry. In a way it can be viewed as a product design. By using a
combination of particle design and process design, the properties of the granules can be
modified. [3] This makes it possible to control different characteristics (as mentioned above),
and hence require a more accurate manufacturing.[2]
The granulation process also shows some disadvantages. The production process is
rather complex. Even with the knowledge of all the variables during this process, it is still
impossible to predict the behaviour of the granule in an accurate way. Developing a granule
formulation and production process mainly starts with the trial and error approach. For
3
example, some formulations request a high amount of excipients, which can influence the
granulation process. Binder viscosity, powder wetting and liquid distribution are some of the
parameters that have an important influence on the process. When scaling up to an
industrial scale, this leads to a significant failure rate. [6] During granulation, optimal
conditions are required. For instance, when the moisture content of the granules is too
high, they may end up sticking to the punch tip faces in the tabletting machine. If the
granules are too dry, there may occur problems after tabletting. [7] Also, agglomerates are
relatively big particles that can cause problems when processing formulations of low-dosed
drugs. In such cases, the accuracy of the dosing of the granules is extremely important and
sometimes it can be better to use a powder mixture instead of granules. [5] When the
granulation process is not conducted properly there can be problems in down-stream
processes, such as caking, segregation and poor tabletting performance. [3]
1.3. CURRENT GRANULATION TECHNIQUES
There are three main classes of granulation: wet-, dry- and melt granulation. The
most suitable technique for granulation depends on the physicochemical properties of the
active pharmaceutical ingredient (API) in the formulation. Properties such as hygroscopicity,
melting point, glass transition temperature, etc. will determine which granulation technique
needs to be applied.
During wet granulation, liquid is added to the powder mixture, to form agglomerates.
After drying, granule formation is achieved. The most common equipment used for wet
granulation are fluidized bed mixers and high shear mixers. Not all API are resistant to high
moisture levels and due to the high work rate of these machines the temperature can rise,
which may affect certain heat sensitive drug substances. Therefore, alternative methods are
also necessary.
The most popular technique for dry granulation is roller compaction. Granulation
occurs by inducing a high pressure to the powder mixture which will deform, fragment,
densify and bond the material. However, some problems may occur using this technique.
Because of the lack of binder liquid, the particles will be dry, thus leading to a higher amount
4
of fines and dust. Also, the compressibility of the material will decrease due to the
compaction process. Therefore, it is better to avoid roller compaction when the desired
formulation contains high proportions of the drug substance. [8]
Melt granulation methods are commonly used for hygroscopic API. During the
process, the temperature stays below the melting point of the API but above the glass
transition temperature of the binder. The powder mixture with low-melting binders typically
melts or softens at relatively low temperatures (50-80°C). [9] Due to the melting of the
materials in the powder mixture, the agglomerates are formed when temperature decreases
again. Otherwise, water of crystallization is exempted out of the powder bed and serves as a
kind of binder liquid. For melt granulation fluidized bed granulators, high shear mixers and
twin-screw extruders can be used. Extrusion is the most promising melt granulation
technique because the rate of energy input can be easily adjusted. Hot melt extrusion has
proven to be useful to improve the bioavailability of poorly soluble drugs by formation of
amorphous states. [8]
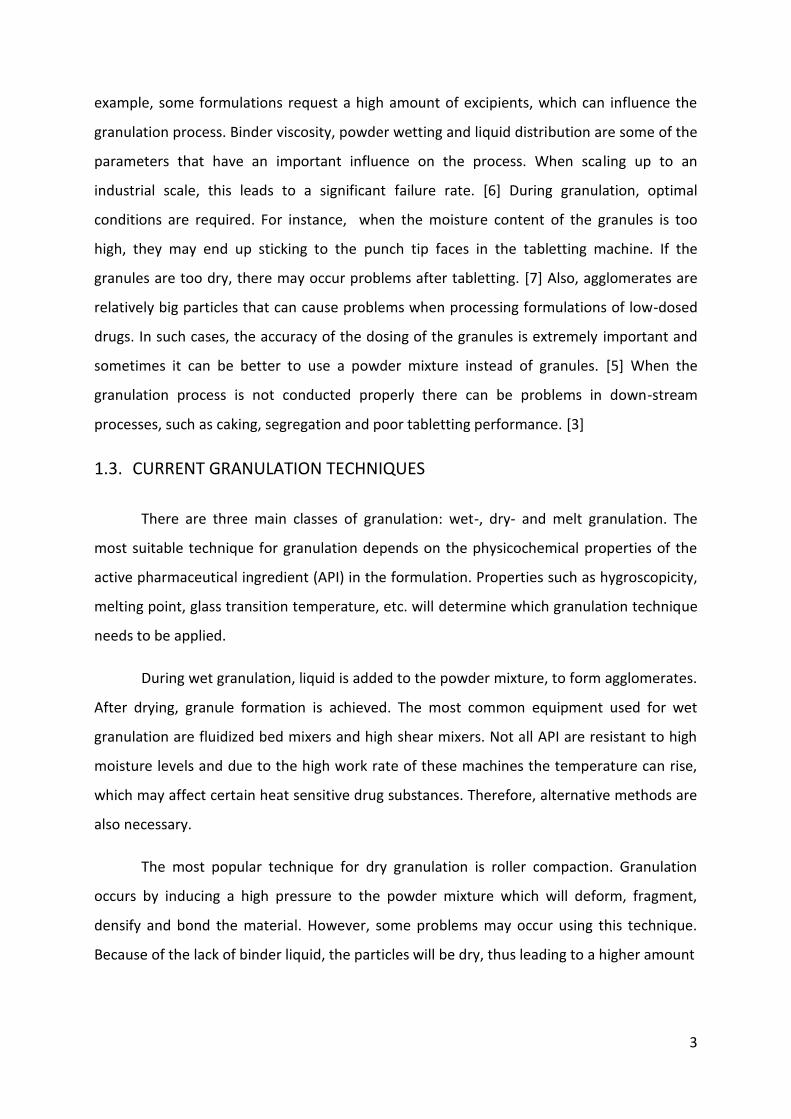
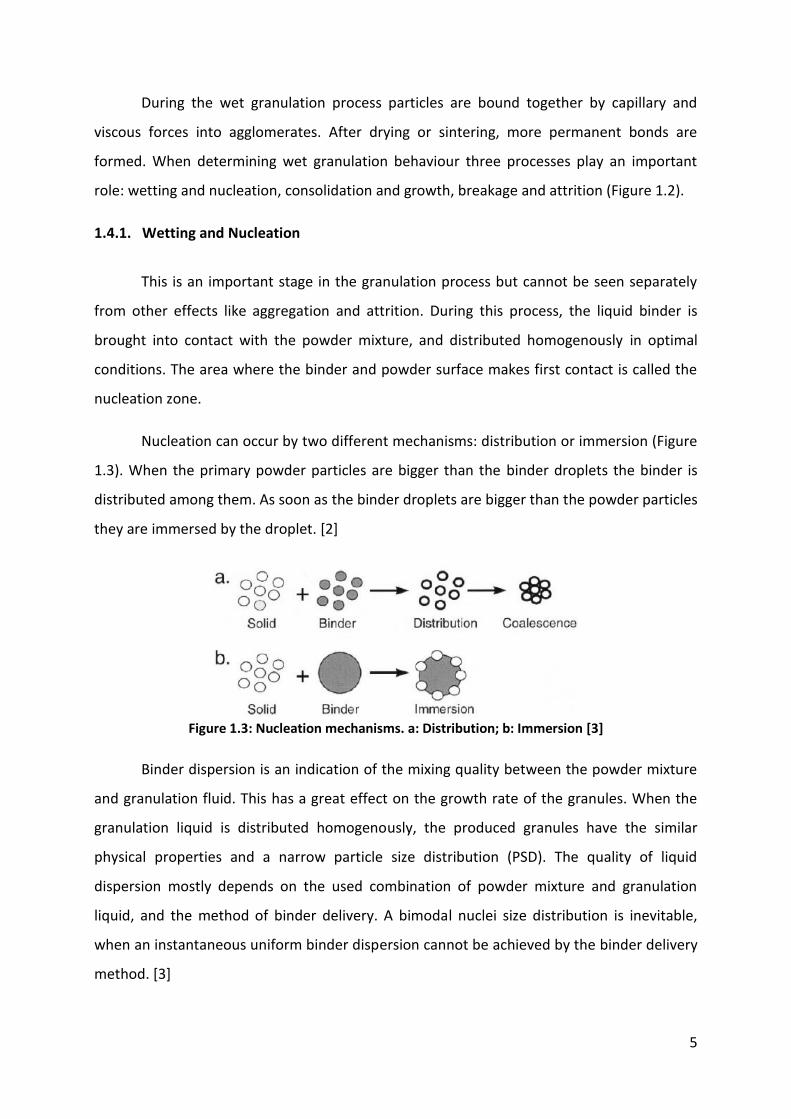
1.4. GRANULE GROWTH DURING WET GRANULATION PROCESS
Figure 1.2: Modern approach on wet granulation process [3]
5
During the wet granulation process particles are bound together by capillary and
viscous forces into agglomerates. After drying or sintering, more permanent bonds are
formed. When determining wet granulation behaviour three processes play an important
role: wetting and nucleation, consolidation and growth, breakage and attrition (Figure 1.2).
1.4.1. Wetting and Nucleation
This is an important stage in the granulation process but cannot be seen separately
from other effects like aggregation and attrition. During this process, the liquid binder is
brought into contact with the powder mixture, and distributed homogenously in optimal
conditions. The area where the binder and powder surface makes first contact is called the
nucleation zone.
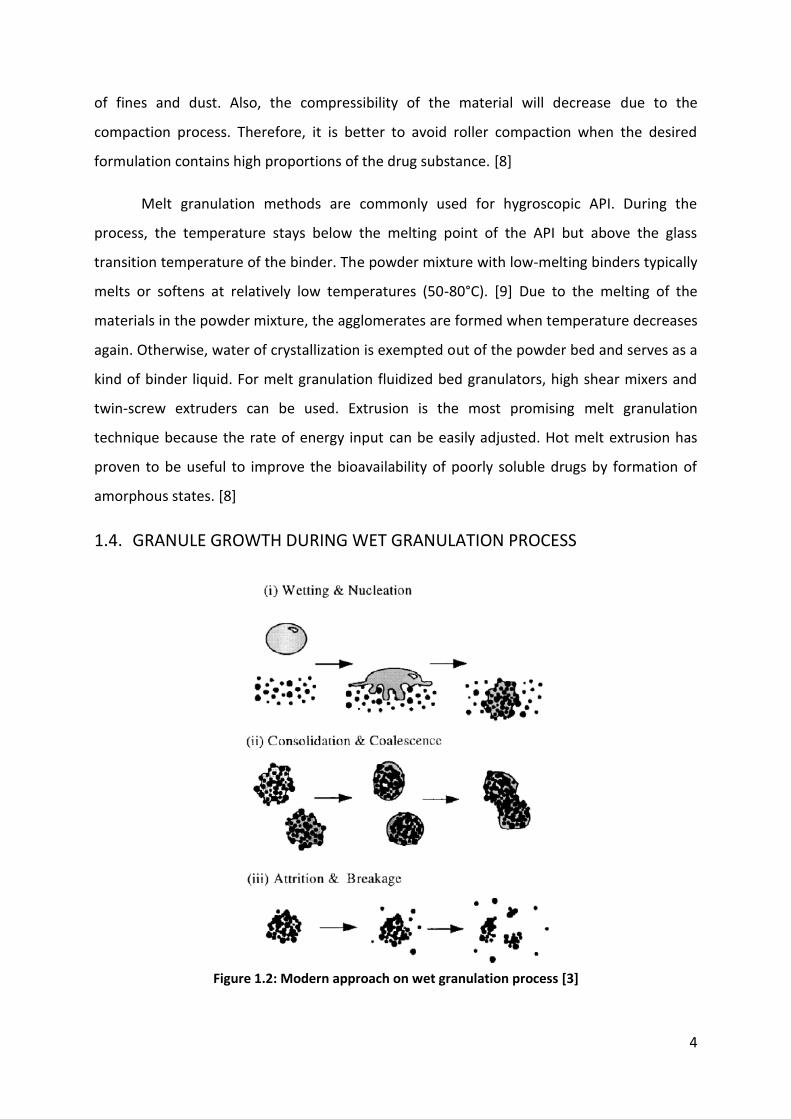
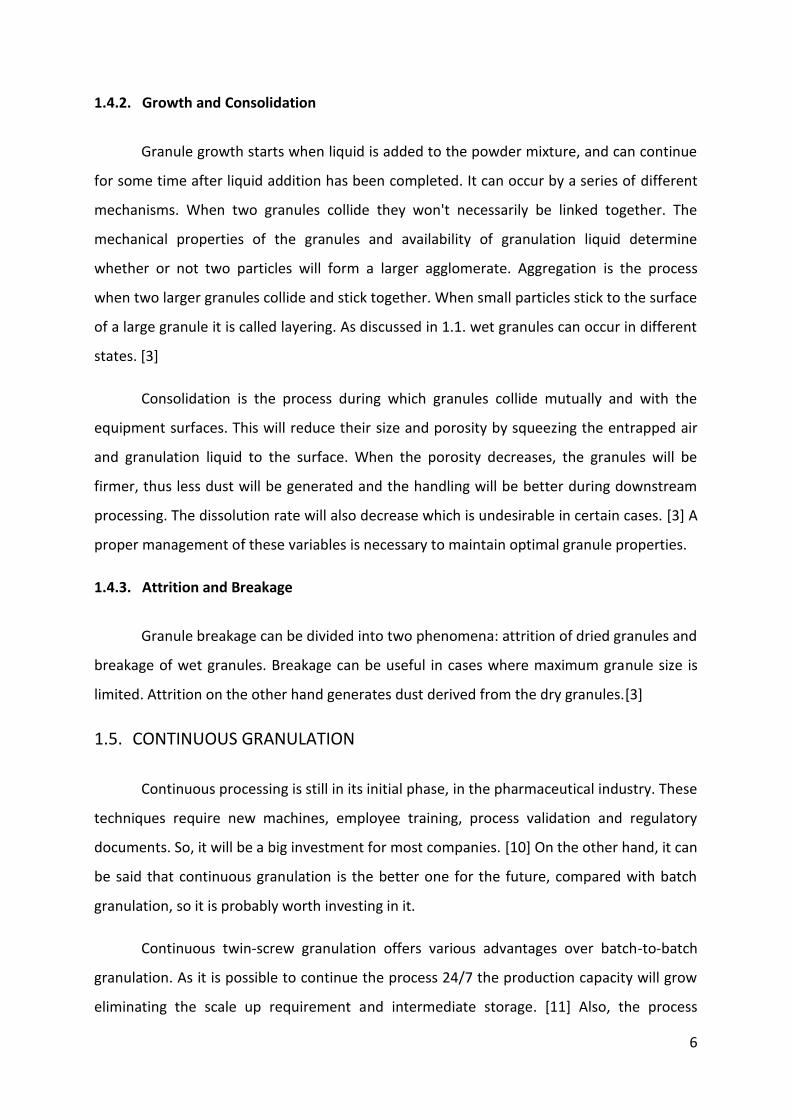
Nucleation can occur by two different mechanisms: distribution or immersion (Figure
1.3). When the primary powder particles are bigger than the binder droplets the binder is
distributed among them. As soon as the binder droplets are bigger than the powder particles
they are immersed by the droplet. [2]
Figure 1.3: Nucleation mechanisms. a: Distribution; b: Immersion [3]
Binder dispersion is an indication of the mixing quality between the powder mixture
and granulation fluid. This has a great effect on the growth rate of the granules. When the
granulation liquid is distributed homogenously, the produced granules have the similar
physical properties and a narrow particle size distribution (PSD). The quality of liquid
dispersion mostly depends on the used combination of powder mixture and granulation
liquid, and the method of binder delivery. A bimodal nuclei size distribution is inevitable,
when an instantaneous uniform binder dispersion cannot be achieved by the binder delivery
method. [3]
6
1.4.2. Growth and Consolidation
Granule growth starts when liquid is added to the powder mixture, and can continue
for some time after liquid addition has been completed. It can occur by a series of different
mechanisms. When two granules collide they won't necessarily be linked together. The
mechanical properties of the granules and availability of granulation liquid determine
whether or not two particles will form a larger agglomerate. Aggregation is the process
when two larger granules collide and stick together. When small particles stick to the surface
of a large granule it is called layering. As discussed in 1.1. wet granules can occur in different
states. [3]
Consolidation is the process during which granules collide mutually and with the
equipment surfaces. This will reduce their size and porosity by squeezing the entrapped air
and granulation liquid to the surface. When the porosity decreases, the granules will be
firmer, thus less dust will be generated and the handling will be better during downstream
processing. The dissolution rate will also decrease which is undesirable in certain cases. [3] A
proper management of these variables is necessary to maintain optimal granule properties.
1.4.3. Attrition and Breakage
Granule breakage can be divided into two phenomena: attrition of dried granules and
breakage of wet granules. Breakage can be useful in cases where maximum granule size is
limited. Attrition on the other hand generates dust derived from the dry granules.[3]
1.5. CONTINUOUS GRANULATION
Continuous processing is still in its initial phase, in the pharmaceutical industry. These
techniques require new machines, employee training, process validation and regulatory
documents. So, it will be a big investment for most companies. [10] On the other hand, it can
be said that continuous granulation is the better one for the future, compared with batch
granulation, so it is probably worth investing in it.
Continuous twin-screw granulation offers various advantages over batch-to-batch
granulation. As it is possible to continue the process 24/7 the production capacity will grow
eliminating the scale up requirement and intermediate storage. [11] Also, the process
7
operates at steady-state which results in more uniform granule properties. [12] Specific to
twin-screw granulators, they can be put in a continuous line with dryer, product control
hopper and tabletting machine. This allows an on-line product quality measurement and
real-time product release. The two screws in the granulator are self-cleaning minimising
accumulation of material and possible degradation. [4] And finally from an economic point
of view, a continuous process offers a reduction in costs and time. [13] Overall, a shorter
time-to-market period can be achieved and the stock can be minimized. [14]
By implementing continuous granulation into the pharmaceutical industry, the
"Quality by Design" (QbD) approach will play an important role. These guidelines are meant
to enable a manufacturing process to continuously deliver a high quality product. QbD is
defined by the International Conference on Harmonization (ICH) in the Q8 guidelines. By
following these, it will become possible to reduce the costs of production, improve process
efficiency and still guarantee a high quality standard. The goal is to make possible real-time
release of pharmaceutical products. [10,15] Process Analytical Technology (PAT) strategies
should already be implemented during process development rather than only on the
manufacturing sites. Such data analysis approaches would enhance the product knowledge
and process understanding. [16]
1.6. TWIN-SCREW GRANULATION
In this report a high-shear twin-screw granulator, which is part of the ConsiGmaTM-25
continuous solid dosage tablet manufacturing line by GEA Pharma Systems, was used. Using
this equipment it is possible to change several input factors, which can affect the granule
properties and further downstream processing. This technique has not been studied very
extensively yet, so the effect of the equipment parameters on the quality of the final
product was studied using the "Design of Experiments" (DOE) approach.
The TSG is interesting to use due to the possibility to change multiple variables such
as screw design, screw speed, powder feed rate, liquid addition, etc. to optimise the
performance. Besides, it is also possible to perform melt granulation with the same
equipment. [17]
8
1.6.1. ConsiGmaTM-25 system
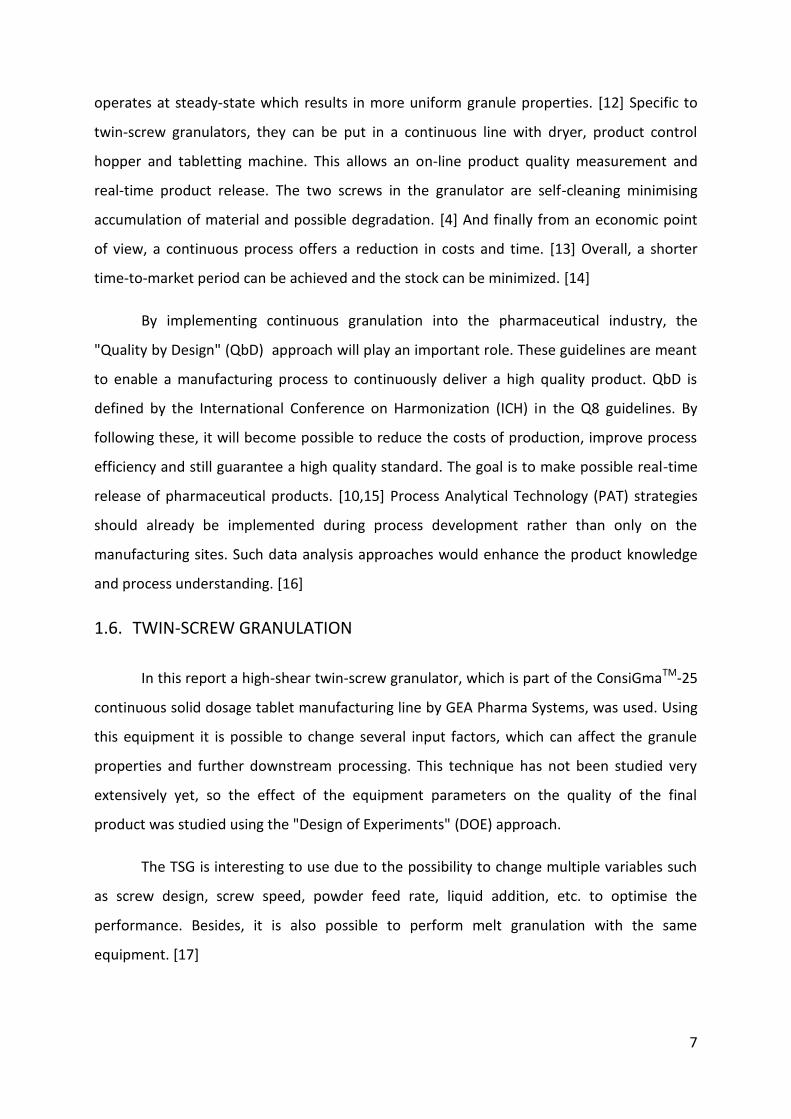
Figure 1.4: ConsiGmaTM-25 (1) Continuous feeder (2) Continuous twin-screw high-shear granulator
(3) Granulation liquid vessel (4) Six parallel cell fluid bed dryer (5) Product control hopper [10]
The ConsiGmaTM-25 unit (Figure 1.4) is a continuous manufacturing line which
consists of three major parts: a continuous twin-screw high-shear granulator (2), a six
parallel cell fluid-bed dryer (4) and a discharge system (5). [10] The discharge system is
equipped with a mill which is used to remove the oversized granule fraction. [11] It is also
possible to connect this system to an in-line tabletting machine, which makes a continuous
'from powder to tablet' manufacturing system. [18] The granules and tablets made by this
system show highly repeatable results. [12]
However, twin-screw granulation requires a stabilization period before reaching a
steady-state condition. This state is defined by measuring the torque, temperature and
granule quality. [19] Due to this stabilisation period it is not possible to change the
equipment variables to other values and have the desired granulation yield immediately.
However, the granules produced during this stabilization period were observed to be in
compliance with the specifications. [12]
9
1.6.2. Screw configuration
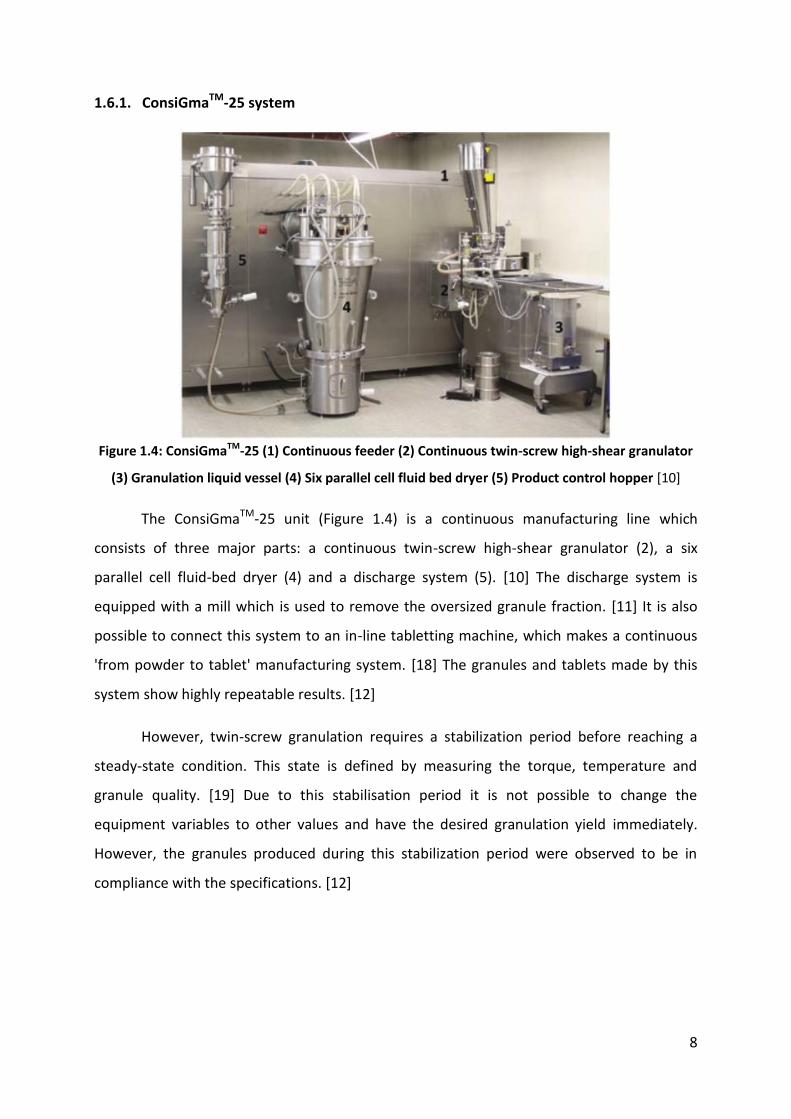
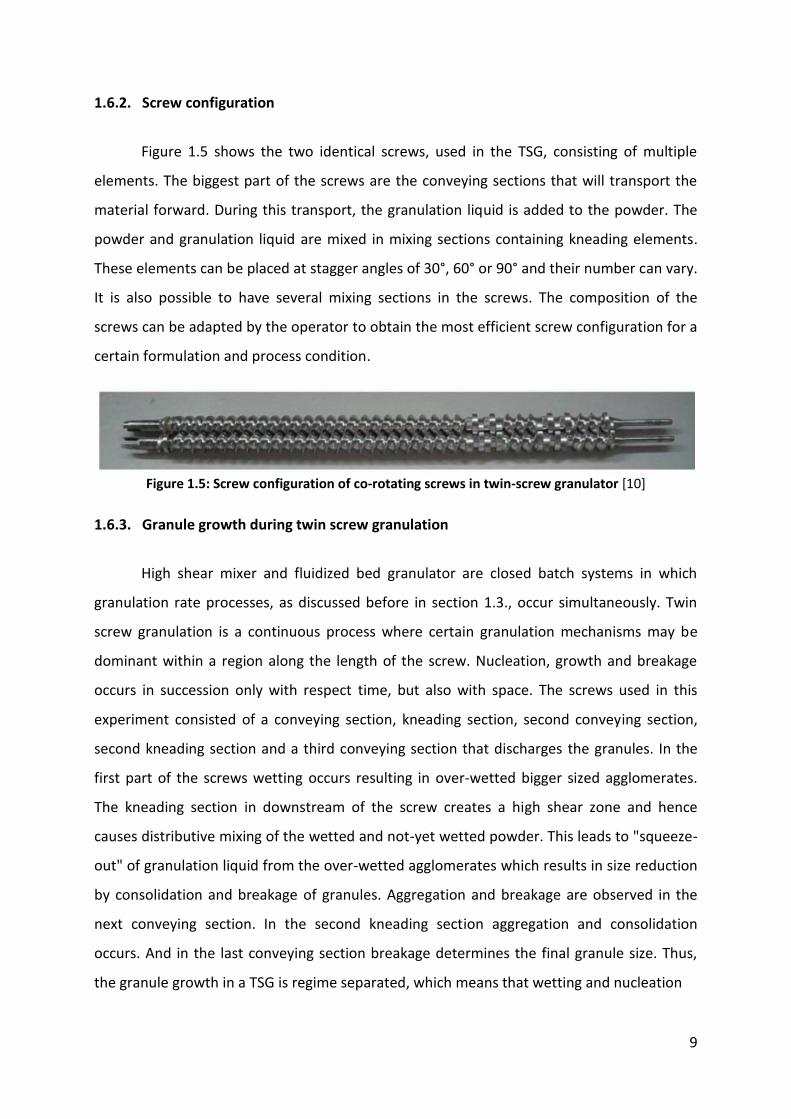
Figure 1.5 shows the two identical screws, used in the TSG, consisting of multiple
elements. The biggest part of the screws are the conveying sections that will transport the
material forward. During this transport, the granulation liquid is added to the powder. The
powder and granulation liquid are mixed in mixing sections containing kneading elements.
These elements can be placed at stagger angles of 30°, 60° or 90° and their number can vary.
It is also possible to have several mixing sections in the screws. The composition of the
screws can be adapted by the operator to obtain the most efficient screw configuration for a
certain formulation and process condition.
Figure 1.5: Screw configuration of co-rotating screws in twin-screw granulator [10]
1.6.3. Granule growth during twin screw granulation
High shear mixer and fluidized bed granulator are closed batch systems in which
granulation rate processes, as discussed before in section 1.3., occur simultaneously. Twin
screw granulation is a continuous process where certain granulation mechanisms may be
dominant within a region along the length of the screw. Nucleation, growth and breakage
occurs in succession only with respect time, but also with space. The screws used in this
experiment consisted of a conveying section, kneading section, second conveying section,
second kneading section and a third conveying section that discharges the granules. In the
first part of the screws wetting occurs resulting in over-wetted bigger sized agglomerates.
The kneading section in downstream of the screw creates a high shear zone and hence
causes distributive mixing of the wetted and not-yet wetted powder. This leads to "squeeze-
out" of granulation liquid from the over-wetted agglomerates which results in size reduction
by consolidation and breakage of granules. Aggregation and breakage are observed in the
next conveying section. In the second kneading section aggregation and consolidation
occurs. And in the last conveying section breakage determines the final granule size. Thus,
the granule growth in a TSG is regime separated, which means that wetting and nucleation
10
are physically separated from consolidation and growth allowing the operator to control
granule properties better. [20] Along the length of the screws the granules became stronger.
Their size was limited by the free space between the screws and granulation barrel.
1.6.4. Influence of equipment parameters on granule quality
Granules with good flow properties, large size, less fines and narrow PSD, can be
achieved with more granulation liquid addition, higher screw speed and a screw
configuration that provides sufficient mixing. [2,20] The liquid-to-solid ratio (L/S) showed to
have a significant influence on the granule properties. Changing the powder feed rate and
the L/S-ratio results to changes in size, shape, structure, porosity, strength and dissolution
time of the granules. This resulted in higher torque values during the process as did a higher
number of kneading elements. This also caused an increase in temperature of the
granulation barrel. A granule mixture with less fines and larger agglomerates was achieved
by increasing the barrel temperature in a controlled way. [17] When increasing the screw
speed and decreasing the moisture content a reduction in residence time was observed. [18]
Using different starting materials, both the granule and tablet characteristics are influenced.
[14] The solid state of wet granules is influenced by the temperature of the granulation
barrel and the amount of granulation liquid added. The powder feed rate also showed some
correlation with the solid state, but was found to be less significant. [10]
A bimodal size distribution is observed when using TSG. [14] This should be avoided
to reduce the risk of segregation in downstream processing. When granulating using TSG,
the granule mixture shows a broad PSD containing large amounts of fines (<250 µm) or large
amounts of oversized granules (>1400 µm). This bimodal size-distribution could possibly be
explained by the presence of binder-rich zones. Due to the short residence time in the
granulation barrel, the powder mixture and binder liquid do not have much time to interact,
which could lead to an inhomogeneous spread of binder. In earlier experiments no binder-
rich zones could be detected. This is an indication that binder liquid is distributed
homogenously amongst the granules. [21] The bimodal size distribution has shown to be
more dependent on the granulation technique itself rather than the liquid distribution. [18]
11
1.6.5. Quality by Design
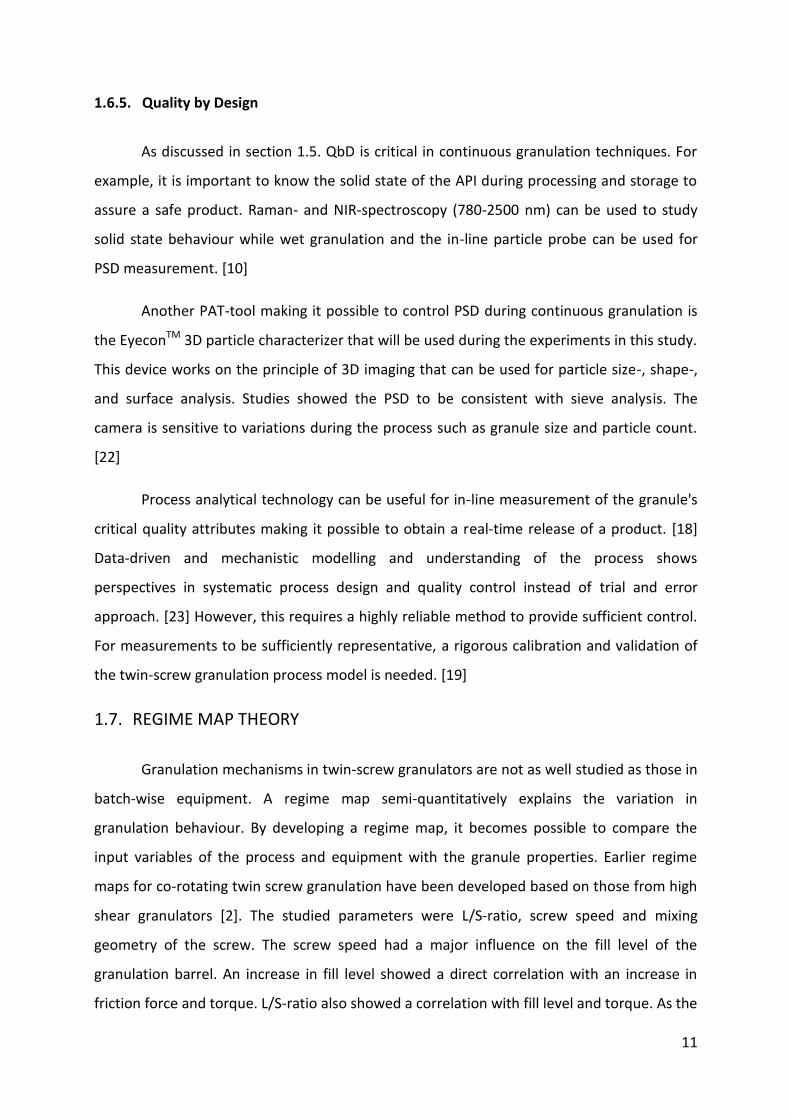
As discussed in section 1.5. QbD is critical in continuous granulation techniques. For
example, it is important to know the solid state of the API during processing and storage to
assure a safe product. Raman- and NIR-spectroscopy (780-2500 nm) can be used to study
solid state behaviour while wet granulation and the in-line particle probe can be used for
PSD measurement. [10]
Another PAT-tool making it possible to control PSD during continuous granulation is
the EyeconTM 3D particle characterizer that will be used during the experiments in this study.
This device works on the principle of 3D imaging that can be used for particle size-, shape-,
and surface analysis. Studies showed the PSD to be consistent with sieve analysis. The
camera is sensitive to variations during the process such as granule size and particle count.
[22]
Process analytical technology can be useful for in-line measurement of the granule's
critical quality attributes making it possible to obtain a real-time release of a product. [18]
Data-driven and mechanistic modelling and understanding of the process shows
perspectives in systematic process design and quality control instead of trial and error
approach. [23] However, this requires a highly reliable method to provide sufficient control.
For measurements to be sufficiently representative, a rigorous calibration and validation of
the twin-screw granulation process model is needed. [19]
1.7. REGIME MAP THEORY
Granulation mechanisms in twin-screw granulators are not as well studied as those in
batch-wise equipment. A regime map semi-quantitatively explains the variation in
granulation behaviour. By developing a regime map, it becomes possible to compare the
input variables of the process and equipment with the granule properties. Earlier regime
maps for co-rotating twin screw granulation have been developed based on those from high
shear granulators [2]. The studied parameters were L/S-ratio, screw speed and mixing
geometry of the screw. The screw speed had a major influence on the fill level of the
granulation barrel. An increase in fill level showed a direct correlation with an increase in
friction force and torque. L/S-ratio also showed a correlation with fill level and torque. As the
12
L/S-ratio increased, so did the fill level and torque. After reaching a critical value the mixture
became over-wetted and the torque decreased again. Depending on the screw configuration
three regimes were suggested: granulation regime, extrudate regime and blocked regime.
Granules with a large size and narrow PSD were obtained with more binder addition, a
higher screw speed and screw configuration that provided sufficient mixing. [2,24]
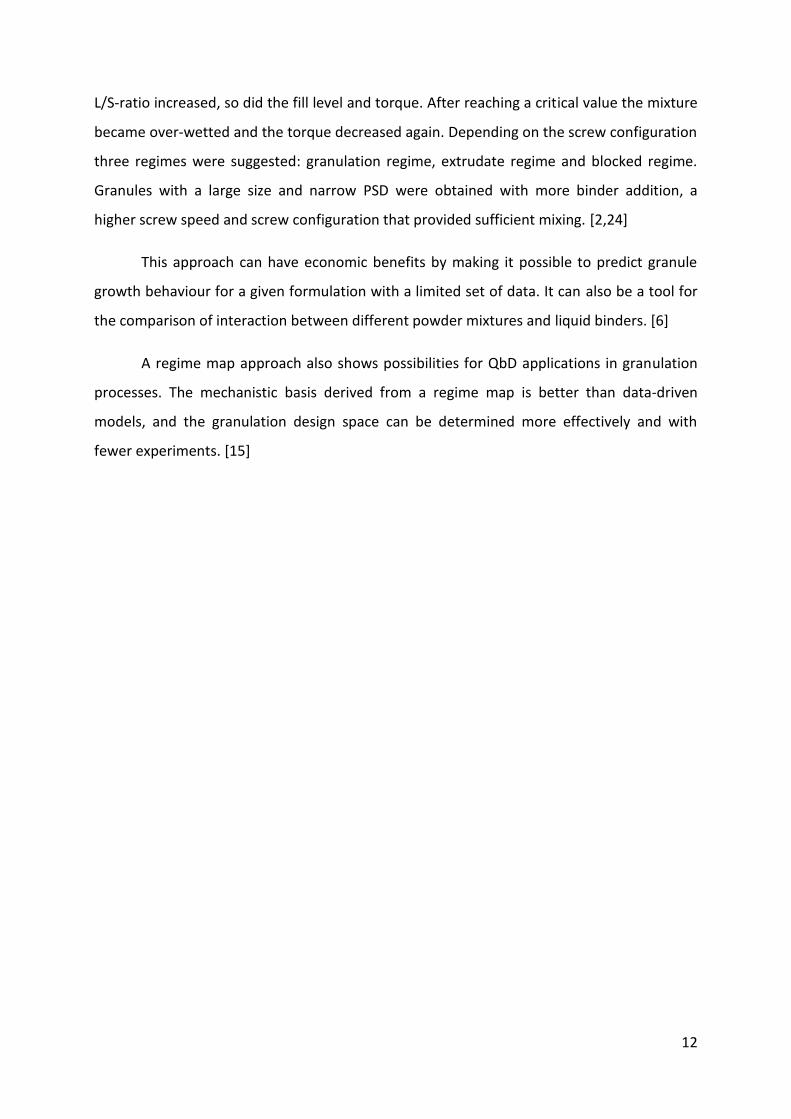
This approach can have economic benefits by making it possible to predict granule
growth behaviour for a given formulation with a limited set of data. It can also be a tool for
the comparison of interaction between different powder mixtures and liquid binders. [6]
A regime map approach also shows possibilities for QbD applications in granulation
processes. The mechanistic basis derived from a regime map is better than data-driven
models, and the granulation design space can be determined more effectively and with
fewer experiments. [15]
13
2. OBJECTIVES
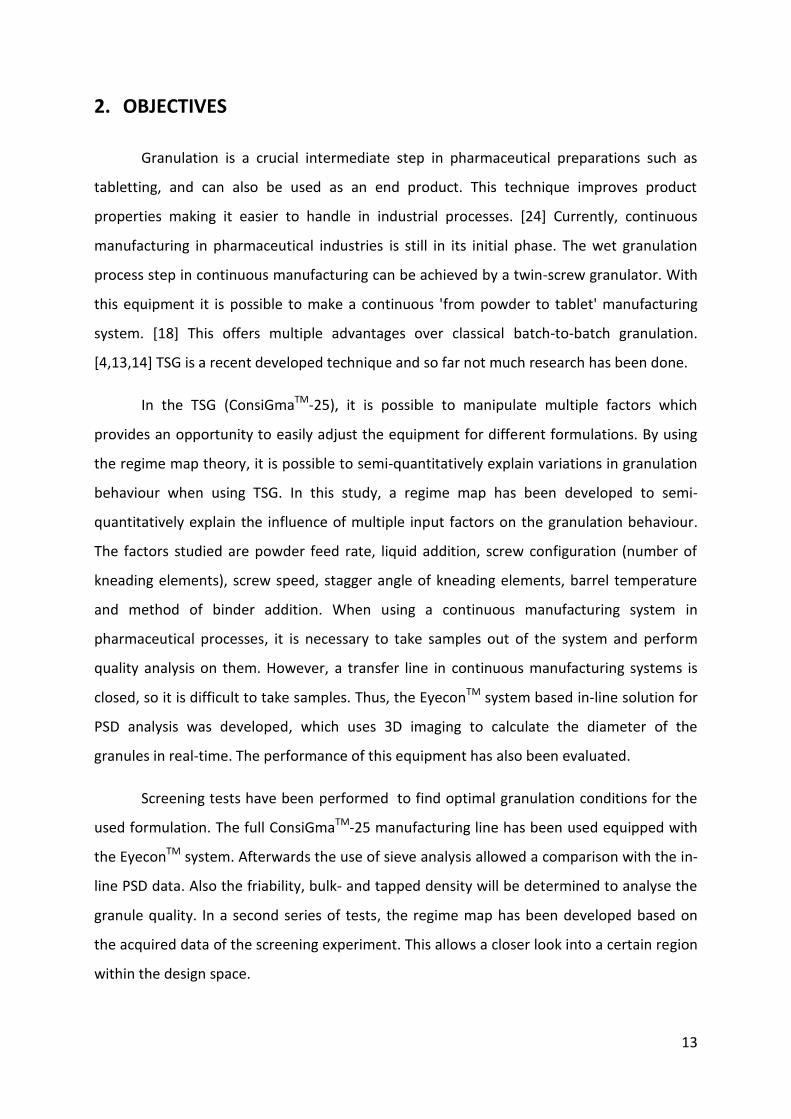
Granulation is a crucial intermediate step in pharmaceutical preparations such as
tabletting, and can also be used as an end product. This technique improves product
properties making it easier to handle in industrial processes. [24] Currently, continuous
manufacturing in pharmaceutical industries is still in its initial phase. The wet granulation
process step in continuous manufacturing can be achieved by a twin-screw granulator. With
this equipment it is possible to make a continuous 'from powder to tablet' manufacturing
system. [18] This offers multiple advantages over classical batch-to-batch granulation.
[4,13,14] TSG is a recent developed technique and so far not much research has been done.
In the TSG (ConsiGmaTM-25), it is possible to manipulate multiple factors which
provides an opportunity to easily adjust the equipment for different formulations. By using
the regime map theory, it is possible to semi-quantitatively explain variations in granulation
behaviour when using TSG. In this study, a regime map has been developed to semi-
quantitatively explain the influence of multiple input factors on the granulation behaviour.
The factors studied are powder feed rate, liquid addition, screw configuration (number of
kneading elements), screw speed, stagger angle of kneading elements, barrel temperature
and method of binder addition. When using a continuous manufacturing system in
pharmaceutical processes, it is necessary to take samples out of the system and perform
quality analysis on them. However, a transfer line in continuous manufacturing systems is
closed, so it is difficult to take samples. Thus, the EyeconTM system based in-line solution for
PSD analysis was developed, which uses 3D imaging to calculate the diameter of the
granules in real-time. The performance of this equipment has also been evaluated.
Screening tests have been performed to find optimal granulation conditions for the
used formulation. The full ConsiGmaTM-25 manufacturing line has been used equipped with
the EyeconTM system. Afterwards the use of sieve analysis allowed a comparison with the in-
line PSD data. Also the friability, bulk- and tapped density will be determined to analyse the
granule quality. In a second series of tests, the regime map has been developed based on
the acquired data of the screening experiment. This allows a closer look into a certain region
within the design space.
14
3. MATERIALS AND METHODS
3.1. PREPARATION OF GRANULES
3.1.1. Granulation process
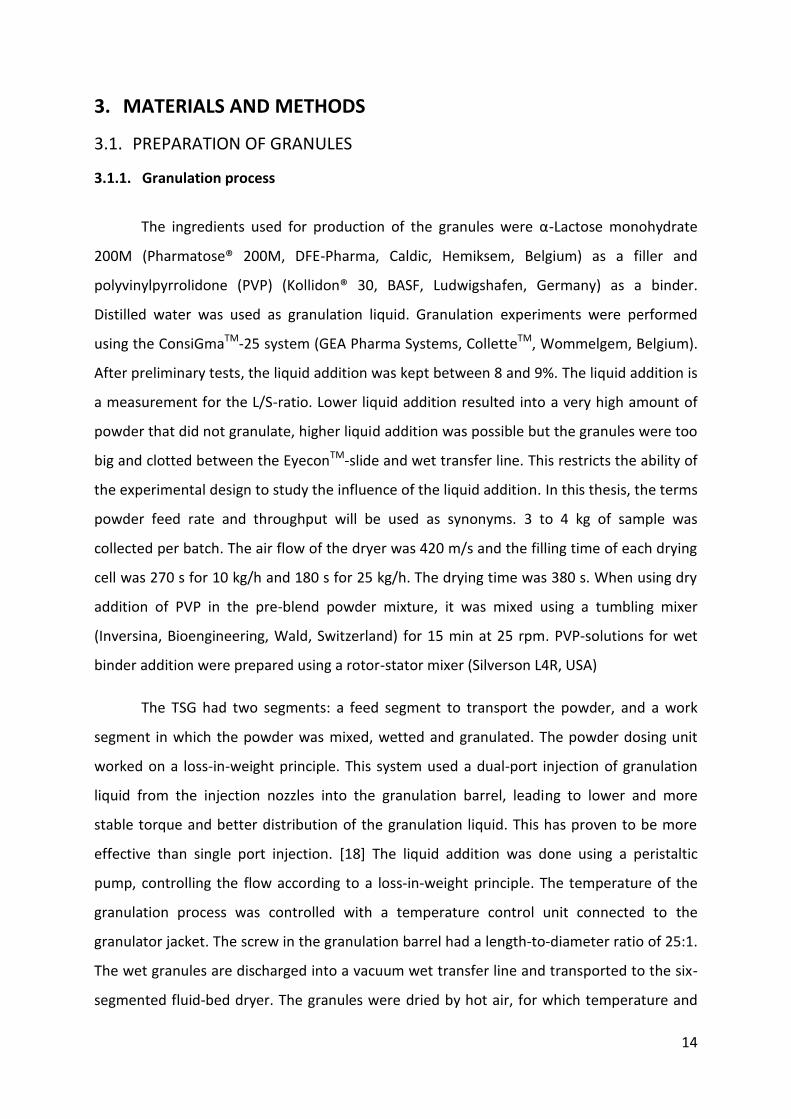
The ingredients used for production of the granules were α-Lactose monohydrate
200M (Pharmatose® 200M, DFE-Pharma, Caldic, Hemiksem, Belgium) as a filler and
polyvinylpyrrolidone (PVP) (Kollidon® 30, BASF, Ludwigshafen, Germany) as a binder.
Distilled water was used as granulation liquid. Granulation experiments were performed
using the ConsiGmaTM-25 system (GEA Pharma Systems, ColletteTM, Wommelgem, Belgium).
After preliminary tests, the liquid addition was kept between 8 and 9%. The liquid addition is
a measurement for the L/S-ratio. Lower liquid addition resulted into a very high amount of
powder that did not granulate, higher liquid addition was possible but the granules were too
big and clotted between the EyeconTM-slide and wet transfer line. This restricts the ability of
the experimental design to study the influence of the liquid addition. In this thesis, the terms
powder feed rate and throughput will be used as synonyms. 3 to 4 kg of sample was
collected per batch. The air flow of the dryer was 420 m/s and the filling time of each drying
cell was 270 s for 10 kg/h and 180 s for 25 kg/h. The drying time was 380 s. When using dry
addition of PVP in the pre-blend powder mixture, it was mixed using a tumbling mixer
(Inversina, Bioengineering, Wald, Switzerland) for 15 min at 25 rpm. PVP-solutions for wet
binder addition were prepared using a rotor-stator mixer (Silverson L4R, USA)
The TSG had two segments: a feed segment to transport the powder, and a work
segment in which the powder was mixed, wetted and granulated. The powder dosing unit
worked on a loss-in-weight principle. This system used a dual-port injection of granulation
liquid from the injection nozzles into the granulation barrel, leading to lower and more
stable torque and better distribution of the granulation liquid. This has proven to be more
effective than single port injection. [18] The liquid addition was done using a peristaltic
pump, controlling the flow according to a loss-in-weight principle. The temperature of the
granulation process was controlled with a temperature control unit connected to the
granulator jacket. The screw in the granulation barrel had a length-to-diameter ratio of 25:1.
The wet granules are discharged into a vacuum wet transfer line and transported to the six-
segmented fluid-bed dryer. The granules were dried by hot air, for which temperature and
15
flow rates were controlled. The dryer is rather semi-continuous due to which the granules
were dried in six "mini-batches", and were sequentially discharged into the dry transfer line.
In the product transfer hopper, the granules were unloaded gravitationally. During
granulation, process parameters like torque and jacket temperature were recorded by the
equipment.
3.1.2. Experimental design
The experimental range for the screening design was determined by carrying out
preliminary tests, especially considering liquid addition. A D-optimal experimental design
was used to evaluate the influence of process variables on the granulation process. D-
optimality is a commonly used principle for screening and optimization of the process. The
design attempts to span an area as big as possible within the design space to maximise the
obtained information with a minimum of experiments. This is useful to save time and costs.
The experiments are typically conducted on the boundaries of the experimental range. [25]
The process variables studied were: powder feed rate (10 - 25 kg/h), liquid addition
(8; 8,5 and 9 %), screw configuration (1x2-, 1x6- and 2x6 kneading elements), screw speed
(500-; 900 rpm), stagger angle of the kneading elements (30 - 60°), barrel temperature (25 -
40 °C) and binder addition (Dry or Wet). When the 2x6 screw configuration was used, the
two kneading zones were separated by a conveying zone with the same length as the
kneading zones to limit the accumulation of the material. During all the experiments, liquid
addition occurred just in front of the first kneading zone.
DOE was made using the Modde software (Umetrics, Umeå, Sweden). A 46 run
experimental design (with 3 centre points) was used for these experiments, and selected
based on G-efficiency out of a series of designs proposed by the software. G-efficiency is a
value which is an indication for the performance of experiments and predictive value. The
exact experimental design can be found in Annex 1.
Based on the results of the screening design and a theoretical point of view a second
series of regime map experiments was set up. Here the binder addition was always wet and
several other variables were fixed at a constant value. The temperature was kept at 25°C and
a 60° stagger angle was used. The 1x6 and 2x6 screw configuration were tested, liquid
16
addition was varied over 8-, 9- and 10%, powder feed rate over 10-; 17,5- and 25 kg/h and
the screw speed over 500-, 700- and 900 rpm. The range for liquid addition could be
expanded to 10% given the fact that the dryer unit was not used. After collecting the
granules, they were dried for 24h in an oven at 40°C.
3.2. GRANULE EVALUTION
3.2.1. Real-time PSD analysis
During the granulation process, an in-line analysis of the EyeconTM 3D Particle
Characterizer (Innopharma Labs, Dublin, Ireland) was used for analysing the PSD of the
granules. This device was installed in-line between the granulation barrel and wet transfer
line and captured images every 2 s. The granules were photographed by the EyeconTM using
an in-house developed slide making the granules visible.
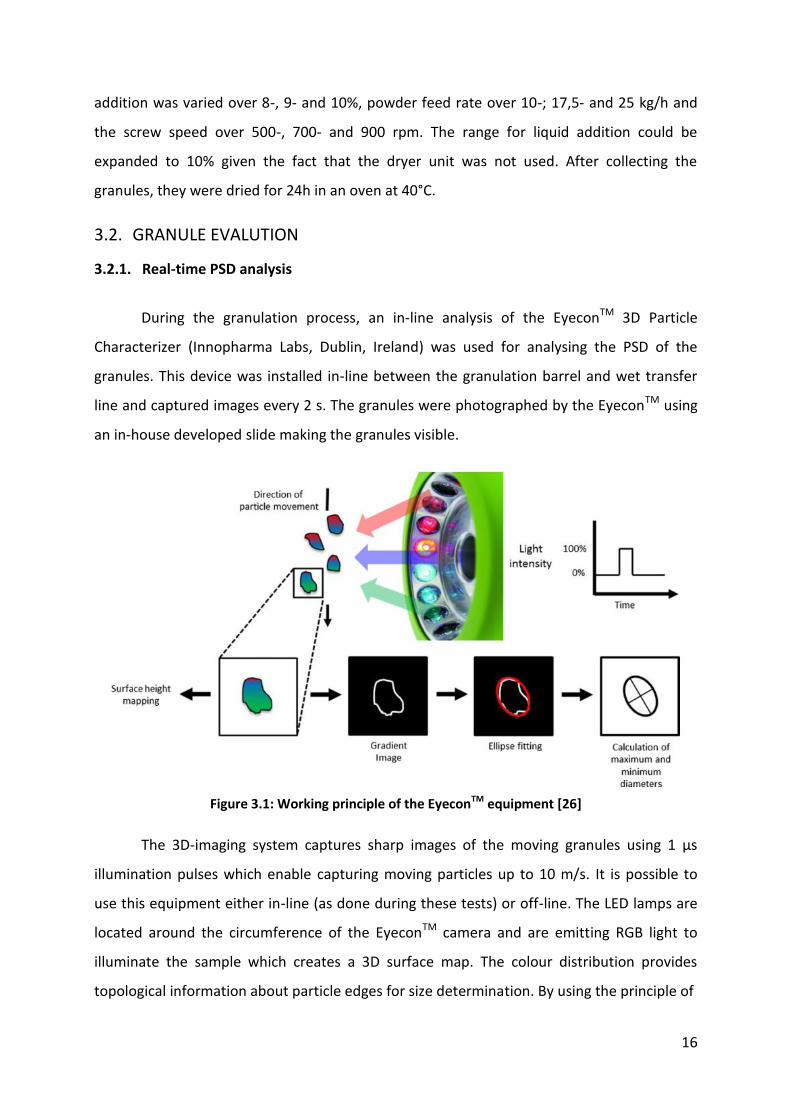
Figure 3.1: Working principle of the EyeconTM equipment [26]
The 3D-imaging system captures sharp images of the moving granules using 1 µs
illumination pulses which enable capturing moving particles up to 10 m/s. It is possible to
use this equipment either in-line (as done during these tests) or off-line. The LED lamps are
located around the circumference of the EyeconTM camera and are emitting RGB light to
illuminate the sample which creates a 3D surface map. The colour distribution provides
topological information about particle edges for size determination. By using the principle of
17
photometric stereo imaging, it is possible to extract 3D information from 2D images. This
should also detect overlapping particles. The size of the particles was then estimated by
calculating the maximum and minimum diameter after fitting an ellipse on the particle edges
as shown in Figure 3.1.
The software used by the EyeconTM calculates the volume-based size distribution of
all the granules measured during each run. The D10, D25, D50, D75 and D90 values for each run
were derived based on this distribution. Because of the transformation from number based
to volume based values the larger particles have a relatively big influence on the complete
distribution. This indicates that D10 values are better to examine PSD than D50 values. [22]
Using the raw data collected by the EyeconTM, it is possible to look at all the granules
measured by the equipment. For a high number of size fractions, the number of granules
observed in that fraction is displayed, making it possible to build in virtual sieves and
compare these results with data from sieve analysis.
3.2.2. Determination of torque and specific mechanical energy
The ConsiGmaTM-25 system keeps track of certain parameters during the granulation
process. Torque values were extracted from each run and the average value for the run
(after steady state conditions were reached) was calculated. The torque value represents the
energy required to rotate the screws in the barrel, which experiences the frictional forces by
the material during the process. Specific mechanical energy is a scale-independent measure,
used to capture information about energy introduced to the system. It is based on the
mechanical torque, screw speed and material throughput during the granulation process, as
shown in equation 3.1. [27]
(Equation 3.1)
Where: SME = Specific Mechanical Energy (J/kg)
T = motor Torque (Nm)
N = screw speed (rpm)
Q = powder feed rate (kg/min)
18
3.2.3. Sieve analysis
PSD was determined off-line using sieve analysis performed with the Retsch VE 1000
sieve shaker (Haan, Germany). 100,0 g of granules were sieved for 5 min at an amplitude of 2
mm using a series of sieves (75, 150, 250, 500, 710, 1000, 1400 and 2000 µm). After sieving,
the mass of the granules was determined gravitationally. All these tests were performed in
duplicate. Afterwards, the PSD was calculated. [28] For sieve analysis as well as in-line
analysis of PSD, the results were expressed as a fraction. Three fractions were considered:
Fines (<150µm), Yield (150-1400µm) and Oversized granules (>1400µm).
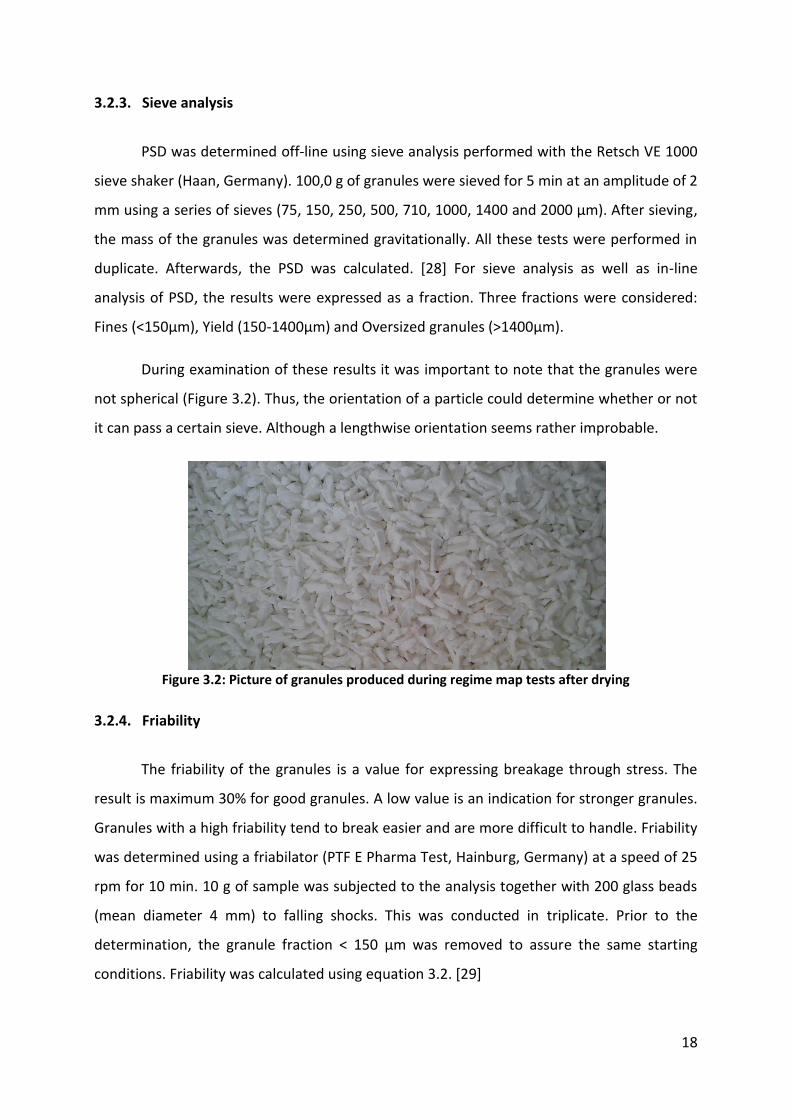
During examination of these results it was important to note that the granules were
not spherical (Figure 3.2). Thus, the orientation of a particle could determine whether or not
it can pass a certain sieve. Although a lengthwise orientation seems rather improbable.
Figure 3.2: Picture of granules produced during regime map tests after drying
3.2.4. Friability
The friability of the granules is a value for expressing breakage through stress. The
result is maximum 30% for good granules. A low value is an indication for stronger granules.
Granules with a high friability tend to break easier and are more difficult to handle. Friability
was determined using a friabilator (PTF E Pharma Test, Hainburg, Germany) at a speed of 25
rpm for 10 min. 10 g of sample was subjected to the analysis together with 200 glass beads
(mean diameter 4 mm) to falling shocks. This was conducted in triplicate. Prior to the
determination, the granule fraction < 150 µm was removed to assure the same starting
conditions. Friability was calculated using equation 3.2. [29]
19
(Equation 3.2)
Where: F = Friability
Iwt = Initial weight
Fwt = Weight after friability test
3.2.5. Flowability
The bulk volume of 30,0 g granules was recorded in a 100 mL measuring cylinder.
After 1250 taps with a tapping machine (J. Englesman, Ludwigshafen, Germany) the volume
was recorded again. 3 repetitions per batch were made. Bulk- and tapped density were
calculated using equation 3.3 and 3.4. The compressibility index was calculated using
equation 3.5. [30] Calculation of compressibility index gives us an idea on how easy it is to
handle and pour the powder. A smaller compressibility index indicates a free-flowing batch
of granules which is easy to handle and will produce less dust. A high index is typical for a
poor-flowing granule batch.
(Equation 3.3)
Where: ρi = bulk density
V0= volume before tapping
(Equation 3.4)
Where: ρf = tapped density
V1250= volume after 1250 taps
(Equation 3.5)
Where: C% = compressibility index
ρi = bulk density
ρf = tapped density
20
3.3. EVALUATION OF RESPONSES
Due to the D-optimal design used for DOE, an interaction model was used to estimate
the influence of process parameters on the granule properties. Using the Modde software
summary of fit- , coefficient- , effect- and 4D contour plots were made to evaluate the
experiments. The summary of fit plot is a tool to evaluate if the model is statistically correct.
The R2 value measures if the model fits to the experimental data. For a good model, a
minimum R2 value of 0,5 is required. Q2 is related to further predictions by the model. If Q2
is higher than 0,1 the model is suitable to predict responses between two conducted
experiments. The model validity should be at least 0,25 for the model to be significant.
Reproducibility shows the variation on a model, a value of 0,5 or higher should be achieved.
[25]
A coefficient plot shows the regression coefficients with confidence intervals. Here it
is possible to see if the process variable is correlated with a certain response. A coefficient is
significant when the confidence interval does not cross zero. The effect plots display the
change in response when a factor varies from its low level to its high level, keeping all other
factors at their averages. Coefficient plots and effect plots often show the same results, so
most of the time only the effect plot has been considered in this study as these are ranked
by decreasing significance of the effect. In these plots, it is also possible to visualise
interactions (indicated by an *) between different parameters on the same response. [25]
For example it could be possible that screw configuration*powder feed rate show a
positive correlation for a certain response. This means that when the screw configuration
increases (more kneading elements) and the powder feed rate increases the response will be
lower. Contour plots are the visualisation of a response that is plotted against multiple
factors.
21
4. RESULTS AND DISCUSSION
4.1. USE OF EYECONTM DATA
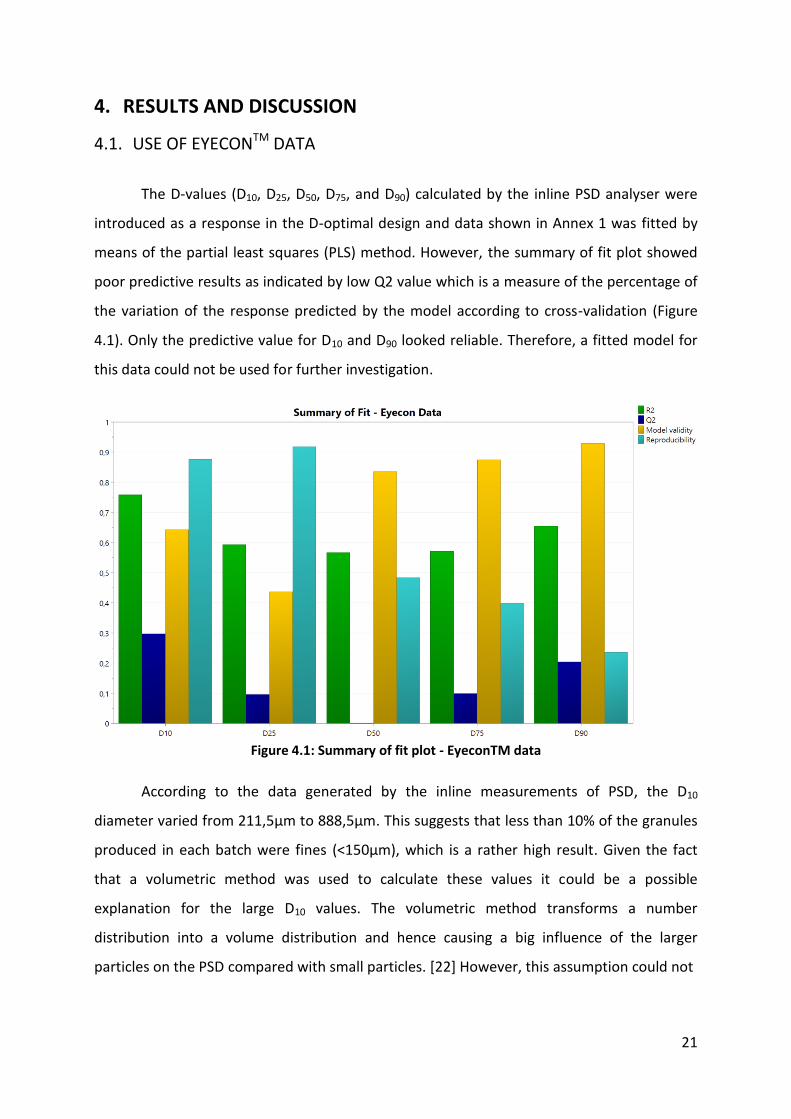
The D-values (D10, D25, D50, D75, and D90) calculated by the inline PSD analyser were
introduced as a response in the D-optimal design and data shown in Annex 1 was fitted by
means of the partial least squares (PLS) method. However, the summary of fit plot showed
poor predictive results as indicated by low Q2 value which is a measure of the percentage of
the variation of the response predicted by the model according to cross-validation (Figure
4.1). Only the predictive value for D10 and D90 looked reliable. Therefore, a fitted model for
this data could not be used for further investigation.
Figure 4.1: Summary of fit plot - EyeconTM data
According to the data generated by the inline measurements of PSD, the D10
diameter varied from 211,5µm to 888,5µm. This suggests that less than 10% of the granules
produced in each batch were fines (<150µm), which is a rather high result. Given the fact
that a volumetric method was used to calculate these values it could be a possible
explanation for the large D10 values. The volumetric method transforms a number
distribution into a volume distribution and hence causing a big influence of the larger
particles on the PSD compared with small particles. [22] However, this assumption could not
22
fully explain the reason behind the large differences with the expected data (large amounts
of fines for runs with low L/S). A method making it possible to compare the EyeconTM data
with a more reliable method was required.
By using the data generated by the EyeconTM, it is possible to build in virtual sieves
and compare these results with actual sieve analysis. Here the amount of fines (f<150µm)
varied from 0,07-3,07%. Annex 2 contains the calculated sieve fractions after the sieve
analysis performed with the same batches. This data was used to validate the results
obtained by the EyeconTM. Here the fraction of fines varied from 13,34-73,61%. These values
are much higher and more likely to be correct compared with those generated by the
EyeconTM, which indicates a problem concerning the detection of small granules and fines. In
an earlier paper, this equipment showed to be reliable [22], so multiple variables could
cause problems.
Some possible explanations could be that the image analysis algorithm of the
equipment recognized a high amount of fines as "background surface" instead of individual
particles, multiple small particles could be mistaken for one big particle, the velocity of the
fines was too high, and there were too many particles in one picture, etc. There could also
be a problem with the focus of the EyeconTM that allows to detect particles at a certain
distance, but in an industrial process not all particles fall down right next to each other. The
variation may also occur due to the in-house developed PSD measurement slide (using
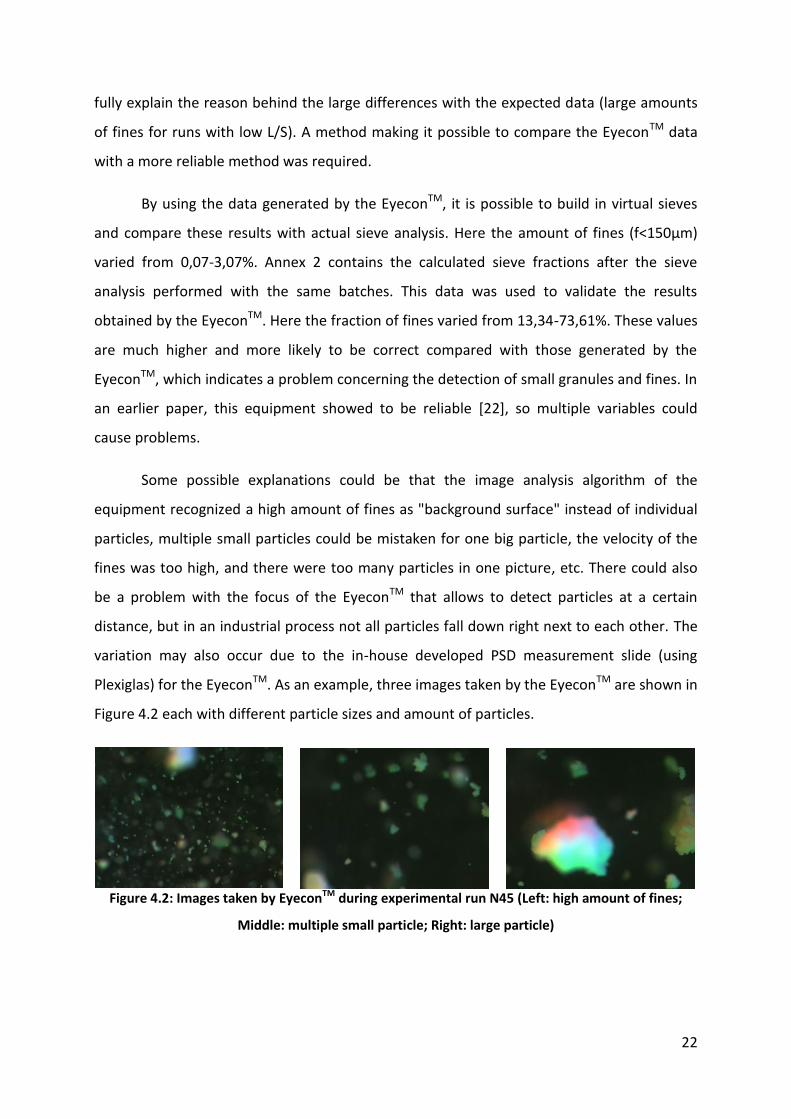
Plexiglas) for the EyeconTM. As an example, three images taken by the EyeconTM are shown in
Figure 4.2 each with different particle sizes and amount of particles.
Figure 4.2: Images taken by EyeconTM during experimental run N45 (Left: high amount of fines;
Middle: multiple small particle; Right: large particle)
23
A possible source of deviation outside the EyeconTM device could be the placement of
the equipment. In the tests performed during granule production, the device was placed
between the granulation barrel and the wet transfer line. After drying, it is normal that the
granules lose a little volume due to evaporation of the granulation liquid, so the device will
detect more big granules than the sieve analysis results show. Also, the dryer from the
ConsiGmaTM-25 system uses hot air to dry the granules, the air flow causes collision of the
granules with each other and with the inner wall of the dryer. This possibly causes additional
breakage of the granules. However, the difference should not be as big as detected.
Therefore, extra tests should be performed placing the EyeconTM after the dryer at the dry
transfer line.
4.2. INFLUENCE OF PROCESS VARIABLES ON PSD
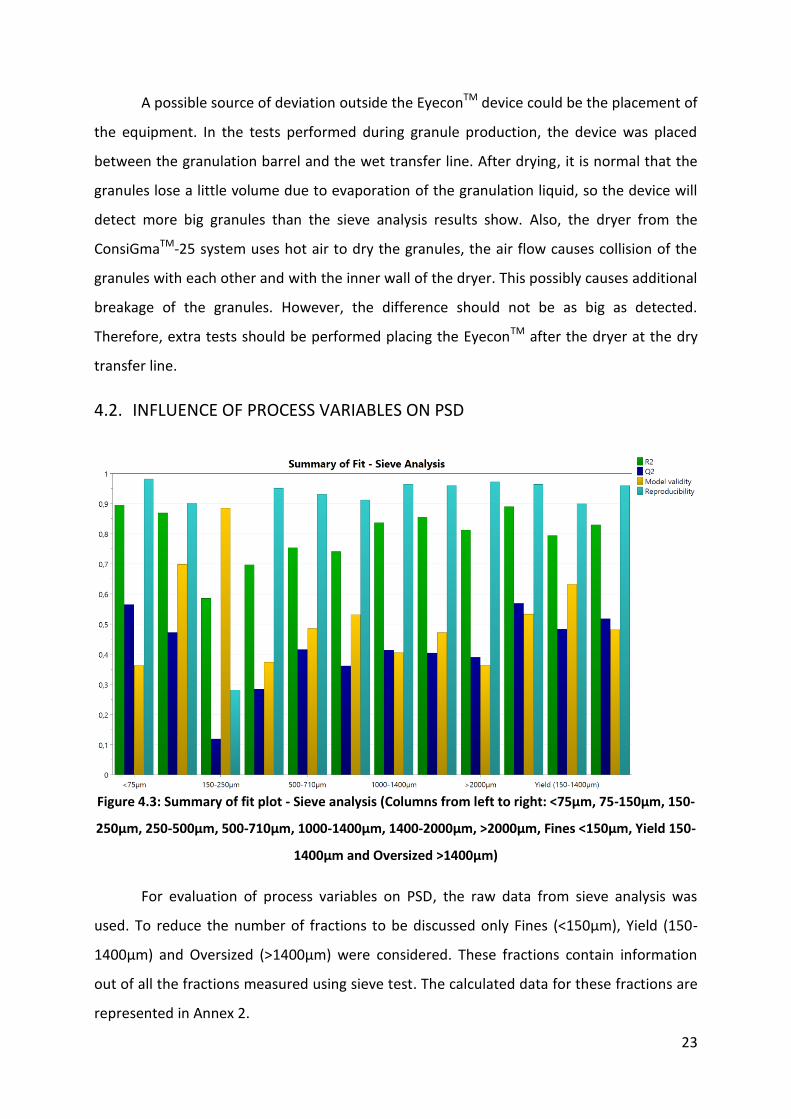
Figure 4.3: Summary of fit plot - Sieve analysis (Columns from left to right: <75µm, 75-150µm, 150-
250µm, 250-500µm, 500-710µm, 1000-1400µm, 1400-2000µm, >2000µm, Fines <150µm, Yield 150-
1400µm and Oversized >1400µm)
For evaluation of process variables on PSD, the raw data from sieve analysis was
used. To reduce the number of fractions to be discussed only Fines (<150µm), Yield (150-
1400µm) and Oversized (>1400µm) were considered. These fractions contain information
out of all the fractions measured using sieve test. The calculated data for these fractions are
represented in Annex 2.
24
The summary of fit plot based on the sieve analysis (Figure 4.3) shows that all R2
values are above 0,5 so the model is significant. Q2 values are all above 0,1 indicating a good
predictive value of the model. The high model validity i.e., always higher than 0,25 suggests
that there is no lack of fit of the model. The variation of the values shown by the
reproducibility is above 0,5 except for the 150-250µm interval which also shows rather low
R2 and Q2 values. By calculation of Fines, Yield and Oversized fractions the model validity
increases due to more consistent results. This increases the predictive value of the model.
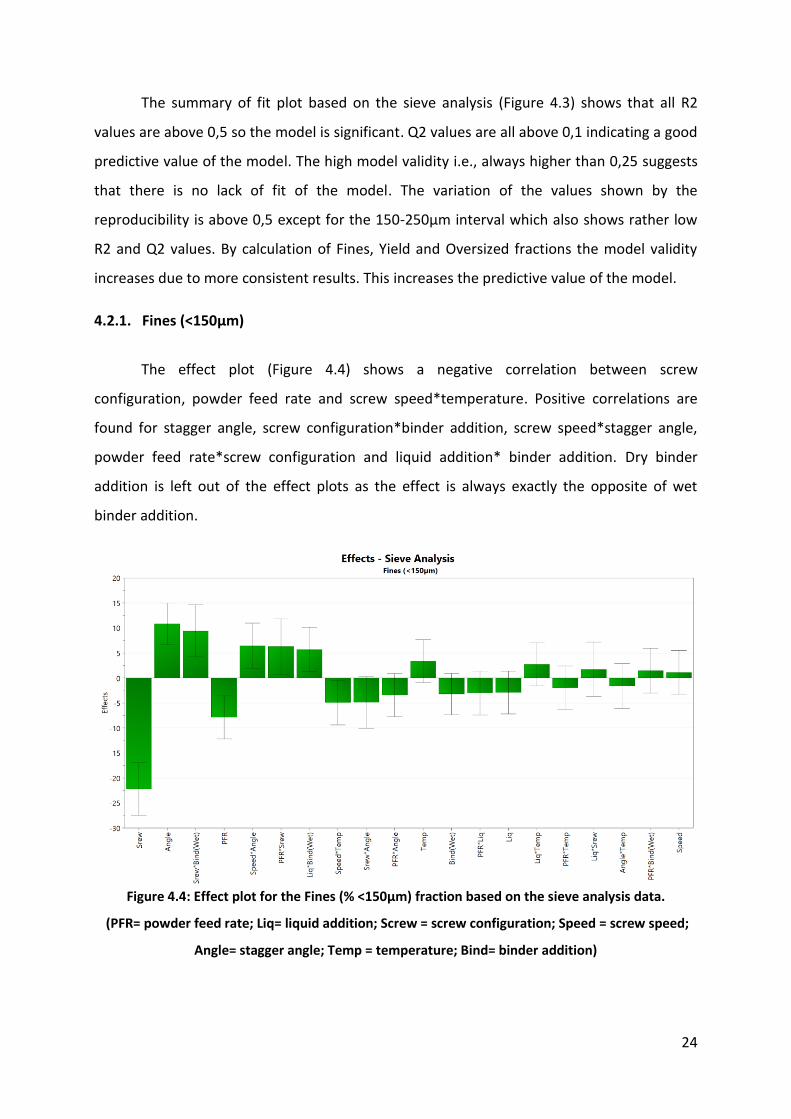
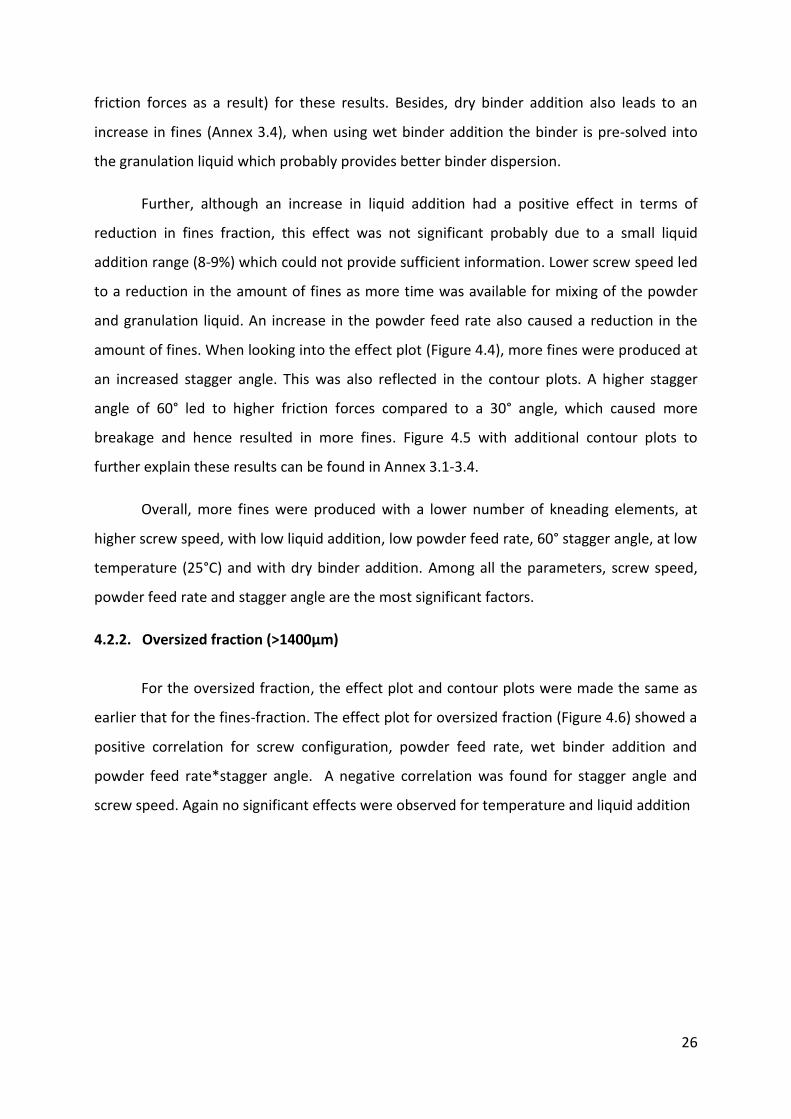
4.2.1. Fines (<150µm)
The effect plot (Figure 4.4) shows a negative correlation between screw
configuration, powder feed rate and screw speed*temperature. Positive correlations are
found for stagger angle, screw configuration*binder addition, screw speed*stagger angle,
powder feed rate*screw configuration and liquid addition* binder addition. Dry binder
addition is left out of the effect plots as the effect is always exactly the opposite of wet
binder addition.
Figure 4.4: Effect plot for the Fines (% <150µm) fraction based on the sieve analysis data.
(PFR= powder feed rate; Liq= liquid addition; Screw = screw configuration; Speed = screw speed;
Angle= stagger angle; Temp = temperature; Bind= binder addition)
25
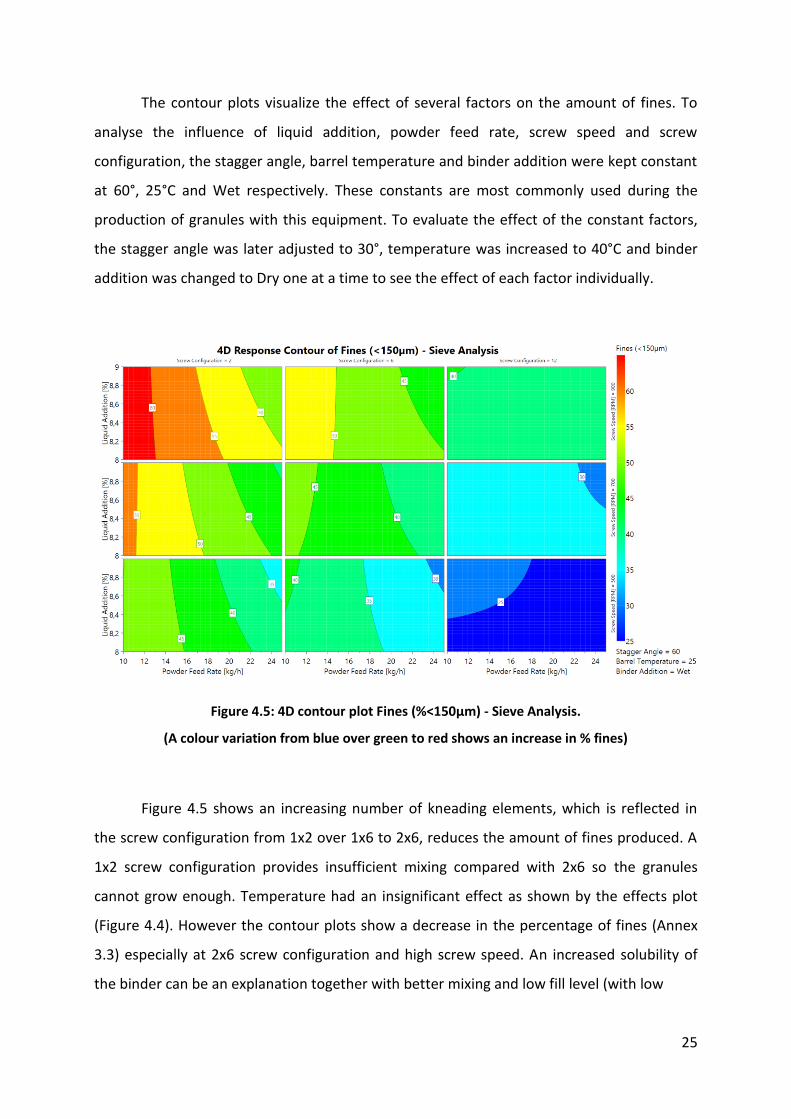
The contour plots visualize the effect of several factors on the amount of fines. To
analyse the influence of liquid addition, powder feed rate, screw speed and screw
configuration, the stagger angle, barrel temperature and binder addition were kept constant
at 60°, 25°C and Wet respectively. These constants are most commonly used during the
production of granules with this equipment. To evaluate the effect of the constant factors,
the stagger angle was later adjusted to 30°, temperature was increased to 40°C and binder
addition was changed to Dry one at a time to see the effect of each factor individually.
Figure 4.5: 4D contour plot Fines (%<150µm) - Sieve Analysis.
(A colour variation from blue over green to red shows an increase in % fines)
Figure 4.5 shows an increasing number of kneading elements, which is reflected in
the screw configuration from 1x2 over 1x6 to 2x6, reduces the amount of fines produced. A
1x2 screw configuration provides insufficient mixing compared with 2x6 so the granules
cannot grow enough. Temperature had an insignificant effect as shown by the effects plot
(Figure 4.4). However the contour plots show a decrease in the percentage of fines (Annex
3.3) especially at 2x6 screw configuration and high screw speed. An increased solubility of
the binder can be an explanation together with better mixing and low fill level (with low
26
friction forces as a result) for these results. Besides, dry binder addition also leads to an
increase in fines (Annex 3.4), when using wet binder addition the binder is pre-solved into
the granulation liquid which probably provides better binder dispersion.
Further, although an increase in liquid addition had a positive effect in terms of
reduction in fines fraction, this effect was not significant probably due to a small liquid
addition range (8-9%) which could not provide sufficient information. Lower screw speed led
to a reduction in the amount of fines as more time was available for mixing of the powder
and granulation liquid. An increase in the powder feed rate also caused a reduction in the
amount of fines. When looking into the effect plot (Figure 4.4), more fines were produced at
an increased stagger angle. This was also reflected in the contour plots. A higher stagger
angle of 60° led to higher friction forces compared to a 30° angle, which caused more
breakage and hence resulted in more fines. Figure 4.5 with additional contour plots to
further explain these results can be found in Annex 3.1-3.4.
Overall, more fines were produced with a lower number of kneading elements, at
higher screw speed, with low liquid addition, low powder feed rate, 60° stagger angle, at low
temperature (25°C) and with dry binder addition. Among all the parameters, screw speed,
powder feed rate and stagger angle are the most significant factors.
4.2.2. Oversized fraction (>1400µm)
For the oversized fraction, the effect plot and contour plots were made the same as
earlier that for the fines-fraction. The effect plot for oversized fraction (Figure 4.6) showed a
positive correlation for screw configuration, powder feed rate, wet binder addition and
powder feed rate*stagger angle. A negative correlation was found for stagger angle and
screw speed. Again no significant effects were observed for temperature and liquid addition
27
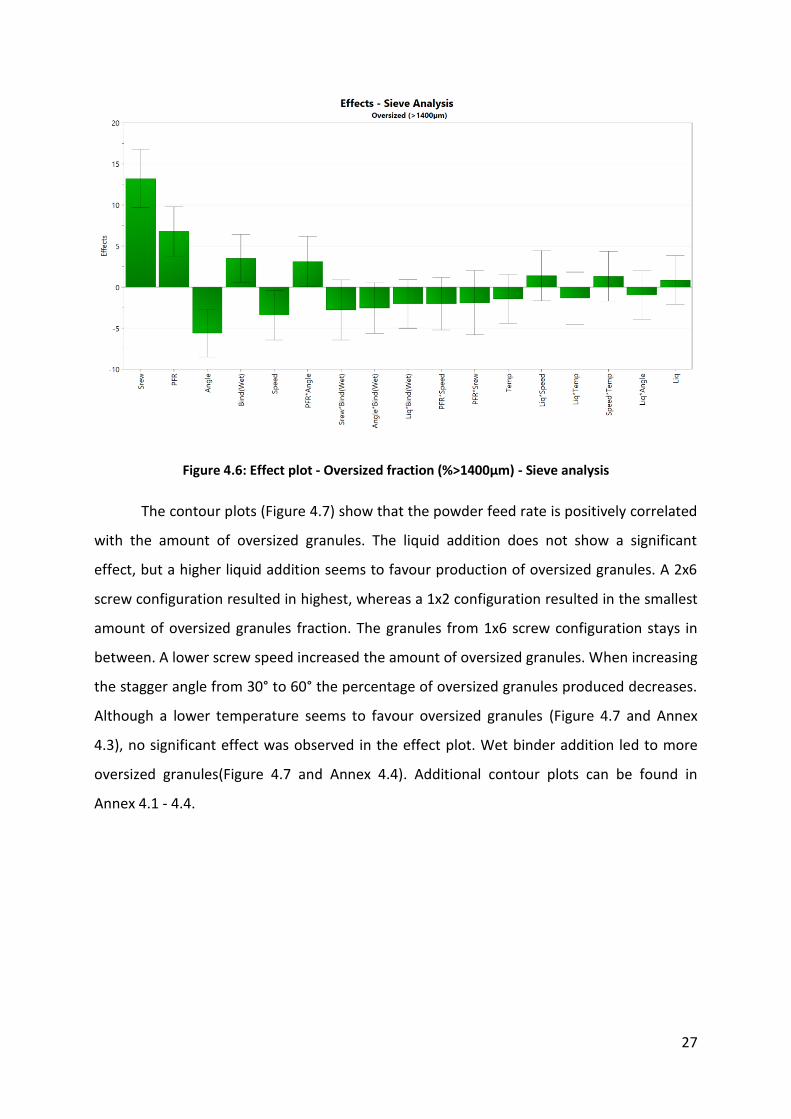
Figure 4.6: Effect plot - Oversized fraction (%>1400µm) - Sieve analysis
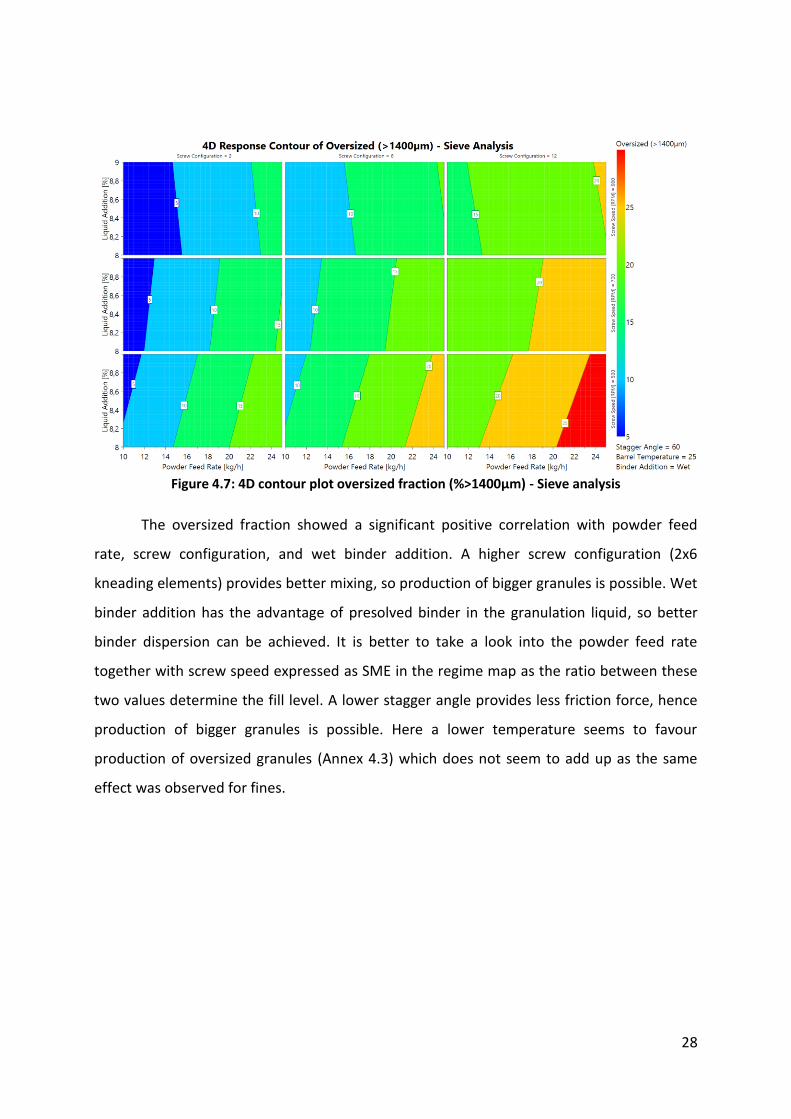
The contour plots (Figure 4.7) show that the powder feed rate is positively correlated
with the amount of oversized granules. The liquid addition does not show a significant
effect, but a higher liquid addition seems to favour production of oversized granules. A 2x6
screw configuration resulted in highest, whereas a 1x2 configuration resulted in the smallest
amount of oversized granules fraction. The granules from 1x6 screw configuration stays in
between. A lower screw speed increased the amount of oversized granules. When increasing
the stagger angle from 30° to 60° the percentage of oversized granules produced decreases.
Although a lower temperature seems to favour oversized granules (Figure 4.7 and Annex
4.3), no significant effect was observed in the effect plot. Wet binder addition led to more
oversized granules(Figure 4.7 and Annex 4.4). Additional contour plots can be found in
Annex 4.1 - 4.4.
28
Figure 4.7: 4D contour plot oversized fraction (%>1400µm) - Sieve analysis
The oversized fraction showed a significant positive correlation with powder feed
rate, screw configuration, and wet binder addition. A higher screw configuration (2x6
kneading elements) provides better mixing, so production of bigger granules is possible. Wet
binder addition has the advantage of presolved binder in the granulation liquid, so better
binder dispersion can be achieved. It is better to take a look into the powder feed rate
together with screw speed expressed as SME in the regime map as the ratio between these
two values determine the fill level. A lower stagger angle provides less friction force, hence
production of bigger granules is possible. Here a lower temperature seems to favour
production of oversized granules (Annex 4.3) which does not seem to add up as the same
effect was observed for fines.
29
4.2.3. Yield fraction (150-1400µm)
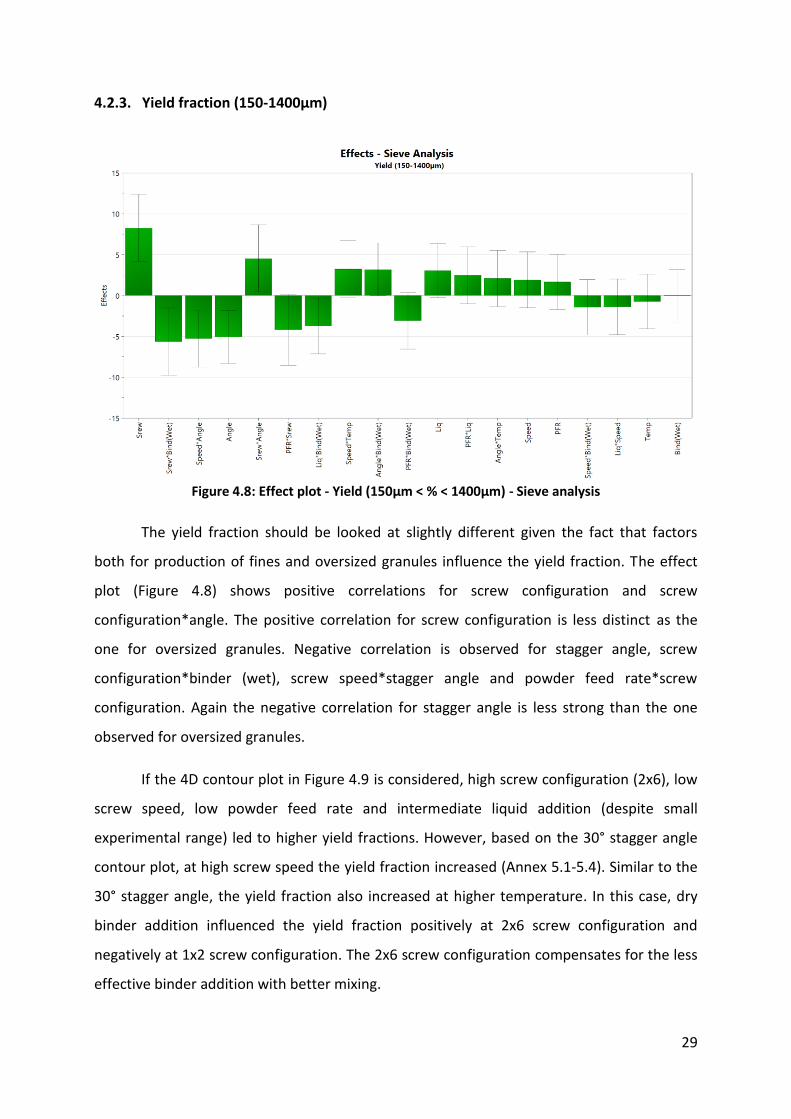
Figure 4.8: Effect plot - Yield (150µm < % < 1400µm) - Sieve analysis
The yield fraction should be looked at slightly different given the fact that factors
both for production of fines and oversized granules influence the yield fraction. The effect
plot (Figure 4.8) shows positive correlations for screw configuration and screw
configuration*angle. The positive correlation for screw configuration is less distinct as the
one for oversized granules. Negative correlation is observed for stagger angle, screw
configuration*binder (wet), screw speed*stagger angle and powder feed rate*screw
configuration. Again the negative correlation for stagger angle is less strong than the one
observed for oversized granules.
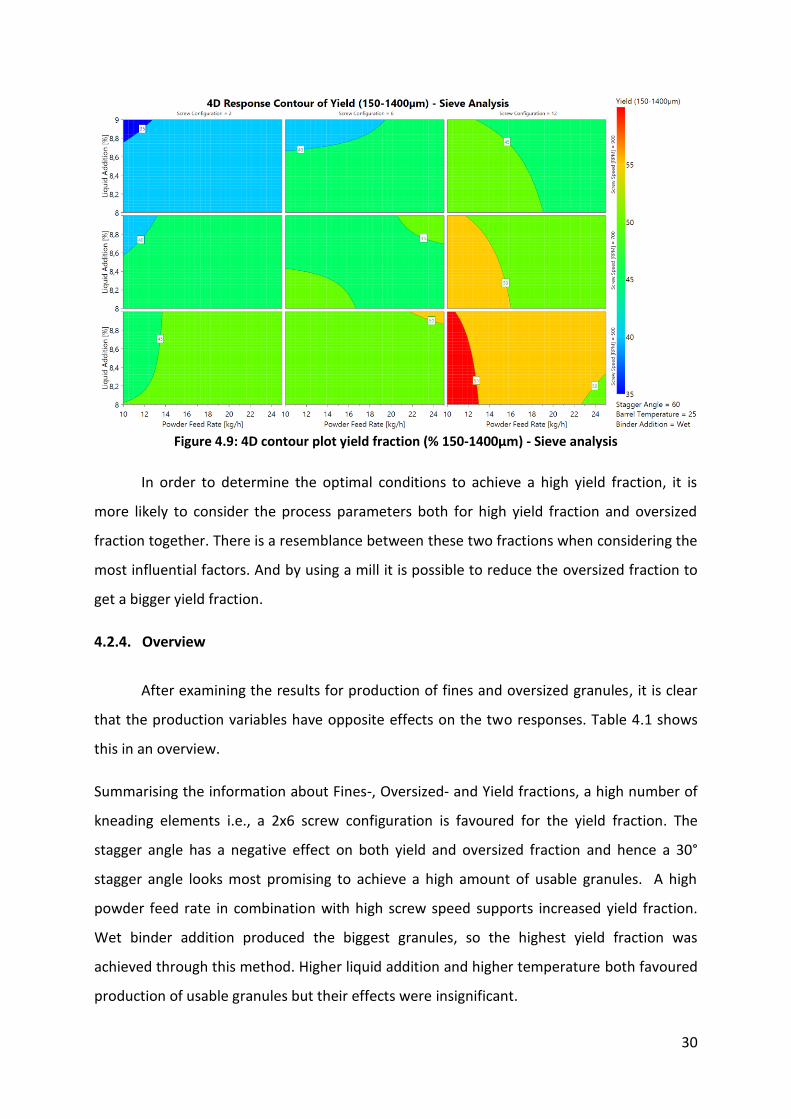
If the 4D contour plot in Figure 4.9 is considered, high screw configuration (2x6), low
screw speed, low powder feed rate and intermediate liquid addition (despite small
experimental range) led to higher yield fractions. However, based on the 30° stagger angle
contour plot, at high screw speed the yield fraction increased (Annex 5.1-5.4). Similar to the
30° stagger angle, the yield fraction also increased at higher temperature. In this case, dry
binder addition influenced the yield fraction positively at 2x6 screw configuration and
negatively at 1x2 screw configuration. The 2x6 screw configuration compensates for the less
effective binder addition with better mixing.
30
Figure 4.9: 4D contour plot yield fraction (% 150-1400µm) - Sieve analysis
In order to determine the optimal conditions to achieve a high yield fraction, it is
more likely to consider the process parameters both for high yield fraction and oversized
fraction together. There is a resemblance between these two fractions when considering the
most influential factors. And by using a mill it is possible to reduce the oversized fraction to
get a bigger yield fraction.
4.2.4. Overview
After examining the results for production of fines and oversized granules, it is clear
that the production variables have opposite effects on the two responses. Table 4.1 shows
this in an overview.
Summarising the information about Fines-, Oversized- and Yield fractions, a high number of
kneading elements i.e., a 2x6 screw configuration is favoured for the yield fraction. The
stagger angle has a negative effect on both yield and oversized fraction and hence a 30°
stagger angle looks most promising to achieve a high amount of usable granules. A high
powder feed rate in combination with high screw speed supports increased yield fraction.
Wet binder addition produced the biggest granules, so the highest yield fraction was
achieved through this method. Higher liquid addition and higher temperature both favoured
production of usable granules but their effects were insignificant.
31
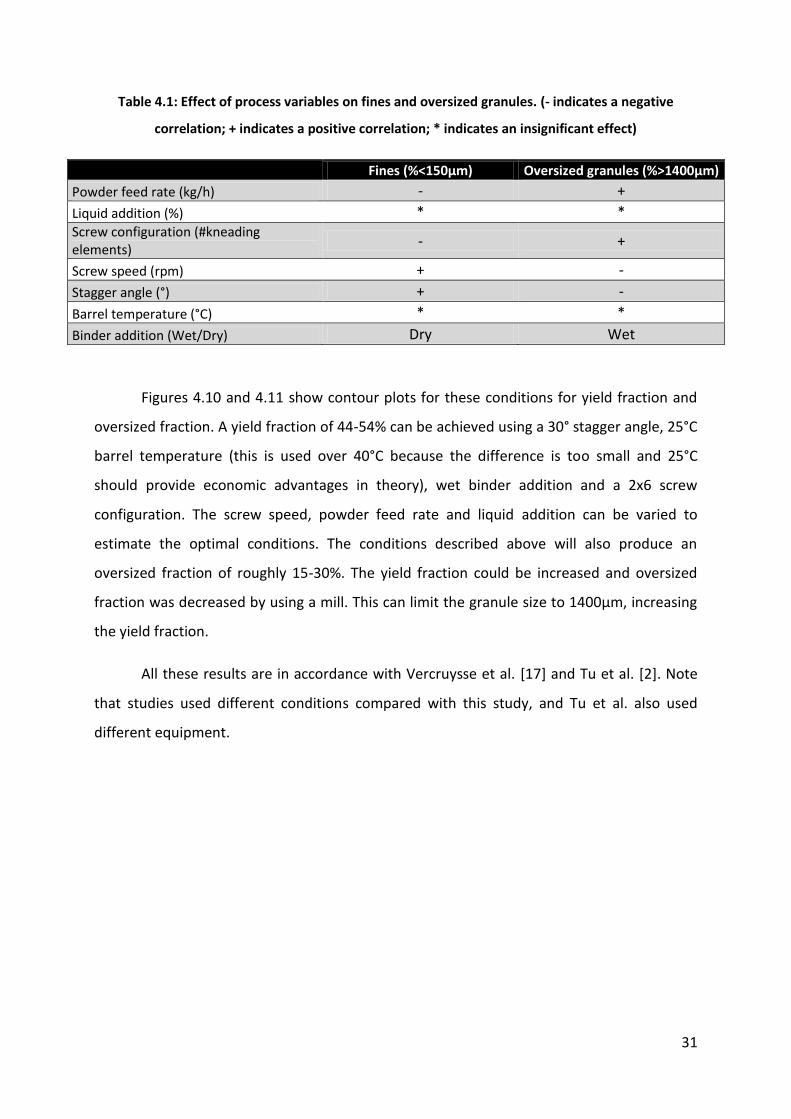
Table 4.1: Effect of process variables on fines and oversized granules. (- indicates a negative
correlation; + indicates a positive correlation; * indicates an insignificant effect)
Fines (%<150µm) Oversized granules (%>1400µm)
Powder feed rate (kg/h) - +
Liquid addition (%) * * Screw configuration (#kneading elements)
- +
Screw speed (rpm) + -
Stagger angle (°) + -
Barrel temperature (°C) * *
Binder addition (Wet/Dry) Dry Wet
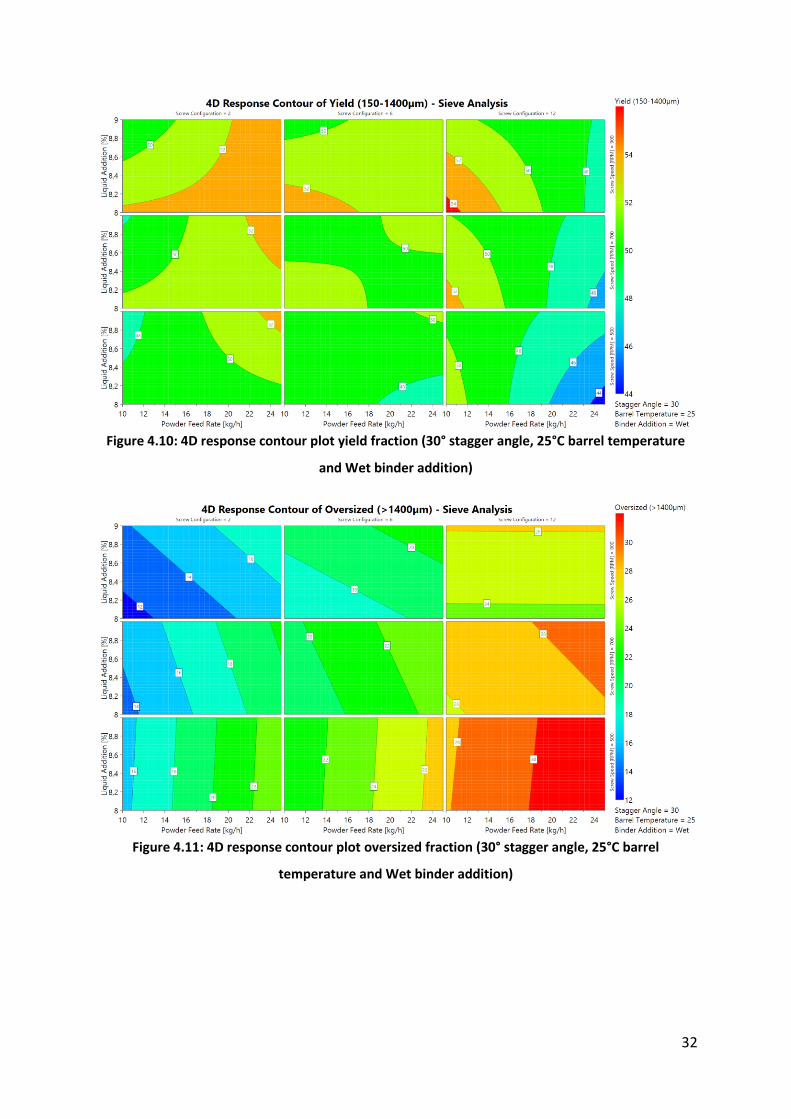
Figures 4.10 and 4.11 show contour plots for these conditions for yield fraction and
oversized fraction. A yield fraction of 44-54% can be achieved using a 30° stagger angle, 25°C
barrel temperature (this is used over 40°C because the difference is too small and 25°C
should provide economic advantages in theory), wet binder addition and a 2x6 screw
configuration. The screw speed, powder feed rate and liquid addition can be varied to
estimate the optimal conditions. The conditions described above will also produce an
oversized fraction of roughly 15-30%. The yield fraction could be increased and oversized
fraction was decreased by using a mill. This can limit the granule size to 1400µm, increasing
the yield fraction.
All these results are in accordance with Vercruysse et al. [17] and Tu et al. [2]. Note
that studies used different conditions compared with this study, and Tu et al. also used
different equipment.
32
Figure 4.10: 4D response contour plot yield fraction (30° stagger angle, 25°C barrel temperature
and Wet binder addition)
Figure 4.11: 4D response contour plot oversized fraction (30° stagger angle, 25°C barrel
temperature and Wet binder addition)
33
4.3. GRANULE PROPERTIES
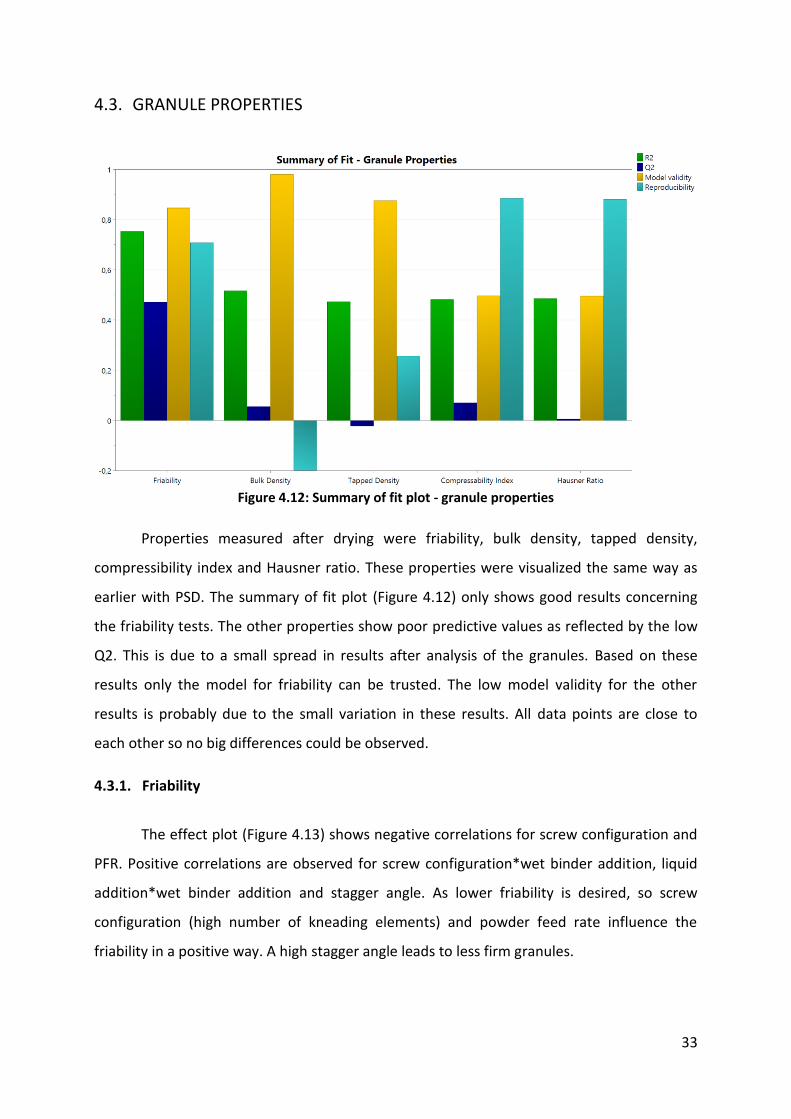
Figure 4.12: Summary of fit plot - granule properties
Properties measured after drying were friability, bulk density, tapped density,
compressibility index and Hausner ratio. These properties were visualized the same way as
earlier with PSD. The summary of fit plot (Figure 4.12) only shows good results concerning
the friability tests. The other properties show poor predictive values as reflected by the low
Q2. This is due to a small spread in results after analysis of the granules. Based on these
results only the model for friability can be trusted. The low model validity for the other
results is probably due to the small variation in these results. All data points are close to
each other so no big differences could be observed.
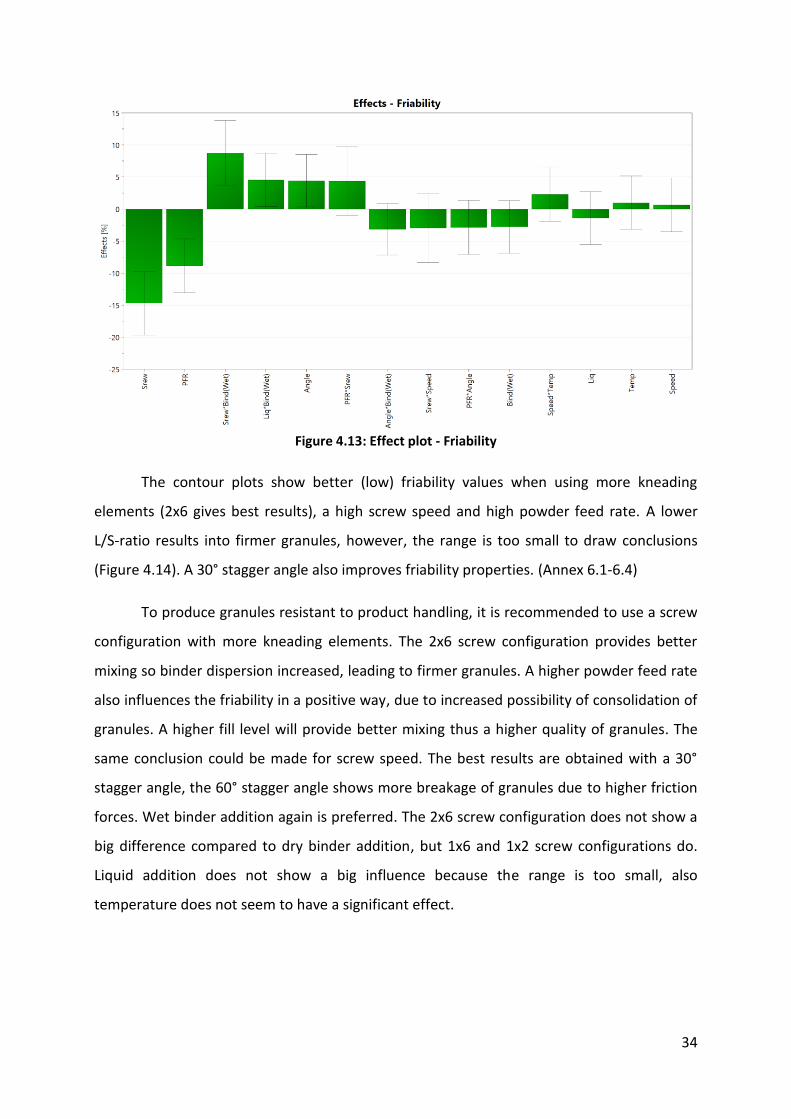
4.3.1. Friability
The effect plot (Figure 4.13) shows negative correlations for screw configuration and
PFR. Positive correlations are observed for screw configuration*wet binder addition, liquid
addition*wet binder addition and stagger angle. As lower friability is desired, so screw
configuration (high number of kneading elements) and powder feed rate influence the
friability in a positive way. A high stagger angle leads to less firm granules.
34
Figure 4.13: Effect plot - Friability
The contour plots show better (low) friability values when using more kneading
elements (2x6 gives best results), a high screw speed and high powder feed rate. A lower
L/S-ratio results into firmer granules, however, the range is too small to draw conclusions
(Figure 4.14). A 30° stagger angle also improves friability properties. (Annex 6.1-6.4)
To produce granules resistant to product handling, it is recommended to use a screw
configuration with more kneading elements. The 2x6 screw configuration provides better
mixing so binder dispersion increased, leading to firmer granules. A higher powder feed rate
also influences the friability in a positive way, due to increased possibility of consolidation of
granules. A higher fill level will provide better mixing thus a higher quality of granules. The
same conclusion could be made for screw speed. The best results are obtained with a 30°
stagger angle, the 60° stagger angle shows more breakage of granules due to higher friction
forces. Wet binder addition again is preferred. The 2x6 screw configuration does not show a
big difference compared to dry binder addition, but 1x6 and 1x2 screw configurations do.
Liquid addition does not show a big influence because the range is too small, also
temperature does not seem to have a significant effect.
35
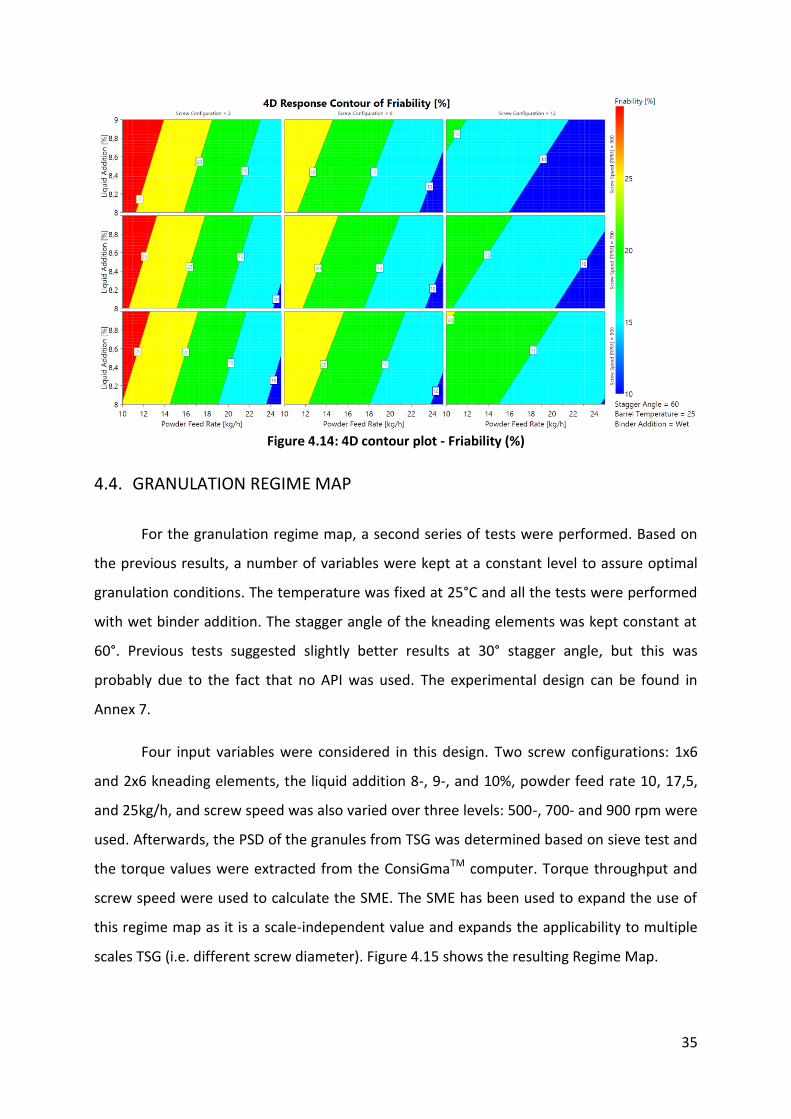
Figure 4.14: 4D contour plot - Friability (%)
4.4. GRANULATION REGIME MAP
For the granulation regime map, a second series of tests were performed. Based on
the previous results, a number of variables were kept at a constant level to assure optimal
granulation conditions. The temperature was fixed at 25°C and all the tests were performed
with wet binder addition. The stagger angle of the kneading elements was kept constant at
60°. Previous tests suggested slightly better results at 30° stagger angle, but this was
probably due to the fact that no API was used. The experimental design can be found in
Annex 7.
Four input variables were considered in this design. Two screw configurations: 1x6
and 2x6 kneading elements, the liquid addition 8-, 9-, and 10%, powder feed rate 10, 17,5,
and 25kg/h, and screw speed was also varied over three levels: 500-, 700- and 900 rpm were
used. Afterwards, the PSD of the granules from TSG was determined based on sieve test and
the torque values were extracted from the ConsiGmaTM computer. Torque throughput and
screw speed were used to calculate the SME. The SME has been used to expand the use of
this regime map as it is a scale-independent value and expands the applicability to multiple
scales TSG (i.e. different screw diameter). Figure 4.15 shows the resulting Regime Map.
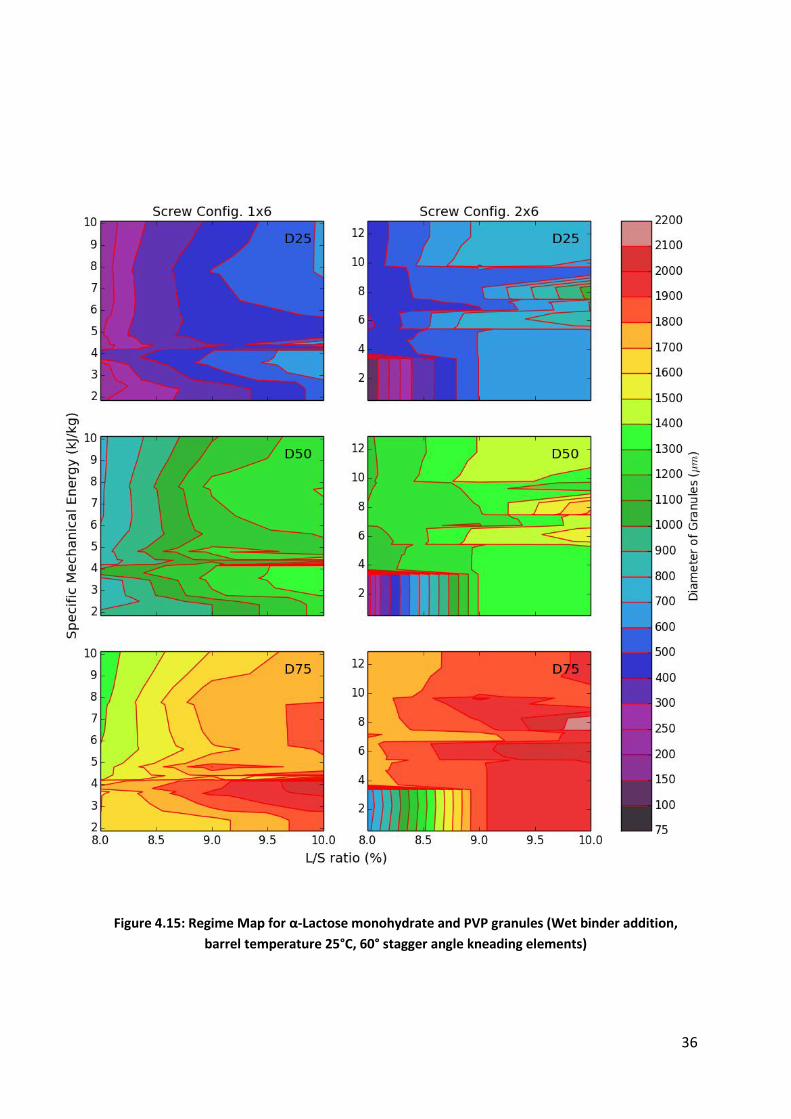
36
Figure 4.15: Regime Map for α-Lactose monohydrate and PVP granules (Wet binder addition,
barrel temperature 25°C, 60° stagger angle kneading elements)
37
The regime map for the D25, D50 and D75 for 1x6 and 2x6 screw configuration have
been shown in Figure 4.15. Less amount of fines was produced compared with the first
series of screening tests. This was probably due to the fact, for this part of the study the
dryer was not used, which minimized the chance of breaking the granules. In this regard, the
fraction of granules suited for tabletting can be found in the D25 and D50 plots. The 2x6 screw
configuration led to bigger granules and thus a higher yield fraction (% between 150 - 1400
µm).
Besides, a high L/S-ratio yielded bigger granules. This complied with the results from
the previous screening study and after extension of the liquid addition range the effect was
clearer. At 10% liquid addition, a minimum of 525 µm in the D25 plot and a maximum of 2475
µm in the D75 plot was observed. Such an increase in granule size indicates that it is better to
use a lower liquid addition. In this regard, 9% liquid addition was most optimum, with a
range from 525- to 2025 µm. The amount of oversized granules can still be reduced by using
the dryer and a mill. The same trends are observed when using 1x6 screw configuration.
Regarding the SME, the granules look to be the biggest at an intermediate level. They
can be observed around 7 kJ/kg. This value can be obtained using for example the following
conditions: Wet binder addition, Temperature 25°C, Stagger angle 60°, Screw configuration
2x6, Liquid addition 9%, Throughput 10 kg/h and screw speed 500 rpm (Experiment 37 in
Annex 7). These conditions had an average torque value of 2,51. Calculating SME at this
condition: SME = (2,51 Nm x 500 rpm) / 0,167 kg/min = 7515 J/kg or 7,515 kJ/kg. Here a low
throughput and low screw speed yielded to good results due to an ideal fill level for mixing
properties.
Lower SME values also led to a high yield at high throughputs and screw speeds
appear. Experiment 45 in Annex 7: Liquid addition 9%, Throughput 25 kg/h, Screw Speed 900
rpm and Torque 2,50 Nm gives a SME of 5,40 kJ/kg. The same torque as experiment 37 is
achieved, this suggests that high throughput in combination with high screw speed prevents
extra load on the equipment. Working at high speed showed advantages earlier during the
screening tests, which has been confirmed here. This also gives the pharmaceutical industry
the opportunity to work at high throughput to achieve higher production output.

38
Based on these results, it is clear that the throughput and screw speed should be
increased together for optimal results. By this, a favourable fill level can be achieved and the
torque values are also at an optimum level, so the energy input to the TSG is at desired level.
The liquid addition should be kept at an intermediate level as a low liquid addition produces
a low amount of usable granules and high liquid addition causes higher torque values.
The regime map together with the experimental design in Annex 7, can be used as a
guidance for process optimization or up-scaling of new formulations. For other formulations
more regime maps are necessary and more process variables could be investigated.
39
5. CONCLUSIONS
Based on the results of the first screening experiments, an optimal granulation
condition for the specific formulation was determined. A high number of kneading elements
favours production of granules usable for tabletting, so a 2x6 screw configuration is desired.
The 30° stagger angle of the kneading elements produced the highest amount of good
quality granules although in theory 60° should provide better mixing properties. Further, a
high powder feed rate (25 kg/h) in combination with high screw speed (700-900 rpm) and
wet binder addition also yield good results. The powder feed rate and screw speed
determine the fill level of the granulation barrel. An optimal ratio between the two variables
provides good mixing properties, and good results for PSD and friability. Last, both liquid
addition and barrel temperature were insignificant but the contour plots showed slightly
more positive results at the higher values. During the regime map experiments the range for
liquid addition was expanded to better evaluate these results.
The data acquired from the EyeconTM seemed to be unusable for the regime map
experiments. A comparison between this data and results after sieve analysis revealed a
problem in the detection of fines (fraction < 150 µm). Some possible problems were
discussed. The problem could be that the software cannot detect fines, this can be
investigated by off-line measurement of samples with high amounts of fines. There is also a
possibility that the equipment works fine but PSD changed after the measurement during
the drying process. This can be tested by placing the EyeconTM equipment between the dryer
and dry transfer line of the ConsiGmaTM in the future.
The granulation regime map revealed that a relative high amount of yield fraction
(granules 150-1400 µm) can be achieved by using an intermediate liquid addition (9%). The
investigation of SME showed a favourable results for SME values in the range of 5-8 kJ/kg,
which was derived from throughput, torque and screw speed values that are tuned in to
each other (if the throughput is high than the screw speed should also be high). For the
further knowledge regarding the TSG, more variables can be varied in order to determine
the influence of the stagger angle of the kneading elements, higher temperature, the
possibilities of different screw configurations, and the effect of different formulations.
40
6. REFERENCES
[1] Granulata. European Pharmacopeia 2014;8.0:01/2008:0499.
[2] Tu W, Ingram A, Seville J. Regime map development for continuous twin screw granulation. Chemical Engineering Science 2013;87:315–26.
[3] Iveson S, Litster J, Hapgood K, Ennis B. Nucleation, growth and breakage phenomena in agitated wet granulation processes: a review. Powder Technology 2001;117:3–39.
[4] Lee K, Ingram A, Rowson N. Twin screw wet granulation: The study of a continuous twin screw granulator using Positron Emission Particle Tracking (PEPT) technique. European Journal of Pharmaceutics and Biopharmaceutics 2012;81:666–73.
[5] Vervaet C, Remon J. Continuous granulation in the pharmaceutical industry. Chemical Engineering Science 2005;60:3949–57.
[6] Iveson S, Wauters P, Forrest S. Growth regime map for liquid-bound granules: further development and experimental validation. Powder Technology 2001;117:83–97.
[7] Chablani L, Taylor M, Mehrotra A. Inline real-time near-infrared granule moisture measurements of a continuous granulation–drying–milling process. AAPS PharmSciTech 2011;12:1050–5.
[8] Dalziel G, Nauka E. Assessment of granulation technologies for an API with poor physical properties. Drug Development and Industrial Pharmacy 2013;39:985–95.
[9] Kukec S, Hudovornik G. Study of granule growth kinetics during in situ fluid bed melt granulation using in-line FBRM and SFT probes. Drug Development and Industrial Pharmacy 2013;9045:1–8.
[10] Fonteyne M, Vercruysse J. Real-time assessment of critical quality attributes of a continuous granulation process. Pharmaceutical Development and Technology 2013;18:1–13.
[11] Melkebeke B Van, Vervaet C, Remon J. Validation of a continuous granulation process using a twin-screw extruder. International Journal of Pharmaceutics 2008;356:224–30.
[12] Vercruysse J, Delaet U. Stability and repeatability of a continuous twin screw granulation and drying system. European Journal of Pharmaceutics and Biopharmaceutics 2013;85:1031–8.
[13] Djuric D, Melkebeke B Van. Comparison of two twin-screw extruders for continuous granulation. European Journal of Pharmaceutics and Biopharmaceutics 2009;71:155–60.
41
[14] Fonteyne M, Wickström H. Influence of raw material properties upon critical quality attributes of continuously produced granules and tablets. European Journal of Pharmaceutics and Biopharmaceutics 2014.
[15] Kayrak-Talay D, Dale S, Wassgren C, Litster J. Quality by design for wet granulation in pharmaceutical processing: Assessing models for a priori design and scaling. Powder Technology 2013;240:7–18.
[16] Burggraeve A, Monteyne T. Process analytical tools for monitoring, understanding, and control of pharmaceutical fluidized bed granulation: A review. European Journal of Pharmaceutics and Biopharmaceutics 2013;83:2–15.
[17] Vercruysse J, Díaz DC. Continuous twin screw granulation: influence of process variables on granule and tablet quality. European Journal of Pharmaceutics and Biopharmaceutics 2012;82:205–11.
[18] Vercruysse J, Toiviainen M. Visualization and understanding of the granulation liquid mixing and distribution during continuous twin screw granulation using NIR chemical imaging. European Journal of Pharmaceutics and Biopharmaceutics 2013.
[19] Kumar A, Gernaey K, Beer T, Nopens I. Model-based analysis of high shear wet granulation from batch to continuous processes in pharmaceutical production–A critical review. European Journal of Pharmaceutics and Biopharmaceutics 2013;85:814–32.
[20] Hagrasy A El, Hennenkamp JR. Twin screw wet granulation: influence of formulation parameters on granule properties and growth behavior. Powder Technology 2013;238:108–15.
[21] Fonteyne M, Fussell A, Vercruysse J. Distribution of binder in granules produced by means of twin screw granulation. International Journal of Pharmaceutics 2014;462:8–10.
[22] Hagrasy A El, Cruise P, Jones I, Litster J. In-line Size Monitoring of a Twin Screw Granulation Process Using High-Speed Imaging. Journal of Pharmaceutical Innov 2013;8:90–8.
[23] Badawy S, Narang A. Mechanistic basis for the effects of process parameters on quality attributes in high shear wet granulation. International Journal of Pharmaceutics 2012;439:324–33.
[24] Tu W, Ingram A, Seville J, Hsiau S. Exploring the regime map for high-shear mixer granulation. Chemical Engineering Journal 2009;145:505–13.
[25] Eriksson L, Johansson E, Kettaneh-Wold N, Wikström C, Wold S. Design of Experiments Principles and Applications. 3rd Editio. Umea: Umetrics AB; 2008.
42
[26] Silva A, Burggraeve A. Particle sizing measurements in pharmaceutical applications: Comparison of in-process methods versus off-line methods. European Journal of Pharmaceutics and Biopharmaceutics 2013;85:1006–18.
[27] Dhenge R, Washino K, Cartwright J. Twin screw granulation using conveying screws: Effects of viscosity of granulation liquids and flow of powders. Powder Technology 2013;238:77–90.
[28] Particle-size distribution estimation by analytical sieving. European Pharmacopeia 2014;8.0:01/2010:20938.
[29] Friability of granules and spheroids. European Pharmacopeia 2014;8.0:04/2012:20941.
[30] Bulk density and tapped density of powders. European Pharmacopeia 2014;8.0:01/2013:20934.
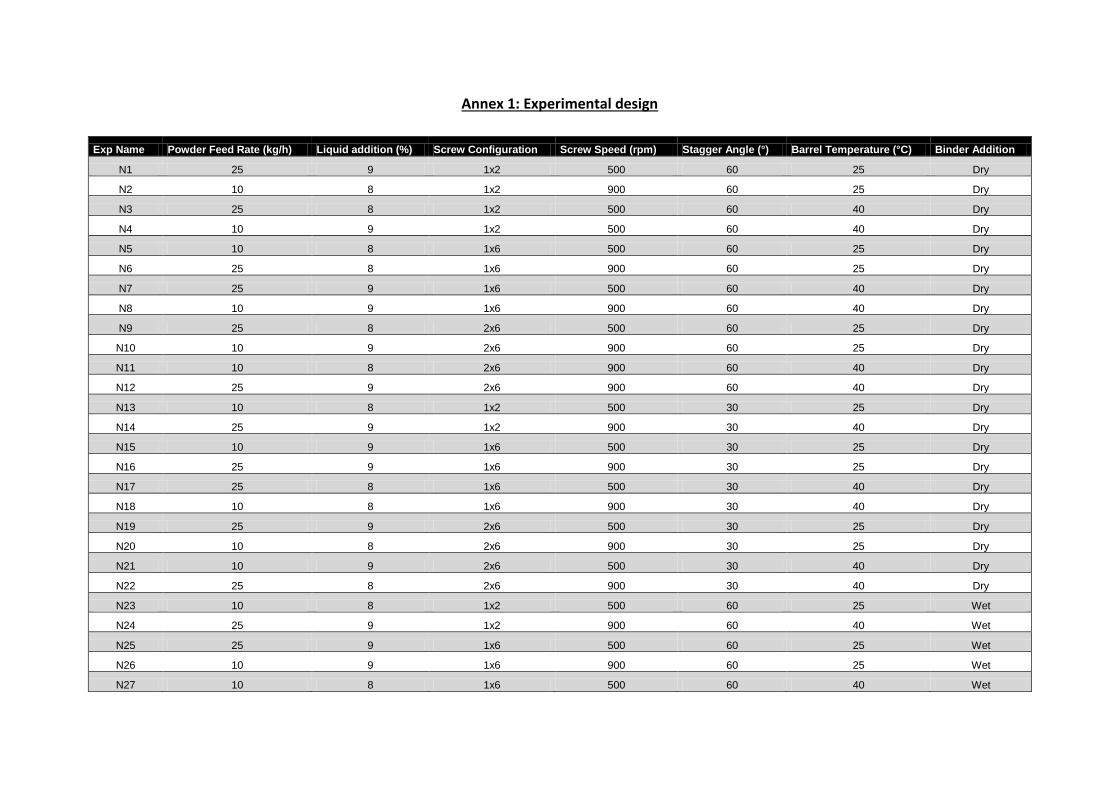
Annex 1: Experimental design
Exp Name Powder Feed Rate (kg/h) Liquid addition (%) Screw Configuration Screw Speed (rpm) Stagger Angle (°) Barrel Temperature (°C) Binder Addition
N1 25 9 1x2 500 60 25 Dry
N2 10 8 1x2 900 60 25 Dry
N3 25 8 1x2 500 60 40 Dry
N4 10 9 1x2 500 60 40 Dry
N5 10 8 1x6 500 60 25 Dry
N6 25 8 1x6 900 60 25 Dry
N7 25 9 1x6 500 60 40 Dry
N8 10 9 1x6 900 60 40 Dry
N9 25 8 2x6 500 60 25 Dry
N10 10 9 2x6 900 60 25 Dry
N11 10 8 2x6 900 60 40 Dry
N12 25 9 2x6 900 60 40 Dry
N13 10 8 1x2 500 30 25 Dry
N14 25 9 1x2 900 30 40 Dry
N15 10 9 1x6 500 30 25 Dry
N16 25 9 1x6 900 30 25 Dry
N17 25 8 1x6 500 30 40 Dry
N18 10 8 1x6 900 30 40 Dry
N19 25 9 2x6 500 30 25 Dry
N20 10 8 2x6 900 30 25 Dry
N21 10 9 2x6 500 30 40 Dry
N22 25 8 2x6 900 30 40 Dry
N23 10 8 1x2 500 60 25 Wet
N24 25 9 1x2 900 60 40 Wet
N25 25 9 1x6 500 60 25 Wet
N26 10 9 1x6 900 60 25 Wet
N27 10 8 1x6 500 60 40 Wet
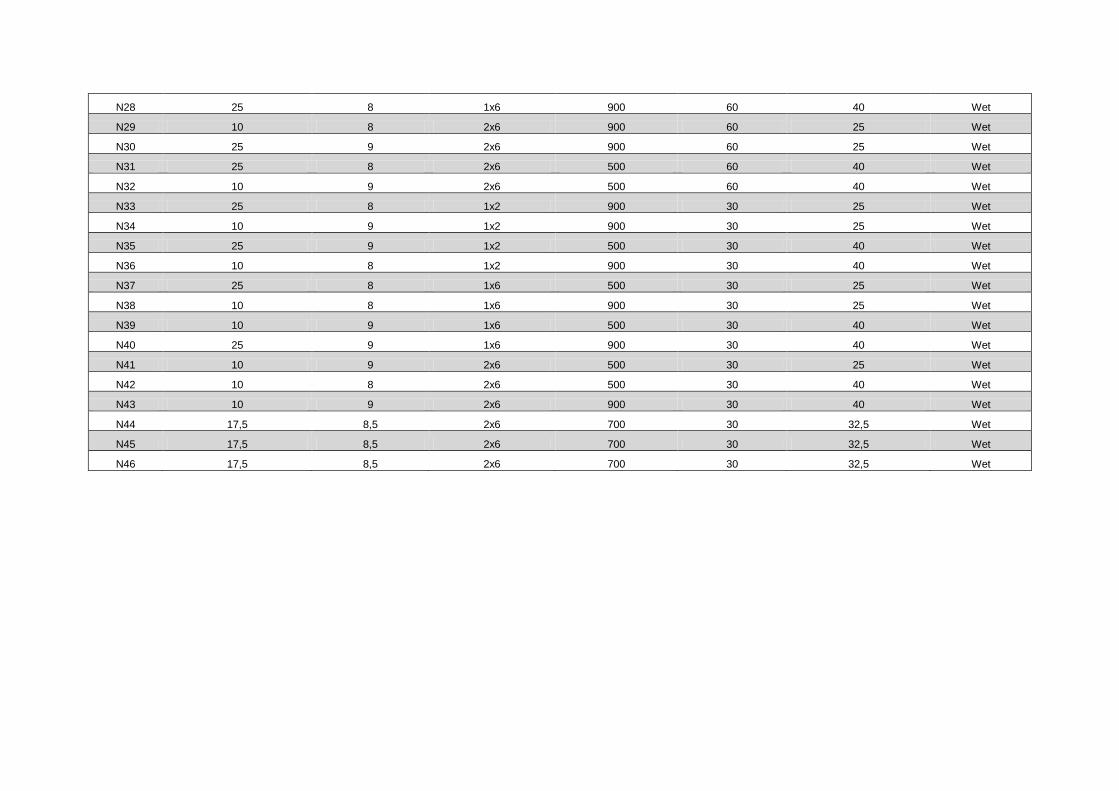
N28 25 8 1x6 900 60 40 Wet
N29 10 8 2x6 900 60 25 Wet
N30 25 9 2x6 900 60 25 Wet
N31 25 8 2x6 500 60 40 Wet
N32 10 9 2x6 500 60 40 Wet
N33 25 8 1x2 900 30 25 Wet
N34 10 9 1x2 900 30 25 Wet
N35 25 9 1x2 500 30 40 Wet
N36 10 8 1x2 900 30 40 Wet
N37 25 8 1x6 500 30 25 Wet
N38 10 8 1x6 900 30 25 Wet
N39 10 9 1x6 500 30 40 Wet
N40 25 9 1x6 900 30 40 Wet
N41 10 9 2x6 500 30 25 Wet
N42 10 8 2x6 500 30 40 Wet
N43 10 9 2x6 900 30 40 Wet
N44 17,5 8,5 2x6 700 30 32,5 Wet
N45 17,5 8,5 2x6 700 30 32,5 Wet
N46 17,5 8,5 2x6 700 30 32,5 Wet
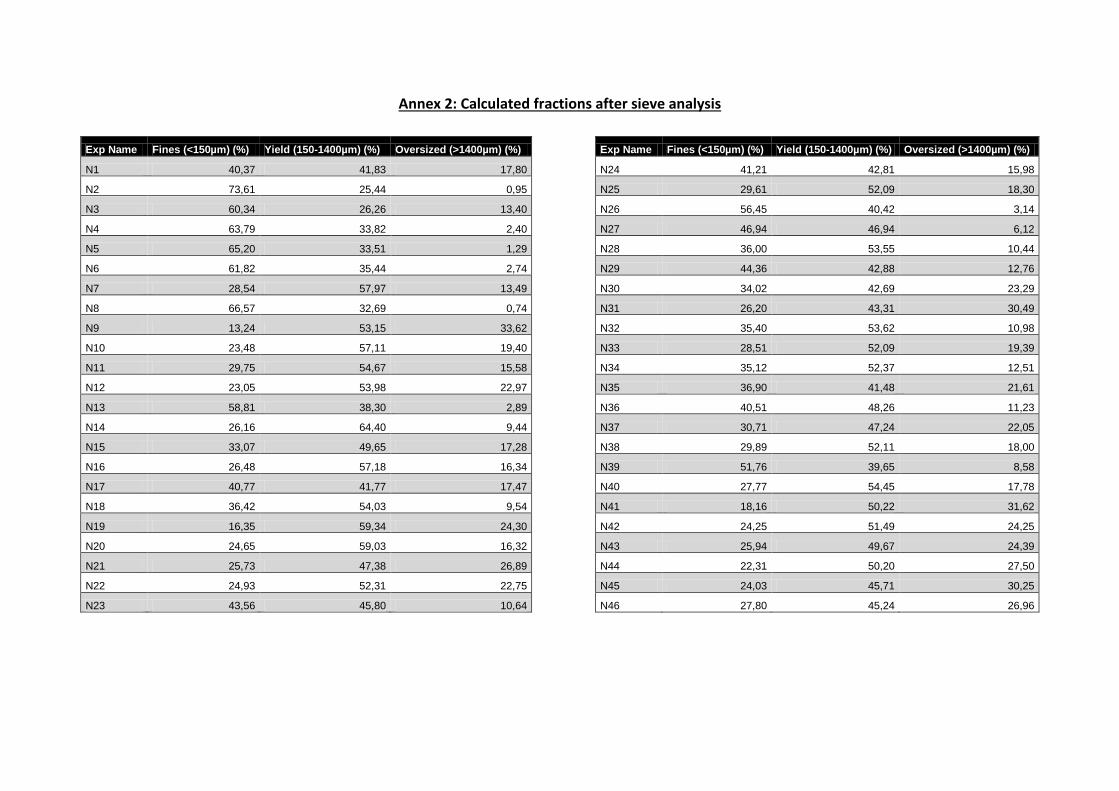
Annex 2: Calculated fractions after sieve analysis
Exp Name Fines (<150µm) (%) Yield (150-1400µm) (%) Oversized (>1400µm) (%)
Exp Name Fines (<150µm) (%) Yield (150-1400µm) (%) Oversized (>1400µm) (%)
N1 40,37 41,83 17,80
N24 41,21 42,81 15,98
N2 73,61 25,44 0,95
N25 29,61 52,09 18,30
N3 60,34 26,26 13,40
N26 56,45 40,42 3,14
N4 63,79 33,82 2,40
N27 46,94 46,94 6,12
N5 65,20 33,51 1,29
N28 36,00 53,55 10,44
N6 61,82 35,44 2,74
N29 44,36 42,88 12,76
N7 28,54 57,97 13,49
N30 34,02 42,69 23,29
N8 66,57 32,69 0,74
N31 26,20 43,31 30,49
N9 13,24 53,15 33,62
N32 35,40 53,62 10,98
N10 23,48 57,11 19,40
N33 28,51 52,09 19,39
N11 29,75 54,67 15,58
N34 35,12 52,37 12,51
N12 23,05 53,98 22,97
N35 36,90 41,48 21,61
N13 58,81 38,30 2,89
N36 40,51 48,26 11,23
N14 26,16 64,40 9,44
N37 30,71 47,24 22,05
N15 33,07 49,65 17,28
N38 29,89 52,11 18,00
N16 26,48 57,18 16,34
N39 51,76 39,65 8,58
N17 40,77 41,77 17,47
N40 27,77 54,45 17,78
N18 36,42 54,03 9,54
N41 18,16 50,22 31,62
N19 16,35 59,34 24,30
N42 24,25 51,49 24,25
N20 24,65 59,03 16,32
N43 25,94 49,67 24,39
N21 25,73 47,38 26,89
N44 22,31 50,20 27,50
N22 24,93 52,31 22,75
N45 24,03 45,71 30,25
N23 43,56 45,80 10,64
N46 27,80 45,24 26,96
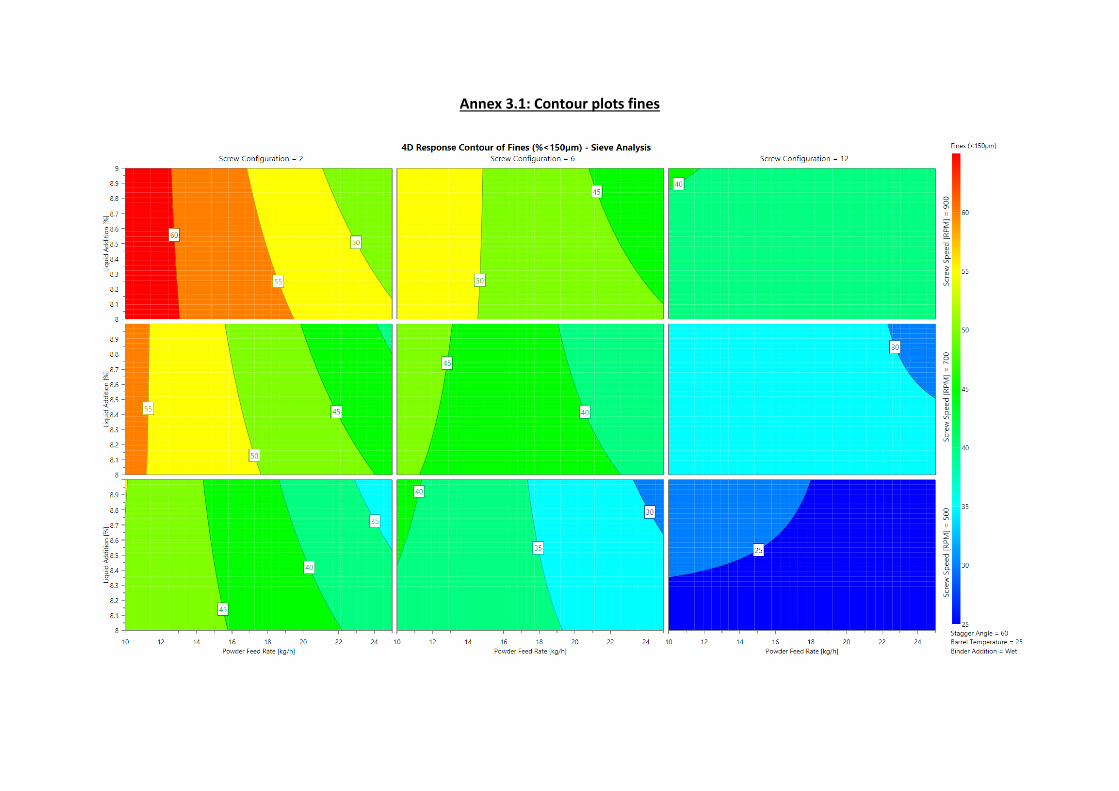
Annex 3.1: Contour plots fines
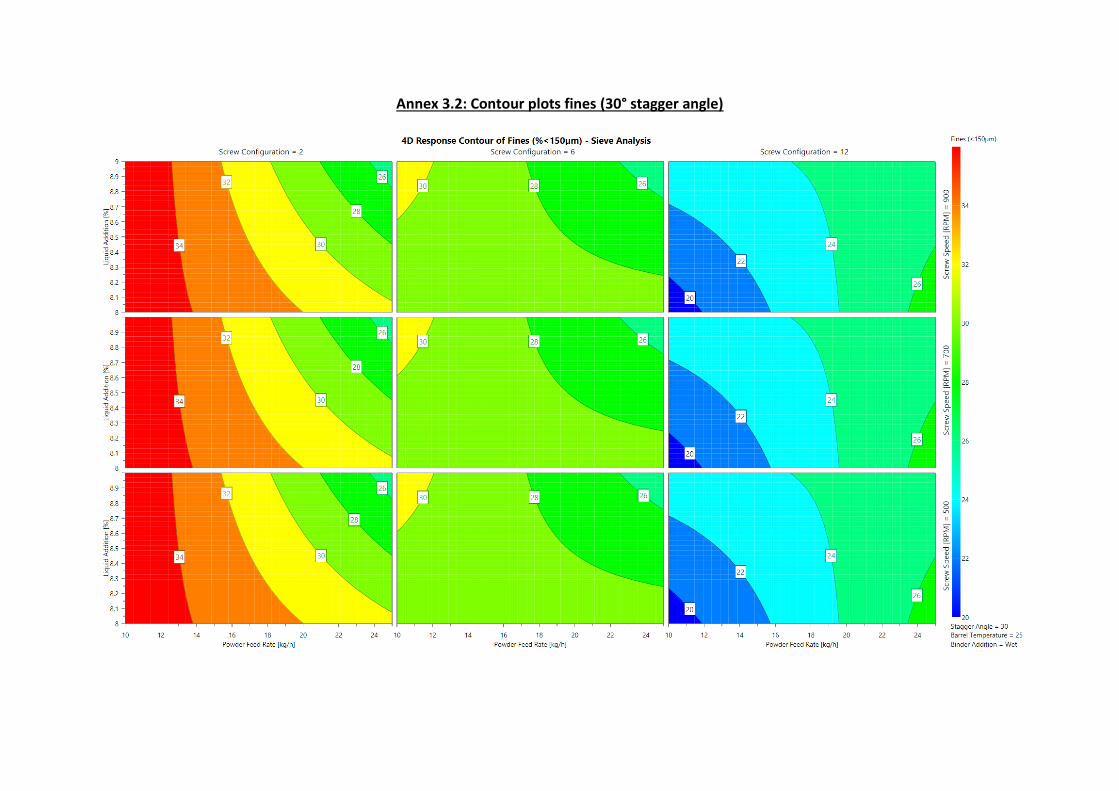
Annex 3.2: Contour plots fines (30° stagger angle)
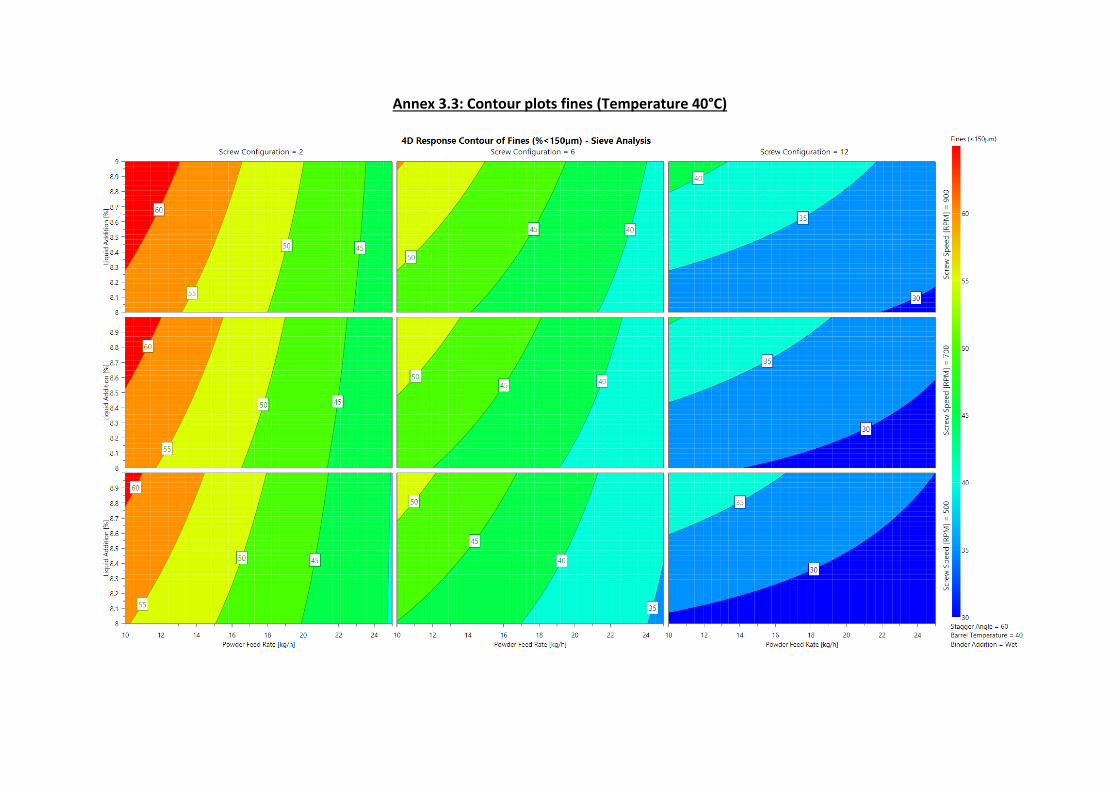
Annex 3.3: Contour plots fines (Temperature 40°C)
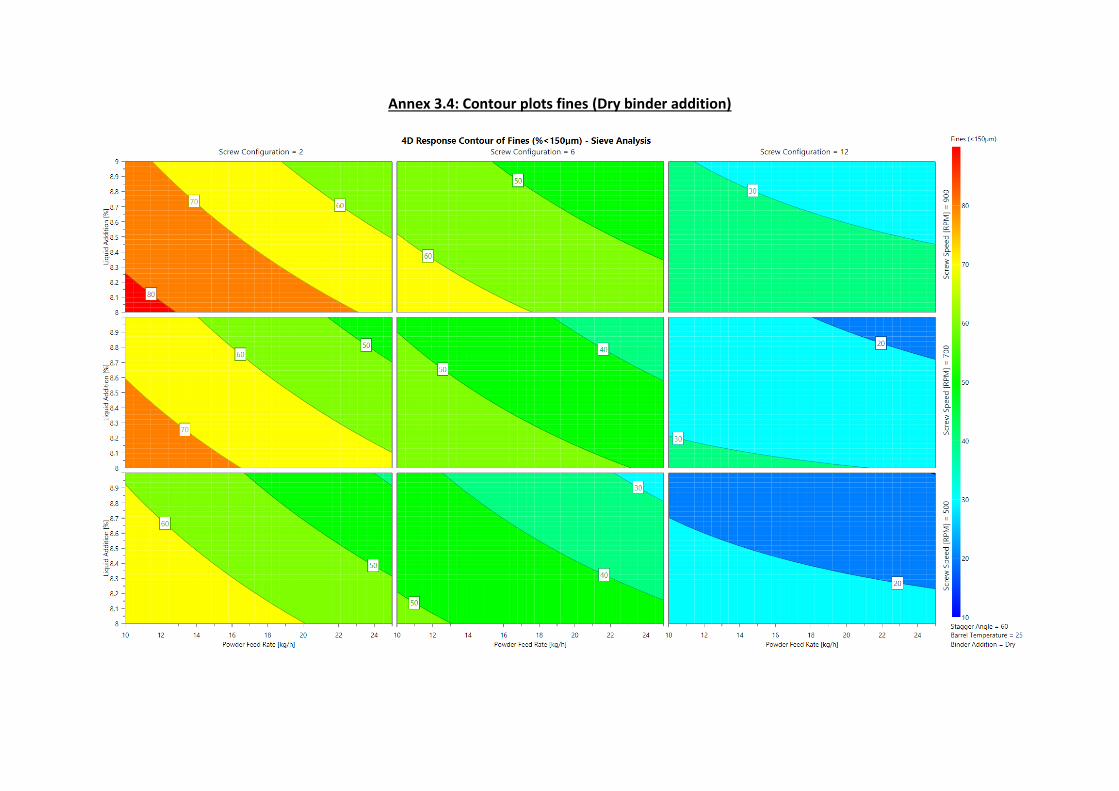
Annex 3.4: Contour plots fines (Dry binder addition)
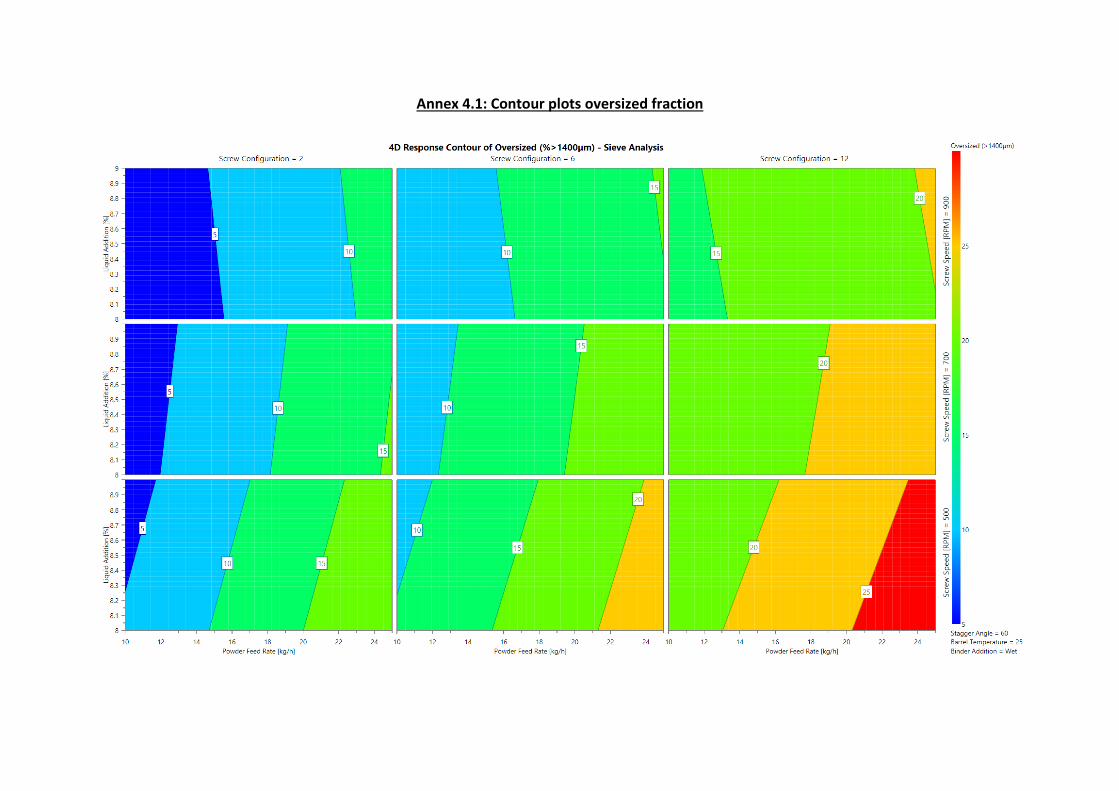
Annex 4.1: Contour plots oversized fraction
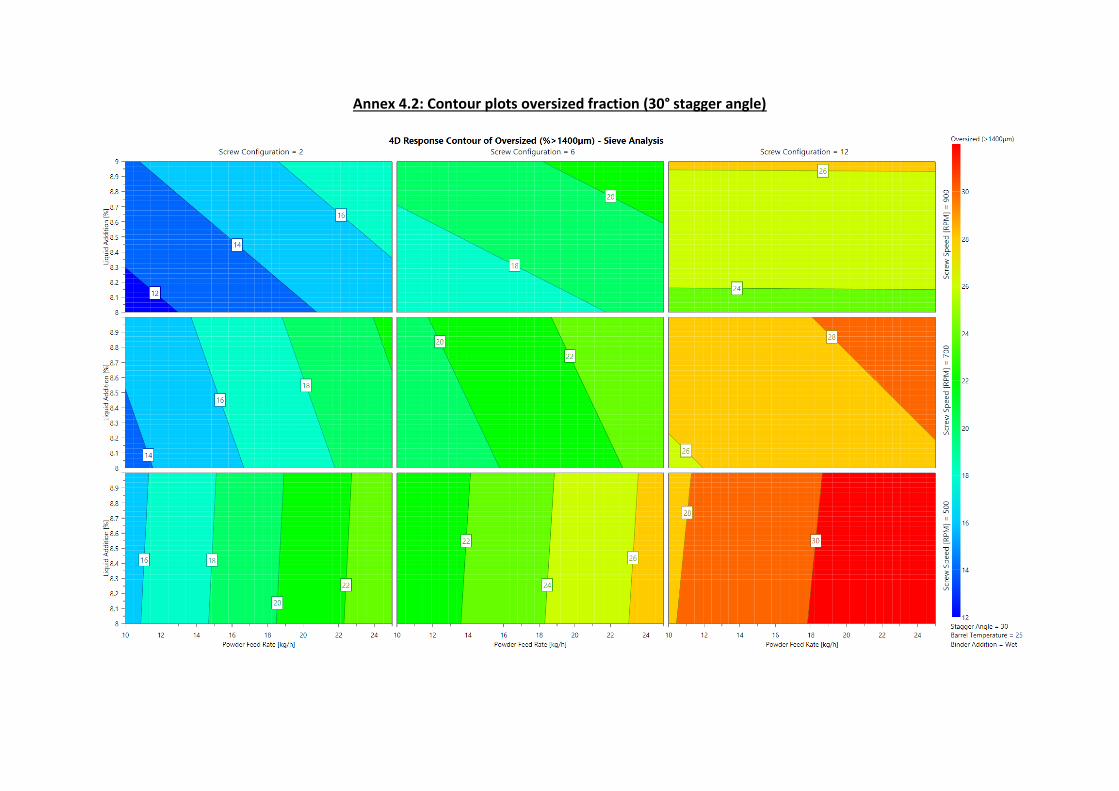
Annex 4.2: Contour plots oversized fraction (30° stagger angle)
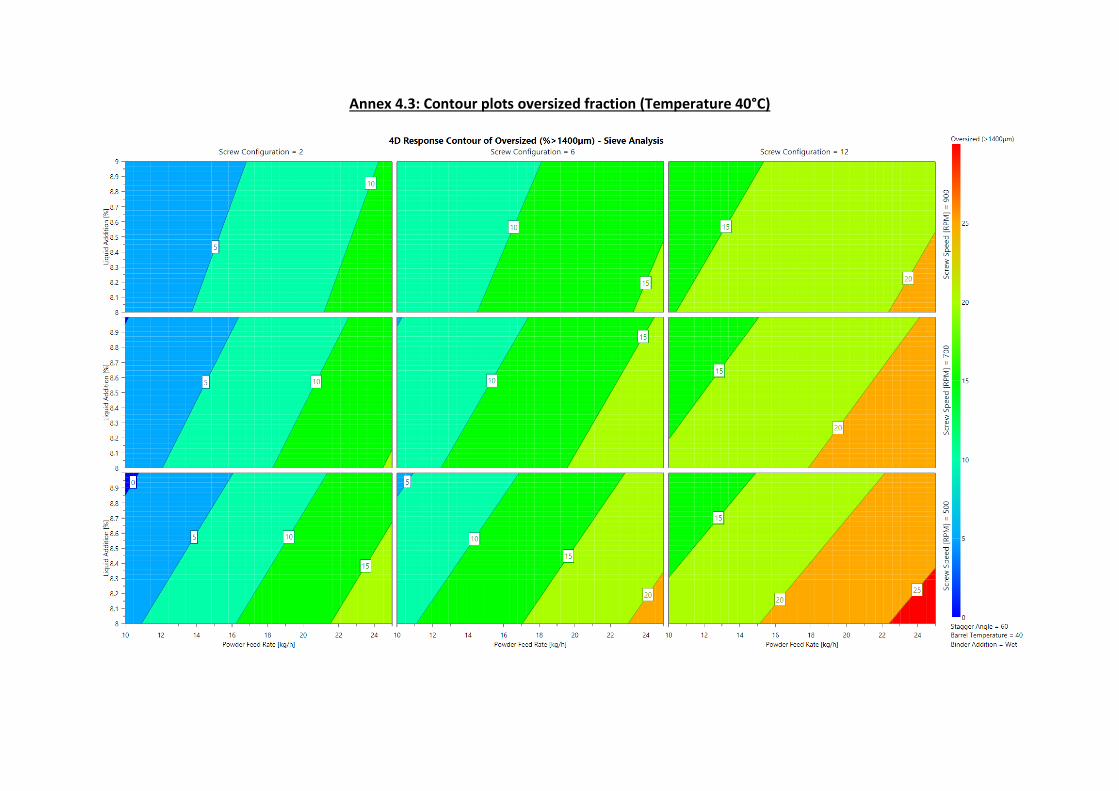
Annex 4.3: Contour plots oversized fraction (Temperature 40°C)
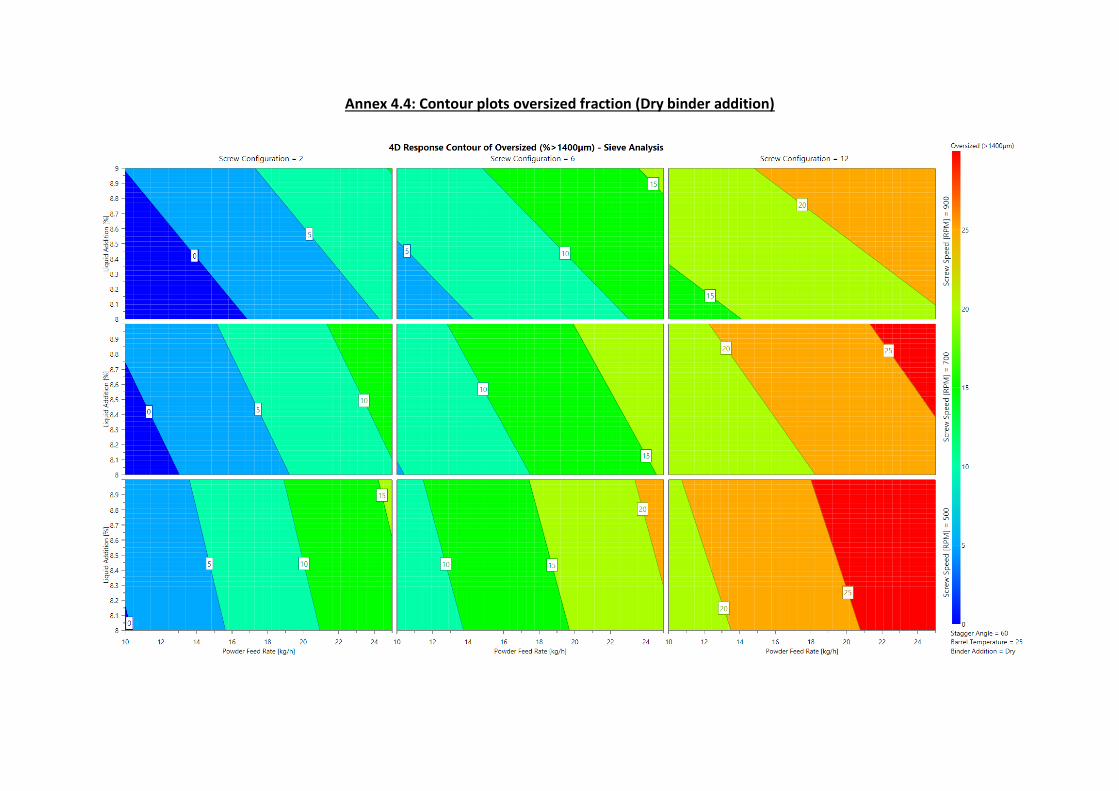
Annex 4.4: Contour plots oversized fraction (Dry binder addition)
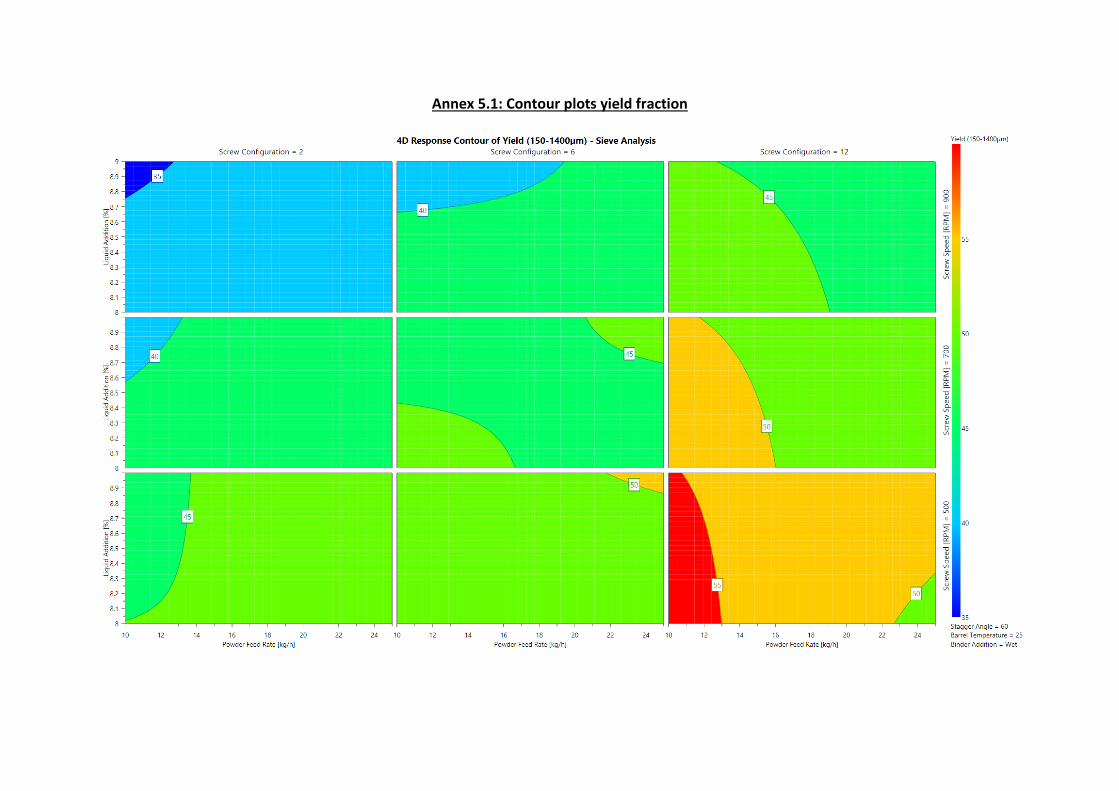
Annex 5.1: Contour plots yield fraction
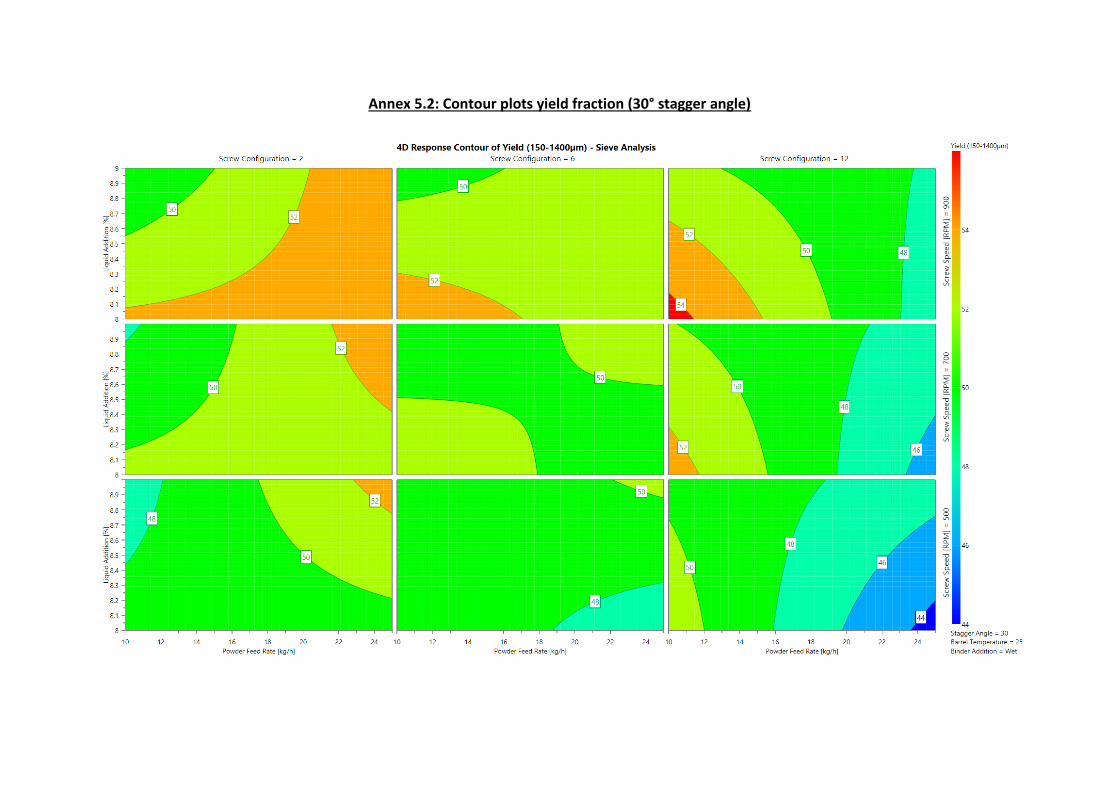
Annex 5.2: Contour plots yield fraction (30° stagger angle)
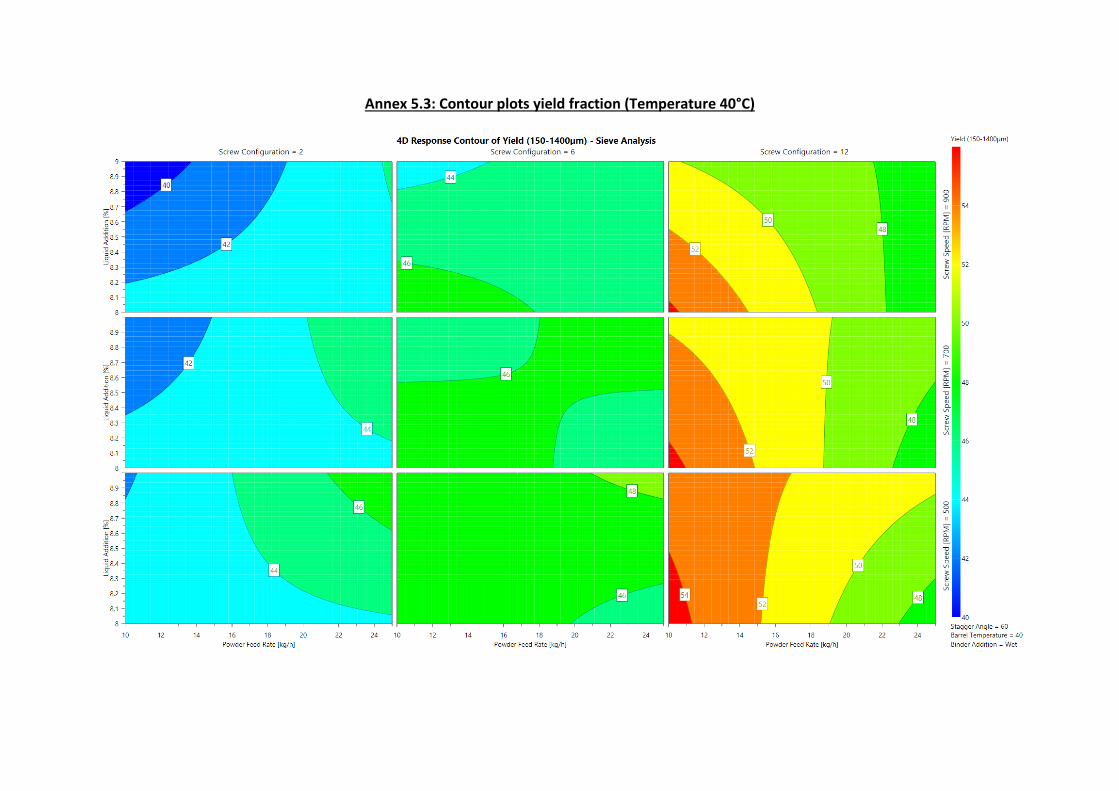
Annex 5.3: Contour plots yield fraction (Temperature 40°C)
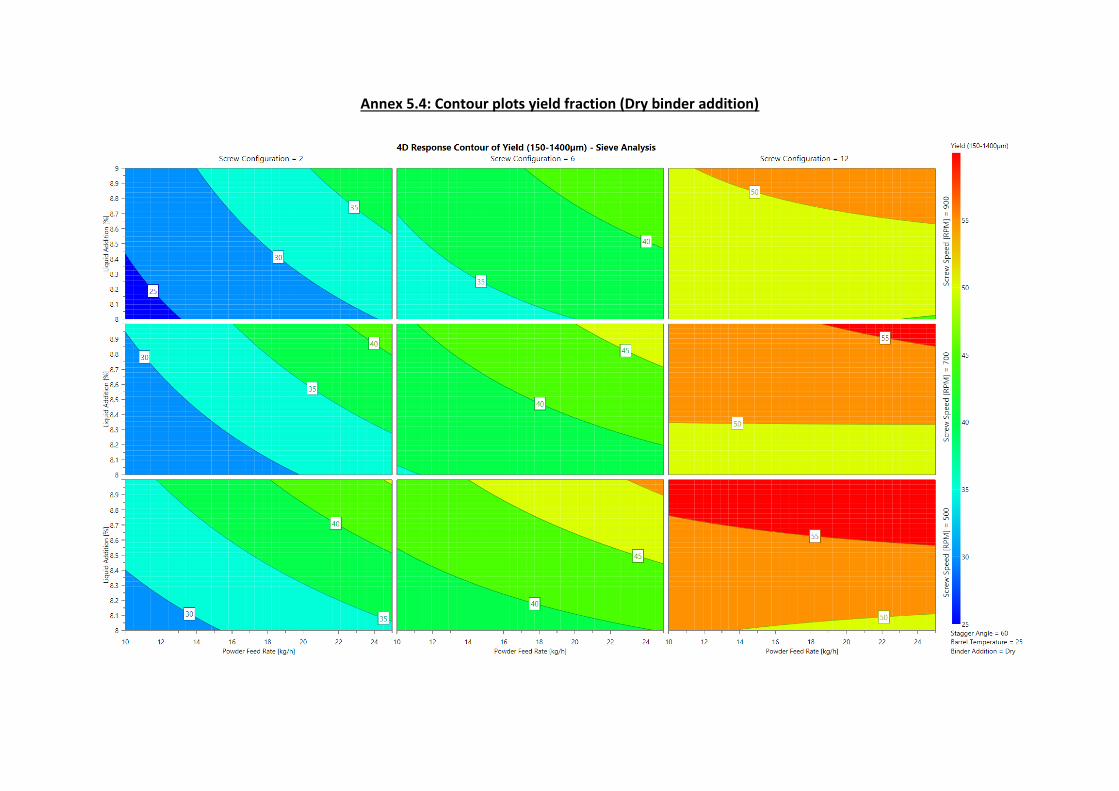
Annex 5.4: Contour plots yield fraction (Dry binder addition)
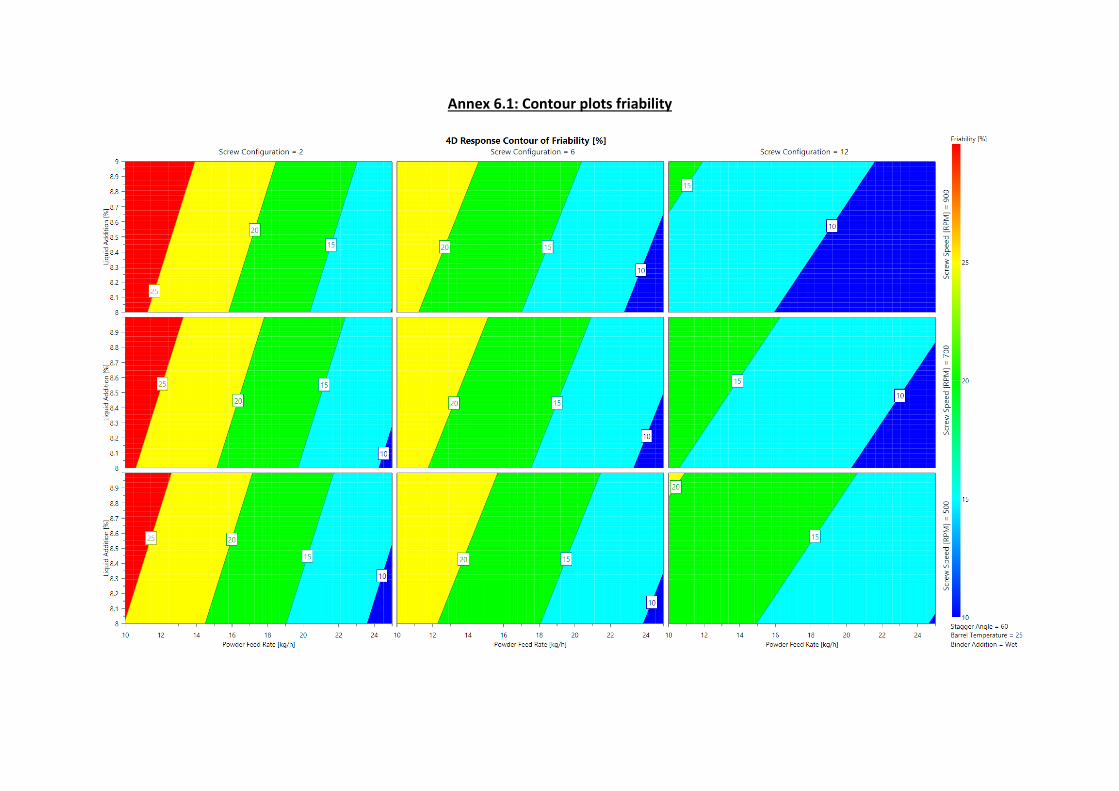
Annex 6.1: Contour plots friability
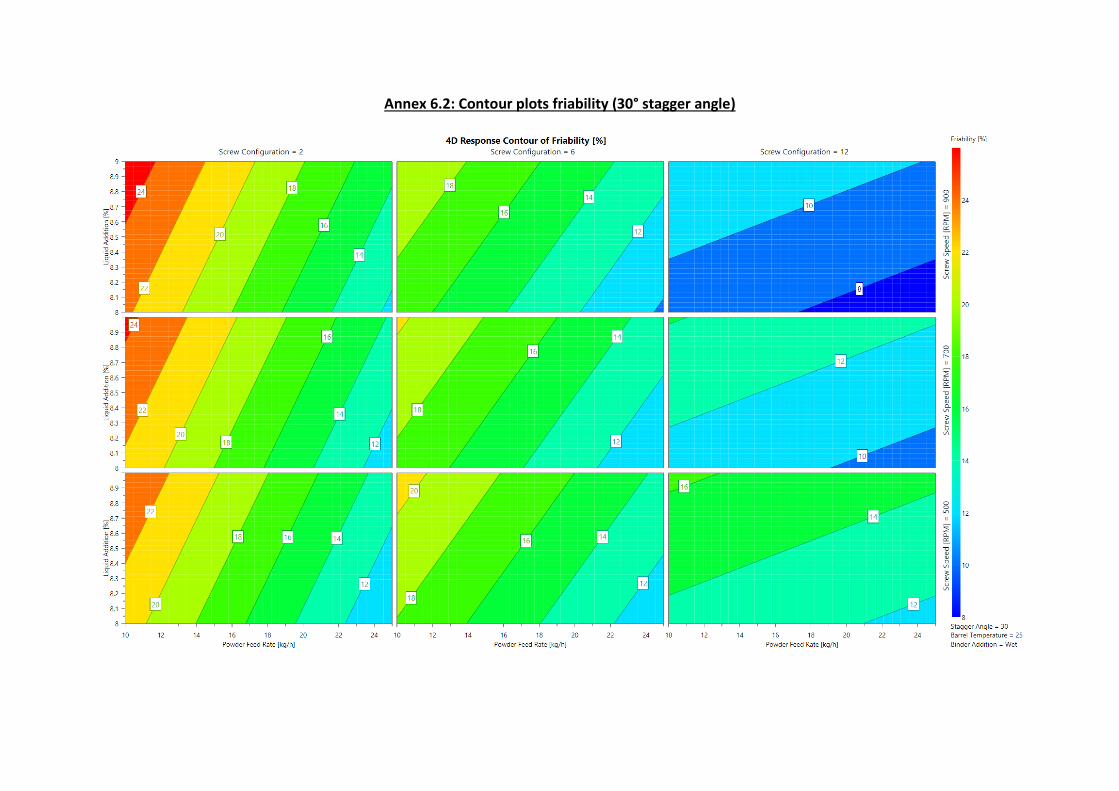
Annex 6.2: Contour plots friability (30° stagger angle)
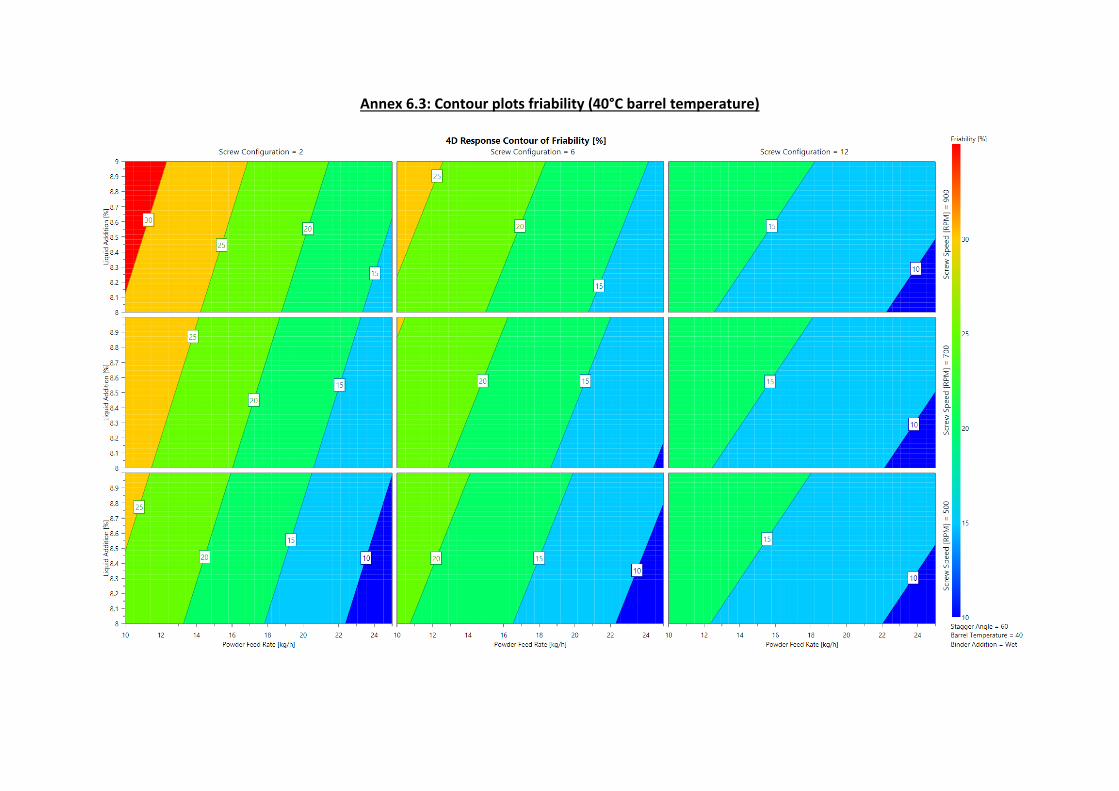
Annex 6.3: Contour plots friability (40°C barrel temperature)
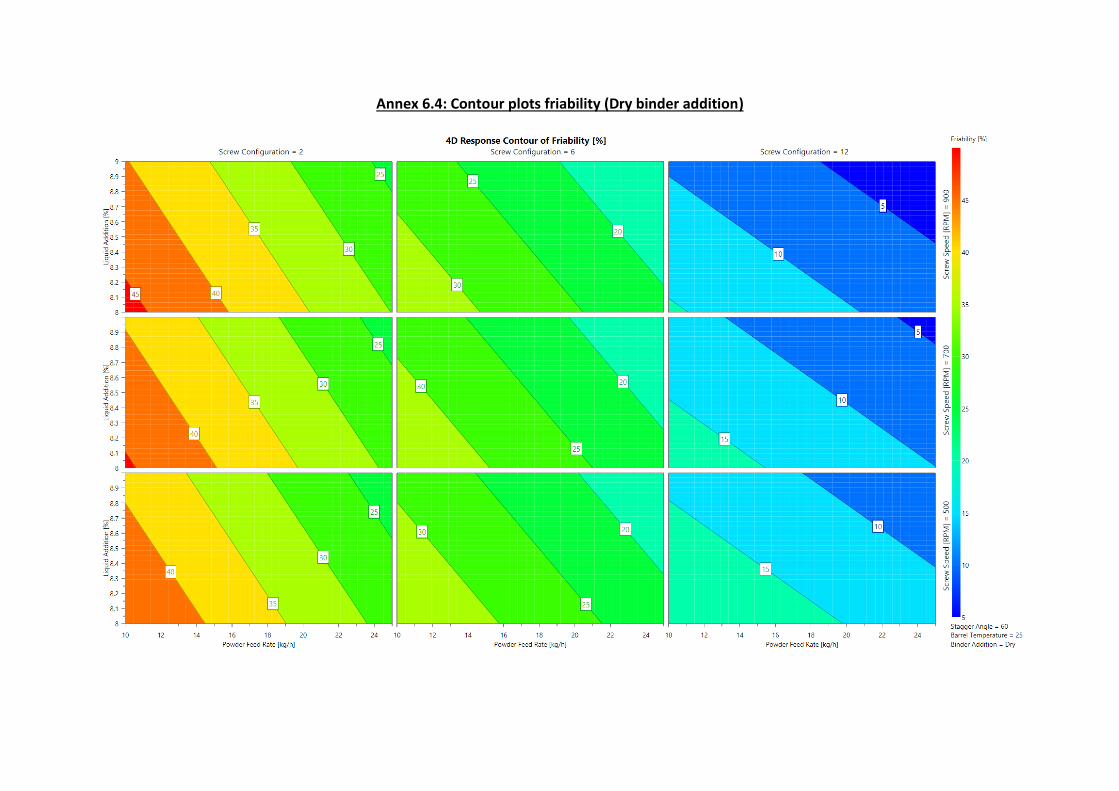
Annex 6.4: Contour plots friability (Dry binder addition)
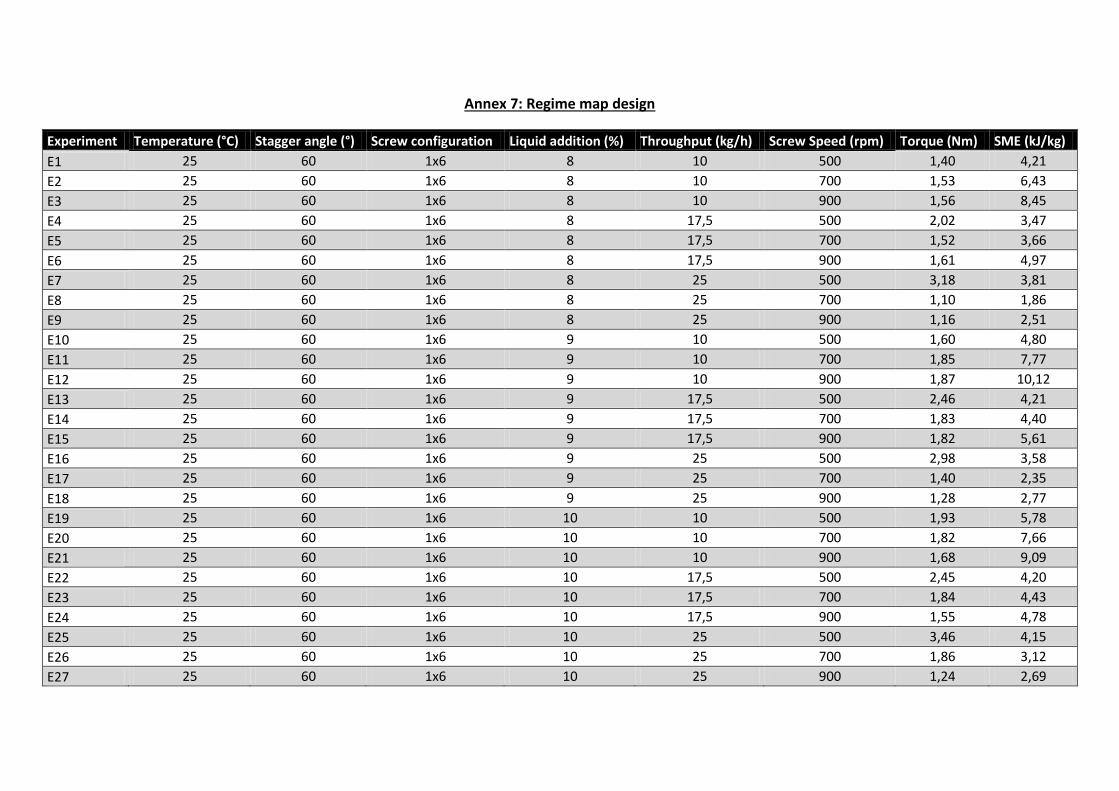
Annex 7: Regime map design
Experiment Temperature (°C) Stagger angle (°) Screw configuration Liquid addition (%) Throughput (kg/h) Screw Speed (rpm) Torque (Nm) SME (kJ/kg)
E1 25 60 1x6 8 10 500 1,40 4,21
E2 25 60 1x6 8 10 700 1,53 6,43
E3 25 60 1x6 8 10 900 1,56 8,45
E4 25 60 1x6 8 17,5 500 2,02 3,47
E5 25 60 1x6 8 17,5 700 1,52 3,66
E6 25 60 1x6 8 17,5 900 1,61 4,97
E7 25 60 1x6 8 25 500 3,18 3,81
E8 25 60 1x6 8 25 700 1,10 1,86
E9 25 60 1x6 8 25 900 1,16 2,51
E10 25 60 1x6 9 10 500 1,60 4,80
E11 25 60 1x6 9 10 700 1,85 7,77
E12 25 60 1x6 9 10 900 1,87 10,12
E13 25 60 1x6 9 17,5 500 2,46 4,21
E14 25 60 1x6 9 17,5 700 1,83 4,40
E15 25 60 1x6 9 17,5 900 1,82 5,61
E16 25 60 1x6 9 25 500 2,98 3,58
E17 25 60 1x6 9 25 700 1,40 2,35
E18 25 60 1x6 9 25 900 1,28 2,77
E19 25 60 1x6 10 10 500 1,93 5,78
E20 25 60 1x6 10 10 700 1,82 7,66
E21 25 60 1x6 10 10 900 1,68 9,09
E22 25 60 1x6 10 17,5 500 2,45 4,20
E23 25 60 1x6 10 17,5 700 1,84 4,43
E24 25 60 1x6 10 17,5 900 1,55 4,78
E25 25 60 1x6 10 25 500 3,46 4,15
E26 25 60 1x6 10 25 700 1,86 3,12
E27 25 60 1x6 10 25 900 1,24 2,69
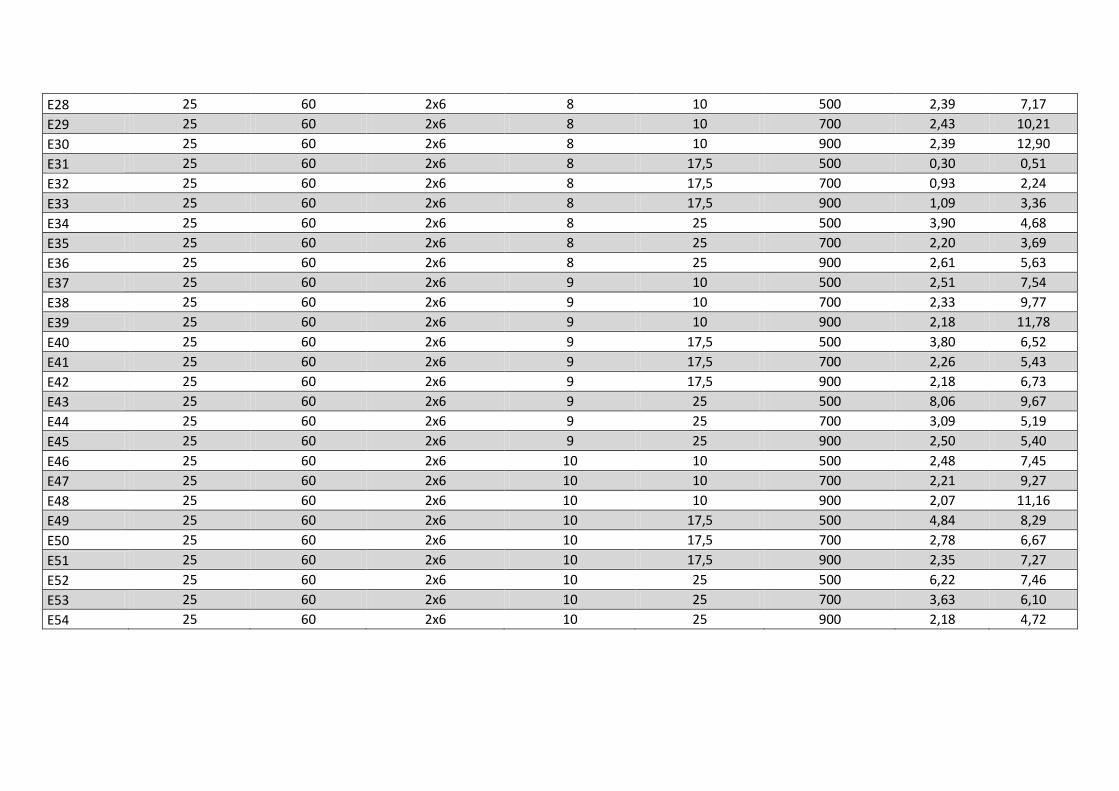
E28 25 60 2x6 8 10 500 2,39 7,17
E29 25 60 2x6 8 10 700 2,43 10,21
E30 25 60 2x6 8 10 900 2,39 12,90
E31 25 60 2x6 8 17,5 500 0,30 0,51
E32 25 60 2x6 8 17,5 700 0,93 2,24
E33 25 60 2x6 8 17,5 900 1,09 3,36
E34 25 60 2x6 8 25 500 3,90 4,68
E35 25 60 2x6 8 25 700 2,20 3,69
E36 25 60 2x6 8 25 900 2,61 5,63
E37 25 60 2x6 9 10 500 2,51 7,54
E38 25 60 2x6 9 10 700 2,33 9,77
E39 25 60 2x6 9 10 900 2,18 11,78
E40 25 60 2x6 9 17,5 500 3,80 6,52
E41 25 60 2x6 9 17,5 700 2,26 5,43
E42 25 60 2x6 9 17,5 900 2,18 6,73
E43 25 60 2x6 9 25 500 8,06 9,67
E44 25 60 2x6 9 25 700 3,09 5,19
E45 25 60 2x6 9 25 900 2,50 5,40
E46 25 60 2x6 10 10 500 2,48 7,45
E47 25 60 2x6 10 10 700 2,21 9,27
E48 25 60 2x6 10 10 900 2,07 11,16
E49 25 60 2x6 10 17,5 500 4,84 8,29
E50 25 60 2x6 10 17,5 700 2,78 6,67
E51 25 60 2x6 10 17,5 900 2,35 7,27
E52 25 60 2x6 10 25 500 6,22 7,46
E53 25 60 2x6 10 25 700 3,63 6,10
E54 25 60 2x6 10 25 900 2,18 4,72
Annex 8: Report Francqui-Lectures Prof. Daan J.A. Crommelin
Inaugural lecture (March 7)
The impact of the pharmaceutical sciences on health care starts from discovery of
new medicines and goes all the way over manufacturing processes to distribution and
support in community pharmacies. From a historical point of view the pharmaceutical
sciences sometimes had a bad connotation. Treatments with unclear working mechanisms,
side effects and ineffective drugs are some of the numerous examples that can be
mentioned. Over the years great leaps forward were made. The understanding of working
mechanisms, drug dosage, quality control etc. all improved dramatically the last decades.
One of the newest challenges are personalized medicines, given the fact that all people are
genetically unique medicines will have a different effect on all of them. Also molecular
biology, information towards patients, pharmaceutical business models and lots of other
fields are challenges for the future. In my opinion interdisciplinary fields of work (like the
Google smart contact lenses for glucose levels), product knowledge both in the industry and
community pharmacies and follow-up of patients are only some of the fields in which young
pharmacists can and should play an important role in the future.
Biotech takes over (March 10)
More and more newly approved medicines are developed on a biotechnological
basis. Most of them are relatively big proteins which causes significant problems concerning
the quality of those products. A key aspect in quality control is the process itself (Quality by
Design) which should be controlled perfectly, this is one of the big challenges in upscaling of
this type of products. The bioavailability of biologicals also has to be studied further,
although these drugs are designed to interact with certain specific receptors or endogenous
compounds, some of them still show side effects.
The generic paradigm revisited (March 10)
In the same way that generic medicines are copies of original medicines we could say
that biosimilars are copies of biological medicines. However some remarks should be made.
Generic medicines are in fact the same as the reference product, biosimilars can differ in the
raw material due to slightly different processes, although the clinical effect should be the
same as the reference product. Even over time the process of a certain product can be
changed without changing the label of the product. Keeping this in mind we can distinguish
biosimilars (which have, as the name suggests, similar effects as the reference product) and
bioquistionables which show deviating clinical results compared with the reference product.
It is the role of the industrial pharmacists and regulatory bodies to keep these in control.
Drug targeting (April 7)
Several techniques have been developed to target drugs such as use of liposomes,
polymers and antibodies in combination with nanomedicines but no big breakthroughs yet.
These passive drug targeting strategies look promising in theory but practical use shows
multiple obstacles such as drug release in the wrong places and problems in penetrations of
the blood vessels. Active targeting relies on methods like triggered drug release and local
drug delivery. Triggered drug release for example can be used to treat tumors by distributing
the drug delivery system in big parts of the body and releasing the drug only in the right
place with radiation. Other new techniques are based on nanotechnology and gene therapy.
Problem is that on this moment Glybera is the only medicine in this class that has been
approved. The most popular technique in this field is the artificial virus approach which uses
empty viral envelopes to target certain tissues and fill it with "healing" DNA for the clinical
effect. A further developed method is stem cell therapy, this is used on a relatively large
scale in for example the treatment of leukaemia. Again the challenge is the quality control of
these product.
Animal experiments (April 7)
Due to ethical problems, animal experiments are questioned more and more. These
are popular for toxicity testing, although more and more studies show big differences in the
biological profile of animals and humans. Even the predictive value of monkey studies can be
questioned. A big problem is the inbred of animals which leads to small genetical
differences, humans on the other hand show great interindividual differences. We should
probably try to limit animal experiments but the search for high quality alternatives is
necessary.