development of regional … of regional sustainability indicators udin hasanudin laboratory of...
TRANSCRIPT

DEVELOPMENT OF REGIONAL
SUSTAINABILITY INDICATORS
Udin Hasanudin
Laboratory of Agro-industrial Waste Management, Faculty of Agriculture,
University of Lampung, Jl. Sumantri Brojonegoro No. 1, Bandar Lampung-35145,
INDONESIA Email: [email protected]
The 3rd “Bioenergy Week”
Indonesia, Medan 25-29 May 2015
ERIA WG on “Sustainability Assessment of Biomass Utilisation in East Asia”

Economic Performance
Triple Bottom Lines for Sustainable Development
Social Performance
GHG Emission
Reduction
(Global & Regional
Environment…)
by LCA
Domestic/Regional Gap
Abatement
Food vs. Energy (Culture,
Education, Poverty, Health, Peace,
Human Rights ..)
by HDI or similar index
Economic
Sustainability,
Energy Security
(Economic
Development)
by Gross Value
Added
2
WG Concept on Sustainability
Environmental Performance
3
List of WG Member
Masayuki SAGISAKA: ERIA Working Group Leader, National Institute of Advanced
Industrial Science and Technology (AIST), Japan
Yuki KUDOH: ERIA Working Group Acting Leader, National Institute of Advanced Industrial
Science and Technology (AIST), Japan
Sau Soon CHEN: Environment & Bioprocess Technology Centre, SIRIM Berhad, Malaysia
Jessie C. ELAURIA: Institute of Agricultural Engineering, College of Engineering and Agro-
Industrial Technology, University of the Philippines Los Baños, the Philippines
Shabbir H. GHEEWALA: The Joint Graduate School of Energy and Environment (JGSEE),
King Mongkut’s University of Technology Thonburi, Thailand
Udin HASANUDIN: Department of Agroindustrial Technology, University of Lampung,
Indonesia
Jane ROMERO: Transport and Climate Finance Specialist (Consultant), Asian Development
Bank
Yucho SADAMICHI: National Institute of Advanced Industrial Science and Technology
(AIST), Japan
Vinod K. SHARMA: Indira Gandhi Institute of Development Research (IGIDR), India
Xunpeng SHI: Energy Studies Institute, National University of Singapore

RENEWABLE ENERGY INNITIATIVES Case Study: Ethanol from Cassava

5

Sustainability Assessment Methodology
(ERIA Project Report No.8-2)
• Environmental Impact
- Life Cycle Greenhouse Gas Emissions
• Economic Impact
- Total Value Added
• Social Impact
- HDI (Human Development Index)
6

What the Environmental Impact ?
LC GHG emission was used to
evaluate the environmental impact
of bioethanol production from
cassava
7

Boundary system
8
Ethanol Factory
Contract Farmers
Non-Contract Farmers
CO2
Thin slop
Wet cake, Cassava peels,
Soil
Bioethanol
Composting
Markets(Chemicals industries, biofuel etc)
Biogas plant
CO2
CO2
CO2
Power Generator
Coals
CO2

Schematic diagram of ethanol production
9
Pre
TreatmentFeed Stock Liquefaction
Distillation
WWTP
Decantation
Slurry MashSaccharification
&
Fermentation
Product
Thin
Slops
Wet Cake
Treated
Effluent
Cassava
Biogas to
Boiler
Molasses
PW Steam PW
Steam

Material balance on cassava-based ethanol
production (based on a ha of plantation)
10
1.37 Ton
Coal

CO2 emission from ethanol production
11 *) every ha produces 4.394 KL ethanol **) neutral
***) Low Heating Value of Ethanol = 21.1 MJ/L
www.bioenergy.ornl.gov/papers/misc/energy_conv.html)
Process Source Unit* Quantity CO2e Emission
(kg/L Ethanol) (kg/GJ)***
Plantation Diesel fuel L/ha 13.7 0.0097 0.4596
Urea Kg/ha 192 0.0406 1.9241
NPK (15-15-15) Kg/ha 185.5 0.0173 0.8220
Herbicides Kg/ha 1.747 0.0069 0.3249
Transportation Diesel fuel L/ton 0.41
L/KL ethanol 2.658 0.0082 0.3920
Processing
Electricity
(Coal) MW 5.7
MWh/KL ethanol 0.760 0.7858 37.2436
CO2 M3/day 0** 0
Waste treatment CH4, flared M3/day 0** 0
CO2 M3/day 0** 0
CH4, vented M3/day 18957.9 1.5798 74.8732
CH4, utilized M3/day 18957.9 -0.3379 -16.0121
TOTAL CO2 EMISSION (SCENARIO 1, FLARED) 0.8686 41.1663
TOTAL CO2 EMISSION (SCENARIO 2, VENTED) 2.4484 116.0395
TOTAL CO2 EMISSION (SCENARIO 3, UTILIZED) 0.5308 25.1542

GHG Emission from Ethanol Production
compare to Gasoline (kg CO2e/GJ)
12
25.15
41.17
116.04
84.80
0.00 30.00 60.00 90.00 120.00 150.00
Utilized
Flared
Vented
GHGgasoline
Utilized
Flared
Vented
GHGgasoline
(kg CO2e/GJ)

GHG Emission from Ethanol Production
compare to Gasoline (%)
13
30
49
137
100
0 25 50 75 100 125 150
Utilized
Flared
Vented
GHGgasoline Utilized
Flared
Vented
GHGgasoline
( % )

What the Economic Impact ?
TVA was used to evaluate the
economic impact of bioethanol
production from cassava
14

Costs and returns in cassava production for partnership farmers
15
ITEMS QUANTITY/
HA
COST/UNIT
(in IDR)
COST/HA
(in IDR)
MATERIAL
Seed, Fertilizer,
compost, and
Chemicals
1 package 1,187,950 1,187,950
LABOR
Weeding, Fertilizing,
and Other
Maintenance
28.05 days 25,000 701,328
MACHINE Land preparation 1 package 294,498 294,498
Harvesting and
Transportation 28,49 ton 69,545 1,981,338
OVERHEAD Tax, and rent,
refraction 2,135,280
TOTAL COST 6,300,394
TOTAL fresh cassava root 28,490kg 439.25 12,536,138
NET PROFIT 6,235,744

Costs and returns in cassava production for non-partnership farmers
16
ITEMS QUANTITY/
HA
COST/UNIT
(in IDR)
COST/HA
(in IDR)
MATERIAL
Seed, Fertilizer,
compost, and
Chemicals
1 package 1,027,716 1,027,716
LABOR
Weeding, Fertilizing,
and Other
Maintenance
37.31 days 25,000 832,811
MACHINE Land preparation 1 package 478,172 478,172
Harvesting and
Transportation 24,67 ton 74,897 1,847,716
OVERHEAD Tax, and rent,
refraction 1,823,862
TOTAL COST 6,110,277
TOTAL fresh cassava root 24,670 kg 449.75 11,106,193
NET PROFIT 4,995,916
17
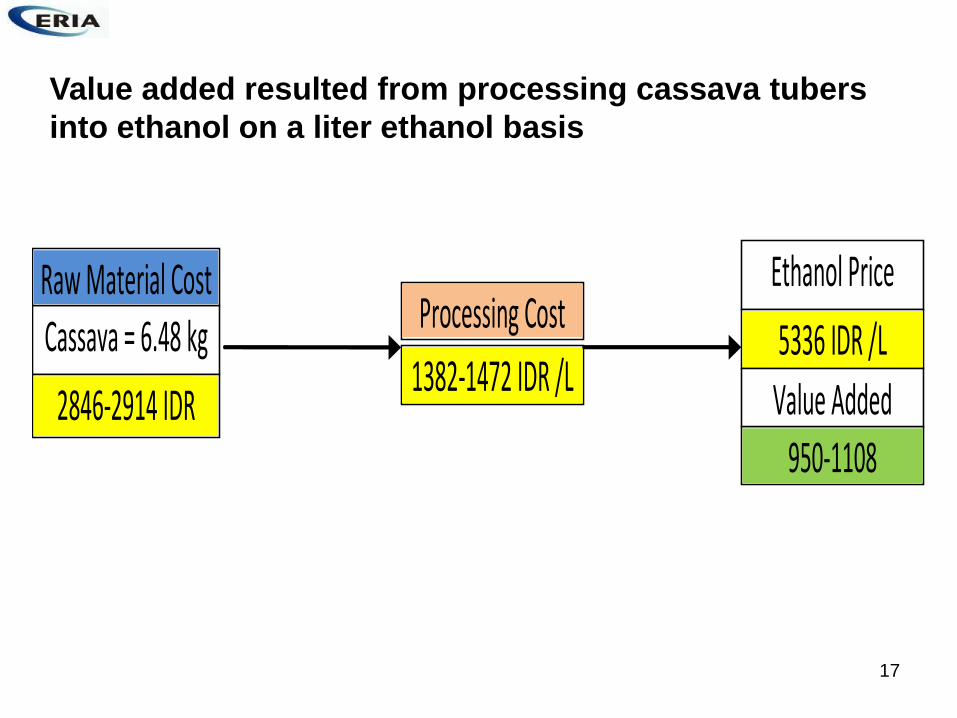
Cassava = 6.48 kg
2846-2914 IDR
Ethanol Price
5336 IDR /L
950-1108
1382-1472 IDR /L
Raw Material Cost Processing Cost
Value Added
Value added resulted from processing cassava tubers
into ethanol on a liter ethanol basis
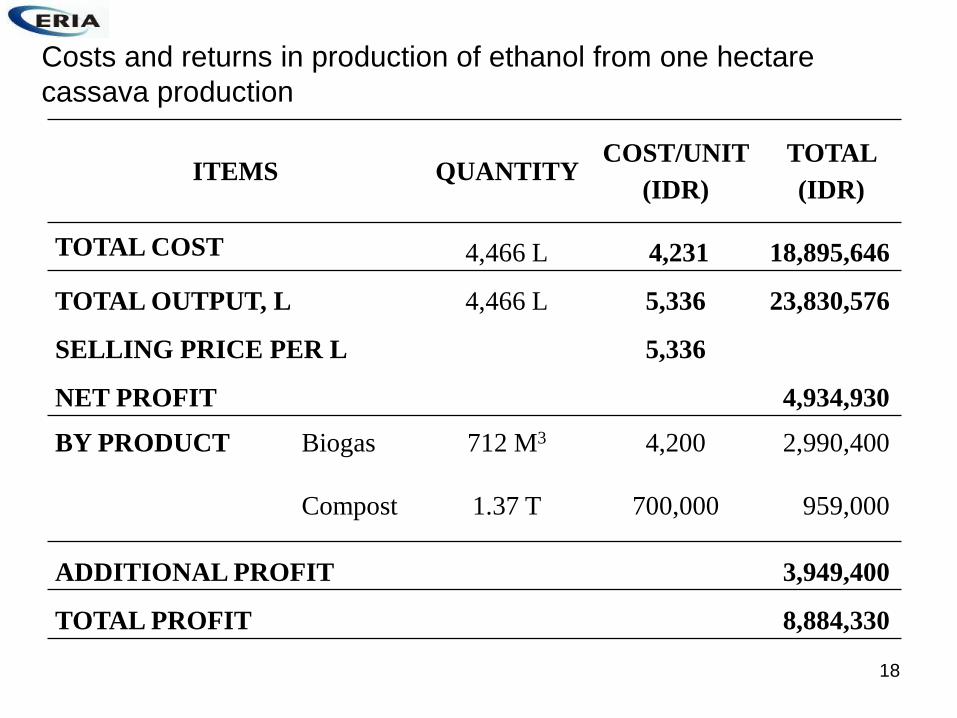
Costs and returns in production of ethanol from one hectare
cassava production
18
ITEMS QUANTITY COST/UNIT
(IDR)
TOTAL
(IDR)
TOTAL COST 4,466 L 4,231 18,895,646
TOTAL OUTPUT, L 4,466 L 5,336 23,830,576
SELLING PRICE PER L 5,336
NET PROFIT 4,934,930
BY PRODUCT Biogas 712 M3 4,200 2,990,400
Compost 1.37 T 700,000 959,000
ADDITIONAL PROFIT 3,949,400
TOTAL PROFIT 8,884,330

What the Social Impact ?
HDI was used to evaluate the
Social impact of bioethanol
production from cassava
19

Social parameters on cassava production
in North Lampung
20
Item Quantity
Number of population 7820
Number of family (NF) 1872
Average age of dead people (year) 61.89
Income per capita (US$/year) 635.8
Number of illiterate people 102
Number of preschool pupils 34
Number of basic school student 397
Number of junior high student 470
Number of senior high student 333
Number of diploma student 19
Number of university student 0

21
Life Expectation Index = 2585
2589.61
= 0.6148
Number of adult people = 2 * NF + HS + DS + US = 2(1872) + 333 + 19 + 0 = 4096
ALR (Adult Literacy Rate) = 100 % * (4096 – 102)/4096 = 97.5 %
ALI (Adult Literacy Index) = 0100
0
ALR =
0100
05.97
= 0.975
GEI = 7820
)1933347039734( = 0.16
EI (Education Index) = 2/3 (ALI) + 1/3 (GEI) = 2/3 (0.975) + 1/3 (0.16) = 0.70
GDP Index = )100log()40000log(
)100log()log(
pcGDP=
)100log()40000log(
)100log()8.635log(
= 0.309
HDI = (LEI + EI + GDPI)/3 = (0.615 + 0.700 + 0.309)/3 = 0.542

Is it Sustainable ?
Integration of environmental.
Economic, and Social Indicator ??
22

Sustainability indicators of cassava
production and utilization for ethanol 23
Current Conditions
• Cassava tubers price increased to
IDR.1000-1300/kg
• Ethanol factory changed cassava to
molases as feed stock
• Ethanol production from cassava was
terminated
24

Highlight of Pilot Project
Sustainability Assessment Methodology
(ERIA Project Report No.8-2)
• Indicators like GHG savings, TVA, and HDI change,
are suitable for assessing the environmental,
economic, and social sustainability, respectively, of
biomass energy utilization
• Utilization of all by-products in the production of
biomass energy is very much recommended to
increase the sustainability of soil, reduce
environmental impact, and optimize social and
ecoconomic benefits
25

Improvement of Methodology
26
• Environmental indicator chosen for this phase of the
project cover only GHG savings which is very relevant to
current concerns on biofuels. Evaluation of GHG
emissions for global warming using LCA is appropriate
but other emission and impacts can also be considered,
such as: land use change, soil quality, eutrophication,
ecotoxicity, human toxicity, and resource depletion affect.
• Other Economic indicators are also considered, such as
NP, TVA, and Forex saving.
• Although HDI is widely applied to evaluate social impact
at state, regional or national level, there is need to
develop an index or some indices that can better
represent social impact at the community level.
27
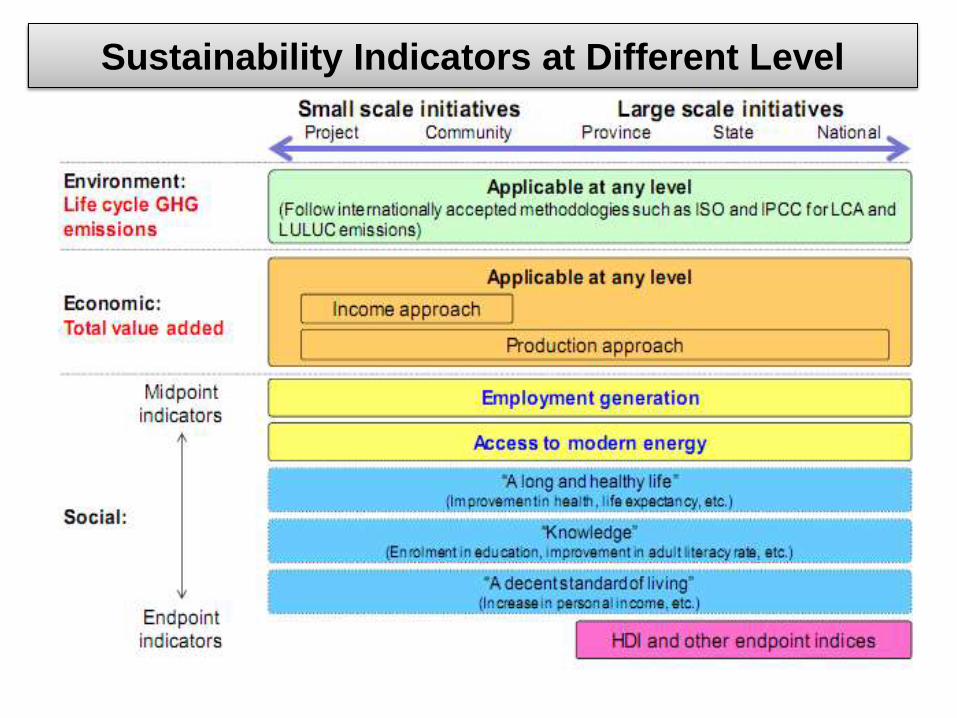
Sustainability Indicators at Different Level

Latest Methodology Improvement
28
• In environmental aspects, one of important
environmental sustainability elements, namely,
soil sustainability, was introduced and possibility
of its quantification was explored using microbial
quinone profiles method.
• In economic aspects, the production and income
approaches were discussed because different
approaches could apply to different scale of
biomass projects.
• In social aspects, “Employment” and “Access to
Modern Bioenergy,” were considered.

RENEWABLE ENERGY INNITIATIVES Case Study: Palm Biomass Power Plant, Bangka Island
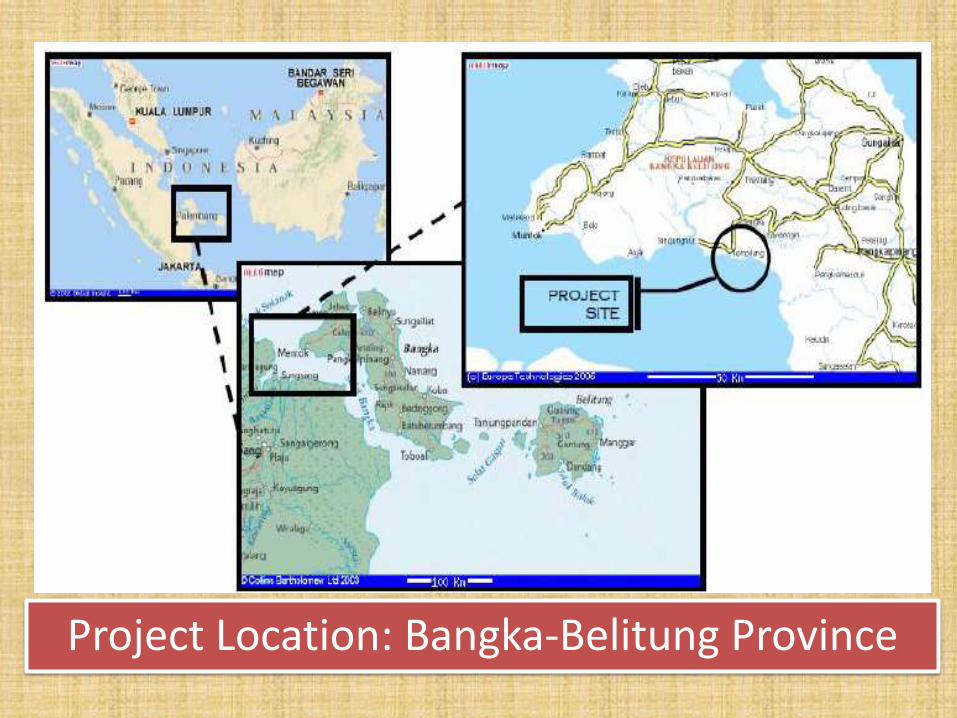
Project Location: Bangka-Belitung Province

• Number of household in Bangka-Belitung province is 324,600 households. Electrification ratio of Bangka-Belitung is 73.94% which mean 26.6% or 86,344 households are still not electrified.
• Recently the total installed capacity is 89.46 MW with rated power (available power) of 51.34 MW and peak load 129.48 MW (PLN, 2013).
• Fuel consumption for electricity production by HSD in Bangka-Belitung is 193,281.40 kL, so that the estimated fuel consumption per household is 179,393.7 kL. Cost of fuel (HSD) is IDR 9,046.09/Liter, so that the cost of fuel totally in Bangka-Belitung is IDR 1.75 Trillion (PLN, 2012).
• Babel Province, there is no oil or coal as fossil energy sources. it’s necessary to use energy from renewable sources that come from the surrounding area.
Electricity Condition in Bangka-Belitung Province

Solid Waste
Solid
Decanter
(3.5%
optional)
EFB Fiber Shell Boiler Ash
POME
Waste generated from Palm Oil Mill
20-23 % 12-13 % 5-6 % 0.5-0.6 % 77-84 %

Steam electricity
Boiler
FFB
Biomass utilization in palm oil mill
Fiber
Kernel shell
EFB
Boiler ash

ENERGY SOURCES IN PALM OIL MILL
Steam
0.075 kL /hr
9.4 ton/hr
Electricity
FFB
WATER
FUEL
PALM OIL MILL
40 ton/hr
60 ton/hr
720 kWh/hr
Crude Palm oil
EFB
Kernel
Fiber
Shell
POME
1.7 ton/hr
4.8 ton/hr
2.8 ton/hr
33.7 ton/hr
5.6 ton/hr
85-100%
50-55%
24 ton/hr
Diesel oil
8,7 ton/hr

Palm Biomass Power Plant

Purpose and General Description of Project Activity
• The project was intended to provide a new supply of electricity by using local fuel from the palm oil industries in the island.
• The project contributes to Indonesia’s sustainable development by providing green electricity in isolated areas such as Bangka and therefore promoting the growth of the local economy by improving access to electricity.
• The electricity was utilized for palm oil mill and the excess electricity was sold to PT. PLN.

• Feed stock composition:
Fiber= 20%; Palm Shell= 20%; EFB= 60%
• Feed stock supply from their own mill
(PT. Sawindo Kencana) only contribute up to 20%. The other 80% should be import from other palm oil mill.

Several problems related to un-successful the palm biomass-based power plant
• The availability of feedstock for boilers (80% from Kalimantan) – NOT LOCAL AVAILABLE.
• The price of feedstock (PKS and EFB) rising continuously (more than IDR 400/kg). Based on this price, FIT is not attractive – GOVERNMENT CONCERN
• Inconsistent quality of feedstock – TECH CONCERN • Feedstock preparation consumes high parasitic (own use) power. • Higher maintenance compared to coal power plant. • Lack of understanding by local authority for PPA process and
other required licenses – GOVERNMENT CONCERN • This system removed the opportunity of oil palm plantation to
have mulch or compost from EFB – COMPETITION WITH OTHER PUSPOSES

RENEWABLE ENERGY INNITIATIVES Case Study: Self Suficience Energy Village Based on Biogas

Location:
Haurngombong Village, Sub distric Pamulihan, Sumedang, West Jawa
UTILIZATION OF COW MANURE
FOR BIOGAS ENERGY

Village: Haurngombong
Sub. District: Pamulihan
District: Sumedang
Bandung
DKI Jakarta
Sumedang

karangnangka
cipareuag
rancamekar
cikondang
warung
kawat
simpang
cirengganis
cigembong
sekepaku
lapang
pangaseran
Overview:
Sub District
Village
District
Province
Area
Population
Elevation
Av. Temperature
Distant from
Bandung
: Pamulihan
: Haurngombong
: Sumedang
: West Jawa
: 219 Ha
: 4,865
: 750-850 ASL
: 22 oC
: 31 km
The Potential of Village
1. Center of milk production and
other agricutural products (Sweet
Potato, Fresh Fish, etc.)
2. Center of organic compost
production
Haurngombong Village

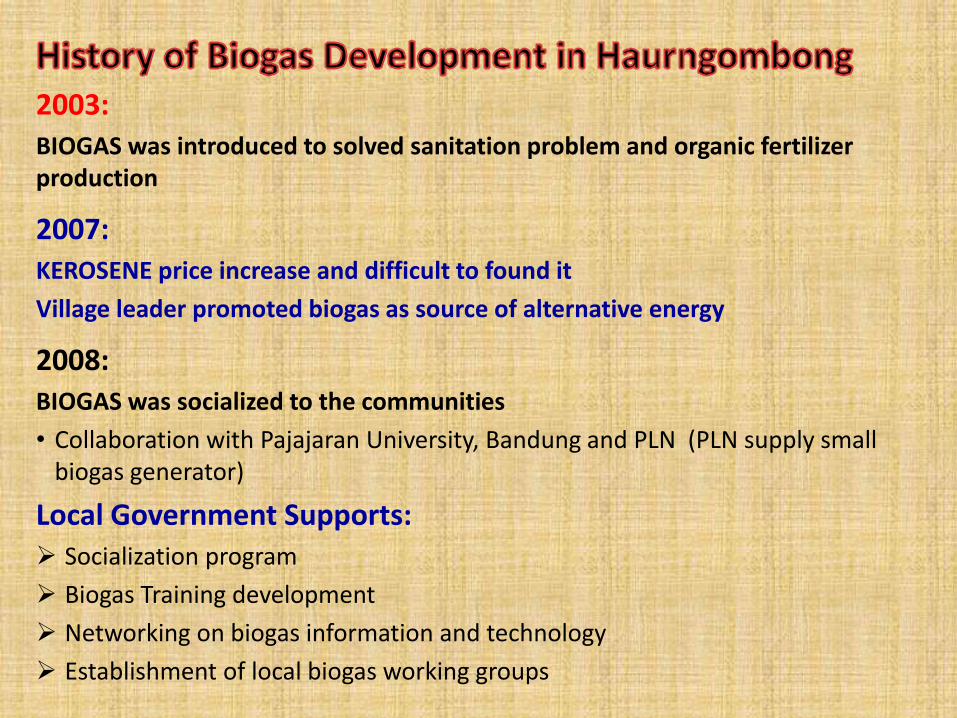
2003: BIOGAS was introduced to solved sanitation problem and organic fertilizer production
2007: KEROSENE price increase and difficult to found it
Village leader promoted biogas as source of alternative energy
2008: BIOGAS was socialized to the communities
• Collaboration with Pajajaran University, Bandung and PLN (PLN supply small biogas generator)
Local Government Supports: Socialization program
Biogas Training development
Networking on biogas information and technology
Establishment of local biogas working groups

Manure Inlet Biogas Reactor
Gas Holder Safety
valve
Stove Electricity Grass Cutting machine
Feed
Cow
Grass

Current Situation:
• The populations of cow in Haurngombong village are about 1300 and all of their manure was utilized for generate biogas in about 300 digester
• Biogas was utilized for cooking energy (more than 700 HH) for free
• Utilization for electricity and fuel of grass cutting machine was not working well due to corrosion.
• Haurngombong village prodused about 1,950 m3 of biogas per day which is equivalent with 897 kg of LPG or 1,209 litre of kerosene, or 6,825 kg of fire wood per day.
• The utilization of biogas for cooking reduced GHGs emission about 835.7 kg of methane or about 17,550 kg CO2e per day.

Biogas digester installed in Haurngombong village
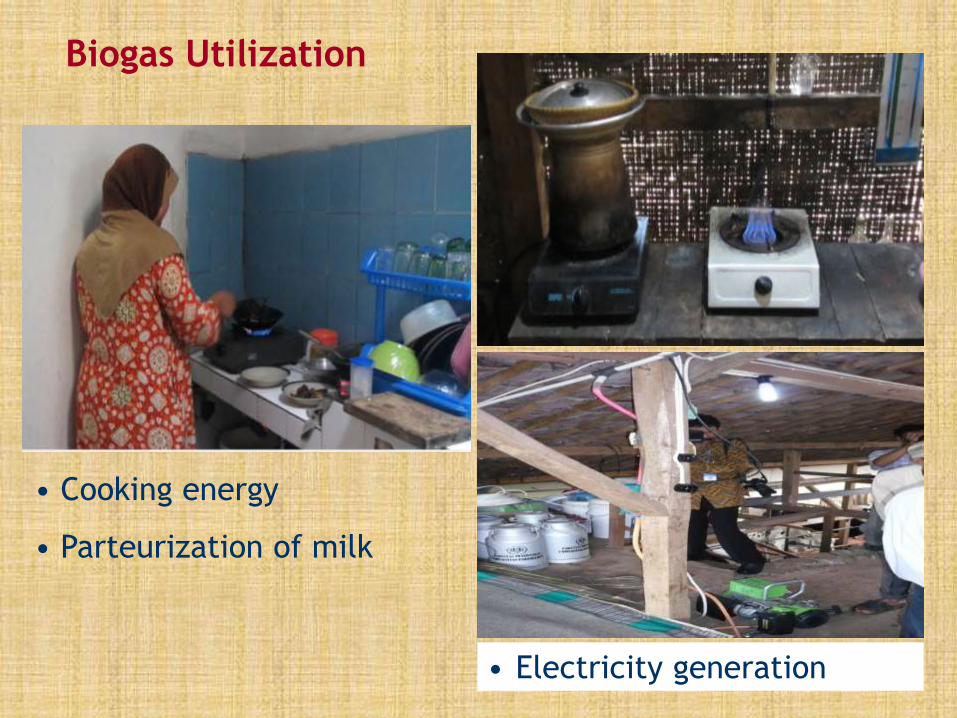
Biogas Utilization
• Cooking energy
• Parteurization of milk
• Electricity generation


Lessons learned from Self Suficience Energy Village Based on Biogas
• Haurngombong village is one of the Self Sufficiency Energy villages that successfully to utilize cow manure for renewable energy and solve sanitation problems in dairy cow farm village.
• Biogas project in Haurngombong village was successfully to educate people in the community level to contribute on renewable energy development and provide access on clean and cheap energy.
• The biogas project was also successfully to provide additional economic activities in the village, such as: compost and liquid fertilizer production, and some of the citizen can works also as biogas technician in the village so that it becomes a new source of livelihood for many villagers.
• The commitment of village leader give important contribution to make this program successfully.
Summary
• Renewable Energy should be develop based on local potential and problems/need in their community.
• Participation and supports of steakholders (community, government, university, and private company) are very important to secure the sustainability of the project.

Thank you for your kind attention