development proposal of 9 st marys street, …
TRANSCRIPT
DEVELOPMENT PROPOSAL OF
9 ST MARYS STREET, ANNAPOLIS MARYLAND
by
Jonathan Bullock
A practicum thesis submitted to Johns Hopkins University in conformity with
the requirements for the degree of Master of Science in Real Estate
Baltimore, Maryland
August, 2010
(notice of copyright is optional)
© 2010 Jonathan Bullock
All Rights Reserved
2
Table of Contents
Executive Summary ........................................................................................................................ 4
Market Analysis ............................................................................................................................... 5
Annapolis Overview ................................................................................................................... 6
Demographics ............................................................................................................................. 7
Employment ................................................................................................................................ 8
Site Analysis..................................................................................................................................... 8
Land Use Regulation ................................................................................................................ 10
Historic District ......................................................................................................................... 11
Building Design ............................................................................................................................. 12
Development Budget ................................................................................................................. 13
Debt Financing........................................................................................................................... 15
Feasibility and Valuation Analysis ................................................................................................ 16
Multi-Family Apartment ........................................................................................................... 17
Office ........................................................................................................................................ 19
Retail ......................................................................................................................................... 22
Mix Use: Retail & Office .......................................................................................................... 24
Feasibility & Valuation Summary ............................................................................................ 27
Mixed-Use Development Plan ....................................................................................................... 28
Ground Floor Retail .................................................................................................................. 28
Offices Suites ............................................................................................................................. 32
Entitlements ............................................................................................................................... 33
Mixed-Use Financial Analysis ...................................................................................................... 35
3
Development Budget ................................................................................................................ 36
Debt Financing .......................................................................................................................... 36
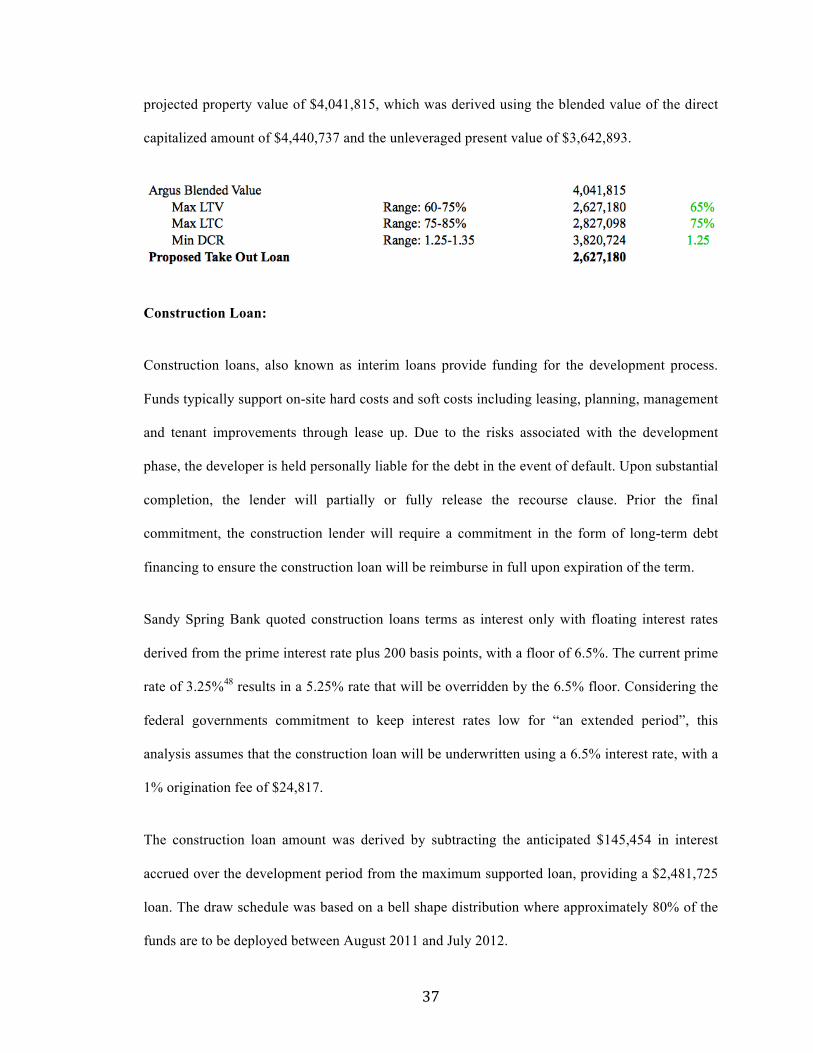
Construction Loan ................................................................................................................ 37
Permanent Loan ................................................................................................................... 38
Initial Equity Requirements & Returns ..................................................................................... 38
Rehabilitation Tax Credit .......................................................................................................... 39
Ground Lease ............................................................................................................................ 40
Profitability Analysis ................................................................................................................. 42
Equity Distribution .................................................................................................................... 43
Sensitivity Analysis ................................................................................................................... 44
Development Schedule................................................................................................................... 45
Conclusion...................................................................................................................................... 47
References ..................................................................................................................................... 48
Appendices .................................................................................................................................... 51
4
Executive Summary:
This proposal analyzes and supports the valuation, feasibility, and development opportunity of
9 St. Marys Street, located in Annapolis Maryland. The proposal begins with a broad market
analysis that identifies the prominent trends and drivers that exist in the Annapolis market area.
Next the analysis will drill down on the subject site through a site analysis followed by an
overview of the land use regulation and the associated challenges that encumber the property.
Incorporating the indentified zoning limitations, the proposed site and building design will then
be evaluated followed by the establishment of the proposed development budget.
The second part of the analysis derives the highest and best use for the site through a detailed
valuation of apartments, office, retail, and a mixed-use product with ground floor retail and
second floor office suites. Current market information was utilized from market reports and
comparable properties in the area and modeled using Argus DCF Valuation. James Graaskamps
single financial feasibility analysis will then be used to derive the use that yields the highest
supported property value.
The final section will entail a detailed analysis of the proposed end use, identifying the targeted
market the use looks to fill, followed by a comprehensive analysis of the various challenges as
well as feasible solutions to mitigate the risks. A detailed financial analysis will then test various
debt and equity structures providing viable alternative solutions including ground leases,
incorporation of rehabilitation tax credits, and the benefit of pursuing a public-private partnership
with the city. The end product will portray a distinctive sense of place that will compliment the
surrounding uses and act as a catalyst in pursuing the city’s goals of rebranding the city dock
5
area1. The space will offer unique features that accentuate the architectural craftsmanship that
inspired the design.
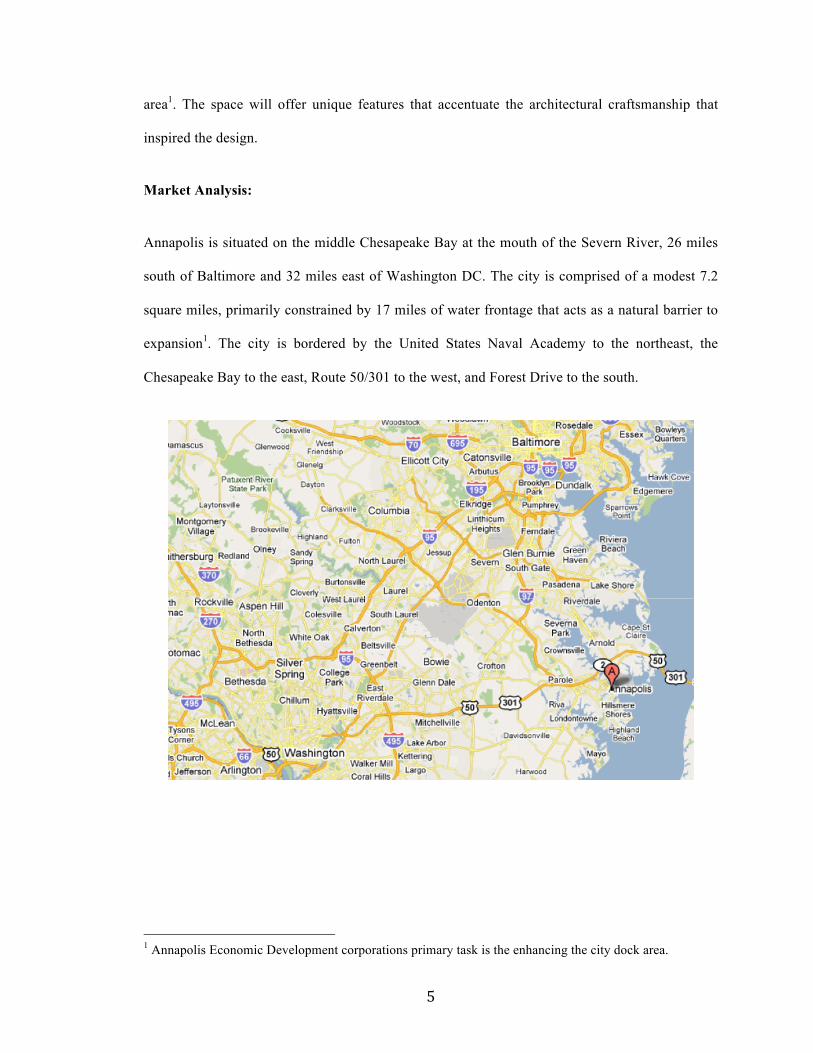
Market Analysis:
Annapolis is situated on the middle Chesapeake Bay at the mouth of the Severn River, 26 miles
south of Baltimore and 32 miles east of Washington DC. The city is comprised of a modest 7.2
square miles, primarily constrained by 17 miles of water frontage that acts as a natural barrier to
expansion1. The city is bordered by the United States Naval Academy to the northeast, the
Chesapeake Bay to the east, Route 50/301 to the west, and Forest Drive to the south.
1 Annapolis Economic Development corporations primary task is the enhancing the city dock area.
6
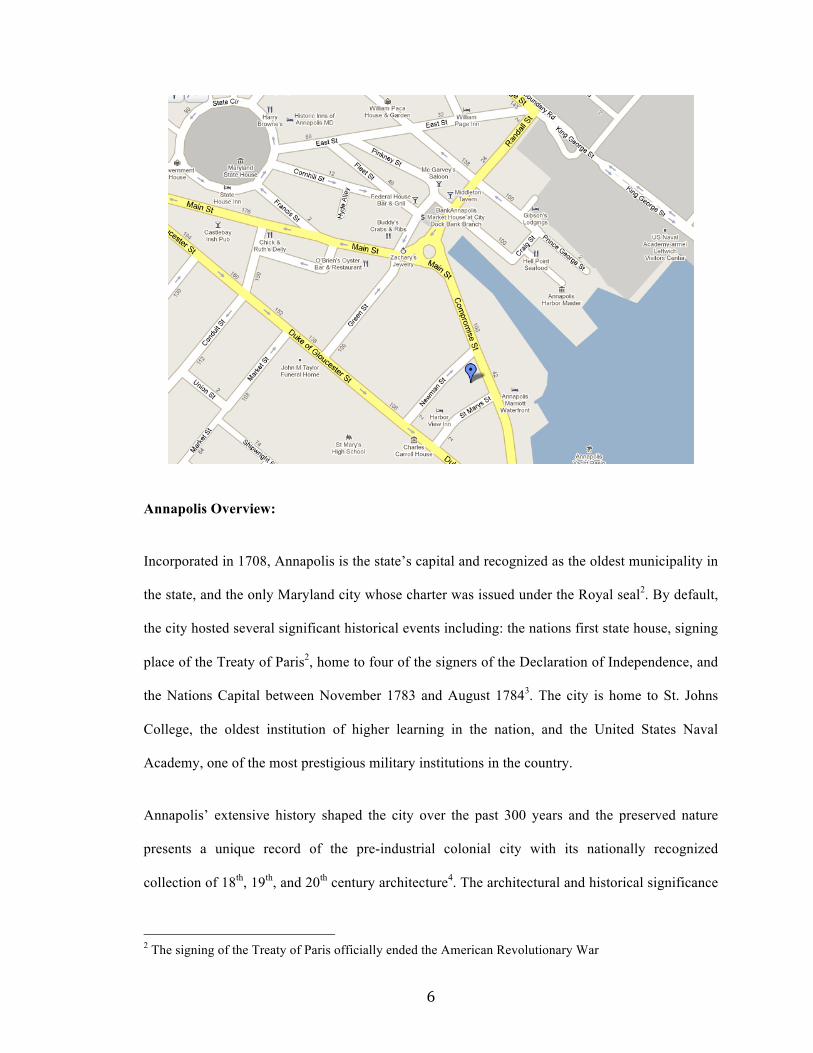
Annapolis Overview:
Incorporated in 1708, Annapolis is the state’s capital and recognized as the oldest municipality in
the state, and the only Maryland city whose charter was issued under the Royal seal2. By default,
the city hosted several significant historical events including: the nations first state house, signing
place of the Treaty of Paris2, home to four of the signers of the Declaration of Independence, and
the Nations Capital between November 1783 and August 17843. The city is home to St. Johns
College, the oldest institution of higher learning in the nation, and the United States Naval
Academy, one of the most prestigious military institutions in the country.
Annapolis’ extensive history shaped the city over the past 300 years and the preserved nature
presents a unique record of the pre-industrial colonial city with its nationally recognized
collection of 18th, 19th, and 20th century architecture4. The architectural and historical significance
2 The signing of the Treaty of Paris officially ended the American Revolutionary War
7
led to its designation as a National and Historic Landmark District in 19655. Additionally,
Annapolis’ Main Street was designated by the state’s Main Street Maryland Program, one that
selects communities that have committed to improve economy, appearance, and image of
traditional downtown business districts. In 2008, the American Planning Association named
Annapolis’ Main Street as one of the Ten Great Streets in America6. With such deep historical
roots, the ongoing preservation of a national treasure is essential to ensure the character of the
city is passed on to future generations and will prove to play a significant role in structuring this
proposal.
Demographics:
The 2000 census provided that Annapolis consisted of 35,838 residents, not including the
approximated 4,300 Naval Academy residents or the estimated 700 student that attend St. Johns
College. Policy Map estimated population of 36,711 as of 2009 and projects 37,222 residents in
2014, resulting in an estimated 1.39% growth rate. The population correlates into a total of
15,888 households bearing an average household size of 2.277, excluding the Naval Academy and
St Johns College residents. The estimated age distribution as of 2009 provided 13% over 65 years
of age, 63% between 18 and 64, 23% under 18, and 7% under 5 years of age8. The city’s median
household income as of 2008 was $72,173, 2.4% above the state’ median income of $70,482 and
38% above the national average of $52,1759.
Employment:
The presence of the state capital and Anne Arundel County seat provides a strong contingency of
government employees. Additionally, the city’s estimated 4.5 million visitors annually translates
into employment demand in the tourism and maritime industries10. A 2009 Claritas estimate
8
provides that the top five employment centers represents 53% of the employment in the City, and
include:
1) Health Care and Social Assistance 11.26%
2) Educational Service 11.19%
3) Retail Trade 10.72%
4) Accommodation and Food Service 9.94%
5) Professional, Scientific, & Technical Services 9.89%
The relatively educated population with 38.7% of citizens holding a bachelor’s degree or higher,
compares favorably to the state’s average of 31.4% and the nation’s average of 24.4%. As a result
of the presence of the Government and educated population, Annapolis faired the recent
economic recession relatively well yielding an unemployment rate of 6.2% in May 2010
compared to the state’s 7%.
Site Analysis:
The site consists of 0.6 acres bordered by St. Marys Street to the south, Compromise Street to the
east, Newman Street to the north, and historic residential single-family dwellings to the west. A
small 16-space parking lot is located in the northwest west property corner with an additional 6-
spaces along the north side of the building.
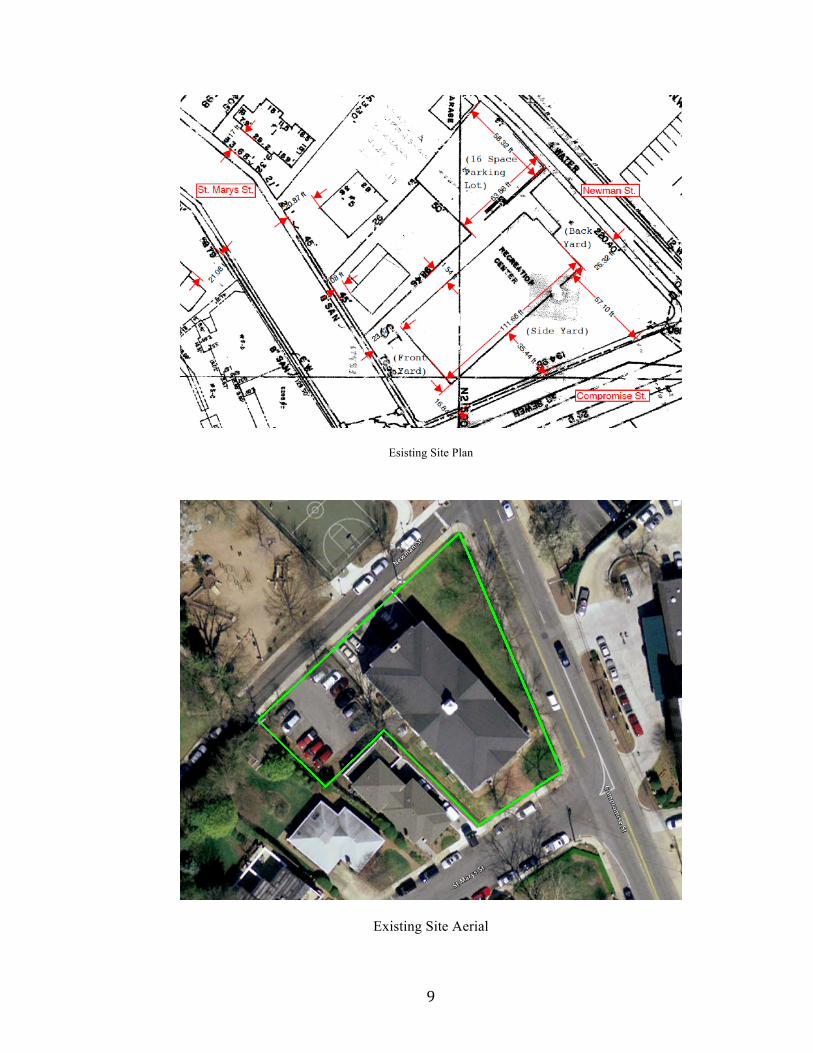
9
Esisting Site Plan
Existing Site Aerial
10
The existing 13,320 SF structure was built in 1942 as a United Services Organization (USO),
used to bridge the social gap between enlisted soldiers and the general public. Over time, the
demand for the Annapolis USO subsided, and the US Government deemed the site obsolete in
1976 when the deed was transferred fee simple, to the City of Annapolis for a sum of $1.00.
The City of Annapolis converted the two story brick building into a recreation center for the
benefit of Annapolis residents. The first floor contains low 8-foot ceilings3 and is divided into
various meeting and activity rooms, while the second floor consists of a basketball court with 19-
foot vaulted ceilings that run the length of the building. The site remained the city’s primary
recreation center for over 30 years, accumulating numerous stories of note, including the former
Annapolis Mayor Roger “Pip” Moyers role as the basketball coach.
As the community grew, the demand for recreational facilities outgrew the potential of the
downtown center. As a result, the city commissioned the construction of a larger center, with a
wider range of services. In the spring of 2010, the 80,000 SF Roger “Pip” Moyer Community
Recreation Center was opened, deeming the downtown site obsolete.
Land Use Regulation Overview:
The city’s zoning is based on Euclidean zones, where parcels are designated specific permitted
uses to ensure compatibility among neighboring properties. Euclidean zones also enable planners
to ‘guide’ future development by implementing growth initiatives into the comprehensive plan.
The city’s current comprehensive plan was adopted in October 2009 and provides valuable
insight into the city’s goals over the next 10 years. The plan is designed around three primary
principles: 1) preserving and enhancing community character, 2) maintaining a vibrant economy,
and 3) promoting ‘green’ Annapolis11.
3 Renovations in mid 1990’s reduced first floor ceilings to add stability to second floor court. Proposed plan would revert first floor to 9-foot ceilings.
11
The site is currently zoned C-1 or Conservation Residential with the goal of encouraging the
conservation of educational, cultural, and the historical character of the old city12. The uses
permitted by-right in the C-1 zone include public and private schools, single family homes,
museums, art galleries, and religious institutions. Uses subject to special exception approval
expand the options to include multi-family apartments consisting of more than six units. In order
to conform with the retail, office, and mixed use options, rezoning will be required to either C2
Conservation Business, or C2A Special Conservation Business.
Rezoning in a Euclidean zone requires the applicant to prove the property meets the change or
mistake rule. A ‘change’ means the character of the neighborhood has changed significantly since
the last comprehensive plan to justify a change in zoning. A case could be made in favor of the
subject parcel providing that a change has occurred in the immediate neighborhood since the
building was vacated. The ‘mistake’ aspect relates to parcels that were improperly zoned based
on surrounding uses. One could argue that the 2009 comprehensive plan’s proposed
“recreational” use for the site subject mistakenly depicts the best use of the property.
Historic District:
In addition to the potential requirement for rezoning, the city’s historical significance is protected
by a historic overlay. The overlay takes precedence over the regulations dictated in the general
zoning code, essentially requiring the applicant to conform to two sets of parameters. Although
the 1942 structure is not itself considered historic, “it is a contributing resource to the Annapolis
National Register Historic District and therefore undertakings are in accordance with the Historic
Preservation Commission Design Guidelines, strict interpretation”13. As a result, the permitted
density in the C1 zone of 2.0 FAR, is overridden by the overlay restricting the structure from being
razed and further providing that additions must not change the historic context of the structure.
12
The Historic Preservation Commissions Design Guidelines are based on four primary preservation
goals: 1) preserving and enhancing the city’s historic urban form, 2) preserving and enhancing
individual historic streetscapes, 3) facilitating compatible landscape and site design, and 4)
preserving and protecting historic buildings, materials, and elements14. The ordinance encourages
respectable contemporary design that follows the design principles of existing neighboring
buildings, and respects the scale, proportions, order, rhythms, and materials of the prevailing
historic context15. Perhaps most applicable to this proposal, the guidelines require that new
building or addition ‘visually relate’ to the contributing historic buildings in its immediate
neighborhood rather than buildings in the historic district in general16. Such highly defined design
standards will warrant the consultation of local architects that possess high success rates with
similar projects. Allocating additional funds to secure a highly regarded local architect will assist
in mitigating the entitlement risk, while also providing a feasible final design that maximizes
density and streamlines the historical review and permitting processes.
Building Design:
The proposed building design will take a conservative approach to ensure compliance with the
historic overlay and general zoning code. Site constraints resulting from the non-symmetrical lot
size, required setbacks, presence existing trees protected by the Historic Preservation Commission,
and the buildings orientation towards the western of the property line, all played a role in
determining permitted density. As a result, the proposal models three modest additions with the
goal of maximizing density while preserving and balancing the building from an aesthetic point
of view.
The first proposed addition will reflect a seven-foot extension to the existing gable portrayed on
the north side of the structure. The south side will mirror the two-story addition, balancing the
13
structure and resulting in a combined total of approximately 1,400 SF4. The impact on the interior
will allow common elements to be concentrated towards the north and south sides of the building,
dedicating the buildings core to the specified end use. The second proposed addition runs the
length of the Compromise Street side of the building with the intent of complimenting the
Georgian architecture, while also softening the institutional characteristics. The first component
portrays the proposed main entrance, accomplished by extending the existing gable twenty feet.
To either side, ten-foot extensions, limited to one-story5 will run the remaining length of the
structure. The ten-foot depth was limited as a result of the narrow lot conditions on the southeast
property corner, and the proximity of existing trees. The second proposed addition results in an
additional 1,600 rentable square feet to the first floor6, while drastically improving the buildings
curb appeal. From an ingress and egress point of view, the entrance on Compromise Street
provides users with an additional access point providing improved circulation throughout the
building. The proposed entrance will also minimize traffic to the current main entrance on St.
Marys Street, comprised of historic single-family homes. The proposed additions are considered
to be within the limitations dictated under the historic preservation guidelines as well as the city’s
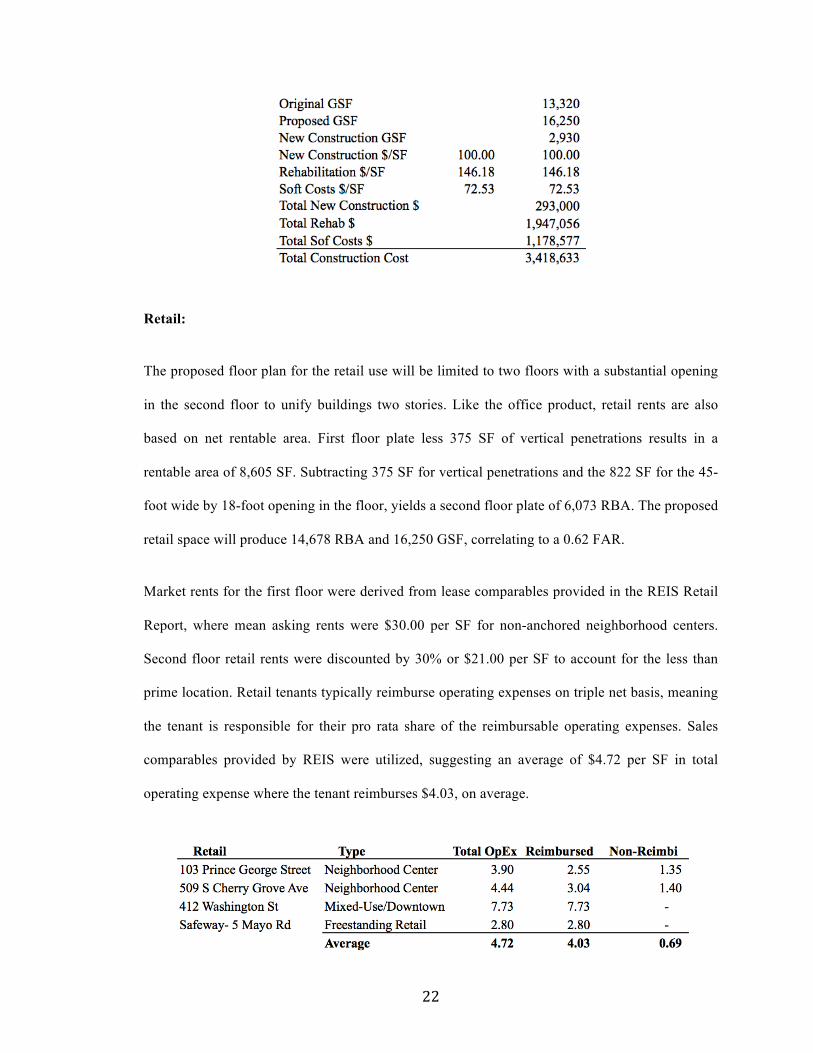
zoning regulation. As a result, the existing 13,320 GSF structure will be increased by 22% to
16,250 GSF, reflecting an increased FAR of 0.62 versus the existing 0.51. Details of calculations
are provided in Appendix A.
Development Budget:
The extent of the renovation work required to deliver the proposed end product has been derived
from take-offs of plans provided by the city, conversations with a city engineers, and a thorough
inspection of the structures exterior. Repeated requests to gain access to the building interior were
4 Range of increased PGI between $28,680 (Apt) and $46,774 (Mix-Use). 5 Original proposal to the city portrayed a two-story addition running the length of the east side. Upon review by the Historic Preservation Commission concern was raised regarding proposed additions impact in altering the buildings historical context. 6 Range of increased PGI between $32,436 (Apt) and $51,117 (Mix-Use)
14
denied by the mayor’s office. As a result, the renovation work of the existing 13,320 SF structure
has been modeled to reflect the associated construction risk and has been based on modified new
construction figures of $143 per SF17, while proposed additions will be based on $100 per SF. To
better gauge the accuracy, conversations with John Fitzgerald, Regional Director of Development
for Archon Group, provided a hard cost estimate of $100 per SF for renovations while David
Smith, Development Manager for Forest City Enterprises, estimated base building costs of $135
per SF for adaptive reuse projects.
Hard cost line items of note include a 5% allocation of the total project costs to achieve LEED
Existing Building certification, keeping in line with the comprehensive plans goal of creating a
‘green’ environment. Additional hard costs include a general conditions budget of 12%
accounting for overhead and the general contractors. A 5% contingency of hard costs acts as an
additional buffer for potential cost overruns.
Soft costs were derived from research and conversations with various industry professionals, and
resulted in an estimated $73 per SF. Line items of note include a 13% architectural fee,
corresponding with the typical range from 5-16% of total hard costs18. The premium accounts for
the anticipated elevated level of involvement required to conform with the restriction set forth in
the historic overlay zone. Engineering fees of 4.25% were averaged based on the typical range of
2.5-6% for new projects19. Similar to architectural fees, the allocation provides for the additional
services required to achieve the proposed design. Accounting for the anticipated level of
involvement with the entitlements process, conversations with Ben Wechsler20 resulted in a
$30,000 line item for a land planner. Mr. Wechsler’s expectation of local opposition in response
to the rezoning process resulted in an estimated legal fees line item of $100,000. Construction
interest was derived from the construction draw scheduled detailed in Appendix G and was based
on 6.5% interest only loan over an 18-months construction period. Real estate taxes are currently
assessed at $0.635 per $100 of the assessed value resulting in an annual tax approximately
15
$20,000. Upon endorsement by the city, lenders, and equity investors, a formal market study will
be commissioned to support of the intended use accounting for a $10,000 allocation. Lastly, a 5%
developer fee has been applied to compensate for the complexity and risk of delivering the
project.
Acquisition costs will vary based on the derived value detailed in the following section, however
the associated costs are based on constant percentages and costs per square foot. Anticipated costs
include an allocation of 2% of the land cost for closing costs, brokerage fees of 1.5%,
construction loan fees of 1%, permanent loan fees of 75bps, and an appraisal quoted at $0.10 per
SF.
Debt Financing:
Debt assumptions were provided by Sandy Spring Bank21 and represent the current environment
of the capital market. The quoted terms were based on the proposed sites details, including the
projects financials and development budget. The funding limitations are based on four primary
constraints: loan-to-value, loan-to-cost, debt service coverage ratio, and equity requirements.
Sandy Spring Bank provided that current underwriting criteria derives funding limitations based
on the least of the following:
• Maximum LTV range: 60-75%
• Maximum LTC range: 75-85%
• Minimum DCR range: 1.25-1.35
• Minimum Equity Requirement: 20% (other banks range from 10-20%)
For the purposes of this proposal we will assume a maximum loan-to-value of 65%, maximum
loan-to-cost of 80%, a minimum debt coverage ratio of 1.25, and a minimum equity requirement
of 20%.
16
Feasibility and Valuation Analysis:
The use determined to support the highest derived property value will be considered the highest
and best use supported by the current market conditions. Considering the city is not actively
marketing the property, the value was initially based on the $3,147,700 assessed value provided
by the Maryland Department of Assessment and Taxation as of July 1, 2010. This value will be
challenged using James Graaskamp’s “backdoor approach” of the Simple Financial Feasibility
Analysis (SFFA). The backdoor approach utilizes current income potential, financing
assumptions, and estimated construction costs to derive a supported property value22.
The backdoor approach starts with the anticipated rentable square feet (RBA) that is multiplied by
market supported achievable rent per RBA to derive the potential gross income. Subtracting
market vacancy allowance provides the effective gross income. Operating expenses are then
subtracted to derive an estimated net operating income (NOI). Dividing the NOI by the debt
service coverage ratio provides the maximum annual debt service. Next, the debt service, interest
rate, and amortization period are used to establish the present value. Dividing the present value by
the maximum loan-to-value establishes the total project cost. Lastly, subtracting estimated
construction costs from the total project cost results in the supported purchase price for the land
and existing structure.
To further reduce valuation risk7, each use was initially modeled in Argus to provide more
accurate projections for items such as blended rental rates, accurate rentable space, and operating
expense reimbursements. Market assumptions for multi-family and retail uses were derived
primarily from REIS reports as of March 28, 2010, and June 28, 2010 for the office product.
Costar first quarter 2010 reports were also utilized to verify market information for the retail and
office uses. Preferred primary data was derived from recent sales and lease comparables, where 7 Risk that lack of current market data exists to accurately value the project.
17
averages were utilized to derive inputs for the financial analysis. Where recent sales and lease
comparables were absent, the Annapolis/Crofton submarket data was utilized.
Multi-Family Apartments:
Detailed in Appendix A, the first floor will consist of 7,094 RBA after accounting for a 21%
common area factor. The second floor will yield 5,816 RBA after factoring in the proposed
additions and a 20% common area factor. To maximize potential gross income, the lofted second
floor has been modified to incorporate a third floor that will yield an additional 2,285 RBA after
factoring in 20% for common areas, and limited head room due to the roof pitch. Overall, the
building will produce a 15,195 RBA or 19,106 gross SF, correlating to a FAR of 0.738.
Market rents were derived from recent lease comparables where studios averaged 504 SF with
asking rent of $2.21 per SF, one-bedrooms average 706 SF at $1.89 per SF and two-bedrooms
averaged 1,174 SF at 1.47 per SF. The average vacancy of the three comparables was 4.9% with a
projected average vacancy rate between 2011 and 2014 of 3.75%23. For the purposes of this
analysis, a 4.9% vacancy rate will be applied. Annual concessions were identified through sales
comparables providing an average $313 per unit has been applied to the first year. A gradual
reduction to 5% over the following two-year period is intended to reflect the anticipated
improvements in the multi-family market.
Income growth of 2.4% was derived from REIS’ submarket five-year forecast. To ensure
projections are not inaccurately inflated over the holding period, expense growth has been
modeled to match income growth at 2.4%. Apartment market leasing assumptions also include a
65% renewal probability for each of the unit types, three-month downtime upon rollover, and unit
preparation costs of $200 per unit. Leasing commissions for new tenants reflect REIS
8 Estimation of floor area was determined through take-offs derived from plans acquired from the City of Annapolis
18
comparables of 3% and 1.5% for renewing leases. Recent sales comparable provided an average
operating expense ratio of 40.6% and capital expenditures of $1.00 per SF24. The assumptions
reveal a year one net operating income of $190,173.
Recent sale comparables provide an average going-in capitalization rate of 6.6% compared to
REIS’ 12-month rolling metro cap rate of 7.1% as of the first quarter of 201025. For the purposes
of this analysis, a 7.1% going-in capitalization rate was applied. A spread of 50bps has be applied
to derive a terminal capitalization rate of 7.6%. This spread reflects the reduction in value based
on the age of the structure and the erosion of income26. Applying the 7.1% capitalization rate to
the year one NOI reveals a suggested value of $2,545,056. Discounting the projected cash flows
and proceeds from reversion using a 10.18% rate, provides an unleveraged present value of
$2,073,817.
Applying Graaskamp’s SFFA backdoor approach to determine if the multi-family use supports
the acquisition of the property, we begin by multiplying the 15,195 rentable SF by the Argus
derived blended annual rental rate of $21.62 to derive a potential gross income of $328,447.
Subtracting the $15,788 vacancy allowance results in an effective gross income of $312,659. Less
operating expenses of $122,486 provides a net operating income of $190,173. Dividing the NOI
by the minimum 1.25 debt service coverage ratio, results in a maximum annual debt service of
$152,138. Incorporating the financial assumptions derives an estimated present value of
$1,855,765. Dividing the present value by a maximum loan-to-value of 65% reveals an estimated
total project cost of $2,855,024.
Illustrated below, new construction hard costs of $100 per SF were applied to the proposed 5,786
SF in new construction. Renovation hard costs of $146 per SF reflect the additional labor, time,
and risk, and were applied to the existing 13,320 SF. Soft costs of $73 per SF were applied to the
entire proposed 19,106 SF structure. The sum of the calculations reflects the total estimated
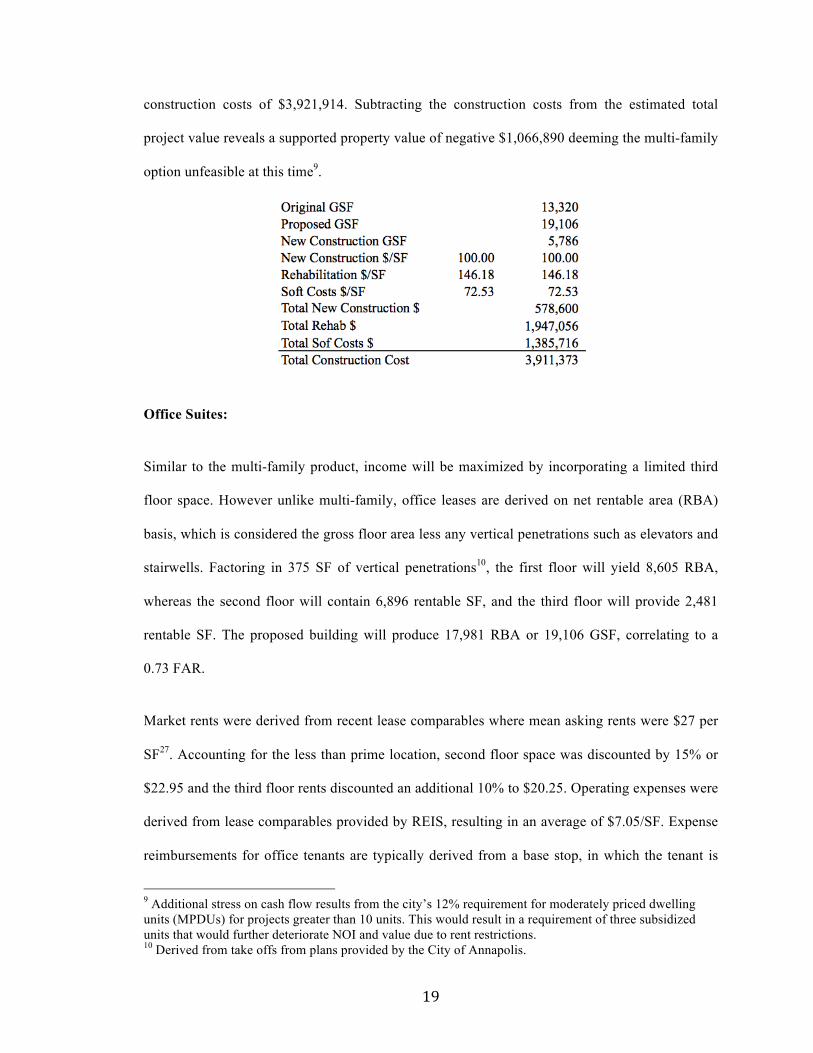
19
construction costs of $3,921,914. Subtracting the construction costs from the estimated total
project value reveals a supported property value of negative $1,066,890 deeming the multi-family
option unfeasible at this time9.
Office Suites:
Similar to the multi-family product, income will be maximized by incorporating a limited third
floor space. However unlike multi-family, office leases are derived on net rentable area (RBA)
basis, which is considered the gross floor area less any vertical penetrations such as elevators and
stairwells. Factoring in 375 SF of vertical penetrations10, the first floor will yield 8,605 RBA,
whereas the second floor will contain 6,896 rentable SF, and the third floor will provide 2,481
rentable SF. The proposed building will produce 17,981 RBA or 19,106 GSF, correlating to a
0.73 FAR.
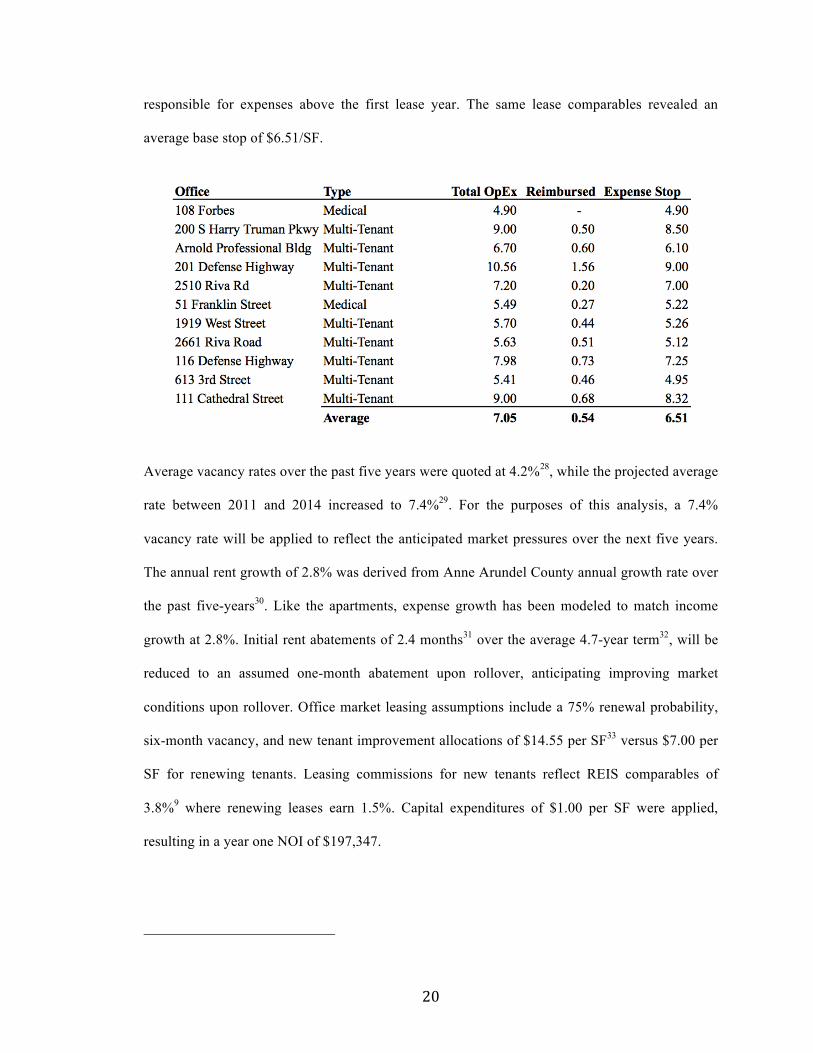
Market rents were derived from recent lease comparables where mean asking rents were $27 per
SF27. Accounting for the less than prime location, second floor space was discounted by 15% or
$22.95 and the third floor rents discounted an additional 10% to $20.25. Operating expenses were
derived from lease comparables provided by REIS, resulting in an average of $7.05/SF. Expense
reimbursements for office tenants are typically derived from a base stop, in which the tenant is
9 Additional stress on cash flow results from the city’s 12% requirement for moderately priced dwelling units (MPDUs) for projects greater than 10 units. This would result in a requirement of three subsidized units that would further deteriorate NOI and value due to rent restrictions. 10 Derived from take offs from plans provided by the City of Annapolis.
20
responsible for expenses above the first lease year. The same lease comparables revealed an
average base stop of $6.51/SF.
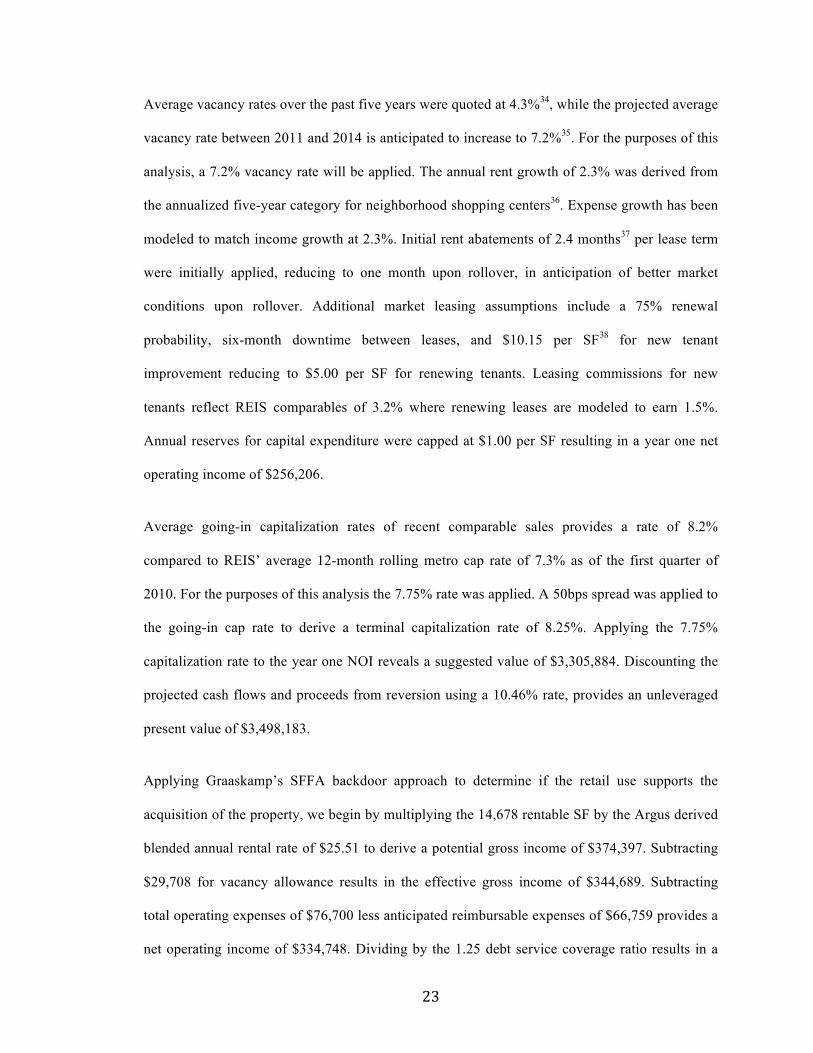
Average vacancy rates over the past five years were quoted at 4.2%28, while the projected average
rate between 2011 and 2014 increased to 7.4%29. For the purposes of this analysis, a 7.4%
vacancy rate will be applied to reflect the anticipated market pressures over the next five years.
The annual rent growth of 2.8% was derived from Anne Arundel County annual growth rate over
the past five-years30. Like the apartments, expense growth has been modeled to match income
growth at 2.8%. Initial rent abatements of 2.4 months31 over the average 4.7-year term32, will be
reduced to an assumed one-month abatement upon rollover, anticipating improving market
conditions upon rollover. Office market leasing assumptions include a 75% renewal probability,
six-month vacancy, and new tenant improvement allocations of $14.55 per SF33 versus $7.00 per
SF for renewing tenants. Leasing commissions for new tenants reflect REIS comparables of
3.8%9 where renewing leases earn 1.5%. Capital expenditures of $1.00 per SF were applied,
resulting in a year one NOI of $197,347.
21
Average going-in capitalization rates from recent sale comparables are limited and evidenced by
one transaction, 108 Forbes Street that traded on March 1, 2010 for 7.7%, compared to the REIS
average 12-month rolling metro cap rate of 8.4%, as of the second quarter of 201011. For the
purposes of this analysis the 7.75% rate was applied. A 50bps spread was applied to the going-in
cap rate to derive the terminal capitalization rate of 8.25%. Applying the 7.75% capitalization rate
to the year one NOI reveals a suggested value of $2,546,413. Discounting the projected cash
flows and proceeds from reversion using a 10.67% rate, provides an unleveraged present value of
$2,831,025.
Applying Graaskamp’s SFFA backdoor approach to determine if the multi-family use supports
the acquisition of the property, we begin by multiplying the 17,981 rentable SF by the Argus
derived blended annual rental rate of $24.52 to derive a potential gross income of $440,812.
Subtracting the $26,825 vacancy allowance results in the effective gross income of $413,987.
Operating expenses of $134,697 less anticipated reimbursable expenses of $9,845 provides a net
operating income of $289,135. Dividing the NOI by the 1.25 minimum debt service coverage
ratio results in a maximum annual debt service of $231,308. Incorporating the financial
assumptions derives an estimated present value of $2,821,466. Dividing the present value by a
maximum loan-to-value of 65% reveals an estimated total project value of $4,340,718.
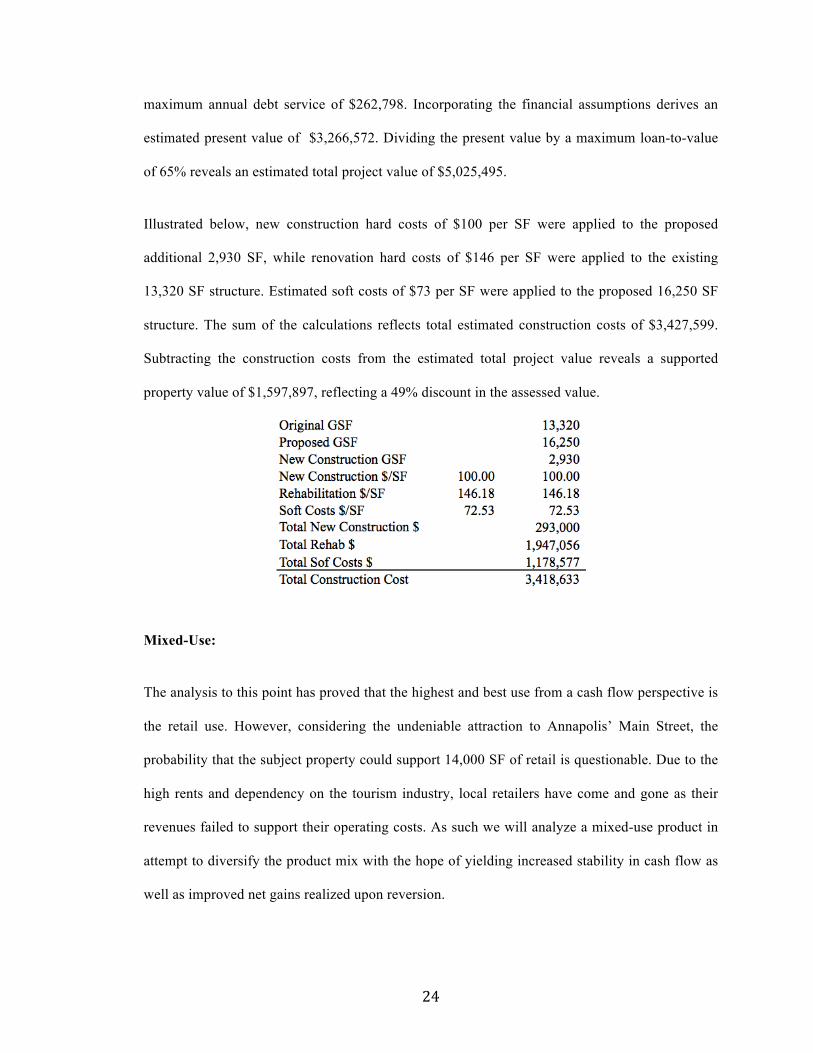
Illustrated below, new construction hard costs of $100 per SF were applied to the proposed 5,786
SF, while renovation hard costs of $146 per SF were applied to the existing 13,320 SF. Estimated
soft costs of $73 per SF were applied to the proposed 19,106 SF structure. The sum reflects total
estimated construction costs of $3,921,914. Subtracting construction costs from the estimated
total project value reveals a supported property value of $418,804 reflecting an 87% discount in
the assessed value.
22
Retail:
The proposed floor plan for the retail use will be limited to two floors with a substantial opening
in the second floor to unify buildings two stories. Like the office product, retail rents are also
based on net rentable area. First floor plate less 375 SF of vertical penetrations results in a
rentable area of 8,605 SF. Subtracting 375 SF for vertical penetrations and the 822 SF for the 45-
foot wide by 18-foot opening in the floor, yields a second floor plate of 6,073 RBA. The proposed
retail space will produce 14,678 RBA and 16,250 GSF, correlating to a 0.62 FAR.
Market rents for the first floor were derived from lease comparables provided in the REIS Retail
Report, where mean asking rents were $30.00 per SF for non-anchored neighborhood centers.
Second floor retail rents were discounted by 30% or $21.00 per SF to account for the less than
prime location. Retail tenants typically reimburse operating expenses on triple net basis, meaning
the tenant is responsible for their pro rata share of the reimbursable operating expenses. Sales
comparables provided by REIS were utilized, suggesting an average of $4.72 per SF in total
operating expense where the tenant reimburses $4.03, on average.
23
Average vacancy rates over the past five years were quoted at 4.3%34, while the projected average
vacancy rate between 2011 and 2014 is anticipated to increase to 7.2%35. For the purposes of this
analysis, a 7.2% vacancy rate will be applied. The annual rent growth of 2.3% was derived from
the annualized five-year category for neighborhood shopping centers36. Expense growth has been
modeled to match income growth at 2.3%. Initial rent abatements of 2.4 months37 per lease term
were initially applied, reducing to one month upon rollover, in anticipation of better market
conditions upon rollover. Additional market leasing assumptions include a 75% renewal
probability, six-month downtime between leases, and $10.15 per SF38 for new tenant
improvement reducing to $5.00 per SF for renewing tenants. Leasing commissions for new
tenants reflect REIS comparables of 3.2% where renewing leases are modeled to earn 1.5%.
Annual reserves for capital expenditure were capped at $1.00 per SF resulting in a year one net
operating income of $256,206.
Average going-in capitalization rates of recent comparable sales provides a rate of 8.2%
compared to REIS’ average 12-month rolling metro cap rate of 7.3% as of the first quarter of
2010. For the purposes of this analysis the 7.75% rate was applied. A 50bps spread was applied to
the going-in cap rate to derive a terminal capitalization rate of 8.25%. Applying the 7.75%
capitalization rate to the year one NOI reveals a suggested value of $3,305,884. Discounting the
projected cash flows and proceeds from reversion using a 10.46% rate, provides an unleveraged
present value of $3,498,183.
Applying Graaskamp’s SFFA backdoor approach to determine if the retail use supports the
acquisition of the property, we begin by multiplying the 14,678 rentable SF by the Argus derived
blended annual rental rate of $25.51 to derive a potential gross income of $374,397. Subtracting
$29,708 for vacancy allowance results in the effective gross income of $344,689. Subtracting
total operating expenses of $76,700 less anticipated reimbursable expenses of $66,759 provides a
net operating income of $334,748. Dividing by the 1.25 debt service coverage ratio results in a
24
maximum annual debt service of $262,798. Incorporating the financial assumptions derives an
estimated present value of $3,266,572. Dividing the present value by a maximum loan-to-value
of 65% reveals an estimated total project value of $5,025,495.
Illustrated below, new construction hard costs of $100 per SF were applied to the proposed
additional 2,930 SF, while renovation hard costs of $146 per SF were applied to the existing
13,320 SF structure. Estimated soft costs of $73 per SF were applied to the proposed 16,250 SF
structure. The sum of the calculations reflects total estimated construction costs of $3,427,599.
Subtracting the construction costs from the estimated total project value reveals a supported
property value of $1,597,897, reflecting a 49% discount in the assessed value.
Mixed-Use:
The analysis to this point has proved that the highest and best use from a cash flow perspective is
the retail use. However, considering the undeniable attraction to Annapolis’ Main Street, the
probability that the subject property could support 14,000 SF of retail is questionable. Due to the
high rents and dependency on the tourism industry, local retailers have come and gone as their
revenues failed to support their operating costs. As such we will analyze a mixed-use product in
attempt to diversify the product mix with the hope of yielding increased stability in cash flow as
well as improved net gains realized upon reversion.
25
The proposed floor plan for a mixed-use project will incorporate ground floor retail and office
suites on the second floor. Similar to the all retail product, a 45-foot long by 18-foot wide
opening will be cut into the center of second floor to expose the second floor lofted ceilings. Both
retail and office leases are based on net rentable area, resulting in a first floor net rentable area of
8,605 SF and a second floor net rentable area of 6,073 SF. The proposed mixed-use space will
produce 14,678 RBA and 16,250 GSF, correlating to a 0.62 FAR.
First floor retail rental rate remain at $30.00 per SF with triple net operating expense
reimbursements of $4.03 per SF and total expenses of $4.72 per SF. Vacancy for the retail portion
has been held constant at 7.2% and the average six-year term will remain. Initial rent abatements
of 2.4 months per lease term were applied, reducing to one month upon rollover in anticipation of
better market conditions. Both income and expenses have been modeled to grow at a constant
2.5%. Additional market leasing assumptions include a 75% renewal probability, six-month
vacancy, and new tenant improvements of $10.15 per SF in comparison to $5.00 per SF for
renewing tenants. Leasing commissions for new tenants reflect REIS comparables of 3.2% where
renewing leases earn 1.5%. Lastly, annual capital expenditures of $1.00 per SF were applied.
The second floor office rental rate has been modeled at $27.00 per SF with the assumption that
the unique open floor plan will attract premium rents. Operating expense reimbursements were
based on an expense stop, and are modeled to reflect $6.51 per SF, with total expenses of $7.05
per SF. The office vacancy rate coincides with the REIS report of 7.4%, as does the average term
of 4.7 years. Both income and expenses have been modeled to grow at a constant 2.5%. Initial
rent abatements of 2.4 months per term have been revised to one-month upon rollover. Additional
office market leasing assumptions include a 75% renewal probability, six-month vacancy, and
new tenant improvement of $14.55 per SF versus $7.00 for renewing tenants. Leasing
commissions for new tenants reflect REIS comparables of 3.8% where renewing leases earn
26
1.5%. Lastly, capital expenditure were modeled using $1.00 per SF annually resulting in a year
one net operating income of $275,433.
Derived going-in capitalization rates of 7.75% were utilized for both retail and office while a 50-
basis point spread provides a terminal capitalization rate of 8.25%. Applying the 7.75%
capitalization rate to the year one NOI reveals a suggested value of $3,553,974. Discounting the
projected cash flows and proceeds from reversion using a 10.5% rate, provides an unleveraged
present value of $3,685,658.
Applying Graaskamp’s SFFA backdoor approach, the 14,678 rentable SF is multiplied by the
Argus derived blended annual rental rate of $28.76 to derive a potential gross income of
$422,121. Subtracting $18,960 for vacancy allowance results in an effective gross income of
$403,161. Subtracting total operating expenses of $83,431 less reimbursable expenses of $43,895
provides a net operating income of $363,625. Dividing by the 1.25 debt service coverage ratio
results in a maximum annual debt service of $290,900. Utilizing the financial assumptions
suggests an estimated present value of $3,548,362. Dividing the present value by a maximum
loan-to-value of 65% reveals an estimated total project value of $5,459,019.
As illustrated below, new construction hard costs of $100 per SF were applied to the anticipated
2,930 GSF in additions, while renovation hard costs of $146 per SF were applied to the 13,320
SF existing structure. Estimated soft costs remain at $73 per SF and were applied to the proposed
16,250 SF structure. The sum of the calculations reflects total estimated construction costs of
$3,427,599. Subtracting the construction costs from the estimated total project value reveals a
supported property value of $2,031,420 reflecting a 35% discount in the assessed value.
27
Feasibility & Valuation Summary:
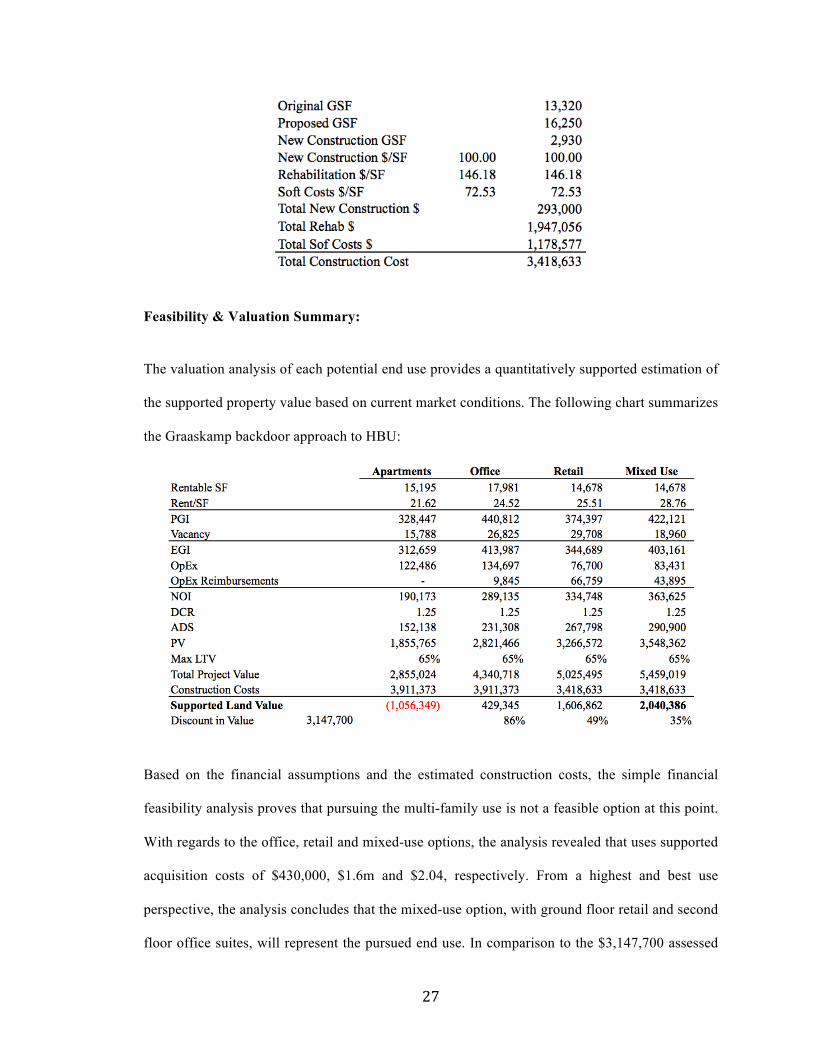
The valuation analysis of each potential end use provides a quantitatively supported estimation of
the supported property value based on current market conditions. The following chart summarizes
the Graaskamp backdoor approach to HBU:
Based on the financial assumptions and the estimated construction costs, the simple financial
feasibility analysis proves that pursuing the multi-family use is not a feasible option at this point.
With regards to the office, retail and mixed-use options, the analysis revealed that uses supported
acquisition costs of $430,000, $1.6m and $2.04, respectively. From a highest and best use
perspective, the analysis concludes that the mixed-use option, with ground floor retail and second
floor office suites, will represent the pursued end use. In comparison to the $3,147,700 assessed
28
value, the supported property value reflects a 35% discount in value, accurately reflecting the
recent economic recession, where on average values of commercial real estate have reset between
30% and 40%39. The remainder of this proposal will focus on the viability of pursuing the mixed-
use product.
Mixed-Use Development Plan:
The pursued end use for the first floor will strive to fill a gap that has been present in the
Annapolis market for decades. For the majority of the city vast 300-year history and up until the
1950’s, the city dock area provided residents with essential goods and services generally
consumed by households. Since the 1950’s, the city’s dynamic has evolved to tailor more towards
tourists than residents. Commercial fishing boats that filled the city dock and provided residents
with fresh seafood, has since been replaced with parking lots and tourist targeted shops. The
closing of iconic 5,000 SF city dock market house resulted in the displacement of tenants, many
of which had occupied the space for decades. The intent of the city’s previous administration was
to renovate the building and lease the entire space to a national gourmet grocer. Fumbles in the
renovation work and disputes over details in the lease, resulted in the termination of the lease by
the tenant. To this day, the market house has not functioned to its potential with a large portion
vacant, portraying the inherent challenges that accompany real estate investing for businesses
whose core business is not real estate.
Ground Floor Retail:
Although a variety of tenants could potentially occupy the ground floor space, this proposal
targets a niche tenant group that aims to fill an essential gap in services. The proposed use will
take the form of a market house setting comprised of a variety of vendors providing fresh
produce, meats, and seafood. The target market would be residents and tourists, as well as the
29
large contingency of transient boater that pass through or spend the season in “America’s Sailing
Capital.”40
Opponents would argue the proposed use would ineffectively compete with the centrally located
city dock market house located two blocks to the north. To the contrary, the space would strive to
compliment the timeless essence of the existing market house. Recently awarded market house
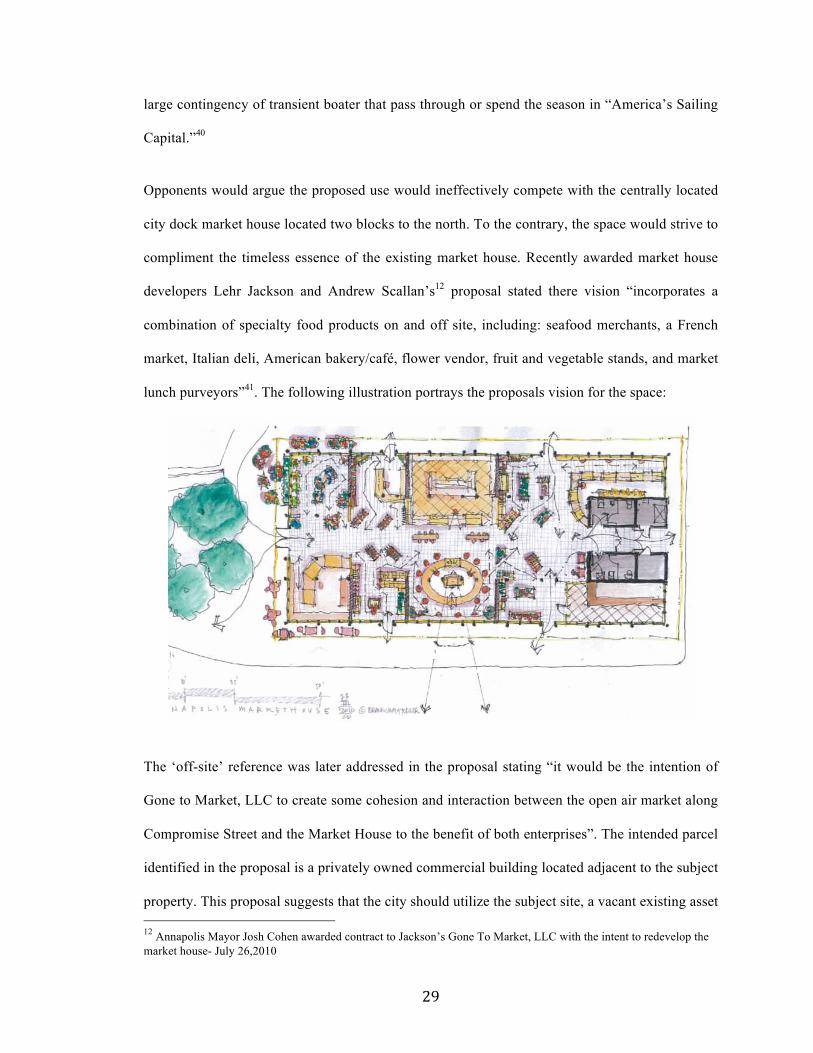
developers Lehr Jackson and Andrew Scallan’s12 proposal stated there vision “incorporates a
combination of specialty food products on and off site, including: seafood merchants, a French
market, Italian deli, American bakery/café, flower vendor, fruit and vegetable stands, and market
lunch purveyors”41. The following illustration portrays the proposals vision for the space:
The ‘off-site’ reference was later addressed in the proposal stating “it would be the intention of
Gone to Market, LLC to create some cohesion and interaction between the open air market along
Compromise Street and the Market House to the benefit of both enterprises”. The intended parcel
identified in the proposal is a privately owned commercial building located adjacent to the subject
property. This proposal suggests that the city should utilize the subject site, a vacant existing asset 12 Annapolis Mayor Josh Cohen awarded contract to Jackson’s Gone To Market, LLC with the intent to redevelop the market house- July 26,2010
30
controlled by the city. As a result, the city dock market house would focus on providing prepared
foods for residents and visitors, while the subject site would cater more towards providing fresh
produce, seafood, poultry and meat.
The closest grocery stores that service city residents are Groul’s Market and Giant Food located
1.4 miles and 3.1 miles from downtown. As a result, residents are required to drive outside the
city limits to fulfill their basic grocery needs, depriving the city of potential revenue. Further,
once the residents leave the city, they are more inclined to run additional errands outside city
limited, placing additional strain on revenues that could be realized by the city42. During a recent
conversation with Lehr Jackson, he stated that Main Street has changed over the last twenty years
to cater more towards the tourist contingency, than focusing on the basic needs of the residents.
As a result, the residents have been forced to leave the city limits to fulfill their basic needs43.
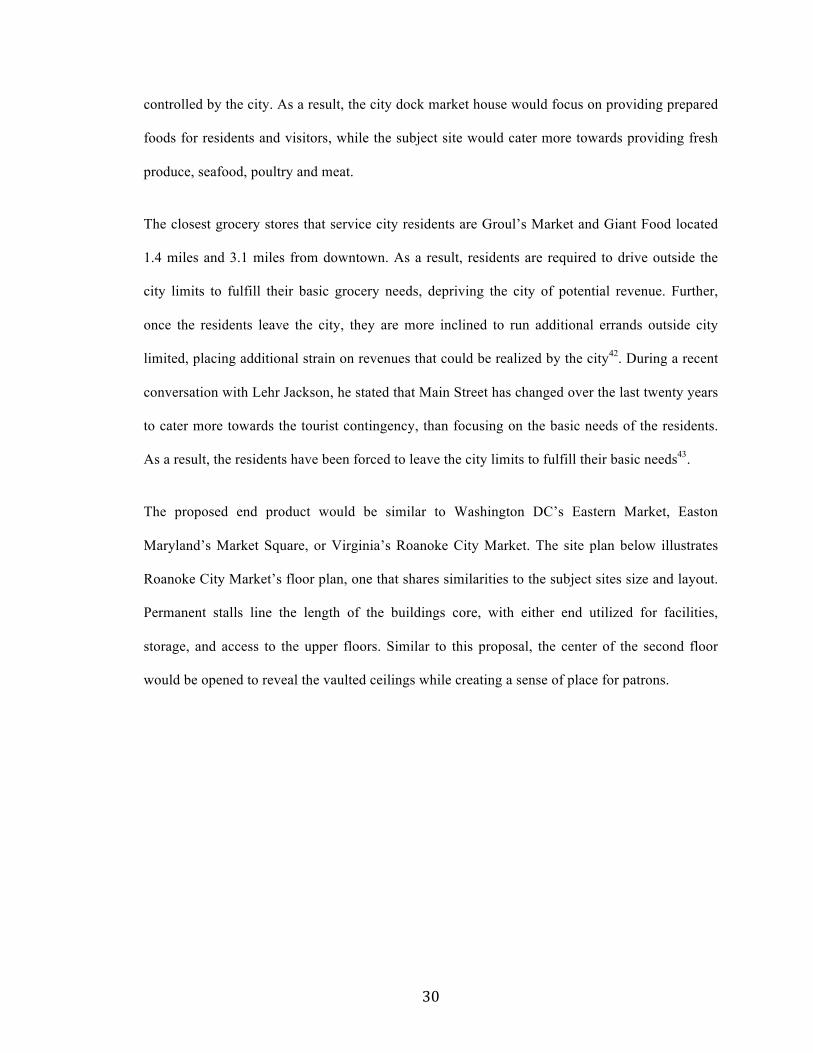
The proposed end product would be similar to Washington DC’s Eastern Market, Easton
Maryland’s Market Square, or Virginia’s Roanoke City Market. The site plan below illustrates
Roanoke City Market’s floor plan, one that shares similarities to the subject sites size and layout.
Permanent stalls line the length of the buildings core, with either end utilized for facilities,
storage, and access to the upper floors. Similar to this proposal, the center of the second floor
would be opened to reveal the vaulted ceilings while creating a sense of place for patrons.
31
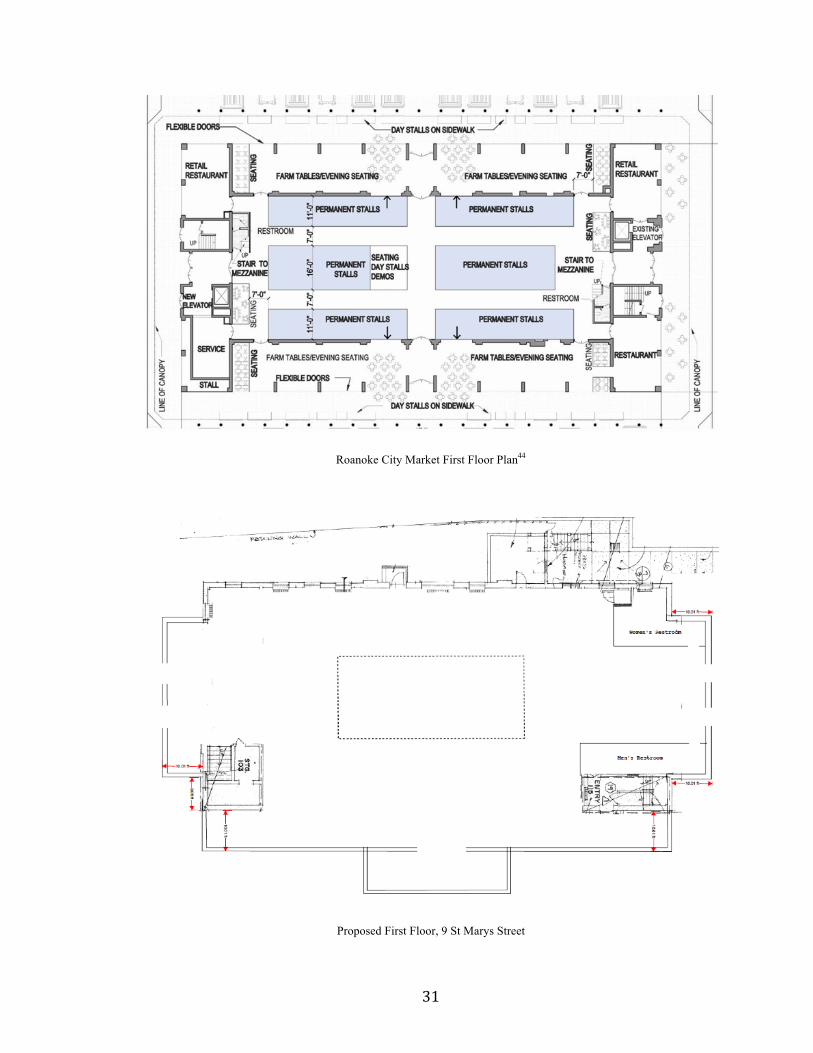
Roanoke City Market First Floor Plan44
Proposed First Floor, 9 St Marys Street
32
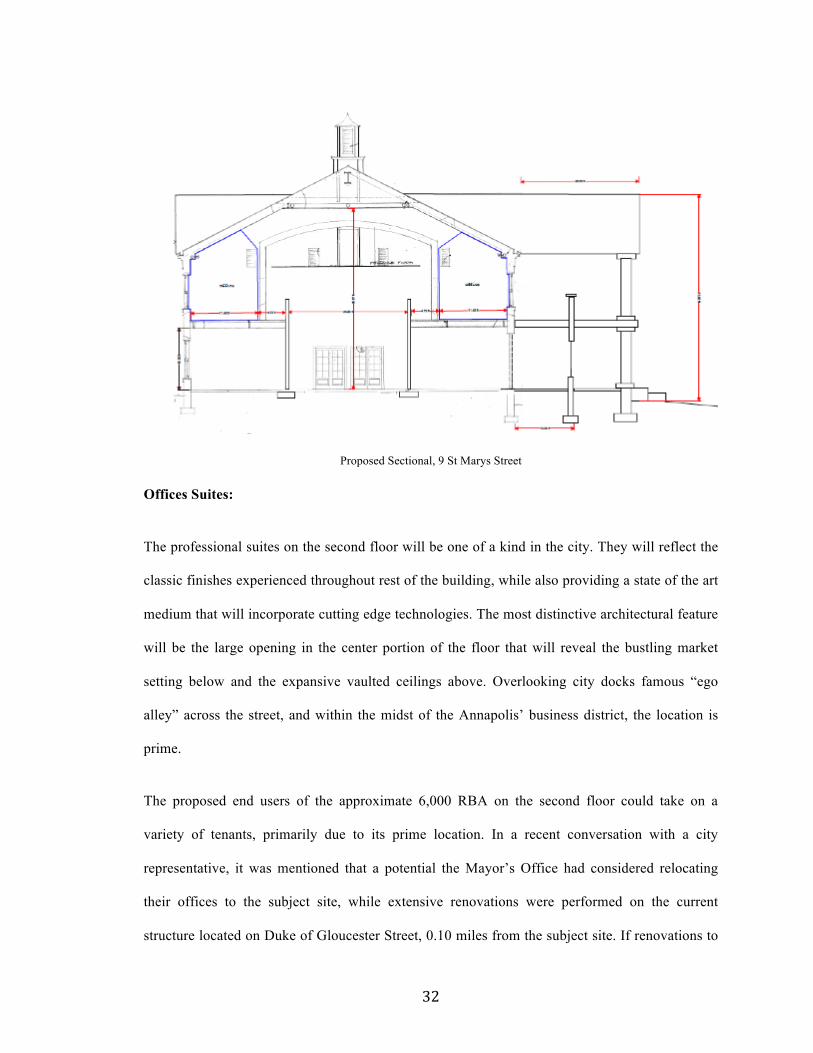
Proposed Sectional, 9 St Marys Street
Offices Suites:
The professional suites on the second floor will be one of a kind in the city. They will reflect the
classic finishes experienced throughout rest of the building, while also providing a state of the art
medium that will incorporate cutting edge technologies. The most distinctive architectural feature
will be the large opening in the center portion of the floor that will reveal the bustling market
setting below and the expansive vaulted ceilings above. Overlooking city docks famous “ego
alley” across the street, and within the midst of the Annapolis’ business district, the location is
prime.
The proposed end users of the approximate 6,000 RBA on the second floor could take on a
variety of tenants, primarily due to its prime location. In a recent conversation with a city
representative, it was mentioned that a potential the Mayor’s Office had considered relocating
their offices to the subject site, while extensive renovations were performed on the current
structure located on Duke of Gloucester Street, 0.10 miles from the subject site. If renovations to
33
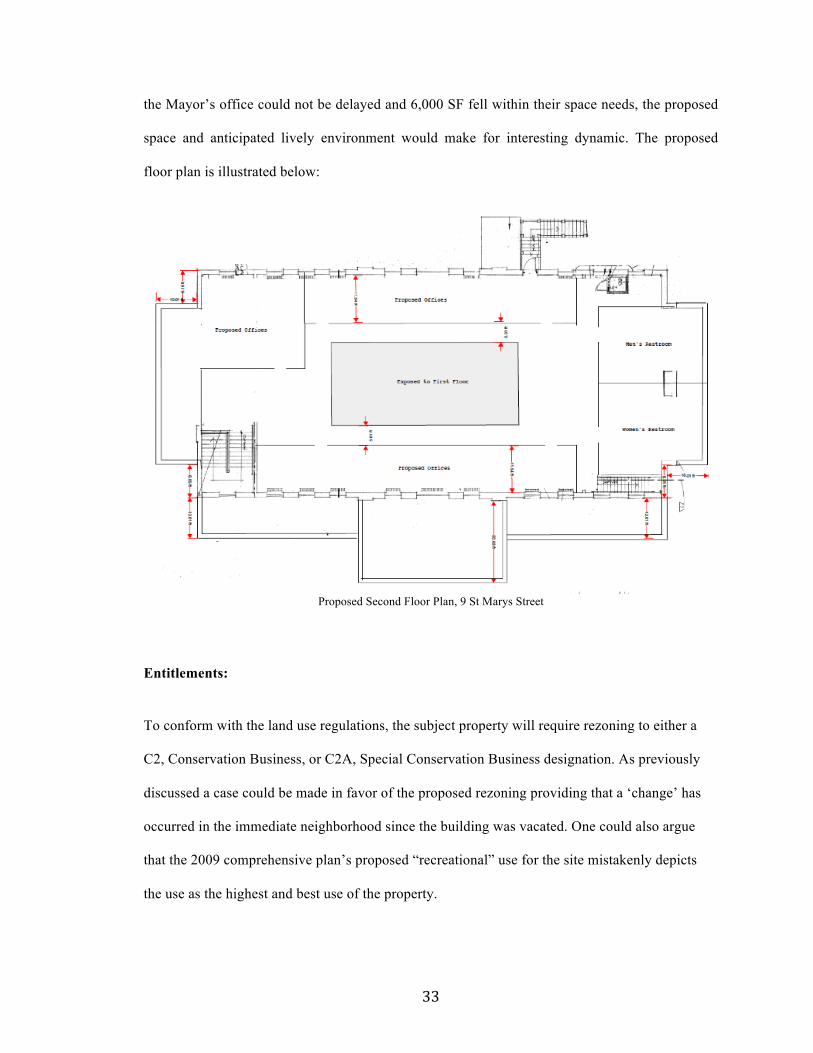
the Mayor’s office could not be delayed and 6,000 SF fell within their space needs, the proposed
space and anticipated lively environment would make for interesting dynamic. The proposed
floor plan is illustrated below:
Proposed Second Floor Plan, 9 St Marys Street
Entitlements:
To conform with the land use regulations, the subject property will require rezoning to either a
C2, Conservation Business, or C2A, Special Conservation Business designation. As previously
discussed a case could be made in favor of the proposed rezoning providing that a ‘change’ has
occurred in the immediate neighborhood since the building was vacated. One could also argue
that the 2009 comprehensive plan’s proposed “recreational” use for the site mistakenly depicts
the use as the highest and best use of the property.
34
Annapolis land use attorney, Ben Wechsler with Linowes & Blocher explained the subject
property’s location within the historic district, and the public context of the property, would likely
result in considerable community involvement and/or opposition. The process would require
various public meetings to the Planning Commission, addressing various issues and points of
contention identified by city staff, the Commission, and the residents. Once the Planning
Commission is satisfied that all requirements have been satisfied, a recommendation for approval
would be made to the Board of Appeals for a final decision during another public hearing. The
anticipated timeframe for approval on the city level would range from four to six months.
The primary risk pertains to the likelihood of the opposition appealing the Planning Commissions
decision and subsequently the Board of Appeals decision. In the event a compromise could not be
reached at the Board of Appeals level, the matter would be heard by the Anne Arundel County
Circuit Court, a process that could conservatively delay the project for nine to twelve months. In
the event the Circuit Courts decision was appealed the issue would require a final decision by the
Special Court of Appeals, providing additional delays in the range of six to twelve months. The
legal costs associated with such a full blown adversarial rezoning process would range from
$100,000 to $200,000 and the process could be drawn out over a five years period45.
To mitigate the associated entitlement risk, it’s the intent of this proposal to enter a public-private
partnership with the city. Doing so would permit the city to rezone the parcel through an
administrative process, as municipalities are not subject to their zoning regulations46. The project
could be incorporated as part of the recently established Annapolis Economic Development
Corporation (AEDC), with the primary task of promoting economic development efforts through
a partial privatization approach. Annapolis Mayor Josh Cohen stated in a recent article “The
AEDC I envision will be working with a lot of businesses, recruiting them, shepherding them
through the process, but they’re going to need the support of planning and zoning, permits and
inspections to make things happen.” The city’s intent is to have the AEDC running by fall 2010,
35
with the initial focus on revitalizing the historic waterfront area, located within the context of the
subject site. Engaging the AEDC to enter a public/private partnership and lobbying the concept to
the alderman and community through a series of design charettes would prove pivotal in gaining
support for the project and significantly reduce the associated entitlement risk in rezoning the
subject property.
Mixed-Use Financial Analysis:
Many of the assumptions used in feasibility analysis will be utilized for the proposed end use.
Variations of note include the revised January 1, 2013 analysis start date that factors a 26-month
period for design, permitting and approvals, and an 18-month construction period. The income
and expense assumptions have accrued to reflect the 2.55% annual growth rate resulting in retail
rents of $31.55 per SF and office rents of $28.39. Operating expenses for the retail portion were
inflated to $4.96 per SF with an average reimbursement of $4.24 per SF while office operating
expenses were modeled at $7.42 per SF with an average base stop of $6.85. Tenant improvement
allocations for the 1st floor of $10.15 per SF have been revised downward to $5.00 per SF to more
accurately represent the anticipated market place setting, while tenant improvements for the
office suites remain at $14.55 per SF.
Incorporating the market house component affected the rent roll reflecting the reduced space
requirements of vendors, resulting in a total of twelve tenants each averaging 715 SF47. The office
suites will be comprised of four tenants each averaging 1,500SF. To address the associated
leasing risk, or the risk that forecasted absorption volume will not be realized, 70% or 10,274 SF
will be preleased, while and the remaining space will be absorbed over the course of the first two
years of the analysis. The market space has been modeled to absorb four tenants at a rate of one
lease per quarter beginning January 2014, while the office suites will absorb one tenant on a
quarterly basis beginning the same time. To further stabilize the projected cash flows, tenant lease
36
terms have been staggered to moderate the rollover impact on cash flow for any given year. The
remaining assumptions reflect the data provided in the valuation and feasibility analysis for the
mixed-use model.
Development Budget:
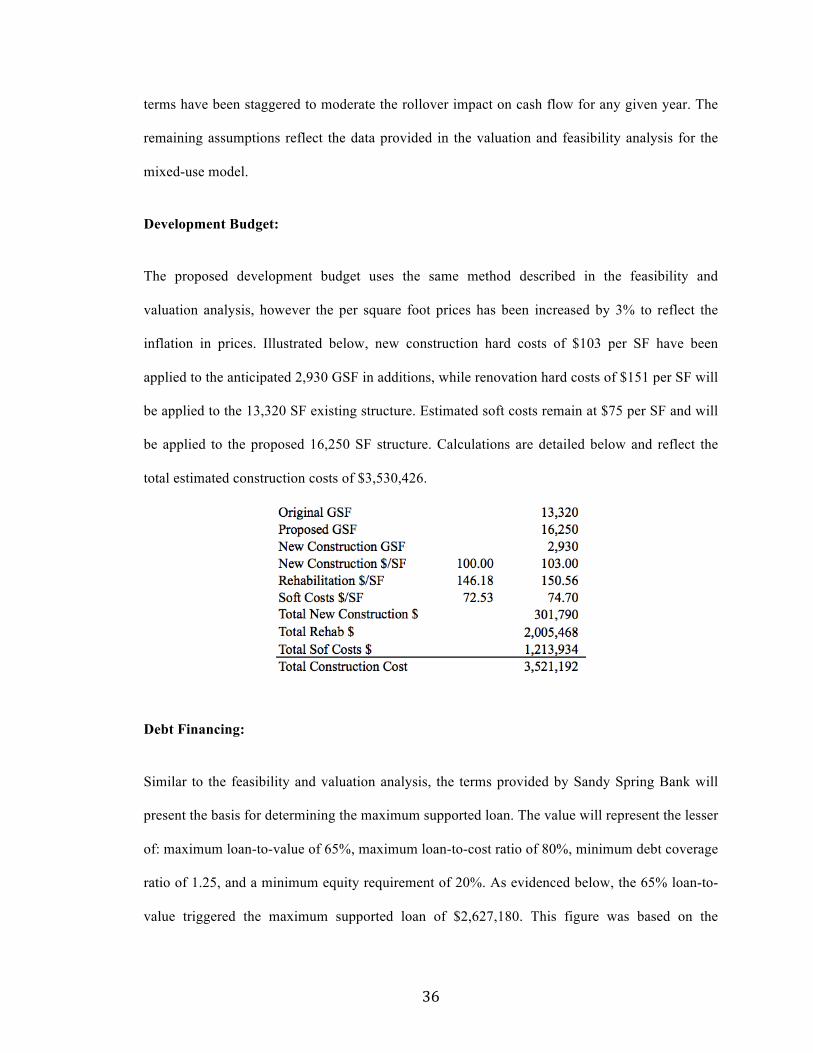
The proposed development budget uses the same method described in the feasibility and
valuation analysis, however the per square foot prices has been increased by 3% to reflect the
inflation in prices. Illustrated below, new construction hard costs of $103 per SF have been
applied to the anticipated 2,930 GSF in additions, while renovation hard costs of $151 per SF will
be applied to the 13,320 SF existing structure. Estimated soft costs remain at $75 per SF and will
be applied to the proposed 16,250 SF structure. Calculations are detailed below and reflect the
total estimated construction costs of $3,530,426.
Debt Financing:
Similar to the feasibility and valuation analysis, the terms provided by Sandy Spring Bank will
present the basis for determining the maximum supported loan. The value will represent the lesser
of: maximum loan-to-value of 65%, maximum loan-to-cost ratio of 80%, minimum debt coverage
ratio of 1.25, and a minimum equity requirement of 20%. As evidenced below, the 65% loan-to-
value triggered the maximum supported loan of $2,627,180. This figure was based on the
37
projected property value of $4,041,815, which was derived using the blended value of the direct
capitalized amount of $4,440,737 and the unleveraged present value of $3,642,893.
Construction Loan:
Construction loans, also known as interim loans provide funding for the development process.
Funds typically support on-site hard costs and soft costs including leasing, planning, management
and tenant improvements through lease up. Due to the risks associated with the development
phase, the developer is held personally liable for the debt in the event of default. Upon substantial
completion, the lender will partially or fully release the recourse clause. Prior the final
commitment, the construction lender will require a commitment in the form of long-term debt
financing to ensure the construction loan will be reimburse in full upon expiration of the term.
Sandy Spring Bank quoted construction loans terms as interest only with floating interest rates
derived from the prime interest rate plus 200 basis points, with a floor of 6.5%. The current prime
rate of 3.25%48 results in a 5.25% rate that will be overridden by the 6.5% floor. Considering the
federal governments commitment to keep interest rates low for “an extended period”, this
analysis assumes that the construction loan will be underwritten using a 6.5% interest rate, with a
1% origination fee of $24,817.
The construction loan amount was derived by subtracting the anticipated $145,454 in interest
accrued over the development period from the maximum supported loan, providing a $2,481,725
loan. The draw schedule was based on a bell shape distribution where approximately 80% of the
funds are to be deployed between August 2011 and July 2012.
38
Permanent Loan:
Permanent, or take out loans from Sandy Spring Bank base the interest rate on 5-year treasuries
plus a 400-450bps spread, with a 6.5% floor. Currently, 5-year treasury notes are yielding
1.457%49 plus a 450bps spread provides a suggested rate of 5.96%, which would be overridden
by the 6.5% floor. Although the rate won’t be locked in until construction nears completion, this
analysis assumes an interest rate of 6.5%. Permanent loan fees due at origination were quoted
between 50-100bps, where for the purpose of this analysis a 75bps or $19,704 fee has been
applied. Lastly the loan will be amortized over a 25 years period with a term of 10 years.
Initial Equity Requirement & Returns:
The initial projected development budget of $5.53m accounts for the derived $2.03m acquisition
cost, hard costs of $2.3m, and $1.2m in related soft costs. Applying the $2.48m construction loan
reveals a funding gap of $3.05m. Running the discounted cash flow to determine the assets
performance over a 10-year hold period reveals leveraged internal rate of return of 5.24%.
Accounting for the fact that equity investors could earn 6% in stock market50, and mezzanine and
hard money investors require returns ranging from 12-25%51, the project as structured is deemed
unfeasible at this time.
Alternative Financing Strategies:
At this point, we will reassess and explore alternative options to reduce the equity requirement,
increase projected returns, and ultimately present a viable development option for the subject site.
Specifically, we will analyze and incorporate the following two concepts: 1) federal and state
rehabilitation tax credits, and 2) supplementing a ground lease in place of purchasing the
property.
39
Rehabilitation Tax Credits:
The benefit of the subject property being within a designated historic district is it qualifies for the
20% Federal Rehabilitation Tax Credit and an additional 10% credit from the state of Maryland.
The cumulative 30% tax credit is applied to the “qualified rehabilitation costs” which include:
hard construction costs incurred for rehabilitation of existing structure, tenant improvements,
construction contingency, architectural and engineering fees, environmental remediation,
appraisal and market study, permit and bond fees, insurance, accounting and tax credit cost
certification, legal fees, preservation consultant, tax credit fees, financing fees, construction
interest, and the developer fee52 (Detailed in Appendices 2 & 5).
Isolating the qualified costs in the proposed development budget results in an estimated qualified
rehabilitation cost of $2,585,994. Applying the 20% Federal tax credit accounts for a $517,199
credit, while the 10% state credit will account for $258,599, providing a total tax credit of
$775,798. The tax credit can be applied as a reduction in the recipients annual tax liability, or as
up front equity to the project, with the final decision based on the alternative that creates the
highest value to the developer.
If the credit were applied to reduce tax liability, once the rehabilitation work is completed and
certified by the National Parks Service, the total credit amount would be applied on an annual
basis, dollar-for-dollar, over a five-year period. The other option reflects the intent of this
proposal and involves the developer selling the credit to a tax credit investor, who in turn uses the
credit to offset alternative tax liabilities. In exchange, the developer realizes the proceeds as
additional equity to the project. To compensate for the risk associated with acquiring the ‘future
benefits’ of the credit, tax credit investors are currently paying $0.85 on the dollar53 providing an
equity value of $659,423. To account for the inclusion of potentially unqualified costs, the equity
value has been reduced by a 10% resulting in a total equity value of $593,486.
40
Ground Lease:
To further reduce the equity requirement, the acquisition cost of the property has been replaced
with a long-term ground lease. Detailed in Appendix F, the projection analyzes the expected NOI
and annual growth rate in conjunction with the derived $2.03m property value as the basis for
supporting the derived annual ground lease payment. Project data derived from the Argus
discounted cash flow portrayed in Appendix H, results in a year one NOI of $363,62513 with a
projected annual growth of 1.5%. Capitalizing the NOI at a going in rate of 7.75% provides an
assessed property value of $4.7m in 2013. The derived annual ground lease payment of $95,000
was backed into assuming a renewable 70-year term, where the land rent has been modeled to
grow in increments of 5% every ten years. The modest growth rate is intended to reflect the long-
term average inflation rate of 3%54 with a risk premium 200bps premium. Modeling the
anticipated payments over the term and capitalized in the 70th year derives a terminal value of
$2,856,904. Accounting for the time value of money, the cash flows and reversionary ground
lease value are discounted at 5%14 to derive a $2,070,371 present value of the existing land and
building, corresponding with the derived $2,031,420 property value. Capitalizing the $95,000
ground lease payment at 4.68%15, reflects the city’s anticipated return, and results in a present
value of $2,030,348.
The accuracy of the ground lease payments is then verified by incorporating the NOI into the
projection above to derive a value of the structure. Assuming a nominal annual growth rate of
1.5% over the 70-year lease term, a terminal value is derived by capitalizing the 70th year NOI
using a 10.09%. Next, the annual subtotals are discounted by 11.6% to derive the structures
present value of $2,661,587. To prove the validity of the calculations, we ensure the sum of the
13 Adjusted NOI omits absorption & turnover vacancy, base rent abatements, and credit loss 14 Discount rate = Risk Free Rate (10yr T-Bills) + Investments Risk Premium 15 Total return = risk free rate (2.68%) + risk premium (200 bps)
41
present value of the property and the proposed building reflects the direct capitalize value of
$4.7m.
The ground lease arrangement provides an annual obligation of $95,000 for the leasehold interest
in the property versus the estimated annual debt service of $170,000 16 associated with acquiring
the fee simple interest. The resulting impact reduces the equity requirement by the assessed value
of the property. Applying the ground lease payment to the discounted cash flow model however,
reveals that the vast majority of the cash flow after debt service is consumed by the ground lease
obligation. As a result, the preferred returns to the equity investors are severely constrained,
presenting a risk that investors may seek alternative investments.
An alternative strategy reflected in the final analysis partitions the available annual cash flows
using a 60/40 split. Under this arrangement, the city would be entitled to 60% of the annual net
cash flow to satisfy the ground lease obligation, while the remaining 40% will be reserved for
distribution to equity investors. Instances where available cash flow insufficiently covers the
ground lease payments, the unpaid balance would carry over to subsequent years. Upon reversion,
the cumulative unpaid ground lease balance would be reimbursed from the net sales proceeds. As
modeled, other than the first year where net cash flow are projected to be negative, the cash flow
allocations in the second year are projected to cover 71% of the annual payment increasing to
98% by year four.
From the city’s perspective, the asset currently doesn’t produce any economic benefit to the city,
and it would not be unreasonable to assume the 60% distribution in exchange for a steady long-
term revenue source. Additionally, the city would reap the various indirect benefits such as the
increased sales and property tax revenue, job creation, rebranding of the city dock area, and the
elimination of a blighted vacant property. As a partner in the project, the city would also benefit
16 Assumes 100% financing at 6.5% amortized over 25 years.
42
from providing an essential service to the community that currently doesn’t exist, while also
recapturing lost revenues spent outside the city. Lastly, the ground lease option preserves the
ownership and equity interest that the city has vested in the asset. With a cost basis of $1.00, the
city will realize benefit from the annual rent payments return, while retaining the fee simple
interest in the asset.
Profitability Analysis:
Pursuing a ground lease through a public-private partnership reduces the equity requirement to
$1.3m. Applying the $593,486 equity value of the rehabilitation tax credit reduces the cash equity
requirement to $694,253. The revised stabilized discounted cash flow detailed in Appendix H
incorporates the market assumptions detailed previously as well as the $2,627,180 loan provided
by Sandy Spring Bank. Modeled based on a 10-year hold period commencing January 2013, the
property provides a positive net present value of $324,513, an unleveraged internal rate of return
of 9.42%, and leveraged internal rate of return of 13.67%, reflecting the role of positive leverage.
Partitioning the IRR reveals a relatively balanced distribution where 24% accounts for assured
value, 32% is devoted to prospective income, and the remaining 44% is based on the proceeds
realized from reversion. Leveraged cash on cash returns, or the cash flow after debt service
divided by the initial equity investment increases from negative 1.78% in year one to 12.33% in
year five and 16.1% in year ten. The negative return in year one primarily reflects the allocation
of $136,000 for vacancy and absorption turnover and $26,000 in base rent abatements.
Accounting for the ground lease obligation, reversionary value was based on a modified year
eleven NOI, reduced by the $99,750 ground lease obligation. Capitalized using an 8.25% terminal
capitalization rate reveals a projected gross sales price of $4,424,473.
43
Equity Distribution:
The $1,287,739 equity component is comprised of three components: the rehabilitation tax credit
equity of $593,486 accounts for 46%, the developer’s 5% contribution of $69,525, and the
investor groups $624,828 accounts for the remaining 49%. The nominal contribution by the
developer is predicated on the equity contribution realized through the tax credit.
Detailed in Appendix J, the equity investors are entitled to 40% of the net cash flow. The equity
obtained from the tax credit has been excluded from distribution, resulting in total cash equity for
distribution of $694,253. Distributions are allocated on a pari-passu basis where the developer
accounts for 10% and the investor group accounts for the remaining 90%. Annual cash flow
distributions are based on two distribution levels. The first level reflects an annual 8% cumulative
non-compounding return to the equity, equating to $55,540. In the event of cash flow shortages,
unpaid preferred returns carry over to subsequent years. Once cash flows are sufficient enough to
cover the preferred return and the accumulated unpaid preferred returns, the second distribution
level is applied. The excess funds are split 50/50 between the equity partners (front end) and the
developer as a back-end promote.
Upon reversion, the sales commission and the outstanding loans balance are deducted from the
gross sales price. The remaining net sales proceeds are distributed in three levels. First, any
unpaid cumulative preferred return and/or unpaid cumulative ground lease payments are
reimbursed. As illustrated in Appendix K, the city will be reimbursed the $108,326 in outstanding
ground lease payment. Once the city has bee compensated, their participation in the equity
distribution has been fulfilled and the remainder will be distributed among the equity partners.
The second distribution returns the investors net capital investment. The third level distributes the
remaining balance of $1.52m, split 60/40, where the equity partners receive 60% distributed pari-
passu, and the developer receives the remaining 40%.
44
The return analysis has been based on the assumption that $40,388 in equity will be deployed in
2011 and the remaining $653,865 in 2012. Projected average annual returns to the equity
investors reflect 20.27% correlating to an annually compounded internal rate of return of
13.89%17. Considering the limited risk and modest equity requirements associated with the
project, the projected returns are considered to be in line with equity investors’ expectations.
Sensitivity Analysis:
A sensitivity analysis has been incorporated in the equity distribution from a sale in 2022, where
the underwritten 8.25% terminal capitalization rate was tested using at 7.75% and 8.75% rate. In
the event the property traded for a 7.75%, average annual returns to equity would increase by
200bps or 22.24%. The annually compounded internal rate of return would reflect and increase of
84bps to 14.73%. If market conditions caused the property to trade at an 8.75% terminal
capitalization rate, the annual rate of return would decrease by 200bps to 18.42% and the internal
rate of return would be revised downward 84bps to13.05%.
A second sensitivity test incorporates a reference made in a recent interview with Mayor Josh
Cohen, where the monthly debt service payment on the city dock market house was quoted at
$20,00055. Assuming the figure is accurate, Graaskamps SFFA was used to derive a supported
rent of $45 per square foot. Deducting 20% for the city dock market house’s prime location,
provides a suggested current rent of $36.00 per SF in 2010 dollars. Accounting for the time value
of money provides a suggested rent in 2013 of $37.86 per SF. The discounted cash flow detailed
in Appendix L illustrates the effect of the increased first floor rent only, holding all other
assumption constant. Leveraged returns increase nearly 500bps over the baseline, to 18.67%
assuming a 10-year hold and reversionary value accounting for the ground lease obligation. The
primary benefit is reflected in the net cash flows available for distribution to service the ground
17 Does not account for promote return
45
lease obligation and the equity investors. Other than the first two years of the analysis, projected
net cash flows available for distribution will cover the annual combined obligations of 150,54018.
Development Schedule:
Appendix M outlines the development schedule for the proposed project. Project milestones are
broken into five categories: partnership formation, design, permits and approvals, financing, and
construction.
Upon the commitment by City of Annapolis to support the project as outlined, a formal market
study will be commissioned to verify the assumptions outlined above. Next, a limited liability
corporation will be formed as the primary entity for the project. Formal commitments from equity
partners and term agreements regarding expected distributions and assumed liability would then
be formalized. At the same time, partnership agreements with the City of Annapolis and/or the
Annapolis Economic Development Corporation would be finalized, including the city’s role in
the project, developer expectations, and agreement on the terms of the ground lease.
Once the terms of the deal are finalized, the design process will begin by selecting a qualified
architect that has a proven success record with similar product types in the historic district. The
architect’s first task after understanding the developer’s goals and vision for the end product will
be the schematic drawings, scheduled to take one month to complete. The initial plans will be
used for initial bidding, and presented to the historic preservation commission as well as planning
and zoning for initial comments. The architect’s next task, scheduled to take three months,
involves refining and incorporating comments and changes to produce the design development
plans. The refined plans will be formally submitted to the Historic Preservation Commission for
their review. Lastly, the architect will provide the construction documents, reflecting the final
18 Reflects 2013-2021 prior to increase of ground lease payment in 2022. Even then cash flows will cover obligations.
46
plans used for bidding and permitting. Three months have been allocated to meet this task,
however once the plans reach 75%, they will be distributed to potential general contractors for
final bid.
Upon the commitment by the city to act as a partner in the project, the rezoning, permitting, and
approvals process will be streamlined. The initial submission to the Historic Preservation
Commission will begin in January 2011, upon completion of the schematic drawings. At the same
time, a series of design charettes will be held in the community, in an attempt to incorporate ideas
and ultimately gain support for the project. Five months have been allocated to satisfy the
Historic Preservation Commission with their approval expected in the beginning of May 2011.
Three months has been allocated for the building permit review process, with approvals
anticipated in June 2011. The issuance of building permits will trigger a milestone in the
partnership agreement and will result in the commencement of the ground lease payments to the
city.
Securing permanent financing is predicated on the final development budget, which in turn is
based on 75% construction documents. As a result, permanent financing will be established in
March 2011. With the intention of utilizing Sandy Spring Bank as both the construction and
permanent lender, construction financing will be approved at the same time.
A general contractor will be solicited upon completion of schematic drawing, to assist in limiting
the construction risk associated in a redevelopment project. Services of note include cost control,
value engineering, and constructability reviews. This proposal has been modeled to assume a
construction manager at risk arrangement, where the general contractor assumes the risk of cost
overruns in return for the potential additional profits in the event the project is delivered under
budget. In this scenario, the general contractor will be selected based on bids derived from 75%
construction drawings. Doing so allows the general contractor to work with the developer and
47
architect to identify issues and incorporate any unidentified costs. Upon receiving permit in June
of 2011, construction will begin with a projected 18-month construction period. The issuance of
the certificate of occupancy is anticipated in late December 2014, along with the certification by
the National Parks Service for the Rehabilitation Tax Credit. The grand opening will be
scheduled for January 2013.
Conclusion:
This analysis has demonstrated that a mixed-use product comprised of a market house setting on
the ground floor and office suites above, represents the highest and best use for 9 St Marys Street
site. The proposed end use will provide a service that is currently absent in Annapolis, while also
portraying a distinctive sense of place that compliments the surrounding historic district. The
feasibility of the project has been proved through the incorporation of a public-private
partnership, the use of rehabilitation tax credits, and the establishment of a ground lease. As a
result, many of the inherent risks associated with the property have been mitigated, providing a
unique development opportunity to potential equity investors while providing attractive leveraged
of nearly 14%. It is recommended that the project be pursued as modeled.
48
References:
City of Annapolis. (2010) Code of Ordinances: Title 21 Planning and Zoning. Retrieved
from:http://library.municode.com/index.aspx?clientId=16754&stateId=20&stateName=Maryl
and
City of Annapolis Maryland. (2009). Annapolis Comprehensive Plan. Retrieved from:
http://www.ci.annapolis.md.us/Government/Departments/PlanZone/ComprehensivePlanning/
CompPlan.aspx
COSTAR Group, Inc. (2010) The COSTAR Retail Report: First Quarter 2010- Baltimore.
COSTAR Group, Inc. (2010) The COSTAR Office Report: First Quarter 2010- Baltimore.
Historic Preservation Commission Design Manual
http://www.google.com/url?sa=t&source=web&cd=4&ved=0CCEQFjAD&url=http%3A%2F
%2Fwww.annapolis.gov%2FGovernment%2FBoardsCommissions%2FHPCdocuments%2F
DesignMnl.pdf&ei=WU1YTJKtMML-8AaZofzfCg&usg=AFQjCNG3-7U-
UvGg_GzhHOhiB93TtOOqkg&sig2=MwGjSF-MVOO2xgZUzLer-w
Google maps. (2010, August 10). Retrieved from http://maps.google.com/
Graaskamp, James A. “The Fundamentals of Real Estate Development,” part of the Development
Component Series of the Urban Land Institute (1981): 18-22.
REIS, Inc. (2010) Apartment Asset Advisor: 9 St. Marys Street, Annapolis MD (Report originated
March 28, 2010).
REIS, Inc. (2010) Retail Asset Advisor: 9 St. Marys Street, Annapolis MD (Report originated
March 28, 2010).
49
REIS, Inc. (2010) Office Asset Advisor: 9 St. Marys Street, Annapolis MD (Report originated
June 28, 2010).
Steele, Kent. "A Backdoor Approach to Highest and Best Use Analysis." The Appraisal Journal
V. 59 (January 1991) P. 21-7, 59 (1991): 21-27.
TRF Policy Map. (2010, Ausgust 2). Retrieved from http://www.policymap.com/
US Census Bureau. (2010, August 1). Retrieved from http://www.census.gov/
Conversation with Jodie Rubino, Vice President and Commercial Relationship Manager for
Sandy Spring Bank.
Conversation with Lehr Jackson, President of Gone To Market, LLC.
Conversation with Patricia Blick, Chief of Historic Preservation for City of Annapolis.
Conversation with Jon Arason, Planning Director for City of Annapolis.
Conversations with Ben Wechsler, land use attorney with Linowes & Blocher, Annapolis MD.
1 Annapolis Historic Preservation Commission Design Guidelines 2 City of Annapolis website www.ci.annapolis.md.us/Residents/QuickFacts.aspx 3 City of Annapolis website www.ci.annapolis.md.us/Residents/QuickFacts.aspx 4 Annapolis Historic Preservation Commission Design Guidelines 5 Annapolis Website www.ci.annapolis.md.us/Residents/QuickFacts.aspx 6 Annapolis Comprehensive Plan pg 16. 7 Policy Map 8 Policy Map 9 Reported in 2008 inflation-adjusted numbers. US Census Bureau, 2007 Economic Census. 10 City of Annapolis website 11 2009 Annapolis Comprehensive Plan 12 Annapolis Zoning Code 13 Patricia Blick, Chief of Historic Preservation, City of Annapolis
14 Historic Preservation Commission Design Guidelines pg 33
15 Historic Preservation Commission Design Guidelines pg 25
16 Historic Preservation Commission Design Guidelines p 36
50
17 Source: RS Means, Q1 2010 18 RS Means Q1 2010
19 RS Means Q1 2010
20 Land use attorney for Linowes & Blocher in the Annapolis 21 Jodie Robino, VP & Commercial Relationship Manager for Sandy Spring Bank in Annapolis 22 James A. Graaskamp, “The Fundamentals of Real Estate Development,” part of the
Development Component Series of the Urban Land Institute (1981): 18-22. 23 REIS: Apartment Asset Advisor
24 Source: 2008 Survey of Income & Expense in Rental Apartment Properties 25 REIS Apartment pg. 9
26 Source: Real Estate Finance and Investments by Bruggeman and Fisher. 27 REIS Office Advisor pg. 46
28 REIS Office Advisor pg. 39
29 REIS Office Advisor pg. 45
30 REIS Office Advisor pg. 40
31 REIS Office Advisor pg. 40
32 REIS Office Advisor pg. 40
33 REIS Office Advisor pg. 40
34 REIS Retail Advisor pg. 34
35 REIS Retail Advisor pg. 41
36 REIS Retail Advisor pg. 32
37 REIS Retail Advisor pg. 42
38 REIS Retail Advisor pg. 42
39 Per David Sislen, Bristol Capital Corporation 40 City of Annapolis Website www.ci.annapolis.md.us/Residents/QuickFacts.aspx 41 Gone to Market, LLC proposal in response to RFP issued by City of Annapolis to redevelop
city dock market house. 42 Based on recent conversation with Annapolis resident Eric Timme, Financial Analyst for the
State of Maryland. 43 Stated in conversation held on July 14, 2010. 44 Source: Project Public Place website. 45 Ben Wechsler, Linowes & Blocher. 46 Article 66B of the Maryland Annotated Code 47 Reflects estimates provided by Duany Plater-Zyberk & Company’s market study for Roanoke,
VA City Market. 48 Wall Street Journal as of August 13, 2010. 49 Wall Street Journal as of August 13, 2010. 50 Wall Street Journal’s Dow Jones Industrial Average yield. 51 Provided by Thomas Sullivan, hard money and mezzanine debt investor, Washington DC 52 National Trust Community Investment Corporation
http://www.ntcic.org/basics/tax_credit_calculator.html
53 Matt Sislen and Jordan Bishop of Dante Partners, Washington DC. 54 Figure provided by Roger Staiger, economist and professor at Johns Hopkins University. 55 Source: The Annapolis Sound http://www.annapolissound.com/politics/soundtv-7-questions-
mayor-cohen-market-house-q7-set-record-straight/

Appendix A: Density Matrix
Annapolis Recreation CenterDensity Matrix
Existing:1st Floor 6,750 2nd Floor 6,570 Ex. GSF 13,320 Ex. RSF 12,570
Acres S F FARLand Area 0.6 26,136 0.51
Proposed Additions:Width Depth Addt'l SF
A. Compromise Entrance 37 20 730 Compromise South 40 10 400 Compromise North 40 10 400
1st Fl Total 1,530
B. St. Marys St 40 10 400Newman St 40 7.5 300
1st Floor 7002nd Floor 700
C. 3rd Floor 34 84 2,856
Multi-Family:Orientation SF1st Floor 6,750 Addition 2,230 Common Area 21% 1,886 Rentable Area 7,094
2nd Floor 6,570 Addition 700 Common Area 20% 1,454 Rentable Area 5,816
3rd Floor 43% 2,856 Common Area 20% 571 Rentable Area 2,285
GSF 19,106 RSF 15,195 Added SF 5,786 Proposed FAR 0.73 % Increase 43%
Office:Orientation SF1st Floor 6,750 Addition 2,230 Vert Penetr. 375 Rentable Area 8,605
2nd Floor 6,570 Addition 700 Vert Penetr. 375 Rentable Area 6,895
3rd Floor 43% 2,856 Vert Penetr. 375 Rentable Area 2,481
GLA 19,106 RBA 17,981 Added SF 5,786 FAR 0.73 % Increase 43%
Retail AND Mixed Use:Office & Retail Orientation SF
1st Floor 6,750 100% 8,605 Addition 2,230 715Vert Penetr. 375 12.03 Rentable Area 8,605
70% 4,599 2nd Floor 6,570 715Addition 700 6.43 Vert Penetr. 1,197 Rentable Area 6,073 30% 4,006
715GLA 16,250 5.60 RBA 14,678 Added SF 2,930 FAR 0.62 % Increase 22%

Appendix B: Construction Budget Detail
Construction Budget: Source RS Means Q2 2010
Site Area (S.F.) 26,136Floor Area (GSF): 16,250
% $/SF Cost
ACQUISITION 36% 125.56 2,040,386 0.6-Acre Site 95% 119.54 1,942,530 Closing Costs (2-2.5%) 2% 2.51 40,808 Brokerage Fees (3%) 1.5% 1.88 30,606 Construction Loan Fees RTC 1% 1.53 24,817 Appraisal 0.1% 0.10 1,625
HARD COSTS -- RESTORATION 42% 146.18 2,375,350 Building Sitework 4% 4.82 96,250
General Sitework 3.00 48,750 Resurface Existing ($5k/spot) 1.82 47,500
Substructure RTC 3% 4.49 73,000 Standard Foundations 1.11 18,000 Slab on Grade 2.03 33,000 Basement Excavation 0.06 1,000 Basement Walls 1.29 21,000
Shell RTC 19% 27.58 448,000 Floor Construction 10.40 169,000 Roof Construction 2.92 47,500 Exterior Walls 7.57 123,000 Exterior Windows 3.85 62,500 Exterior Doors 0.62 10,000 Roof Coverings 2.22 36,000
Interiors RTC 15% 22.31 362,500 Partitions 2.55 41,500 Interior Doors 2.31 37,500 Fittings 0.25 4,000 Stair Construction 6.28 102,000 Wall Finishes 0.86 14,000 Floor Finishes 5.63 91,500 Ceiling Finishes 4.43 72,000
Services RTC 33% 47.75 776,000 Elevators and Lifts 16.40 266,500 Plumbing Fixtures 3.63 59,000 Domestic Water Distribution 0.40 6,500 Rain Water Drainage 0.46 7,500 Terminal & Package Units 6.77 110,000 Sprinklers 2.52 41,000 Standpipes 2.55 41,500 Electrical Service/Distribution 1.54 25,000 Lighting and Branch Wiring 10.28 167,000 Communications and Security 3.05 49,500 Other Electrical Systems 0.15 2,500
Equipment & RTC 1% 1.20 19,500 Other Equipment (Detections Systems, Emergency Lighting, Directory Board)
1.20 19,500
Tenant Improvements 7% 24.70 175,703 Retail Tenant Improvements (1st Floor 8,605 GSF) Report quotes $5/SF 10.15 87,341 Office Tenant Improvements (2nd Floor 6,073 GSF) 14.55 88,362
General Conditions 18% 26.12 424,397 LEED Silver Cert. (3% TPC New Construction; 5% Gold) RTC 5% 5.71 92,735 General Conditions, Overhead (8%), Fee (4%) 12% 14.41 234,114 Contingency 5% 6.00 97,548
SOFT COSTS 21% 72.53 1,178,577 Architectural Fees RTC 13% 15.61 253,624 Land Planner Fees RTC 1.5% 1.80 29,264 Engineering Fees RTC 4.3% 5.10 82,915 Legal Fees RTC 8% 6.15 100,000 Enviro Studies / Other Consultants RTC 1% 0.62 10,000 Soil Testing RTC 1% 1.50 24,387 Permit Fees / Bond RTC 2% 1.80 29,264 Construction Interest RTC 12% 8.95 145,454 Permanent Loan Fees 2% 1.21 19,704 Real Estate Taxes (2 RTC 3% 2.46 40,000 Marketing RTC 6% 4.00 65,000 Market Study 1% 0.62 10,000 Developer Fee RTC 5% 6.00 97,548 Utility Connection RTC 2% 1.45 23,481 Water & Sewer Tap RTC 3% 1.87 30,388 Contingency 5% 6.00 97,548 Builder's Risk RTC 2% 1.50 24,375 Accounting and Tax Credit Cost Cert RTC 1% 0.50 8,125 Preservation Consultant RTC 1% 0.62 10,000 Tax Credit Fee RTC 0% 0.15 2,500 Operating & Lease-Up Reserve RTC 6% 4.62 75,000
TOTAL PROJECT COST 100% 344.27 5,594,313 Land Cost 36% 125.56 2,040,386 Hard Costs 42% 146.18 2,375,350 Soft Costs 21% 72.53 1,178,577
Annapolis Recreation Center

Appendix C: Valuation Models
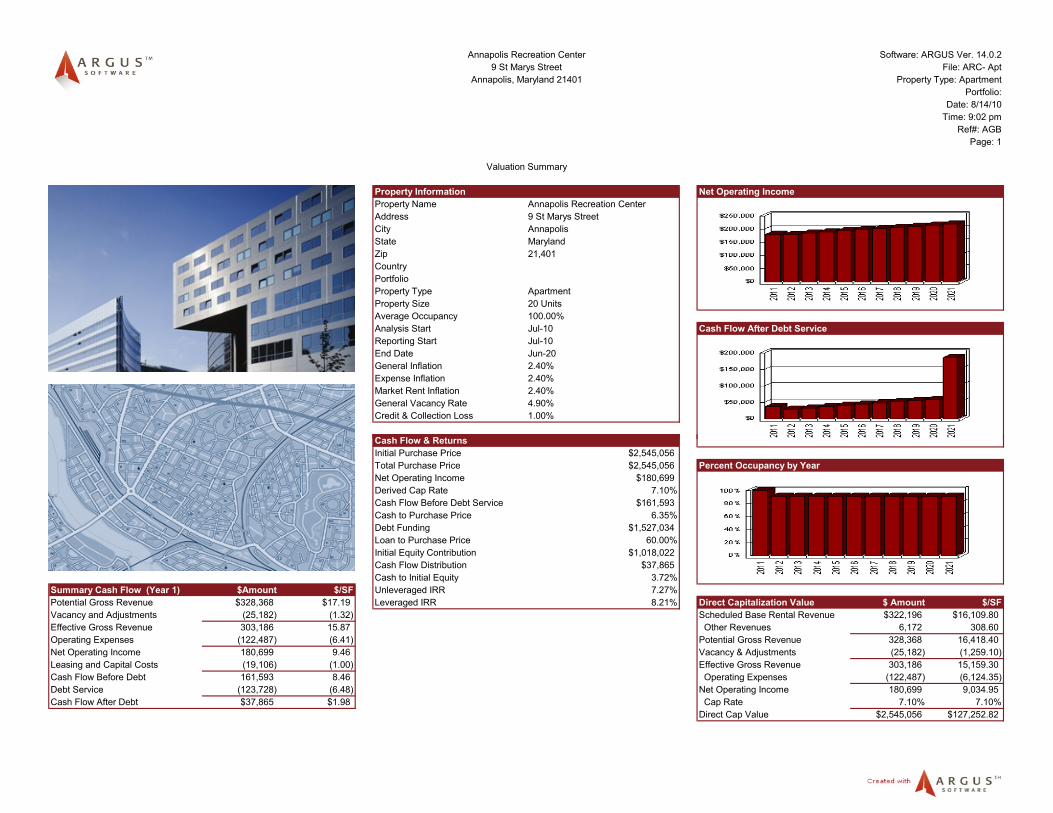
Software: ARGUS Ver. 14.0.2File: ARC- Apt
Property Type: ApartmentPortfolio:
Date: 8/14/10Time: 9:02 pm
Ref#: AGBPage: 1
Property Information Net Operating IncomeProperty Name Annapolis Recreation CenterAddress 9 St Marys StreetCity AnnapolisState MarylandZip 21,401CountryPortfolioProperty Type ApartmentProperty Size 20 UnitsAverage Occupancy 100.00%Analysis Start Jul-10 Cash Flow After Debt ServiceReporting Start Jul-10End Date Jun-20General Inflation 2.40%Expense Inflation 2.40%Market Rent Inflation 2.40%General Vacancy Rate 4.90%Credit & Collection Loss 1.00%
Cash Flow & Returns
Valuation Summary
Annapolis Recreation Center9 St Marys Street
Annapolis, Maryland 21401
Cash Flow & ReturnsInitial Purchase Price $2,545,056Total Purchase Price $2,545,056 Percent Occupancy by YearNet Operating Income $180,699Derived Cap Rate 7.10%Cash Flow Before Debt Service $161,593Cash to Purchase Price 6.35%Debt Funding $1,527,034Loan to Purchase Price 60.00%Initial Equity Contribution $1,018,022Cash Flow Distribution $37,865Cash to Initial Equity 3.72%
Summary Cash Flow (Year 1) $Amount $/SF Unleveraged IRR 7.27%Potential Gross Revenue $328,368 $17.19 Leveraged IRR 8.21% Direct Capitalization Value $ Amount $/SFVacancy and Adjustments (25,182) (1.32) Scheduled Base Rental Revenue $322,196 $16,109.80Effective Gross Revenue 303,186 15.87 Other Revenues 6,172 308.60Operating Expenses (122,487) (6.41) Potential Gross Revenue 328,368 16,418.40Net Operating Income 180,699 9.46 Vacancy & Adjustments (25,182) (1,259.10)Leasing and Capital Costs (19,106) (1.00) Effective Gross Revenue 303,186 15,159.30Cash Flow Before Debt 161,593 8.46 Operating Expenses (122,487) (6,124.35)Debt Service (123,728) (6.48) Net Operating Income 180,699 9,034.95Cash Flow After Debt $37,865 $1.98 Cap Rate 7.10% 7.10%
Direct Cap Value $2,545,056 $127,252.82
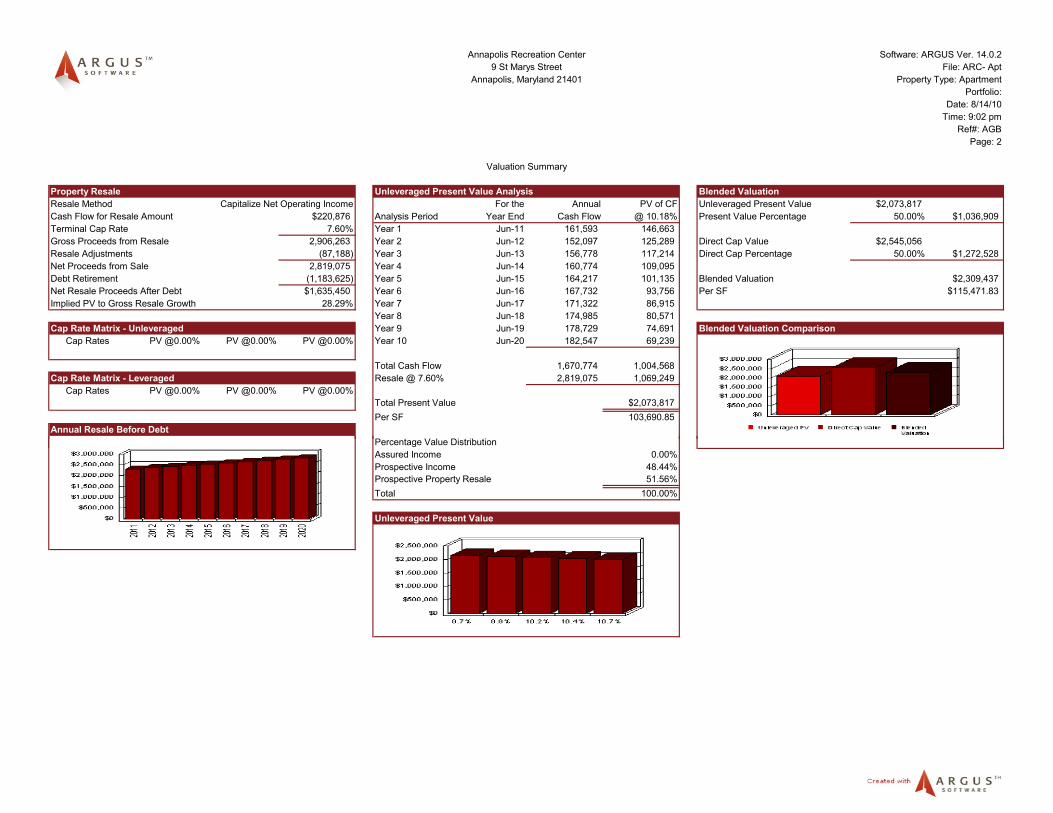
Software: ARGUS Ver. 14.0.2File: ARC- Apt
Property Type: ApartmentPortfolio:
Date: 8/14/10Time: 9:02 pm
Ref#: AGBPage: 2
Property Resale Unleveraged Present Value Analysis Blended ValuationResale Method Capitalize Net Operating Income For the Annual PV of CF Unleveraged Present Value $2,073,817Cash Flow for Resale Amount $220,876 Analysis Period Year End Cash Flow @ 10.18% Present Value Percentage 50.00% $1,036,909Terminal Cap Rate 7.60% Year 1 Jun-11 161,593 146,663Gross Proceeds from Resale 2,906,263 Year 2 Jun-12 152,097 125,289 Direct Cap Value $2,545,056Resale Adjustments (87,188) Year 3 Jun-13 156,778 117,214 Direct Cap Percentage 50.00% $1,272,528Net Proceeds from Sale 2,819,075 Year 4 Jun-14 160,774 109,095Debt Retirement (1,183,625) Year 5 Jun-15 164,217 101,135 Blended Valuation $2,309,437Net Resale Proceeds After Debt $1,635,450 Year 6 Jun-16 167,732 93,756 Per SF $115,471.83Implied PV to Gross Resale Growth 28.29% Year 7 Jun-17 171,322 86,915
Year 8 Jun-18 174,985 80,571Cap Rate Matrix - Unleveraged Year 9 Jun-19 178,729 74,691 Blended Valuation Comparison
Cap Rates PV @0.00% PV @0.00% PV @0.00% Year 10 Jun-20 182,547 69,239
Total Cash Flow 1,670,774 1,004,568Cap Rate Matrix - Leveraged Resale @ 7.60% 2,819,075 1,069,249
Cap Rates PV @0.00% PV @0.00% PV @0.00%Total Present Value $2,073,817Per SF 103,690.85
Annual Resale Before DebtPercentage Value Distribution
Valuation Summary
Annapolis, Maryland 21401
Annapolis Recreation Center9 St Marys Street
Percentage Value DistributionAssured Income 0.00%Prospective Income 48.44%Prospective Property Resale 51.56%Total 100.00%
Unleveraged Present Value
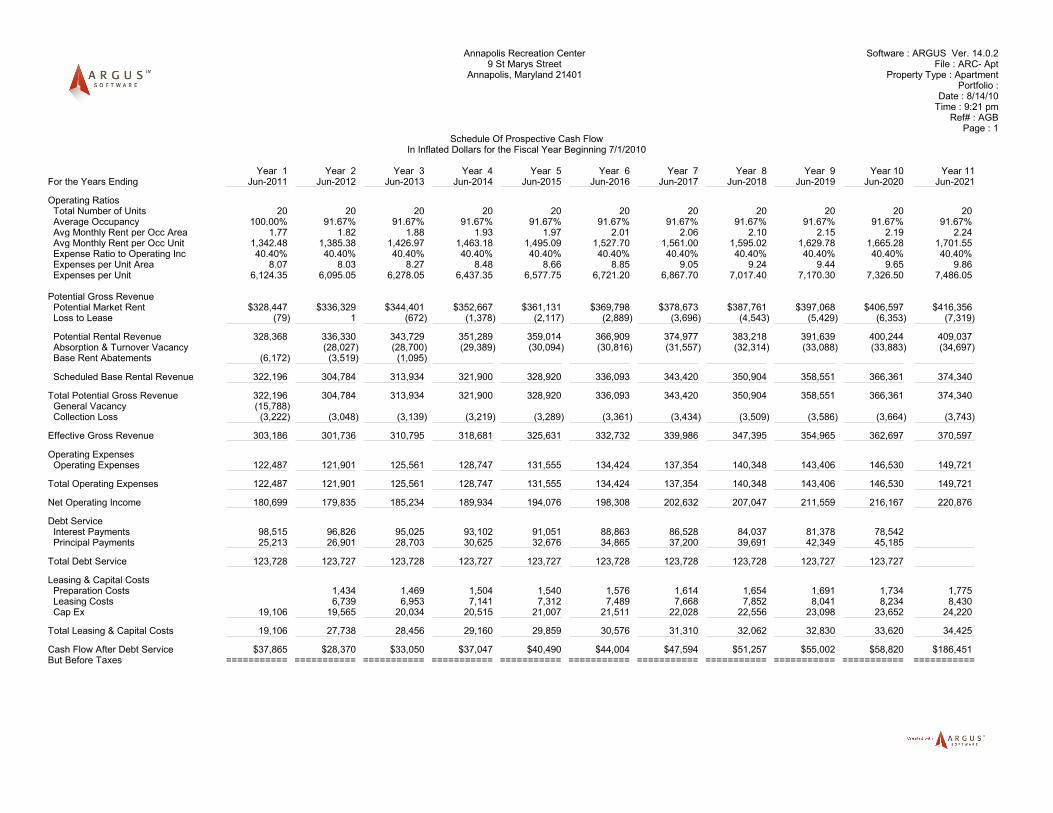
Annapolis Recreation Center Software : ARGUS Ver. 14.0.2 9 St Marys Street File : ARC- Apt
Annapolis, Maryland 21401 Property Type : Apartment Portfolio :
Date : 8/14/10 Time : 9:21 pm Ref# : AGB
Page : 1 Schedule Of Prospective Cash Flow
In Inflated Dollars for the Fiscal Year Beginning 7/1/2010
Year 1 Year 2 Year 3 Year 4 Year 5 Year 6 Year 7 Year 8 Year 9 Year 10 Year 11For the Years Ending Jun-2011 Jun-2012 Jun-2013 Jun-2014 Jun-2015 Jun-2016 Jun-2017 Jun-2018 Jun-2019 Jun-2020 Jun-2021
Operating Ratios Total Number of Units 20 20 20 20 20 20 20 20 20 20 20 Average Occupancy 100.00% 91.67% 91.67% 91.67% 91.67% 91.67% 91.67% 91.67% 91.67% 91.67% 91.67% Avg Monthly Rent per Occ Area 1.77 1.82 1.88 1.93 1.97 2.01 2.06 2.10 2.15 2.19 2.24 Avg Monthly Rent per Occ Unit 1,342.48 1,385.38 1,426.97 1,463.18 1,495.09 1,527.70 1,561.00 1,595.02 1,629.78 1,665.28 1,701.55 Expense Ratio to Operating Inc 40.40% 40.40% 40.40% 40.40% 40.40% 40.40% 40.40% 40.40% 40.40% 40.40% 40.40% Expenses per Unit Area 8.07 8.03 8.27 8.48 8.66 8.85 9.05 9.24 9.44 9.65 9.86 Expenses per Unit 6,124.35 6,095.05 6,278.05 6,437.35 6,577.75 6,721.20 6,867.70 7,017.40 7,170.30 7,326.50 7,486.05
Potential Gross Revenue Potential Market Rent $328,447 $336,329 $344,401 $352,667 $361,131 $369,798 $378,673 $387,761 $397,068 $406,597 $416,356 Loss to Lease (79) 1 (672) (1,378) (2,117) (2,889) (3,696) (4,543) (5,429) (6,353) (7,319)
Potential Rental Revenue 328,368 336,330 343,729 351,289 359,014 366,909 374,977 383,218 391,639 400,244 409,037 Absorption & Turnover Vacancy (28,027) (28,700) (29,389) (30,094) (30,816) (31,557) (32,314) (33,088) (33,883) (34,697) Base Rent Abatements (6,172) (3,519) (1,095)
Scheduled Base Rental Revenue 322,196 304,784 313,934 321,900 328,920 336,093 343,420 350,904 358,551 366,361 374,340
Total Potential Gross Revenue 322,196 304,784 313,934 321,900 328,920 336,093 343,420 350,904 358,551 366,361 374,340 General Vacancy (15,788) Collection Loss (3,222) (3,048) (3,139) (3,219) (3,289) (3,361) (3,434) (3,509) (3,586) (3,664) (3,743)
Effective Gross Revenue 303,186 301,736 310,795 318,681 325,631 332,732 339,986 347,395 354,965 362,697 370,597
Operating Expenses Operating Expenses 122,487 121,901 125,561 128,747 131,555 134,424 137,354 140,348 143,406 146,530 149,721
Total Operating Expenses 122,487 121,901 125,561 128,747 131,555 134,424 137,354 140,348 143,406 146,530 149,721
Net Operating Income 180,699 179,835 185,234 189,934 194,076 198,308 202,632 207,047 211,559 216,167 220,876
Debt Service Interest Payments 98,515 96,826 95,025 93,102 91,051 88,863 86,528 84,037 81,378 78,542 Principal Payments 25,213 26,901 28,703 30,625 32,676 34,865 37,200 39,691 42,349 45,185
Total Debt Service 123,728 123,727 123,728 123,727 123,727 123,728 123,728 123,728 123,727 123,727
Leasing & Capital Costs Preparation Costs 1,434 1,469 1,504 1,540 1,576 1,614 1,654 1,691 1,734 1,775 Leasing Costs 6,739 6,953 7,141 7,312 7,489 7,668 7,852 8,041 8,234 8,430 Cap Ex 19,106 19,565 20,034 20,515 21,007 21,511 22,028 22,556 23,098 23,652 24,220
Total Leasing & Capital Costs 19,106 27,738 28,456 29,160 29,859 30,576 31,310 32,062 32,830 33,620 34,425
Cash Flow After Debt Service $37,865 $28,370 $33,050 $37,047 $40,490 $44,004 $47,594 $51,257 $55,002 $58,820 $186,451 But Before Taxes =========== =========== =========== =========== =========== =========== =========== =========== =========== =========== ===========
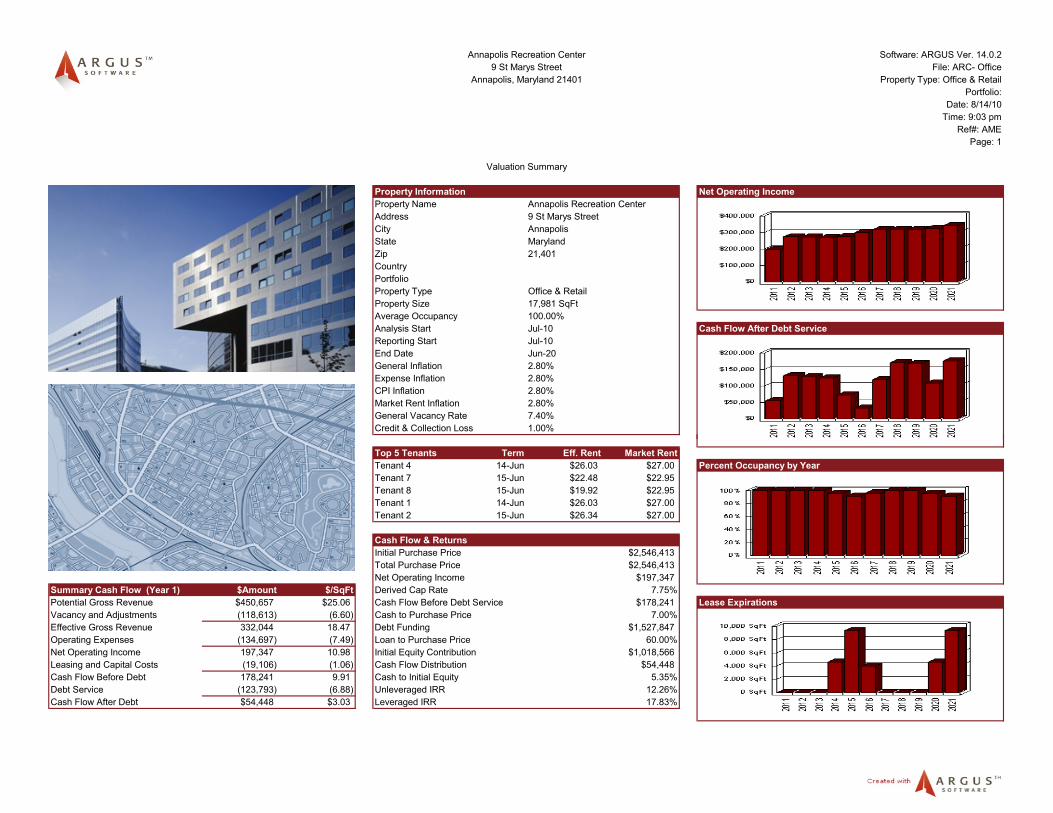
Software: ARGUS Ver. 14.0.2File: ARC- Office
Property Type: Office & RetailPortfolio:
Date: 8/14/10Time: 9:03 pm
Ref#: AMEPage: 1
Property Information Net Operating IncomeProperty Name Annapolis Recreation CenterAddress 9 St Marys StreetCity AnnapolisState MarylandZip 21,401CountryPortfolioProperty Type Office & RetailProperty Size 17,981 SqFtAverage Occupancy 100.00%Analysis Start Jul-10 Cash Flow After Debt ServiceReporting Start Jul-10End Date Jun-20General Inflation 2.80%Expense Inflation 2.80%CPI Inflation 2.80%Market Rent Inflation 2.80%General Vacancy Rate 7.40%Credit & Collection Loss 1.00%
Valuation Summary
Annapolis Recreation Center9 St Marys Street
Annapolis, Maryland 21401
Top 5 Tenants Term Eff. Rent Market RentTenant 4 14-Jun $26.03 $27.00 Percent Occupancy by YearTenant 7 15-Jun $22.48 $22.95Tenant 8 15-Jun $19.92 $22.95Tenant 1 14-Jun $26.03 $27.00Tenant 2 15-Jun $26.34 $27.00
Cash Flow & ReturnsInitial Purchase Price $2,546,413Total Purchase Price $2,546,413Net Operating Income $197,347
Summary Cash Flow (Year 1) $Amount $/SqFt Derived Cap Rate 7.75%Potential Gross Revenue $450,657 $25.06 Cash Flow Before Debt Service $178,241 Lease ExpirationsVacancy and Adjustments (118,613) (6.60) Cash to Purchase Price 7.00%Effective Gross Revenue 332,044 18.47 Debt Funding $1,527,847Operating Expenses (134,697) (7.49) Loan to Purchase Price 60.00%Net Operating Income 197,347 10.98 Initial Equity Contribution $1,018,566Leasing and Capital Costs (19,106) (1.06) Cash Flow Distribution $54,448Cash Flow Before Debt 178,241 9.91 Cash to Initial Equity 5.35%Debt Service (123,793) (6.88) Unleveraged IRR 12.26%Cash Flow After Debt $54,448 $3.03 Leveraged IRR 17.83%
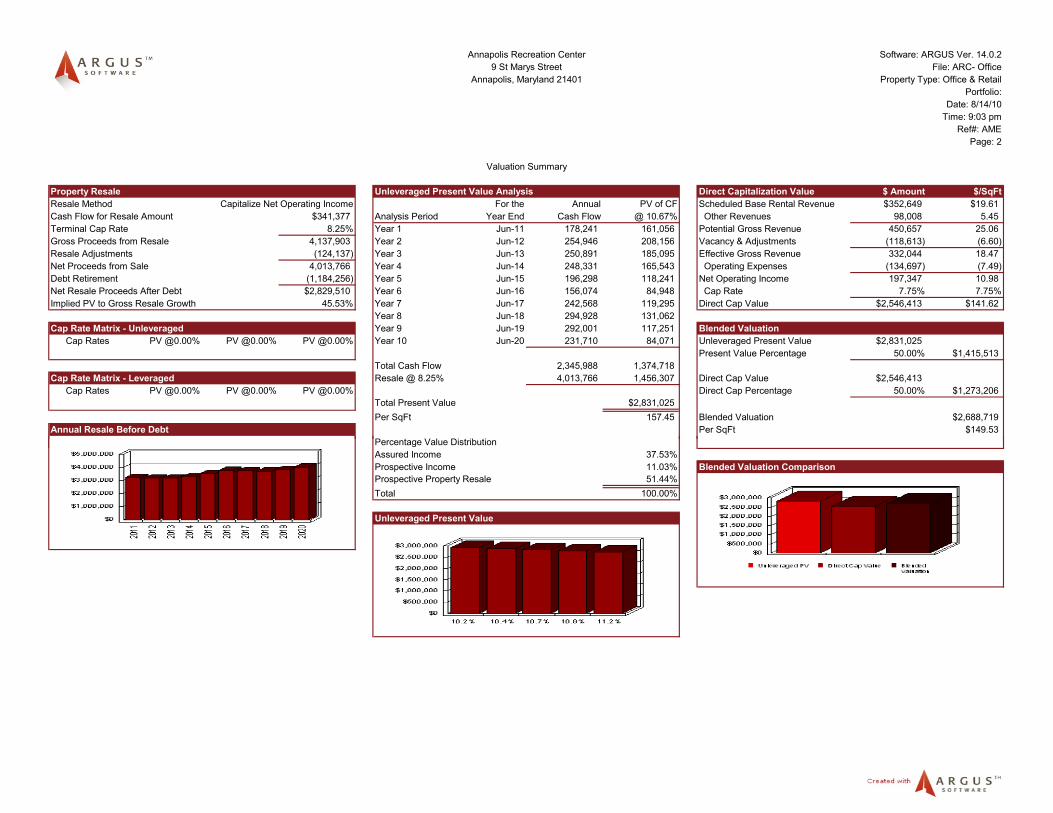
Software: ARGUS Ver. 14.0.2File: ARC- Office
Property Type: Office & RetailPortfolio:
Date: 8/14/10Time: 9:03 pm
Ref#: AMEPage: 2
Property Resale Unleveraged Present Value Analysis Direct Capitalization Value $ Amount $/SqFtResale Method Capitalize Net Operating Income For the Annual PV of CF Scheduled Base Rental Revenue $352,649 $19.61Cash Flow for Resale Amount $341,377 Analysis Period Year End Cash Flow @ 10.67% Other Revenues 98,008 5.45Terminal Cap Rate 8.25% Year 1 Jun-11 178,241 161,056 Potential Gross Revenue 450,657 25.06Gross Proceeds from Resale 4,137,903 Year 2 Jun-12 254,946 208,156 Vacancy & Adjustments (118,613) (6.60)Resale Adjustments (124,137) Year 3 Jun-13 250,891 185,095 Effective Gross Revenue 332,044 18.47Net Proceeds from Sale 4,013,766 Year 4 Jun-14 248,331 165,543 Operating Expenses (134,697) (7.49)Debt Retirement (1,184,256) Year 5 Jun-15 196,298 118,241 Net Operating Income 197,347 10.98Net Resale Proceeds After Debt $2,829,510 Year 6 Jun-16 156,074 84,948 Cap Rate 7.75% 7.75%Implied PV to Gross Resale Growth 45.53% Year 7 Jun-17 242,568 119,295 Direct Cap Value $2,546,413 $141.62
Year 8 Jun-18 294,928 131,062Cap Rate Matrix - Unleveraged Year 9 Jun-19 292,001 117,251 Blended Valuation
Cap Rates PV @0.00% PV @0.00% PV @0.00% Year 10 Jun-20 231,710 84,071 Unleveraged Present Value $2,831,025Present Value Percentage 50.00% $1,415,513
Total Cash Flow 2,345,988 1,374,718Cap Rate Matrix - Leveraged Resale @ 8.25% 4,013,766 1,456,307 Direct Cap Value $2,546,413
Cap Rates PV @0.00% PV @0.00% PV @0.00% Direct Cap Percentage 50.00% $1,273,206Total Present Value $2,831,025Per SqFt 157.45 Blended Valuation $2,688,719
Annual Resale Before Debt Per SqFt $149.53Percentage Value Distribution
Valuation Summary
Annapolis, Maryland 21401
Annapolis Recreation Center9 St Marys Street
Percentage Value DistributionAssured Income 37.53%Prospective Income 11.03% Blended Valuation ComparisonProspective Property Resale 51.44%Total 100.00%
Unleveraged Present Value
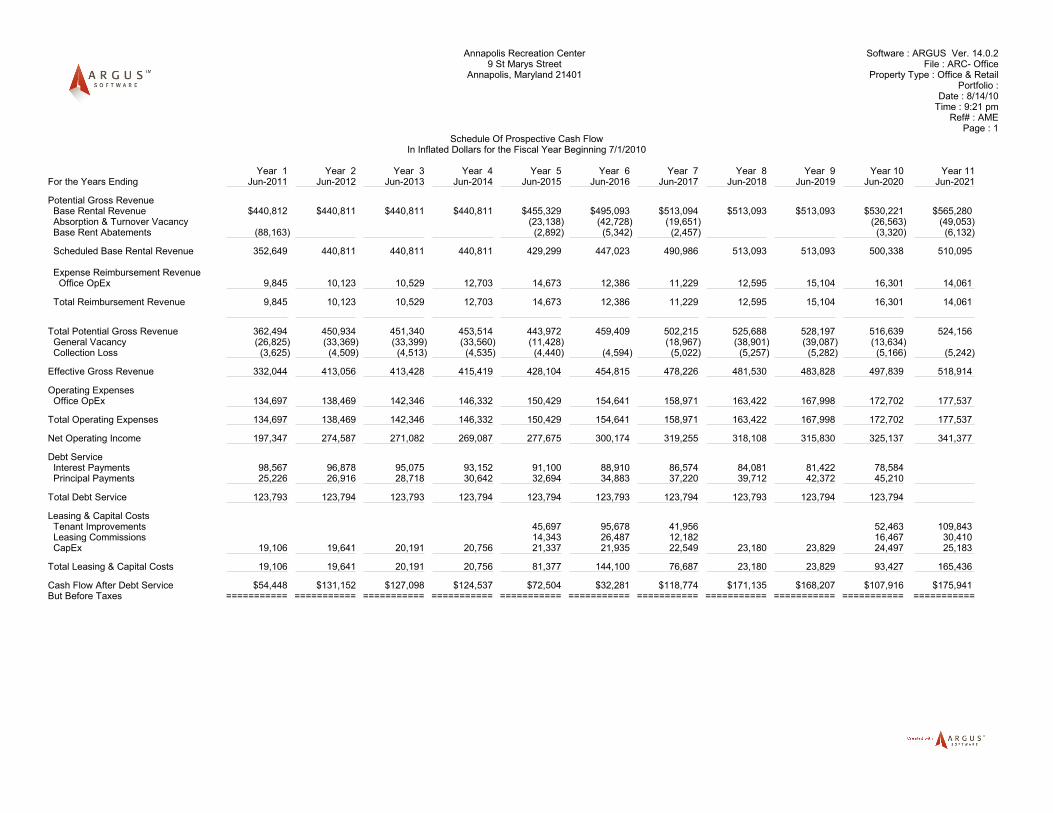
Annapolis Recreation Center Software : ARGUS Ver. 14.0.2 9 St Marys Street File : ARC- Office
Annapolis, Maryland 21401 Property Type : Office & Retail Portfolio :
Date : 8/14/10 Time : 9:21 pm Ref# : AME
Page : 1 Schedule Of Prospective Cash Flow
In Inflated Dollars for the Fiscal Year Beginning 7/1/2010
Year 1 Year 2 Year 3 Year 4 Year 5 Year 6 Year 7 Year 8 Year 9 Year 10 Year 11For the Years Ending Jun-2011 Jun-2012 Jun-2013 Jun-2014 Jun-2015 Jun-2016 Jun-2017 Jun-2018 Jun-2019 Jun-2020 Jun-2021
Potential Gross Revenue Base Rental Revenue $440,812 $440,811 $440,811 $440,811 $455,329 $495,093 $513,094 $513,093 $513,093 $530,221 $565,280 Absorption & Turnover Vacancy (23,138) (42,728) (19,651) (26,563) (49,053) Base Rent Abatements (88,163) (2,892) (5,342) (2,457) (3,320) (6,132)
Scheduled Base Rental Revenue 352,649 440,811 440,811 440,811 429,299 447,023 490,986 513,093 513,093 500,338 510,095
Expense Reimbursement Revenue Office OpEx 9,845 10,123 10,529 12,703 14,673 12,386 11,229 12,595 15,104 16,301 14,061
Total Reimbursement Revenue 9,845 10,123 10,529 12,703 14,673 12,386 11,229 12,595 15,104 16,301 14,061
Total Potential Gross Revenue 362,494 450,934 451,340 453,514 443,972 459,409 502,215 525,688 528,197 516,639 524,156 General Vacancy (26,825) (33,369) (33,399) (33,560) (11,428) (18,967) (38,901) (39,087) (13,634) Collection Loss (3,625) (4,509) (4,513) (4,535) (4,440) (4,594) (5,022) (5,257) (5,282) (5,166) (5,242)
Effective Gross Revenue 332,044 413,056 413,428 415,419 428,104 454,815 478,226 481,530 483,828 497,839 518,914
Operating Expenses Office OpEx 134,697 138,469 142,346 146,332 150,429 154,641 158,971 163,422 167,998 172,702 177,537
Total Operating Expenses 134,697 138,469 142,346 146,332 150,429 154,641 158,971 163,422 167,998 172,702 177,537
Net Operating Income 197,347 274,587 271,082 269,087 277,675 300,174 319,255 318,108 315,830 325,137 341,377
Debt Service Interest Payments 98,567 96,878 95,075 93,152 91,100 88,910 86,574 84,081 81,422 78,584 Principal Payments 25,226 26,916 28,718 30,642 32,694 34,883 37,220 39,712 42,372 45,210
Total Debt Service 123,793 123,794 123,793 123,794 123,794 123,793 123,794 123,793 123,794 123,794
Leasing & Capital Costs Tenant Improvements 45,697 95,678 41,956 52,463 109,843 Leasing Commissions 14,343 26,487 12,182 16,467 30,410 CapEx 19,106 19,641 20,191 20,756 21,337 21,935 22,549 23,180 23,829 24,497 25,183
Total Leasing & Capital Costs 19,106 19,641 20,191 20,756 81,377 144,100 76,687 23,180 23,829 93,427 165,436
Cash Flow After Debt Service $54,448 $131,152 $127,098 $124,537 $72,504 $32,281 $118,774 $171,135 $168,207 $107,916 $175,941 But Before Taxes =========== =========== =========== =========== =========== =========== =========== =========== =========== =========== ===========
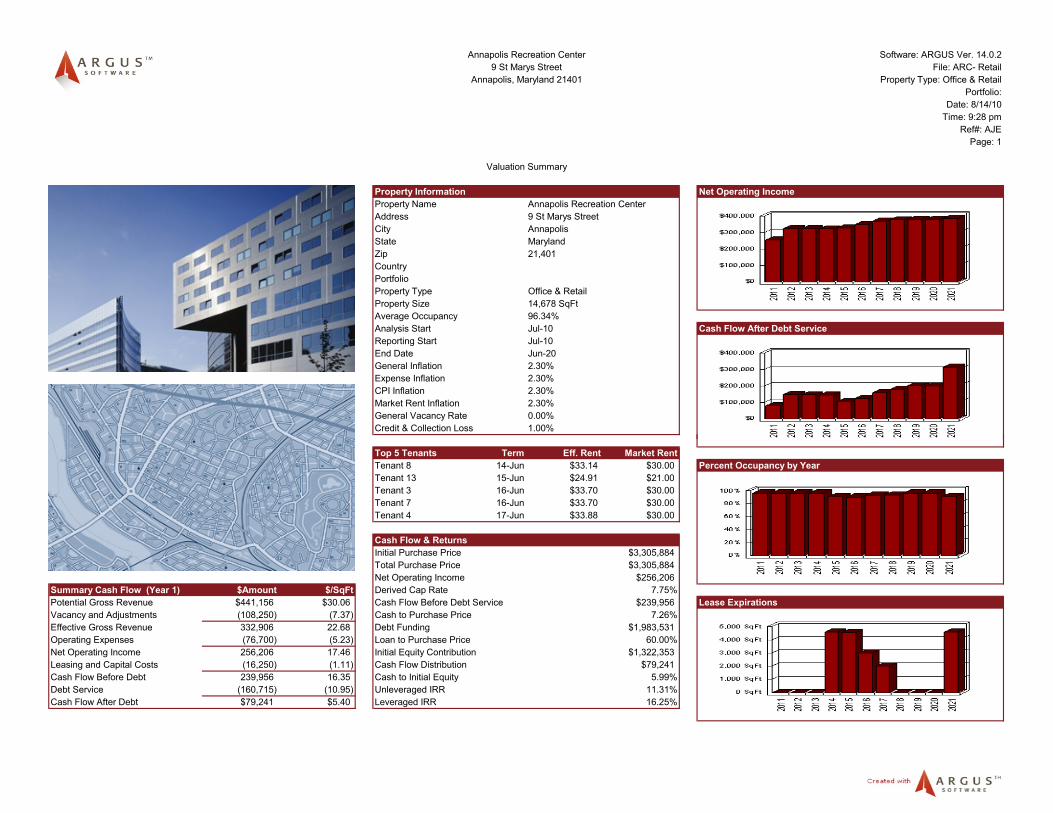
Software: ARGUS Ver. 14.0.2File: ARC- Retail
Property Type: Office & RetailPortfolio:
Date: 8/14/10Time: 9:28 pm
Ref#: AJEPage: 1
Property Information Net Operating IncomeProperty Name Annapolis Recreation CenterAddress 9 St Marys StreetCity AnnapolisState MarylandZip 21,401CountryPortfolioProperty Type Office & RetailProperty Size 14,678 SqFtAverage Occupancy 96.34%Analysis Start Jul-10 Cash Flow After Debt ServiceReporting Start Jul-10End Date Jun-20General Inflation 2.30%Expense Inflation 2.30%CPI Inflation 2.30%Market Rent Inflation 2.30%General Vacancy Rate 0.00%Credit & Collection Loss 1.00%
Valuation Summary
Annapolis Recreation Center9 St Marys Street
Annapolis, Maryland 21401
Top 5 Tenants Term Eff. Rent Market RentTenant 8 14-Jun $33.14 $30.00 Percent Occupancy by YearTenant 13 15-Jun $24.91 $21.00Tenant 3 16-Jun $33.70 $30.00Tenant 7 16-Jun $33.70 $30.00Tenant 4 17-Jun $33.88 $30.00
Cash Flow & ReturnsInitial Purchase Price $3,305,884Total Purchase Price $3,305,884Net Operating Income $256,206
Summary Cash Flow (Year 1) $Amount $/SqFt Derived Cap Rate 7.75%Potential Gross Revenue $441,156 $30.06 Cash Flow Before Debt Service $239,956 Lease ExpirationsVacancy and Adjustments (108,250) (7.37) Cash to Purchase Price 7.26%Effective Gross Revenue 332,906 22.68 Debt Funding $1,983,531Operating Expenses (76,700) (5.23) Loan to Purchase Price 60.00%Net Operating Income 256,206 17.46 Initial Equity Contribution $1,322,353Leasing and Capital Costs (16,250) (1.11) Cash Flow Distribution $79,241Cash Flow Before Debt 239,956 16.35 Cash to Initial Equity 5.99%Debt Service (160,715) (10.95) Unleveraged IRR 11.31%Cash Flow After Debt $79,241 $5.40 Leveraged IRR 16.25%
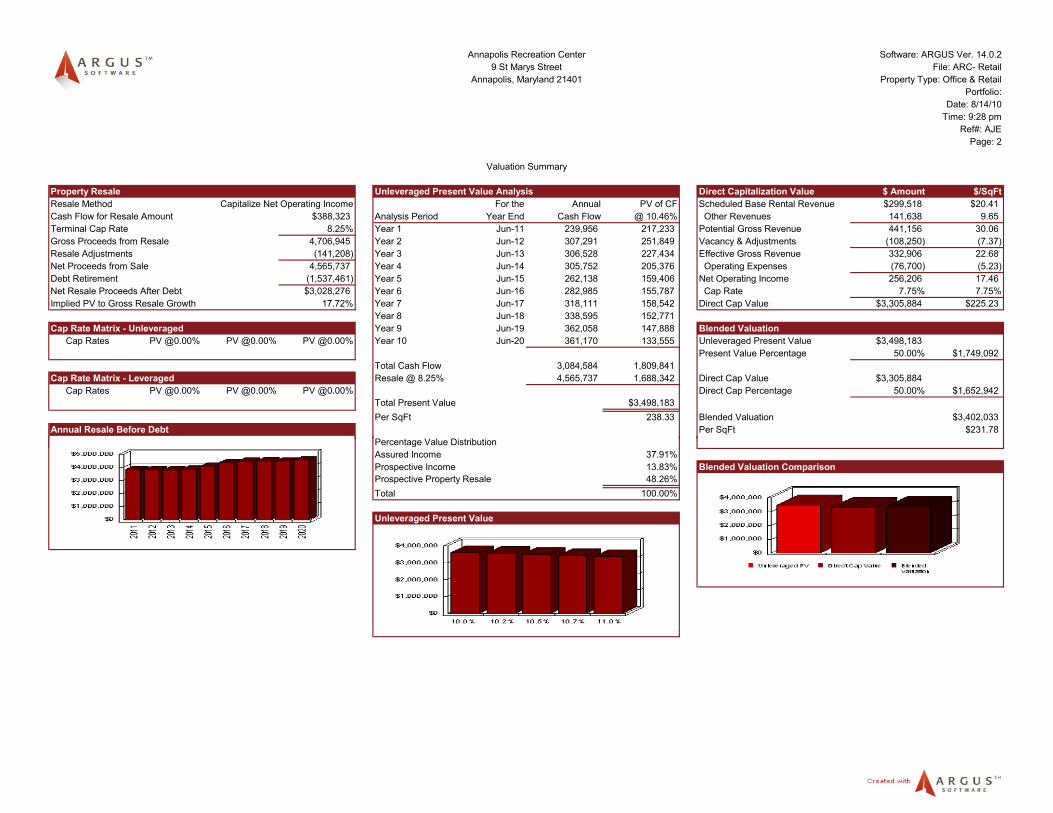
Software: ARGUS Ver. 14.0.2File: ARC- Retail
Property Type: Office & RetailPortfolio:
Date: 8/14/10Time: 9:28 pm
Ref#: AJEPage: 2
Property Resale Unleveraged Present Value Analysis Direct Capitalization Value $ Amount $/SqFtResale Method Capitalize Net Operating Income For the Annual PV of CF Scheduled Base Rental Revenue $299,518 $20.41Cash Flow for Resale Amount $388,323 Analysis Period Year End Cash Flow @ 10.46% Other Revenues 141,638 9.65Terminal Cap Rate 8.25% Year 1 Jun-11 239,956 217,233 Potential Gross Revenue 441,156 30.06Gross Proceeds from Resale 4,706,945 Year 2 Jun-12 307,291 251,849 Vacancy & Adjustments (108,250) (7.37)Resale Adjustments (141,208) Year 3 Jun-13 306,528 227,434 Effective Gross Revenue 332,906 22.68Net Proceeds from Sale 4,565,737 Year 4 Jun-14 305,752 205,376 Operating Expenses (76,700) (5.23)Debt Retirement (1,537,461) Year 5 Jun-15 262,138 159,406 Net Operating Income 256,206 17.46Net Resale Proceeds After Debt $3,028,276 Year 6 Jun-16 282,985 155,787 Cap Rate 7.75% 7.75%Implied PV to Gross Resale Growth 17.72% Year 7 Jun-17 318,111 158,542 Direct Cap Value $3,305,884 $225.23
Year 8 Jun-18 338,595 152,771Cap Rate Matrix - Unleveraged Year 9 Jun-19 362,058 147,888 Blended Valuation
Cap Rates PV @0.00% PV @0.00% PV @0.00% Year 10 Jun-20 361,170 133,555 Unleveraged Present Value $3,498,183Present Value Percentage 50.00% $1,749,092
Total Cash Flow 3,084,584 1,809,841Cap Rate Matrix - Leveraged Resale @ 8.25% 4,565,737 1,688,342 Direct Cap Value $3,305,884
Cap Rates PV @0.00% PV @0.00% PV @0.00% Direct Cap Percentage 50.00% $1,652,942Total Present Value $3,498,183Per SqFt 238.33 Blended Valuation $3,402,033
Annual Resale Before Debt Per SqFt $231.78Percentage Value Distribution
Valuation Summary
Annapolis, Maryland 21401
Annapolis Recreation Center9 St Marys Street
Percentage Value DistributionAssured Income 37.91%Prospective Income 13.83% Blended Valuation ComparisonProspective Property Resale 48.26%Total 100.00%
Unleveraged Present Value
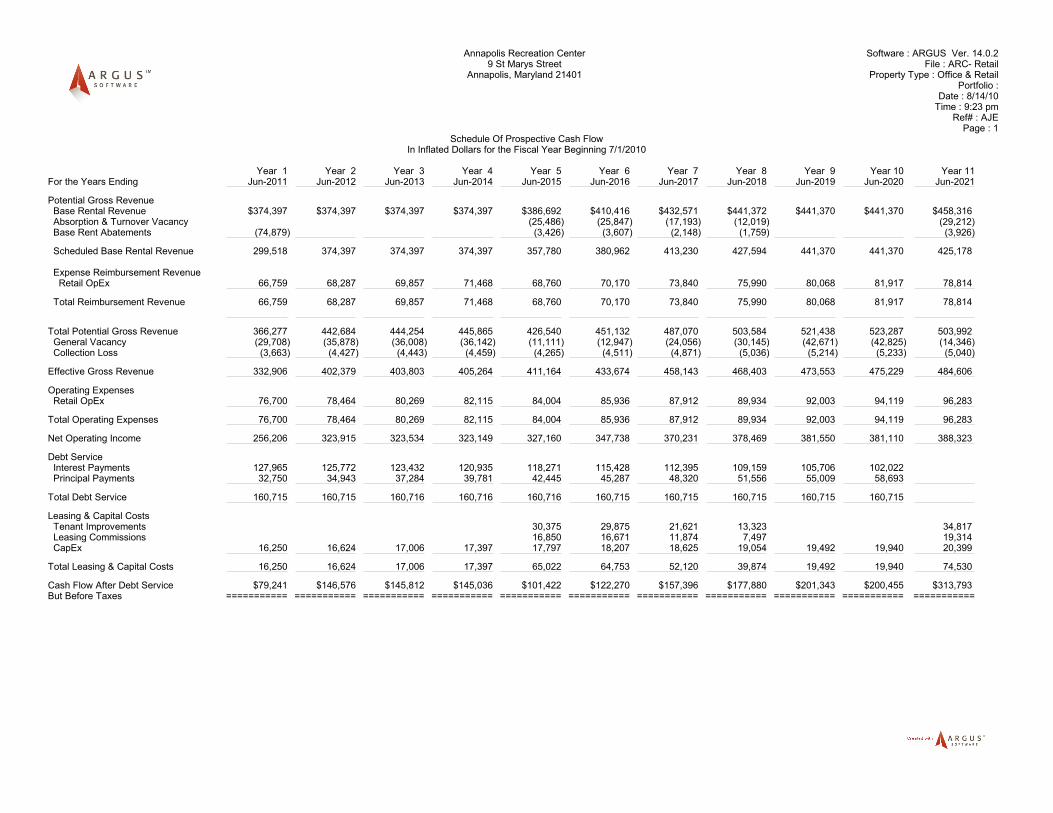
Annapolis Recreation Center Software : ARGUS Ver. 14.0.2 9 St Marys Street File : ARC- Retail
Annapolis, Maryland 21401 Property Type : Office & Retail Portfolio :
Date : 8/14/10 Time : 9:23 pm
Ref# : AJE Page : 1
Schedule Of Prospective Cash FlowIn Inflated Dollars for the Fiscal Year Beginning 7/1/2010
Year 1 Year 2 Year 3 Year 4 Year 5 Year 6 Year 7 Year 8 Year 9 Year 10 Year 11For the Years Ending Jun-2011 Jun-2012 Jun-2013 Jun-2014 Jun-2015 Jun-2016 Jun-2017 Jun-2018 Jun-2019 Jun-2020 Jun-2021
Potential Gross Revenue Base Rental Revenue $374,397 $374,397 $374,397 $374,397 $386,692 $410,416 $432,571 $441,372 $441,370 $441,370 $458,316 Absorption & Turnover Vacancy (25,486) (25,847) (17,193) (12,019) (29,212) Base Rent Abatements (74,879) (3,426) (3,607) (2,148) (1,759) (3,926)
Scheduled Base Rental Revenue 299,518 374,397 374,397 374,397 357,780 380,962 413,230 427,594 441,370 441,370 425,178
Expense Reimbursement Revenue Retail OpEx 66,759 68,287 69,857 71,468 68,760 70,170 73,840 75,990 80,068 81,917 78,814
Total Reimbursement Revenue 66,759 68,287 69,857 71,468 68,760 70,170 73,840 75,990 80,068 81,917 78,814
Total Potential Gross Revenue 366,277 442,684 444,254 445,865 426,540 451,132 487,070 503,584 521,438 523,287 503,992 General Vacancy (29,708) (35,878) (36,008) (36,142) (11,111) (12,947) (24,056) (30,145) (42,671) (42,825) (14,346) Collection Loss (3,663) (4,427) (4,443) (4,459) (4,265) (4,511) (4,871) (5,036) (5,214) (5,233) (5,040)
Effective Gross Revenue 332,906 402,379 403,803 405,264 411,164 433,674 458,143 468,403 473,553 475,229 484,606
Operating Expenses Retail OpEx 76,700 78,464 80,269 82,115 84,004 85,936 87,912 89,934 92,003 94,119 96,283
Total Operating Expenses 76,700 78,464 80,269 82,115 84,004 85,936 87,912 89,934 92,003 94,119 96,283
Net Operating Income 256,206 323,915 323,534 323,149 327,160 347,738 370,231 378,469 381,550 381,110 388,323
Debt Service Interest Payments 127,965 125,772 123,432 120,935 118,271 115,428 112,395 109,159 105,706 102,022 Principal Payments 32,750 34,943 37,284 39,781 42,445 45,287 48,320 51,556 55,009 58,693
Total Debt Service 160,715 160,715 160,716 160,716 160,716 160,715 160,715 160,715 160,715 160,715
Leasing & Capital Costs Tenant Improvements 30,375 29,875 21,621 13,323 34,817 Leasing Commissions 16,850 16,671 11,874 7,497 19,314 CapEx 16,250 16,624 17,006 17,397 17,797 18,207 18,625 19,054 19,492 19,940 20,399
Total Leasing & Capital Costs 16,250 16,624 17,006 17,397 65,022 64,753 52,120 39,874 19,492 19,940 74,530
Cash Flow After Debt Service $79,241 $146,576 $145,812 $145,036 $101,422 $122,270 $157,396 $177,880 $201,343 $200,455 $313,793 But Before Taxes =========== =========== =========== =========== =========== =========== =========== =========== =========== =========== ===========
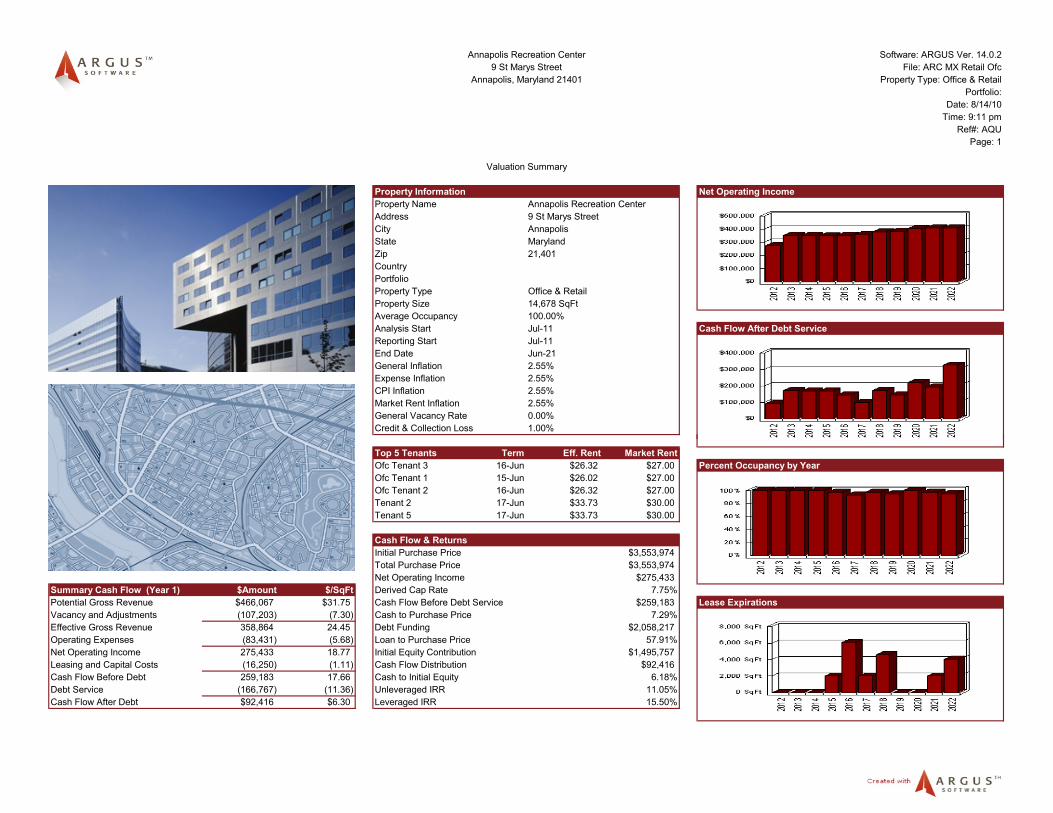
Software: ARGUS Ver. 14.0.2File: ARC MX Retail Ofc
Property Type: Office & RetailPortfolio:
Date: 8/14/10Time: 9:11 pm
Ref#: AQUPage: 1
Property Information Net Operating IncomeProperty Name Annapolis Recreation CenterAddress 9 St Marys StreetCity AnnapolisState MarylandZip 21,401CountryPortfolioProperty Type Office & RetailProperty Size 14,678 SqFtAverage Occupancy 100.00%Analysis Start Jul-11 Cash Flow After Debt ServiceReporting Start Jul-11End Date Jun-21General Inflation 2.55%Expense Inflation 2.55%CPI Inflation 2.55%Market Rent Inflation 2.55%General Vacancy Rate 0.00%Credit & Collection Loss 1.00%
Valuation Summary
Annapolis Recreation Center9 St Marys Street
Annapolis, Maryland 21401
Top 5 Tenants Term Eff. Rent Market RentOfc Tenant 3 16-Jun $26.32 $27.00 Percent Occupancy by YearOfc Tenant 1 15-Jun $26.02 $27.00Ofc Tenant 2 16-Jun $26.32 $27.00Tenant 2 17-Jun $33.73 $30.00Tenant 5 17-Jun $33.73 $30.00
Cash Flow & ReturnsInitial Purchase Price $3,553,974Total Purchase Price $3,553,974Net Operating Income $275,433
Summary Cash Flow (Year 1) $Amount $/SqFt Derived Cap Rate 7.75%Potential Gross Revenue $466,067 $31.75 Cash Flow Before Debt Service $259,183 Lease ExpirationsVacancy and Adjustments (107,203) (7.30) Cash to Purchase Price 7.29%Effective Gross Revenue 358,864 24.45 Debt Funding $2,058,217Operating Expenses (83,431) (5.68) Loan to Purchase Price 57.91%Net Operating Income 275,433 18.77 Initial Equity Contribution $1,495,757Leasing and Capital Costs (16,250) (1.11) Cash Flow Distribution $92,416Cash Flow Before Debt 259,183 17.66 Cash to Initial Equity 6.18%Debt Service (166,767) (11.36) Unleveraged IRR 11.05%Cash Flow After Debt $92,416 $6.30 Leveraged IRR 15.50%
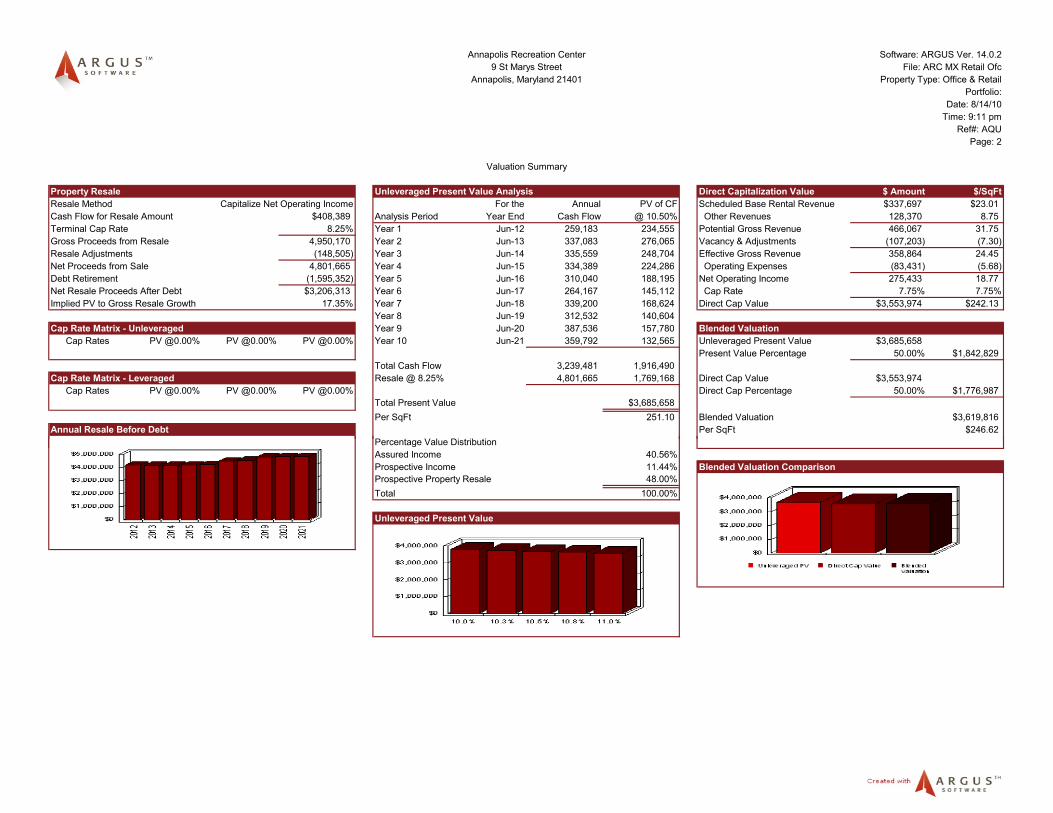
Software: ARGUS Ver. 14.0.2File: ARC MX Retail Ofc
Property Type: Office & RetailPortfolio:
Date: 8/14/10Time: 9:11 pm
Ref#: AQUPage: 2
Property Resale Unleveraged Present Value Analysis Direct Capitalization Value $ Amount $/SqFtResale Method Capitalize Net Operating Income For the Annual PV of CF Scheduled Base Rental Revenue $337,697 $23.01Cash Flow for Resale Amount $408,389 Analysis Period Year End Cash Flow @ 10.50% Other Revenues 128,370 8.75Terminal Cap Rate 8.25% Year 1 Jun-12 259,183 234,555 Potential Gross Revenue 466,067 31.75Gross Proceeds from Resale 4,950,170 Year 2 Jun-13 337,083 276,065 Vacancy & Adjustments (107,203) (7.30)Resale Adjustments (148,505) Year 3 Jun-14 335,559 248,704 Effective Gross Revenue 358,864 24.45Net Proceeds from Sale 4,801,665 Year 4 Jun-15 334,389 224,286 Operating Expenses (83,431) (5.68)Debt Retirement (1,595,352) Year 5 Jun-16 310,040 188,195 Net Operating Income 275,433 18.77Net Resale Proceeds After Debt $3,206,313 Year 6 Jun-17 264,167 145,112 Cap Rate 7.75% 7.75%Implied PV to Gross Resale Growth 17.35% Year 7 Jun-18 339,200 168,624 Direct Cap Value $3,553,974 $242.13
Year 8 Jun-19 312,532 140,604Cap Rate Matrix - Unleveraged Year 9 Jun-20 387,536 157,780 Blended Valuation
Cap Rates PV @0.00% PV @0.00% PV @0.00% Year 10 Jun-21 359,792 132,565 Unleveraged Present Value $3,685,658Present Value Percentage 50.00% $1,842,829
Total Cash Flow 3,239,481 1,916,490Cap Rate Matrix - Leveraged Resale @ 8.25% 4,801,665 1,769,168 Direct Cap Value $3,553,974
Cap Rates PV @0.00% PV @0.00% PV @0.00% Direct Cap Percentage 50.00% $1,776,987Total Present Value $3,685,658Per SqFt 251.10 Blended Valuation $3,619,816
Annual Resale Before Debt Per SqFt $246.62Percentage Value Distribution
Valuation Summary
Annapolis, Maryland 21401
Annapolis Recreation Center9 St Marys Street
Percentage Value DistributionAssured Income 40.56%Prospective Income 11.44% Blended Valuation ComparisonProspective Property Resale 48.00%Total 100.00%
Unleveraged Present Value
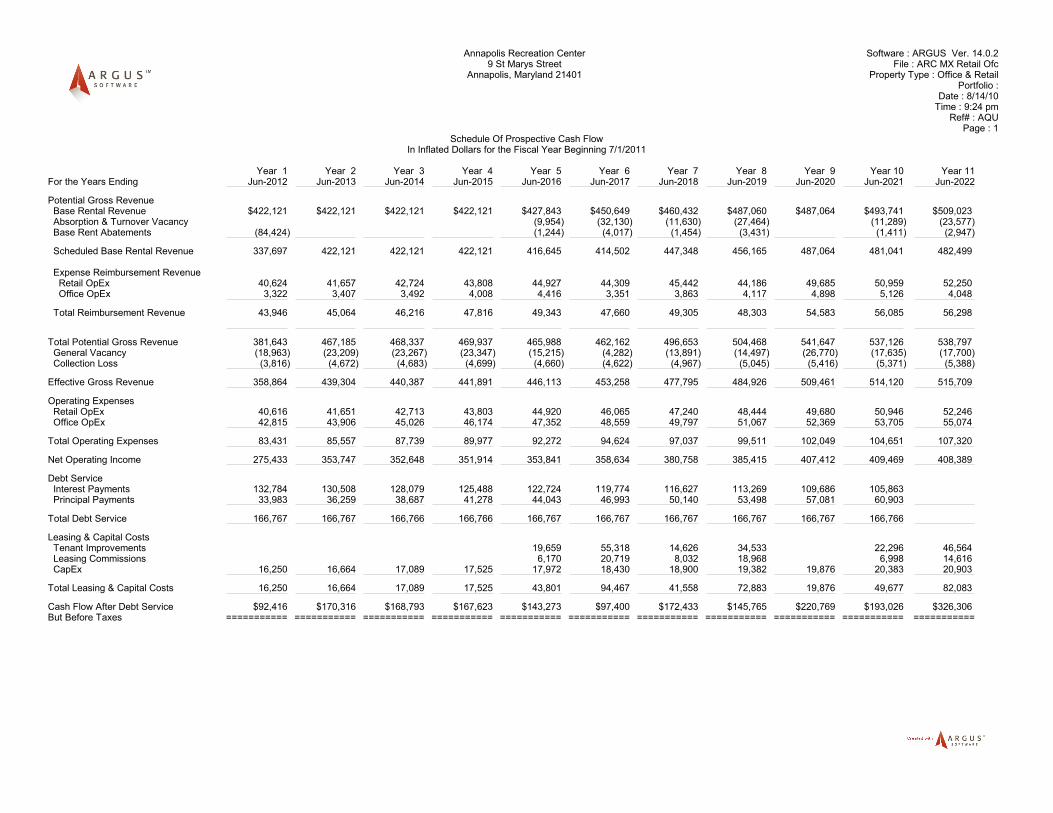
Annapolis Recreation Center Software : ARGUS Ver. 14.0.2 9 St Marys Street File : ARC MX Retail Ofc
Annapolis, Maryland 21401 Property Type : Office & Retail Portfolio :
Date : 8/14/10 Time : 9:24 pm Ref# : AQU
Page : 1 Schedule Of Prospective Cash Flow
In Inflated Dollars for the Fiscal Year Beginning 7/1/2011
Year 1 Year 2 Year 3 Year 4 Year 5 Year 6 Year 7 Year 8 Year 9 Year 10 Year 11For the Years Ending Jun-2012 Jun-2013 Jun-2014 Jun-2015 Jun-2016 Jun-2017 Jun-2018 Jun-2019 Jun-2020 Jun-2021 Jun-2022
Potential Gross Revenue Base Rental Revenue $422,121 $422,121 $422,121 $422,121 $427,843 $450,649 $460,432 $487,060 $487,064 $493,741 $509,023 Absorption & Turnover Vacancy (9,954) (32,130) (11,630) (27,464) (11,289) (23,577) Base Rent Abatements (84,424) (1,244) (4,017) (1,454) (3,431) (1,411) (2,947)
Scheduled Base Rental Revenue 337,697 422,121 422,121 422,121 416,645 414,502 447,348 456,165 487,064 481,041 482,499
Expense Reimbursement Revenue Retail OpEx 40,624 41,657 42,724 43,808 44,927 44,309 45,442 44,186 49,685 50,959 52,250 Office OpEx 3,322 3,407 3,492 4,008 4,416 3,351 3,863 4,117 4,898 5,126 4,048
Total Reimbursement Revenue 43,946 45,064 46,216 47,816 49,343 47,660 49,305 48,303 54,583 56,085 56,298
Total Potential Gross Revenue 381,643 467,185 468,337 469,937 465,988 462,162 496,653 504,468 541,647 537,126 538,797 General Vacancy (18,963) (23,209) (23,267) (23,347) (15,215) (4,282) (13,891) (14,497) (26,770) (17,635) (17,700) Collection Loss (3,816) (4,672) (4,683) (4,699) (4,660) (4,622) (4,967) (5,045) (5,416) (5,371) (5,388)
Effective Gross Revenue 358,864 439,304 440,387 441,891 446,113 453,258 477,795 484,926 509,461 514,120 515,709
Operating Expenses Retail OpEx 40,616 41,651 42,713 43,803 44,920 46,065 47,240 48,444 49,680 50,946 52,246 Office OpEx 42,815 43,906 45,026 46,174 47,352 48,559 49,797 51,067 52,369 53,705 55,074
Total Operating Expenses 83,431 85,557 87,739 89,977 92,272 94,624 97,037 99,511 102,049 104,651 107,320
Net Operating Income 275,433 353,747 352,648 351,914 353,841 358,634 380,758 385,415 407,412 409,469 408,389
Debt Service Interest Payments 132,784 130,508 128,079 125,488 122,724 119,774 116,627 113,269 109,686 105,863 Principal Payments 33,983 36,259 38,687 41,278 44,043 46,993 50,140 53,498 57,081 60,903
Total Debt Service 166,767 166,767 166,766 166,766 166,767 166,767 166,767 166,767 166,767 166,766
Leasing & Capital Costs Tenant Improvements 19,659 55,318 14,626 34,533 22,296 46,564 Leasing Commissions 6,170 20,719 8,032 18,968 6,998 14,616 CapEx 16,250 16,664 17,089 17,525 17,972 18,430 18,900 19,382 19,876 20,383 20,903
Total Leasing & Capital Costs 16,250 16,664 17,089 17,525 43,801 94,467 41,558 72,883 19,876 49,677 82,083
Cash Flow After Debt Service $92,416 $170,316 $168,793 $167,623 $143,273 $97,400 $172,433 $145,765 $220,769 $193,026 $326,306 But Before Taxes =========== =========== =========== =========== =========== =========== =========== =========== =========== =========== ===========

Appendix D: Feasibility Analysis
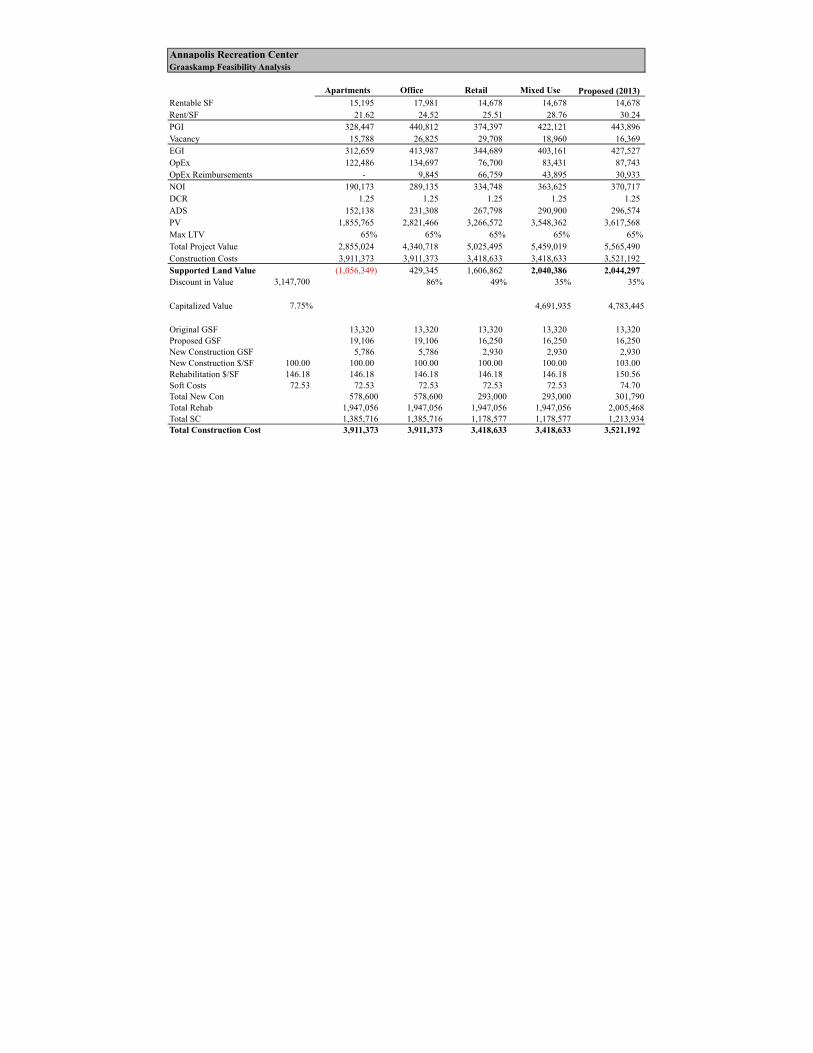
Annapolis Recreation CenterGraaskamp Feasibility Analysis
Apartments Office Retail Mixed Use Proposed (2013)Rentable SF 15,195 17,981 14,678 14,678 14,678 Rent/SF 21.62 24.52 25.51 28.76 30.24 PGI 328,447 440,812 374,397 422,121 443,896 Vacancy 15,788 26,825 29,708 18,960 16,369 EGI 312,659 413,987 344,689 403,161 427,527 OpEx 122,486 134,697 76,700 83,431 87,743 OpEx Reimbursements - 9,845 66,759 43,895 30,933 NOI 190,173 289,135 334,748 363,625 370,717 DCR 1.25 1.25 1.25 1.25 1.25 ADS 152,138 231,308 267,798 290,900 296,574 PV 1,855,765 2,821,466 3,266,572 3,548,362 3,617,568 Max LTV 65% 65% 65% 65% 65%Total Project Value 2,855,024 4,340,718 5,025,495 5,459,019 5,565,490 Construction Costs 3,911,373 3,911,373 3,418,633 3,418,633 3,521,192 Supported Land Value (1,056,349) 429,345 1,606,862 2,040,386 2,044,297 Discount in Value 3,147,700 86% 49% 35% 35%
Capitalized Value 7.75% 4,691,935 4,783,445
Original GSF 13,320 13,320 13,320 13,320 13,320 Proposed GSF 19,106 19,106 16,250 16,250 16,250 New Construction GSF 5,786 5,786 2,930 2,930 2,930 New Construction $/SF 100.00 100.00 100.00 100.00 100.00 103.00 Rehabilitation $/SF 146.18 146.18 146.18 146.18 146.18 150.56 Soft Costs 72.53 72.53 72.53 72.53 72.53 74.70 Total New Con 578,600 578,600 293,000 293,000 301,790 Total Rehab 1,947,056 1,947,056 1,947,056 1,947,056 2,005,468 Total SC 1,385,716 1,385,716 1,178,577 1,178,577 1,213,934 Total Construction Cost 3,911,373 3,911,373 3,418,633 3,418,633 3,521,192

Appendix E: Rehabilitation Tax Credit
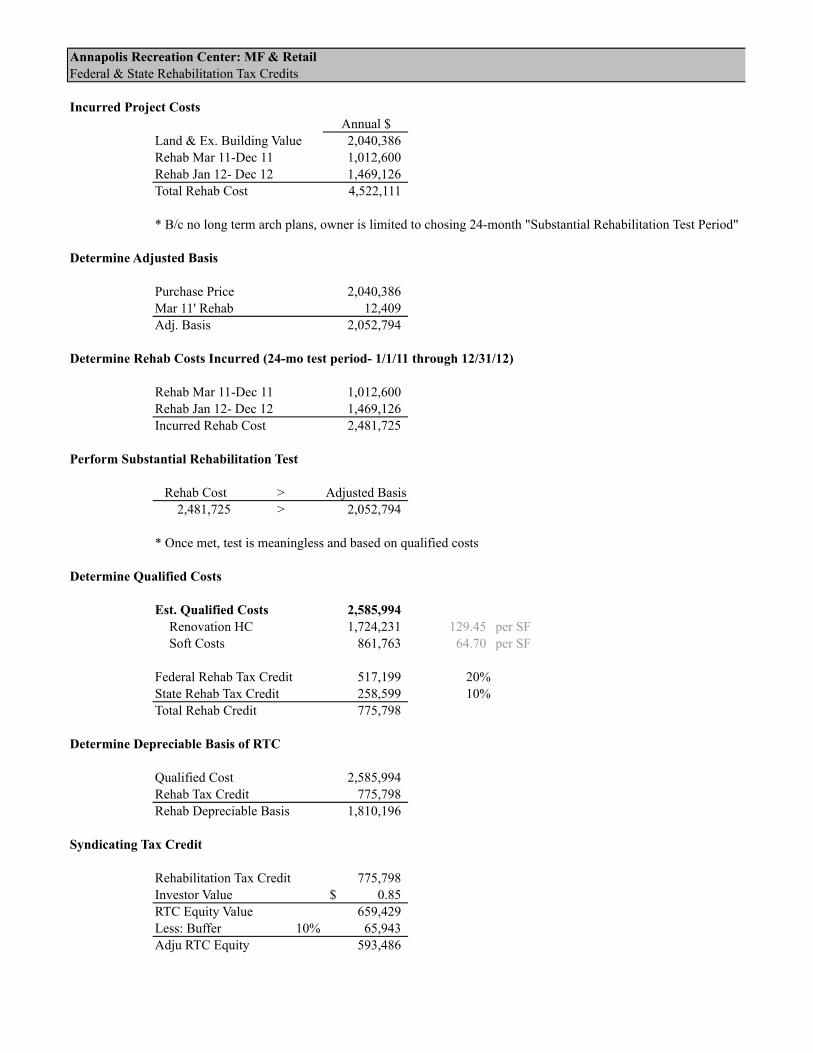
Annapolis Recreation Center: MF & RetailFederal & State Rehabilitation Tax Credits
Incurred Project CostsAnnual $
Land & Ex. Building Value 2,040,386 Rehab Mar 11-Dec 11 1,012,600 Rehab Jan 12- Dec 12 1,469,126 Total Rehab Cost 4,522,111
* B/c no long term arch plans, owner is limited to chosing 24-month "Substantial Rehabilitation Test Period"
Determine Adjusted Basis
Purchase Price 2,040,386 Mar 11' Rehab 12,409 Adj. Basis 2,052,794
Determine Rehab Costs Incurred (24-mo test period- 1/1/11 through 12/31/12)
Rehab Mar 11-Dec 11 1,012,600 Rehab Jan 12- Dec 12 1,469,126 Incurred Rehab Cost 2,481,725
Perform Substantial Rehabilitation Test
Rehab Cost > Adjusted Basis2,481,725 > 2,052,794
* Once met, test is meaningless and based on qualified costs
Determine Qualified Costs
Est. Qualified Costs 2,585,994 Renovation HC 1,724,231 129.45 per SFSoft Costs 861,763 64.70 per SF
Federal Rehab Tax Credit 517,199 20%State Rehab Tax Credit 258,599 10%Total Rehab Credit 775,798
Determine Depreciable Basis of RTC
Qualified Cost 2,585,994 Rehab Tax Credit 775,798 Rehab Depreciable Basis 1,810,196
Syndicating Tax Credit
Rehabilitation Tax Credit 775,798 Investor Value 0.85$ RTC Equity Value 659,429 Less: Buffer 10% 65,943 Adju RTC Equity 593,486

Appendix F: Ground Lease Derivation
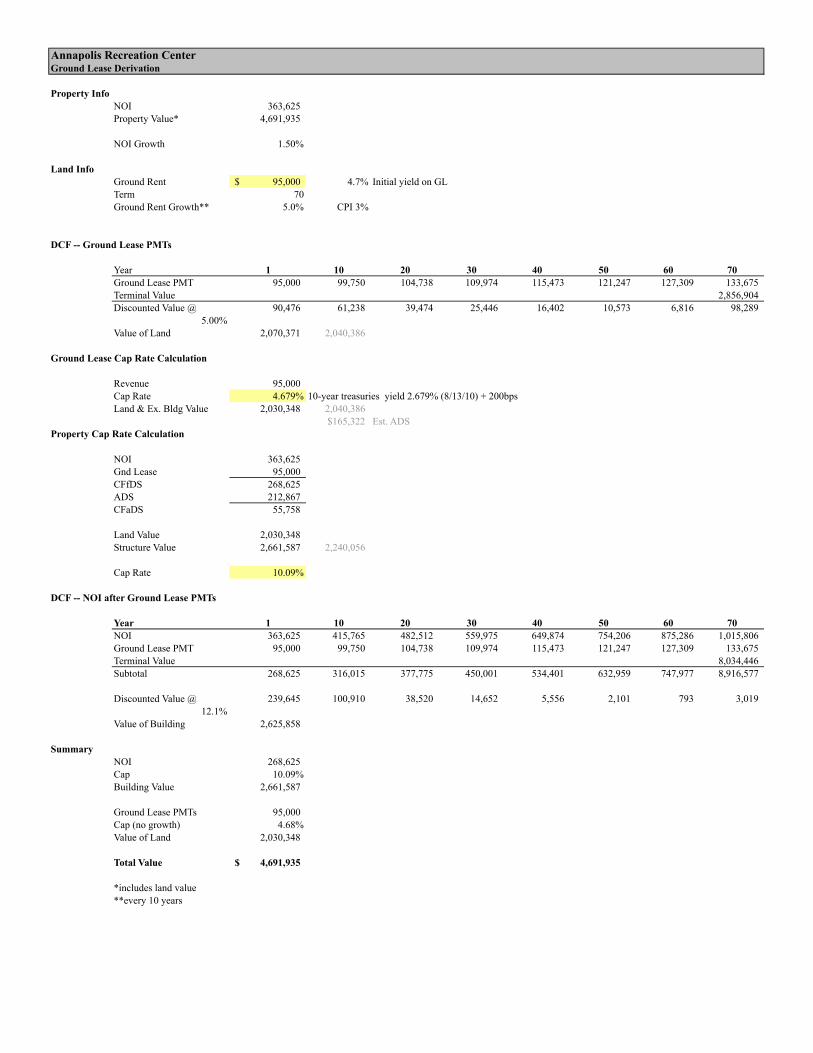
Annapolis Recreation CenterGround Lease Derivation
Property InfoNOI 363,625 Property Value* 4,691,935
NOI Growth 1.50%
Land InfoGround Rent 95,000$ 4.7% Initial yield on GLTerm 70Ground Rent Growth** 5.0% CPI 3%
DCF -- Ground Lease PMTs
Year 1 10 20 30 40 50 60 70Ground Lease PMT 95,000 99,750 104,738 109,974 115,473 121,247 127,309 133,675 Terminal Value 2,856,904 Discounted Value @ 90,476 61,238 39,474 25,446 16,402 10,573 6,816 98,289
5.00%Value of Land 2,070,371 2,040,386
Ground Lease Cap Rate Calculation
Revenue 95,000 Cap Rate 4.679% 10-year treasuries yield 2.679% (8/13/10) + 200bpsLand & Ex. Bldg Value 2,030,348 2,040,386
$165,322 Est. ADSProperty Cap Rate Calculation
NOI 363,625 Gnd Lease 95,000 CFfDS 268,625 ADS 212,867 CFaDS 55,758
Land Value 2,030,348 Structure Value 2,661,587 2,240,056
Cap Rate 10.09%
DCF -- NOI after Ground Lease PMTs
Year 1 10 20 30 40 50 60 70NOI 363,625 415,765 482,512 559,975 649,874 754,206 875,286 1,015,806 Ground Lease PMT 95,000 99,750 104,738 109,974 115,473 121,247 127,309 133,675 Terminal Value 8,034,446 Subtotal 268,625 316,015 377,775 450,001 534,401 632,959 747,977 8,916,577
Discounted Value @ 239,645 100,910 38,520 14,652 5,556 2,101 793 3,019 12.1%
Value of Building 2,625,858
SummaryNOI 268,625 Cap 10.09%Building Value 2,661,587
Ground Lease PMTs 95,000 Cap (no growth) 4.68%Value of Land 2,030,348
Total Value 4,691,935$
*includes land value**every 10 years

Appendix G: Project Financing
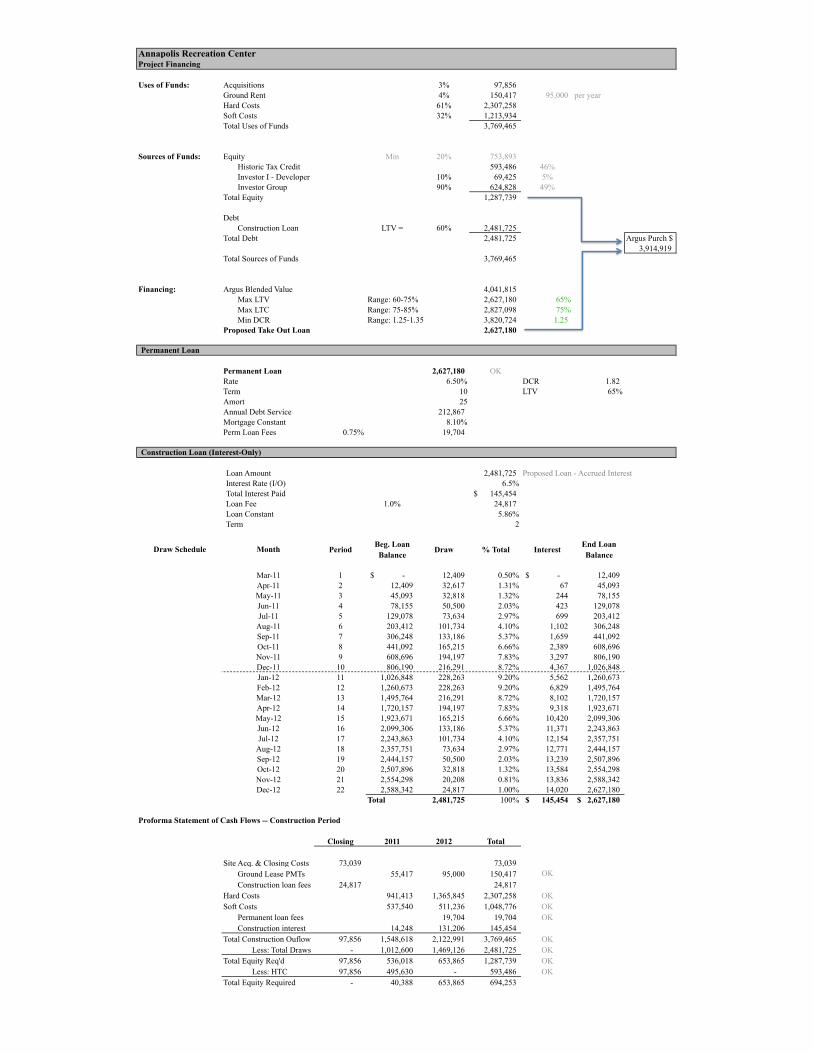
Uses of Funds: Acquisitions 3% 97,856 Ground Rent 4% 150,417 95,000 per yearHard Costs 61% 2,307,258 Soft Costs 32% 1,213,934 Total Uses of Funds 3,769,465
Sources of Funds: Equity Min 20% 753,893 Historic Tax Credit 593,486 46%Investor I - Developer 10% 69,425 5%Investor Group 90% 624,828 49%
Total Equity 1,287,739
DebtConstruction Loan LTV = 60% 2,481,725
Total Debt 2,481,725 Argus Purch $3,914,919
Total Sources of Funds 3,769,465
Financing: Argus Blended Value 4,041,815 Max LTV Range: 60-75% 2,627,180 65%Max LTC Range: 75-85% 2,827,098 75%Min DCR Range: 1.25-1.35 3,820,724 1.25
Proposed Take Out Loan 2,627,180
Permanent Loan
Permanent Loan 2,627,180 OKRate 6.50% DCR 1.82 Term 10 LTV 65%Amort 25Annual Debt Service 212,867 Mortgage Constant 8.10%Perm Loan Fees 0.75% 19,704
Construction Loan (Interest-Only)
Loan Amount 2,481,725 Proposed Loan - Accrued InterestInterest Rate (I/O) 6.5%Total Interest Paid 145,454$ Loan Fee 1.0% 24,817 Loan Constant 5.86%Term 2
Draw Schedule Month Period Beg. Loan Balance
Draw % Total Interest End Loan Balance
Mar-11 1 -$ 12,409 0.50% -$ 12,409 Apr-11 2 12,409 32,617 1.31% 67 45,093 May-11 3 45,093 32,818 1.32% 244 78,155 Jun-11 4 78,155 50,500 2.03% 423 129,078 Jul-11 5 129,078 73,634 2.97% 699 203,412
Aug-11 6 203,412 101,734 4.10% 1,102 306,248 Sep-11 7 306,248 133,186 5.37% 1,659 441,092 Oct-11 8 441,092 165,215 6.66% 2,389 608,696 Nov-11 9 608,696 194,197 7.83% 3,297 806,190 Dec-11 10 806,190 216,291 8.72% 4,367 1,026,848 Jan-12 11 1,026,848 228,263 9.20% 5,562 1,260,673 Feb-12 12 1,260,673 228,263 9.20% 6,829 1,495,764 Mar-12 13 1,495,764 216,291 8.72% 8,102 1,720,157 Apr-12 14 1,720,157 194,197 7.83% 9,318 1,923,671 May-12 15 1,923,671 165,215 6.66% 10,420 2,099,306 Jun-12 16 2,099,306 133,186 5.37% 11,371 2,243,863 Jul-12 17 2,243,863 101,734 4.10% 12,154 2,357,751
Aug-12 18 2,357,751 73,634 2.97% 12,771 2,444,157 Sep-12 19 2,444,157 50,500 2.03% 13,239 2,507,896 Oct-12 20 2,507,896 32,818 1.32% 13,584 2,554,298 Nov-12 21 2,554,298 20,208 0.81% 13,836 2,588,342 Dec-12 22 2,588,342 24,817 1.00% 14,020 2,627,180
Total 2,481,725 100% 145,454$ 2,627,180$
Proforma Statement of Cash Flows -- Construction Period
Closing 2011 2012 Total
Site Acq. & Closing Costs 73,039 73,039 Ground Lease PMTs 55,417 95,000 150,417 Construction loan fees 24,817 24,817
Hard Costs 941,413 1,365,845 2,307,258 OKSoft Costs 537,540 511,236 1,048,776 OK
Permanent loan fees 19,704 19,704 OKConstruction interest 14,248 131,206 145,454
Total Construction Ouflow 97,856 1,548,618 2,122,991 3,769,465 OKLess: Total Draws - 1,012,600 1,469,126 2,481,725 OK
Total Equity Req'd 97,856 536,018 653,865 1,287,739 OKLess: HTC 97,856 495,630 - 593,486 OK
Total Equity Required - 40,388 653,865 694,253
Annapolis Recreation CenterProject Financing
OK

Appendix H: Mixed-Use Financial Analysis
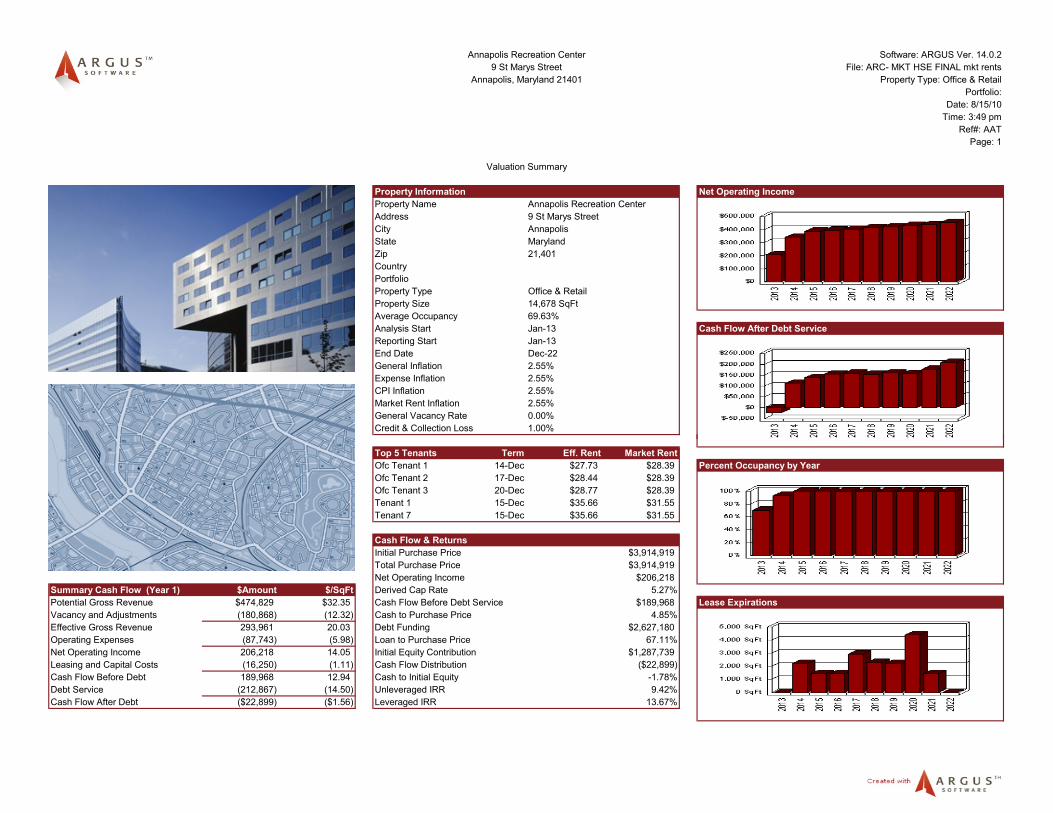
Software: ARGUS Ver. 14.0.2File: ARC- MKT HSE FINAL mkt rents
Property Type: Office & RetailPortfolio:
Date: 8/15/10Time: 3:49 pm
Ref#: AATPage: 1
Property Information Net Operating IncomeProperty Name Annapolis Recreation CenterAddress 9 St Marys StreetCity AnnapolisState MarylandZip 21,401CountryPortfolioProperty Type Office & RetailProperty Size 14,678 SqFtAverage Occupancy 69.63%Analysis Start Jan-13 Cash Flow After Debt ServiceReporting Start Jan-13End Date Dec-22General Inflation 2.55%Expense Inflation 2.55%CPI Inflation 2.55%Market Rent Inflation 2.55%General Vacancy Rate 0.00%Credit & Collection Loss 1.00%
Valuation Summary
Annapolis Recreation Center9 St Marys Street
Annapolis, Maryland 21401
Top 5 Tenants Term Eff. Rent Market RentOfc Tenant 1 14-Dec $27.73 $28.39 Percent Occupancy by YearOfc Tenant 2 17-Dec $28.44 $28.39Ofc Tenant 3 20-Dec $28.77 $28.39Tenant 1 15-Dec $35.66 $31.55Tenant 7 15-Dec $35.66 $31.55
Cash Flow & ReturnsInitial Purchase Price $3,914,919Total Purchase Price $3,914,919Net Operating Income $206,218
Summary Cash Flow (Year 1) $Amount $/SqFt Derived Cap Rate 5.27%Potential Gross Revenue $474,829 $32.35 Cash Flow Before Debt Service $189,968 Lease ExpirationsVacancy and Adjustments (180,868) (12.32) Cash to Purchase Price 4.85%Effective Gross Revenue 293,961 20.03 Debt Funding $2,627,180Operating Expenses (87,743) (5.98) Loan to Purchase Price 67.11%Net Operating Income 206,218 14.05 Initial Equity Contribution $1,287,739Leasing and Capital Costs (16,250) (1.11) Cash Flow Distribution ($22,899)Cash Flow Before Debt 189,968 12.94 Cash to Initial Equity -1.78%Debt Service (212,867) (14.50) Unleveraged IRR 9.42%Cash Flow After Debt ($22,899) ($1.56) Leveraged IRR 13.67%

Software: ARGUS Ver. 14.0.2File: ARC- MKT HSE FINAL mkt rents
Property Type: Office & RetailPortfolio:
Date: 8/15/10Time: 3:49 pm
Ref#: AATPage: 2
Property Resale Unleveraged Present Value Analysis Direct Capitalization Value $ Amount $/SqFtResale Method Directly Input Final Year Resale For the Annual PV of CF Revenue at Full Occupancy $474,829 $32.35Cash Flow for Resale Amount $464,769 Analysis Period Year End Cash Flow @ 10.50% Stabilized Market Vacancy 35,137 2.39Terminal Cap Rate - Year 1 Dec-13 189,968 171,917 Adjusted Effective Gross Revenue 439,692 29.96Gross Proceeds from Resale 4,424,473 Year 2 Dec-14 325,237 266,364 Expenses Adjusted For Vacancy 87,742 5.98Resale Adjustments (66,367) Year 3 Dec-15 351,155 260,262 Stabilized Net Operating Income 527,434 35.93Net Proceeds from Sale 4,358,106 Year 4 Dec-16 367,728 246,648 Leasing & Capital Costs 7.75% 7.75%Debt Retirement (2,036,363) Year 5 Dec-17 371,689 225,616 Capitalized Value IndicationNet Resale Proceeds After Debt $2,321,743 Year 6 Dec-18 366,526 201,340 Cap RateImplied PV to Gross Resale Growth 6.18% Year 7 Dec-19 372,632 185,244 Direct Cap Value $6,805,600 $463.66
Year 8 Dec-20 370,043 166,477Cap Rate Matrix - Unleveraged Year 9 Dec-21 389,235 158,472 Blended Valuation
Cap Rates PV @10.25% PV @10.50% PV @10.75% Year 10 Dec-22 420,180 154,814 Unleveraged Present Value $3,642,8937.75% $3,703,436 $3,642,893 $3,583,658 Present Value Percentage 50.00% $1,821,4478.75% 3,703,436 3,642,893 3,583,658 Total Cash Flow 3,524,393 2,037,154
Resale @ - 4,358,106 1,605,739 Direct Cap Value $4,440,737Direct Cap Percentage 50.00% $2,220,369
Cap Rate Matrix - Leveraged Total Present Value $3,642,893Cap Rates PV @10.25% PV @10.50% PV @10.75% Per SqFt 248.19 Blended Valuation $4,041,815
7.75% $1,641,907 $1,612,253 $1,583,255 Per SqFt $275.378 75% 1 641 907 1 612 253 1 583 255 Percentage Value Distribution
Valuation Summary
Annapolis, Maryland 21401
Annapolis Recreation Center9 St Marys Street
8.75% 1,641,907 1,612,253 1,583,255 Percentage Value DistributionAssured Income 24.18%Prospective Income 31.74% Blended Valuation Comparison
Annual Resale Before Debt Prospective Property Resale 44.08%Total 100.00%
Unleveraged Present Value
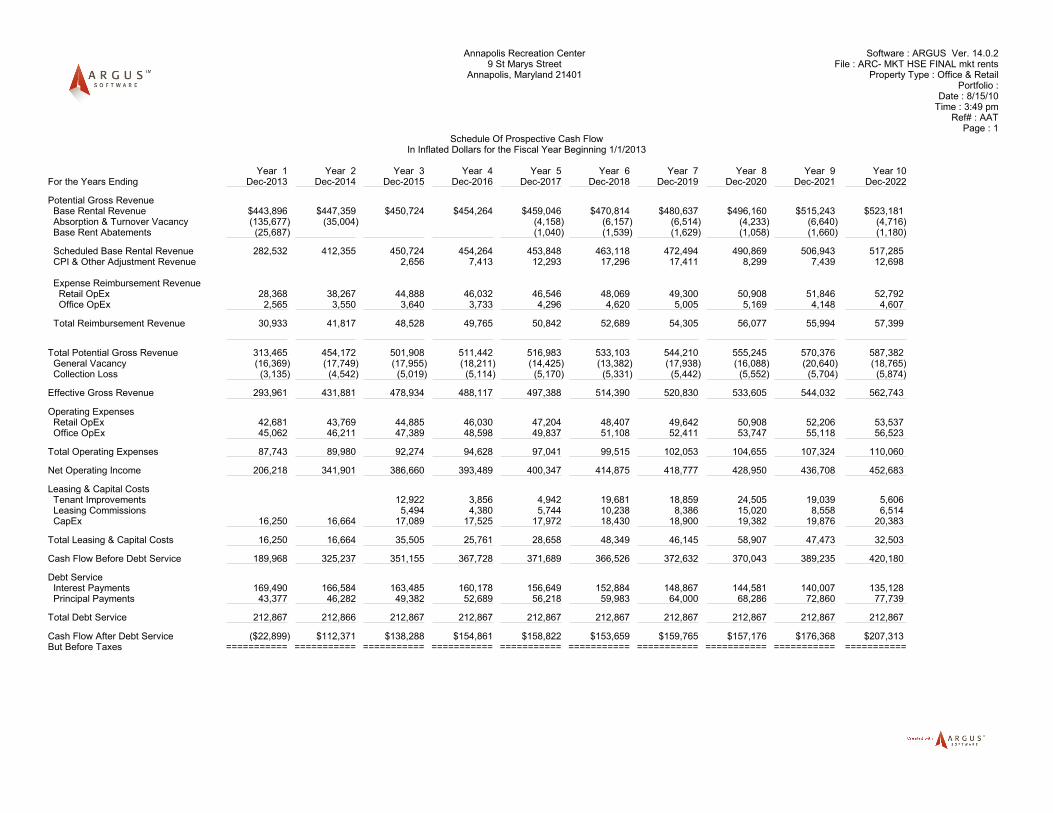
Annapolis Recreation Center Software : ARGUS Ver. 14.0.2 9 St Marys Street File : ARC- MKT HSE FINAL mkt rents
Annapolis, Maryland 21401 Property Type : Office & Retail Portfolio :
Date : 8/15/10 Time : 3:49 pm
Ref# : AAT Page : 1
Schedule Of Prospective Cash FlowIn Inflated Dollars for the Fiscal Year Beginning 1/1/2013
Year 1 Year 2 Year 3 Year 4 Year 5 Year 6 Year 7 Year 8 Year 9 Year 10For the Years Ending Dec-2013 Dec-2014 Dec-2015 Dec-2016 Dec-2017 Dec-2018 Dec-2019 Dec-2020 Dec-2021 Dec-2022
Potential Gross Revenue Base Rental Revenue $443,896 $447,359 $450,724 $454,264 $459,046 $470,814 $480,637 $496,160 $515,243 $523,181 Absorption & Turnover Vacancy (135,677) (35,004) (4,158) (6,157) (6,514) (4,233) (6,640) (4,716) Base Rent Abatements (25,687) (1,040) (1,539) (1,629) (1,058) (1,660) (1,180)
Scheduled Base Rental Revenue 282,532 412,355 450,724 454,264 453,848 463,118 472,494 490,869 506,943 517,285 CPI & Other Adjustment Revenue 2,656 7,413 12,293 17,296 17,411 8,299 7,439 12,698
Expense Reimbursement Revenue Retail OpEx 28,368 38,267 44,888 46,032 46,546 48,069 49,300 50,908 51,846 52,792 Office OpEx 2,565 3,550 3,640 3,733 4,296 4,620 5,005 5,169 4,148 4,607
Total Reimbursement Revenue 30,933 41,817 48,528 49,765 50,842 52,689 54,305 56,077 55,994 57,399
Total Potential Gross Revenue 313,465 454,172 501,908 511,442 516,983 533,103 544,210 555,245 570,376 587,382 General Vacancy (16,369) (17,749) (17,955) (18,211) (14,425) (13,382) (17,938) (16,088) (20,640) (18,765) Collection Loss (3,135) (4,542) (5,019) (5,114) (5,170) (5,331) (5,442) (5,552) (5,704) (5,874)
Effective Gross Revenue 293,961 431,881 478,934 488,117 497,388 514,390 520,830 533,605 544,032 562,743
Operating Expenses Retail OpEx 42,681 43,769 44,885 46,030 47,204 48,407 49,642 50,908 52,206 53,537 Office OpEx 45,062 46,211 47,389 48,598 49,837 51,108 52,411 53,747 55,118 56,523
Total Operating Expenses 87,743 89,980 92,274 94,628 97,041 99,515 102,053 104,655 107,324 110,060
Net Operating Income 206,218 341,901 386,660 393,489 400,347 414,875 418,777 428,950 436,708 452,683
Leasing & Capital Costs Tenant Improvements 12,922 3,856 4,942 19,681 18,859 24,505 19,039 5,606 Leasing Commissions 5,494 4,380 5,744 10,238 8,386 15,020 8,558 6,514 CapEx 16,250 16,664 17,089 17,525 17,972 18,430 18,900 19,382 19,876 20,383
Total Leasing & Capital Costs 16,250 16,664 35,505 25,761 28,658 48,349 46,145 58,907 47,473 32,503
Cash Flow Before Debt Service 189,968 325,237 351,155 367,728 371,689 366,526 372,632 370,043 389,235 420,180
Debt Service Interest Payments 169,490 166,584 163,485 160,178 156,649 152,884 148,867 144,581 140,007 135,128 Principal Payments 43,377 46,282 49,382 52,689 56,218 59,983 64,000 68,286 72,860 77,739
Total Debt Service 212,867 212,866 212,867 212,867 212,867 212,867 212,867 212,867 212,867 212,867
Cash Flow After Debt Service ($22,899) $112,371 $138,288 $154,861 $158,822 $153,659 $159,765 $157,176 $176,368 $207,313 But Before Taxes =========== =========== =========== =========== =========== =========== =========== =========== =========== ===========
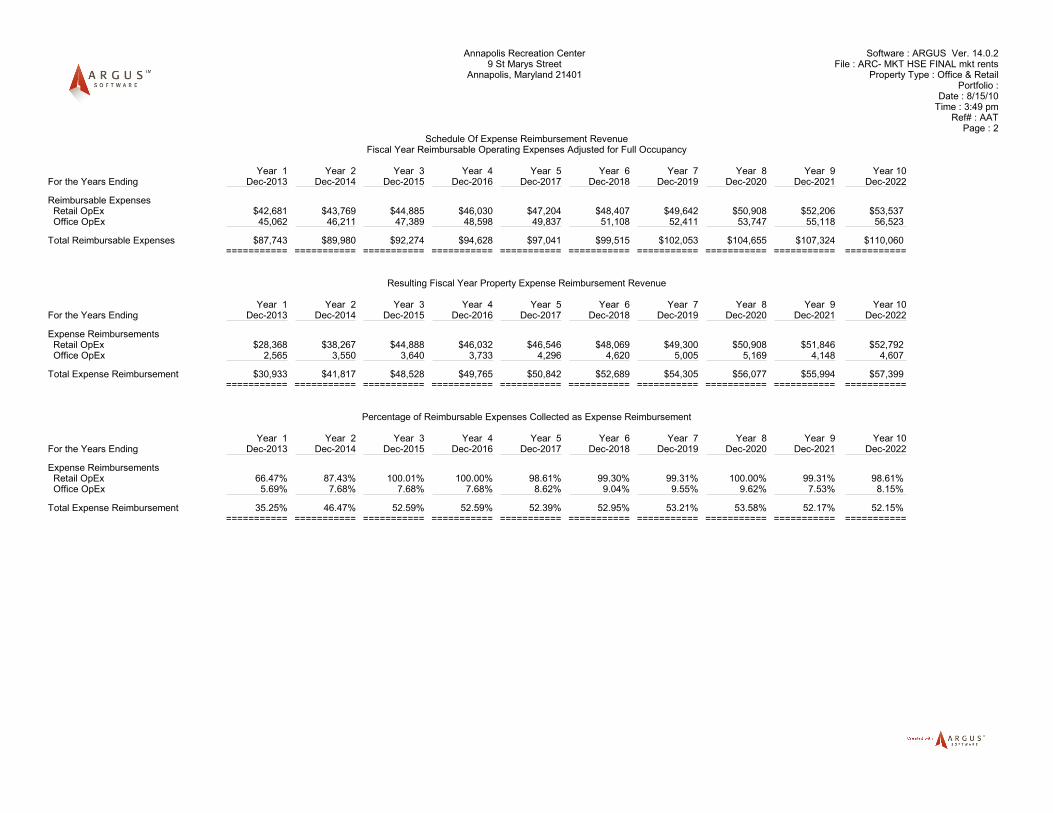
Annapolis Recreation Center Software : ARGUS Ver. 14.0.2 9 St Marys Street File : ARC- MKT HSE FINAL mkt rents
Annapolis, Maryland 21401 Property Type : Office & Retail Portfolio :
Date : 8/15/10 Time : 3:49 pm
Ref# : AAT Page : 2
Schedule Of Expense Reimbursement RevenueFiscal Year Reimbursable Operating Expenses Adjusted for Full Occupancy
Year 1 Year 2 Year 3 Year 4 Year 5 Year 6 Year 7 Year 8 Year 9 Year 10For the Years Ending Dec-2013 Dec-2014 Dec-2015 Dec-2016 Dec-2017 Dec-2018 Dec-2019 Dec-2020 Dec-2021 Dec-2022
Reimbursable Expenses Retail OpEx $42,681 $43,769 $44,885 $46,030 $47,204 $48,407 $49,642 $50,908 $52,206 $53,537 Office OpEx 45,062 46,211 47,389 48,598 49,837 51,108 52,411 53,747 55,118 56,523
Total Reimbursable Expenses $87,743 $89,980 $92,274 $94,628 $97,041 $99,515 $102,053 $104,655 $107,324 $110,060 =========== =========== =========== =========== =========== =========== =========== =========== =========== ===========
Resulting Fiscal Year Property Expense Reimbursement Revenue
Year 1 Year 2 Year 3 Year 4 Year 5 Year 6 Year 7 Year 8 Year 9 Year 10For the Years Ending Dec-2013 Dec-2014 Dec-2015 Dec-2016 Dec-2017 Dec-2018 Dec-2019 Dec-2020 Dec-2021 Dec-2022
Expense Reimbursements Retail OpEx $28,368 $38,267 $44,888 $46,032 $46,546 $48,069 $49,300 $50,908 $51,846 $52,792 Office OpEx 2,565 3,550 3,640 3,733 4,296 4,620 5,005 5,169 4,148 4,607
Total Expense Reimbursement $30,933 $41,817 $48,528 $49,765 $50,842 $52,689 $54,305 $56,077 $55,994 $57,399 =========== =========== =========== =========== =========== =========== =========== =========== =========== ===========
Percentage of Reimbursable Expenses Collected as Expense Reimbursement
Year 1 Year 2 Year 3 Year 4 Year 5 Year 6 Year 7 Year 8 Year 9 Year 10For the Years Ending Dec-2013 Dec-2014 Dec-2015 Dec-2016 Dec-2017 Dec-2018 Dec-2019 Dec-2020 Dec-2021 Dec-2022
Expense Reimbursements Retail OpEx 66.47% 87.43% 100.01% 100.00% 98.61% 99.30% 99.31% 100.00% 99.31% 98.61% Office OpEx 5.69% 7.68% 7.68% 7.68% 8.62% 9.04% 9.55% 9.62% 7.53% 8.15%
Total Expense Reimbursement 35.25% 46.47% 52.59% 52.59% 52.39% 52.95% 53.21% 53.58% 52.17% 52.15% =========== =========== =========== =========== =========== =========== =========== =========== =========== ===========
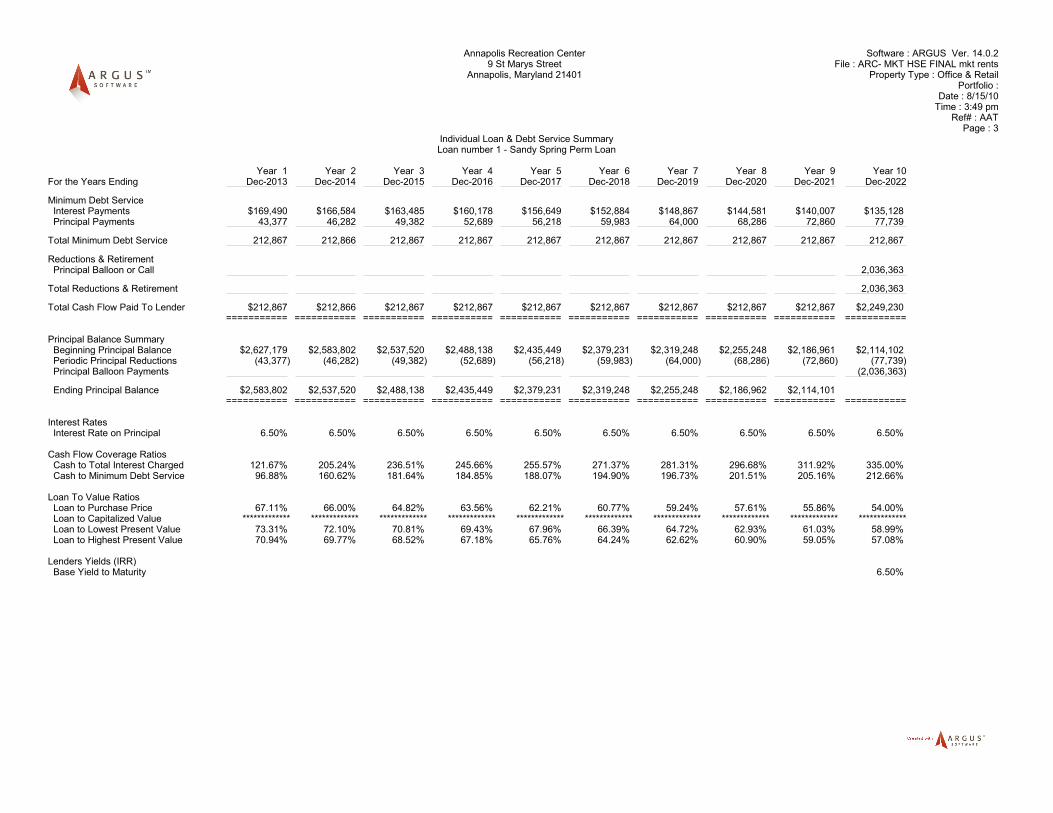
Annapolis Recreation Center Software : ARGUS Ver. 14.0.2 9 St Marys Street File : ARC- MKT HSE FINAL mkt rents
Annapolis, Maryland 21401 Property Type : Office & Retail Portfolio :
Date : 8/15/10 Time : 3:49 pm
Ref# : AAT Page : 3
Individual Loan & Debt Service SummaryLoan number 1 - Sandy Spring Perm Loan
Year 1 Year 2 Year 3 Year 4 Year 5 Year 6 Year 7 Year 8 Year 9 Year 10For the Years Ending Dec-2013 Dec-2014 Dec-2015 Dec-2016 Dec-2017 Dec-2018 Dec-2019 Dec-2020 Dec-2021 Dec-2022
Minimum Debt Service Interest Payments $169,490 $166,584 $163,485 $160,178 $156,649 $152,884 $148,867 $144,581 $140,007 $135,128 Principal Payments 43,377 46,282 49,382 52,689 56,218 59,983 64,000 68,286 72,860 77,739
Total Minimum Debt Service 212,867 212,866 212,867 212,867 212,867 212,867 212,867 212,867 212,867 212,867
Reductions & Retirement Principal Balloon or Call 2,036,363
Total Reductions & Retirement 2,036,363
Total Cash Flow Paid To Lender $212,867 $212,866 $212,867 $212,867 $212,867 $212,867 $212,867 $212,867 $212,867 $2,249,230 =========== =========== =========== =========== =========== =========== =========== =========== =========== ===========
Principal Balance Summary Beginning Principal Balance $2,627,179 $2,583,802 $2,537,520 $2,488,138 $2,435,449 $2,379,231 $2,319,248 $2,255,248 $2,186,961 $2,114,102 Periodic Principal Reductions (43,377) (46,282) (49,382) (52,689) (56,218) (59,983) (64,000) (68,286) (72,860) (77,739) Principal Balloon Payments (2,036,363)
Ending Principal Balance $2,583,802 $2,537,520 $2,488,138 $2,435,449 $2,379,231 $2,319,248 $2,255,248 $2,186,962 $2,114,101 =========== =========== =========== =========== =========== =========== =========== =========== =========== ===========
Interest Rates Interest Rate on Principal 6.50% 6.50% 6.50% 6.50% 6.50% 6.50% 6.50% 6.50% 6.50% 6.50%
Cash Flow Coverage Ratios Cash to Total Interest Charged 121.67% 205.24% 236.51% 245.66% 255.57% 271.37% 281.31% 296.68% 311.92% 335.00% Cash to Minimum Debt Service 96.88% 160.62% 181.64% 184.85% 188.07% 194.90% 196.73% 201.51% 205.16% 212.66%
Loan To Value Ratios Loan to Purchase Price 67.11% 66.00% 64.82% 63.56% 62.21% 60.77% 59.24% 57.61% 55.86% 54.00% Loan to Capitalized Value ************* ************* ************* ************* ************* ************* ************* ************* ************* ************* Loan to Lowest Present Value 73.31% 72.10% 70.81% 69.43% 67.96% 66.39% 64.72% 62.93% 61.03% 58.99% Loan to Highest Present Value 70.94% 69.77% 68.52% 67.18% 65.76% 64.24% 62.62% 60.90% 59.05% 57.08%
Lenders Yields (IRR) Base Yield to Maturity 6.50%
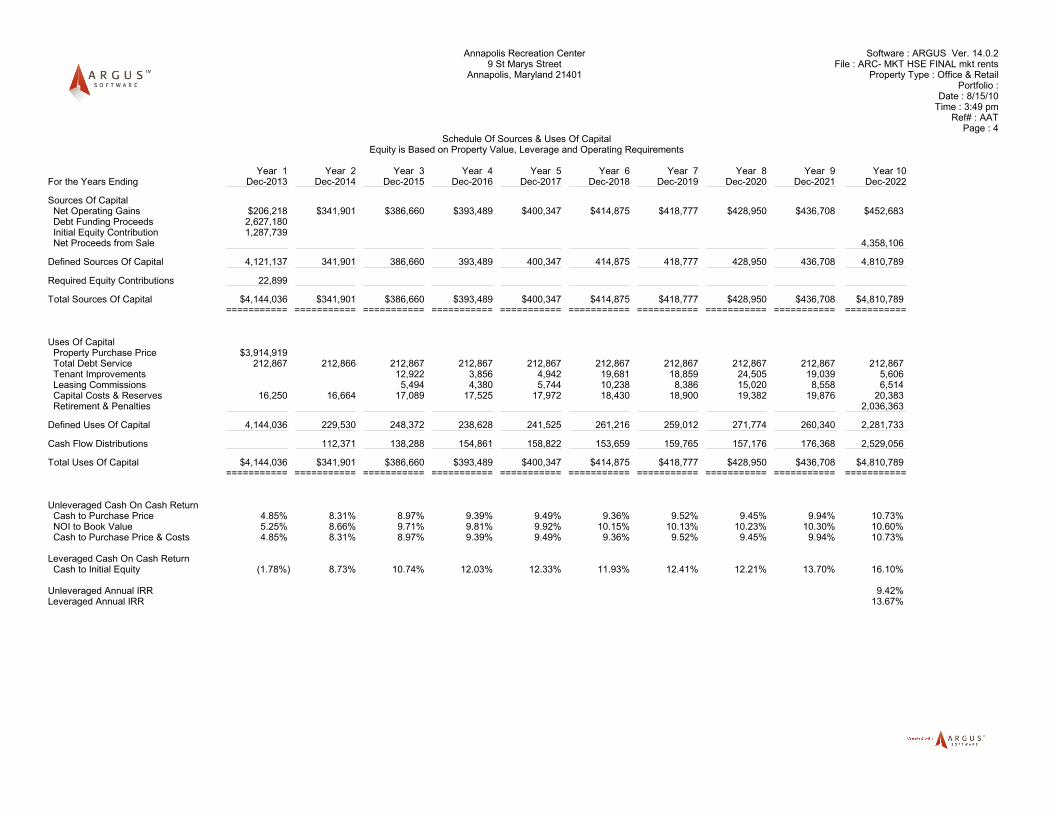
Annapolis Recreation Center Software : ARGUS Ver. 14.0.2 9 St Marys Street File : ARC- MKT HSE FINAL mkt rents
Annapolis, Maryland 21401 Property Type : Office & Retail Portfolio :
Date : 8/15/10 Time : 3:49 pm
Ref# : AAT Page : 4
Schedule Of Sources & Uses Of CapitalEquity is Based on Property Value, Leverage and Operating Requirements
Year 1 Year 2 Year 3 Year 4 Year 5 Year 6 Year 7 Year 8 Year 9 Year 10For the Years Ending Dec-2013 Dec-2014 Dec-2015 Dec-2016 Dec-2017 Dec-2018 Dec-2019 Dec-2020 Dec-2021 Dec-2022
Sources Of Capital Net Operating Gains $206,218 $341,901 $386,660 $393,489 $400,347 $414,875 $418,777 $428,950 $436,708 $452,683 Debt Funding Proceeds 2,627,180 Initial Equity Contribution 1,287,739 Net Proceeds from Sale 4,358,106
Defined Sources Of Capital 4,121,137 341,901 386,660 393,489 400,347 414,875 418,777 428,950 436,708 4,810,789
Required Equity Contributions 22,899
Total Sources Of Capital $4,144,036 $341,901 $386,660 $393,489 $400,347 $414,875 $418,777 $428,950 $436,708 $4,810,789 =========== =========== =========== =========== =========== =========== =========== =========== =========== ===========
Uses Of Capital Property Purchase Price $3,914,919 Total Debt Service 212,867 212,866 212,867 212,867 212,867 212,867 212,867 212,867 212,867 212,867 Tenant Improvements 12,922 3,856 4,942 19,681 18,859 24,505 19,039 5,606 Leasing Commissions 5,494 4,380 5,744 10,238 8,386 15,020 8,558 6,514 Capital Costs & Reserves 16,250 16,664 17,089 17,525 17,972 18,430 18,900 19,382 19,876 20,383 Retirement & Penalties 2,036,363
Defined Uses Of Capital 4,144,036 229,530 248,372 238,628 241,525 261,216 259,012 271,774 260,340 2,281,733
Cash Flow Distributions 112,371 138,288 154,861 158,822 153,659 159,765 157,176 176,368 2,529,056
Total Uses Of Capital $4,144,036 $341,901 $386,660 $393,489 $400,347 $414,875 $418,777 $428,950 $436,708 $4,810,789 =========== =========== =========== =========== =========== =========== =========== =========== =========== ===========
Unleveraged Cash On Cash Return Cash to Purchase Price 4.85% 8.31% 8.97% 9.39% 9.49% 9.36% 9.52% 9.45% 9.94% 10.73% NOI to Book Value 5.25% 8.66% 9.71% 9.81% 9.92% 10.15% 10.13% 10.23% 10.30% 10.60% Cash to Purchase Price & Costs 4.85% 8.31% 8.97% 9.39% 9.49% 9.36% 9.52% 9.45% 9.94% 10.73%
Leveraged Cash On Cash Return Cash to Initial Equity (1.78%) 8.73% 10.74% 12.03% 12.33% 11.93% 12.41% 12.21% 13.70% 16.10%
Unleveraged Annual IRR 9.42% Leveraged Annual IRR 13.67%
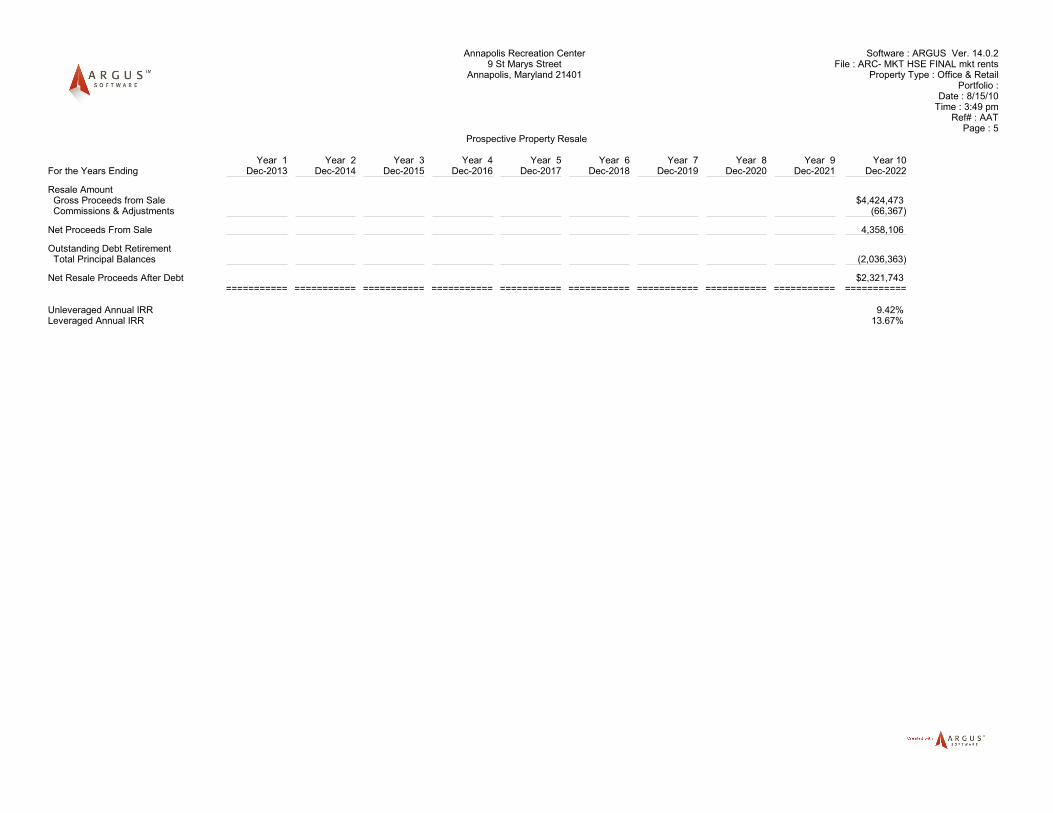
Annapolis Recreation Center Software : ARGUS Ver. 14.0.2 9 St Marys Street File : ARC- MKT HSE FINAL mkt rents
Annapolis, Maryland 21401 Property Type : Office & Retail Portfolio :
Date : 8/15/10 Time : 3:49 pm
Ref# : AAT Page : 5
Prospective Property Resale
Year 1 Year 2 Year 3 Year 4 Year 5 Year 6 Year 7 Year 8 Year 9 Year 10For the Years Ending Dec-2013 Dec-2014 Dec-2015 Dec-2016 Dec-2017 Dec-2018 Dec-2019 Dec-2020 Dec-2021 Dec-2022
Resale Amount Gross Proceeds from Sale $4,424,473 Commissions & Adjustments (66,367)
Net Proceeds From Sale 4,358,106
Outstanding Debt Retirement Total Principal Balances (2,036,363)
Net Resale Proceeds After Debt $2,321,743 =========== =========== =========== =========== =========== =========== =========== =========== =========== ===========
Unleveraged Annual IRR 9.42% Leveraged Annual IRR 13.67%
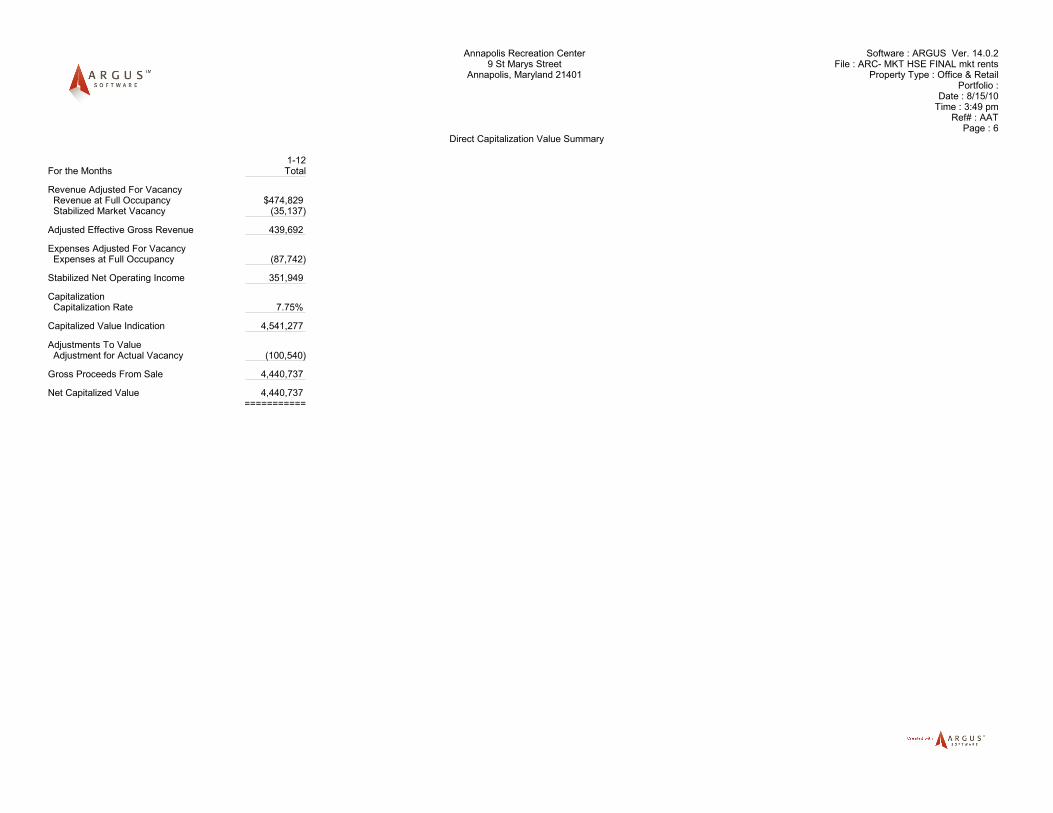
Annapolis Recreation Center Software : ARGUS Ver. 14.0.2 9 St Marys Street File : ARC- MKT HSE FINAL mkt rents
Annapolis, Maryland 21401 Property Type : Office & Retail Portfolio :
Date : 8/15/10 Time : 3:49 pm
Ref# : AAT Page : 6
Direct Capitalization Value Summary
1-12For the Months Total
Revenue Adjusted For Vacancy Revenue at Full Occupancy $474,829 Stabilized Market Vacancy (35,137)
Adjusted Effective Gross Revenue 439,692
Expenses Adjusted For Vacancy Expenses at Full Occupancy (87,742)
Stabilized Net Operating Income 351,949
Capitalization Capitalization Rate 7.75%
Capitalized Value Indication 4,541,277
Adjustments To Value Adjustment for Actual Vacancy (100,540)
Gross Proceeds From Sale 4,440,737
Net Capitalized Value 4,440,737 ===========
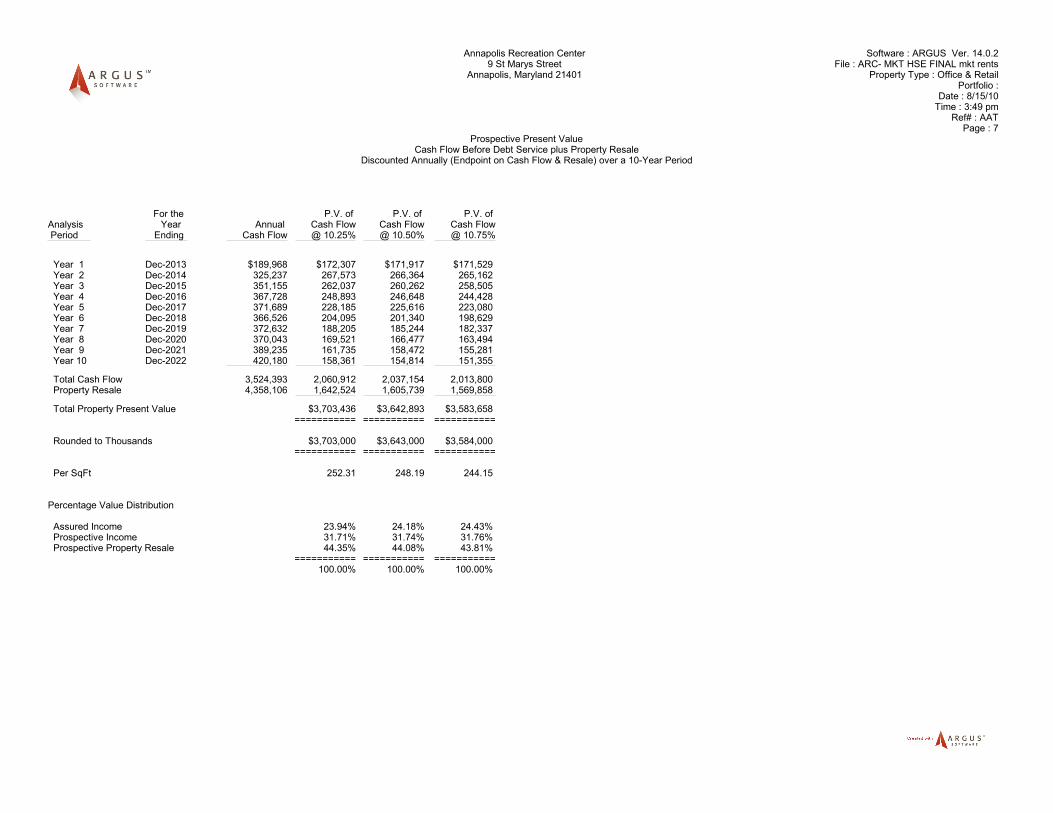
Annapolis Recreation Center Software : ARGUS Ver. 14.0.2 9 St Marys Street File : ARC- MKT HSE FINAL mkt rents
Annapolis, Maryland 21401 Property Type : Office & Retail Portfolio :
Date : 8/15/10 Time : 3:49 pm
Ref# : AAT Page : 7
Prospective Present ValueCash Flow Before Debt Service plus Property Resale
Discounted Annually (Endpoint on Cash Flow & Resale) over a 10-Year Period
For the P.V. of P.V. of P.V. of Analysis Year Annual Cash Flow Cash Flow Cash Flow Period Ending Cash Flow @ 10.25% @ 10.50% @ 10.75%
Year 1 Dec-2013 $189,968 $172,307 $171,917 $171,529 Year 2 Dec-2014 325,237 267,573 266,364 265,162 Year 3 Dec-2015 351,155 262,037 260,262 258,505 Year 4 Dec-2016 367,728 248,893 246,648 244,428 Year 5 Dec-2017 371,689 228,185 225,616 223,080 Year 6 Dec-2018 366,526 204,095 201,340 198,629 Year 7 Dec-2019 372,632 188,205 185,244 182,337 Year 8 Dec-2020 370,043 169,521 166,477 163,494 Year 9 Dec-2021 389,235 161,735 158,472 155,281 Year 10 Dec-2022 420,180 158,361 154,814 151,355
Total Cash Flow 3,524,393 2,060,912 2,037,154 2,013,800 Property Resale 4,358,106 1,642,524 1,605,739 1,569,858
Total Property Present Value $3,703,436 $3,642,893 $3,583,658 =========== =========== ===========
Rounded to Thousands $3,703,000 $3,643,000 $3,584,000
=========== =========== =========== Per SqFt 252.31 248.19 244.15
Percentage Value Distribution
Assured Income 23.94% 24.18% 24.43% Prospective Income 31.71% 31.74% 31.76% Prospective Property Resale 44.35% 44.08% 43.81%
=========== =========== =========== 100.00% 100.00% 100.00%
Annapolis Recreation Center Software : ARGUS Ver. 14.0.2 9 St Marys Street File : ARC- MKT HSE FINAL mkt rents
Annapolis, Maryland 21401 Property Type : Office & Retail Portfolio :
Date : 8/15/10 Time : 3:49 pm
Ref# : AAT Page : 8
Prospective Present ValueCash Flow After Debt Service plus Property Resale
Discounted Annually (Endpoint on Cash Flow & Resale) over a 10-Year Period
For the P.V. of P.V. of P.V. of Analysis Year Annual Cash Flow Cash Flow Cash Flow Period Ending Cash Flow @ 10.25% @ 10.50% @ 10.75%
Year 1 Dec-2013 ($22,899) ($20,770) ($20,723) ($20,676) Year 2 Dec-2014 112,371 92,448 92,030 91,615 Year 3 Dec-2015 138,288 103,192 102,494 101,801 Year 4 Dec-2016 154,861 104,816 103,870 102,936 Year 5 Dec-2017 158,822 97,503 96,405 95,322 Year 6 Dec-2018 153,659 85,563 84,409 83,271 Year 7 Dec-2019 159,765 80,693 79,422 78,176 Year 8 Dec-2020 157,176 72,004 70,712 69,445 Year 9 Dec-2021 176,368 73,284 71,805 70,360 Year 10 Dec-2022 207,313 78,134 76,385 74,677
Total Cash Flow 1,395,724 766,867 756,809 746,927 Property Resale 2,321,743 875,041 855,444 836,328
Value of Equity Interest $1,641,908 $1,612,253 $1,583,255 =========== =========== ===========
Rounded to Thousands $1,642,000 $1,612,000 $1,583,000
=========== =========== =========== Per SqFt 111.86 109.84 107.87
Value of Equity Interest $1,641,908 $1,612,253 $1,583,255 Debt Balance as of Jan-2013 2,627,180 2,627,180 2,627,180 2,627,180
=========== =========== =========== Total Leveraged Present Value 4,269,088 4,239,433 4,210,435 Rounded to Thousands $4,269,000 $4,239,000 $4,210,000
=========== =========== =========== Per SqFt 290.85 288.83 286.85
Annapolis Recreation Center Software : ARGUS Ver. 14.0.2 9 St Marys Street File : ARC- MKT HSE FINAL mkt rents
Annapolis, Maryland 21401 Property Type : Office & Retail Portfolio :
Date : 8/15/10 Time : 3:49 pm
Ref# : AAT Page : 9
Property Summary Report
Timing & Inflation Reporting Period: January 1, 2013 to December 31, 2022; 10 years Inflation Month: Analysis Start General Inflation Rate: 2.55% Property Size & Occupancy Property Size: 14,678 Square Feet Alternate Size: 16,250 Square Feet Number of rent roll tenants: 11 Total Occupied Area: 10,220 Square Feet, 69.63%, during first month of analysis Space Absorption Vacant Retail 2,885.00 Square Feet, leasing from 1/14 to 10/14
1 lease per quarter, 721.25 SqFt per lease Vacant Office 1,573.00 Square Feet, leasing from 1/14 to 1/14
1 lease per quarter, 1,573.00 SqFt per lease General Vacancy Method: Percent of Potential Gross Revenue Rate: 0.00% Based On: Tenant Groups Affect Primary Rate As: Replace Included Groups: 7.40% for Office
7.20% for Retail Credit & Collection Loss Method: Percent of Potential Gross Revenue Rate: 1.00% Debt Financing Number of Notes: 1 Beginning Principal Balance: $2,627,180 Average Year 1 Interest Rate: 6.50% Property Purchase & Resale Purchase Price: $3,914,919 Resale Method: Directly Input Final Year Resale Amount Commission/Closing Cost: $66,367 Net Cash Flow from Sale: $2,321,743 Present Value Discounting Discount Method: Annually (Endpoint on Cash Flow & Resale) Unleveraged Discount Rate: 10.50% Unleveraged Present Value: $3,642,893 at 10.50% Unleveraged Annual IRR: 9.42% Leveraged Discount Rate: 10.50% Value of Equity Interest: $1,612,253 at 10.50% Leveraged Annual IRR: 13.67%
Annapolis Recreation Center Software : ARGUS Ver. 14.0.2 9 St Marys Street File : ARC- MKT HSE FINAL mkt rents
Annapolis, Maryland 21401 Property Type : Office & Retail Portfolio :
Date : 8/15/10 Time : 2:18 am Ref# : AAM
Page : 1 For the Year Ending 12/31/13
Market Leasing Assumption ResultsIn Inflated Dollars for the Fiscal Year Beginning 1/01/13
MLA Categories Office Retail
Renewal Probability 75.00% 75.00%
Market Rent $/SqFt/Yr $/SqFt/Yr
New: 28.39 31.55 Renewal: 28.39 31.55
Result: 28.39 31.55
Months Vacant New: 3.00 3.00 Renewal: 0 0 Rounded: 1 1
Tenant Improvements $/SqFt $/SqFt
New: 14.55 5.00 Renewal: 7.00 2.50
Result: 8.89 3.13
Leasing Commissions Percent Percent
New: 3.80% 3.20% Renewal: 1.50% 1.50%
Result: 2.08% 1.93%
Rent Abatements New: 1.00 1.00 Renewal: 0.00 0.00
Result: 0.25 0.25
Non-Weighted Items Rent Changes Yes Retail Rent Changes Reimbursements Office Reimb Retail Reimb
Term Lengths 5 6 Years Years
Term Overrides Yes No
Annapolis Recreation Center Software : ARGUS Ver. 14.0.2 9 St Marys Street File : ARC- MKT HSE FINAL mkt rents
Annapolis, Maryland 21401 Property Type : Office & Retail Portfolio :
Date : 8/15/10 Time : 2:16 am Ref# : AAM
Page : 1 Presentation Rent Roll & Current Term Tenant Summary
As of Jan-2013 for 14,678 Square Feet
Description Area Base Rent Rent Adjustments & Categories Abatements Reimbursement Leasing Costs Upon Expiration
Tenant Name Floor Rate & Amount CPI & Current Months Pcnt Description of Imprvmnts Commssns Assumption about Type & Suite Number SqFt per Year Changes Changes Porters' Wage to to Operating Expense Rate Rate subsequent terms Lease Dates & Term Bldg Share per Month on to Miscellaneous Abate Abate Reimbursements Amount Amount for this tenant
1 Tenant 1 $31.55 - - - 1 100% See method: - - Renew Retail, Suite: 101 715.00 $22,558 Retail See assumption: Jan-2013 to Dec-2015 4.87% $2.63 Reimbursements Retail 36 Months $1,880
2 Tenant 2 $31.55 - - - 1 100% See method: - - Market Retail, Suite: 102 715.00 $22,558 Retail See assumption: Jan-2013 to Dec-2016 4.87% $2.63 Reimbursements Retail 48 Months $1,880
3 Tenant 3 $31.55 - - - 1 100% See method: - - Market Retail, Suite: 103 715.00 $22,558 Retail See assumption: Jan-2013 to Dec-2017 4.87% $2.63 Reimbursements Retail 60 Months $1,880
4 Tenant 4 $31.55 - - - 1 100% See method: - - Market Retail, Suite: 104 715.00 $22,558 Retail See assumption: Jan-2013 to Dec-2018 4.87% $2.63 Reimbursements Retail 72 Months $1,880
5 Tenant 5 $31.55 - - - 1 100% See method: - - Renew Retail, Suite: 105 715.00 $22,558 Retail See assumption: Jan-2013 to Dec-2017 4.87% $2.63 Reimbursements Retail 60 Months $1,880
6 Tenant 6 $31.55 - - - 1 100% See method: - - Market Retail, Suite: 106 715.00 $22,558 Retail See assumption: Jan-2013 to Dec-2016 4.87% $2.63 Reimbursements Retail 48 Months $1,880
7 Tenant 7 $31.55 - - - 1 100% See method: - - Renew Retail, Suite: 107 715.00 $22,558 Retail See assumption: Jan-2013 to Dec-2015 4.87% $2.63 Reimbursements Retail 36 Months $1,880
8 Tenant 8 $31.55 - - - 1 100% See method: - - Renew Retail, Suite: 108 715.00 $22,558 Retail See assumption: Jan-2013 to Dec-2014 4.87% $2.63 Reimbursements Retail 24 Months $1,880
9 Ofc Tenant 1 $28.39 - - - 1 100% See method: - - Renew Office, Suite: 201 1,500.00 $42,585 Office See assumption: Jan-2013 to Dec-2014 10.22% $2.37 Reimbursements Office 24 Months $3,549
(continued on next page)
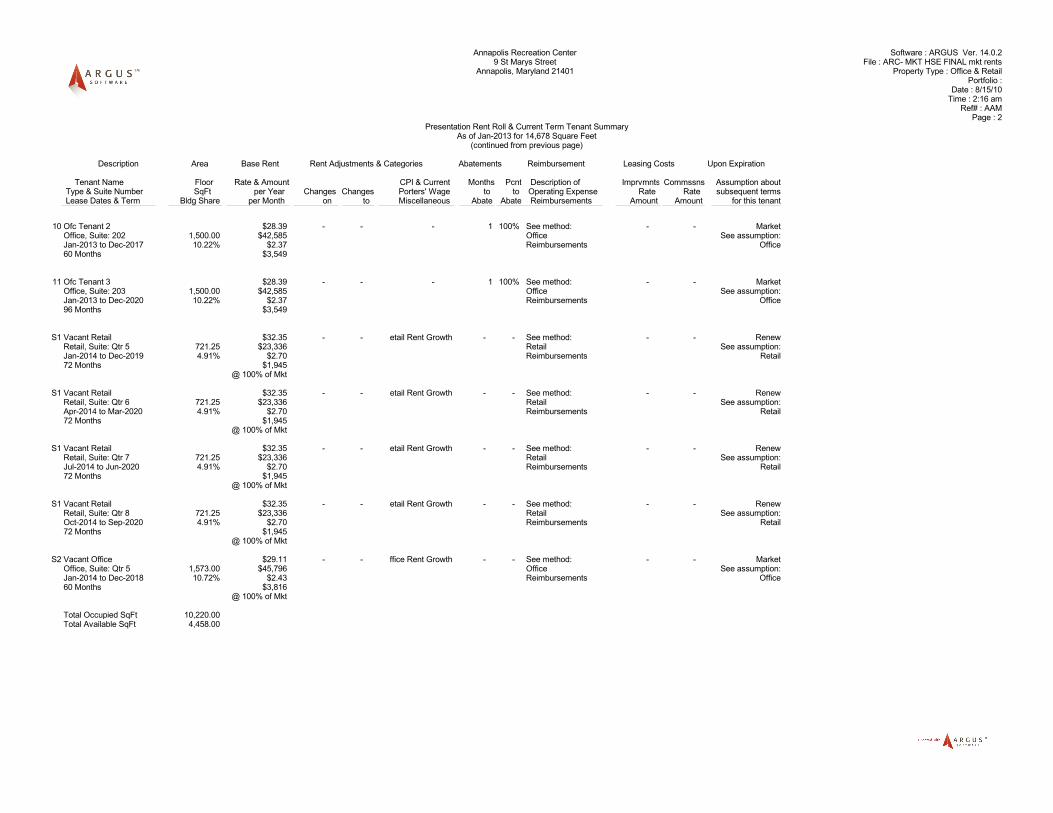
Annapolis Recreation Center Software : ARGUS Ver. 14.0.2 9 St Marys Street File : ARC- MKT HSE FINAL mkt rents
Annapolis, Maryland 21401 Property Type : Office & Retail Portfolio :
Date : 8/15/10 Time : 2:16 am Ref# : AAM
Page : 2 Presentation Rent Roll & Current Term Tenant Summary
As of Jan-2013 for 14,678 Square Feet(continued from previous page)
Description Area Base Rent Rent Adjustments & Categories Abatements Reimbursement Leasing Costs Upon Expiration
Tenant Name Floor Rate & Amount CPI & Current Months Pcnt Description of Imprvmnts Commssns Assumption about Type & Suite Number SqFt per Year Changes Changes Porters' Wage to to Operating Expense Rate Rate subsequent terms Lease Dates & Term Bldg Share per Month on to Miscellaneous Abate Abate Reimbursements Amount Amount for this tenant
10 Ofc Tenant 2 $28.39 - - - 1 100% See method: - - Market Office, Suite: 202 1,500.00 $42,585 Office See assumption: Jan-2013 to Dec-2017 10.22% $2.37 Reimbursements Office 60 Months $3,549
11 Ofc Tenant 3 $28.39 - - - 1 100% See method: - - Market Office, Suite: 203 1,500.00 $42,585 Office See assumption: Jan-2013 to Dec-2020 10.22% $2.37 Reimbursements Office 96 Months $3,549
S1 Vacant Retail $32.35 - - etail Rent Growth - - See method: - - Renew Retail, Suite: Qtr 5 721.25 $23,336 Retail See assumption: Jan-2014 to Dec-2019 4.91% $2.70 Reimbursements Retail 72 Months $1,945
@ 100% of Mkt
S1 Vacant Retail $32.35 - - etail Rent Growth - - See method: - - Renew Retail, Suite: Qtr 6 721.25 $23,336 Retail See assumption: Apr-2014 to Mar-2020 4.91% $2.70 Reimbursements Retail 72 Months $1,945
@ 100% of Mkt
S1 Vacant Retail $32.35 - - etail Rent Growth - - See method: - - Renew Retail, Suite: Qtr 7 721.25 $23,336 Retail See assumption: Jul-2014 to Jun-2020 4.91% $2.70 Reimbursements Retail 72 Months $1,945
@ 100% of Mkt
S1 Vacant Retail $32.35 - - etail Rent Growth - - See method: - - Renew Retail, Suite: Qtr 8 721.25 $23,336 Retail See assumption: Oct-2014 to Sep-2020 4.91% $2.70 Reimbursements Retail 72 Months $1,945
@ 100% of Mkt
S2 Vacant Office $29.11 - - ffice Rent Growth - - See method: - - Market Office, Suite: Qtr 5 1,573.00 $45,796 Office See assumption: Jan-2014 to Dec-2018 10.72% $2.43 Reimbursements Office 60 Months $3,816
@ 100% of Mkt
Total Occupied SqFt 10,220.00 Total Available SqFt 4,458.00

Appendix I: Profitability Analysis
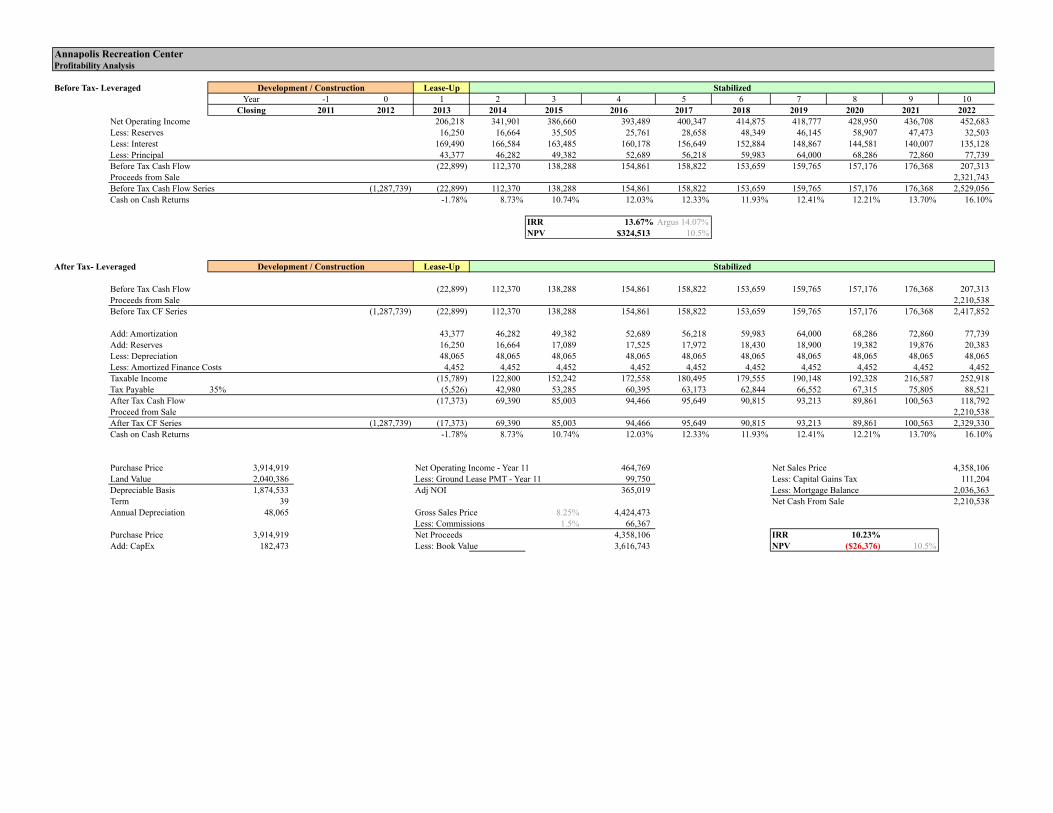
Annapolis Recreation CenterProfitability Analysis
Before Tax- Leveraged Development / Construction Lease-Up StabilizedYear -1 0 1 2 3 4 5 6 7 8 9 10
Closing 2011 2012 2013 2014 2015 2016 2017 2018 2019 2020 2021 2022Net Operating Income 206,218 341,901 386,660 393,489 400,347 414,875 418,777 428,950 436,708 452,683 Less: Reserves 16,250 16,664 35,505 25,761 28,658 48,349 46,145 58,907 47,473 32,503 Less: Interest 169,490 166,584 163,485 160,178 156,649 152,884 148,867 144,581 140,007 135,128 Less: Principal 43,377 46,282 49,382 52,689 56,218 59,983 64,000 68,286 72,860 77,739 Before Tax Cash Flow (22,899) 112,370 138,288 154,861 158,822 153,659 159,765 157,176 176,368 207,313 Proceeds from Sale 2,321,743 Before Tax Cash Flow Series (1,287,739) (22,899) 112,370 138,288 154,861 158,822 153,659 159,765 157,176 176,368 2,529,056 Cash on Cash Returns -1.78% 8.73% 10.74% 12.03% 12.33% 11.93% 12.41% 12.21% 13.70% 16.10%
IRR 13.67% Argus 14.07%NPV $324,513 10.5%
After Tax- Leveraged Development / Construction Lease-Up Stabilized
Before Tax Cash Flow (22,899) 112,370 138,288 154,861 158,822 153,659 159,765 157,176 176,368 207,313Proceeds from Sale 2,210,538Before Tax CF Series (1,287,739) (22,899) 112,370 138,288 154,861 158,822 153,659 159,765 157,176 176,368 2,417,852
Add: Amortization 43,377 46,282 49,382 52,689 56,218 59,983 64,000 68,286 72,860 77,739 Add: Reserves 16,250 16,664 17,089 17,525 17,972 18,430 18,900 19,382 19,876 20,383Less: Depreciation 48,065 48,065 48,065 48,065 48,065 48,065 48,065 48,065 48,065 48,065Less: Amortized Finance Costs 4,452 4,452 4,452 4,452 4,452 4,452 4,452 4,452 4,452 4,452 Taxable Income (15,789) 122,800 152,242 172,558 180,495 179,555 190,148 192,328 216,587 252,918 Tax Payable 35% (5,526) 42,980 53,285 60,395 63,173 62,844 66,552 67,315 75,805 88,521 After Tax Cash Flow (17,373) 69,390 85,003 94,466 95,649 90,815 93,213 89,861 100,563 118,792 Proceed from Sale 2,210,538 After Tax CF Series (1,287,739) (17,373) 69,390 85,003 94,466 95,649 90,815 93,213 89,861 100,563 2,329,330 Cash on Cash Returns -1.78% 8.73% 10.74% 12.03% 12.33% 11.93% 12.41% 12.21% 13.70% 16.10%
Purchase Price 3,914,919 Net Operating Income - Year 11 464,769 Net Sales Price 4,358,106 Land Value 2,040,386 Less: Ground Lease PMT - Year 11 99,750 Less: Capital Gains Tax 111,204 Depreciable Basis 1,874,533 Adj NOI 365,019 Less: Mortgage Balance 2,036,363 Term 39 Net Cash From Sale 2,210,538 Annual Depreciation 48,065 Gross Sales Price 8.25% 4,424,473
Less: Commissions 1.5% 66,367 Purchase Price 3,914,919 Net Proceeds 4,358,106 IRR 10.23%Add: CapEx 182,473 Less: Book Value 3,616,743 NPV ($26,376) 10.5%

Appendix J: Cash Flow Equity Distribution
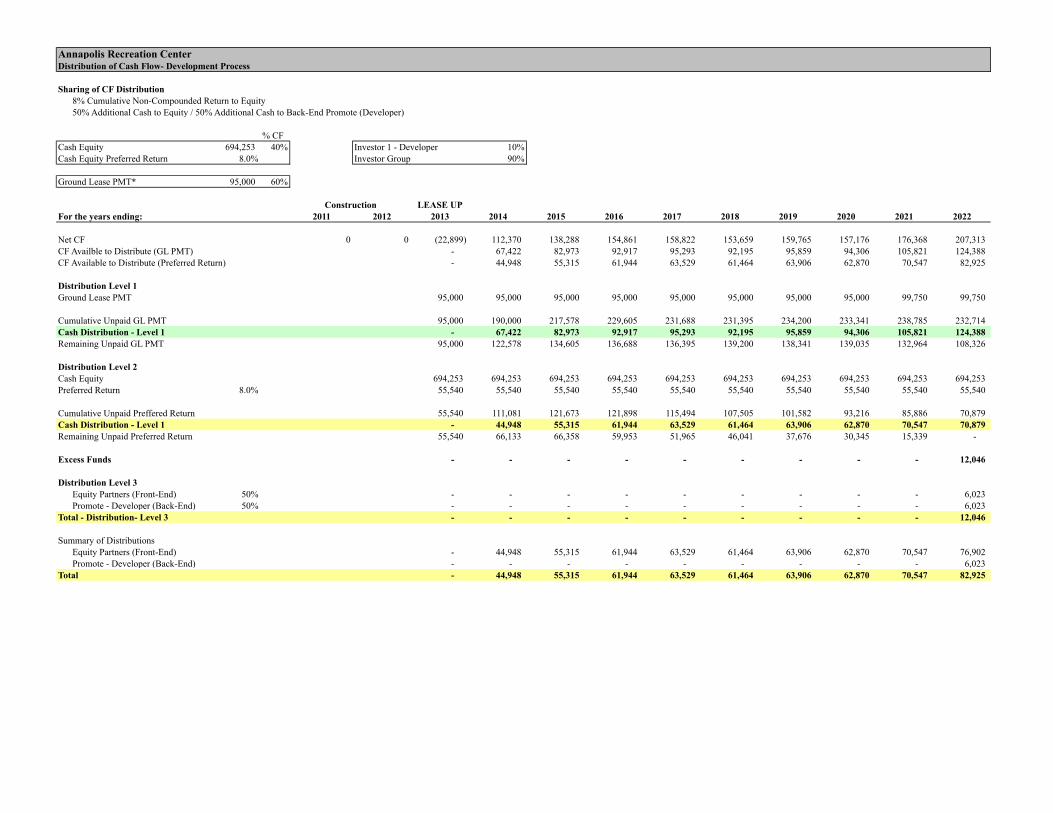
Annapolis Recreation CenterDistribution of Cash Flow- Development Process
Sharing of CF Distribution8% Cumulative Non-Compounded Return to Equity50% Additional Cash to Equity / 50% Additional Cash to Back-End Promote (Developer)
% CFCash Equity 694,253 40% Investor 1 - Developer 10%Cash Equity Preferred Return 8.0% Investor Group 90%
Ground Lease PMT* 95,000 60%
Construction LEASE UPFor the years ending: 2011 2012 2013 2014 2015 2016 2017 2018 2019 2020 2021 2022
Net CF 0 0 (22,899) 112,370 138,288 154,861 158,822 153,659 159,765 157,176 176,368 207,313 CF Availble to Distribute (GL PMT) - 67,422 82,973 92,917 95,293 92,195 95,859 94,306 105,821 124,388 CF Available to Distribute (Preferred Return) - 44,948 55,315 61,944 63,529 61,464 63,906 62,870 70,547 82,925
Distribution Level 1Ground Lease PMT 95,000 95,000 95,000 95,000 95,000 95,000 95,000 95,000 99,750 99,750
Cumulative Unpaid GL PMT 95,000 190,000 217,578 229,605 231,688 231,395 234,200 233,341 238,785 232,714 Cash Distribution - Level 1 - 67,422 82,973 92,917 95,293 92,195 95,859 94,306 105,821 124,388 Remaining Unpaid GL PMT 95,000 122,578 134,605 136,688 136,395 139,200 138,341 139,035 132,964 108,326
Distribution Level 2Cash Equity 694,253 694,253 694,253 694,253 694,253 694,253 694,253 694,253 694,253 694,253 Preferred Return 8.0% 55,540 55,540 55,540 55,540 55,540 55,540 55,540 55,540 55,540 55,540
Cumulative Unpaid Preffered Return 55,540 111,081 121,673 121,898 115,494 107,505 101,582 93,216 85,886 70,879 Cash Distribution - Level 1 - 44,948 55,315 61,944 63,529 61,464 63,906 62,870 70,547 70,879 Remaining Unpaid Preferred Return 55,540 66,133 66,358 59,953 51,965 46,041 37,676 30,345 15,339 -
Excess Funds - - - - - - - - - 12,046
Distribution Level 3Equity Partners (Front-End) 50% - - - - - - - - - 6,023 Promote - Developer (Back-End) 50% - - - - - - - - - 6,023
Total - Distribution- Level 3 - - - - - - - - - 12,046
Summary of DistributionsEquity Partners (Front-End) - 44,948 55,315 61,944 63,529 61,464 63,906 62,870 70,547 76,902 Promote - Developer (Back-End) - - - - - - - - - 6,023
Total - 44,948 55,315 61,944 63,529 61,464 63,906 62,870 70,547 82,925

Appendix K: Reversion Equity Distribution
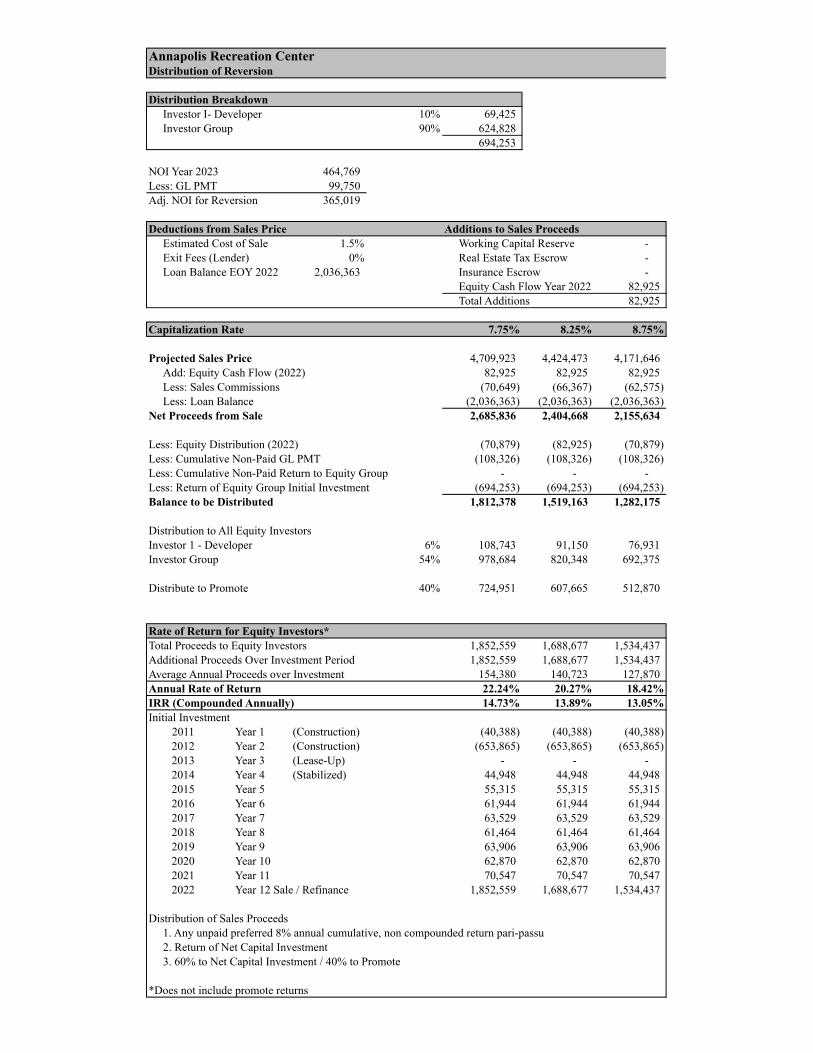
Annapolis Recreation CenterDistribution of Reversion
Distribution BreakdownInvestor I- Developer 10% 69,425 Investor Group 90% 624,828
694,253
NOI Year 2023 464,769 Less: GL PMT 99,750 Adj. NOI for Reversion 365,019
Deductions from Sales Price Additions to Sales ProceedsEstimated Cost of Sale 1.5% Working Capital Reserve - Exit Fees (Lender) 0% Real Estate Tax Escrow - Loan Balance EOY 2022 2,036,363 Insurance Escrow -
Equity Cash Flow Year 2022 82,925 Total Additions 82,925
Capitalization Rate 7.75% 8.25% 8.75%
Projected Sales Price 4,709,923 4,424,473 4,171,646 Add: Equity Cash Flow (2022) 82,925 82,925 82,925 Less: Sales Commissions (70,649) (66,367) (62,575) Less: Loan Balance (2,036,363) (2,036,363) (2,036,363)
Net Proceeds from Sale 2,685,836 2,404,668 2,155,634
Less: Equity Distribution (2022) (70,879) (82,925) (70,879) Less: Cumulative Non-Paid GL PMT (108,326) (108,326) (108,326) Less: Cumulative Non-Paid Return to Equity Group - - - Less: Return of Equity Group Initial Investment (694,253) (694,253) (694,253) Balance to be Distributed 1,812,378 1,519,163 1,282,175
Distribution to All Equity InvestorsInvestor 1 - Developer 6% 108,743 91,150 76,931 Investor Group 54% 978,684 820,348 692,375
Distribute to Promote 40% 724,951 607,665 512,870
Rate of Return for Equity Investors*Total Proceeds to Equity Investors 1,852,559 1,688,677 1,534,437 Additional Proceeds Over Investment Period 1,852,559 1,688,677 1,534,437 Average Annual Proceeds over Investment 154,380 140,723 127,870 Annual Rate of Return 22.24% 20.27% 18.42%IRR (Compounded Annually) 14.73% 13.89% 13.05%Initial Investment
2011 Year 1 (Construction) (40,388) (40,388) (40,388) 2012 Year 2 (Construction) (653,865) (653,865) (653,865) 2013 Year 3 (Lease-Up) - - - 2014 Year 4 (Stabilized) 44,948 44,948 44,948 2015 Year 5 55,315 55,315 55,315 2016 Year 6 61,944 61,944 61,944 2017 Year 7 63,529 63,529 63,529 2018 Year 8 61,464 61,464 61,464 2019 Year 9 63,906 63,906 63,906 2020 Year 10 62,870 62,870 62,870 2021 Year 11 70,547 70,547 70,547 2022 Year 12 Sale / Refinance 1,852,559 1,688,677 1,534,437
Distribution of Sales Proceeds1. Any unpaid preferred 8% annual cumulative, non compounded return pari-passu2. Return of Net Capital Investment3. 60% to Net Capital Investment / 40% to Promote
*Does not include promote returns

Appendix L: Alternative Mixed-Use Financial Analysis
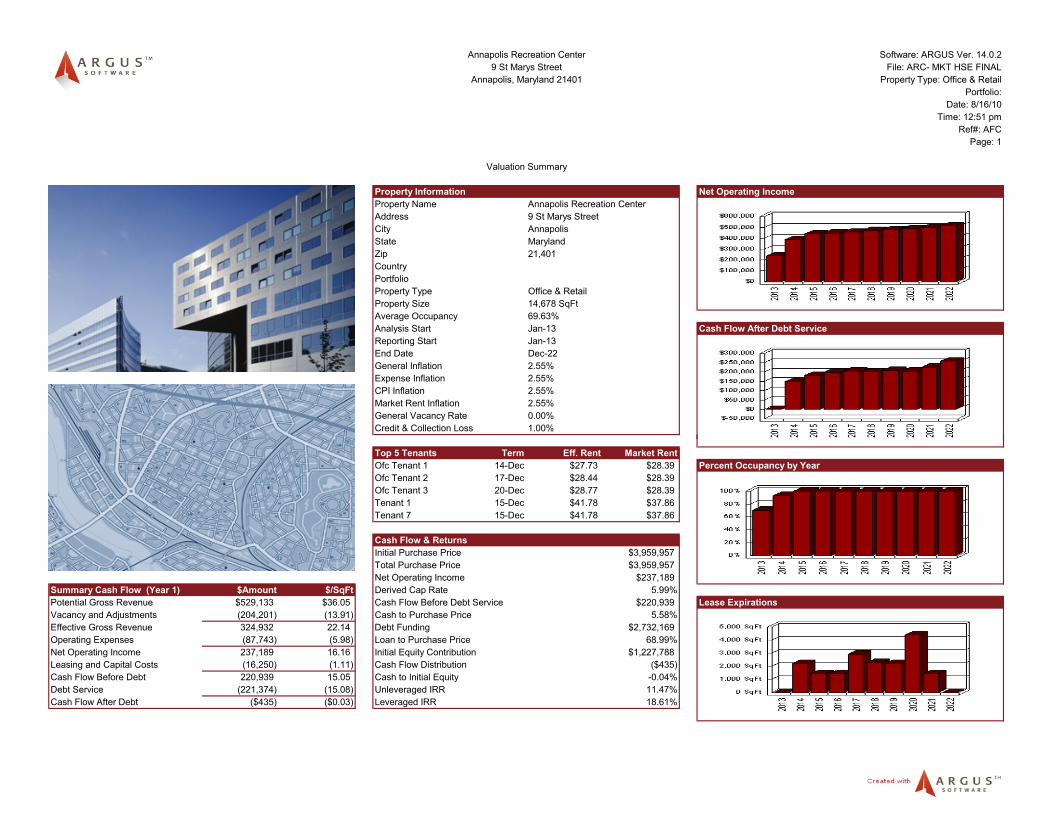
Software: ARGUS Ver. 14.0.2File: ARC- MKT HSE FINAL
Property Type: Office & RetailPortfolio:
Date: 8/16/10Time: 12:51 pm
Ref#: AFCPage: 1
Property Information Net Operating IncomeProperty Name Annapolis Recreation CenterAddress 9 St Marys StreetCity AnnapolisState MarylandZip 21,401CountryPortfolioProperty Type Office & RetailProperty Size 14,678 SqFtAverage Occupancy 69.63%Analysis Start Jan-13 Cash Flow After Debt ServiceReporting Start Jan-13End Date Dec-22General Inflation 2.55%Expense Inflation 2.55%CPI Inflation 2.55%Market Rent Inflation 2.55%General Vacancy Rate 0.00%Credit & Collection Loss 1.00%
Valuation Summary
Annapolis Recreation Center9 St Marys Street
Annapolis, Maryland 21401
Top 5 Tenants Term Eff. Rent Market RentOfc Tenant 1 14-Dec $27.73 $28.39 Percent Occupancy by YearOfc Tenant 2 17-Dec $28.44 $28.39Ofc Tenant 3 20-Dec $28.77 $28.39Tenant 1 15-Dec $41.78 $37.86Tenant 7 15-Dec $41.78 $37.86
Cash Flow & ReturnsInitial Purchase Price $3,959,957Total Purchase Price $3,959,957Net Operating Income $237,189
Summary Cash Flow (Year 1) $Amount $/SqFt Derived Cap Rate 5.99%Potential Gross Revenue $529,133 $36.05 Cash Flow Before Debt Service $220,939 Lease ExpirationsVacancy and Adjustments (204,201) (13.91) Cash to Purchase Price 5.58%Effective Gross Revenue 324,932 22.14 Debt Funding $2,732,169Operating Expenses (87,743) (5.98) Loan to Purchase Price 68.99%Net Operating Income 237,189 16.16 Initial Equity Contribution $1,227,788Leasing and Capital Costs (16,250) (1.11) Cash Flow Distribution ($435)Cash Flow Before Debt 220,939 15.05 Cash to Initial Equity -0.04%Debt Service (221,374) (15.08) Unleveraged IRR 11.47%Cash Flow After Debt ($435) ($0.03) Leveraged IRR 18.61%
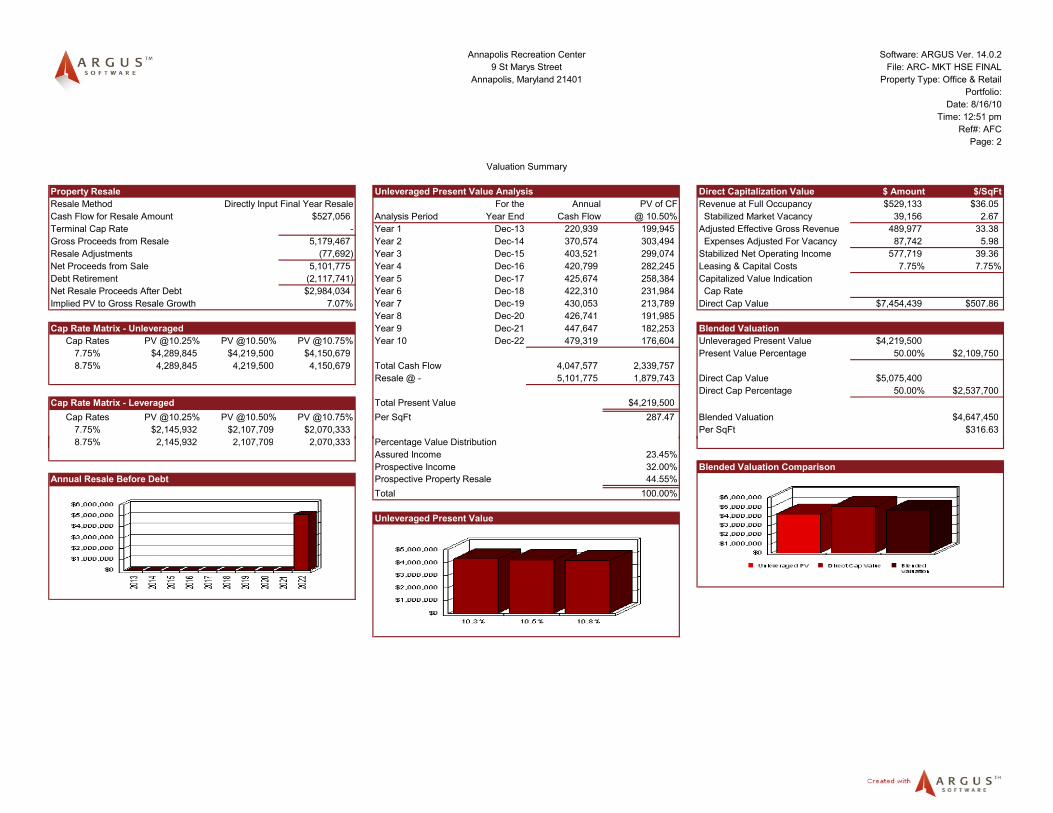
Software: ARGUS Ver. 14.0.2File: ARC- MKT HSE FINAL
Property Type: Office & RetailPortfolio:
Date: 8/16/10Time: 12:51 pm
Ref#: AFCPage: 2
Property Resale Unleveraged Present Value Analysis Direct Capitalization Value $ Amount $/SqFtResale Method Directly Input Final Year Resale For the Annual PV of CF Revenue at Full Occupancy $529,133 $36.05Cash Flow for Resale Amount $527,056 Analysis Period Year End Cash Flow @ 10.50% Stabilized Market Vacancy 39,156 2.67Terminal Cap Rate - Year 1 Dec-13 220,939 199,945 Adjusted Effective Gross Revenue 489,977 33.38Gross Proceeds from Resale 5,179,467 Year 2 Dec-14 370,574 303,494 Expenses Adjusted For Vacancy 87,742 5.98Resale Adjustments (77,692) Year 3 Dec-15 403,521 299,074 Stabilized Net Operating Income 577,719 39.36Net Proceeds from Sale 5,101,775 Year 4 Dec-16 420,799 282,245 Leasing & Capital Costs 7.75% 7.75%Debt Retirement (2,117,741) Year 5 Dec-17 425,674 258,384 Capitalized Value IndicationNet Resale Proceeds After Debt $2,984,034 Year 6 Dec-18 422,310 231,984 Cap RateImplied PV to Gross Resale Growth 7.07% Year 7 Dec-19 430,053 213,789 Direct Cap Value $7,454,439 $507.86
Year 8 Dec-20 426,741 191,985Cap Rate Matrix - Unleveraged Year 9 Dec-21 447,647 182,253 Blended Valuation
Cap Rates PV @10.25% PV @10.50% PV @10.75% Year 10 Dec-22 479,319 176,604 Unleveraged Present Value $4,219,5007.75% $4,289,845 $4,219,500 $4,150,679 Present Value Percentage 50.00% $2,109,7508.75% 4,289,845 4,219,500 4,150,679 Total Cash Flow 4,047,577 2,339,757
Resale @ - 5,101,775 1,879,743 Direct Cap Value $5,075,400Direct Cap Percentage 50.00% $2,537,700
Cap Rate Matrix - Leveraged Total Present Value $4,219,500Cap Rates PV @10.25% PV @10.50% PV @10.75% Per SqFt 287.47 Blended Valuation $4,647,450
7.75% $2,145,932 $2,107,709 $2,070,333 Per SqFt $316.638 75% 2 145 932 2 107 709 2 070 333 Percentage Value Distribution
Valuation Summary
Annapolis, Maryland 21401
Annapolis Recreation Center9 St Marys Street
8.75% 2,145,932 2,107,709 2,070,333 Percentage Value DistributionAssured Income 23.45%Prospective Income 32.00% Blended Valuation Comparison
Annual Resale Before Debt Prospective Property Resale 44.55%Total 100.00%
Unleveraged Present Value
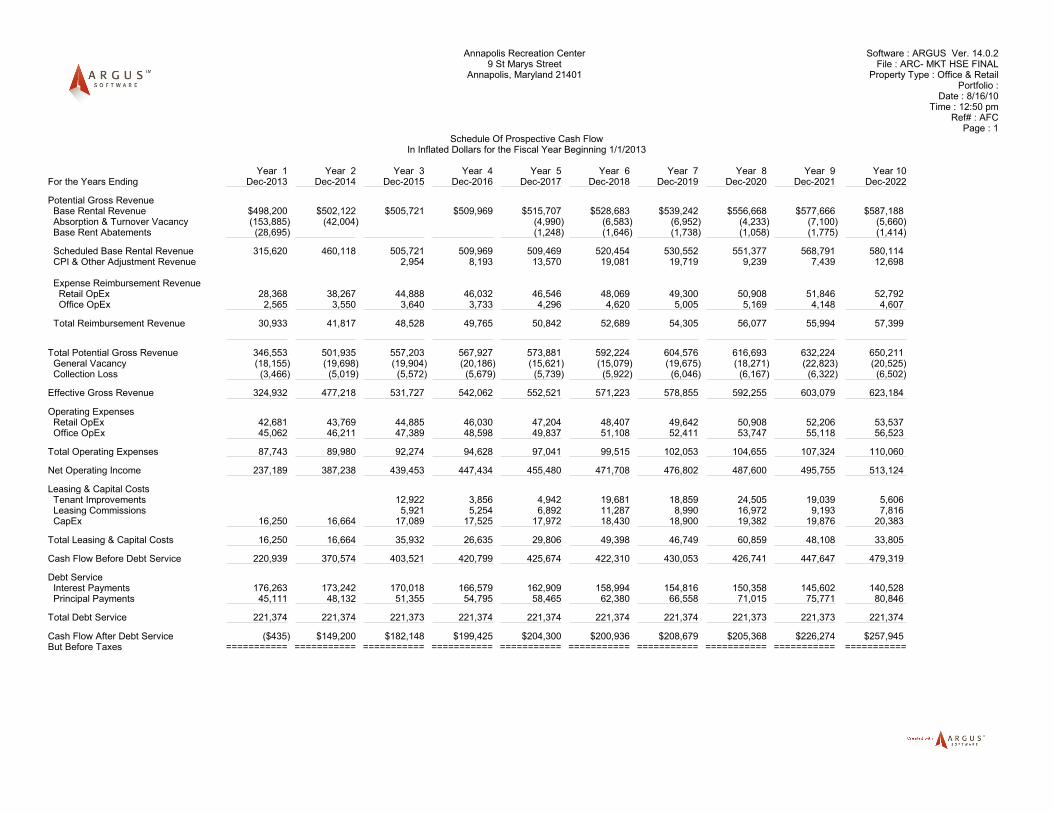
Annapolis Recreation Center Software : ARGUS Ver. 14.0.2 9 St Marys Street File : ARC- MKT HSE FINAL
Annapolis, Maryland 21401 Property Type : Office & Retail Portfolio :
Date : 8/16/10 Time : 12:50 pm
Ref# : AFC Page : 1
Schedule Of Prospective Cash FlowIn Inflated Dollars for the Fiscal Year Beginning 1/1/2013
Year 1 Year 2 Year 3 Year 4 Year 5 Year 6 Year 7 Year 8 Year 9 Year 10For the Years Ending Dec-2013 Dec-2014 Dec-2015 Dec-2016 Dec-2017 Dec-2018 Dec-2019 Dec-2020 Dec-2021 Dec-2022
Potential Gross Revenue Base Rental Revenue $498,200 $502,122 $505,721 $509,969 $515,707 $528,683 $539,242 $556,668 $577,666 $587,188 Absorption & Turnover Vacancy (153,885) (42,004) (4,990) (6,583) (6,952) (4,233) (7,100) (5,660) Base Rent Abatements (28,695) (1,248) (1,646) (1,738) (1,058) (1,775) (1,414)
Scheduled Base Rental Revenue 315,620 460,118 505,721 509,969 509,469 520,454 530,552 551,377 568,791 580,114 CPI & Other Adjustment Revenue 2,954 8,193 13,570 19,081 19,719 9,239 7,439 12,698
Expense Reimbursement Revenue Retail OpEx 28,368 38,267 44,888 46,032 46,546 48,069 49,300 50,908 51,846 52,792 Office OpEx 2,565 3,550 3,640 3,733 4,296 4,620 5,005 5,169 4,148 4,607
Total Reimbursement Revenue 30,933 41,817 48,528 49,765 50,842 52,689 54,305 56,077 55,994 57,399
Total Potential Gross Revenue 346,553 501,935 557,203 567,927 573,881 592,224 604,576 616,693 632,224 650,211 General Vacancy (18,155) (19,698) (19,904) (20,186) (15,621) (15,079) (19,675) (18,271) (22,823) (20,525) Collection Loss (3,466) (5,019) (5,572) (5,679) (5,739) (5,922) (6,046) (6,167) (6,322) (6,502)
Effective Gross Revenue 324,932 477,218 531,727 542,062 552,521 571,223 578,855 592,255 603,079 623,184
Operating Expenses Retail OpEx 42,681 43,769 44,885 46,030 47,204 48,407 49,642 50,908 52,206 53,537 Office OpEx 45,062 46,211 47,389 48,598 49,837 51,108 52,411 53,747 55,118 56,523
Total Operating Expenses 87,743 89,980 92,274 94,628 97,041 99,515 102,053 104,655 107,324 110,060
Net Operating Income 237,189 387,238 439,453 447,434 455,480 471,708 476,802 487,600 495,755 513,124
Leasing & Capital Costs Tenant Improvements 12,922 3,856 4,942 19,681 18,859 24,505 19,039 5,606 Leasing Commissions 5,921 5,254 6,892 11,287 8,990 16,972 9,193 7,816 CapEx 16,250 16,664 17,089 17,525 17,972 18,430 18,900 19,382 19,876 20,383
Total Leasing & Capital Costs 16,250 16,664 35,932 26,635 29,806 49,398 46,749 60,859 48,108 33,805
Cash Flow Before Debt Service 220,939 370,574 403,521 420,799 425,674 422,310 430,053 426,741 447,647 479,319
Debt Service Interest Payments 176,263 173,242 170,018 166,579 162,909 158,994 154,816 150,358 145,602 140,528 Principal Payments 45,111 48,132 51,355 54,795 58,465 62,380 66,558 71,015 75,771 80,846
Total Debt Service 221,374 221,374 221,373 221,374 221,374 221,374 221,374 221,373 221,373 221,374
Cash Flow After Debt Service ($435) $149,200 $182,148 $199,425 $204,300 $200,936 $208,679 $205,368 $226,274 $257,945 But Before Taxes =========== =========== =========== =========== =========== =========== =========== =========== =========== ===========

Annapolis Recreation Center Software : ARGUS Ver. 14.0.2 9 St Marys Street File : ARC- MKT HSE FINAL
Annapolis, Maryland 21401 Property Type : Office & Retail Portfolio :
Date : 8/16/10 Time : 12:50 pm
Ref# : AFC Page : 2
Schedule Of Expense Reimbursement RevenueFiscal Year Reimbursable Operating Expenses Adjusted for Full Occupancy
Year 1 Year 2 Year 3 Year 4 Year 5 Year 6 Year 7 Year 8 Year 9 Year 10For the Years Ending Dec-2013 Dec-2014 Dec-2015 Dec-2016 Dec-2017 Dec-2018 Dec-2019 Dec-2020 Dec-2021 Dec-2022
Reimbursable Expenses Retail OpEx $42,681 $43,769 $44,885 $46,030 $47,204 $48,407 $49,642 $50,908 $52,206 $53,537 Office OpEx 45,062 46,211 47,389 48,598 49,837 51,108 52,411 53,747 55,118 56,523
Total Reimbursable Expenses $87,743 $89,980 $92,274 $94,628 $97,041 $99,515 $102,053 $104,655 $107,324 $110,060 =========== =========== =========== =========== =========== =========== =========== =========== =========== ===========
Resulting Fiscal Year Property Expense Reimbursement Revenue
Year 1 Year 2 Year 3 Year 4 Year 5 Year 6 Year 7 Year 8 Year 9 Year 10For the Years Ending Dec-2013 Dec-2014 Dec-2015 Dec-2016 Dec-2017 Dec-2018 Dec-2019 Dec-2020 Dec-2021 Dec-2022
Expense Reimbursements Retail OpEx $28,368 $38,267 $44,888 $46,032 $46,546 $48,069 $49,300 $50,908 $51,846 $52,792 Office OpEx 2,565 3,550 3,640 3,733 4,296 4,620 5,005 5,169 4,148 4,607
Total Expense Reimbursement $30,933 $41,817 $48,528 $49,765 $50,842 $52,689 $54,305 $56,077 $55,994 $57,399 =========== =========== =========== =========== =========== =========== =========== =========== =========== ===========
Percentage of Reimbursable Expenses Collected as Expense Reimbursement
Year 1 Year 2 Year 3 Year 4 Year 5 Year 6 Year 7 Year 8 Year 9 Year 10For the Years Ending Dec-2013 Dec-2014 Dec-2015 Dec-2016 Dec-2017 Dec-2018 Dec-2019 Dec-2020 Dec-2021 Dec-2022
Expense Reimbursements Retail OpEx 66.47% 87.43% 100.01% 100.00% 98.61% 99.30% 99.31% 100.00% 99.31% 98.61% Office OpEx 5.69% 7.68% 7.68% 7.68% 8.62% 9.04% 9.55% 9.62% 7.53% 8.15%
Total Expense Reimbursement 35.25% 46.47% 52.59% 52.59% 52.39% 52.95% 53.21% 53.58% 52.17% 52.15% =========== =========== =========== =========== =========== =========== =========== =========== =========== ===========

Annapolis Recreation Center Software : ARGUS Ver. 14.0.2 9 St Marys Street File : ARC- MKT HSE FINAL
Annapolis, Maryland 21401 Property Type : Office & Retail Portfolio :
Date : 8/16/10 Time : 12:50 pm
Ref# : AFC Page : 3
Individual Loan & Debt Service SummaryLoan number 1 - Sandy Spring Perm Loan
Year 1 Year 2 Year 3 Year 4 Year 5 Year 6 Year 7 Year 8 Year 9 Year 10For the Years Ending Dec-2013 Dec-2014 Dec-2015 Dec-2016 Dec-2017 Dec-2018 Dec-2019 Dec-2020 Dec-2021 Dec-2022
Minimum Debt Service Interest Payments $176,263 $173,242 $170,018 $166,579 $162,909 $158,994 $154,816 $150,358 $145,602 $140,528 Principal Payments 45,111 48,132 51,355 54,795 58,465 62,380 66,558 71,015 75,771 80,846
Total Minimum Debt Service 221,374 221,374 221,373 221,374 221,374 221,374 221,374 221,373 221,373 221,374
Reductions & Retirement Principal Balloon or Call 2,117,741
Total Reductions & Retirement 2,117,741
Total Cash Flow Paid To Lender $221,374 $221,374 $221,373 $221,374 $221,374 $221,374 $221,374 $221,373 $221,373 $2,339,115 =========== =========== =========== =========== =========== =========== =========== =========== =========== ===========
Principal Balance Summary Beginning Principal Balance $2,732,169 $2,687,059 $2,638,926 $2,587,572 $2,532,777 $2,474,311 $2,411,932 $2,345,373 $2,274,358 $2,198,587 Periodic Principal Reductions (45,111) (48,132) (51,355) (54,795) (58,465) (62,380) (66,558) (71,015) (75,771) (80,846) Principal Balloon Payments (2,117,741)
Ending Principal Balance $2,687,058 $2,638,927 $2,587,571 $2,532,777 $2,474,312 $2,411,931 $2,345,374 $2,274,358 $2,198,587 =========== =========== =========== =========== =========== =========== =========== =========== =========== ===========
Interest Rates Interest Rate on Principal 6.50% 6.50% 6.50% 6.50% 6.50% 6.50% 6.50% 6.50% 6.50% 6.50%
Cash Flow Coverage Ratios Cash to Total Interest Charged 134.57% 223.52% 258.47% 268.60% 279.59% 296.68% 307.98% 324.29% 340.49% 365.14% Cash to Minimum Debt Service 107.14% 174.92% 198.51% 202.12% 205.75% 213.08% 215.38% 220.26% 223.95% 231.79%
Loan To Value Ratios Loan to Purchase Price 68.99% 67.86% 66.64% 65.34% 63.96% 62.48% 60.91% 59.23% 57.43% 55.52% Loan to Capitalized Value ************* ************* ************* ************* ************* ************* ************* ************* ************* ************* Loan to Lowest Present Value 65.82% 64.74% 63.58% 62.34% 61.02% 59.61% 58.11% 56.51% 54.79% 52.97% Loan to Highest Present Value 63.69% 62.64% 61.52% 60.32% 59.04% 57.68% 56.22% 54.67% 53.02% 51.25%
Lenders Yields (IRR) Base Yield to Maturity 6.50%
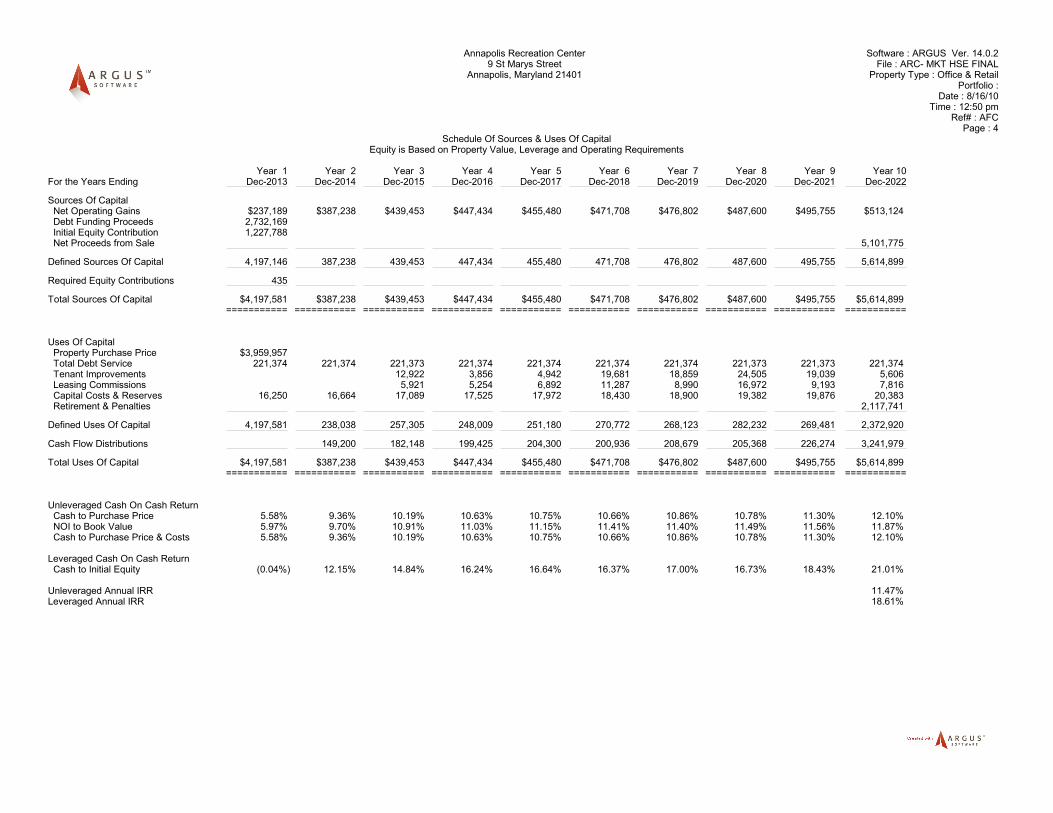
Annapolis Recreation Center Software : ARGUS Ver. 14.0.2 9 St Marys Street File : ARC- MKT HSE FINAL
Annapolis, Maryland 21401 Property Type : Office & Retail Portfolio :
Date : 8/16/10 Time : 12:50 pm
Ref# : AFC Page : 4
Schedule Of Sources & Uses Of CapitalEquity is Based on Property Value, Leverage and Operating Requirements
Year 1 Year 2 Year 3 Year 4 Year 5 Year 6 Year 7 Year 8 Year 9 Year 10For the Years Ending Dec-2013 Dec-2014 Dec-2015 Dec-2016 Dec-2017 Dec-2018 Dec-2019 Dec-2020 Dec-2021 Dec-2022
Sources Of Capital Net Operating Gains $237,189 $387,238 $439,453 $447,434 $455,480 $471,708 $476,802 $487,600 $495,755 $513,124 Debt Funding Proceeds 2,732,169 Initial Equity Contribution 1,227,788 Net Proceeds from Sale 5,101,775
Defined Sources Of Capital 4,197,146 387,238 439,453 447,434 455,480 471,708 476,802 487,600 495,755 5,614,899
Required Equity Contributions 435
Total Sources Of Capital $4,197,581 $387,238 $439,453 $447,434 $455,480 $471,708 $476,802 $487,600 $495,755 $5,614,899 =========== =========== =========== =========== =========== =========== =========== =========== =========== ===========
Uses Of Capital Property Purchase Price $3,959,957 Total Debt Service 221,374 221,374 221,373 221,374 221,374 221,374 221,374 221,373 221,373 221,374 Tenant Improvements 12,922 3,856 4,942 19,681 18,859 24,505 19,039 5,606 Leasing Commissions 5,921 5,254 6,892 11,287 8,990 16,972 9,193 7,816 Capital Costs & Reserves 16,250 16,664 17,089 17,525 17,972 18,430 18,900 19,382 19,876 20,383 Retirement & Penalties 2,117,741
Defined Uses Of Capital 4,197,581 238,038 257,305 248,009 251,180 270,772 268,123 282,232 269,481 2,372,920
Cash Flow Distributions 149,200 182,148 199,425 204,300 200,936 208,679 205,368 226,274 3,241,979
Total Uses Of Capital $4,197,581 $387,238 $439,453 $447,434 $455,480 $471,708 $476,802 $487,600 $495,755 $5,614,899 =========== =========== =========== =========== =========== =========== =========== =========== =========== ===========
Unleveraged Cash On Cash Return Cash to Purchase Price 5.58% 9.36% 10.19% 10.63% 10.75% 10.66% 10.86% 10.78% 11.30% 12.10% NOI to Book Value 5.97% 9.70% 10.91% 11.03% 11.15% 11.41% 11.40% 11.49% 11.56% 11.87% Cash to Purchase Price & Costs 5.58% 9.36% 10.19% 10.63% 10.75% 10.66% 10.86% 10.78% 11.30% 12.10%
Leveraged Cash On Cash Return Cash to Initial Equity (0.04%) 12.15% 14.84% 16.24% 16.64% 16.37% 17.00% 16.73% 18.43% 21.01%
Unleveraged Annual IRR 11.47% Leveraged Annual IRR 18.61%

Annapolis Recreation Center Software : ARGUS Ver. 14.0.2 9 St Marys Street File : ARC- MKT HSE FINAL
Annapolis, Maryland 21401 Property Type : Office & Retail Portfolio :
Date : 8/16/10 Time : 12:50 pm
Ref# : AFC Page : 5
Prospective Property Resale
Year 1 Year 2 Year 3 Year 4 Year 5 Year 6 Year 7 Year 8 Year 9 Year 10For the Years Ending Dec-2013 Dec-2014 Dec-2015 Dec-2016 Dec-2017 Dec-2018 Dec-2019 Dec-2020 Dec-2021 Dec-2022
Resale Amount Gross Proceeds from Sale $5,179,467 Commissions & Adjustments (77,692)
Net Proceeds From Sale 5,101,775
Outstanding Debt Retirement Total Principal Balances (2,117,741)
Net Resale Proceeds After Debt $2,984,034 =========== =========== =========== =========== =========== =========== =========== =========== =========== ===========
Unleveraged Annual IRR 11.47% Leveraged Annual IRR 18.61%
Annapolis Recreation Center Software : ARGUS Ver. 14.0.2 9 St Marys Street File : ARC- MKT HSE FINAL
Annapolis, Maryland 21401 Property Type : Office & Retail Portfolio :
Date : 8/16/10 Time : 12:50 pm
Ref# : AFC Page : 6
Direct Capitalization Value Summary
1-12For the Months Total
Revenue Adjusted For Vacancy Revenue at Full Occupancy $529,133 Stabilized Market Vacancy (39,156)
Adjusted Effective Gross Revenue 489,977
Expenses Adjusted For Vacancy Expenses at Full Occupancy (87,742)
Stabilized Net Operating Income 402,235
Capitalization Capitalization Rate 7.75%
Capitalized Value Indication 5,190,129
Adjustments To Value Adjustment for Actual Vacancy (114,729)
Gross Proceeds From Sale 5,075,400
Net Capitalized Value 5,075,400 ===========
Annapolis Recreation Center Software : ARGUS Ver. 14.0.2 9 St Marys Street File : ARC- MKT HSE FINAL
Annapolis, Maryland 21401 Property Type : Office & Retail Portfolio :
Date : 8/16/10 Time : 12:50 pm
Ref# : AFC Page : 7
Prospective Present ValueCash Flow Before Debt Service plus Property Resale
Discounted Annually (Endpoint on Cash Flow & Resale) over a 10-Year Period
For the P.V. of P.V. of P.V. of Analysis Year Annual Cash Flow Cash Flow Cash Flow Period Ending Cash Flow @ 10.25% @ 10.50% @ 10.75%
Year 1 Dec-2013 $220,939 $200,398 $199,945 $199,493 Year 2 Dec-2014 370,574 304,872 303,494 302,126 Year 3 Dec-2015 403,521 301,114 299,074 297,054 Year 4 Dec-2016 420,799 284,813 282,245 279,704 Year 5 Dec-2017 425,674 261,327 258,384 255,481 Year 6 Dec-2018 422,310 235,158 231,984 228,860 Year 7 Dec-2019 430,053 217,206 213,789 210,434 Year 8 Dec-2020 426,741 195,495 191,985 188,545 Year 9 Dec-2021 447,647 186,007 182,253 178,583 Year 10 Dec-2022 479,319 180,650 176,604 172,659
Total Cash Flow 4,047,577 2,367,040 2,339,757 2,312,939 Property Resale 5,101,775 1,922,805 1,879,743 1,837,740
Total Property Present Value $4,289,845 $4,219,500 $4,150,679 =========== =========== ===========
Rounded to Thousands $4,290,000 $4,220,000 $4,151,000
=========== =========== =========== Per SqFt 292.26 287.47 282.78
Percentage Value Distribution
Assured Income 23.22% 23.45% 23.69% Prospective Income 31.96% 32.00% 32.03% Prospective Property Resale 44.82% 44.55% 44.28%
=========== =========== =========== 100.00% 100.00% 100.00%
Annapolis Recreation Center Software : ARGUS Ver. 14.0.2 9 St Marys Street File : ARC- MKT HSE FINAL
Annapolis, Maryland 21401 Property Type : Office & Retail Portfolio :
Date : 8/16/10 Time : 12:50 pm
Ref# : AFC Page : 8
Prospective Present ValueCash Flow After Debt Service plus Property Resale
Discounted Annually (Endpoint on Cash Flow & Resale) over a 10-Year Period
For the P.V. of P.V. of P.V. of Analysis Year Annual Cash Flow Cash Flow Cash Flow Period Ending Cash Flow @ 10.25% @ 10.50% @ 10.75%
Year 1 Dec-2013 ($435) ($395) ($394) ($393) Year 2 Dec-2014 149,200 122,748 122,193 121,642 Year 3 Dec-2015 182,148 135,921 135,001 134,089 Year 4 Dec-2016 199,425 134,979 133,761 132,557 Year 5 Dec-2017 204,300 125,422 124,010 122,617 Year 6 Dec-2018 200,936 111,889 110,379 108,892 Year 7 Dec-2019 208,679 105,397 103,739 102,111 Year 8 Dec-2020 205,368 94,082 92,392 90,736 Year 9 Dec-2021 226,274 94,021 92,124 90,270 Year 10 Dec-2022 257,945 97,217 95,040 92,916
Total Cash Flow 1,833,840 1,021,281 1,008,245 995,437 Property Resale 2,984,034 1,124,651 1,099,464 1,074,896
Value of Equity Interest $2,145,932 $2,107,709 $2,070,333 =========== =========== ===========
Rounded to Thousands $2,146,000 $2,108,000 $2,070,000
=========== =========== =========== Per SqFt 146.20 143.60 141.05
Value of Equity Interest $2,145,932 $2,107,709 $2,070,333 Debt Balance as of Jan-2013 2,732,169 2,732,169 2,732,169 2,732,169
=========== =========== =========== Total Leveraged Present Value 4,878,101 4,839,878 4,802,502 Rounded to Thousands $4,878,000 $4,840,000 $4,803,000
=========== =========== =========== Per SqFt 332.34 329.74 327.19
Annapolis Recreation Center Software : ARGUS Ver. 14.0.2 9 St Marys Street File : ARC- MKT HSE FINAL
Annapolis, Maryland 21401 Property Type : Office & Retail Portfolio :
Date : 8/16/10 Time : 12:50 pm
Ref# : AFC Page : 9
Property Summary Report
Timing & Inflation Reporting Period: January 1, 2013 to December 31, 2022; 10 years Inflation Month: Analysis Start General Inflation Rate: 2.55% Property Size & Occupancy Property Size: 14,678 Square Feet Alternate Size: 16,250 Square Feet Number of rent roll tenants: 11 Total Occupied Area: 10,220 Square Feet, 69.63%, during first month of analysis Space Absorption Vacant Retail 2,885.00 Square Feet, leasing from 1/14 to 10/14
1 lease per quarter, 721.25 SqFt per lease Vacant Office 1,573.00 Square Feet, leasing from 1/14 to 1/14
1 lease per quarter, 1,573.00 SqFt per lease General Vacancy Method: Percent of Potential Gross Revenue Rate: 0.00% Based On: Tenant Groups Affect Primary Rate As: Replace Included Groups: 7.40% for Office
7.20% for Retail Credit & Collection Loss Method: Percent of Potential Gross Revenue Rate: 1.00% Debt Financing Number of Notes: 1 Beginning Principal Balance: $2,732,169 Average Year 1 Interest Rate: 6.50% Property Purchase & Resale Purchase Price: $3,959,957 Resale Method: Directly Input Final Year Resale Amount Commission/Closing Cost: $77,692 Net Cash Flow from Sale: $2,984,034 Present Value Discounting Discount Method: Annually (Endpoint on Cash Flow & Resale) Unleveraged Discount Rate: 10.50% Unleveraged Present Value: $4,219,500 at 10.50% Unleveraged Annual IRR: 11.47% Leveraged Discount Rate: 10.50% Value of Equity Interest: $2,107,709 at 10.50% Leveraged Annual IRR: 18.61%

Appendix M: Development Schedule
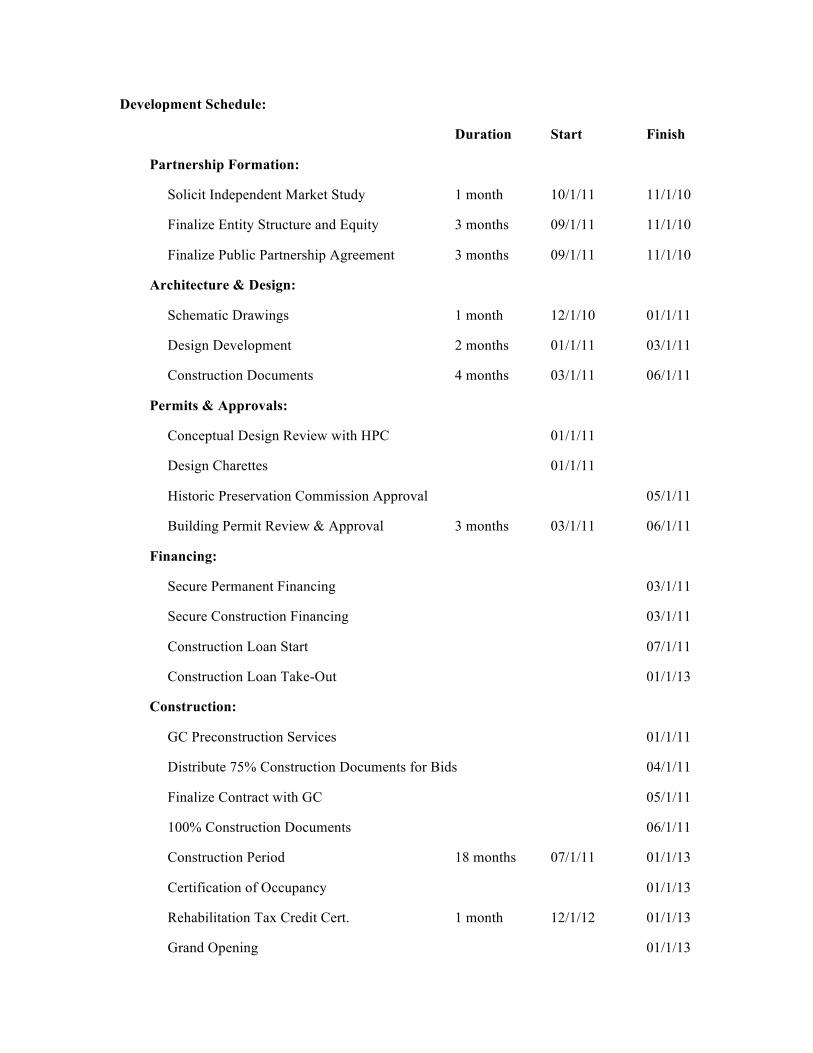
Development Schedule:
Duration Start Finish
Partnership Formation:
Solicit Independent Market Study 1 month 10/1/11 11/1/10
Finalize Entity Structure and Equity 3 months 09/1/11 11/1/10
Finalize Public Partnership Agreement 3 months 09/1/11 11/1/10
Architecture & Design:
Schematic Drawings 1 month 12/1/10 01/1/11
Design Development 2 months 01/1/11 03/1/11
Construction Documents 4 months 03/1/11 06/1/11
Permits & Approvals:
Conceptual Design Review with HPC 01/1/11
Design Charettes 01/1/11
Historic Preservation Commission Approval 05/1/11
Building Permit Review & Approval 3 months 03/1/11 06/1/11
Financing:
Secure Permanent Financing 03/1/11
Secure Construction Financing 03/1/11
Construction Loan Start 07/1/11
Construction Loan Take-Out 01/1/13
Construction:
GC Preconstruction Services 01/1/11
Distribute 75% Construction Documents for Bids 04/1/11
Finalize Contract with GC 05/1/11
100% Construction Documents 06/1/11
Construction Period 18 months 07/1/11 01/1/13
Certification of Occupancy 01/1/13
Rehabilitation Tax Credit Cert. 1 month 12/1/12 01/1/13
Grand Opening 01/1/13