development readings in human nepal · the chapters of the nepal: readings in human development...
TRANSCRIPT

Nepal:Readings in HumanDevelopment
Nepal: Readings in H
uman D
evelopment
Four Essential Pillars of Human Development
EquityEquity is a powerful concept that lies at the heart of the humandevelopment paradigm. Equity should be understood as equity in lifeopportunities, not necessarily in results. If development is to enlargechoices, the people must enjoy equitable access to social, economic andpolitical opportunities. Ensuring equity in access to opportunitiesdemands a fundamental restructuring of power.
SustainabilityCentral to the concept of sustainability is the notion of distributionalequity – of sharing development opportunities between present and futuregenerations and ensuring intragenerational and intergenerational equityin access to opportunities. It is the sustainability of all forms of capital– physical, human, financial and environmental– that must lie at the centreof human development concerns. What must be sustained are worthwhilelife opportunities, not human deprivation.
ProductivityProductivity is another essential component of the human developmentparadigm. In contrast to human capital based development models whichtreat people only as a means of development, productivity is just onepart of the human development paradigm - with equal importance givento the other components of human development. Economic growth istherefore a subset of the human development model - an essential partbut not the entire structure.
EmpowermentHuman development paradigm envisages full empowerment of the peopleon all fronts - social, economic and political- meaning that people are ina position to exercise their choice of their own free will. In contrast tothe basic needs model, which is generally limited to economic choice, thehuman development paradigm embrace all critical choices – social, cultural,economic and political. Empowerment is, therefore, the critical pillarreinforcing other components of human development.
9 7 8 9 9 9 3 3 7 6 3 9 2
ISBN 99933 - 763 - 9 - 6Edited by
Sriram Raj PandeShawna TroppBikash Sharma
Yuba Raj Khatiwada
Nepal:Readings in HumanDevelopment
Edited bySriram Raj Pande
Shawna TroppBikash Sharma
Yuba Raj Khatiwada

Nepal: Readings in Human Development
Copyright @ 2006United Nations Development Programme
Published byUnited Nations Development ProgrammePost Office Box 107PulchowkKathmandu, Nepal
tel. 977-1-5523200email. [email protected]. http://www.undp.org.np
All rights reserved. No part of this publication may bereproduced, stored in a retrieval system or transmitted,in any form or by any means, electronic, mechanical,photocopying, recording or otherwise, without priorpermission of UNDP.
ISBN: 99933-763-9-6Printed in Nepal by Jagadamba PressDesign and layout by Bhai Kaji Rajbahak
Foreword
iii
Human development must be at the centreof all development efforts to enhance thecapabilities of people to expand choices andlive in dignity. UNDP has successfullyadvocated for human development since1990 through the annual humandevelopment reports. Since then, nationalhuman development reports have beenproduced in more than 136 countriesworldwide. The human developmentparadigm has now become the overarchingframework for development planning inmost developing countries with theMillennium Development Goals (MDGs) asinstruments for sustained human progress.
The Nepal Readings in HumanDevelopment has been produced as areference for Master’s level students whowill be enrolling in the human developmentcourse. The course is expected to be
introduced into the major universities ofNepal soon. The book has been preparedin close collaboration with these academicinstitutions. The course was piloted duringintensive ten-day training programmes atPurbanchal and Pokhara Universities. Thebook went through several reviews and waspresented to senior faculty of theuniversities before final editing. I hope thisbook will be useful for students as they seekto broaden their understanding of humandevelopment.
UNDP is pleased to support Nepal’sacademic institutions as they introducehuman development into Master’s levelcourses. I am sure this book will be useful tostudents, teachers and researchers alike intaking the human development torchforward for the creation of a just andequitable Nepalese society.
Matthew G. KahaneUN Resident and Humanitarian Coordinatorand UNDP Resident Representative
v
Acknowledgements
The Nepal: Readings in Human Develop-ment (RHD) makes an in-depth analysis ofthe theory and practice of humandevelopment in Nepal. Prepared under theaegis of the National Planning Commission(NPC) and United Nations DevelopmentProgramme (UNDP), the primary objectiveof the RHD is to provide a reference tosupport a course on human development atthe Masters level in the universities in Nepal.
This book could not have been producedwithout the collaboration of the fouruniversities - Tribhuvan, Kathmandu,Purbanchal and Pokhara. The supportprovided by the teachers and studentsof these universities are gratefullyacknowledged.
The chapters of the Nepal: Readings inHuman Development were reviewed by ateam of eminent experts. The reviewersincluded Sriram Raj Pande (chapter 1),Bikash Sharma, Prakash Dev Pant, andArun Kumar Lal Das (chapter 2), KailashNath Pyakurel (chapter 3), Chandani Joshi(chapter 4), Shiva Raj Lohani (chapter 5),Badri Raj Pande (chapter 6), theEnvironment Unit of UNDP (chapter 7),Yuba Raj Khatiwada (Chapter 8), Dev RajDahal (chapter 9) and Shawna Tropp(chapter 10).
We wish to express our sincere gratitude tothe members of the Human Development
Policy Working Group (HDPWG) - a highlevel committee formed by the universitiesto advise and guide the consultants on thecontents and quality of the product. TheCommittee comprised of Govinda RamAgrawal of Tribhuvan University, KulShekhar Adhikari of Purbanchal University,Kundan Dutta Koirala of PokharaUniversity and Rana Bahadur Chhetri andthe late Kishor Gajurel of KathmanduUniversity.
We are thankful to Govinda P. Sharma, Vice-chancellor, Tribhuvan University, SureshRaj Sharma, Vice-chancellor, KathmanduUniversity, Purushottam Banskota, Vice-chancellor, Pokhara University and ToranBahadur Karki, then Vice-chancellor,Purbanchal University for their supportduring this exercise. Mahendra PrasadSingh, Rector, Gita Bhakta Joshi, Registrar,Tri Ratna Manandhar, former Dean,Ramesh Kanwar, Dean, Faculty ofHumanities and Social Science andParashar Koirala, Dean, Faculty ofManagement, of Tribhuvan University areduly acknowledged for their ongoingsupport in the introduction andinstitutionalization of the humandevelopment course in the university.
We would like to express our appreciationto Shankar P. Sharma, Vice Chairman,National Planning Commission, Yuba RajKhatiwada, then Member of National

vi
Planning Commission, Matthew Kahane,UNDP Resident Representative and UNResident and Humanitarian Coordinatorand Ghulam M. Isaczai, Deputy ResidentRepresentative, UNDP, for their guidanceand encouragement.
We would also like to acknowledgecontributions and support of Keshav P.Bhattarai, Joint Secretary, National PlanningCommission, and Nanako Tsukahara and
Deepak Shrestha, Programme Officers, Pro-poor Policies and Initiative Unit, UNDP.
The technical and logistical supportprovided by Mukunda Raj Pandeya,National Project Manager, BuildingCapacity to Promote Human Development,and his team during the entire process isduly acknowledged. Bhai Kaji Rajbahakprovided secretarial support to the team andprepared design and layout of the book.
Sriram Raj PandeAssistant Resident Representative andSenior Advisor on Pro-Poor PoliciesUnited Nations Development Programme

vii
Abbreviations
ALR Adult Literacy RateAPP Agricultural Perspective PlanCBOs Community Based OrganizationsCBS Central Bureau of StatisticsCEDAW Convention on Eradication of
Discrimination Against WomenCFUG Community Forestry User GroupCIAA Commission for the Investigation of the
Abuse of AuthorityCSOs Civil Society OrganizationsDRD Declaration on the Right to DevelopmentEAP Economically Active PopulationEASA Education Act Seventh AmendmentECD Early Childhood DevelopmentEDEI Equally Distributed Equivalent IndexEFA Education for AllEIA Environmental Impact AssessmentFDI Foreign Direct InvestmentFLE Femlae Life ExpectancyF-M Male and Female RatioFWCW Fourth World Conference on WomenGAD Gender and DevelopmentGBV Gender-based ViolenceGDI Gender-related Development IndexGDPs Gross Domestic ProductsGEM Gender Empowerment MeasureGER Gross Enrollment RatioGHGs Greenhouse GasesGIA Grants-in-aidGNP Gross National ProductHDI Human Development IndexHDRs Human Development ReportsHEI Human Empowerment IndexHMG/N His Majesty’s Government of NepalHNP Health, Nutrition and PopulationHSEB Higher Secondary Education BoardHSRS Health Sector Reform StrategyICPD International Conference on Population
DevelopmentIDA International Development AssociationILO International Labour OrganizationIMF International Monetary FundINGOs International Non-governmental
Orgnizations
LSGA Local Self-governance ActMCH/FP Maternal and Child Health and Family
PlanningMDGs Millennium Development GoalsMLE Male Life ExpectancyMoE Ministry of EducationMOES Ministry of Education and SportsMoH Ministry of HealthMTEF Medium-Term Expenditure FrameworkNESP National Education System PlanNFE Non-formal EducationNGOs Non-governmental OrganizationsNHP National Health PolicyNLSS Nepal Living Standards SurveyOECD Organization for Economic Cooperation
and DevelopmentPAF Poverty Alleviation FundPHC Primary Health CarePPP Purchasing Power ParityPRGFs Poverty Reduction and Growth FacilitiesPRSPs Poverty Reduction Strategy PapersRTIS Reproductive Tract InfectionsSAARC South Asian Association for Regional
CooperationSAPs Structural Adjustment PoliciesSMCs School Management CommitteesTU Tribhuvan UniversityUN United NationsUNCED United Nations Conference on
Environment and DevelopmentUNDP United Nations Development ProgrammeUNESCO United Nations Educational, Scientific and
Cultural OrganizationUNFPA United Nations Fund for Population
ActivitiesUNIFEM United Nations Development Fund for
WomenVDC Village Development CommitteeWAD Women and DevelopmentWCED World Commission on Environment and
DevelopmentWHO World Health OrganizationWID Women in DevelopmentWTO World Trade Organization


Contents
CHAPTER 1 INTRODUCTION TO HUMAN DEVELOPMENT 1– Pitamber SharmaIntroduction 1Perceptions of the “development process”: an historical overview 1The why and how of economic growth 3Antecedents of the human development approach 7The Concept of human development 12Concepts and measurements of human development 21The human development paradigm and its implications 22Human development in the global context 25Human development in Nepal 30
CHAPTER 2 MEASURING HUMAN DEVELOPMENT 37– Devendra ChhetryThe human development index 39Gender-related development index 42Gender empowerment measure 46Human poverty index 48Critiques of the human development measures 50Human development measurement practices in Nepal 52Data issues of Nepal human development measurements 53Analysing human development measurements in Nepal 54
CHAPTER 3 INCLUSIVE HUMAN DEVELOPMENT IN NEPAL 71– Harka GurungIntroduction 71Causes of disparity 72The extent of exclusion 73Conclusion 77
CHAPTER 4 GENDER AND HUMAN DEVELOPMENT 81– Bina PradhanThe Gender dimension of the human development approach 82Charting progress in gender equality/equity 92Emerging issues in gender inequalities and global concerns 101Socioeconomic measures of gender equality 107Women’s progress in Nepal 110Conclusions and their implications for engendering development 115
ix

CHAPTER 5 EDUCATION AND HUMAN DEVELOPMENT 119– Badri Dev PandeEducation and development 119Development and expansion of education in Nepal 122The state of education in Nepal 125Educational challenges and policy responses 133
CHAPTER 6 HEALTH AND HUMAN DEVELOPMENT 149– Bina PradhanIntroduction 149Health in human development 152Determinants of health status and health disparities 178The health situation in Nepal 180Conclusions 186
CHAPTER 7 THE ENVIRONMENTAL PERSPECTIVE INSUSTAINABLE HUMAN DEVELOPMENT 191– Mahesh BanskotaIntroduction 191The Environment and society 191Rethinking development and the role of the environment 195The human development paradigm and approach 203Nepal’s environmental profile 204Environmental problems and their impact onhuman development in Nepal 208Environmental laws, policies, plans and programmes 210Conclusion 211
CHAPTER 8 ECONOMIC POLICIES, POVERTYAND HUMAN DEVELOPMENT 213– Shizu UpadhyaIntroduction 213International poverty strategies 219Poverty and human development in Nepal 228Economic policies and poverty in Nepal 236Conclusion 248
x
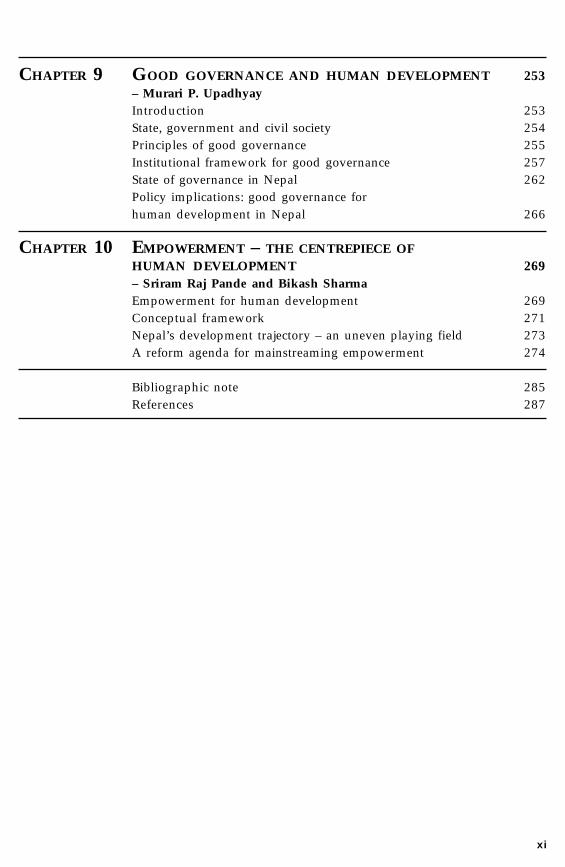
CHAPTER 9 GOOD GOVERNANCE AND HUMAN DEVELOPMENT 253– Murari P. UpadhyayIntroduction 253State, government and civil society 254Principles of good governance 255Institutional framework for good governance 257State of governance in Nepal 262Policy implications: good governance forhuman development in Nepal 266
CHAPTER 10 EMPOWERMENT – THE CENTREPIECE OFHUMAN DEVELOPMENT 269– Sriram Raj Pande and Bikash SharmaEmpowerment for human development 269Conceptual framework 271Nepal’s development trajectory – an uneven playing field 273A reform agenda for mainstreaming empowerment 274
Bibliographic note 285References 287
xi
BOXES1.1 The basic needs approach in Nepal 91.2 Elements of a typical structural adjustment programme 101.3 General critique of structural adjustment programme 111.4 Achievements that people generally value 131.5 Comparison between the capability-based approach and
the utility-based approach 161.6 Perceptions of development: the economic growth and
human development schools 171.7 Principles of the washington consensus 231.8 Differing national policy priorities 251.9 MDGs and targets 331.10 Analytical linkage between human development and the MDGs 342.1 Dimension of HDI 392.2 Refinement in the selection of indicators of HDI 392.3 Dimension and indicators of GDI 432.4 Dimensions and indicators of GEM 462.5 Dimensions and indicators of HPI-1 and HPI-2 492.6 Regular data sources of human development measures 532.7 Worst districts with respect to HDI, GDI or HPI 552.8 Districts with worsening HDI, GDI rankings between 1996 and 2001 564.1 Strategic interest versus practical gender interest 834.2 International conferences and consensuses on women and related areas 934.3 Gynecological and other diseases among women 994.4 Percentage of women-headed households in different regions of the world 1034.5 Extend and forms of gender based violence (GBV) 1044.6 Beliefs and practices resulting in GBV 1045.1 Orientation and content as important as resources –
lessons from education strategies in East Asia 1215.2 Historical evolution of education reforms in Nepal 1245.3 Challenges to be met for the attainment of MDGs 1406.1 Millennium development health goals 1516.2 Definition of health 1596.3 Definition of reproductive health 1666.4 ICPD paradigm shift in population 1676.5 Calculation of missing women 1726.6 Definition of GBV 1746.7 Abuse and violence 1746.8 Violence and discrimination 1756.9 Rape and physical abuse 1756.10 HIV/AIDS demographics, South/Southeast Asia 1777.1 Religions and biodiversity 1937.2 Sustainable development 197
xii
7.3 Environmental dimensions of poverty 1987.4 Links between ecosystems services and poverty 1997.5 Different indictors 2017.6 Valuation techniques of environmental resources 2038.1 Three perspectives on poverty 2178.2 A comparison of WB/IMF conditionalities under structural adjustment
and policies pursued by the highly industrialised and industrialisingcountries (Japan, the East Asian “tigers”, Western Europe, USA, Canada) 223
8.3 Some highlights of the international human rights framework 2258.4 Deprivation trap of the Kamaiya 2358.5 Targeted credit programmes in Nepal 237
TABLES1.1 HDI trends in Nepal and neighbouring countries 1975-2002 301.2 Trends in human development indices – national and regional 321.3 Nepal’s progress in achieving the MDGs, 1990-2005 362.1 HDI-related basic indicator values of Nepal, 1996 412.2 Gender disaggregated literacy rates and problem of ranking districts 422.3 GDI-related basic indicator values of Nepal, 2000 442.4 Computation of normalized score 452.5 Trends in gender inequality in Nepal in the 1990s 452.6 GEM-related basic indicator values for Nepal, 2000 472.7 HPI-related basic indicator values for Nepal, 2004 502.8 Example showing substitutability between longevity and GDP/capita 512.9 National level measurements of human development by report 522.10 Percentage of stunted and underweight children under 5 by region 532.11 Regional variation in human development 2001 552.12 Regional ranking patterns by year and human development measure 563.1 HDI trend in SAARC countries 723.2 Trends in poverty incidence by ethnicity/caste, 1996 and 2004 743.3 Major occupations by ethnicity/caste, 2001 753.4 Household characteristics by ethnicity/caste, 2001 763.5 Literacy rate by social groups, 2001 773.6 Candidates passing gazetted level (grade III) 784.1 Ratio of girls to boys in primary, secondary and tertiary education 954.2 Gender inequality in education in selected countries and regions 964.3 Women’s economic participation in selected countries and regions 984.4 Survival progress and setbacks in selected countries and regions 1004.5 More girls die than boys at a young age
(annual deaths per 1000 children aged 1-4 years, 1984-90) 1014.6 Under-5 mortality rates 1014.7 Socio-demographic background of
gender based violence (GBV) clients in four countries 105
xiii
4.8 Forms, causes and consequences of violence (% in parenthesis) 1074.9 Trends in HDI, GDI and GEM in selected countries 1094.10 Difference in survival rate by caste/ethnicity 1134.11 Gender distribution of economically active population
by occupation in Nepal, 1981-2001 (%) 1134.12 Percentage distribution of total population in rural and urban areas of Nepal 1144.13 Agriculture and non-agriculture occupation by sex in Nepal 1154.14 Urban/rural dependency ratio and sex ratio of population in Nepal 1155.1 Schools and enrollment, 1951-2003 1235.2 Literacy situation by census years 1952 – 2001 1265.3 Adult literacy rate (%) 1275.4 Spatial distribution of literacy in selected districts in 2001 1275.5 Literacy rate by source of literacy in 2000 1285.6 Estimated literacy status of major population groups, 2001 1295.7 Efficiency rate in primary schools, 2003 1315.8 Public and private section school enrollment, 2003 1315.9 Ratio of girls to boys in education 1415.10 Targets by core EFA indicators 1435.11 Government expenditure on education 1475.12 Sectoral distribution of the educational budget 1486.1 GNP per capita and selected social indicators 1546.2 Mortality trend since 1750 1566.3 Skilled care at delivery and maternal deaths, regional comparison, 1995 1716.4 Trend of sex ratio in China, Taiwan, Korea, and India 1716.5 Numbers of girls missing per 1,000 live births 1726.6 Proportion of girls and boys severely stunted,
by sex composition of surviving sibling(s) 1736.7 Malnutrition among women/mothers in selected countries 1736.8 Nutritional deprivation and longevity 1796.9 Infant/child and maternal mortality 1996-2001 1846.10 Infant and child mortality by sex and ethnicity 1846.11 Reproductive health status of women in Nepal 1856.12 Nutritional deprivation of girls by income levels 1858.1 Changes in the share and number of people living on $1 a day 2198.2 Real GDP per capita for the world/developing countries 1970s-1990s 2218.3 Trends in the incidence of poverty in Nepal 2308.4 Distribution of HPI by region 1996 and 2001 2318.5 Economically active population of 10 years of age and over by major industry 2328.6 Poverty incidence by farm size 2338.7 Sectoral classification of government expenditure (growth in %) 2408.8 Economic growth performance, 1971-2005 2418.9 Indicative targets of the tenth plan 2458.10 Resource gap for selected MDG sector (Rs. in billion) 24710.1 Dimensions of human empowerment in Nepal by region 275
xiv

FIGURES3.1 Educational attainment, SLC/certificate percent of total 773.2 Educational attainment, graduate 794.1 Sex vs gender 834.2 The conceptual construction of gender differences
based on physical differences 844.3 Dualistic ways of perceiving and describing society 854.4 Policy approaches to women’s development: theoretical and conceptual
distinction and practical implication for policy/programmes change 874.5 Male/female work burden 974.6 Contributing family workers 974.7 Women’s wages as a percentage of men’s wages in manufacturing, 1992-1997 994.8 Progress in gender equality 1114.9 Life expectancy at birth 1114.10 Trends in literacy rates in Nepal 1124.11 Proportion of population in non-agriculture by sex, 1971-2001 1126.1 Regional trends in life expectancy at birth (in years) 1556.2 Life expectancy at birth, 1995-2000 1686.3 Life expectancy at birth in more developed and less developed countries 1686.4 Health inequalities in less developed countries 1686.5 Inequalities in the use of health services 1686.6 Under-5 mortality and income status in selected countries 1696.7 Percent of Wisconsin residence reporting fair or poor health by race/ethnicity 1706.8 Trends of infant mortality by mother’s race/ethnicity 1706.9 Maternal deaths by WHO regions 1716.10 Incidence of gender based violence 1766.11 Determinants of health outcomes 1806.12 Proximate determinants 1816.13 Trend in life expectancy at birth 1836.14 Trend in infant mortality in Nepal 18310.1 Empowerment and human development – a conceptual framework 27210.2 Relationship between HEI and HDI across districts 273
xv

I N T R O D U C T I O N T O H U M A N D E V E L O P M E N T 1
INTRODUCTION
Human development means positive growthand change in human well-being – collec-tive and individual – in all its multiple di-mensions: economic, social, political, cul-tural, and environmental. It is a complex phe-nomenon in terms of its many determinantsand the numerous interactions among them.Human development focuses on people andtheir well-being. It concerns expanding theirchoices to live full, creative lives in freedomand dignity. It therefore stresses expandingthe capabilities of individuals and commu-nities to enlarge their range of choice as theyseek to fulfill their aspirations.
The human development perspective consti-tutes a radical departure in developmentthinking because it supersedes the earlierpreoccupation of planners with economicgrowth or growth in per capita income.While these kinds of growth, which entailincreasing trade and investment and tech-nological advance, remain essential, they areviewed as the means, not the ends of humandevelopment. Consequently, if an increasein gross national product (GNP) does nottranslate into jobs, better livelihoods, betterhealth care, better education, a better envi-ronment, equality of opportunities, peace and
security, it cannot be considered develop-ment. In short, the human development ap-proach evolved from an appreciation of whatearlier concepts of development neglected –human well-being.
PERCEPTIONS OF THE“DEVELOPMENT PROCESS”:AN HISTORICAL OVERVIEW
Although economic development is nowgenerally understood as material enrich-ment, and the creation and accumulation ofwealth, early thinkers about the human con-dition saw it as meaningless except withregard to human beings and the human“ends” that it might serve. Aristotle (384-322 BCE) saw the accumulation of wealthand its uses in his ideal city as a means topromoting “human good”. “Wealth,” hestated “is not the only good we are seeking,for it is merely useful and for the sake ofsomething else” (quoted in Haq 1995). Inhis treatise on economics, Kautilya, thefourth century Indian scholar and states-man, describes economics as the study oflivelihoods intrinsically related to the ac-quisition and productive management ofland and resources to serve human ends(Sharma 1967).
CHAPTER 1
Introduction to human developmentPitamber Sharma

2 R E A D I N G S I N H U M A N D E V E L O P M E N T
More than a millennium later, William Petty(1623-87), often called the founder of politi-cal economy and one of the first scholars toestimate national income, regarded peopleas part of the wealth of a country andemphasised “each man’s particular Happi-ness” as the objective of increased wealth.Immanuel Kant (1724-1804) considered hu-man beings as the true end of all activities,“never as a means alone.” Adam Smith(1723-90) the progenitor of free enterpriseand laissez-faire ideas – generally regardedas the father of modern economics – arguedin favour of unrestricted competition becauseit ultimately resulted in increasing the satis-faction of the wants of all members of thecommunity. Market growth, he thought,should enable the poor to integrate into thelarger world without shame. He consideredfree enterprise the best possible means of fur-thering the welfare of the entire country. Healso considered education and skill forma-tion, as well as workers’ unions to negotiatefor the betterment of working conditions, es-sential to furthering national welfare.
In the view of David Hume (1711-76), thefounder of modern empiricism, the virtues ofcommerce derived from the fact that the“greatness of a state, and the happiness ofits subjects” depended upon ensuring “pri-vate men [of] greater security, in the posses-sions of their trade and riches, from the powerof the public, so the public becomes power-ful in proportion to the opulence and exten-sive commerce of private men” (quoted inRouth 1977). To John Stuart Mill (1806-73),the broadest and most daring of the politicaleconomists of his age, the widespread distri-bution of wealth was critical because “thegreatest happiness of the greatest numberwas the measure of right and wrong.” Thisnumber included women, whom most think-
ers of the time considered mere adjuncts oftheir husbands or fathers – even sons.
Finally, Karl Marx (1818-83), who attackedthe capitalist system of production, nonethe-less admired the “formal freedom” that itprovided because this very freedom fur-nished the basis for a radical reshaping ofthe foundations of 19th century politicaleconomy so as to free the working class fromexploitation and thereby permit the flower-ing of their creative potential. Enhancinghuman capabilities and skills, along withtechnological progress, took centre-stage inMarx’s thought. To him, development meant“replacing the domination of circumstancesand chance over individuals by the domina-tion of individuals over chance and circum-stances” (quoted in Sen 1999).
With the advent of the 20th century, new tech-niques in national income accounting gavescholars and planners new tools for examin-ing the economies of countries and regions.With the rise of Keynesian economics, aggre-gate income-consumption relationships tookcentre-stage in macro-economic analysis.National income and employment began be-ing assessed in terms of real investments andconsumer expenditures. Economists startedto study closely the marginal efficiency of capi-tal and interest rates, as well as disposableincome and people’s ability to consume. Al-though planners dealt with the human dimen-sion of development by framing policies todeal with the massive depression of the 1930s,conventional wisdom held that as long asaggregate relationships were favourablymanaged, development took care of itself.
Only in the years following the Second WorldWar did development become a key conceptin the non-industrialised world. A host of
I N T R O D U C T I O N T O H U M A N D E V E L O P M E N T 3
new nation-states began freeing themselvesfrom the yoke of colonialism in Asia and Af-rica. At the same time, the world witnessed ahuge ideological divide, unparalleled in theglobal North since the wars of religion in the16th and 17th centuries. The political implica-tions of this divide began evolving as coun-tries of the so-called “third world” started tolook to the so-called “first world” of devel-oped capitalist economies and the “sec-ond”, the socialist economies of the Sovietbloc, as models for realising their political,social and economic aspirations in anemerging world order.
Western ideas about development began per-colating in a number of poor countries, pre-dominantly around their low aggregates ofnational income accounting. Incomes werelow, as were ratios of savings and invest-ments. Poverty was an accepted fact of life.Levels of health care and literacy translatedinto mass misery. National output was domi-nated by the production of primary goods.The modern industrial sector and manufac-turing comprised only an insignificant seg-ment of the total economy. Imports from theindustrialised world were the sole source ofmodern manufactured goods. The depen-dency of third world nations on their formermasters was overwhelming. Countries likeNepal that had avoided political colonisationwere no better off in terms of modern trans-port and communication infrastructure thantheir newly independent counterparts and,like them, also had no government structuresto deliver services to remote rural backwa-ters where the bulk of the population lived.All emerging economies were eager for short-cuts to development, whatever these mightentail – and for most at this time in history,the fulfillment of their development mirroredthe image of the industrialised West.
THE WHY AND HOW OFECONOMIC GROWTH
The late 1950s became a period in which de-velopment economics emerged as a disci-pline in its own right. Unanimity prevailedin identifying the central problem of pooragrarian countries as increasing the level ofaggregate output or the gross domestic prod-uct (GDP), which would automatically en-hance incomes and levels of human well-being. Economic growth was seen as a pana-cea for dealing with all problems that inhib-ited development. And development itselfwas seen as a process of cumulative changethat grew out of rising productivity.
While the Nobel laureate W. Arthur Lewis(1955) saw “development as widening therange of human choices”, he believed thateconomic growth served this objective ad-mirably. The benefits of economic growthwould spread widely and speedily throughmarket forces, namely, an increasing de-mand for labour, increasing productivity,increasing wages, and lower prices forgoods and service. The benefits of suchgrowth would flow downwards to the poorthrough government intervention in provid-ing social services now made possible bytheir ability to generate revenues throughprogressive taxation. The build-up of infra-structure and productive capacity wouldalso benefit the poor. During the early stagesof economic growth, wealth would be con-centrated in only a few hands and havelittle impact on poverty reduction. How-ever, these processes would naturally cor-rect themselves with time. Similarly, as in-comes increased, inequality would grow,but only up to a point at which trends to-wards equalisation would begin takingover rapidly.

4 R E A D I N G S I N H U M A N D E V E L O P M E N T
However, these assumptions failed tomaterialise – except where growth was ac-companied by land reform and widespreadefforts to improve education and public health.Moreover, government interventions thatfavoured the poor tended not to take placewhen those in power benefited from growth.More important, prolonged mass poverty wasnot a necessary condition for acceleratingcapital formation (Streeten 2003).
The Lewis model of economic growth de-pended on taking advantage of the “unlim-ited supply of labour” in the dualistic econo-mies of the former colonised countries. Asthe capitalist sector expanded, it would drawlabour from the reservoir of the traditionalnon-capitalist sector. With the expansion ofthe capitalist sector, more labourers wouldenter waged employment, resulting in aneven larger capital surplus. This processwould continue progressively absorbing sur-plus labour from the subsistence sector.Lewis assumed that an entrepreneurial classalready existed in the third world countriesand that the technology they received fromthe industrialised world would automati-cally absorb labour. These expectations failedto materialise for four major reasons:! the condition for widespread progress in
industrialisation lay in the increased pro-ductivity of agriculture, which the devel-oping countries had not experienced;
! the growth rates of the population and there-fore the labour force were typically quite highin subsistence agriculture economies;
! technology transfers did not create addi-tional jobs; and
! skill levels varied greatly between urbanand rural areas.
The debate on how to expedite economicgrowth in poor countries continued. Some
economists, such as W.W. Rostow (1960),saw the choices they confronted as a reflec-tion of the stages of growth experienced muchearlier by rich countries – and therefore de-manded policies and approaches similar tothose pursued by such states as England andFrance during their commercial and indus-trial revolutions. Rostow, however, under-estimated the differences in the basic condi-tions that had enabled the West to evolve asit did, and, equally important, the intensity,complexity and interactions of the problemsthat beset low-income countries.
Nonetheless, paths to industrialisation re-mained at the forefront of the developmentdebate. Rosenstein-Rodan had earlier arguedfor a “big push” – a sizeable minimum in-vestment in industrialisation – to overcomeeconomic obstacles to development. RagnarNurkse (1970) advocated “balanced growth”to accelerate economic growth – promotinga balanced pattern of investment in differinglines of production so that people workingmore productively, with more capital andimproved techniques, could serve as custom-ers for one another. This would enlarge themarket and fill the vacuum in the domesticeconomy of low-income areas. The balancedgrowth thesis also called for mutually rein-forcing investment decisions to strengthenthe growth impulses between the agriculturaland manufacturing sectors.
Critics argued that poor countries did nothave the capacity to attain balanced invest-ment over a wide range of industries. By con-trast, A.O. Hirschman (1958) advocated apolicy of “unbalanced growth” arguing thata high rate of growth – and therefore devel-opment – could be achieved by creating stra-tegic imbalances that would foster the stimuliand pressures needed to induce investment
I N T R O D U C T I O N T O H U M A N D E V E L O P M E N T 5
decisions, given the dearth of venture capi-tal in poor countries. This, however, left openthe critical question of sequencing invest-ments to create the appropriate imbalancesthrough appropriate activities. Hirschmanargued that “it is the role of foreign capital toenable and to embolden a country to set outon the path of unbalanced growth”.
In searching for the shortest route toindustrialisation, import substitution or theproduction of consumer goods to substitutefor imports began emerging as a dominantfeature in much of Asia and Latin America.Different economists argued in favour of pro-tecting domestic industries, improving acountry’s balance of payments position, andexpanding employment outside agriculture.Foreign capital began to play a significantrole in industrialisation, particularly in LatinAmerica. Some countries, such as Brazil inthe 1960s and 1970s, achieved impressivegrowth rates.
But the idea that industrialisation and in-creased external links with industrialisedcountries would automatically correct lowincomes, sluggish growth, and the myriadhuman manifestations of underdevelopmentfound critics quite early. The Marxist theoryof imperialism derived from a recognition thatinternational monopolies penetrate nationaleconomies in their search for raw materialsand market outlets to generate increasing eco-nomic surpluses. The new critics, who cameto be known as the dependency school – in-cluding Frank (1967), Sunkel (1973) and Amin(1974) – refused to look at underdevelopmentonly as a stage in the evolution of a societyisolated from the rest of the world. They pos-tulated underdevelopment as an intrinsic el-ement of the historical evolution of the inter-national system. To them, underdevelopment
and development were two interlinked simul-taneous processes that manifested themselvesin a geographical polarisation – the rich,industrialised countries of the North formingthe “centre” or the dominant group, and thenon-industrialised poor countries of theSouth forming its “peripheral” dependentcounterpart. A parallel process also took placewithin countries – the industrialised,modernised regions and population groupsvis-à-vis the backward, marginal, dependentregions and population groups. In both con-texts, however, industrialisation reliedheavily on external support for technology,finance, administrative capacity and know-how – which only increased dependency andintensified the global division of labour.
The analysis of the “spread” and “back-wash” effect of the interaction of industrialeconomies with primary producers made byMyrdal, Singer and Prebisch, among others,also showed that the former benefited dis-proportionately. The primary producerswere characterised by an increase of export-based “enclaves” unrelated and unrespon-sive to the local economy; worsening termsof trade accompanied by unstable prices; andthe outflow of profits to the industrialisedcountries. Myrdal (1970, 1971) also arguedthat left to themselves, market forces pro-moted inequalities between regions evenwithin the same country, as factors of pro-duction moved from slow growth regions tothose of high growth, thereby spurring a vi-cious circle of poverty.
Disenchantment with”economic growth”By the late 1960s, there was disenchantmentwith the paramount emphasis on economicgrowth. Many economists realised that
6 R E A D I N G S I N H U M A N D E V E L O P M E N T
growth in total and per capita GDP formedonly a small part of the total developmentpicture. Equally, if not more important, wasthe composition of aggregate output and itsdistribution among the different incomegroups. Likewise, industrialisation per secould not be easily equated with economicdevelopment because it did not touch thelives of the mass of the poor involved in agri-culture. In many countries, reasonablegrowth rates were accompanied by risingunemployment, and high levels of underem-ployment. Far from lifting the poor from thequagmire of misery, economic growth leftpoverty not only endemic, but rising – andin absolute terms. In many instances, coun-tries that produced primary goods re-mained heavily dependent on the majorindustrialised countries, locking the formerinto a relationship over which they hadlittle control. Moreover, growth- orientedpolicies in and of themselves ignored thepublic goods on which most of the poordepended for basic services such as edu-cation and health – essential conditions forimproving the economy itself, as well asthe quality of life.
Noting these problems, the internationallabour organisation (ILO) initiated the worldemployment programme in 1969 as a meansof exploring ways to create productive andremunerative jobs in the developing coun-tries. If substantial poverty reduction wasto be made in these countries, it was neces-sary to focus on livelihoods that providedthe poor with both economic and social se-curity rather than on formal employment.The very perception of employment requireda different view because the poor had todepend on low-productivity occupations inthe informal sector. The problem thereforewas enhancing productive and remunera-
tive labour utilization with many dimen-sions – including gender. It was also arguedthat focusing on formal employment alonewould create more problems by inducingmassive migration from rural to urban ar-eas in search of jobs.
Fuller labour utilisation entailed far morethan creating a demand for labour. A num-ber of conditions are intrinsically related(Streeten 2003), particularly nutrition,health and education. Investment in thesefields had to be understood as productiveinvestments. Attitudes towards jobs, par-ticularly among the literate, were often sig-nificant impediments to fuller labourutilisation. The social perception of manualwork and certain other job categories hadto change. Institutional arrangements, suchas systems of tenancy and land ownership,the creation of credit and marketing facili-ties and information centres, as well aslabour organisation, needed to be in place.At the same time, governments had to adoptpolicies to facilitate a better pricing of labourand its products.
This reassessment of the economic growthexperience in developing countries shiftedthe focus of the development debate to ques-tions of income distribution – nowhere moreevident than in the 1974 World Bank studyRedistribution with Growth (Chenery, et al1974), which investigated the ways throughwhich strategies of growth could be com-bined with the strategies of income redistri-bution so as to achieve simultaneously thetwin objectives of growth and increased pro-ductivity of the small-scale, labour-inten-sive informal sector that involved the vastmajority of the “working poor”. The Bank,though, focused more on the redistributionof growth than on the redistribution of as-

I N T R O D U C T I O N T O H U M A N D E V E L O P M E N T 7
sets or the policies, technologies and pau-city of basic services that perpetuated pov-erty. At most, the study fine-tuned the pri-mary economic growth agenda; it advocateda marginal redistribution of income in thesense of using part of the additional outputcreated by growth to benefit the poor by in-vesting in those assets that concerned them.It also recognised, albeit grudgingly, that ex-panding production did not suffice to re-duce poverty and, by implication, achievedevelopment.
However, Mahbub ul Haq had approachedthe issue eloquently in the early 1970s, say-ing that “the problem of development mustbe defined as a selective attack on the worstforms of poverty. Development goals mustbe defined in terms of the progressive re-duction and eventual elimination of mal-nutrition, disease, illiteracy, squalor, unem-ployment and inequalities. We were taughtto take care of our GNP as this will take careof poverty. Let us reverse this and take careof poverty as this will take care of the GNP.In other words, let us worry about the con-tent of GNP even more than its rate of in-crease” (Haq 1971). This clarion call was toreorient the development debate completelyand lead to the evolution of the human de-velopment approach.
ANTECEDENTS OF THE HUMANDEVELOPMENT APPROACH
What approach would directly confront theissue of poverty? One answer was the basicneeds concept. At the same time, interest inhuman resource development and humancapital formation revived. Both ideas contrib-uted to the evolution of the human develop-ment approach.
The basic needs approachBy the early 1970s, it had become clear that! the traditional “prescription” of income
increases or employment creation couldnot deal with the increasing levels of theworst forms of poverty in many develop-ing countries and that
! a direct public policy and programmeaction was needed.
This led the ILO to propose the basic needsapproach, which was “… the minimum stan-dards of living which a society should setfor the poorest groups of its people. The sat-isfaction of basic needs means meeting theminimum requirements of a family for per-sonal consumption: food, shelter, clothing;it implies access to essential services, suchas safe drinking water, sanitation, transport,health and education; it implies that eachperson available for and willing to workshould have an adequately remunerative job.It should further imply the satisfaction ofneeds of a more qualitative nature: a healthy,humane and satisfying environment, andpopular participation in the making of deci-sions that affect the lives and livelihoods ofpeople and individual freedoms” (ILO 1976).
The basic needs approach advocated! programmes to increase income;! wider availability of public services
through public action; and! increased participation of communities
in planning, designing and implement-ing programmes that would benefitthem.
Four advantages of basic needs were imme-diately apparent (Streeten 2003):
First, it established the objective of develop-ment as providing all human beings with
8 R E A D I N G S I N H U M A N D E V E L O P M E N T
opportunities for a “full life”, i.e., opportuni-ties for meeting their basic needs.
Second, it reduced aggregate and abstractnotions such as money, income and employ-ment to disaggregated, concrete and mean-ingful objectives that people as individualscould seek and experience. Basic needs de-manded a concrete identification of targetpopulation groups at various levels and withvarious characteristics. It stood the idea ofGDP growth on its head, since growth be-came secondary to the right composition, dis-tribution and use of production.
Third, basic needs was appealing formobilising domestic and international re-sources because it provided concrete objec-tives against which the general efficacy ofresource mobilization could be judged – in-ternational aid in particular.
Fourth, the basic needs approach was intel-lectually and politically appealing; it pro-vided a frame of reference for all policies,programmes and actions.
Two aspects of basic needs immediatelybecame evident. Satisfying basic needs com-prised (a) goods and services provided bythe public sector, notably basic educationand health care, and (b) goods and servicespurchased by private income, includingfood and clothing. In most cases, basic needsemphasised the former. Opening up oppor-tunities to people – access to jobs, incomeand other assets – became background con-cerns. In many countries, however, basicneeds became confused with basic commod-ity bundles (calorie needs per capita, yardsof cloth per capita, etc.). The concept ofchoice was absent; a “full life” did not seemto require it. This preoccupation with com-
modities – what Marx had called “commod-ity fetishism” – made meeting basic needsan end in itself. Some critics also argued thatthe role of the state in this approach wastoo powerful; states were regarded as inef-ficient in determining these needs and inensuring their satisfaction. Developingcountries also objected that donors wereusing the concept to reduce developmentaid, put up protectionist barriers and divertattention from reforming the system of in-ternational relations. Although the initialbasic needs concept was broad-based, thenarrow focus on commodity bundles de-tracted from its innovations. In Nepal, forinstance, it became only the old approachin new clothing (box 1.1).
The major criticism of the basic needs ap-proach, particularly in its implementation,was its! narrow focus on the bundle of commodi-
ties;! implicit concern with the supply side,
very little with the demand side;! automatic presupposed link between the
consumption of goods and services andhuman well-being;
! lack of emphasis on the sustainability ofsatisfactions in goods and services.
In other words, in seeking to satisfy the basicneeds of human beings, planners lost sightof what the satisfaction of these needs al-lowed people to do.
The innovative features of basic needs weresubmerged by new concerns in the develop-ment dialogue that appeared during the1980s, the period in which the Bretton Woodsinstitutions – the World Bank and the inter-national monetary fund (IMF) – proposedstructural adjustment as a conditionality for
I N T R O D U C T I O N T O H U M A N D E V E L O P M E N T 9
the disbursement of loans (box 1.2 and 1.3).Policies of structural adjustment called formacro-economic stability, the stabilisation offinancial markets, trade liberalisation andprivatisation. “Fiscal discipline” became thewatchword. The debt problem of many de-veloping countries garnered attention. At thesame time, new areas of concern – the role ofwomen, the status of children, human rights,including reproductive health, the wave ofpolitical freedom following the fragmentingof the Soviet bloc, and employment issues,along with governance and corruption – be-gan to attract international interest. Themasses of the poor and their basic needs wereeither forgotten or subsumed into theseemerging issues.
Human resource developmentand the idea of human capitalPrescriptions for economic growth made inthe immediate post-Second World War eraassumed slower rates of population growthin agrarian countries than their continuedhigh fertility rates manifested, along withthe presence of an educated and mobile
labour force and a plentiful supply of entre-preneurs. During the 1950s and 1960s,economists like Theodor Schultz had pos-ited the idea of human capital as a residualfactor in explaining labour productivityand, therefore, economic growth. The asser-tion that acquired knowledge and skill wasa durable means of production highlightednot only the economic value of education,but also the fact that a pool of educated,skilled, trained manpower constituted capi-tal embodied in human beings. The fact thatthis capital involved the human being (withher or his culture heritage, legal rights andother norms and values) distinguished itfrom capital embodied in material plantsand equipment, but it functioned nonethe-less to yield a stream of income and to raiseproductivity. “Human resource develop-ment” and “human capital formation” be-came terms used to improve the quality ofpeople as productive agents. Economistsbegan exploring the manifold relationshipsamong aspects of population growth andproduction and productivity, includinghealth, nutrition, fertility, education, pub-lic services, and poverty. If human resources
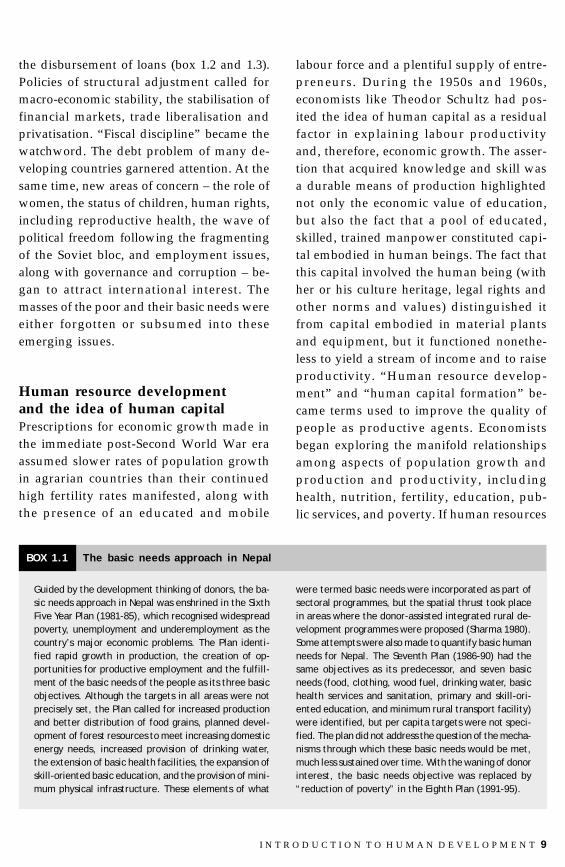
Guided by the development thinking of donors, the ba-sic needs approach in Nepal was enshrined in the SixthFive Year Plan (1981-85), which recognised widespreadpoverty, unemployment and underemployment as thecountry’s major economic problems. The Plan identi-fied rapid growth in production, the creation of op-portunities for productive employment and the fulfill-ment of the basic needs of the people as its three basicobjectives. Although the targets in all areas were notprecisely set, the Plan called for increased productionand better distribution of food grains, planned devel-opment of forest resources to meet increasing domesticenergy needs, increased provision of drinking water,the extension of basic health facilities, the expansion ofskill-oriented basic education, and the provision of mini-mum physical infrastructure. These elements of what
were termed basic needs were incorporated as part ofsectoral programmes, but the spatial thrust took placein areas where the donor-assisted integrated rural de-velopment programmes were proposed (Sharma 1980).Some attempts were also made to quantify basic humanneeds for Nepal. The Seventh Plan (1986-90) had thesame objectives as its predecessor, and seven basicneeds (food, clothing, wood fuel, drinking water, basichealth services and sanitation, primary and skill-ori-ented education, and minimum rural transport facility)were identified, but per capita targets were not speci-fied. The plan did not address the question of the mecha-nisms through which these basic needs would be met,much less sustained over time. With the waning of donorinterest, the basic needs objective was replaced by“reduction of poverty” in the Eighth Plan (1991-95).
BOX 1.1 The basic needs approach in Nepal

10 R E A D I N G S I N H U M A N D E V E L O P M E N T
were necessary for accelerating and sustain-ing economic growth, they merited invest-ment. Consequently, cost-benefit analysesbegan estimating the “returns” expectedfrom investments in these areas.
To the credit of the human capital school,the focus of development shifted to humanbeings – though only as factors of produc-tion. This led to assessing the human resourceproblems in poor countries in a new light.Rapidly growing populations, the preva-lence of high unemployment, and underem-ployment, the shortage of skills critical toindustrialisation, inadequate organisationsand institutions for mobilising human re-sources, and incentive structures that wouldcontribute to motivate the labour force to en-gage in activities considered vital for nationaldevelopment all became areas of policy andprogramme attention.
Moreover, during the 1980s, the emphasis onhuman resource development received furtherimpetus as social scientists began seeking ex-planations for economic growth in the endog-enous behaviour of people, rather than in suchexogenous factors as technological inputs that
enhanced factor productivity. The role of edu-cation, skill formation and research and de-velopment in increasing total productivityalso began to be appreciated in a broader con-text. Better education and skills, plannersstarted thinking, increased the efficiency andinnovative potential not only of the individualeducated, but also of others. Similarly, R andD improved not only the productivity of firmsthat invested in it, but also that of other firmsthat used those new products. Economistsalso began realising that investments in hu-man capital could overcome the problem ofthe diminishing returns of investments inphysical capital.
However, the limitation of this approach wasprecisely its focus on those human qualitiesthat could be used as capital in production.As Amartya Sen (1999) was to point out, itdid not address the fundamental question:Why seek economic growth in the first place?In short, the human capital approach did notconsider the human being as the end of thedevelopment exercise. That the benefits ofeducation far exceed its role as capital in theproduction of goods and services; or that im-proved health far exceeds the production ad-
" Exchange rate adjustment (may include devalua-tion and move toward convertibility).
" Demand-management measures (including reduc-tion of the growth of money supply, reduction inrecurrent expenditures, improvement in revenuecollection, increase in investment efficiency, andpublic sector enterprise efficiency).
" Promotion of market mechanisms through reduc-tion in price controls, removal of subsidies andliberalisation of interest rate determination.
" Liberalisation of trade and foreign investment
(delicensing, removal of quotas, reduction of tar-iffs, simplification and homogenisation of tariffstructures; incentives for foreign private invest-ment through tax incentives, liberal equity par-ticipation, repatriation and exit policy).
" Public sector reforms (privatisation of the publicsector enterprises as well as services; incentivesfor private sector to enhance productivity andefficiency).
" Financial sector reforms (reforms in the bankingsector, strengthening money and capital markets,along with markets for securities).
BOX 1.2 Elements of a typical structural adjustment programme

I N T R O D U C T I O N T O H U M A N D E V E L O P M E N T 11
vantages of a healthy labour force; or thatsmaller families far exceed the advantagesof higher disposable income – none of theseissues figure in the human capital formationperspective.
The “ends” and ”means”of developmentThe fulfillment of basic needs was presumedto lead to a decent life – but why was a decentlife important to an individual and what gaveit universal value? Human capital formationresulted in enhanced productivity – but howdid enhanced productivity relate to the per-son and his well-being? The importance ofthese questions is twofold: first, they illumi-nate the need for positing the purpose of de-velopment; and, second, they highlight thenecessity of reconciling means with ends.
The human development approach startswith the explicit recognition that developmentfocuses on the well-being of people. Once thisperspective is established in defining the
“end” of development, all efforts and pro-cesses that contribute to its enhancement be-come the “means”. We return to the ideas ofboth Aristotle and Kautilya. To the extent thatit serves human well-being, economic growthis a means to enhancing human development.If it does not, it has no value from the humandevelopment point of view. Education, forexample, is of intrinsic value in human de-velopment because it enlarges the knowledgehorizon, enhances the capabilities of individu-als and communities, improves the quality ofdebate in public life, contributes to creating aricher civil society and broadens the range ofchoices and freedoms. It is therefore an end aswell as a means.
This redefinition of the prime objective ofdevelopment as human well-being has twoinextricable components: first, that devel-opment must address the plurality of pro-cesses that contribute to human well-being;and, second, that development must beevaluated in terms of its effects on the qual-ity of people’s lives.
" Uses short-term approaches to long-term prob-lems (related to low human development, poor so-cial institutions, weak administrative and man-agement capability).
" Ignores external shocks such as deteriorating termsof trade, debt burden, reluctance of industrialisedcountries to open their markets, vulnerabilities ofdomestic industries after abandonment of importsubstitution strategies.
" Often leads to reverse resource flows from devel-oping to industrial nations.
" Ignores the social dimensions of adjustment (thepoor suffer because of low investment in public
services and infrastructure, while the elitestrengthen control over economic resources).
" Ignores the key role of the state in poor countriesin developing infrastructure, building human capi-tal, creating competitive conditions, providingbasic social services, strengthening institutions andmanagement capabilities; in promoting research;in taking the lead in pioneering investments in ar-eas where the private sector is unwilling or unableto become involved; and, most of all, in protectingthe mass of the poor, vulnerable and disadvan-taged sections of society.
" Recipient governments manifest lack of owner-ship, and political consensus.
Source: Gurugharana 1996.
BOX 1.3 General critique of structural adjustment programme

12 R E A D I N G S I N H U M A N D E V E L O P M E N T
In addition, putting human beings rather thanincomes at the centre of development consti-tutes recognition of people as the real wealthof a nation. Development must therefore cre-ate an enabling environment that allowspeople to lead long, healthy, creative lives.
THE CONCEPT OFHUMAN DEVELOPMENT
By the 1980s, the initial enthusiasm gener-ated by the basic needs approach haddwindled considerably in the face of the debtcrisis and the structural adjustment policies(SAPs) imposed by multilateral agencies.These policies hurt the poor by curtailinginvestments in public services and infrastruc-ture. What counted in the market were as-sets that the poor did not possess. SAPs,coupled with trade liberalisation, served theinterests of capital rather than labour – anda not-altogether-benign neglect of workersonly contributed to entrenching poverty moredeeply in many poor countries.
Development ascapability expansionThe Nobel laureate Amartya Sen considereddevelopment as capability expansion. Thisperception provides the conceptual basis forthe human development approach. Follow-ing the classical political economists, Senargues that increase in real incomes or eco-nomic prosperity cannot be a goal of devel-opment in itself because the importance ofincome and economic prosperity is contin-gent on what it ultimately contributes to hu-man lives. Enriching the lives of people orhuman well-being is the objective of devel-opment, and income measures can at bestbe only one of the means to well-being. The
question posed by Sen is this: If enrichingthe lives of people or human well-being isthe end of development, how does oneevaluate that well-being, how does one goabout achieving that well-being, and howdoes one establish what the really valuableends are?
Human well-being, according to Sen (1989),can be evaluated or assessed only in terms ofthe capability to function. Human life is a setof functionings or “doings” and “beings”that a person values. Evaluating a person’swell-being therefore has to take the form ofassessing the combination of thesefunctionings.
The valuable functionings – those that con-tribute to a person’s being or doing whatshe or he values – are the means as well asends of human life. These functionings canbe elementary – such as escaping disease ormorbidity, being adequately nourished, un-dertaking movements, acquiring knowledgeor expressing oneself. They can also be com-plex – such as achieving self-respect, attain-ing a standing in society, participating incommunity life, or appearing in public with-out shame. They can be general – such asthe capability to be nourished or the capa-bility to acquire knowledge – or specific –such as the capability to drink milk ratherthan tea or the capability to read a particu-lar newspaper. A functioning is an achieve-ment whereas capability is the ability toachieve. These are complementary but dis-tinct concepts. While functionings are ob-jectively observable, capabilities are unob-servable facts. As such, most empirical ap-plications are often limited to measuringoutcome through achieved functioningrather than measuring opportunitiesthrough capabilities.
I N T R O D U C T I O N T O H U M A N D E V E L O P M E N T 13
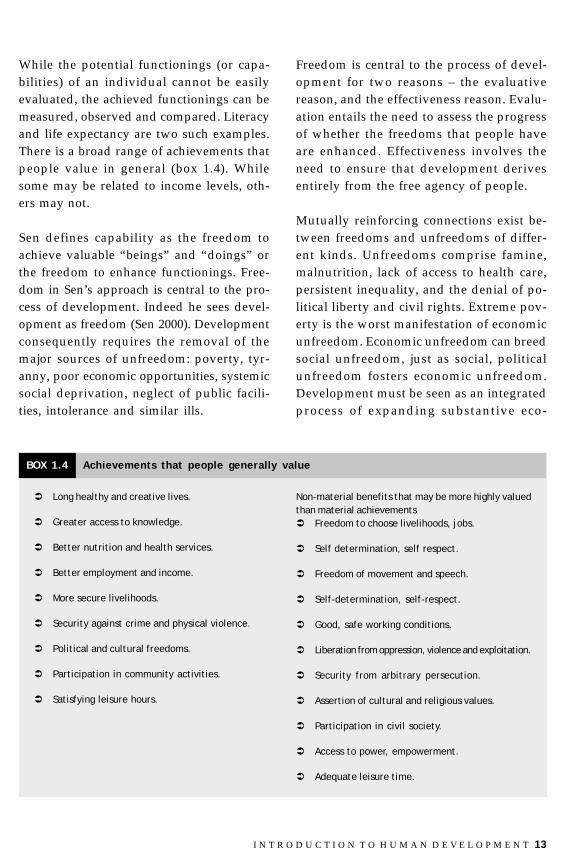
While the potential functionings (or capa-bilities) of an individual cannot be easilyevaluated, the achieved functionings can bemeasured, observed and compared. Literacyand life expectancy are two such examples.There is a broad range of achievements thatpeople value in general (box 1.4). Whilesome may be related to income levels, oth-ers may not.
Sen defines capability as the freedom toachieve valuable “beings” and “doings” orthe freedom to enhance functionings. Free-dom in Sen’s approach is central to the pro-cess of development. Indeed he sees devel-opment as freedom (Sen 2000). Developmentconsequently requires the removal of themajor sources of unfreedom: poverty, tyr-anny, poor economic opportunities, systemicsocial deprivation, neglect of public facili-ties, intolerance and similar ills.
Freedom is central to the process of devel-opment for two reasons – the evaluativereason, and the effectiveness reason. Evalu-ation entails the need to assess the progressof whether the freedoms that people haveare enhanced. Effectiveness involves theneed to ensure that development derivesentirely from the free agency of people.
Mutually reinforcing connections exist be-tween freedoms and unfreedoms of differ-ent kinds. Unfreedoms comprise famine,malnutrition, lack of access to health care,persistent inequality, and the denial of po-litical liberty and civil rights. Extreme pov-erty is the worst manifestation of economicunfreedom. Economic unfreedom can breedsocial unfreedom, just as social, politicalunfreedom fosters economic unfreedom.Development must be seen as an integratedprocess of expanding substantive eco-
" Long healthy and creative lives.
" Greater access to knowledge.
" Better nutrition and health services.
" Better employment and income.
" More secure livelihoods.
" Security against crime and physical violence.
" Political and cultural freedoms.
" Participation in community activities.
" Satisfying leisure hours.
Non-material benefits that may be more highly valuedthan material achievements" Freedom to choose livelihoods, jobs.
" Self determination, self respect.
" Freedom of movement and speech.
" Self-determination, self-respect.
" Good, safe working conditions.
" Liberation from oppression, violence and exploitation.
" Security from arbitrary persecution.
" Assertion of cultural and religious values.
" Participation in civil society.
" Access to power, empowerment.
" Adequate leisure time.
BOX 1.4 Achievements that people generally value

14 R E A D I N G S I N H U M A N D E V E L O P M E N T
nomic, social and political freedoms andtheir interactions. This broad approachpermits a simultaneous appreciation of theroles of institutions, markets, governmentsat various levels, political and civic insti-tutions, social values, educational arrange-ments, and the media and communicationsin providing space for dialogue and debatein the development process.
From the instrumental perspective of devel-opment, Sen (2000) identifies five distincttypes of freedoms that link with one another:! political freedoms! economic facilities! social opportunities! transparency guarantees, and! protective security.
These instrumental freedoms contribute toadvancing a person’s general capability.They also reinforce one another. For this rea-son, freedom is not only the primary end, butalso the principal means of development.
Political freedom (such as freedom of expres-sion, uncensored press, rule of law, elec-tions, basic rights) refers to political entitle-ments associated with democracies thatprovide opportunities for dialogue, dissentand critique and having a say on who gov-erns and how. Political liberty and civil free-doms are intrinsically important. Economicfacilities refer to the opportunities to enjoyand utilise economic resources for con-sumption, production or exchange. En-hancing people’s economic entitlementsdepends on various factors (such as owner-ship or access to resources, conditions ofexchange, and relative prices). Distribu-tional considerations at both the nationaland household levels are important. Socialopportunities refer to the provisions made
by a society for education, health care andother services that influence theindividual’s substantive freedom to live bet-ter. These facilities are also important for moreeffective participation in economic and po-litical activities. Literacy can enhance par-ticipation in economic activities and alsopromote political participation. Transpar-ency guarantees refer to the openness andrights of disclosure that people can expect invarious dealings so that the basic presump-tion of trust on which a society operates isnot violated. These guarantees have a clearrole in preventing corruption and promot-ing financial accountability and fair deal-ings. Finally, protective security refers to thesocial safety net that a society provides forvulnerable groups that can succumb to greatdeprivation and abject poverty for variousreasons. This includes institutional arrange-ments such as unemployment benefits, statu-tory income supplements and various meth-ods of generating income for those who aredestitute. These freedoms are shaped by in-stitutions – both formal and informal.
Instrumental freedoms have stronginterlinkages and often complement andstrengthen one another. Thus, political free-dom can promote economic security andguarantee transparency. Economic facilities(such as the opportunities for participationin trade and commerce) can generate per-sonal as well as public resources for socialfacilities. Social opportunities (such as edu-cation and health facilities) can facilitate eco-nomic participation. The promotion of over-all freedoms can facilitate people to lead thekind of lives they have reason to value. Indi-vidual capabilities depend critically on eco-nomic, social and political arrangements. Theexercise of freedom is also mediated by thevalues and mores of a society – whether or
I N T R O D U C T I O N T O H U M A N D E V E L O P M E N T 15
not, for example, it allows women to partici-pate in public affairs.
From this perspective of freedom as the pri-mary end and the principal means of devel-opment, people emerge not as passive re-cipients, but active participants in develop-ment, shaping their own destinies, given theopportunities open to them. And to that ex-tent, the state and society play significantroles in strengthening and safeguardinghuman capabilities.
Like many earlier thinkers, Sen differentiatesbetween two aspects of freedom – positivefreedom and negative freedom. The formerconsists of having the resources needed forexercising choice – such as adequate nour-ishment or the resources that free one frommaterial want. Negative freedom consists ofhaving the space to choose autonomously,in the sense of not being controlled by anexternal agent. Negative freedoms can rangefrom the liberty to drive a car into a city tothat of having as many children as onewishes. One characteristic of negative free-doms is that their aggregate exercise may notbenefit society. Thus, the freedom to driveinto a city may cause traffic jams and add toair pollution. Similarly, the freedom to havean unlimited number of children may in-crease population pressures and therebyheighten demands on scarce environmentaland societal resources.
An individual’s freedom to lead one type oflife or another – the freedom to choose frompossible livings – has implications for themanner in which a society is organised, andthe manner in which the needs of a societyare addressed, but the capability to choosegives freedom both intrinsic and instrumen-tal value. “The ‘good life’,” according to Sen,
“is partly a life of genuine choice, and notone in which the person is forced into a par-ticular life – however rich it might be in otherrespects.” It would be perfectly possible toattain high income and satisfaction of all ma-terial needs in a well-managed prison, butthis would not constitute development be-cause the freedom to choose from possiblelivings is constrained. Sen considers the free-dom to choose as important as well-being.That is why the well-being of a fasting monkdiffers from that of a starving beggar, al-though the physical act (going hungry) is thesame. For the monk, fasting represents hisfree choice to achieve well-being. For the beg-gar, starvation results from the restrictionsof his capabilities and is a manifestation ofhis unfreedom.
The freedom-based perspective on capabil-ity, according to Sen, brings together the in-terest in utility maximization of utilitarian-ism, the libertarian’s emphasis on processesof choice and the freedom to act, and JohnRawls’ focus on individual liberty. Rawls,the moral philosopher who published ATheory of Justice in 1971, included freedomof movement, freedom of association, free-dom of occupational choice, freedom of in-come and wealth and the social bases of self-respect among the basic liberties. In his view,the just economic system needs to guaranteesome “social minimum” to its membersthrough various means.
The capability approach is far more compre-hensive than the utility-based approachupon which the paramount pursuit of eco-nomic growth is based (box 1.5). In addition,the capability-based approach provides aplatform for examining a host of developmentissues from poverty through human rights.Poverty, for example, has been conceptually

16 R E A D I N G S I N H U M A N D E V E L O P M E N T
identified in terms of capability deprivation,whose policy implications differ distinctlyfrom that of income poverty.
Sen has also highlighted the importance ofthe agency of women as a major mediatorand determinant of economic and socialchange. Women’s education and empower-ment, for example, improves health, educa-tion and nutrition in families; reduces infantmortality and fertility; helps raise produc-tivity; and increases the range and efficiencyof public debate. He also asserts that from alegitimacy perspective, human rights emergeas a set of ethical claims that go beyond leg-islated legal rights. To those who argue thatrights have no meaning unless matched bycorresponding duties, Sen reasons that hu-man rights should be seen as rights sharedby all, whose benefits everyone should have,even though no single entity may be chargedwith fulfilling these rights involved. As tothe cultural critique of human rights (thatsome societies, such as the “Asians”, arequintessentially authoritarian), Sen con-trasts the rich intellectual traditions of thesesocieties with the “authoritarian” bias ofthose in power to show that human rights
have universal appeal irrespective of cul-tures. He also delineates the intrinsic (ofvalue by itself), consequential (provision ofpolitical incentives for economic security)and constructive (establishment of valuesand priorities) roles of human rights andbasic freedoms in expanding capabilities(Sen 2000).
The various combinations of the capabilitiesof individuals, groups and communities con-tinue to change, contracting as well as ex-panding. These changes permit evaluationover time in terms of the impact of particularpolicies, programmes and activities.
Economic growth and humandevelopment: the perceptions ofMahbub ul HaqWhile Amartya Sen explored the conceptualbase of human development in terms of itsphilosophical antecedents and the signifi-cance of expanding capabilities and choicesfor individuals and societies in general andfor the poor in particular, Mahbub ul Haqprovided a humane and practical approachto human development in terms of its impli-
Capability-based approach" Value in well-being.
" Well-being defined as a combination of differentfunctionings or what one manages to do or be.
" Capability reflects a person’s freedom to choosebetween different ways of living.
" Pluralistic conception of progress, i.e., “many dif-ferent things are simultaneously valuable”.
" Policy implication (example): Deprivation and vul-nerability are major concerns because they re-strict capability and freedom.
Utility-based approach" Value in satisfaction of individual utility.
" Utility defined in terms of mental condition suchas pleasure, happiness, desire fulfillment.
" Emphasis on real income because it leads to satis-faction of individual utility.
" Monistic conception of progress.
" Policy implication (example): Deprivation andvulnerability as one state of affairs; may evenbe justified because of lack of strong publicdemand.
BOX 1.5 Comparison between the capability-based approach and the utility-based approach
I N T R O D U C T I O N T O H U M A N D E V E L O P M E N T 17
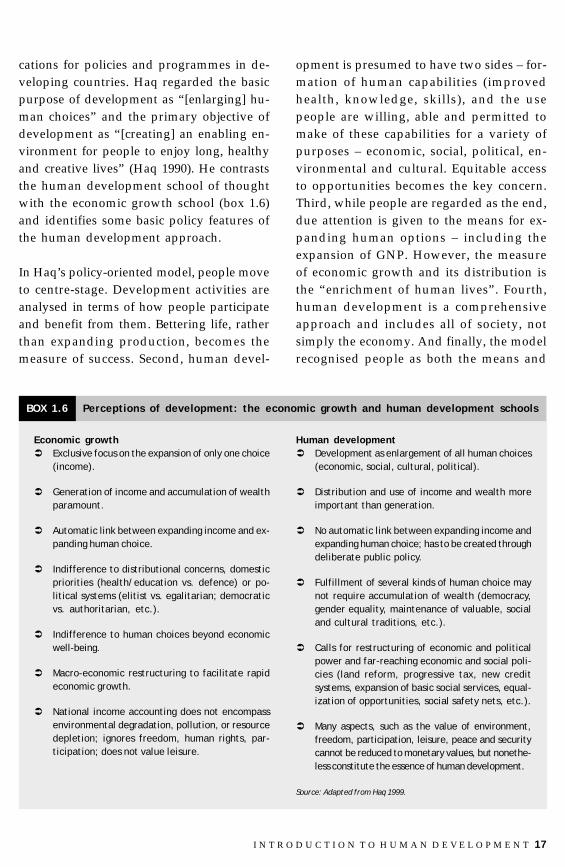
cations for policies and programmes in de-veloping countries. Haq regarded the basicpurpose of development as “[enlarging] hu-man choices” and the primary objective ofdevelopment as “[creating] an enabling en-vironment for people to enjoy long, healthyand creative lives” (Haq 1990). He contraststhe human development school of thoughtwith the economic growth school (box 1.6)and identifies some basic policy features ofthe human development approach.
In Haq’s policy-oriented model, people moveto centre-stage. Development activities areanalysed in terms of how people participateand benefit from them. Bettering life, ratherthan expanding production, becomes themeasure of success. Second, human devel-
opment is presumed to have two sides – for-mation of human capabilities (improvedhealth, knowledge, skills), and the usepeople are willing, able and permitted tomake of these capabilities for a variety ofpurposes – economic, social, political, en-vironmental and cultural. Equitable accessto opportunities becomes the key concern.Third, while people are regarded as the end,due attention is given to the means for ex-panding human options – including theexpansion of GNP. However, the measureof economic growth and its distribution isthe “enrichment of human lives”. Fourth,human development is a comprehensiveapproach and includes all of society, notsimply the economy. And finally, the modelrecognised people as both the means and
Economic growth" Exclusive focus on the expansion of only one choice
(income).
" Generation of income and accumulation of wealthparamount.
" Automatic link between expanding income and ex-panding human choice.
" Indifference to distributional concerns, domesticpriorities (health/education vs. defence) or po-litical systems (elitist vs. egalitarian; democraticvs. authoritarian, etc.).
" Indifference to human choices beyond economicwell-being.
" Macro-economic restructuring to facilitate rapideconomic growth.
" National income accounting does not encompassenvironmental degradation, pollution, or resourcedepletion; ignores freedom, human rights, par-ticipation; does not value leisure.
Human development" Development as enlargement of all human choices
(economic, social, cultural, political).
" Distribution and use of income and wealth moreimportant than generation.
" No automatic link between expanding income andexpanding human choice; has to be created throughdeliberate public policy.
" Fulfillment of several kinds of human choice maynot require accumulation of wealth (democracy,gender equality, maintenance of valuable, socialand cultural traditions, etc.).
" Calls for restructuring of economic and politicalpower and far-reaching economic and social poli-cies (land reform, progressive tax, new creditsystems, expansion of basic social services, equal-ization of opportunities, social safety nets, etc.).
" Many aspects, such as the value of environment,freedom, participation, leisure, peace and securitycannot be reduced to monetary values, but nonethe-less constitute the essence of human development.
Source: Adapted from Haq 1999.
BOX 1.6 Perceptions of development: the economic growth and human development schools

18 R E A D I N G S I N H U M A N D E V E L O P M E N T
the ends of development, rather than instru-ments of production.
Haq identifies four essential components ofhuman development that distinguish it fromtraditional models: equity, sustainability,productivity and empowerment.
Equity refers to equitable access to opportu-nities, without which there can be no enlarge-ment of people’s choices. Lack of equity indevelopment not only restricts the choices ofmany individuals, but may even disenfran-chise whole sections of society. However,Haq specifies equity in opportunities, notnecessarily in results. Equity in access topolitical and economic opportunities is re-garded as basic human right because “allindividuals in a society must be enabled todevelop their human capabilities to the full-est and to put those capabilities to the bestuse in all areas of their lives” since life is ofvalue in itself.
The policy implications arising from equityin access to opportunities are far-reachingand multiple. The distribution of produc-tive assets may need to be changed. Fiscalpolicies that allow income transfers from therich to the poor may be called for. Creditsystems require sensitivity to the predica-ment of the poor, particularly their need forcollateral. Restraint on the exercise of ex-cessive political power by feudal minoritiesmay be needed to equalise political oppor-tunities through electoral reforms. Socialand legal barriers that limit access to eco-nomic and political opportunities forwomen, minorities or particular ethnicgroups may need to be dismantled. Withadequate policies and programmes in place,equity can serve as a powerful base for fur-ther human development.
Sustainability has been defined as “devel-opment that meets the needs of the presentwithout compromising the ability of futuregenerations to meet their own needs” (WCED1987). Haq argues that sustainability cannotbe ensured for the future without the pursuitof sustainable policies in the present. He em-phases the sustainability of human oppor-tunities through the sustainability of allforms of capital – physical, human, finan-cial and environmental. A depletion in theseforms of capital restricts the opportunitiesfor sustainable development for future gen-erations. This concept of sustainability isnot limited to the idea of ensuring the re-newal of all natural resources. Technologi-cal progress can create substitutes for natu-ral resources. What needs to be ensured isthe capacity to produce similar levels ofwell-being, even though the stock of formsof physical and natural capital may change.Sustainability involves distributional eq-uity, (the sharing of development opportu-nities between generations, thereby ensur-ing equity within a single generation andamong generations) and has to be appreci-ated in a dynamic context.
In terms of policy, this perception ofsustainability implies that worthwhile lifeopportunities need to be sustained. Existingdisparities in living standards within andamong nations has to be re-examined. Thefact that the developed North with only one-fifth of the global population consumes overthree-fourths of the world’s resources is aclear source of unsustainability. Efforts needto be made to facilitate a major redistributionof the world’s income and resources. Anunjust, environment-unfriendly and unequalworld simply cannot be sustainable. The es-sence of sustainability lies in focussing onthe kind of growth that puts people at the

I N T R O D U C T I O N T O H U M A N D E V E L O P M E N T 19
centre; that derives from environmentallysound technologies; that incorporates anadequate accounting of environmental fac-tors; and that is participatory and commu-nity-based. There should be no distinctionbetween global and national environmentalproblems because environmental problemsknow no political boundaries.
Productivity is also an essential componentof human development because it requiresinvestments in people and an enablingmacro-economic environment. The value ofeconomic growth lies in using the resourcesresulting from expansion for the purposes ofhuman development. The role of investmentsin human capital on accelerated growth isexemplified by East Asian economies suchas Japan and Korea. But the concern withproductivity needs to be accompanied by anequal concern with aspects of distributionand empowerment.
Empowerment refers to the power that peoplehave to exercise free choice. Democracy, de-centralization, relative freedom from eco-nomic regulations and controls, and an en-vironment that facilitates effective participa-tion in decision-making (including invest-ments in education and health) are all es-sential ingredients of empowerment. It re-quires the creation of conditions in whichpeople can become active participants indetermining their destinies rather than pas-sive recipients of decisions made by others.Empowerment is both an end as well as ameans for human development.
Human development –an innovative paradigmMahbub ul Haq has eloquently argued thatthe essence of the human development ap-
proach is quite simple: approach every issuein the traditional growth models from thevantage point of people (Haq 1995). Dopeople participate and benefit from growth?Are their choices and opportunities ex-panded? Are “free” markets open to allpeople? Are the strategies of balanced bud-gets also balancing lives? Are SAPs struc-turing people’s lives? One can have economicgrowth that is “jobless” (economic growthwithout commensurate growth in employ-ment), or “voiceless” (growth withoutpeople’s participation and basic freedoms),“ruthless” (growth that benefits only the richand is blind to distributional aspects) or“rootless” (growth that is not rooted in themobilising endogenous resources and capa-bilities, and growth that discriminatesagainst cultural identities). What the humandevelopment paradigm calls for is the expan-sion of income and growth that creates jobs,that promotes participation and benefit-shar-ing, that mobilizes endogenous resourcesand capabilities, that protects cultural val-ues, and that encompasses all developmentissues, from basic needs to political and cul-tural freedoms.
This approach to human development hasbeen described as an innovative develop-ment paradigm by Haq. In a general sense,the economic growth approach to develop-ment and the human development approachmay be considered as separate paradigms.The fact that high rates of economic growthdid not translate into the increase in “valu-able” capabilities of people, including sig-nificant worldwide poverty reduction,brought about a “crisis” in the old ap-proach. The human development approachhas been proposed as a different “view” and“image” of the world and a different inter-pretation of development experience. In-

20 R E A D I N G S I N H U M A N D E V E L O P M E N T
deed, as opposed to the GNP growth modelof development, Haq proposes a new ethicsof development that focuses on the humanperson and her choices that differs distinctlyfrom the commodity-centred view of devel-opment. Human development approachmay then be thought of as a new, competingparadigm that is holistic and comprehen-sive – one within which all questions re-lated to the human person can legitimatelybe posed.
In his Reflections on Human Development,Haq (1999), explores the various dimensionsof human development and their implica-tions for national and global policies and in-stitutions. The human development ap-proach calls for a wholly new approach tohuman security centred on the security ofpeople rather than territories, and the secu-rity of individuals everywhere, not onlywithin nations. A major point of departureis the idea that security derives from devel-opment rather than military strength. Thepeace agenda proposed by Haq is orientedtowards halting the arms race, transparencyof information on military spending by na-tions and the initiation of a new develop-ment aid dialogue linked to military spend-ing. In the human development approach,the framework for development cooperationhas to be based on a new resolve to combatglobal poverty. The scope of developmentcooperation has to be broadened to includetrade, investment, technology and labourflows. The essential human developmentagenda, according to Haq, can be financedby reallocating priorities in existing budgets.Reduced military spending, better nationalgovernance and sustainable human devel-opment should form the core of the newpolicy dialogues within and between na-tions. Haq calls for the establishment of an
Economic Security Council within the UnitedNations (UN) to facilitate collective actionon global issues such as poverty, narcoticscontrol, population growth, ecological secu-rity, international migration and deadly dis-eases like HIV/AIDS, malaria and the newstrains of tuberculosis. Macro-economic co-ordination at the global level would be a majortask of the Council.
From the human development perspective,Haq argues for an urgent re-examination ofthe Bretton Woods institutions – the IMF andthe World Bank. The IMF should grow into aWorld Central Bank with appropriatechanges, including voting structure and con-ditionalities for structural adjustment. Themain tasks of the IMF should be acting as alender of last resort, stabilising financialmarkets, regulating international bankingand financial institutions, and expandingand regulating international liquidity. TheWorld Bank, in his view, should redefine it-self as an international investment trust fo-cused on economic growth linked to humanlives and livelihoods, explore new ways torecycle resources to developing countries,find prudent means to restructure debts, andact as a global development agency ratherthan lender.
Since the 1990s, the human developmentperspective articulated by Mahbub ul Haqhas been enriched by a much clearer articu-lation of the essential compatibility andcomplementarity between the language andapproaches of the human rights communityand the human development paradigm(UNDP 2000). The human rights approachcontributes tools to the analysis of progressoffered by the human development approach.At the same time, human development addsdynamism to the human rights perspective
I N T R O D U C T I O N T O H U M A N D E V E L O P M E N T 21
in the sense of highlighting the social condi-tions that can lead to the fulfillment of hu-man rights at the individual level. Both hu-man rights and human development aremotivated by a fundamental commitment topromoting the freedom, well-being and dig-nity of individuals in all societies and inguaranteeing the basic freedoms that peoplehave reason to value. The human rights ap-proach has brought to the centre-stage of hu-man development the issues of cultural liber-ties and the fact that democratic governance –in which political liberties, civil rights anddemocratic freedoms are assured – is the cruxof good governance.
The key aspects of the human developmentparadigm may then be summed up as fol-lows: Human beings are the end and notmerely the means of development. Widen-ing human choices, and by implication, thefreedom to choose, is the purpose of devel-opment. Economic growth and incomes areonly means, not the end of development. Hu-man development has to deal with all theissues that affect the human potential; it istherefore open-ended. The fulfillment of ba-sic needs is just one of its aspects. The hu-man development approach goes beyondphysical conditions to encompass institu-tional and political elements. In order to haveany meaning, the human development ap-proach must ultimately be translated into anagenda of the political economy in evaluat-ing the current condition of humanity andin seeking humane alternatives and solutionsto world problems. There is, to be sure, a defi-nite altruistic bias in the human developmentparadigm and an emotional appeal to abid-ing by a new development ethics, both glo-bally and nationally. A certain simplistic el-ement also pervades the paradigm – a delib-erate naiveté that overlooks the ideological
and political motivations of nations andtheir leaders. However, those who fault theapproach for this oversight should recall thescepticism, even scorn, which greeted thefirst modern proponents of basic humanrights, such as universal suffrage, in 18th cen-tury Europe.
CONCEPTS AND MEASUREMENTSOF HUMAN DEVELOPMENT
The notion of the expansion of human capa-bilities enabled by freedom lies at the heartof the concept of human development. Asoutlined above, Sen’s work has provided thetheoretical foundations of the concept. Buthow does one measure human development?Why is such a measure needed or deemednecessary in the first place? Measuring hu-man development would provide a yardstickagainst which intra- and inter-national as-sessments could be made of the state of theworld’s social and economic progress. Sucha measure had to: (a) be cross-nationally com-parable over periods of time with as littlenormative bias as possible, (b) reflect thevarious dimensions of human developmentas comprehensively as possible, (c) besimple to construct, (d) be easy to interpretwith minimum controversy and (e) be basedon readily available initial data that couldbe built up over time.
According to Haq (1999), the principles thatguided the search for an index of socio-eco-nomic progress included the following:! It should measure the basic concept of
human development in terms of expand-ing capabilities and choices of people.These choices included the desire to livelong, to acquire knowledge, have a com-fortable standard of living, be gainfully
22 R E A D I N G S I N H U M A N D E V E L O P M E N T
employed, live and participate in commu-nity life, and be free to choose among dif-ferent livelihoods.
! The measure should have few variables,so that the index would be simple andmanageable.
! It should be a composite index rather thana number of separate indices, which meantthat it should be possible to reduce the in-dicators to some common denominator.
! It should cover both social and economicchoices.
! The problem of arbitrary weightingshould be avoided.
! The coverage and methodology shouldremain flexible and open-ended, subjectto gradual refinement as better data be-came available.
! Reliability and precision of data would notbe allowed to inhibit the development ofthe index and countries would be rankedaccording to the availability of data. Theidea was that these rankings would beused as pressure points to persuade gov-ernments to produce relevant data.
The human development index (HDI), evolvedout of this effort to measure capabilities, thechoices that people had before them. HDI tookinto account only the most importantchoices, namely, the ability to lead a longand healthy life, the ability to acquireknowledge, and the ability to have accessto resources needed for a decent standardof living.
The introduction of the gender-related devel-opment index (GDI), the gender empower-ment measure (GEM) and the human pov-erty index (HPI), elucidate the flexibility ofthe concept of human development and thenew vistas it opens in measuring, assessingand analysing the various aspects of human
development. The GDI basically uses thesame variables as HDI, but adjusts the aver-age achievement in the variables in accor-dance with the disparity between women andmen. The GEM has been constructed to ex-plicitly measure the relative empowermentof women and men in political and economicspheres of activity. To capture the multipledimensions of poverty, two composite mea-sures of human poverty have been intro-duced – HPI-1 and HPI-2 for developing anddeveloped countries. The HPI-1 focuses onthe deprivations in three essential dimen-sions of human life as reflected in the HDI –longevity, knowledge and decent standardof living. In addition to these three dimen-sions of human life, the HPI-2 takes accountof one more dimension – social inclusion andmeasure the deprivation in four dimensions.The measurement of the indices are presentedin detail in chapter 2. Indices related to vari-ous dimensions of human development arecontinually being revised and expanded. Themeasurement of human development in thissense is an evolving work – a feature that high-lights the enormous creative potential of theconcept both theoretically and in terms of prac-tical assessment and application.
THE HUMAN DEVELOPMENTPARADIGM AND ITS IMPLICATIONS
The human development paradigm has far-reaching implications for national and in-ternational development. The idea of “put-ting people at the centre” has been so seduc-tive politically and so appealing to human-ists generally that it is often used as rhetoricfor political ends. As the concept of humandevelopment becomes popular, its very popu-larity could erode its deeper significance fordevelopment (Fukuda-Parr 2002). Consider-
I N T R O D U C T I O N T O H U M A N D E V E L O P M E N T 23
able scepticism is also expressed with regardto the internalisation of the human develop-ment approach by multilateral agencies suchas the World Bank. In the tug of war betweencapital and labour, these agencies see thehuman development approach as essentiallyagainst the interests of capital, while the con-ventional view has consistently remainedpro-capital.
The objective and meaning of human devel-opment appears to be understood differentlyby the neo-liberal school of what is termedthe Washington Consensus (box 1.7) and bythe human development school. One shouldtherefore look at the deeper significance ofthe contrast between the two, particularly interms of policy implications – always recall-ing that the human development approachand neo-liberal approach share similar ideo-logical roots, including a belief in the funda-mental importance of individual choice, andthe value of well-functioning markets. Its fre-quent reference to poverty reduction notwith-standing, the neo-liberal consensus remainsthe dominant economic paradigm in today’sworld. This may well point up the difficul-
ties of developing countries in their efforts topursue the human development approachwhen they remain critically dependent onmultilateral assistance, particularly from theBretton Woods institutions.
Richard Jolly (2003) has systematically ex-plored the differences between the two interms of objectives and strategies, and interms of policies and priorities. A fundamen-tal philosophical difference underlies the twoapproaches. The philosophy of the humandevelopment approach stresses freedom ofchoice by developing and strengthening hu-man capabilities and by an emphasis on allhuman rights. Though freedom of choice isimportant to neo-liberals, it lies in increas-ing utility and satisfying preferences; theytherefore place primary stress on civil andpolitical rights, traditionally known as the“negative rights” as opposed to the “posi-tive” economic, social and cultural rights.
In the human development approach, theobjective is the expansion of human oppor-tunities and capabilities, while for neo-liber-als it is the maximisation of economic wel-
" Trade liberalisation.
" Financial liberalisation.
" Privatisation.
" “Deregulation” (abolition of barriers to entry andexit).
" Foreign capital liberalisation.
" Secure property rights.
" Unified and competitive exchange rates.
" “fiscal discipline” (Diminished public spending).
" Public expenditure shifts (a redirection of publicexpenditure priorities to fields offering high eco-nomic returns and the potential to improve in-come distribution such as primary health care(PHC), primary education and infrastructures).
" Tax reform (lowering marginal rates and broad-ening the tax base).
" “Social safety net” (selective state transfer to theneedy).
Note: The phrase “Washington Consensus” was originally coined by JohnWilliamson in 1990 to refer to the lowest common denominator of policyadvice being addressed by the Washington-based international financialinstitutions to Latin American countries. It is often seen as synonymouswith “neo-liberalism” and “globalization”.
BOX 1.7 Principles of the Washington consensus*
24 R E A D I N G S I N H U M A N D E V E L O P M E N T
fare. Human development is people-centred,while neo-liberalism is market-centred.While the guiding principle of human de-velopment thinkers is a concern for equityand justice, neo-liberals highlight the impor-tance of economic efficiency. Human devel-opment thinkers regard poverty reduction,i.e., decreasing the number of people livingin multi-dimensional deprivation, as theirfundamental focus, whereas neo-liberalslook to economic growth and, through it,decreasing the population living below agiven minimum income level. The key indi-cators in the human development approachare the HDI, HPI, GDI, GEM, which are es-sentially multidimensional. GNP per capita,growth rates and the percentage of the popu-lation living below a given poverty line arethe key indicators for the neo-liberals; theyalso circumvent issues of what income fluc-tuations mean in people’s lives.
The difference between the human develop-ment approach and that of the neo-liberalsalso lies in their respective views of the rolesof education, health and nutrition in society.For the proponents of human development,these elements are important not only inthemselves, but are also fundamental to hu-man rights politically and to people’s em-powerment. For neo-liberals, they are impor-tant as investments in human capital andthe extent to which they enhance productionand productivity. While human develop-ment thinkers advocate a state active in so-cial areas, the building of basic infrastruc-ture and environmental regulation, neo-lib-erals call for a minimal state involvement ineconomic, social and environmental affairs.Governance for human development propo-nents should not only be democratic, but alsoinclusive; inclusion is not a prime concernof neo-liberals.
The policy implications of the two approachesfor poverty reduction and for national poli-cies in general appear distinctly different, al-though both rely on the role of the market forexpanding opportunities (box 1.8).
In terms of international action and supportfor poorer countries, the implications of thetwo approaches also seem different. Humandevelopment approach seeks more demo-cratic global governance to level the globalplaying field so that the bargaining positionsof weak and poor countries are strengthened.Increased aid and support for developingcountries is called for. The neo-liberal ap-proach seeks to remove all barriers to tradeand capital flows, but not to internationalmigration. Military security, not human se-curity and reduced military spending, is thepriority of the neo-liberal approach. Humandevelopment approach has a more structur-alist view of development, i.e., there is animplicit belief that conscious efforts shouldbe made to change social and economic struc-tures, whereas the neo-liberal approach seeksto maintain the status quo. In general, thestrength of the human development para-digm lies in both its focus on the funda-mental aspects of development that theneo-liberal paradigm neglects, notably inits attention to non-market issues anddecentralisation. The strength of the neo-lib-eral approach lies in its strong, though nar-rowly focused economic theory, financialanalysis and high-quality economic data. Bycontrast, the analyses of the human devel-opment approach often derive from weakdata and frequently tend to be casual. But asSen reminds us, in strategies for develop-ment, it is far more important to be “roughlyright” than “precisely wrong”. The problemof data notwithstanding, the human devel-opment model may well provide the roughly

I N T R O D U C T I O N T O H U M A N D E V E L O P M E N T 25
right approach, whereas a single-minded de-votion to GNP growth, as the experience ofmany developing countries has shown, maybe a precise but wrong strategy for dealingwith the dilemmas of the 21st century world.
HUMAN DEVELOPMENTIN THE GLOBAL CONTEXT
The Human Development Reports producedby the United Nations DevelopmentProgramme (UNDP) annually haveemphasised capabilities related to educationand health more than others. The assump-tion has been that the capabilities identifiedas basic should have universal value, mustbe basic to life and open up many options.Of the four capabilities identified as basic
right from the inception of the human devel-opment idea, only three – survival, knowl-edge, and a decent living standard – havebeen included in the HDI, and the fourth, toparticipate in the life of a community, re-mains outside the HDI largely because it isnot meaningfully measurable (Fukuda-Parrand Shiva Kumar 2003).
The first Human Development Report (HDR)was brought out in 1990. Since then the an-nual HDRs at the global level have monitoredprogress in human development through HDIrankings. By focussing on particular themeseach year the reports have also expanded thescope of human development analysis andhighlighted practical and relevant policy is-sues in efforts to enrich the development dia-logue within and among countries.
Human development paradigm" Broadening choices/opportunities.
" Strengthening human capabilities.
" Enhancing participation.
" Moderating inequality.
" Investing in basic education and health as essen-tials of human development.
" Restructuring national budgets.
Poverty reduction strategy → goal-oriented
Assumption: Growth must be consciously made pro-people and pro-poor." Empowering the poor.
" Aiming at gender equity.
" Ensuring that the poor have access to assets.
" Accelerating pro-poor growth.
" International support for national action.
Neo-liberal paradigm" Free markets/right prices.
" Preventing monopoly.
" Increasing efficiency.
" Allowing the “free”market” to create socioeco-nomic mobility.
" Investing in human resources (in education andhealth, if returns to investment are good).
" Reducing national budgets.
Poverty reduction strategy → growth oriented
Assumption: A “trickle-down” effect can be expected." Ensuring adequate economic growth.
" Expanding the social sector allocations.
" Built-in safety nets as affordable.
" Open economy policies and international aid.
Source: Jolly 2003.
BOX 1.8 Differing national policy priorities

26 R E A D I N G S I N H U M A N D E V E L O P M E N T
The 1990 HDR challenged conventional wis-dom in proposing a new measure of humandevelopment and exploded the myth that highrates of economic growth were imperative for“enlarging people’s choices”. Major policyconclusions of the report show that! In spite of the income gaps existing be-
tween the developed and the developingcountries, there is room for optimism withrespect to the achievements in the area ofhuman development,
! Economic growth matters, but growthdoes not automatically translate intohigher levels of human development; re-distribution policies and equality of op-portunities are important
! Poverty alleviation is an intrinsic part ofhuman development
! There is vast potential for human devel-opment in less developed countries; theissue is one of restructuring national pri-orities and foreign assistance allocation
! Markets alone cannot deliver growth andhuman development; a judicious mix ofmarket efficiency and increased govern-ment expenditure in social services andsocial safety nets is required
The report called for each developing countryto prepare its own human development goalsand integrate them with overall growth mod-els; create a better database for human devel-opment indicators; and pay attention toanalysing the impact of policies andprogrammes on people rather than production.
Since 1991, each of the annual Human De-velopment Reports have focussed on par-ticular themes, and in doing so, have eluci-dated the wide scope of human develop-ment. An early concern was the financingaspect of human development (UNDP1991). The analysis showed that there is
enough scope for restructuring existing bud-gets to finance basic social services for allthe people in each country; the need was torecast priorities. Halting capital flights,combating corruption, reforming public en-terprises and restructuring debt paymentswere some of the actions that could be initi-ated. The best way of mobilising additionalresources was to use the existing resourceswell. A number of innovative markers topublic spending to enhance human devel-opment were suggested. The report also in-troduced the controversial Political Free-dom index. Another theme explored wasthat of the international dimensions of hu-man development (UNDP 1992). The dis-parities between the rich and poor nationsand the contradictions afflicting the globaleconomic system were analysed to showthat a more enlightened dialogue on newpatterns of international development co-operation was called for. Human develop-ment is about a wider participation of stake-holders in determining, prioritising, imple-menting and benefiting from developmentinitiatives. An analysis of this theme (UNDP1993) showed the need for facilitating inclu-sive and collective action throughdecentralisation, strengthening of civil so-ciety and people’s participation. The eco-nomic and political powerlessness ofwomen and minorities and the need to ad-dress the issue through fundamentalchanges in the management of economic andpolitical systems was brought out in sharprelief. Many nations of the world – rich aswell as poor – spend a vast amount of re-sources in the name of security. The explo-ration of the theme of human security(UNDP 1994) showed convincingly that theconcern should be for the security of people,not merely the security of national borders,but a security based on better lives for
I N T R O D U C T I O N T O H U M A N D E V E L O P M E N T 27
people rather than better weapons. A newframework for development cooperationbased on a global compact among nations,rather than charity, was called for.
In most nations of the world, women – whocomprise half of humanity – are systemati-cally deprived of opportunities to enhancetheir capabilities by cultural and religioussanctions, traditions, legal systems and facevarious forms of exclusion from participat-ing in the economic and political life of thenation. The exploration of this theme (UNDP1995) introduced the GDI and GEM as mea-sures of gender inequality and showed theenormous disparities that exist between fe-males and males with respect to the basicindicators of human development. Theanalysis also showed that reducing genderinequality had nothing to do with the levelsof national income. What was required wasto recognise the economic contribution ofwomen, which was grossly undervalued.Strong government intervention was neededto facilitate rapid gender equality throughpolicy reforms and affirmative action. Gen-der equality was considered so crucial tohuman development that human develop-ment, if not engendered, is endangered. Thelinkages between economic growth and hu-man development was the theme analysed(UNDP 1996) to reiterate that there was noautomatic link between economic growthand human development, although the twotended to move together in the long run. Eco-nomic growth can become “jobless”, “ruth-less”, “voiceless”, “rootless” or “futureless”if attention is not paid to the structure, qual-ity and distribution of growth. Poverty wasthe next theme explored in great detail(UNDP 1997). A new measure of human pov-erty, the Human Poverty Index, based on thedenial of opportunities of life, i.e., poverty of
opportunities, rather than poverty of income,was introduced to reflect the concept of pov-erty as capability deprivation. The analysisshowed that poverty reduction strategieswere manageable, as evidenced by a numberof countries including Korea and China, andthat poverty was reversible. In a world whereincreased consumption was considered syn-onymous with development, the theme ex-plored by HDR 1998 was the link betweenconsumption and human development. Theanalysis highlighted the maldistribution oftotal consumption, and illustrated how un-der-consumption coexists with obscene over-consumption. The explosion of private con-sumption goods coexisted with the scarcityof public services. The environmental conse-quences of over- consumption on under-con-sumers were explored and the ways in whichthe link between consumption patterns andhuman development could be improved weresuggested. The impact of globalisation onhuman development has been a matter of realconcern, particularly for the less- developedcountries. This theme was analysed (UNDP1999) to stress that globalisation offered op-portunities that needed to be widely shared.Attention was also drawn on the new threatscreated by globalisation in both rich and poorcountries in terms of economic, job, health,cultural, political, community and environ-mental insecurities. This called for reinvent-ing national and global governance with afocus on equity so that the threats and inse-curities emanating from globalisation couldbe minimised.
Human rights and human freedoms wasanother theme explored by HDR 2000. Itshowed that the basic ideas of human devel-opment and human rights shared commonmotivations and concerns and reinforcedeach other. Seven basic freedoms (freedom

28 R E A D I N G S I N H U M A N D E V E L O P M E N T
from discrimination, from want, for therealisation of one’s human potential, fromfear, from injustice, freedom of participation,expression and association, and freedom fordecent work without exploitation) were iden-tified and the importance of inclusive democ-racy, safeguarding the rights of all and col-lective action was emphasised. Persistentpoverty and widening inequality wereviewed as denials of human rights.
In a world that is being increasingly shapedby technology, HDR 2001 looked at technol-ogy as a tool for promoting human develop-ment and not merely as a reward for higherincomes. A technology achievement indexwas introduced and countries were rankedaccordingly. The role of public policies inmaking new technologies work for humandevelopment was explored.
The political implications of human devel-opment became the theme explored in HDR2002. The analysis showed that advancinghuman development requires democraticgovernance and that democracy must widenand deepen to safeguard freedom and dig-nity and empower the people. It also calledfor democratic control over security forcesand more participation and accountabilityin global decision-making.
The millennium development goals (MDGs)adopted by 189 countries at the UN Millen-nium Summit in September 2000 is thetheme explored by the HDR 2003. The MDGsare basically a global compact among na-tions to end human poverty. The analysisdraws attention to the shortfalls in MDGachievements that can already be seen andcalls for accelerating the pace of progress,particularly by countries that have low hu-man development and poor MDG perfor-
mance and countries that are performingwell on the MDGs, but still have deep pock-ets of poverty. The report also examines link-ages between human development and theMDGs, along with the questions of nationalownership of the Goals by the poorer na-tions and policy changes that the rich needto make concerning aid, debt, trade, andtechnology transfer so as to permit broaderachievement of the Goals among low- andmiddle-income states.
HDR 2004 explores the theme of cultural lib-erty in today’s diverse world. Nearly 200countries today have some 5,000 ethnicgroups, and two thirds of these states haveat least one minority that makes up at least10 percent of its population. Cultural diver-sity is vital to human development and cul-tural liberty is essential to choosing one’sidentity without being excluded from otherchoices in building a full life. The report ad-vocates building more inclusive societies byadopting multi-cultural policies that explic-itly recognise cultural differences; it showsthat a multi-cultural policy approach is notjust desirable, but necessary. The report re-futes notions that cultural diversity detractsfrom national unity and shows that the ex-pansion of cultural freedoms is the only sus-tainable option for promoting both democ-racy and stability within national politiesand across political frontiers.
The coverage and treatment of the variousannual themes in the Human DevelopmentReport indicate the overarching nature andexpanding scope of human developmenttheory and the utility of the explorations ofits ramifications, linkages and relationships.
Human development reports have also beenprepared at regional and national levels. The

I N T R O D U C T I O N T O H U M A N D E V E L O P M E N T 29
reports for South Asia have provided frankprofiles of the region and identified the tasksrequired for its development (Haq 1997).
HDI and related indices can be used as toolsof policy analysis, assessment and monitor-ing across countries, and within countriesover time. At the global level, the most citedexamples are with respect to countryrankings in HDI and per capita income.There can be enormous differences in GDPand HDI rankings (UNDP 2003).! It is possible to have similar HDI at vastly
different levels of per capita income. Forexample the HDI of Thailand (0.768) andSaudi Arabia (0.769) are similar, but Saudiper capita income ($13,330) is over twicethat of Thailand.
! It is also possible to have similar incomelevels with substantially different HDI.For example, Peru ($4,570) and Guate-mala ($4,400) have similar incomes butPeru’s HDI (0.752) is higher than that ofGuatemala (0.652).
! Higher incomes do not always translateinto high HDI. For example, South Africahas quite a high income ($11,290) com-pared to Indonesia ($2,940), but their HDIvalues are comparable (0.684 and 0.682respectively).
! Even at relatively lower income levels adecent level of HDI can be maintained.Sri Lanka, for example has high HDI(0.730) in spite of relatively low incomelevel ($3,180).
! Scarcity of resources is not the main rea-son for deprivation in human develop-ment; most often it is misplaced priori-ties of the state. For example, Jamaica andSri Lanka show that it is possible to en-sure universal provisioning of basichealth and education even at low levelsof income.
Similar conclusions can be derived from look-ing at GDP, life expectancy and educationindex. At similar levels of GDP per capitalife expectancy achievements and educationindex can be strikingly different.
Disaggregated data at the national level (dis-aggregated by region, gender, ethnicity etc.)can provide similar insights into the natureof HDI, income and other indices such asGDI, GEM, HPI and point to the kind of policyorientations that are necessary to raise theHDI and comparable indices.
In the case of each perspective, the rankingscan be measured in terms of (a) absolutechange (b) percentage change, and (c) short-fall reduction over time. Absolute changemethod is biased towards less developedcountries/regions/groups which have morescope for improving absolute levels ofachievements. The percentage changemethod also favours countries/regions/groups with low human development levelsand is fairly easy to compute. The shortfallreduction method is computationally a littlecomplex (it takes the difference in shortfallrelative to the universal between period 1 (p1)and period 2 (p2) as a percentage of p1) but itrecognises the efforts of even countries withhigh levels of achievements in their movetowards universal coverage. Each of the per-spectives provides pointers to policy-mak-ers concerning areas of policy andprogramme attention. For example, if the av-erage HDI has risen, but the deprivation levelamong females and males or among certainethnic groups or regions has not improved,it is a clear pointer that policy focus has to beon those areas and groups. HDI and similarindices can also be indicative of symptomsof problems that have much deeper roots, andneed to be investigated in greater detail. Hu-

30 R E A D I N G S I N H U M A N D E V E L O P M E N T
man development, of course, is much, muchmore than the HDI.
HUMAN DEVELOPMENT IN NEPAL
Nepal has produced three human develop-ment reports to date. The first report in 1998introduced human development into the pub-lic domain and planning process in the coun-try. Subsequently two thematic reports wereproduced: one in 2001 and the other in 2004.The 2001 Nepal Human Development Re-port (NHDR) dealt with poverty reductionand governance while the 2004 report wason empowerment and poverty reduction.
Nepal is among those countries of the worldthat are characterised by low level of humandevelopment. Nepal’s HDI in 2002 was0.504, compared to the world average of 0.729and the average of 0.663 for the developingcountries (UNDP 2004a). Nepal’s level ofHDI is higher than that of the least devel-oped countries (0.446), and higher than theaverage for countries with low human de-
velopment (0.438). In the context of herneighbours, Nepal’s HDI is among the low-est with the exception of Pakistan. Sri Lanka,China and India have much higher HDI lev-els than that of Nepal (table 1.1). However,from a low base of 0.291 in 1975 Nepal’sprogress has been steady. In turns of theprogress in HDI. The country now ranksamong the best of her neighbours with theexception of China. In 2002 Nepal ranked140th among 177 nations in terms of HDI,and 151st in terms of GDP per capita(PPP$). This shows that Nepal’s perfor-mance on the HDI score has been somewhatbetter than on the GDP score, i.e., progressin life expectancy and education has beenrelatively better compared to progress in in-come. The 2002 data show that Nepal isnow on the lower rungs of the countrieswith medium human development status.
Disaggregation of HDI at sub-national lev-els show enormous differences in humandevelopment, even considering the fact thatthe HDI leaves out many other importantdimensions. For disaggregated data one has
TABLE 1.1 HDI trends in Nepal and neighbouring countries 1975-2002
Country 1975 1980 1985 1990 1995 2000 2002 Progressin HDI
1975-2002
Nepal 0.291 0.330 0.372 0.418 0.455 0.488 0.504 0.213
India 0.411 0.437 0.476 0.514 0.548 0.579 0.595 0.184
Bangladesh 0.345 0.363 0.388 0.417 0.445 0.497 0.509 0.164
Bhutan ..... ..... ..... ..... ..... ..... 0.536
Pakistan 0.346 0.373 0.405 0.444 0.473 ..... 0.497 0.151
Sri Lanka 0.613 0.648 0.674 0.698 0.719 ..... 0.740 0.127
China 0.523 0.557 0.593 0.627 0.683 0.721 0.745 0.222
Source: UNDP 2004a.Note: The trend data are not strictly comparable with those in earlier Human Development Reports.

I N T R O D U C T I O N T O H U M A N D E V E L O P M E N T 31
to rely on Nepal Human Development Re-ports 1998, 2001 and 2004, which providedata for 1996, 2000, and 2001. Also, the na-tional reports of 1998 and 2004 provide dis-aggregated data at the district level, whereasthe 2001 report provides data only at the re-gional level. It should be noted that the HDIfor Nepal in the global report and the na-tional report show considerable differences,the national reports show lower HDI scoresthan the global, but the trends are similar.Because of varying data sources (and differ-ing data reliability) and methods of estima-tions used, inter-temporal comparisons maybe hazardous (and have been skilfullyavoided by the 2001 and 2004 reports (seechapter 2). It is nonetheless instructive to lookat the patterns displayed in each year forwhich data is available to appreciate the re-gional differences in HDI (table 1.2).
Urban areas in general have higher HDI thantheir rural counterparts for obvious reasons –better access to health care, education andalso income opportunities. There is some in-dication of the fact that the trend is one ofdeclining rural-urban differences with time.According to the 2001 census only 13.9 per-cent of Nepal’s population was urban, i.e.,resided in designated municipal areas.
Among the three ecological regions in Nepalthe highest HDI has consistently been in thehill region, with the lowest in the moun-tains. The data give the impression that thedifference between the hill and mountainregions, as well as the hills and the Taraiseems to be slowly increasing over time. Thecomparison between development regionshides the enormous intra-regional differ-ences within the hills, mountains and Taraiin each development region. In 2001 for ex-ample, the central mountains had an HDI
score that was 22 percent less than that ofthe central hills. The central hills, it mightbe noted, has a consistently high HDIthroughout mainly because of the highly ur-banized capital region of the KathmanduValley with the provision of services andfacilities unmatched by any other region inNepal. In comparison, the mid-west and thefar western mountains and hills, represent-ing the remote periphery of the Nepalesestate, have the lowest HDI scores.
Among the districts, Kathmandu and Mugustand at the two extremes of the HDI scoresin Nepal. Kathmandu’s HDI was four timeshigher than that of Mugu in 1996, and wasover two times higher in 2001. Fifteen dis-tricts in 2001, all in the mid-western and farwestern hills and mountains – with thesingle exception of Rasuwa – had HDIscores of less than 0.4 in 2001. Only 16 dis-tricts, including the districts of theKathmandu Valley, have HDI scores of over0.5 (UNDP 2004b).
The 1998 Nepal Human Development Re-port provides HDI by ethnicity and castegroups also. It shows that the Newar ethnicgroup has the highest HDI (0.457), followedby Brahmin (0.441), and Chhetri (0.348). Withthe exception of these three groups, all otherethnic/caste groups had HDI less than thenational average of 0.325. The dalit (occu-pational caste groups) and the Muslims hadthe lowest HDI (0.239 each).
Human development andthe millennium developmentgoals (MDGs)The MDGs reflect the key concerns of the UNdevelopment conferences of the 1990s andact as a road map for achieving the Millen-
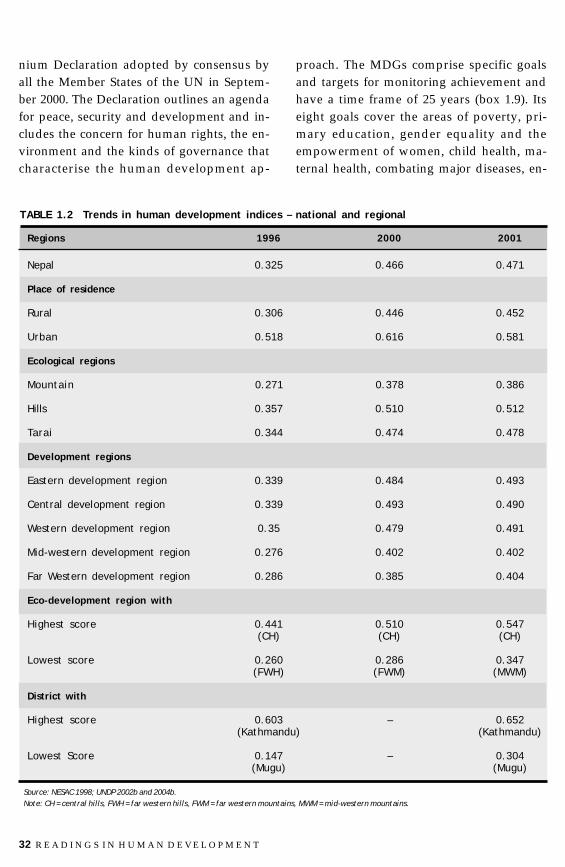
32 R E A D I N G S I N H U M A N D E V E L O P M E N T
nium Declaration adopted by consensus byall the Member States of the UN in Septem-ber 2000. The Declaration outlines an agendafor peace, security and development and in-cludes the concern for human rights, the en-vironment and the kinds of governance thatcharacterise the human development ap-
proach. The MDGs comprise specific goalsand targets for monitoring achievement andhave a time frame of 25 years (box 1.9). Itseight goals cover the areas of poverty, pri-mary education, gender equality and theempowerment of women, child health, ma-ternal health, combating major diseases, en-
TABLE 1.2 Trends in human development indices – national and regional
Regions 1996 2000 2001
Nepal 0.325 0.466 0.471
Place of residence
Rural 0.306 0.446 0.452
Urban 0.518 0.616 0.581
Ecological regions
Mountain 0.271 0.378 0.386
Hills 0.357 0.510 0.512
Tarai 0.344 0.474 0.478
Development regions
Eastern development region 0.339 0.484 0.493
Central development region 0.339 0.493 0.490
Western development region 0.35 0.479 0.491
Mid-western development region 0.276 0.402 0.402
Far Western development region 0.286 0.385 0.404
Eco-development region with
Highest score 0.441 0.510 0.547(CH) (CH) (CH)
Lowest score 0.260 0.286 0.347(FWH) (FWM) (MWM)
District with
Highest score 0.603 – 0.652(Kathmandu) (Kathmandu)
Lowest Score 0.147 – 0.304(Mugu) (Mugu)
Source: NESAC 1998; UNDP 2002b and 2004b.Note: CH = central hills, FWH = far western hills, FWM = far western mountains, MWM = mid-western mountains.

I N T R O D U C T I O N T O H U M A N D E V E L O P M E N T 33
Goal 1. Eradicate extreme poverty and hunger
Target 1. Halve, between 1990 and 2015, the propor-tion of people whose income is less than $ 1 a day.
Target 2. Halve, between 1990 and 2015, the propor-tion of people who suffer from hunger.
Goal 2. Achieve universal primary education
Target 3. Ensure that, by 2015, children everywhere,boys and girls alike, will be able to complete a fullcourse of primary schooling.
Goal 3. Promote gender equality andempower women
Target 4. Eliminate gender disparity in primary andsecondary education, preferably by 2005 and in alllevels of education no later than 2015.
Goal 4. Reduce child mortality
Target 5. Reduce by two-thirds, between 1990 and2015, the under-five mortality rate.
Goal 5. Improve maternal health
Target 6. Reduce by three-quarters, between 1990and 2015, maternal mortality ratio.
Goal 6. Combat HIV/AIDS, malaria and otherdiseases
Target 7. Have halted by 2015 and begun to reverse thespread of HIV/AIDS.
Target 8. Have halted by 2015 and begun to reverse theincidence of malaria and other major diseases.
Goal 7. Ensure environmental sustainability
Target 9. Integrate the principles of sustainable devel-opment into country policies and programmes and re-verse the loss of environmental resources.
*BOX 1.9 MDGs and targets
Target 10. Halve by 2015 the proportion of peoplewithout sustainable access to safe drinking Water.
Target 11. Have achieved by 2020 a significant improve-ment in the lives of at least 100 million slum dwellers.
Goal 8. Develop a global partnershipfor development
Target 12. Develop further an open, rule based, pre-dictable, non-discriminatory trading and financial sys-tem (includes a commitment to good governance, de-velopment and poverty reduction – both nationally andinternationally).
Target 13. Address the special needs of the least devel-oped countries (includes tariff- and quota-free accessfor exports, enhanced programme of debt relief forand cancellation of official bilateral debt, and moregenerous official development assistance for countriescommitted to poverty reduction).
Target 14. Address the special needs of land-lockedcountries and small island developing states (throughthe Programme of Action for the Sustainable Develop-ment of Small Island Developing States and 22nd GeneralAssembly provisions).
Target 15. Deal comprehensively with the debt prob-lems of developing countries through national and in-ternational measures in order to make debt sustain-able in the long term.
Target 16. In cooperation with developing countries,develop and implement strategies for decent and pro-ductive work for youth.
Target 17. In cooperation with pharmaceutical com-panies, provide access to affordable essential drugs indeveloping countries Target 18. In cooperation withthe private sector, make available the benefits of newtechnologies, especially information and communica-tion technologies.
Source: UNDP 2003.

34 R E A D I N G S I N H U M A N D E V E L O P M E N T
vironmental care, and a framework for glo-bal partnership. Their 18 numerical targetsare supplemented by 48 indicators for mea-suring achievement of the targets.
All in all, the MDGs provide a road map toaccelerating human development. While theydo not cover all its dimensions, such as as-pects of civil and political freedoms or theimportance of people’s participation, they doreflect the three key capabilities for humandevelopment, namely, the capability to live along and healthy life, the capability forknowledge, and the capability for a decentstandard of living (box 1.10).
It should be noted, however, that Goal 8, thecritical area of financing and sustaining de-velopment in poor countries – and, far moreimportant, the trade rules and intellectualproperty rights that now imprison many de-veloping countries in their respective pov-erty traps – is neither time- bound nor mea-surable by the kinds of indicators specifiedfor the other Goals. Such indicators not only
Key capabilities for human development" Living a long and healthy life
" Being educated
" Having a decent standard of living
" Enjoying political and civil freedoms to partici-pate in the life of one’s community
Essential conditions for human development" Environmental sustainability
" Equity – especially gender equity
" Enabling global economic environment
*BOX 1.10 Analytical linkage between human development and the MDGs
Corresponding MDGs" Goals 4, 5 and 6 (child mortality, maternal mortal-
ity, HIV/AIDS)
" Goals 2 and 3 (universal primary education, em-powering women)
" Goal 1 (extreme poverty and hunger)
" Important objective in the Millennium Declaration
Corresponding MDGs" Goal 7 (environmental sustainability)
" Goal 3 (gender equality and empowering women)
" Goal 8 (partnership between rich and poor countries)
Source: UNDP 2003.
monitor progress, but hold the actors respon-sible to account. Given the implications ofGoal 8 for evolving a system of global gover-nance and global justice, these shortcomingsrepresent a significant political failure; intoday’s world, so many decisions made atthe global level in a wide range of areas haveprofound impacts on national policies.
MDGs can be seen as ways of easing the con-straints on people’s ability to make choicesand, to that extent, are the building blocksfor human development. The values thatguide the MDGs are the same that motivatehuman development, namely, the values offreedom, equality, solidarity, tolerance, re-spect for nature, and shared responsibility.The common denominator of human devel-opment and human rights is human free-dom. Human development enlarges humancapabilities and opportunities and therebyenhances the freedom of choices. Humanrights, on the other hand, protect that free-dom. Human development and human rightsare thus mutually reinforcing (Jahan 2004).

I N T R O D U C T I O N T O H U M A N D E V E L O P M E N T 35
Underlying the MDGs as well as the conceptof human development is a very fundamen-tal concern for human rights. While theachievement of the MDGs contributes di-rectly to the enhancement of human capa-bilities, these also advance human rights.Each of the MDGs can be directly linked toeconomic, social and cultural rights enumer-ated in the Universal Declaration of HumanRights (articles 22, 24, 25, 26) and other in-struments of human rights (UNDP 2003, box1.1). The full realisation of the economic, so-cial and cultural rights requires far more thanachieving the MDGs, but they are an impor-tant step to that end.
Goals 4, 5 and 6 (reducing child mortality,improving maternal health, and combatingmajor diseases and HIV/AIDS) contribute tothe first capability. Goals 2 and 3 (achievinguniversal primary education, and promotinggender equality and empowerment of women)enhance the capability related to knowledge.Goal 1 (eradicating extreme poverty and hun-
ger) relates to enhancing the capability for adecent standard of living. The essential con-ditions for human development, namely, en-vironmental sustainability, equity (more par-ticularly, gender equity), and enabling globaleconomic environment are addressed by Goal7 (ensuring environmental sustainability),Goal 3 (promoting gender equity), and Goal 8(developing global partnership for develop-ment). These caveats notwithstanding, theprogress towards the MDGs have the poten-tial of becoming milestones in human devel-opment in developing countries.
The fact that achieving some of these MDGtargets remains an uphill task is evidencedby Nepal’s progress through 2005 (table 1.3).The country’s first MDG Progress Reportshows that, with the exception of the goalconcerning child mortality, which can bepotentially met, and access to safe drinkingwater, which probably will be met, all theother MDGs are unlikely to be met at thepresent pace of progress.

36 R E A D I N G S I N H U M A N D E V E L O P M E N T
TABLE 1.3 Nepal’s progress in achieving the MDGs, 1990-2005
Targets/indicators Situation Progress Goal1990 2005 2015
1. (a) Percent of population below $1 per day (PPP) 37.7 24.1 17(1995)
(b) Percent of population below national poverty line 42 3 21(1996) (2004)
2. (a) Percent of population below minimum level of 49 47 24.5dietary energy consumption (1992) (1997)
(b) Percent of underweight under-5 children 57 48.3 28
3. (a) Net enrollment rate in primary education (percent) 64 84 100
(b) Proportion of pupils starting grade 1 who reach grade 5 38 76 100(1994)
4. (a) Percentage of girls to boys in primary education (gross enrollment) 56 86 100
(b) Percentage of girls to boys in lower secondary education 41 82 100(gross enrollment)
(c) Ratio of girls to boys in higher secondary education NA 82 100(gross enrollment)
5. Under-5 mortality rate (per thousand live births) 161.6 82 54(1989)
6. (a) Maternal mortality ratio (per 100,000 live births) 850 415 213(1988) (2000) or
515 129(1991)
(b) Percent of deliveries attended by health care providers 7.4 20 100(doctors/nurses/midwives) (1991)
(c) Contraceptive prevalence rate among married women 24.1 38.9 10015-49 years of age (percent) (1991) (2001)
7. HIV prevalence rate among adults (15-49 years of age) (percent) 0 0.29 2(1999)
(estimate)
8. (a) Number of malaria cases per 100,000 people 115 78 –(1992)
(b) Prevalence tuberculosis associated with (per 100,000 people) 460 280 –
9. (a) Percent of land area protected to maintain biodiversity 10.95 28.6 –(‘000 sq. km.) (2004)
(b) Percent of change in area of forest land 37.4 29 –(1986) (1995)
(c) Energy use per unit of GDP (TOE/in Rs) 35 48 –
10. Percent of population without access to drinking water supply 54 19 27
Source: UNDP/HMG/N 2005.
M E A S U R I N G H U M A N D E V E L O P M E N T 37
The 1990s witnessed marked changes in theperceptions and measurement practices ofdevelopment, notably a shift from the nar-row income-based concerns that began in themid 20th century to the concept of human de-velopment discussed in chapter 1. This chap-ter basically reviews the measurement prac-tices of human development undertaken ina global context by the UNDP since 1990 and,in Nepal, since 1998.
Human development is the process of en-larging people’s choices; and these choicesare infinite in number and change over time.The measurement of human developmentis primarily concerned with identifying themost critical choices, measuring the level ofachievements made in enlarging thesechoices, and aggregating these measure-ments into a single index, which provides abasis for cross-country comparison in theglobal context.
The most critical human choices are to leada long and healthy life, to acquire knowledgeand to have access to resources needed fordecent standard of living, and “If these es-sential choices are not available, many otheropportunities remain inaccessible (UNDP1990).” Additional choices, highly valued bymany philosophers and social scientists, as
well as citizens in the street, range from po-litical, economic, social and cultural freedomto opportunities for being creative and pro-ductive, and enjoying personal self-respectand guaranteed human rights.
Health, education and income are the mostcritical dimensions of human developmentidentified in HDR 1990. Each of these criti-cal dimensions is measured through one ormore appropriate indicators. Their selectionposes challenging tasks for several reasons:First, each indicator should be measurablewith the fewest possible data problems – interms of measurement, collection, and qual-ity. Second, each indicator should be univer-sally valued with as few conceptual prob-lems as possible – in terms of relevancy andsensitivity. Third, the values of each indica-tor should be internationally comparable;they could be used, for instance, for rankingthe world’s countries.
The task of aggregating the measurements tocreate the HDI is also challenging. First, itshould be based on a globally accepted meth-odology with the least possible grounds forcriticism. Second, it should be based on assimple a methodology as possible – in termsof mathematical formulation and weighingsystem. Third, each country’s values should
CHAPTER 2
Measuring human developmentDevendra Chhetry
38 R E A D I N G S I N H U M A N D E V E L O P M E N T
be aggregated on a single scale of measure-ment, so that they can be compared with oneanother internationally.
HDR 1990 provided the HDI values of 130countries, including Nepal, along with theirrankings on a global scale. This first mea-surement was undertaken with three basicindicators: “life expectancy at birth”, “adultliteracy rate” and “adjusted per capita in-come” (see annex 2.1 for definitions), corre-sponding to the three dimensions “a longand health life”, “knowledge”, and “decentstandard of living”. The first two indicatorsare living standard achievements that haveintrinsic value – for example, the capabilityto lead a long and healthy life is valuable initself, as is the capability to achieve literacy;they are ends in themselves. By contrast, theadjusted per capita income has only instru-mental value in terms of what it does – andsometimes does not – allow one to purchaseor achieve, for example, a longer life (Anand1994). Thus, in the measurement of humandevelopment, the expansion of income is im-portant, but only as a means to valuable ends.
Within a country, all the three indicators varyacross population groups defined by vari-ous grouping variables – sex, residence,caste/ethnicity and other social stratifica-tion. Gender variation plays a special role inthe measurement of gender disparities inachievements. Within the broader context ofhuman development, such disparities led tothe development of the GDI in 1995. In thesame year, using the indicators measuringthe three dimensions “political participationand decision making”, “economic participa-tion and decision making” and “power overeconomic resources” social scientists evolvedthe GEM, which measures primarily genderdisparities in opportunities.
In the broader context of development, theprocess of human development is seen fromtwo perspectives – “conglomerative” and“deprivation” (Anand and Sen 2003a). Theformer focuses on the advances made by allgroups in each community, from the rich tothe poor. This perspective is taken while con-structing the HDI. By contrast, a later per-spective views development in terms of howthe poor and the deprived fare in each com-munity. This perspective gave rise to the no-tion of human poverty and a new measure,the Human Poverty Index (HPI) was intro-duced in 1999. Two earlier measures basedon the deprivation perspective and featuredin the human development literature are thecapability poverty measure and human dep-rivation measure, but they have given wayto the HPI.
The HDI, GDI, GEM and HPI use real quan-titative indicators. Another human develop-ment endeavour concentrated on using quali-tative indicators, notably the political free-dom index, introduced in 1992 but subse-quently dropped, in part because of interna-tional political sensitivities, in part becauseof the tremendous difficulties involved infinding adequate measures for the five at-tributes eventually selected: integrity of theself/personal security, rule of law, freedomof expression, political participation andequality before the law (Desai 2003). Politi-cal freedom index scores were calculated for101 countries, of which 36 countries be-longed to the “high political freedom” cat-egory, 38 to that of “reasonable political free-dom”, 18 to “modest political freedom” andnine to the “low political freedom” category.Although abandoned, this exercise clearlyshows that it is possible to construct mea-sures of human development using qualita-tive information.
M E A S U R I N G H U M A N D E V E L O P M E N T 39
A technical problem exists for aggregatingreal quantitative data (like life expectancy)and qualitative/subjective rating data (likestatus of human rights – low, medium andhigh), since the scale of measurement asso-ciated each is different. HDR 1992 arguesthat although political freedom is an essen-tial element of human development, “[m]anypeople argue that even if freedom should bedebated, it should not be measured. The con-cept, they point out, is so large and complexthat any system of measurement will dimin-ish it. Freedom is too valuable to be reducedto a number. It should, they say, be discussedqualitatively, not quantitatively” (quoted byFukuda-Parr and Shiva Kumar 2003).
THE HUMAN DEVELOPMENT INDEX
Conceptually, human development has twosides. One is the formation of human capa-bilities, such as improved health, knowledgeand skills. The other is the use that peoplemake of their acquired capabilities for pro-ductive work or leisure. The HDI measuresthe average formation of human capabilities.From it inception, the measurement of HDIhas focused on three basic dimensions of de-velopment (box 2.1). Other valuable dimen-
sions, such as individual security and tech-nological advance, have so far been impos-sible to incorporate, some for the reasonsstated in the above discussion. However, theannual global HDR has attempted to pro-vide information on some of these dimen-sions of human development through a num-ber of indicators.
HDI measures the average achievement of acountry, or of a region within a country, interms of basic human capabilities sketchedabove. Its value always lies between 0 and 1.The higher value of HDI corresponds tohigher level of human development.
Selection of indicatorsSome refinement in the selection of indica-tors has taken place over time (box 2.2), un-dertaken on the basis of suggestions madeby eminent researchers in the field.
! A long and healthy life
! Knowledge
! A decent standard of living
BOX 2.1 Dimension of HDI
Dimension! A long and healthy life
! Knowledge
! A decent standard of living
BOX 2.2 Refinement in the selection of indicators of HDI
Indicator! Life expectancy at birth.
! Adult (15+) literacy rate (in 1990).
! A combination of ALR and mean years of schooling calculated for popula-tion aged 15 and older (during 1991 to 1994).
! A combination of ALR and combined GERs at all levels of education –primary, secondary and tertiary – (since 1995).
! Adjusted per capita GDP.

40 R E A D I N G S I N H U M A N D E V E L O P M E N T
A few qualifications should be noted:" First, adult literacy measures only the
most basic level of educational attain-ment. Although literacy is undoubtedlya basic requirement for the capability toacquire and to use information, knowl-edge and communication encompass farmore than literacy alone. To reflect this inthe HDI, another indicator – mean yearsof schooling – was introduced in 1991 asa supplement to adult literacy. However,because it was soon realized that the com-putation of mean years of schooling is acomplex exercise and that such statisticsare not readily available in any UNagency or international organization, amore readily available indicator – com-bined gross enrollment ratio (GER) – re-placed it in 1995.
" Second, the reason for choosing the percapita GDP as a proxy measure for percapita income is described in annex 2.1.To make the per capita GDP globallycomparable, an adjustment – widelyknown as purchasing power parity(PPP) in US dollar – has to be made toper capita GDP.
" Third, an additional adjustment to GDPper capita PPP US$ must to be made forincorporating the law of diminishing re-turns. This is essential since per capitaincome is a means rather than an end ofhuman development, unlike health andeducation. In the human developmentcontext, the law of diminishing returnsstates simply that as income increases,the impact on human development of ev-ery additional dollar (marginal utility)shrinks. In other words, the value of eachadditional dollar is higher to a personwith per capita income PPP$ 1,000 thanto another with a per capita income PPP$2,000. This derives from a simple premise:
people do not need an infinite income fora decent standard of living (UNDP 1995)(see annex 2.1).
Constructing the HDI: The given values offour indicators – life expectancy at birth,adult literacy rate (ALR), combined GER, andadjusted GDP per capita – must be aggre-gated to obtain HDI value. The process ofaggregation can be carried out in the twosteps described below (UNDP 2002b)." The first step is the computation of the
dimension index, which is carried out bytransferring original values of indicatorsto normalized scores using the transfor-mation given by
valueMinimum–valueMaximum
valueMinimum–valueActual (2.1)
In (2.1) the actual value is the original valueof the indicator; minimum and maximumvalue are the smallest and largest possiblevalues, called benchmarks or goalposts, ofthe corresponding indicator. The transfor-mation (2.1) is one-to-one, in the sense thateach actual value corresponds to a uniquescore and vice-versa. Also, the transforma-tion is order-preserving, in the sense thatlarger values correspond to larger scores.The transformation (2.1) converts the origi-nal value to the 0 to 1 scale, which is free ofunit measurements.
It is important to note that change in thegoalposts will change the normalized score.First, the goalposts kept on changing fromyear to year between 1990 and 1993. Thesechanges caused undesirable externalities,and many scholars advocated fixing thegoalposts. This process started in 1994 andmaterialized fully in 1995 (for more aboutgoalposts, see annex 2.2).

M E A S U R I N G H U M A N D E V E L O P M E N T 41
Using (2.1) the given values of ALR, com-bined GER and life expectancy at birth areconverted into normalized scores, for conve-nience referred to as ALR, GER and LE in-dex respectively. The adjusted per capitaGDP is also normalized using (2.1) with littlemodification – replacing each value by itslog value. The two ALR and GER indices arethen combined into an education achieve-ment (EA) index as follows.
EA index = 32
× ALR index + 31 × GER index
(2.2)
" In the second step, the three normalizedindices – the LE, EA and GDP index – areaggregated by taking their simple aver-age, which is HDI. Thus,
HDI =31 × LE Index +
31 × EA Index +
31
× GDP Index (2.3)
Computation of HDI: The above two stepsof HDI calculation are illustrated below. Forthis purpose, the following statistics avail-able in the 1998 Nepal Human DevelopmentReport are used (table 2.1).
Step 1 Computation of normalized score
Life expectancy index = 85 – 2555 – 25
= 6030
= 0.50,
ALR index = 100 – 0
36.72 – 0 = 0.367
Mean years of schooling index= 15 – 0
2.25 – 0
= 0.15
Education index = 32
× 0.367 + 31 × 0.15
= 0.295
GDP index = log(40000) – log(100)
og(1186) – log(100)l
= 4.602 – 2.0003.074 – 2.000
= 2.6021.074
= 0.413
Step 2 Aggregation of three indices
HDI = 31 × (0.50 + 0.295 + 0.413)
= 31 × 1.208 = 0.403
In this example, the minimum (25) and maxi-mum value (85) in life expectancy index arethe global extreme life expectancy levels.Similarly, in education index, the maximumyears of schooling is taken as 15, whereasminimum is zero. In GDP index, the maxi-mum income is taken as PPP$ 40,000 andminimum as PPP$ 100.
The HDI value computed above differs fromthe one reported in the 1998 Nepal HumanDevelopment Report because the latter hadused the “income discounting” method foradjusting GDP per capita, while this exer-cise has used log transformation. This clearlydemonstrates that the change in adjustmentmethodology of GDP brings about change inthe HDI value.
TABLE 2.1 HDI-related basicindicator values of Nepal, 1996
Life Adult Mean GDP/capitaexpectancy literacy years of in
at birth rate schooling PPP$
55.0 36.72 2.25 1186
Source: NESAC 1998.

42 R E A D I N G S I N H U M A N D E V E L O P M E N T
GENDER-RELATEDDEVELOPMENT INDEX
In 1993, Anand and Sen (2003b) wrote:“Women and men share many aspects of liv-ing together, collaborate with each other incomplex and ubiquitous ways, and end up -often enough - with very different rewardsand deprivations.” The female-male differ-entials in achievements of human capabili-ties have always been a major concern. Allattempts to reflect gender inequality in theHDRs prior to 1995 encountered two majorproblems (UNDP 1995). First, they did notrelate the female-male disparity to the overalllevel of achievement in a society. Second, eachsociety could choose a specific value for itsaversion to gender inequality, depending onwhere it started and what goals it wanted toachieve over a specified period of time.
Problems in gender disaggregated out-comes: Assume that the case is six Nepalesedistricts (1 = best …6 = worst) out of thegiven gender disaggregated literacy rates(6+). At the outset, there seem to be two op-
tions: computing the overall literacy rates(weighted average literacy rates) and rank-ing the districts based on overall achieve-ments in literacy rates – or computing F-Mratios (ratios of female to male literacy rates)and ranking the districts based on these ra-tios. The two options produced two differ-ent ranking scenarios (table 2.2), which pro-vided an inconclusive result. One of the ba-sic issues at this point is whether or not it ispossible to compute the overall achieve-ments that depend upon the society’s aver-sion to gender inequality or preference togender equality? Anand and Sen (UNDP1995) suggested a general formula for sucha computation (see annex 2.3), involving anadjustment parameter designated by ε, of-ten called a “penalty” for inequality. For ex-ample, if a society has no preference for gen-der equality (that is ε = 0), then it can takethe weighted average1 as a gender-relatedmeasure of development. By contrast, if thesociety has a very high preference for gen-der equality (that is ε = ∞), then it can takethe minimum {Xf, Xm}2 as a gender-relatedmeasure of development.
1 The weighted average = pf ´Xf + pm´Xm where pf and pm are correspondingly the proportion of female and male and Xf and Xm are
correspondingly the achievement of female and male.2 min{Xf, Xm}= minimum between the two numbers Xf, and Xm, and usually it turns out Xf .
TABLE 2.2 Gender disaggregated literacy rates and problem of ranking districts
District Female literacy rate Male literacy rate Overall literacy rate F-M ratio
(%) (%) % Rank % Rank
Dhading 34 54 44 3.5 63 3
Doti 26 61 44 3.5 43 6
Siraha 27 54 41 5 50 5
Rautahat 22 43 33 6 51 4
Manang 53 67 60 2 79 1
Kaski 62 83 72 1 75 2
Source: CBS 2003.

M E A S U R I N G H U M A N D E V E L O P M E N T 43
A new measure of human development – theGDI – was at last introduced in 1995, mea-suring achievement in the same basic capa-bilities as does the HDI, but taking note ofinequality in achievement between womenand men. The methodology eventually usedimposes a penalty for inequality, such thatthe GDI falls when achievement levels of bothwomen and men in a country go down orwhen the disparity between their achieve-ments increases. The values of GDI lie be-tween 0 and 1. A value of 1 reflects a maxi-mum achievement in basic capabilities withperfect gender equality. Likewise, a value of0 reflects a minimum achievement in basiccapabilities with perfect gender equality. Butno society achieves such values. Higher val-ues correspond to higher gender equality orhigher level of achievements made by bothmean and women.
Dimension and indicators of GDI: The di-mensions of GDI remain the same as thoseof HDI. The difference in indicators is thatGDI incorporates the basic indicators – lifeexpectancy at birth, ALR, combined GERand adjusted GDP/capita – in accordancewith the degree of disparity in achievementbetween women and men. Obviously, GDIdemands appropriate gender-disaggre-gated data corresponding to basic indica-tors (box 2.3) and, unfortunately, gender-disaggregated data on GDP are not readily
available. Consequently, HDR 1995 adopteda methodology for deriving the estimates offemale and male earned incomes to capturethe disparities between men and women incommand over resources (see annex 2.1).
A few points, however, need to be noted:" The life expectancy for women is higher
than that for men – possibly by some fiveyears or more - provided women receivedthe same treatment as men in terms of nu-trition, health care and other conditionsof living arrangements.
" There is no such corresponding differencein the potential for adult literacy, com-bined GER and income earning.
Constructing the GDI: The given values ofeight indicators are aggregated in order toget the GDI value. The process of aggrega-tion can be carried out in the three steps de-scribed below (UNDP 2002b)." The first step is the computation of di-
mension index, which is carried out bytransferring original values of indicatorsinto normalized scores separately formale and female using the transforma-tion given by equation (2.1). This step issimilar to the first in constructing theHDI value. For this purpose, thegoalposts for male and female are pro-vided in annex 2.2. Construct the educa-tional achievement (EA) index sepa-
Dimension! A long and healthy life
! Knowledge
! A decent standard of living
BOX 2.3 Dimension and indicators of GDI
Indicator! Female and male life expectancy (FLE and MLE) at birth.
! Female and male ALR (FALR and MALR).
! Female and male combined GER (FGER and MGER).
! Female and male estimated earned income (FEEI and MEEI).

44 R E A D I N G S I N H U M A N D E V E L O P M E N T
GDI = 31 × EDILE +
31 × EDIEA +
31 × EDII
(2.5)
Computation of GDI: The above three stepsof GDI calculation are illustrated below us-ing statistics available in the 2001 Nepal Hu-man Development Report (table 2.3).
Step 1 involves the computation of normal-ized scores, as set out in table 2.4.
The ALR and mean years of schooling indi-ces are combined separately for female andmale to get education attainment index formale and female as follows.
Education attainment index for female
= 32
× 0.354 + 31 × 0.150
= 0.286
Education attainment index for male
= 32
× 0.658 + 31 × 0.297
= 0.538
Step 2 involves the computation of equallydistributed indices.
Equally distributed life expectation index= [0.502 × 0.538–1 + 0.498 × 0.613–1]–1
= 0.573
Equally distributed education index= [0.502 × 0.286–1 + 0.498 × 0.538–1]–1
= 0.373
Equally distributed income index=[0.502 × 0.369–1 + 0.498 × 0.459–1]–1
= 0.409
TABLE 2.3 GDI-related basicindicator values of Nepal, 2000
Indicators Female Male
Share of population 0.502 0.498
Life expectancy at birth 59.8 59.3
Adult literacy rate 35.4 65.8
Mean years of schooling 2.25 4.45
Estimated earned income 911 1565(per capita GDP in PPP$)
Source: UNDP 2002b.
rately for male and female by combiningthe normalized scores of ALR and GERwith corresponding weights of two-thirds and one-third respectively. Thiswill produce six indices – FLE, MLE,FEA, MEA, FI and MI index.
" The second step is the computation of theequally distributed index, according tothe following general formula, whose ra-tionale is described in annex 2.3.
equally distributed index
= [ pf × xf–1 + pm × xm
–1]–1 (2.4)
In (2.4), pf and pm respectively designate theproportional share of female and male inthe population, and xf and xm respectivelydesignate the female and male indices con-structed in the first step. This will producethree equally distributed indices – anequally distributed index of life expectancy(EDILE) at birth, an equally distributed in-dex of educational achievements (EDIEA)and an equally distributed income index(EDII)." The third step is the aggregation of the
three indices by taking their simple aver-age, which is GDI. Thus,
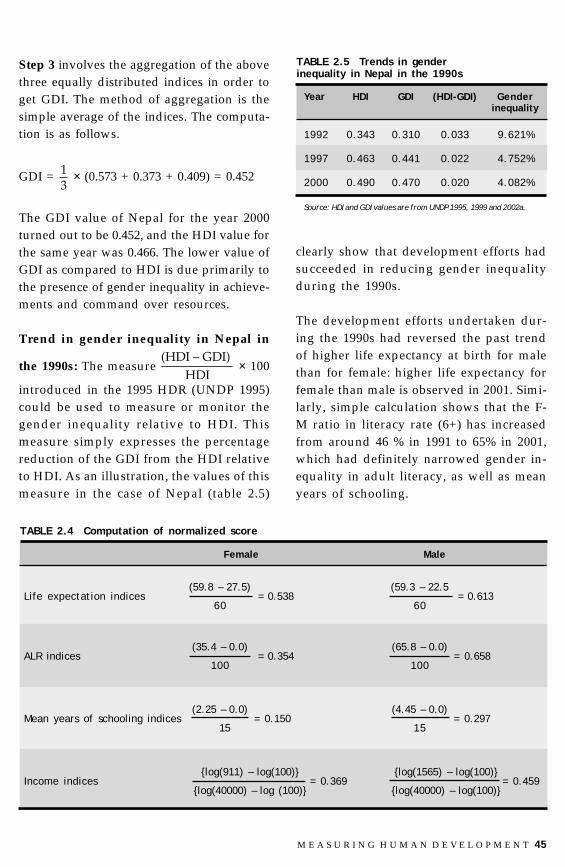
M E A S U R I N G H U M A N D E V E L O P M E N T 45
Step 3 involves the aggregation of the abovethree equally distributed indices in order toget GDI. The method of aggregation is thesimple average of the indices. The computa-tion is as follows.
GDI = 31 × (0.573 + 0.373 + 0.409) = 0.452
The GDI value of Nepal for the year 2000turned out to be 0.452, and the HDI value forthe same year was 0.466. The lower value ofGDI as compared to HDI is due primarily tothe presence of gender inequality in achieve-ments and command over resources.
Trend in gender inequality in Nepal in
the 1990s: The measure HDI
(HDI – GDI) × 100
introduced in the 1995 HDR (UNDP 1995)could be used to measure or monitor thegender inequality relative to HDI. Thismeasure simply expresses the percentagereduction of the GDI from the HDI relativeto HDI. As an illustration, the values of thismeasure in the case of Nepal (table 2.5)
TABLE 2.4 Computation of normalized score
Female Male
(59.8 – 27.5) (59.3 – 22.5Life expectation indices = 0.538 = 0.613
60 60
(35.4 – 0.0) (65.8 – 0.0)ALR indices = 0.354 = 0.658
100 100
(2.25 – 0.0) (4.45 – 0.0)Mean years of schooling indices = 0.150 = 0.297
15 15
{log(911) – log(100)} {log(1565) – log(100)}Income indices = 0.369 = 0.459
{log(40000) – log (100)} {log(40000) – log(100)}
TABLE 2.5 Trends in genderinequality in Nepal in the 1990s
Year HDI GDI (HDI-GDI) Genderinequality
1992 0.343 0.310 0.033 9.621%
1997 0.463 0.441 0.022 4.752%
2000 0.490 0.470 0.020 4.082%
Source: HDI and GDI values are from UNDP 1995, 1999 and 2002a.
clearly show that development efforts hadsucceeded in reducing gender inequalityduring the 1990s.
The development efforts undertaken dur-ing the 1990s had reversed the past trendof higher life expectancy at birth for malethan for female: higher life expectancy forfemale than male is observed in 2001. Simi-larly, simple calculation shows that the F-M ratio in literacy rate (6+) has increasedfrom around 46 % in 1991 to 65% in 2001,which had definitely narrowed gender in-equality in adult literacy, as well as meanyears of schooling.
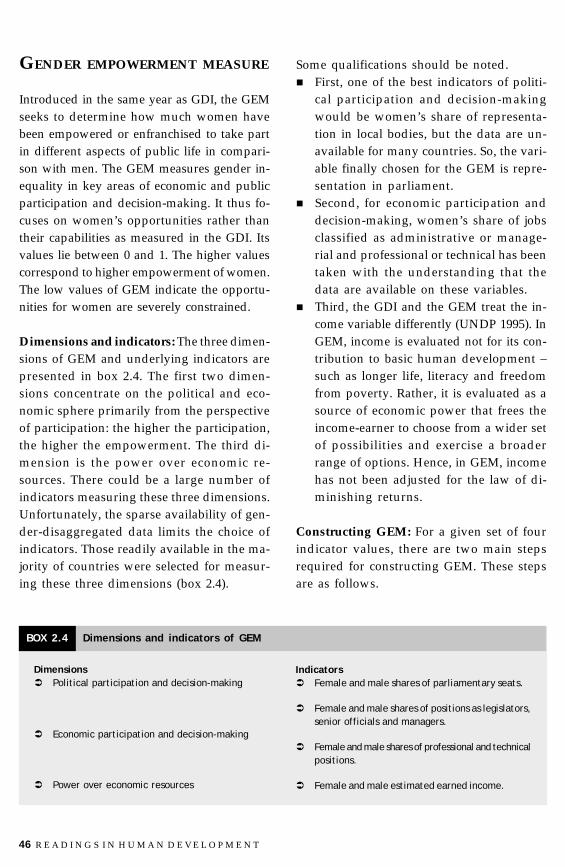
46 R E A D I N G S I N H U M A N D E V E L O P M E N T
Some qualifications should be noted." First, one of the best indicators of politi-
cal participation and decision-makingwould be women’s share of representa-tion in local bodies, but the data are un-available for many countries. So, the vari-able finally chosen for the GEM is repre-sentation in parliament.
" Second, for economic participation anddecision-making, women’s share of jobsclassified as administrative or manage-rial and professional or technical has beentaken with the understanding that thedata are available on these variables.
" Third, the GDI and the GEM treat the in-come variable differently (UNDP 1995). InGEM, income is evaluated not for its con-tribution to basic human development –such as longer life, literacy and freedomfrom poverty. Rather, it is evaluated as asource of economic power that frees theincome-earner to choose from a wider setof possibilities and exercise a broaderrange of options. Hence, in GEM, incomehas not been adjusted for the law of di-minishing returns.
Constructing GEM: For a given set of fourindicator values, there are two main stepsrequired for constructing GEM. These stepsare as follows.
GENDER EMPOWERMENT MEASURE
Introduced in the same year as GDI, the GEMseeks to determine how much women havebeen empowered or enfranchised to take partin different aspects of public life in compari-son with men. The GEM measures gender in-equality in key areas of economic and publicparticipation and decision-making. It thus fo-cuses on women’s opportunities rather thantheir capabilities as measured in the GDI. Itsvalues lie between 0 and 1. The higher valuescorrespond to higher empowerment of women.The low values of GEM indicate the opportu-nities for women are severely constrained.
Dimensions and indicators: The three dimen-sions of GEM and underlying indicators arepresented in box 2.4. The first two dimen-sions concentrate on the political and eco-nomic sphere primarily from the perspectiveof participation: the higher the participation,the higher the empowerment. The third di-mension is the power over economic re-sources. There could be a large number ofindicators measuring these three dimensions.Unfortunately, the sparse availability of gen-der-disaggregated data limits the choice ofindicators. Those readily available in the ma-jority of countries were selected for measur-ing these three dimensions (box 2.4).
Dimensions! Political participation and decision-making
! Economic participation and decision-making
! Power over economic resources
BOX 2.4 Dimensions and indicators of GEM
Indicators! Female and male shares of parliamentary seats.
! Female and male shares of positions as legislators,senior officials and managers.
! Female and male shares of professional and technicalpositions.
! Female and male estimated earned income.
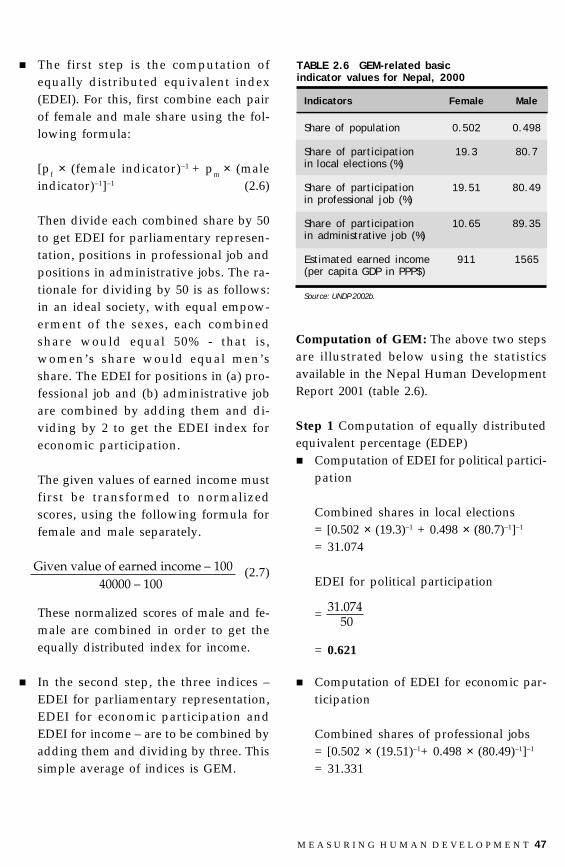
M E A S U R I N G H U M A N D E V E L O P M E N T 47
" The first step is the computation ofequally distributed equivalent index(EDEI). For this, first combine each pairof female and male share using the fol-lowing formula:
[pf × (female indicator)–1 + pm × (maleindicator)–1]–1 (2.6)
Then divide each combined share by 50to get EDEI for parliamentary represen-tation, positions in professional job andpositions in administrative jobs. The ra-tionale for dividing by 50 is as follows:in an ideal society, with equal empow-erment of the sexes, each combinedshare would equal 50% - that is,women’s share would equal men’sshare. The EDEI for positions in (a) pro-fessional job and (b) administrative jobare combined by adding them and di-viding by 2 to get the EDEI index foreconomic participation.
The given values of earned income mustfirst be transformed to normalizedscores, using the following formula forfemale and male separately.
40000 – 100
Given value of earned income – 100 (2.7)
These normalized scores of male and fe-male are combined in order to get theequally distributed index for income.
" In the second step, the three indices –EDEI for parliamentary representation,EDEI for economic participation andEDEI for income – are to be combined byadding them and dividing by three. Thissimple average of indices is GEM.
TABLE 2.6 GEM-related basicindicator values for Nepal, 2000
Indicators Female Male
Share of population 0.502 0.498
Share of participation 19.3 80.7in local elections (%)
Share of participation 19.51 80.49in professional job (%)
Share of participation 10.65 89.35in administrative job (%)
Estimated earned income 911 1565(per capita GDP in PPP$)
Source: UNDP 2002b.
Computation of GEM: The above two stepsare illustrated below using the statisticsavailable in the Nepal Human DevelopmentReport 2001 (table 2.6).
Step 1 Computation of equally distributedequivalent percentage (EDEP)" Computation of EDEI for political partici-
pation
Combined shares in local elections= [0.502 × (19.3)–1 + 0.498 × (80.7)–1]–1
= 31.074
EDEI for political participation
= 50
31.074
= 0.621
" Computation of EDEI for economic par-ticipation
Combined shares of professional jobs= [0.502 × (19.51)–1+ 0.498 × (80.49)–1]–1
= 31.331

48 R E A D I N G S I N H U M A N D E V E L O P M E N T
EDEI for participation in professional jobs
= 50
31.331 = 0.627
Combined shares of administrative jobs= [0.502 × (10.65)–1 + 0.498 × (89.35)–1]–1
= 18.972
EDEI for participation in administrativejobs
= 50
18.972 = 0.379
EDEI for economic participation
= 2
(0.627 + 0.379) = 0.503
" Computation of EDEI for income
Normalized score of woman’s earnedincome
= 40000 – 100
911 – 100 = 0.020
Normalized score of men’s earned income
= 40000 – 1001565 – 100
= 0.037
EDEI for income= [0.502 × (0.020)–1 + 0.498 × (0.037)–1]–1
= 0.026
Step 2 involves aggregation of EDEI for" political participation," economic participation, and" income by taking their simple average in
order to get GEM. Thus,
GEM = 3
0.621 + 0.503 + 0.026 = 0.384
Thus, GEM of Nepal for the 2000 was0.384, which is well below the maximumvalue of 1.
HUMAN POVERTY INDEX
Poverty is a multi-dimensional concept. It in-dicates lack of access to resources and op-portunities, illiteracy, poor health, lack ofsanitation, deprivation of basic rights andsecurity, and powerlessness (Lanjouw, et al1998). Poverty, when perceived or measuredin economic perspective, is known as incomepoverty, and the incidence of poverty (pov-erty rate or head count ratio) is the most com-monly used measurement. By contrast, pov-erty when perceived or measured from asocio-political perspective – health, educa-tion, and political freedom – is known as ca-pability poverty. As indicated earlier, the firstattempt of measuring poverty within theframework of human development was madein the 1996 by introducing a composite in-dex (UNDP 1996) known as capability pov-erty measure. A second attempt, made in 1997by introducing a composite index (UNDP1997), became known as human poverty in-dex (HPI). Just as there are two measures ofincome poverty – absolute and relative – ap-propriate for developing and developedcountries, there are also two measures of hu-man poverty – HPI-1 and HPI-2 – appropri-ate for developing and developed countries.
The HPI-1 measures the average depriva-tions in three basic dimensions of humandevelopment – a long and healthy life,knowledge and economic provisioning. Inaddition to three dimensions, HPI-2 takesaccount of one more dimension – social in-clusion - and measures the average depri-vations in four basic dimensions. The val-ues of both measures lie between 0 to 100per cent. The higher value of HPI-1 or HPI-2corresponds to higher average deprivationin the three or four basic dimensions of hu-man deprivation.

M E A S U R I N G H U M A N D E V E L O P M E N T 49
Dimensions and indicators: The dimensionsand indicators measuring HPI-1 (hereafterknown simply as HPI) and HPI-2 are pre-sented in box 2.5. Note that some modifica-tions would concentrate on deprivation inthree essential dimensions of human life al-ready reflected in the HDI – longevity, knowl-edge and a decent standard of living.
Some qualifications must be noted:" First, we focus here only on HPI-1 because
in a country like Nepal, it is more relevant." Second, the indicator “probability at
birth of not surviving to age 40” mea-sures the vulnerability to death at a rela-tively early age.
" Third, the indicator “adult illiteracy rate”measures the deprivation of people be-cause of their exclusion from the world ofreading and written communication.
" Fourth, note that a decent standard of liv-ing is bound up with economic provi-sioning in the previous measures of hu-man development. The rationale for us-ing the last two indicators for measuringeconomic provisioning is clearly spelled
out in HDR 1999: “… for economic provi-sioning, in developing countries, publicprovisioning is more important than pri-vate income. At the same time, more thanfour-fifths of private income is spent onfood. Thus, in developing countries, lackof access to health services and safe wa-ter and the level of malnutrition capturedeprivation in economic provisioningmore practically than other indicators.”
Construction of HPI: The construction meth-odology of the HPI is simpler than that ofHDI, because the indicators used to measurethe deprivation are already normalizedscores between 0 and 100; they are expressedin percentages. Two major steps are requiredto compute it." In the first step, the two indicators mea-
suring the deprivation in standard of de-cent living is combined as a simple aver-age of the two.
" In the second step, the three deprivationindices are combined using the follow-ing formula, whose rationale is describedin annex 2.4.
BOX 2.5 Dimensions and indicators of HPI-1 and HPI-2
Indicators of HPI-1! Probability at birth of not
surviving to age 40.
! Adult illiteracy rate.
! Percentage of population notusing improved water sources.
! Percentage of children underfive who are underweight.
! Percentage of populationwithout access to healthservices (which was droppedsince 2001).
! No indicator.
Indicators of HPI-2! Probability at birth of not
surviving to age 60.
! Percentage of adults lackingfunctional literacy skills.
! Percentage of populationliving below the poverty line.
! Long term unemployment rate.
Dimension! A long and healthy life
! Knowledge
! A decent standard of living
! Social Inclusion
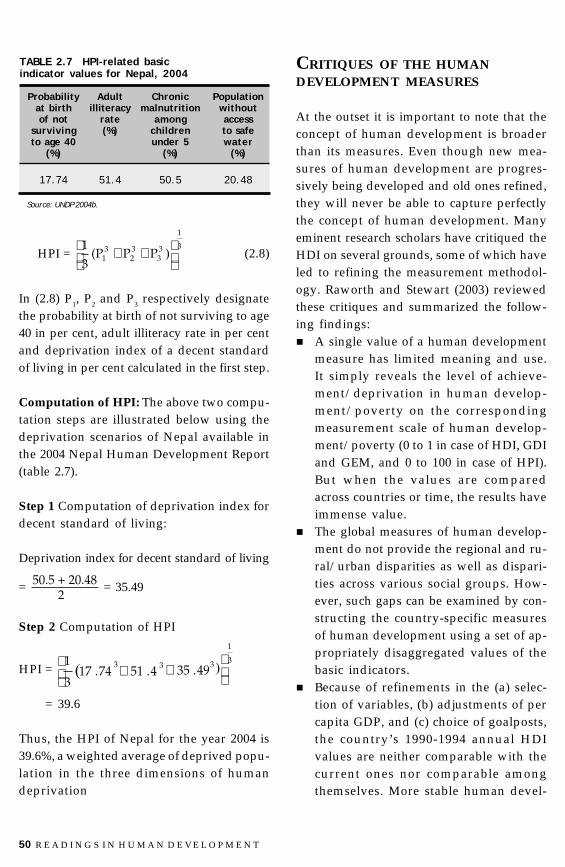
50 R E A D I N G S I N H U M A N D E V E L O P M E N T
HPI = 33
32
31 PP(P
3
1 3
1
)���
� �� (2.8)
In (2.8) P1, P2 and P3 respectively designatethe probability at birth of not surviving to age40 in per cent, adult illiteracy rate in per centand deprivation index of a decent standardof living in per cent calculated in the first step.
Computation of HPI: The above two compu-tation steps are illustrated below using thedeprivation scenarios of Nepal available inthe 2004 Nepal Human Development Report(table 2.7).
Step 1 Computation of deprivation index fordecent standard of living:
Deprivation index for decent standard of living
= 2
50.5 + 20.48 = 35.49
Step 2 Computation of HPI
HPI = 374.17(
3
1 34.51� 3
49.35�3
1
)���
�
= 39.6
Thus, the HPI of Nepal for the year 2004 is39.6%, a weighted average of deprived popu-lation in the three dimensions of humandeprivation
CRITIQUES OF THE HUMANDEVELOPMENT MEASURES
At the outset it is important to note that theconcept of human development is broaderthan its measures. Even though new mea-sures of human development are progres-sively being developed and old ones refined,they will never be able to capture perfectlythe concept of human development. Manyeminent research scholars have critiqued theHDI on several grounds, some of which haveled to refining the measurement methodol-ogy. Raworth and Stewart (2003) reviewedthese critiques and summarized the follow-ing findings:" A single value of a human development
measure has limited meaning and use.It simply reveals the level of achieve-ment/deprivation in human develop-ment/poverty on the correspondingmeasurement scale of human develop-ment/poverty (0 to 1 in case of HDI, GDIand GEM, and 0 to 100 in case of HPI).But when the values are comparedacross countries or time, the results haveimmense value.
" The global measures of human develop-ment do not provide the regional and ru-ral/urban disparities as well as dispari-ties across various social groups. How-ever, such gaps can be examined by con-structing the country-specific measuresof human development using a set of ap-propriately disaggregated values of thebasic indicators.
" Because of refinements in the (a) selec-tion of variables, (b) adjustments of percapita GDP, and (c) choice of goalposts,the country’s 1990-1994 annual HDIvalues are neither comparable with thecurrent ones nor comparable amongthemselves. More stable human devel-
TABLE 2.7 HPI-related basicindicator values for Nepal, 2004
Probability Adult Chronic Populationat birth illiteracy malnutrition withoutof not rate among access
surviving (%) children to safeto age 40 under 5 water
(%) (%) (%)
17.74 51.4 50.5 20.48
Source: UNDP 2004b.
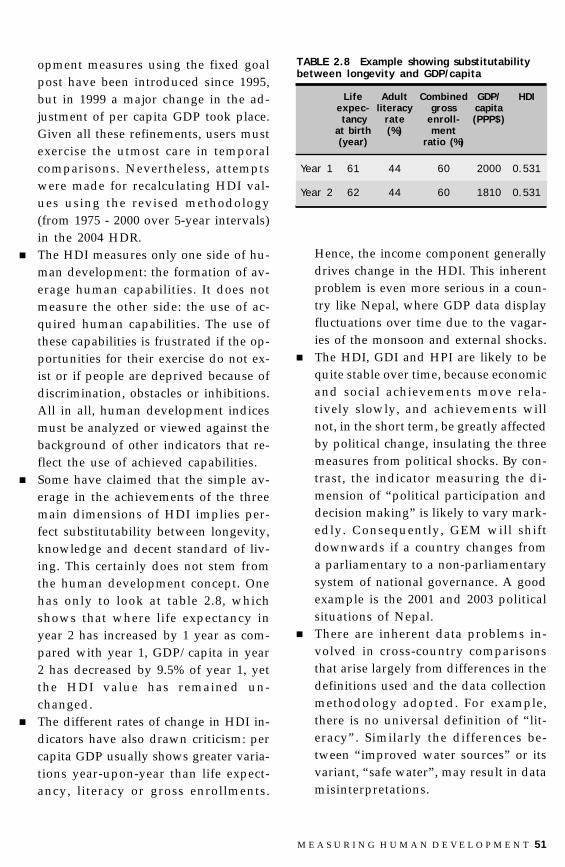
M E A S U R I N G H U M A N D E V E L O P M E N T 51
opment measures using the fixed goalpost have been introduced since 1995,but in 1999 a major change in the ad-justment of per capita GDP took place.Given all these refinements, users mustexercise the utmost care in temporalcomparisons. Nevertheless, attemptswere made for recalculating HDI val-ues using the revised methodology(from 1975 - 2000 over 5-year intervals)in the 2004 HDR.
" The HDI measures only one side of hu-man development: the formation of av-erage human capabilities. It does notmeasure the other side: the use of ac-quired human capabilities. The use ofthese capabilities is frustrated if the op-portunities for their exercise do not ex-ist or if people are deprived because ofdiscrimination, obstacles or inhibitions.All in all, human development indicesmust be analyzed or viewed against thebackground of other indicators that re-flect the use of achieved capabilities.
" Some have claimed that the simple av-erage in the achievements of the threemain dimensions of HDI implies per-fect substitutability between longevity,knowledge and decent standard of liv-ing. This certainly does not stem fromthe human development concept. Onehas only to look at table 2.8, whichshows that where life expectancy inyear 2 has increased by 1 year as com-pared with year 1, GDP/capita in year2 has decreased by 9.5% of year 1, yetthe HDI value has remained un-changed.
" The different rates of change in HDI in-dicators have also drawn criticism: percapita GDP usually shows greater varia-tions year-upon-year than life expect-ancy, literacy or gross enrollments.
TABLE 2.8 Example showing substitutabilitybetween longevity and GDP/capita
Life Adult Combined GDP/ HDIexpec- literacy gross capita tancy rate enroll- (PPP$)
at birth (%) ment(year) ratio (%)
Year 1 61 44 60 2000 0.531
Year 2 62 44 60 1810 0.531
Hence, the income component generallydrives change in the HDI. This inherentproblem is even more serious in a coun-try like Nepal, where GDP data displayfluctuations over time due to the vagar-ies of the monsoon and external shocks.
" The HDI, GDI and HPI are likely to bequite stable over time, because economicand social achievements move rela-tively slowly, and achievements willnot, in the short term, be greatly affectedby political change, insulating the threemeasures from political shocks. By con-trast, the indicator measuring the di-mension of “political participation anddecision making” is likely to vary mark-edly. Consequently, GEM will shiftdownwards if a country changes froma parliamentary to a non-parliamentarysystem of national governance. A goodexample is the 2001 and 2003 politicalsituations of Nepal.
" There are inherent data problems in-volved in cross-country comparisonsthat arise largely from differences in thedefinitions used and the data collectionmethodology adopted. For example,there is no universal definition of “lit-eracy”. Similarly the differences be-tween “improved water sources” or itsvariant, “safe water”, may result in datamisinterpretations.

52 R E A D I N G S I N H U M A N D E V E L O P M E N T
HUMAN DEVELOPMENTMEASUREMENTPRACTICES IN NEPAL
To date, three Nepal HDRs have been pub-lished: in 1998, 2001 and 2004. The 1998and 2004 Reports provide regional as wellas district level measurements of human de-velopment, while the 2001 Report providesonly regional level measurements. TheNepal Human Development Report 2004has constructed a new human empower-ment index (HEI) using 15 objective indica-tors for measuring three dimensions of em-powerment (social, economic and political)and bringing them together into a compos-ite index (see chapter 10 for its rational, con-cept and measurement, Nepal Human De-velopment Report 2004). The national levelmeasurements of human developmentavailable in these three Reports are pre-sented in table 2.9.
At the outset it is important to note that themeasurements of human development of table2.9 are not comparable over time because ofthe following reasons, among others:" The 1998 Report derived income data
from the 1995/96 Nepal living standardssurvey (NLSS), while the 2001 and 2004Report derived income data from the na-tional accounting system. The per capita
income derived from the sample surveyis lower than that of the national account.Thus, per capita income based on NLSS96 is Rs 7,690, while the nominal percapita GDP for the same year is aroundRs 11,659, 150% higher than the sampleestimate (Chhetry 2004).
" The methodology adopted for incorporat-ing the law of diminishing returns to theper capita GDP adjusted for PPP differsfrom that of the 1998 Report in those of2001 and 2004. A revision of the 1998HDI value by incorporating the prevail-ing methodology results in HDI value of0.403–.078 points higher than the ear-lier one.
" The GEM value is considerably higher inthe 2004 Report than in the 1998 Report,in part because of a change in the indica-tor measuring the dimension of “politi-cal participation and decision-making”.More specifically, the indicator “femaleshare in parliament” used in the 1998Report has been changed to “women’sparticipation in local elections” in the2001 and 2004 Reports, resulting in a sig-nificant increase: from 3.41% in the 1998Report to 19.3% in that of 2001.
It is also important to note that the measure-ments of human development available inthe Nepal Human Development Report arenot comparable with those available in theglobal HDRs due, among other factors, to thefollowing reasons:" The Nepal Human Development Report
has been using the “mean years ofschooling” as one of the indicators inthe measurement of HDI, while UNDPreplaced this indicator by “combinedprimary, secondary and tertiary GER”about a decade ago. No UN agency orinternational organization provides
TABLE 2.9 National level measurements ofhuman development by report
Nepal Human HDI GDI GEM HPIDevelopmentReport
1998 0.325 0.267 0.191 49.7
2001 0.466 0.452 0.385 39.2
2004 0.471 0.452 0.391 39.6
Source: NESAC 1998; UNDP 2002b and 2004b.
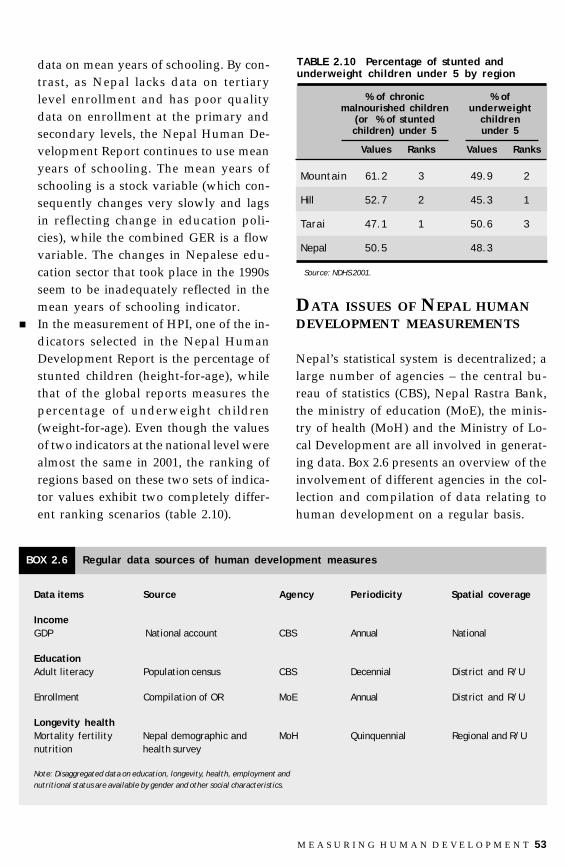
M E A S U R I N G H U M A N D E V E L O P M E N T 53
data on mean years of schooling. By con-trast, as Nepal lacks data on tertiarylevel enrollment and has poor qualitydata on enrollment at the primary andsecondary levels, the Nepal Human De-velopment Report continues to use meanyears of schooling. The mean years ofschooling is a stock variable (which con-sequently changes very slowly and lagsin reflecting change in education poli-cies), while the combined GER is a flowvariable. The changes in Nepalese edu-cation sector that took place in the 1990sseem to be inadequately reflected in themean years of schooling indicator.
" In the measurement of HPI, one of the in-dicators selected in the Nepal HumanDevelopment Report is the percentage ofstunted children (height-for-age), whilethat of the global reports measures thepercentage of underweight children(weight-for-age). Even though the valuesof two indicators at the national level werealmost the same in 2001, the ranking ofregions based on these two sets of indica-tor values exhibit two completely differ-ent ranking scenarios (table 2.10).
DATA ISSUES OF NEPAL HUMANDEVELOPMENT MEASUREMENTS
Nepal’s statistical system is decentralized; alarge number of agencies – the central bu-reau of statistics (CBS), Nepal Rastra Bank,the ministry of education (MoE), the minis-try of health (MoH) and the Ministry of Lo-cal Development are all involved in generat-ing data. Box 2.6 presents an overview of theinvolvement of different agencies in the col-lection and compilation of data relating tohuman development on a regular basis.
TABLE 2.10 Percentage of stunted andunderweight children under 5 by region
% of chronic % ofmalnourished children underweight
(or % of stunted childrenchildren) under 5 under 5
Values Ranks Values Ranks
Mountain 61.2 3 49.9 2
Hill 52.7 2 45.3 1
Tarai 47.1 1 50.6 3
Nepal 50.5 48.3
Source: NDHS 2001.
Data items Source Agency Periodicity Spatial coverage
IncomeGDP National account CBS Annual National
EducationAdult literacy Population census CBS Decennial District and R/U
Enrollment Compilation of OR MoE Annual District and R/U
Longevity healthMortality fertility Nepal demographic and MoH Quinquennial Regional and R/Unutrition health survey
Note: Disaggregated data on education, longevity, health, employment andnutritional status are available by gender and other social characteristics.
BOX 2.6 Regular data sources of human development measures

54 R E A D I N G S I N H U M A N D E V E L O P M E N T
These agencies have been collecting and com-piling data using various methods – census,survey, and the compilation of official records(OR). Some data are available every ten years,some every five years and some each year.Some are available at district level, others onlyat the regional level and some only at thenational level. In addition, enrollment dataare available only for the primary and sec-ondary levels of education, not for institu-tions of higher learning.
In deriving human development measure-ments, data from other sources are also used:comprehensive household surveys – con-ducted, however, at irregular intervals – somebeing the between census household informa-tion, monitoring and evaluation system, theNLSS and the Nepal labour force survey. Re-sults of the Election Commission are also used.
A careful examination of the data availabil-ity and the data needs for Nepal Human De-velopment Report clearly demonstrates thatwide gaps exist. For example, the districtlevel literacy data are available through thecensus once every ten years, but their need isfelt at shorter intervals, as is the data on lon-gevity. The malnutrition data are availableonly at the regional level every five years, butits need is felt at district level. The data onincome variables are available only at thenational level (the GDP series, for example)or at the regional level (for example, NLSSdata, which are reliable only at the regionallevel), but their need is felt at the district level.Because of such persistent data gaps, theNepal Human Development Report prepa-ration is bound to use some sorts of estima-tion methods, which often depend upon in-formation available from a weak database.Some of these methods are well-documented(see, for example, UNDP 2002b).
ANALYSING HUMAN DEVELOPMENTMEASUREMENTS IN NEPAL
Analysis of human development usuallytakes place through two perspectives – tem-poral and cross-sectional. For both, one canuse two kinds of measurements – actual val-ues and ranking values. In planning andpolicy formulation processes or for advocacypurposes, one must also bear in mind thatthe pace of human development in Nepalmanifests significant disparities across vari-ous population groups that arise largely fromregional, gender, caste/ethnic and rural-ur-ban diversity in" access to resources, market, health and
education institutions" infrastructure development, and" other social factors.
These disparities – common to virtually allcountries, including the industrializedstates (with the exception of caste) – becomecollectively manifested as spatial or socialinequality.
Cross-sectional analysisRegional disparities are immense in Nepal(table 2.11). The measurements of HDI ofthe eastern, central and western develop-ment regions (region A) vary around 0.49,while those of mid-western and far west-ern development regions (group B) fluctu-ate around 0.40. Comparable disparitiesalso exist in measuring GDI and HPI. Thedisparity is even worse across the ecologi-cal regions.
District level disparities: The HDI, GDI andGEM are less than 0.4 in 15, 25 and 56 dis-tricts, while the measurements are greaterthan 0.5 in 16, 12, and 1 districts.
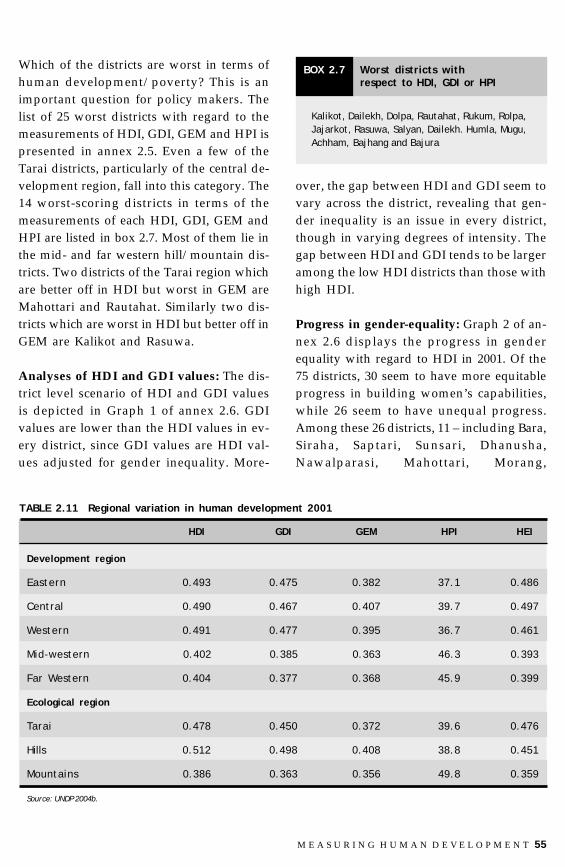
M E A S U R I N G H U M A N D E V E L O P M E N T 55
Which of the districts are worst in terms ofhuman development/poverty? This is animportant question for policy makers. Thelist of 25 worst districts with regard to themeasurements of HDI, GDI, GEM and HPI ispresented in annex 2.5. Even a few of theTarai districts, particularly of the central de-velopment region, fall into this category. The14 worst-scoring districts in terms of themeasurements of each HDI, GDI, GEM andHPI are listed in box 2.7. Most of them lie inthe mid- and far western hill/mountain dis-tricts. Two districts of the Tarai region whichare better off in HDI but worst in GEM areMahottari and Rautahat. Similarly two dis-tricts which are worst in HDI but better off inGEM are Kalikot and Rasuwa.
Analyses of HDI and GDI values: The dis-trict level scenario of HDI and GDI valuesis depicted in Graph 1 of annex 2.6. GDIvalues are lower than the HDI values in ev-ery district, since GDI values are HDI val-ues adjusted for gender inequality. More-
over, the gap between HDI and GDI seem tovary across the district, revealing that gen-der inequality is an issue in every district,though in varying degrees of intensity. Thegap between HDI and GDI tends to be largeramong the low HDI districts than those withhigh HDI.
Progress in gender-equality: Graph 2 of an-nex 2.6 displays the progress in genderequality with regard to HDI in 2001. Of the75 districts, 30 seem to have more equitableprogress in building women’s capabilities,while 26 seem to have unequal progress.Among these 26 districts, 11 – including Bara,Siraha, Saptari, Sunsari, Dhanusha,Nawalparasi, Mahottari, Morang,
TABLE 2.11 Regional variation in human development 2001
HDI GDI GEM HPI HEI
Development region
Eastern 0.493 0.475 0.382 37.1 0.486
Central 0.490 0.467 0.407 39.7 0.497
Western 0.491 0.477 0.395 36.7 0.461
Mid-western 0.402 0.385 0.363 46.3 0.393
Far Western 0.404 0.377 0.368 45.9 0.399
Ecological region
Tarai 0.478 0.450 0.372 39.6 0.476
Hills 0.512 0.498 0.408 38.8 0.451
Mountains 0.386 0.363 0.356 49.8 0.359
Source: UNDP 2004b.
BOX 2.7 Worst districts withrespect to HDI, GDI or HPI
Kalikot, Dailekh, Dolpa, Rautahat, Rukum, Rolpa,Jajarkot, Rasuwa, Salyan, Dailekh. Humla, Mugu,Achham, Bajhang and Bajura

56 R E A D I N G S I N H U M A N D E V E L O P M E N T
TABLE 2.12 Regional ranking patterns by year and human development measure
1996 2000 2001
HDI GDI GEM HPI HDI GDI GEM HPI HDI GDI GEM HPI
Ecological region
Tarai 2 1 2 1 2 2 2 2 2 2 2 2
Hills 1 2 1 2 1 1 1 1 1 1 1 1
Mountains 3 3 3 3 3 3 3 3 3 3 3 3
Development region
Eastern 2 2 3 1 2 2 3 3 1 2 3 2
Central 3 3 1 3 1 1 1 2 3 3 1 3
Western 1 1 2 2 3 3 2 1 2 1 2 1
Mid-western 5 4 4 5 4 4 5 4 5 4 5 5
Far Western 4 5 5 4 5 5 4 5 4 5 4 4
BOX 2.8 Districts with worsening HDI, GDIrankings between 1996 and 2001
! An overwhelming majority of Tarai districtsworsened their HDI as well as GDI ranks.
! The five districts showing the most steeplydeclining HDI are Saptari, Siraha, Sarlahi,Mahottari and Parsa.
! The five districts showing the steeply decliningGDI are Saptari, Siraha, Taplejung, Sarlahi andMahottari.
Kapilbastu, Sarlahi and Kanchanpur – arein the Tarai. These results suggest that oneof the major issues in the Tarai is unequalprogress in building women’s capabilitiescompared to men.
Temporal analysisAlthough a direct comparison of the national,regional or district level measurements ofhuman development over time is not possible,as we have noted earlier, the regional and
district level human development ranks arecomparable over time, because a comparisonof rank values is less problematic than thecomparison of actual values. Such compari-sons reveal valuable information aboutchanges over time at the district or regionallevel, as we can tentatively conclude fromexamining human development patterns in75 districts in Graphs 3 and 4 of annex 2.7,which plot HDI and GDI rankings for 1996and 2001. As box 2.8 shows, the Tarai dis-tricts’ worsening situation in respect of bothindices appears to be a serious issue.
Regional level changes in ranking patternsfor each human development measure for thethree years 1996, 2000 and 2001 are summa-rized in table 2.12. Given some consistentpatterns, one can derive the following policyimplications:" First, it is very clear that the human de-
velopment outcomes are worse in theTarai region than in the hills, even thoughthe Tarai has comparative advantages in

M E A S U R I N G H U M A N D E V E L O P M E N T 57
terms of infrastructure development,farmland availability and market access.This is a serious issue and warrants im-mediate attention.
" Second, the mid-western and far westerndevelopment regions have continued todisplay worse human development out-comes than the three other developmentregions. By contrast, the contiguous west-
ern development region manifests thebest human development outcomes. Thecomparison warrants in-depth analysis.
" Third, the Central development regionwith greater comparative advantages overthe western development region in termsof it concentration of economic and po-litical power has failed to produce im-proved human development outcomes.

58 R E A D I N G S I N H U M A N D E V E L O P M E N T
ANNEX 2.1TECHNICAL NOTESON BASIC INDICATORS
Life expectancy at birthLife expectancy at birth is defined as the av-erage number of years a new born baby isexpected to live if he/she is exposed to theprevailing pattern of age specific death ratesthroughout the life. It is measured in terms ofthe number of years, and is estimated fromthe population census or demographicsample survey data.
Adult literacy rateAdult literacy rate is defined as the ratio ofthe literate population of 15 years and aboveto the population of the same age group. It ismeasured in terms of percentage, and is esti-mated from the population census or house-hold survey data.
Per capita incomePer capita income is defined as the ratio of thetotal income to the total population. It is mea-sured in terms of the country’s currency, andis estimated from the household income sur-vey data. It is a common practice to approxi-mate per capita income by per capita GDP orper capita GNP, whose main data source isthe national account system. GDP is the totalfor final use of output of goods and servicesproduced by an economy, by both residentsand non-residents, regardless of the alloca-tion to domestic and foreign claims. It doesnot include deductions on depreciation of
physical capita or depletion and degradationof natural resources. The GDP divided bypopulation is per capita GDP. It is importantto note that GDP is not only the personal in-comes of individuals but also the provision ofpublic services (such as public health care)paid out of the aggregate national income(Anand and Sen 2003a). An implication ofthis result is as follows: per capita GDP is largerthan the sample estimate of per capita income.
The use of national account system insteadof household income survey as the mainsource of income has several advantages.First, per GDP/GNP data are availabletimely, usually annually. Second, each coun-try follows almost the same methodology forestimating GDP/GNP.
Purchasing powerparity adjustmentThe per capita GDP/GNP is not easily com-parable across countries, since differentcountries use different currencies. A simpleway out from this problem is to convert eachcountry’s per capita GDP/GNP into a singlecurrency, like US dollar, using country’s pre-vailing exchange rate. But there is still oneproblem, because one could not buy as muchservices or commodities as from one dollarin Europe than in Asia. This is mainly due tovariability in purchasing power across thecountries. Consequently, the country level percapita GDP/GNP must be adjusted for pur-chasing power, so that the adjusted figuresare comparable. The comparable income ob-tained through such adjustment is knownas PPP income and it is in terms of US dollar.
ANNEXES

M E A S U R I N G H U M A N D E V E L O P M E N T 59
Law of diminishingreturns adjustmentThis adjustment is needed for incorporatingthe law of diminishing return to income inmeasuring the utility of resources. For suchadjustment, the original adjusted per capitaGDP values in PPP US$ (for convenience re-ferred to as x values) are transformed intonew values (for convenience referred to as yvalues) through a mathematical rule desig-nated by y = u(x). As for example, in the mea-surement of HDI in 1990 the following ruleis adopted:
y =
�
���
>
<
4861XIflog(4861)
4861XIflog(x)(2.9)
A new method, called “income discounting”,was adopted in 1991 and continued till 1998.This method implicitly uses the Atkinson’sconstant elasticity income utility function(Atkinson 1970) described as below.
y =
��
���
�
�
�� �
�
1�iflog(x)
1�1
�1X
if
(2.10)
The modification adopted in 1991 is simplyto let the value of ε rise slowly as incomerises. For this purpose, the full range of in-come was divided into multiples of the pov-erty line x*. Thus, most countries are between0 and x*, some between x* and 2x*, even fewerbetween 2x* and 3x* so on. Now for all coun-tries for which x < x*, that is, poor countries eis set equal to 0. There are no diminishingreturns here. For income between x* and 2x*,
ε is set equal to 1/2. For income between 2x*
and 3x*, ε is set at 2/3. In general, if αx* < × <(α +1)x*, then ε is set equal to α/(α + 1).
The income-discounting method was cri-tiqued by many scholars and advocated forthe method of logarithmic transformation.Consequently, the transformation y = log(x)is adopted in 1999, and continues till now.
Logarithmic transformationThe notion of logarithm is attached with thatof logarithmic transformation. The logarithmof a positive number x is a number, denotedby log(x), which when raised as a power of10 yields the number x. By definition, log(1)= 0, log(10) = 1, log (100) = 2, log (1000) = 3,and so on.
This transformation primarily scale downsthe original income data (x) into transformeddata (y) in such a way that the rate of changein y with respect to x decreases as x increases.The impact of this transformation can be seenin figure 2.1, which is concave in nature, thatis, the curve rises fast for low level of incomesand slowly for high level of incomes, show-ing the diminishing marginal return.
Methodology forestimating earned incomeA methodology for estimating female andmale earned income (PPP US $) adopted byHDR is described here. For this purpose thefollowing variables are introduced. Let Wf,Wm and W be the average female, male andoverall wage of a country, respectively, andlet Lf, Lm and L be the female, male and totaleconomically active population (EAP) aged15 and above of the country, respectively.

60 R E A D I N G S I N H U M A N D E V E L O P M E N T
Then, in this notation W × L yields the totalwage bill and its gender decomposition formis W × L = Wf × Lf + Wm × Lm. Then, in thisnotation, female share of wage bill
= Total wage bill
Female wage bill – Which algebraically
is expressed as
fLfW
fWfL mW mL���
�
��
��
fW
mW fL
fW
mW fL mL
��
��
fW
mW LfL
fW
mW LfL
LmL
(2.11)
Usually Wf, and Wm would be unknown, and
the ratio fW
mW would assumed to be 75%. An
assumption has to be made that the female
share of wage bill is equal to the female shareof GDP. Under this assumption,
Estimated female earned income
= Total females
Total GDP female share of wage bill�
Estimated male earned income
= Total males
G – G female share of wage bill�
FIGURE 1 Graph of log transformation
Income
150001000050000
4.34.3
4.1
3.9
3.7
3.5
3.3
3.1
2.9
2.7
2.5
log
(incom
e)
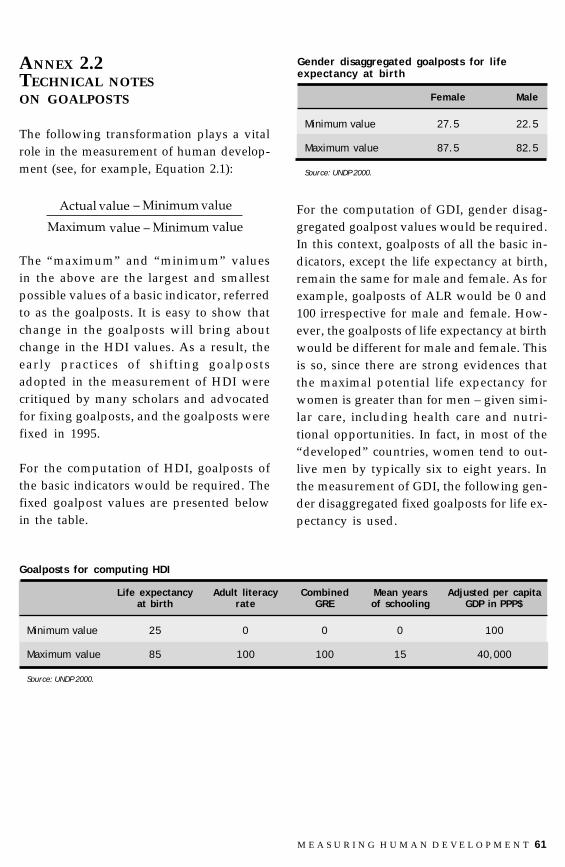
M E A S U R I N G H U M A N D E V E L O P M E N T 61
ANNEX 2.2TECHNICAL NOTESON GOALPOSTS
The following transformation plays a vitalrole in the measurement of human develop-ment (see, for example, Equation 2.1):
valueMinimum–valueMaximum
valueMinimum–valueActual
The “maximum” and “minimum” valuesin the above are the largest and smallestpossible values of a basic indicator, referredto as the goalposts. It is easy to show thatchange in the goalposts will bring aboutchange in the HDI values. As a result, theearly practices of shifting goalpostsadopted in the measurement of HDI werecritiqued by many scholars and advocatedfor fixing goalposts, and the goalposts werefixed in 1995.
For the computation of HDI, goalposts ofthe basic indicators would be required. Thefixed goalpost values are presented belowin the table.
For the computation of GDI, gender disag-gregated goalpost values would be required.In this context, goalposts of all the basic in-dicators, except the life expectancy at birth,remain the same for male and female. As forexample, goalposts of ALR would be 0 and100 irrespective for male and female. How-ever, the goalposts of life expectancy at birthwould be different for male and female. Thisis so, since there are strong evidences thatthe maximal potential life expectancy forwomen is greater than for men – given simi-lar care, including health care and nutri-tional opportunities. In fact, in most of the“developed” countries, women tend to out-live men by typically six to eight years. Inthe measurement of GDI, the following gen-der disaggregated fixed goalposts for life ex-pectancy is used.
Goalposts for computing HDI
Life expectancy Adult literacy Combined Mean years Adjusted per capitaat birth rate GRE of schooling GDP in PPP$
Minimum value 25 0 0 0 100
Maximum value 85 100 100 15 40,000
Source: UNDP 2000.
Gender disaggregated goalposts for lifeexpectancy at birth
Female Male
Minimum value 27.5 22.5
Maximum value 87.5 82.5
Source: UNDP 2000.

62 R E A D I N G S I N H U M A N D E V E L O P M E N T
ANNEX 2.3TECHNICAL NOTES ONEQUALLY DISTRIBUTEDEQUIVALENT ACHIEVEMENT
This part of the materials is drawn fromAnand and Sen (2003b). The notion of“equally distributed equivalent” achievementbetween women and men plays an importantrole in developing gender-equality sensitiveindicators. To understand this notion, let Xf
and Xm refer to the social achievements madeby female and male, respectively, which invector notation is written as (Xf , Xm). If nf andnm are the number of females and males in thepopulation, respectively, then the overall ormean achievement X is given by
X = fX mX�fn mn
fn � mn = pf Xf + pm Xm,
where pf = fn
fn � mn = proportion of female
and pm = (1 – pf ) = proportion of male
The equally distributed equivalent achieve-ment Xede is defined to be the level of achieve-ment which if attained equally by womenand men, as (Xede , Xede), would be judged to beexactly as valuable socially as the actuallyobserved achievement (Xf , Xm). For given ε,Xede is thus defined through the equation
mfedeede XXXX ���fn 1 � �mn fn 1 � �
mn1 � �1 � �
or, Xede = � � 1
mmffXpXp �1 � � 1 � � 1 � � (2.12)
Equally
dis
trib
ute
dachie
vem
ents
1512930 6
Values of Epsilon
36
38
40
44
42
50
48
52
46
The value ε is the size of aversion to genderinequality or size of penalty for gender in-equality. The larger the value, the moreheavily a society is penalized for having in-equalities. The nature of the graph of Xede andε is displayed in the figure for Xf = 35.4, Xm =65.8, pf = 0.502 and pm = 0.498. The nature ofthe graph is convex and decreasing.
In practice the choice of ε depends upon thesociety’s aversion to gender inequality. If asociety has no aversion to inequality then ε= 0, in which case Xede = pfXf + pmXm =weighted arithmetic mean. On the contrary,if a society has very high aversion to inequal-ity then ε = ∞, in which case Xede = min{Xf,Xm}. In the measurement of GDI, ε is assumed
to be 2, in which case Xede =
m
m
f
f
X
p
X
p1
� =
weighted harmonic mean. When ε = 1, it can
be showed that Xede = mf pm
pf XX � , weighted
geometric mean.

M E A S U R I N G H U M A N D E V E L O P M E N T 63
ANNEX 2.4TECHNICAL NOTES ONAGGREGATION OFDEPRIVATION INDICES
This part of the material is drawn fromAnand and Sen (2003a). A general formulafor constructing human poverty index P(α)based on three distinct poverty sub-indicesP1, P2 and P3 is discussed in Anand and Sen(2003a). In particular, the formula for P(α)simplifies to the following form
P(α) = 321 )PP(P31
�
��������������������������������������������������������������������������������������������
1
�������������������������������������������������������
(2.13)
where α is an integer greater than or equal to1. Note that P(α) is an average of order α ofthe three sub-indices P1, P2 and P3.
It is important to note that P(α) lies betweenmin{P1, P2 , P3} and max{P1, P2 , P3}. As α getslarger and larger, P(α) gets closer and closerto max{P1, P2 , P3}. The nature of the graph ofP(α) and α is displayed in the figure for P1 =17.74, P2 = 56.0 and P3 = 35.49, where thegraph is concave and increasing.
The elasticity of substitution between any two
of P1, P2 and P3 is constant and equal to 1
���� 1.
As α increases from 1, the elasticity of substi-tution decreases from infinity to 0. If wechoose α = 1 (the case of perfect substitut-ability), the aggregate index P(α) is the simplearithmetic mean of three sub-indices P1, P2
and P3. As α tends to infinity, the substitut-ability becomes zero, and the aggregate in-
Values of alpha
Aggre
gate
dvalu
es
251510 2050
45
37
39
41
43
35
47
49
51
55
53
dex tends to maximum of the three sub-indi-ces. With α = 1 (the case of perfect substitut-ability), the impact on P(α) for a unit increase(or decrease) of any sun-index is the same,irrespective of the level of deprivation in dif-ferent dimensions. This contradicts the usualassumption that as the extent of deprivationin any dimension increases (given the oth-ers) the weight on further additions to depri-vation in that dimension should also in-crease. For this we need α > 1. The value of αalso influences, correspondingly, the relativeweight to be placed on deprivation in threedifferent dimensions.
For calculating HPI, α = 3 has been chosen.This gives an elasticity of substitution of0.5 and places greater weight on those di-mensions in which deprivation is larger.There is an inescapable arbitrariness in thechoice of α. The right way to deal with theissue is to explain clearly what is beingassumed, as has been attempted here, sothat public criticism of this assumption ispossible.

64 R E A D I N G S I N H U M A N D E V E L O P M E N T
ANNEX 2.5LIST OF TWENTY FIVEWORST DISTRICTS, 2001
Low HDI districts Low GDI districts Low GEM districts High HPI districts
District HDI District GDI District GEM District HPI
Mugu 0.304 Mugu 0.263 Pyuthan 0.293 Humla 63.8
Bajura 0.310 Kalikot 0.274 Mahottari 0.295 Dolpa 61.9
Kalikot 0.322 Bajura 0.277 Dadeldhura 0.296 Mugu 61.1
Bajhang 0.331 Bajhang 0.289 Dailekh 0.300 Bajhang 59.9
Jajarkot 0.343 Achham 0.314 Darchula 0.303 Achham 59.2
Jumla 0.348 Jumla 0.316 Mugu 0.304 Kalikot 58.9
Achham 0.350 Jajarkot 0.328 Bajura 0.304 Jajarkot 57.2
Humla 0.367 Humla 0.337 Doti 0.306 Jumla 56.8
Dolpa 0.371 Dolpa 0.341 Rolpa 0.306 Bajura 56.4
Dailekh 0.381 Rolpa 0.357 Humla 0.308 Rasuwa 54.5
Rolpa 0.384 Dailekh 0.358 Ramechap 0.311 Rukum 53.7
Rukum 0.386 Baitadi 0.361 Achham 0.314 Doti 53.4
Baitadi 0.391 Rukum 0.364 Baitadi 0.314 Ramechhap 53.4
Rasuwa 0.394 Doti 0.368 Khotang 0.314 Rolpa 53.1
Salyan 0.399 Mahottari 0.368 Bajhang 0.323 Dailekh 52.5
Doti 0.402 Rasuwa 0.376 Saptari 0.323 Sindhupalchok 51.1
Mahottari 0.407 Sarlahi 0.377 Dhanusha 0.324 Rautahat 51.0
Sarlahi 0.408 Salyan 0.382 Bara 0.326 Mahottari 50.6
Dang 0.409 Rautahat 0.384 Siraha 0.327 Sarlahi 49.8
Rautahat 0.409 Dang 0.388 Rautahat 0.331 Baitadi 48.7
Dhading 0.410 Siraha 0.388 Sindhupalchok 0.331 Kapilbastu 48.5
Sindhupalchok 0.414 Dhading 0.394 Rukum 0.337 Sindhuli 48.3
Pyuthan 0.416 Darchula 0.394 Salyan 0.338 Salyan 48.2
Darchula 0.424 Dadeldhura 0.396 Dolakha 0.344 Pyuthan 47.9
Siraha 0.427 Pyuthan 0.399 Kanchanpur 0.344 Dhading 47.7
Data Source: UNDP 2004b.Note: Bold districts are common to all the four measures.

M E A S U R I N G H U M A N D E V E L O P M E N T 65
ANNEX 2.6CROSS-SECTIONAL ANALYSIS
HDI GDI
Gap (HDI-GDI) tends to wider among the lowHDI districts than among the higher ones
District
Valu
es
0.25
0.40
0.35
0.50
0.45
0.30
0.55
0.60
0.65
FIGURE 1 District level comparison of HDI and GDI values, 2001
Source: Based on data of UNDP 2004b.
26 dots are above the line, revealing unequal progressin building women’s capabilities in these districts
Ranking scheme1 = best, 75 = worst
30 districts are below the line, revealing more equitableprogress in building women’s capabilities in these districts
60
65
70
55
50
45
75
40
35
30
25
20
15
10
5
0
0 5 10 15 20 25 30 35 40 45 50 55 60 65 70 75
HDI rank
GD
Ira
nk
FIGURE 2 Plot of GDI ranks against HDI ranks, 2001
Source: Based on data of UNDP 2004b.

66 R E A D I N G S I N H U M A N D E V E L O P M E N T
ANNEX 2.7TEMPORAL ANALYSIS
34 districts are below the line:rank-improving districts
36 dots are above the line:rank-worsening districts
0 5 10 15 20 25 30 35 40 45 50 55 60 65 70 75
GDI ranks of 1996
60
65
70
55
50
45
75
40
35
30
25
20
15
10
5
0
GD
Ira
nks
of
2001
FIGURE 4 Relationship between district level GDI ranks of 1996 and 2001
Source: Based on data of NESAC 1998 and UNDP 2004b.
32 dots are above the line:rank-worsening districts
31 districts are below the line:rank-improving districts
60
45
30
15
0
75
0 5 10 15 20 25 30 35 40 45 50 55 60 65 70 75
HDI rank of 1996
HD
Ira
nk
of
2001
FIGURE 3 Relationship between district level HDI ranks of 1996 and 2001
Source: Based on data of NESAC 1998 and UNDP 2004b.

M E A S U R I N G H U M A N D E V E L O P M E N T 67
ANNEX 2.8EXERCISES
2.1 Regional and national level depriva-tions in longevity, literacy and a decentstandard of living of Nepal, 2001, aresummarized in the table below. Com-pute the regional and national level HPI,and rank the regions.
2.2 Regional and national level participa-tion rates of female and male in locallevel election, in professional and ad-ministrative jobs of Nepal, 2001, are pre-sented in the table below. Using the in-formation available in this table and theinformation available on adjusted percapita income (Exercise 2.5), computethe regional and national level GEM,and rank the regions.
2.3 The reported data on regional and na-tional population and GDP values (atcurrent prices) in the 2004 Nepal Hu-man Development Report are presentedin the following table. Additional dataon per capita GDP are also presentedfor your reference purpose.
" Divide each GDP value by the corre-sponding population size and comparethe results with per capita GDP in Rs.
" Divide each result obtained in (a) by 73.6and compare the results with per capitaGDP in US$.
" Multiply each result obtained in (b) by5.44 and compare the results with percapita GDP in PPP US$
2.4 Gender-specific regional and nationallevel socioeconomic outcomes of Nepal,2001, are presented in the table below.Compute regional and national levelGDI. Assign ranks for the five regions.
2.5 The reported regional and national leveldata on population and adjusted percapita income indices by gender in the2004 Nepal Human Development Re-port are summarized below in the table.These indices are constructed from theactual estimated values of gender spe-cific per capita earned incomes. The re-lationship between Y = an adjusted percapita income value and X = an esti-mated per capita earned income valuein PPP US$ is follows: X = 10Y´[log(40000) –
log(100)] + log(100).
" For each given Y value in the table find Xvalue using the equation described above.
" Compute the income generated by fe-males (female population ́ estimated percapita earned income of female) at re-
Region Population GDP in Per capita Per capita Per capitamillion of Rs GDP in Rs GDP in US$ GDP in PPP US$
Eastern 5,344,476 86,936 16,266 221 1,202
Central 8,031,629 173,561 21,610 293 1,597
Western 4,571,013 77,522 16,960 230 1,254
Mid-western 3,012,975 40,271 13,366 181 988
Far Western 2,191,330 31,997 14,602 198 1,079
Nepal 23,151,423 410,287 17,722 240 1,310
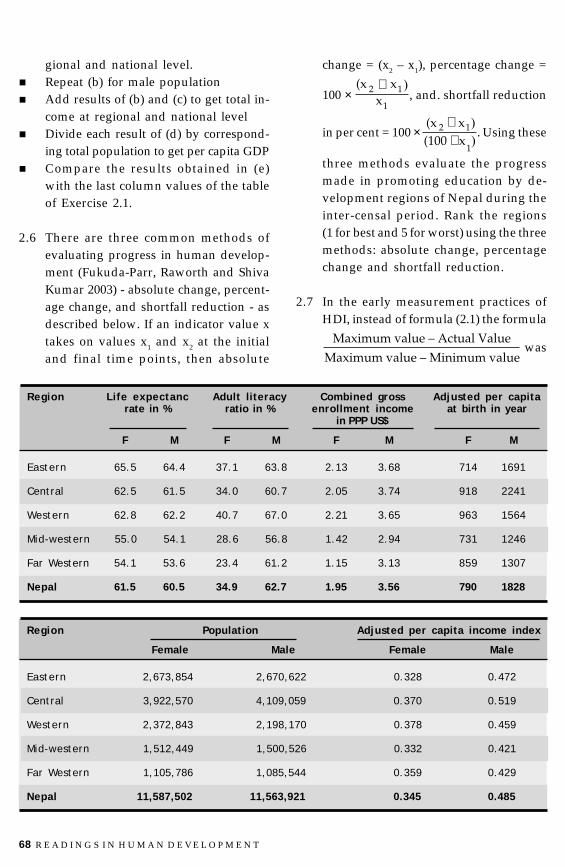
68 R E A D I N G S I N H U M A N D E V E L O P M E N T
Region Life expectanc Adult literacy Combined gross Adjusted per capitarate in % ratio in % enrollment income at birth in year
in PPP US$
F M F M F M F M
Eastern 65.5 64.4 37.1 63.8 2.13 3.68 714 1691
Central 62.5 61.5 34.0 60.7 2.05 3.74 918 2241
Western 62.8 62.2 40.7 67.0 2.21 3.65 963 1564
Mid-western 55.0 54.1 28.6 56.8 1.42 2.94 731 1246
Far Western 54.1 53.6 23.4 61.2 1.15 3.13 859 1307
Nepal 61.5 60.5 34.9 62.7 1.95 3.56 790 1828
Region Population Adjusted per capita income index
Female Male Female Male
Eastern 2,673,854 2,670,622 0.328 0.472
Central 3,922,570 4,109,059 0.370 0.519
Western 2,372,843 2,198,170 0.378 0.459
Mid-western 1,512,449 1,500,526 0.332 0.421
Far Western 1,105,786 1,085,544 0.359 0.429
Nepal 11,587,502 11,563,921 0.345 0.485
gional and national level." Repeat (b) for male population" Add results of (b) and (c) to get total in-
come at regional and national level" Divide each result of (d) by correspond-
ing total population to get per capita GDP" Compare the results obtained in (e)
with the last column values of the tableof Exercise 2.1.
2.6 There are three common methods ofevaluating progress in human develop-ment (Fukuda-Parr, Raworth and ShivaKumar 2003) - absolute change, percent-age change, and shortfall reduction - asdescribed below. If an indicator value xtakes on values x1 and x2 at the initialand final time points, then absolute
change = (x2 – x1), percentage change =
100 × 12
1x)x(x �, and. shortfall reduction
in per cent = 100 × )x(x 12 �)(100 x
1� . Using these
three methods evaluate the progressmade in promoting education by de-velopment regions of Nepal during theinter-censal period. Rank the regions(1 for best and 5 for worst) using the threemethods: absolute change, percentagechange and shortfall reduction.
2.7 In the early measurement practices ofHDI, instead of formula (2.1) the formula
Maximum value – Minimum value
Maximum value – Actual Value was

M E A S U R I N G H U M A N D E V E L O P M E N T 69
Region % share of participation % share of participation % share of participationin local level election in professional job in administrative job
F M F M F M
Eastern 19.20 80.80 16.44 83.56 13.22 86.78
Central 19.00 81.00 20.47 79.53 13.51 86.49
Western 20.30 79.70 19.92 80.08 12.57 87.43
Mid-western 19.20 80.80 16.65 83.35 9.50 90.50
Far Western 18.60 81.40 19.30 80.70 9.44 90.56
Nepal 19.33 80.67 18.75 81.25 12.71 87.29
Region % population with Adult illiteracy % of chronic % populationLE less than rate (%) malnourished children without access
40 years among under 5 to safe water
Eastern 10.50 49.7 44.6 17.15
Central 16.46 52.3 52.3 15.84
Western 15.26 47.1 50.3 18.52
Mid-western 26.08 57.5 53.9 35.66
Far Western 21.71 58.3 53.7 32.89
Nepal 17.74 51.4 50.5 20.48
Development Literacy rate Literacy rateRegion (6+) of 1991 (6+) of 2001
Eastern 44.3 55.7
Central 38.6 52.9
Western 44.0 59.3
Mid-western 31.8 49.4
Far Western 32.2 48.7
tion index of LE + deprivation index ofEA + deprivation index in GDP). Showthat H = 1 – D, where H is HDI.
2.8 One of the objectives of calculating hu-man development measures in a coun-try is to monitor and evaluate withincountry inter-regional variations in hu-man development. In this context, do youthink that is it necessary to make PPPadjustment in per capita income? Dis-cuss this issue in detail.
2.9 Regional and national level socioeco-nomic outcomes of Nepal, 2001, are pre-sented in the table below. Compute re-gional and national level HDI. Assignranks for the five regions according to the
used to get normalized scores. This ap-proach of normalization is known asdeprivation or shortfall approach(Anand and Sen 2003c). Using thisshortfall approach human deprivation
index D is computed by D = 31 (depriva-

70 R E A D I N G S I N H U M A N D E V E L O P M E N T
rule: 1 for the best region, 2 for the secondbest, and, finally, 5 for the worst region.
2.10 The gender specific literacy rates (6+)of Nepal by development regions in2001 are presented in the followingtable. Using the formula
� � 1
mmffXpXp �1 � � 1 � � 1 � � compute EDE
achievement for e = 0, 1 and 2.
Region Life expectancy Adult literacy Combined gross Adjusted per capitaat birth in year rate in % enrollment ratio in % income in PPP US$
Eastern 64.90 50.3 2.90 1202
Central 62.51 47.7 2.89 1597
Western 63.00 52.9 2.93 1254
Mid-western 54.50 42.5 2.18 988
Far Western 54.30 41.7 2.14 1079
Nepal 60.98 48.6 2.75 1310
Development Xm X f pm
region
Eastern 66.5 45.0 0.50
Central 63.7 41.6 0.51
Western 70.4 49.3 0.47
Mid-western 61.1 37.7 0.50
Far Western 64.7 33.2 0.49
71I N C L U S I V E H U M A N
D E V E L O P M E N T I N N E P A L
INTRODUCTION
Social exclusion occurs when a group isbarred “from rights or entitlements as a citi-zen, where rights include the social right toa certain standard of living and to participa-tion in society” (UNDP 1997).
As documented in the Nepal Human Devel-opment Report 2004, exclusion has a dis-tinct regional dimension in Nepal; the con-tinued impoverishment and underdevelop-ment of the mid- and far western develop-ment regions constitutes a glaring manifes-tation of historical geographic exclusionthat has shut every population segment –irrespective of caste, religion and sex – outof mainstream development. From this per-spective, any analysis of disadvantagedgroups that focuses only on women, Dalitsand indigenous people will fail to capturethe true picture of poverty in Nepal. Eachcountry faces unique development problems,those of the industrialized North as well asthe industrializing or largely agrarian South.All are developing in one way or another,particularly in a world characterised by rapidflows of financial capital, labour and infor-mation. GDP, as we have seen in chapter 1,
is no guarantor of equity or the inclusion ofthe poor – and poverty is multi-dimensional;GDP per capita is only one of its components.
Nepal faces an almost unique geographicaldevelopment challenge with significant spa-tial manifestations. A landlocked country of147,181 sq. km., nearly 60% of its land sur-face has an altitude too elevated for humanoccupation, ranging from steep to very steep(exceeding 30 degrees); the level considered“very gentle” amounts to only 13.6%. More-over, roughly a third of Nepalese territorylies above the temperate zone (2,500m) andtherefore has limited agricultural potential,while its sub-tropical zone has rugged to-pography. Given these physical limitations,the country’s 23 million people live in ahighly skewed distribution pattern with amisleading average population density of157.3 persons per sq. km. that varies fromfour in a few mountain districts to over 500in some Tarai districts; 53.9% of the Nepalesenow reside in the lowlands. The highgrowth rate of the Tarai (2.70) and innerTarai (2.55), as compared to the nationalaverage (2.25), derives from migration, acontinuous process of adjustment betweenpopulation and land resources.
CHAPTER 3
Inclusive humandevelopment in Nepal
Harka Gurung

72 R E A D I N G S I N H U M A N D E V E L O P M E N T
The country’s population problems stemfrom rapid growth and a generally low levelof capability. The total number of Nepalesehas doubled since 1971 and the annualgrowth rate of 2001 remains higher thanthat of 1991. This now translates into anincreasing volume of the under-employedand unemployed, compounded by lowskill levels and high levels of illiteracy andmorbidity. The literacy rate in 2001 stoodat 54.1%, with 65.5 for males and 42.8 forfemales. Health services remain poor, witha maternity mortality ratio of 415 per 100,000live births, an under-5 mortality rate of 82per 1,000 live births and a tuberculosis rateof 280 cases per 100,000 persons. A fifth ofthe total population still has no access tosafe water supply.
Nepal’s low human development status isrevealed by figures such as a 59.6-year lifeexpectancy at birth in 2001, with 40.2% ofthe population under the age of 15 and only3.7% over the age of 65 (CBS 2002). In termsof income/consumption, the poorest 10%consumed only 3.2% of available goods and
services in that year and the richest 10% al-most 10 times as much.
Nonetheless, the country has made signifi-cant human development strides. In 1975,Nepal had the lowest HDI value amongSAARC countries for which estimates weremade (table 3.1). Sri Lanka led with a HDIvalue of 0.616. A quarter century later, Nepalhad registered the greatest gain and findsitself squarely in the medium human devel-opment group (UNDP 2004b).
However, yet again, this macro figure masksenormous disparities and a marked rate ofexclusion that call for analyses at the meso(region) and micro (district) levels, as wellas inequality because of social exclusion.
CAUSES OF DISPARITY
Locational constraintsThe country’s immensely varied landscapes,as indicated above, have led to enormous
TABLE 3.1 HDI trend in SAARC countries
HDI Country 1975 1980 1985 1990 1995 2000 Gain HDI Rank*Rank 1975-2000 2002* 20022000 %
84 Maldives ...... ...... 0.629 0.676 0.707 0.743 - 0.752 84
89 Sri Lanka 0.616 0.650 0.676 0.697 0.719 0.741 20.3 0.740 96
124 India 0.407 0.434 0.473 0.511 0.545 0.577 41.8 0.595 127
138 Pakistan 0.345 0.372 0.404 0.442 0.473 0.499 44.6 0,497 142
140 Bhutan ...... ...... ...... ...... ...... 0.494 - 0.536 134
142 Nepal 0.289 0.378 0.370 0.416 0.453 0.490 69.6 0.504 140
145 Bangladesh 0.335 0.353 0.385 0.416 0.445 0.478 42.7 0.509 138
Source: UNDP 2002a; * UNDP 2004.Note: Trend data for HDI is revised in each subsequent human development report.

73I N C L U S I V E H U M A N
D E V E L O P M E N T I N N E P A L
regional economic differences in which themore backward regions have witnessed anout-migration of youth and their better-skilled workers that has impoverished theseareas further.
The 15 regions officially adopted by Nepalin 1971 are based on the combination of threeecological (mountain, hill, Tarai) and fivedevelopment regions (far west, mid-west,western, central and eastern).
The average per capita income for Nepalin 2001 has been estimated at US $ 240(UNDP 2004b). However, wide per capitaincome disparities persist across districtsand regions. In 1996, eight districts hadvery high per capita income as comparedwith 14 others categorized as very low(NESAC 1988), while by 2001, the eightvery high districts remained within thisrange, but those with very low per capitaincome had increased to 21. Indeed, the percapita income of Pyuthan and Kathmandudiffer by a factor of almost 4.6.
Of Nepal’s 75 districts, the majority (46)have per capita income below the nationalaverage. These are found in all elevationzones, two-thirds of which lie in the hills(UNDP 2004b).
THE EXTENT OF EXCLUSION
Nepal’s low human development levelstems not only from the country’s physicalfeatures – locational constraints – but itssteep, entrenched social structure.
The political ideology of Nepal as a Hindustate has remained highly exclusionary. Ithas religious, linguistic and cultural dimen-
sions (UNDP 2004b). While the western con-cept of “race” has the connotation of colour,the Hindu version of untouchability has acomparable bias because impure status de-rives from birth. Other major discriminationsrelate to culture and language, whichmarginalise the ethnic and regional groups.
One must beware of making nation-widegeneralisations in Nepal because of numer-ous levels of complexity created by thecountry’s history over the last century anda half. Together, it is true, spatial diversityand historical antecedents have contributedto enormous social inequality. However,spatial diversity has contributed to thecounty’s cultural riches, while caste dis-crimination has been the foundation of so-cial exclusion. Both factors, however, con-tribute to multiple layers of discrimination.The political, economic, and educational ar-eas examined here in terms of social exclu-sion has perpetuated a high-caste hegemonyin politics. Such a polity marginalises thelow castes and the ethnic groups economi-cally. Since most of their members remainpoor, they have very limited access to edu-cation and become trapped in vicious circleof poverty.
All in all, the hill high castes, though lessthan a third of total population, nonethelessoccupy two-thirds of governance positions(Neupane 2002). Another inequitablyadvantaged group is the Newar, with about6% in population share, but a 13% share ingovernance. By contrast, the Madhesi, 31% ofthe Nepalese population, hold only a 12%share in governance representation. The hillethnic representation is similar: 22% in popu-lation and 8% in governance. The Dalits fareworst with regard to share of population vis-à-vis positions of power.

74 R E A D I N G S I N H U M A N D E V E L O P M E N T
Economic deprivationThe Nepal Living Standard Survey 1995/96is one primary source on the economic sta-tus by caste and ethnicity; its sample focusedon 3,373 households from 15 randomly se-lected districts, but covered only a few widelydistributed social groups. Despite these limi-tations, the NLSS provided some indicativedata used by the Nepal Human Develop-ment Report 1998 (NESAC 1998). But thecomparison of ethnic and caste groups var-ied from eight (proportions below povertyline) for human development status to 15 forpoverty incidence, even though the datasource was the same.
The three human development indicators –per capita income, life expectancy and ALR –influence the HDI of four basic social groupsand several of their sub-groupings. Althoughthe four distinct and three sub-groupings arenot strictly comparable, they exhibit someconsistency of pattern in their human devel-opment status. The Newar lead the rest in lifeexpectancy, per capita income and HDI. TheBrahman rank second in all three indica-tors – except that they outrank the Newar inadult literacy ratio. The Chhetri rank third inadult literacy, income and HDI – but fourthin life expectancy (NESAC 1998).
Tarai castes, which include a wide array ofsocial status, rank third in life expectancy,fourth in income and HDI, and fifth in adultliteracy. Hill ethnics rank fifth in life expect-ancy, income, and HDI but fourth in ALRbecause of their army tradition.
The artisan castes or Dalits rank sixth in lifeexpectancy, adult literacy and HDI, and sev-enth in income. The Muslim group ranks sev-enth in life expectancy, literacy and HDI andsixth in per capita income.
Table 3.2 shows the trends in poverty inci-dence for 7 ethnic/caste groups. Here, too,there is strong evidence of convergence be-tween social hierarchy and poverty level.Decline in poverty incidence between 1996and 2004 is more pronounced among uppercastes and Tharu compared to other ethnicgroups. The aberrations may be attributed tothe small number of households and dis-tricts sampled by NLSS. Dalit (Kami, Damai,Sarki) have the highest proportion below thepoverty line (45.5) (table 3.2).
A recent analysis of the 2001 populationcensus data for poverty mapping reveals thelevel of disparity among social groups inmajor occupational and household charac-teristics (Acharya and others 2004). The up-per caste group constitutes 35.4% of the to-tal EAP aged 10 years and above. Theirdominance is 62.2% in the professional/technical, 58.3% in the legislative/admin-istrative, and 53.6% in the clerical occupa-tions (table 3.3). The Dalit castes, with 11.9%
TABLE 3.2 Trends in poverty incidence byethnicity/caste, 1996 and 2004
Caste/ethnicity Proportion belowpoverty line
1996 2004
1. Newar 19.3 14.0
2. Upper caste 34.1 18.4
3. Yadav 28.7 21.3
4. Dalits 57.8 45.5
5. Muslims 43.7 41.3
6. Hill janajati 48.7 44.0
7. Tharu 53.4 35.4
NEPAL 41.8 30.8
Source: CBS 2005.

75I N C L U S I V E H U M A N
D E V E L O P M E N T I N N E P A L
percent of the total EAP, have an involve-ment of only 1-4% in these kinds of work.The Janajati group, with a 38.7% share inthe EAP, account for above one-third innon-manual fields. The reverse is true in thecase of production labour: 19.1% high caste,20.3% Dalit and 38.1% Janajati.
Household characteristics derived from the2001 census data provide some indicationof living standards by ethnicity and caste.Accordingly, the national average for a puccaor well-built house was 36.6%. It ranged from19.7% for the Dalit to 32.6% for Janajati and52.4% for the high castes (table 3.4), whilehouses with flush toilets varied from a lowfor Dalit (13.3%) to median for Janajati(20.8%) and high for the upper castes(31.9%). Tap water provisions showed asimilar gradation: 43.3% for Dalit, 58.5% forJanajati, and 60.8% for the high castes. Inlighting, more high caste households had
electricity/biogas and more Dalit used kero-sene, with the Janajati between them. A simi-lar pattern prevails in cooking fuel types:more upper caste households used kero-sene/gas, while more Dalit and Janajatihouseholds used wood.
These disparities in amenities that directlyaffect quality of life provide clear evidence ofthe economic advantages of higher castegroups and vice versa. Those of high socialstatus dominate political positions and there-fore have better economic status. This pre-dominance in the political economy is fur-ther reinforced by rates of high educationalattainment based on resource capabilities.
Educational disparityEducation is one of the basic indicators ofhuman development levels: literacy providesaccess to new opportunities, while educa-
TABLE 3.3 Major occupations by ethnicity/caste, 2001
Ethnic/ Total Prof/ Legislative/ Clerical Sales/ Forestry/ Production Of whichcaste group economically technical admin service farm/ labour elementary
active fishery
Upper caste 35.4 62.2 58.3 53.6 42.2 37.1 21.2 19.1
Middle caste 10.0 6.6 5.1 7.2 12.8 8.8 8.8 14.9
(Tarai only)
Dalit 11.9 1.6 1.3 3.9 4.0 10.9 20.3 22.6
Janajati 38.7 27.6 33.2 33.3 35.5 40.5 38.1 36.1
- Hill Janajati 23.6 10.7 10.3 14.4 14.3 28.6 18.1 16.5
- Newar/Thakali 7.5 13.8 20.8 12.7 16.8 5.0 8.7 4.8
- Tarai Janajati 7.5 3.1 2.1 6.2 4.4 6.9 11.4 14.9
Muslim/Sikh 3.1 1.2 1.1 1.1 4.5 2.0 6.0 5.7
Others 0.9 0.8 1.1 0.9 1.1 0.7 1.3 1.5
All 100.00 100.0 100.0 100.0 100.0 100.0 100.0 100.0
Source: Acharya et al 2003.

76 R E A D I N G S I N H U M A N D E V E L O P M E N T
The 100 ethnic/caste groups reported in the2001 census can also be placed in regionalcategories by their native areas: mountain,hill, Kathmandu Valley (Newar), Inner Tarai,and the Tarai (table 3.5). The hill high casteshave a range of 59.0-74.9% as compared to33.5-46.9% for hill Dalit and the higher rangeof the Dalit is lower than that of bottomrange of high castes. In the case of the Tarai,the range varies from 14.8-82.1% for thehigher castes and 9.4-34.8% for lower castes.The Tarai high castes have a very widerange, but that of Tarai Dalits is lower thanthat of their hill counterparts.
Educational attainment: Of Nepal’s totalpopulation of 19.2 million aged 6 years andabove in 2001, 48.6% had varied educa-tional attainment levels: school level,80.5%; SLC/Certificate, 15.7%; and gradu-ate and above, 3.8%. Among the 7.4 mil-lion with school level attainment, 57.5%came from the caste group and 38.4% fromthe ethnic group, while others made up0.9%. The caste group dominance in edu-cational attainment becomes more evidentat the tertiary level (figure 3.1).
TABLE 3.4 Household characteristics by ethnicity/caste, 2001
Water source House type Flush Water Lighting facility Cooking fueltoilet source
tap/pipe Pucca Kacha Tap/ Electrify/ Kerosene Wood Kerosene Gaspipe biogas
Upper caste 52.4 18.1 31.9 60.8 52.1 43.2 65.3 16.0 16.1
Dalit 19.7 50.7 13.3 43.3 18.0 76.9 75.2 5.9 1.3
Janajati 32.6 34.7 20.8 58.5 38.1 59.8 70.1 14.4 8.2
Religious Minorities 27.3 49.0 7.9 34.1 35.4 62.8 52.1 13.6 3.9
All 36.6 33.5 22.7 52.9 39.6 57.2 65.6 13.5 9.4
Source: Acharya and others, 2004, draft, tables 3.6, 3.8, 3.9, 3.10 and 3.12.Pucca = Concrete/brick cemented, Kacha = mud and wood.
tional attainment generally improves thequality of life. The education level ofNepalese population is very low with thepronounced discrepancy in access to educa-tion across Nepalese social groups. Two-thirds of ethnic/caste groups have literacyrates below the national average (CBS 2002).On the other hand, certain other ethnic/castegroups monopolise higher education.
Literacy: Literacy rate of Nepal’s popula-tion aged six years and above increasedfrom 39.0 in 1991 to 54.0 in 2001. Althoughthis improvement appears encouraging, animmense gap persists across caste and eth-nic groups.
The extremes in literacy rates ranged from4.2%-88.0% in 1991 and 7.3%-93.9% in 2001,an overall gain for all ethnic/caste groups of15%. Only 21 groups exceeded this level ofgain, the highest being the Rajbhar, Jirel,Bangali and Sikh. Among those with low gainswere the Raji, Dusadh, Brahman (Tarai),Chamar, Musahar, and Marwari. These socialgroups with the least gain – except the Marwariand Brahman – also had very low literacy rates.

77I N C L U S I V E H U M A N
D E V E L O P M E N T I N N E P A L
In geographic terms, the hill high caste groupconstituted 59.7% of those with high educa-tional attainment, followed by some 13% forTarai high caste and the Newar, with only afew Dalit – 0.5% for hill and 0.2% for Tarai.
A discrepancy in educated manpower byethnicity/caste has led to the entrenchmentof privileged groups in bureaucracy and au-thority (table 3.6).
CONCLUSION
In the differentiation across regions and so-cial exclusion set out above along each HDIindicator, horizontal differentiation is a geo-graphic reality that cannot be eradicated.However, it can be reduced by a spatial de-velopment strategy. By contrast, vertical in-equality, being a cultural construct, caneventually disappear through a core agendaof social inclusion appropriate to the multi-cultural democracy that Nepal now is inname. The global HDR 2004 makes the fol-lowing observations to dismantle severalprevailing fallacies:! multi-cultural policies are a way to build
diverse and unified states;! identity politics need to be managed so
that violence does not ensue;! the development process should involve
wider participation value shifts that pro-mote human rights
! there is no evidence of any relationshipbetween cultural diversity and develop-ment; and
! the “clash of civilizations” concept ex-aggerates differences between culturalgroups and ignores similarities betweenthem.
TABLE 3.5 Literacy rate by social groups, 2001
Social group A. Rate range
A. Hill castes
1. Higher 59.0-74.9
2. Dalit 33.5-46.9
B. Tarai castes
1. Higher 14.8-82.1
2. Dalit 9.4-34.8
C. Ethnic group
1. Mountain 27.2-75.7
2. Hill 29.2-70.7
3. Inner 32.0-55.4
4. Tarai 13.2-54.4
D. Others 34.7-93.9
NEPAL 53.7
Source: CBS 1991 and 2001.
53
1.2
13.9
0.4
Hill high caste
Caste
Hill dalit
Tarai high caste
Tarai dalit
0.5
11
12.4
0.3
3.6
Hill
Mountain
Newar
Ineer Tarai
Tarai
Ethnic
2.2Others
FIGURE 3.1 Educational attainment,SLC/certificate percent of total
Source: Annex 3.5.

78 R E A D I N G S I N H U M A N D E V E L O P M E N T
cial code of Muluki Ain, had an enduring im-pact on the people as the law of the land. TheConstitution of the Kingdom of Nepal (1990)promulgated after the establishment of po-litical democracy, defines the country as a“Hindu” kingdom (Article 4.1). Therefore, thecurrent Constitution contains certain contra-dictions on social equality. Article 11.3 onthe right to equality stipulates: The Stateshall not discriminate the citizens on thebasis of religion, colour, sex, caste, ethnicityor conviction or any of these.
At the same time, Article 19.1, on the right toreligion, states: Each individual will have theright to follow and practice one’s ancient(sanatan) religion by maintaining the dignityof prevailing tradition.
Based on the spirit of this Article, the TenthAmendment of Naya Muluki Ain (1993) in-cludes a provision that traditional practicesat religious places shall not be deemed dis-criminatory. By implication, however, main-taining the dignity of traditional practicesmeans perpetuating past inequality and theexclusion of significant population segments.
TABLE 3.6 Candidates passing gazetted level (grade III)
Caste/ethnic group 1984/85 1990/91 1994/95 2000/01
Brahman/Brahman/Thakuri/Rajput/Chhetri 69.3 67.3 81.2 87.0
Newar 18.6 18.5 9.7 8.7
Madhesi (excluding Brahman, Rajput, Dalit) 8.5 10.2 5.5 3.2
Indigenous Nationalities (excluding Newar) 3.0 2.4 1.8 0.5
Muslim 0.6 0.9 0.4 0.5
Dalit - 0.7 0.2 -
Total 100.0 100.0 100.0 100.0
Number 472 459 1,014 185
Source: Subba and others 2002, based on bulletins of public service commission, table 49.
This global HDR goes on to elaborate poli-cies to be adopted to ensure social inclusion,including secularism with regard to religion,the recognition of minority languages, anaffirmation of many cultural rights, affirma-tive action to raise the status of disadvan-taged groups, and power-sharing throughproportional representation, along withasymmetric federalism. Social transforma-tion is usually a slow process, since any es-tablishment benefits from the system inplace; it has usually put it there. To changethe situation, “empowerment from belowneeds to be supported by complementary ef-forts at the system level to make institutionsand policies more inclusive” (Bennett 2003).
The emphasis on poverty reduction inNepal’s development strategy is not new;what is novel is the recent recognition of so-cial exclusion as both an impediment to hu-man development and also the cause of theinsurgency that began in 1996 (UNDP 2004b).
The political ideology of the Nepalese Stateis enshrined in the Constitution of 1990 andits legislative provisions. However, the so-
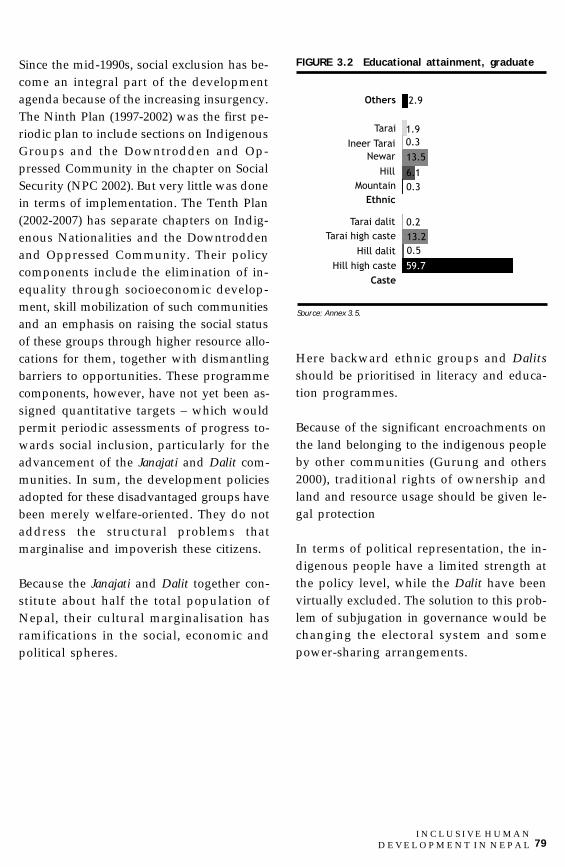
79I N C L U S I V E H U M A N
D E V E L O P M E N T I N N E P A L
Since the mid-1990s, social exclusion has be-come an integral part of the developmentagenda because of the increasing insurgency.The Ninth Plan (1997-2002) was the first pe-riodic plan to include sections on IndigenousGroups and the Downtrodden and Op-pressed Community in the chapter on SocialSecurity (NPC 2002). But very little was donein terms of implementation. The Tenth Plan(2002-2007) has separate chapters on Indig-enous Nationalities and the Downtroddenand Oppressed Community. Their policycomponents include the elimination of in-equality through socioeconomic develop-ment, skill mobilization of such communitiesand an emphasis on raising the social statusof these groups through higher resource allo-cations for them, together with dismantlingbarriers to opportunities. These programmecomponents, however, have not yet been as-signed quantitative targets – which wouldpermit periodic assessments of progress to-wards social inclusion, particularly for theadvancement of the Janajati and Dalit com-munities. In sum, the development policiesadopted for these disadvantaged groups havebeen merely welfare-oriented. They do notaddress the structural problems thatmarginalise and impoverish these citizens.
Because the Janajati and Dalit together con-stitute about half the total population ofNepal, their cultural marginalisation hasramifications in the social, economic andpolitical spheres.
59.7
0.5
13.2
0.2
Hill high caste
Caste
Hill dalit
Tarai high caste
Tarai dalit
0.3
6.1
13.5
0.3
1.9
Hill
Mountain
Newar
Ineer Tarai
Tarai
Ethnic
2.9Others
FIGURE 3.2 Educational attainment, graduate
Source: Annex 3.5.
Here backward ethnic groups and Dalitsshould be prioritised in literacy and educa-tion programmes.
Because of the significant encroachments onthe land belonging to the indigenous peopleby other communities (Gurung and others2000), traditional rights of ownership andland and resource usage should be given le-gal protection
In terms of political representation, the in-digenous people have a limited strength atthe policy level, while the Dalit have beenvirtually excluded. The solution to this prob-lem of subjugation in governance would bechanging the electoral system and somepower-sharing arrangements.

80 R E A D I N G S I N H U M A N D E V E L O P M E N T
G E N D E R A N D H U M A N D E V E L O P M E N T 81
Evaluating gender equality – the develop-ment of women’s capabilities as well as thoseof men within the traditional and rapidlychanging division of labour between thesexes – is integral to human developmentsimply because it takes into account the con-tributions of women to society both withinand outside the household. These two ap-proaches – gender development and humandevelopment – complement each other. Bothwere born of the concern for examining ex-isting realities in socio-cultural and eco-nomic inequality. Both challenge the as-sumption that economic growth per se willnecessarily trickle down to all sectors andsegments of the population.
Further, the gender development approachposits that women’s subordination in the de-velopment process cannot be attributed solelyto their marginal position in the trickle-downmodel of socio-economic development, butto the very factors that have relegated themto that margin. Most of these factors are sex-based. Women face multiple oppressions interms of class, ethnicity and nationality. Hu-man development acknowledges these ineq-uities, studies their forms and has thereforeset benchmarks for assessing the inequali-ties between women and men produced bythese injustices (UNDP 1995; HDR in South
Asia 2000) It attempts to bring them into fo-cus as a basic human rights issue and con-sequently explores ways of overcoming per-sistent gender gaps/inequalities from a sys-temic perspective. Recognising the impor-tance of the issue, Mahbub ul Haq, the archi-tect of measuring human development, as-serts that development, “if not engendered,is endangered.”
Both the conceptual and practical issues ofgender inequalities are articulated in the an-nual global Human Development Reports,as well as those produced at the regional andcountry levels. However, the key issue thatneed to be examined in the context of humandevelopment related to gender equality aretwo fold:! the extent to which the human develop-
ment approach, based on the capabilityframework conceived by Amartya Sen,can effectively be applied to conceptualiseand assess gender inequalities in all coun-tries; and
! the extent to which the capability frame-work can be operationalised for “engen-dering” development as envisaged inhuman development approach.
This chapter deals first with the concept ofgender as a social construct, then with the
CHAPTER 4
Gender and human developmentBina Pradhan

82 R E A D I N G S I N H U M A N D E V E L O P M E N T
different approaches that have evolved tomainstream gender into the processes ofeconomic development. This will help usunderstand the complexities of the rela-tionships between gender development andhuman development, particularly as it mani-fests itself globally as well as in Nepal.
THE GENDER DIMENSION OF THEHUMAN DEVELOPMENT APPROACH
To understand the gender dimension of hu-man development, it is necessary to clarifyconcepts and arrive at a common understand-ing of the term gender and how gender rela-tions are constructed, maintained and rein-forced in societies. Such an understandingof the concept and the approaches it implieswill increase our sensitivity to a broad rangeof gender issues at the personal, inter-per-sonal, institutional and community levels. Itwill also highlight what is entailed- forrealising gender equality and gender justicein the human development approach.
Understanding genderand its constructionThe concept of gender is relatively new. Itdoes not even exist as a single word in manylanguages. It is therefore important to de-velop a shared language for discussing rolesthat are determined culturally and the powerrelations between women and men, as dis-tinguished from their biological differences.Gender may be defined as a network of be-liefs, personality traits, attitudes, values, be-haviors and activities differentiating womenand men through a process of social con-struction that has a number of distinctive fea-tures. It is historical; it takes place withindifferent macro and micro spheres, such as
the state, the labour market, schools, the me-dia, the law, family/household and inter-personal relations; it involves the rankingof traits and activities so that those associ-ated with men are normally given greatervalue. Ranking, and therefore the formationof hierarchies, in most societies is an intrin-sic component of gender construction(Beneria 1987).
Further, gender is constructed within amultiplicity of relations involving class,caste/ethnicity and race, among othersocio-cultural constructs. Women face dualchallenges to their identities within thesecategories:! being female within the social group; and! belonging to a particular social group/
class.
A wide range of subordinations to men ex-ists within these categories. The processesof gender construction create asymmetricalrelations between women and men that aretranslated into development policies andactions, as figures 4.1, 4.2 and 4.3 reveal.
This becomes the belief system on which so-cieties/cultures are founded, thearbitrageurs of the divide and the assump-tion of family intrinsic to feminity. The out-come of this construction is an asymmetri-cally structured access to resources andpower/authority that generates male privi-lege and domination, on the one hand, and,on the other, female subordination. To doaway with this inequity, feminists questionthe logic, validity and scientific basis of thedualistic belief system and seek in the longterm to put an end to male domination. Theirgoals include equality before the law,women’s economic and psychological self-reliance; the abolition of a gender-based di-

G E N D E R A N D H U M A N D E V E L O P M E N T 83
vision of work; the enhancement of women’scapabilities and their control over their sexu-ality and reproductive capacities; and theelimination of male violence and coercionvis-a-vis women. However, in part becausethese strategic interests (box 4.1) become po-litical and economic as well as cultural, theyface resistance at any given time.
During the last 30 years, a vast amount ofliterature – both theoretical and empirical –has appeared to explain gender inequali-ties in development and women’s sourcesof subordination. The publication of EsterBoserup’s pioneering work, Women’s Rolein Economic Development (1970) raisedawareness of the differing impacts of devel-opment activities on women and men andthe bypassing of women in programmesaimed at poverty reduction and technologi-cal advancement. In short, development ac-tivities in poor countries after World War IIaffected women negatively. Boserup
pointed out that all societies had developedclear divisions of labour by sex, even thoughwhat was considered a male or female taskvaried significantly across countries/cul-tures. This implied that the sexual divisionof labour was arbitrary – and gave rise to awholly new area of interest in women’splace in development that questioned ste-
Strategic interests are the “objectives to over-come women’s subordination, such as the abolitionof sexual division of labour, the alleviation of theburden of domestic labour and child care, removalof institutionalised forms of discrimination, the es-tablishment of political equality, freedom of choicein childbearing, and the adoption of adequate mea-sures against male violence and control over women”.These contrast with practical gender interests,usually a response to “immediate perceived needs”such as “basic needs” or “economic necessity”.
Source: Molyneux 1986.
BOX 4.1 Strategic interest versuspractical gender interest
FIGURE 4.1 Sex vs gender
Biology
“Sex” is the biological difference between womenand men. Biological, evolutionary and practical re-lations of “maleness” to “femaleness” are – is natu-ral. Sexual differences are absolute, fixed or un-changeable and non-contradictory.
Culture
“Gender” is a systematic constellation of ideas,values, assumptions, hopes and fears about “male-ness” and “femaleness”. It organises the roles,status/positions of men and women and their re-lationships into two categories.
This divide is variable; it - changes with time andacross cultures and is , contradictory, and arbi-trary, creating a fixed dichotomy as its organisingprinciple.
Creates categories and an absolute dualism be-tween men and women.
Sex in relation to Gender is an importantdistinction to be made for conceptual clarity.
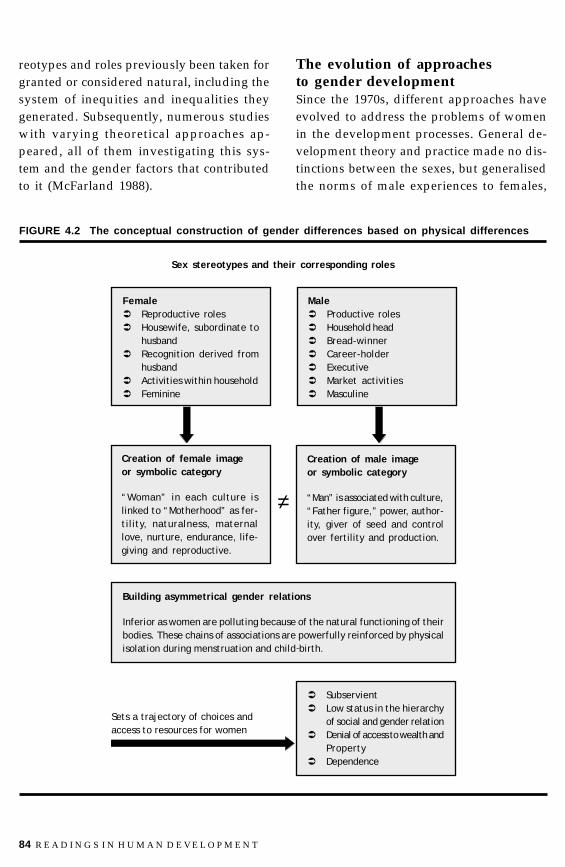
84 R E A D I N G S I N H U M A N D E V E L O P M E N T
reotypes and roles previously been taken forgranted or considered natural, including thesystem of inequities and inequalities theygenerated. Subsequently, numerous studieswith varying theoretical approaches ap-peared, all of them investigating this sys-tem and the gender factors that contributedto it (McFarland 1988).
The evolution of approachesto gender developmentSince the 1970s, different approaches haveevolved to address the problems of womenin the development processes. General de-velopment theory and practice made no dis-tinctions between the sexes, but generalisedthe norms of male experiences to females,
FIGURE 4.2 The conceptual construction of gender differences based on physical differences
Sex stereotypes and their corresponding roles
Female" Reproductive roles" Housewife, subordinate to
husband" Recognition derived from
husband" Activities within household" Feminine
Male" Productive roles" Household head" Bread-winner" Career-holder" Executive" Market activities" Masculine
Creation of female imageor symbolic category
“Woman” in each culture islinked to “Motherhood” as fer-tility, naturalness, maternallove, nurture, endurance, life-giving and reproductive.
Creation of male imageor symbolic category
“Man” is associated with culture,“Father figure,” power, author-ity, giver of seed and controlover fertility and production.
Building asymmetrical gender relations
Inferior as women are polluting because of the natural functioning of theirbodies. These chains of associations are powerfully reinforced by physicalisolation during menstruation and child birth.
≠
Sets a trajectory of choices andaccess to resources for women
" Subservient" Low status in the hierarchy
of social and gender relation" Denial of access to wealth and
Property" Dependence
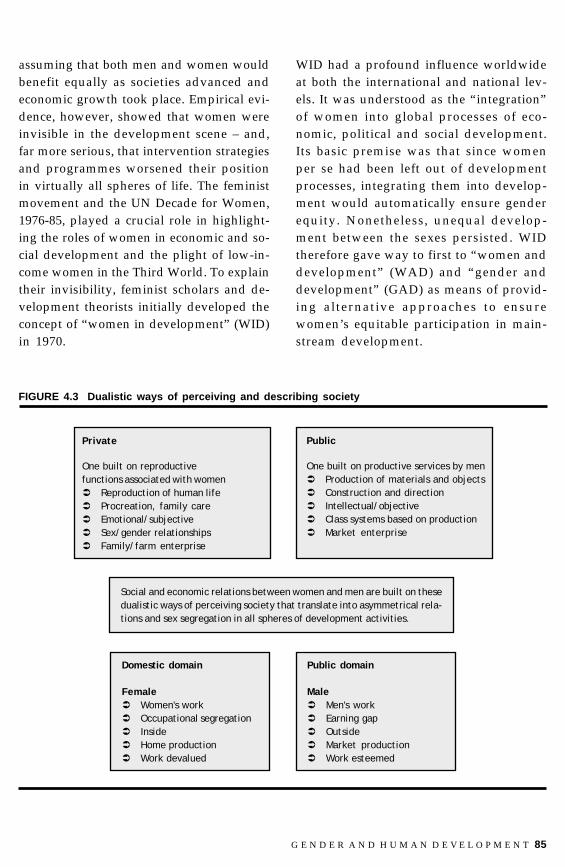
G E N D E R A N D H U M A N D E V E L O P M E N T 85
assuming that both men and women wouldbenefit equally as societies advanced andeconomic growth took place. Empirical evi-dence, however, showed that women wereinvisible in the development scene – and,far more serious, that intervention strategiesand programmes worsened their positionin virtually all spheres of life. The feministmovement and the UN Decade for Women,1976-85, played a crucial role in highlight-ing the roles of women in economic and so-cial development and the plight of low-in-come women in the Third World. To explaintheir invisibility, feminist scholars and de-velopment theorists initially developed theconcept of “women in development” (WID)in 1970.
FIGURE 4.3 Dualistic ways of perceiving and describing society
Private
One built on reproductivefunctions associated with women" Reproduction of human life" Procreation, family care" Emotional/subjective" Sex/gender relationships" Family/farm enterprise
Public
One built on productive services by men" Production of materials and objects" Construction and direction" Intellectual/objective" Class systems based on production" Market enterprise
Social and economic relations between women and men are built on thesedualistic ways of perceiving society that translate into asymmetrical rela-tions and sex segregation in all spheres of development activities.
Domestic domain
Female" Women's work" Occupational segregation" Inside" Home production" Work devalued
Public domain
Male" Men's work" Earning gap" Outside" Market production" Work esteemed
WID had a profound influence worldwideat both the international and national lev-els. It was understood as the “integration”of women into global processes of eco-nomic, political and social development.Its basic premise was that since womenper se had been left out of developmentprocesses, integrating them into develop-ment would automatically ensure genderequity. Nonetheless, unequal develop-ment between the sexes persisted. WIDtherefore gave way to first to “women anddevelopment” (WAD) and “gender anddevelopment” (GAD) as means of provid-ing alternative approaches to ensurewomen’s equitable participation in main-stream development.

86 R E A D I N G S I N H U M A N D E V E L O P M E N T
Progress achieved under WID and GAD not-withstanding, development practitioners of-ten lose sight of these fundamental conceptsand fail to contextualise them in specificcountry situations. Figure 4.4 provides asnapshot of how both these concepts evolved,how they influenced development policiesand strategies at large, and the practical im-plications of such policies.
The WID perspective, based on the theory ofmodernisation and strongly supported byAmerican policy-makers and the WorldBank, assumed that industrialisation andtechnological advance would improve stan-dards of living in developing countries; eco-nomic growth and mass education wouldtransform agrarian societies and the benefitsof such modernisation would “trickle down”through market mechanisms to all segmentsof the society, including women. WID closelyresembled neoclassical theories of economicgrowth during the 1960s and 1970s, posit-ing the market as the instrument of redistrib-uting wealth (Roberts 1981). Women’s par-ticular problems related to social inequali-ties and their subordinate position was rarelyconsidered. Women were viewed as a disad-vantaged group like any other – the poor ingeneral, whether urban or rural, and ethnicor racial minorities. Policies and programmeinterventions for women stressed the promo-tion of women in education and skills train-ing for income generation and adequatehealth services to enable them to participatein the “productive” sectors.
By the late 1970s and early 1980s, the WIDapproach came seriously into question. Therelative position of women had improvedvery little over the two decades. In fact,women were found to be relegated into sec-ondary position and low-paying occupations
as formal industrial sectors developed. Mar-ket processes of accumulation simply usedthe cheap and flexible labour services ofwomen under exploitative conditions in al-most all the newly industrialising countries.The trickle down theory did not work formen, even less for women.
During the latter 1970s, the concept of“WAD” was put forward by neo-MarxistFeminist movement (also known as the So-cialist Feminists) to explain the sources ofdiscrimination against women. Within thisschool, two theoretical explanationsemerged: first, a restatement and elaborationof Engels’ idea that capitalism and patriar-chy are mutually reinforcing; and, second, aMarxist reconstruction of women’s subordi-nation in an international perspective. Boththeories sought to explain “sexual inequalitystructurally and dialectically, as it relates tosocial class inequality and to the uneven andunequal development of capitalism globally”(Bandarage 1984). The neo-Marxist feministsalso argued that women’s integration into freetrade through export-oriented manufacturingrepresented further exploitation because thismodel exemplified the dependency thrustupon the global South by the global North.They also stressed the complexity and diver-sity of women’s integration into the processesof capitalist development, contending that thepatriarchy was intensified by this process inrelation to the class positions of differentgroups of women. In contrast to the WIDSchool, the neo-Marxist Feminists criticisedthe capitalist development model and statedthat the elimination of capitalism was a nec-essary, but not sufficient condition for the over-throw of the patriarchy.
However, they did not consider the socialrelations of men and women within classes,
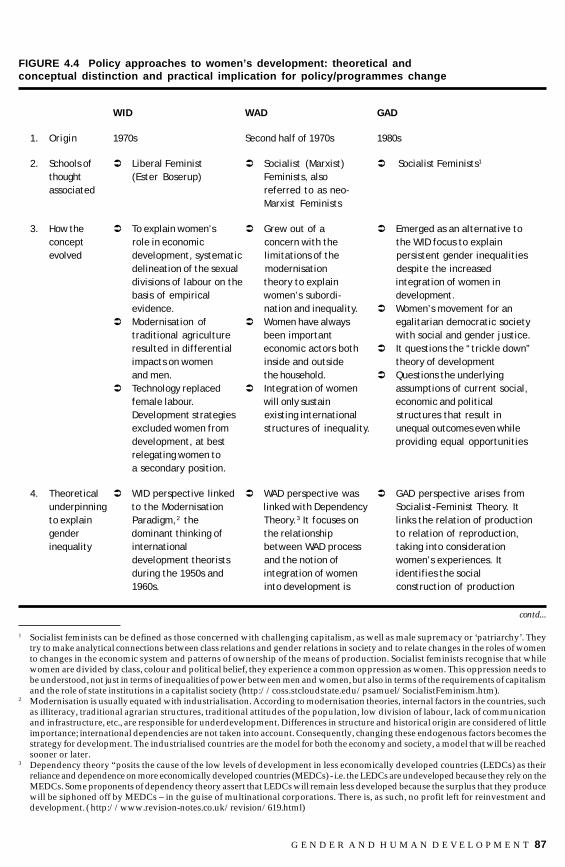
G E N D E R A N D H U M A N D E V E L O P M E N T 87
FIGURE 4.4 Policy approaches to women’s development: theoretical andconceptual distinction and practical implication for policy/programmes change
WID WAD GAD
1. Origin 1970s Second half of 1970s 1980s
2. Schools of " Liberal Feminist " Socialist (Marxist) " Socialist Feminists1
thought (Ester Boserup) Feminists, alsoassociated referred to as neo-
Marxist Feminists
3. How the " To explain women’s " Grew out of a " Emerged as an alternative toconcept role in economic concern with the the WID focus to explainevolved development, systematic limitations of the persistent gender inequalities
delineation of the sexual modernisation despite the increaseddivisions of labour on the theory to explain integration of women inbasis of empirical women’s subordi- development.evidence. nation and inequality. " Women’s movement for an
" Modernisation of " Women have always egalitarian democratic societytraditional agriculture been important with social and gender justice.resulted in differential economic actors both " It questions the “trickle down”impacts on women inside and outside theory of developmentand men. the household. " Questions the underlying
" Technology replaced " Integration of women assumptions of current social,female labour. will only sustain economic and politicalDevelopment strategies existing international structures that result inexcluded women from structures of inequality. unequal outcomes even whiledevelopment, at best providing equal opportunitiesrelegating women toa secondary position.
4. Theoretical " WID perspective linked " WAD perspective was " GAD perspective arises fromunderpinning to the Modernisation linked with Dependency Socialist-Feminist Theory. Itto explain Paradigm,2 the Theory.3 It focuses on links the relation of productiongender dominant thinking of the relationship to relation of reproduction,inequality international between WAD process taking into consideration
development theorists and the notion of women’s experiences. Itduring the 1950s and integration of women identifies the social1960s. into development is construction of production
1 Socialist feminists can be defined as those concerned with challenging capitalism, as well as male supremacy or ‘patriarchy’. Theytry to make analytical connections between class relations and gender relations in society and to relate changes in the roles of womento changes in the economic system and patterns of ownership of the means of production. Socialist feminists recognise that whilewomen are divided by class, colour and political belief, they experience a common oppression as women. This oppression needs tobe understood, not just in terms of inequalities of power between men and women, but also in terms of the requirements of capitalismand the role of state institutions in a capitalist society (http://coss.stcloudstate.edu/psamuel/SocialistFeminism.htm).
2 Modernisation is usually equated with industrialisation. According to modernisation theories, internal factors in the countries, suchas illiteracy, traditional agrarian structures, traditional attitudes of the population, low division of labour, lack of communicationand infrastructure, etc., are responsible for underdevelopment. Differences in structure and historical origin are considered of littleimportance; international dependencies are not taken into account. Consequently, changing these endogenous factors becomes thestrategy for development. The industrialised countries are the model for both the economy and society, a model that will be reachedsooner or later.
3 Dependency theory “posits the cause of the low levels of development in less economically developed countries (LEDCs) as theirreliance and dependence on more economically developed countries (MEDCs) - i.e. the LEDCs are undeveloped because they rely on theMEDCs. Some proponents of dependency theory assert that LEDCs will remain less developed because the surplus that they producewill be siphoned off by MEDCs – in the guise of multinational corporations. There is, as such, no profit left for reinvestment anddevelopment. ( http://www.revision-notes.co.uk/revision/619.html)
contd...

88 R E A D I N G S I N H U M A N D E V E L O P M E N T
WID WAD GAD
" Focuses exclusive on intricately linked to the and reproduction as the basisthe productive aspect maintenance of the eco- of women’s subordination.of women’s lives. nomic dependency of " GAD is not concerned with
the global South on the women per se, but with theindustrialised countries. social construction of gender
" Preoccupation with the and the specific roles.productive sector at ascribed to women and men.the expense of the " Rejects patriarchy as anreproductive side of organising principle thatwomen’s work and lives. systematically subordinates
women to men and establishespaternalistic dominance.
5. Assumptions " Integration of women " Assumes that women’s " Assumes equal participationinto the mainstream position will improve and cooperation by malewill improve women’s only when international counterparts in overcomingposition. structures become women’s subordination.
" Theory of the more equitable and the " Sees women as agents of“trickle-down” dependency situation change rather than as passivemechanism will benefit of the Southern coun- recipients. It sees the need forwomen automatically. tries is eliminated. women to organise themselves
" Emphasis on productive " Women’s subordination for a more effective politicalroles of women, is subsumed under voice.assuming that enhanced international structuraleconomic participation inequalities.will improve women’sposition.
6. Policy " Legal and " Like the WID approach, " Fundamental shifts in values,approach administrative change WAD emphasises income assumptions and attitudes.
to include women in generation. " Emphasis on gender equality.development. " Structural changes and power
" Emphasis on shifts.egalitarianism. " Empowerment and capability
" Promotion of women’s enhancement programmes forparticipation in women to voice their needsproductive sectors and problems.through skill " Policies and programmes todevelopment and income- address strategic needs andgeneration programmes. immediate practical needs.
" Development of " Strengthening of women’s legal“appropriate technology”. rights.
" Mass education.
FIGURE 4.4 Policy approaches to women’s development: theoretical andconceptual distinction and practical implication for policy/programmes change
G E N D E R A N D H U M A N D E V E L O P M E N T 89
races, and ethnic groups – although they didpoint out the social construction of produc-tion and reproduction as the basis of women’ssubordination and began examining whywomen have been systematically assignedinferior or secondary roles. In doing so theyquestion the sexual division of labour be-tween women and men and their sociallyassigned roles. However, the WAD approachalso does not adequately analyse the socialrelations of gender within the class structure.It focuses mainly on how the class structureand capitalist mode of production negativelyimpact women. It also stresses women’s pro-ductive roles. Although the WAD perspectiveoffers a more critical view of women’s posi-tion than does WID, the policies and inter-vention strategies are not very different fromthe WID approach. The underlying assump-tion is that improvements in women’s posi-tion will come about only when internationaleconomic structures become more equitable.
The GAD approach emerged during the1980s, from frustration with the lack ofprogress of WID policy in changing women’slives and influencing the broader develop-ment agenda. The GAD approach aims tomeet women’s practical, productive, and stra-tegic needs by changing the existing divisionof labour and power relations. It draws muchof its theoretical base from socialist feminism,but concentrates primarily on why women’swork is systematically devalued in all aspectsof their lives, based on their experiences(Jaquette 1982). In attempting to answer thisquestion, socialist feminists combine ananalysis of the impact of patriarchy withsome aspects of a more traditional Marxistapproach. GAD takes a holistic view, look-ing at the “totality of social organisation, eco-nomic and political life in order to under-stand the shaping of particular aspects of
society” (Young 1988). It focuses on both menand women and analyses the social con-struction of gender and the assignment ofspecific roles, responsibilities and expecta-tions of women versus men, showing thenature of women’s contributions inside andoutside the household, and recognising thehousehold as an economic unit in itself, par-ticularly in the global South, where thehousehold so often comprises the familyfarm. The major thrust of GAD is that thesubordination of women is rooted in the so-cial and structural inequalities and the ideo-logical value system emanating from patri-archal structures.
GAD also moved away from the portrayal ofwomen as victims of change processes to-wards a full consideration of different formsof women’s resistance. The approach per-ceives women as agents of change, ratherthan as passive recipients of developmentassistance and stresses a better understand-ing of women’s agency in the developingcountries. Increasingly, feminists throughoutthe global South indicate that the very con-ceptual base of the development processworks against poor women. They see the truechallenge as the transformation of subordi-nation structures through the empowermentof individual women – enhancing women’scapabilities to acquire skills, leadershipqualities in democratic processes, equal par-ticipation in policy- and decision-making,and the application of women’s techniquesto resolving household conflicts to muchbroader areas of conflict, including disputesbetween nations.
The ideas outlined above make it clear thatthe development of the human developmentapproach and the evolution of the GAD ap-proach are founded on common principles

90 R E A D I N G S I N H U M A N D E V E L O P M E N T
fare economics or political philosophy,which assume that gender relationswithin the family are homogeneous, co-operative, and altruistic, ignoring intra-household inequalities and conflict. Bycontrast, human development permits usto focus on individual well-being andtherefore differences between men andwomen within the household. Empiricalevidence has shown that increases in theincome of women worldwide do not nec-essarily lead to their well-being.
! The capability approach permits analy-ses of well-being beyond market transac-tions. This allows us to measure inequali-ties between women and men in non-market activities such as family care,women’s household work burden, andgender-based domestic violence, amongother areas. This is crucial becausewomen tend to spend much more timeoutside the market than men and makeimmense contributions to the householdeconomy that usually go unrecognisedand are undervalued. One of the mainfeminist concerns about mainstream de-velopment processes is that they separatethe household economy from wider eco-nomic processes – and thereby excludewomen automatically from mainstreamdevelopment. human development there-fore becomes compatible with GAD.
! Like GAD, the capability approach explic-itly recognises human diversity as mani-fest in race, ethnicity, age, gender, sexu-ality and geographic location. In so do-ing, it permits an examination of the dy-namics of the gender relations withineach of the socio-demographic categoriesto assess the capability functionings ofwomen relative to men.
! Like GAD, too, the capability approachemphasises the agency of human beings
of social justice and gender equality/equity,rights to peoples’ development, and disillu-sionment with the model of developmentbased on the “trickle down” mechanism. Itis therefore critically important to examinethe compatibility or the adequacy of the “ca-pability” approach, of human developmentfor practical application in assessing andaddressing gender issues.
The human developmentapproach and gender inequalitiesAs indicated at the beginning of this chapter,achieving gender equity constitutes an impor-tant dimension of human development. Femi-nist scholars have studied – and, indeed, con-tributed to – Sen’s conceptualisation of thecapability approach and developed differentversions of it in operation (Fukuda-Parr andShiva Kumar 2003). Some have specificallyexplored its usefulness in assessing genderinequalities (Robeyns 2002; Prabhu 2003).
The concept of capability is based on theliberal theory of justice and human rights –concepts of substantial freedoms or expres-sion of capabilities as such are universalvalues in human development (see chapter1). Further, the conceptual perspective andthe broad set of capabilities essential forachieving human development with genderjustice, are similar to the GAD approachdiscussed above. The human developmentapproach is quite useful for dealing withgender issues in a holistic view of the well-being of women and men as an end in itself.This enables us to focus on the concept ofstrategic gender needs in comparison withpractical gender needs. Its utility may beoutlined as follows:! The capability approach improves upon
standard well-being approaches in wel-

G E N D E R A N D H U M A N D E V E L O P M E N T 91
work has pointed to difficulties inoperationalising the framework in theabsence of specified capabilities relatedto being truly human (Robeyns 2002). Toovercome these difficulties, a number ofscholars have developed the capabilityapproach further to specify essential ca-pabilities for gender equality assessment(Robeyns 2002).
! The subjective perceptions of individualwell-being used by the capability ap-proach can be very misleading when ap-plied to women because of the particularnature of gender inequalities in whichwomen serve as “accomplices”. Subordi-nation and deprivation are internalisedby women themselves; because they tendto see their inferior status as a part of nor-mal life, it may not emerge in their per-ception of what they are missing in claim-ing their rightful possibilities and oppor-tunities. This has important ramificationsfor practical policies and programmes(Sen 2003).
! Similarly, the importance attached to “in-dividual choices” can also be misleadingwhen applied to women. Socio-culturalnorms and practices influence a woman’schoices and behaviour. What may seemher choice may simply confirm societal ex-pectations and pressures. Such social/cultural settings would limit women’sputting forth their demands for a just andequitable life. This in itself could be animpediment to achieving gender equality.
! The use of conventional socio-economicmeasures, such as income/employment,education and life expectancy at birth –measures whose underlying perspectivesare socio-economic in many ways – con-tradicts the broader conceptualisation ofhuman development from a socio-cultural,institutional and political perspective.
as a capability functioning that allowspeople to choose the kinds of life theywish to lead and to exercise this right.The concept of agency therefore permitsthe portrayal of women as agents ofchange rather than victims of the processof development and allows social scien-tists to measure improvements in health,education, nutrition, fertility and childhealth in terms of women’s well-being –and above all, their ways of resisting thesocial, cultural, political and institutionalforces that have made them subordinateto men (Pradhan 2003; Presser and Sen2000; England 2000). The agency concep-tion thereby goes well beyond conven-tional measures of women’s empowermentand brings into focus the qualitative as-pects of empowerment in individuals andgroups, as well as their vulnerabilities vis-à-vis those who dominate them.
! Further, the capability approach allowsus to probe strategic gender needs bybringing into focus both women’s produc-tive and reproductive roles and capabili-ties in this resistance, as well as differingvulnerabilities.
While the capability approach provides anoverall value-based framework, it nonethe-less has several practical drawbacks, amongthem are the following:! The capability approach does not specify
which activities characteristically per-formed by human beings are central toachieving the life that is “truly human”.We must also ask which key capabilitiesof women, as compared with men, appearcentral to women’s quality of life that willbring them into an egalitarian relation-ship with their male counterparts bothwithin and outside the household. Someempirical testing of the capability frame-

92 R E A D I N G S I N H U M A N D E V E L O P M E N T
Nonetheless, gender development and humandevelopment share much common ground.Both approaches are built on a human rightsframework that transcends sectoral concerns.Both encompass the concept of well-being,equity and empowerment as facets of the rightsof all people. Gender therefore constitutes anessential dimension of human development.The annual global HDRs amply recognise theimportance of the issue and see the empower-ment of women and their well-being as a “linkto growth and human development” and away of engendering human development.From methodological standpoint, however,feminist research on GAD could well contrib-ute to the capability approach. Despite the rec-ognition of gender issues and wide advocacyfor women in human development publica-tions, gender questions remain on the periph-ery of development processes.
CHARTING PROGRESS INGENDER EQUALITY/EQUITY
Gender development varies significantlyfrom one region to another and certainlyamong countries, whether in primary edu-cation access, health status or labour forceparticipation. While a number of womenmay have benefited from economic growth,the majority remains marginalised, their op-tions severely limited.
Policy discourse and actionsat the international levelBetween the First World Conference onWomen, held in Mexico in 1975 and the in-ternational conference on population devel-opment (ICPD) held in Cairo in 1994 and thefourth world conference on women (FWCW)held in Beijing in 1995, there has been sig-
nificant rethinking on the viability of initia-tives that deal with women in isolation fromother major issues (box 4.2). The consensusreached at both Cairo and Beijing set the stagefor two major strategic shifts in integratinggender into development programmes – first,a change in focus from “women’s issues”alone to the context of gender relations inwhich women functioned and, second, arights-based approach that would enablewomen to participate actively in all spheresof public and private life, as well as secureand safeguard their reproductive and sexualrights. Several complementary approachesto achieving gender equality/equity were in-corporated into the Beijing platform for ac-tion, among these, gender mainstreaming, thelife cycle approach; human rights; and GAD.Many countries have initiated policy actionsin line with these and other new directions:! Measures to increase the representation
of women in policy and decision-makingprocesses, often involving affirmative ac-tion through the fixing of quotas for par-liamentary and other political leadershippositions with sensitivity to diversityamong women.
! National plans of action for improvingwomen’s status, formulated by more thantwo thirds of the Asian countries. Manyhave widely divergent goals and modali-ties of implementation. National institu-tional mechanisms for the implementa-tion of action plans frequently include co-ordinating committees and the designa-tion of focal points in various ministries.
! Poverty alleviation measures for womenon the part of both governments – amongthem, Bangladesh, China, India andNepal – as well as non-governmentalorganisations (NGOs), using variousschemes such as micro-credit, livelihoodskills development and food for work.
G E N D E R A N D H U M A N D E V E L O P M E N T 93
! Legal reforms (for example, in Cambodiaand Myanmar) to make girls’ educationcompulsory, including the monitoring ofcompliance with policy directives; theprovision of grants and scholarships forgirls’ education; multigrade systems, non-formal schooling and functional literacyprogrammes.
! Gender-sensitive and client-oriented repro-ductive health programmes, developed tomeet the differing needs of men and women.
! Gender-based violence (GBV), once a ta-boo subject, openly acknowledged, pub-licly stigmatised and made punishableby law (among the list, Argentina, Aus-tralia, Malaysia, Nicaragua, NewZealand, Romania, and the Republic ofKorea). Public education campaigns oneliminating GBV have been launched topromote the adoption of a “zero tolerancepolicy”. Further, GBV has been recognisedas a public health issue in many coun-tries and integrated into reproductivehealth facilities in Cape Verde, Guate-mala, Lithuania, Lebanon, Mozambique,Nepal, and Sri Lanka.
! CSOs have strengthened their advocacyand information efforts to make womenaware of their basic rights and to workfor reforms in institutional protection.
! Government and various groups in civilsociety worked on their own or in collabo-ration with governments to review, moni-tor and enforce measures.
Five years after ICPD and FWCW, specialsessions of the UN General Assembly, popu-larly known as “ICPD+5” and “Beijing +5”,met in June of 1999 and 2000 to review andappraise the implementation of the ICPDProgramme of Action and FWCW/Beijingplatform for action respectively. Despite ac-knowledged progress, the reviews stated that:! The mainstreaming of gender perspec-
tives in policies and programmes had notbeen undertaken on a systematic basis.Technical skills for incorporating genderinto policies and programmes, includingtheir implementation and monitoring, arestill inadequate;
! While laws and policies have been enactedfor the promotion of women’s rights and
On women1975 Mexico City
1979 CEDAW
1980 Copenhagen
1985 Nairobi
1995 Beijing
(1979-85 UN decade for Women)
2000 Beijing+5
Related conferences1990 Education for all (EFA), Jomtien Children’s
Summit, New York
1992 Environment and Development, Rio de Janeiro
1993 World Conference on Human Rights, Vienna
1994 ICPD, Cairo
1995 World Social Development Summit,Copenhagen
1996 Habitat II on Human Settlement, Istanbul
1999 ICPD+5
BOX 4.2 International conferences and consensuses on women and related areas
Source: Adapted from human development in South Asia 2000.

94 R E A D I N G S I N H U M A N D E V E L O P M E N T
the elimination of their discrimination,compliance and enforcement are wanting;
! Although national machineries and fo-cal points have been established, am-biguous mandates, a lack of clear defini-tions of roles and responsibilities, andinsufficient political support hampertheir performance;
! Inadequate monitoring systems and in-dicators hinder efficient tracking of theprogress made in the implementation ofplans. These are aggravated by the inabil-ity to generate sex-disaggregated infor-mation on a timely basis. Monitoring waslimited largely to narrative accounts ofcertain issues, such as sexual exploita-tion, trafficking and domestic violence;
! The exercise of reproductive rights hasnot been realized, owing to a lack ofawareness and knowledge of the entitle-ments of women; public education cam-paigns have not focused on appropriatecontent and dissemination modalities.
! The full participation of women in deci-sion-making processes at the political andadministrative levels has not beenachieved. In most countries, parliamen-tary representation of women has beenless than 10%.
! Action plans developed were not clearlylinked to the intended outcomes.
The main hurdle in implementing these planslies largely in the fact that very little effort hasgone into reforming social and institutionalstructures that implement the programmes ofaction. The result is that there is much changein language with little change in content. Gen-der relations are a product of the ways inwhich institutions are organised and recon-stituted over time. Although the institution offamily and kinship in households and ex-tended family networks are the primary locus
of gender relations, the processes throughwhich gender inequalities are socially con-structed go well beyond these structures intoa wide range of high-level governance insti-tutions, whose organisation has changed littleover time (Kabeer 1999). Despite significantefforts made in the policy, programme, andstrategy formulation, we have yet to deal withthe institutional construction of gender in-equality, even as we make legal provision forequal opportunities.
Achievements insocioeconomic statusClosing the gender gap in education: En-rollment has improved for both girls and boysin regions where girls’ enrollment had beensignificantly lower: Northern and sub-Sa-haran Africa, and South and West Asia. Atthe secondary level, the female/male ratiohas exceeded 100 in Maldives and Sri Lankain South Asia; in Brunei Darussalam, Ma-laysia, Myanmar and the Philippines inSouth-East Asia. At the tertiary level, femaleenrollment has exceeded that of males inBrunei Darussalam, Mongolia, Myanmarand the Philippines, and in Northern andCentral Asian countries, as well some coun-tries in the Pacific (tables 4.1 and 4.2).
While enrollment has been almost universalat the primary level, at the secondary andtertiary levels, girls still lag behind boys inmost South Asian countries, in some East andSouth-East Asian countries (Cambodia,China, Indonesia, Lao People’s DemocraticRepublic, Republic of Korea) and countriesin the Pacific. While significant gains havebeen made in tertiary education, the enroll-ment levels are still below 20% in many coun-tries of the region, with male levels exceed-ing those of females.

G E N D E R A N D H U M A N D E V E L O P M E N T 95
TABLE 4.1 Ratio of girls to boys in primary, secondary and tertiary education
Selected Primary education Secondary Tertiary Ratio of literate Net enrollment ratiocountries/regions education education females to males of females to males
1990/91 2000/01 2000/01 2000/01 1990 2000/01 2000/01
Afghanistan 0.52 - - - - - -
Bangladesh 0.81 0.96 0.99 0.51 0.65 0.71 1.02
Bhutan - 0.86 0.81 0.52 - - -
India 0.71 0.77 0.66 0.61 0.74 0.82 -
Iran 0.81 0.91 0.86 0.89 0.88 0.95 0.98
Maldives - 0.95 1.05 - 1.00 1.00 1.01
Nepal 0.56 0.79 0.69 0.25 0.41 0.57 0.87
Pakistan 0.48 0.55 0.63 0.38 0.49 0.60 0.74
Sri Lanka 0.93 0.94 1.03 - 0.98 1.00 1.00
Southern countries - - - - 0.89 0.91 0.93
Least developed - - - - 0.72 0.81 0.90countries
East Asia and - - - - 0.96 0.98 1.01the Pacific
South Asia - - - - 0.72 0.80 0.84
Sub-Saharan Africa - - - - 0.80 0.89 0.92
Central and East - - - - 1.00 1.00 1.02Europe and CIS
OECD - - - - - - 1.00
Source: UNDP 2003.
Gender differentials in economic participa-tion: Women’s participation in the labourforce has increased in almost all regions ofthe world, largely because women’s use offamily planning has enabled them to spendless time on child care and more on workoutside the home; attitudes toward the em-ployment of women have changed; and newpolicies in some countries on family andchild care favour working women. In addi-tion, economic growth and the expansion ofservice industries (like finance, communica-
tions, and tourism) that tend to employ largenumbers of women have increased. How-ever, the increase in women’s labour forceparticipation has not led to an equal sharingof the work burden or market opportunitiesfor women (figure 4.5). Nor has more paidwork led to a reduction in unpaid work.Women still contribute most family work (fig-ure 4.6) and are unpaid for these tasks – areality irrespective of the socioeconomic de-velopment of the country. For instance, inSingapore, women contribute on average

96 R E A D I N G S I N H U M A N D E V E L O P M E N T
TABLE 4.2 Gender inequality in education in selected countries and regions
Countries Adult literacy Net primary Net secondary Gross tertiaryenrollment enrollment enrollment
Female rate Female rate Female Ratio of Female Ratio of Female Ratio of(% age 15 as % of ratio female ratio females ratio femalesand above male rate (%) to males (%) to males (%) to males
2001) 2001 2000/01 2000/01 2000/01 2000/01 2000/01 2000/01
High humandevelopment
Hong Kong (China) 89.6 92 98 1.00 72 1.02 26 0.99
Singapore 88.7 92 - - - - - -
Korea, Republic of 96.6 97 100 1.01 91 1.00 57 0.59
Medium humandevelopment
Bangladesh 30.8 62 90 1.02 44 1.05 5 0.55
Bhutan - - - - - - - -
China 78.7 85 95 1.03 - - - -
Iran 70.2 84 73 0.98 - - 10 0.93
Maldives 96.9 100 99 1.01 33 1.13 - -
Myanmar 81.0 91 83 0.99 35 0.95 15 1.75
Philippines 95.0 100 93 1.01 57 1.18 33 1.10
Sri Lanka 89.3 94 97 1.00 - - - -
India 46.4 67 - - - - 8 0.66
Low humandevelopment
Nepal 25.2 42 67 0.87 - - 2 0.27
Pakistan 28.8 49 56 0.74 - - - -
Mozambique 30.0 49 50 0.85 8 0.68 (.) 0.79
Selected regions
Southern countries 67.1 82 79 0.93 - - - -
Least developed 43.8 70 57 0.90 - - - -countries
Arab States 48.8 68 73 0.90 - - - -
East Asia and the Pacific 81.3 88 93 1.01 - - - -
Latin America and 88.2 98 96 0.99 - - - -the Caribbean
South Asia 44.8 67 72 0.84 - - - -
Sub-Saharan Africa 54.5 77 56 0.92 - - - -
Central and East 99.1 99 91 1.02 - - - -Europe and CIS
High-income OECD - - 98 1.00 - - - -
Source: UNDP 2003 and 2004a.
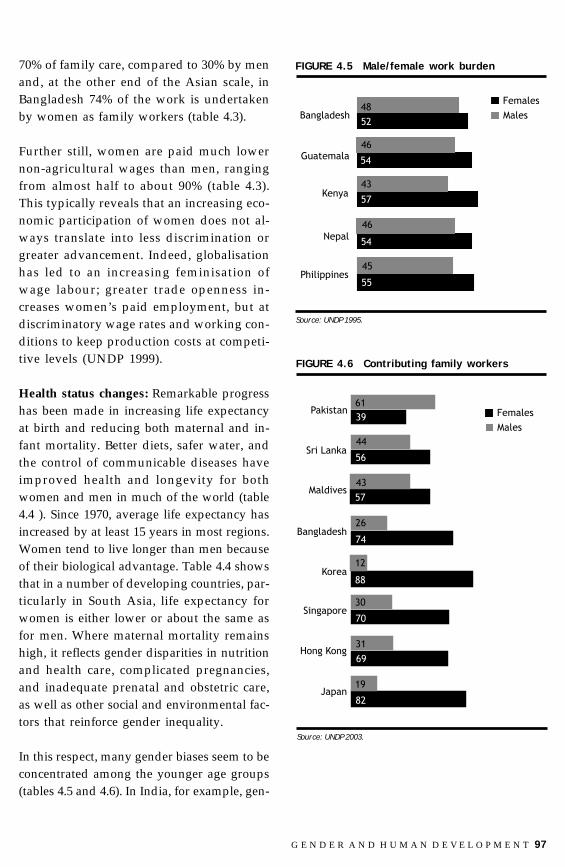
G E N D E R A N D H U M A N D E V E L O P M E N T 97
70% of family care, compared to 30% by menand, at the other end of the Asian scale, inBangladesh 74% of the work is undertakenby women as family workers (table 4.3).
Further still, women are paid much lowernon-agricultural wages than men, rangingfrom almost half to about 90% (table 4.3).This typically reveals that an increasing eco-nomic participation of women does not al-ways translate into less discrimination orgreater advancement. Indeed, globalisationhas led to an increasing feminisation ofwage labour; greater trade openness in-creases women’s paid employment, but atdiscriminatory wage rates and working con-ditions to keep production costs at competi-tive levels (UNDP 1999).
Health status changes: Remarkable progresshas been made in increasing life expectancyat birth and reducing both maternal and in-fant mortality. Better diets, safer water, andthe control of communicable diseases haveimproved health and longevity for bothwomen and men in much of the world (table4.4 ). Since 1970, average life expectancy hasincreased by at least 15 years in most regions.Women tend to live longer than men becauseof their biological advantage. Table 4.4 showsthat in a number of developing countries, par-ticularly in South Asia, life expectancy forwomen is either lower or about the same asfor men. Where maternal mortality remainshigh, it reflects gender disparities in nutritionand health care, complicated pregnancies,and inadequate prenatal and obstetric care,as well as other social and environmental fac-tors that reinforce gender inequality.
In this respect, many gender biases seem to beconcentrated among the younger age groups(tables 4.5 and 4.6). In India, for example, gen-
FIGURE 4.5 Male/female work burden
Source: UNDP 1995.
FIGURE 4.6 Contributing family workers
Bangladesh
Guatemala
Kenya
Nepal
Philippines
Females
Males52
54
57
54
55
48
46
43
46
45
Source: UNDP 2003.
Bangladesh
Maldives
Sri Lanka
Pakistan39
Korea
Singapore
Hong Kong
Japan
61
56
57
74
88
70
69
82
44
43
26
30
31
19
Females
Males
12

98 R E A D I N G S I N H U M A N D E V E L O P M E N T
TABLE 4.3 Women’s economic participation in selected countries and regions
Countries/regions Female eco. activity rate Contributing Female Women’s non-(15 yrs. and above) family share of agricultural
2001 workers non-agri- wages ascultural wage % of men’s4
employment(%)
Rate Index As % of Female as Male as 1990 2001(1990=100) male rate % of total % of total
2000 1995-01 1995-01
High humandevelopment
Hong Kong (China) 50.9 104 65 69 31 41 46 69.5
Singapore 50.1 99 64 70 30 43 47 71.1
Korea, Republic of 53.6 110 70 88 12 38 41 53.5
Medium humandevelopment
Bangladesh 66.4 101 76 74 26 18 23 53.5
Bhutan 57.1 100 65 - - - - -
Iran 29.5 134 38 - - - - -
Maldives 65.4 100 80 57 43 - 37 -
Myanmar 65.8 100 75 - - - - -
Sri Lanka 43.1 107 55 56 44 39 47 89.6
India 42.2 104 50 - - 13 17 -
Low humandevelopment
Nepal 56.8 101 66 - - - - -
Pakistan 35.8 124 43 39 61 7 8 -
Mozambique 82.7 99 92 - - - - -
Selected regions
Southern countries 55.8 101 67 - - - - -
Least developed 64.2 100 74 - - - - -countries
East Asia and 68.8 99 83 - - - - -the Pacific
South Asia 43.6 106 52 - - - - -
Sub-Saharan Africa 62.3 99 73 - - - - -
Central and East 57.8 99 81 - - - - -Europe and CIS
OECD 51.1 105 71 - - - - -
Source: UNDP 2003.
4 HDR 1995.

G E N D E R A N D H U M A N D E V E L O P M E N T 99
der differences in the food intake of youngchildren account for high female mortality.Some studies reveal that girls still receive lessaccess to health care – particularly girls bornlater in the birth order and girls born to therural families. Mortality, resulting from gen-eral illness and maternal health complica-tions, is only one visible aspect of women’shealth problems. Morbidity, the other aspectof health, is generally related to women’s re-productive functions, both biological and so-cial (the reproduction of household mainte-nance and family upkeep), whose incidenceis simultaneously more common, more haz-ardous – and largely invisible statistically.Micro studies reveal the magnitude of the prob-lem that women bear in silence, notably dis-eases related to sex and sexuality, stillstigmatised in many societies. Some studiesin Nepal showed a wide prevalence of non –pregnancy-related health problems, gyneco-logical or sexual disease. Studies reveal thatevery third Nepalese woman has health com-plications stemming from her reproductivefunctions (Pradhan 1995) – a finding sup-ported by similar studies carried out in India,
France
Egypt
Mexico
Thailand
South Korea
Brazil
Bangladesh
Sri Lanka 85
79
74
71
68
56
54
50
FIGURE 4.7 Women’s wages as a percentage ofmen’s wages in manufacturing, 1992-97
Source: UN 2000.
" Pakistan - incidence of chlamydia trachomatis in-fection varied from 2% to 18% as detected amongseries of cases of pregnant women in differenthospitals in Karachi; hepatitis E viral infectionfound among 21.6% of non-pregnant women in thereproductive age group (Hakim, et al 1998).
" India - a study in two villages in Maharastra foundthat 55% of women had one or more gynecologicalailments (Bang and Bang 1989).
" Nepal — a study in 5 districts found that 82.5% ofthe women studied suffered from RH complica-
tions such as loss of weight/appetite, weakness/inability to work, headache/giddiness, constantfever, bleeding, uterus prolapse, vaginal dis-charge/burning and frequent micturition etc– av-eraging 2.2 diseases per women (Pradhan 2003).
" A community study of gynecological and relatedmorbidity in rural Egypt among a sample of 500rural women revealed a high prevalence of repro-ductive morbidity (96%). Half the women werefound to suffer reproductive tract infections (RTI)and nearly two-thirds suffered from anemia(Younis, et al 1993).
BOX 4.3 Gynecological and other diseases among women
5 Malnutrition, defined as ill health caused by deficiencies of calories, proteins, vitamins, and minerals interacting with infections andother poor health and social conditions, saps the strength and well-being of millions of women and adolescent girls around the world.
Pakistan and Egypt (box 4.3) that point to agross neglect of women’s health.
Weak links between national income andwomen’s nutrition status are another criticalfactor.5 India and Bolivia, for example, have simi-lar GDP, but 36% of Indian women are under-weight, compared to 1% of Bolivian women.
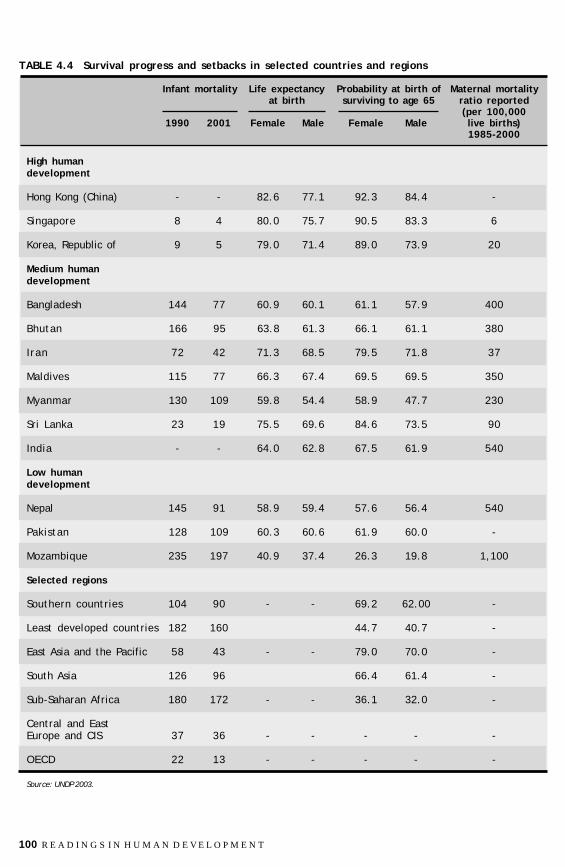
100 R E A D I N G S I N H U M A N D E V E L O P M E N T
TABLE 4.4 Survival progress and setbacks in selected countries and regions
Infant mortality Life expectancy Probability at birth of Maternal mortalityat birth surviving to age 65 ratio reported
(per 100,0001990 2001 Female Male Female Male live births)
1985-2000
High humandevelopment
Hong Kong (China) - - 82.6 77.1 92.3 84.4 -
Singapore 8 4 80.0 75.7 90.5 83.3 6
Korea, Republic of 9 5 79.0 71.4 89.0 73.9 20
Medium humandevelopment
Bangladesh 144 77 60.9 60.1 61.1 57.9 400
Bhutan 166 95 63.8 61.3 66.1 61.1 380
Iran 72 42 71.3 68.5 79.5 71.8 37
Maldives 115 77 66.3 67.4 69.5 69.5 350
Myanmar 130 109 59.8 54.4 58.9 47.7 230
Sri Lanka 23 19 75.5 69.6 84.6 73.5 90
India - - 64.0 62.8 67.5 61.9 540
Low humandevelopment
Nepal 145 91 58.9 59.4 57.6 56.4 540
Pakistan 128 109 60.3 60.6 61.9 60.0 -
Mozambique 235 197 40.9 37.4 26.3 19.8 1,100
Selected regions
Southern countries 104 90 - - 69.2 62.00 -
Least developed countries 182 160 44.7 40.7 -
East Asia and the Pacific 58 43 - - 79.0 70.0 -
South Asia 126 96 66.4 61.4 -
Sub-Saharan Africa 180 172 - - 36.1 32.0 -
Central and EastEurope and CIS 37 36 - - - - -
OECD 22 13 - - - - -
Source: UNDP 2003.

G E N D E R A N D H U M A N D E V E L O P M E N T 101
EMERGING ISSUES IN GENDERINEQUALITIES AND GLOBALCONCERNS
In addition to the gender inequalities in theconventional socioeconomic indicators ofprogress, new forms of exploitation andmarginalisation of women have emerged.These are related to addressing social andgender inequalities, which stem from the ideo-logical values of the social construction ofgender that shape and reconstruct gender re-lations even under changed circumstances.
Globalisation and marginalisation ofwomen’s employment: Significant changesin the world economy, such as theglobalisation process, which involves openmarket economies, the free flow of capital andcommodities, the unchecked power oftransnational corporations, and a growinginformalisation of work has resulted in un-even development and economic relations(Sen 1998). Globalisation has reinforced ex-isting imbalances between and within coun-tries, contributing to further impoverishment,particularly among Southern women.Women comprise an increasing share of theworld’s work force – at least one third in al-most all regions (with perhaps with an ex-ception of North Africa and West Asia). Thefeminisation of employment in Southerncountries includes self-employment andpart-time and home-based workcharacterised by a lack of job security, lack ofbenefits and low income. Increasing num-bers of women are entering into informal sec-tor at low wages in exploitative work condi-tions. They remain at the lower end of a seg-regated labour market and continue to beconcentrated in low-paying occupations at
TABLE 4.5 More girls die than boysat a young age (annual deaths per1000 children aged 1-4 years, 1984-90)
Countries Girls Boys Girls’ death as% of boys’
Singapore 0.5 0.4 125
Maldives 9.3 7.8 119
Egypt 6.6 5.6 118
Grenada 1.6 1.4 114
Pakistan 9.6 8.6 112
Bangladesh 15.7 14.2 111
Suriname 2.2 2.0 110
Jamaica 1.5 1.4 107
Guatemala 11.3 10.6 107
Honduras 2.9 2.8 104
Syrian Arab Republic 2.9 2.8 104
Algeria 12.8 12.5 102
Peru 5.7 5.6 102
Source: UNDP 1995.
TABLE 4.6 Under-5 mortality rates
Countries Male Female Ratio
Bangladesh 106 116 1.09
Bhutan 98 94 0.96
India 82 97 1.18
Maldives 53 80 1.51
Nepal 110 124 1.13
Pakistan 108 104 0.96
Sri Lanka 22 20 0.91
South Asia 86.9 99.0 1.14
Source: HDC 1995.

102 R E A D I N G S I N H U M A N D E V E L O P M E N T
discriminatory wage rates. Employers seewomen as more manageable and subservi-ent than men, more willing to accept lowerwages, and easier to dismiss, particularlywhen economies experience recession.
Female-headed households: The proportionof female-headed households is rising glo-bally; for a variety of reasons – includingarmed conflicts, men’s migration for workand widowhood among older women – thesehouseholds are typically poorer than thoseheaded by men. Female-headed householdsaccount for one-quarter or more of house-holds in eastern and southern Africa, theCaribbean, North America, and parts of Eu-rope and Central Asia. Women-headedhouseholds result from divorce, widowhood,men’s migration for work, war and otherarmed conflicts, and unmarried women whobegin childbearing. Elderly women livingalone account for a growing proportion offemale-headed households.
Women who head households suffer fromthe triple disadvantage of supporting thehousehold, gender discrimination and lowsocioeconomic status. However, femalehousehold headship does not always corre-late with poverty, as some receive remittancesfrom husbands working elsewhere and someexist in the higher socioeconomic brackets.A clear definition of household headship isneeded: is it de facto or de jure?
The feminisation of poverty: The relation-ship between gender and poverty is both com-plex and controversial. After Dian Pearce’swork on ‘feminisation’ of poverty (1970), alarge body of literature has appeared, debat-ing the issue as well as challenging the valid-ity of the concept in the absence of adequatedata (Marcoux 1998; Staudt 1998). However,
human development has broadened the con-cept from “income” poverty to “human” pov-erty, which refers to the denial of opportuni-ties and choices for living a “decent” or “tol-erable” life (see chapters 1 and 8). From thisviewpoint, a definite trend towards thefeminisation of poverty is taking place bothquantitatively and qualitatively.
Women’s increased participation in thelabour force has resulted in a feminisationof wage labour, exploitative conditions andrisks of dismissal evictions and so on. Socio-cultural and gender factors constrainwomen from enhancing their capabilities,among these the expansion of life expect-ancy, better health, higher levels of educa-tion, better quality of living, and improve-ment in their decision-making capacity toexercise their right to choices. This showsthat even increases in the distribution ofsocioeconomic variables, such as access toincome and employment, health services,resources/credit, and the provision of equalopportunities/affirmative action, result inunequal outcomes and deprivation ofwomen compared to men.
Several scholars have used the female-headed household as an indicator of thehigher incidence of poverty among womencompared to men. However, this indicatoris not straightforward and data are not eas-ily comparable for assessing comparativepoverty situation of women and men. Sev-eral studies have pointed out to the vari-ability of female-headed-households, themethodological and data problems in de-termining the incidence of female poverty,and the extent of the feminisation of pov-erty worldwide. However, what is clear is acommon agreement on women’s greatervulnerability to poverty within social

G E N D E R A N D H U M A N D E V E L O P M E N T 103
classes in association with the existence ofgender inequalities and gender biases inhousehold allocations of resources (includ-ing property rights), in public policies, andin legislation (Moghadam 1998). Lack ofproperty rights in land or access to employ-ment, lower wages/income, illiteracy, earlymarriage and early childbearing, divorce,continuing gender gaps in educational at-tainment, and higher life expectancy areamong the reasons why women-headedhouseholds are most likely to be vulnerableto poverty and less likely to be able to copewith these circumstances without well-de-signed support programmes that, inter alia,promote self-esteem.
Further, women’s increasing concentrationin subsistence agriculture also points to thefeminisation of poverty because they havebeen bypassed by technological change andother forms of modernisation. Boserup wasthe first to examine these trends (1970). Sinceher analysis, statistical data and a vast bodyof feminist scholarship has amply docu-mented evidence of the feminisation of agri-culture. Jiggens (1998), using measures suchas labour force participation, agricultural ac-tivity, allocational priorities, adjustment inthe structures of economies in competitionwith world markets, and poverty profilesshow a feminisation of agriculture. For in-stance, when women’s compensated labourand unwaged household production labourare aggregated, the general picture revealsthat female participation in agriculturalwork outstrips that of men. Further, womenfarmers typically are concentrated in thelow-input, low-return, non-export end of theproduction spectrum; essentially, they arenot regarded by public sector agencies asfarmers at all. Conversely, the increase infemale agricultural labour participation
rates is also in part a simple indicator of theincreasing poverty among women. The risein the number and proportion of rural house-holds headed by women is one measure ofthis trend.
Increasing gender-based violence: The un-derstanding of GBV has improved dramati-cally in the last decade. International instru-ments, such as the ICPD Programme of Ac-tion, the Beijing Platform for Action and theConvention on the Elimination of all Form ofDiscrimination against Women situated “vio-lence against women” squarely within thehuman rights discourse. However, the mag-nitude of GBV cannot be adequately ascer-tained, owing to the “culture of silence” andthe social stigma attached to it. It nonethe-
AfricaNorthern Africa 12Southern Africa 42Rest of sub Saharan Africa 21
Latin America and the CaribbeanCaribbean 36Central America 22South America 22
AsiaEastern Asia 22South-eastern Asia 19Southern Asia 9Central Asia 24Western Asia 10
Oceana 15
Developed regionsEastern Europe 27Western Europe 29Other developed regions 31
Source: UN 2000.
BOX 4.4 Percentage of women-headedhouseholds in different regionsof the world

104 R E A D I N G S I N H U M A N D E V E L O P M E N T
less exists in many forms, including house-hold beatings, marital rape and sexual as-sault, prostitution, trafficking and the sexualexploitation of women in armed conflict situ-ations (box 4.5 and 4.6). The consequencesare manifold, ranging from the denial of fun-damental rights to adverse effects on repro-ductive and mental health, children’s well-being and women’s productivity.
As indicated above, an increasing recogni-tion of GBV as a public health issue has re-cently taken place and efforts have been madeto link GBV with reproductive health ser-vices so as to deal with the problem withinhealth facilities. UNFPA, for example, piloteda project in integrating GBV with reproduc-tive health facilities in ten countries.6 Clini-cal data recorded on the GBV victims in thefour selected countries reveal the following(AIDOS 2004):! Of the patients coming into the RH clin-
ics/hospitals, victims of GBV rangedfrom 10.5% in Nepal to 47.7% inMozambique.
! Across all cultures and countries, irre-spective of socioeconomic development,women suffer from GBV.
! There was no age bar in the exposure ofwomen to GBV, but those most at riskranged from 20 to 35 years old.
! Unemployed women are more likely toface violence.
Women with a larger number of childrenface risks equal to those with fewer childrenor none.
Table 4.7 provides the forms, causes andhealth consequences of the GBV. In all fourcountries, most perpetrators are the
Prostitution, Slavery and Trafficking
2 million women in Prostitution in India
20,000 in Myanmar and Thai brothels
200-400 young women trafficked from Bangladeshevery year
17,000 Nepali girls are trafficked to neighboringcountries
8-10,000 girls are trafficked to Japan from Thailand
200 domestic workers seeking shelter in onemonth in Philippines and Sri Lanka
Traditional PracticesDowry Deaths 11,259 in India (it is
increasing)
Sex Selective Abortion 78,000 female (1983)i.e. 95.5%
abortion cases werefemales
FGM in Middle East, 85-114 million
Africa and Asia
Worldwide 130 million
Missing females in Asia 60 million
Source: Pradhan 2000.
BOX 4.6 Beliefs and practicesresulting in GBV
In every country where studies have been con-ducted, results indicate the following picture (in-cluding both Northern and Southern countries).
Domestic Violence (Physical Abuse) — from 16% to52% of women have been assaulted by intimate. InSri Lanka, 60% of women respondents reportedbeing subject to violence Rape and Sexual Abuse —40-58% of the women aged 15 or less.
Hit by Inmate In industrialised countries 17-59%
Latin America and 20-60%Caribbean
Asia and the Pacific 38-60%
Child Abuse and Incest 36-62%
Source: AIDOS 2004.
BOX 4.5 Extend and forms of genderbased violence (GBV)
6 A Practical Approach to GBV: A Programme Guide for Health Care Providers and Managers, was developed and piloted in 10countries in 2001: Cape Verde, Guatemala, Lebanon, Lithuania, Mozambique, Nepal, Romania, Ecuador and Sri Lanka. This is aninnovative and practical strategy to assist victims of violence by integrating the assessment and treatment of GBV into RH services.At the end of the field-testing, an evaluation was carried out in the Lebanon, Mozambique, Nepal and Romania.

G E N D E R A N D H U M A N D E V E L O P M E N T 105
women’s own husbands and close familymembers; the main cause of violence isspousal conflict and the alcoholism of hus-bands and other male family members.GBV has serious health consequences forwomen – often multiple consequencesranging from gynecological problems,early and unwanted pregnancy, physicalinjury and severe depression. The childrenof those abused are also far more likely tobecome abusers themselves or to tolerateGBV. All in all, GBV leads to anintergenerational denial of capability en-hancement.
Women in conflict situations: The growingmilitarisation and escalation of differentforms of violence the world over has in-
creased GBV significantly. The growing vio-lence in South Asia is pushing back the de-velopmental agenda and people’s healthand well-being at both the national and re-gional levels – the political conflict in Kash-mir, as well as the violence against Dalits inIndia, the political and cultural conflictsbetween the Bangladeshi government andtribal communities in the Chittagong hilltracts, the conflict between extremist reli-gious groups of the majority Sunni and mi-nority Shia communities in Pakistan, or ofHindus and Muslims in India; and politi-cal conflict between the Nepalese govern-ment and the Maoist rebels. In addition,opposition to destructive development poli-cies and projects and resistance toprivatisation often erupts into violence.
TABLE 4.7 Socio-demographic background ofgender based violence (GBV) clients in four countries (% in parenthesis)
Socio-demographic characteristic Lebanon Mozambique Nepal Romania
1. Number of persons screened 1419 899* 514 400
2. Number of GBV victims 495 (34.9) 429 (47.7) 54 (10.5) 48 (12.0)
3. Age of GBV Clients
a) Age group 20-35 248 (50.0) 256 (59.7) 29 (53.7) 16 (33.3)
b) Age group >35 220 (44.4) 83 (19.4) 13(24.0) 21 (43.8)
4. Education
a) Literate - - 23 (46.9) 1 (2.2)
b) Secondary/higher secondary 212 (42.8) NA 18 (36.7) 36 (80.0)
5. Marital status: Married 407 (84.4) 290 (68.0) 41 (76.0) 18 (44.0)
6. Occupation of GBV clients
a) Not employed/housewife 379 (85.0) NA 28 (52.0) 10 (20.8)
b) Working 61 (15.0) NA 25 (46.3) 38 (79.2)
7. Mean number of children 4.22 NA 1.5 1.1
Source: Pradhan 2004.* Cases of any violence.Note: Figures in parentheses are percentage of screened persons.
106 R E A D I N G S I N H U M A N D E V E L O P M E N T
Moreover, the immense growth of religiousfundamentalism in the region – particularlyits union with party politics – has openedanother arena of potential and actual vio-lence. It also shapes popular perceptions thatlegitimise contestation, social tension anddisruption. At the root of this violence lie thepersisting inequalities and the widespreaddestruction and destabilisation of the sub-sistence base of a majority of women andmen. These conflicts have impacted womenand girls far more than men and boys; aslivelihoods and incomes are threatened,families break up, general insecurity in-creases and those who occupy subordinatepositions in either the household or societybecome far more vulnerable to additionalthreats of physical violence and/or dispos-session. Gender oppression and violence isnow a noted concern in many of the conflicts.
In cultures where honour is closely tied towomen’s sexuality, they systematically be-come GBV targets; rape and other sexual as-saults have become acknowledged weap-ons of war or tactics to threaten the identi-ties and structures of families and commu-nities. Economic and social insecurity of-ten compels women to engage in transac-tional sex to keep their families safe or toobtain water, food, or shelter. To take ex-amples from South Asia, a 2003 study con-ducted in Nepal by women’s rehabilitationcentre, an NGO, showed the breadth of theimpacts of the Maoist conflict and their mul-tidimensionality for women: the loss ofloved ones and the loss of livelihoods andfamily networks, as well as the increase inwomen’s physical and social vulnerability.Rape, sexual assault, illegal arrest and kid-napping all lead to crippling individualwomen, psychologically and/or physically,destroying families and the social fabric of
whole communities. In Kashmir, decades ofconflict have lead to prolonged trauma withparticular repercussions for women, so-cially the “half-widows”. The social disrup-tion has resulted in women’s taking on newroles and added responsibilities withoutcommunal or public acknowledgement ofthe functions they have been forced to as-sume (SID-SAN Seminar, Kathmandu, 2003)In India, women’s movements continue tograpple with the deep level of violence –indeed, open sadism - experienced byGujurat Muslim women, where deep-seatedethnic and gender prejudice was fueled byeconomic and political inequities (SID-SANSeminar, Kathmandu 2003).
Not only the immediate issues of the vio-lence – whether perpetrated by women ormen – but also the longer-term processes ofeconomic, social and cultural disruptionand the erosion of human capability need tobe addressed. Essential services such as edu-cation and health care, including reproduc-tive health, are disrupted or unavailable.Studies describe how women walk manykilometres to give birth or seek treatment, onlyto arrive at hospitals with no supplies or staffto provide adequate care.
Livelihoods are also threatened or destroyed.As one observer in southern Sri Lanka stated:“The lives of the women and motherschanged drastically. They could go abouttheir daily business only while daylightlasted. The nights were spent hiding in thejungles … Some men remained hidden in thevillage on the lookout for the rampaging Lib-eration Tiger of Tamil Eelam cadres, and theothers were guarding the women and chil-dren in the jungle. The men got their sleep inthe daytime. This put the burden of provid-ing for the family on the woman. She became
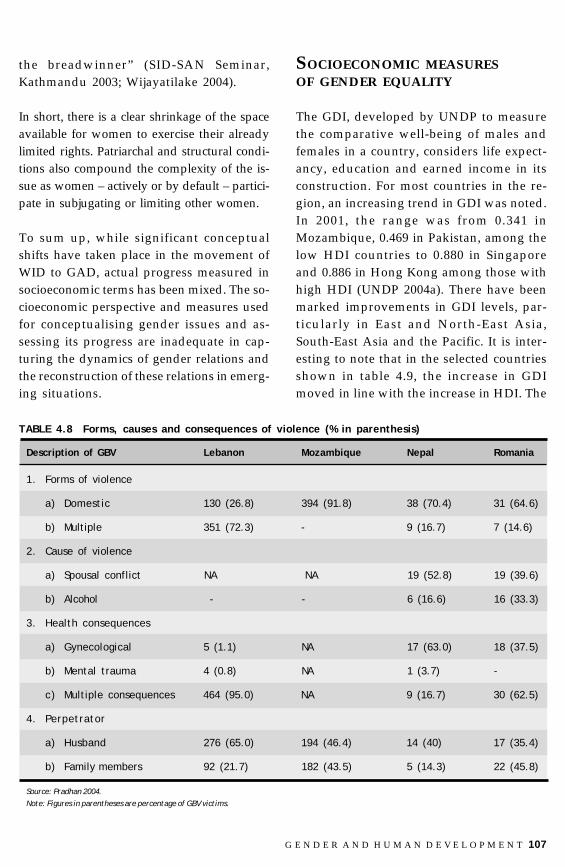
G E N D E R A N D H U M A N D E V E L O P M E N T 107
the breadwinner” (SID-SAN Seminar,Kathmandu 2003; Wijayatilake 2004).
In short, there is a clear shrinkage of the spaceavailable for women to exercise their alreadylimited rights. Patriarchal and structural condi-tions also compound the complexity of the is-sue as women – actively or by default – partici-pate in subjugating or limiting other women.
To sum up, while significant conceptualshifts have taken place in the movement ofWID to GAD, actual progress measured insocioeconomic terms has been mixed. The so-cioeconomic perspective and measures usedfor conceptualising gender issues and as-sessing its progress are inadequate in cap-turing the dynamics of gender relations andthe reconstruction of these relations in emerg-ing situations.
SOCIOECONOMIC MEASURESOF GENDER EQUALITY
The GDI, developed by UNDP to measurethe comparative well-being of males andfemales in a country, considers life expect-ancy, education and earned income in itsconstruction. For most countries in the re-gion, an increasing trend in GDI was noted.In 2001, the range was from 0.341 inMozambique, 0.469 in Pakistan, among thelow HDI countries to 0.880 in Singaporeand 0.886 in Hong Kong among those withhigh HDI (UNDP 2004a). There have beenmarked improvements in GDI levels, par-ticularly in East and North-East Asia,South-East Asia and the Pacific. It is inter-esting to note that in the selected countriesshown in table 4.9, the increase in GDImoved in line with the increase in HDI. The
TABLE 4.8 Forms, causes and consequences of violence (% in parenthesis)
Description of GBV Lebanon Mozambique Nepal Romania
1. Forms of violence
a) Domestic 130 (26.8) 394 (91.8) 38 (70.4) 31 (64.6)
b) Multiple 351 (72.3) - 9 (16.7) 7 (14.6)
2. Cause of violence
a) Spousal conflict NA NA 19 (52.8) 19 (39.6)
b) Alcohol - - 6 (16.6) 16 (33.3)
3. Health consequences
a) Gynecological 5 (1.1) NA 17 (63.0) 18 (37.5)
b) Mental trauma 4 (0.8) NA 1 (3.7) -
c) Multiple consequences 464 (95.0) NA 9 (16.7) 30 (62.5)
4. Perpetrator
a) Husband 276 (65.0) 194 (46.4) 14 (40) 17 (35.4)
b) Family members 92 (21.7) 182 (43.5) 5 (14.3) 22 (45.8)
Source: Pradhan 2004.Note: Figures in parentheses are percentage of GBV victims.

108 R E A D I N G S I N H U M A N D E V E L O P M E N T
differences between the two measures con-sistently narrowed over the period 1995-2001, indicating progress in gender equal-ity. This can be largely attributed to in-creases in literacy, educational attainmentand life expectancy in these countries.However, the pattern of improvement inthe GEM differs.
In 2001, GEM ranged from 0.218 inBangladesh to 0.594 in Singapore. Al-though, GEM has increased in general, withthe exception of a few countries likeBangladesh and Sri Lanka, it does not fol-low the HDI pattern as does GDI. The in-crease in GEM was higher among countrieswith lower levels of human development,such as Nepal, Pakistan and Mozambiquethan among countries with higher and me-dium levels of human development. Thisreveals that measures of empowerment donot necessarily correlate with income andeducation. In some countries likeBangladesh and Sri Lanka, GEM has de-creased despite increases in GDI and HDI.This trend supports the findings of Seguino(2002) that gender equality in quality of liferatings is highest in those Asian economiesthat grew most slowly from 1995-2001.Women’s bargaining power and spendingon public education have a greater effect onrelative female life opportunities than eco-nomic growth. These trends in GDI andGEM call into question the sensitivity ofthese measures to subtle gender inequali-ties and their robustness in reflecting therealities facing women and their generalconditions of subordination, for the follow-ing reasons:! Implicit in the human development in-
dicators is the assumption that increasesin the socioeconomic variables – the par-ticipation of women in employment, im-
proved health status, as measured by lifeexpectancy at birth, and literacy and edu-cational attainment of women – shouldnecessarily result in improved condi-tions or the well-being of women. How-ever, as discussed above, improvementin employment, health and the educa-tional situation of women present amixed picture. Moreover macro improve-ments have not necessarily resulted inconcomitant improvements either inwomen’s lives or their day-to-day livingconditions.
! Both GDI and GEM assume that socialinequalities and women’s subordinationderive from the social structure in whichthey exist and therefore that any mar-ginal shift in the variables of each indi-cator will affect that overall structure.However, if agency is an important com-ponent in human development, changewill come about not through a massivesum of individual choices, but the col-lapse of the very system that constrainsthis choice. The very construction of bothGDI and GEM takes no account ofagency, i.e. the exercise of any or all ofthe individual capabilities.
! Infant/child mortality and life expect-ancy at birth are taken as measures ofgeneral health status and people’s qual-ity of life. The rationale for using healthas an indicator is that a reduction inmortality would indicate access tohealth services and adequate nutrition,i.e., that life expectancy at birth canserve as a proxy for the capability func-tion of healthy individuals. While thisis generally true, it applies only par-tially to women in developing coun-tries, particularly in South Asia. Sim-ply reducing average mortality ratesdoes not necessarily indicate improve-

G E N D E R A N D H U M A N D E V E L O P M E N T 109
ment in health conditions or in raisingthe quality of life of women. Even withimproved mortality and longevity,women may still be deprived of basichealth services or nutrition because ofa) women’s particular health needs inrelation to their reproductive functions;b) gender biases in the formulation of
health policies and programmes; andc) gender biases in social and culturalpractices that begin very early in life.Average life expectancy cannot ad-equately capture the morbidity associ-ated with a neglect of reproductivehealth needs or women’s responses tosuch adversities.
TABLE 4.9 Trends in HDI, GDI and GEM in selected countries
Countries HDI GDI GEM
1995 2001 1995 2001 1995 2001
High human development
Hong Kong (China) 0.875 0.889 0.854 0.886 - -
Singapore 0.858 0.884 0.822 0.880 0.424 0.594
Korea, Republic of 0.848 0.879 0.780 0.873 0.255 0.363
Medium human development
Bangladesh 0.443 0.502 0.334 0.495 0.287 0.218
Bhutan 0.305 0.511 - - - -
China 0.578 - 0.474 -
Iran 0.690 0.719 0.611 0.702 0.237 0.3007
Maldives 0.554 0.751 0.522 - 0.294 0.312
Myanmar 0.457 0.549 0.448 - - -
Philippines 0.731 0.751 0.625 0.748 0.435 0.539
Sri Lanka 0.715 0.730 0.660 0.726 0.288 0.272
India 0.553 0.590 0.401 0.574 0.226 0.2408
Low human development
Nepal 0.451 0.499 0.310 0.479 0.315 0.4419
Pakistan 0.472 0.499 0.360 0.469 0.153 0.414
Mozambique 0.325 0.356 0.229 0.341 0.350 0.42810
Source: UNDP 1995 and 2003.
7 Figure taken from Iran Human Development Report of Iran, 1999.8 Figure taken from HDR 1999.9 Nepal Human Development Report 2004.10 Figure is From HDR 1999.
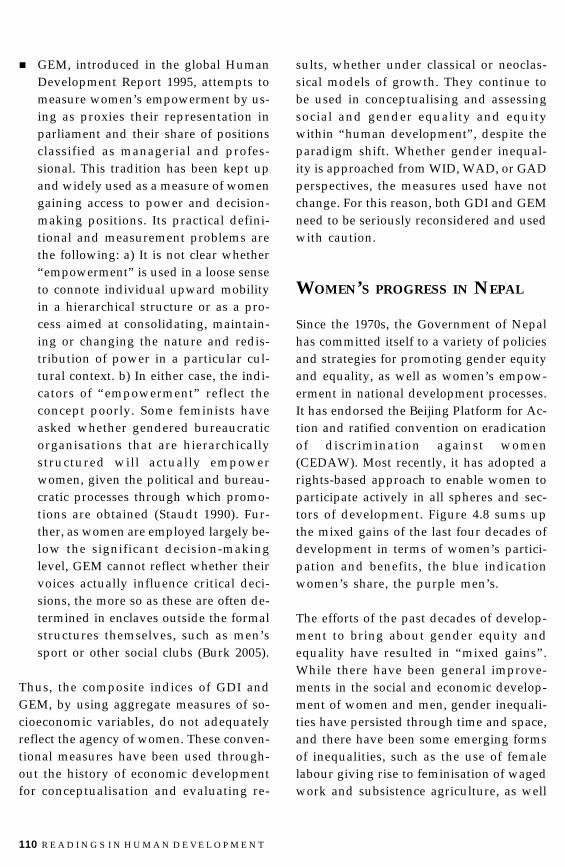
110 R E A D I N G S I N H U M A N D E V E L O P M E N T
! GEM, introduced in the global HumanDevelopment Report 1995, attempts tomeasure women’s empowerment by us-ing as proxies their representation inparliament and their share of positionsclassified as managerial and profes-sional. This tradition has been kept upand widely used as a measure of womengaining access to power and decision-making positions. Its practical defini-tional and measurement problems arethe following: a) It is not clear whether“empowerment” is used in a loose senseto connote individual upward mobilityin a hierarchical structure or as a pro-cess aimed at consolidating, maintain-ing or changing the nature and redis-tribution of power in a particular cul-tural context. b) In either case, the indi-cators of “empowerment” reflect theconcept poorly. Some feminists haveasked whether gendered bureaucraticorganisations that are hierarchicallystructured will actually empowerwomen, given the political and bureau-cratic processes through which promo-tions are obtained (Staudt 1990). Fur-ther, as women are employed largely be-low the significant decision-makinglevel, GEM cannot reflect whether theirvoices actually influence critical deci-sions, the more so as these are often de-termined in enclaves outside the formalstructures themselves, such as men’ssport or other social clubs (Burk 2005).
Thus, the composite indices of GDI andGEM, by using aggregate measures of so-cioeconomic variables, do not adequatelyreflect the agency of women. These conven-tional measures have been used through-out the history of economic developmentfor conceptualisation and evaluating re-
sults, whether under classical or neoclas-sical models of growth. They continue tobe used in conceptualising and assessingsocial and gender equality and equitywithin “human development”, despite theparadigm shift. Whether gender inequal-ity is approached from WID, WAD, or GADperspectives, the measures used have notchange. For this reason, both GDI and GEMneed to be seriously reconsidered and usedwith caution.
WOMEN’S PROGRESS IN NEPAL
Since the 1970s, the Government of Nepalhas committed itself to a variety of policiesand strategies for promoting gender equityand equality, as well as women’s empow-erment in national development processes.It has endorsed the Beijing Platform for Ac-tion and ratified convention on eradicationof discrimination against women(CEDAW). Most recently, it has adopted arights-based approach to enable women toparticipate actively in all spheres and sec-tors of development. Figure 4.8 sums upthe mixed gains of the last four decades ofdevelopment in terms of women’s partici-pation and benefits, the blue indicationwomen’s share, the purple men’s.
The efforts of the past decades of develop-ment to bring about gender equity andequality have resulted in “mixed gains”.While there have been general improve-ments in the social and economic develop-ment of women and men, gender inequali-ties have persisted through time and space,and there have been some emerging formsof inequalities, such as the use of femalelabour giving rise to feminisation of wagedwork and subsistence agriculture, as well

G E N D E R A N D H U M A N D E V E L O P M E N T 111
as greater deprivation and poverty amongwomen compared to men. Figure 4.8 pro-vides an overview of the progress made andwomen’s share of the benefits of develop-ment indicated by socioeconomic and em-powerment measures such as the propor-tion of women’s representation in admin-istrative jobs, women’s political participa-tion – represented by women in the localelections – professional jobs, labour forceparticipation, and their share of incomeearned. The purple area representswomen’s share of the benefits of develop-ment compared to the blue area that goesto their male counterparts.
If we look back over the last four decades ofNepal’s overall development, we see re-markable progress. People live much longer;they are better educated, participate in thedevelopment process much more than theyever did, and have a greater voice in thedecision-making process, as well as accessto resources/credit. However, despite theyears of effort to bring about redistributivechange favouring women, outcomes havebeen, at best, mixed. Measured by standardsocioeconomic indicators, women’s shareof the benefits of development has remainedminimal. Different surveys and studies re-veal a wide spectrum of gender gaps inhealth and education, the vulnerability ofwomen to market forces and SAPs, pro-nounced inequalities in ownership and con-trol over assets, and a comparative lack ofaccess to income, employment, and deci-sion-making positions. All these phenom-ena exist alongside a growing feminisationof poverty.
Health status: Although national censusesshow a marked improvement in life expect-
1961 1971 1981 1991 2001
70.0
60.0
50.0
40.0
30.0
20.0
10.0
0.0
Male
Female
Year
FIGURE 4.9 Life expectancy at birth
Source: HMG/N/CBS 1987, 1995 and 2004.
70
87.3
81.2 Women’s share ofbenefits of development
80.7
Participation inlocal election
Women’sprofessional jobs
62.7
First, second andthird level education
57.7
Labour forceparticipation
Women’s sharein income
Administrativejobs held
42.3
30 34.9
19.3
18.8
12.7
0
20
40
60
80
100
Male
Female
FIGURE 4.8 Progress in gender equality
Source: HMG/N/CBS 2001.
ancy at birth and infant and child mortality,women and girls remain exposed to greaterhealth risks than men. Only recently haswomen’s life expectancy reached parity withmen’s (figure 4.9). Given their biological ad-vantage, infant mortality for girls is lowerthan for boys, but the picture changes as girlsgrow older. Child mortality becomes higherfor girls than for boys. Health disadvantagesfor women and girls belonging to minorityethnic groups and Dalit castes remain evenhigher (table 4.10).

112 R E A D I N G S I N H U M A N D E V E L O P M E N T
Educational status: Nepal has also made sig-nificant strides in education since the firstcensus in 1952/54. From the 5% rate of thatcensus period, literacy rose to 54.1% in 2001(figure 4.10). Both men and women have alsoadvanced in their levels of education. None-theless, while male literacy rose from 23.6 %in 1971 to 65.5 % in 2001, the comparablefemale statistics were 3.9 % and 42.8 %. Asimilar gap exists in school enrollment andhigher education.
Labour force participation: Women’s partici-pation in employment in the non-agricul-tural sector has increased, according to in-ter-census data from 1971 to 2001 (table 4.11and figure 4.11). But male/female participa-
tion in some selected occupations reveals asubstantial increase in the participation rateof women in low-level, unstable work, whilemen’s participation in such employment de-clined substantially compared to other oc-cupations between 1981 and 2001. Duringthe inter-census periods between 1971, 1981and 2001, women appear to have replacedmen in labour-intensive and low- paid occu-pations, while men moved on to dominatetechnical/professional and higher produc-tion-oriented occupations. This suggests thatNepal is following the world trend of thefeminisation of flexible, cheap wage labour,more so as it slowly integrates into globaleconomic processes. Moreover, women arevisibly concentrating in subsistence agricul-tural occupations (from 36.4% in 1981 to49.3% in 2001, as table 4.11 indicates), as menincreasingly leave the land (a decline from64% in 1981 to 51.3% in 2001). Although thepercentage of female participation is stilllower than that of males in these occupations,their rate of increase is higher. This supportsa trend of the encouragement of private sec-tor enterprise that hires women because theyaccept lower wages than men and are moresubmissive otherwise, especially with regardto longer hours and unattractive workingconditions, including sudden, unannouncedterminations. The government’s liberal mar-ket policies, in support of economic restruc-turing, have simplified licensing and regis-tration procedures and favoured the disman-tling of regulations constraining business ac-tivities in the formal and informal sectors.Increasing numbers of women are also en-tering the work force in the manufacture oftextiles, carpet and garment industries, con-centrated in low-skill, menial and repetitivejobs. Most of these women workers are young,poor and either illiterate or with low levelsof education.
66.5Female
Total
Male
54.5
34
23.6
42.8
39.6
23.3
13.9
42.8
25
123.9
70
60
50
40
30
20
10
01971 1981 1991 2001
FIGURE 4.10 Trends in literacy rates in Nepal
Source: ICIMOD/CBS 2003.
7.2
11.1
25.2
37.3
1.83.9
9.5
20.3
Male
Female
1971 1981 1991 2001
Year
Valu
ein
%
FIGURE 4.11 Proportion of populationin non-agriculture by sex, 1971-2001
Source: ICIMOD/CBS 2003.
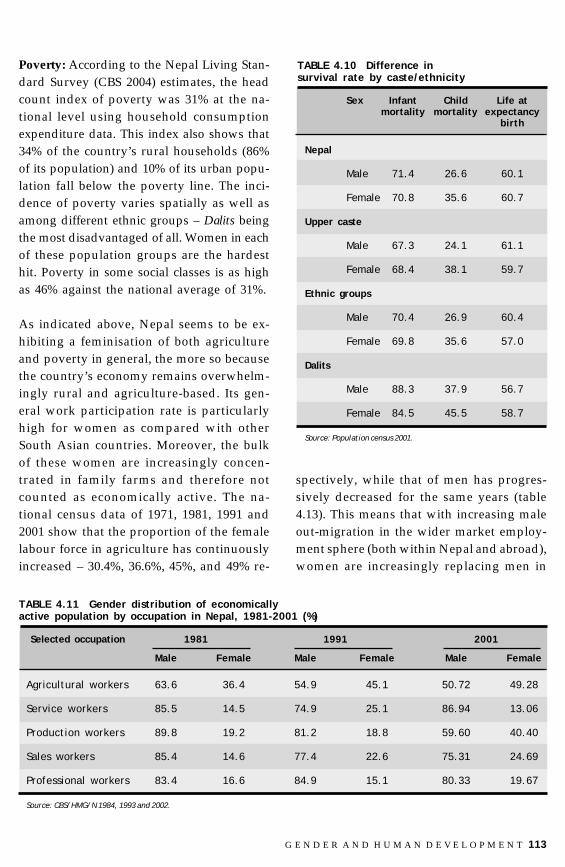
G E N D E R A N D H U M A N D E V E L O P M E N T 113
Poverty: According to the Nepal Living Stan-dard Survey (CBS 2004) estimates, the headcount index of poverty was 31% at the na-tional level using household consumptionexpenditure data. This index also shows that34% of the country’s rural households (86%of its population) and 10% of its urban popu-lation fall below the poverty line. The inci-dence of poverty varies spatially as well asamong different ethnic groups – Dalits beingthe most disadvantaged of all. Women in eachof these population groups are the hardesthit. Poverty in some social classes is as highas 46% against the national average of 31%.
As indicated above, Nepal seems to be ex-hibiting a feminisation of both agricultureand poverty in general, the more so becausethe country’s economy remains overwhelm-ingly rural and agriculture-based. Its gen-eral work participation rate is particularlyhigh for women as compared with otherSouth Asian countries. Moreover, the bulkof these women are increasingly concen-trated in family farms and therefore notcounted as economically active. The na-tional census data of 1971, 1981, 1991 and2001 show that the proportion of the femalelabour force in agriculture has continuouslyincreased – 30.4%, 36.6%, 45%, and 49% re-
spectively, while that of men has progres-sively decreased for the same years (table4.13). This means that with increasing maleout-migration in the wider market employ-ment sphere (both within Nepal and abroad),women are increasingly replacing men in
TABLE 4.10 Difference insurvival rate by caste/ethnicity
Sex Infant Child Life atmortality mortality expectancy
birth
Nepal
Male 71.4 26.6 60.1
Female 70.8 35.6 60.7
Upper caste
Male 67.3 24.1 61.1
Female 68.4 38.1 59.7
Ethnic groups
Male 70.4 26.9 60.4
Female 69.8 35.6 57.0
Dalits
Male 88.3 37.9 56.7
Female 84.5 45.5 58.7
Source: Population census 2001.
TABLE 4.11 Gender distribution of economicallyactive population by occupation in Nepal, 1981-2001 (%)
Selected occupation 1981 1991 2001
Male Female Male Female Male Female
Agricultural workers 63.6 36.4 54.9 45.1 50.72 49.28
Service workers 85.5 14.5 74.9 25.1 86.94 13.06
Production workers 89.8 19.2 81.2 18.8 59.60 40.40
Sales workers 85.4 14.6 77.4 22.6 75.31 24.69
Professional workers 83.4 16.6 84.9 15.1 80.33 19.67
Source: CBS/HMG/N 1984, 1993 and 2002.

114 R E A D I N G S I N H U M A N D E V E L O P M E N T
subsistence agriculture. However, statisticsalso show that the participation of womenin non-agricultural occupations has in-creased rapidly over the years. As to non-agricultural work, women’s participationincreased from 1.8% in 1971 to about 20.3%in 2001, while the percentages for men were7.2% in 1971 and 37.3% in 2001 – an incre-mental rate of 3.1% per year for femalesagainst 2.7% per year for males. Betweenthese two phenomena, an increasing num-ber of women are being employed in themost vulnerable sectors of the economy – byimplication, exposed to greater risks of pov-erty and deprivation and disadvantaged incomparison to their male counterparts.
The feminisation and localisation of povertyis exacerbated by the insurgency. Compa-rable variations are manifest in the incidenceof poverty by gender, women in all groupsbeing disadvantaged and deprived relativeto men. The data on increasing the depen-dency ratio in the rural areas, female-headedhouseholds and the predominance of femalesamong the internal migrant population alsopoint to an emerging rural feminisation ofpoverty. In addition, SAPs and the market-led development strategy favour urban rather
than rural development. Over the years, too,female-headed households have increasedfrom about 8% in the 1970s and 1980s to 13%in 1991 and 15% in 2001. These figures arelikely to be higher if one takes householdsmaintained by females de jure – generallythe poorest, particularly in the rural areas(Buvinic and Rao Gupta 1997).
The urban growth of Nepal’s populationhas been higher than that of the rural areas.Particularly, between 1981-91, urbangrowth reached new heights. This may belinked to the growth of private sector enter-prises in the urban areas. The rapid shiftfrom agriculture and traditional industriesto modern enterprises (both within the coun-try and outside) has resulted in increasedmigration to urban areas (table 4.14). Thismeans that the young and able-bodied popu-lation is moving out of the rural areas andseems to be the overall trend, towards thenuclearisation of families throughout theAsia and Pacific region (FAO/RAP 1996).The result is that the absolute poverty levelin the rural areas is higher than in the ur-ban areas. According to the Nepal LivingStandard Survey 2004, the incidence of pov-erty is three times higher in the rural areas
TABLE 4.12 Percentage distribution of total population in rural and urban areas of Nepal
Year Number of Urban Growth Rural Totalurban areas population rate
Population Growth Population Growthrate rate
1961 16 336,222 9,076,774 9,412,996
1971 16 461,938 3.18 11,094,045 2.01 11,555,983 2.05
1981 23 956,721 7.29 14,066,118 2.37 15,022,839 2.62
1991 33 1,695,719 5.72 16,792,431 1.77 18,488,150 2.08
2001 58 3,239,446 6.5 19,911,977 1.70 23,151,423 2.24
Source: CBS/HMG/N 1984, 1993 and 2002.
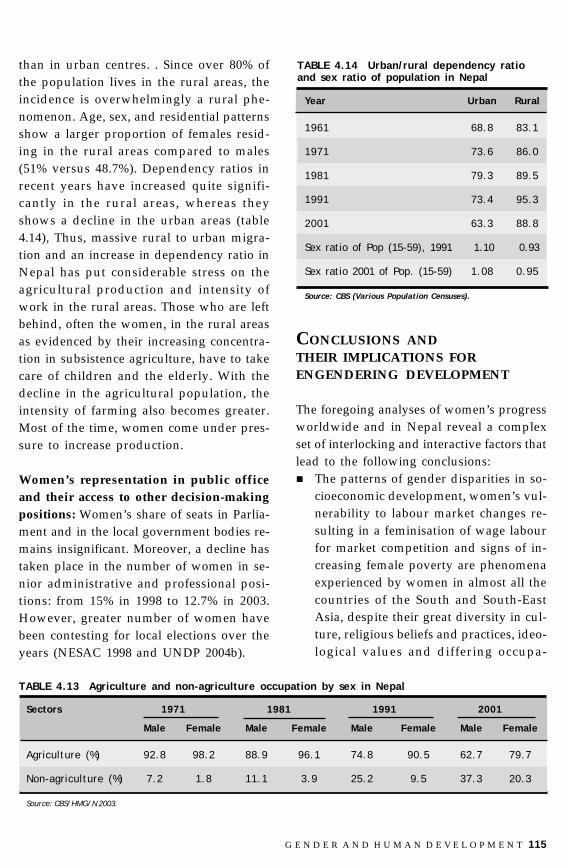
G E N D E R A N D H U M A N D E V E L O P M E N T 115
than in urban centres. . Since over 80% ofthe population lives in the rural areas, theincidence is overwhelmingly a rural phe-nomenon. Age, sex, and residential patternsshow a larger proportion of females resid-ing in the rural areas compared to males(51% versus 48.7%). Dependency ratios inrecent years have increased quite signifi-cantly in the rural areas, whereas theyshows a decline in the urban areas (table4.14), Thus, massive rural to urban migra-tion and an increase in dependency ratio inNepal has put considerable stress on theagricultural production and intensity ofwork in the rural areas. Those who are leftbehind, often the women, in the rural areasas evidenced by their increasing concentra-tion in subsistence agriculture, have to takecare of children and the elderly. With thedecline in the agricultural population, theintensity of farming also becomes greater.Most of the time, women come under pres-sure to increase production.
Women’s representation in public officeand their access to other decision-makingpositions: Women’s share of seats in Parlia-ment and in the local government bodies re-mains insignificant. Moreover, a decline hastaken place in the number of women in se-nior administrative and professional posi-tions: from 15% in 1998 to 12.7% in 2003.However, greater number of women havebeen contesting for local elections over theyears (NESAC 1998 and UNDP 2004b).
TABLE 4.13 Agriculture and non-agriculture occupation by sex in Nepal
Sectors 1971 1981 1991 2001
Male Female Male Female Male Female Male Female
Agriculture (%) 92.8 98.2 88.9 96.1 74.8 90.5 62.7 79.7
Non-agriculture (%) 7.2 1.8 11.1 3.9 25.2 9.5 37.3 20.3
Source: CBS/HMG/N 2003.
TABLE 4.14 Urban/rural dependency ratioand sex ratio of population in Nepal
Year Urban Rural
1961 68.8 83.1
1971 73.6 86.0
1981 79.3 89.5
1991 73.4 95.3
2001 63.3 88.8
Sex ratio of Pop (15-59), 1991 1.10 0.93
Sex ratio 2001 of Pop. (15-59) 1.08 0.95
Source: CBS (Various Population Censuses).
CONCLUSIONS ANDTHEIR IMPLICATIONS FORENGENDERING DEVELOPMENT
The foregoing analyses of women’s progressworldwide and in Nepal reveal a complexset of interlocking and interactive factors thatlead to the following conclusions:! The patterns of gender disparities in so-
cioeconomic development, women’s vul-nerability to labour market changes re-sulting in a feminisation of wage labourfor market competition and signs of in-creasing female poverty are phenomenaexperienced by women in almost all thecountries of the South and South-EastAsia, despite their great diversity in cul-ture, religious beliefs and practices, ideo-logical values and differing occupa-

116 R E A D I N G S I N H U M A N D E V E L O P M E N T
tional and social levels. These experi-ences of uneven development for womenstem from both development strategiesand the institutional construction of gen-der inequality. Although major shifts inthinking and conceptualisation, theshaping of approaches and the formu-lation of policy have taken place, therehas been very little reform in the institu-tional structures and the mechanismscharged with making these changes op-erational. The implementation of eventhe most progressive and positive policyactions under the present institutionalstructures result in unequal opportuni-ties for women and men.
! Paradoxically, the problems of WID areassumed to be their lack of participationin mainstream development. An increased“participation”, “integration” of womenand their “empowerment” through “in-come-generating activities”, along with“awareness-raising” and “education” areconceived as natural responses towomen’s problems, thereby influencingpolicies and programmes heavily. How-ever, as indicated earlier, the issue is not alack of participation in work or decision-making, but rather the level at which de-velopment strategies and structures limitor facilitate the women’s participation. Itis also the lack of recognition of the kind ofwomen’s “own work” in sustaininghouseholds as the fundamental units ofboth society and the economy. Macroeco-nomic policies and practices do not yetrecognise the realities of household econo-mies as economies in their own right nortake into account women’s “own work”as the economic contribution crucial tomaintaining the household and thereforethe economy at large.
! Although policies are assumed to play adynamic role in bringing about genderequality, the current emphasis on policymeasures and programme targeting is nota sufficient condition for bringing aboutredistributive change. It is the growth poli-cies and development strategies that de-termine the employment opportunitiesand structures and the mechanisms ofdistribution process. Women’s experi-ences with free market policies,commercialisation/privatisation hasbeen highly inequitable between coun-tries, within countries and between gen-ders and ethnic groups. These structuresare still built on the capitalist mode ofproduction, which in turn has the his-torical legacy of colonial domination.Gender and social equality-based humanrights are noble objectives that have yetto be inclusive in the economic policiesand strategies geared to redistributivechange.
! Macroeconomic policies are not gender-neutral. They embody the ideological andattitudinal biases of those who makethem and become important parametersin determining the kinds and level of de-velopment for women compared to men.This is revealed by the opportunitiesmade available to women in the openmarket, along with interventionprogrammes – all of which continue toperpetuate stereotypes. Even the new em-ployment opportunities and creditprogrammes fail to make women entre-preneurs, while social and political struc-tures fail to make women leaders.
! Improvements in education and income,as well as increased participation in thelabour market, tells us little about quali-tative changes and the empowerment of

G E N D E R A N D H U M A N D E V E L O P M E N T 117
women. Policies and plans that purportto embody a GAD or the Human Capa-bility Approach are still implementedwithin the parameters of the WID ap-proach with structural limitations thatresult in uneven development.
The implications of the analysis above arethe following:! The preconditions and patterns of
growth that are conducive to reducingdisadvantages for women must be iden-tified in gender- and minority- inclusivepolicies;
! Alternative approaches that will allow fora successful transition to engendered de-velopment through transformative advo-cacy and action need to be devised; and
! The implementation of gender develop-ment interventions must be approachedfrom a management perspective to tacklethe structural factors that result in unevendevelopment for both women and men.
To this end, the following preconditionsmust be instituted:! Macro economic policies must recognise
and treat local household economies aseconomies in their own right. In Nepal,rural household economies constitute thebase. Women in the local or sub-nationaleconomies play a dominant role in con-tributing to this base. Within these house-holds the concept of “own work” thatboth women and men perform must berecognised and made rewarding activi-ties that people “choose”, value, organiseand control for themselves. This calls fora shift to a more self-reliant local/rural
development for which specific economicpolicies and strategies need to be devised,much as they are formulated for the na-tional economy. Households should notbe subsumed under national macro poli-cies. This means changes in perception,gender ideology, values, norms and rulesthat govern not only household and com-munity-level structures, but also develop-ment institutions. The recognition ofhousehold economies and “own work”will help bring about this change.
! The concepts of power and empowermentmust be seen and conceptualised in thecontext of gender relations and the differ-ences between women and men in differ-ent societies in terms of the degree of con-trol they exercise and the autonomy theyenjoy in various domains, including in-terpersonal relations such as marriage,conjugal relations (in which the bulk ofGBV tends to take place), inheritance andwomen’s rights to property. Accordingly,measures should be taken to empowerwomen in creating “collective” and “in-dividual capacity” to make claims on in-stitutional structures, whether govern-mental or non-governmental, so that bu-reaucracies and other power structuresrespond to women’s needs.
! So far, mainstreaming has been ap-proached largely from a “gender equity”11
perspective and less from “gender speci-ficity”12 point of view. When plans andprogrammes are approached from the gen-der equity perspective, analyses tend to fo-cus on women at risk or disadvantagedgroups needing special attention. Thisgenerally results in working with women
11 “Gender equity” refers to the relational aspects of gender (male and female) and the concept of gender as a power structure thatpermeates human relationships and often facilitates or limits opportunities based on one’s sex.
12 “Gender specificity” refers to examining specific development risks to women and men because of their biological sex and gendernorms.

118 R E A D I N G S I N H U M A N D E V E L O P M E N T
to improve their position in relation to men.For this reason, men are often ignored inplans and programmes that aim atbehavioural change.
! It must be recognised that improvementsin the status of women and women’sempowerment can be achieved only bytransforming the existing gendered so-cial, structural/institutional deliverymechanisms that result in unequal out-comes for women and men. Current ap-proaches needs to go beyond providingequal treatment and equal opportunitiesto gender equality and equity. Therefore,There is a need to address the social andstructural factors that result in unequalgender relations and the distribution ofbenefits even when equal treatment andequal opportunity for women and menare provided.
! There is also a need to work with mul-tiple partners/stakeholders who can ef-fectively contribute to achieving genderequality and equity by observing three re-inforcing principles for change:
• Empowerment viewed not only froma socioeconomic perspective, butalso from a capability perspectivethat includes control over resources,decisions and issues that affectone’s life – in particular, having rep-resentation in political and decision-making bodies and control over thedistribution of resources and ben-efits, and creating support systemsthat enable individuals to do and bewhat they wish.
• Integration: adopting a systemic ap-proach to mainstreaming gender thataims at transforming the structuresthat create and perpetuate gender andother inequalities This requires a highlevel of gender analysis, conscious ef-forts, coordination and the integrationof efforts.
• Accountability that creates changewithin an organisations and withinsociety, which requires action to mo-tivate people to effect the necessarychange.
E D U C A T I O N A N D H U M A N D E V E L O P M E N T 119
During the past century, the perception of edu-cation as a whole has shifted from humancapital formation to meet industrial labourmarket demands – certainly through the sec-ondary level – to an end of development whichleads an individual to a dignified and cre-ative life. Nepal, too, has recognised the im-portance of this enlarged vision. Althoughmuch remains to be done in providing qual-ity education to most public school studentsin the country, the achievements of the last 50years are impressive. The challenge of pro-viding equal access to education to girls andpeople from disadvantaged groups remainsdaunting. Given the growing awarenessabout the promise of EFA, efforts under wayby government agencies, NGOs, communitybased organisations (CBOs) and the interna-tional community can be expected to bringpositive changes.
EDUCATION ANDDEVELOPMENT
Education and human developmentEducation is often perceived as the aggre-gate of all the processes by which a persondevelops abilities, attitudes and forms ofbehaviour with practical value to the society
in which he or she lives. The Latin wordeduco is formed by the conjoining of twowords: E and Duco. E means from the inside,while Duco means to draw or lead outside.In short, education means drawing out orenhancing the inherent potentials or abili-ties of a child. Similarly, the word siksha,which means “education” in Nepali, is de-rived from the Sanskrit Siksh, which means toteach. It is also interpreted as impartingknowledge, building character and develop-ing skills in each individual.
The term school originated in ancient Greeceand meant leisure, love of knowledge or lec-ture place, depending on the context in whichit was used. Formal schooling in most pre-industrial societies was available only tothose who had the time and means to enjoyit. In many of those societies, religious lead-ers or priests constituted the vast majority ofthe fully literate – with notable exceptions,such as members of the ancient Egyptian andChinese civil services. In the latter, promis-ing boys had to sit for formal examinationsfrom the 7 century BCE on, starting in publicprimary schools. In addition, a good num-ber of aristocrats and merchants throughoutthe ancient Middle East and North Africa,ancient South and South-East Asia, the Ro-man Empire and what are now Mexico and
CHAPTER 5
Education and human developmentBadri Dev Pande

120 R E A D I N G S I N H U M A N D E V E L O P M E N T
Guatemala found literacy prestigious, oftenessential to their livelihoods. As commerceand banking became widespread in theMuslim and Christian worlds, the childrenof the emerging merchant class began goingto school to attain literacy, numeracy andsome mastery of the basic texts of their cul-tures. With the advent of industrialisationin Western Europe, demands for at least afew years of primary schooling increased forboth girls and boys, along with training inwhat we now call vocational skills.
The conception of education keeps chang-ing. It is no longer construed even as formalschooling, whether at the pre-school, pri-mary, secondary or tertiary and higher lev-els. Nor is it limited to the knowledge ofbooks. Instead, it is accepted as life-longlearning, as wide as a person’s experiencefrom birth to death.
At times, human development is confusedwith human resource development, whichaims at increasing the effectiveness and effi-ciency of personnel in a particularorganisation. However, efficiency in thework environment is only one element ofhuman development. Education enhancesessential qualities in individuals by prepar-ing them for jobs, for taking on responsibili-ties as family members and good citizens andfor adapting to changing circumstances. Theessential nature of education is developing aperson’s capabilities to lead a “creative” life.
Of the three components of the HDI, educa-tion and health, which lead to a creative, longand healthy life, have intrinsic values andare ends in themselves.
According to UNDP (Hallak 1990) educationis one of the five “energisers” of human re-
source development, the others being healthand nutrition; the environment; employment;and political and economic freedom. Indeed,education is considered a means for meetingall human needs. The social objective of edu-cation can be analysed in three areas: humanrelations, economic efficiency and civic knowl-edge. Education prepares a person to coexistwith his neighbours and other members ofthe household; mutual cooperation and good-will enable him or her to carry out a numberof his responsibilities in this sphere more eas-ily. Another task of education is enabling in-dividuals to become efficient economically. Byimparting skills training and instilling pro-fessional capabilities, education enhances thecapacity of the people to obtain gainful em-ployment. Finally, education creates civicawareness and knowledge of a society interms of an individual’s fulfilling his dutiesas a citizen.
Education andsocioeconomic developmentEducation also opens up the way for equityin opportunities by maximising the capacityof each person. Through education, adultwomen as well as members of other disad-vantaged groups get a chance to expand theirknowledge, acquire marketable skills and se-cure highly paid technical and professionaljobs. In addition, education enables mothersto take better care of their children. Indeed,educated women – particularly in urban anddeveloped areas – tend to have fewer children;this frees them for employment, other gainfulactivities and further learning or leisure activi-ties. The 1990 World Conference on EFArecognised education as the single most im-portant factor in the struggle against poverty,protecting the rights of women and providingthem greater opportunities.

E D U C A T I O N A N D H U M A N D E V E L O P M E N T 121
Most economists believe that the human re-sources of a nation determine the nature andrate of economic and social development, theformal education system being the main in-stitutional mechanism for developing skillsand knowledge. Countries such as Germany,Japan, Switzerland – and, more recently,Mexico, Chile, Malaysia, Singapore and Thai-land – have demonstrated that a healthy popu-lation with a high level of education increasesthe productivity of the national economy.
Towards the end of the 19th century, AlfredMarshall, in his Principles of Economics,stated that “although nature is subject to di-minishing returns, man is subject to increas-ing returns… [k]nowledge is the most power-ful engine of production; it enables us to sub-due nature and satisfy our wants”. In hisstudy entitled The Distribution of Wealth, J.B.Clark observed that “knowledge is the onlyinstrument of production that is not subject todiminishing returns,” advancing the idea ofsocial capital formation. More recently, in anarticle entitled “Human Capital and HumanCapability”, Amartya Sen (2003) observes:“[C]onsider an example. If education makes a
person more efficient in commodity produc-tion, then this is clearly an enhancement ofhuman capital. This can add to the value ofproduction in the economy and also to theincome of the person who has been educated.But even with the same level of income, a per-son may benefit from education, in reading,communicating, arguing, in being able tochoose in a more informed way, in being takenmore seriously by others, and so on”.
If education is to make a significant impacton the socioeconomic life of a country, quan-titative increases alone would not suffice. Therelevance of educational content to chang-ing labour market needs are vital to economicgrowth, as demonstrated by South Korea,Hong Kong, Taiwan and Singapore, whichbuilt high university enrollments on highsecondary-level completion rates in goodschools. These countries and territories notonly heavily invested in basic education, butalso emphasised a technology-oriented cur-riculum at certain higher levels of secondaryand tertiary education. Box 5.1 shows thatNepal can draw a number of lessons fromthe experiences of East Asia. In particular,
Over the past four decades, the East Asian “tigers” —Hong Kong, (China, SAR), Republic of Korea, Singaporeand Taiwan (province of China) — achieved rapid de-velopment of human skills, equipping them for progressin adopting technologies. Their success suggests strat-egies that less developed countries could consider andadapt to their own circumstances.
One key lesson: the orientation and content of educa-tion are as important as resource allocation. Thesecountries not only invested in basic education, but alsoemphasised a technology-oriented curriculum at manyof the higher levels. These investments in skills werepart of an export-led development strategy, which
provided demand signals for the skills required forimproving competitiveness.
Public education spending had been fairly low in EastAsia, around 2.5% of GNP in 1960 for most countries.In 1997 the regional average was still only 2.9%, far lessthan the 3.9% average for all developing countries andthe 5.1% average for Sub-Sahara Africa. But as theregion’s countries grew rapidly, so did the absolutelevel of spending on education. And education spendinghas also expanded as a share of national income, partlythrough increased private spending.
Source: UNDP 2001.
BOX 5.1 Orientation and content as important as resources –lessons from education strategies in East Asia
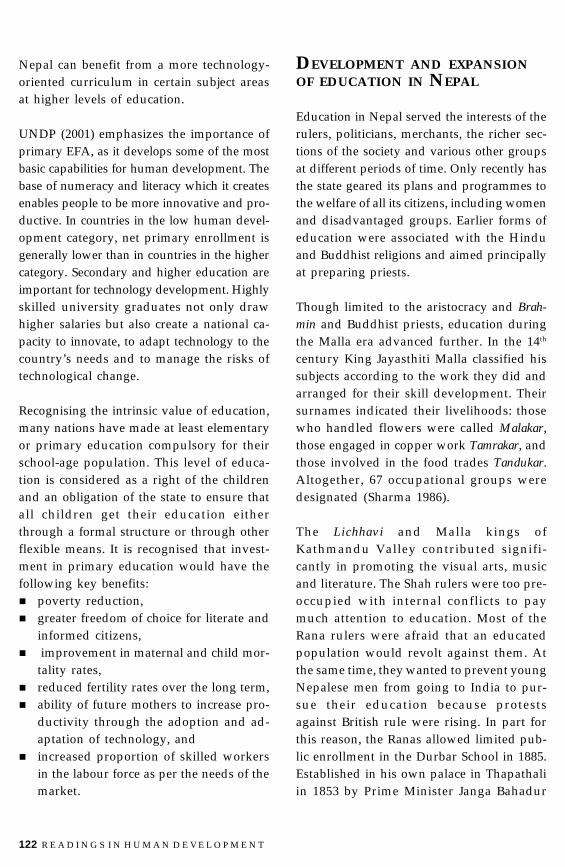
122 R E A D I N G S I N H U M A N D E V E L O P M E N T
Nepal can benefit from a more technology-oriented curriculum in certain subject areasat higher levels of education.
UNDP (2001) emphasizes the importance ofprimary EFA, as it develops some of the mostbasic capabilities for human development. Thebase of numeracy and literacy which it createsenables people to be more innovative and pro-ductive. In countries in the low human devel-opment category, net primary enrollment isgenerally lower than in countries in the highercategory. Secondary and higher education areimportant for technology development. Highlyskilled university graduates not only drawhigher salaries but also create a national ca-pacity to innovate, to adapt technology to thecountry’s needs and to manage the risks oftechnological change.
Recognising the intrinsic value of education,many nations have made at least elementaryor primary education compulsory for theirschool-age population. This level of educa-tion is considered as a right of the childrenand an obligation of the state to ensure thatall children get their education eitherthrough a formal structure or through otherflexible means. It is recognised that invest-ment in primary education would have thefollowing key benefits:! poverty reduction,! greater freedom of choice for literate and
informed citizens,! improvement in maternal and child mor-
tality rates,! reduced fertility rates over the long term,! ability of future mothers to increase pro-
ductivity through the adoption and ad-aptation of technology, and
! increased proportion of skilled workersin the labour force as per the needs of themarket.
DEVELOPMENT AND EXPANSIONOF EDUCATION IN NEPAL
Education in Nepal served the interests of therulers, politicians, merchants, the richer sec-tions of the society and various other groupsat different periods of time. Only recently hasthe state geared its plans and programmes tothe welfare of all its citizens, including womenand disadvantaged groups. Earlier forms ofeducation were associated with the Hinduand Buddhist religions and aimed principallyat preparing priests.
Though limited to the aristocracy and Brah-min and Buddhist priests, education duringthe Malla era advanced further. In the 14th
century King Jayasthiti Malla classified hissubjects according to the work they did andarranged for their skill development. Theirsurnames indicated their livelihoods: thosewho handled flowers were called Malakar,those engaged in copper work Tamrakar, andthose involved in the food trades Tandukar.Altogether, 67 occupational groups weredesignated (Sharma 1986).
The Lichhavi and Malla kings ofKathmandu Valley contributed signifi-cantly in promoting the visual arts, musicand literature. The Shah rulers were too pre-occupied with internal conflicts to paymuch attention to education. Most of theRana rulers were afraid that an educatedpopulation would revolt against them. Atthe same time, they wanted to prevent youngNepalese men from going to India to pur-sue their education because protestsagainst British rule were rising. In part forthis reason, the Ranas allowed limited pub-lic enrollment in the Durbar School in 1885.Established in his own palace in Thapathaliin 1853 by Prime Minister Janga Bahadur

E D U C A T I O N A N D H U M A N D E V E L O P M E N T 123
Rana, the school became the first to offerrecognisably modern education in Nepal.
However, during the 104 years of Rana rule,educational expansion took place at a snail’space. By establishing the first Sanskrit schoolin 1877 and a few hundred schools in andoutside the Kathmandu Valley, a group ofRana rulers wanted to impress upon the gen-eral public their supposed sense of care.While a more liberal Rana Prime Minister,Dev Shamsher, is known to have favouredmass education, Prime Minister ChandraShamsher is reported to have shut downhundreds of schools established by his pre-decessors. Ironically, during his reign,Nepal’s first institution of higher education,Tri-Chandra College – named for KingTribhuvan as well as the Prime Minister –
was established in 1918. For 30 years there-after, no other institution of tertiary educa-tion came into existence.
In 1951, the number of students at the Col-lege was estimated at a mere 200 (Pande1978). However, in 1950, a total of 288 sec-ondary school students appeared for theSchool Leaving Certificate examination; only125, or 43% passed. Despite the establish-ment of some schools and colleges duringRana rule, the number of students enrolledremained very small. Only after the dawn ofdemocracy in 1951 did enrollment begin ac-celerating (table 5.1).
Still, by 1951, the number of primary, sec-ondary and higher education institutionstotalled only 321, 11 and two respectively.
TABLE 5.1 Schools and enrollment, 1951-2003
Schools and colleges Year
1951 1961 1970 1980 1991 2001 2003
Primary 321 4,001 7,256 10,130 19,498 24,943 27,268
Lower secondary - - - 3,501 4,055 7340 8,249
Secondary 11 156 1,065 785 2,079 4,113 4,741
Higher secondary - - - - - - 856*
Higher education 2 33 49 68 - 268 -
Enrollment
Primary 8,505 182,533 449,141 1,067,912 3,034,710 3,418,923 4,025,692
Lower secondary - - - 391,427 378,000*** 927,629 1,210,059
Secondary 1,680 21,115 102,704 121,007 395,000*** 385,551 511,092
Higher secondary - - - - - 141,353 119,151**
Higher education 250 5,143 17,200 38,450 111,172 144,333 -
Source: MoES 1971.* Data for 2004.** Private school enrollment included.***Does not include private school enrollment.
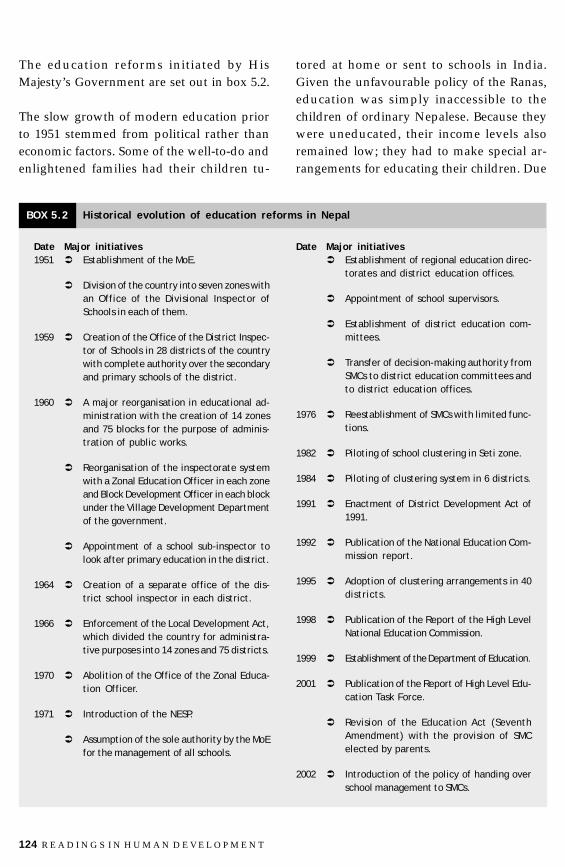
124 R E A D I N G S I N H U M A N D E V E L O P M E N T
The education reforms initiated by HisMajesty’s Government are set out in box 5.2.
The slow growth of modern education priorto 1951 stemmed from political rather thaneconomic factors. Some of the well-to-do andenlightened families had their children tu-
tored at home or sent to schools in India.Given the unfavourable policy of the Ranas,education was simply inaccessible to thechildren of ordinary Nepalese. Because theywere uneducated, their income levels alsoremained low; they had to make special ar-rangements for educating their children. Due
Date Major initiatives1951 " Establishment of the MoE.
" Division of the country into seven zones withan Office of the Divisional Inspector ofSchools in each of them.
1959 " Creation of the Office of the District Inspec-tor of Schools in 28 districts of the countrywith complete authority over the secondaryand primary schools of the district.
1960 " A major reorganisation in educational ad-ministration with the creation of 14 zonesand 75 blocks for the purpose of adminis-tration of public works.
" Reorganisation of the inspectorate systemwith a Zonal Education Officer in each zoneand Block Development Officer in each blockunder the Village Development Departmentof the government.
" Appointment of a school sub-inspector tolook after primary education in the district.
1964 " Creation of a separate office of the dis-trict school inspector in each district.
1966 " Enforcement of the Local Development Act,which divided the country for administra-tive purposes into 14 zones and 75 districts.
1970 " Abolition of the Office of the Zonal Educa-tion Officer.
1971 " Introduction of the NESP.
" Assumption of the sole authority by the MoEfor the management of all schools.
Date Major initiatives" Establishment of regional education direc-
torates and district education offices.
" Appointment of school supervisors.
" Establishment of district education com-mittees.
" Transfer of decision-making authority fromSMCs to district education committees andto district education offices.
1976 " Reestablishment of SMCs with limited func-tions.
1982 " Piloting of school clustering in Seti zone.
1984 " Piloting of clustering system in 6 districts.
1991 " Enactment of District Development Act of1991.
1992 " Publication of the National Education Com-mission report.
1995 " Adoption of clustering arrangements in 40districts.
1998 " Publication of the Report of the High LevelNational Education Commission.
1999 " Establishment of the Department of Education.
2001 " Publication of the Report of High Level Edu-cation Task Force.
" Revision of the Education Act (SeventhAmendment) with the provision of SMCelected by parents.
2002 " Introduction of the policy of handing overschool management to SMCs.
BOX 5.2 Historical evolution of education reforms in Nepal

E D U C A T I O N A N D H U M A N D E V E L O P M E N T 125
to a lack of transportation and communica-tion facilities, the level of awareness of themass population was also low.
The next 50 years saw a rapid increase bothin educational institutions and in enroll-ment. The number of primary, lower sec-ondary/secondary, and higher-educationinstitutions increased by 78, 1,041 and 134folds respectively. Enrollment in primary,secondary and higher education institu-tions increased by 453%. 376% and 502%respectively. This was largely because ofincreased consciousness, the effect ofglobalisation, political commitment, in-creased expenditure in the education sec-tor, special enrollment campaigns, and rec-ognition of the importance of education forhuman development.
THE STATE OFEDUCATION IN NEPAL
Education is one of the major sectors in whichNepal has made remarkable progress over thepast 50 years. It has been one of the most re-warding fruits of democracy. Impressive gainshave been made on all fronts of formal educa-tion, from early childhood development(ECD) to advanced levels of higher education.
Non-formal and informal educationNon-formal education (NFE) covers the fol-lowing learning objectives:! literacy for the illiterate adult population! early childhood and pre-school education! second-chance opportunities for basic
education for older adolescents, not en-rolled in school, or drop-outs
! life-long learning opportunities for per-sonal fulfillment, the acquisition of new
productive skills and life skills, and theenhancement of knowledge and skills asa citizen and community member
! non-formal training in vocational, entre-preneurship and employment-relatedskills, and
! enhancement of the informal learningenvironment through the wideningavailability of reading materials, infor-mation dissemination by the media, par-ticularly in non-print forms, and the en-couragement of cultural expression inthe form of reading centres, multi-mediacentres, and self-learning and interestgroups in the community
Non-formal and informal education providenumerous opportunities for learning in waysthat meet the needs of individuals or diversegroups of learners. They also promote literacyin addition to imparting knowledge andskills for intellectual growth and improvinglivelihoods.
The concept of NFE has been influenced byhumanistic concerns for the value of the in-dividual, his learning capabilities and hispotential for self-direction and develop-ment. The American philosopher, JohnDewey, argued against authoritarian teach-ing; in his 1899 work, The School and Soci-ety, he put forward the idea that formal edu-cation should stimulate children to lookcritically at themselves and their surround-ings with the teacher as their guide and co-worker rather than as a taskmaster assign-ing a fixed set of lessons. In Latin America,during the 1950s and 1960s, Ivan Illich andPaolo Freire contributed to adult and NFE,particularly among the poor, by raisingquestions about the traditional educationalmethods and formal education systems.They believed that the domination of teach-

126 R E A D I N G S I N H U M A N D E V E L O P M E N T
ers in most formal education rendered stu-dents passive recipients of knowledge. Illichcontended that in adult and NFE, thelearner was able to establish a new relation-ship with his environment and couldchoose what he wanted to learn – and fromwhom. In Friere’s view, adult educationshould raise an awareness of selfhood, sothat its participants could begin examiningtheir own social situations and taking stepsto change the societies in which they lived.
NFE refers to those educational and exten-sion programmes that emphasize informa-tion and skills for self-enhancement, com-munity development and, above all, theimprovement of people’s quality of life.Non-formal educational establishmentsdiffer from formal educational institutionsin that they are not rigid in their curricula,programme requirements, schedules,boundaries and rules as to who learns,from whom learning is received and wherelearning takes place. NFE includes literacyas well as functional adult education,which provides livelihood-related skills inagriculture, cottage industries, health care,and other technical education and voca-tional training in wide-ranging areas.
Literacy and continuing educationThe progressive political climate of the1950s, the infrastructural development ofthe 1960s, the growth of educational facili-ties under the national education systemplan (NESP) during the 1970s, liberal poli-cies for the privatisation of education in the1980s and decentralisation and morefavourable conditions for the participationof the disadvantaged groups and the masspopulation in the 1990s all provided impe-tus for the promotion of NFE. Within a spanof 50 years from 1952-54, when Nepal’s lit-eracy rate was mere 4.4%, 53.7% of its citi-zens attained functional literacy (table 5.2).The female literacy rate during this periodjumped from 0.7% to an impressive 42.49%.However, much remains to be made to in-crease women’s literacy.
The 2001 census of Nepal defines a literateperson as one “who can read and write”.According to that census, 53.7% of the popu-lation (6+years) was literate in 2001. Theaverage adult literacy level of 15+ years was44% – 10% lower than that of the 6+ yearspopulation. In only four districts(Kathmandu Valley and Kaski) did the lit-eracy rate exceed 60%. As many as 36 dis-
TABLE 5.2 Literacy situation by census years 1952 – 2001
Census year Population Literate
Total Male Female
1952-54 (5 yrs. and above) 7,146,147 316,119 (4.4) 290,277 (8.2) 25,842 (0.7)
1971 (6 yrs. and above) 9,453,846 1,312,273 (13.9) 11,302,045 (23.6) 182,519 (3.9)
1981 (6 yrs. and above) 12,179,688 2,833,435 (23.3) 2,117,025 (34.0) 716,410 (12.0)
1991 (6 yrs. and above) 15,147,590 6,006,342 (40.0) 4,100,336 (54.1) 1,906,006 (24.7)
2001 (6 yrs. and above) 19,255,808 10,348,432 (53.7) (65.08) (42.49)
Source: Central Bureau of Statistics Census Reports.Note: Numbers in parentheses indicate percentages.
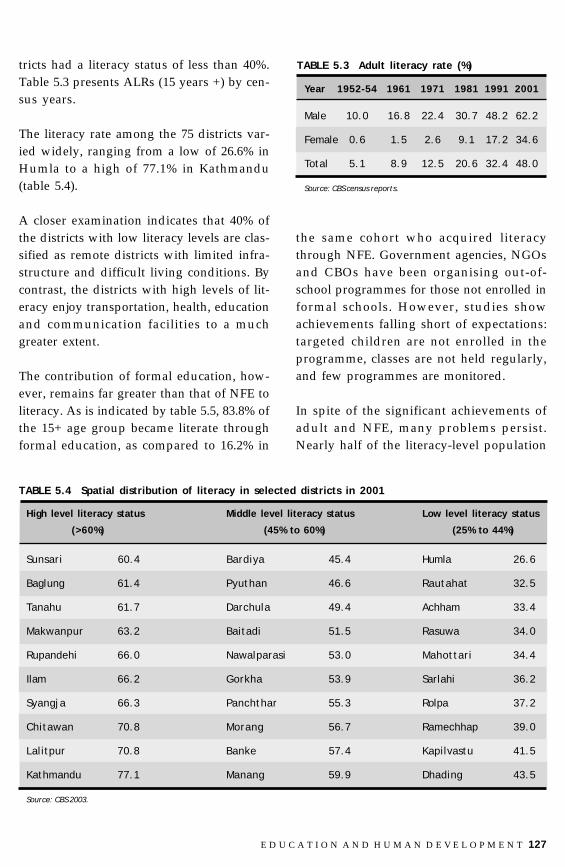
E D U C A T I O N A N D H U M A N D E V E L O P M E N T 127
tricts had a literacy status of less than 40%.Table 5.3 presents ALRs (15 years +) by cen-sus years.
The literacy rate among the 75 districts var-ied widely, ranging from a low of 26.6% inHumla to a high of 77.1% in Kathmandu(table 5.4).
A closer examination indicates that 40% ofthe districts with low literacy levels are clas-sified as remote districts with limited infra-structure and difficult living conditions. Bycontrast, the districts with high levels of lit-eracy enjoy transportation, health, educationand communication facilities to a muchgreater extent.
The contribution of formal education, how-ever, remains far greater than that of NFE toliteracy. As is indicated by table 5.5, 83.8% ofthe 15+ age group became literate throughformal education, as compared to 16.2% in
the same cohort who acquired literacythrough NFE. Government agencies, NGOsand CBOs have been organising out-of-school programmes for those not enrolled informal schools. However, studies showachievements falling short of expectations:targeted children are not enrolled in theprogramme, classes are not held regularly,and few programmes are monitored.
In spite of the significant achievements ofadult and NFE, many problems persist.Nearly half of the literacy-level population
TABLE 5.4 Spatial distribution of literacy in selected districts in 2001
High level literacy status Middle level literacy status Low level literacy status
(>60%) (45% to 60%) (25% to 44%)
Sunsari 60.4 Bardiya 45.4 Humla 26.6
Baglung 61.4 Pyuthan 46.6 Rautahat 32.5
Tanahu 61.7 Darchula 49.4 Achham 33.4
Makwanpur 63.2 Baitadi 51.5 Rasuwa 34.0
Rupandehi 66.0 Nawalparasi 53.0 Mahottari 34.4
Ilam 66.2 Gorkha 53.9 Sarlahi 36.2
Syangja 66.3 Panchthar 55.3 Rolpa 37.2
Chitawan 70.8 Morang 56.7 Ramechhap 39.0
Lalitpur 70.8 Banke 57.4 Kapilvastu 41.5
Kathmandu 77.1 Manang 59.9 Dhading 43.5
Source: CBS 2003.
TABLE 5.3 Adult literacy rate (%)
Year 1952-54 1961 1971 1981 1991 2001
Male 10.0 16.8 22.4 30.7 48.2 62.2
Female 0.6 1.5 2.6 9.1 17.2 34.6
Total 5.1 8.9 12.5 20.6 32.4 48.0
Source: CBS census reports.
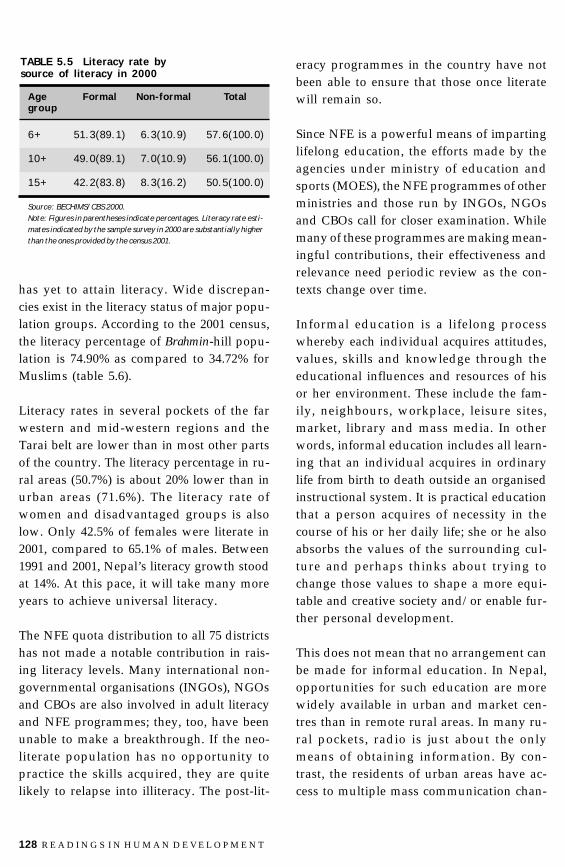
128 R E A D I N G S I N H U M A N D E V E L O P M E N T
has yet to attain literacy. Wide discrepan-cies exist in the literacy status of major popu-lation groups. According to the 2001 census,the literacy percentage of Brahmin-hill popu-lation is 74.90% as compared to 34.72% forMuslims (table 5.6).
Literacy rates in several pockets of the farwestern and mid-western regions and theTarai belt are lower than in most other partsof the country. The literacy percentage in ru-ral areas (50.7%) is about 20% lower than inurban areas (71.6%). The literacy rate ofwomen and disadvantaged groups is alsolow. Only 42.5% of females were literate in2001, compared to 65.1% of males. Between1991 and 2001, Nepal’s literacy growth stoodat 14%. At this pace, it will take many moreyears to achieve universal literacy.
The NFE quota distribution to all 75 districtshas not made a notable contribution in rais-ing literacy levels. Many international non-governmental organisations (INGOs), NGOsand CBOs are also involved in adult literacyand NFE programmes; they, too, have beenunable to make a breakthrough. If the neo-literate population has no opportunity topractice the skills acquired, they are quitelikely to relapse into illiteracy. The post-lit-
eracy programmes in the country have notbeen able to ensure that those once literatewill remain so.
Since NFE is a powerful means of impartinglifelong education, the efforts made by theagencies under ministry of education andsports (MOES), the NFE programmes of otherministries and those run by INGOs, NGOsand CBOs call for closer examination. Whilemany of these programmes are making mean-ingful contributions, their effectiveness andrelevance need periodic review as the con-texts change over time.
Informal education is a lifelong processwhereby each individual acquires attitudes,values, skills and knowledge through theeducational influences and resources of hisor her environment. These include the fam-ily, neighbours, workplace, leisure sites,market, library and mass media. In otherwords, informal education includes all learn-ing that an individual acquires in ordinarylife from birth to death outside an organisedinstructional system. It is practical educationthat a person acquires of necessity in thecourse of his or her daily life; she or he alsoabsorbs the values of the surrounding cul-ture and perhaps thinks about trying tochange those values to shape a more equi-table and creative society and/or enable fur-ther personal development.
This does not mean that no arrangement canbe made for informal education. In Nepal,opportunities for such education are morewidely available in urban and market cen-tres than in remote rural areas. In many ru-ral pockets, radio is just about the onlymeans of obtaining information. By con-trast, the residents of urban areas have ac-cess to multiple mass communication chan-
TABLE 5.5 Literacy rate bysource of literacy in 2000
Age Formal Non-formal Totalgroup
6+ 51.3(89.1) 6.3(10.9) 57.6(100.0)
10+ 49.0(89.1) 7.0(10.9) 56.1(100.0)
15+ 42.2(83.8) 8.3(16.2) 50.5(100.0)
Source: BECHIMS/CBS 2000.Note: Figures in parentheses indicate percentages. Literacy rate esti-mates indicated by the sample survey in 2000 are substantially higherthan the ones provided by the census 2001.
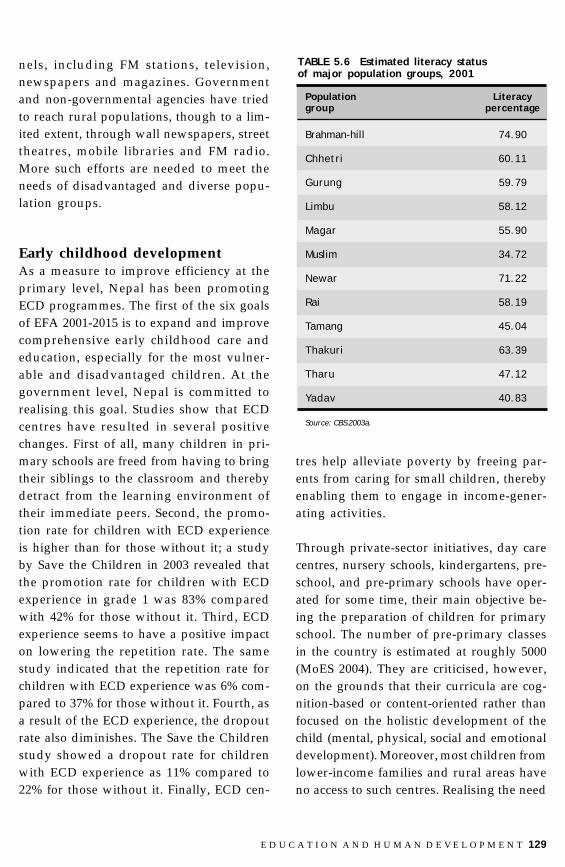
E D U C A T I O N A N D H U M A N D E V E L O P M E N T 129
nels, including FM stations, television,newspapers and magazines. Governmentand non-governmental agencies have triedto reach rural populations, though to a lim-ited extent, through wall newspapers, streettheatres, mobile libraries and FM radio.More such efforts are needed to meet theneeds of disadvantaged and diverse popu-lation groups.
Early childhood developmentAs a measure to improve efficiency at theprimary level, Nepal has been promotingECD programmes. The first of the six goalsof EFA 2001-2015 is to expand and improvecomprehensive early childhood care andeducation, especially for the most vulner-able and disadvantaged children. At thegovernment level, Nepal is committed torealising this goal. Studies show that ECDcentres have resulted in several positivechanges. First of all, many children in pri-mary schools are freed from having to bringtheir siblings to the classroom and therebydetract from the learning environment oftheir immediate peers. Second, the promo-tion rate for children with ECD experienceis higher than for those without it; a studyby Save the Children in 2003 revealed thatthe promotion rate for children with ECDexperience in grade 1 was 83% comparedwith 42% for those without it. Third, ECDexperience seems to have a positive impacton lowering the repetition rate. The samestudy indicated that the repetition rate forchildren with ECD experience was 6% com-pared to 37% for those without it. Fourth, asa result of the ECD experience, the dropoutrate also diminishes. The Save the Childrenstudy showed a dropout rate for childrenwith ECD experience as 11% compared to22% for those without it. Finally, ECD cen-
TABLE 5.6 Estimated literacy statusof major population groups, 2001
Population Literacygroup percentage
Brahman-hill 74.90
Chhetri 60.11
Gurung 59.79
Limbu 58.12
Magar 55.90
Muslim 34.72
Newar 71.22
Rai 58.19
Tamang 45.04
Thakuri 63.39
Tharu 47.12
Yadav 40.83
Source: CBS 2003a.
tres help alleviate poverty by freeing par-ents from caring for small children, therebyenabling them to engage in income-gener-ating activities.
Through private-sector initiatives, day carecentres, nursery schools, kindergartens, pre-school, and pre-primary schools have oper-ated for some time, their main objective be-ing the preparation of children for primaryschool. The number of pre-primary classesin the country is estimated at roughly 5000(MoES 2004). They are criticised, however,on the grounds that their curricula are cog-nition-based or content-oriented rather thanfocused on the holistic development of thechild (mental, physical, social and emotionaldevelopment). Moreover, most children fromlower-income families and rural areas haveno access to such centres. Realising the need
130 R E A D I N G S I N H U M A N D E V E L O P M E N T
for community-based ECD centres to meetthe requirements of potential public schoolenrollees, the basic and primary educationproject of MOES initiated ECD in schoolsthroughout the country. At present, morethan 5,700 community-based ECD centresare supported by the government with do-nor funds. Their sustainability has there-fore been a major issue.
In view of the low performance of publicschool children as compared to those in pri-vate schools, as well as for the reasons men-tioned above, the number of community-based ECD centres and other child-care cen-tres is likely to increase in the years to come.According to the Education Statistics ofNepal 2001, enrollment in pre-primary andECD centers had reached 259,065.
Primary educationPrimary education is the first level of the for-mal education system; the formal establish-ments differ from non-formal or informaleducation because of their hierarchic struc-tures and chronological succession of gradesfrom primary school to university. In addi-tion to general academic studies, formal edu-cation comprises a variety of specializedprogrammes and full-time technical and vo-cational training institutions. In Nepal, thestructure of formal education consists of pri-mary (1-5 grades), lower secondary (6-8grades), secondary (9-10 grades), higher sec-ondary (11-12 grades) and post-secondaryor tertiary education.
Since the establishment of Durbar School in1853, primary education in Nepal has ad-vanced significantly, although Nepal re-mains one of the few countries not to make
primary education compulsory. Thoughprimary education has been made tuition-free, parents have to bear other direct andindirect costs. Of the total number of chil-dren in the 5-9 age group 83.5% were en-rolled in school in 2003 – meaning that16.5% of school-age children were not en-rolled. Among those enrolled, the wastagerate is considerable (table 5.7). In 2003 pro-motion, repetition and dropout rates forgrade 1 were 50.8%, 34.0% and 15.3% re-spectively. Low internal efficiency is causedlargely by the high repetition rate at grade1, itself largely a result of the absence of pre-primary or ECD centres.
Despite the large number of children andrelatively low efficiency rate, the achieve-ment made in primary level cannot be un-derestimated. Both the state and the peoplein general are now aware of the importanceof education.
The 2005 Progress Report on the MDGs castsdoubt on Nepal’s ability to achieve univer-sal access to primary education by 2015. Theslow annual growth in primary enrollment(1.0%), insurgency, mother tongue, caste andculture related constraints, and an unevendistribution of access to primary educationby region and district, caste status, incomelevel and gender featured prominentlyamong the concerns of the MDG Report.
Secondary and tertiary educationThe transition rate from primary to lowersecondary school in 2003 was 75.2 percent.Private schools enrolled a significant percent-age of students at primary, lower secondaryand secondary levels (11%, 13% and 15%respectively) (table 5.8).

E D U C A T I O N A N D H U M A N D E V E L O P M E N T 131
The failure rate in the School-Leaving Cer-tificate (SLC) Examination, popularly knownas the “Iron Gate”, is very high for public orcommunity schools. While the overall passpercentage in 2003 was 46%, only 26% ofpublic school students succeeded in gettingthrough the SLC test.
The failure of 54% of the candidates is evi-dence of an inefficient educational system.Of the 175,417 regular candidates, only81,008 passed. This means 94,409 boys andgirls are required to reappear for the exami-nation. Some of the students meeting speci-fied criteria, however, will be allowed to sitfor the supplementary exam. Compared tothe 34% success rate in 2003, the result in2004 is encouraging. One of the factors isthe implementation of reforms introducedunder the education act seventh amend-ment (EASA), 2001, concerning the forma-tion and functions of school managementcommittees (SMCs).
As the pass percentage in the SLC examina-tion is low, higher secondary schools in manyparts of the country find only a few students
to enroll in their schools – or none at all. Oneof the objectives of higher secondary schoolsin rural areas has been to provide access tothose who cannot afford to pursue their stud-ies away from home.
In Nepal, there are two isolated and parallelpublic higher secondary education (grades11-12) streams using different curricula, nei-ther of which is integrated into the educa-tion system as a whole from grades 1-10. Oneof the streams, intermediate-level educationor proficiency certificate level, is provided byTribhuvan University (TU) on its own cam-
TABLE 5.7 Efficiency ratein primary schools, 2003
Grade Grade Grade Grade Grade1 2 3 4 5
Promotion 50.8 74.9 77.7 76.9 73.0rate
Repetition 34.0 19.4 15.3 15.7 13.5rate
Dropout 15.3 5.8 7.0 7.5 13.5rate
Source: MoES 2004.
TABLE 5.8 Public and private section school enrollment, 2003
Types of schools No. of schools Enrollment
Total Public Private Total Private
Primary 24,746 21,888 2,858 4,030,043 425,099
Lower secondary 7,436 5,664 1,772 1,444,996 148,702
Secondary 4,547 3,258 1,289 587,566 78,287
Higher secondary
HSEB - - 856* 74,319 -
TU - - 347** 67,034 -
Source: MOF 2005.* Data for 2004.** Includes affiliated colleges.

132 R E A D I N G S I N H U M A N D E V E L O P M E N T
pus and others affiliated with it; several otheruniversities do likewise. The other stream isprovided by MOES, through the higher sec-ondary education board (HSEB). AlthoughHSEB-affiliated schools are located in bothurban and rural areas, poor students in ru-ral areas generally cannot afford to attendthem because of their high tuition fees. Profi-ciency certificate level affiliated institutionscharge lower tuition fees per student permonth, but are located largely in urban ar-eas; students from rural areas cannot affordthe high living expenses of towns and cities.Of the 110,000 grade-11 students, the HSEBstream caters to about 77%, and the profi-ciency certificate level stream 23%. However,as both streams suffer from low quality, theyhave become a constraint to improving sec-ondary education for two reasons: their in-congruity with one another as well as withthe education system as a whole; and lack ofsufficient support from MOES, which pro-vides financial support to only one teacherper HSEB-affiliated school. Consequently,these schools cannot find and retain quali-fied teachers. The current Tenth Plan (2002–2007) has made a commitment to integratinghigher secondary education with the entireeducation system, as well as providing fullsupport to 225 HSEB-affiliated schools. None-theless, shortfalls in funding impede imple-mentation. Without firm government com-mitment and availability of funds, highersecondary education will remain a bottleneckto improving the overall secondary educa-tion system.
After the establishment of Tri-Chandra Col-lege in 1918, 30 years elapsed before a sec-ond institution of higher education came intoexistence. After 1951, however, the numbersof colleges rapidly increased. By 1969, theirtotal number had reached 56. But 22 of these
were located in the Kathmandu Valley andmost were established through private ini-tiative. However, under the NESP, all collegeswere nationalised in 1972. TU, the country’sfirst, was established in 1959.
Today, the number of universities has in-creased to five, with TU enrolling most ofthe students. TU encompasses 60 constitu-ent campuses and offers academicprogrammes ranging from the ProficiencyCertificate to doctoral studies. It also pro-vides accreditation to private institutions;Pokhara University, Kathmandu Universityand Purbanchal University also provideaccreditation to dozens of colleges – mostof which, however, are concentrated in largecities. Mahendra Sanskrit University is de-voted to the study of the ancient language.The combined enrollment in higher educa-tion in 2001 was 144,133.
Technical and vocationaleducation and skill trainingTechnical and vocational education in Nepalranges from skills acquired in on-the-jobtraining at the household level to advancedtechnical training at the Institute of Engineer-ing of TU. Secondary schools require onevocational training course for each student,although it involves little or no practicaltraining. Many NGOs and INGOs also pro-vide technical and vocational education fortheir particular areas of activity. In additionto MOES, several other ministries also offeroccupational and technical training. Underthe MOES, the council for technical educa-tion and vocational training, established in1989, is responsible for policy formulationand the coordination of technical educationand vocational training programmes. In ad-dition to providing technical education and
E D U C A T I O N A N D H U M A N D E V E L O P M E N T 133
vocational training through its nine train-ing centres across the country, council fortechnical education and vocational traininghas recognised nearly 100 institutionsthroughout the country. These affiliated in-stitutions offer education and training inmedicine, engineering and tourism, as wellas other technical specialties.
EDUCATIONAL CHALLENGESAND POLICY RESPONSES
The report of the Nepal National EducationPlanning Commission, prepared in 1956,emphasised the need for introducing aneducational system that fostered individualcapability as well as economic growth ofthe nation. Since then, a number of commis-sions, committees, advisory groups, andperiodic (five-year) plans have tried to re-spond to the challenges of contemporaryeducation. The most significant was theNESP for 1971-1976, implemented almostin its entirety, with the government takingcharge of policy formulation and the man-agement and funding of all educational in-stitutions from the primary to universitylevel. All educational institutions werenationalised. The NESP represented the firstcomprehensive effort to give Nepal’s edu-cation system a national form. It tried toensure a minimum standard of learning byproviding uniform curricula at the primaryand lower secondary levels, in part to raisestudent awareness of the positive linkagesamong the country’s different ethnicgroups, micro-cultures and small commu-nities, thereby promoting faith in the Crown,love of the country and an esteem dignityfor labour and self-reliance (Mohsin 1974).The other objective was redressing theshortage of Nepal’s technically trained
manpower. Accordingly, technical and vo-cational education was given high priority.One of the Plan’s distinct features was theprovision of the national development ser-vice for higher education students, with aview to making them more cognisant of thecountry’s realities and the promotion ofeducation as an integral part of nationaldevelopment. Within less than a decade, thePlan fostered many innovative schemes,such as the national development serviceand the termination of the semester systemand the high weight accorded to internalexaminations. At the university level, how-ever, the NESP is considered a failure; thereasons range from low public support to alack of resources and political will.
Soon after implementation of the NESPstarted under the Education Act of 1971, theneed to alter some of the impractical objec-tives was realised. Accordingly, some fun-damental policies were changed during thefive-year implementation period. Primaryeducation was extended from three to fiveyears, as the achievement of literacy alonewas considered inappropriate as the soleobjective. The concept of education’s pro-duction of low-level manpower wasemphasised; the four 400 marks of voca-tional subjects at the secondary level wasreplaced by one subject of 100 marks. An-other major policy shift was the discontinu-ation of a standard entrance examinationfor admission to institutions of higher edu-cation. Similarly, the policy of enrolling over50% of higher education students in techni-cal education was not even implemented.As a result, about 80% were enrolled in gen-eral education institutions.
Over the past three decades, the EducationAct of 1971 has been amended seven times,

134 R E A D I N G S I N H U M A N D E V E L O P M E N T
most recently in 2002. With each amendment,changes were made at every level of educa-tion. Not long after the restoration of multi-party democracy in 1990, His Majesty’s Gov-ernment formed a National Education Com-mission to recommend reforms in light of thenew Constitution. In its 1992 report, the com-mission proposed new national goals andthe restructuring of education as a 5+3+2+2-year system, for primary, lower secondary,secondary and higher secondary educationrespectively. For general higher education, itrecommended a three-year bachelor’sprogramme. The present educational systemis largely based on these recommendations.The current national goals of education, verysimilar to the commission’s proposals, areas follows:! to nurture and develop the personalities
and innate abilities of each individual! to instill respect for human values and
national cultures! to enhance social unity! to help the individual develop his or her
identity in both the national and interna-tional contexts and to lead a socially har-monious life in the modern world
! to aid in the modernisation of the nationby creating capable human resources forits development
! to teach the thoughtful protection andwise use of Nepal’s natural resources
! to help disadvantaged citizens enter themainstream of national life
It is important to note here that the very firstgoal concerns human development. A newgoal became the protection and wise use ofNepal’s natural resources.
The High-Level National Education Com-mission was formed in 1997 to review theexisting education system and offer sugges-
tions for appropriate reforms. Some of theprincipal highlights of this report, submit-ted slightly more than a year later, are asfollows:! one year of pre-primary education for
children under 6 years of age! a policy of NFE programmes in a cam-
paign for the eradication of illiteracy! a clearer policy for equality of educa-
tional opportunities for women! emphasis on access to education for spe-
cial groups, such as the disabled, dalitsand children from disadvantaged groups
! a policy of making primary educationcompulsory on a gradual basis
In 2001, a High-Level Education Task Forceon quality education specified key areas forreforms that became the basis of amendmentsto the 1971 Education Act. This SeventhAmendment of 2002 resulted in a number ofchanges, among them the following high-lights:! Schools were classified as community
(receiving government funds) and cor-porate (privately supported). Corporateschools fall under two headings: thoseregistered under a company act (for-profit), and those registered as trusts(not-for-profit)
! Provision was made for one year of pre-primary education for four year-olds.
! A village development committee (VDC)or a municipality was authorised to grantpermission for the establishment of com-munity-based ECD centres.
! Education through grade 5 was madetuition-free, with cost-sharing at the lowersecondary and secondary levels.
! Provision was made for primary educa-tion in the child’s mother tongue.
! Mobile schools were authorised for re-mote and Himalayan regions.

E D U C A T I O N A N D H U M A N D E V E L O P M E N T 135
! The interests of teachers were to be safe-guarded by central and district-levelteachers’ unions.
! SMCs could be established by the major-ity of parents in a particular vicinity.
Although Nepal now pays more attention toeducational development and allocates moreresources for this purpose, immense chal-lenges remain with regard to access, equityand quality.
Access to educationThere has been a steady progress in schoolenrollment over the years. Primary school netenrollment rate increased from 64 percent in1990 to 84 percent in 2004 (CBS 2004). How-ever, there are two critical issues behind this.First, the household survey data show a muchlower net school enrollment rate than that ofthe MoE. In 2003/04, the net enrollment rateas per the survey data was only 72 percent,thus indicating that more than one-fourth ofthe school-age children have never attendedschool. The net enrollment rate in lower sec-ondary and secondary levels is much lower –29 percent and 15 percent respectively. Sec-ond, disparities in school enrollment ratesacross sex, caste/ethnicity, and geographi-cal region are very high. Low income leveland poverty make access to education all themore difficult. The household survey data(CBS 2004) shows that in 2003/04 64 per-cent of the people in the poorest consump-tion quintile never attended school, com-pared with only 26 percent of those in therichest consumption quintile. The genderdimension within this is more pronounced.In the poorest consumption quintile, a littleover 50 percent of males had never attendedany school; the same for females was morethan three-fourth. The gender bias in access
to education persists even when income oraffordability is not an impeding factor. Thesurvey data (CBS 2004) shows that 37 per-cent of the females in the richest consump-tion quintile have never attended school com-pared with 15 percent for males. In the agegroup of 6-9 years, nearly 27 percent of girlshave never attended school compared with15 percent of boys. This clearly calls for non-formal or out-of-school education, withoutwhich attainment of higher literacy forwomen would be extremely difficult.
Whereas low income is cited as the majorreason behind parents’ not sending chil-dren to school, physical access and familyattitudes are also behind the disparity inenrollment. The disparity widens as onemoves on to higher level of education. Ofthose with SLC-and-above education in2001, more than two-thirds were from theso-called “higher and middle castes”; dalitscomprised less than two percent and reli-gious minorities just one percent (TPAMF2005). The attitudinal factor is clearly vis-ible considering that 54 percent of the popu-lation in East Tarai never attended schoolcompared with 47 percent in the mountainsand hills of the same region. Physical ac-cessibility and income seem to be less rel-evant in this case.
More than one-fourth of the school-going-age children have never seen school or havedropped out so early that formal educationhas made no difference to their lives. To bringthem into the mainstream of education, thesechildren need special arrangements such asmobile schools, non-formal structures, schol-arships, and remedial tutoring.
Since girls have particular needs, they re-quire women teachers with whom they can

136 R E A D I N G S I N H U M A N D E V E L O P M E N T
talk about their problems and aspirations.Though the MOES has adopted a policy ofhiring at least one female teacher in each pri-mary school, roughly 11,000 have none. Girlsalso need separate toilets, especially at thesecondary level. As many schools have nosanitary facilities at all, separate toilets forgirls are a luxury.
Policy measures to promote education forgirls have either been adopted or have beenproposed. Primary education has alreadybeen made tuition-free both for boys andgirls. However, no reliable mechanism ex-ists to ensure that schools are not chargingsome kinds of fees. The budget for fiscal year2004/2005 allocated Rs. 1,588 million toscholarships for girls with a proposal thateach girl receive Rs. 100 per month, providedshe does not marry, attends classes at least75% of school days and scores at least 50%in her substantive study subjects. But the dis-tribution mechanism is so weak that manyneedy girls would not be able to receive thisminimal scholarship.
Quality and relevanceWhile Nepal has made significant progressin terms of numbers, much remains to makeschooling stimulating, enjoyable and re-warding. Existing curricula and textbooksdo not address the needs of Nepal’s diverseethnic groups, many of whom have mothertongues other than Nepali as well as distinctcultures. A Tamang child from the mid-hillfinds it extremely difficult to understand hisTarai teacher, who has his own language,but teaches in Nepali. Moreover, the contenttaught may not be relevant to his life. Rotelearning remains widespread with little orno opportunity to acquire practical knowl-edge and skills.
Secondary education has been generally per-ceived as preparation for the tertiary level.Since SLC graduates acquire no skills forearning a living, most seek admission to aninstitution of higher education within thecountry or outside. As a result of the liberalpolicy of universities and private colleges,almost everybody seeking admission be-comes enrolled – but not necessarily to heror his programme of first choice. Those whocannot afford to continue post-secondaryeducation try to obtain a teaching positionwithin a school or employment elsewhere.
In recent years, an increasing number ofgraduates have found jobs in the Gulf coun-tries, Malaysia and South Korea. In addition,most who receive college degrees prefer notto continue their family business in agricul-ture or other traditional occupations. Unem-ployment is therefore high among collegegraduates, as livelihood opportunities forthose without saleable skills are limited.
Educational managementThe management of education is highlycentralised in Nepal. The Department ofEducation (DOE), created in 1999, ischarged with supervising the implementa-tion of programmes by district and regionaleducation offices. In practice, the MOES,together with the DOE, is heavily involvedin formulating and implementing educa-tional policy. Though the EASA envisagedthe decentralisation of education manage-ment to the school level, SMCs have not beenempowered to take up the challenges.
Investment in educationEducation has both investment and con-sumption components. Economists have in-
E D U C A T I O N A N D H U M A N D E V E L O P M E N T 137
creasingly recognised that education is pre-dominantly an investment, which providesfuture satisfactions or enhances the futureearnings of a person as a productive agent.Investment is defined as an economic activ-ity that forgoes consumption today with aneye to increasing output or income in thefuture. Alternative approaches to educa-tional investment may broadly be classifiedas follows:! The social demand approach, which
seeks to maximise social welfare and so-cial demand in determining public expen-diture on education.
! The manpower requirement approach,in which educational investment in dif-ferent types and levels is guided by thehuman capital requirements of aneconomy. A common feature of this ap-proach is the projection of manpower andtraining needs, usually between fiveyears (medium-term) and 20 years (long-term) into the future. These projections aregenerally estimated based on• employers’ estimates of future needs,• international comparisons of the
manpower and educational struc-tures of countries at different stagesof development,
• ratios of manpower to population, and• the extrapolation of input-output ratios.
! The rate of return approach, which stemsfrom an essential concern with the scar-city of resources and their efficient allo-cation among investment alternatives.This approach relies on labour market sig-nals and cost-benefit assessments to iden-tify the priorities and seeks to push edu-cational expenditure in different typesand levels to the point where marginal
rates of return on investments in all typesand levels of education are equalised. Theestimates of private and social rates ofreturn guide the policy-makers to decideupon public subsidies by levels of educa-tion and a corresponding expectation ofcost-sharing by households.
Several studies conducted since the 1970shave shown the contribution of education toeconomic growth, agriculture productivityand earnings in Nepal. A recent estimate ofprivate rates of return to education based onthe statistical data obtained from NationalLabour Force Survey (CBS 1999) and Na-tional Living Standard Survey (CBS 1996;2004) reveals the following (Parajuli 1999):! Each extra year of schooling yields an
overall private rate of return of 9.7%. Fe-males enjoy a nearly two-point advantageover males, and rural workers have a simi-lar edge over their urban counterparts.The agricultural and non-agriculturalsectors do not differ in their rates of re-turn to education.
! Overall private returns to primary school-ing are high-17.4% compared to second-ary schooling (9.8%) and universityschooling are (13.8 %).
! Girls have higher returns at both the pri-mary and secondary levels, but a rela-tively low return at the university level,implying that moderately schooled girlsare significantly more productive thantheir uneducated counterparts.1 Boysshow much higher returns at the uni-versity level.
! In rural areas, primary education has thehighest return. By contrast, university edu-cation has a higher return in urban areas.
1 Another implication is that girls marry and drop out of the formal labour market during their child-bearing years simply becauseemployers make no provision for society’s needs at this time; if Prof. Pande doesn’t want to provoke feminist rage, a footnote to thiseffect had better be written.
138 R E A D I N G S I N H U M A N D E V E L O P M E N T
! In non-agricultural sectors, universityeducation has the highest return. How-ever, the agricultural sector seems tovalue secondary education; secondaryeducation shows the highest return inthis sector, even though differentials areminimal across different levels.
! Overall formal vocational and/or profes-sional training has a 12% return advan-tage over no training.
! Only two percent of those who have at-tained education with more than 11 yearsof schooling are in absolute poverty com-pared to 45 percent of the illiterate.
This estimate of private rates of return in-cluded only the costs of forgone earnings (in-direct costs). The following observationscould be made about the comparison of pri-vate and social rates of return estimates.! As expected, the high cost estimates of
private rates of return and social returnsare lower than the low cost estimates forall levels of education.
! The social rates of return to primary edu-cation are estimated to be 15.9%, ignor-ing external benefits such as health im-provement, technological innovation anda better society for all.
! The social return to university educationis only 9.3%.
! Both the private rates of return and socialreturns are low for secondary education.
! The estimates of the public subsidy in-dex indicate that this subsidy is highestfor higher education and lowest for sec-ondary education.
The findings suggest that both the privateand social rate of return to education inNepal is rather modest. The current systemof Nepalese education exhibits a differentialdegree of external efficiency across educa-
tion levels. Empirical evidence shows higherreturns to primary and university education.Secondary education in Nepal, however,shows symptoms of low external efficiency.Government subsidy is also the least at thislevel. The implication of these findings canbe summarised as follows:! Higher social returns at the primary level
would provide justification for furtherincreasing public investment at this level.
! As private returns to primary educationis highly profitable, there is also a poten-tial for increased private financing at theprimary level.
! Higher returns to female education im-ply that women’s education should re-ceive high priority.
! Low private returns at the secondary levelmeans that few job opportunities exist forsecondary school graduates. A compre-hensive structural reform may be requiredto improve the quality of secondary edu-cation with appropriate skills so as toraise the profitability of private invest-ment at this level.
! Current subsidy of higher education istoo high and benefits only the rich. Highprivate returns, together with the highestgovernment subsidy rate at the univer-sity level, clearly indicate a need for in-troducing a cost-recovery strategy herethrough increased private financing anda reduced public contribution. In addi-tion, a merit scholarship system and stu-dent loan schemes, among other mea-sures, should be introduced to supportthe cost-sharing strategy.
Private educationDOE/MOES education statistics for 2004show that private schools accounted for 11.0%of school (1-10 grades) enrollment in 2004.

E D U C A T I O N A N D H U M A N D E V E L O P M E N T 139
The roles and contribution of private schoolsrun on a commercial basis have increased inrecent years, especially in urban areas. In1981, the government adopted the policy ofencouraging the private sector to come for-ward in the delivery of educational services.The amendment to the Education Regulationin 1981 allowed the establishment and op-eration of private and boarding schools andstipulated minimum conditions to be met bythe private sector. These included:! meeting certain conditions in order to ob-
tain a permit,! Providing certain minimum physical fa-
cilities,! following the government curriculum by
gearing instruction to the students’ pass-ing the national grade 5 examinations,
! hiring teachers whose qualifications andcompensation were at least comparableto those of teachers in government-aidedschools, and
! specifying the composition of the SMCsuch that the government has strong in-fluence on the committee’s membership.
In response to this policy, there was a sub-stantial growth of private schools – increasedin part by the deterioration of the quality ofeducation in government-aided schools. Theprivate growth helped meet demand pres-sures and also helped satisfy the differinginterests groups.
The education regulations of the past hadalso made some provisions to monitor feelevels, the qualifications of teachers and thecontent of curricula in the private schools.However, in the absence of a well-definedregulatory framework and effective imple-mentation mechanism acceptable to both thegovernment and the private providers, theseprovisions were not implemented. The suc-
cessive reports of the Education Commission,Study Group and Task Force made a num-ber of recommendations to regulate the pri-vate sector, but none were implemented. Anumber of private and boarding schools havealso recognised many issues. The MOES re-cently fixed the fee structure for the privateschools, but there is reluctance from the pri-vate school boards in complying with pub-lic regulations.
As indicated above, the EASA distinguishesbetween community schools (that receivegovernment grants-in-aid) and corporateschools (that cannot receive any regular gov-ernment support). The private and boardingschools, now categorised as corporateschools, must operate as either profit-mak-ing or as trust schools that make no profits.More than 90% of the private schools haveregistered themselves in the profit-makingcategory under the Company Act. The own-ership issue disappears, as a school underAct is owned by the company and governedby the rules and regulations stipulated bythe Act. In principle, MOES becomes free ofadministrative tasks and concentrates oneducational issues.
Private school associations have raisedquestions about many of the provisions ofEASA and the Education Regulation, 2002,that might well militate against the devel-opment of private education in Nepal. First,in connection with the requirement thateach private school deposit 1.5% of its grossincome into a fund to benefit rural educa-tion, they ask if this is justified in the case ofprivate schools registered under the Com-pany Act, which requires them to pay taxeson their profits. It is also unclear how muchof this fund would be collected or how itwould be used to improve rural education.

140 R E A D I N G S I N H U M A N D E V E L O P M E N T
Moreover, the costs of managing such afund would probably absorb much of itsresources. Second, these associations voiceconcerns about the formation of SMCs bythe DOE. If private schools registered un-der the Company Act do not have autonomyin forming their SMCs, their managing di-rectors will play no role in running theschool. Similarly, the inclusion of a schoolsupervisor in a private school SMC violatesthe principle of autonomy. Further, such asupervisor’s role at SMC meetings shouldextend to monitoring or regulating the pri-vate education system.
Because many of the EASA regulations ap-pear to be confusing, it is necessary to de-velop, announce and disseminate a “WhitePaper” on private education detailing a com-prehensive regulatory framework to facilitatecompetition and innovation, as well as pro-tect parents from commercial exploitation.The framework should also include strate-gies to encourage corporate financial sectorto share with other private sector partners interms of financing at a lower interest ratesand providing grants from their profits tobuild up the infrastructure of private second-ary schools.
Meeting the millenniumdevelopment goal on educationAlthough Nepal is committed to attainingthe MDG of achieving universal primaryeducation – a prerequisite for laying the foun-dations of human development at an earlyage – many challenges remain. Box 5.3 setsthese challenges in detail.
The MDG has set the third goal of promotinggender equality and empowering women –eliminating gender disparities in primary andsecondary education, preferably by 2005, andat all levels of education no later than 2015.Given the low percentage of girls in relationto boys at the primary, lower secondary andsecondary levels of education, set out in table5.9, meeting this Goal within the stipulatedtimeframe will indeed be an uphill battle.
The challenges include:! Enrollment retention and promotion, espe-
cially during the early years of education;! Provision of female teachers, separate
toilets and other girl-friendly initiatives;! Additional incentives for the parents of
girls children; and! Changing the social and cultural outlook
of girls.
" Overcoming the severity of income-poverty amonga significant proportion of households.
" Making primary education more relevant to local,rural and agricultural modes of life.
" Reducing the household work and other work bur-dens of children.
" Raising the quality of education by enforcing regu-larity in school hours, training of teachers, makingeducation more relevant to local life conditions and
BOX 5.3 Challenges to be met for the attainment of MDGs
enforcement of existing administrative regulations.
" Shifting school management initiatives from thebureaucracy to school boards.
" Generating and investing additional resources forthe promotion of primary education.
" Promotion of retention and completion rates.
" Recognition of primary education as a fundamen-tal right of all children.
Source: HMG/N and UN Country Team 2002.

E D U C A T I O N A N D H U M A N D E V E L O P M E N T 141
His Majesty’s Government is keenly aware ofthe need to provide access to quality educa-tion to the entire population of Nepal and hasadopted several policy measures to this end.
Education for allOne of the principal policy responses is thepreparation of a national plan of action forEFA, launched at the World Conference ofJomtein, Thailand, in 1990 and reinforcedby Nepal’s commitments at the Dakar Con-ference on EFA in 2000, which encompasssix major goals for the year 2015.! Expanding and improving comprehen-
sive early childhood care and education,especially for the most vulnerable anddisadvantaged children.
! Ensuring that by 2015, all children, par-ticularly girls, children in difficult cir-cumstances and those belonging to eth-nic minorities, have access to and com-plete free and compulsory primary edu-cation of good quality.
! Ensuring that the learning needs of allyoung people and adults are met throughequitable access to appropriate learningand life skills programmes.
! Achieving a 50% improvement in levelsof adult literacy by 2015, especially forwomen, and equitable access to basic andcontinuing EFA adults.
! Eliminating gender disparities in primaryand secondary education by 2005 andachieving gender equality in educationby 2015, with a focus on ensuring girl’sfull and equal access to and achievementin basic education of good quality.
! Improving all aspects of the quality ofeducation and ensuring excellence of allso that recognised and measurable learn-ing outcomes are achieved by all, espe-cially in literacy, numeracy and essentiallife skills
In view of the ethnic, social and linguisticdiversities one more goal has been consid-ered in the preparation of the National Planof Action: to ensure the rights of indigenouspeople and linguistic minorities to qualitybasic and primary education through theirmother tongue.
Nepal has set targets by core EFA indicators,presented in table 5.10. To meet the goals, amulti-donor-funded EFA Programme (2004-09) has been prepared and implementedsince 2004/05.
The Tenth Plan/PovertyReduction Strategy PaperThe Tenth Plan/the Poverty Reduction Strat-egy Paper (PRSP) is the major policy strategy
TABLE 5.9 Ratio of girls to boys in education
Indicator 1990 2000 2004/2005 2015Actual Target
Ratio of girls’ enrollment (gross) to 0.56 0.79 0.86 1.0boys enrollment in primary education
Ratio of girls enrollment (gross) to 0.43 0.70 0.82 1.0boys’ enrollment in secondary education
Ratio of women to men at tertial level of education 0.32 0.28 - 1.0
Source: UNDP/HMG/N 2005.
142 R E A D I N G S I N H U M A N D E V E L O P M E N T
that has set targets for accelerating the paceof human development. Its focus is on in-creasing the access of the poor to social ser-vice through decentralization and skill de-velopment programmes.
In light of the experience of the Ninth Planand in response to the current challengesconfronting the education sector, the TenthPlan has set seven goals as follows:! Assist in raising living standards, es-
pecially those of disadvantaged commu-nities and women, through literacy,post-literacy and life-related NFEprogrammes;
! Develop and expand quality education tomeet the country’s needs and make qual-ity primary education accessible to all;
! Prepare basic and middle-level skilledtechnical manpower to meet the country’srequirements;
! Make use of education as a means of eradi-cating poverty through economic andsocial development and producinghighly competent manpower that cancompete internationally;
! Develop a definition of quality educa-tion and instruments to measure it so asto create system-wide improvements ineducation;
! Make special arrangements for women’saccess to education, and of other targetgroups.
To meet these goals, the plan specifies de-tailed policies and strategies for all levelsand types of education. The government’spolicies for universalising primary educa-tion and enhancing the quality of life of thedisadvantaged and poverty-strickenpopulation are supported by numerousNGOs, CBOs and private sector enterprises.Poor education – quantitatively and qualita-
tively – has played a major role in relegat-ing Nepal to its current low position in theglobal HDI. With heightened awarenessand efforts on the part of the governmentand non-government sectors alike, there isgood reason for optimism for raising the sta-tus of human development.
Community transferof school managementA major concern in making education re-sponsive to human development needs is in-creasing people’s participation in the man-agement of schools. After the NESPnationalised schools and colleges, the levelof community participation in school infra-structure development, teacher support andthe overall management of educational in-stitutions decreased substantially. As partof the government’s efforts to restore people’sparticipation in developing educationthroughout the country, the government iscurrently implementing several policy mea-sures, including the local self-governanceact (LSGA). This Act promotes the partici-pation of local politicians, social workersand consumers in health, education, drink-ing water improvement and other areas ofcommunity interest. The Act also providesfor the involvement of VDC in the manage-ment of primary schools.
The other policy measure transfers schoolmanagement to communities, providing fullfinancial and technical support from thegovernment. Over the past three years about2,000 schools have been handed over toSMCs. The Tenth Plan target is 8,000. Com-munity-managed schools necessarily in-volve parents/guardians and those inter-ested in the development of education. SMCsare authorized to recruit, manage and evalu-

E D U C A T I O N A N D H U M A N D E V E L O P M E N T 143
TABLE 5.10 Targets by core EFA indicators
Indicators 2000 2005 End of End of End of10th Plan 11th Plan 2015
2007 2012
1. Gross enrollment rate (GER) for ECD 13 20 32 60 80
2. % of new entrants at grade 1 with ECD 10.5 30 40 65 80
3. Gross intake rate at grade 1 141 125 123 111 102
4. Net intake rate at grade 1 53.7 67 73 89 98
5. GER at primary grade 1-5 119.8 110 110 110 105
6. Net enrollment rate (NER) (primary grade 1-5) 80.4 88 90 95 100
7. Primary expenses/GNP 1.8 1.9 2.0 2.3 2.5
8. Primary expenses/total education expenses 56.7 60 62 65 65
9. % of teachers with required 15.4 50 100 100 100qualification and training
10. % of teachers with required certification - 60 100 100 100
11. Pupil/teacher ration 37 34 34 31 30
12. Repetition rate
Grade 1 42 30 24 14 10
Grade 2 11 9 8 8 8
13. Survival rate up to grade 5 63 71 75 86 90
14. Efficiency 55 63 67 76 80
15. % of learning achievement at grade 5 40 52 57 70 80
16. % of literacy age group 15-24 70 76 79 86 95
17. % of literacy:
Age group 6 + years 54 65 75 85 90
Age group 15 + years 48 58 63 70 75
18. Literacy GPI (15+ years) 0.6 0.7 0.8 0.9 1.0
Source: EFA national plan of action Nepal (2001-2015).
ate teaching personnel. As an incentive forschool takeover, a lump sum amount of Rs.100,000 is provided for each level (primary,lower secondary, secondary) of managementresponsibility. Studies have already indi-cated several positive impacts – increased
regularity of student attendance and greaterteacher involvement, as well as that of SMCmembers and parents/guardians, in infra-structure development and improved learn-ing. The community school national network,an umbrella organization of SMCs which

144 R E A D I N G S I N H U M A N D E V E L O P M E N T
have now assumed management responsi-bility, has taken a prominent place in theNGO sector to support the governmentprogramme of transferring school manage-ment to communities and increasing accessto education, along with its quality at thegrassroots level.
Financing educationFrom the standpoint of financing, four par-allel systems exist:! a subsidised education provided through
government-aided schools,! a partially subsidised education pro-
vided in the facilities of government-aided schools with community support,
! private schools opened and operatedon a not-for-profit basis (trust schools)and
! private schools opened as profit-makingenterprises.
Under the free education policy of the gov-ernment, the entire salary of teachers, aswell as partial operating costs of govern-ment-supported schools have been met bythe government. The community-supportedschools are now largely those proposed forgovernment support; some have receivedone or two government-paid teaching posi-tions. The Education Act and Regulationsdefine private schools as those which arenot eligible for any government support andare therefore financed by student fees. In thecase of higher secondary schools (grade 11and 12), the HSEB requires local communi-ties and schools to deposit Rs.800,000 to ob-tain permission to run such institutions. Ahigh-priced higher secondary educationsystem has been developed, especially inurban areas.
The present financing modality in Nepal,which supports schools and higher educa-tion institutes (not students and householdsdirectly), basically embodies a supply-sideapproach. But many of the problems andchallenges in the education sector – notablyin quality, equity, efficiency and relevance –have resulted from this approach. Its disad-vantages are:! not all members of society benefit equally,
as it does not target the groups that needsupport;
! the schooling offered may be inappropri-ate for children from certain back-grounds;
! girls, indigenous people, tribal groups,disadvantaged minorities and the poormay be left out;
! a widening gap opens between urbanand rural areas in terms of educationalservices;
! public spending on education resultingfrom the misallocation of resources de-creases its efficiency; and
! the government probably will not be ableto meet the increasing costs of the publiceducation system.
Demand-side financing is based on the as-sumption that households and individualsdetermine the demand for schooling by animplicit cost-benefit analysis. The costs tohouseholds are direct costs such as fees,books, and materials, the indirect being op-portunity costs or income foregone. The ben-efits are a return to schooling to the indi-vidual household as well as society at large.Public support to households through de-mand-side financing reduces the overallcost of schooling, thereby increasing the par-ticipation of poorer households. Its tools arestipends, community financing, targeted
E D U C A T I O N A N D H U M A N D E V E L O P M E N T 145
scholarships, vouchers, subsidies to privateinstitutions and student loans. The main ad-vantage of demand-side financing is that itmakes the education system more efficient,improves quality, increases access, and en-hances equity. The argument for public fi-nance is equity in terms of resources, stu-dent achievement, future income or oppor-tunity. Demand-side financing has alsoproved effective in addressing the equityissue. It encourages choice and schoolinginvestment is made in order to attract par-ents. It can be used to help poor familiesinvest in schooling by reducing tuitioncharges.
Cost-sharing means meeting the costs ofschooling by households, community andthe government jointly. If the education pro-viders (government or the private sector)charge fees to the students to meet their fullcosts, it is called full cost recovery approach.On the other hand, if education providersmeet full costs by other sources such as gov-ernment subsidies or community contribu-tions and do not collect funds from thehousehold, it is called the “zero cost” re-covery method. In the zero-cost recoveryapproach, there is no sharing of directschooling costs by the households whereasin the full cost recovery, households bearall costs. As the private service providersmay earn profit, they may include profits intheir costs and operate in a full-cost recov-ery model. The support of the community tothe education providers would reduce theburden for both households and the gov-ernment. Cost-sharing arrangements arepossible in both the demand-side and thesupply-side financing approaches.
The estimates of private and social rates ofreturn would guide policy-makers in arriv-
ing at decisions regarding public subsidiesby levels of education and the correspond-ing anticipated cost-sharing by households.Generally, the social payoffs are highest forprimary schooling, followed by general sec-ondary schooling. Therefore the share of thegovernment should be higher at these lev-els than for secondary vocational educationand higher education. The government sub-sidy to education would cause a private rateof return that exceeds social returns. Con-sequently, heavy subsidies (for example,higher education in the case of Nepal) tendto encourage a strong demand for educa-tion. Although cost-sharing policy de-mands have generally increased private fi-nancing in education, the objectives of in-creasing private contributions should notbe recovering costs fully, particularly whenthere are economies of scale and when theeducation produces externalities.
Government-aided schools and higher edu-cation institutions in Nepal have been fi-nanced by grants provided by the govern-ment (grants in aid), support from externallyfunded government projects such as basicand primary education project, SEDP, theHigher Education Project, projects under theministry of local development, local electedbodies such as district development com-mittees and VDCs, local communities andcontributions made by households.
The national education account estimatesreveal that Nepal invested Rs 9.82 billionin the education sector in 1994/95, Rs 12.17billion in 1995/96 and Rs 13.97 billion in1996/97. The share of the education sectorin GDP increased from 4.7% in 1994/95 to5.1% and 5.3 % in 1995/96 and 1996/97respectively. Households were the majorcontributor to educational expenditure in

146 R E A D I N G S I N H U M A N D E V E L O P M E N T
1994/95 – more than two-fifths (41.4%) –while the share of the government and do-nors were 38% and 20% respectively. By con-trast, the government made the major con-tribution to education expenditure in1995/96 and 1996/97, as its share rosefrom 38% to 40% in 1995/96 and, further,to 40.25% in 1996/97. National accounttables show that most of the household ex-penditure on education has gone to sec-ondary education (55%), followed by pri-mary education (38%) and higher educa-tion (10%). There has since been a reduc-tion in the contribution of households tosecondary education from 72% in 1994/95 to 64% in 1996/97 with the increase infunds from government and donors.
Steady growth has taken place in govern-ment expenditure on education, particularlyin the primary and secondary education(grade 1-10) sub-sectors in recent years. Thegovernment education expenditure/GDPratio has shown a continuous rise (withlittle fluctuation) from 1.8% to 2.8% between1990 and 1999. This share increased to over16% in 2004/05, as compared to its level of8.8% in 1990/91. The major portion of edu-cational expenditure goes to recurrent costs,which include wages and salaries, alongwith other expenses. Almost all expenditureunder grants-in-aid (GIA) is used to financethe salaries of teachers.
Donor contribution to financing the educa-tion sector has been increasing. Nepal re-ceived Rs. 122.2 million from externalsources in 1990/91, which accounted for5.9% of total education expenditure. Thisproportion increased to 26% in 1994/95,24.8% in 1996/97 and 30.1% in 2004/05.Loans constitute the major portion of total
foreign assistance (43% in 2004/05), themajor donors being the International De-velopment Association, the Asian Devel-opment Bank, the Danish International De-velopment Agency, Swiss DevelopmentCooperation, the World Food Programme,the Department for International Develop-ment (UK) and the Japanese InternationalCooperation Agency. The increased aidflows for education have contributed inlarge measure to the rising share of the sec-tor in total expenditure.
Following the restoration of multiparty de-mocracy in 1990, the elected government in-creased its commitment to education by ini-tiating the policy of free secondary educa-tion. The head teachers of public schools, aswell as most education experts and planners,feel strongly that the government cannot con-tinue its free education policy up to Grade10 if standards are to improve. On average,the total revenues of public schools have de-clined since the declaration of the free edu-cation policy because it funds mainly teachersalaries. Schools that were already strugglingfor resources to finance quality inputs priorto the free education policy are now unableto arrange for these inputs. Hence, it iswidely believed, the proliferation of privateschools, which are able to spend significantamounts on non-salary inputs critical toquality improvements.
The MOES provides GIA to government-supported schools and is the main sourceof income of public schools. The present GIApolicy, provided by the DOE as part of thecentralised management system, provideslittle control of resources to those respon-sible for implementation at the field level.The GIA has become an entitlement for

E D U C A T I O N A N D H U M A N D E V E L O P M E N T 147
which no justification is required. It doesnot encourage teachers to aim at a higherlevel of performance, as their salaries arenot linked to their performance and schooloutcomes.
The government budget allocation giveslittle emphasis to activities directly relatedto improving classroom instruction. Mostschools have been established through lo-cal initiatives and support from local com-munities. Once the government starts sup-porting them through grants, communitiesfind themselves marginalised. Governmentsupport, therefore, has not added to the re-sources available to schools. District devel-opment committees, VDCs and local com-munities are not involved in the process.GIA is allocated at a point far removed fromthe local context, on a uniform basis, lead-ing to lower motivation for local resourcemobilisation and creating dependency. Oneresult of the present GIA policy is teacherssee themselves as employees of a distant par-ent organization.
Although public expenditure on educationhas increased in recent years (table 5.11),most of the schools lack adequate physicalfacilities, adequate faculty and a congenialenvironment for learning. Despite the factthat primary education consumes about halfof the government budget allocation to edu-cation sector, much remains to be done tomake school attendance attractive to chil-dren; a large number can hardly find a com-fortable seat in their classrooms. Play-grounds, extracurricular activities, tiffin fa-cilities and transportation to school are luxu-ries to an overwhelming majority of stu-
TABLE 5.11 Governmentexpenditure on education
Year Total Percent Educationbudget allocated budget as
(in billions to education % of GDPof Rs.)
1993/94 33.60 13.58 2.3
1996/97 57.60 13.48 2.8
1999/00 77.24 13.17 2.7
2000/01 82.40 15.60 3.1
2004/05 111.68* 16.05 3.7
Source: MoES 2000 and 2001.*Budget for 2004/2005.
dents. Obviously, far more expenditure onthe part of both the government and par-ents/guardians is required before minimumneeds are met for making learning comfort-able and enjoyable.
The budget allocation by type of educationreveals that the amount allocated to literacy,technical and vocational education,women’s education and scholarships andstudent welfare is too small to make a sig-nificant impact (table 5.12). These are thevery areas that improve literacy, generateemployment and provide incentives to thedisadvantaged and needy segments of thepopulation. Public spending in educationin Nepal is typically enjoyed by the non-poor as 46% of education spending accruesto the richest fifth, and 11% to the poorest. Ifthe government policy of equality of oppor-tunities is to be translated into reality, thereis a clear need for increasing the existinglevel of budget allocated to the programmesthat target the poor.

148 R E A D I N G S I N H U M A N D E V E L O P M E N T
TABLE 5.12 Sectoral distribution of the educational budget Rs. in Thousand
Types of Yeareducation
1995/96 1997/98 1999/00 2001/02 2003/04
Total % Total % Total % Total % Total %
Primary 3,558,512 49.2 3,880,168 47.82 5,599,833 55.03 7,790,981 55.4 8,507,380 58.8education
Secondary 1,206,361 16.68 830,510 10.23 2,101,767 20.65 2,971,033 21.1 3,159,845 21.8education
Higher 8,500 0.12 13,905 0.17 26,600 0.26 48,092 0.3 40,000 0.3secondaryeducation
Higher 533,027 7.37 13,050 0.16 1,915,382 18.82 1,680,413 11.9 1,675,722 11.6education
Non-formal 74,093 1.02 120,000 1.48 - - 133,528 0.9 + -education(includesliteracy)
Technical and 296,029 4.09 133,751 1.65 106,055 1.04 193,235 1.4 152,524 1.1vocationaleducation
Women’s 20,235 0.28 20,240 0.25 - - 261,754 1.9 + -education
Scholarship and 47,200 0.65 15,361 0.19 66,256 0.65 50,400 0.4 - -student welfare
Source: MoES statistical reports for various years.+ Included in primary and secondary education. Along with low level of financing, education system is warred by poor governance like teachers’ absentee-ism, frequent disturbances in teaching-learning process, lack of adequate monitoring, and parents’ indifference to school operations. Without improvinggovernance, quality and universal school education can not be attained even if sufficient budget is allocated to education.

H E A L T H A N D H U M A N D E V E L O P M E N T 149
INTRODUCTION
Health is regarded as an important compo-nent in measuring overall development out-comes. Until recently, most have assumedthat progress in economic developmentwould lead to better health, indicated by lev-els of mortality and life expectancy at birth.This assumption is based on socioeconomic-biomedical perspectives that increases inincome, employment and access to healthcare will lead to overall health improvement.Efforts to improve health status, as such, havetargeted increase in life expectancy at birthand reduction in mortality – in particular,infant/child and maternal mortality from abio-medical perspective of improving healthcare services. Although impressive increasesin life expectancy and dramatic reduction inmortality have taken place during the lastthree centuries, development effortscharacterised by increases in growth as wellas improvements in health care services, havenot resulted in the outcomes anticipated. In-equalities in health persist between andwithin countries, among different populationgroups, and between the rich and the poor.
Existing unequal health trends and studieson the relationships between mortality andincome levels (Carr 2004; Gwatkins 2002;
Whitehead 2000; Preston and others 1975)have shown that today’s health issues go wellbeyond simply living longer. We live longerand healthier lives on average than at anytime in history. Overall, life expectancy in-creased faster in the last 40-50 years thanever before. But not all groups of populationhave benefited equally. The overall improve-ment in longevity has not meant better healthfor all. Key concerns have been:! bringing about qualitative improvements
in the lives of people through equity andequality
! a re-examination of the assumption thatincreases in income, employment and thesupply of health care services will actu-ally produce that improvement.
It is in this context that the human develop-ment approach emerged as an alternative toaddress existing inequalities in economicdevelopment that focused on income andutility functions
Health is an essential component of humandevelopment which emphasises qualitativeimprovements in a person’s ability to lead ahealthy and decent life. Health, thus con-ceived, is the right of every individual. Thehuman development approach links one’shealth conditions with one’s capability to
CHAPTER 6
Health and human developmentBina Pradhan
150 R E A D I N G S I N H U M A N D E V E L O P M E N T
function efficiently and effectively so as tocontribute to one’s own “well-being”, as wellas to public welfare and development in gen-eral. Health is thereby seen both as a conse-quence and determinant of development. Senfor example, stresses health as a contributivefactor to development and the need for “basicrecognition that deprivation of health is anaspect of underdevelopment, becausepeople’s productivity depends on their levelof nutrition and health. The functioning ofthe economy suffers from illness-related ab-senteeism” (http://www.iadb.org/idbamerica/English/JUL01E/jul01e2.html).Poor health is regarded as impediment toprogress in human development.
The concept of health and approaches toimprove health have evolved significantlysince the 17th century, when health was seenprimarily as a struggle for survival againstdeadly diseases and calamities ranging fromfamine and epidemics to war. We have con-sequently evolved from the question of sur-vival through the epidemiological-demo-graphic perspective of viewing health as abio-physical phenomenon, to the presentperspective of health as a right of every indi-vidual to enjoy “the highest attainable stan-dard of health”.
Contemporary perspectives examine not onlybio-medical phenomena, but the roles playedby non-medical factors such as socioeconomic,cultural and political processes in the etiol-ogy of the multiple determinants not only ofdeath, but also of the debilitating health con-ditions we call morbidity. Accordingly, healthpolicy/strategies and approaches adopted topromote the health of people at different timeshave also differed. They have comprised:! medical services that emphasised costly
high-technology, urban-based, curative care;
! comprehensive approaches to the provi-sion of basic health services that wouldengender social equity in health care;
! the comprehensive PHC approachfounded on the idea of health as a basichuman right – a concept envisioned atthe Alma Ata conference of 1978, whichhad strong socio-political implications;
! the health sector reform strategy (HSRS)for promoting efficiency and effectivenessin health service systems;
! the reproductive health approach thatrecognises women’s reproductive rightsand their need for empowerment; and
! the MDGs, which focus on poverty re-duction strategies for sustained healthylives.
Since the modern health transition of the1800s to the present, different initiatives un-dertaken at the international as well as na-tional levels have recognised health as a fun-damental human right. This recognition im-plies a need to go beyond the bio-medicalaspects of health so as to deal with factorsthat constrain the health of individuals andgroups – among these constraints, socio-cul-tural, economic, political, and gender factors.From the perspective of human development,it is therefore imperative to address the non-medical factors that impact health andthereby thwart the enhancement of capabili-ties and freedoms for fulfilling the entire spec-trum of human rights.
Inevitably, prevailing macroeconomic andpolitical environments, both internationallyand nationally, influence health concerns,health policies, and health intervention strat-egies. To take only one example, the ICPD,held in Cairo in 1994, represented the broadshift to making human well-being the focusof national and international activities de-
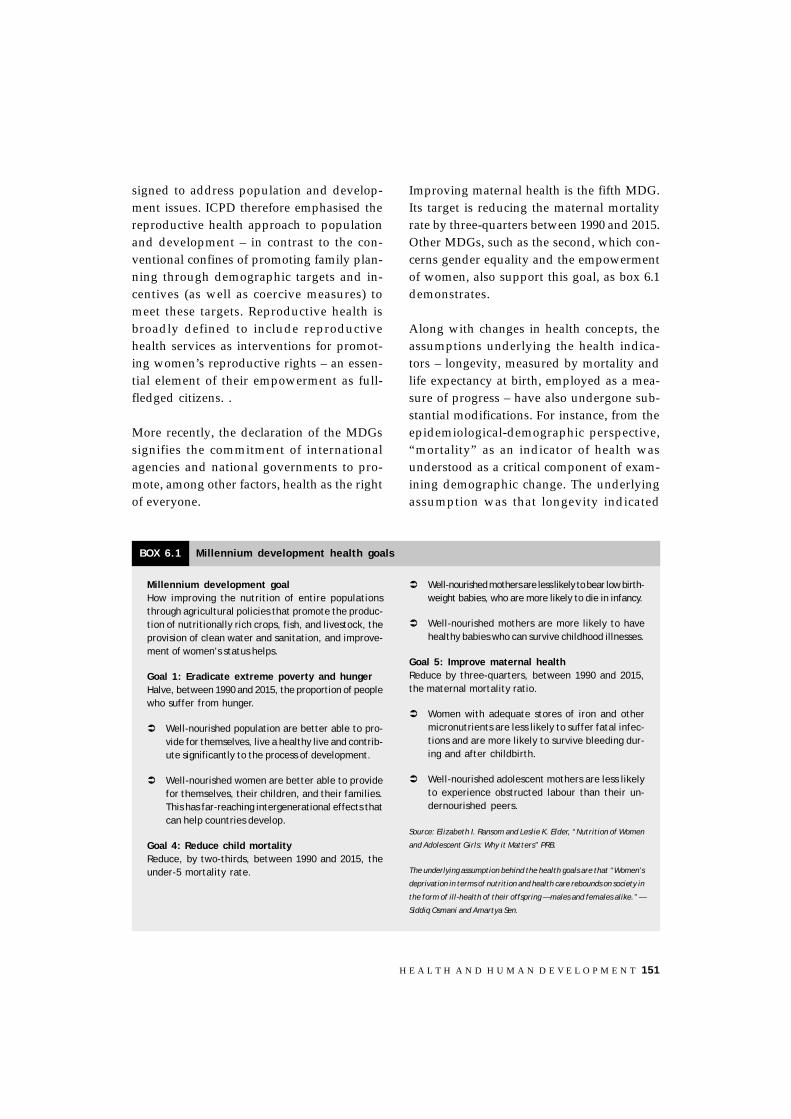
H E A L T H A N D H U M A N D E V E L O P M E N T 151
signed to address population and develop-ment issues. ICPD therefore emphasised thereproductive health approach to populationand development – in contrast to the con-ventional confines of promoting family plan-ning through demographic targets and in-centives (as well as coercive measures) tomeet these targets. Reproductive health isbroadly defined to include reproductivehealth services as interventions for promot-ing women’s reproductive rights – an essen-tial element of their empowerment as full-fledged citizens. .
More recently, the declaration of the MDGssignifies the commitment of internationalagencies and national governments to pro-mote, among other factors, health as the rightof everyone.
Improving maternal health is the fifth MDG.Its target is reducing the maternal mortalityrate by three-quarters between 1990 and 2015.Other MDGs, such as the second, which con-cerns gender equality and the empowermentof women, also support this goal, as box 6.1demonstrates.
Along with changes in health concepts, theassumptions underlying the health indica-tors – longevity, measured by mortality andlife expectancy at birth, employed as a mea-sure of progress – have also undergone sub-stantial modifications. For instance, from theepidemiological-demographic perspective,“mortality” as an indicator of health wasunderstood as a critical component of exam-ining demographic change. The underlyingassumption was that longevity indicated
Millennium development goalHow improving the nutrition of entire populationsthrough agricultural policies that promote the produc-tion of nutritionally rich crops, fish, and livestock, theprovision of clean water and sanitation, and improve-ment of women’s status helps.
Goal 1: Eradicate extreme poverty and hungerHalve, between 1990 and 2015, the proportion of peoplewho suffer from hunger.
" Well-nourished population are better able to pro-vide for themselves, live a healthy live and contrib-ute significantly to the process of development.
" Well-nourished women are better able to providefor themselves, their children, and their families.This has far-reaching intergenerational effects thatcan help countries develop.
Goal 4: Reduce child mortalityReduce, by two-thirds, between 1990 and 2015, theunder-5 mortality rate.
" Well-nourished mothers are less likely to bear low birth-weight babies, who are more likely to die in infancy.
" Well-nourished mothers are more likely to havehealthy babies who can survive childhood illnesses.
Goal 5: Improve maternal healthReduce by three-quarters, between 1990 and 2015,the maternal mortality ratio.
" Women with adequate stores of iron and othermicronutrients are less likely to suffer fatal infec-tions and are more likely to survive bleeding dur-ing and after childbirth.
" Well-nourished adolescent mothers are less likelyto experience obstructed labour than their un-dernourished peers.
Source: Elizabeth I. Ransom and Leslie K. Elder, “Nutrition of Women
and Adolescent Girls: Why it Matters” PRB.
The underlying assumption behind the health goals are that “Women’s
deprivation in terms of nutrition and health care rebounds on society in
the form of ill-health of their offspring — males and females alike.” —
Siddiq Osmani and Amartya Sen.
BOX 6.1 Millennium development health goals
152 R E A D I N G S I N H U M A N D E V E L O P M E N T
progress in human survival and hence theneed to survive. However, from the humandevelopment and human rights perspective,health measured by the value of longevity(life expectancy at birth) is regarded as ameans of capturing those aspects of humandevelopment that address social inequalitiesand their bearing on the quality of life. Theunderlying assumption here is that longev-ity necessarily entails improvements in dietand nutrition, hygiene and sanitation, im-provements in access to health care and inliving conditions. Hence, an increase in lifeexpectancy is taken as a proxy for qualita-tive improvements in health.
Despite changes in concepts and underly-ing assumptions – along with the motiva-tion for using health as an indicator – mor-tality and life expectancy at birth have re-mained basic measures of progress. Further,health and health reforms aimed at achiev-ing equality have focused on access to medi-cal care as the most important determinantof health. Yet though access to health care iscrucial, even with equal access to health care,racial/ethnic minorities, socially disadvan-taged groups, and people with low incomesand limited education would still have worsehealth and higher mortality than privilegedmembers of society. Social, economic, culturalconditions of life affect health and well-be-ing in ways that access to technical andmedical care can neither prevent nor correct.Consequently, human development practi-tioners examine issues beyond medical carein their efforts to improve health. They alsotry to develop measures/indicators that willcapture qualitative and non-economicchanges that affect health.
For these reasons, this chapter looks at thefollowing issues:
! Historical changes in the concept ofhealth and the use of health as an indica-tor of development, health policies andtheir links to macroeconomic and politi-cal environments;
! Inequalities in health and the differentfactors – socioeconomic, cultural, andbehavioural – that influence health andhealth-seeking behaviour;
! The relevance and adequacy of conven-tional measures of health - life expectancyat birth and mortality - in capturing the“well-being” and quality of life envisagedby the human development approach.This concern is particularly importantbecause underlying concepts of healthand the survey instruments used to gen-erate data have not changed;
! Whether the human development con-cept and its approach to improvinghealth as a vital component of enlarginghuman choice can be implementedwithin the existing institutional mecha-nisms that are “top-down” and per-vaded by sectoral mandates shaped bythe biomedical perspective.
HEALTH INHUMAN DEVELOPMENT
The sustained health of a population is amajor objective of development, irrespectiveof the changes in development model andapproaches. Even during the 19th century,reducing mortality and health risks was amajor concern; as Prime Minister of England,Benjamin Disraeli termed public health aprime objective of domestic policy. But themain issue surrounding health in develop-ment is setting societal values for equity ob-jectives or the extent to which health isprioritised in development; the approach

H E A L T H A N D H U M A N D E V E L O P M E N T 153
pursued in promoting health – whetherthrough the general process of economicgrowth, or through the advancement of healthas a separate goal. Further, do the process ofdevelopment and the advancement of healthnecessarily go together? These are several ofthe many questions examined by develop-ment professionals as early as 1970s (Preston1975; Sen 1999; Caldwell 2003; Whitehead,et al 2002). We have since learned from coun-try experiences that exclusive concentrationon economic growth does not automaticallylead to better health and equity in humanprogress. That link has to be made throughsocial policies with strong ethical dimen-sions and the management of growth. Anexclusive concentration in economic growthhas resulted in the failed trickle-down sys-tem and missed opportunities for humandevelopment (UNDP 1990; 1996). Further,the root causes of health inequalities mustbe identified and ways of tackling thesecauses determined. It is in this context thatwe now examine the links between the placethat health occupies in human develop-ment, the evolution of concepts of health,and both health policies and developmentapproaches pursued, as well as the relation-ship between reproductive health and hu-man development.
Links between healthand human developmentHuman development emerged as an alter-native approach to economic-centred devel-opment, putting “people” at the center ofdevelopment. A fundamental concern of thehuman development model is the social andgender inequalities that exist between nationsand within them. Wealth is regarded as ameans for achieving the well-being of people;well-being, in turn, is equated to health of
people, including the “freedom to live long”and to “live well”. The basic objective in hu-man development is to “create an enablingenvironment for people to enjoy long, healthyand creative life” (UNDP 1990). It addressesthe issue of how best to promote health andhow to capture the aspects of human devel-opment that are not reflected in income.
Human development practitioners maintainthat national income, although useful, doesnot a) reflect the inequalities between dif-ferent population groups; nor b) show quali-tative aspects of life achievements, such asbetter health and nutrition, secure liveli-hoods, work conditions, or access to knowl-edge/information – in short, “humangood”. The HDI was conceptualised anddeveloped to capture the aspects of humandevelopment and the inequalities that arenot reflected by income or monetary mea-sures alone. HDI is expected to provide acomprehensive measure of people’s well-being by including life expectancy at birthin conjunction with education and income.Health as such is viewed as an enhance-ment of capability functioning to alleviatepoverty and prevent both premature mor-tality and escapable morbidity, includingunder-nourishment. Consequently, in hu-man development, health occupies a par-ticular place and is considered critical. Itsproxy is a composite of life expectancy plusinfant and maternal mortality.
Further, health in human development isconsidered as more than living longer andbeing healthy in the sense of an absence ofdisease or malnutrition. As noted above, it isthe enhancement of one of the human capa-bilities that enables individuals to act andbe what they desire to be. Its importance maybe viewed at two levels: first, physical health
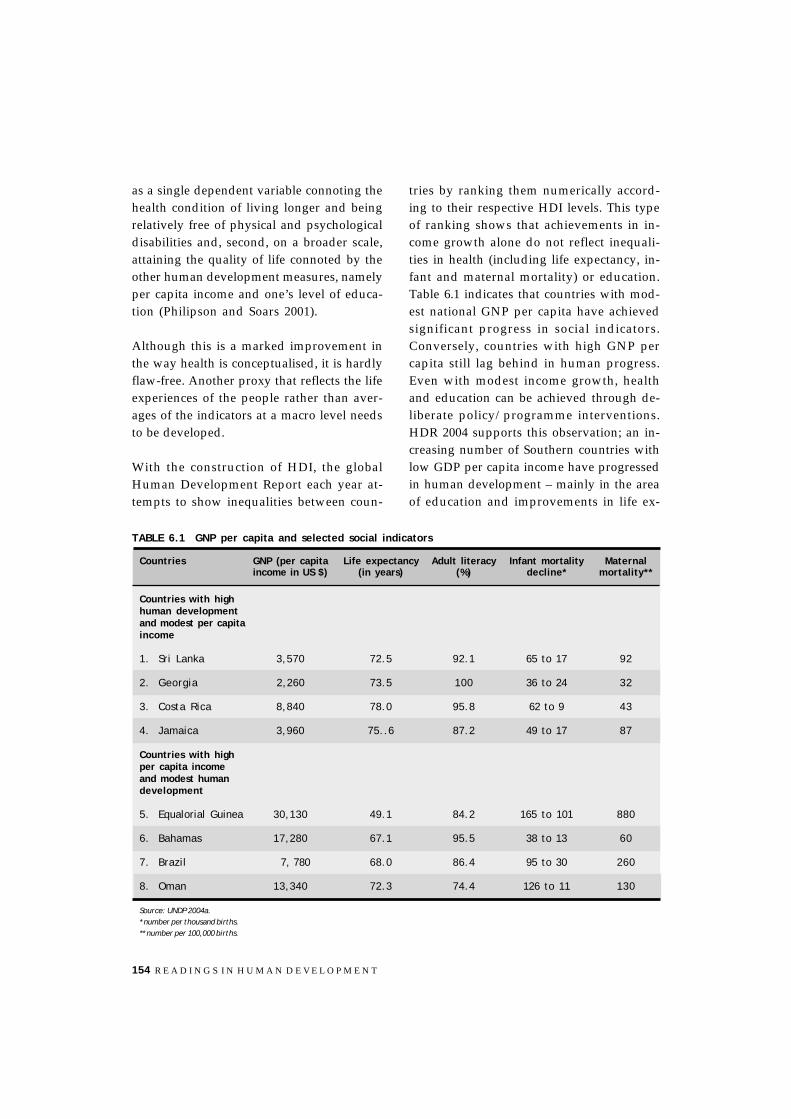
154 R E A D I N G S I N H U M A N D E V E L O P M E N T
as a single dependent variable connoting thehealth condition of living longer and beingrelatively free of physical and psychologicaldisabilities and, second, on a broader scale,attaining the quality of life connoted by theother human development measures, namelyper capita income and one’s level of educa-tion (Philipson and Soars 2001).
Although this is a marked improvement inthe way health is conceptualised, it is hardlyflaw-free. Another proxy that reflects the lifeexperiences of the people rather than aver-ages of the indicators at a macro level needsto be developed.
With the construction of HDI, the globalHuman Development Report each year at-tempts to show inequalities between coun-
tries by ranking them numerically accord-ing to their respective HDI levels. This typeof ranking shows that achievements in in-come growth alone do not reflect inequali-ties in health (including life expectancy, in-fant and maternal mortality) or education.Table 6.1 indicates that countries with mod-est national GNP per capita have achievedsignificant progress in social indicators.Conversely, countries with high GNP percapita still lag behind in human progress.Even with modest income growth, healthand education can be achieved through de-liberate policy/programme interventions.HDR 2004 supports this observation; an in-creasing number of Southern countries withlow GDP per capita income have progressedin human development – mainly in the areaof education and improvements in life ex-
TABLE 6.1 GNP per capita and selected social indicators
Countries GNP (per capita Life expectancy Adult literacy Infant mortality Maternalincome in US $) (in years) (%) decline* mortality**
Countries with highhuman developmentand modest per capitaincome
1. Sri Lanka 3,570 72.5 92.1 65 to 17 92
2. Georgia 2,260 73.5 100 36 to 24 32
3. Costa Rica 8,840 78.0 95.8 62 to 9 43
4. Jamaica 3,960 75..6 87.2 49 to 17 87
Countries with highper capita incomeand modest humandevelopment
5. Equalorial Guinea 30,130 49.1 84.2 165 to 101 880
6. Bahamas 17,280 67.1 95.5 38 to 13 60
7. Brazil 7, 780 68.0 86.4 95 to 30 260
8. Oman 13,340 72.3 74.4 126 to 11 130
Source: UNDP 2004a.* number per thousand births.** number per 100,000 births.

H E A L T H A N D H U M A N D E V E L O P M E N T 155
pectancy. Bangladesh, Bhutan and Nepalhave moved from the ranking of low humandevelopment countries to that of mediumhuman development countries. The develop-ment experiences of numerous countriesunderline the need for paying attention tothe links between economic growth and hu-man development.
Further, human development reports alsoshow that many of the fast-growing devel-oping countries have failed to reduce socio-economic deprivation, thereby pointing tothe erroneous assumption that income willautomatically lead to a betterment of people’slives and better health. The fact that increasesin income do not guarantee good health isevidenced by the rapid spread of drug ad-diction, alcoholism, HIV/AIDS, violence andmany other morbidities that result from socio-cultural, behavioural and gender factors(UNDP 1996). Human development under-scores the importance of a proper utilisationof income for investments in health as a hu-man right, rather than as the distribution ofwelfare benefits.
The changes in the concept ofhealth and health approaches,and mortality trendsAs indicated in the introductory section ofthis chapter, the concept of health itself hasundergone substantial change from the epi-demiological perspective of the struggle forsurvival to the view of health as a funda-mental human right within a sociocultural,economic and behavioural perspective. Thischange signifies a need to treat health as ahuman and behavioural issue that goes wellbeyond medical measures of health care andthe socioeconomic concept of health. Wemust look instead at the evolution of the con-
FIGURE 6.1 Regional trends inlife expectancy at birth (in years)
Source: PRB 1999.LAC = Latin America and the Caribbean.MDC = More developed countries.
56
65
44
51
54
66
59
69
71
75
World
Africa
Asia
LAC
MDC
1965-1970
?????1990-2000
cept of health in relation to the differenthealth policies/strategies developed over thelast few centuries and their links to the over-all macroeconomic and political climate. Thelinks among the three – health concepts, poli-cies on/influencing health, and macro eco-nomic/political environment – are depictedby figure 6.1.
Health as a biological phenomenon in thehuman struggle for survival: Before the mid-18th century, life in Europe and elsewhere wascharacterised by high mortality from faminesand epidemics, among these smallpox,measles, typhoid fever, cholera, yellow fever,influenza and bubonic and pneumonicplague (Haines 1999). Average longevitywas only 30 years and at least 50% of chil-dren died before reaching maturity (UNDP2000). One result was slow populationgrowth. Consequently, issues of improvinghealth as such were equated with reducingmortality levels and increasing life expect-ancy at birth.

156 R E A D I N G S I N H U M A N D E V E L O P M E N T
However, mortality began decreasing in themiddle of 18th century. The ensuing transi-tion that spanned the later 1700s well intothe 19th century was one of the outstandingachievements of the modern era. By 1800, thenumber of births exceeded deaths and hu-man populations began to grow. The 19th cen-tury saw this rise primarily in theindustrialising countries of Europe andNorth America. By the early 1900s, life ex-pectancy had increased dramatically: In theUSA, it rose to 56 years by 1920 and furtherincreased to 68 years by 1950. For WesternEurope, it was even higher, despite the ter-rible tolls of World Wars I and II. Averagelife expectancy for these parts of the world,along with Canada, reached 75 years be-tween 1995 and 2000. After World War II,remarkable progress was made in reducingmortality so that by 1990-1995, global lifeexpectancy was estimated at 65 years. Table6.2 and figure 6.1 illustrate this pattern, lifeexpectancy for females increasing at aslightly faster rate than that of males.
Crude death rates for the world as a wholedeclined from almost 20/1000 in 1950s to
9/1000 in 1990s (UN 2000). This remarkableprogress is attributed to life-saving advancesin medicine, public health and hygiene, andimprovements in nutritional status resultingfrom agricultural development.
However, mortality patterns were quite dif-ferent among Southern countries over thepast 50 years. Life expectancy rose from 41to 62 years between 1950 and 1995, Asia ex-periencing the largest increase since the late1960s: from 54 to 66 years. Progress wasmuch slower in sub-Saharan Africa, with alife expectancy of only 51 years (PRB 1999).
As disease patterns change, the average ageat death shifts from childhood and youngadulthood to later age brackets, with corre-sponding increases in life expectancy. Theseimprovements in survival selectively favourthe young more than the old, women morethan men and the privileged more than thepoor. All in all, the modern mortality tran-sition of the mid-18th to mid-20th century wasseen largely as a struggle for survival. Anychange in mortality was viewed as a vitalprocess with profound impacts on human
TABLE 6.2 Mortality trend since 1750
Approxi- World Life expectancy Crude Infant Lifemately population (W. Europe death rate mortality expectancydate Growth and U.S.) (Sweden) rate (Latin America)
1750 - - - 204 -
1800 0.42 37.4 26 200 -
1850 0.51 41.5 20 149 -
1900 0.54 54.3 16 98 27.2
1950 0.82 69.8 10 22 46.4
1965 1.08 72.3 10 14 55.8
1990 1.92 76.4 12 6 67.0
Source: Haines 1999.

H E A L T H A N D H U M A N D E V E L O P M E N T 157
demographic history. The primary concernwas saving lives and increasing longevitythrough curative and preventive measures.The policies pursued were health promo-tion through public health interventionsand specific disease eradicationprogrammes.
Although the pace has been uneven, the phe-nomenon has rapidly spread from the North-ern to the Southern world. Mortality levelswere therefore taken as good indicators ofdevelopment and access to basic minimumhealth care. The period between 1945 and1975 was also the peak of decolonisation.The newly independent countries inheritedhealth care systems modeled upon those ofthe indutrialised countries, and most pur-sued development in the image of the West.Economic development was seen as a meansof ending misery and increasing longevity.Planners assumed that increases in percapita income and economic growth wouldlead automatically to better human healthand well-being.
The epidemiological and demographic per-spective: Based on mortality trends and thedebate surrounding the ramifications of in-creased longevity for quality of life and well-being, the concept of epidemiological transi-tion was first formulated by Abdel Omran(1971), who attempted to integrate epidemiol-ogy with demographic changes in humanpopulation in explaining the complex changesin patterns of health and disease and theirinteractions. The theory focused on these pat-terns; their demographic, socioeconomic andbiologic determinants; and their conse-quences for population groups. It also dis-cussed their health-care implications andidentified mortality as the fundamental forcein population change. In this view, the life
expectancy transition occurred in three suc-cessive stages:! pestilence and famine, associated with a
rise in infections diseases that accompa-nied the Neolithic Revolution;
! receding pandemics, which involved ashift from infectious to the chronic diseasesassociated with industrialisation; and
! degenerative and man-made diseasescharacterised by aging, chronic diseases,emerging new scourges (such as HIV/AIDS) and the resurgence of older dis-eases (such as tuberculosis). The recentresurgence of the old and new infectiousdiseases drew attention to the deadlypathogens. The works of Lederberg, et al(1992) and Morse (1994) reported an omi-nous resurgence of morbidity and mor-tality from these infectious diseases andalso showed the eroding effects of anti-microbial therapies in the face of grow-ing multidrug resistance. Among the re-cently emerging infectious diseases,HIV/AIDS has become the second lead-ing cause of death among adult males of25 years and above in the USA and themain contributor to a 40% increase in in-fectious disease mortality over the past15 years.
Yet mortality and births were seen as“events” determining the size of population.A mortality decline – or rise in the life ex-pectancy at birth – is perceived as wideningthe gap between birth and death rates. Popu-lation growth, therefore, becomes increas-ingly sensitive to fertility changes. The pat-terns, pace, and specific dynamics of thesetransitional changes vary in different histori-cal, political, socioeconomic and cultural set-tings. The formulation of models of the epide-miological transition for societies at differentlevels of social and health development pro-
158 R E A D I N G S I N H U M A N D E V E L O P M E N T
vides a basis for predicting future changes inpopulation and health. Thus, mortality andlife expectancy per se was of particular inter-est as a determinant of population change.However, increases in longevity did not meanimprovement in the quality of life.
The general reduction in deaths after 1950led to an explosion of population growth inmany Southern countries. Births remainedhigh and the rate of natural increase (morebirths than deaths) shot to new heights. Birthrates declined very slowly in these countries.By 1987, world population reached its fifthbillion and today has crossed the 6 billionmark – the most rapid increase in world his-tory within just 17 years. This led interna-tional agencies and national governments topursue policies to control fertility, focusingon restraining population growth becauseof widespread concern with the threat to eco-nomic development, public health and theenvironment. Health policy as such focusedon maternal and child health and familyplanning (MCH/FP) programmes to reducebirth rates and slow population growth,while concerns for general health were mani-fest in increasing life expectancy at birththrough curative and preventive measures –public health interventions and diseaseeradication programmes.
MCH/FP programmes were closely linkedto population policies that tried to reducepopulation growth as a means of promotingsocial and economic development. Thesepolicies, adopted by a great number of gov-ernments, aimed at improving the quality oflife in terms of the resources available in agiven country. India’s population controlmeasures during the 1960s and China’scointinuing one-child policy illustrate coer-cive measures adopted to control fertility so
as to slow down population growth in theinterests of general socioeconomic develop-ment. South Korea, Thailand and Brazil alsofollowed policies aimed at achieving fertilityrates close to or below 2 children on average.
These few examples indicate that despite ageneral aim at qualitative health improve-ment, these measures and the programmespursued to implement them were very muchinfluenced by the prevailing developmentenvironment.
The health equity and rights perspective:The progress in global health achieved dur-ing the 19th century was a mixed blessing.Despite gains in longevity, reductions in in-fant mortality and the control of severaldeadly communicable diseases, there weremajor setbacks. Aggregate improvements inlife expectancy and child mortality resultedin mortality gaps between the rich and poor,both between and within countries. In somecountries of sub-Saharan Africa, infant mor-tality actually increased during the 1990sunder SAPs, coupled with drought, armedconflict, the upsurge of HIV/AIDS and theresurgence and spread of old communicablediseases once thought to be well under con-trol – among these, cholera, tuberculosis,malaria, yellow fever, trypamosomiasis anddengue fever. Several of these new and olddiseases, notably HIV/AIDS, threatenedhealth gains in many other Southern coun-tries, too, as well as transitional countries inCentral and Eastern Europe.
The emphasis on economic growth in thedevelopment process during the 1950s and1960s had added to health inequalities andthe perpetuation of the power of the globalNorth, giving birth eventually to the “Healthfor All” movement of the 1970s. Governments

H E A L T H A N D H U M A N D E V E L O P M E N T 159
and international and national agencieswidely recognised the need to improve thehealth of the poor. Health differentials be-tween nations and different populationgroups, along with relative deprivation anda denial of basic needs and opportunitieswere considered important aspects of health.During the 1970s, for instance, instead of aim-ing primarily at mortality reduction and in-creasing longevity, world healthorganisation (WHO) led a global effort toachieve “Health for All” by the year 2000.
The 1978 international conference on PHC,held in Alma-Ata, Kazakhstan, under WHOauspices, resulted in the commitment of 134countries to a declaration that stated: “In-equalities in the health status of people, par-ticularly, between developed and develop-ing countries as well as within countries, ispolitically, socially and economically unac-ceptable” (WHO 1978). PHC consequentlyhad strong socio-political implications. Itexplicitly outlined a strategy that would re-spond not only more equitably to basichealth needs, but also address the underly-ing social, economic and political causes ofpoor health. From an equity perspective, ithad a strong community orientation withemphasis on universal accessibility and cov-erage on the basis of need (WHO 2003).
However, this movement was short-lived.After six years, international donors turnedtheir attention from PHC to redirect fundsinto programmes that promised quicker so-lutions for more narrowly targeted problems.These had negative impacts at the commu-nity level and set back the implementation ofPHC for both economic and political reasons.
The market-oriented health perspective: Bythe 1980s, the PHC approach to health care
faced serious problems, in large measure be-cause of three broad factors on the globalscene (Health for All 2003; Gwatkin 2002).First, the overall development picture hadbecome complicated by the severe economicdifficulties of many Southern countries fol-lowing the World Bank/IMF imposition ofSAPs for debt servicing. This policy packageaimed at reducing public expenditure. In thepublic sector, real wages were held down orcut and subsidies to essential goods, nota-bly foodstuffs, were removed or reduced. Sec-ond, the collapse of the socialist system inCentral and Eastern Europe, as well as eco-nomic liberalisation in China, had led to aloss of confidence in the state-led approachto development. The market-led approach be-came dominant in all sectors of the economy,including health. Third, the poor perfor-mances of PHC programnmes, particularlyin the areas of immunisation coverage be-tween 1990-93, the reappearance of diphthe-ria in several former colonies, the limited cov-erage of pregnant women (only 50%) withtetanus anti-toxin and declines in nutritionalstatus shifted emphasis towards health sec-tor reform and the sustainability approach,emphasising the efficiency and effectivenessof health services. Ability of PHC as an ap-proach was seriously questioned in beingable to deliver the benefits expected. Healthof the poor was no longer the area of atten-
“Health is a state of complete physical, mental, andsocial well-being and not merely the absence of dis-ease or infirmity. The enjoyment of the highestattainable standard of health is one of the funda-mental rights of every human being without dis-tinction of race, religion, political belief, economicor social condition”.
Source: WHO 2002.
BOX 6.2 Definition of health

160 R E A D I N G S I N H U M A N D E V E L O P M E N T
tion during the time. The attention shiftedaway from “Health for All” towards “healthsector reform” with greater concern forsustainability, as reflected in the intensiveactivity on health financing that took placewith concerns of efficiency and cost effective-ness. The World Bank publication, Financ-ing Health Services in Developing Countries,in 1997 had a great influence.
Neo-liberal free-market ideology, “topdown” approach based on market orienta-tion with its emphasis on liberalisation andprivatisation had a profound influence onhealth policies of the developing countriesleading to adverse consequences on people’shealth, particularly of the poor. By the 1980s,WHO, UNICEF and the World Bank hadlaunched the global initiative for selectivepublic health care focusing on immuniza-tions, AIDS and tuberculosis, based on thecost-effective and efficiency criteria.
Equality in health and health services ratherthan overall increase in survival were thefocus of the movement, which currently hasregained greater concern.
Renewed concern with health inequalities:As the third millennium began, there was arenewed concern for poverty and equity inhealth because of several developments inthe international health community. First, anumber of inter-country research projectsemerged on health, poverty, and equity, sup-ported by a wide range of donors (Carr, et al1999; Whitehead 2000). Findings from suchresearch works raised awareness and re-newed concerns for improving the situationfrom equity or social justice perspective thatgoes beyond the socioeconomic perspectiveof assuming that increase in income or tech-nological improvement in the health services
will lead to better health of the people. Sec-ond, the World Bank’s sector strategy of work-ing with countries to improve health, nutri-tion and population (HNP) outcomes,adopted in 1997, highlighted the importanceof improving the health of the poor and do-ing away with health inequalities in the de-velopment process (World Bank 1997). Tothis end, the Director-General of WHO, thenDr. Gro Harlem Brundtland stressed the chal-lenge to “reduce the burden of mortality andmorbidity suffered by the poor” in her pref-ace to the Organisation’s 1999 annual report.This emphasis was further reinforced by theHDR 1997 with a new poverty measure, theHPI. Amartya Sen gave further visibility tothe issues of poverty and health inequalities.These renewed emphases spurred a greaterawareness of social exclusion and its role inpeople’s health.
Two distinctive concepts of “health” emergedin the public arena – the gender dimension ofhealth inequalities and a broadening of theunderstanding of health’s contribution to de-velopment, from a basic service that helpsmitigate the impact of poverty to a prerequi-site of growth for poverty reduction. The gen-der dimension of health, exemplified by theICPD held in Cairo, in September 1994,brought about a fundamental shift in the con-cept of population and health – from a bio-medical and socioeconomic perspective to areproductive health (RH) approach. It took aholistic view of women’s health encompass-ing both the biological aspects of women’shealth and their roles in social reproductionwithin a life cycle approach. This meant thatone had to consider the context of health, i.e.existing structural inequalities in both socialand gender spheres. It set out an ethical basefor promoting population and health issuesin the framework of human development, gen-

H E A L T H A N D H U M A N D E V E L O P M E N T 161
der equality and equity and human rights,particularly women’s reproductive rights andtheir right to empowerment. The conferenceset a new paradigms for population andhealth policy with shift away from demo-graphic target fixes, incentives and coercivemeasures of promoting family planning to-wards the provision of broadly defined repro-ductive health services that recognisewomen’s reproductive rights and their needfor empowerment. At the core of this newthinking lay the contributions of womenNGOs, health advocates and women activ-ists. The women’s movement for mainstreaminggender into the development process providedthe climate for change in population andhealth policies from a gender perspective.
ICPD had a major influence on the 179 par-ticipating countries. Almost all Southerncountries adopted a reproductive health ap-proach to development in the context ofPHC. In the five years that followed, NGOs,the UN and other donors and internationalagencies worked in a number of ways toadvance these goals. The Cairo Programmeof Action, reaffirmed by the Beijing Platform,also provided momentum and direction topost-Cairo government policies andwomen’s health advocacy. Accordingly,most Southern countries adopted a broaderapproach to reproductive health within thecontext of PHC with the following essentialcomponents:! family planning counseling, information,
education, communication and servicesemphasising the prevention of unwantedpregnancy
! prevention and management of compli-cations of abortion
! prevention and management of RTIs,STDs, HIV/AIDS and other reproductivehealth conditions
! adolescent reproductive health whichinclude information, education and coun-seling on human sexuality
! prevention and management of sub-fer-tility
! life cycle issues including breast cancer,cancer of the reproductive system andcare of the elderly.
Nonetheless, gender inequalities persist withunacceptably high maternal deaths and lowmaternity services, a feminisation of repro-ductive health, continued stigmatisation ofwomen’s health related to sex and sexuality,the structural limitations of health care sys-tems in integrating broader concerns in re-productive health, –particularly those relatedto social-cultural aspects of RH. ICPD + 5identified the following reasons for these set-backs as! The estimated requirement of US $ 17 bil-
lion to cover the cost of core family plan-ning and RH programmes by the year2000 did not materialise. The donor com-munity delivered only $2 million of the$5.7 billion they had pledged. Southerncountries, however, met more than twothirds of their commitments, despite thecrushing debt burdens of Africa, LatinAmerica and parts of South Asia.
! Globalisation and privatisation policiesand the free-market ideology precipitateda global economic crisis that rocked manycountries of Southeast Asia, Russia andthe former Soviet republics, Brazil and Ar-gentina between 1997 and 1999. The cri-sis in Asia led to drastic cuts in socialsector spending. Further devaluations ofnational currencies placed food, medi-cine, and other essentials beyond thereach of large segments of the population,pusing up malnutrition rates amongwomen and children.

162 R E A D I N G S I N H U M A N D E V E L O P M E N T
! Lack of conceptual clarity and the persis-tence of demographically driven ap-proaches have impeded the integrationof comprehensive reproductive healthwithin the life cycle approach into theconventional bio-medical system.
The MDGs of 2000 not only reflect the cur-rent issues and concerns of poverty andhealth inequalities, but also representchanges in health perspectives. The goalshave been set in support of the human devel-opment aimed at ending human deprivation.Of the eight goals, four are directly related tohealth. These goals and targets to be achievedby 2015 have been set for monitoring humandevelopment. The elimination of poverty isassumed to bring about an improvement inpeople’s overall health through improve-ments in nutrition, drinking water and sani-tation as well as improvements in agricul-tural policies and production. Most South-ern countries have incorporated the MDGsinto their national plans and are committedto achieving the targets within their coun-try-specific contexts.
More recently, the report of the Commissionon Macroeconomics and Health (WHO2001) stressed the importance of health inthe context of current global economictrends and the need to address health in-equalities in terms of the cost of continuedill- health and the burden of disease amongthe poor on overall development. The eco-nomic costs of avoidable disease are stag-geringly high: “... dozens of percent of GNPof the poorest countries each year, whichtranslates into hundreds of billions of USdollars”. The Commission’s key recommen-dation was the commitment of massive ad-ditional financial resources by both donorsand national governments for scaling up
health intervention programmes – a re-sponse to the adverse impacts of SAPs, theeconomic costs of avoidable diseases andthe renewed articulation of the positive ef-fect of improved health on gains in growthin per capita income (WHO 2002).
Reproductive healthand human developmentAs indicated earlier, reproductive health, asdelineated by ICPD, represents a new dimen-sion of health care and also a change in theperception of population issues – from fam-ily planning to a rights perspective that linksreproductive health to human developmentand reinforces values of social and genderjustice in development processes. Reproduc-tive health concerns not only biological re-production, but also all the social tasks in-volved in maintaining human families andcommunities. It contributes to populationdynamics not only because it involveschanges in women’s “fertility” and mortal-ity, but also factors bound up with mater-nity, including a woman’s age at marriage,her age at the birth of each child she bearsand her status within her family – all factorsrelated to marriage rights, maternal age, andparity – that determine the well-being of hu-man populations. In addition, gender equal-ity and the empowerment of women contrib-ute significantly to the regulation of fertilityand therefore to achieving population sta-bility. Further, if women are to contribute tohuman development, reproductive healthcare enhances her capability functioning. Allin all, the role of reproductive health is criti-cal in balancing the reproduction of the hu-man population with its quality of life.
In view of this spectrum of population is-sues, women’s health advocates became in-
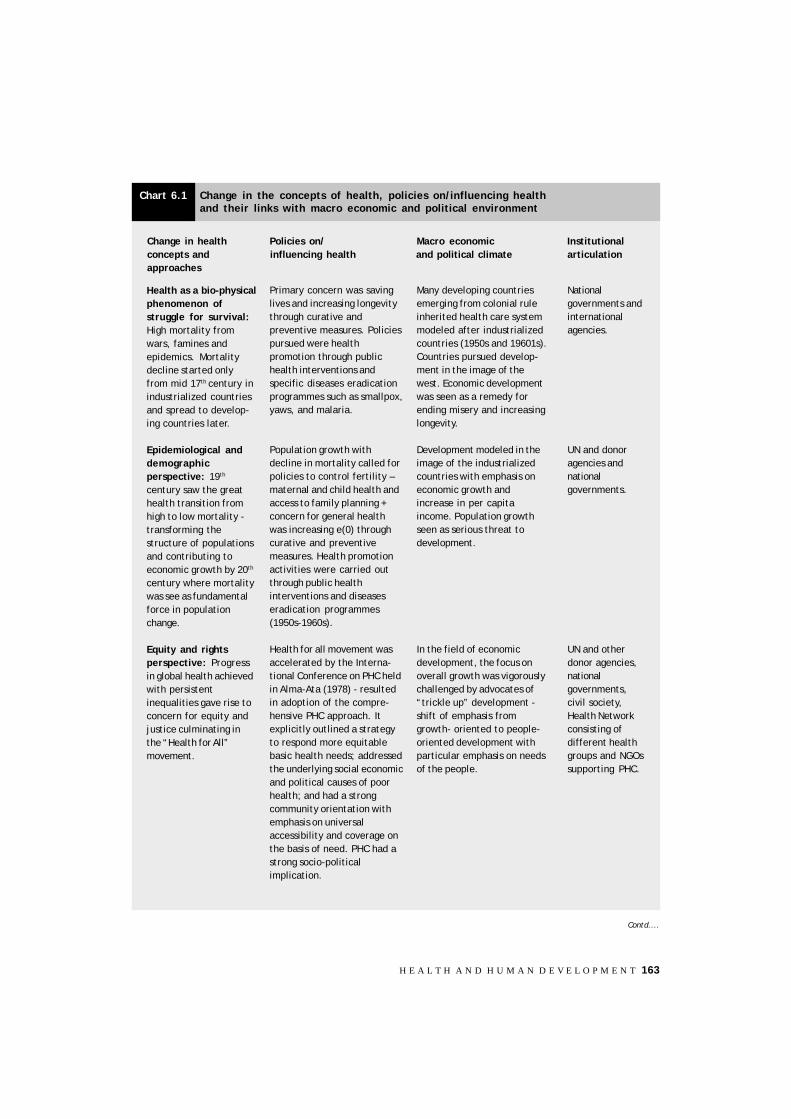
H E A L T H A N D H U M A N D E V E L O P M E N T 163
Change in health Policies on/ Macro economic Institutionalconcepts and influencing health and political climate articulationapproaches
Chart 6.1 Change in the concepts of health, policies on/influencing healthand their links with macro economic and political environment
Primary concern was savinglives and increasing longevitythrough curative andpreventive measures. Policiespursued were healthpromotion through publichealth interventions andspecific diseases eradicationprogrammes such as smallpox,yaws, and malaria.
Population growth withdecline in mortality called forpolicies to control fertility –maternal and child health andaccess to family planning +concern for general healthwas increasing e(0) throughcurative and preventivemeasures. Health promotionactivities were carried outthrough public healthinterventions and diseaseseradication programmes(1950s-1960s).
Health for all movement wasaccelerated by the Interna-tional Conference on PHC heldin Alma-Ata (1978) - resultedin adoption of the compre-hensive PHC approach. Itexplicitly outlined a strategyto respond more equitablebasic health needs; addressedthe underlying social economicand political causes of poorhealth; and had a strongcommunity orientation withemphasis on universalaccessibility and coverage onthe basis of need. PHC had astrong socio-politicalimplication.
Health as a bio-physicalphenomenon ofstruggle for survival:High mortality fromwars, famines andepidemics. Mortalitydecline started onlyfrom mid 17th century inindustrialized countriesand spread to develop-ing countries later.
Epidemiological anddemographicperspective: 19th
century saw the greathealth transition fromhigh to low mortality -transforming thestructure of populationsand contributing toeconomic growth by 20th
century where mortalitywas see as fundamentalforce in populationchange.
Equity and rightsperspective: Progressin global health achievedwith persistentinequalities gave rise toconcern for equity andjustice culminating inthe “Health for All”movement.
Many developing countriesemerging from colonial ruleinherited health care systemmodeled after industrializedcountries (1950s and 19601s).Countries pursued develop-ment in the image of thewest. Economic developmentwas seen as a remedy forending misery and increasinglongevity.
Development modeled in theimage of the industrializedcountries with emphasis oneconomic growth andincrease in per capitaincome. Population growthseen as serious threat todevelopment.
In the field of economicdevelopment, the focus onoverall growth was vigorouslychallenged by advocates of“trickle up” development -shift of emphasis fromgrowth- oriented to people-oriented development withparticular emphasis on needsof the people.
Nationalgovernments andinternationalagencies.
UN and donoragencies andnationalgovernments.
UN and otherdonor agencies,nationalgovernments,civil society,Health Networkconsisting ofdifferent healthgroups and NGOssupporting PHC.
Contd....
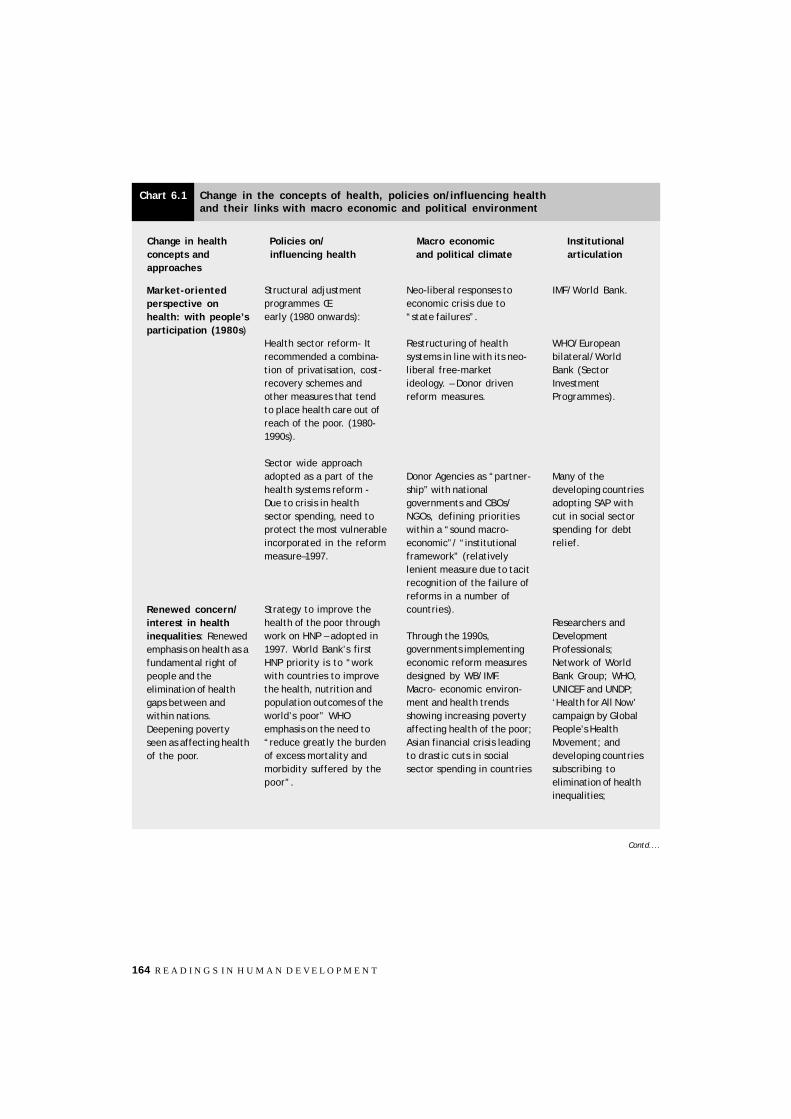
164 R E A D I N G S I N H U M A N D E V E L O P M E N T
Change in health Policies on/ Macro economic Institutionalconcepts and influencing health and political climate articulationapproaches
Chart 6.1 Change in the concepts of health, policies on/influencing healthand their links with macro economic and political environment
Structural adjustmentprogrammes Œearly (1980 onwards):
Health sector reform- Itrecommended a combina-tion of privatisation, cost-recovery schemes andother measures that tendto place health care out ofreach of the poor. (1980-1990s).
Sector wide approachadopted as a part of thehealth systems reform -Due to crisis in healthsector spending, need toprotect the most vulnerableincorporated in the reformmeasure–1997.
Strategy to improve thehealth of the poor throughwork on HNP – adopted in1997. World Bank’s firstHNP priority is to “workwith countries to improvethe health, nutrition andpopulation outcomes of theworld’s poor” WHOemphasis on the need to“reduce greatly the burdenof excess mortality andmorbidity suffered by thepoor”.
Market-orientedperspective onhealth: with people’sparticipation (1980s)
Renewed concern/interest in healthinequalities: Renewedemphasis on health as afundamental right ofpeople and theelimination of healthgaps between andwithin nations.Deepening povertyseen as affecting healthof the poor.
Neo-liberal responses toeconomic crisis due to“state failures”.
Restructuring of healthsystems in line with its neo-liberal free-marketideology. – Donor drivenreform measures.
Donor Agencies as “partner-ship” with nationalgovernments and CBOs/NGOs, defining prioritieswithin a “sound macro-economic”/ “institutionalframework” (relativelylenient measure due to tacitrecognition of the failure ofreforms in a number ofcountries).
Through the 1990s,governments implementingeconomic reform measuresdesigned by WB/IMF.Macro- economic environ-ment and health trendsshowing increasing povertyaffecting health of the poor;Asian financial crisis leadingto drastic cuts in socialsector spending in countries
IMF/World Bank.
WHO/Europeanbilateral/WorldBank (SectorInvestmentProgrammes).
Many of thedeveloping countriesadopting SAP withcut in social sectorspending for debtrelief.
Researchers andDevelopmentProfessionals;Network of WorldBank Group; WHO,UNICEF and UNDP;‘Health for All Now’campaign by GlobalPeople’s HealthMovement; anddeveloping countriessubscribing toelimination of healthinequalities;
Contd....

H E A L T H A N D H U M A N D E V E L O P M E N T 165
Change in health Policies on/ Macro economic Institutionalconcepts and influencing health and political climate articulationapproaches
Chart 6.1 Change in the concepts of health, policies on/influencing healthand their links with macro economic and political environment
Reproductive healthapproach to populationpolicies and programmeadopted. The main thrustof this approach iselimination of genderinequalities as the key toimproving health, reducingpoverty and empoweringwomen. The ICPD held inCairo, September 1994 setthe ethnical base forpromoting population issuesin the framework of humandevelopment, genderequality/equity and humanrights.
The recent UN declarationof the time bound MDGswith a particular focus onpoverty for a sustainedhealthy life – It contains acore list of eight goals andtargets, directly orindirectly related to health,to be achieved by 2015through improvement innutrition, drinking waterand sanitation and overallimprovement in theagricultural policies andproduction. They reflectthe current issues andconcerns of poverty andhealth inequalities.
Gender and socialinequalities as theroot of the existinghealth inequality:concern/interest ingender disparities inhealth and the need totreat health from aholistic perspective,taking into accountsocio-cultural andeconomic contexts andthe multiple factorsinfluencing health ofwomen (1995).
Health as a contribu-tory factor indevelopment: Needfor time- boundachievements inhealth; good healthseen as contributing tothe overall develop-ment and healthdeprivation seen as anaspect of poverty.
Efforts to mainstreamgender in development –largely due to the women’smovement and feministlobby for gender equality/equity and social justice indevelopment particularly inhealth sector; recognition ofgender biases in macroeconomic policies withadverse impact on women.Exploitation and use ofwomen’s cheap and flexiblelabour to support structuraladjustment policy and globalmarket economy;feminisation of poverty andserious gender inequalitiesin health/sharing ofresources.
Globalization is under trial –despite the potentials ofbenefit of globalization theresult is yet to be realized.Wide recognition of adverseimpact of market leddevelopment, free trade,and privatisation on healthand lives of the world’spoor. Recognition of thisglobal interdependence andrenewed commitment of theworld’s political leaderstowards reduction inpoverty and improvement inhealth Economic growth withhuman face.
UNFPA, UNIFEM;Women’s groups andNGOs working ongender and healthissues at nationaland internationallevels.
National Govern-ments adaptingreproductive healthapproach topopulation anddevelopment andempowerment ofwomen. UNDP andother UN agencies;National govern-ments adoptingMDGs in theirnational contextsand carrying outpoverty reductionstrategy (prepara-tion of PRSP atnational level bygovernments).
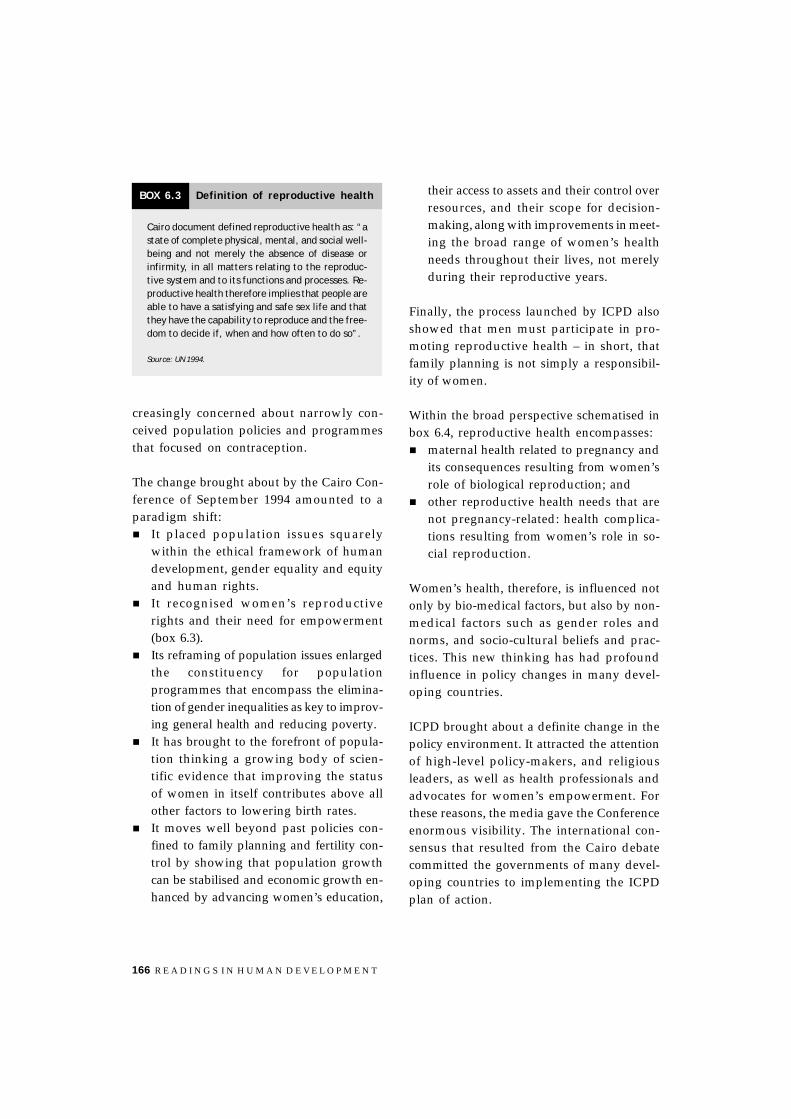
166 R E A D I N G S I N H U M A N D E V E L O P M E N T
their access to assets and their control overresources, and their scope for decision-making, along with improvements in meet-ing the broad range of women’s healthneeds throughout their lives, not merelyduring their reproductive years.
Finally, the process launched by ICPD alsoshowed that men must participate in pro-moting reproductive health – in short, thatfamily planning is not simply a responsibil-ity of women.
Within the broad perspective schematised inbox 6.4, reproductive health encompasses:! maternal health related to pregnancy and
its consequences resulting from women’srole of biological reproduction; and
! other reproductive health needs that arenot pregnancy-related: health complica-tions resulting from women’s role in so-cial reproduction.
Women’s health, therefore, is influenced notonly by bio-medical factors, but also by non-medical factors such as gender roles andnorms, and socio-cultural beliefs and prac-tices. This new thinking has had profoundinfluence in policy changes in many devel-oping countries.
ICPD brought about a definite change in thepolicy environment. It attracted the attentionof high-level policy-makers, and religiousleaders, as well as health professionals andadvocates for women’s empowerment. Forthese reasons, the media gave the Conferenceenormous visibility. The international con-sensus that resulted from the Cairo debatecommitted the governments of many devel-oping countries to implementing the ICPDplan of action.
Cairo document defined reproductive health as: “astate of complete physical, mental, and social well-being and not merely the absence of disease orinfirmity, in all matters relating to the reproduc-tive system and to its functions and processes. Re-productive health therefore implies that people areable to have a satisfying and safe sex life and thatthey have the capability to reproduce and the free-dom to decide if, when and how often to do so”.
Source: UN 1994.
BOX 6.3 Definition of reproductive health
creasingly concerned about narrowly con-ceived population policies and programmesthat focused on contraception.
The change brought about by the Cairo Con-ference of September 1994 amounted to aparadigm shift:! It placed population issues squarely
within the ethical framework of humandevelopment, gender equality and equityand human rights.
! It recognised women’s reproductiverights and their need for empowerment(box 6.3).
! Its reframing of population issues enlargedthe constituency for populationprogrammes that encompass the elimina-tion of gender inequalities as key to improv-ing general health and reducing poverty.
! It has brought to the forefront of popula-tion thinking a growing body of scien-tific evidence that improving the statusof women in itself contributes above allother factors to lowering birth rates.
! It moves well beyond past policies con-fined to family planning and fertility con-trol by showing that population growthcan be stabilised and economic growth en-hanced by advancing women’s education,

H E A L T H A N D H U M A N D E V E L O P M E N T 167
Current patterns andissues of health inequalitiesDespite the significant progress in publichealth and evolving health concepts andapproaches on how best to reach and serveinterests of the people, progress in healthstatus of the people around the globe hasbeen uneven in access to health care. Over-all gains in health often hide the inequali-ties and worsening health outcomes forsome groups of population. Such inequali-ties are increasingly recognised as viola-tions of the individual’s right to health aswell as an issue of general ethics (Evans2001), especially within the human devel-opment and equity perspective. Currently,an increasing number of studies on healthinequalities probe the magnitude and na-ture of inequalities and the factors that con-tribute to these situations (Carr 2004; White-head 2000; Gwatkin 2000). Almost all thisresearch examines differences in averagehealth status across groups of people, fo-cusing on different kinds of inequalities andusing different measures. For example, thestudies that concentrate on economic in-
equality use income as a measure to showthe health gaps. Researchers with a socio-logical focus examine inequalities in aver-age health status among social classes, suchas ethnicity or race, while demographersfocus on the differences in health status viademographic variables such as age, sex, andeducation. Others have studied gender orindividual population groups.
Health gaps between rich and poor: Healthservices and modern medicines remain outof reach for the poor and socially disadvan-taged. Millions of people continue to die pre-maturely from diseases that are preventableand/or curable. Still more live in debilitat-ing health conditions that affect their pro-ductivity and efficiency. For these reasons,poverty has become the central focus of re-cent development efforts. Improving thehealth of the world’s poorest people is a pri-ority concern of all international develop-ment agencies and national governments.The magnitude of the health divide betweenthe rich and poor is documented yearly bythe global Human Development Report.
Family planning approach" Targets reduction in population growth through
fertility control and family planning.
" Population of interest mainly women of reproduc-tive age (15-49 years).
" Health care services from supply side with empha-sis on family planning through promotional means-incentives and disincentives – supply- driven.
" Emphasis mainly on maternal/child health and con-trol of fertility (in lowering number of births).
Reproductive health approach" Target-free, emphasis on improving quality of life
and individual needs and choices.
" Life cycle approach – concerned with meeting theindividual needs of women of all ages, and withpriority group health needs.
" Provides health services including family planning+ quality RH services from the clients’ perspec-tive and their health needs – demand-driven.
" Emphasis on the right of women to remain in goodhealth — both sexual, physical and mental – empha-sis in reproductive rights.
BOX 6.4 ICPD paradigm shift in population

168 R E A D I N G S I N H U M A N D E V E L O P M E N T
Figures 6.2 and 6.3 show the wide dispari-ties in life expectancy at birth between coun-tries with different levels of development.Between 1995 and 2000, people in theindustrialised and post-industrial worldlived much longer (26 years more) than thoseborn in the least developed countries. How-ever, although the gap has narrowed overthe years, the difference in average life ex-pectancy is still more than 13 years betweenthe rich and poor countries. The health gapbetween less developed and least developedcountries – over 17 years – is also very sig-nificant. But the health divide between thepoor and rich countries remains an endur-ing health issue. Preventable and treatablediseases continue to take enormous tolls inthe developing countries. Recent researchreveals that in Africa, infectious and para-sitic diseases account for more than half ofall deaths (Carr 2004) that could have beenavoided. Further, the health gap between thedeveloped and developing countries persiststhrough time and space with respect to theirsurvival/mortality, access to health care,and nutritional status.
Figures 6.4 and 6.5 depict these discrepan-cies. On average, a child from the poorestquintile is twice as likely to die as a childcompared to those belonging to the richestquintile. Similarly, women in the poorestquintile are twice as likely to be malnour-ished than those in the richest quintile mea-sured by body mass index. The same trendis manifest in stunting among children.Likewise, services among the poorestquintile and richest quintile reveal widedisparity. People in the poorest quintiles areless likely to access health services such asimmunisations, medical assistance duringdelivery and modern contraceptive use.Similarly, figure 6.6 is an illustration ofwealth inequalities in under 5 mortality rate
World
More developed regions
Lease developed countries
Other lessdeveloped countries
64.6
74.8
48.7
65.4
FIGURE 6.2 Life expectancy at birth, 1995-2000
Source: Carr 2004.
Under 5 mortality rate(56 countries)
Women malnourished(45 countries)
Children stunted(50 countries)
3.2
1.9
2.2
(Average ratio of rate in poorest quintileto rate in richest quintile)
FIGURE 6.4 Health inequalitiesin less developed countries
Source: Carr 2004.
FIGURE 6.3 Life expectancy at birth inmore developed and less developed countries
Source: PRB 2004.
Less developed
More developed
2000-2005
1950-1955
75.8
63.4
66.1
41
Least
All recommendedchildhood immunizations
4.6
Professional deliverassistance (55 countries)
Modern contraceptive useby women (49 countries)
5.2
2.3
(Ratio of rate in richest population quintileto that in the poorest quintile)
FIGURE 6.5 Inequalities inthe use of health services
Source: Gwatkin 2000.

H E A L T H A N D H U M A N D E V E L O P M E N T 169
in selected countries, which reveal the mag-nitude of the mortality difference betweencountries and within countries.
Health disparities between social groups:In addition to the health divide between richand poor, research has also demonstratedthat people’s socio-cultural contexts, as wellas their beliefs and practices, determinehealth behaviours. Although health care andaffordability remain extremely important,increasing research shows that socio-culturalfactors could have worse effects on healthand how people access health care. For ex-ample, in 1993 under apartheid, black chil-dren in South Africa were 5 times more likelyto die before reaching the age of 5 comparedto poorer white or mixed-race children. Cur-rent interest in health differences betweensocial groups stems from their covariancewith other socioeconomic variables. It is there-fore important to understand and distinguishhealth issues that relate to distribution is-sues and those related to social inequalities(non-health factors), requiring broader multi-level social and economic interventions.
However, systematic documentation on thesocial conditions of life affecting health isscanty because of the difficulties of collect-ing such data. At best, data on health differ-entials based on ethnicity and race/lan-guage may be taken as representative ofmany socio-cultural effects on health.
The development of the Calvert-HendersonHealth indicators by a group of scholars andpractitioners (Calvert-Henderson 2000-2004)provide revealing data on trends in healthdifferentials between race and ethnicity inthe US from 1983 to 2001, as shown by figure6.7. Despite the fact that United States has
FIGURE 6.6 Under-5 mortality andincome status in selected countries
Source: Cote d’lvoire DHS 1994; Bolivia DHS 1998; Kyrgyz Rep. DHS1997; Burkina Faso DHS 1992/93; Colombia DHS 1995; India NationalFamily Health Survey 1992/93 and Indonesia DHS 1997.
Cote d’lvoire
Bolivia
Kyrgyz Rep.
Burkina Faso
Colombia
India
Indonesia
189.5
95.5
146.5
32
96.4
49.3
199.2
156.4
52.1
23.6
154.7
54.3
109
29.2
Poorest
Richest
Deaths under-5 per 1000 births
the highest cost health care services percapita worldwide, it ranks below most of thewealthy nations and even some of the poorercountries in basic health statistics, such asinfant mortality, and life expectancy at birth.The benefits of health care are distributed un-evenly across different groups of populationwith large disparities depending on race/ethnicity and education level. Further, fig-ure 6.8 reveals higher percentages of Ameri-can Indian and African-Americans in fair orpoor health than white or Hispanic popula-tions. Similarly, infant mortality rates perthousand in 2001 have been persistentlyhighest among African-Americans (13) andAmerican Indians (9.7).
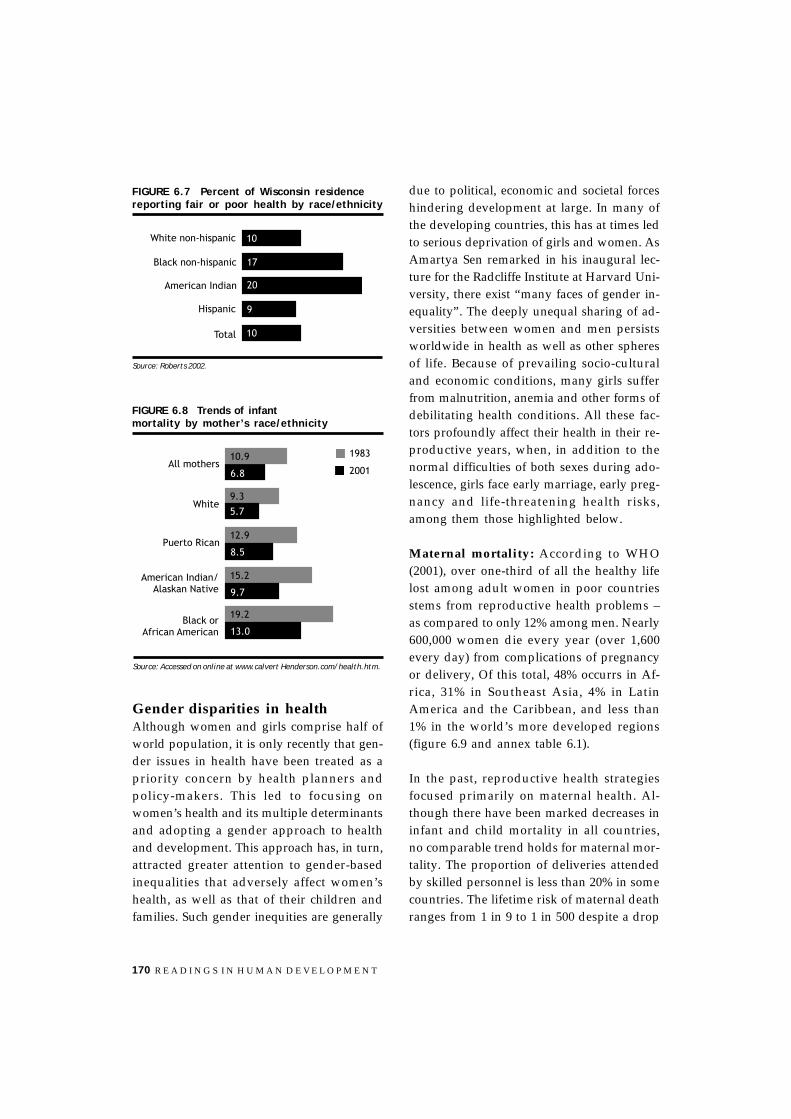
170 R E A D I N G S I N H U M A N D E V E L O P M E N T
due to political, economic and societal forceshindering development at large. In many ofthe developing countries, this has at times ledto serious deprivation of girls and women. AsAmartya Sen remarked in his inaugural lec-ture for the Radcliffe Institute at Harvard Uni-versity, there exist “many faces of gender in-equality”. The deeply unequal sharing of ad-versities between women and men persistsworldwide in health as well as other spheresof life. Because of prevailing socio-culturaland economic conditions, many girls sufferfrom malnutrition, anemia and other forms ofdebilitating health conditions. All these fac-tors profoundly affect their health in their re-productive years, when, in addition to thenormal difficulties of both sexes during ado-lescence, girls face early marriage, early preg-nancy and life-threatening health risks,among them those highlighted below.
Maternal mortality: According to WHO(2001), over one-third of all the healthy lifelost among adult women in poor countriesstems from reproductive health problems –as compared to only 12% among men. Nearly600,000 women die every year (over 1,600every day) from complications of pregnancyor delivery, Of this total, 48% occurrs in Af-rica, 31% in Southeast Asia, 4% in LatinAmerica and the Caribbean, and less than1% in the world’s more developed regions(figure 6.9 and annex table 6.1).
In the past, reproductive health strategiesfocused primarily on maternal health. Al-though there have been marked decreases ininfant and child mortality in all countries,no comparable trend holds for maternal mor-tality. The proportion of deliveries attendedby skilled personnel is less than 20% in somecountries. The lifetime risk of maternal deathranges from 1 in 9 to 1 in 500 despite a drop
White non-hispanic
Black non-hispanic
American Indian
Hispanic
Total
10
17
20
9
10
FIGURE 6.7 Percent of Wisconsin residencereporting fair or poor health by race/ethnicity
Source: Roberts 2002.
FIGURE 6.8 Trends of infantmortality by mother’s race/ethnicity
Source: Accessed on online at www.calvert Henderson.com/health.htm.
1983
2001All mothers
White
Puerto Rican
American Indian/Alaskan Native
Black orAfrican American
10.9
6.8
9.3
5.7
12.9
8.5
15.2
9.7
19.2
13.0
Gender disparities in healthAlthough women and girls comprise half ofworld population, it is only recently that gen-der issues in health have been treated as apriority concern by health planners andpolicy-makers. This led to focusing onwomen’s health and its multiple determinantsand adopting a gender approach to healthand development. This approach has, in turn,attracted greater attention to gender-basedinequalities that adversely affect women’shealth, as well as that of their children andfamilies. Such gender inequities are generally

H E A L T H A N D H U M A N D E V E L O P M E N T 171
in fertility from 4.7 children in 1970 to 3 in1990-1995, due to the use of contraceptionamong nearly half the women of childbear-ing age. These indicator values reflect thevarying social status of women, as well astheir access to essential obstetric care.
In addition, 100,000 maternal deaths resultfrom the 20 million unsafe abortions thatoccur every year; 80 million pregnancies aresaid to be unwanted or unplanned. Figure6.9 shows the wide disparities in maternaldeaths (see also annex table 6.1).
Mortality inequality: In addition to high ma-ternal mortality and inadequate access totrained medical services during pregnancy,women and girls often face discriminationin health and special obstacles in accessinghealth care from birth onwards. This is re-flected in gender disparities in life expect-ancy and adverse sex ratios. In societieswhere women are treated equally, averagelife expectancy is 65 for females and 62 formales and the sex ratio is about 106 femalesto 100 males. Any reversal of this ratio indi-cates gender discrimination and a neglect ofgirls and women resulting in unfavourablehealth outcomes (see chapter 4). Gender dis-crimination in a glaring form manifest in amarked imbalance in sex ratios – particularlyin East and South Asian countries such asChina, Taiwan, South Korea, India, Nepal,and Pakistan. The high juvenile sex imbal-ance has been historically documented inthese countries, along with the phenomenonof missing women and girls (box 6.6; Sen1992; Sajeda 1990; UNDP 1995). Tables 6.4and 6.5 show, respectively, sex ratio trendsin China, the Republic of Korea and Taiwanand the phenomenon of missing girls. Themale/female composition of population hasbeen increasing in favour of men despite the
TABLE 6.3 Skilled care at delivery andmaternal deaths, regional comparison, 1995
% births MMRassisted
Sub Saharan Africa 45 967
South Asia 59 430
East Asia and Pacific 73 189
Middle East and N. Africa 77 175
Latin America/Caribbean 83 146
Central, Eastern Europe 97 45
North America 100 9
FIGURE 6.9 Maternal deaths by WHO regions
Source: Hill, Abou and Wardlaw 2001.
Americas
Europe
Africa
Southeast Asia
EasternMediterranean
WesternPacific
48%31%
11%
5% 4% 1%
Total (global) number of deaths = 515,000
Source: Hill, Abou and Wardlaw 2001.
TABLE 6.4 Trend of sex ratioin China, Taiwan, Korea, and India
Year Sex ratio at birth
China Taiwan Korea India
1961 106.5 106.3
1971 105.2 106.2 107.5
1981 107.1 107.0 103.9 107.1
1991 110.0 116.8 107.9
2001 107-120 107.2
Source: Chaudhury 2002.

172 R E A D I N G S I N H U M A N D E V E L O P M E N T
discrimination against girls through nutri-tional neglect and unequal care compared toboys during infancy and early childhood.Sex-selective abortion is rising in parts ofAsia where parents can now have pregnan-cies scanned. Amartya Sen estimated in 1992that some 100 million women were elimi-nated from the global population because ofsuch activities. Indeed, such trends have in-creased since 1961 in China, Taiwan, Koreaand India. The number of excess deaths ofgirls in China is 13 per 1,000 live births and,in India, 36/1,000. The number of excess abor-tions per 1,000 female live births is estimatedto range from 9 in India to 48-81 in China.
Inequalities in nutritional status: The socialpractice of discrimination against survivinggirls tends to manifest itself in a lower nutri-tional status of girls and women, which isthe most proximate cause of ill-health com-pared to boys and men. Available informa-tion and research in India, Pakistan andBangladesh show that girls are deprived ofadequate nutrition and health care (DasGupta 1987; Pande 2000; Basu 1989; Chen,Haq and D’Sonza 1981). The strength andpersistence of such discriminatory practicesin South Asia, particularly in India, stem from
“For example, if we take the ratio of women to menin sub-Saharan Africa as the standard (there is rela-tively little bias against women in terms of healthcare, social status and mortality rates in sub-Sa-haran Africa, even though the absolute numbers arequite dreadful for both men and women), then itsfemale-male ratio of 1.022 can be used to calculatethe number of missing women in women-short coun-tries. For example, with India’s female-male ratio of0.93, there is a total difference of 9 per cent (of themale population) between that ratio and the stan-dard used for comparison, namely, the sub-SaharanAfrican ratio of 1.022. This yielded a figure of 37million missing women already in 1986 (when I firstdid the estimation). Using the same sub-Saharan stan-dard, China had 44 million missing women, and itwas evident that for the world as a whole the magni-tude of shortfall easily exceeded 100 million”. AmartyaSen (extracted from inauguration lecture, RadcliffeInstitute at Harvard University, on April 24, 2001).
BOX 6.5 Calculation of missing women
TABLE 6.5 Numbers of girls missing per 1,000 live births
China South Korea India1989-90 1992 1981-91
No. of excess deaths age 0-4 per 1,000 female live births1 13 - 36
No. of excess abortions per 1,000 female live births2 48-81 70 9
Total No. of girls missing per 1,000 female live births 61-94 70 45
Total No. of girls missing per 1,000 live births (m+f) 30-46 34 22
0-4 mortality rate 1991 61 14-17 109-119
Source: Das Gupta, et al 2001.
1 Computed from the sex differential in recorded mortality, compared with West model life tables for the prevailing life expectancy.2 Computed from the recorded sex ratio at birth, assuming a normal ratio of 106.
“female advantage” due to genetic hormonaldifferences (Lemaire 2001). This imbalanceindicates son preference and gender biasesagainst daughters because of the ideologicalvalues attached to sons and their sociallyascribed economic, social and religious roles.These become a strong enough motivationfor couples and families to resort to sex-se-lective abortion and infanticide, as well as
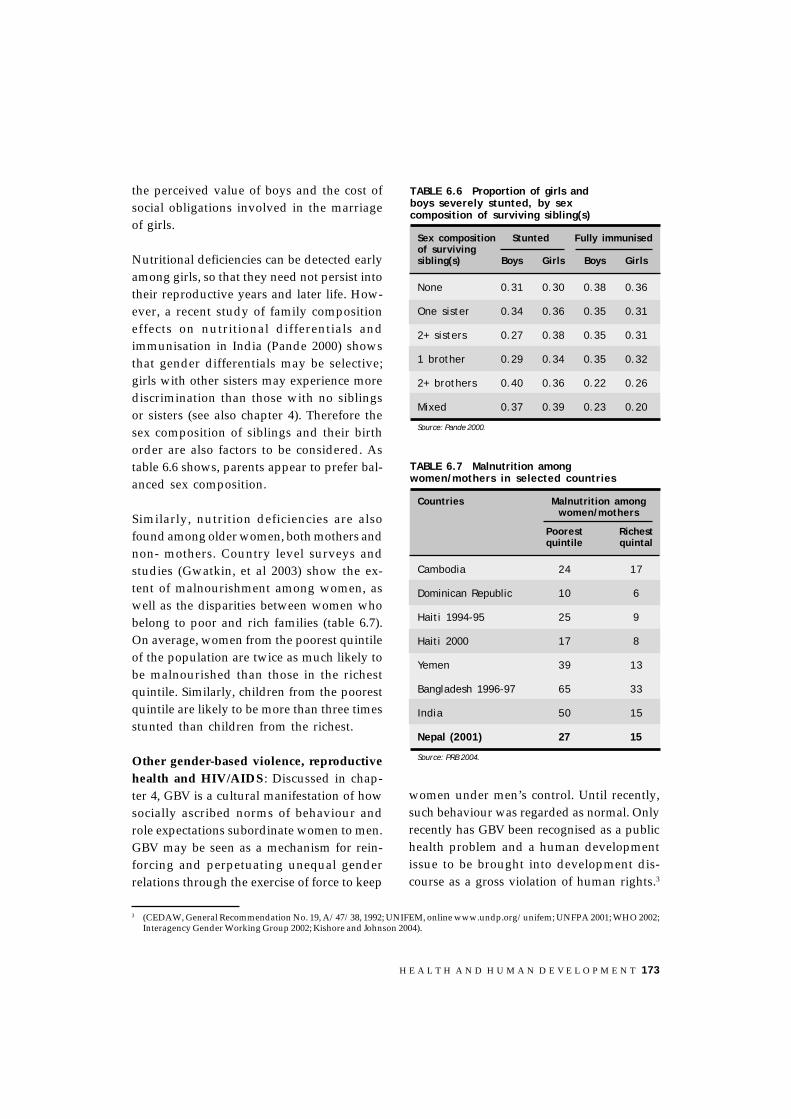
H E A L T H A N D H U M A N D E V E L O P M E N T 173
the perceived value of boys and the cost ofsocial obligations involved in the marriageof girls.
Nutritional deficiencies can be detected earlyamong girls, so that they need not persist intotheir reproductive years and later life. How-ever, a recent study of family compositioneffects on nutritional differentials andimmunisation in India (Pande 2000) showsthat gender differentials may be selective;girls with other sisters may experience morediscrimination than those with no siblingsor sisters (see also chapter 4). Therefore thesex composition of siblings and their birthorder are also factors to be considered. Astable 6.6 shows, parents appear to prefer bal-anced sex composition.
Similarly, nutrition deficiencies are alsofound among older women, both mothers andnon- mothers. Country level surveys andstudies (Gwatkin, et al 2003) show the ex-tent of malnourishment among women, aswell as the disparities between women whobelong to poor and rich families (table 6.7).On average, women from the poorest quintileof the population are twice as much likely tobe malnourished than those in the richestquintile. Similarly, children from the poorestquintile are likely to be more than three timesstunted than children from the richest.
Other gender-based violence, reproductivehealth and HIV/AIDS: Discussed in chap-ter 4, GBV is a cultural manifestation of howsocially ascribed norms of behaviour androle expectations subordinate women to men.GBV may be seen as a mechanism for rein-forcing and perpetuating unequal genderrelations through the exercise of force to keep
TABLE 6.6 Proportion of girls andboys severely stunted, by sexcomposition of surviving sibling(s)
Sex composition Stunted Fully immunisedof survivingsibling(s) Boys Girls Boys Girls
None 0.31 0.30 0.38 0.36
One sister 0.34 0.36 0.35 0.31
2+ sisters 0.27 0.38 0.35 0.31
1 brother 0.29 0.34 0.35 0.32
2+ brothers 0.40 0.36 0.22 0.26
Mixed 0.37 0.39 0.23 0.20
Source: Pande 2000.
TABLE 6.7 Malnutrition amongwomen/mothers in selected countries
Countries Malnutrition amongwomen/mothers
Poorest Richestquintile quintal
Cambodia 24 17
Dominican Republic 10 6
Haiti 1994-95 25 9
Haiti 2000 17 8
Yemen 39 13
Bangladesh 1996-97 65 33
India 50 15
Nepal (2001) 27 15
Source: PRB 2004.
3 (CEDAW, General Recommendation No. 19, A/47/38, 1992; UNIFEM, online www.undp.org/unifem; UNFPA 2001; WHO 2002;Interagency Gender Working Group 2002; Kishore and Johnson 2004).
women under men’s control. Until recently,such behaviour was regarded as normal. Onlyrecently has GBV been recognised as a publichealth problem and a human developmentissue to be brought into development dis-course as a gross violation of human rights.3

174 R E A D I N G S I N H U M A N D E V E L O P M E N T
The serious health consequences of GBV areincreasingly being documented and ways todeal with it within health sector services arebeing explored. WHO, for example, estimatesthat at least one in five women has experi-enced violence during her life (WHO 1997).Other studies estimate the figure as one inthree (Heise, et al 1999). GBV can have long-term psychological and physical conse-quences. Its frequently devastating effects onthe lives and health of women and childrenneed to be related to both women’s repro-ductive health and HIV/AIDS (box 6.7).
It is generally agreed that GBV: (a) is a seri-ous, pervasive problem that underminesprogress in RH and curbing the spread ofHIV/AIDS; (b) directly affects women’s ac-cess to services, specifically their ability to
obtain contraceptives; (c) hinders informedchoice; (d) handicaps sexual negotiations,particularly in the use of condoms; (e) is afactor in spreading HIV/AIDS; and (f) in-creases the likelihood of maternal deaths andcontributes to poor birth outcomes.
GBV takes place in different degrees andforms in all parts of the world, irrespective ofthe cultural diversity and levels of economicdevelopment (box 6.8 and 6.9). Figure 6.10shows the incidence of GBV in 13 countries.4
According to the DHS survey, the prevalenceof GBV among women between 15-49 yearsand the percentages of married women whohave experienced violence in the 12 monthspreceding the survey ranges from 21% in In-dia to 58% in Zambia. Similarly, the recordedcases of violence in Lebanon, Mozambique,Nepal and Romania, among the nine coun-tries where the pilot project on GBV was car-ried out, the incidence of GBV ranged from11% in Nepal to 48% in Mozambique. Otherprevalence estimates show similar results;an overall review of available estimates inmore than 30 Southern countries showsrates between 8% and 70% of women whoreported violence by a family member,(Heise, et al 1999), the majority beingspouses/partners. The violence ranges fromdomestic beatings and spousal rapethrough sexual abuse, including that of chil-dren (see annex tables 6.4 and 6.5). Thehealth consequences reported in the DHSranges from bruises and aches through emo-tional trauma to pregnancy/abortion re-quiring hospital treatment (annex table 6.6).
Although systematic documentation of theRH consequences of GBV is still lacking, sev-
“Any act of GBV that results in or is likely to resultin physical, sexual, of psychological harm or suffer-ing to women, including threats of such acts, coer-cion or arbitrary deprivation of liberty, whetheroccurring in public or private life”.
Source: UN general assembly, declaration on the elimination ofviolence against women 2003.
BOX 6.6 Definition of GBV
“Abuse and violence are major causes of diseaseburden world wide and there are many types: vio-lence between individuals, including inmate part-ner violence, and collective violence orchestratedas part of wars and genocides – In 2000, violencecaused 70,000 deaths in the world: about 50% bysuicide, 30% by interpersonal violence, and 20% bycollective violence”.
Source: WHO 2002.
BOX 6.7 Abuse and violence
4 Incidences of GBV in nine countries are drawn from Demographic Health Survey (Kishore and Johnson 2004) and others are from arecent evaluation of pilot project on integrating GBV in health facilities (Pradhan 2003) (see annex).
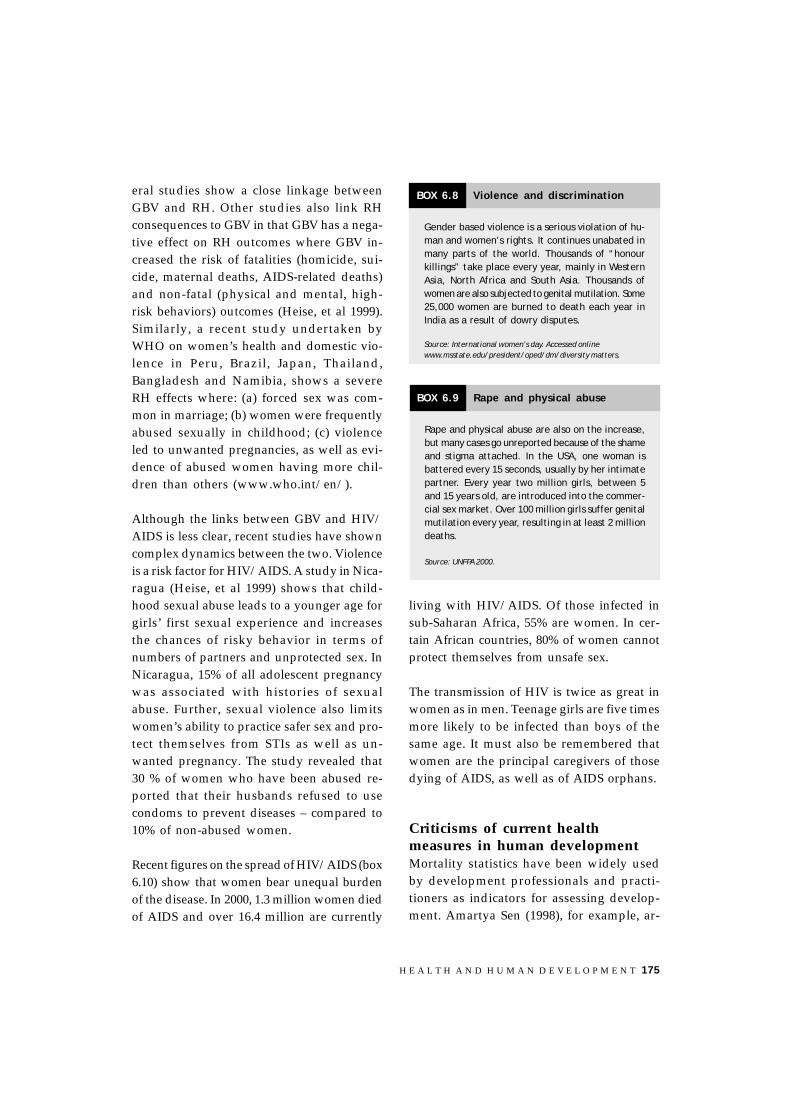
H E A L T H A N D H U M A N D E V E L O P M E N T 175
eral studies show a close linkage betweenGBV and RH. Other studies also link RHconsequences to GBV in that GBV has a nega-tive effect on RH outcomes where GBV in-creased the risk of fatalities (homicide, sui-cide, maternal deaths, AIDS-related deaths)and non-fatal (physical and mental, high-risk behaviors) outcomes (Heise, et al 1999).Similarly, a recent study undertaken byWHO on women’s health and domestic vio-lence in Peru, Brazil, Japan, Thailand,Bangladesh and Namibia, shows a severeRH effects where: (a) forced sex was com-mon in marriage; (b) women were frequentlyabused sexually in childhood; (c) violenceled to unwanted pregnancies, as well as evi-dence of abused women having more chil-dren than others (www.who.int/en/).
Although the links between GBV and HIV/AIDS is less clear, recent studies have showncomplex dynamics between the two. Violenceis a risk factor for HIV/AIDS. A study in Nica-ragua (Heise, et al 1999) shows that child-hood sexual abuse leads to a younger age forgirls’ first sexual experience and increasesthe chances of risky behavior in terms ofnumbers of partners and unprotected sex. InNicaragua, 15% of all adolescent pregnancywas associated with histories of sexualabuse. Further, sexual violence also limitswomen’s ability to practice safer sex and pro-tect themselves from STIs as well as un-wanted pregnancy. The study revealed that30 % of women who have been abused re-ported that their husbands refused to usecondoms to prevent diseases – compared to10% of non-abused women.
Recent figures on the spread of HIV/AIDS (box6.10) show that women bear unequal burdenof the disease. In 2000, 1.3 million women diedof AIDS and over 16.4 million are currently
living with HIV/AIDS. Of those infected insub-Saharan Africa, 55% are women. In cer-tain African countries, 80% of women cannotprotect themselves from unsafe sex.
The transmission of HIV is twice as great inwomen as in men. Teenage girls are five timesmore likely to be infected than boys of thesame age. It must also be remembered thatwomen are the principal caregivers of thosedying of AIDS, as well as of AIDS orphans.
Criticisms of current healthmeasures in human developmentMortality statistics have been widely usedby development professionals and practi-tioners as indicators for assessing develop-ment. Amartya Sen (1998), for example, ar-
Gender based violence is a serious violation of hu-man and women’s rights. It continues unabated inmany parts of the world. Thousands of “honourkillings” take place every year, mainly in WesternAsia, North Africa and South Asia. Thousands ofwomen are also subjected to genital mutilation. Some25,000 women are burned to death each year inIndia as a result of dowry disputes.
Source: International women’s day. Accessed onlinewww.msstate.edu/president/oped/dm/diversity matters.
BOX 6.8 Violence and discrimination
Rape and physical abuse are also on the increase,but many cases go unreported because of the shameand stigma attached. In the USA, one woman isbattered every 15 seconds, usually by her intimatepartner. Every year two million girls, between 5and 15 years old, are introduced into the commer-cial sex market. Over 100 million girls suffer genitalmutilation every year, resulting in at least 2 milliondeaths.
Source: UNFPA 2000.
BOX 6.9 Rape and physical abuse
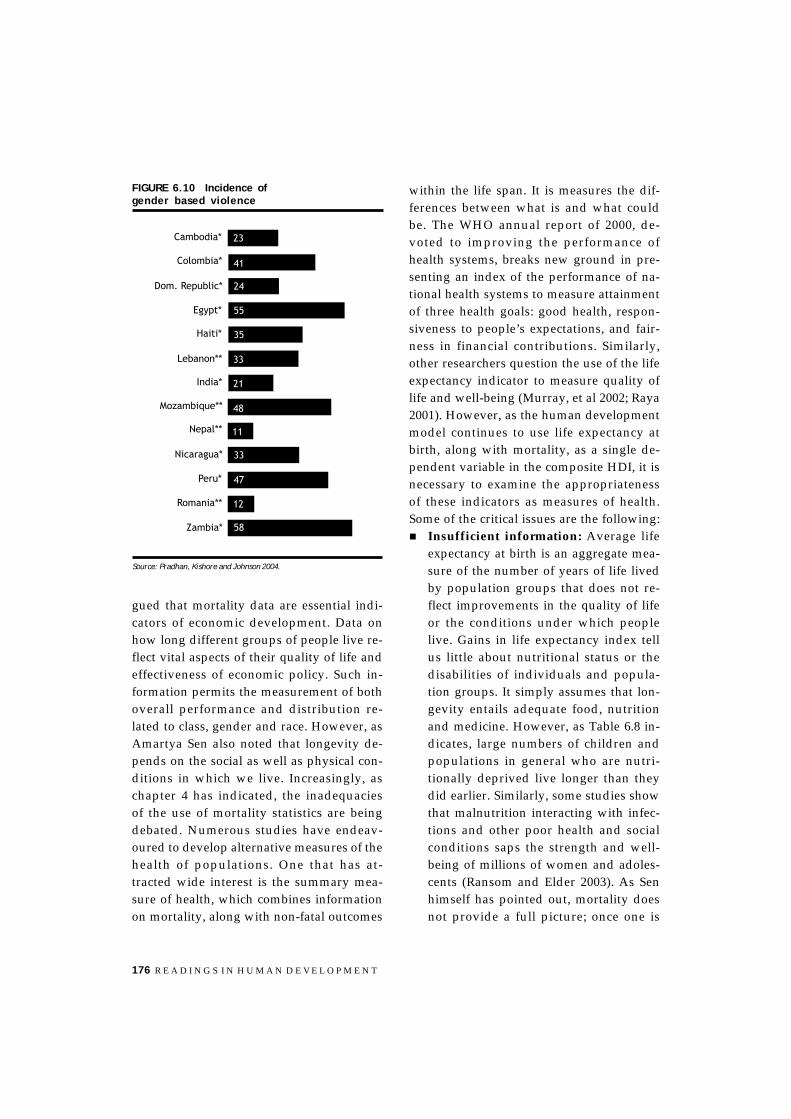
176 R E A D I N G S I N H U M A N D E V E L O P M E N T
gued that mortality data are essential indi-cators of economic development. Data onhow long different groups of people live re-flect vital aspects of their quality of life andeffectiveness of economic policy. Such in-formation permits the measurement of bothoverall performance and distribution re-lated to class, gender and race. However, asAmartya Sen also noted that longevity de-pends on the social as well as physical con-ditions in which we live. Increasingly, aschapter 4 has indicated, the inadequaciesof the use of mortality statistics are beingdebated. Numerous studies have endeav-oured to develop alternative measures of thehealth of populations. One that has at-tracted wide interest is the summary mea-sure of health, which combines informationon mortality, along with non-fatal outcomes
within the life span. It is measures the dif-ferences between what is and what couldbe. The WHO annual report of 2000, de-voted to improving the performance ofhealth systems, breaks new ground in pre-senting an index of the performance of na-tional health systems to measure attainmentof three health goals: good health, respon-siveness to people’s expectations, and fair-ness in financial contributions. Similarly,other researchers question the use of the lifeexpectancy indicator to measure quality oflife and well-being (Murray, et al 2002; Raya2001). However, as the human developmentmodel continues to use life expectancy atbirth, along with mortality, as a single de-pendent variable in the composite HDI, it isnecessary to examine the appropriatenessof these indicators as measures of health.Some of the critical issues are the following:! Insufficient information: Average life
expectancy at birth is an aggregate mea-sure of the number of years of life livedby population groups that does not re-flect improvements in the quality of lifeor the conditions under which peoplelive. Gains in life expectancy index tellus little about nutritional status or thedisabilities of individuals and popula-tion groups. It simply assumes that lon-gevity entails adequate food, nutritionand medicine. However, as Table 6.8 in-dicates, large numbers of children andpopulations in general who are nutri-tionally deprived live longer than theydid earlier. Similarly, some studies showthat malnutrition interacting with infec-tions and other poor health and socialconditions saps the strength and well-being of millions of women and adoles-cents (Ransom and Elder 2003). As Senhimself has pointed out, mortality doesnot provide a full picture; once one is
FIGURE 6.10 Incidence ofgender based violence
Source: Pradhan, Kishore and Johnson 2004.
Cambodia*
Colombia*
Dom. Republic*
Egypt*
Haiti*
Lebanon**
India*
Mozambique**
Nepal**
Nicaragua*
Peru*
Romania**
Zambia*
23
41
24
55
35
33
21
48
11
33
47
12
58

H E A L T H A N D H U M A N D E V E L O P M E N T 177
dead, agony disappears. The agony ofthose living in illness needs to be cap-tured. The longevity indicator alone can-not reflect morbidity.
! Lack of a measure of well-being: As in-dicated above, health in human devel-opment has a particular place in reflect-ing not only bio-physical aspects ofhealth, but also its quality: how humandevelopment affects the overall well-be-ing of people – a normative notion ofhealth plus well-being. By contrast, lifeexpectancy at birth, being an aggregativemeasure of the length of time one is ex-pected to live, measures only mortalityi.e. number of years lived. It does not tellus whether the life lived is free of dis-ease or disability or the individual’s ex-perience of the extent of her or his capa-bilities. The health of population shouldreflect the health of individuals through-out the life course, taking into consider-ation both mortality and morbidity con-ditions and their weight in overall well-being. From the human developmentperspective, health should reflect the fullrange of individual experiences includ-ing the “non-health dimensions” thatinfluence health. Life expectancy as suchis inadequate in capturing the qualita-tive aspects of health.
! The calculation of life expectancy: An-other point at issue in the use of life ex-pectancy at birth is its method of calcu-lation. Normally, life expectancy is cal-culated from census figures and birthregistration. However, in many coun-tries, a complete registration system usu-ally does not exist. Life expectancy esti-mates are calculated from models ofadult to child mortality levels that areproblematic. This is difficult because ofthe markedly different ratios of adult
and child mortality levels found in dif-ferent countries. Consequently, differentsources, such as data on parents report-ing the “proportion of their childrendead” or mothers’ reports of their histo-ries of child birth and loss are taken asproxies for mortality levels. However,such surveys are infrequent and theirgeneralisations fail to capture actualmortality fluctuations. There is there-fore a need to look behind national av-erages to understand the variations inlevels of mortality across areas andpopulation groups.
! Difficulty in identifying factors that con-tribute to mortality decline: As dis-cussed above, simply looking at eventsof births and mortality patterns do notexplain the reasons for the general de-cline in mortality or increase in life ex-pectancy. It does not tell us whether thesestem from improvements in modernmedicine, increases in living standards,increases in income and education, orchange in cultural attitudes andbehaviours. Throughout the last few de-cades, as we have seen, developmentprofessionals and researchers have tried
Composition of the infected population 2001:Women 36%Men 61%Children 4%
People living with HIV/AIDSAs of end of 2002 an estimated 42 million adults andchildren worldwide were living with HIV/AIDS, ofwhich 95% of the world HIV/AIDS population lives inless developed countries and 71% of the populationlives in Sub-Saharan Africa.
Source: UNAIDS 2002.
BOX 6.10 HIV/AIDS demographics,South/Southeast Asia

178 R E A D I N G S I N H U M A N D E V E L O P M E N T
to identify reasons for the worldwidedecline in mortality and increase in lifeexpectancy and have come up with vari-ous explanations. The debate continuesculminate with the most plausible expla-nation. Population characteristics arerelated to their setting, the context inwhich people live. Therefore, contextvariable becomes an important factor inexplaining for the decline and differencesin mortality. Deaths and births areevents; they do not have much meaningoutside of the context in which they oc-cur. Only when the events are related tothe social, economic and cultural envi-ronments in which they take place doestheir meaning and importance becomeapparent. Life expectancy at birth as ameasure of health has little relevance un-less it is linked to its contextual variable.
It is evident that while the concept of humandevelopment has broadened, the narrowproxies of the HDI have not changed. Ac-cording to Fukuda-Parr (quoted in UNDP2002a), HDI has reinforced the narrow, over-simplified interpretation of the human de-velopment concept as merely the expansionof education, health and a rise in standardsof living.
DETERMINANTS OF HEALTHSTATUS AND HEALTH DISPARITIES
Most of the health interventions undertakenthus far have focused on access to medicalcare as the most important determinant ofhealth. However, despite the policy shiftsand emphasis on improved quality healthservices outlined above, health inequalitiesremain widespread and persist throughtime and space in the countries of South as
well as the North. Numerous theories havebeen advanced to explain differences inhealth and access to health care to achievesocial justice. Farr’s work during the 18th
century represents the earliest study on thesocial inequalities of health (Whitehead2000). He identified contextual variables –the particular civilization, occupation, thephysical environment, hunger and sanita-tion – as important determinants of healthinequalities.
More recently, several studies have pointedto a variety of social, cultural, economic,and behavioural factors, in addition tothose of the prevailing health system. Awhole body of literature has been devel-oped in “health transition” work, much ofit derived from a seminal series of work-shops that began in 1985, supported byRockefeller Foundation, on the subject ofGood Health at Low Cost (Caldwell andSantow 1989; Caldwell, Findley, et al 1990).The major interest of the health transitionscholars is the role played by social, cul-tural and behavioural factors – as distin-guished from health interventions or eco-nomic or nutritional factors – in determin-ing levels of mortality or morbidity. Dur-ing the ensuing 20 years, compelling re-search in health transition has been car-ried out, which provided: (a) analytical andtheoretical framework for the analysis ofhealth changes and (b) evidence of hownon-biomedical factors, such as the role ofeducation, household and cultural factorsin determining the health of children andwomen (Mosley and Chen 1984; Basu 1989;Simons and others 1989). Caldwell (1986),in a celebrated work on achieving low mor-tality in poor countries, identified educa-tion as a critical factor in lowering infantmortality and raising life expectancy at

H E A L T H A N D H U M A N D E V E L O P M E N T 179
birth. He studied four poor countries – In-dia (Kerala), Sri Lanka, Costa Rica andChina – and the relative cost-effectivenessof such measures in promoting health.
A surge of new research focuses on healthinequalities within and between countries(Gwatkin 2000). Five technical papers thatillustrate approaches to dealing with differ-ent aspects of poverty. They are expected tocontribute enormously to our understandingof the magnitude and nature of the problemsthat affect the underprivileged and separatethem from the better-off. However, no newstrategies have yet emerged for tackling theseproblems,
Also in response to the renewed concernabout health inequalities, the World Bankhas initiated a programme entitled “Reach-ing the Poor” with support from the GatesFoundation and the governments of the Neth-erlands and Sweden. The programme will(a) take stock of how well or poorly existinghealth programmes and initiatives havereached needy population groups; and (b)begin identifying the reasons why some donot (Gwatkin 2001; World Bank,www.worldbank.org/poverty/healthdata/discussion2.htm).
Further, research work undertaken throughthe Population Reference Bureau points tothe need for a long-term comprehensive pro-poor approach that can address multiplesocial and economic determinants of exist-ing health disparities and improve access tovital services.
All these works reveal that many of thecauses of inequalities are social, cultural,economic and behavioural in origin. How-ever, this literature says little about processes
through which these non-health factors, in-cluding gender, create inequalities.
In Nepal some studies provide a frameworkfor mapping sequence of the health ofpeople in various social, cultural, economicand environmental settings and the influ-ence of these factors on health outcomes(Pradhan 1995; 2003). These analyses de-rive from the premise that the health of bothwomen and men – particularly those be-longing to socially and economically dis-advantaged groups – is “rooted in socialand gender inequalities”. Consequently, alargely biomedical framework for providinghealth care is inadequate to bringing aboutimprovements in the health conditions ofthe poor and the disadvantaged.
TABLE 6.8 Nutritionaldeprivation and longevity
Countries Under- Under- Improvementweight nourished in lifechildren population expectancy
age 5 years (% of total) at birth(% of total) (in years)
1995-2000 1997-2000 1975 2000
Medium HDI
Maldives 43 ... 51 68
India 47 23 50 65
Jamaica 33 8 69 75
Philippines 30 24 58 70
Sri Lanka 33 23 65 73
Viet Nam 33 19 50 69
Low HDI
Bangladesh 47 35 45 61
Nepal 38 23 43 60
Pakistan 48 19 49 61
Source: UNDP 2002a and 2003.

180 R E A D I N G S I N H U M A N D E V E L O P M E N T
This framework, set out in figure 6.11, showsthe sequential influence of factors affectinghealth. It incorporates sets of socio-cultural,economic, gender, biological and behavioralfactors. It also provides for the measurementof morbidity and mortality as health riskfactors in overall health – particularly re-productive health. The key is the identifica-tion of the proximate variables that are bio-logical and environmental, including nu-trition, sanitation and occupational condi-tions, along with maternal and health carefactors. Figure 6.12 elaborates the indica-tors of the proximate variables. All socio-cultural, economic, and gender determi-nants necessarily operate through a com-mon set of biological mechanisms or proxi-mate determinants to create impacts onmortality/morbidity in reproductive health.It is hoped that this framework will stimu-late further thinking and research inconceptualising health from non-biomedi-cal and gender perspectives.
THE HEALTHSITUATION IN NEPAL
Nepal has undertaken a series of initia-tives to address health issues at the na-tional and district levels that have resultedin significant progress over the last threeor four decades, particularly in reducingmortality rates (including maternal andinfant/child deaths), preventing and con-trolling endemic diseases such as small-pox, measles, malaria, tuberculosis andextending the immunisation coverage ofchildren. However, the country still facessome of the most formidable challenges inmeeting basic minimum health standardsand tackling the health disparities thatexist between different population groups.Further, the current widespread violenceposes new challenges.
Trends in policy development: Trends inhealth policy development show that
FIGURE 6.11 Determinants of health outcomes
Contextual variables Behavioral factors Health outcomes
Socio-cultural andeconomic factors" Social/kinship structure" Beliefs/values and
practices (norms ofbehavior)
" Socioeconomic status offamilies (land, income,education)
Proximate determinants" Nutrition" Biological" Environmental" Health care
Health risksMorbidity + mortality
Reproductive healthcomplications/illnesses
Gender systemsGender hierarchy, role/relationship

H E A L T H A N D H U M A N D E V E L O P M E N T 181
Nepal’s health concerns and have beenguided by trends in global health policies/strategies. Following the declaration of theHealth for All Strategy in 1978, HMG/Nundertook policy measures andprogrammes for promoting health at the na-tional and district levels. In 1991, a nationalhealth policy (NHP) aimed at enhancing thehealth status of the country’s rural popula-tion (86%), addressing service delivery aswell as the administrative structure of thehealth system was adopted. It also containselements of the PHC approach, as well asthe HSRS.
The Eighth Health Plan (1992-1997), theNinth (1997-2002) and second long-termhealth plan of 1997-2017 were developed inkeeping with the NHP. Its main features are:! developing integrated and essential
health care services at the district leveland below,
! encouraging active community participa-tion and the mobilisation of the privatesector to develop general as well asspecialised health services,
! ensuring quality assurance in health care! making MCH/FP an integral part of PHC
services,! promoting inter- and intra-sectoral coor-
dination,! decentralisation of health administration! developing the traditional system of medi-
cine, and! promoting the participation of national
and international NGOs, private enter-prises and foreign investors.
In practical terms, its achievements in-clude the adoption of an integrated ap-proach to all programmes, and the imple-mentation of special programmes such asdistrict health systems development, safemotherhood, community drug schemes, thehealth management information system,and special surveys to re-evaluate theachievements in the implementation of thehealth policy (HMG/N/MoH 2004; HMG/N/DHS 2003).
Following ICPD in 1995, the NHP wasadapted to recognise the reproductive and
FIGURE 6.12 Proximate determinants
Nutrition levelIndicator
" body massindex – height/
age weight/age
EnvironmentfactorsIndicator" Living
conditions" Work burden" Hygiene/
sanitation
Biological/maternal factorsIndicator" Maternal age" Birth interval" Parity
Health careIndicator" Health services –
for women(including preg.and non-preg.related, FP) andmen
" Nutritionalsupplement
Proximate factors

182 R E A D I N G S I N H U M A N D E V E L O P M E N T
sexual health rights of women, adolescentsand youth. A Comprehensive ReproductiveHealth Strategy was developed, along witha multi-sectoral and incremental approachto strengthen the existing Safe Motherhoodand Family Planning Programmes that con-tained the following seven components of RH(MoH/HMG/N 1998):! Family Planning! Safe Motherhood including child health
(newborn care)! Prevention and management of the com-
plications of abortion! RTI/STD/HIV/AIDS! Prevention and management of sub-in-
fertility! Adolescent reproductive health; and! Problems of elderly women.
Components such as RTI/STD/HIV/AIDSand adolescent reproductive health wereadded to the existing service programme.Further, various policy documents, strate-gies and guidelines have been developedby the MoH to strengthen safer motherhoodinitiatives in Nepal, especially after theICPD Conference. The interest in reproduc-tive health grew in the aftermath of ICPD;governments and NGOs had developed anumber of new programme initiatives,largely supported by external developmentpartners.
Further, HMG/N is committed to bringingabout tangible changes in the health-sectordevelopment processes. The Nepal healthsector programme implementation plan(NHSP-IP) (2002-2009) and Tenth Five YearPlan (2002-2007) aim to provide an equi-table, high quality health care system for thepeople. The Tenth Plan, in line with the Pov-erty Reduction Strategy, incorporates theMDGs. All in all, HSRS aims at moving the
health sector towards strategic planningand a sector-wide approach. It provides op-erational guidelines for implementing theoutputs of the HSRS (such as those relatedto improvement in supply of health care ser-vices and sector-wide management issues,including the management of financing andresource mobilisation, physical assets andhuman resource development, as well asan integrated information system) duringthe first five years. The goal of the healthsector strategy is to achieve the health sec-tor MDGs in Nepal with improved healthoutcomes for the poor and those living inremote areas and a subsequent reductionin poverty. Support for the formulation ofHNSP-IP has received support fromNepal’s external development partners.However, policies remain largely bio-medi-cally oriented with a focus on strengthen-ing the supply of health services. Socio-cul-tural factors have yet to be addressed. Themain constraints are frequent changes ofgovernment, limited national resources forthe development of health services,centralised administration, ineffectivemanagement and supervision, difficult geo-graphic conditions, slow economic growth,and the lack of a socio-cultural and genderperspective grounded in the actual experi-ences of women and men.
Health status in Nepal: Significant quanti-tative achievements have taken place interms of an increase in overall longevity, areduction in mortality, an increase in thedistribution of health services, improvedaccess to MCH/FP services, resulting in asignificant reduction in fertility, and a gen-eral awareness of population and healthissues. However, a closer look at the healthexperiences of the Nepalese from a humandevelopment perspective shows that the

H E A L T H A N D H U M A N D E V E L O P M E N T 183
country still has a long way to go in im-proving basic quality of life and humaneconditions. The vast majority of the peoplein the rural areas continue to live in pov-erty, deprived of even minimum require-ments. Socioeconomic and gender inequali-ties in health persist. Maternal mortality isunacceptably high.
Life expectancy and mortality trends: Thetrend in life expectancy at birth, and mor-tality levels show that impressive progressin health has been made overall during thelast 30-40 years. Life expectancy at birth in-creased from a mere 35 years in 1961 to over60 years in 2001. Similarly, the infant mor-tality rate declined from 172 per 1,000 in1971 to 64/1,000 in 2001 (figures 6.13 and6.14). However, average improvements inlongevity diverge widely between differentpopulation groups and geographic areas,as well as between women and men. Fur-ther, the existing poverty situation, includ-ing nutritional levels, reveal acute humandeprivation in terms of capability to surviveand the quality of life itself.
Social and ethnic variation: Among the eth-nic groups, life expectancy varies widely,with the Muslim population having short-est life span (only 48.7 years) compared toNewars and Brahmins (62 years and 61 yearsrespectively). Similarly, the hill groups –Gurungs, Magars, Limbu, Rai, and Sherpa –are comparatively disadvantaged in theirchances of survival. Measured in terms ofHDI, these popularion groups rank signifi-cantly lower than higher caste groups.
Gender disparities in health: Despite theoverall improvement in health, gender dis-parities are evident in all the health indica-tors: mortality, life expectancy, nutritional
intake, and access to health care services, aswell as information.
Nepalese women marry early, and havechildren early – a proportion that hasinceased since 1991. The majority (53%)marry by the age of 19; those who bear chil-dren by that age constitute 42%. Both fac-tors drain their nutritional health; 64% suf-fered from anemia in 1996. Maternal mor-tality in Nepal is one of the highest in theworld and second highest in the SAARCregion. Despite all the efforts that have goneinto making pregnancy and childbirth lessrisky, women continue to die of avoidableobstetric complications. Maternal mortallyas shown by the 2001 census stands at 415/100,000 – almost a 30% reduction from theprevious level of 530/100,000, but stillhighly unsatisfactory. Access to health care
70.060.050.040.0
30.020.0
10.00.0
1961 1971 1981 1991 2001
Male
Female
FIGURE 6.13 Trend in life expectancy at birth
FIGURE 6.14 Trend in infant mortality in Nepal
1971 1981 1991 2001
200
150
100
50
0
Male
Female
Both
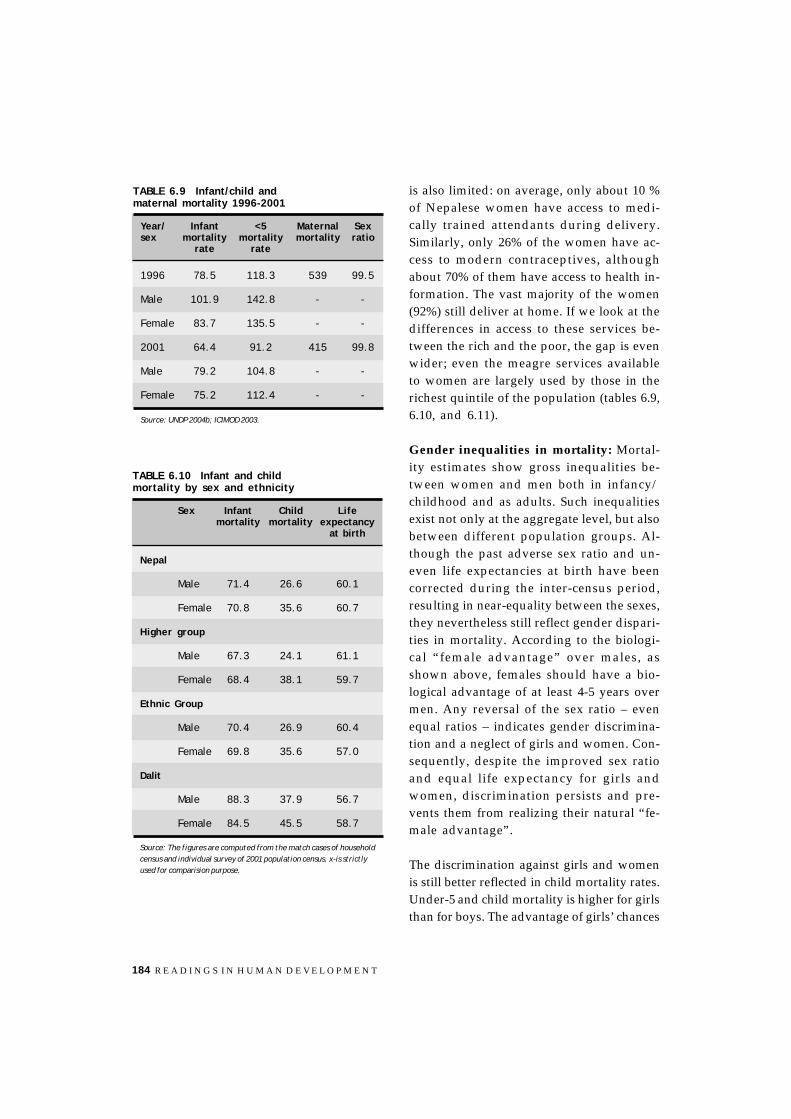
184 R E A D I N G S I N H U M A N D E V E L O P M E N T
is also limited: on average, only about 10 %of Nepalese women have access to medi-cally trained attendants during delivery.Similarly, only 26% of the women have ac-cess to modern contraceptives, althoughabout 70% of them have access to health in-formation. The vast majority of the women(92%) still deliver at home. If we look at thedifferences in access to these services be-tween the rich and the poor, the gap is evenwider; even the meagre services availableto women are largely used by those in therichest quintile of the population (tables 6.9,6.10, and 6.11).
Gender inequalities in mortality: Mortal-ity estimates show gross inequalities be-tween women and men both in infancy/childhood and as adults. Such inequalitiesexist not only at the aggregate level, but alsobetween different population groups. Al-though the past adverse sex ratio and un-even life expectancies at birth have beencorrected during the inter-census period,resulting in near-equality between the sexes,they nevertheless still reflect gender dispari-ties in mortality. According to the biologi-cal “female advantage” over males, asshown above, females should have a bio-logical advantage of at least 4-5 years overmen. Any reversal of the sex ratio – evenequal ratios – indicates gender discrimina-tion and a neglect of girls and women. Con-sequently, despite the improved sex ratioand equal life expectancy for girls andwomen, discrimination persists and pre-vents them from realizing their natural “fe-male advantage”.
The discrimination against girls and womenis still better reflected in child mortality rates.Under-5 and child mortality is higher for girlsthan for boys. The advantage of girls’ chances
TABLE 6.9 Infant/child andmaternal mortality 1996-2001
Year/ Infant <5 Maternal Sexsex mortality mortality mortality ratio
rate rate
1996 78.5 118.3 539 99.5
Male 101.9 142.8 - -
Female 83.7 135.5 - -
2001 64.4 91.2 415 99.8
Male 79.2 104.8 - -
Female 75.2 112.4 - -
Source: UNDP 2004b; ICIMOD 2003.
TABLE 6.10 Infant and childmortality by sex and ethnicity
Sex Infant Child Lifemortality mortality expectancy
at birth
Nepal
Male 71.4 26.6 60.1
Female 70.8 35.6 60.7
Higher group
Male 67.3 24.1 61.1
Female 68.4 38.1 59.7
Ethnic Group
Male 70.4 26.9 60.4
Female 69.8 35.6 57.0
Dalit
Male 88.3 37.9 56.7
Female 84.5 45.5 58.7
Source: The figures are computed from the match cases of householdcensus and individual survey of 2001 population census. x-is strictlyused for comparision purpose.

H E A L T H A N D H U M A N D E V E L O P M E N T 185
of survival over boys as infants (a lower mor-tality rate for girls compared to boys) is soonoffset by higher child mortality for girls. Fur-ther, the gender differentials in mortalityrates vary widely at the aggregate level aswell as by ethnicity. Infant mortality amongethnic groups and the Dalit population ismuch higher than the national average andhigher caste groups. Moreover, among thesetwo groups, mortality for girls is higher thanthat for boys. Similar disparities in childmortality also exist among different ethnicgroups. All in all, the gender disparity inmortality is pronounced at all levels – na-tional as well as between different groups,indicating significant social and culturaldiscrimination against girl children, irrespec-tive of their group membership.
Reproductive health and nutritional in-equalities among women: Nutritional sta-tus is a good measure of health, represent-ing access, use and enhancement of basichuman capabilities essential to survival. Italso conveys the level of well-being ofpeople. Inadequate nutrition therefore mea-sures morbidity as well as the extent of in-equality between people and groups ofpeople. The reproductive health of womenincludes their marital status, age at mar-riage, age at first birth, fertility, and theirnutritional condition during pregnancy/child birth and access to health care. Earlymarriage, early childbearing and lack of ad-equate health care are a drain on the nutri-tional status of women. Both the nutritionaldeprivation of girls and the reproductivehealth status of mothers show an acutebias against girls and women in Nepalesesociety. Further, the pre-existing healthcondition and nutritional status to a largeextent determine both reproductive andmaternal health.
TABLE 6.11 Reproductivehealth status of women in Nepal
Indicators 1991 1996 2001
% of women married 47.3 44.0 53.0by age 19 years
% of women married who 38.3 42.4give birth by age 19 years
% of women with anemia 33.0 64.0
% of women with TT2 26.8 32.6
% of births attended by 17.7 32.6 24.5trained person/TBA
Source: http://siteresources.worldbank.org/INTPAH/Resources/Publications/Country-Reports/nepal.xls
TABLE 6.12 Nutritional deprivationof girls by income levels
Indicators Male Females
Poorest Richest Poorest Richest
HNP StatusIndicators
IMR 105 71.8 87.5 55.5
U5MR 160.9 88.2 151.5 76.8
Children 59.3 28.2 58.8 35.9Stunted (%)
Children 53.4 26.4 53.1 30.5Underweight(% moderate)
Children 20.2 3 20 5.9Underweight(% severe) Source: http://siteresources.worldbank.org/INTPAH/Resources/Publications/Country-Reports/nepal.xls
An overwhelming proportion of Nepalesechildren are stunted, and underweight, witha wide gap between the poorest quintile andsignificant gender disparities. Although thedisparities between boys and girls in thepoorest quintile are marginal, it is significantin the richest quintile. For instance, the pro-
186 R E A D I N G S I N H U M A N D E V E L O P M E N T
portion of boys stunted in the richest quintileconstitutes 28%, while it is 36% for girls inthe economic bracket. Similarly, girls aretwice as much likely to be severely under-weight in the richest quintile.
Unfortunately, the proportion of womenmarrying early and having children has in-creased since 1991. The proportion of womenwith anemia has also increased, indicatingthat the nutritional situation for women hasworsened.
CONCLUSIONS
Based on the presentation made on the evo-lution of concepts of health and changes inexisting socioeconomic conditions, includ-ing gender inequalities, one must bear inmind the following points:! Health in human development is more
than an increase in longevity or reduc-tion in mortality. It is a process of hu-man capital formation that may beviewed at two levels – that of physicalhealth or physical capacity to sustainactivities that of developing /enhanc-ing capability (health + education).Health may be seen as a gateway forachieving one’s own well-being andthat of society. It implies that achievinggood health calls for addressing all thesocio-cultural, economic, and politicalconstraints that prevent individualsfrom attaining the highest quality of life.It is therefore no longer possible to viewhealth from a purely bio-medical per-spective. It goes beyond the confines ofphysical health and health care to abroad spectrum of social and gender in-equalities.
! From a human development point of view,people’s health needs to be perceived asa) a bio-medical physical phenomenon;and b) a non-medical phenomen. We needto recognise poverty, socio-cultural andgender factors – GBV in particular - aspublic health issues.
! Changing concepts over time haveevolved with the dominant health expe-riences of people
! Persistent socioeconomic and gender in-equalities in health show that currenthealth care systems cannot address so-cial and gender issues that are non-medi-cal, but nonetheless have a profound in-fluence on health.
! There is an urgent need to improve thehealth of the world’s poor, its sociallydeprived and its women. We must dealwith the social and structural factors thatexclude all these groups from basic careand medical technology because of theconstraints they face as members of par-ticular disadvantaged populations. Theirexclusion has taken a high toll on fami-lies, communities and societies.
! Although there is wide acceptance andagreement at the governmental and in-ternational levels of the need to improvethe health of the poor, the programmesdesigned to benefit the poor and the un-derprivileged have been at best only par-tially successful.
! Many health systems are unresponsiveto the needs of the poor and increase theirvulnerabilities in access to the services.Services developed for the poor lack qual-ity care.
! The health of the poor, particularly ofpoor women, is multifaceted, requiringmulti-sectoral approach to addressingtheir needs. However, current health sys-
H E A L T H A N D H U M A N D E V E L O P M E N T 187
tems operate within a sectoral mandategeared to the confines of medical care andhence fail to reach the root causes of thehealth problems of the poor and the dis-advantaged. In addition, existing healthsystems have neither the mandate nor thecapacity to deal with social problems andgender inequalities.
! However, the weight of the evidence todate suggests that health disparities andparticular health problems can be ad-dressed, provided that• A reorientation of health policies and
programmes specifically designed to ca-
ter to the needs of the poor and the un-derprivileged, along with better-man-aged growth and investment prioritiesfor the health of the poor, takes place;
• A broadened health policy that in-cludes a non-medical perspective isworked out so as to provide an envi-ronment for health sector responsesto social and gender inequalities.
• Inter-sectoral and inter-agency col-laboration through referral services incountry programmes to cater to thenon-medical factors impacting healthis fostered.

188 R E A D I N G S I N H U M A N D E V E L O P M E N T
ANNEXES
TABLE 6.1 Estimate of maternal mortality ratios,number of maternal deaths, and lifetime risk by UNICEF regions (2000)
Maternal mortality ratio Number of Lifetime risk of Range of(maternal deaths per maternal deaths maternal death uncertainty on100,000 live births) 1 in MMR estimates
Lower Upper
Sub-Saharan Africa 940 240,000 16 400 1,500
ESARO 980 123,000 15 490 1,500
WCARO 900 118,000 16 310 1,600
Middle East and North Africa 220 21,000 100 85 380
South Asia 560 205,000 43 370 760
East Asia and Pacific 110 37,000 360 44 210
Latin America and Caribbean 190 22,000 160 110 280
CEE/CIS and Baltic States 64 3,400 770 29 100
Industrialised countries 13 1,300 4,000 8 17
Developing countries 440 527,000 61 230 680
Least developed countries 890 236,000 17 410 1,400
World 400 529,000 74 210 620
Source: Calvert-Henderson 2000–2004.
TABLE 6.2 Skilled care at delivery and maternal deaths, regional comparison, 1995
Regions % births assisted MMR
Sub-Sahran Africa 45 967
South Asia 59 430
East Asia and Pacific 73 189
Middle East and N. Africa 77 175
Latin America/Caribbean 83 146
Central, Eastern Europe 97 45
North America 100 9
Source: PRB, using data from maternal mortality in 1995: estimates developed by WHO, UNICEF and UNFPA.

H E A L T H A N D H U M A N D E V E L O P M E N T 189
TABLE 6.3 Trends in life expectancy at birth (years) by sex inthe SEA region, by country, (reported 1996-2001, estimated 1975-2000)
Country Reported Estimated
1996-2001 1975-1980 1995-2000
Male Female Both Male Female Both Male Female Both
Bangladesh 60.7 60.5 60.8 47.1 46.4 46.7 58.1 58.2 58.1
Bhutan - - 60.7 44.5 46.5 45.5 59.5 62.0 60.7
DPR Korea 63.0 70.9 67.1 64.4 69.8 66.9 60.5 66.0 63.1
India 62.4 63.4 - 53.3 52.4 52.9 61.9 62.6 62.3
Indonesia 61.9 65.7 63.9 51.5 54.0 52.7 63.3 67.0 65.1
Maldives 70.7 72.2 71.4 55.9 53.2 54.6 66.3 64.5 65.4
Myanmar 61.0 63.9 62.5 48.6 52.8 50.6 53.6 58.3 55.8
Nepal - - 58.9 47.0 45.4 46.2 57.6 57.1 57.3
Sri Lanka 70.7 75.4 73.0 65.0 68.5 66.4 69.0 74.7 71.6
Thailand 69.9 74.9 - 58.0 65.1 61.4 66.7 72.6 69.6
World - - - 58.0 61.5 59.8 62.9 67.1 65.0
Sources: UN 2003.
TABLE 6.4 Percent of all women who have experienced any violence at any time
Countries Taken from DHS* Countries Taken fromUNFPA pilot project**
1. Cambodia 23 11. Lebanon 35
2. Colombia 41 12. Mozambique 48
3. Domican Republic 24 13. Nepal 11
4. Egypt 35 14. Romania 12
5. Haiti 35
6. India 21
7. Nicaragua 33
8. New Peru 47
9. Zambia 58
Source: * Kishor and Johnson 2004.**Pradhan 2004.
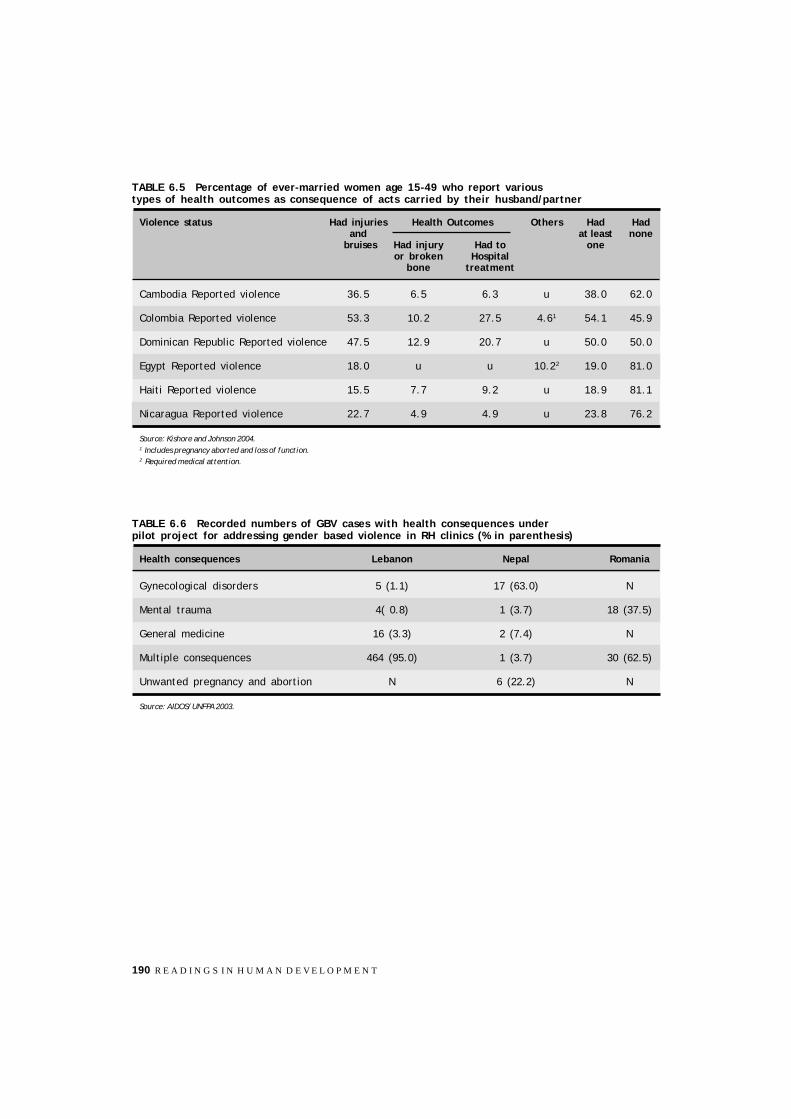
190 R E A D I N G S I N H U M A N D E V E L O P M E N T
TABLE 6.5 Percentage of ever-married women age 15-49 who report varioustypes of health outcomes as consequence of acts carried by their husband/partner
Violence status Had injuries Health Outcomes Others Had Hadand at least none
bruises Had injury Had to oneor broken Hospital
bone treatment
Cambodia Reported violence 36.5 6.5 6.3 u 38.0 62.0
Colombia Reported violence 53.3 10.2 27.5 4.61 54.1 45.9
Dominican Republic Reported violence 47.5 12.9 20.7 u 50.0 50.0
Egypt Reported violence 18.0 u u 10.22 19.0 81.0
Haiti Reported violence 15.5 7.7 9.2 u 18.9 81.1
Nicaragua Reported violence 22.7 4.9 4.9 u 23.8 76.2
Source: Kishore and Johnson 2004.1 Includes pregnancy aborted and loss of function.2 Required medical attention.
TABLE 6.6 Recorded numbers of GBV cases with health consequences underpilot project for addressing gender based violence in RH clinics (% in parenthesis)
Health consequences Lebanon Nepal Romania
Gynecological disorders 5 (1.1) 17 (63.0) N
Mental trauma 4( 0.8) 1 (3.7) 18 (37.5)
General medicine 16 (3.3) 2 (7.4) N
Multiple consequences 464 (95.0) 1 (3.7) 30 (62.5)
Unwanted pregnancy and abortion N 6 (22.2) N
Source: AIDOS/UNFPA 2003.

191T H E E N V I R O N M E N T A L P E R S P E C T I V E
I N S U S T A I N A B L E H U M A N D E V E L O P M E N T
INTRODUCTION
The purpose of this chapter is to briefly presentthe evolution of integration between humandevelopment and environment in general andin the context of Nepal in particular. The fo-cus is on better understanding the two con-cepts, identification of appropriate indicatorsto measure the changes and impacts, assess-ing the role of different policy measures, andan advocacy for improving the harmony ofhuman development with the environment.
The concept of human development has be-come widely accepted and is being used as acomprehensive measure of development per-formance on account of the conceptual andpractical work supported by UNDP both atthe global and national levels. Together withGNP measures, UNDP- supported annual ex-ercises on preparation of the HDI incorporatepreviously neglected dimensions of develop-ment. The exercises to incorporate the envi-ronmental concerns have only begun. Integra-tion of the environment with different compo-nents of human welfare, with national incomeaccounts and with sectoral performance in-dicators have a long way to go. Environmen-tal statistics in most countries are still rela-
tively limited, both in content and coverage.While it may be easy to report on the status ofsome environmental variables, there are manygaps regarding the continuity and coverageof the data. Environmental data has strongarea specificity because of the wide heteroge-neity in environmental conditions. There aremany changes going on in nature all the time.Given this, it is necessary to monitor the hu-man contribution to environmental changesas well as the human impact of changes inthe environment. Better understanding of en-vironmental processes is critical if appropri-ate policy and institutional responses are tobe generated.
THE ENVIRONMENTAND SOCIETY
“Civilised man has marched across the faceof the Earth and left a desert in his footprint”(Gill and Dale 1974). While this statementmay not be wholly true, throughout a longstretch of history, humans beings have re-lentlessly changed their environments, de-stroying forests, denuding grasslands byovergrazing, killing wildlife, recklessly min-ing resources, applying inappropriate inten-
CHAPTER 7
The environmental perspectivein sustainable human development
Mahesh Banskota
192 R E A D I N G S I N H U M A N D E V E L O P M E N T
sive agricultural techniques to very poor soilsand engaging in many other activities thatcan hardly be called a “wise” use of naturalresources or the environment. After short-lived grandeur, many civilisations have per-ished or found themselves forced to move intonew lands – often because they had ex-hausted the natural resource base that hadsustained their societies. Although some ofthe major religions have advocated harmonywith nature (box 7.1) and many indigenousgroups have continued to put this conceptinto practice in their livelihood strategies,they face significant difficulties in continu-ing their traditional relationships with na-ture because of numerous external pressures(Miller, et al 2001).
Human behaviour lies at the root of bothconservation and environmental damage.Poor people have not always destroyed theirenvironment, nor have the rich always pro-tected it. Different actors, time scales andnatural conditions interact in complex waysto produce certain types of human re-sponses, which constantly change. How-ever, to assume that nature will always ac-commodate human needs is a clear misread-ing of natural forces.
Human knowledge and technologies mayhelp alleviate particular conditions of scar-city and other difficulties, but as long as hu-man survival demands air, water, food pro-duced on the basis of natural resources, in-cluding biodiversity, nature will alwayshave the upper hand. With or without hu-man beings, nature itself changes continu-ously, “repairing” parts of the ecosystem –up to a point – because of in-built regulat-ing processes. However, after that point,significant changes will take place, manyof them inimical to human societies. It is
therefore up to us to decide how we wish tointeract with nature – antagonistically orharmoniously. Human devastation of natu-ral resources has now reached dangerousglobal proportions.
Environmental impacts are being seen al-most everywhere on the planet. (UNDP 1998;UNEP 2002a) Increase in greenhouse gases(GHGs), pollution of water bodies, increaseddependence on pesticides and many otherproblems now pose dilemmas for most coun-tries. The significant difference today is thatalong with many important local changes inthe ecosystem, we have a number of majorglobal problems that did not exist before orwere not recognized as such.
The issue of overpopulationRapid population growth is considered oneof the most important factors in environmen-tal degradation. World population is ex-pected to stabilise only around 2050 at ap-proximately 8.9 billion. Much of that increasehas been – and will continue to be – in theless developed countries, where people de-pend on subsistence agriculture and the useof natural resources for their livelihoods (UN2003). Demands for agricultural land hascompelled many societies to cultivate mar-ginal areas, thereby increasing soil erosion,deforestation, and a number of other envi-ronmental ills. The sheer increase in humannumbers is likely to outstrip available foodsupply and the capacity of natural systemsto support human needs (Brown 1978;Ehrlich and others 1977).
However, other scientists argue that thegrowth rate (2.2%) of human populationspeaked in 1962/63 and that growth rate hascontinued to fall; in 2001, it was only 1.2%
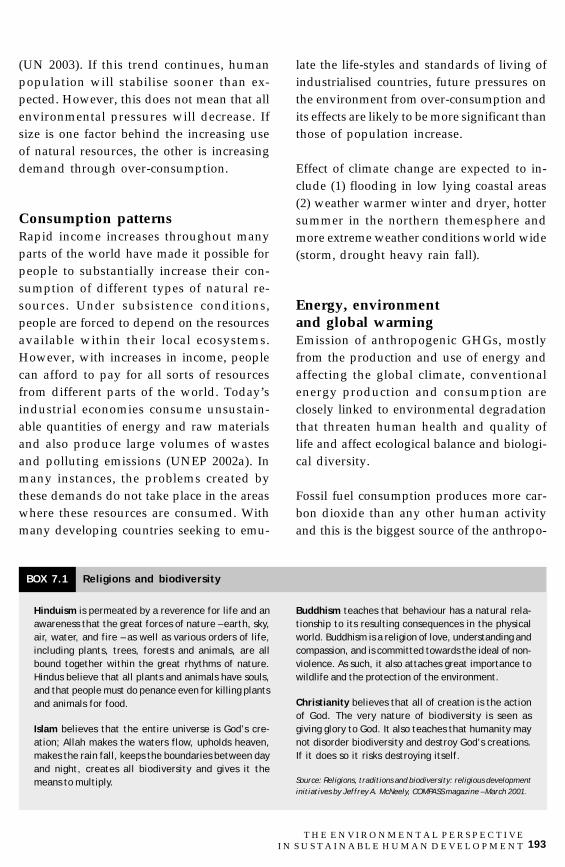
193T H E E N V I R O N M E N T A L P E R S P E C T I V E
I N S U S T A I N A B L E H U M A N D E V E L O P M E N T
(UN 2003). If this trend continues, humanpopulation will stabilise sooner than ex-pected. However, this does not mean that allenvironmental pressures will decrease. Ifsize is one factor behind the increasing useof natural resources, the other is increasingdemand through over-consumption.
Consumption patternsRapid income increases throughout manyparts of the world have made it possible forpeople to substantially increase their con-sumption of different types of natural re-sources. Under subsistence conditions,people are forced to depend on the resourcesavailable within their local ecosystems.However, with increases in income, peoplecan afford to pay for all sorts of resourcesfrom different parts of the world. Today’sindustrial economies consume unsustain-able quantities of energy and raw materialsand also produce large volumes of wastesand polluting emissions (UNEP 2002a). Inmany instances, the problems created bythese demands do not take place in the areaswhere these resources are consumed. Withmany developing countries seeking to emu-
late the life-styles and standards of living ofindustrialised countries, future pressures onthe environment from over-consumption andits effects are likely to be more significant thanthose of population increase.
Effect of climate change are expected to in-clude (1) flooding in low lying coastal areas(2) weather warmer winter and dryer, hottersummer in the northern themesphere andmore extreme weather conditions world wide(storm, drought heavy rain fall).
Energy, environmentand global warmingEmission of anthropogenic GHGs, mostlyfrom the production and use of energy andaffecting the global climate, conventionalenergy production and consumption areclosely linked to environmental degradationthat threaten human health and quality oflife and affect ecological balance and biologi-cal diversity.
Fossil fuel consumption produces more car-bon dioxide than any other human activityand this is the biggest source of the anthropo-
Hinduism is permeated by a reverence for life and anawareness that the great forces of nature – earth, sky,air, water, and fire – as well as various orders of life,including plants, trees, forests and animals, are allbound together within the great rhythms of nature.Hindus believe that all plants and animals have souls,and that people must do penance even for killing plantsand animals for food.
Islam believes that the entire universe is God’s cre-ation; Allah makes the waters flow, upholds heaven,makes the rain fall, keeps the boundaries between dayand night, creates all biodiversity and gives it themeans to multiply.
Buddhism teaches that behaviour has a natural rela-tionship to its resulting consequences in the physicalworld. Buddhism is a religion of love, understanding andcompassion, and is committed towards the ideal of non-violence. As such, it also attaches great importance towildlife and the protection of the environment.
Christianity believes that all of creation is the actionof God. The very nature of biodiversity is seen asgiving glory to God. It also teaches that humanity maynot disorder biodiversity and destroy God’s creations.If it does so it risks destroying itself.
Source: Religions, traditions and biodiversity: religious developmentinitiatives by Jeffrey A. McNeely, COMPASS magazine – March 2001.
BOX 7.1 Religions and biodiversity

194 R E A D I N G S I N H U M A N D E V E L O P M E N T
genic greenhouse gas emission that is chang-ing the composition of the atmosphere.
Global warming is the greatest environmen-tal challenge facing the world today. Muchof the warming is due to human emission ofGHGs. Over the past 140 years the earth’ssurface temperature has increased on aver-age by 0.6 ± 0.2oC (Jones, Phil and Palutikofn.d). Global warming is caused by increasein the levels of six GHGs attribute to hu-man activities. Carbon dioxide is the maincontributor responsible for 80% of emis-sions from industrialised countries (ucsusan.d). Other GHGs coming from a range ofindustrial and agricultural activities aremethane (CH4), nitrous oxide (NzO),hydrofluorocarbon (HFC6) perfluoro carbon(PFCs) and sulphur hexafluoride (SF6).
Two major transboundary air pollution prob-lems are stratospheric ozone depletion andglobal warming. The Montreal Protocol onOzone Depleting Substances is an interna-tional agreement that limits the productionof refrigerants and other chemicals deplet-ing the ozone layer and provides penaltiesfor countries that violate the agreement. Asecond agreement is the Kyoto Protocol ne-gotiated by most countries in 1997 to controlemission of gas leading to climate change.This agreement calls for stabilising worldemission by 2010 at roughly 5% below 1990levels (wikipedia n.d).
The protocol defines the limits in terms ofthe full range of six GHGs and allow emis-sion reducing project in other countriesthrough Clean Development Mechanism (indeveloping countries) or joint implementa-tion (in developed countries) to generateemission credit that can be used towardscompliance.
Market failures andpolicy distortionsHuman activities do not take into accountthe true environmental costs for many rea-sons, including government subsidies, lackof knowledge about environmental impactsespecially if these are ex situ, the absence oflaws and regulations to control environmen-tal damage, undefined access rights to natu-ral resources, conflict situations in whichboth parties ignore or destroy environmen-tal safeguards, poorly developed markets forenvironmental goods and services and a lop-sided development system that forces largenumbers of people to depend on scarce natu-ral resources for their livelihoods.
Market failures occur where resources are notused efficiently. In many instances, currentmarket systems are unable to price the out-puts or impacts of activities, the most glar-ing examples being the disposal of wastes inwater bodies, the dumping of toxic sub-stances and the pollution of the atmosphere.This happens either because the pollutersthink they can get away with it or becausethe costs of proper disposal are too high. Thesocial costs in both cases usually far out-weigh the costs to the private producer.
Solutions lie in making price signals workmore effectively, usually by taxing the pro-ducer for pollution or other depredations.Permits provide quotas of pollution beyondwhich fines are imposed. In some instanceswhere pollution levels fall below the permis-sion threshold, the industry can sell part ofthe permit to another polluter.
One area of policy distortion is the subsidiesand protection given to certain industriesthat cause environmental damage. Manypublic-sector industries with a high degree
195T H E E N V I R O N M E N T A L P E R S P E C T I V E
I N S U S T A I N A B L E H U M A N D E V E L O P M E N T
of pollution continue to operate only becauseof the huge subsidies and protection pro-vided by the government. Other forms ofdistortion arise because of bureaucratic iner-tia and the subsequent creation of huge trans-action costs in obtaining government approv-als, including the paperwork required for li-censes to export, import, or transport goods.
RETHINKING DEVELOPMENT ANDTHE ROLE OF THE ENVIRONMENT
Development thinking has been strongly in-fluenced by both economic and environmen-tal groups. Until the mid-1960s, when a num-ber of Western thinkers began publicly airingtheir fears about the dangers of chemical pes-ticides and other ecological disruptions, de-velopment thinking was dominated by politi-cal and socioeconomic considerations, to theneglect of a number of other issues, such asthe environment and the role of culture in de-velopment. However, with the convening ofthe Stockholm Conference on the Human En-vironment in 1972 and the founding of theUnited Nations Environment Programme afew months later, environmental issues be-came firmly inscribed on the internationalagenda and fierce debates began on whetherenvironmental protection could ethically – orpractically – be undertaken at the expense ofeconomic growth, especially in poor countries.The fierceness of this discussion has notabated, though the arguments on both sideshave become increasingly complex.
Economic vs. environmental issuesEcological/environmental groups point tothe need for greater harmony with nature.Economic thinkers still maintain that hu-man needs take precedence over other is-
sues, pointing out that nature changes con-stantly and that in the long run, scarcitywill determine how resources are used.Ecologists, however, state that the scale ofnatural self-correction no longer operatesas it did even a century ago and that therenow exist many serious local, regional andglobal problems, such as reducedbiodiversity and increasing toxic wastes inthe natural system. (UNDP 1998; UNEP2002a) Further, they attribute such dam-age to rapid population increases and ex-ploding consumption patterns worldwide.“As things deteriorate,” states TerryRambo, “countries and individuals thathave wealth and power will find ways toprotect themselves. Those who don’t havethe money and the power will live worseand worse lives. But they will survive andcontinue to compete for scarcer and scarcerresources” (Rambo 1997).
Economists respond by pointing out thatMalthusian predictions about a populationdisaster, discussed ever since the late 18th
century, have not come to pass; technologi-cal advances have always intervened to pre-vent it. Thus, fuelwood crises led to the wide-spread use of coal and, later, to drilling forpetroleum. Present efforts to develop renew-able alternatives to fossil fuels are develop-ing rapidly. Some maintain that fossil fuelsstill abound and that price will regulate de-mand, as it has in the past. The ScepticalEnvironmentalist, (Lomborg 2001) has at-tempted to calm ecological fears by point-ing out that the evidence to date does notsupport the contention of human defilementof the earth, that biodiversity loss is still avery small fraction of what has been pre-dicted and that many reports of pollutionhave been exaggerated. It argues that eco-nomic growth remains the best cure for rem-

196 R E A D I N G S I N H U M A N D E V E L O P M E N T
edying environmental problems – even glo-bal warming, which, the author says, is avery long-term process that probably willnot be devastating for humanity.
The introduction ofsustainable developmentSustainable development has become a keyterm in the current development discussionthat seeks to bring environment and devel-opment together (box 7.2). The word sustain-able is defined as being able to “support, en-dure, given strength to do so, or to maintaincontinuously over a long period” (Oxford1995). An activity is sustainable if it can becarried out for a reasonable time without dis-ruption. It is also presumed that sustainableuses of resources exist if these resources areutilized at rates within their capacity forgrowth and renewal. Consequently, a sustain-able economy is one in which economic im-provements are accompanied by improve-ments in the human and physical environ-ment. Sustainable development is improve-ment in human life within the “carrying ca-pacity” of the life support systems. Sustain-able human development is the developmentof human capability to fulfil people’s re-quirements without damaging the environ-ment. A sustainable society is one that re-spects and cares for the community of life,improving the quality of human life whileconserving Earth’s vitality and diversity,minimising the depletion of non-renewableresources, keeping changes within Earth’scarrying capacity, changing personal atti-tudes and practices to enable communitiesto care for their own environments, adopt-ing frameworks for integrating environmentand development and creating a global alli-ance to implement these frameworks. Thelist could be much longer.
The word sustainable is being used in manyother contexts as well, such as sustainabletourism and sustainable harvesting prac-tices; the term has become an environment-friendly “hat” for all, including governmentsand businesses that have not been particu-larly environment-friendly in the past –which, in fact, characterised the environmen-tal movement as anti-development. Earlieruses of the term sustainable were foundmainly in ecology and agriculture.
As Conway (1983) describes it, “Sustainabilityis the ability of a system to maintain produc-tivity in spite of a major disturbance (inten-sive stress)”. The non-governmental organi-zation environment “treaty” of 1993, follow-ing the 1992 World Conference on Environ-ment and Development (UNCED 1992),states “Agriculture is sustainable when it isecologically sound, economically viable, so-cially just, culturally appropriate and basedon a holistic scientific approach” (quoted inBecker 1997).
The world commission on environment anddevelopment (WCED 1987) provided thenow-popular definition of integrated envi-ronment and development: “Developmentthat meets the needs of the present genera-tion without compromising the needs of thefuture generation.” That definition first ap-peared in 1987 in Our Common Future, theWCED report, often called the “BrundtlandReport” because the Commission waschaired by Gro Harlan Brundtland, thenPrime Minister of Norway. The subsequent1992 Conference, often called the “EarthSummit,” adopted Agenda 21, an environ-mental agenda for the 21st century, whichbecame the basis of many concepts advo-cated by the UN system, including theMDGs. The MDGs incorporate several en-
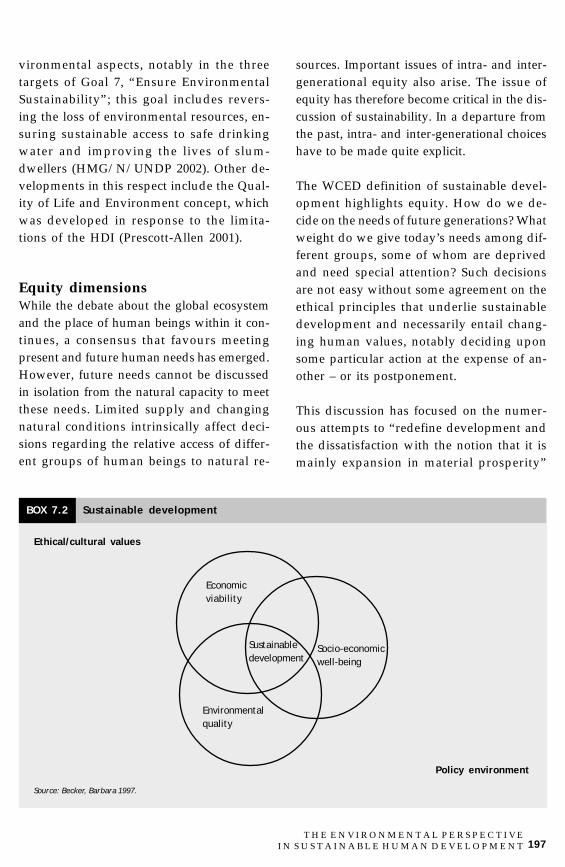
197T H E E N V I R O N M E N T A L P E R S P E C T I V E
I N S U S T A I N A B L E H U M A N D E V E L O P M E N T
vironmental aspects, notably in the threetargets of Goal 7, “Ensure EnvironmentalSustainability”; this goal includes revers-ing the loss of environmental resources, en-suring sustainable access to safe drinkingwater and improving the lives of slum-dwellers (HMG/N/UNDP 2002). Other de-velopments in this respect include the Qual-ity of Life and Environment concept, whichwas developed in response to the limita-tions of the HDI (Prescott-Allen 2001).
Equity dimensionsWhile the debate about the global ecosystemand the place of human beings within it con-tinues, a consensus that favours meetingpresent and future human needs has emerged.However, future needs cannot be discussedin isolation from the natural capacity to meetthese needs. Limited supply and changingnatural conditions intrinsically affect deci-sions regarding the relative access of differ-ent groups of human beings to natural re-
sources. Important issues of intra- and inter-generational equity also arise. The issue ofequity has therefore become critical in the dis-cussion of sustainability. In a departure fromthe past, intra- and inter-generational choiceshave to be made quite explicit.
The WCED definition of sustainable devel-opment highlights equity. How do we de-cide on the needs of future generations? Whatweight do we give today’s needs among dif-ferent groups, some of whom are deprivedand need special attention? Such decisionsare not easy without some agreement on theethical principles that underlie sustainabledevelopment and necessarily entail chang-ing human values, notably deciding uponsome particular action at the expense of an-other – or its postponement.
This discussion has focused on the numer-ous attempts to “redefine development andthe dissatisfaction with the notion that it ismainly expansion in material prosperity”
Ethical/cultural values
Policy environment
BOX 7.2 Sustainable development
Economicviability
Sustainabledevelopment
Socio-economicwell-being
Environmentalquality
Source: Becker, Barbara 1997.

198 R E A D I N G S I N H U M A N D E V E L O P M E N T
(Qizilbash 1996). However, developing na-tions argue that moving away from aspira-tions to material prosperity is simply un-feasible, given the high levels of poverty anddeprivation of their general populations.They argue, too, that development in poornations must aim at improving the satisfac-tion of basic needs, including those of healthand education and the infrastructure re-quired to provide such services. As theSouth Centre (1991) stated “It is imperativethat the developing countries should claimthe right to an adequate ‘environmentalspace’ and strive for the recognition of thisright by the international community. Theymust stand firm on the principle that thedevelopment of the South can in no way becompromised by the North’s pre-emption
of the global environmental space.… ‘sus-tainable development’ does not mean onlythat the needs of the present have to be metwithout prejudice to the satisfaction of fu-ture needs. It means also that the needs ofthe North should be met in ways that do notcompromise the satisfaction of the presentand future needs of the South”.
The poverty/environment nexusThe relationship between poverty and theenvironment is complex (boxes 7.3 and 7.4)On the one hand, many see poor people asthe major cause of environmental damage.However, others argue that the poor are alsothe victims of environmental changes. Manyrural societies have developed highly so-
Examples of environmental conditions
Access to natural resources
Ecosystem services
Access to safe water and sanitation
Pollutants
Ecological fragility
Likelihood of natural disasters
Dimensions of poverty
Livelihoods
Health
Vulnerability
BOX 7.3: Environmental dimensions of poverty
Source: Palanivel, T. 2003.

199T H E E N V I R O N M E N T A L P E R S P E C T I V E
I N S U S T A I N A B L E H U M A N D E V E L O P M E N T
Ecosystems services
Provisioning! Food! Micro-organisms, plant/animal
items! Genetic material, pharmaceuticals! Fuels/energy! Fiber! No-living materials! Fresh water
Regulating! Purification of air and water
! Mitigation of floods and droughts
! Detoxification and decompositionof waters
! Generation of renewal of soil andsoil fertility
! Pollination of crops and naturalvegetation
! Control of a vast majority of po-tential agricultural pests
! Dispersal of seeds and transloca-tion of nutrients
! Maintenance of biodiversity pro-tection of the sun’s harmful ul-traviolet rays
! Partial stabilization of climate! Moderation of temperature
extremes
Enriching! Spiritual uses and relationship or
people to land and water! Aesthetic values! Social relations and values! Education and scientific value
Poverty/human well-being
Being able to be adequately nourished.
Being able to be free from avoidabledisease
Being able to live in an environmentallyclean and safe shelter
Being able to have adequate and cleandrinking water
Being able to have clean air
Being able to have energy to keep warmand cook
Being able to use traditional medicine
Being able to have cultural and spiri-tual practices using ecological systemsrespected
Being able to cope against extreme natu-ral events like floods, tropical stormsand land slides
Being able to make sustainable manage-ment decisions with respect to the useof natural resources in order to achievesustainable income stream
BOX 7.4 Links between ecosystems services and poverty
Source: Palanivel, T. 2003.

200 R E A D I N G S I N H U M A N D E V E L O P M E N T
phisticated community-based conservationefforts; others have denuded hillsides anddegraded watersheds. Past observers as-sumed that the dimensions of poverty weresimilar among all poor households and thatthey all interacted similarly with the envi-ronment, largely destructively. This as-sumption is patently false: some householdsand/or communities may face fuelwoodproblems, others may confront floods, wild-life and other pests. The type and severityof these problems usually determines dif-fering household responses (Reardon andVosti 1995). It is therefore essential to un-derstand how poverty affects different en-vironmental conditions and how they, inturn, affect poverty.
Each society must decide upon its prioritiesfor the future. There are opportunities to worktogether at the regional and global level onkey problems, such as global warming, theprotection of tropical rain forests, the con-servation of biodiversity, biopiracy, and in-tellectual property rights.
Vulnerability andenvironmental changeThe issue of vulnerability in the ecologicalas well as economic context has recently re-ceived a fair amount of attention. Vulner-ability refers to exposure to physical threatsto human well-being and the capacity of asociety to cope with these threats. Naturalevents such as floods, droughts, fire, storms,volcanic eruptions, earthquakes and insectswarms have always posed threats to hu-mans. Humans themselves have added tothis list with new dangers, such as chemi-cal and radioactive contamination andspread of new diseases in animals and hu-mans (UNEP 2004b). Global climate changes
resulting from increasing GHGs and greaterfrequency in extreme weather events poseyet another type of threat to human society.In addition, particular groups – notablyamong the poor – are especially vulnerablebecause of top-down policies that tend toignore them and sociocultural conditionsthat marginalise them physically.
Worldwide discussions of vulnerability tothe dumping of toxic waste have further de-veloped the concept of environmental justice.The application of this concept, along withassertions of the rights of vulnerable groups,especially those in developing countries, hasled to the notion of environmental entitle-ments (Forsyth and Scoones Leach 1998).
In a number of cities of the United States ofAmerica, where many environmental prob-lems have affected marginalised racial andethnic groups relegated to slums inside andon the fringes of metropolitan areas, a num-ber of non-governmental organizationssprang up during the 1970s to defend theseminorities legally against environmentalthreats that arose from the decayed build-ings they occupy and neglectedneighbourhoods unserved by municipal gar-bage collection and other normal public ser-vices. Occasionally, special interests – of-ten involved with criminal networks –bribed such groups to accept the dumpingof toxic wastes. This gave rise to the con-cept of environmental justice, defined as “therights of people to a safe, healthy, produc-tive and sustainable environment” (Panos2002). It is also used interchangeably withenvironmental “equity”, which also refersto “fairness” and “rights”.
Worldwide discussions of the dumping oftoxic wastes during the 1980s and 1990s,

201T H E E N V I R O N M E N T A L P E R S P E C T I V E
I N S U S T A I N A B L E H U M A N D E V E L O P M E N T
particularly in the rural areas in the devel-oping countries, gave rise to the concept ofenvironmental entitlements. These are sim-ply the potential benefits from the environ-ment and its resources over which peopleliving in a particular environment have le-gitimate command (Forsyth, et al 1998).Poor and marginalised communities, gen-erally unaware of the protections providedby law for various environmental entitle-ments, cannot enforce their rights to theseresources or their products, such as non-timber forest products, now under legal dis-cussion in a number of countries in Southand South-East Asia. Environmental justiceseeks to ensure livelihood security for thesegroups (Panos 2002).
Operationalising sustainabilityEfforts are also under way to operationalisesustainability and its components so as toimprove the measurement of different vari-ables for evaluation over time (box 7.5). Thesystems approach to sustainability seeks topredict changes in different ecosystems byextrapolating variables in their distinct com-ponents. Based on past observations aboutthe performance of the systems and some exante assumptions about feedback mecha-nisms, cumulative effects, time lags and otherissues, scientists make projections to showhow the system behaves under different sce-narios. Normally, verification establishes therobustness of the model for its predictability.The first of these types of exercises was car-
Economic indicators! Modified GNP
! Discount rates
! Depletion costs
! Pollution costs
! Total factor productivity
! Total social factor productivity
! Willingness to pay
! Contingent valuation method
! Hedonic price method
! Travel cost approach
Social indicators! Equity coefficients
! Disposable family income
! Social costs
! Tenure rights
Environmental indicators! Yield trends
! Coefficients for limited resources
! Depletion costs
! Material and energy flows and balances
! Soil health
! Modelling– empirical
– deterministic
– analytical
– deterministic
– numerical
! Bioindicators
Composite indicators! Scoring systems
! Integrated system properties
! Unranked list of indicators
Source: Becker, Barbara 1997.
BOX 7.5 Different indicators

202 R E A D I N G S I N H U M A N D E V E L O P M E N T
ried out in 1972 by the Club of Rome (Mead-ows, et al 1972). The International Union forthe Conservation of Nature (IUCN 2003) hasexamined the impact of different policies onprotected areas while UNEP (UNEP 2004a)has looked at the impact of different policyscenarios on the environment.
Economic analyses of sustainability havefocused, inter alia, on the valuation of natu-ral resources as a limited resource, likelabour and capital (Aires, et al 1996;Costanza 1991). There exists several types ofvaluation techniques of environmental re-sources economy-environmental nexusmodelling together with their underlyingindicators (box 7.5). Commonly used onesare willingness to pay, contingent valuation,hedonic pricing, travel cost approaches, andthe precautionary principle (box 7.6).
Although the conversion of sustainability as-pects into monetary values constitutes a ma-jor contribution to environmental studies, ithas a number of critics, some of whom saythat economists know the price of everythingand the value of nothing. This kind of critiquemisses the practical point that there is no freelunch. Because any decision has quantifiablecosts that someone has to pay, one must findout who has to pay what to whom in terms ofthe environment. While the answers are usu-ally imperfect, they provide good guides tolooking at different options.
Efforts have been made to build on the ideaof human development further by integrat-ing human welfare with ecosystem welfare(Prescott-Allen 2001). The HDI does not showhow far a country has depleted its stock ofnatural resources in trying to realise humandevelopment objectives. There is no negativeHDI to reflect losses in natural resources by
type or degree. If human development hastaken place at the expense of natural wealth,one cannot possibly say that a country is onthe path to sustainable development.
The Well-Being of Nations presents a Well-being Index as a barometer of sustainability(Prescott-Allen 2001). In terms of HumanWell Being, the report ranks 3 countries asgood (2%), 34 as fair (19%), 52 as medium(29%), 51 as poor (28%) and 40 as bad (22%).By contrast, the Ecosystem Well-being Indexshows that no country is good, 27 are fair(15%), 81 are medium (45%), 68 are poor(38%) and four are bad (2%) (Prescott-Allen2001). As this has not been a continuing ex-ercise, the value of this exercise is greatly lim-ited. However, it presents many consider-ations well worth follow-up.
Environmental awarenessand assessmentSignificant efforts have been made since thelate 1960s to promote environmental educa-tion, in part through the UNESCO’sOrganisation’s Man and the BiosphereProgramme and the development of suchtools as the strategic environmental assess-ment and the environmental impact assess-ment (EIA). These have shown immensevalue in examining projects and programmesand, often, correcting decisions in differentsectoral projects and programmes. Individualcountries and international organisationshave also developed a considerable body ofenvironmental law to address ecological con-ditions. In addition, in many countries, anactive pro-environment judiciary has playedan important role in ensuring that these stat-utes are carefully implemented and enforced.This growing body of law, general action toincrease awareness and specific instruments

203T H E E N V I R O N M E N T A L P E R S P E C T I V E
I N S U S T A I N A B L E H U M A N D E V E L O P M E N T
for assessments are converging under thebroader theme of environmental governance(HMG/N/UNDP 2002).
In the human development approach, the endof all development is to improve choices forhuman beings and to develop their capacitymake such choices (Sen 2003). The focus ofmuch environmental action has been on pro-moting greater harmony with nature so thatthe bounty of nature remains available for gen-erations to come. Agenda 21 emphasises un-der Principle 1 that “Human beings are at thecentre of concern for sustainable development.They are entitled to a healthy and productivelife in harmony with Nature” (UNCED 1992).
A better understanding of what is happen-ing to the natural environment because ofhuman activities should be encouraged;without knowing what is changing or beingaffected where, how and by whom, it is verydifficult to shape meaningful responses. Asenvironmental processes can be both localand non-local, they often have differing im-plications at different levels. As the scale ofimpacts increases, complexities also grow
significantly, especially when the benefitsand costs are not equitably distributed be-tween the parties affected and those thatoriginate the process, whether harmful orbeneficial. Changes in nature take place overlong time frames. As the debate on climatechange has revealed, even where partiesagree that global warming is taking place,debates on measures to deal with the phe-nomenon are often acrimonious. Any con-sensus action requires vastly improved un-derstanding, because the resources requiredfor meaningful action on one front will meanlesser expenditures on others (Kumar 2003).Neither the environmentalist nor the econo-mist is likely to be fully satisfied.
THE HUMAN DEVELOPMENTPARADIGM AND APPROACH
Equity, sustainabilityproductivity and empowermentMahbub ul Haq identified the four pillars ofhuman development as equity, sustainability,productivity and empowerment. Any discus-
Willingness to pay is the maximum amount of moneyone would give up to levy some good.
Hedonic Pricing Approach derives values by decom-posing market prices into components encompassingenvironmental and other characteristics through study-ing values, wages and other phenomena.
Contingent Valuation Method directly asks people whatthey are willing to pay for a benefit and/or willing toreceive in compensation for tolerating a cost througha survey. The aim is to elicit valuation or bids whichare close to what would be revealed if an actual mar-ket existed.
Travel Cost Method derives values by evaluating expendi-ture of recreators. Travel costs are used as a proxy forprice in deriving demand curves for recreation site.
Precautionary Principle has been introduced with theobjective of protecting the environment and publichealth even when scientific information was consid-ered insufficient regarding the potential impact of theproduct or technology. It was introduced in the WorldSummit in Rio 1992. Rio Principle 15 says where thereare threats of serious or irreversible damage, lack ofscientific certainty shall not be used as a reason forpostponing cost-effective measures to prevent envi-ronmental degradation.
Source: UNCED 1992.
BOX 7.6 Valuation techniques of environmental resources

204 R E A D I N G S I N H U M A N D E V E L O P M E N T
sion of environmental issues in relation tohuman development must examine them withregard to each of these pillars.
Equity requires improvements in access toenvironmental assets and their distributionas far as possible.
Sustainability appears to echo theBrundtland proposal that future generationshould enjoy the same level of well-being asthat of the present. However, Haq points outthe common mistake that equatessustainability only with the preservation ofnatural capital – essentially calling for thepreservation of all natural resources andspecies, which is not only unfeasible, but aperspective whose limitations distort theentire human development concept. Humandevelopment requires sustaining physical,human, financial and environmental capi-tal, he argues; depleting any one of these willcompromise the potential of sustainable de-velopment (Haq 2003).
Productivity focuses on economic growthas well as the enabling environment thatpromotes human productivity. Enabling en-vironment refers to living conditions thatare not environmentally harmful. Air, wa-ter and noise pollution adversely affect hu-man health and therefore productivity. Ex-posure to toxic compounds has damagedthe health of many workers in industrialcities. Some have confused human devel-opment with mainly improvements in theskills of human resources but not on theoverall factors contributing towards beinga physically, mentally and environmentallysound being.
Empowerment, which deals primarily withparticipation, requires improving opportu-
nities for decision-making about environmen-tal matters by every citizen of a country atdifferent levels and ensuring that they aresufficiently aware and informed on suchquestions to make rational decisions.
To highlight the role of the environment inthe human development paradigm, Haqpoints out that ecological resources must becorrectly priced (Haq 2003); that some re-sources call for mandatory quotas and com-pulsory audits; and that a framework for safetechnologies must be developed, along witha “green” GNP. He adds that improving na-tional capacity to undertake all these taskswill require significant resources (Haq 2003).
NEPAL’S ENVIRONMENTAL PROFILE
Overall changesNepal’s rapidly growing population is put-ting pressure on its natural resource base,particularly water, land and forests. Muchof the forestland between the Himalayas andthe Tarai has been cleared for crops, livestock,and human settlement. Landslides, erosion,and slope instability are common, particu-larly during the monsoon, exacerbated byvegetation loss, ill-managed water, and hap-hazard construction. As a result, hugeamounts of hillside topsoil are washed awayevery monsoon season. All these negativedevelopments, together with haphazardurbanisation and spreading transport links,have contributed to the overuse of thecountry’s limited agricultural land and, con-sequently, rural poverty. In addition, the dis-posal of solid wastes and increased fuel emis-sions has increased pollution, particularlyin the Kathmandu Valley, despite its limitedindustrial base.
205T H E E N V I R O N M E N T A L P E R S P E C T I V E
I N S U S T A I N A B L E H U M A N D E V E L O P M E N T
As people find it more and more difficult tomeet their basic resource needs in a sustain-able manner, especially in rural areas, theyput additional pressures on the natural re-source base, leading to further degradation.Given this intertwining of environmentaldegradation and poverty, sustainable use ofnatural resources is essential to poverty re-duction in Nepal.
Since the early 1980s, the government hasmade several efforts to integrate environmen-tal concerns into national development plansand programmes. An Environment ProtectionCouncil was established in 1993 and a sepa-rate ministry of population and environmentwas set up in 1995. In 2005 the Ministry wasdissolved and environment activities trans-ferred to the Ministry of Environment, Scienceand Technology. There has since been someprogress: the introduction of EIAs, the pro-mulgation of the Nepal Environmental Policyand Action Plan, the implementation of theEnvironment Protection Act and its Rules in1997, and the development of standards tominimise the adverse effects of developmentactivities on environment and health.
In addition, the government has committedNepal to Agenda 21 and to the MDGs, estab-lishing a National Commission for Sustain-able Development and developing new poli-cies and strategies. Among them: the Na-tional Wetland Policy, the Tarai Arc Land-scape Strategy, the Code of Conduct forBiodiversity, and the Action Plan for Herbs.The government has adopted the agenda ofsustainable development as its developmentstrategy. Despite these measures, progress inmainstreaming environmental consider-ations is limited and Nepal’s environmentremains fragile. Monitoring the enforcementof environmental laws, regulations, and stan-
dards is weak, environmental capacitiesthroughout the government and the privatesectors are low and public awareness is lim-ited. A lack of coordination also contributesto the fragmentation of data collection onareas vital to environmental planning andtherefore to development.
Development, from an environmental pointof view, must become distinctly rural andurban in its targeting. In the rural areas,where over 80% of the population live, theproblems are primarily the loss and degra-dation of renewable natural resources. Whilethese resources can be restored through con-servation – depending on the nature of theecosystem – that restoration often takes avery long time. By contrast, urban problemsarise from the pollution of air, water and landfrom industrialisation and the inadequate,often improper, disposal of wastes. Experi-ence from other cities around the world sug-gests that solutions need money, organiza-tion, environmental education and some de-gree of political will.
Land degradation in NepalLand degradation implies decline in produc-tive capacity of land due to processes inducedby natural and human activities. The prob-lems of land degradation in rural Nepal stemfrom both natural and human factors: aban-doned terracing, gullied soils, denuded up-lands with or without scrub or poor vegeta-tion, shifting cultivation areas, overgrazedpastures and meadowlands and degradedforest areas (Banskota 2002; Carson 1985;1992). According to one study, most of thedegradation is taking place in the rural areasof the middle mountains, the Class III landsthat are categorised as are “mostly steep” and“very steep” (LRMP 1986b). Most of these

206 R E A D I N G S I N H U M A N D E V E L O P M E N T
problems stem from continuing land hungerin a rapidly growing population that has fewalternatives. The person/land ratio in areassuitable to cultivation area increased from3.4 persons to 7.5 persons per square hectarebetween 1952/54 and 2001 – more than adoubling of pressures (CBS 2003b). Anothermajor factor is the removal of forest cover onsloping land and land in other categorieswith high rainfall rates, especially during themonsoon. Deforestation rates have grown toover 100,000 ha per annum in the country-side (CBS 2003b).
Deforestation in Nepal has continued notonly because of land clearance for agriculture,but also because of over-collection of firewoodand fodder, along with other NFTPs, cuttingtimber, uncontrolled grazing and inadequatecare in the implementation of developmentprojects such as roads, transmission lines,hydro-electric projects and other activities in-volving substantial construction (LRMP1986b; Mahat 1987). One early study main-tained that under traditional agriculture, 2.5ha of forest area (with good forest cover) wasnecessary to maintain 1982 yield levels of ev-ery hectare of agricultural land (Wyatt-Smith1982). This deforestation has significant ad-verse impacts on agriculture productivity –which influences food availability, nutritionlevels and, ultimately, livelihood conditions.
Soil erosion processes in the hill and moun-tain areas constitute yet another major factorin land degradation and also stem from bothnatural and human sources (Carson 1985).Natural erosion is high because of the frag-ile mountain environment with its high-in-tensity monsoon rains, mass wasting, rockfailures, landslides, and riverine cutting andgulling (LRMP 1986a). Man-made factors in-clude intensive farming with poor soil pro-
tection and improvement measures, over-grazing, forest fires and cultivation in highlyerosion-prone slopes, far more suitable to treecrops rather than other agricultural uses.Flooding and riverine cutting of flatlands arealso very common in low-lying areas in boththe hills and the plains, resulting in losses ofarable land. In the Tarai alone, more landhas probably been degraded by changingriver courses and flooding than the land lostin the hills through the combined effects ofsoil erosion and deforestation – a subject sofar inadequately examined. The critical roleof conservation in large parts of the Tarai isonly now being recognised, as the damageto Churia hills may well become an endlesscause of flooding and debris flow, seriouslyaffecting agricultural activities, settlementsand infrastructures in the plains and rap-idly growing urban areas near rivers.
Loss of biodiversityThe loss of biodiversity is yet another ma-jor – and worsening – environmental prob-lem correlated to rural land degradation. Be-cause of Nepal’s enormous variations in to-pography, climate conditions and geophysi-cal endowments, the country is relativelyrich in biodiversity: despite representingonly 0.1% of the global land surface, Nepalcontains 20.7% of the world’s floweringplants, 9.14% of its birds, 1% of its amphib-ians, 1.6% of its reptiles, 2.2% of its aquaticlife, 4.2% of its butterflies and 4.5% of itsmammals (MOFSC 2002). This diversity isdistributed in three horizontal East-Westecological belts of the country - the highmountains in the North, bounded by theChinese frontier, the middle hills south ofthe high mountains, and the Tarai plains inthe south (45.3%) bordering India and a partof the Indo-Gangetic plain.
207T H E E N V I R O N M E N T A L P E R S P E C T I V E
I N S U S T A I N A B L E H U M A N D E V E L O P M E N T
Within this broad physiography, 20% of thearea belongs to forests and about, 10.6% toshrubs; about 21% is cultivated and some18.3% has been set aside as National Parks,Wildlife Reserves and other conservation ar-eas. Nepal also contains 242 wetlands, dis-tributed in a different ecological belt, that sup-port rare and largely endangered wetland-dependent fauna and flora (CBS 2003b). Ofthe country’s 118 ecosystems, 80 are locatedin protected areas. Despite the efforts made toprotect this huge natural wealth, Nepal’sbiodiversity losses through deforestationalone threaten 2.8% of its reptiles, 2.3% of itsbirds, 3.8% of its mammals and 0.1% of inver-tebrates (CBS 2003b). The figures for floral di-versity are lacking and the problems cited herecould be even more serious, given the exten-sive destruction of ecosystems caused by ex-panding agricultural development, defores-tation, reckless harvesting practices and de-velopment interventions (MOFSC 2002). Un-like animals, plants are literally rooted in theirenvironments and therefore unable to fleethreats with relative rapidity.
Systematic documentation of this variety ofplants, insects, butterflies and other speciesis dangerously lacking in both environmen-tal and human development terms. Any dis-cussion of the land at the macro level masksthe extent of heterogeneity in Nepal’s eco-logical belts. Each belt, especially in the highmountains and the middle hills, is home tomyriad micro climatic zones and ecosystems,each with its unique resources, includingtheir interactions in environmental services.This land mass also benefits from a widevariety of relatively favourable climatic con-ditions – summer rainfall from the southwestmonsoon (small parts in the North are notinfluenced by these winds) and extensiveseasonal and temporal variations in rainfall,
temperatures, and humidity that signifi-cantly influence water flows, flora, faunaand, of course, human livelihoods.
Water shortages,floods and pollutionNepal has over 6,000 rivers with a combinedlength of almost 45,000 km, mostly fed bysnowmelt from the Himalayas. The countryalso has 660 lakes with an area of more than1 hectare (DHM 2001). The mean annual rain-fall is about 1700 mm, of which 75% fallsduring the monsoon.
Rainfall decreases as one moves from Eastto West. In 2001, 53.4% of the populationhad access to piped drinking water, 9.1%had access to a well and 28.6% usedtubewells (CBS 2003b). Little is knownabout the quality of this water or its distri-bution among different groups. Many settle-ments in the high mountains and middlehills now face freshwater shortages becauseof extensive ecosystem deterioration. Theuse of groundwater for drinking and otherpurposes has increased significantly overthe years; in areas like the Kathmandu Val-ley, water tables are declining fast (CBS2003b). Excessive pumping, deforestation,and the increase in built-up areas probablyplay significant roles in the low rechargeand declining levels of ground- water.
The quality of drinking water, both surfaceand groundwater, is deteriorating becauseof the direct discharge of domestic and in-dustrial wastes into rivers and improper usesand disposal of agro-chemicals. Only 40%of Nepalese households have access to sani-tation facilities. The Bagmati River inKathmandu Valley stands out glaringly inany serious consideration of the degradation

208 R E A D I N G S I N H U M A N D E V E L O P M E N T
of water bodies near large urban areas. InKathmandu Valley alone, 20,846 kg of do-mestic sewerage is discharged directly intothe river (Pradhan 1999; CBS 2003b). A newproblem of arsenic poisoning has become aserious issue in the Tarai, where arsenic lev-els are fairly high in those districts that useshallow tubewells (Pradhan, et al 2003).
Air qualityAir quality is also changing rapidly in partsof Nepal. In rural areas, the main problem isindoor air quality, pollution that arises fromthe burning firewood in improperly venti-lated rooms (CEN/ENPHO 2003). In urbanareas, overall air quality is beginning to de-teriorate because of vehicular emissions, in-dustrial exhausts, dust pollution arisingfrom the reckless and poorly managed con-struction of buildings and roads and theadulteration of fuel (IUCN 2004). For areaslike Kathmandu, reports have identified tem-perature inversion because of special physi-cal conditions limit the rapid dispersal of pol-lutants and particles (Tuladhar 2003). Thereis also increasing concern about Nepal’s con-tribution to various GHGs - which are rela-tively small, but nevertheless increasing.Another important issue is the identificationof the atmospheric brown cloud that hashovered over parts of Nepal and Asia and israising concerns about its long-term effectson people, the environment and the economy(UNEP 2002b).
Global warmingWhile Nepal is a small contributor to GHGsat present, the adverse impacts of globalwarming on the country’s environment andeconomy requires systematic analysis (IUCN2004). Receding glaciers, melting glacial
lakes, warmer days and changing weatherevents will have far- reaching effects on agri-culture, water supply and health. Just whatthese changes will be demands study so thatpossible responses can be carefully identi-fied. The government ratified the Kyoto Pro-tocol in 2005.
ENVIRONMENTAL PROBLEMSAND THEIR IMPACT ONHUMAN DEVELOPMENT IN NEPAL
How have the environmental changes dis-cussed above affected human conditions?What adjustments have been made? Cur-rent levels of understanding of the interac-tion between changing environment and hu-man conditions are still quite limited. If cer-tain impacts, such as changes in farmingpractices, have been looked into, others suchas the health effects have only recentlyaroused interest.
Poverty and livelihood impactsThe degradation of land, losses ofbiodiversity, increasing shortages of water,and extreme weather events have adverselyaffected rural household in fragile mountainenvironments, where the use of external in-puts in agriculture have so far been quite lim-ited (Jodha, et al 1992). The majority of thepeople still depend heavily on such commonproperty resources as forests, grasslands,water bodies and the species populations ofthe area. Mountain livelihoods are sup-ported by a complex set of linkages amongagriculture, livestock, forestry and water.Any disruptions in any single componentcould jeopardise the system’s equilibrium(Mahat 1987; Banskota 2002). The pace ofchange is now far more rapid than in the

209T H E E N V I R O N M E N T A L P E R S P E C T I V E
I N S U S T A I N A B L E H U M A N D E V E L O P M E N T
past; serious forest losses, with correspond-ing losses in biodiversity, as well as increas-ing external linkages, have severely dis-rupted traditional livelihood systems. In ar-eas that have improved access to markets,farming has taken a turn towards substan-tial increased dependence on external inputs(Banskota 2002). However, where such ac-cess remains difficult, hill and mountainpeople are sinking into deeper and deeperpoverty (Sarkar 1998).
A recent study in Nepal discussed some ofthe livelihood questions regarding commu-nity forestry user group (CFUG) householdsand drew the following conclusions.
Membership in local institutions other thanCFUGs is limited. CFUGs are a highly re-garded institution by more members and maybe the single most important institution forcommunity development. The majority ofCFUG households are very poor in assetownership. CFUG households have limitedaccess to group loan schemes and pay highinterest rate. Forest-based income generationactivities remain a relatively unexploited live-lihood strategy for most CFUG household.The typical CFUG household has very smallland holdings and is not able to meet its nor-mal food requirements though agriculture.Community forests play a vital role in sup-plying goods to CFUGs; however, the issueof the inequitable ratio of households to com-munity forest size should be addressed. De-spite some problems managing communityforest, the majority of users felt that forestconditions are improving and that manag-ing community forest is a worthwhile en-deavour (LFP 2003).
To sum up, additional inputs and resourcesare necessary if rural households are to over-
come their poverty (Banskota 2002). It is alsoevident that their environmental needs dif-fer; some need increased access to land, oth-ers to forests, some to irrigation and still oth-ers to more water (LFP 2003). In short, sus-taining livelihoods in these remote areasmeans sustaining ecosystems in their fulldiversity.
Disaster and displacement fromloss of access to natural resourcesExtreme weather events and other distur-bances in the environment displaced 41,000hill and mountain households in 2002 alone.Floods, fires, wind and hail storms, lightningbolts, earthquakes and, above all, landslidesresulted in the destruction of some 20,000homes over 10,000 ha, with comparable live-stock losses (CBS 2003b).
Land has been acquisitioned for varied de-velopment interventions – ranging from pro-tected areas to roads, hydroelectric projects,research stations and security outposts.While in some cases forest areas were cleared,in many others, existing settlements havebeen removed or traditional access rights cur-tailed. Households dependent on wetlandsresources in the Koshi Tappu area were dis-located after the land became an official Wild-life Reserve. Fishing, mat-weaving, and col-lection of wild vegetables and snails havedisrupted the livelihoods of some 3,600households among the Mallah, Mushahar,Satar, Mukhiya, Kumal and Tharus, al-though some official assistance measureswere implemented to assist these people(IUCN 2002). The issue here is not one ofdevelopment per se, but inadequate attentionto suitable alternatives for disadvantagedgroups who have been generally invisible topolicy-makers.

210 R E A D I N G S I N H U M A N D E V E L O P M E N T
Public health impactsWater pollution has become Nepal’s mostserious public health hazard. As indicatedabove, rivers that run through urban areashave become sewers for untreated house-hold wastes. Similarly, industrial effluentsare directly discharged into rivers by facto-ries that could have easily installed treat-ment facilities (MOPE 2000). Diarrhoeaamong children below five years of age isstill as high as 131 per thousand childrenand the mortality rate of this age group in2002 was 0.34 per 1000 (HMG/N/UNDP2002) simply because local streams areused by farmers for cleaning green veg-etables destined for market and childrenswim in these polluted waters during thehot summers.
Respiratory illnesses top the list of the fivemajor diseases reported by Kathmandu hos-pitals – probably because of prolonged ex-posure to smoke and dust particles – chil-dren and the elderly being the most vulner-able (CEN/ENPHO 2003). Kathmandu isnow said to be among the most pollutedworld capitals in terms of air quality, solidwastes and water supply. The quality of ed-ible food is also increasingly substandard -particularly milk, edible oils, and cerealgrains. In Kathmandu and other Nepalesecities, the past dangers of household wastesare now rivalled by a mixture of medical,industrial and discarded materials, some ofwhich need very careful handling proce-dures. Hazardous and obsolete pesticidescontinue to be a problem in some of the ar-eas, while dry cells and used batteries forelectric machines and cars are likely to poseincreasingly serious disposal problems.
Urban problems increasingly affect rural citi-zens because of increased commuting and
migration. If Nepal is to avoid a slow poi-soning of its ecosystems and ultimately itspeople, it must urgently undertake a mas-sive environmental clean-up.
ENVIRONMENTAL LAWS,POLICIES, PLANS ANDPROGRAMMES
Nepal’s early focus on the conservation offorests and its formulation of forest policiesbecame vastly expanded by the elaborationof the Nepal Conservation Strategy. TheEighth Plan (1992-1997) and the Ninth Plan(1998-2002) have both emphasised environ-mental considerations. The 1990 Constitu-tion also identifies the need to conserve andmake wise use of the country’s natural re-sources; provisions to this end must beadopted by two thirds of the Members ofParliament. New initiatives such as theNepal Environment Action Plan 1993, theSolid Waste Management Policy of 1996, theNepal Biodiversity Strategy of 2002, and theSustainable Development Agenda of 2003have been introduced. The PRSP and relatedprogrammes need further strengthening withregard to environmental and natural re-source concerns because of the evident envi-ronment-poverty nexus throughout the coun-try. Although the LSGA of 1999 includesmandatory provisions for integrating envi-ronmental concerns into local planning andimplementation, many anomalies demand re-moval for effective implementation.
Environmental impactassessmentsThe application of EIA, earlier a donor re-quirement, became a national requirementas well following the enforcement of the En-
211T H E E N V I R O N M E N T A L P E R S P E C T I V E
I N S U S T A I N A B L E H U M A N D E V E L O P M E N T
vironmental Protection Act (EPA 1996) andthe Environmental Protection Regulation(EPR 1997).
In many countries, scoping exercises arecarried out at the initial stage of the EIA pro-cess to determine whether or not the pro-posed project requires the application of EIAor Initial Environmental Examination. Thisis not practical in Nepal, as current scopingpractices do not allow for an adjustment oflocal conditions (a communication prob-lem), do not indicate the minimum contextsof a scoping report and do not have time-bound approval processes. All these needsadd to private sector costs. In addition,Nepal lacks sufficient trained staff for ef-fective EIA. Whether or not EIA recommen-dations are actually integrated into aproject remains unclear. Worse, if EIA rec-ommendations are not implemented, theentire exercise becomes largely useless(Khadka, et al 2000).
Controlling air pollutionThe government has taken many initiativesto control air pollution in the transport sector– the introduction of emission testing, the ban-ning of two-stroke motorcycle engines, theregulation of movements of heavy vehicles inthe urban areas of the Kathmandu valley, theintroduction of unleaded petrol and the pro-vision of tax relief for various types of envi-ronment-friendly measures. However, theconsumption of petrol and diesel continuesto grow rapidly, increasing the difficulties ofmeasuring the effects of different policy mea-sures on air quality, particularly in areas likeKathmandu valley (IUCN 2004).
Nonetheless, it is now clear that direct envi-ronmental measures, such as those related
to pollution control, must be supplementedby policies related to, among other things,energy use, banking loans for different con-sumer items, the regulation of older, highlypolluting vehicles, traffic management anda systematic handling of construction mate-rials. Better integration with other sectors isalso becoming critical to air pollution con-trol. At the same time, careful monitoring ofhealth impacts is also essential to betteringour understanding of effects and identifyingsocial costs within long-term human devel-opment policy.
Nepal’s MDG activities under Goal 7 areprotecting and maintaining biodiversity,maintaining forests and improving energyuse. The 2005 national report that tracksthese goals states that environmental goalsare likely/potentially achievable with fairsupportive environment.
Sustainable development and the attain-ment of MDG targets go hand in hand. “Theoverarching goal of sustainable develop-ment in Nepal is to expedite a process thatreduces poverty and provides to its citizensand successive generations not just the ba-sic means of livelihood, but also the broad-est of opportunities in the social, economic,political, cultural and ecological aspects oftheir lives” (HMG/N/NPC/UNDP/MOPE2003). It is a vision of the country until 2015and builds on past achievements and is inconformity with the major strategies of de-velopment such as PRSP, the Tenth Plan(NPC 2003) and the MDGs.
CONCLUSION
“When we are hungry we eat the elephantsWhen we are full, the elephants are beautiful”

212 R E A D I N G S I N H U M A N D E V E L O P M E N T
The main message of this old African prov-erb is straightforward in its emphasis onhuman needs. Its implications are notequally obvious. What happens if there areno more elephants? What will people eat?Human beings also must think about pre-serving the elephants at a certain level so asto meet their future needs. Further, is it safeto depend on elephants alone? In the longrun, there is a clear need for greater diversifi-cation so that problems created by changesin the availability of any resource are buf-feted by the availability and use of others.
Gandhi said the Earth had enough foreveryone’s needs – but not enough for ourgreed. Today, greed itself is considered agood and promoted through emphasis onhigh profits, an inequitable distribution ofresources and policy distortions that favourcertain activities and groups. The overallimpacts of these values are an excessive har-vesting of natural resources with consequentdamage of the environment. As Mahbub ulHaq argued, within the human developmentparadigm, all resources must be suitablypriced and policy distortions removed.
We still know relatively little about the envi-ronment. After UNCED in 1992, a significantincrease took place in international and na-tional prioritisation of environmental issues.That emphasis has conspicuously diminishedand, with it, international funding for researchas well as appropriate action. This is all themore unfortunate at a time when critical envi-ronmental issues face countries, regions andthe world as a whole. Better awareness andbetter education and training in environmentare urgently needed in both industrialised
and developing countries; new environmen-tal problems arise constantly and fewrecognise any political frontiers. A betteraware, more participatory, more educated, andskilled society – and one far less hungry – isultimately the best hope for working towardsgreater harmony between environmental con-ditions and the satisfaction of human needs.The implications for Nepal are obvious.
In Nepal, where the majority of householdslive in rural areas and directly depend on thein-situ natural resources for their livelihood,there can be no alternative but to improve boththe quantity and quality of the natural envi-ronment. In many areas community-basedconservation and development are restoringthe biodiversity and also benefiting the com-munity in many different ways. Just as beingtotally dependent on available natural re-sources is no longer viable for the rapidlygrowing population and alternatives must bepromoted in other sectors, it is also quite evi-dent that in the long run a degrading envi-ronment costs far more to the society than theone that is well managed. Striking the rightbalance raises many issues – economic politi-cal, institutional and ethical.
Nepal still has a long way to go in terms ofsuccessfully exploiting the full potentials ofits available natural resources. Many of thedevelopment activities can be productivelylinked with the development of its naturalresources potentials in forestry, water re-sources, ecotourism and high value commer-cial crops. Conservation of the environmentin Nepal must be an integral part of its over-all development strategy for development tobe sustainable.
213 E C O N O M I C P O L I C I E S, P O V E R T Y
A N D H U M A N D E V E L O P M E N T
INTRODUCTION
There is greater recognition now than everbefore of the need to place poverty reduc-tion at the centre of the development pro-cess. More than 50 years after its foundingin the wake of the Second World War, theUN convened the Millennium Summit in2000, when more than 160 countries pledgedthemselves to halving world poverty by2015. According to the Millennium Decla-ration, the world committed itself to “mak-ing the right to development a reality foreveryone and to freeing the entire humanrace from want”. Identifying the nature of aproblem is, surely, the first step in its reso-lution. In the meantime, a historic consen-sus to achieve the MDGs has also emergedwithin the donor community and global civilsociety actors.
Coming a decade after the first Human De-velopment Report, the MDGs outline an at-tempt by the UN to put forward a strategyfor the pursuit of human development. Theprocess of human development – increas-ing men’s, women’s and children’s controlover resources, strengthening their ability
to take decisions and exert basic authority overtheir lives – is also what the MDGs seek toachieve. Moreover, this expansion of people’schoices and freedoms in functioning is nowfirmly positioned as a contributory factor forthe realisation of human rights – thereby cap-turing a more matured and, in many ways,bolder understanding of human develop-ment in 2000 as compared to 1990. The im-perative of addressing poverty has beenmade a moral as well as legal responsibil-ity. At the international level, the eighthMDG aims to alter aid, trade, business anddebt-related policies in developed countriesthat now obstruct poverty reduction effortsin developing countries. At the nationallevel, the achievement of Goals 1-7 (see chap-ter 1) requires the intensive empowermentof poor people. While the MDGs do not pro-pose a blueprint strategy, their targeted ap-proach within a strict timeframe requiresthe pursuit of growth with equity and ofaction by states as well as markets to pro-mote both collective and individual free-doms – the same approach taken by coun-tries that have made substantial progressin reducing poverty and furthering humandevelopment so far.
CHAPTER 8
Economic policies, povertyand human development
Shizu Upadhya
214 R E A D I N G S I N H U M A N D E V E L O P M E N T
The years prior to economic reforms inNepal were marked by resource constraintsthat impeded investment in human capa-bilities and the pockets of moderate expan-sion in production and consumption since1990 did not significantly touch the vastmajority of the Nepali people. As the 10thFive Year Plan/PRSP reflects an alignmentwith the MDGs, poverty appears to havecome to the forefront of the planning processfar more than ever before. The statistics fromthe Rural Household Survey 2001 and theNLSS of 2003/04 point to a reduction in theproportion of people living below the pov-erty line since 1995/96. However, povertyincidence still remains high at 31 percent.Some analysts speculate that this reductionhas derived in large measure from the remit-tance economy. At the same time, recent hu-man development indicators confirm thathuman poverty and disempowerment re-main deep and unevenly distributed amonggroups of poor people.
A more widespread and sustainable enlarge-ment of human development in Nepal willrequire bringing to an end the violent aspectsof the present conflict. At the same time,policy-makers need to come to a consensuson a long-term programme of action for eco-nomic and social transformation based on acommitment to participatory and democraticgovernance. Specifically, this should entaila new design for macroeconomic policies sothat they better encourage both public andprivate investment alongside specific sectoralpolicies in industry, agriculture, infrastruc-ture and financial markets – and for the fur-ther generation of work opportunities. Aprogramme for land reform and well-de-signed targeted programmes in the supplyof essential goods and services for men andwomen who have been marginalised over
centuries will redistribute assets and in-comes to rural areas and thereby contributeto the enlargement of poor people’s economicand social capabilities – the purpose of de-velopment. In the present context, conflict-ridden areas will require additional relief.Against this backdrop, Nepal’s further en-gagement with global and regional marketswill improve the prospects for expandingpeople’s capabilities.
Though predictions hold that Nepal is un-likely to meet all of the targets of the MDGson schedule, this should not detract from themore immediate process of redefining thepurpose of national public policy, and de-signing and implementing a policy agendafor human development. In emphasising thesignificance of local poverty analysis andstrategising, the Millennium Declaration alsoacknowledges the political nature of deci-sion-making processes concerning resourcedistribution. Further, the human develop-ment perspective on poverty goes well be-yond traditional notions of inadequate in-come. Poverty is, in fact, the denial of oppor-tunities and choices most basic to humandevelopment. At the beginning of the newcentury, it is clear that removing poverty istherefore a much longer-term and complexenterprise than past propositions of simpleformulae have implied.
The task of expanding people’s choicesshould not be restricted to states or marketsalone, but must build on interactions betweenboth. Moreover, these interactions best con-tribute to poverty reduction when they areinformed and decided upon with the par-ticipation of a nation’s citizens. Not only doesthis build the public stake in difficult deci-sions about resource distribution that areinherently intertwined with poverty; it

215 E C O N O M I C P O L I C I E S, P O V E R T Y
A N D H U M A N D E V E L O P M E N T
also strengthens people’s sustainableagency in shaping both their own and theircommunity’s destiny – without which pov-erty cannot be reduced.
Human development indices do not yet fullycapture all the constitutive elements of hu-man development. This is further affirmedin the recognition of the reciprocal nature ofhuman rights and human development. Ac-cording to this concept, it is necessary to ex-pand people’s choices so that they can livelives of dignity as defined in the internationalhuman rights framework. At the same time,realising people’s civil and political as wellas economic, social and cultural rights is it-self necessary to expand human development.As such, the expansion of people’s freedoms,and the opportunity for open thought andaction that this allows becomes not just themeans, but also the end of public policy-mak-ing for human development. At the end ofthe Cold War and in the era of globalisation,it is clear that the sustainable protection ofindividual rights as well as social equity de-pends on new forms of capitalism rooted insystems of democracy – not democracies inthe sense of electoral politics alone that wesee today, but real democracies that ensureparticipation and inclusion. As an area ofsocial science enquiry, a deeper understand-ing of the complexity of the human develop-ment concept, including its perspective onpoverty, will require far more interdiscipli-nary analysis in addition to current eco-nomic and quantitative analysis.
From income to capabilitiesThe evolution of economic thought is theframework within which conceptualisationsand measures of poverty emerged. In eco-nomic terms, poverty came to focus on the
scarcity of the means of development, ratherthan the achievement of ends. The applica-tion of the poverty line, one of the most widelyused measures of poverty, exemplified thisapproach. It identified poverty with short-falls in household purchasing power andwas represented by the average amount ofincome necessary to purchase enough foodfor all members of an average sized house-hold to meet their average daily-recom-mended calorie requirements. Householdscame to be classified as poor or non-poordepending on whether their income was be-low or above the poverty line. To address theproblem of comparability, the World Bankintroduced an international poverty line ofone dollar-a-day (World Bank 2001). Basedon national poverty lines from a sample ofdeveloping countries, the international pov-erty lines assumed that after adjusting forthe cost of living, US$ 1 at PPP values – aconversion of the composition of the basketof goods to cost the same dollar amount indifferent countries – was the average mini-mum consumption required for daily sub-sistence in the developing world.
An expenditure measure such as $1 wasappealing, since it is a simple marker to sepa-rate the poor from non-poor, allowing anaggregation of the poor into a scaled mea-sure. But there are many limitations of thepoverty line and exclusive reliance on sucha narrow indicator is likely to lead to faultyunderstandings. As these arguments havebeen well documented elsewhere (e.g., UNDP1997) only five are recapitulated here:! First, the poverty line added up people
and households with diverse character-istics and heterogeneous environmentswithin which they made their living. Itrevealed nothing about the divergent ex-periences of poverty and hunger.

216 R E A D I N G S I N H U M A N D E V E L O P M E N T
! Second, it concentrated on purchasingpower rather than achieved consumption,which would depend on factors otherthan income, including the supply ofpublic goods and services and the guar-antee of human rights.
! Third, it was insensitive to changes in theabsolute levels of poverty, as well as tochanges in the distribution of poverty oneither side of the poverty line.
! Fourth, it measured only household in-come, ignoring intra-household welfareconsiderations.
! Fifth was the belief that whateverpeople’s needs were, they could be satis-fied through a sufficient level of purchas-ing power, drawing an inevitable line ofcausation from commodity consumptionto well-being.
Amartya Sen’s distinction between relativepoverty and absolute poverty laid part of thegroundwork for the later elucidation of hiscapabilities perspective on poverty (Sen 1983).This distinction emerged from the recognitionof the limitations of absolute definitions ofpoverty (the poverty line, for instance) in cap-turing the ability of a person to be a full par-ticipant in his or her community. This capa-bility required more than a command overcommodities; it called for some understand-ing of relative poverty: the things a person cando rather than what they have, depending onthe local context. The state of relative povertycould be captured, in turn, by an absolutevalue of capabilities, the sequence of things aperson is able to do and become. Income defi-nitely contributed to capability deprivation –but only as one of several factors. The notionof capability was later defined essentially asone of freedom, the range of economic, socialand political options a person has in decid-ing what kind of life to lead. It was through
the expansion of freedoms that lives became“richer and more unfettered” (Sen 2000).Within this perspective, poverty was a lack ofreal opportunity – created by social constraintsas well as personal circumstances - to chooseother ways to live. The capability understand-ing of poverty thus imparted considerablevalue to the freedom of choice or opportunity.
If we shift attention from means to the endspeople have reason to pursue, we see the cor-responding freedoms they require to be ableto satisfy those ends. This illuminates far bet-ter the nature of poverty and its causes. Un-like the abstraction of the income poverty line,the capabilities approach located poverty insocial and institutional environments. Giveneach person’s characteristics, social back-ground and economic circumstances – andthe prevailing legal context – each person haddifferent basis of claims (entitlements andendowments) on resources available in a so-ciety. These claims were often intangible –striving for autonomy, perhaps, or self-esteem.They were embedded within the social rela-tions and practices that govern possession,distribution and use in that society. Povertywould occur when the basis of household orindividual claims to the social product wasinadequate to covering basic needs. In mostinstances, this was caused by institutionalprocesses that had effectively disenfranchisedcertain groups from participating in decisionsabout the distribution of these claims. Thussocio-political factors that restricted people’saccess to resources influenced the extent towhich poor people were able to move out ofpoverty. By this understanding, the impor-tance of the supply of more goods, prime prod-ucts of an economic growth-oriented strategy,were not as important as the configuration ofentitlements that determined who gets to ownthese goods.

217 E C O N O M I C P O L I C I E S, P O V E R T Y
A N D H U M A N D E V E L O P M E N T
The acknowledgment of the inherent re-sources of poor people themselves – theiragency – was central to the freedom perspec-tive to development, as was the recognitionof the need to significantly complement poorpeople’s resources with what they lack. Thefreedom of people’s thoughts and actionswas considered not just the primary end ofdevelopment, but also one of its principalmeans. Development, therefore, not only ledpeople’s agency, but also demanded it. More-over, the different types of freedoms wereconsidered to be not just mutually reinforc-ing but also equally important. The freedomof exchange and transactions allowed for bymarkets, for instance, was as basic to socialliving as a person’s liberty to participate insocial choice and in making public decisionsto further pursue the progress of development.Since access to both economic and politicalopportunities and choices influenced whatpeople could positively achieve, poverty re-duction within this conception required theinterplay of states as well as markets, insti-tutional arrangements that themselves func-tioned most appropriately and sustainably
when open to the influence of the exercise ofpeople’s freedoms.
Human developmentWhen the UNDP’s human development per-spective defined poverty as the denial ofchoices and opportunities for a tolerable life,it sought to highlight those factors that re-strict poor people from improving their con-ditions. It examined different features of thequality of life, not just income, and assessedpolicies to the extent that they had fosteredtangible gains for poor people in the pur-suit of different options. The deprivationfocus of human poverty, which took as itsstarting point denial rather than achieve-ment, emphasised equity. Human depriva-tion was reduced to three key indicators:longevity, literacy and living standard toconstruct the Human Poverty Index for de-tailed explanation of concept and measure-ment of HPI, see chapter 2 (box 8.1).
UNDP itself acknowledged that the HPI didnot capture critical dimensions of human
Income Perspective. A person is poor if — and onlyif — his or her income falls below the defined povertyline. Many countries have adopted income povertylines to monitor progress in reducing poverty inci-dence. Often the cut-off poverty line is defined interms of having enough income for a specified amountof food.
Basic Needs Perspective. Poverty is deprivation ofmaterial requirements for a minimally acceptable ful-fillment of human needs, including food. This conceptof deprivation goes well beyond the lack of privateincome because it includes the need for basic health,education and essential services that the communitymust provide to prevent people from falling into pov-
erty. It also recognises the need for employment andparticipation.
Capability Poverty. Poverty represents the absenceof some basic capabilities to function — a person lack-ing the opportunity to achieve some minimally accept-able levels of these functionings. The functionings rel-evant to this analysis can vary from the physical (beingwell nourished, being adequately clothed and shelteredand avoiding preventable morbidity) to more complexsocial functionings, such as partaking in the life of thecommunity. The capability approach reconciles thenotions of absolute and relative poverty, since relativedeprivation in incomes and commodities can lead to anabsolute deprivation in minimum capabilities.
Source: UNDP 1997.
BOX 8.1 Three perspectives on poverty

218 R E A D I N G S I N H U M A N D E V E L O P M E N T
poverty, namely the lack of political freedom,the inability to participate in decision-mak-ing and the lack of personal security. In re-sponse, in Nepal, for instance, UNDP wenton to further widen the types of informationincluded in a poverty measure. The HEI mea-sures equity in the distribution of economic,social and political assets and capabilities(UNDP 2004b). Other indices that aim at bet-ter capturing all the dimensions of the hu-man development concept will surely ap-pear over time. The challenge of the furtherevolution of quantitative poverty measureswill be to recognise the inherent complexi-ties of the state of being poor, while remain-ing in basic ways usable and practical foractual assessment of living standards(Kanbur and Squire 1999). Moreover, socialscientists are now increasingly acceptingthe role of qualitative information to gain afuller understanding of the hardships ofpoverty. This trend is unlikely to subside inthe future.
Qualitative empirical approaches to measur-ing poverty increasingly involve asking howpoor people themselves describe poverty inwhatever dimension they choose (e.g., WorldBank 2001). According to many of these de-scriptions, poverty is not only the failure inability to command market-purchased goods;it is limited life expectancy, low literacy andpoor health, it is the regular encounter withlivelihood risks and income volatility andthe denial of opportunity for the exercise of“voice” and political rights. The gradualdeepening of understanding of poverty overtime, and its increased accuracy in measure,has gradually expanded notions of the verypurpose of economic development. It has alsowidened the options available in policy-making. When we compare HPI measureswith measures of per capita income, we are
comparing measures of relative and abso-lute poverty – and both are important. Thiscomparison reveals different ratings for dif-ferent countries, as there are multiple waysin which claims on resources may be dis-tributed contingent upon, but not onlyupon, a nation’s wealth. The core achieve-ment of successive HDRs, therefore, has beento alter the focus of poverty policies from anoverwhelming emphasis on increasing eco-nomic growth to addressing economic in-equity and social disempowerment as well.For these constitute more significant causesof poverty in many societies than purchas-ing power.
The equity concern of the human develop-ment paradigm clearly challenged the mar-ket efficiency foundations of neoclassicaleconomics. Not only does human develop-ment acknowledge the many forms thatmarkets and states can take; it alsorecognises the relative merits of both – whichare in fact wholly interdependent. The de-velopment experiences of the past haveshown that the relative contribution of do-mestic institutional arrangements differfrom one context to the next. Today, statesremain the institutions of greatest politicallegitimacy. That said, in an age ofglobalisation, states own and command farfewer resources than do markets. The even-tual selection of policy choices for economicdevelopment is, as it turns out, less a value-neutral, technical exercise than an outcomeof a nation’s political philosophy (Upadhya2000). Because of the potential contributionin this selection of open debate betweenstates, markets and citizens, the expansionof participatory and democratic politics hascome to be considered an inherent elementof human development and, indeed, effortsat poverty reduction.

219 E C O N O M I C P O L I C I E S, P O V E R T Y
A N D H U M A N D E V E L O P M E N T
INTERNATIONALPOVERTY STRATEGIES
Poverty todayPoverty trends over time are most correctlydiscerned by monitoring the progress of themultiple poverty measures that now exist.One of the great achievements of the 20thcentury that thus emerges is the dramaticreduction of income poverty. Income povertyhas fallen faster in the past 50 years than inthe previous 50 decades. And by the end ofthe 20th century, the number of people de-prived in other dimensions of life was re-duced to some 1-2 billion, from some 2-3 bil-lion three decades ago. For parts of the de-veloping world, the gains in recent decadeshave been unprecedented. Some of the morerecent poverty reduction has grown out ofincreased global economic integration, a pro-cess that gained momentum in the 1980s and1990s. During this time, total world incomemay well have increased by an average of2.5% annually (UNDP 2000). However, it ap-pears that progress in poverty reduction inthe latest 10 years has been slower than inthe 20-year period between 1970 and 1990(IFAD 2001). The number of people living inextreme poverty has also increased in thistime, by almost 100 million. The reasons forthis slowdown are attributed to the types ofeconomic policies that were pursued, by gov-ernments around the world, an issue dis-cussed in the next section of this chapter.
The proportion of people living on less than$1 a day at the global level has dropped fromnearly 30% in 1990 to 23% in 1999 (table 8.1).But with a growing world population, thenumber fell by just 123 million, a small frac-tion of the progress needed to eliminate pov-erty. And, excluding China, the number of
extremely poor people actually increased by28 million (in the 1990s China itself lifted 150million people, 12% of the population, out ofpoverty, thereby halving its incidence). Onlyin East Asia did the number of people in ex-treme poverty decline significantly during the1990s. In South Asia, the proportion of poorpeople has fallen, but the actual number ofpoor people has hardly changed at all. In otherregions, notably Sub-Saharan Africa and evenLatin America, the number of poor people rose.In Eastern Europe and the Commonwealth ofIndependent States (CIS) the number of poorpeople more than tripled – from 31 million toalmost 100 million (UNDP 2003). Applyingthe much broader perspective of human de-velopment than just a measure of income,some 54 countries had become poorer in 2003than they were in 1990, while life expectancyin 34 countries had fallen. Twenty one coun-tries were hungrier in 2003 than in 1990.
TABLE 8.1 Changes in the share andnumber of people living on $1 a day
Region Percentage Number (000)
1990 1999 1990 1999
Sub Saharan Africa 47.4 49.0 241 315
East Asiaand the Pacific 30.5 15.6 486 279
ExcludingChina South Asia 45.0 36.6 506 488
Latin Americaand Caribbean 11.0 11.1 48 57
Central andEastern Europe 6.8 20.3 31 97
Middle Eastand North Africa 2.1 2.2 5 6
Total 29.6 23.2 1,292 1,169
Excluding China 28.5 25.0 917 945
Source: UNDP 2003.

220 R E A D I N G S I N H U M A N D E V E L O P M E N T
Where the conditions for growth have ex-isted, the increased opportunities for tradehave allowed real GDPs and trade shares torise, increased per capita incomes and re-duced poverty in large parts of the develop-ing world. Per capita real GDP has been in-creasing in the world as a whole, as well asin developing countries on average (table8.2). However, their fare has been mixed. Theworld’s two biggest nations - India andChina, containing huge numbers of theworld’s poor - have accelerated their growthrates over the last two decades. Many of thepoorest countries in Africa have either stoodstill or experienced negative growth. RealGDP per capita in high trading developingcountries has over taken that in low tradingdeveloping countries. As a result, apolarisation process has taken place in thedeveloping world, whereby the shrinkingoverall proportions of the global poor areincreasingly found in some of its non-trad-ing parts. These countries show falling orstagnant real GDPs and trade shares, stag-nant per capita incomes and increasing pov-erty (Maajis 2003).
The outcome of globalisation therefore hasnot been predetermined; rather, it has de-pended on the policy options available togovernments, as well as those adopted byinternational institutions and the privatesector. Its outreach has indeed been inequi-table. The least developed countries, where10% of the world’s people live, have had ac-cess to only 0.3% of world trade (UNDP 1997).Tariffs remain high on goods with the great-est potential for the poorest countries, suchas textiles, leather and agricultural commodi-ties. Agriculture subsidisation in the richcountries has hit developing countries hard.It has kept world prices low, so these coun-tries receive little for their commodities. In
addition, foreign direct investment (FDI) – ofwhich 2/3 goes to only eight developingcountries – has bypassed more than half ofall the developing countries. Within coun-tries, too, the benefits of economic opennessand globalisation have been skewed, de-pending most of all on the extent to whichtrade has increased intra-country inequali-ties – between poor and rich, rural and ur-ban areas, women and men and among eth-nic groups.
The pursuit of growthThe limitations of the current global policyagenda hinge foremost on the fact that theyare still production-oriented strategiesbased on unrealistic assumptions of mar-ket functioning rather than policies for re-ducing poverty and expanding people’sopportunities and freedoms. This constraintdates back to the years when many formercolonies were becoming independent – thetwo decades after 1945 – when the formula-tion of public policy in such countries forthe first time became an issue for consider-ation. It was assumed that developing coun-tries would follow the same transitions pio-neered by the industrialised “first world”towards development. However, the relativeweakness of a national entrepreneurialclass in the “third world” was consideredto mean that the state should play a muchgreater role in promoting change, than thecase had been during earlier industrialisation.The American economist Walt Rostow in hisinfluential book “The Stages of EconomicGrowth: A Non Communist Manifesto”(1960) attempted to generalise “the sweepof modern economic history” in a linearset of stages of growth that emphasised in-vestment in particular sectors of theeconomy. The import substitution model,
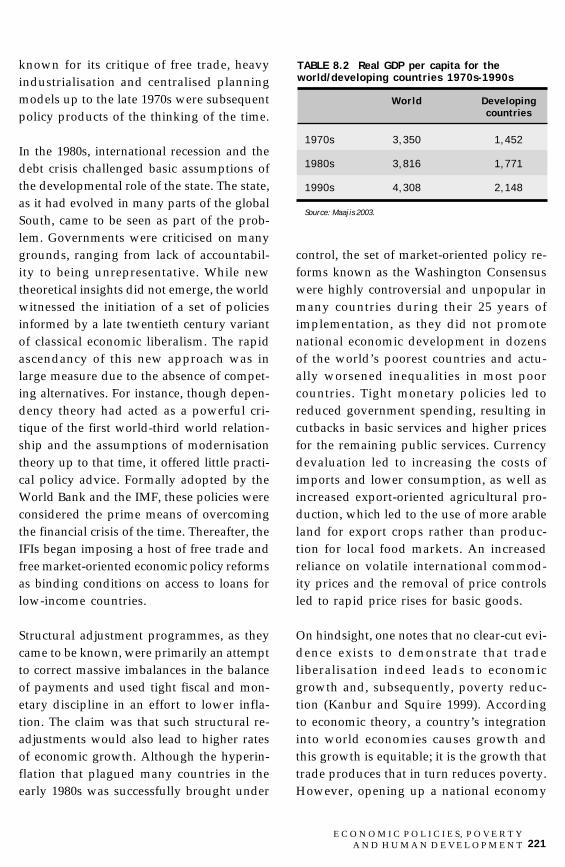
221 E C O N O M I C P O L I C I E S, P O V E R T Y
A N D H U M A N D E V E L O P M E N T
known for its critique of free trade, heavyindustrialisation and centralised planningmodels up to the late 1970s were subsequentpolicy products of the thinking of the time.
In the 1980s, international recession and thedebt crisis challenged basic assumptions ofthe developmental role of the state. The state,as it had evolved in many parts of the globalSouth, came to be seen as part of the prob-lem. Governments were criticised on manygrounds, ranging from lack of accountabil-ity to being unrepresentative. While newtheoretical insights did not emerge, the worldwitnessed the initiation of a set of policiesinformed by a late twentieth century variantof classical economic liberalism. The rapidascendancy of this new approach was inlarge measure due to the absence of compet-ing alternatives. For instance, though depen-dency theory had acted as a powerful cri-tique of the first world-third world relation-ship and the assumptions of modernisationtheory up to that time, it offered little practi-cal policy advice. Formally adopted by theWorld Bank and the IMF, these policies wereconsidered the prime means of overcomingthe financial crisis of the time. Thereafter, theIFIs began imposing a host of free trade andfree market-oriented economic policy reformsas binding conditions on access to loans forlow-income countries.
Structural adjustment programmes, as theycame to be known, were primarily an attemptto correct massive imbalances in the balanceof payments and used tight fiscal and mon-etary discipline in an effort to lower infla-tion. The claim was that such structural re-adjustments would also lead to higher ratesof economic growth. Although the hyperin-flation that plagued many countries in theearly 1980s was successfully brought under
control, the set of market-oriented policy re-forms known as the Washington Consensuswere highly controversial and unpopular inmany countries during their 25 years ofimplementation, as they did not promotenational economic development in dozensof the world’s poorest countries and actu-ally worsened inequalities in most poorcountries. Tight monetary policies led toreduced government spending, resulting incutbacks in basic services and higher pricesfor the remaining public services. Currencydevaluation led to increasing the costs ofimports and lower consumption, as well asincreased export-oriented agricultural pro-duction, which led to the use of more arableland for export crops rather than produc-tion for local food markets. An increasedreliance on volatile international commod-ity prices and the removal of price controlsled to rapid price rises for basic goods.
On hindsight, one notes that no clear-cut evi-dence exists to demonstrate that tradeliberalisation indeed leads to economicgrowth and, subsequently, poverty reduc-tion (Kanbur and Squire 1999). Accordingto economic theory, a country’s integrationinto world economies causes growth andthis growth is equitable; it is the growth thattrade produces that in turn reduces poverty.However, opening up a national economy
TABLE 8.2 Real GDP per capita for theworld/developing countries 1970s-1990s
World Developingcountries
1970s 3,350 1,452
1980s 3,816 1,771
1990s 4,308 2,148
Source: Maajis 2003.

222 R E A D I N G S I N H U M A N D E V E L O P M E N T
comes at a price, especially for countrieswith weak domestic markets, negligible sup-port for domestic producers and in which asignificant proportion of the population isengaged in subsistence production. More-over, SAP prescriptions for economicgrowth ignored the internal capacity-build-ing of domestic economies, which wouldhave been vital for equitable outcomes. Theovert reliance on exogenous factors, e.g., thedemand for exports, commodity terms oftrade and inflows of FDI paid inadequateattention to local endowments and internaleconomic capacities. For instance, SAPsinstitutionalised policies that shrank directgovernment responsibilities for a significantredistribution of assets and benefits. Publicsupport and subsidies were systematicallydemolished, and market-based price sys-tems were made the primary determinantsof allocation and distribution. Interestingly,as box 8.2 shows, SAP policies varied greatlyfrom the economic policies generally pur-sued by developed countries; the EuropeanUnion’s Common Agricultural Policy, totake one example, withstood the tradeliberalisation mandate of the general agree-ment on tariff and trade from 1948-1994 upto the establishment of world tradeorganisation (WTO) in 1995.
In the 1990s, World Bank Chief EconomistJoseph Stiglitz began to challenge the freemarket ideology that underpinned the Wash-ington Consensus of the prior two decadesand openly acknowledged the prevalence ofmarket imperfections, claiming that thesimple, competitive supply and demand eco-nomics that lay at its foundation was mis-guided. His comments generated a new in-terest among economists to revisit basic “ra-tional” economic theory (Stiglitz himselfwent on to win the Nobel Prize in Econom-
ics in 2001). At about the same time, studiesbegan to put forward empirical evidence ofthe damaging effects of pursuing liberalgrowth models in the global South. A 2001study by a think tank based in WashingtonDC, for instance, suggested that the 20-yearglobalisation era had brought about substan-tially less progress than that achieved dur-ing the two decades that had preceded it. Inparticular, over the 20 years of neoliberal re-forms, per capita output growth on averagehad been markedly lower than during theprevious 20 years (ActionAid USA/ActionAid Uganda 2004). In 2003, theUNDP Human Development Report calledfor a broader policy view than the pre-emi-nent focus on the acceleration of economicgrowth that had marked the 1990s. “Growthcan be ruthless or it can be poverty reducing –depending on its pattern, on structural as-pects of the economy and on public policies”,it said, and that this needed to be taken intoaccount in order to achieve the first MDG ofhalving 1990 rates of world poverty by 2015(UNDP 2003).
Poverty reduction strategy papersHaving borne witness to the unilateral dam-age in the livelihoods of hundreds of mil-lions of poor people in the North as well asSouth, the World Bank and IMF, both underpressure from global civil society actors andsome governments, promised in 1999 thatSAPs would no longer be a condition for theirlending to Southern countries. Instead, loancandidates would now have to submit PRSPsand plans for poverty reduction and growthfacilities (PRGFs), respectively.
The PRSP process had begun as a by-prod-uct of the international debt-relief programmedeveloped in the late 1990s, in which 42

223 E C O N O M I C P O L I C I E S, P O V E R T Y
A N D H U M A N D E V E L O P M E N T
heavily indebted poor countries couldqualify for partial debt cancellation, but wererequired first to show that they would usethe savings from foreign debt payments “re-sponsibly”. Poor countries hoping to obtaindebt-cancellation through the heavily in-debted poor countries programme were re-quired to produce a strategy paper describ-ing how the saved revenue would be directedtowards poverty-reducing goals. Later, thenumber of borrowing countries required toproduce PRSPs expanded well beyond thoseseeking the cancellation of foreign debt to in-clude those opting for all the lower-interestloans issued by the international develop-ment association (IDA) countries.
Most significantly, the IFIs stated that policyreforms would be opened to public consul-tations. At the same time, PRSPs were to beapproved by IFI boards based on countryjoint staff assessments and country policyand institutional awareness surveys, inwhich IFI staff would judge the credibility ofthe proposed frameworks. Several years
down the line, and many PRSPs on, it is nowclear that this basic contradiction betweennational ownership on the one hand, and,on the other, conditional approval in Wash-ington DC, lies at the heart of the PRSP/PRGFphenomenon. Moreover, the PRGF was origi-nally intended to allow for a new degree offiscal flexibility by presenting alternativepolicy scenarios for poverty reduction ineach country. These alternative macroeco-nomic scenarios – which contained termsthat markedly resembled the most controver-sial elements of earlier structural adjustmentloan conditionalities – would enable publicassessment of different policy choices andwould be the basis for PRSP financing frame-works. These frameworks would then beused for signalling needs and mobilisinghigher aid commitments from donors and thepoverty-reduction spending to be pro-grammed from the outset.
Since 1999, the new (theoretical) focus onpoverty has not actually changed the basic(practical) framework of the policy reforms.
IMF/WB loan conditionalities" Trade liberalisation
" Foreign investment liberalisation
" Privatisation of states companies/utilities
" Deregulation
" Tight fiscal and monetary policies
" Export-led growth model
" Primary goods production
Successfully developed countries" Trade protection
" Foreign investment regulation
" Public companies/utilities
" Regulation
" Keynesian fiscal/monetary policies
" Domestic investment and export-led growth
" Processing and industrial diversification
Source: ActionAid USA and ActionAid Uganda 2004.
BOX 8.2 A comparison of WB/IMF conditionalities under structural adjustment and policiespursued by the highly industrialised and industrialising countries (Japan, the EastAsian “tigers”, Western Europe, USA, Canada)
224 R E A D I N G S I N H U M A N D E V E L O P M E N T
Experience has shown that a number of sub-jects have not been opened for public con-sultation, among them:! industrial policy! trade protection! subsidy support to domestic industries! domestic investment! levels of deficit spending! price support! regulations on foreign investment! achieving lower interest rates and subsi-
dies credit for domestic industry! bolstering public health, education and
agricultural services
In the final “policy matrix” that is translatedinto a loan document for submission by theborrowing countries to the funders, there hasbeen a separation of the problem of poverty –on which there has been some consultation –and discussion on the nature of the growthprocess itself, which has not occurred(Chandrashekhar 2003). This has been reaf-firmed in the practice of aligning PRSPswithin the PRGF budget constraints set bythe IMF. Not surprisingly, a 2002 report bythe United Nations Conference on Trade andDevelopment noted that the IFI model forpoverty reduction strategies shows strongcontinuity with the structural reform andliberalisation agendas pursued for more than20 years.
The MDGsIn a context in which the IFIs still show re-luctance to cede control over the macroeco-nomic policies of borrowing countries, theUN adopted the MDGs (see chapter 1). Theirgreatest value, as indicated at the beginningof this chapter, is a focus on equity in na-tional and international economic policy sothat resources are generated for poverty-re-
ducing expenditures. Simple as the goals,targets and indicators may appear, they em-body a complex policy agenda. The hardchoices entailed therein require strong po-litical will inside countries and cooperationamong nations globally. In 1970, for in-stance, the world’s rich countries agreed toprovide 0.7% of their gross national incomefor development assistance. Only five coun-tries have met or surpassed the target – Den-mark, Luxembourg, the Netherlands, Nor-way and Sweden. The MDGs’ Goal 8 re-minds high-income countries of the need formeeting their commitments, so that the to-tal amount of aid annually increases sub-stantially in the remaining years until 2015.In 2002, the UN estimated that achievingthe MDGs would require an extra $50 bil-lion per year – the equivalent of doublingaid levels at the time. As the InternationalFund for Agricultural Development (IFAD)pointed out in 2001, if the trend of the de-clining donor support for agriculture con-tinues, it will severely damage efforts to re-duce poverty and hunger and achieve thefirst MDG goal (IFAD 2001).
Goal 8 targets aim at increasing developedcountry commitments to relax trade restric-tions to enable market access, especially fordeveloping country agricultural commodi-ties and labour-intensive manufactures,along with expanded provisions of debt re-lief and transfers of technology. The MDGsthus embody a new international economicparadigm. The perceived legitimacy of theUN certainly makes it the right proponent ofsuch a paradigm shift; some would arguethat this shift has been rather late in coming.Although envisaged as part of the same sys-tem of global governance as the IFIs at theend of the Second World War, the relation-ship between the UN and the IFIs institu-

225 E C O N O M I C P O L I C I E S, P O V E R T Y
A N D H U M A N D E V E L O P M E N T
tions has often been one of tension rather thancooperation. As the roles of the IMF, WTO andWorld Bank have expanded, the influence ofthe UN on economic and social issues hasdeclined. In part, this reflects the ability of richcountries to pursue their interests through theless democratic IFIs, which have voting sys-tems heavily weighted to favour the rich coun-tries. The relevance of the policy agenda ad-dressed by the MDGs is perhaps a first step inthe revival of the UN in the global debate oneconomic equity and poverty.
More can be done by strengthening the inter-national role of UN institutions such asUnited Nations Conference on Trade andDevelopment, UNDP and the ILO, particu-larly on matters related to economicglobalisation and poverty reduction. Muchwill also depend on the extent to which gov-ernments and citizens of the South utilise intheir favour existing policy-making fora,such as the regular meetings of the G-20, theG-24, the G-77, the UN General Assembly(including its High-Level Committee onSouth-South Cooperation), the World Bankand IMF, as well as ministerial meetings ofthe WTO.
The UN must also begin to put more pres-sure on the world’s rich and powerful na-tions to follow through on commitmentsmade, resolutions passed and decisionstaken. The current debate about the reform ofthe governance of the UN system will beginthe process of re-shaping the body as an in-stitution that works towards the ideas of uni-versality and global justice evoked by its 1945Charter. In the meantime, the UN needs topursue further the human rights agenda. Aseries of UN conferences during the 1990shave revived an existing body of interna-tional human rights legislation that now pro-vides a basis of accountability by states andmarkets to uphold people’s economic, socialand political rights (box 8.3). Particular em-phasis is given to the promotion of non-dis-crimination, the interests of disadvantagedgroups, participation, empowerment andgood governance. According to this frame-work, the realisation of human rights con-tributes to the poverty eradication agendaand is also its outcome (Sengupta 2001 andUNDP 2000). The Millennium Declaration,on which the MDGs are based, for example,commits governments to making the “rightto development” a reality for everyone.
The core human rights treaties as norms and stan-dards of human development are:
1. Universal Declaration of Human Rights (1948).
Articles 3-21 set forth civil and political rights.
Articles 22-27 set forth economic, social and cul-tural rights; Articles 28-30 recognise that every-one is entitled to a social and international orderin which these human rights may be fully realised.
2. Covenant on Civil and Political Rights (1966) witheffect from 1976.
BOX 8.3 Some highlights of the international human rights framework
3. Covenant on Economic, Social and Cultural Rights(1966) with effect from 1976.
4. Vienna DRD 1993.
Article 1: The right to development is an inalienablehuman right by virtue of which every human personand all peoples are entitled to participate in and con-tribute to and enjoy economic, social, cultural andpolitical development in which all human rights andfundamental freedoms can be fully realised.
Source: Sengupta 2001.

226 R E A D I N G S I N H U M A N D E V E L O P M E N T
The UN’s enunciation of the declaration onthe right to development (DRD) in 1996 af-firmed the right to development as a uni-versal and inalienable right and an integralpart of fundamental human rights. Adoptedalmost 38 years after the Universal Decla-ration of Human Rights, according towhich human rights constituted both civiland political rights and economic, socialand cultural rights, it was mooted from themid-1970s on. The consensus on the unityof civil and political rights and economicand social and cultural rights had brokendown in the 1950s; the spread of the ColdWar led to the promulgation of two sepa-rate covenants in the 1960s – one coveringthe civil and political rights (the so-called“negative rights” that imply governmentnon-interference in the lives of their citi-zens) and another covering economic, so-cial and cultural rights (the so-called “posi-tive rights” that entail the obligations ofgovernments to provide or ensure certainservices for their citizens).
The DRD’s reunification of economic withpolitical rights is both its value-added, aswell as the reason for the controversy thatstill surrounds it. During the Cold War, thepromotion of economic rights was consid-ered by USA and the western world as symp-toms of socialism. By contrast, the USSR andits allies did not consider the guarantee ofcivil and political rights the foremost obliga-tion of governments. Hence the adoption ofthe DRD only in 1993. The Declaration is nowjust a fairly generally worded statement ofintent that lacks the binding legal power of aConvention or Covenant – not unlike theUniversal Declaration of Human Rights in1948. However, backed with national-levellaws, it can open up new opportunities forthe global eradication of poverty.
DRD endows rights-holders seeking devel-opment with the basis for legal claims. Gov-ernments became duty-bearers mandated byinternational law to design their develop-ment policies so that they respect, protect andfulfil human rights. At the national level,DRD can induce an exploration of the justi-ciability and institutionalisation of economicand social rights. The 1996 Constitution ofSouth Africa, for instance, regarded as oneof the world’s most progressive, commits thestate to the progressive realisation of socio-economic rights, such as health, housing,social welfare and access to water (Allan2003). At the international level, DRD cantherefore be used by developing country gov-ernments to seek greater equity in decision-making in the international economy. DRDcan also serve as an international guide forthe provision and evaluation of official de-velopment assistance – for instance, in press-ing claims for debt relief and in transform-ing decision-making in the governance of theworld economy within WTO and the WorldBank and IMF, as well as within the UN. Formore than a decade, policy-makers in bothNorthern and Southern countries have beendiscussing the potential of better using theinternational human rights framework andin particular, the concept of economic rights,for human development and poverty reduc-tion; they will continue to do so. These areideas whose time has come.
States, markets and citizensAt the beginning of the 21st century, and morethan two hundred years after the beginningof Industrial Revolution in Western Europe,social and economic inequalities remain themajor concern of the countries of the South.With democratisation sweeping the world, forthe first time there is a semblance of the begin-

227 E C O N O M I C P O L I C I E S, P O V E R T Y
A N D H U M A N D E V E L O P M E N T
nings of a dialogue between North and South,between donor and borrowing countries andbetween governments and civil society. Policydebates about what worked, what wentwrong and why have become more open –one manifestation being the growing move-ment for more “fair” globalisation, whichsome consider the most significant social phe-nomenon in present times (Fukuda-Parr 2002).In this plethora of voices, one message comesout with stark clarity and it is difficult to re-fute: that the types of macroeconomic policiesimplemented in developing countries have,to a great extent, failed to increase per capitaincomes for all and have increased inequal-ity. This argument is particularly powerfulbecause it targets the very purpose of struc-tural adjustment programmes – economicgrowth – on the basis of which short-term in-stability and loss in people’s lives had beenjustified (Kanbur 2001).
Understandably, the world’s attention hasbeen shifting more and more to comprehend-ing successful experiences of poverty reduc-ing growth. Parts of East Asia, Singapore,for instance, and South Korea, recorded themost rapid poverty reduction in history, priorto global economic integration. China has ac-counted for three-quarters of all the peoplein the world lifted out of abject poverty in thelast 25 years (Watts 2004). What is signifi-cant is that the substantial part of povertyreduction in China had already taken placeby the mid 1980s – before more substantiallinks with foreign markets and capital wereestablished. Even thereafter, liberalisationdid not preclude strong support to small-scale agriculture pursued between 1978 and1985 (likewise in Malaysia since 1971 andin India during the early 1980s). Today,China is the largest recipient of FDI amongdeveloping countries while its public spend-
ing on health is 2.1% of GDP, as comparedwith India’s spending of 1.3% (UNDP 2003).As a whole, therefore, the East Asian experi-ence offers the world a lesson on using eco-nomics to reduce poverty through a power-ful alternative to the neo-liberal model of de-velopment. Many of these policies would to-day be deemed inconsistent with the stan-dard policy advice of the IMF and WorldBank and even with the conditions of theWTO. Importantly, too, most of the East Asianreforms occurred in one-party states.
The first round of human development in-dices that appeared in the early 1990s didnot include measures of political and civilfreedom. For example, the HPI index did notcapture specific dimensions of human pov-erty including the inability to participate indecision-making, the lack of personal secu-rity or the inability to participate in the lifeof a community (UNDP 1997). Muchprogress has been made in the interim. The2000 HDR reaffirmed the centrality of hu-man rights in attaining human develop-ment. Additional indices, such as the gen-der empowerment index and the HEI (thelatter was first introduced in the Nepal Hu-man Development Report 2004 now attemptto measure people’s political participation.The limitations of quantification techniques,however, have tended to allow policy-mak-ers to avoid posing hard questions aboutthe types of political system most condu-cive to human development. Some academ-ics have been more assertive in this respect.Amartya Sen, for instance, compares theexperiences of East Asia and India to drawsome conclusions on the political dimen-sions of human development.
On the one hand, South Korea and Chinahad created conditions of equity – through

228 R E A D I N G S I N H U M A N D E V E L O P M E N T
land reform, for instance – and the initiationof labour-intensive non-agricultural produc-tion, prior to more aggressive pursuit of eco-nomic growth thereafter. On the other hand,India had implemented much fewerequalising reforms at the onset of economicliberalisation in the early 1990s. As an out-come, India experienced a much slower de-cline in poverty alongside tradeliberalisation than did China. However,when more recent intra-country achieve-ments are taken into account, social indica-tors such as life expectancy in the southernstate of Kerala compare favourably withthose of China – and often outstrip the Chi-nese indicators. Sen credits such achieve-ments to India’s competitive, multi-partysystem of government. The opportunity todissent and defer, to determine who shouldgovern and on what principles, and to havean uncensored press that accompanies demo-cratic politics are all part and parcel of thosethings that people can positively achieve.According to Sen, “The real issues... involvetaking note of the extensive interconnectionsbetween political freedoms and the under-standing and fulfillment of economic needs.The connections are not only instrumental(political freedoms can have a major role inproviding incentives and information in thesolution of acute economic needs) but alsoconstructive. Our conceptualisation of eco-nomic needs depends crucially on open pub-lic debates and discussions, the guarantee-ing of which requires insistence on basicpolitical liberty and civil rights” (Sen 2000).
Analysis today concerning the MDGs islargely economic. According to some, the cur-rent rate of global economic growth is muchslower than that needed to achieve the firstGoal - halving the numbers in absolute pov-erty by 2015 - on schedule. The reasons for
this include the overall recession of worldmarkets in recent years and the continuedbarriers imposed by developed countries onlabour intensive exports in the form of exportquotas and enormous subsidies to domesticproducers, especially in agriculture and tex-tiles. FDI, too, remains largely concentratedin middle-income countries and donor coun-tries are not making available the amounts ofdevelopment assistance they have pledged.Current projections imply that Nepal, too, isunlikely to meet several MDGs targets, in partbecause of poor rates of economic growth lim-ited to urban areas, the poor implementationof public services and support mechanismsand low agricultural productivity.
Much less is being said about the politics ofMDG policy-making at both national andinternational levels. This concerns requiringaccountability from states and markets infurthering the global agenda for poverty re-duction and human development. Takinggreater account of the dynamics of the localpolitical constructs will play a part in deter-mining whether the MDGs are realised. Thistask would be most constructive were it torevisit the larger debate about capitalism andits alternatives - concepts that earlier think-ers grappled with – in the context of presentrealities.
POVERTY AND HUMANDEVELOPMENT IN NEPAL
Lives and livelihoodsFor hundreds of years until the mid-19th cen-tury, economic exchange in Nepal tookplace in subsistence terms, encompassingonly a severely restricted interaction at thelevel of the household and community for
229 E C O N O M I C P O L I C I E S, P O V E R T Y
A N D H U M A N D E V E L O P M E N T
commodities and services. A segregated so-ciety precluded the development of a moreextensive economic organisation and KingPrithvi Narayan Shah, Nepal’s founder,favoured domestic self reliance as an eco-nomic policy objective. Eventually, subse-quent rulers were more expansionist andensured that capitalist production modesbegan to take shape, imported from British-ruled India. Bartering slowly gave way to acentralised monetary economy controlled bylanded classes and caste groups. Commu-nity institutions that had evolved for themanagement of local public resources be-came disempowered, as such power was ac-quired by the state. Arable land remainedthe livelihood-sustaining asset for all andbecame the most valued form of property.Over time, land ownership solidified a newsocial and economic differentiation withinthe agrarian community, particularly be-tween indigenous and migrant Hindu com-munities (Caplan 2000). This differentia-tion perpetuated inequities in opportunityand achievement between poor and non-poor people and underlay perpetuated feu-dal relations of production between the dif-ferent caste and ethnic groups, as well asbetween women and men. These inequitieshave gone on to obstruct the gradualmodernisation of Nepal’s economy from im-proving the quality of life for all.
Planning processes specifically focused onimproving people’s standards of living be-gan only in 1950 after the fall of the Ranaregime. Alongside the first inputs of foreignassistance the mission for acquiring “devel-opment” started, first under a multi partysetup and after 1960 in the context of thePanchayat regime. However, available datadoes indicate slow progress in generatingeconomic dynamism. Growth rates hardly
exceeded 2.5% for much of the 1960s and1970s. GDP grew at an average rate of 5%during the 1980s, during which time agri-cultural performance also improved. On av-erage, however, agriculture, virtually the onlysource of income and employment for a grow-ing population, grew at an estimated 2.2%only from the 1970s onwards. The influenceof international trends led eventually to theformulation of the Basic Needs Plan in 1986.The reduction of poverty was made the primeobjective of the Ninth Plan and its successor,the ongoing Tenth Plan.
Poverty measuresJust prior to the start of the Sixth Plan, in1976/77, the National Planning Commissionconducted the first large-scale national sur-vey on employment, income distribution andconsumption patterns. Deriving a subsis-tence income level of Rs. 2 per person perday, the absolute number of poor people wasestimated at 37.2% in rural areas and muchlower, at 17%, in urban areas. The nationalaverage of poverty was estimated at 36.2% ofthe population. The next large-scale survey,a multipurpose household budget surveyconducted by the Nepal Rastra Bank during1984/85, followed a “basic needs” incomeapproach to estimate poverty incidence. Thisestimated that 43.1% of the rural populationand 19.2 % of the urban population, and42.55% of the total population, was poor. Thepoverty incidence was found to be highestin the rural hills (52.9%) and in the Tarai(35.4%), and much lower in urban Nepal.
The most recent data available derives fromthe NLSS conducted by CBS in 2003/04. Thefirst NLSS (table 8.3) uses a poverty line ofRs. 5,089 per person per year to establishthat 42% of the population (43% in rural
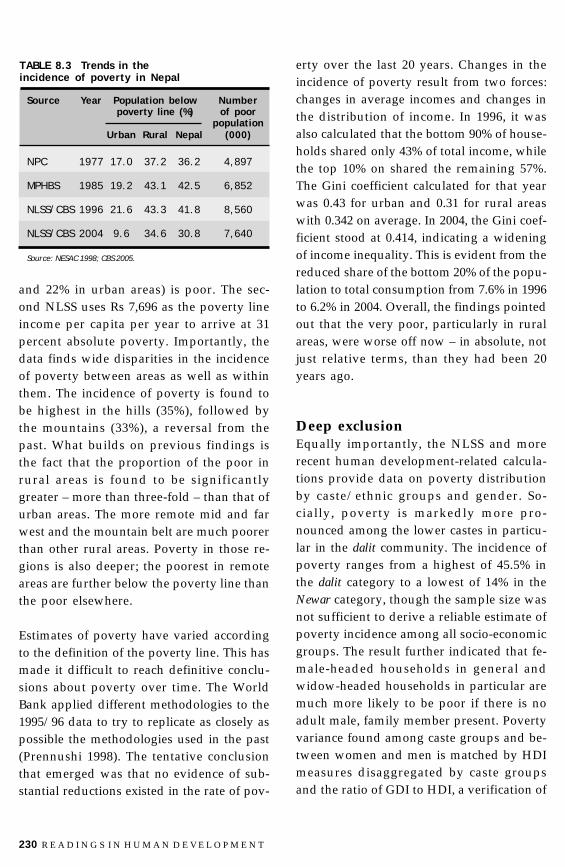
230 R E A D I N G S I N H U M A N D E V E L O P M E N T
and 22% in urban areas) is poor. The sec-ond NLSS uses Rs 7,696 as the poverty lineincome per capita per year to arrive at 31percent absolute poverty. Importantly, thedata finds wide disparities in the incidenceof poverty between areas as well as withinthem. The incidence of poverty is found tobe highest in the hills (35%), followed bythe mountains (33%), a reversal from thepast. What builds on previous findings isthe fact that the proportion of the poor inrural areas is found to be significantlygreater – more than three-fold – than that ofurban areas. The more remote mid and farwest and the mountain belt are much poorerthan other rural areas. Poverty in those re-gions is also deeper; the poorest in remoteareas are further below the poverty line thanthe poor elsewhere.
Estimates of poverty have varied accordingto the definition of the poverty line. This hasmade it difficult to reach definitive conclu-sions about poverty over time. The WorldBank applied different methodologies to the1995/96 data to try to replicate as closely aspossible the methodologies used in the past(Prennushi 1998). The tentative conclusionthat emerged was that no evidence of sub-stantial reductions existed in the rate of pov-
erty over the last 20 years. Changes in theincidence of poverty result from two forces:changes in average incomes and changes inthe distribution of income. In 1996, it wasalso calculated that the bottom 90% of house-holds shared only 43% of total income, whilethe top 10% on shared the remaining 57%.The Gini coefficient calculated for that yearwas 0.43 for urban and 0.31 for rural areaswith 0.342 on average. In 2004, the Gini coef-ficient stood at 0.414, indicating a wideningof income inequality. This is evident from thereduced share of the bottom 20% of the popu-lation to total consumption from 7.6% in 1996to 6.2% in 2004. Overall, the findings pointedout that the very poor, particularly in ruralareas, were worse off now – in absolute, notjust relative terms, than they had been 20years ago.
Deep exclusionEqually importantly, the NLSS and morerecent human development-related calcula-tions provide data on poverty distributionby caste/ethnic groups and gender. So-cially, poverty is markedly more pro-nounced among the lower castes in particu-lar in the dalit community. The incidence ofpoverty ranges from a highest of 45.5% inthe dalit category to a lowest of 14% in theNewar category, though the sample size wasnot sufficient to derive a reliable estimate ofpoverty incidence among all socio-economicgroups. The result further indicated that fe-male-headed households in general andwidow-headed households in particular aremuch more likely to be poor if there is noadult male, family member present. Povertyvariance found among caste groups and be-tween women and men is matched by HDImeasures disaggregated by caste groupsand the ratio of GDI to HDI, a verification of
TABLE 8.3 Trends in theincidence of poverty in Nepal
Source Year Population below Numberpoverty line (%) of poor
populationUrban Rural Nepal (000)
NPC 1977 17.0 37.2 36.2 4,897
MPHBS 1985 19.2 43.1 42.5 6,852
NLSS/CBS 1996 21.6 43.3 41.8 8,560
NLSS/CBS 2004 9.6 34.6 30.8 7,640
Source: NESAC 1998; CBS 2005.
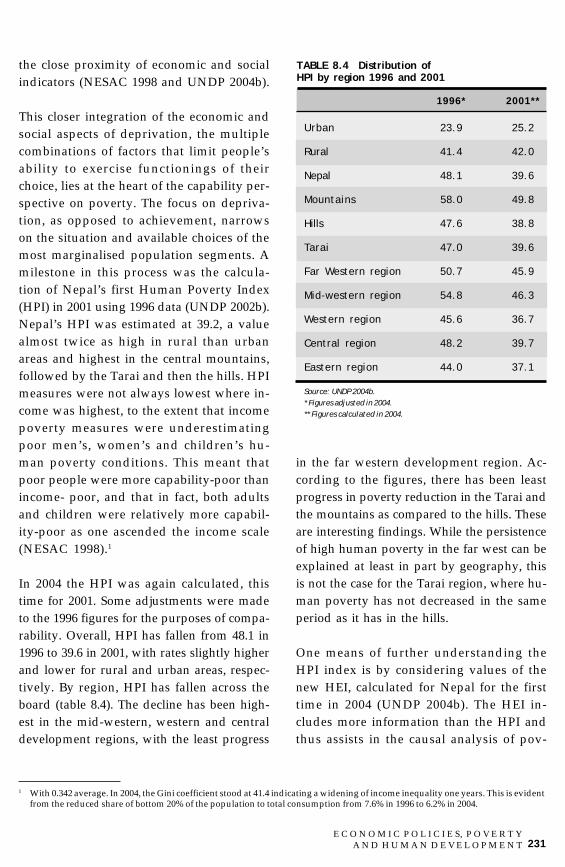
231 E C O N O M I C P O L I C I E S, P O V E R T Y
A N D H U M A N D E V E L O P M E N T
the close proximity of economic and socialindicators (NESAC 1998 and UNDP 2004b).
This closer integration of the economic andsocial aspects of deprivation, the multiplecombinations of factors that limit people’sability to exercise functionings of theirchoice, lies at the heart of the capability per-spective on poverty. The focus on depriva-tion, as opposed to achievement, narrowson the situation and available choices of themost marginalised population segments. Amilestone in this process was the calcula-tion of Nepal’s first Human Poverty Index(HPI) in 2001 using 1996 data (UNDP 2002b).Nepal’s HPI was estimated at 39.2, a valuealmost twice as high in rural than urbanareas and highest in the central mountains,followed by the Tarai and then the hills. HPImeasures were not always lowest where in-come was highest, to the extent that incomepoverty measures were underestimatingpoor men’s, women’s and children’s hu-man poverty conditions. This meant thatpoor people were more capability-poor thanincome- poor, and that in fact, both adultsand children were relatively more capabil-ity-poor as one ascended the income scale(NESAC 1998).1
In 2004 the HPI was again calculated, thistime for 2001. Some adjustments were madeto the 1996 figures for the purposes of compa-rability. Overall, HPI has fallen from 48.1 in1996 to 39.6 in 2001, with rates slightly higherand lower for rural and urban areas, respec-tively. By region, HPI has fallen across theboard (table 8.4). The decline has been high-est in the mid-western, western and centraldevelopment regions, with the least progress
in the far western development region. Ac-cording to the figures, there has been leastprogress in poverty reduction in the Tarai andthe mountains as compared to the hills. Theseare interesting findings. While the persistenceof high human poverty in the far west can beexplained at least in part by geography, thisis not the case for the Tarai region, where hu-man poverty has not decreased in the sameperiod as it has in the hills.
One means of further understanding theHPI index is by considering values of thenew HEI, calculated for Nepal for the firsttime in 2004 (UNDP 2004b). The HEI in-cludes more information than the HPI andthus assists in the causal analysis of pov-
TABLE 8.4 Distribution ofHPI by region 1996 and 2001
1996* 2001**
Urban 23.9 25.2
Rural 41.4 42.0
Nepal 48.1 39.6
Mountains 58.0 49.8
Hills 47.6 38.8
Tarai 47.0 39.6
Far Western region 50.7 45.9
Mid-western region 54.8 46.3
Western region 45.6 36.7
Central region 48.2 39.7
Eastern region 44.0 37.1
Source: UNDP 2004b.* Figures adjusted in 2004.** Figures calculated in 2004.
1 With 0.342 average. In 2004, the Gini coefficient stood at 41.4 indicating a widening of income inequality one years. This is evidentfrom the reduced share of bottom 20% of the population to total consumption from 7.6% in 1996 to 6.2% in 2004.

232 R E A D I N G S I N H U M A N D E V E L O P M E N T
erty. The HEI’s measure of economic em-powerment is defined as the extent to whichpeople have access to productive assets –including land, non-agricultural employ-ment and credit – to pursue economic capa-bilities. Compared to social and politicalempowerment, rates of economic empower-ment are lower, a reflection of the lack ofincome-earning opportunities, limited ac-cess to productive assets and lack of gain-ful employment in Nepal today. Moreover,rates of economic and social empowermentare closely related, indicating clearly thegender, caste, ethnic and religious dimen-sions of poverty. Further, levels of economicempowerment – more than social and po-litical – appear to affect levels of the HPI aswell as the HDI. It can be concluded, then,that persistently high rates of literacy, mal-nutrition among children, and low life ex-pectancy, per capita income and access tosafe drinking water are in large part the re-sult of people’s particularly low access toproduction and work opportunities.
Agricultural dependenceThe HEI measure of economic empowermentseeks to gauge the extent of poor people’saccess to livelihood opportunities. It mea-sures opportunities by region for non-agri-cultural wage employment, Gini correctedland size per household, access to credit, andper capita income. Considering each of thesecriteria in turn, it is not surprising that theeconomic empowerment index is lower thanthe others. According to the 2001 PopulationCensus, just 34% of Nepal’s labour force isemployed in non-agricultural work (CBS2003a). The proportion falls further in spe-cific geographical regions – in mountainousregions less than 20% of the labour force isengaged in economic activities outside thehome. By gender, 48% of normally economi-cally active women of 10 years and abovewere engaged in the agricultural sector in2001, which indicates a falling proportioncompared to 90.5% in 1991 (table 8.5). Theparallel proportion for men was 60.2% in2001 compared to 74.9% in 1991. A caste
TABLE 8.5 Economically active population of 10 years of age and over by major industry
1991 2001
Male Female Male Female% % % %
Agriculture, forestry and fishing 74.9 90.5 60.2 72.8
Manufacturing and mining 0.7 1.2 8.3 9.8
Electricity, gas and water supply 0.3 0.0 0.6 2.7
Construction 0.7 0.1 4.2 1.2
Concern 4.5 2.0 10.7 8.9
Transport, storage and communications 1.1 0.1 2.8 0.1
Financial and business service 0.4 0.1 1.2 0.3
Community and personal services 13.6 5.3 9.6 2.9
Others 1.8 0.7 2.4 1.3
Source: CBS 2003.

233 E C O N O M I C P O L I C I E S, P O V E R T Y
A N D H U M A N D E V E L O P M E N T
breakdown of these figures would probablythrow further light on other dimensions ofthis phenomenon. However, overall, theshift from agricultural to non-agriculturalemployment is pronounced. The latestNLSS data, for instance, indicate that theshare of non-agricultural wage employmentin overall wage employment across Nepalhas increased from 47% in 1995/96 to 63%in 2003/04.
Where close to 70% of the total workforcedepends on agricultural work, the signifi-cance of land access in enhancing people’shuman capabilities cannot be over-emphasised. According to latest figures, thelargest proportion of landowning house-holds in Nepal are marginal cultivators,with just over 27% operating land holdingsof between 0.0021 and 0.01 hectares (UNDP2004b). Further, given the proportions ofsmall cultivators (operating holdings of upto 0.2 ha) and the semi-landless (holdingsof less than 0.002 ha), an estimated 55% ofhouseholds in Nepal survive on land hold-ings of less than 0.02 ha. Data from the 1991Agricultural Census showed that an esti-mated 43% of landed households operatedless than 0.5 ha. It also found that the top10% of households owning three or moreha accounted for an estimated 42% of thetotal cultivated land in Nepal (Sharma2003a). According to the Agricultural Cen-sus of 2002, the top 5% of landed house-holds now own approximately 37% of totalland (UNDP 2004b). Detailed analysis oftrends in land distribution over time wouldbe necessary to make better sense of thesefigures. However, overall land distributiondoes not appear to have changed signifi-cantly during the last decade, and the aver-age size of already small landholdings ap-pears to have further diminished.
Evidence worldwide indicates a close corre-lation between the size of a holding and pov-erty. In 1996, the MIMAP research projectfound for Nepal a high poverty incidenceamong landless/marginal and small land-holders in Tarai, hill and mountain areas(table 8.6). The concentration of poverty washigher in landholdings below 0.5 ha as com-pared to those up to 1.0 ha. However, due tolow agricultural productivity overall, pov-erty was also found to be substantial amongmedium and large holders in the hills, moun-tains and, to a lesser extent, in the Tarai. Smallfarms were particularly disadvantaged intheir access to irrigation facilities; they also
TABLE 8.6 Poverty incidenceby farm size
Poverty incidence(%)
Mountains
Below 0.5 hectare 77.8
Between 0.5 - 1.0 hectare 67.3
Below 1.0 hectare 73.1
Above 1.0 hectare 39.7
Hills
Below 0.5 hectare 70.3
Between 0.5 - 1.0 hectare 64.3
Below 1.0 hectare 67.5
Above 1.0 hectare 51.0
Tarai
Below 0.5 hectare 39.7
Between 0.5 - 1.0 hectare 32.3
Below 1.0 hectare 37.6
Above 1.0 hectare 23.6
Source: Sharma and Chhetry 1997.

234 R E A D I N G S I N H U M A N D E V E L O P M E N T
tended to use fewer purchased inputs andcultivate more traditional cereal crops ascompared with large farms. Further, farm sizewas positively related to reliance on institu-tional credit, as well as access to service sec-tor income-earning opportunities. Since theincidence of female-owned land holdingswas found to be higher among small farmsbelow one ha, and the average size of femalelandholders was found to be slightly loweroverall compared to that of men, MIMAP pin-pointed an additional constraint, on aver-age, of women in acquiring returns fromsmall holdings. Finally, certain caste and eth-nic groups were found particularly prone tolandlessness. Most recent data show that, onaverage, approximately 24% of the totalpopulation is landless (UNDP 2004b). Thisfigure rises to almost 44% with regard to thetotal Tarai dalit population. Additionally,landlessness in Nepal appears to have in-creased over time (SAAPE 2003).
According to the HEI, the other two indica-tors of economic empowerment are accessto institutional credit and per capita in-come. The latest figures indicate that justunder 20% of households across Nepalhave access to credit from formal sources.This proportion is lower in the mountainregions (about 14%) and the hills (just under15%). In rural areas overall, an estimated23.5% of households have access to formalcredit. The proportion of credit accessed byfemale-headed households depends onwhether or not the holding is landed. Land-less holdings are clearly disadvantaged inacquiring formal credit, an estimated 86% ofwhich currently requires collateral based onland or other forms of property (UNDP 2004b).Access to sources of per capita income, theother indicator, is related in part to access toland, and the size of land holding as far as it
affects rates of agricultural productivity andaccess to credit.
There are other reasons as well for inefficientproduction in Nepal’s agricultural sector,whose growth rate has ranged around 3% inrecent years. These include weak physicalinfrastructure reaching out to remote and out-lying areas, lack of storage facilities, weak andfragmented output markets, the poor outreachof irrigation facilities and low utilisation offertilizer. The commercial production of fruitand vegetables is hampered by poor knowl-edge and lack of roads in the hills. The avail-ability of cheap imports in the plains, includ-ing rice, has reduced the profitability of do-mestic food product, while consumers in re-mote parts of the country face exceedingly highprices for particular food products. Indeed,food shortage is a daily experience and anadditional dimension of poverty not easilycaptured by income-based indicators. It is es-timated that 62% of Nepal’s districts have of-ficially food deficits, it size being highest inthe mountain regions (Sharma 2003a). In thecurrent context, there is little doubt of the posi-tive role of land reforms of some sort in reduc-ing poverty. However, the other causes of pooragricultural productivity, the specific needsof female-headed households and the needsof the landless – including women who gen-erally are forbidden to own land – will alsoneed to be addressed.
The multi-dimensionalnature of povertyThe HEI takes a leap forward in capturingthe many dimensions of poverty, which per-mits deeper causal analysis of poverty pro-cesses. The experience of deprivation –poverty’s essence – also emerges strongly inqualitative assessments carried out with

235 E C O N O M I C P O L I C I E S, P O V E R T Y
A N D H U M A N D E V E L O P M E N T
small farmers, poor and low-caste women,sharecroppers, landless tenants and for-merly bonded labourers (e.g., Poudel andNiraula, 1998 in box 8.4). The severity of pov-erty, sustained over several years – often fromone generation to another – comes acrossstarkly, adding an important temporal per-spective pinpointing the need to perceivepoverty not as an isolated phenomenon, butas a product of the historical evolution of re-lations between the individual, her commu-
nity and society. The capability to access theresources required to pull oneself out of pov-erty, temporarily or permanently, is con-strained by multiple factors.
Under such circumstances, poverty is notmerely the failure to possess the commodi-ties required for survival, but a failure of en-titlements, and in particular, endowments,over time. Inadequate income is an impor-tant causal factor, as is insufficient access to
Physical/social weakness" Forefather’s loan/debt burden
" Large family size
" Expensive social practices
" Lack of risk-bearing capacity
" Lack of access to institutional credit
Powerlessness" Inability to cope with exploitation
" Lack of legal rights and provisions
" Lack of political representation or access to it
" Hesitation in arguing for conflict andcomplications
" Lack of association
" Feelings of social inferiority
Isolation" Uninformed
" Lack of education
" Undeveloped creativity/skills
" Lack of access to services and information
" No alternative employment opportunities
Vulnerability" Danger of becoming poorer and more
deprived
" Forced to work hard
" Forced to negotiate as bonded labour
" Trading of Kamaiyas
" Difficulties in changing one’s presentconditions
BOX 8.4 Deprivation trap of the Kamaiya
Poverty" Lack of income, wealth
" Own land and housing
" Precarious economic condition
" Economic insecurity, often seasonal
Source: Poudel and Niraula 1998.

236 R E A D I N G S I N H U M A N D E V E L O P M E N T
physical and financial assets, vulnerabilitycaused by short-term shocks, deep indebted-ness and a denial of information, public ser-vices, social security and political represen-tation. The distribution of resources and op-portunities and indeed, feelings of dignityand confidence in expressing one’s beliefsand opinions, are determined by institutionalarrangements established a long time ago forthe benefit of the few, and sustained by cur-rent practices and their prevalence. The depthof dependence incurred by poor people wasmanifested, among other conditions, in therelations of bondage between high-castelandlords and Tharu workers under theKamaiya system prevalent in the far westernTarai until mid 2000. Qualitative povertyanalysis can help to reveal this multitude ofoverlapping factors that cause and resultfrom poverty experiences and should be con-sidered alongside poverty statistics such asthose revealed by the Living Standards Sur-vey exercises.
Such analysis also highlights the lack ofstate support received by poor people. Apartfrom land, disadvantaged caste groups havedifficulties in accessing services like healthcase, education, electricity and loans. In1998, the Nepalese Nepal Human Develop-ment Report estimated that dalit and disad-vantaged ethnic groups lagged behind oth-ers in access to education; only 30% of theirchildren attended school as compared to thenational figure of 66%. The Nepal HumanDevelopment Report of 2004 adds that in1996, immunisation coverage for dalit chil-dren was 20% lower than the national av-erage. Also, differences in literacy rates, edu-cation and opportunity to develop talents,nutrition levels, and health and survivalrates persist between the women and menof Nepal. Manifestations of women’s addi-
tional vulnerabilities experienced inside thehousehold – thus, not immediately appar-ent, difficult to quantify and probably stillvery much underestimated – include theirunequal access to resources and incomeflows, greater exposure to HIV infection andhigher susceptibility to physical and psy-chological abuse. Thus largely disconnectedfrom the state, the fundamental inability ofpoor men, women and children to exercisetheir inherent agency, the intent and capacityto act, stands out all the more. Living in eco-nomic and social hardship and in the pastdecade increasingly fearful for their very lives,poor people constantly deploy a number ofstrategies to protect their levels of consump-tion from deteriorating. Only by understand-ing these poverty dynamics, can policy-mak-ers increase their ability to achieve their pov-erty objectives (Parasuraman, Gomathy, Rajand Fernandez 2003).
ECONOMIC POLICIESAND POVERTY IN NEPAL
Poverty policies prior to 1990Planned development first began in 1950with the First Five Year Plan. Developmentexpenditure during the plan period was en-tirely financed by foreign assistance, thoughthis ratio declined somewhat in successiveplans. Planners initially emphasised find-ing economic and administrative structuresand policies to deliver goods and services tocitizens. The approach was technocratic andcentralised, strongly influenced by globaltrends in growth theory because of depen-dency on foreign assistance (NESAC 1998).In addition to an attempt at land reform inthe 1960s, the government initiated somesubsidisation programmes for education,

237 E C O N O M I C P O L I C I E S, P O V E R T Y
A N D H U M A N D E V E L O P M E N T
kerosene and food supplies, along with credittargeted at those households that did nothave land or that lacked savings. The 1980swere characterised by the adoption of a se-ries of Integrated Rural DevelopmentProgrammes that focused on regional pov-erty. In 1986, again influenced by the inter-national policy agenda, the governmentadopted the Basic Needs Plan in the contextof the Seventh Five Year Plan (1985-1990).
Much has been written about the outcomesof the early policy years. Land reform remainsan unfinished agenda. The performance ofthe targeted credit programmes during thistime (box 8.5) is perhaps representative ofthe overall trend. Most programmes were ef-fective to an extent. However, from the stand-point of sustainability, they suffered from avariety of problems including the high costof service delivery, low rate of loan recovery,
Name Starting year Donors Objectives and activities RemarksSmall Farmers’ 1975/76 FAO, Small farmers (farmers with Weak targeting andDevelopment GTZ small holdings, landless labourers, small coverage.
IFAD, tenants, sharecroppers, cottage Programme Collateral-UNICEF industry, artisans etc.) are based recovery rateUNFPA organised into groups and credit low (up to 60%) andADB, NRB and other support services high overhead costs.
provided, including family Problem of staffwelfare and environmental motivation andprotection activities. efficiency.
Production 1982 IFAD/ADB/N Delivery of Intensive Banking Very high overheadCredit for UNICEF/SNV Programme credit to rural costs in creditRural Women Peace Corps. women by forming women’s delivery alone,
groups. Other assistance also low coverage, staffprovided to help save labour problems, problemsand time through access to of marketingwater, child care centres, technology and rawhealth/ nutrition, family materials not resolvedplanning and improved stoves recovery rate aboveas well as environmental 80% yet deliveryprotection. cost very high (42%).
Intensive 1974 as Small NB Ltd. Provide credit to those low- Spread over 74Banking Sector Credit, RBB and income families that could not districts and aboutProgramme 1976 as Priority Nabil Bank afford collateral, on project 340 bank branches(IBP) Sector Credit viability and group guarantee. but coverage (benefi-
and ciaries) still small and1981 as IBP targeting weak, reco-
very rate of only 44%.
Regional 1982 HMG/N, NRB A prototype of the Grameen Well-targeted and 100%Rural Banks and other Bikas Bank of Bangladesh for recovery. Butfor the Poor or financial assisting the poorest women overhead costs in theGrameen Bikas institutions living in rural areas through initial few years veryBank (GBB) credit provision on group high. As yet, mostly
guarantee. Tarai villages covered.
Source: Gurugharana 1998.
BOX 8.5 Targeted credit programmes in Nepal

238 R E A D I N G S I N H U M A N D E V E L O P M E N T
high dependence on foreign resources forcontinuity and inadequate commitment ofthe concerned institutions (Khatiwada 2003).To this day, informal credit continues to beused by as much as 80% of rural borrowinghouseholds, with only 20% accessing creditfrom financial institutions. Further, of this20%, most also resort to informal sources offinancing. The distribution of formal sectorcredit remains unequal, as it benefits only9% of landless households as compared to38% of large farm households accessing thisfacility. Despite efforts to target asset-poorwomen during this time, they largely remaindeprived of institutional credit today.
Economic reformsA combination of high-cost investment andpoor economic performance increased fis-cal deficits to unsustainable levels. Persis-tently deteriorating internal and externalbalances led to the adoption of a stabiliza-tion programme in 1985, accompanied byan 18-month stand-by agreement with theIMF, promoted serious consideration of part-nerships with the private sector for the firsttime. Eventually, Nepal entered into a struc-tural adjustment programme in 1987/88supported by the IMF and World Bank –one of the first countries in South Asia toreceive a SAP loan. Independent analystshesitant to determine to what extent the gov-ernment voluntarily accepted the packagesor whether they were imposed e.g. (Sharma2003b and Deraniyagala 2003). During1993-95, Nepal took on an enhanced struc-tural adjustment facility. Economic reformsaccelerated after 1990 and have since cov-ered almost all sectors, including fiscal andmonetary policies, trade policies, as well asindustrial, investment, foreign exchange andfinancial policy reform.
Overall, these reforms aimed at stabilisingthe economy, reorienting production struc-tures towards the market, creating the cor-rect incentives for private sector involvementin economic activity, limiting state involve-ment in the economy and, generally, increas-ing openness. In the financial sector reforms,conditions for industrial investment wereconsiderably liberalised for both domesticand foreign capital. NGOs and cooperatives,too, were allowed to undertake banking ac-tivities, albeit within limits. Agricultural in-puts and fertilizer distribution were partiallyprivatised and the distribution of agriculturalproducts was opened up to the private sec-tor. Licensing procedures, too, were stream-lined, fiscal incentives and other facilitiesprovided, and a liberal industrial policyadopted. The social and infrastructure sec-tors were also opened to private and foreigninvestment and the privatisation of state-owned enterprises initiated. Strengthenedfiscal management entailed downsizing thegovernment and expanding and strengthen-ing public resource management. A Value-Added Tax replaced the domestic sales taxand a new Income Tax was introduced. In-terest rates were liberalised.
External sector liberalisation, perhaps themost far-reaching part of the reform process,introduced full convertibility of the rupee onthe current account by early 1993, the re-moval of quantitative controls on imports anda drastic downward revision of tariff rates.These reforms purportedly ensured easy ac-cess for the import of industrial raw materi-als and machinery and the repatriation ofinvestment proceeds from foreign investment.Average tariffs declined to 6% in 1995 frommore than 15% in 1987/88. Tariff and salestaxes on imports diminished substantiallyand additional taxes on imports were with-

239 E C O N O M I C P O L I C I E S, P O V E R T Y
A N D H U M A N D E V E L O P M E N T
drawn. With the gradual depreciation of theIndian currency against the American dol-lar, the Nepali rupee depreciated against thedollar by 40% on average in the late 1980s,47% during 1991-95 and by 27% in the late1990s. With regard to foreign investment,the government waived license require-ments for imports and exports on all goodsexcept those related to defence, publichealth and the environment, liberalised in-terest rates and simplified customs duties.In FDI, licensing requirements were abol-ished for industrial investment, and the in-frastructure, education and health sectorswere opened to private investment. A “one-window” investment facility was intro-duced for foreign investors for the registra-tion, operation of duty drawback facilitiesand repatriation of investment income.
The emphasis of the SAP model on contain-ing public expenditure to attain low infla-tion and encourage private investment iswell known the world over. During the pe-riod of the SAP, public expenditure, 18% ofGDP, remained below the internationalnorm of 25% throughout the 1990s. How-ever, the fiscal ceiling set by enhanced struc-tural adjustment facility resulted in a re-structuring of public expenditure in threemain respects (table 8.7).
An assessment of reformsDuring this time, Nepal has achieved broadmacroeconomic stability overall, with stable –though not high – economic growth ratesaveraging 4.8% (per capita growth of 2.5%)per annum during 1996-2001. 2002 was anexceptional year, when GDP recorded a nega-tive growth rate of 0.6% largely because ofthe Maoist insurgency. In 2003 GDP againgrew at 2.6%. One factor underlying growth
has been the structural change that has oc-curred in the economy since 1984/85. Theshare of agriculture in GDP has come downby more than 10 percentage points in 10 years,though it remains significant at around 40%.Production is increasingly becoming commer-cial and units of production in the manufac-turing sector are shifting from homes to facto-ries. The proportion of the urban populationhas increased. However, the changed eco-nomic structure has had a much smaller ef-fect on the structure of employment. In 1995/96, 86.1% of the employed population (78.9%of employed men and 93.7% of employedwomen) still engaged in agriculture. Al-though more recent data from 2001 indicatea further shift of the labour force to the non-agricultural sector, agriculture remains offoremost importance for rural livelihoods.Yet agricultural growth has been very slow,only 2.2 % on average per annum during thepast three decades – lower than the rate ofpopulation growth during this time. In re-cent years (2001-05), agriculture has grownby average (table 8.8); but this has more to dowith smoother monsoon than with reforms.
Nepal’s production structure shows thatunless economic growth results in increasesin incomes and productivity in agriculture,it will not reduce poverty. Expanding workopportunities in the formal non-agriculturalsector is important as is improving the con-ditions of work in the large informal sector.Neither has occurred so far. It is, thereforenot surprising that calculations of the im-pact on poverty reduction of each percent-age change of growth in the post-reformsperiod confirm that economic growth wasonly moderately pro-poor during the reformperiod, its benefits limited to the small for-mal sector and parts of the urban, businessand industrial communities (UNDP 2002b).

240 R E A D I N G S I N H U M A N D E V E L O P M E N T
TABLE 8.7 Sectoral classification of government expenditure (growth in %)
Heading/fiscal year Nominal growth rate Real growth rate (at 1990 prices)
1991-1995 1996-2000 1991-2000 1991-1995 1996-2000 1991-2000
General services 17.0 13.4 15.2 5.7 6.5 6.1
Of which: police 19.8 15.6 17.7 8.3 8.6 8.4
Social services 19.7 14.4 17.1 8.0 7.6 7.8
Education 23.8 13.3 18.6 11.8 6.6 9.2
Health 18.2 19.6 18.9 6.8 12.6 9.7
Drinking water 26.7 17.3 22.0 12.5 10.4 11.4
Local development 49.9 12.0 31.0 36.5 5.2 20.8
Other social services -7.2 24.5 8.6 -15.9 17.3 0.7
Economic services 2 11.7 8.5 10.1 1.3 2.0 1.6
Agriculture and forestry 3 14.6 0.7 7.6 3.7 -5.3 -0.8
Irrigation 24.6 4.2 14.4 11.7 -2.2 4.7
Industry and mining -4.4 25.9 10.7 -14.2 19.0 2.4
Transportation and 20.1 5.4 12.7 8.6 -1.1 3.8Communication
Electricity 1.3 28.8 15.1 -8.5 20.8 6.2
Others 4 162.5 18.1 90.3 140.5 10.8 75.7
Defence 14.5 11.8 13.2 3.4 5.0 4.2
Debt servicing 23.0 10.6 16.8 10.8 3.9 7.4
Foreign 22.9 12.5 17.7 10.8 5.8 8.3
Domestic 23.6 9.7 16.7 11.3 3.0 7.1
Miscellaneous 5 32.4 15.4 23.9 21.7 8.6 15.2
Total 14.8 11.2 13.0 3.9 4.5 4.2
Source: UNDP 2002b.
2 Includes general administration, economic administration and planning, constitutional organs, revenue administration, judicial, andforeign services.
3 Includes agriculture, land reform and forestry.4 Includes survey and other economic services.5 Includes loan and investment extended by government.
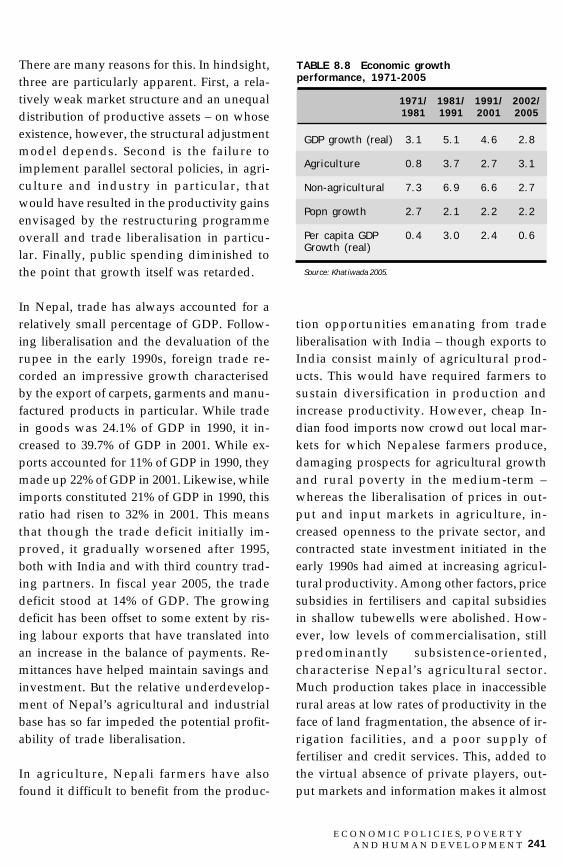
241 E C O N O M I C P O L I C I E S, P O V E R T Y
A N D H U M A N D E V E L O P M E N T
There are many reasons for this. In hindsight,three are particularly apparent. First, a rela-tively weak market structure and an unequaldistribution of productive assets – on whoseexistence, however, the structural adjustmentmodel depends. Second is the failure toimplement parallel sectoral policies, in agri-culture and industry in particular, thatwould have resulted in the productivity gainsenvisaged by the restructuring programmeoverall and trade liberalisation in particu-lar. Finally, public spending diminished tothe point that growth itself was retarded.
In Nepal, trade has always accounted for arelatively small percentage of GDP. Follow-ing liberalisation and the devaluation of therupee in the early 1990s, foreign trade re-corded an impressive growth characterisedby the export of carpets, garments and manu-factured products in particular. While tradein goods was 24.1% of GDP in 1990, it in-creased to 39.7% of GDP in 2001. While ex-ports accounted for 11% of GDP in 1990, theymade up 22% of GDP in 2001. Likewise, whileimports constituted 21% of GDP in 1990, thisratio had risen to 32% in 2001. This meansthat though the trade deficit initially im-proved, it gradually worsened after 1995,both with India and with third country trad-ing partners. In fiscal year 2005, the tradedeficit stood at 14% of GDP. The growingdeficit has been offset to some extent by ris-ing labour exports that have translated intoan increase in the balance of payments. Re-mittances have helped maintain savings andinvestment. But the relative underdevelop-ment of Nepal’s agricultural and industrialbase has so far impeded the potential profit-ability of trade liberalisation.
In agriculture, Nepali farmers have alsofound it difficult to benefit from the produc-
tion opportunities emanating from tradeliberalisation with India – though exports toIndia consist mainly of agricultural prod-ucts. This would have required farmers tosustain diversification in production andincrease productivity. However, cheap In-dian food imports now crowd out local mar-kets for which Nepalese farmers produce,damaging prospects for agricultural growthand rural poverty in the medium-term –whereas the liberalisation of prices in out-put and input markets in agriculture, in-creased openness to the private sector, andcontracted state investment initiated in theearly 1990s had aimed at increasing agricul-tural productivity. Among other factors, pricesubsidies in fertilisers and capital subsidiesin shallow tubewells were abolished. How-ever, low levels of commercialisation, stillpredominantly subsistence-oriented,characterise Nepal’s agricultural sector.Much production takes place in inaccessiblerural areas at low rates of productivity in theface of land fragmentation, the absence of ir-rigation facilities, and a poor supply offertiliser and credit services. This, added tothe virtual absence of private players, out-put markets and information makes it almost
TABLE 8.8 Economic growthperformance, 1971-2005
1971/ 1981/ 1991/ 2002/1981 1991 2001 2005
GDP growth (real) 3.1 5.1 4.6 2.8
Agriculture 0.8 3.7 2.7 3.1
Non-agricultural 7.3 6.9 6.6 2.7
Popn growth 2.7 2.1 2.2 2.2
Per capita GDP 0.4 3.0 2.4 0.6Growth (real)
Source: Khatiwada 2005.

242 R E A D I N G S I N H U M A N D E V E L O P M E N T
impossible for risk-averse farmers – increas-ingly women – to respond to higher produc-tion costs that result from greater openness.Commenting on the elimination of subsidieson chemical fertilisers, the Asian Develop-ment Bank recently acknowledged that out-comes have remained “fragile” and “are nothomogeneous countrywide” (ADB 2003).
Increased productivity in the industrial sec-tor is both an impetus for further growth inagriculture as well the generation of employ-ment opportunities for poor people, particu-larly in the labour- intensive sectors of manu-facturing and services. Evidence worldwideindicates that income from non-farm employ-ment plays an important role in moving thepoor above the poverty line. That said, sincethe estimated proportion of the labour forceemployed in the manufacturing sector hasbeen relatively small compared to other Asiancountries – at 5% – poverty effects have alsobeen much smaller. Indeed, the performanceof the manufacturing sector following re-forms, as well as its poverty impact, was dis-appointing. Production was overly concen-trated on garments, carpets and pashmina –all industries operating out of urban indus-trial centers – creating few backward linksbetween urban and rural production. Policyincentives offered to domestic producers werealso insufficient; many industries collapsedbecause of high transaction and infrastruc-ture costs.
While the share of manufacturing produc-tion within trade increased in the post-liberalisation period, marked by new typesof export industries such as food process-ing, paper and paper products, footwear, ironand steel, it was constrained by a limiteddomestic market, the lack of infrastructure,skilled human resources, capital and stiff
competition with Indian goods. Equally se-rious from the human development perspec-tive, the local employment impact of manu-factured production in Nepal remained mini-mal: the garment and carpet industries havehad very little value-added, as indicated inthe declining trend of total employment inthe manufacturing units that employ morethan 10 workers. In fact, in the period 1984/85-1995/96, an overall decline took place inthe combined role of the manufacturing andconstruction sectors in employment genera-tion (Acharya, Khatiwada and Aryal 2003).Since 1996-97, manufacturing output hasslowed down; even though employment inthese industries expanded by over 16% perannum before 1991/92, the labour intensityof production of output has fallen since. Simi-larly, manufacturing sector wages have notkept up with prices and the real wages ofworkers, as indicated by the price index andits change in relation to the wage index.
Foreign private investment can generatemuch-needed capital and employment forhuman development. While incentives forFDI were introduced during 1992-93, its im-portance to Nepal has been limited. A mix-ture of poor infrastructure, particularly inelectrical supply, political instability, unre-liable revenue policies and tax administra-tion and unclear investment policy overallprevented more intensive FDI inflows (IIDS1999). A total of 860 FDI projects are regis-tered (and are in legal existence) till April2005 with fixed capital of Rs 74 billion. Butmany of them have not yet come into opera-tion. FDI has concentrated largely in manu-facturing, followed by services – more spe-cifically in manufacturing products for ex-port to India (e.g. vegetable fat, soap, tooth-paste, Ayurvedic preparations) and overseas(ready-made garments). Hotels have also
243 E C O N O M I C P O L I C I E S, P O V E R T Y
A N D H U M A N D E V E L O P M E N T
benefited; tourism brought in an estimatedRs. 14 million in foreign exchange earningsover the reform period. More recently, therehas been significant FDI in hydropower, tak-ing advantage of further policy liberalisationin this sector.
Financial liberalisation in Nepal has also ledto the spread of financial institutions. Beforeliberalisation, Nepal boasted only two com-mercial banks – the Nepal Bank Limited andthe Rastriya Banijya Bank. Subsequently, anumber of other actors, including privatebanks, finance companies, cooperative soci-eties and NGOs have been allowed to en-gage in banking transactions at varying lev-els, to cater to the financial requirements ofthe various economic sectors – one indica-tion being the increased share of credit inGDP from 28% in 1985 to 54% in 2005. Com-mercial credit to the private sector has risenfrom 8.7% of GDP in 1985 to 43% in 2005. Atthe same time, since Nepal’s unfavourableeconomic environment during parts of thereform period has reduced the earnings ca-pacity in many sectors of the economy, theoverall performance of commercial banks hasbeen hindered to some extent; the volume ofnon-performing loans has been risingsteadily, which has constrained the earningcapacity of banks. It has also reduced theturnover of funds in commercial banking,translating into an average deterioration ofbank asset quality.
Particularly important from the perspectiveof rural development is the fact that there hasbeen no increase in credit to the agriculturesector; of the total credit extended by com-mercial banks, only 3% went to agriculturein 2005 – though the share of industrial sec-tor credit increased from 18.8% in 1985 to37% in 2005 (Khatiwada 2005). The govern-
ment has, in fact, withdrawn from rural de-velopment banks and phased out prioritysector credit programmes that benefited at-tempts at rural regeneration. Financialliberalisation has in part also resulted in clo-sures and mergers of rural financial net-works. Though a few development banksopened in the private sector have gone to therural areas, their coverage is constrained bytheir very small capital base and limited out-reach. Microfinance programmes cover verysmall areas and incur high service costs. Ad-ditionally, they still do not reach out topeople in the lowest income bracket. Conse-quently, rural indebtedness has risen in con-junction with growing landlessness. Therehas been little compliance with directivesfrom the central bank to expand services inthe rural areas and priority sectors. Indeed,the weak supervisory capacity of the centralbank, followed by inadequate legal provi-sions, has posed challenges for the develop-ment of a healthy and sound financial sys-tem – one consequence being a reverse flowof financial resources from rural to urbanareas that have arisen largely from structuralbottlenecks within the financial system thatneed to be dealt with before the sector isliberalised further.
The other significant means of expandingpeople’s choices and achievements is chan-neling a high proportion of public revenueinto priority social and economic expendi-tures. However, with a public expenditureshare in GDP of just 18.7% in the 1990s, percapita spending in Nepal has remained loweven by South Asian standards. Despite com-paratively low public expenditure, a highdeficit – more than 5% of GDP – has per-sisted. Revenue has generated only 11% ofGDP, remaining virtually stagnant duringthe reform period though it grew by 22%, be-

244 R E A D I N G S I N H U M A N D E V E L O P M E N T
tween 1991 and 1995 and by 11% between1996 and 1998 (Roy 2003). Revenue fromtaxes hovered around 9% during this time.Foreign aid has financed the bulk of publicexpenditure, while national savings havelargely financed domestic investment. Inparticular, the control of the fiscal deficit hasmeant that a larger proportion of develop-ment expenditure is now financed locally –an average of 55%, as compared to an aver-age of 40% in the 1970s.
Moreover, even falling development alloca-tions have been ineffective: they have oftenremained underspent – aid disbursementwas less than 70% during the reform period –or have been distributed through a highlyinefficient delivery system. At the same time,a higher reliance on foreign loans to financethe fiscal deficit has meant that debt obliga-tions have risen – partly because of the rapiddepreciation of the Nepali rupee against theAmerican dollar during this time. The gov-ernment debt-servicing obligation grew from10.2% of the total budget in 1991 to 15.1% in2000. In 2001/02, debt servicing took up65.35% of the inflow of foreign loans and13.52% of regular expenditure. Two othertrends have hampered the impact of publicexpenditure on human development – thegrowth of military spending (at an averagerate of 13.2% per annum during 1991-2000)and the persistent centralisation of budgetexpenditure, and, consequently, revenue gen-eration: in 2000, it is estimated that 82% ofthe budget was spent at the centre as com-pared to 18% disbursed at the district level(UNDP 2002b).
The Tenth Plan/PRSPWere the country at peace, the current TenthPlan, based on the PRSP (2002-07), could
have been expected to revive the reform pro-cess that had slowed considerably in thesecond half of the 1990s. Moreover, itsstated objective of reducing poverty indi-cates a renewed attempt to improve thequality of the lives of poor people (table8.9). Its strategic thrust hinges on broad-based economic growth by raising agricul-tural productivity at the rate of 2.8-4.1%per annum and encouraging the privatesector, increasing investment, strengthen-ing the manufacturing sector, focusing onemployment generation and betterprioritising public expenditure while main-taining macroeconomic stability. Non-ag-ricultural production is predicted to in-crease by 3.9-7.5%. To mitigate regionaldisparities, the PRSP seeks to improve thequality and availability of social and eco-nomic services for rural communities andinfrastructure, access to primary education,healthcare, drinking water and sanitation,roads and electricity. Programmes targetedparticularly at poor and marginalised com-munities in rural areas are also foreseen.Improved service delivery and project man-agement is expected to result from a newemphasis on good governance.
The Tenth Plan includes an informedanalysis of why past economic policiescould not reduce poverty significantly. Thereasons include the past pattern of economicgrowth and development that has concen-trated on towns and cities, encouraginggrowth in urban manufacturing and ser-vices at the expense of agricultural growthand the delivery of basic social and eco-nomic services and infrastructure (in par-ticular, education, health, drinking water,roads) to rural areas – all of which had “lim-ited the opportunities for income generationand human development” (NPC 2003). Fur-
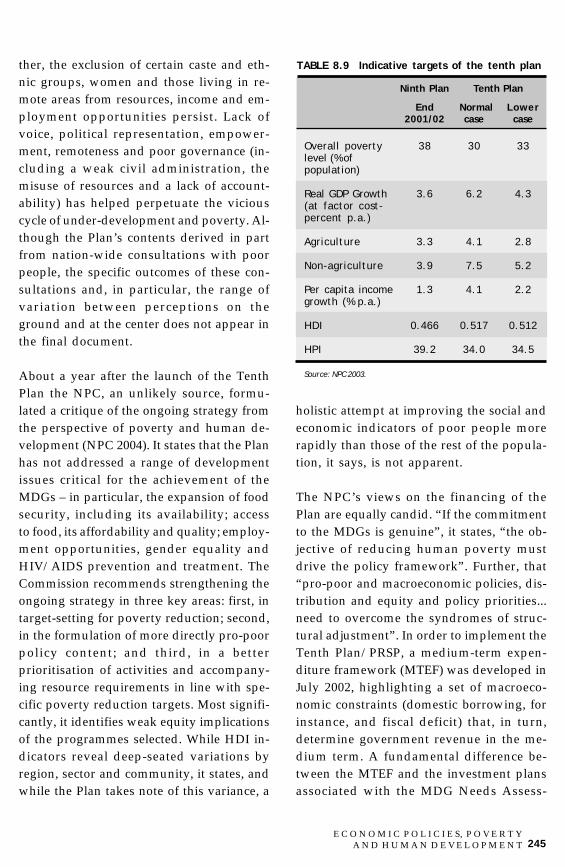
245 E C O N O M I C P O L I C I E S, P O V E R T Y
A N D H U M A N D E V E L O P M E N T
ther, the exclusion of certain caste and eth-nic groups, women and those living in re-mote areas from resources, income and em-ployment opportunities persist. Lack ofvoice, political representation, empower-ment, remoteness and poor governance (in-cluding a weak civil administration, themisuse of resources and a lack of account-ability) has helped perpetuate the viciouscycle of under-development and poverty. Al-though the Plan’s contents derived in partfrom nation-wide consultations with poorpeople, the specific outcomes of these con-sultations and, in particular, the range ofvariation between perceptions on theground and at the center does not appear inthe final document.
About a year after the launch of the TenthPlan the NPC, an unlikely source, formu-lated a critique of the ongoing strategy fromthe perspective of poverty and human de-velopment (NPC 2004). It states that the Planhas not addressed a range of developmentissues critical for the achievement of theMDGs – in particular, the expansion of foodsecurity, including its availability; accessto food, its affordability and quality; employ-ment opportunities, gender equality andHIV/AIDS prevention and treatment. TheCommission recommends strengthening theongoing strategy in three key areas: first, intarget-setting for poverty reduction; second,in the formulation of more directly pro-poorpolicy content; and third, in a betterprioritisation of activities and accompany-ing resource requirements in line with spe-cific poverty reduction targets. Most signifi-cantly, it identifies weak equity implicationsof the programmes selected. While HDI in-dicators reveal deep-seated variations byregion, sector and community, it states, andwhile the Plan takes note of this variance, a
holistic attempt at improving the social andeconomic indicators of poor people morerapidly than those of the rest of the popula-tion, it says, is not apparent.
The NPC’s views on the financing of thePlan are equally candid. “If the commitmentto the MDGs is genuine”, it states, “the ob-jective of reducing human poverty mustdrive the policy framework”. Further, that“pro-poor and macroeconomic policies, dis-tribution and equity and policy priorities...need to overcome the syndromes of struc-tural adjustment”. In order to implement theTenth Plan/PRSP, a medium-term expen-diture framework (MTEF) was developed inJuly 2002, highlighting a set of macroeco-nomic constraints (domestic borrowing, forinstance, and fiscal deficit) that, in turn,determine government revenue in the me-dium term. A fundamental difference be-tween the MTEF and the investment plansassociated with the MDG Needs Assess-
TABLE 8.9 Indicative targets of the tenth plan
Ninth Plan Tenth Plan
End Normal Lower2001/02 case case
Overall poverty 38 30 33level (% ofpopulation)
Real GDP Growth 3.6 6.2 4.3(at factor cost-percent p.a.)
Agriculture 3.3 4.1 2.8
Non-agriculture 3.9 7.5 5.2
Per capita income 1.3 4.1 2.2growth (% p.a.)
HDI 0.466 0.517 0.512
HPI 39.2 34.0 34.5
Source: NPC 2003.

246 R E A D I N G S I N H U M A N D E V E L O P M E N T
ment (the basis of this analysis) was thatthe latter did not assume the same set ofmacroeconomic constraints that underliethe MTEF. There is a resource shortfall,therefore, between the resources allowed forby the MTEF and those required by theNeeds Assessment exercise (table 8.10). Es-sentially, the Planning Commission is im-plying that PRSP formulation proceededwith the identification of a set of macroeco-nomic conditions, around which its povertyand human development programmes werearranged afterwards. This would indicatea reversal in the stages of PRSP formulationofficially announced by the World Bankwhen PRSPs were first initiated. It is notclear which institution(s) would haveauthorised this or why.
The greatest value-added of the PRSP is thata government document identifies specifi-cally the causes of poverty in Nepal, identi-fies the poor in detail, and identifies the rea-sons for the ineffectiveness of past policies.Further, it seeks to address poverty at boththe micro and the macro level. While small-scale targeted interventions will be contin-ued through the poverty alleviation fund(PAF), PRSP goals, once aligned with theMDGs, will build an equity objective intofiscal policy at the national level. Becauseof the government’s tight financial position,this may require allowing for a larger fiscaldeficit and a higher rate of inflation (morethan 5%) than has been the case in the past(Roy 2003). Nepal’s experience to date hasbeen that increased public spending, ratherthan theoretical concerns of crowding out,is required to stimulate investment and in-creased productivity for improving mea-sures of both income and human poverty.To increase the size of the budget withoutdisturbing macroeconomic stability and es-
calating the debt burden will require a con-certed effort at mobilising higher levels ofinternal revenue and streamlining non-de-velopment spending, notably on defenceand the police, on administrative expensesand on debt servicing.
Moreover, there is a strong need to under-stand that increased spending on social ser-vices at the expense of economic serviceswhere private capital is not forthcoming –unlike the assumptions of SAPs – cannot beconsidered either equitable or poverty-reduc-ing (Deraniyagala 2003). The relativelylower rates of economic empowerment incomparison to rates of social and politicalempowerment measured by the HEI showin quantitative terms that investment in thedays ahead is particularly important in pro-ductive sectors. Most worrisome is the factthat the proportion of office developmentassistance going to economic services andin particular, agriculture, has fallen not justin Nepal, but all around the world (IFAD2001). Assistance to agriculture from the IFIshas followed a similar path. In this context,providing well-targeted and limited subsi-dies in key areas, including food supplies,fertiliser and other agricultural inputs, inagro-enterprise promotion with high em-ployment and export potential, interest sub-sidies for the provision of micro-credit andcapital subsidies for small irrigation mecha-nisms appears to be justifiable. In thepresent context, fiscal planning must takeinto account the increased spending on na-tional security. Targeted programmes forconflict-affected areas – including substan-tive components of relief, rehabilitation andreconstruction in much greater amountsthan are outlined in the current PRSP, andare clearly needed now and in the foresee-able future (Pyakuryal 2004).
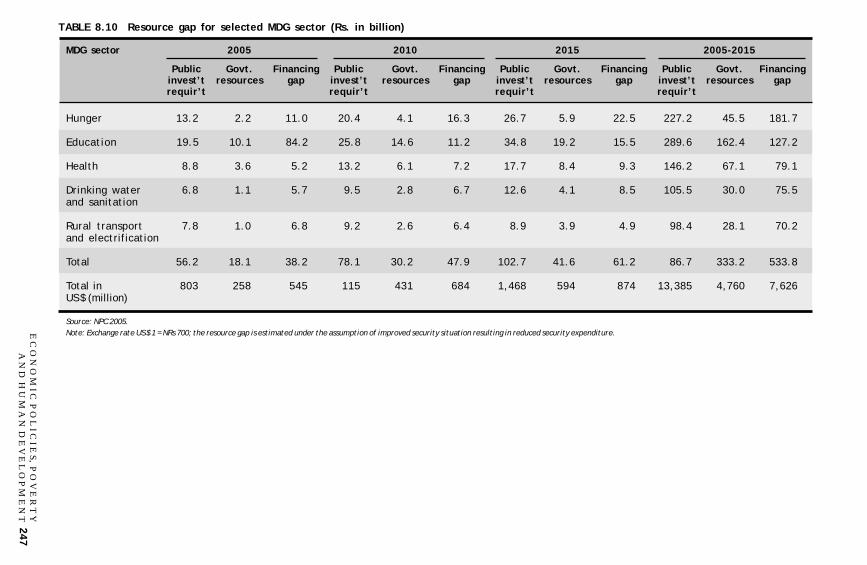
247 E
C O
N O
M I C
P O
L I C
I E S, P
O V
E R
T Y
A N
D H
U M
A N
D E
V E
L O
P M
E N
T
TABLE 8.10 Resource gap for selected MDG sector (Rs. in billion)
MDG sector 2005 2010 2015 2005-2015
Public Govt. Financing Public Govt. Financing Public Govt. Financing Public Govt. Financinginvest’t resources gap invest’t resources gap invest’t resources gap invest’t resources gaprequir’t requir’t requir’t requir’t
Hunger 13.2 2.2 11.0 20.4 4.1 16.3 26.7 5.9 22.5 227.2 45.5 181.7
Education 19.5 10.1 84.2 25.8 14.6 11.2 34.8 19.2 15.5 289.6 162.4 127.2
Health 8.8 3.6 5.2 13.2 6.1 7.2 17.7 8.4 9.3 146.2 67.1 79.1
Drinking water 6.8 1.1 5.7 9.5 2.8 6.7 12.6 4.1 8.5 105.5 30.0 75.5and sanitation
Rural transport 7.8 1.0 6.8 9.2 2.6 6.4 8.9 3.9 4.9 98.4 28.1 70.2and electrification
Total 56.2 18.1 38.2 78.1 30.2 47.9 102.7 41.6 61.2 86.7 333.2 533.8
Total in 803 258 545 115 431 684 1,468 594 874 13,385 4,760 7,626US $ (million)
Source: NPC 2005.Note: Exchange rate US $ 1 = NRs 700; the resource gap is estimated under the assumption of improved security situation resulting in reduced security expenditure.

248 R E A D I N G S I N H U M A N D E V E L O P M E N T
Whether growth expands the opportunitiesfor work and contributes to human devel-opment depends not just on the rate ofgrowth but also on its pattern. Economicgrowth contributes most to poverty reduc-tion when it expands the employment, pro-ductivity and people’s wages. In Nepal, thismeans generating growth in rural areas,from agriculture and labour utilising smalland medium-scale industries that link upwith production process in urban areas andoutside of the country. Alongside continuedderegulation and liberalisation of theeconomy, additional sectoral restructuringand government investment in agriculturaland industrial production will be required.Detailed plans such as the Agricultural andIndustrial Perspective Plans have alreadybeen formulated; it is now a matter of re-turning to their content and going aheadwith coherent implementation. The in-creased shift of the labour force from theagricultural to the non-agricultural sectorrevealed by the latest NLSS data are evi-dence of the potential of building furtherlinks between the agricultural and indus-trial sectors in the future. The other crucialfactor to be taken into account in futurestrategising is how best to design pricing,interest rate and exchange rate policy inview of the high integration of Nepal’seconomy with that of India in terms of mer-chandise, trade, tourism, labour and finan-cial markets.
Land reform remains a pending item onNepal’s policy agenda, and is indeed a mat-ter of ongoing political controversy acrossSouth Asia. However, the distribution of landin semi-feudal, agricultural societies holdsimportant implications for the future of pov-erty reduction and equity. Land reform pro-ponents, for instance, are critical of the im-
pact of the Agricultural Perspective Plan(APP) that continues until 2015. They claimthat its strategy for commercial agricultureis unviable in hill and mountain areas notyet penetrated by market forces. They alsohold that APP excludes mechanisms for en-suring livelihood opportunities for resource-poor and landless people (e.g. SAAPE 2003).Such concerns are valid. An equitable sys-tem of land ceilings and land taxes, secureland ownership for tenants and a verifiableprogramme of land transfers is likely tospread the potential benefits of increasedagricultural productivity to wider sectionsof the population. Land reform alone, though,is not enough. It will also be necessary toprovide farmers with better access to techno-logical inputs, irrigation, power, credit andmarkets to sell their produce as recom-mended by the APP. More profitable produc-tion of basic food staples in the Tarai plainsand promoting livestock and higher-valuecommercial crops in the hills and mountainswill not only reduce hunger and ensure foodsecurity, but allow farmers to benefit morefrom agricultural trade with India. Govern-ment investment in rural infrastructure andthe improved provision of credit facilities canfurther help create employment opportuni-ties in rural areas and pave the way for agri-culture-supported small and medium-scaleenterprises. This can be an incentive for ru-ral development overall, extending advan-tages to those without access to land as well.
CONCLUSION
A profound understanding of the nature ofrelations between the individual, state andsociety is a prerequisite for attempts to alterthe composition of the social order. A newparadigm of progress (that is human devel-

249 E C O N O M I C P O L I C I E S, P O V E R T Y
A N D H U M A N D E V E L O P M E N T
opment) has emerged. It calls for a transfor-mation in the terms on which resources areoffered and opportunities made available.Given these considerations, the freely exer-cised agency of poor people is considered asimportant as their literacy and their health.
Clearly, many states have failed in their man-date of lifting millions of people out of abso-lute poverty. They have not tried hard enoughin some cases, made the wrong decisions inothers or may have been constricted by a lackof resources. History has revealed the limita-tions of government capacity. These are inlarge measure increasing as globalisationcontinues. It, therefore, becomes necessary totry for combinations of state and market in-stitutions that can sustain progress towardshuman development. No single model thatcan be adjusted will suit all nations andpeoples. Nor will any one combination ofpublic and private forces endure forever inany one country. The key learning from theimposed rigidities of past growth models hasbeen that different sets and sequences of poli-cies come with both advantages and disad-vantages; individual selections are best madeat the local level. There are no simple formu-lae that will help policy makers make thedifficult redistributive measures and hardpolicy choices that a path to the expansionof people’s achievements and choices inevi-tably entails.
While development is woven into the fabricof Nepali society, it has been a deeply exclu-sionary process (see chapter 2). Today Nepalremains a nation in pursuit of fast and sus-tained economic growth to reduce the abso-lute poverty rate to 10% by 2017. With themajority of poor people still outside of theformal economy, dependent overwhelminglyon agriculture for their livelihoods, they have
scarcely participated in the growth process,let alone benefited from it. An inequitabledelivery of social and economic services hasdenied particular groups any form of statesupport for hundreds of years. Moreover, aconflict now into its tenth year has led towide displacement and losses among thepoor, and caused people to fear for their livesand those of their children.
Once economic growth begins to be perceivedas the means to the end of allowing moreand more people access to more choices, im-proved distributions of entitlements to eco-nomic and social resources becomes thepolicy objective. The purpose of economicpolicy aimed at poverty reduction mustgraduate from the achievement of economicgrowth to making accessible economic andsocial security for all. While positive changeshave come with the adoption of the PRSP asa planning instrument, the experience so farindicates that it has not allowed for a sub-stantive transformation in understandingpoverty or the action for which human de-velopment strives, an argument now beingaccepted in part by the IFIs themselves. Theobjectives of plans and policies and in par-ticular, economic reforms, must be to widenthe expanse and efficiency of the home mar-ket, to provide the broadest possible basisfor development through appropriate struc-tural change. This will require sectoral focusin agriculture and industry with a view toincreasing competitiveness and generatingemployment particularly in rural areas. Spe-cific redistributive programmes targeted atthe asset-less, landless people, for instance,and those with no skills at all, will also benecessary. This will require a mix of macro-economic policies that allows for a larger fis-cal deficit. Moves to increase direct taxationand a reduction in inessential spending as

250 R E A D I N G S I N H U M A N D E V E L O P M E N T
well as greater discipline in tax enforcementshould attempt to increase the revenue base.
In the meantime, foreign assistance in theform of grants and increasingly, loans, willremain necessary. Ultimately, broad-basedgrowth in Nepal should not depend on ac-cess to international finance, but use the foot-hold offered in part by the home market. Theexpansion of the domestic market impliesemphasising employment generation and theprovision of adequate, equitable and sustain-able livelihood opportunities to all people.This will also improve Nepal’s prospects forengaging with external markets, providedthat the implications of the open border withIndia is taken into account properly in for-mulating pricing, interest rate and exchangerate policy. At the same time, efforts must bemade, together with other developing coun-tries, to commit developed countries to real-izing the targets of Goal 8 of the MDGs, thoserelated to the controversial issues of an un-just global trading system, the insufficientsupply of development assistance and debtservicing arrangements that prevent socialand economic spending on poor people bydebtor nations. Goal 8 also calls for specialprovisions for least developed countries suchas Nepal. Decision-making at the institutionsof global governance themselves needs to bedemocratised, an issue now high up on theworld’s policy agenda. This campaign canbe made more effective by linking it to thebody of human rights instruments that ex-ists at the international level, particularly theevolving notions of economic rights.
In revenue-scarce economies such as Nepal,faced with manifold and equally urgent re-quirements, the central policy dilemma isthe generation of resources and their distri-bution across a range of competing ends –
among these, increasing the number of pri-mary schools, improving maternal healthand supporting informal sector income-gen-erating activities. Criteria can be developedto judge the whether a given process ofneeds prioritisation is “better” than another.However, equitable policies by their verynature benefit some sections of the popula-tion to the exclusion of others, at least in theshort term. What is important is buildingpublic understanding and ownership of theprocess to increase its chances forsustainability and freedom from violent con-flict. The reform process can gain greaterlegitimacy if a direct link can be made be-tween liberalisation and gains for specificgroups. To ensure that these gains favourpoor people, the very process of governancemust become pro-poor, based on a politicalphilosophy that strives for equity. Outsidethe state, pro-poor coalitions can play a partin ensuring that the state and other gover-nance bodies remain accountable in termsof avowed poverty goals.
Countries following different forms of gov-ernment have progressed on human devel-opment over time. However, comparing thesocial achievements of “closed” and “open”states reveals that the role of informed pub-lic discussion, with the presence of poorpeople and their representatives, in build-ing consensus on reforms policies and hold-ing decision-makers to account has no peerin generating the collective will required tosustain this slow, complex process. Build-ing people’s participation into existing in-stitutional arrangements inevitablypoliticises policy-making and causes ideo-logical conflict. But through the very “incon-veniences” of contestational politics and con-flicts of values and ideas that thus emerge,the chances of implementing policies and

251 E C O N O M I C P O L I C I E S, P O V E R T Y
A N D H U M A N D E V E L O P M E N T
achieving goals – certainly in the long term –seems to increase (Harris 2001). People’sparticipation in the process of social change,though still inadequately measured by hu-man development indices, is an intrinsiccomponent of empowerment. Moreover, tak-ing into account the historical causes ofNepal’s present political crisis, it is difficultto contest the notion that non-accountableand ill-informed governments pose seriousobstacles to increasing people’s functioningsand capabilities.
The human development paradigm de-mands a will to act at multiple levels. It re-quires dialogue and consensus-buildingwithin a framework of transparent and re-sponsive institutional arrangements. A hu-man development strategy does not ques-tion either states or markets, but advocatesthose types of states and markets that ex-pand people’s social, political and eco-nomic freedoms. If this process is to truly
support removing all aspects of deprivation,it must acknowledge citizen’s participationas a means and an end. Not only do citi-zens provide policy-makers with invaluableinformation about the causes and effects ofpoverty and exclusion; they also help shapea nation’s ethos and hold decision-makersto account.
At the end of the Cold War and with increas-ing globalisation, such deliberations cancontribute in charting a new vision for capi-talism in the 21st century, a third way follow-ing the extremes of welfare statism and neo-liberalism, is positioned within a frameworkof democracy, still not attained in either theNorth or South in a true sense, simply be-cause it is the most equitable of all politicaland social systems. Interdisciplinary socialscience enquiry that rises above the limita-tions of any single discipline, research meth-odology or cultural paradigm, can best con-tribute to this great debate of our time.

252 R E A D I N G S I N H U M A N D E V E L O P M E N T

253G O O D G O V E R N A N C E A N D
H U M A N D E V E L O P M E N T
INTRODUCTION
Governance is the complex of mechanisms,processes, relationships, and institutionsthrough which citizens and groups articu-late their interests, exercise their rights andobligations, and mediate their differences.Governance encompasses all the methods –good and bad – that societies use to distrib-ute power and manage public resources andproblems. In sound governance, public re-sources and problems are managed effec-tively, efficiently, and in response to the criti-cal needs of society. Effective democraticforms of governance rely on public partici-pation, accountability, and transparency.
Good governance ensures equitable accessto resources without regard to gender, so-cial, class, ethnic, or religious affiliation. Itunderlies the process of realizing real free-doms and capabilities, along with subse-quent achievements in poverty reductionand human development. The hallmark ofdemocratic good governance is its ability tosecure freedom from discrimination, want,injustice, and fear. Freedom of participation,expression, and association and freedom for
decent work and for the realization of one’shuman potential are also essential elementsof a mature and ideal governance systemand a just and equitable society. The fouressential elements of humane governance –ownership, equity, accountability, and effi-ciency – provide an enabling environmentfor human development and eradication ofhuman deprivation.
Human development concerns wideningthe range of choices for people to pursue –economic, social, cultural and political – byenhancing their capabilities to shape theirlives as they wish and enabling them to livein dignity (UNDP 2000). It is only throughthe exercise of socio-political and economicfreedoms and an enhanced people’s partici-pation in governance within an inclusivedemocracy can the fullest human capabili-ties be achieved (Fukuda-Parr and ShivaKumar 2003). The challenge of all societiesat all times has been to institute a system ofgovernance and enable it to achieve gover-nance goals – security, rule of law – voiceand participation and public goods, all ofwhich constitute crucial elements of humandevelopment.
CHAPTER 9
Good governance andhuman development
Murari P. Upadhyay

254 R E A D I N G S I N H U M A N D E V E L O P M E N T
During the 1990’s, pluralist democracy re-placed long-standing authoritarian regimesin many countries. Even within democraticpolitical systems, the concept of governancegoes well beyond the formal functioning of agovernment. Instead, it is a system in whichall the stakeholders of the state – the politi-cal elite, the civil service, the business sectorand civil society at large, representing all seg-ments of the population (professional andworkers’ organisations; cultural, ethnic, andracial minorities; and religious groups,among other components of civil society) ar-rive at a common social consensus on goalsand rules.
Governance therefore lies at the heart of thehuman development approach because itseeks to address the capabilities of all poten-tially active citizens to enable them to func-tion effectively within the established gov-ernmental system
STATE, GOVERNMENTAND CIVIL SOCIETY
Democracy and governanceIt is the very nature of human beings thatgenerates the necessity for a government, ledby a monarch, tribal head or other sovereignfigure. Nonetheless, individuals run the riskof being victimised by the government itself.Therefore, citizens should have control overthe decision and affairs of their government.It implies that people should have right toappoint or reject the government. This pro-vides the major reason for a democraticallyelected government.
However, even in a democratic governancesystem, there is a need to check the abuse of
power by government officials. The resultwas the idea of the separation of powers be-tween different organs of the state. In thisregard, the checks and balances system in-stituted in the American Constitution is note-worthy.
In the context of the modern state, democ-racy becomes an even more critical pre-con-dition for enhancing human capabilities. Itis the obligation of the government to respondto the articulated development needs andpriorities of the people and to be account-able to them in its conduct and performance.
However, in modern states, direct democracyas such generally does not exist. It is insteadgoverned by representatives who are peri-odically elected by citizens. In representativedemocracy, there are some inherent limita-tions that need to be addressed to make thesystem truly functional and capable of de-livering people’s expectations. The larger thesize of the assembly of representatives, themore difficult it is for assemblies to functionbecause of diversities in terms of regional,ethnic, religious, political and contrastingideological loyalties, as well as the sheer lackof adequate time for the representatives todiscuss and deliberate on issues at hand(Dahl 1989). In a national assembly wherenational level issues and interests are to bediscussed and resolved, its representativescan contribute meaningfully if they are un-derstood as representative of the citizens ofa given constituency to articulate nationalpriorities and needs rather than that of theconstituency s/he represents. The constitu-tion of local governments with clear task andresponsibilities to deal with local issues canmake the representatives at the national as-semblies contribute meaningfully in dealingwith national issues.
255G O O D G O V E R N A N C E A N D
H U M A N D E V E L O P M E N T
Civil society: empoweringpeople in governanceThere is increasing consensus that democ-racy is good for development. The concept ofgovernance received greater attention as im-portant global institutions like the UNDPand the World Bank discovered that success-ful development requires reforms in politi-cal and administrative regime. Accordingly,it is in this perspective that “civil society”has acquired relevance.
Civil society is generally defined as the realmof social life standing between the individualand the state. It helps empower individualcitizens through harnessing their collectivevoice in asserting their rights, needs and pri-orities. Right-based associations usually takeconfrontational relationship with the state.Others particularly, developmental organi-zations, do not want to take uncompromis-ing position with the state as it undercutsthe overall objective of building social capi-tal and strengthening civil society. Strength-ening civil society is based on two strategies.The first is to break state monopoly over re-source mobilization and allocation and thusloosen its grip over civil society. The WorldBank and other donors are supportive of thisstrategy by promoting market economy anddelegating authority to civil society as an ef-fort to promote democratic governance. Theother strategy involves decentralizing devel-opment responsibilities to local civil societyinstitutions. But, this also requires a paralleldevolution of political authority to local gov-ernments so that these local level institutionshave a chance of influencing public policy-making. Regarding scope of involvementalso, there are two arguments. The minimalistargument regards civil society associationsas only those that are explicitly political orcivic in the sense of fostering democratic
norms. The maximalist position howevermakes no distinction between political anddevelopmental organization.
In a number of developing countries evenunder formal democratic system of govern-ment where significant amount of resourceswere also invested for poverty reduction andhuman development, the standard indica-tors have not shown much improvement.What then has been missing? It has nowbeen clearly demonstrated that governanceis the link between the efforts and achieve-ment that has been missing. UNDP definesgovernance as the exercise of political, eco-nomic and administrative authority in themanagement of a country’s affairs at all lev-els. It comprises the complex mechanisms,processes and institutions through whichcitizens and groups articulate their inter-ests, mediate their differences and exercisetheir legal rights and obligations. Thereforegovernance is more than the system of for-mal government. It includes all three sec-tors – the state, civil society and private sec-tor (UNDP 1997). But there is also space formultilateral and bilateral institutions to as-sist the government with a comprehensiveapproach to human development, by fos-tering partnerships and facilitating the ex-change of ideas and experiences.
PRINCIPLES OFGOOD GOVERNANCE
Based on the broader definition of gover-nance presented above, it can be said that alimitation of representative democracy- ab-sence of direct rule by the people can largelybe overcome through good governance.“Good governance is a process of executinga coherent governing plan for the nation
256 R E A D I N G S I N H U M A N D E V E L O P M E N T
based on the interests and priorities ofpeople. It purports to create a just societybased on the principles of human essence,such as inclusiveness, liberty, equality andcooperation” [Dahal-b]. Generally, goodgovernance includes eight major character-istics that are mutually inclusive and rein-forcing – participation, rule of law, trans-parency, responsiveness, consensus ori-ented, equity and inclusiveness, effective-ness and efficiency, and accountability(UNDP 1997).
ParticipationAs a core principle of democracy, every citi-zen has the right to participate in the man-agement of public affairs. Participation cantake both forms-directly or through repre-sentative civil society organisations (CSOs).Therefore it calls for freedom of associationand expression. It also stresses on partici-pation of both men and women as partnersin conducting affairs of society. And undera democratic framework it is more than par-ticipating in periodic elections. In a decen-tralized polity it calls for providing explicitopportunity and power to participate in andinfluence decision making functions of thegovernments at all levels.
Rule of lawAs democracy is inseparable from humanrights, therefore, good governance must bebased on the primacy of the law. To guar-antee that the rule of law prevails, judicialinstitutions, police and administratorsshould be impartial and indiscriminatoryin applying general rules to citizens. Thisrequires the establishment of independentoversight mechanisms that are functionaland efficient.
TransparencyGovernment decisions and their enforce-ment should be transparent which meansthat they should follow set rules and regu-lations. It also means that people are awareof the existence of such rules. Moreover, in-formation on such decisions and enforce-ments must be made freely available tothose who need them. Transparency en-sures public access to decision making andeffective participation.
ResponsivenessGood governance requires that governmentinstitutions and processes should be in-clined to serve all stakeholders within settime frame. Crisis of governance springsfrom non-responsiveness of the governors,loss of legitimacy and corruption.
Consensus orientedThere are naturally a number of differingviewpoints and interests in a given society.Therefore, good governance requires media-tion among differing and alternative view-points to arrive at a broad consensus onwhat is the best for the whole community.The primary task is to mediate tension, pre-serve equilibrium between competingclaims, and resolve conflict through collec-tive action.
Equity and inclusivenessGood governance requires bringing all mem-bers of the society, particularly the disad-vantaged and vulnerable groups, intosociety’s mainstream. Nobody should feelexcluded. This will not only enhance own-ership but also diminish risk of alienationand conflicts.
257G O O D G O V E R N A N C E A N D
H U M A N D E V E L O P M E N T
Effectiveness and efficiencyGood governance should be geared towardsefficient and effective delivery of publicgoods and services to members of the soci-ety. Effectiveness entails high performancebehavior. Efficiency thus consists of a widescope of activity matched with high successin the management of the allocation and sus-tainable use of resources.
AccountabilityThe other core principle of democracy andgood governance is accountability. Publicaccountability is required to be observed byall – government, civil society and privatesector in their conduct. Generally an organi-zation is accountable to those who are likelyto be affected by its conducts. Accountabilitycan be ensured when conducts are madetransparent and rule of law is followed.
The above features of good governance indi-cate that it is an ideal that will guide the soci-ety to move towards attaining human devel-opment in a coherent manner. The HumanDevelopment Report 2002 has summarizedthe substance of good governance as follows:! People’s human rights and fundamental
freedoms are respected, allowing them tolive with dignity.
! People have say in decisions that affecttheir lives.
! People can hold decision-makers ac-countable.
! Inclusive and fair rules, institutions andpractices govern social interactions.
! Women are equal partners with men inprivate and public spheres of life and de-cision-making.
! People are free from discrimination basedon race, ethnicity, class, gender or anyother attribute.
! The needs of future generations are re-flected in current policies.
! Economic and social policies are respon-sive to people’s needs and aspirations.
! Economic and social policies aim at eradi-cating poverty and expanding the choicesthat all people have in their lives.
INSTITUTIONAL FRAMEWORKFOR GOOD GOVERNANCE
DemocracyThe fundamental element for human devel-opment is human freedom to exercise onesown inalienable rights. And, in a social con-text the most appropriate system of humancoexistence is democracy. Democracy pro-vides favorable institutional framework,which not only defends individual’s life, lib-erty and property but also restrains the gov-ernment from encroaching upon the freedomand rights of the individual. But, these are theo-retical arguments and require specific vigi-lance from citizens and civil society at largeto translate these virtues in real practice. Someof the major areas that need reform and pub-lic caution are presented below.
Enhancing civic participation ingovernance processIn democracy people formally participate inthe governance during times of electing thegovernment. From the point of view of goodgovernance there should be wider and regu-lar formal and civic channels for public par-ticipation in governance. Political freedomcan only be ensured through continuouspresence and participation of people in gov-ernment decision-making and implementa-tion processes.

258 R E A D I N G S I N H U M A N D E V E L O P M E N T
Public accountabilityUnder formal democratic governance struc-ture the government is accountable for itsconduct to the people through the legisla-ture. Under representative democracy the ef-ficacy of legislature can be enhanced whenpeople participate through different citizengroups by informing and pressurizing par-liamentarians. At the local level governmentsthere is wider opportunities and possibili-ties of direct participation of people in pub-lic affairs that affect their life.
Transparency ofgovernment functionsTransparency in government decision-mak-ing and process of implementing decisions,which also largely enhances the legislature’soversight capability, have to be built into thesystem. The other mechanism is enactmentof right to information law and its effectiveenforcement. Independent and free media indemocracy are regarded indispensable insti-tutions for effective and influential publicoversight of government functions.
Functioning in-builtchecks and balanceThe power of the state under democratic sys-tem of governance, whether in a parliamen-tary or presidential system, is usually dividedamong three branches – executive, legisla-tive and judiciary. This is the most appropri-ate built-in method of ensuring rule and re-straints. But, in many developing countrieslegislative and judiciary check and balancesystem is weak. If legislative branch suffersfrom lack of information and capability,judiciary’s independence is compromised.An independent judiciary can only ensurerule of law in democracy. Similarly, in par-
liamentary system where separation of poweris not very distinct, the parliament gets over-shadowed by the executive branch (i.e. gov-ernment). Therefore, there is a need to reviewprevailing system and introduce effective subsystems to ensure that system of checks andbalance is effectively functional. “This con-ventional [check and balance] formula isnecessary but by no means sufficient; for itcannot erect a balance among social, eco-nomic and political power and, as a result,the enforcement of laws is subjected to cor-ruption and arbitrariness. In the absence ofbalance, the legislative, the executive and thejudicial elite senselessly continue to promotetheir corporate interests at the cost of socialneeds. In the new context, newer types ofchecks and balances are required among theother instruments- the state, the market andthe civil society” (Dahal 2002c).
InclusionDemocracy brings to the forefront societies’diversities in terms of differing and at timesmutually conflicting interests and loyalties.If such diversities are not properly addressedand harmonized, governance system is likelyto break down. Therefore, democracy shouldbuild new designs and instruments whereparticipation of different groups particularlywomen, vulnerable and disadvantagedgroups; ethnic minorities in governance canbe ensured and promoted.
EfficiencyThe role of state in efficient delivery of publicservices is of critical importance. The respon-sibility of the state has increased tremen-dously due to larger attention of people to-wards the performance of their elected gov-ernment in service delivery. Who makes ac-
259G O O D G O V E R N A N C E A N D
H U M A N D E V E L O P M E N T
tual delivery is immaterial, so long as govern-ment is entrusted to provisioning, efficiencyin service delivery will remain an importantelectoral therefore, political issue. It is also cru-cial from a poverty reduction perspective.
A foremost issue is of civil service reform asthe performance of the bureaucracy largelydetermines the efficiency. A number of de-mocracies in the past were discredited be-cause of unmatched bureaucracy incompat-ible with democratic governance. A modernapproach to improvement of public serviceis to ensuring humane aspects of public ad-ministration through the introduction of ethi-cal norms and rules of public service. Theethics in public service can be regulated byrules, instruction and codes; trainings; in-troduction of role models and; public par-ticipation in government (UNDP 2000).
CorruptionCorruption is rampant in most developingcountries including Nepal. One of the prin-cipal reasons for corruption is discretionarypower vested in the officials – both electedand appointed. In most countries formalchannels are built to discourage corrupt prac-tices. Corruption, however, is nowadays soentrenched and pervasive that a more force-ful approach may be required where focusshould be on both formal and civil monitor-ing of official actions. Greater enforcementof transparency instruments and public par-ticipation in state conducts will also discour-age corrupt practices.
DecentralizationTransforming prevalent democracies into agood governance system requires the intro-duction of appropriate policy, tools and in-
stitutions. The most appropriate policy inthis regard is decentralization and the mostappropriate institutions are local govern-ments and civil societies. The phrase nowused universally for the conceptual frame-work that combines both these characteris-tics is “decentralized local self-governance”(UNDP 2002b).
There are basically three forms of decentrali-zation of government practiced in the world(UNDP 1993):! Deconcentration: This is limited to pass-
ing down only administrative discretion-to local offices of central government min-istries, for example. Although it does re-sult in some dispersal of power, few deci-sions can be taken without reference tothe center.
! Delegation: This involves passing some au-thority and decision-making power to lo-cal officials. But central government retainsthe right to overturn local decisions andcan, at any time, take these powers back.
! Devolution: The strongest form of decen-tralization: granting decision-makingpowers to local authorities and allowingthem to take full responsibility withoutreference back to central government. Thisincludes financial power as well as theauthority to design and execute local de-velopment projects and programmes.
In the devolution model of decentralization,the popularly elected local governments, civilsocieties and private sector become main ac-tors and public administration of governmentassumes facilitative, coordinating and en-abling responsibility rather than promotingomnipresence of center at all levels. Devolu-tion model is based on subsidiarity principleof governance as the guiding principle ofdecentralization.

260 R E A D I N G S I N H U M A N D E V E L O P M E N T
The subsidiarity principle can be presentedas follows:! Function and services that can be carried
out by citizens or citizen’s institutions attheir level should be allowed to be car-ried out by them.
! If function/services can be carried out ata lower level, it should be carried out atthat lower level.
! The necessary governance functionsshould always be carried out as close tothe citizens as possible (UNDP 2002b).
Decentralization of government is based onsome following important learning (UNDP2002b).! Central government agencies cannot pro-
vide sufficient access to people in gover-nance, hence people’s participation andtheir ownership remains questionable.
! In the absence of strong local level insti-tutions, equity and inclusion concernscannot be addressed effectively.
! People’s participation in governanceand service delivery cannot be achievedin the absence of accountability andtransparency.
! Effectiveness of public services is vitalfrom the perspective of cost, coverage,quality, time and people’s satisfaction.
Inspite of the experience in democratic gover-nance in many developing countries, achieve-ments made with regard to human develop-ment have remained poor. Elites continue tocontrol decision, resources and public ser-vices. Campaigns against poverty have oftenbypassed and ignored local government. Do-nors used to favor funneling resourcesthrough central governments now increas-ingly rely on CSOs. But, the critical role of lo-cal government-when elected and account-able- continues to be forgotten. Thus the effec-
tiveness of poverty programmes in reachingthe poor continues to be hampered” (UNDP2000). A recent study of eight country experi-ence shows that human development and pov-erty reduction through local governments maytake longer time than the “conventional tar-geted schemes to benefit the poor- but the even-tual benefits would outweigh the costs”(UNDP 2000).
The link between decentralized local gover-nance and human development can be un-derstood on the following premises:! When decision–making on the use of re-
sources and services moves closer to thepeople, accountability to the people in-creases.
! Local elections increase direct account-ability of local leaders to citizens.
! Under such a system, local people will bebetter placed in terms of influencing de-cisions affecting their life.
! Civil societies can take on catalytic roles tomobilize and enable communities to maketheir voices and choices heard and heeded.
Increasing participation in local governanceprocess creates a more conducive environ-ment for good governance by ensuring eq-uity, accountability and efficiency of localgovernance bodies and institutions.
Contribution of civil societyIn the context of CSO’s contribution to pro-motion of good governance and human de-velopment, it cannot be assumed that all theseassociations necessarily promote democracyand human development. Civil society canundercut democracy and human develop-ment if its association pursues values that goagainst tolerance and respect for others. There-fore some forms of normative criteria are sug-

261G O O D G O V E R N A N C E A N D
H U M A N D E V E L O P M E N T
gested so that they are qualified as ‘civil’(UNDP 2000). First, it should be autonomousof the state in terms of decisional competenceand resources. Over dependence of nationalNGOs with poor local resource base onINGOs is also regarded harmful for the exer-cise of their autonomy. Such instances aremore prevalent in developing countries in-cluding Nepal. Second, associations shouldbe democratically structured so that as per-ceived microcosms of civil society itself, val-ues compatible to good governance and de-mocracy can be internalized. Third, in orderto foster democratic organizational cultureassociation’s officeholders should be madeaccountable to members and public at large.Fourth, recruitment of staff should be madeopen. Exclusive and closed associationstend to be less inclined towards inclusionthus undermining cultural pluralism. Fifth,networking among civil societies is also im-portant from the point of view of socializa-tion of members. Well-developed networksalso amplify flows of information creatingconditions for collaborative campaigns.These relationships and social norms makeup a nation’s social capital to improve flowsof future outcome.
CSOs do not always pursue the qualities ofgood governance nor are they always themost effective development agents. That iswhy states, while recognizing and protect-ing their democratic rights of association andaction, must also ensure that the rule of lawand values that reflect societal norms areadhered to (UNDP 1997).
The value of civil society in the promotion ofhuman capabilities for good governance andhuman development cannot be measured interms of volume of activities it undertakes.Far more valuable is citizen mobilization in
the creation of social goods and in fosteringindividual initiatives as well as groupstrength that build human capabilities par-ticularly of vulnerable and disadvantagedgroups. Civil society also shape public opin-ion on good governance problems and cre-ate pressure for change. Civil society asso-ciations, who work in partnership with thestate in policy-making and its implementa-tion on contractual basis, also foster ‘wel-fare pluralism’ (UNDP 2000). Through theseengagements, they influence state policy inthe advantage of the people and also elimi-nate chances of elite control over publicgoods and resources.
At the national level the role of right-basedcivil society is very crucial for transformingsociety and polity and inculcating demo-cratic practices and culture. Civil society’sengagements in articulating and advocatingfor gender mainstreaming or women partici-pation in governance, for inclusionary poli-cies, election monitoring, control of humanrights abuses by the state, conflict mediation,ensuring consumer protection, child rights,biodiversity conservation, environment pro-tection and many other public concerns, etc.have brought tremendous change in humancapabilities and conducive politico-socialenvironment for fostering good governance.
At the local community level also, the contri-bution of civil society can be significant. Theyhave been proved valuable in enabling poorpeople and local people at large to effectivelyparticipate in local level planning and prior-ity settings. Through introduction of publicauditing systems at the local level, govern-ment accountability to people have been pro-moted. In a number of developing countriesincluding Nepal, civil societies have alreadyestablished faith for public- private partner-

262 R E A D I N G S I N H U M A N D E V E L O P M E N T
ships in efficient delivery of public services tocommunities. In short, the subsidiarity prin-ciple of governance, an important subsystemfor good governance has been brought underpractice by the initiation of civil societies.
Contribution of private sectorIt is the need for mutual exchange and tradebetween individuals that has promoted andshaped modern social life. But the introduc-tion of economic policies without democra-tizing the decision-making power of the statedoes not necessarily bring benefits for humandevelopment. The neo-liberal economic pre-scriptions in the form of growth-centered de-velopment, deregulation and privatization ofpublic sector, and liberalization and global-ization have failed to address the plight ofpoor. These policies instead have helpedwiden the gap between haves and have-nots;created conducive environment for conflicts,and greatly weakened the state autonomythereby weakening newly established democ-racies. Social obligation of private businesssector has fast eroded. Therefore, new eco-nomic order is required to be built, which en-sures strong democratization of economic sec-tor where role of the state is not of a silentspectator but active umpire and mediator ofclass conflicts.
In the arena of good governance, the role ofprivate sector lies in fostering consumerrights and well-being. Private sector businessassociations can play constructive role inbringing fairness and cleanliness in businesspursuits, facilitate exchange relationshipand contribute to wealth creation. The stateshould also explore opportunities to bringprivate sector in national policy making func-tions. It can form public -private participa-tion forums at all levels.
In policy planning area private sector cancontribute to protect vital national interestsfrom WTO provisions. Equally important,private sector can forge alliance with civilsociety to discourage rent-seeking behaviorof government officials by contributing toreframing of business regulations that pro-vide arbitrary discretionary power to them.
STATE OF GOVERNANCE IN NEPAL
Political governanceWith the promulgation of the Constitutionof the Kingdom of Nepal in 1990, the coun-try entered the world community of demo-cratic nations. However, Maoist insurgencythat began in 1996 in small pockets of theremote countryside of mid-western Nepalhas now engulfed the entire nation with vir-tually full-blown war of attrition. It is esti-mated that around 8-10 percent of GDP islost in the conflict. Side by side, security ex-penses has sky rocketed from 7 billion ru-pees in 2000-01 to 15 billion in 2002-03(Joshi 2004).
Between 1990 and 2002 country saw 12governments. All possible corrupt prac-tices were introduced either to topple orform government. Parliament was quiteoften marred by the absence of democraticproceedings and practices, and consensuswas often undermined in the process ofmajority decisions. At times even the par-liament was bypassed in major policy de-cisions of national importance. Public ser-vice providers are stubbornly non-respon-sive and discriminatory practices continueunabated. There is total lack of transpar-ency in government decision-making andimplementation.

263G O O D G O V E R N A N C E A N D
H U M A N D E V E L O P M E N T
The organizational system, culture and prac-tices of political parties were well reflected inparliamentary proceedings. A dominant pa-tronage oriented leadership structure, absenceof intra-party democracy and a credible lead-ership succession procedure, non-transpar-ency of fund raising system, poor intra-partydemocracy, dominance of corrupt leaders inparty rank and file and, exclusion have to-tally blocked desirable changes in politicalpower and social relations. Accountabilitybecame a forgotten term among politicians.
The manifestation of confused, apathetic, un-accountable, corrupt and irresponsible po-litical atmosphere, existence of exclusionarysocial structure, deep-rooted social cleavageand discrimination – ethnic, caste, genderand regional – offered conditions of struc-tural injustices and provided a fertile groundfor Maoist insurgency.
JudiciaryAutonomous, clean and efficient judicial sys-tem is a must for a functioning democracyand therefore for good governance. Credibil-ity of Nepalese judiciary system is as low asthat of the political parties. Autonomy ofcourts has to do with its accessibility, effec-tive bankruptcy laws, sound securities andcompetition regimes. Efficiency of courts inproviding justice to citizens is miserably low.The Supreme Court reveals that there are16,674 backlogs in the appellate courts. Onaverage, slightly more than half of the casesfiled in the appellate courts get disposed offevery year. Similarly there are 59,077 arrearcases in all the 75 district courts. The districtcourts dispose of the 50 percent of the caseseach year on average. The problem of back-log cases is more serious in the SupremeCourt, which disposes of only 30 percent of
the total cases each year. Justice delayed isjustice denied.
DecentralizationDecentralisation is not a new concept inNepal. Its existence can be traced back toancient times, though the forms and scopeboth vary greatly. The modern concept ofdecentralization started to take clearer shapesince the overthrow of the century old Ranaoligarchy in 1950. The series of initiativestaken during the Panchayat rule under ab-solute monarchy (1960-1990) were focusedlargely on delegation and deconcentration.Consequently, the local bureaucracy wasstrengthened at the cost of empoweringelected bodies.
Simultaneous delegation of central govern-ment powers to local governments as well asto line agencies led to the overlapping andduplication of their responsibilities thus cre-ating functional anarchy at the local level.This was one basic reason for the failure ofthe implementation of all types of moderndecentralization plans and programmes dur-ing this period.
The balance sheet of decentralization effortsmade under the Panchayat System was byand large negative because its inherentlycentralized power structure was hardly con-ducive to promote and establish decentral-ized local self-governance. The slogan of de-centralization then served the strategic needof presenting an authoritarian system looklike a democracy. This never allowed thedecentralization reform process get hold inthe Nepalese polity.
Under governance reform, decentralizationhas been an important agenda of the govern-

264 R E A D I N G S I N H U M A N D E V E L O P M E N T
ment following the restoration of democracyin the country. Based on the recommenda-tion of the High Level Decentralization Co-ordination Committee chaired by the Primeminister himself, the LSGA was enacted in1999. It provides sweeping powers to localgovernment bodies. But, as it contradictswith over two dozen sectoral and other acts,its implementation has been critically im-peded. Local government bodies preparetheir development plans – periodic as wellas annual, based on bottom up participatoryapproach. This approach therefore assuresbetter matching of genuine demand and sup-ply of services to citizens. But, as harmonybetween LSGA and sectoral Acts is not ap-propriately established, local governmentbodies are increasingly facing difficulty inimplementing their service provisioning anddelivery functions. This is much reflected inthree decentralized service sectors – namely,agriculture, health and education, as theirGuidelines themselves are facing implemen-tation problems.
Government with the support from interna-tional funding agencies is implementingnew design of development funding at thelocal level, which deliberately bypasses lo-cal government bodies. PAF and water boardfund are some examples. This design not onlyweakens local government bodies but alsolimits greatly the scope of public participa-tion in governance. The policies that affectlocal people and programmes dictated fromthe center undercut the prospect for local self-governance.
Administrative governanceNepal’s administrative structure was histori-cally shaped to serve the needs of a highlycentralized state and the political system. Ex-
ecutive function is carried out by the Councilof Ministers headed by the Prime Minister.Similar to the meaning of king in parliament,the council of ministers also performs execu-tive functions in the name of the king withking’s power to warn and/or advise the Coun-cil of Ministers. Individual sectoral adminis-trative functions are carried out through abouttwo dozen ministries, their respective Depart-ments and line agencies at regional, districtand field levels. None of the civil servants as-signed for different functions at different lev-els are personally accountable for their per-formance. Therefore, hierarchic loyalties de-generated into personal loyalties nurturedthrough the Chakari has been fully estab-lished as the system of reward and punish-ment for public service performance or non-performance. Even after the restoration ofmulti-party parliamentary system with con-stitutional monarchy in 1990, the adminis-trative apparatus was not reformed to suitethe changed need. Administrative reform pro-gramme of the government has been long over-due. Immediately following the first demo-cratically elected government in 1992, a high-level Administrative Reform Commission wasformed. Government principally agreed toimplement its recommendations. However, itis now almost forgotten, except at times of con-sulting it as reference note. Government hassince 1998 introduced a civil service reformcalled Governance Reform Programme. It hasbroad mandate of improving governance andreducing corruption in the civil service. Untilrecently, out of 16 proposed actions only 3have been completed (Joshi 2004).
In order to ensure transparency in the gov-ernment and to put an end to all forms ofembezzlement, a joint HMG/N-IDA Coun-try Financial Accountability Assessmentwas carried out, which suggested that the

265G O O D G O V E R N A N C E A N D
H U M A N D E V E L O P M E N T
regulatory framework is impressive but runsthe risk of non-compliance.
Control of corruptionIn order to curb corruption from public of-fices, a constitutional commission (CIAA) isin place with the mandate of investigatingand prosecuting abuse of authority. Follow-ing broadened mandate and the law puttingthe burden of proof on the accused, casesagainst abuse of authority increased signifi-cantly. Number of registered cases between2000-01 and 2002-03 increased from 26 to147. Similarly, out of 55 cases decided by thecourt, CIAA won 47 cases.
The government constituted a judicial com-mission to investigate the property of publicofficials. Based on the report of the commis-sion, CIAA is conducting investigation on bothpoliticians and civil servants (Joshi 2004).
Economic governanceDesign and implementation of Nepal’s de-velopment policies are rarely linked with thelocal knowledge, realities, needs and priori-ties. A centralized policy planning set up runby technocrats suggest and draft policies asadvisors to the Prime Minister. The veryconceptualisation and design of policy plan-ning is heavily influenced by internationaland bilateral donor agencies, which providealmost over 60 percent of country’s develop-ment budget. Every two years there is a meet-ing of Nepal’s donors, called Nepal devel-opment forum. It is not the country’s parlia-ment but Nepal development forum de factodetermines policy direction and actions.Currently Nepal’s economic reformprogramme follows World Bank led neo-lib-eral approach following the Washington
Consensus (see chapter 8). As discussed inpreceding sections, economic reform policiesare not addressing human development is-sues that the country is facing. Governmenthas deregulated industries, foreign trade,transport and financial services sectors.Privatization is its other agenda. Govern-ment is currently finalizing second round ofprivatization package. Three modalities arebeing adopted for transferring public enter-prises to private sector. Out-right sale, bulkpublic sale of government share by convert-ing public corporations into public compa-nies, and contracting out management func-tions of government industries and farmsto private sector are the modalities that arebeing followed. Communication and insur-ance sectors have also been opened for for-eign investment.
Subsidies from agriculture have been longwithdrawn. Unfavorable terms of trade inagriculture sector have been further wors-ened. Nepal has already acquired WTOmembership. It will have implication on thenation’s farm sector, which has not beenfully assessed.
In a context where the historical characterof the economy has remained feudal, mar-kets are internally fragmented, the introduc-tion of neo-liberal economic policies insteadof allowing market mechanism to fully func-tion, have only promoted vested interests ofprivate business, politicians and bureau-cracy, and weakened the power of the stateto influence the distribution of economicsurplus to the poor. Principles of integrity,transparency and accountability are impor-tant for sound economic governance. Mar-ket performance requires perceived credibil-ity of information where media plays a cru-cial role.

266 R E A D I N G S I N H U M A N D E V E L O P M E N T
InclusionInspite of the commitments of successive gov-ernments human development remains farfrom inclusive in Nepal (see chapter 3). Therehave been some general improvement in lit-eracy, access to safe drinking water, accessto electricity, telephone, roads, etc. but theproportion has not improved among ex-cluded groups, regions and ethnicities. Simi-larly, against the spirit of the civil code, socio-cultural discrimination and untouchabilityinflicted on Dalits, wage differentials be-tween men and women, and lack of propertyrights for women continue to weaken thegovernance to achieve social equality. Im-pending affirmative actions such as reserva-tions in political seats and jobs have not beeninitiated yet. The impact of neo-liberal poli-cies have put the poor in a more disadvan-taged position as most such groups are farmworkers who are the ones most hit by unfa-vorable agricultural terms of trade. In themain, there has not been sincere effort to ad-dress exclusion in Nepal.
Civil societiesThere has been profound proliferation ofCSOs in Nepal following the restoration ofdemocratic system in 1990. It is estimated thatthe number of active CSOs in the country isaround 13 thousand. These CSOs are of allkinds, right-based advocacy, development-oriented and religious organizations. Theright-based advocacy organizations havebeen very instrumental in articulating citi-zens’ claims including rights of different mi-norities and disadvantaged groups. Someachievements are also seen in terms of legis-lative reforms. Development organizationshave also contributed in terms of communityawareness, social mobilization and collectiveefforts for public goods. However, many of
them are highly dependent on foreign organi-zations including multilateral and bilateralagencies for resources. Many CSOs naturallyare streamlined to follow the donors’ agenda.Indigenous knowledge, aspirations and pri-orities are often overlooked. Such CSOs areused to implement globally set agendas in lo-cal areas. In this way, the autonomy of thestate not only at the national level but equallyat the local level is getting undermined.
POLICY IMPLICATIONS: GOODGOVERNANCE FOR HUMANDEVELOPMENT IN NEPAL
In the on-going Tenth Plan Nepal has in-cluded what it calls the human developmentapproach, which announces inclusion, em-powerment and affirmative actions to bringpoor, women and disadvantaged to develop-ment mainstream. But, these announcementsare yet to be seen in actual implementation. Inseeking good governance for human devel-opment in Nepal the following areas are ofcritical importance for review and revision.
Deconstruction ofneo-liberal policiesThe primary area of focus to assess the sta-tus of governance in Nepal is neo-liberalpolicy and its implementation instrumentsPRSP, MTEF and PAF-like social funds. To-gether, these have been instrumental in seri-ously undermining both the state autonomyas well as local self-governance and havedirect implications for the non-performanceof democratic system in the country.
Therefore, deconstruction of neo-liberal poli-cies should be the priority area of reform forgood governance. The greater democratiza-
267G O O D G O V E R N A N C E A N D
H U M A N D E V E L O P M E N T
tion of national economic conduct will ad-dress the developmental needs of the massesand is likely to address human developmentissues that the country is currently facing.Democratization also entails wider publicparticipation in national priority setting.This would garner lager autonomy to stateto address its unique problems of develop-ment. And, naturally, together with widerpublic participation in national policies andpriorities and preservation of state sover-eignty through effective autonomy, a synergywill be built fostering the goals of good gov-ernance. Promotion of public-private part-nerships should be given serious thought asthe compatible policy alternative to harnessthe benefits of the market, “buffering of citi-zens from the state” (Dahal 2002c) as well asto capacitate the state to address citizens’needs and priorities.
Decentralization reformAs discussed in the earlier section, most ofthe elements of good governance cannot beenforced and achieved in the absence of de-centralized local self-governance system.Therefore, devolution of state power basedon subsidiarity principles of governance isthe other policy area that needs serious at-tention. In addition to meeting preconditionsfor good governance conducts, it will replacetechnocratic wisdom with community wis-dom in planning, prioritizing and mobiliz-ing resources in meeting local needs. It willhave positive influence in generating localemployment, in checking migration to cities,and in preserving social capital.
Question of inclusionMajority ruled democracy needs to be re-viewed to address the question of inclusive
development. The lack of any attempts at ad-dressing this issue is a historical legacy andperhaps is indicative of the powers of theelites that preside the political and economicstatus quo in Nepal. Even after the restora-tion of democracy the social, economic andpolitical divide has further widened in thecountry. Reform in a number of areas includ-ing the constitution, electoral system andprocedures etc. are required to appropriatelyaddress the issue of inclusion. Similarly,parliamentary proceedings are to be re-formed so that chances of majority tyrannycould be effectively checked. Under multi-party democratic system the role of politicalparties is also to function as links betweenstate and civil society. Therefore, promotionand assurance of intra-party democracy isalso crucial.
The established system of separation ofstate power into three branches – executive,legislative and judiciary – is supposed toprovide mutual checks and balances. Butthis system is not performing as required.There have been instances when judiciarycurtailed executive’s constitutional author-ity and looks for ways to bypass legislature.In Nepal there is increasing tendency amongthese branches to cultivate and promotetheir own corporate interests. In order toensure good governance under democracy,newer system of checks and balances arecalled for. Under modern inclusive democ-racy, citizens articulate their demands andconcerns to state, state controls and guidesthe market towards meeting citizen’s socialneeds, and market provides buffer to citi-zens from the state. Therefore, there is a needto explore and install new system of checksand balance between the state, market andcivil society and creation of a public orderthat is both just and legitimate.

268 R E A D I N G S I N H U M A N D E V E L O P M E N T

269E M P O W E R M E N T – T H E C E N T R E P I E C E
O F H U M A N D E V E L O P M E N T
Conventional anti-poverty approaches,which focus almost exclusively on incomeand basic needs, have generally failed to re-duce powerlessness and the negative at-tributes usually associated with it, notablyisolation, vulnerability and physical weak-ness. By contrast, the empowerment ap-proach – with its stress on enhancing indi-vidual entitlements, capabilities, rights andfreedoms – is one of the four pillars of hu-man development and effectively reinforcesthe other three: equity, productivity andsustainability (UNDP 2004b). It creates theconditions necessary to enable the poor totake advantage of poverty-reduction oppor-tunities by strengthening their socio-cultural,economic and political capabilities.
EMPOWERMENT FORHUMAN DEVELOPMENT
Empowerment has become a keyword of de-velopment discussions worldwide, accruingas many definitions and connotations as theword ‘development’ itself. Empowerment isabout transforming existing power relationsin favour of those (generally, the poor) whohad previously been limited in exercising
power and choice of their own free will. Itrefers to the processes by which those whohave been denied the ability to make choicesacquire such ability through the expansionof assets and capabilities to participate in,negotiate with, influence, control, and holdaccountable institutions that affect their lives(Kabeer 1999; World Bank 2002). Empower-ment builds people’s capacity to gain under-standing and control over personal, social,economic and political forces to act individu-ally as well as collectively to make choicesabout the way they want to be and do thingsin their best interest to improve their life situ-ation. This definition captures the spirit ofhuman development, which is defined as“creating an environment in which peoplecan develop their full potential and lead pro-ductive, creative lives in accord with theirneeds and interests to be able to participatein the life of the community.”
Empowerment is not just a process; it is alsoabout reaching desirable outcomes/goals -substantive empowerment, which encom-passes both inter-personal (individual ca-pacities, self-esteem and self-efficacy) andinstrumental (capabilities such as knowl-edge and skills) empowerment to achieve col-
CHAPTER 10
Empowerment – the centrepieceof human development
Sriram Raj Pande and Bikash Sharma
270 R E A D I N G S I N H U M A N D E V E L O P M E N T
lective socio-political goals (Rich, et al 1995).As a process, it involves building people’scapacity. As an outcome, it involves people’scoming together to bring about structuraltransformation of the political, economic,social and cultural conditions to address thecauses of their poverty.
Empowerment and social inclusion are closelyrelated but separate concepts. While the em-powerment process operates “from below” andinvolves agency, as exercised by individualsand groups, social inclusion – through the re-moval of institutional barriers – requires sys-temic change (initiated from above) that is nec-essary to sustain empowerment over time(World Bank 2002). It is through the process ofsocial inclusion that the “rules of the game”are modified and institutions transformed sothat economic growth is widely shared(Malhotra, et al 2002). Empowerment has therevolutionary potential to transform conflictinto constructive outcomes. However, a mis-match between political, economic and socialempowerment can act negatively – transform-ing disputes into violent conflicts.
Empowering people and creating a good in-vestment climate are mutually reinforcingbasic pillars of any pro-poor growth strat-egy for sustainable poverty reduction (Stern2002). As a comprehensive concept, em-powerment is both an inherent part of anda means to sustainable poverty reduction.1
Economic growth is essential for human de-velopment, but the link between the two isnot obvious or automatic because the na-ture and quality of growth can be jobless,ruthless, voiceless and futureless. Empow-erment is the surest way to establish the link
between economic growth and human de-velopment – by addressing the voices andchoices of the people.
Failure to place the empowerment agendaat the centre of human development makeshuman poverty intractable, as poverty is in-tricately linked to disempowerment anddeprivation. As the concept of human de-velopment is much broader than any of itsmeasures, the human development index(HDI) cannot fully capture the comprehen-sive picture of human development (Jahan1999). The HDI encompasses only three criti-cal human choices (a long and healthy life,knowledge and a decent standard of living);it does not capture human freedom andhuman rights – the essential ingredients ofhuman empowerment. This has led to a con-tinuous search for a broader range of indi-cators to encompass holistically the at-tributes of human development. That searchunderpins the rationale for the human em-powerment index (HEI).
Economic empowerment concerns the ex-pansion of access to productive assets, in-cluding physical and financial opportuni-ties, to pursue economic gains. Althougheconomic empowerment necessarily in-volves the distribution of capital and of in-come generating opportunities, it also en-tails ensuring that the workings of the mar-ket and relative prices can enhancepeople’s economic agency.
Political empowerment involves enlargingthe capabilities associated with democraticself-governance. It ensures not only respectfor the fundamental dignity of the human
1Empowerment is an integral component of any strategy of development and poverty reduction, a message that can be heard throughthe World Bank study, Voices of the Poor, which drew on surveys of more than 60,000 poor people in more than 60 countries (Narayan,et al 2000).

271E M P O W E R M E N T – T H E C E N T R E P I E C E
O F H U M A N D E V E L O P M E N T
person and the basic rights set out by inter-national norms, but equitable representationin decision-making processes and institu-tions – especially those that can demand ac-countability from public servants and theprivate sector bodies entrusted with publicresources. It includes freedom to participatein political dialogue, to dissent from major-ity or accepted views, and to mobilize forchange. It also encompasses legal empower-ment, generally understood as the process ofacquiring the knowledge essential to protectone’s rights and to assert them under the law.
Socio-cultural empowerment entailsstrengthening the social fabric by augment-ing a complex network of human qualities –both individual and collective - whose sumand synergies we call “social capital”. It isthe process through which people andgroups become aware of the interplay of so-cietal and cultural forces at work in their livesand learn how they can act individually andjointly to influence and eventually controlthe dynamics of these forces.
CONCEPTUAL FRAMEWORK
Improvement in one dimension of empower-ment can play a catalytic role in bringing aboutchange in the other two. Expanding humanknowledge and capabilities certainly has anindirect influence on economic and politicalempowerment. Nonetheless, direct linkagesare hardly automatic, let alone rapid and self-perpetuating in virtuous synergies, i.e., sus-tainable. Sustainable empowerment requiresan integrated approach and tools to make thisintegration operational. Empowerment be-comes sustainable only in an environmentwhere policies and institutional reformscomplement grassroots initiatives to address
political, social and economic empowermentsimultaneously – in short, the policy environ-ment generally termed “pro-poor”.
The Venn diagram in figure 1 illustrates therelationships among social, economic andpolitical empowerment and their place in thelarger canvas of human development. Inter-actions between social and political empow-erment without economic empowermentmake people’s empowerment unsustainable(area B). Likewise, area D represents a situa-tion where a lack of political empowermentwill make social and economic empower-ment unsustainable. Hence, promoting sus-tainable empowerment (area A) requires anintegrated empowerment-led strategy forpoverty reduction and human development.This framework offers a potential roadmapfor making empowerment strategies opera-tional and for measuring their impacts.
This framework can become operational onlyunder genuine democracy that guaranteeshuman rights and freedoms. Developmentexperience clearly shows a two-way relation-ship between good governance and empow-erment. Deepening democracy is thus essen-tial to promoting transparent, responsive,participatory, inclusive and accountable gov-ernance. Empowerment – through inclusion,voice and accountability – also promotessocial cohesion and inclusiveness. Evidencefurther demonstrates that the breakdown ofsocial cohesion and trust leads to war andcivil conflict. Thus, mainstreaming the em-powerment agenda lies not only at the heartof deepening democracy, but also address-ing ongoing conflicts around the world.
To make this approach operational, the HEIhas been constructed for the first time bybringing together social, economic and po-

272 R E A D I N G S I N H U M A N D E V E L O P M E N T
litical dimensions of empowerment in a ho-listic perspective to measure the empower-ment level of all human beings in the samespirit as the HDI. This information providesplanners and policy makers with new in-sights to devise appropriate policy interven-tions to address concentrated poverty anddisempowerment at different geographicallevels. As with the HDI, the disaggregationof HEI will provide the basis for measuringdisparities in terms of caste, ethnicity andgender, subject to the availability of a suffi-ciently desegregated database (see annex 1for indicators used for measuring HEI).
From a policy perspective, the HEI providesa picture of the levels of human empower-ment and how these levels in social, eco-nomic and political terms manifest them-selves across regions. As such, the HEI cap-tures poverty-reducing opportunities, as wellas social economic and political capabilities,more than the HDI and other associated in-dices, such as GEM and the Human PovertyIndex (HPI). Second, the HEI is a particularlyaccurate tool for identifying areas of concen-trated poverty, especially at the lower end ofthe development scale where the HDI ex-ceeds HEI (figure 10.2). Third, with a larger
FIGURE 10.1 Empowerment and human development – a conceptual framework
Equity Sustainability
Support for
Empowerment
Productivity
Human development
Empowerment Poverty reduction
Individual,organisational andcommunity empowerment
Social Economic
Political
D
AB C
Supply side
Removal of policy andinstitutional barriers:Expanded freedomsDemocratic governanceInclusionAccountable institutionsUniversal access toinformation
Demand side
DecentralisationSocial mobilisationParticipationOrganisation capacity buildingAssets and capabilitiesNetworks and partnerships
Attacking the roots ofpoverty and conflict
Capability deprivationVulnerabilityPowerlessnessUnequal access to resourceand opportunities

273E M P O W E R M E N T – T H E C E N T R E P I E C E
O F H U M A N D E V E L O P M E N T
set of short and medium-term progress indi-cators measuring social, economic and po-litical choices, it provides policy signals notonly as to the kinds of social, economic andpolitical interventions essential to reducingdisparities at the local level, but also the scaleof such corrective measures.
NEPAL’S DEVELOPMENTTRAJECTORY – AN UNEVENPLAYING FIELD
Nepal has made some progress in raisingliving standards over the last 50 years, par-
ticularly since 1990. However, developmentoutcomes have varied inequitably, manifest-ing themselves in gender, caste, ethnic andgeographic disparities. But Nepal is hardlyalone among the numerous countries world-wide that have allowed both historical andcontemporary factors to perpetuate the gapsbetween its haves and have-nots. Althoughthe disadvantaged and marginalizedgroups have used new opportunities to or-ganize themselves and voice their concerns,these advances have not yet reduced thepowerlessness of the vast majority of its citi-zens or significantly diminished the isola-tion, vulnerability and marginality in which
FIGURE 10.2 Relationship between HEI and HDI across districts
Source: UNDP 2004b.
0.00
0.10
0.20
0.30
0.40
0.50
0.60
0.70
0.80
0.90
1.00
0 15 30 45 60 75
Number of districts in ascending order of HEI
Ind
ex
Va
lue
HEI
HDI

274 R E A D I N G S I N H U M A N D E V E L O P M E N T
they live. Indeed, the country’s low percapita growth rate and high disparities inincome distribution have limited the impactof economic growth on the poverty of thatmajority and starved the nation as a wholeof the contributions that these very citizenscould make to the development of Nepal’swell-being - economically, socially, cultur-ally and politically.
The HEI is a powerful tool for identifyingand addressing specific issues of exclusion,incongruities among the criticalaspects of empowerment and multipledisempowerments in areas of concentratedpoverty. The overall Index shows consider-able regional disparity and mismatch be-tween the three dimensions of empower-ment – social, economic and political. Eco-nomic empowerment (0.337) is lowest andpolitical empowerment the highest (0.646)– with social empowerment (0.406) in be-tween (table 10.1). While the high level ofpolitical empowerment is a clear manifes-tation of democratic practices and the ris-ing aspirations of the people, the low levelof economic empowerment is reflected bylow incomes, limited access to productiveassets, and a lack of gainful employmentopportunities that severely limit the expan-sion and exercise of human and social ca-pabilities. Sustainable poverty reductioncannot take place when both economic andsocial empowerment remains so low. Theseimbalances have provided fertile ground forconflict.
Nepal’s Tenth Plan/PRSP (2002-2007) at-tempts to redress the crisis now facing thecountry by placing peace-building and secu-rity centre-stage. The Tenth Plan also offers avariety of strategies for drawing the excludedinto the mainstream of Nepal’s development.However, the Plan cannot reduce poverty sig-
nificantly or address exclusion effectivelywithout systematic efforts to augment andharmonize the three fundamental compo-nents of empowerment: the economic, the po-litical and the socio-cultural.
Policies and programmes alone cannotguarantee empowerment. Unless their in-dividual and social capabilities can en-hance their position in competitive bar-gaining or to hold institutions account-able, people may not be able to take ad-vantage of the opportunities created byreforms. So far, the devolution of author-ity, capacity-building and accountabilityto local bodies in accordance with theprinciples of local self-governance and thespirit of the LSGA of 1999 has not oc-curred fast enough to consolidate the em-powerment of people at the grassrootslevel. But devolution will not work effec-tively without partnerships and otherforms of collaboration, both horizontaland vertical, that ensure the communica-tion of the voices and choices of the poorto governance bodies well beyond theirimmediate communities. All in all, a “top-down” development paradigm directed bythe country’s elite, coupled with slowprogress in devolution, has found itselfoverwhelmed by narrowly-based growthpolicies, widened income inequalities andexacerbated conflicts in the distributionof national income and assets. Clearly, itis essential take a holistic and integratedapproach to development.
A REFORM AGENDA FORMAINSTREAMING EMPOWERMENT
Deepening democracy is a key to enhanc-ing empowerment. Without strengtheningdemocratic institutions that enhance the de-

275E M P O W E R M E N T – T H E C E N T R E P I E C E
O F H U M A N D E V E L O P M E N T
cision-making powers of the disadvantagedgroups, initiatives to increase empowermentcannot be sustained. Yet once citizens haveexperienced democratic political practices,social imbalances are bound to surface,whether because of historical or contempo-rary factors. The fact that these imbalanceshave now exacerbated violent conflictthroughout Nepal points clearly to a needfor radical, dynamic social transformationthrough systemic reforms in policies and in-stitutions to overcome the current emer-gency successfully. Now, facing the worstcrisis in its modern history, the countrymust take a critical step further and placethe empowerment of these citizens at thecentre of its application of the human de-velopment paradigm. Without radical shiftsin current policies and resource allocations,
Nepal will not be able to sustain the progressit has made to date.
Nepal’s reform agenda should, therefore,concentrate on the following thrusts:! Deepening democracy! Removing discriminatory laws and
practices! Making macroeconomic policy reforms
pro-poor! Transforming agriculture! Expanding equitable education and
health facilities! Building infrastructure! Creating employment opportunities! Empowering the disadvantaged and
marginalized groups! Investing in the organizational capacity
of the poor
TABLE 10.1 Dimensions of human empowerment in Nepal by region
Social Economic Political Overall HEI
Nepal 0.406 0.337 0.646 0.463
Place of Residence
Urban 0.604 0.518 0.737 0.62
Rural 0.372 0.304 0.642 0.439
Ecological Region
Mountain 0.315 0.236 0.526 0.359
Hills 0.476 0.31 0.568 0.451
Tarai 0.362 0.392 0.674 0.476
Development Region
Eastern 0.398 0.369 0.691 0.489
Central 0.413 0.383 0.695 0.497
Western 0.468 0.317 0.599 0.461
Mid Western 0.33 0.247 0.602 0.393
Far Western 0.347 0.268 0.582 0.399
Source: UNDP 2004b.
276 R E A D I N G S I N H U M A N D E V E L O P M E N T
Changing the long-standing institutionalculture that governs Nepal’s decision-mak-ing processes simply will not take placewithout radical changes in mindsets ofthose who work within them. This processneed not take generations. The process canbe accelerated by making empowerment thecentrepiece of development with a radiantlyshining human face. There clearly exists aneed to create an enabling environmentthrough substantial shifts in policies andpriorities by linking the MDGs with the
PRSP, among other development plans,roadmaps and tools. Since it is a movementfrom power of the elite to the power of thecitizen in the street, poverty alleviation willcontinue to be a myth until we redefine andtransform these power dynamics in thebroader context of an empowerment-led de-velopment framework. Sustainable humandevelopment strategy for poverty reductionwould become possible only when we havethis new vision, a vision in which develop-ment is seen as truly human.

277E M P O W E R M E N T – T H E C E N T R E P I E C E
O F H U M A N D E V E L O P M E N T
ANNEX I: MEASURINGHUMAN EMPOWERMENTINDEX: APPROACH, METHODAND APPLICATION
Existing literature shows varied dimensionsof the empowerment (Malhotra, et al 2002,Freidman 1992, CIDA, 1996 Stromquist 1995)occurring mainly within economic, socio-cultural, political, legal, inter-personal andpsychological dimensions.1 For operationalpurposes, it becomes possible to group theseinto three broad categories, namely the socio-cultural, economic and political. Clearly,each of these dimensions is very broad, con-taining a range of sub-domains within whichpeople may be empowered. Social empower-ment encompasses both human capability(education, skills, health, access to safe wa-ter and sanitation, information and commu-nication) and social capabilities (social sta-tus, dignity, cultural expression, and a senseof belonging and solidarity in society andparticipation in social organizations).2 Eco-nomic empowerment is about expandingpeople’s economic capabilities to improvetheir access to productive assets (both physi-cal and financial) as well as access to eco-nomic opportunities (employment, marketsand production technologies) to make use ofthese capabilities. Political empowermentcannot be seen solely as the power to vote,but also as the power of voice and of collec-
tive action (Freidman 1992). It is about theexpansion of political capabilities/entitle-ment associated with democratic governance,encompassing opportunities for political dia-logue, dissent and critique, as well as votingrights and a participatory selection of legis-lators and executives.3
Sen’s capability approach, which providesthe foundation of the human developmentconcept, can be seen as an appropriate frame-work for conceptualizing andoperationalizing empowerment.4 Capabilityis a combination of functionings that a per-son can achieve, reflecting the freedom tolead one type of life over another. Given thatthese functionings are objectively observable,whereas the person’s capability (potentialbeing and doing) are unobservable facts,most empirical applications, including theHDI are often limited to measuring outcomesthrough achieved functionings (outcome-based evaluation), rather than measuring op-portunities through capabilities (Roemer1996). The capability approach is similar tothe notion of empowerment, comprising threeinterrelated components: resources, whichform the enabling conditions under whichchoices are made (similar to the notion ofprimary good or resource in the capabilityapproach); agency, which lies at the heart ofthe process through which choices are made(similar to the conversion factors influenced
1 Psychological empowerment is about the individual’s sense of potency (perceived competencies, self-confidence and self-determina-tion) which is largely a result of successful action in the social and political domain (Freidman 1992).
2 Capability may be seen as the capacity that enables people to increase their well-being – depending on a variety of factors, such aseducation, health, skills that are inherent in the family or skills that are acquired or learnt. In addition to its direct value (creative andhealthy life) in its own right, it has also instrumental value (indirect role) in influencing social, economic and political participationand entitlements (Sen 2001).
3 Democratic governance ensures that people’s human rights and freedoms are respected, that people have influence in decisions thataffect their lives and that they can hold decision-makers accountable.
4 Sen’s capability approach has contributed to an important paradigm shift in development economics with increased emphasis onincorporating individual entitlements, capabilities, freedoms and rights into conceptual foundation of economics and social choice.This approach can be seen as a framework of thought and stresses the plurality of purposes for which it can have relevance forconceptualizing and analyzing well-being and poverty, liberty and freedom and empowerment (Sen 1993).
278 R E A D I N G S I N H U M A N D E V E L O P M E N T
by instrumental freedoms); and achieve-ments, which are the outcomes of choices(achieved functionings/capabilities). If hu-man development is about enlargingpeople’s choices by enhancing theirfunctionings and capabilities, empowermentmeans that opportunities and choices mostbasic to human development are fully real-ized. Considering that poverty is the reflec-tion of disempowerment, capabilities andfunctionings may be the most appropriatefocal variables for measuring empowerment.If poverty includes all the dimensions of ca-pability deprivations, empowerment is theexpansion of assets and capabilities madepossible though freedom of choice and ac-tion. These assets and capabilities can bebroadly grouped into social (including hu-man), economic and political componentsto provide the conceptual foundation for de-veloping indicators for the three broad di-mensions of empowerment. The frameworkdelineating these dimensions of capabilityexpansion offers potential roadmaps foroperationalizing empowerment and mea-suring it.
CONSTRUCTINGTHE HEI FOR NEPAL
The HEI has been constructed to bring to-gether the available objective social, economicand political indicators into a composite in-dex of empowerment at a more disaggre-
gated level of spatial unit – in the case, thedistrict. It embodies5 a holistic perspective tomeasure the empowerment level of all hu-man beings at the district level in the samespirit of the HDI. The choice of indicators forcomputing empowerment index has beenlargely guided by reliance on availability ofrelevant quantitative indicators at the dis-trict level.6 As such, the indicators selectedfor use are neither exhaustive nor compre-hensive enough to measure all the crucialattributes of varied dimensions of empower-ment. Altogether, 15 objective indicators havebeen selected for capturing the three dimen-sions of empowerment in the composite In-dex briefly described below:
SocialAddressing the social dimension of empow-erment requires expanding both human(educational attainment, good health andother life-enhancing information technolo-gies/ skills) and social capabilities (socialstatus, dignity and a sense of belonging,leadership, trust, identity and the capacityto organize and participate in social orga-nizations) and entitlements through socialopportunities to address social exclusionand deprivation.! Educational Attainment: Knowledge is
a critical human choice in its own right.It is also valued as a constituent of thehuman capabilities to do other things(contributes to productivity, self-respect
5 Functionings are achievements more directly related to living conditions, whereas capabilities are ability to achieve or notions offreedom to enhance capabilities - real opportunities people have regarding the lives they may lead. The functionings that a person hasachieved are not sufficient to determine her or his overall well-being. Instead, it is the potential functionings that a person could haveachieved, given the opportunity to choose or exercise freedom of choice. While the potential functionings (or capabilities) of anindividual cannot be easily evaluated, the achieved functionings can be measured, observed and compared.
6 Most subjective/ qualitative variables crucial for measuring empowerment are not available at the district level. Nor are theyconceptually possible to link to available objective indicators so as to arrive at the composite index of empowerment. Even the existingdatabases are not sufficiently rich to provide a useful set of objective indicators, especially to measure political empowerment.
279E M P O W E R M E N T – T H E C E N T R E P I E C E
O F H U M A N D E V E L O P M E N T
and relative power or empowerment) –instrumental empowerment. As in thecase of HDI, the two sets of indicatorsused to capture the educational attain-ment are adult literacy and mean yearsof schooling.
! Health Status: As with knowledge, thehealth of a country’s citizens is anothercritical human choice. Life expectancy atbirth is certainly the most comprehensiveindicator of the health outcome. But thecapability expansion in health has beenmeasured by three indicators, namely in-fant mortality per 1000 live births, chronicmalnutrition among children under 5,and the proportion of population withaccess to sanitation facilities. These indi-cators can be considered more meaning-ful and sensitive for capturing short-termpolicy changes than long- term stock vari-ables, such as life expectancy.
! Information and Communication: Infor-mation is power. Conceptually, access toinformation and justice cannot be seenonly as the outreach of mass informationand communication media (newspapers,radio, TV) but also the degree of open-ness in their access (the Right to Informa-tion Act, mechanisms for social audits).7
In the absence of the latter set of indica-tors (objective), the extent of mass infor-mation and communication media hasbeen proximated by the population servedby radio and telephone.
! Participation in Local Organizations: Theparticipation of people in social organi-
zations is considered one of the criticalelements of social empowerment. Orga-nized communities are more likely tohave their voices heard and their de-mands met than unorganized commu-nities. The proportion of householdmembers participating in various socialorganizations (outreach of social orga-nization) has been included as a proxyfor capturing social capital or capabili-ties of organized communities at the dis-trict level.
EconomicAddressing the economic dimension of em-powerment requires enhancing economicentitlements and capabilities through theexpansion of economic facilities/infrastruc-ture and promoting equitable access to eco-nomic opportunities. Economic empower-ment is measured by five sets of indicatorsthat reflect access to land and its distribu-tion, access to credit, employment and percapita income.! Access to and control over productive
assets: In many developing countries, in-cluding Nepal, where poverty is predomi-nantly a rural phenomenon, lack of ac-cess to land and its unequal distributionremains a critical barrier to economicempowerment of the poor. To better re-flect unequal control over economic re-sources, the inequality adjusted or Gini-corrected average size of land holding8
has been used.
7 While the people may have the constitutional right to demand information on any matter of public importance, such a provisioncannot be realized without specific legislation adopted by the government.
8 When G is the Gini coefficient utilized to measure the degree of inequality in the distribution of land-holding and L is the average sizeof operational holding, Gini corrected average land holding (W) is computed as W= L( 1-G). If a particular district has a higher valueof W, then it can be seen as having higher level of productive asset than the latter.

280 R E A D I N G S I N H U M A N D E V E L O P M E N T
! Access to Financial Resources: In addi-tion to the physical assets such as land,other financial assets – particularlycredit – are of the foremost importance toany understanding of the economic em-powerment of people, especially the poor.The proportion of households benefitingfrom institutional credit is an importantindicator for reflecting the coverage of in-stitutional credit in the country.
! Access to electrification: The availabil-ity of electricity creates many avenues fordevelopment and empowerment ofpeople; it enables them to start up or ex-pand small-scale economic enterprises forreducing poverty and also creates theopportunity for climbing up the energyladder. The proportion of householdsthat are connected to electricity has beenincluded to proximate the role of enablingeconomic infrastructure for empoweringthe people.
! Employment: With Nepal’s persistentlyhigh levels of unemployment and under-employment, there is mounting concernabout the economic exclusion that followsfrom limited employment opportunities,poor labour market information systemsand discriminatory labour market prac-tices in the country. The ratio of labourforce employed in non-agricultural em-ployment is used to capture the extent ofsectoral shift/transformation in employ-ment away from agricultural jobs (towardsnon-agricultural wage employment).
! Income: As a crucial means to a numberof important ends (control over purchas-able commodities), income has great sig-nificance in the accounting of economiccapabilities in an indirect way (both asproxy and as causal antecedent) aboutthe ability of a person to do thing that sheor he has reason to value (Anand and Sen2000). Per capita GDP in PPP $ is treatedas source of economic power in the samespirit as GEM as opposed to adjusting itto take into account the law of diminish-ing returns, as in the HDI.
PoliticalConceptually, both negative (freedom fromarbitrary arrest, exclusion) as well as posi-tive (freedom to vote, participate in politicaland social life) aspects of political freedomshould be captured by focusing on both theformal availability and actual exercise ofpolitical freedom by people. Most of the indi-cators reflecting the attributes of politicalempowerment are subjective in nature9 and,as such, they are open to dispute and to per-ception biases. Second, subjective indicatorscannot be conceptually linked to objectiveindicators in the formulation of the compos-ite index. Voter turnout and the existence ofcompetitive and fair elections are the twomost widely used and readily available ob-jective indicators of democracy and politicalrights10 and are thus used in the absence ofany other readily available objective indica-
9 A World Bank team has constructed six aggregate indices based on numerous indicators from more than a dozen sources: voice andaccountability, political instability and violence, rule of law, corruption, government effectiveness and regulatory burden. The voiceand accountability index combines several indicators of the political process, including the selection of governments, with indicatorsof civil liberties and political rights, and press freedom and independence (UNDP 2002b).
10 Even these readily available objective indicators are not without ambiguity and controversy, as they often fail to capture the wide-spread, substantive participation-and accountability of people holding power required for the truly democratic governance. Forexample, the very low voter turnout in the local government election is also visible even in the healthiest democratic system such asBritain. In some cases a country may hold elections without their ever resulting in a change in power, whereas in others there arechanges in power, but civil liberties such as press freedoms may be curtailed.

281E M P O W E R M E N T – T H E C E N T R E P I E C E
O F H U M A N D E V E L O P M E N T
tors at the district. The first indicator is in-dented to capture the extent of participationin political process to exercise their votingrights, while the latter indicator is includedto measure the degree of competition amongcitizens in the local election.
NORMALIZATION AND SCALING
Each variable selected for measuring differ-ent dimensions of empowerment is normal-ized through a process of scaling. The nor-malized variable is constructed by the ratioof difference between the observed value andthe minimum value to the difference of themaximum value and the minimum value.This method transforms the values of all in-dicators from 0 (worst condition) to 1 (bestcondition) of spatial unit (district in our case)and handles the indicators that are directlyproportional to the well-being (equation 1)and those that are inversely proportional toempowerment or well-being (equation 2). Thenormalized variable, which is a pure num-ber, shows for a particular variable the pathcovered by a society as a proportion of thepath to be covered.
( )
( )1( )minmax ii
ijXX
XXI
–
–=
ij ( )mini
Where Iij is the normalized value of ith indica-tor for jth region (district) in the country. Xij isthe observed value of ith indicators for jth dis-trict whereas Xi (max) and Xi (min) are the maxi-mum and minimum value of the same indi-cators respectively.
( )
( ) ( )
( )2*
minmax
max
ii
iji
ijXX
XXI
–
–=
A composite index of empowerment is thesimple arithmetic mean of these three dimen-sions of empowerment. The maximum valueof the empowerment index is 1 and the mini-mum value is 0.
IN
1EI
n
ijj �1i =
= ( )3
Where EIj is the overall empowerment indexfor jth spatial unit (districts and eco-develop-ment region in this case) and Iij denote thenormalized value of ith sub indices, compris-ing social, economic and political empower-ment for jth spatial unit. N is the number ofthree sub-indices: those for social, economicand political empowerment. Box 10.1 illus-trates the calculation of the human empow-erment index for Nepal based on the estimateof normalized value of each indicator.
SCOPE FOR FURTHER RESEARCH
There is a scope for refinements of the HEIin a number of ways. First, there is a needfor further research to explore the thresh-old level for certain indicators beyondwhich an individual or community mayfeel empowered in each sphere of life. Insome cases, a very low level ofdisempowerment for a single indicator –no matter how high or empowered a re-gion is relative to other indicators – may beenough to dominate all other consider-ations. Second, there is a need to fix thegoalpost for all indicators in order to makethe HEI comparable over time. In the ab-sence of such information, the observedminimum and maximum value of indica-tors across the regions/districts have to beutilized for normalizing the indicators and

282 R E A D I N G S I N H U M A N D E V E L O P M E N T
BOX 10.1 Summary Illustration of Human Empowerment index Calculation for Nepal
SOCIAL EMPOWERMENT INDEX
Adult literacy Index (i.e., normalized value of adult literacy rate) = 0.538
Mean Years of Schooling Index = 0.320
Education Index = (0.538+0.320)/2 = 0.429
Infant mortality Index = 0.703
Malnourished children under 5 index = 0.623
Population with access to sanitation Index = 0.362
Health Index = (0.703+0.623+0.362)/3 = 0.563
Radio ownership Index = 0.443
Access to Telephone Index = 0.151
Information & Communication Index =(0.442+0.151)/2 = 0.297
Social mobilization outreach Index = 0.336
Social Empowerment Index = (0.429+0.563+0.297+0.336)/4 = 0.406
ECONOMIC EMPOWERMENT INDEX
Gini corrected average land holding Index = 0.540
Electrification Index = 0.317
Access to institutional credit Index = 0.289
Non agricultural sector job Index = 0.309
Income Index = 0.229
Economic Empowerment Index =
(0.54+0.317+0.289+0.309+0.229)/5 = 0.337
POLITICAL EMPOWERMENT INDEX
Voters Turn out Index = 0.698
Degree of competition (candidates per seat) Index = 0.594
Political Empowerment Index = (0.698+0.594)/2 = 0.646
HUMAN EMPOWERMENT INDEX = (0.406+0.337+0.646)/3 = 0.463
Source: UNDP 2004b.

283E M P O W E R M E N T – T H E C E N T R E P I E C E
O F H U M A N D E V E L O P M E N T
this was the method also used by UNDPinitially (till 1994) in normalizing HDI in-dicators. A third possible refinement is toexplore the possibility of assigningweights for each indicator – although thetreatment of weight is not always free fromdispute. While the assumption of no sub-stitution among some indicators that areimportant in their own right makes theequal weighting defensible, more researchis needed to explore the substitution pos-sibilities among indicators through mod-eling. In summary, as a much broader con-cept, human empowerment includes manyaspects – both subjective perceptions and
objective realities of life – that have not beenpossible to fully capture, or are not beingmeasured. Political freedom, participationin decision-making, personal security, andthreats to sustainability (environment) aresome critical aspects of human empower-ment that are difficult to measure. Whilethese have currently deterred our efforts toinclude other pertinent governance-relatedsubjective indicators of political empower-ment, constant research in this area, togetherwith the establishment of disaggregateddata, will certainly provide scope for cap-turing a greater number of the aspects ofpolitical empowerment in future.

B I B L I O G R A P H I C N O T E 285
Bibliographic Note
Chapter 1 draws on Amin 1974; Chenery, et al 1974;Frank 1967; Fukuda-Parr 2002, Fukuda-Parr and ShivaKumar 2003; Haq 1971, 1990, 1995, 1997, 1999;Hirschman 1958; ILO 1976; Jahan 2004; Jolly 2003; Lewis1955; Myrdal 1970, 1971; Nurkse 1970; Rawls 1971;Rostow 1960; Sen 1989, 1999, 2000; Sharma 1967, 1980;Streeten 2003; Sunkel 1973; UNDP 1991, 1992, 1993,1994, 1995, 1996, 1997, 1999, 2000, 2003, 2004a, 2004b;and WCED 1987.
Chapter 2 draws on Anand 1994; Anand and Sen 2003a,2003b, 2003c; Atkinson 1970; Chhetry 2004; Desai 2003;Fukuda-Parr and Shiva Kumar 2003; Fukuda-Parr,Raworth and Shiva Kumar 2003; Lanjouw, et al 1998;Raworth and Stewart 2003; and UNDP 1990, 1995, 1996,1997, 2002b.
Chapter 3 draws on Acharya and others 2004; Bennett2003; CBS 2002; Gurung and others 2000; NESAC 1988;Neupane 2002; NPC 2002; and UNDP 1997, 2004b.
Chapter 4 draws on AIDOS 2004; Bandarage 1984; Bangand Bang 1989; Beneria 1987; Boserup 1970; Burk 2005;Buvinic and Rao Gupta 1997; CBS 2004; England 2000;FAO/RAP 1996; Fukuda-Parr and Shiva Kumar 2003;Hakim, et al 1998; HDR in South Asia 2000; Jaquette1982; Jiggens 1998; Kabeer 1999; Marcoux 1998;McFarland 1988; Moghadam 1998; NESAC 1998; Pearce1970; Prabhu 2003; Pradhan 1995, 2003; Presser and Sen2000; Roberts 1981; Robeyns 2002; Seguino 2002; Sen1998, 2003; Staudt 1998; UNDP 1995, 1999, 2004a, 2004b;Wijayatilake 2004; Young 1988; and Younis, Khattab,Zurayk, El-Mouelhy, Amin, Faraq 1993.
Chapter 5 draws on CBS 1996, 1999, 2004; Hallak 1990;MoES 2004; Mohsin 1974; Pande 1978; Parajuli 1999;Sharma 1986; TPAMF 2005; and UNDP 2001.
Chapter 6 draws on Basu 1989; Caldwell 1986, 2003;Caldwell and Santow 1989; Caldwell, Findley, et al1990; Calvert-Henderson 2000-2004; Carr 2004; Carr, etal 1999; Chen, Haq and D’Sonza 1981; Das Gupta 1987;Evans 2001; Gwatkin 2000, 2001, 2002; Gwatkin, et al2003; Haines 1999; Health for All 2003; Heise, et al1999; HMG/N/DHS 2003; HMG/N/MoH 2004; Kishoreand Johnson 2004; Lederberg, et al 1992; Lemaire 2001;MoH/HMG/N 1998; Morse 1994; Mosley and Chen1984; Murray, et al 2002; Omran 1971; Pande 2000;Philipson and Soars 2001; Pradhan 1995, 2003; PRB
1999; Preston and others 1975; Preston 1975; Ransomand Elder 2003; Raya 2001; Sajeda 1990; Sen 1992, 1998,1999; Simons and others 1989; UN 2000; UNDP 1990,1995, 1996, 2000, 2002a; UNFPA 2001; Whitehead 2000;Whitehead, et al 2002; WHO 1978, 1997, 2001, 2002,2003; and World Bank 1997.
Chapter 7 draws on Aires, et al 1996; Banskota 2002;Becker 1997; Brown 1978; Carson 1985, 1992; CBS 2003b;CEN/ENPHO 2003; Conway 1983; Costanza 1991; DHM2001; Ehrlich and others 1977; Forsyth and Scoones Leach1998; Gill and Dale 1974; Haq 2003; HMG/N/NPC/UNDP/MOPE 2003; HMG/N/UNDP 2002; IUCN 2002,2003, 2004; Jodha, et al 1992; Jones, Phil and Palutikofn.d.; Khadka, et al 2000; Kumar 2003; LFP 2003; Lomborg2001; LRMP 1986a, 1986b; Mahat 1987; Meadows, et al1972; Miller, et al 2001; MOFSC 2002; MOPE 2000; NPC2003; Oxford 1995; Panos 2002; Pradhan 1999; Pradhan,et al 2003; Prescott-Allen 2001; Qizilbash 1996; Rambo1997; Reardon and Vosti 1995; Sarkar 1998; Sen 2003;South Centre 1991; Tuladhar 2003; ucsusa n.d.; UN 2003;UNCED 1992; UNDP 1998; UNEP 2002a, 2002b, 2004a,2004b; WCED 1987; wikipedia n.d; and Wyatt-Smith1982.
Chapter 8 draws on Acharya, Khatiwada and Aryal 2003;ActionAid USA/ActionAid Uganda 2004; ADB 2003;Allan 2003; Caplan 2000; CBS 2003a; Chandrashekhar2003; Deraniyagala 2003; Fukuda-Parr 2002; Harris 2001;IFAD 2001; IIDS 1999; Kanbur 2001; Kanbur and Squire1999; Khatiwada 2003, 2005; Maajis 2003; NESAC 1998;NPC 2003, 2004; Parasuraman, Gomathy and Fernandez2003; Poudel and Niraula 1998; Prennushi 1998;Pyakuryal 2004; Roy 2003; SAAPE 2003; Sen 1983, 2000;Sengupta 2001; Sharma 2003a, 2003b; UNDP 1997, 2000,2003, 2002b, 2004b; Upadhya 2000; Watts 2004; andWorld Bank 2001.
Chapter 9 draws on Dahal 2002c; Dahal-b; Dahl 1989;Fukuda-Parr and Shiva Kumar 2003; Joshi 2004; andUNDP 1993, 1997, 2000, 2002b.
Chapter 10 heavely draws on the Nepal HumanDevelopment Report 2004 (UNDP 2004b) as well asthe following references: Anand and Sen 2000;Freidman 1992; Jahan 1999; Kabeer 1999; Malhotra, etal 2002; Naryan, et al 2000; Rich, et al 1995; Roemer1996; Sen 1993, 2000, 2001; Stern 2002; and WorldBank 2002.

286 B I B L I O G R A P H I C N O T E
R E F E R E N C E S 287
References
Acharya, Meena, and others. 2004. ‘Analysis of Caste,Ethnicity and Gender Data from 2001 PopulationCensus in Preparation for Poverty Mapping andWider PRSP Monitoring’. Report to DFID byTanka Prasad Acharya Memorial Foundation.Kathmandu.
Acharya, Meena, Yubaraj Khatiwada, and ShankarAryal. 2003. Structural Adjustment Policies andPoverty Eradication. Kathmandu: Institute forIntegrated Development Studies.
ActionAid USA, and ActionAid Uganda. 2004.Rethinking Participation: Questions for CivilSociety about the Limits of Participation inPRSPs. Washington, DC: ActionAid.
ADB (Asian Development Bank). 2003. CountryStrategy and Program Update: Nepal 2004-06.Manila.
AIDOS. 2004. A Practical Approach to Gender-BasedVoilence: A Programme Guide for Health CareProvides and Managers. Italian Association forWomen and Development.
Aires, Robert, Beatriz Castaneda, Cutler J. Cleveland,Robert Costanza, Daly, Folke Herman, HannonCarl, Harris Jonathan Bruce, Robert Kaufmann,Xiannuan Lin, Richard Norgaard, Matthias Ruth,Daniel Spreng, David I. Stern, C.J.M. Van denBergh. 1996. “Natural Capital, Human Capital,and Sustainable Economic Growth”. Workshopon Assessing the Role of Human and NaturalCapital in Economic Production. Sponsored byMacArthur Foundation and held at the Centrefor Energy and Environmental Studies at BostonUniversity, August 2-3.
Allan, Colm. 2003. Accountability and Social Activism:A New Strategy for Achieving Socio-EconomicRights in a Democratic South Africa. Cape Town:Public Service Accountability Monitor.
Amin. Samir. 1974. Accumulation as a World Scale. Acriti que of the theory of under-development.New York: Monthly Review Press.
Anand, Sudhir. 1994. “Population, Well-being, andFreedom”. In Gita Sen, Adrienne Germain, andLincoln C. Chen, eds. Population PoliciesReconsidered: Health Empowerment andRights. Harvard University Press.
Anand, S., and A. K. Sen. 1994. The HumanDevelopment Index: Methodology andMeasurement. Working Paper 12. New York:Human Development Report Office, UnitedNations Development Programme.
. 2003a. “Concepts of Human Developmentand Poverty: A Multidimensional Perspective”.In Fukuda-Parr, and Shiva Kumar, eds.Readings in Human Development. New Delhi:Oxford.
. 2003b. “Gender Inequality in HumanDevelopment: Theories and Measurement”. InFukuda-Parr, and Shiva Kumar, eds. Readingsin Human Development. New Delhi: Oxford.
. 2003c. “Human Development Index:Methodology and Measurement”. In Fukuda-Parr, and Shiva Kumar, eds. Readings inHuman Development. New Delhi: Oxford.
Atkinson, Anthony B. 1970. On the Measurement ofInequality. Journal of Economic Theory 2(3),September, 244-63.
Bandarage, Asoka. 1984. “Women in Development:Liberalism, Marxism and Marxist Feminism”,Development and Change, Vol. 15.
Bang, R. A., and A. T. Bang. 1989. High Prevalence ofGynecological Diseases in Rural IndianWomen. The Lancet, January 14, 85-88.
Banskota, M. 2002. “Resources - Managing Demand”in World Conservation Mountain High The IUCNBulletin Number 1, 2002.
Boserup, Ester. 1970. Women’s Role in EconomicDevelopment. Allen and Unwin. London.
Basu, Alaka M. 1989. Culture, the Status of Women andDemographic Behavior. Oxford: Clarendon Press.
Becker, Barbara. 1997. Sustainability Assessment: AReview of Values, Concepts and MethodologicalApproaches. Issues in Agriculture 10,Consultative Group on International AgriculturalResearch. Washington, DC: CGIAR Secretariat.
Beneria, Lourdes. 1987. “Introduction and TheoreticalFramework”. In L. Beneria, and M. Roldan,eds. The Cross Roads of Class and Gender:Homework, Subcontracting and HouseholdDynamics in Mexico City. Chicago: ChicagoUniversity Press.

288 R E F E R E N C E S
Bennett, Lynn. 2003. ‘Towards an Inclusive Society:Agency, Structure and Diversity in Nepal. ‘Paperpresented at the Agenda of Transformation:Inclusion in Nepali Democracy. Lalitpur: SocialScience Baha.
Brown, Lester R. 1978. The Twenty Ninth Day. NewYork: W.W. Norton and Company Inc.
Buvinic, Mayra, and Geeta Rao Gupta. 1997. “Female-Headed Households and Female-MaintainedFamilies: Are They Worth Targeting to ReducePoverty in Developing Countries?” In EconomicDevelopment and Cultural Change, Vol. 45, No.2: 259-80. Chicago: The University of Chicago.
Burk, Martha. 2005. Cult of Power. Sex Discriminationin Corporate America and What can be DoneAbout It? New York. .........................
Caldwell, J. C. 1986. “Routes to Low Mortality in PoorCountries”. In Population and DevelopmentReview, Vol. 12.
. 2003. “Mortality in Relation to EconomicDevelopment”. Bulletin of the World HealthOrganization, Vol. 81, No. 11, pp 831-832, ISSPN0042-9686.
Caldwell, John C., and Gigi Santow, eds. 1989.Selected Readings in the Cultural, Social, andBehavioral Determinants of Health. HealthTransition Series No. 1. Canberra: HighlandPress for The Australian National University.
Caldwell, J.C., S. Findley, et al, eds. 1990. “What weknow about Health Transition: The Cultural,Social and Behavioral Determinants of Health”.The Proceedings on a International Workshop,Canberra, May 1989. Health Transition SeriesNo. 2. ANU, Canberra.
Calvert-Henderson. 2000–2004. Quality of LifeIndicators. Accessed on line http://www.calvert-henderson.com/index.htm.
Caplan, Lionel. 2000. Land and Social Change in EastNepal: A Study of Hindu Tribal Relations.Kathmandu: Himal Books.
Carr, Dara. 2004. “Improving the Health of the World’sPoorest People”. In Health Bulletin No. 1.Washington, DC: Population Reference Bureau.
Carr, D., D. Gwatkins, D. Fragueiro, and R. Pande.1999. A Guide to Country Level Informationabout Equity, Poverty, and Health Availablefrom Multi-Country Research Programme.Washington: World Bank.
Carson, B. 1985. Erosion and sedimentation processin the Nepalese Himalaya. ICIMOD OccasionalPaper No. 1. Kathmandu: International Centrefor Integrated Mountain Development.
. 1992. The land, the farmer and the future. ASoil Fertility Management Strategy for Nepal.ICIMOD Occasional paper No. 21. Kathmandu:International Centre for Integrated MountainDevelopment.
CBS (Central Bureau of Statistics). 1993. Population Census1991, Vol. I. Kathmandu: National PlanningCommission/His Majesty’s Government of Nepal.
. 1996. Nepal Living Standard Survey.Kathmandu.
. 1999. National Labour Force Survey. Kathmandu.
. 2002. Population Census 2001. Kathmandu.
. 2003a. Population Monograph of Nepal,Vol. I. Kathmandu.
. 2003b. A Handbook of Environment Statistics2003. Kathmandu: Central Bureau of Statistics,and National Planning Commission.
. 2004. Nepal Living Standard Survey.Kathmandu.
. 2005. Poverty Trends in Nepal, 1995-96; 2003-04. Kathmandu.
CIDA (Canadian International Development Agency).1996. Guide to Gender Sensitive Indicators.Ottawa: Geneva.
CEN/ENPHO (Clean Energy Nepal/Environment andPublic Health Organization). 2003. HealthImpacts of Kathmandu’s Air Pollution. Submittedto Kathmandu Electric Vehicle Alliance,September 2003.
Chandrashekhar, C. P. 2003. What is Wrong with thePRSP as an Instrument Promoting aDevelopment Paradigm, and What Could Bethe Alternative? Bangkok: ActionAid Asia.
Chaudhury, R. H. 2002. “Socio-cultural Factors AffectingDemographic and Reproductive Health Behaviorand the Implication for Population Policy andProgrammes”. In Integrating Socio-culturalResearch into Population and Reproductive HealthProgrammes: Workshop Report, 26 November – 1December. Kathmandu: UNFPA/CST.
Chhetry, D. 2004. “Practices of Poverty Measurement andPoverty Profile of Nepal”. To appear in Economicand Research Department, Working Paper No. 57from Asian Development Bank. Manila.
Chenery, D., B. Hollis, et al. 1974. Redistribution withGrowth. London: Oxford.
Chen, Lincoln, E. Haq, and S. D’Douza. 1981. “SexBias in the Family Allocation of Food and HealthCare in Rural Bangladesh”. Population andDevelopment Review, Vol. 7.
Conway, G. R. 1983. Agroecosystem Analysis. London:Imperial College of Science and Technology.
Costanza, R., ed. 1991. Ecological Economics: TheScience and Management of Sustainability. NewYork: Columbia University Press.
Dahal, Dev Raj, ‘Towards Alternatives: Vision of GoodGovernance in Nepal’. www.nepaldemocracy.org/institutions/vision_of_goodgovernance.html.
. 2002. ‘Governance Challenges for Nepal’. InReadings on Governance and Development,Institute of Governance and Development.Kathmandu.

R E F E R E N C E S 289
Dahl, Robert A. 1989. Democracy and its Critics, IndianReprint 1991. Hyderabad: Orient Longman.
Deraniyagala, Sonali. 2003. “The Macroeconomics ofPoverty Reduction in Nepal: An Overview”. InThe Macroeconomics of Poverty Reduction:The Case Study of Nepal (draft of August). NewYork: United Nations Development Programme.
Das Gupta, Monica. 1987. “Selective Discriminationagainst Female Children in Panjab, India”. InPopulation and Development Review, 13 (1):77-100.
Dasgupta, et al. 2001. “Why is Son Preference soPersistent in East and South Asia? A Cross-Country Study China, India and the Republic ofKorea”, working paper. World Bank.
Desai, M. 2003. “Measuring Political Freedom”. InFukuda-Parr, and Shiva Kumar, eds. Readingsin Human Development. New Delhi: Oxford.
DHM (Department of Hydrology and Meteorology).2001. Hydrological Records of Nepal: StreamFlow Summary. Kathmandu.
Ehrlich, Paul, Anne H. Ehrlich, and John P. Holdren.1997. Ecoscience Population, Resources,Environment. San Francisco: W.H. Freeman andCompany.
England, P. 2000. “Conceptualizing Women’sEmpowerment in Countries of the North”. InHarriet B. Presser, and Geeta Sen, eds.Women’s Empowerment and DemographicProcesses. Oxford University Press.
Escobar, Arturo. 1994. Encountering Development.New Jersey: Princeton University Press.
Evants, Timothy. 2001. “Challenging inequalities inHealth from Ethics to Action”. Summary.Rockefeller Foundation/Swedish InternationalDevelopment Cooperation Agency.
FAO/RAP. 1996. “Rural families and HouseholdEconomies in Asia and the Pacific”. Report ofa Regional Expert Consultation held in Bangkok,November 7-10, 1995. Bangkok: RAPpublication.
Forsyth, Tim, and Melissa with Ian Scoones Leach.1998. Poverty and Environment: Priorities forResearch and Policy an Overview Study.Prepared for the UNDP and EuropeanCommission. Sussex: Institute of DevelopmentStudies.
Frank, Andre Gunder. 1967. Capitalism andUnderdevelopment in Latin America. NewYork: Monthly Review Press.
Freidman, John. 1992. Empowerment: The Politics ofAlternative Development. Cambridge, Mass.:Blackwell Publishers.
Fukuda-Parr, Sakiko. 2002. Operationalising AmartyaSen’s Ideas on Capabilities, Development,Freedom and Human Rights - The Shifting PolicyFocus of the Human Development Approach.New York: United Nations DevelopmentProgramme.
Fukuda-Parr, Sakiko, and A.K. Shiva Kumar, eds. 2003.Readings in Human Development. New Delhi:Oxford University Press.
Fukuda-Parr, Sakiko, Kate Raworth, and A. K. ShivaKumar. 2003. Using HDI for Policy Analysis. InFukuda-Parr, and A.K. Shiva Kumar, eds.Readings in Human Development. Op cit.
Gill, Vernon, and Tom Dale. 1974. Top Soil andCivilization. Norman: University of OklahomaPress .
Gurugharana, Kishore Kumar. 1996. “StructuralAdjustment. Concept and Practices withReference to South Asia”. In A. P. Shrestha,and N.R. Dahal 1996. Structural AdjustmentProgramme in Nepal. Impact on Workers, Pp.12- 32. Kathmandu: FESNEFAS.
. 1998. “Poverty Measurements,Determinants and Dynamics in Nepal”. InProceedings of a National Poverty Workshop.Kathmandu: ActionAid Nepal.
Gurung, Harka, and others. 2000. Janajati BikashkoJukti. Translated as Development ofNationalities: A Strategy Paper 2004.Kathmandu: Nationalities DevelopmentCoordination Centre.
Gwatkin, Davidson R. 2000. “Health Inequalities andthe Health of the Poor: What do we know?What Can We Do?” Bulletin of the World HealthOrganization, Vol. 78 (1). WHO.
. 2002. “Reducing health inequalities indeveloping countries”. In Oxford Textbook ofPublic Health. UK: Oxford University Press.
Gwatkin, D., et al. 2003. Initial Country-levelInformation about Socio-Economic Differencesin Health, Nutrition and Population, 2nd edition.Washington, DC: The World Bank.
Haines, Micheal. 1999. “The Great Modern Transition”.Chapter prepared as Presidential Address to theannual meeting of the Social Science HistoryAssociation. Fort Worth, Texas.
Hakim, A., et al. 1998. Pakistan Fertility and FamilyPlanning Survey 1996-97. Population Instituteof Pop. Studies and Centre for PopulationStudies, London School of Hygiene and TropicalMedicine.
Hallak, Jacques. 1990. Investing in the Future. Paris:Unesco.

290 R E F E R E N C E S
Haq, Mahbub ul. 1971. “Employment and IncomeDistribution in the 1970s: A New Perspective”.In Haq 1976. The Poverty Curtain: Choices for theThird World. New York: Columbia UniversityPress.
. 1990. Human Development Paradigm. NewYork: United Nations Development Programme.
. 1995. Reflections on Human Development.New York: Oxford University Press.
. 1997. Human Development in South Asia 1997.Karachi: Oxford University Press.
. 1999. Reflections on Human Development.Delhi: Oxford University Press.
. 2003. “The Birth of the Human DevelopmentIndex”. In Fukuda-Parr, and A.K. Shiva Kumar,eds. Readings in Human Development. Op cit.
Harris, John. 2001. Depoliticizing Development. Delhi:LeftWord Books.
HDC. 1995. Human Development in South Asia 1995.New York: Oxford University Press.
Health for All. 2003. Accessed online at<www.phmovement.org> and www.iphglobal.org.
Heise, L., M. Ellsberg, and M. Gottemoeller. 1999.“Ending Violence Against Women”. PopulationReports, Series L, No. 11. Baltimore, MD: JohnHopkins University School of Public Health,Population Information Programme.
Hill, K., Zahr C. Abou, and T. Wardlaw. 2001.“Estimates of maternal mortality of 1995”.Bulletin of the World Health Organization, 79(3):182-193.
Hirschman, A. O. 1958. The Strategy of EconomicDevelopment. New Haven: Yale.
HMG/N/MoH (His Majesty’s Government of Nepal/Ministry of Health). 2004. Annual Report 2004.Kathmandu: Department of Health Services.
HMG/N/NPC/UNDP/MOPE (His Majesty’sGovernment of Nepal/National PlanningCommission/United nations DevelopmentProgramme/Ministry of Population andEnvironment). 2003. Sustainable DevelopmentAgenda for Nepal. Kathmandu: His Majesty’sGovernment of Nepal.
ICIMOD/CBS (International Centre for IntegratedMountain Development/Central Bureau ofStatistics). 2003. Districts of Nepal. Indicatorsof Development. Update 2003.
IFAD (International Fund for Agricultural Development).2001. Rural Poverty Report 2001: The Challengeof Ending Rural Poverty. Oxford: OxfordUniversity Press.
IIDS (Institute for Integrated Development Studies). 1999.Do We Need Economic Reforms Phase II:Proceedings of a National Workshop. Kathmandu.
ILO (International Labour Organisation). 1976.Employment, Growth and Basic Needs: A One-World Problem. Geneva.
IUCN (International Union for the Conservation ofNature). 2002. Conservation and Sustainable Useof Wetlands in Nepal. Draft Project Brief.Kathmandu.
. 2003. Protected Areas in 2003. Scenarios for AnUncertain Future. Gland.
. 2004. Urban Air Quality Changes and PolicyMeasures: A Review of Recent Conditions inNepal. Kathmandu.
Jahan, Selim. 1999. “Measurement of HumanDevelopment: Evolution of Indices and Indicators”.Paper Presented at the First Global Forum onHuman Development. New York.
. 2004. “Human Rights-based approach topoverty reduction - Analytical linkages, practicalwork and UNDP”. Paper presented to the Highlevel Seminar under Global Partnership forDevelopment on Right to Developmentorganized by UN Office of the HighCommissioner on Human Rights, 9-10 Feb 2004.Geneva.
Jaquatte, Jane S. 1982. “Women and ModernizationTheory: A Decade of Feminist Criticism” inWorld Politics 34, No.2.
Jiggens, Janice. 1998. “The Feminization ofAgriculture”. The Brown Journal of WorldAffairs, Summer/Fall, Volume V, Issue 2,1998:251-262.
Jodha, N.S., M. Banskota, and T. Partap, eds. 1992.Sustainable Mountain Agriculture. New Delhi:Oxford and IBH Publishing Co. Ltd.
Jolly, Richard. 2003. “Human development and neo-liberalism. Paradigms compared”. In Fukuda-Parr, and Shiva Kumar, eds. Readings inHuman Development. New Delhi: Oxford.
Jones, Phil, and Palutikof. “Global TemperatureRecord”. http://www.cru.uea.ac.uk/cru/info/warming/.
Joshi, Janak Raj. 2004. Governance Reform andCorruption Control. Paper presented in thePre-consultation for Nepal Development Forum2004. Kathmandu: His Majesty’s Government,Ministry of Finance.
Kabeer, Naila. 1999. The conditions and consequencesof choice: Reflection on the measurement ofWomen Empowerment. UNRISD discussionpaper 108. Geneva: United Nation ResearchInstitute for Social Development.
Kanbur, Ravi. 2001. Economic Policy, Distribution andPoverty: The Nature of Disagreements. New York:Cornell University.

R E F E R E N C E S 291
Kanbur, Ravi, and Lyn Squire. 1999. The Evolution ofThinking about Poverty: Exploring theInteractions. New York: Cornell University.
Khadka, Ram B., Stefan Gorzulla, and Sudesh K. Malla.2000. Environmental Impact Assessment Processfor Hydropower Project in Nepal. Kathmandu:Department of Electricity Development, Ministryof Water Resources, His Majesty’s Government ofNepal, USAID, International Resource Group, andNational EIA Association in Nepal.
Khatiwada, Yuba Raj. 2003. “Macroeconomic Policy andPoverty in Nepal” in The Macroeconomics ofPoverty Reduction: The Case Study of Nepal. NewYork: United Nations Development Programme.
. 2005. Linkage between Trade, Developmentand Poverty. Paper submitted to SAWTEE.Kathmandu.
Kishor, Sunita, and Kiersten Johnson. 2004. ProfilingDomestic Violence: A Multi-Country Study.Carlverton, Maryland: ORC Macro.
Kumar, Mayank. 2003. “Environment: Functioning andChange”. In Economic and Political Weekly(EPW), Vol. xxxviii, No. 46, pp 4847-4849.
Lanjouw, P, G. Prennushi, and S. Zaidi. 1998. Povertyin Nepal Today. Tathakna Gatibidhi (FourMonthly Statistical Bulletin). Kathmandu:Central Bureau of Statistics.
Lederberg, J., et al. 1992. “Emerging Infection: MicrobalThreats to Health in the United States”.Washington, DC: Inst. Med., Natl. Acad. Press.
Lemaire, J. 2001. “Why do Females Live Longer thanMen”.
Lewis, W. Arthur. 1955. Theory of Economic Growth.Homewood.
LFP (Livelihoods and Forestry Programme). 2003. HillLivelihoods Baseline Study Report ofLivelihoods and Forestry Programme.Kathmandu: Livelihoods and ForestryProgramme in collaboration with TANGOInternational, Inc. USA, and Development VisionNepal.
Lomborg, Bjom. 2001. The Sceptical Environmentalist.London: Cambridge University Press.
LRMP (Land Resources Mapping Project). 1986a. LandUtilization Report. Kathmandu: Kenting EarthSciences Limited.
. 1986b. Agricultural Forestry Project.Kathmandu: Kenting Earth Science Limited.
Maajis, Nomaan. 2003. “Globalization and Poverty”.Employment Paper 54. Geneva: InternationalLabour Organization.
Mahat, T. B. S. 1987. Forestry-Farming Linkages in theMountains. ICIMOD Occasional Paper, No. 7.Kathmandu: International Centre for IntegratedMountain Development.
Malhotra, Anju, Sidney Ruth Schuler, and CarolBoender. 2002. “Measuring Women’sEmpowerment as a Variable in InternationalDevelopment”. Commissioned by the Gender andDevelopment Group of the World Bank, SocialDevelopment Group Final Version: June 28, 2002.
Marcoux, Alain. 1998. “How Much Do We Really Knowabout the Feminization of Poverty?” In The BrownJournal of World Affairs, Summer/Fall, VolumeV, Issue 2, 1998:187-194.
McFarland, Joan. 1988. “Review Essay: The Constructionof Women and Development theory” Rev.Canadian, Soc. and Anth. Canadian. Rev. Soc.,and Anth, 25(2), 1988:299-308.
Meadows, D. H., D. L. Meadows, J. Randers, and W. W.Behrens III. 1972. The Limits to Growth. New York:Universe Books.
Meir, G. M., and James R. Rouch, eds. 2000. LeadingIssues in Economic Development. New York:Oxford.
Millar, David, Bertus Haverkort, Katrien van’t Hooft,and Hiemstra Wim. 2001. “ChallengingDevelopments Approaches, Results andPerspectives for Endogenous Development” inCompass magazine, no. 4, pp 4–7.
MoES (Ministry of Education and Sports). 1971. TheNational Education System Plan for 1971-76.Kathmandu: Author.
. 2000. Education Information of Nepal 2000.Kathmandu: Author.
. 2001. Primary Level Curriculum: A Review(in Nepali). Kathmandu: Author.
. 2004. School Level Educational Statistics ofNepal 2003 (2060 BS). Kathmandu: Author.
MOF/HMG/N (Ministry of Finance/His Majesty’sGovernment of Nepal). 2005. Economic Survey.Kathmandu.
MOFSC (Ministry of Forests and Soil Conservation).2002. Nepal Biodiversity Strategy. Kathmandu:Ministry of Forests and Soil Conservation/Global Environment Facility/United NationsDevelopment Programme/His Majesty’sGovernment of Nepal.
Moghadam, M. Valentine. 1998. “The Feminization ofPoverty in International Perspective”. In TheBrown Journal of World Affairs, Summer/Fall,Volume V, Issue 2, 1998:184-194.
MOH/HMG/N (Ministry of Health/His Majesty’sGovernment of Nepal). 1998. Second Long TermHealth Plan 1997-2017. Kathmandu: Ministry ofHealth.
Mohsin, Mohammad. 1974. “The National EducationPlan: An Analytical Introduction”. In On Educationin Nepal. Mohammad Mohsin, and Prem Kasaju,eds. Kathmandu: National Education Committee.

292 R E F E R E N C E S
Molyneux, M. 1986. “Mobilization withoutEmancipation? Women’s Interest, the State, andRevolution”. In R. Pagan, C. D. Deere, and J.L.Corragio, eds. Transition and Development:Problems of Third World Socialism. New York:Monthly Review Press.
MOPE (Ministry of Population and Environment). 2000.State of the Environment Nepal. Kathmandu.
Morse, S. S. 1994. “Prediction and Biological Evolution:Concept Paper”. Ann N Y Acad Sci (Annuals ofNew York Academic Sciences), 15, 740:436-8.
Mosley, Henery H., and Linclon C. Chen. 1984. “AnAnalytical Framework for the Study of ChildSurvival in Developing Countries”. In HeneryH. Mosley, and Linclon C. Chen, eds. ChildSurvival: Strategies for Research. USA: PopulationCouncil.
Murray, Christopher J. L., et al, eds. 2002. SummaryMeasures of Population Health: Concepts.Ethics, Measurements and Applications.Geneva: World Health Organization.
Myrdal, Gunnar. 1970. The challenge of world poverty.A world anti-party programme in online victoria.Penguin.
. 1971. Asian Drama. An Enquiry into thePoverty of Nations. New York: Vintage Books.
Narayan, Deepa, with Raj Patel, Kai Schafft, AnneRademacher, and Sarah Koch-Schulte. 2000. Voicesof the Poor: Can Anyone Hear Us? World BankSeries. Oxford: Oxford University Press.
NDHS (Nepal Demographic Health Survey). 2001. NepalDemographic and Health Survey. Kathmandu:Department of Health Division, Ministry of Health,His Majesty’s Government of Nepal.
NESAC (Nepal South Asia Centre). 1998. Nepal HumanDevelopment Report, 1998. Kathmandu.
Neupane, Govind. 2002. Nepalko Jatiya Prasna: SamajikBanot Ra Sajhedariko Sambhavana (Ethnic Issuesin Nepal: Social make-up and prospect forcommonality). Kathmandu: Centre forDevelopment Studies.
NPC (National Planning Commission). 2002. “PovertyReduction Strategy Paper”. Kathmandu.
. 2003. The Tenth Plan: Poverty ReductionStrategy Paper. Kathmandu.
. 2004. Progress Report on Poverty Reduction:An Assessment of the Tenth Plan Implementation.Kathmandu.
. 2005. MDG Need Assessment Report.Kathmandu.
Nurkse, Ragnar. 1970. Problems of Capital Formationin Underdeveloped Countries and Patterns ofTrade and Development. New York: OxfordUniversity Press.
Omran, A. R. 1971. The Epidemiologic Transition: ATheory of the Epidemiology of PopulationChange, Millbank Mem. Fund Q. 49 (4):509-37.
Oxford. 1995. Oxford English Reference Dictionary.London: Oxford University Press.
Palanivel, T. 2003. Poverty, Environment andDevelopment: Exploring the likes inEnvironmental Dimensions of Poverty. UNURIUM Workshop. Kathmandu.
Pande, Badri D. 1978. Development of Higher Educationin Nepal, 1918-1976. Unpublished doctoraldissertation. Carbondale, Illinois: Southern IllinoisUniversity.
Pande, Rohini. 2000. Family Composition Effects onGender Differentials in Nutrition andImmunization in Rural India. Presented at theannual Population Association of America held inLos Angeles.
Panos. 2002. Justice For All. Lalitpur: JagadambaPress .
Parajuli, Dilip. 1999. External Efficiency and Equity inNepalese Education. Background Paperprepared for Nepal Priorities and Strategiesfor Education Reform. Report No. 22065. HumanDevelopment Unit, South Asia Region. WorldBank.
Parasuraman, S., Kumaran Raj Gomathy, and BinaFernandez. 2003. Listening to People Living inPoverty. Bangalore: Books for Change.
Pearce, Diana. 1970. “The Feminization of Poverty:Women. Work and Welfare”, in The Urbanand Social Change Review, 11, No. 1 and 2:28-36.
Philipson, Tomas, and Radrigo Soars. 2001. “HumanCapital, Longevity, and Economic Growth: AQuantitative Assessment of Full IncomeMeasures”.
Poudel, Mehar Man, and Bhanu P. Niraula. 1998. Genderand Child Issues Under Kamaiya System in Midand Far-Western Tarai of Nepal: A ParticipatoryStudy. Kathmandu: ActionAid Nepal.
Prabhu, Seeta K. 2003. “Engendering HumanDevelopment”. Paper presented at the Genderand Poverty Summit, November 9-11, 2003. NewDelhi.
Pradhan, Bina. 1995. Women’s Autonomy andReproductive Health (doctoral dissertation). CornelUniversity.
. 1999. Water Quality Analysis of the BagmatiRiver and Its Tributaries in Kathmandu Valley.Using Bacterial and Saprobic Measures.Proceeding of III National Conference on Scienceand Technology. Kathmandu: RONAST.
. 2000. Gender Based Violence. CASA Bulletin.UNFPA/CST for CASA, Vol. 8. No. 1, November.
. 2003. “Measuring Empowerment:Methodological Approach”, in development,Volume 46, No. 2, June 2003.
. 2004. Piloting Gender-Based Violence in RHClinics: Evaluation Report. AIDOS and UNFPA.
R E F E R E N C E S 293
Pradhan, B., R. Shrestha, and M. Shrestha. 2003. Studyon Assessment of the Effects of NRCS/ENPHOArsenic Mitigation Measures on the Health ofArsenicosis Patients in Four Tarai Districts -Nawalparasi, Parsa, Bara, and Rautahat, Nepal.Kathmandu: Environment and Public HealthOrganization/Nepal Red Cross Society.
PRB (Population Reference Bureau). 1999. “WorldPopulation: More than just numbers”.Washington, DC. Belgian Actuarial Bulletin, Vol.1, No. 1.
Prennushi, Giovanna. 1998. “Nepal: Poverty at the Turnof the Century - An Interim Note on the PovertyAssessment”. In Proceedings of a National PovertyWorkshop. Kathmandu: ActionAid Nepal.
Prescott-Allen, Robert. 2001. The Wellbeing of Nations.Washington: Island Press.
Presser, Harriet B., and Geeta Sen, eds. 2000. Women’sEmpowerment and Demographic Processes.Oxford University Press.
Preston, S. H. 1975. “Relation between Mortality andLevel of Economic Development” in PopulationStudies, 29(2): 231-48.
Pyakuryal, Bishwamber. 2004. Nepal’s ConflictEconomic: Costs, Consequences andAlternatives. Kathmandu: Nepal EconomicAssociation.
Qizilbash, Mozaffar. 1996. “Ethical Development”, inWorld Development, Vol 24, No. 7, pp.1209–1221.
Rambo, Terry A. 1997. The Fallacy of Global SustainableDevelopment, Asia Pacific Issues, Analysis fromEast West Centre, no. 30.
Ransom, Elizabeth I., and Leslie K. Elder. 2003. “Nutritionof Women and Adolescent Girls: Why It Matters”.Accessed from online: http://www.prb.org/Template.cfm? Section= PRB&template=/C o n t e n t M a n a g e m e n t /ContentDisplay.cfm&ContentID=9597#box1.
Ravillion, M., and Chen 2001. Poverty Comparisons.Chur, Switzerland: Harwood AcademicPublishers.
Rawls, John. 1971. A Theory of Justice. Cambridge:Harvard University Press.
Raworth, Kate, and David Stewart. 2003. “Critiques ofthe Human Development Index: A Review”. InFukuda-Parr, and A.K. Shiva Kumar, eds.Readings in Human Development. Op cit.
Raya, R. Rene. 2001. “An alternative Measure of Povertyand Human Capability” in Social WatchPhilippines. Philippines: Action for EconomicReforms.
Reardon, Thomas, and Stephen A. Vosti. 1995. “LinksBetween Poverty and the Environment inDeveloping Countries: Asset Categories andInvestment Poverty” in World Development, vol.23, no. 9, pp 1495-1506.
Rich, R. M. Edelstein, W. K. Hallam, and A. H.Wandersman. 1995. Citizens’ Particpation andEmpowerment: The Case of Local EmpowermentHazards. American Journal of CommunityPsychology, 23(5): 657-676.
Roberts, P. 1981. “The Integration of Women into theDevelopment Process: Some ConceptualProblems”. Sussex: IDS Bulletin.
Roberts, Stephnie. 2002. “Health Priority: Social andEconomic Factors that Influence Health”. Preparedfor the Wisconsin Turning Point Initiative.Madison: University of Wisconsin.
Robeyns, Ingrid. 2002. “Sen’s Capability Approach andGender Inequality”. England: Wolfson Collegeand Faculty of Economics and Politics.
Roemer, J. 1996. Theories of Distributive Justice. CambridgeMassachusetts: Harvard University Press.
Rostow, W. W. 1960. The Stages of Economic Growth.Cambridge.
Roy, Rathin. 2003. “Fiscal Policy and Poverty in Nepal”.In The Macroeconomics of Poverty Reduction: TheCase Study of Nepal (draft of August). New York:United Nations Development Programme.
SAAPE (South Asia Alliance for Poverty Eradication).2003. Poverty in South Asia 2003: Civil SocietyPerspectives. Kathmandu.
Sajeda, Amin. 1990. “Effects of Women’s Status in SexDifferentials in Infant and Child Mortality in SouthAsia”, Genus, Vol. XLVI (3-4): 55-69.
Sarkar, Kinki. 1998. “Understanding Sustainability:Study of a Hill Settlement”, in Economic andPolitical Weekly, vol XXXIII, no. 44, pp. 2800–2806.
Seguino, Stephanie. 2002. “Gender, Quality of Life, andGrowth in Asia 1970-1990”, in The Pacific Review,15 (2): 245-277.
Sen, Amartya K. 1983. Development: Which Way Now?in The Economic Journal. 93.
. 1985. Commodities and Capabilities. North-Holland, Amsterdam.
. 1989. “Development as capability expansion”.Journal of Development Planning. No. 19, pp. 41-58.
. 1992. “Missing Women,” British MedicalJournal, 304, March 1992.
. 1998. ‘Mortality as an Indicator of Economic Successand Failure”, The Economic Journal, 108: 1-25.
. 1999. Development as Freedom. New York:Oxford University Press.
. 2000. ‘A Decade of Human Development.’Journal of Human Development. No. 1, pp. 17-23.
. 2001. “Many Faces of Gender Inequality” inFrontline, Volume 18, Issue 22, Oct. 27 - Nov. 09,2001.
. 2003. “Development as capability expansion”.In Fukuda-Parr, and Shiva Kumar, eds. Readingsin Human Development. Delhi: Oxford UniversityPress.
294 R E F E R E N C E S
Sengupta, Arjun. 2001. Right to Development as aHuman Right, EPW Special Articles. Delhi: EPW.
Sharma, Gopinath. 1986. History of Education in Nepal(in Nepali). Kathmandu: Hem Kumari Sharma.
Sharma, Pitamber. 1980. “Development Strategies, BasicNeeds and the Sixth Plan. Some Issues”. TheHimalayan Economist, Vol 7, No. 1, Pp. 1-24.
Sharma, Shiva. 2003a. “Poverty in Nepal”. In TheMacroeconomics of Poverty Reduction: The CaseStudy of Nepal (draft of August). New York: UnitedNations Development Programe.
. 2003b. “Nepal: Integration in the IndianEconomy”. In Juhani Koponen, ed. BetweenIntegration and Exclusion: Impacts of Globalizationin Mozambique, Nepal, Tanzania and Vietnam.Helsinki: Institute of Development Studies.
Sharma, Shiva, and Devendra Chhetry. 1997. MIMAPResearch on Poverty in Nepal – A Synthesis Paperof Phase One. Kathmandu: APROSC.
Sharma, Som Nath, ed. 1967. Kautilya ko Arthasastra(The Economics of Kautilya). Nepali translationby Keshab Raj Aryal. Kathmandu: Royal NepalAcademy.
South Centre. 1991. Environment and Development.Geneva: South Commission.
Staudt, Kathleen. 1998. “The Feminization of Poverty:Global Perspectives”. The Brown Journal of WorldAffairs: Summar/Fall, Volume V, Issue 2, 1998.
Stern, N. 2002. A Strategy for Development. Washington,DC: World Bank.
Streeten, Paul. 2003. Human Development Report. NewYork.
Stromquist, N. P. 1995. The Theoretical and PracticalBases for Empowerment. Women, Education andEmpowerment Pathway towards Autonomy.Carolyn Medel, ed. Report of the InternationalSeminar held UIE, 27 January to 2 February 1993.Hamburg, Germany: United Nations Educational,Scientific and Cultural Organization.
Subba, Chaitanya, and others. 2002. ‘Adivasis/Janajatisin National Development: Major Issues,Constraints and Opportunities’. Plan of ActionProposed for the Tenth Plan 2003-2007.Kathmandu: Institute for Integrated DevelopmentStudies.
Sunkel, Osvaldo. 1973. Transnational capitalism andnational disintegration in Latin America” inSocial and Economic Studies, Special Number, Vol22, No. 1, March 1973, Pp. 135-170.
Todaro, Michael P. 1993. Economic Development inthe Third World. Hyderabad: Orient Longman.
Todaro, Michael P., and C. Smith Stephen. 1999.Economic Development. New York: AWLongman.
TPAMF. 2005. Analysis of Caste, Ethnicity and GenderData from 2001. Population Census in Preparationfor Poverty Mapping and Wider PRSPMonitoring. Kathmandu: Tanka Prasad AcharyaMemorial Foundation.
Tuladhar, Bhushan. 2003. Kathmandu’s Air Quality.CEN Auality. CEN Fact Sheet. Kathmandu: CleanEnergy Nepal.
ucsusa n.d. http://www.UCSUSa.org/global_warming/S c i e n c e / e a c h - c o u n t r y s - s h a r e - o f - C O 2 -emissions.html.
UN (United Nations). 1994. Programme of Action,International Conference on Population andDevelopment.
. 2000. The World’s Women: Trends andStatistics. New York.
. 2003. World Population Prospects, 2002Revision.
UNCED (United Nations Coference on Environment andDevelopment). 1992. http://www.un.org/documents/ga/conf15126-lannexl.htm.
UNDP (United Nations Development Programme). 1990.Human Development Report 1990. Concept andMeasurement of human development. New York:Oxford University Press.
. 1991. Human Development Report 1991.Financing Human Development. New York.Oxford University Press.
. 1992. Human Development Report 1992. GlobalDimensions of Human Development. New York.Oxford University Press.
. 1993. Human Development Report 1993.People’s Participation. New York. OxfordUniversity Press.
. 1994. Human Development Report 1994. Newdimensions of human security. New York. OxfordUniversity Press.
. 1995. Human Development Report 1995.Gender and human development. New York:Oxford University Press.
. 1996. Human Development Report 1996. NewYork: Oxford University Press.
. 1997. Human Development Report 1997.Human Development to Eradicate Poverty. NewYork: Oxford University Press.
. 1998. Human Development Report 1998.Consumption of Human Development. New York:Oxford University Press.
. 1999. Human Development Report 1999.Globalization with a human face. New York:Oxford University Press.
. 2000. Human Development Report 2000.Human rights and human development. NewYork: Oxford University Press.

R E F E R E N C E S 295
. 2001. Human Development Report 2001.Making new technologies work for humandevelopment. New York: Oxford UniversityPress.
. 2002a. Human Development Report 2002.Deepening democracy in a fragmented world.New York: Oxford University Press.
. 2002b. Nepal Human Development Report2001. Poverty Reduction and Governance.Kathmandu.
. 2003. Human Development Report 2003. NewYork: Oxford University Press.
. 2004a. Human Development Report 2004.Cultural Liberty in Today’s Diverse World. NewYork: Oxford University Press.
. 2004b. Nepal Human Development Report2004. Empowerment and Poverty Reduction.Kathmandu.
. 2005. Human Development Report 2005.International Cooperation at a crossroads: Aid,trade and security in an unequal world. NewYork: Oxford University Press.
UNDP/HMG/N (United Nations DevelopmentProgramme/His Majesty’s Government of Nepal).2002. Nepal Millennium Development Goals.Progress Report 2002. Kathmandu.
. 2005. Nepal Millennium Development Goals.Progress Report 2005. Kathmandu.
UNEP (United Nations Environment Programme). 2002a.UNEP’s Global Environment Outlook 3. UNEP’sReport for the World Summit on SustainableDevelopment. London: Earthscan.
. 2002b. The Asian brown cloud: climate andother environmental impacts. Nairobi.
. 2004a. http://www.unep.org/GEO/geo3/english/029.htm.
. 2004b. http://www.unep.org/GEO/geo3/english/498.htm.
UNFPA (United Nations Fund for Population Activities).2000. The slate of world population. http://www.infoplease.com/spot/womensday1.html.
. 2001. A Practical Approach to Gender BasedViolence: Programme Guide for Health CareProviders and Managers, Pilot Edition. New York.
Upadhya, Shizu. 2000. Farmers in Flux: A ParticipatoryStudy of Fertilizer Use in the Context of EconomicLiberalization. Kathmandu: ActionAid Nepal.
Watts, Jonathan. 2004. China Shows How to Wipe OutPoverty. London: Guardian Newspapers Limited.
WCED (World Commission on Environment andDevelopment). 1987. Our Common Future. NewDelhi: Oxford.
Whitehead, M. 2000. “Willian Farr’s legacy to the studyof inequalities in health. Bulletin of the WorldHealth Organization, 2000, 78(1):86-96.
WHO (World Health Organization). 1978. Declaration ofAlma-Ata (International Conference on PrimaryHealth Care, Alma-Ata, USSR, Sept. 1-12, 1978).Accessed online at www.who.int/hpr/HPN/docs.
. 1997. Violence and Injury Prevention: ViolenceAgainst Women: A Priority Health Issue. WHOInformation Kit on Violence and Health. Geneva.Accessed on line: www.who.int/violence injuryprevention/vaw/infopack.htm.
. 2002. The World Health Report 2002. ReducingRisks, Promoting Healthy Life. Geneva.
Wijayatilake, K. 2004. Study on Sexual and Gender BasedViolence in Selected Locations in Sri Lanka. SriLanka: CENWOR/UNHCR.
wikipedia n.d. http://en.wikipedia.org/wiki/kyoto_protocol
World Bank. 1997. Human Development Network,World Bank Group, Health, Nutrition andPopulation Sector Strategy. Washington, DC.
. 2001. World Development Report: AttackingPoverty. New York: Oxford University Press.
. 2002. Empowerment and Poverty Reduction:A Sourcebook. PREM: World Bank.
Wyatt-Smith. 1982. The Agricultural System in the hillsof Nepal. The Ratio of Agriculture to Forest Landand the Problems of Animal Fodder. Kathmandu.
Young, Kate. 1988. Gender and Development: A RelationApproach. Oxford: Oxford University Press.
Younis, Nabil, H. Khattab, H. Zurayk, M. El-Mouelhy,M. F. Amin, and A. M. Faraq. 1993. A CommunityStudy of Gynecological and Related Morbiditiesin Rural Egypt. Studies in Family Planning 24:175-186.

296 R E F E R E N C E S