development strategy in pakistan 1.macro-economic stability – policy choices? or need to meet...
TRANSCRIPT

Rethinking Development Strategy – The Importance of the Rural Non Farm
Economy in Growth and Poverty Reduction in Pakistan
by
Sohail Jehangir Malik
Paper Prepared for
the
Fourth Annual Conference on Management of the Pakistan Economy Center for Research in Economics and Business
Lahore School of Economics
April 24-25, 2008
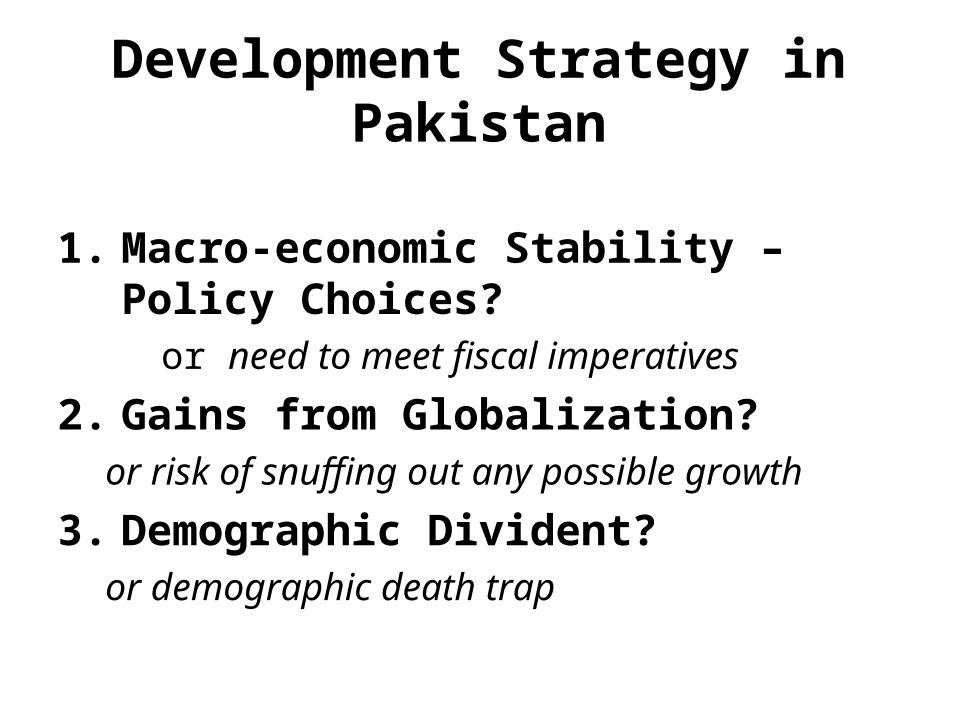
Development Strategy in Pakistan
1. Macro-economic Stability – Policy Choices?
or need to meet fiscal imperatives
2. Gains from Globalization?or risk of snuffing out any possible growth
3. Demographic Divident?or demographic death trap

Missing Links
• Weak Data and Weaker Analyses• Absence of M&E and effective policy research• Scant Regard for what works and what doesn’t
and how it can be replicated and up-scaled• Little understanding or consideration of the
complex micro-macro linkages and sectoral inter-relationships
• No consideration of the importance of institutions
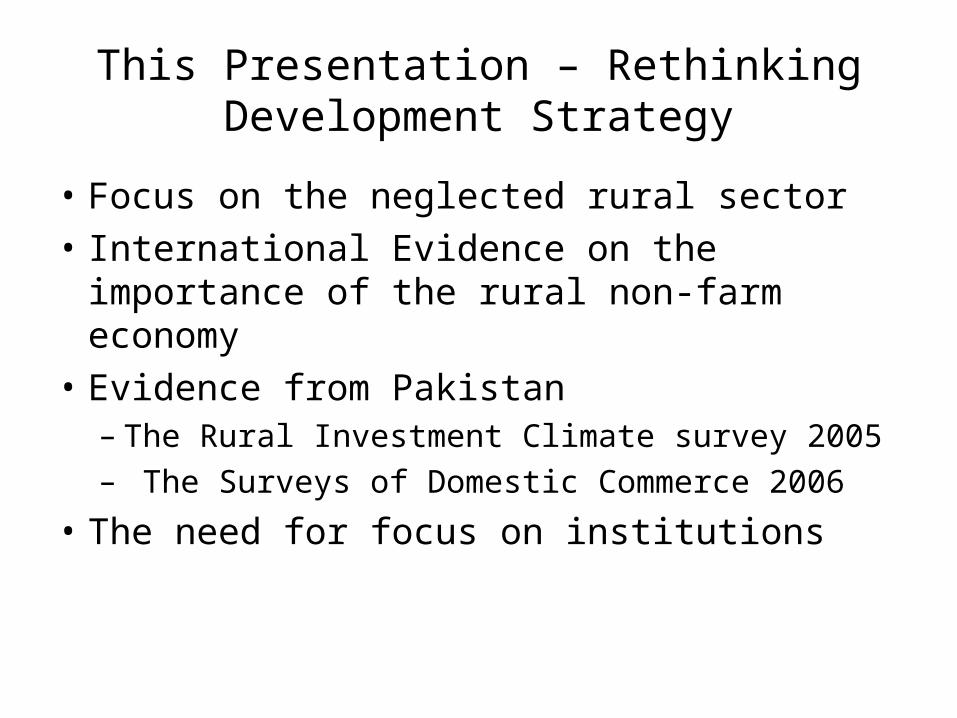
This Presentation – Rethinking Development Strategy
• Focus on the neglected rural sector
• International Evidence on the importance of the rural non-farm economy
• Evidence from Pakistan– The Rural Investment Climate survey 2005– The Surveys of Domestic Commerce 2006
• The need for focus on institutions

Rural – The neglected sector in Pakistan’ s Development Strategy
• 68% of the population is rural
• High incidence of rural poverty (39%?!)
• High agricultural growth appears to have coincided with rising poverty levels
• Recognition that non-farm sector growth is necessary to address rural poverty.
• Share of household income from rural non-farm activities is growing

What Makes “Rural” Areas Special?
• There are sharp differences in economic and social constraints and outcomes between rural and urban areas– Poverty rates in rural areas are generally higher than in urban areas
[although LGO2001 has obliterated the definitional distinction]
• Public service delivery and outcomes are generally much poorer in rural areas– Infant mortality rates higher– Birth rates higher– Poorer access to health services– Poorer quality educational infrastructure, services and outcomes
• Major role of agriculture in the rural economy implies– Seasonal labor demand– Large fluctuations in agricultural output, price and incomes related to
weather and pest

Rethinking Development Strategy
The structural transformation of developing economies has not been accompanied by a concomitant decline in the proportion of labour employed in agriculture – WHY?

Figure 1: Share of Major Sectors in GDP and in Total Labour Employed 2005-06
0
5
10
15
20
25
30
35
40
45
50
Agriculture,
Forestry , Hunting
& Fishing
Mining &
Quarry ing
Manufacturing Electricity , Gas &
Water
Construction Wholesale &
Retail Trade,
Resturants &
Hotels
Transport,Storage
& Communication
Financing,
Insurance & Real
Estate
Community ,
Social and
Serv ices
Activ ities not
defined
Perc
enta
ge
Distribution of Employed Persons (%) Sectoral Share in GDP (%)

1. Characteristics of the RNFE
2. Rural dynamics: what drives change in the RNFE?
3. RNFE as an engine of pro-poor growth?
Can the Rural Non-farm Economy (RNFE) substitute for agriculture as an engine of rural
poverty reduction?

Characteristics of the RNFE
• Big
• Growing
• Heterogeneous
• Equity impact variable

Big
Nonfarm share of rural income
Africa 42%
Asia 32%
Latin America 40%

Growing
Rural Nonfarm Share of
China Farm hh income
National income
1980 17% 4%
1985 25% 7%
1990 26% 10%
1997 39% 28%

Growing
India Nonfarm share of rural income
1968 26%
1980 36%
2000 46%
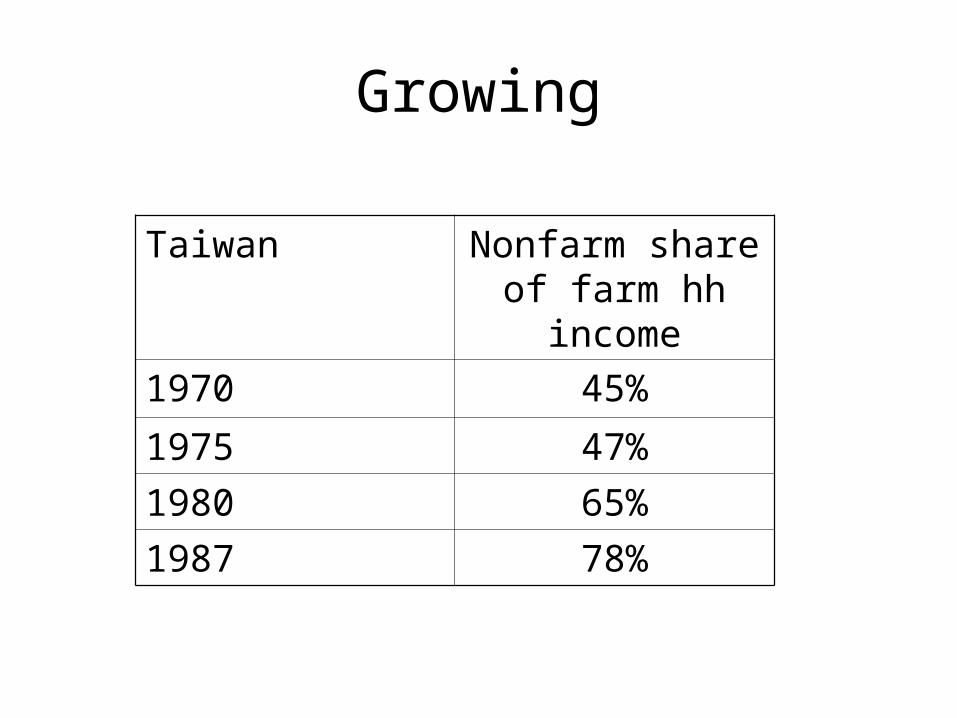
Growing
Taiwan Nonfarm share of farm hh income
1970 45%
1975 47%
1980 65%
1987 78%

Growing
Thailand Nonfarm share of farm hh income
1976 35%
1986 46%

Heterogeneous activities
Rural Nonfarm Employment Shares
Mftr Trade Services Constr etc
Africa 23% 22% 25% 30%
Asia 28% 26% 32% 14%
Latin America
20% 20% 27% 34%

Heterogeneous wage rates
Sudan Income per day (P)
Sector
Carpet making 21 Manufacturing
Pot making 23 Manufacturing
Water selling 75 Commerce
Food selling 80 Commerce
Blacksmithing 150 Services
Construction 180 Services

Because of this heterogeneity, equity impact of RNFE varies
• Poor dominate some segments of the RNFE
• Rich dominate others
• Net impact on poverty varies

Capital intensity and returns to labor
Bangladesh
RNF Activity
K/worker
(Tk)
VA/worker (Tk/day)
Female workers
Tailoring 5,000 28 20%
Carpentry 3,010 20 4%
Handloom 1,600 15 38%
Pottery 800 12 47%
Paddy husking 300 7 56%
Bamboo products
310 5 49%
Coir rope 145 4 64%

Mixed equity impact
Rural Nonfarm Income as Share of Total
Equity enhancing
Neutral Inequitable
Kenya Pakistan India Ethiopia Ecuador Viet Nam
Poorest 82 75 32 32 22 40
Middle 45 36 38 30 37 50
Richest 40 21 31 31 64 82

Rural dynamics: what drives change in the RNFE?
a) Two dimensions of change in the RNFE
i) Spatial dynamics
ii) Sectoral dynamics

Sectoral dynamics
• Structural transformation
• Agricultural growth linkages
• Other motors of RNF growth

Other “motors” of non-farm growth
• Technology
• Export markets
• Foreign investment; and
• Globalization

The growth linkages of the rural non-farm economy run in both directions
• Production linkages (forward and backward)
• Consumption linkages
• Labor market linkages
• Investment linkages
• Spatial linkages
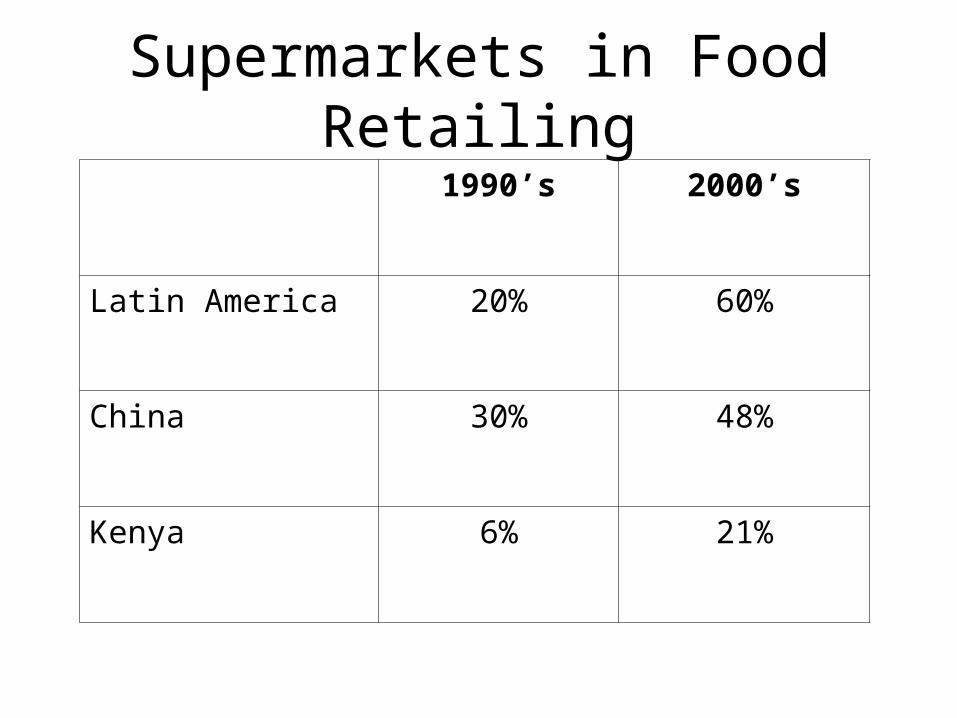
1990’s 2000’s
Latin America 20% 60%
China 30% 48%
Kenya 6% 21%
Supermarkets in Food Retailing

Evidence from Pakistan

Pakistan’s Rural Poor 2004-05: More than Half are in the Non Farm Sector
Source: Calculated from PSLM 2004-05 dataNotes: The poor are defined as households in the bottom 40 percent of the rural adult equivalent per capita expenditure distribution. Livestock herders who do not receive any crop income, (4 percent of the rural poor), are included in the other non-farm category.
Non-farm Other35%
Non-farm Self-
Employed17%
Farmers NWFP
6%
Farmers Sindh11%
Farmers Punjab24%
Farmers Baluchistan
2%
Agricultural Laborers
5%

Sources of non-farm income: % distribution of reporting households - Pakistan
Source of non-farm income
Farm households
Non-agri hholds
Livestock holders
Service 11.9 22.7 8.0
Business 7.1 19.5 8.4
Livestock 3.0 0.3 9.4
Remittances 2.9 1.7 1.3
Agriculture labour 21.6 4.9 14.9
Non-agri. Labour 18.5 42.5 46.8
Rent 1.6 0.7 0.9
Poultry 0.2 0.2 0.4
Others 6.6 7.5 9.9
None 26.5 0.0 0.0
Source: Agriculture Census (2000)

Source of non-farm income
Farm households
Non-Farm hholds.
Livestock holders
Service 11.9 22.7 8.0
Business 7.1 19.5 8.4
Livestock 3.0 0.3 9.4
Remittances 2.9 1.7 1.3
Agriculture labour 21.6 4.9 14.9
Non-agri. Labour 18.5 42.5 46.8
Rent 1.6 0.7 0.9
Poultry 0.2 0.2 0.4
Others 6.6 7.5 9.9
None 26.5 0.0 0.0
Non-farm Income Sources are Important for Farm Households

Growth Linkages in Pakistan• Share of agriculture in rural and national
incomes is small (20 percent of GDP; major crops only 10 percent, compared to 1960’s when agricultural share was 40 percent)
• Large pool of rural non-farm poor: non-farm incomes arising from multiplier effects must be spread over a large pool of households
• Substantial “leakages” of multiplier-induced consumer demand to urban sector (including small towns). Very little non-farm economic activity in villages

WB - Rural Investment Climate Survey 2005
MOC - Surveys of Domestic Commerce 2007

Figure 3: Distribution of Enterprises by Type for Rural and Small Towns in Punjab, 2005
12
44 44
9
35
56
10
40
50
0
10
20
30
40
50
60
Perc
enta
ge
Urban Rural Overall
Production Service Trade
Source: Rural Pakistan Investment Climate Survey – World Bank 2005

Table 9: Profile of Rural Enterprises in Pakistan 2005
RuralSmall Town
Total
Average No. of Workers 1.97 2.05 2.01
No. of Family Workers 1.29 1.37 1.33
No. of Hired Workers 0.68 0.68 0.68
Average age (years) 9.17 9.03 9.10
Stand-alone businesses (%)
94% 67% 80%
Share of firms registered (%)
28% 20% 24%
Sole proprietorships (%) 95% 94% 94%

Table 10: Value of Rural Enterprise Assets
Median Value of Assets (`000 Rs)
Average Value of Assets(`000 Rs)
Land 25.0 146.5
Building 50.0 146.0
Equipment & Machinery 5.0 23.0
Furniture & Storage Facilities 1.5 5.5
Tools 1.0 3.3
Vehicles 1.8 17.0
Other Fixed Assets 1.0 15.4
All 16.5 92.0

Table 11: Forward Linkages of Rural Non Farm Enterprises
ProductionServices Trade
Share of sales to:
Households 55% 82% 89%
Traders 12% 0% 0%
Multinationals 0% 1% 0%
Parent company or affiliated subsidiaries 1% 1% 0%
Large domestic firms 6% 1% 0%
Other (small firms, farms etc) 27% 16% 11%
Share of sales by location:
Same tehsil 74% 98% 100%
Different tehsil in the same district 15% 1% 0%
Different district in the same province 7% 0% 0%
Other province 2% 0% 0%
Other country 1% 0% 0%

Table 12: Backward Linkages of Rural Non Farm Enterprises
Production Services Trade
Value of inputs originating from:
Households 6% 11% 3%
Traders 26%
Multinationals 0% 6% 8%
Parent company or affiliated subsidiaries 3% 1% 2%
Large domestic firms 14% 12% 11%
Other (small firms, farms etc) 51% 69% 77%
Value of inputs originating from:
Same tehsil 31% 22% 16%
Different tehsil in the same district 22% 16% 20%
Different district in the same province 31% 49% 47%
Other province 10% 9% 11%
Other country 6% 4% 5%
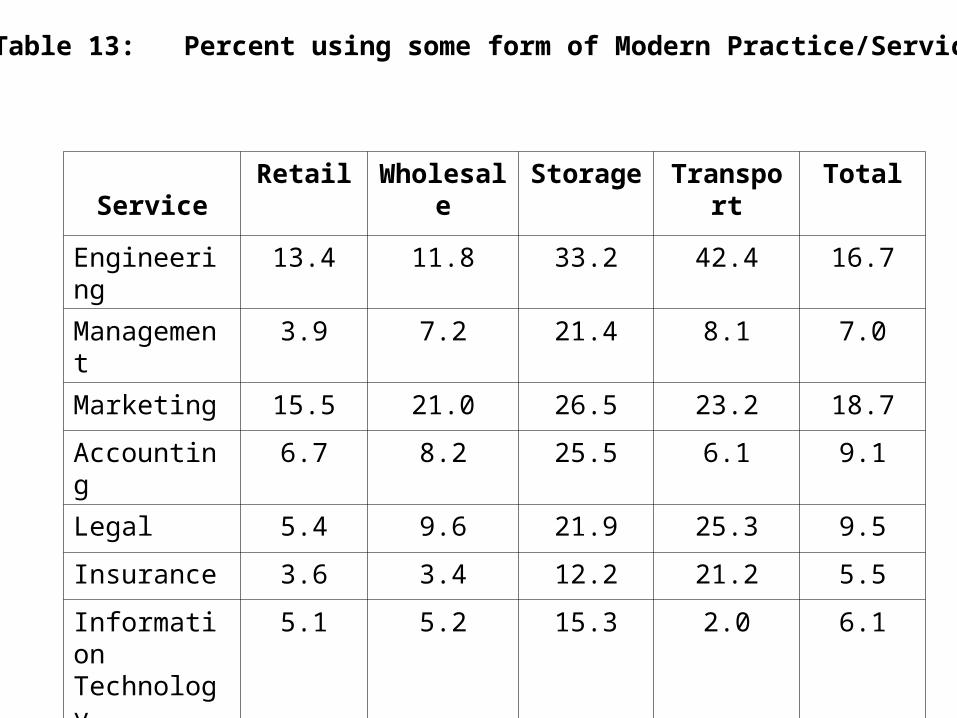
Table 13: Percent using some form of Modern Practice/Service
ServiceRetail Wholesale Storage Transport Total
Engineering 13.4 11.8 33.2 42.4 16.7
Management 3.9 7.2 21.4 8.1 7.0
Marketing 15.5 21.0 26.5 23.2 18.7
Accounting 6.7 8.2 25.5 6.1 9.1
Legal 5.4 9.6 21.9 25.3 9.5
Insurance 3.6 3.4 12.2 21.2 5.5
Information Technology
5.1 5.2 15.3 2.0 6.1
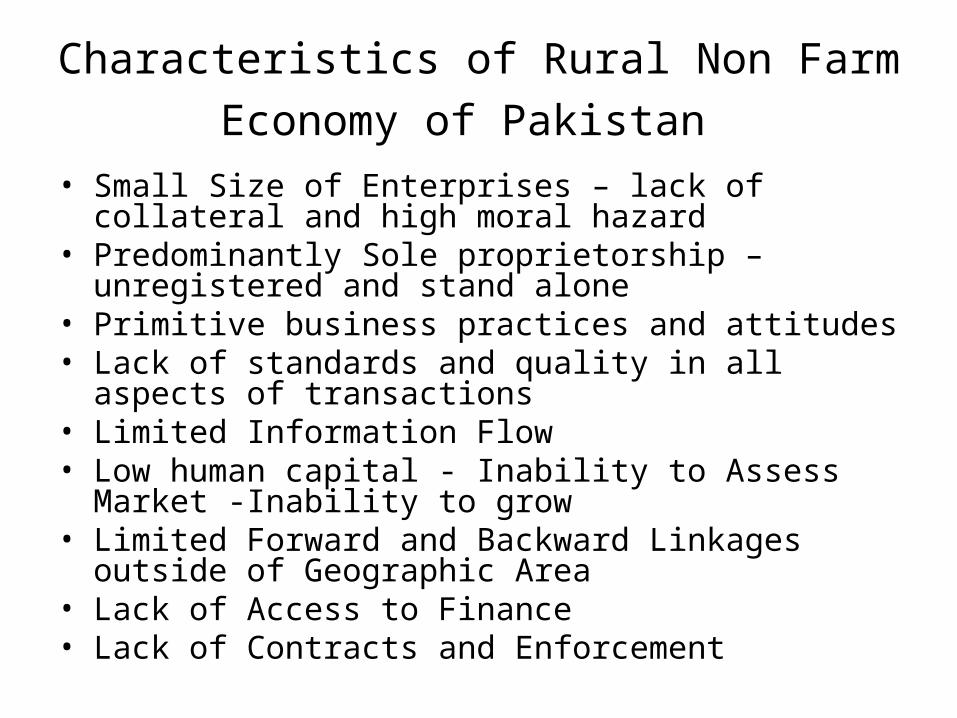
Characteristics of Rural Non Farm Economy
of Pakistan • Small Size of Enterprises – lack of collateral and high
moral hazard• Predominantly Sole proprietorship – unregistered and
stand alone• Primitive business practices and attitudes• Lack of standards and quality in all aspects of
transactions• Limited Information Flow• Low human capital - Inability to Assess Market -Inability
to grow• Limited Forward and Backward Linkages outside of
Geographic Area• Lack of Access to Finance• Lack of Contracts and Enforcement

Underdeveloped RNFE due to Absence or Inefficiency of Institution – Need for new
Facilitating Policy Approach based on Institutions
• Failure/Inappropriateness of Public Sector Institutions
• New Institutions for:– Legal and Judicial – contracts and property rights– Capacity strengthening and Information
Management/Dissemination– Factor Markets esp. Land, Water, Labour,
Capital(Finance)– Domestic Commerce– International Trade and Globalization (Quality and
Standards)

Thank You so much