developments in the indonesian power sector · the lantau group-10,000 0 10,000 20,000 30,000...
TRANSCRIPT
The Lantau Group
Developments in the Indonesian power sectorSarah FairhurstApril 2016
The Lantau Group
Agenda
Introduction to The Lantau Group
Regional context within ASEAN
Indonesia
• Overview
• Supply and demand fundamentals
• The role of fuels
• Renewable energy
• Regulation and policy
• Financing and competition
Summary
1
The Lantau Group
Agenda
Introduction to The Lantau Group
Regional context within ASEAN
Indonesia
• Overview
• Supply and demand fundamentals
• The role of fuels
• Renewable energy
• Regulation and policy
• Financing and competition
Summary
2
The Lantau Group
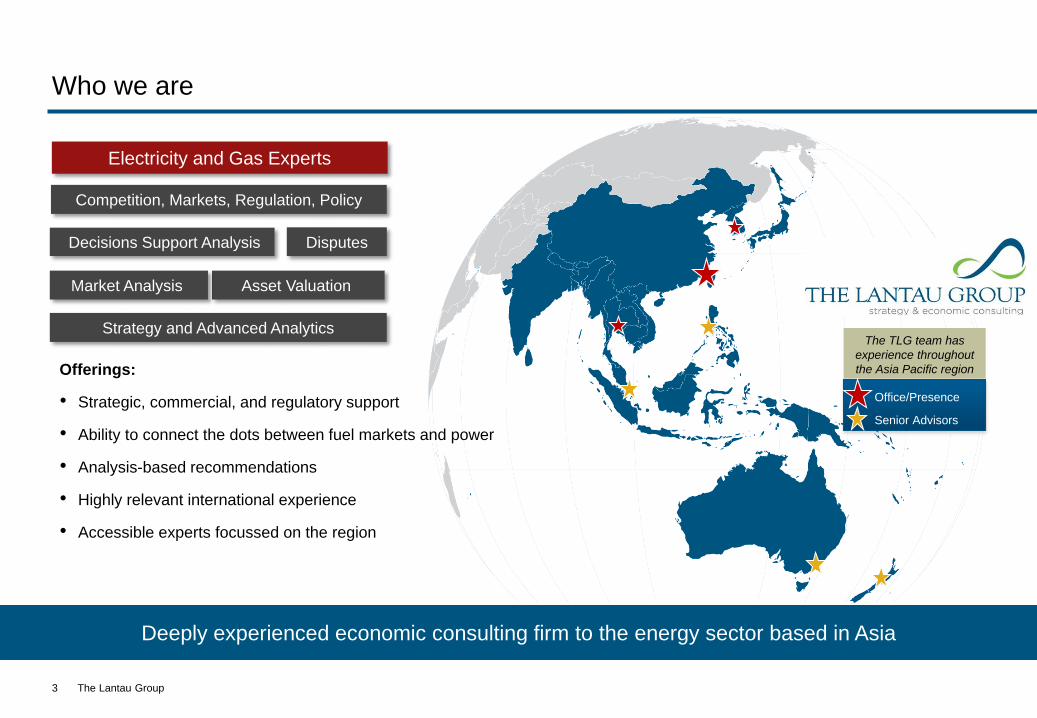
Deeply experienced economic consulting firm to the energy sector based in Asia
Who we are
3
Decisions Support Analysis
Asset Valuation
Strategy and Advanced Analytics
Competition, Markets, Regulation, Policy
Disputes
Market Analysis
Electricity and Gas Experts
The TLG team has
experience throughout
the Asia Pacific region
Office/Presence
Senior Advisors
Offerings:
• Strategic, commercial, and regulatory support
• Ability to connect the dots between fuel markets and power
• Analysis-based recommendations
• Highly relevant international experience
• Accessible experts focussed on the region
The Lantau Group
Agenda
Introduction to The Lantau Group
Regional context within ASEAN
Indonesian power sector
• Overview
• Supply and demand fundamentals
• The role of fuels
• Renewable energy
• Regulation and policy
• Financing and competition
Summary
4
The Lantau Group
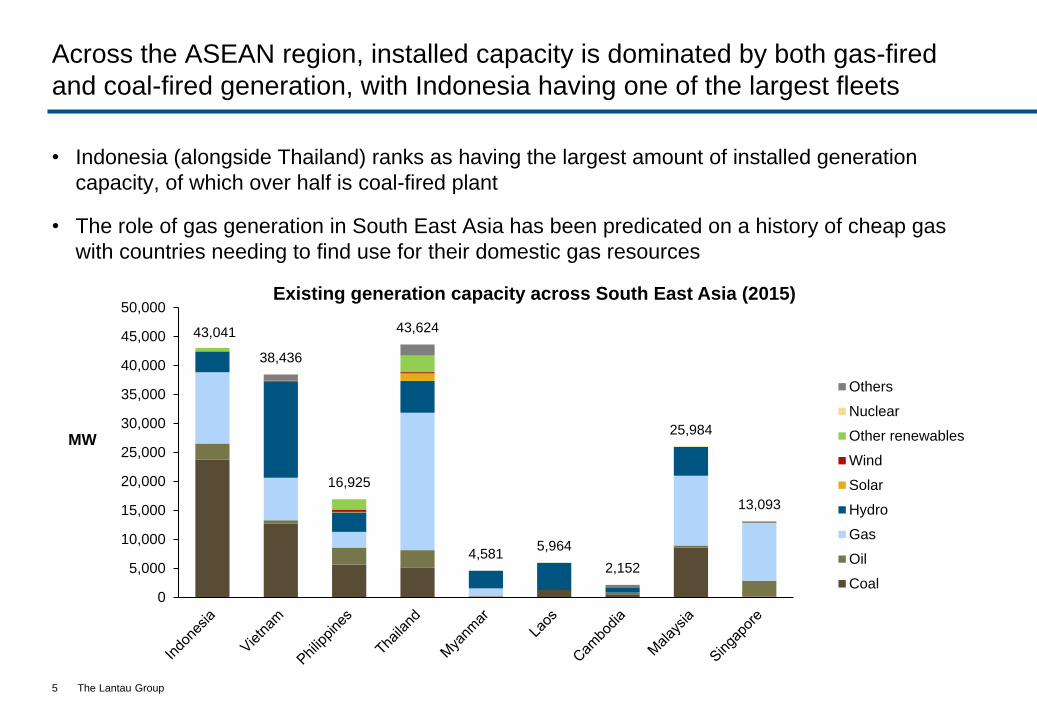
Across the ASEAN region, installed capacity is dominated by both gas-fired
and coal-fired generation, with Indonesia having one of the largest fleets
• Indonesia (alongside Thailand) ranks as having the largest amount of installed generation
capacity, of which over half is coal-fired plant
• The role of gas generation in South East Asia has been predicated on a history of cheap gas
with countries needing to find use for their domestic gas resources
5
43,041
38,436
16,925
43,624
4,5815,964
2,152
25,984
13,093
0
5,000
10,000
15,000
20,000
25,000
30,000
35,000
40,000
45,000
50,000Existing generation capacity across South East Asia (2015)
Others
Nuclear
Other renewables
Wind
Solar
Hydro
Gas
Oil
Coal
MW
The Lantau Group
-10,000
0
10,000
20,000
30,000
40,000
50,000
60,000
70,000
MW
Renewables
Hydro
Oil
Gas
Coal
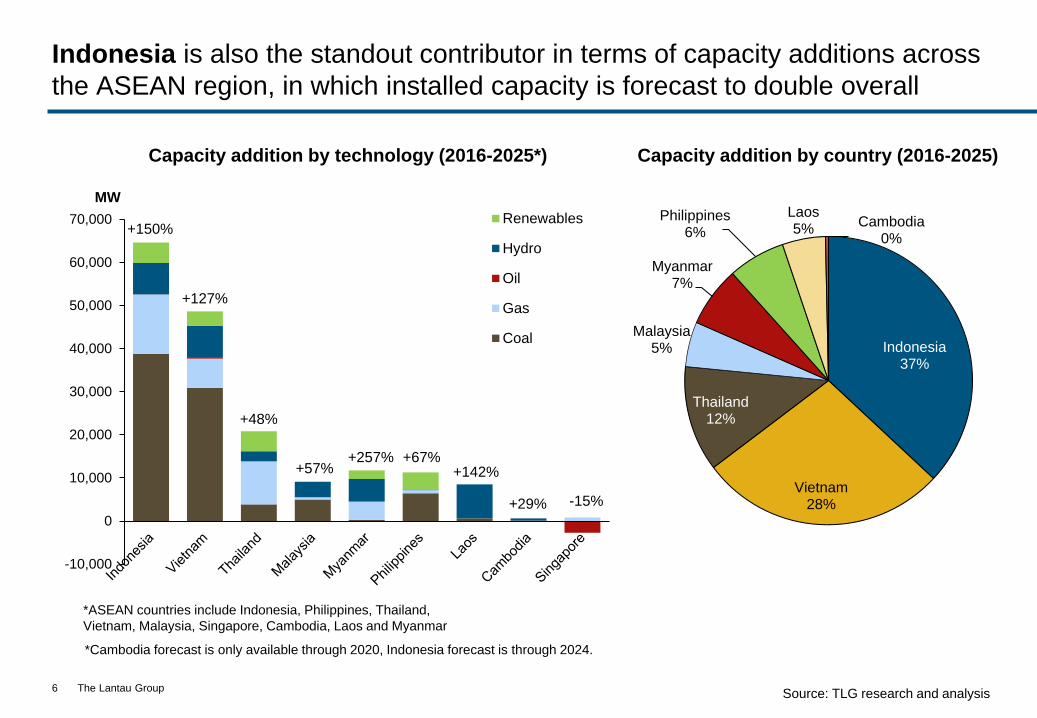
Indonesia is also the standout contributor in terms of capacity additions across
the ASEAN region, in which installed capacity is forecast to double overall
6
+150%
+127%
+48%
+57%+257% +67%
+142%
+29%
Capacity addition by technology (2016-2025*)
-15%
*Cambodia forecast is only available through 2020, Indonesia forecast is through 2024.
Indonesia37%
Vietnam28%
Thailand12%
Malaysia5%
Myanmar7%
Philippines6%
Laos5%
Cambodia0%
Capacity addition by country (2016-2025)
Source: TLG research and analysis
*ASEAN countries include Indonesia, Philippines, Thailand,
Vietnam, Malaysia, Singapore, Cambodia, Laos and Myanmar
The Lantau Group
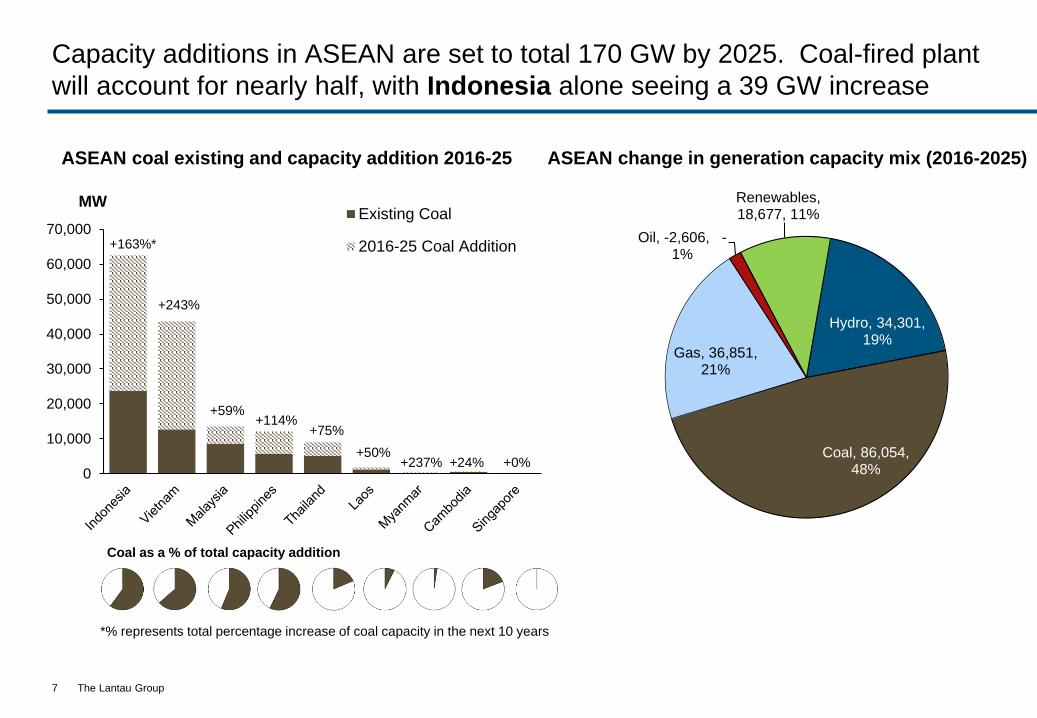
Capacity additions in ASEAN are set to total 170 GW by 2025. Coal-fired plant
will account for nearly half, with Indonesia alone seeing a 39 GW increase
7
ASEAN coal existing and capacity addition 2016-25
Coal as a % of total capacity addition
0
10,000
20,000
30,000
40,000
50,000
60,000
70,000
MWExisting Coal
2016-25 Coal Addition+163%*
+243%
+59%+114%
+75%
+50%+24%+237% +0%
*% represents total percentage increase of coal capacity in the next 10 years
ASEAN change in generation capacity mix (2016-2025)
Hydro, 34,301, 19%
Coal, 86,054, 48%
Gas, 36,851, 21%
Oil, -2,606, -1%
Renewables, 18,677, 11%
The Lantau Group
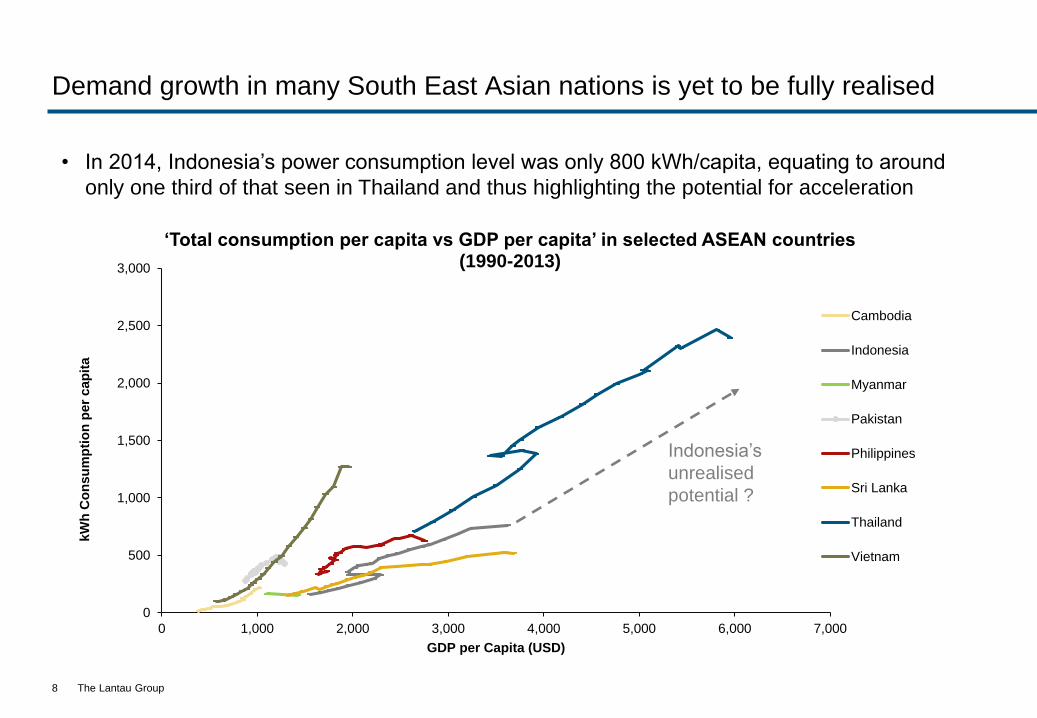
Demand growth in many South East Asian nations is yet to be fully realised
8
0
500
1,000
1,500
2,000
2,500
3,000
0 1,000 2,000 3,000 4,000 5,000 6,000 7,000
kW
h C
on
su
mp
tio
n p
er
ca
pit
a
GDP per Capita (USD)
‘Total consumption per capita vs GDP per capita’ in selected ASEAN countries (1990-2013)
Cambodia
Indonesia
Myanmar
Pakistan
Philippines
Sri Lanka
Thailand
Vietnam
• In 2014, Indonesia’s power consumption level was only 800 kWh/capita, equating to around
only one third of that seen in Thailand and thus highlighting the potential for acceleration
Indonesia’s
unrealised
potential ?
The Lantau Group
Agenda
Introduction to The Lantau Group
Regional context within ASEAN
Indonesian power sector
• Overview
• Supply and demand fundamentals
• The role of fuels
• Renewable energy
• Regulation and policy
• Financing and competition
Summary
9
The Lantau Group
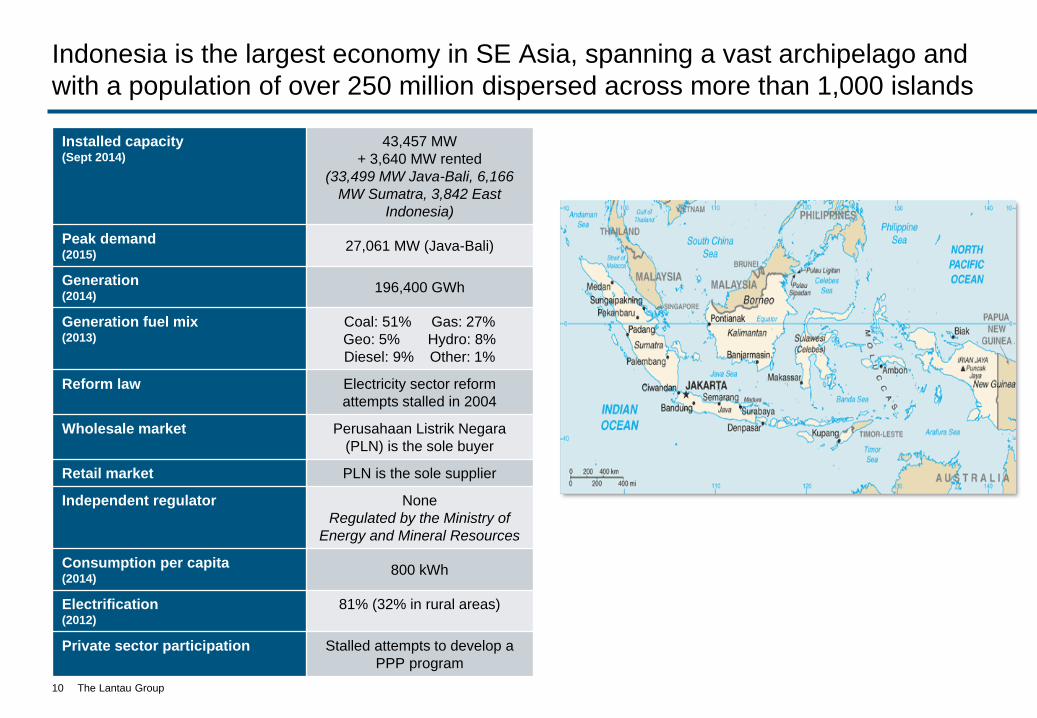
Indonesia is the largest economy in SE Asia, spanning a vast archipelago and
with a population of over 250 million dispersed across more than 1,000 islands
10
Installed capacity(Sept 2014)
43,457 MW
+ 3,640 MW rented
(33,499 MW Java-Bali, 6,166
MW Sumatra, 3,842 East
Indonesia)
Peak demand(2015)
27,061 MW (Java-Bali)
Generation(2014)
196,400 GWh
Generation fuel mix(2013)
Coal: 51% Gas: 27%
Geo: 5% Hydro: 8%
Diesel: 9% Other: 1%
Reform law Electricity sector reform
attempts stalled in 2004
Wholesale market Perusahaan Listrik Negara
(PLN) is the sole buyer
Retail market PLN is the sole supplier
Independent regulator None
Regulated by the Ministry of
Energy and Mineral Resources
Consumption per capita(2014)
800 kWh
Electrification(2012)
81% (32% in rural areas)
Private sector participation Stalled attempts to develop a
PPP program

The Lantau Group
Agenda
Introduction to The Lantau Group
Regional context within ASEAN
Indonesian power sector
• Overview
• Supply and demand fundamentals
• The role of fuels
• Renewable energy
• Regulation and policy
• Financing and competition
Summary
11
The Lantau Group
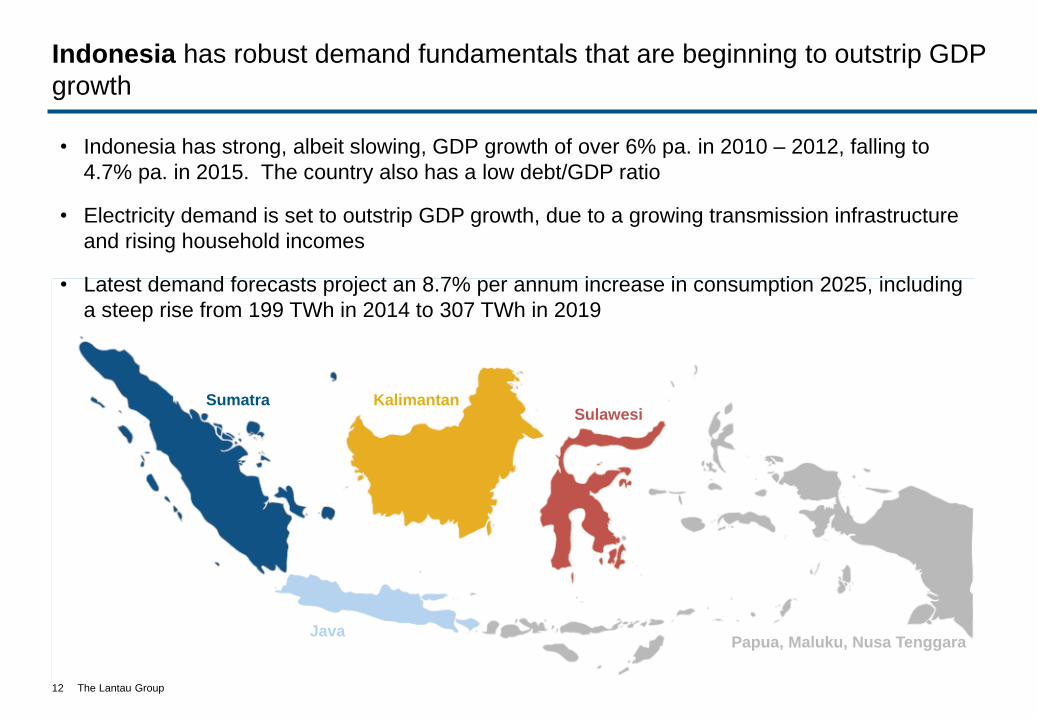
Sumatra KalimantanSulawesi
Papua, Maluku, Nusa TenggaraJava
Indonesia has robust demand fundamentals that are beginning to outstrip GDP
growth
12
• Indonesia has strong, albeit slowing, GDP growth of over 6% pa. in 2010 – 2012, falling to
4.7% pa. in 2015. The country also has a low debt/GDP ratio
• Electricity demand is set to outstrip GDP growth, due to a growing transmission infrastructure
and rising household incomes
• Latest demand forecasts project an 8.7% per annum increase in consumption 2025, including
a steep rise from 199 TWh in 2014 to 307 TWh in 2019
The Lantau Group
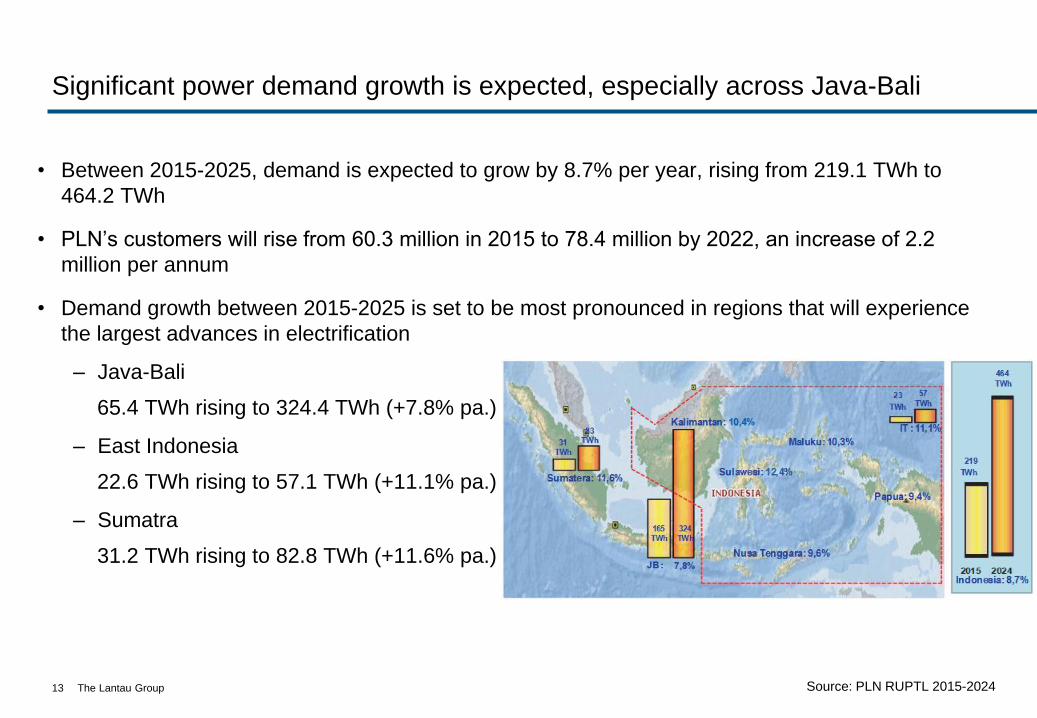
Significant power demand growth is expected, especially across Java-Bali
• Between 2015-2025, demand is expected to grow by 8.7% per year, rising from 219.1 TWh to
464.2 TWh
• PLN’s customers will rise from 60.3 million in 2015 to 78.4 million by 2022, an increase of 2.2
million per annum
• Demand growth between 2015-2025 is set to be most pronounced in regions that will experience
the largest advances in electrification
– Java-Bali
65.4 TWh rising to 324.4 TWh (+7.8% pa.)
– East Indonesia
22.6 TWh rising to 57.1 TWh (+11.1% pa.)
– Sumatra
31.2 TWh rising to 82.8 TWh (+11.6% pa.)
13 Source: PLN RUPTL 2015-2024
The Lantau Group
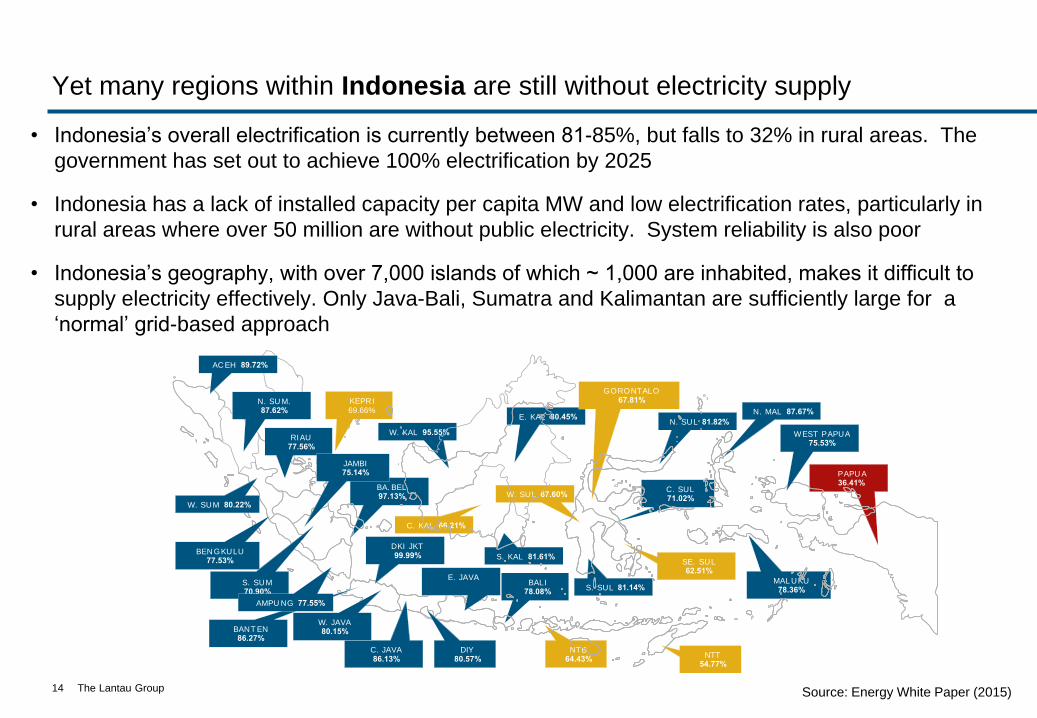
Yet many regions within Indonesia are still without electricity supply
• Indonesia’s overall electrification is currently between 81-85%, but falls to 32% in rural areas. The
government has set out to achieve 100% electrification by 2025
• Indonesia has a lack of installed capacity per capita MW and low electrification rates, particularly in
rural areas where over 50 million are without public electricity. System reliability is also poor
• Indonesia’s geography, with over 7,000 islands of which ~ 1,000 are inhabited, makes it difficult to
supply electricity effectively. Only Java-Bali, Sumatra and Kalimantan are sufficiently large for a
‘normal’ grid-based approach
14 Source: Energy White Paper (2015)
79.26% BALI78.08%
BA. BEL97.13%
NTB 64.43%
NTT54.77%
W. KAL 95.55%
E. KAL 80.45%
C. KAL 66.21%
S. KAL 81.61%
N. SUL 81.82%
GORONTALO67.81%
SE. SUL62.51%
S. SUL 81.14%
W. SUL 67.60%C. SUL71.02%
N. MAL 87.67%
MAL UKU78.36%
PAPU A36.41%
I r 2 Pred.
KEPRI69.66%
AC EH 89.72%
N. SU M.87.62%
W. SUM 80.22%
RIAU77.56%
BEN GKULU77.53%
JAMBI75.14%
S. SUM 70.90%
DKI JKT99.99%
BANT EN86.27%
C. JAVA86.13%
DIY80.57%
E. JAVA
WEST PAPUA75.53%
W. JAVA80.15%
AMPU NG 77.55%
ELECTRIFICATION RATIO
BENCHMARK
The Lantau Group
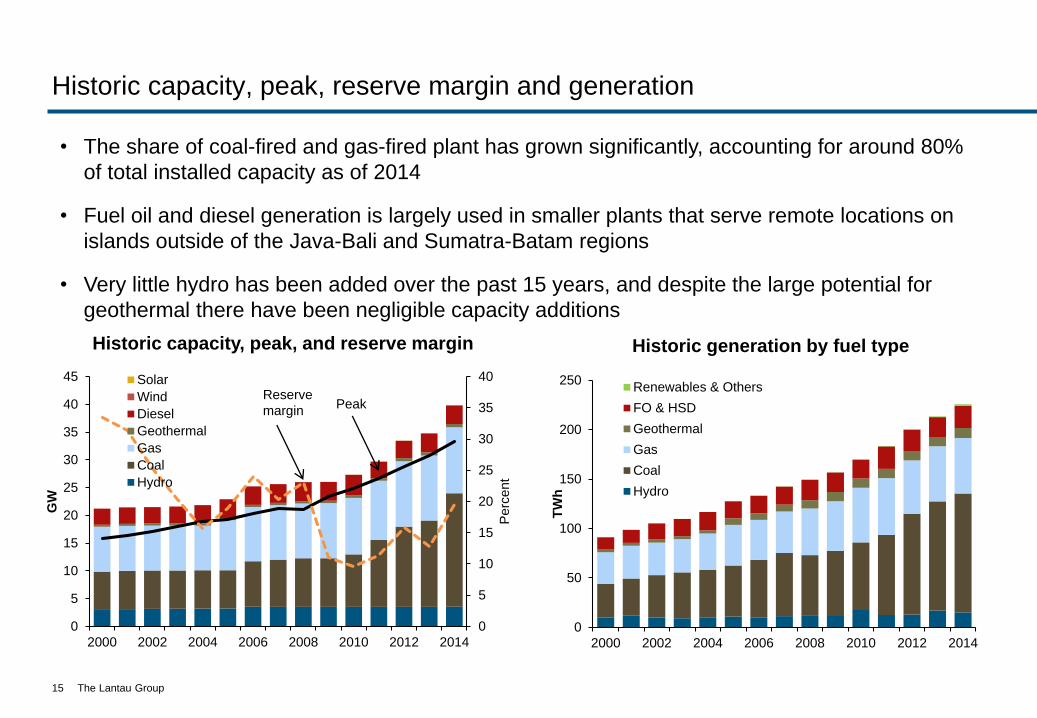
Historic capacity, peak, reserve margin and generation
15
0
50
100
150
200
250
2000 2002 2004 2006 2008 2010 2012 2014
TW
h
Renewables & Others
FO & HSD
Geothermal
Gas
Coal
Hydro
Historic generation by fuel type
0
5
10
15
20
25
30
35
40
0
5
10
15
20
25
30
35
40
45
2000 2002 2004 2006 2008 2010 2012 2014
Pe
rce
nt
GW
Solar
Wind
Diesel
Geothermal
Gas
Coal
Hydro
Historic capacity, peak, and reserve margin
Reserve
marginPeak
• The share of coal-fired and gas-fired plant has grown significantly, accounting for around 80%
of total installed capacity as of 2014
• Fuel oil and diesel generation is largely used in smaller plants that serve remote locations on
islands outside of the Java-Bali and Sumatra-Batam regions
• Very little hydro has been added over the past 15 years, and despite the large potential for
geothermal there have been negligible capacity additions
The Lantau Group
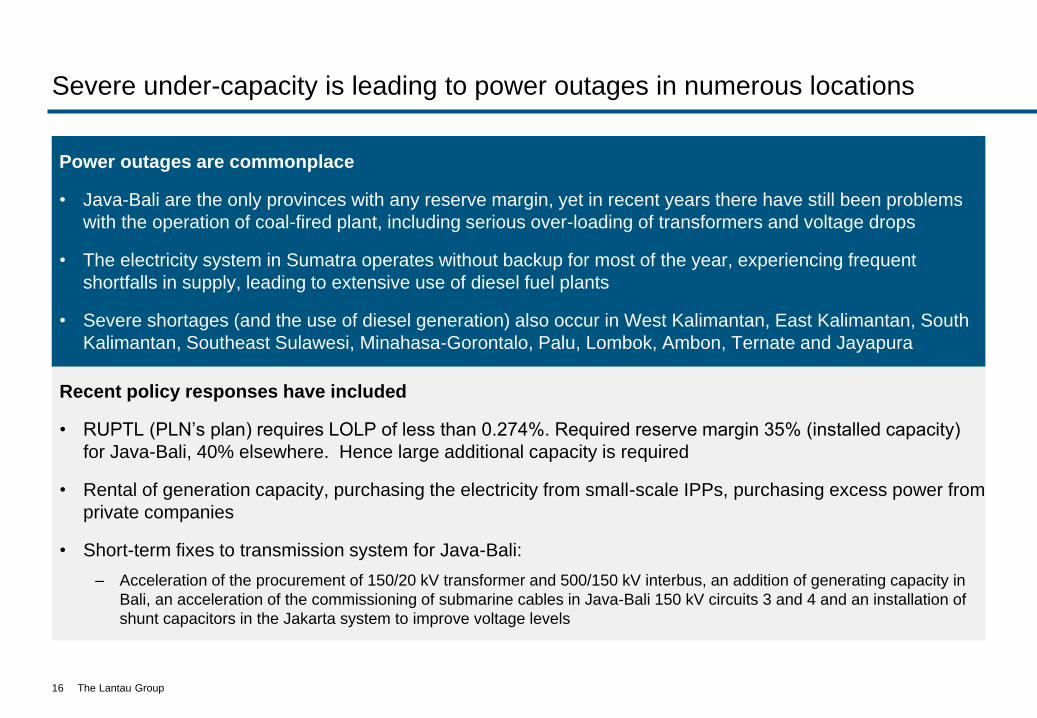
Severe under-capacity is leading to power outages in numerous locations
Power outages are commonplace
• Java-Bali are the only provinces with any reserve margin, yet in recent years there have still been problems
with the operation of coal-fired plant, including serious over-loading of transformers and voltage drops
• The electricity system in Sumatra operates without backup for most of the year, experiencing frequent
shortfalls in supply, leading to extensive use of diesel fuel plants
• Severe shortages (and the use of diesel generation) also occur in West Kalimantan, East Kalimantan, South
Kalimantan, Southeast Sulawesi, Minahasa-Gorontalo, Palu, Lombok, Ambon, Ternate and Jayapura
16
Recent policy responses have included
• RUPTL (PLN’s plan) requires LOLP of less than 0.274%. Required reserve margin 35% (installed capacity)
for Java-Bali, 40% elsewhere. Hence large additional capacity is required
• Rental of generation capacity, purchasing the electricity from small-scale IPPs, purchasing excess power from
private companies
• Short-term fixes to transmission system for Java-Bali:
– Acceleration of the procurement of 150/20 kV transformer and 500/150 kV interbus, an addition of generating capacity in
Bali, an acceleration of the commissioning of submarine cables in Java-Bali 150 kV circuits 3 and 4 and an installation of
shunt capacitors in the Jakarta system to improve voltage levels
The Lantau Group
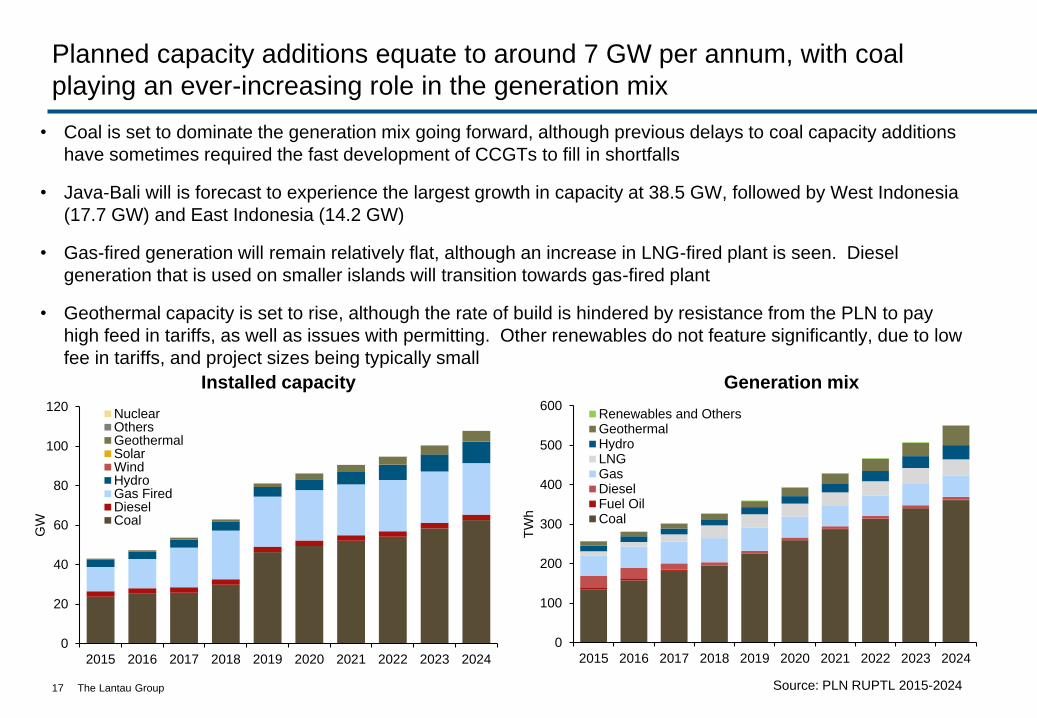
Planned capacity additions equate to around 7 GW per annum, with coal
playing an ever-increasing role in the generation mix
• Coal is set to dominate the generation mix going forward, although previous delays to coal capacity additions
have sometimes required the fast development of CCGTs to fill in shortfalls
• Java-Bali will is forecast to experience the largest growth in capacity at 38.5 GW, followed by West Indonesia
(17.7 GW) and East Indonesia (14.2 GW)
• Gas-fired generation will remain relatively flat, although an increase in LNG-fired plant is seen. Diesel
generation that is used on smaller islands will transition towards gas-fired plant
• Geothermal capacity is set to rise, although the rate of build is hindered by resistance from the PLN to pay
high feed in tariffs, as well as issues with permitting. Other renewables do not feature significantly, due to low
fee in tariffs, and project sizes being typically small
17 Source: PLN RUPTL 2015-2024
Installed capacity Generation mix
0
100
200
300
400
500
600
2015 2016 2017 2018 2019 2020 2021 2022 2023 2024
TW
h
Renewables and OthersGeothermalHydroLNGGasDieselFuel OilCoal
0
20
40
60
80
100
120
2015 2016 2017 2018 2019 2020 2021 2022 2023 2024
GW
NuclearOthersGeothermalSolarWindHydroGas FiredDieselCoal
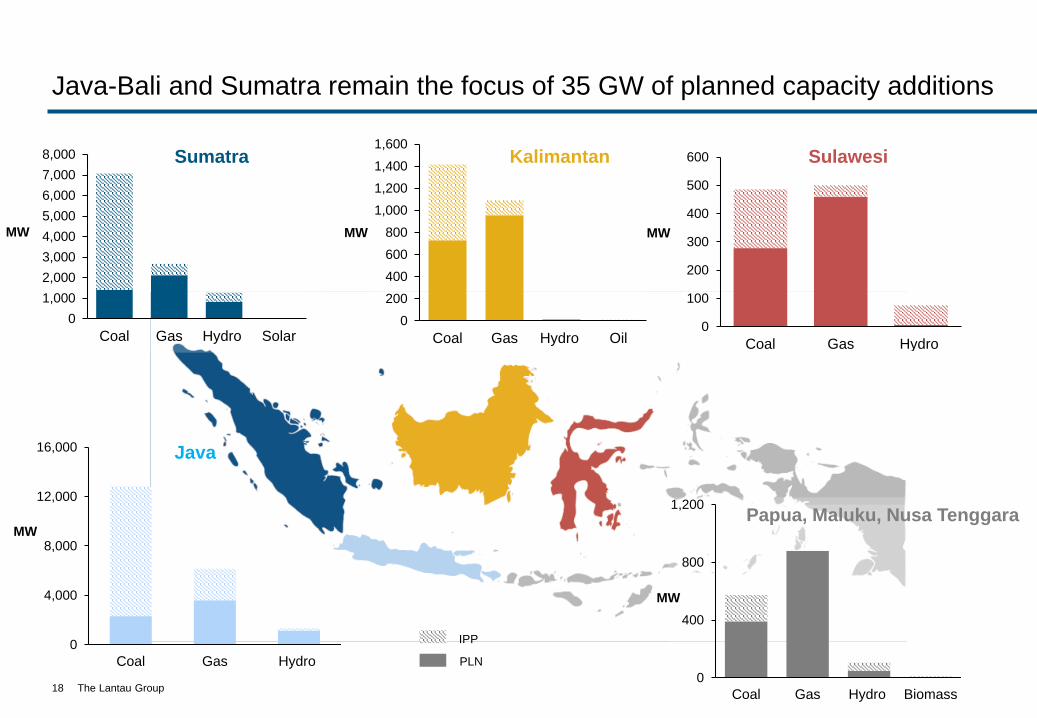
The Lantau Group
Java-Bali and Sumatra remain the focus of 35 GW of planned capacity additions
18
0
1,000
2,000
3,000
4,000
5,000
6,000
7,000
8,000
Coal Gas Hydro Solar0
200
400
600
800
1,000
1,200
1,400
1,600
Coal Gas Hydro Oil0
100
200
300
400
500
600
Coal Gas Hydro
0
400
800
1,200
Coal Gas Hydro Biomass
MW MW MW
Sumatra Kalimantan Sulawesi
Papua, Maluku, Nusa Tenggara
0
4,000
8,000
12,000
16,000
Coal Gas Hydro
Java
MW
MW
PLN
IPP
The Lantau Group
0
10
20
30
40
50
60
70
2001 2002 2003 2004 2005 2006 2007 2008 2009 2010 2011 2012 2013 2014 2015
GW
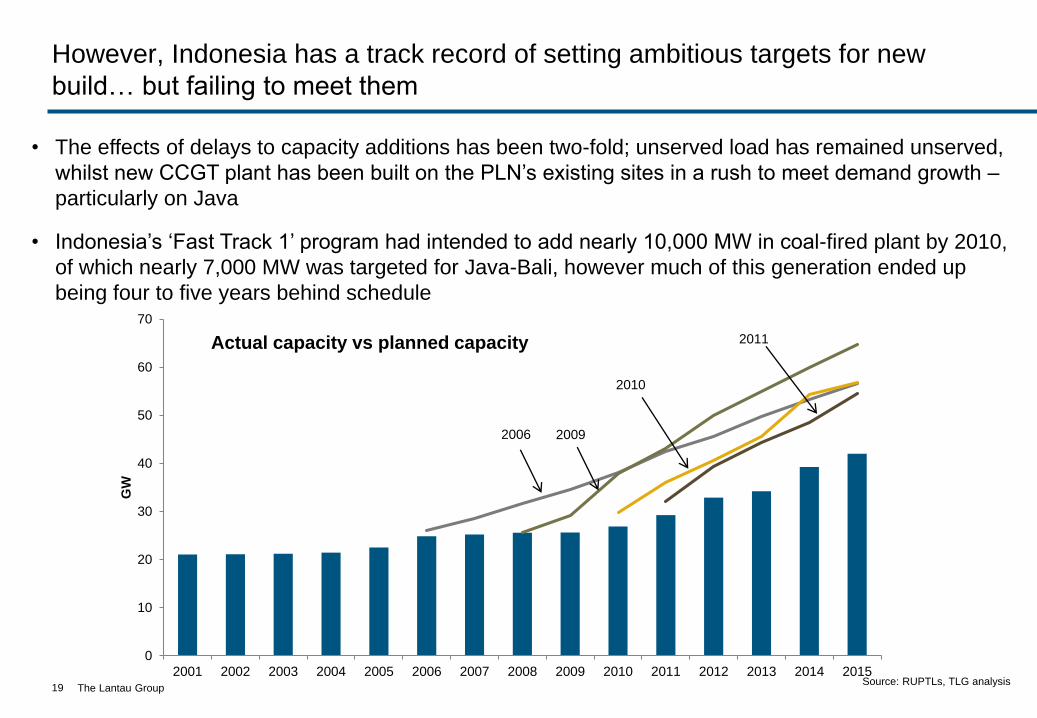
However, Indonesia has a track record of setting ambitious targets for new
build… but failing to meet them
19Source: RUPTLs, TLG analysis
2011
2009
2010
2006
• The effects of delays to capacity additions has been two-fold; unserved load has remained unserved,
whilst new CCGT plant has been built on the PLN’s existing sites in a rush to meet demand growth –
particularly on Java
• Indonesia’s ‘Fast Track 1’ program had intended to add nearly 10,000 MW in coal-fired plant by 2010,
of which nearly 7,000 MW was targeted for Java-Bali, however much of this generation ended up
being four to five years behind schedule
Actual capacity vs planned capacity
The Lantau Group
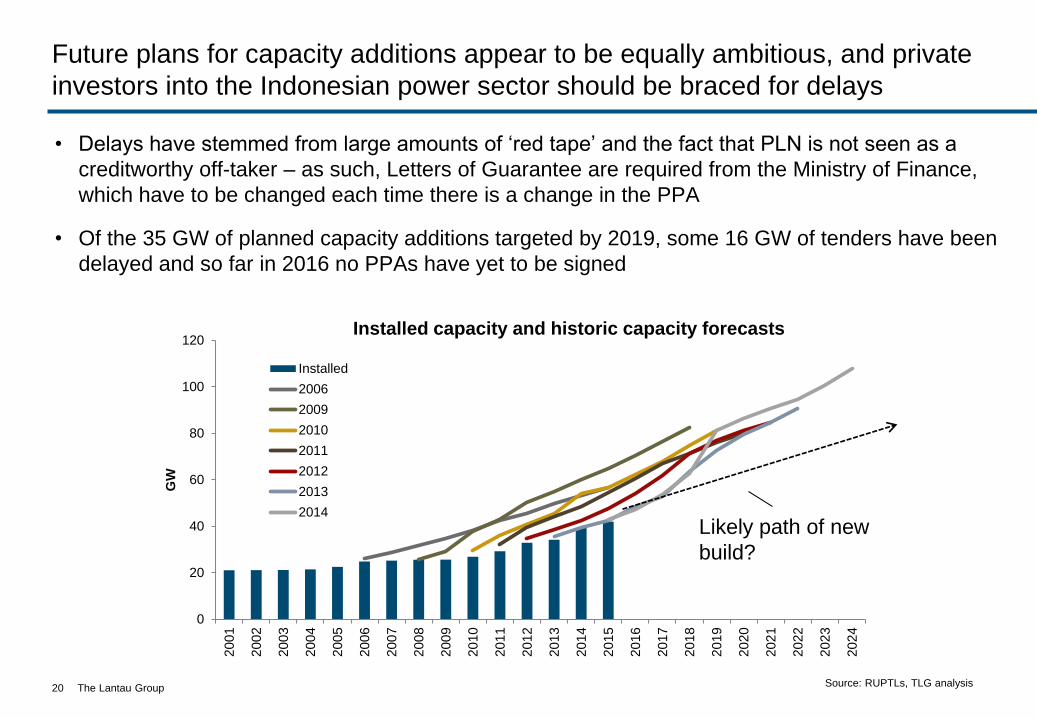
Future plans for capacity additions appear to be equally ambitious, and private
investors into the Indonesian power sector should be braced for delays
• Delays have stemmed from large amounts of ‘red tape’ and the fact that PLN is not seen as a
creditworthy off-taker – as such, Letters of Guarantee are required from the Ministry of Finance,
which have to be changed each time there is a change in the PPA
• Of the 35 GW of planned capacity additions targeted by 2019, some 16 GW of tenders have been
delayed and so far in 2016 no PPAs have yet to be signed
20Source: RUPTLs, TLG analysis
0
20
40
60
80
100
120
200
1
200
2
200
3
200
4
200
5
200
6
200
7
200
8
200
9
201
0
201
1
201
2
201
3
201
4
201
5
201
6
201
7
201
8
201
9
202
0
202
1
202
2
202
3
202
4
GW
Installed
2006
2009
2010
2011
2012
2013
2014
Likely path of new
build?
Installed capacity and historic capacity forecasts
The Lantau Group
Agenda
Introduction to The Lantau Group
Regional context within ASEAN
Indonesian power sector
• Overview
• Supply and demand fundamentals
• The role of fuels
• Renewable energy
• Regulation and policy
• Financing and competition
Summary
21
The Lantau Group
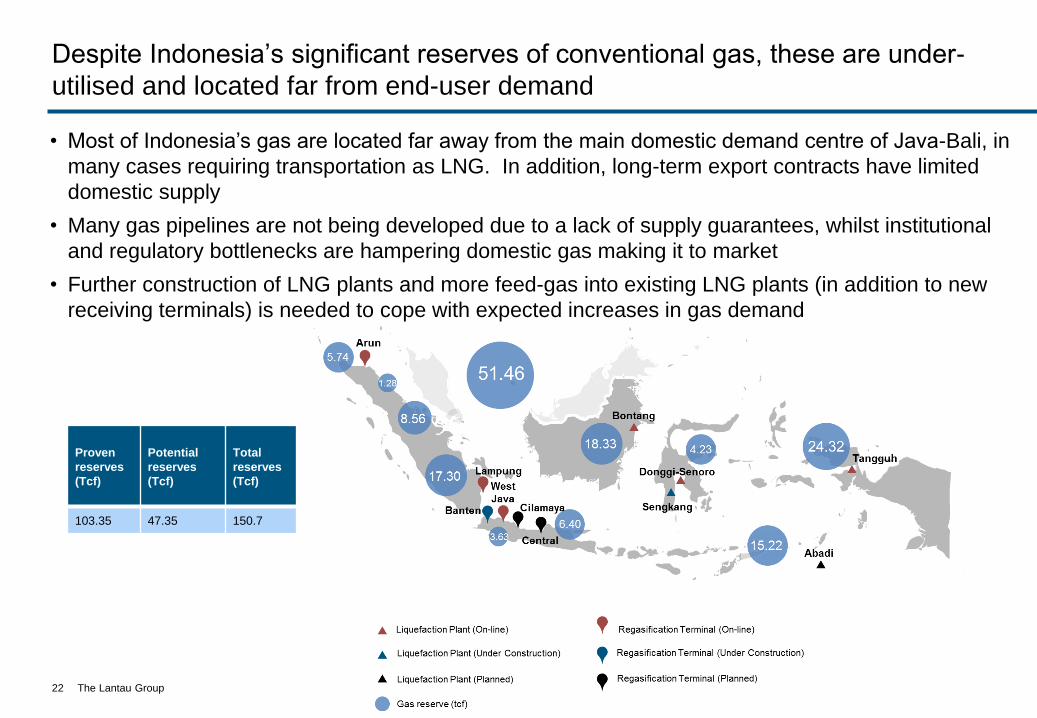
Despite Indonesia’s significant reserves of conventional gas, these are under-
utilised and located far from end-user demand
22
• Most of Indonesia’s gas are located far away from the main domestic demand centre of Java-Bali, in
many cases requiring transportation as LNG. In addition, long-term export contracts have limited
domestic supply
• Many gas pipelines are not being developed due to a lack of supply guarantees, whilst institutional
and regulatory bottlenecks are hampering domestic gas making it to market
• Further construction of LNG plants and more feed-gas into existing LNG plants (in addition to new
receiving terminals) is needed to cope with expected increases in gas demand
Proven
reserves
(Tcf)
Potential
reserves
(Tcf)
Total
reserves
(Tcf)
103.35 47.35 150.7
The Lantau Group
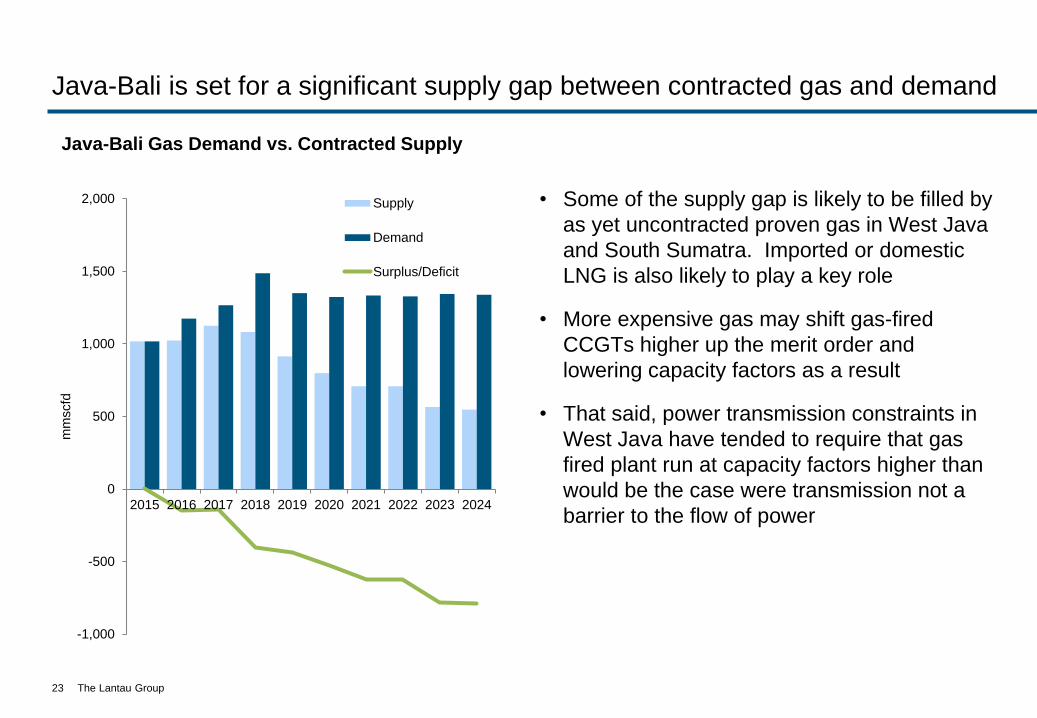
Java-Bali is set for a significant supply gap between contracted gas and demand
• Some of the supply gap is likely to be filled by
as yet uncontracted proven gas in West Java
and South Sumatra. Imported or domestic
LNG is also likely to play a key role
• More expensive gas may shift gas-fired
CCGTs higher up the merit order and
lowering capacity factors as a result
• That said, power transmission constraints in
West Java have tended to require that gas
fired plant run at capacity factors higher than
would be the case were transmission not a
barrier to the flow of power
23
-1,000
-500
0
500
1,000
1,500
2,000
2015 2016 2017 2018 2019 2020 2021 2022 2023 2024
mm
scfd
Supply
Demand
Surplus/Deficit
Java-Bali Gas Demand vs. Contracted Supply
The Lantau Group24
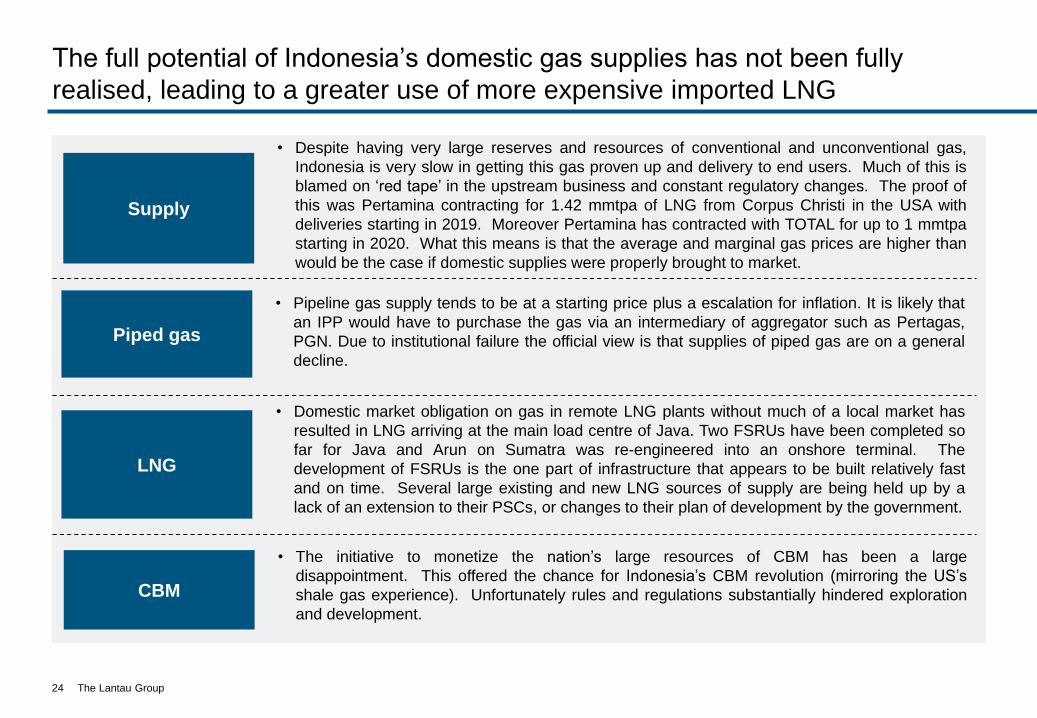
The full potential of Indonesia’s domestic gas supplies has not been fully
realised, leading to a greater use of more expensive imported LNG
Supply
• Despite having very large reserves and resources of conventional and unconventional gas,
Indonesia is very slow in getting this gas proven up and delivery to end users. Much of this is
blamed on ‘red tape’ in the upstream business and constant regulatory changes. The proof of
this was Pertamina contracting for 1.42 mmtpa of LNG from Corpus Christi in the USA with
deliveries starting in 2019. Moreover Pertamina has contracted with TOTAL for up to 1 mmtpa
starting in 2020. What this means is that the average and marginal gas prices are higher than
would be the case if domestic supplies were properly brought to market.
Piped gas
• Pipeline gas supply tends to be at a starting price plus a escalation for inflation. It is likely that
an IPP would have to purchase the gas via an intermediary of aggregator such as Pertagas,
PGN. Due to institutional failure the official view is that supplies of piped gas are on a general
decline.
LNG
• Domestic market obligation on gas in remote LNG plants without much of a local market has
resulted in LNG arriving at the main load centre of Java. Two FSRUs have been completed so
far for Java and Arun on Sumatra was re-engineered into an onshore terminal. The
development of FSRUs is the one part of infrastructure that appears to be built relatively fast
and on time. Several large existing and new LNG sources of supply are being held up by a
lack of an extension to their PSCs, or changes to their plan of development by the government.
CBM
• The initiative to monetize the nation’s large resources of CBM has been a large
disappointment. This offered the chance for Indonesia’s CBM revolution (mirroring the US’s
shale gas experience). Unfortunately rules and regulations substantially hindered exploration
and development.
The Lantau Group
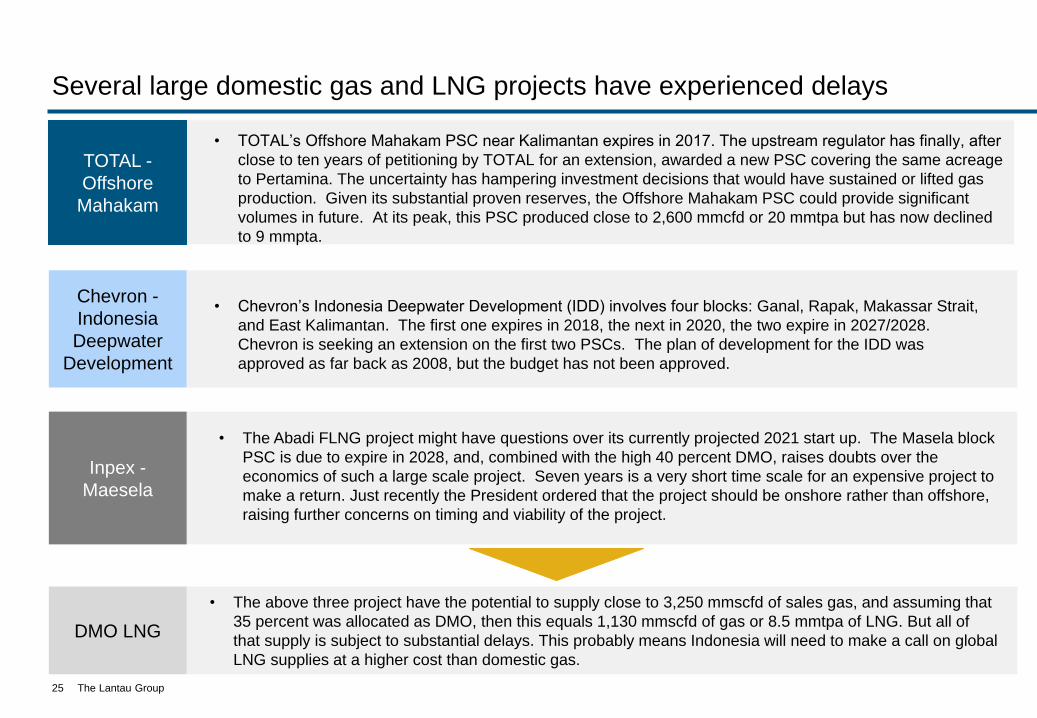
Several large domestic gas and LNG projects have experienced delays
• TOTAL’s Offshore Mahakam PSC near Kalimantan expires in 2017. The upstream regulator has finally, after
close to ten years of petitioning by TOTAL for an extension, awarded a new PSC covering the same acreage
to Pertamina. The uncertainty has hampering investment decisions that would have sustained or lifted gas
production. Given its substantial proven reserves, the Offshore Mahakam PSC could provide significant
volumes in future. At its peak, this PSC produced close to 2,600 mmcfd or 20 mmtpa but has now declined
to 9 mmpta.
TOTAL -
Offshore
Mahakam
Chevron -
Indonesia
Deepwater
Development
Inpex -
Maesela
DMO LNG
• Chevron’s Indonesia Deepwater Development (IDD) involves four blocks: Ganal, Rapak, Makassar Strait,
and East Kalimantan. The first one expires in 2018, the next in 2020, the two expire in 2027/2028.
Chevron is seeking an extension on the first two PSCs. The plan of development for the IDD was
approved as far back as 2008, but the budget has not been approved.
• The Abadi FLNG project might have questions over its currently projected 2021 start up. The Masela block
PSC is due to expire in 2028, and, combined with the high 40 percent DMO, raises doubts over the
economics of such a large scale project. Seven years is a very short time scale for an expensive project to
make a return. Just recently the President ordered that the project should be onshore rather than offshore,
raising further concerns on timing and viability of the project.
• The above three project have the potential to supply close to 3,250 mmscfd of sales gas, and assuming that
35 percent was allocated as DMO, then this equals 1,130 mmscfd of gas or 8.5 mmtpa of LNG. But all of
that supply is subject to substantial delays. This probably means Indonesia will need to make a call on global
LNG supplies at a higher cost than domestic gas.
25
The Lantau Group26
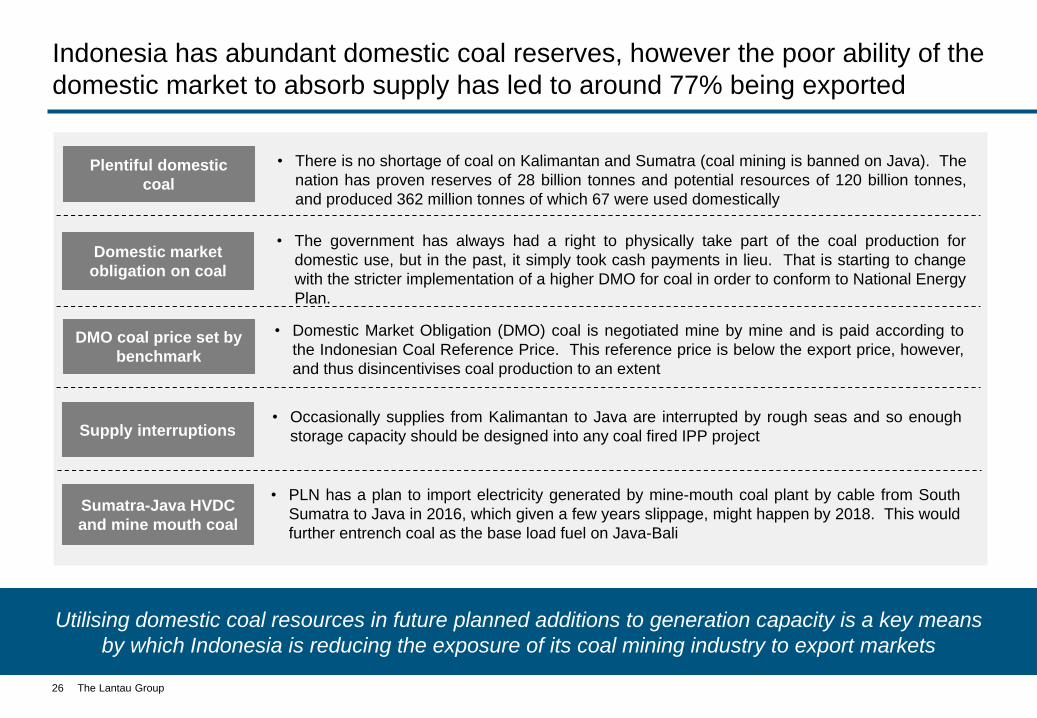
Indonesia has abundant domestic coal reserves, however the poor ability of the
domestic market to absorb supply has led to around 77% being exported
Plentiful domestic
coal
• There is no shortage of coal on Kalimantan and Sumatra (coal mining is banned on Java). The
nation has proven reserves of 28 billion tonnes and potential resources of 120 billion tonnes,
and produced 362 million tonnes of which 67 were used domestically
Domestic market
obligation on coal
• The government has always had a right to physically take part of the coal production for
domestic use, but in the past, it simply took cash payments in lieu. That is starting to change
with the stricter implementation of a higher DMO for coal in order to conform to National Energy
Plan.
DMO coal price set by
benchmark
• Domestic Market Obligation (DMO) coal is negotiated mine by mine and is paid according to
the Indonesian Coal Reference Price. This reference price is below the export price, however,
and thus disincentivises coal production to an extent
Supply interruptions • Occasionally supplies from Kalimantan to Java are interrupted by rough seas and so enough
storage capacity should be designed into any coal fired IPP project
Sumatra-Java HVDC
and mine mouth coal
• PLN has a plan to import electricity generated by mine-mouth coal plant by cable from South
Sumatra to Java in 2016, which given a few years slippage, might happen by 2018. This would
further entrench coal as the base load fuel on Java-Bali
Utilising domestic coal resources in future planned additions to generation capacity is a key means
by which Indonesia is reducing the exposure of its coal mining industry to export markets
The Lantau Group
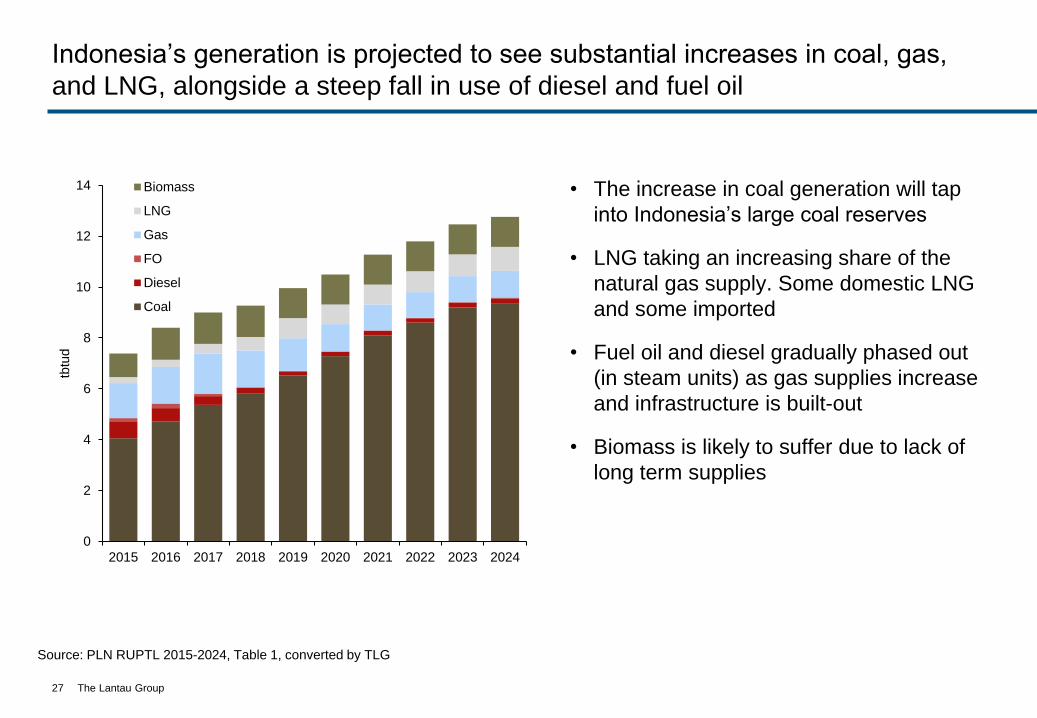
Indonesia’s generation is projected to see substantial increases in coal, gas,
and LNG, alongside a steep fall in use of diesel and fuel oil
• The increase in coal generation will tap
into Indonesia’s large coal reserves
• LNG taking an increasing share of the
natural gas supply. Some domestic LNG
and some imported
• Fuel oil and diesel gradually phased out
(in steam units) as gas supplies increase
and infrastructure is built-out
• Biomass is likely to suffer due to lack of
long term supplies
27
Source: PLN RUPTL 2015-2024, Table 1, converted by TLG
0
2
4
6
8
10
12
14
2015 2016 2017 2018 2019 2020 2021 2022 2023 2024
tbtu
d
Biomass
LNG
Gas
FO
Diesel
Coal
The Lantau Group
Agenda
Introduction to The Lantau Group
Regional context within ASEAN
Indonesian power sector
• Overview
• Supply and demand fundamentals
• The role of fuels
• Renewable energy
• Regulation and policy
• Financing and competition
Summary
28
The Lantau Group
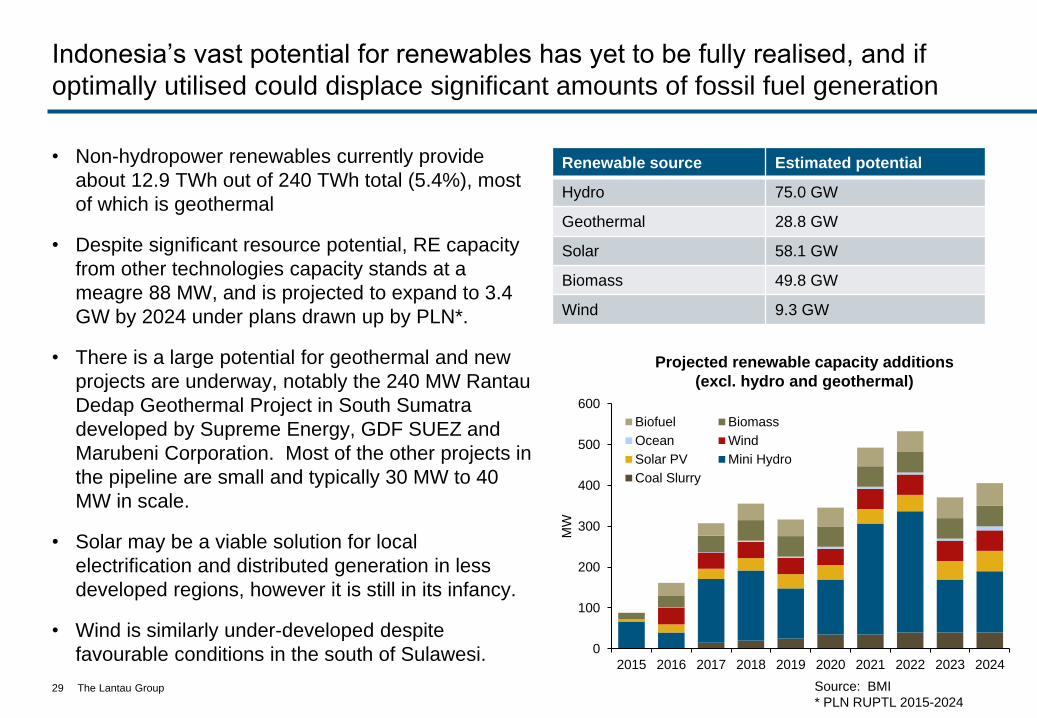
Indonesia’s vast potential for renewables has yet to be fully realised, and if
optimally utilised could displace significant amounts of fossil fuel generation
• Non-hydropower renewables currently provide
about 12.9 TWh out of 240 TWh total (5.4%), most
of which is geothermal
• Despite significant resource potential, RE capacity
from other technologies capacity stands at a
meagre 88 MW, and is projected to expand to 3.4
GW by 2024 under plans drawn up by PLN*.
• There is a large potential for geothermal and new
projects are underway, notably the 240 MW Rantau
Dedap Geothermal Project in South Sumatra
developed by Supreme Energy, GDF SUEZ and
Marubeni Corporation. Most of the other projects in
the pipeline are small and typically 30 MW to 40
MW in scale.
• Solar may be a viable solution for local
electrification and distributed generation in less
developed regions, however it is still in its infancy.
• Wind is similarly under-developed despite
favourable conditions in the south of Sulawesi.
29 Source: BMI
* PLN RUPTL 2015-2024
Projected renewable capacity additions
(excl. hydro and geothermal)
Renewable source Estimated potential
Hydro 75.0 GW
Geothermal 28.8 GW
Solar 58.1 GW
Biomass 49.8 GW
Wind 9.3 GW
0
100
200
300
400
500
600
2015 2016 2017 2018 2019 2020 2021 2022 2023 2024
MW
Biofuel Biomass
Ocean Wind
Solar PV Mini Hydro
Coal Slurry
The Lantau Group
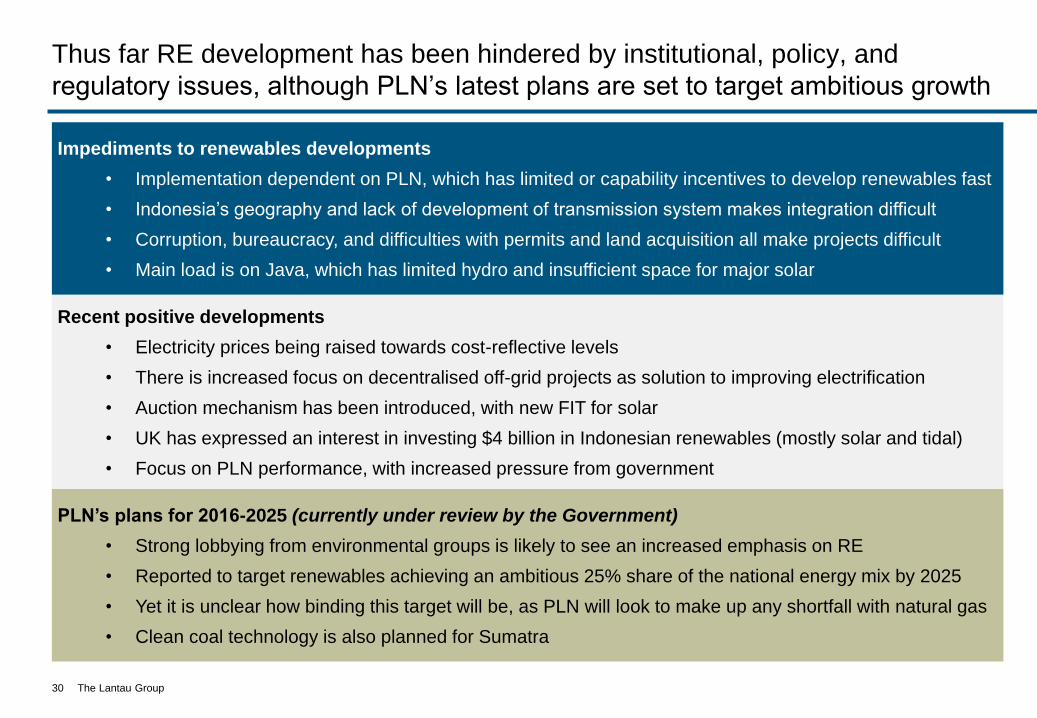
Recent positive developments
• Electricity prices being raised towards cost-reflective levels
• There is increased focus on decentralised off-grid projects as solution to improving electrification
• Auction mechanism has been introduced, with new FIT for solar
• UK has expressed an interest in investing $4 billion in Indonesian renewables (mostly solar and tidal)
• Focus on PLN performance, with increased pressure from government
Impediments to renewables developments
• Implementation dependent on PLN, which has limited or capability incentives to develop renewables fast
• Indonesia’s geography and lack of development of transmission system makes integration difficult
• Corruption, bureaucracy, and difficulties with permits and land acquisition all make projects difficult
• Main load is on Java, which has limited hydro and insufficient space for major solar
30
Thus far RE development has been hindered by institutional, policy, and
regulatory issues, although PLN’s latest plans are set to target ambitious growth
PLN’s plans for 2016-2025 (currently under review by the Government)
• Strong lobbying from environmental groups is likely to see an increased emphasis on RE
• Reported to target renewables achieving an ambitious 25% share of the national energy mix by 2025
• Yet it is unclear how binding this target will be, as PLN will look to make up any shortfall with natural gas
• Clean coal technology is also planned for Sumatra
The Lantau Group
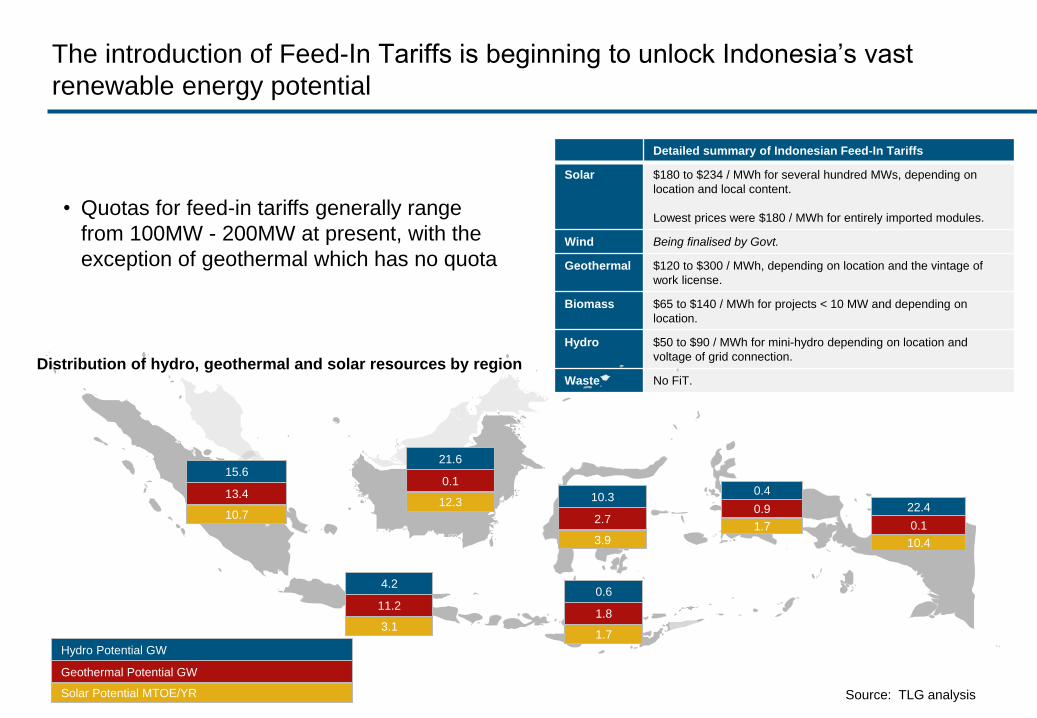
The introduction of Feed-In Tariffs is beginning to unlock Indonesia’s vast
renewable energy potential
31
• Quotas for feed-in tariffs generally range
from 100MW - 200MW at present, with the
exception of geothermal which has no quota
Detailed summary of Indonesian Feed-In Tariffs
Solar $180 to $234 / MWh for several hundred MWs, depending on
location and local content.
Lowest prices were $180 / MWh for entirely imported modules.
Wind Being finalised by Govt.
Geothermal $120 to $300 / MWh, depending on location and the vintage of
work license.
Biomass $65 to $140 / MWh for projects < 10 MW and depending on
location.
Hydro $50 to $90 / MWh for mini-hydro depending on location and
voltage of grid connection.
Waste No FiT.
51.46
6.40
15.22
15.6
13.4
10.7
21.6
0.1
12.3
4.2
11.2
3.1
10.3
2.7
3.9
0.6
1.8
1.7
0.4
0.9
1.7
22.4
0.1
10.4
Hydro Potential GW
Geothermal Potential GW
Solar Potential MTOE/YR
Distribution of hydro, geothermal and solar resources by region
Source: TLG analysis
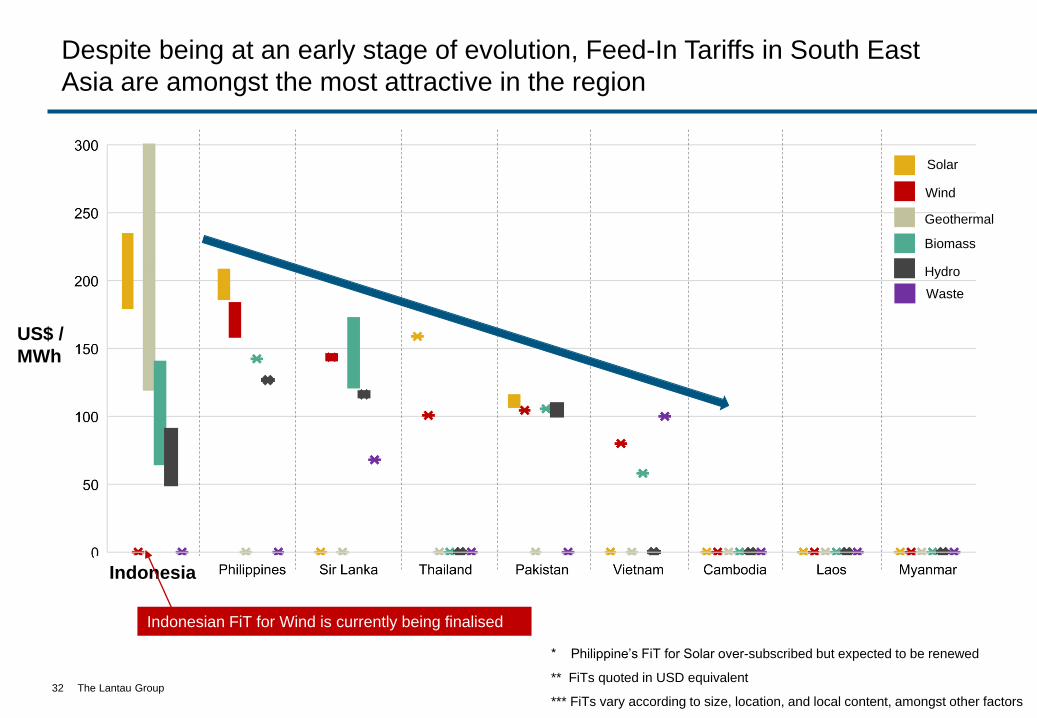
The Lantau Group32
* Philippine’s FiT for Solar over-subscribed but expected to be renewed
** FiTs quoted in USD equivalent
*** FiTs vary according to size, location, and local content, amongst other factors
US$ /
MWh
Indonesia
Indonesian FiT for Wind is currently being finalised
Solar
Wind
Geothermal
Biomass
Hydro
Waste
Despite being at an early stage of evolution, Feed-In Tariffs in South East
Asia are amongst the most attractive in the region
The Lantau Group
Agenda
Introduction to The Lantau Group
Regional context within ASEAN
Indonesian power sector
• Overview
• Supply and demand fundamentals
• The role of fuels
• Renewable energy
• Regulation and policy
• Financing and competition
Summary
33
The Lantau Group
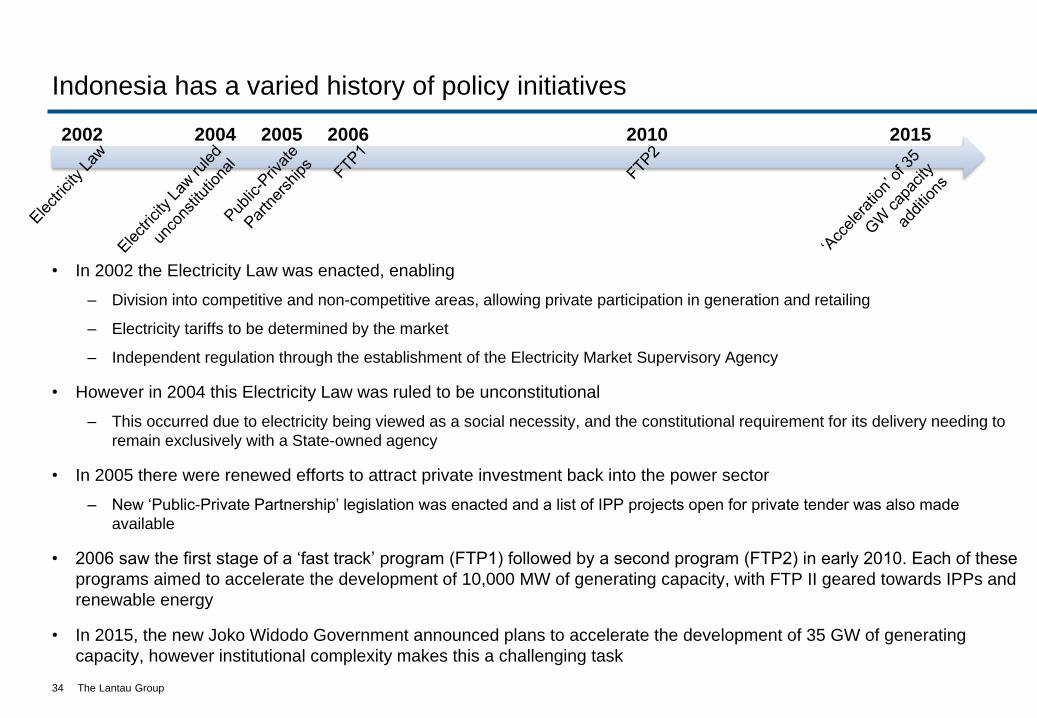
Indonesia has a varied history of policy initiatives
• In 2002 the Electricity Law was enacted, enabling
– Division into competitive and non-competitive areas, allowing private participation in generation and retailing
– Electricity tariffs to be determined by the market
– Independent regulation through the establishment of the Electricity Market Supervisory Agency
• However in 2004 this Electricity Law was ruled to be unconstitutional
– This occurred due to electricity being viewed as a social necessity, and the constitutional requirement for its delivery needing to
remain exclusively with a State-owned agency
• In 2005 there were renewed efforts to attract private investment back into the power sector
– New ‘Public-Private Partnership’ legislation was enacted and a list of IPP projects open for private tender was also made
available
• 2006 saw the first stage of a ‘fast track’ program (FTP1) followed by a second program (FTP2) in early 2010. Each of these
programs aimed to accelerate the development of 10,000 MW of generating capacity, with FTP II geared towards IPPs and
renewable energy
• In 2015, the new Joko Widodo Government announced plans to accelerate the development of 35 GW of generating
capacity, however institutional complexity makes this a challenging task
34
2002 2004 2005 2006 20152010

The Lantau Group
A background to electricity pricing and subsidies
A key issue with the Indonesian ESI is that PLN sells electricity at a lower price than it costs
• PLN's selling price in 2014 was IDR922 per kWh while the cost of production was IDR1,424
• The shortfall is funded through a Government subsidy estimated at around US$5.6 billion pa.
Electricity prices are regulated by the Indonesian government and they are trying to phase out the
subsidies
• There are four basic tariff categories based on consumer type: residential; industrial; business;
and public (such as government agencies and hospitals)
• The Government increased electricity prices by an average of 15% in 2013 under (MEMR
Regulation No.30/2012)
• Electricity prices were raised further during 2014 (MEMR Regulations Nos. 9/2014, 19/2014 and
31/2014), with total increases of over 30% for a number of industry and household sub-
categories
• There are automatic price adjustments for some consumers based on the exchange rate,
inflation and the Indonesian Crude Price (ICP)
35
The Lantau Group
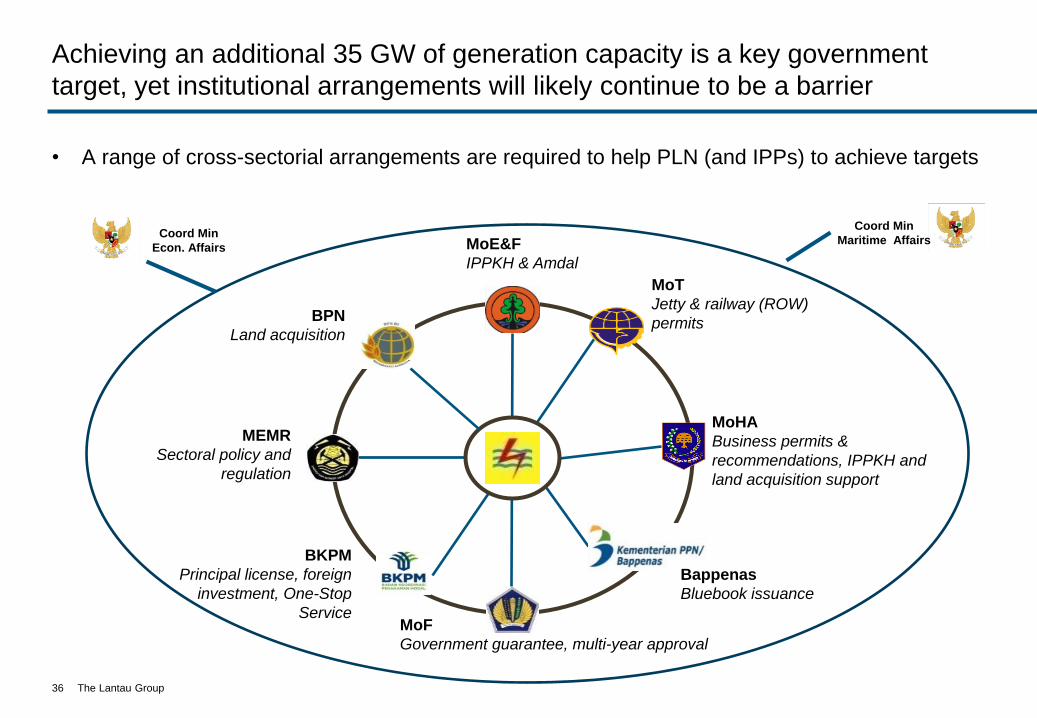
Coord Min
Econ. Affairs
MoT
Jetty & railway (ROW)
permits
MoHA
Business permits &
recommendations, IPPKH and
land acquisition support
MoE&F
IPPKH & Amdal
BPN
Land acquisition
MEMR
Sectoral policy and
regulation
BKPM
Principal license, foreign
investment, One-Stop
ServiceMoF
Government guarantee, multi-year approval
Bappenas
Bluebook issuance
Coord Min
Maritime Affairs
36
Achieving an additional 35 GW of generation capacity is a key government
target, yet institutional arrangements will likely continue to be a barrier
• A range of cross-sectorial arrangements are required to help PLN (and IPPs) to achieve targets
The Lantau Group
Agenda
Introduction to The Lantau Group
Regional context within ASEAN
Indonesian power sector
• Overview
• Supply and demand fundamentals
• The role of fuels
• Renewable energy
• Regulation and policy
• Financing and competition
Summary
37
The Lantau Group
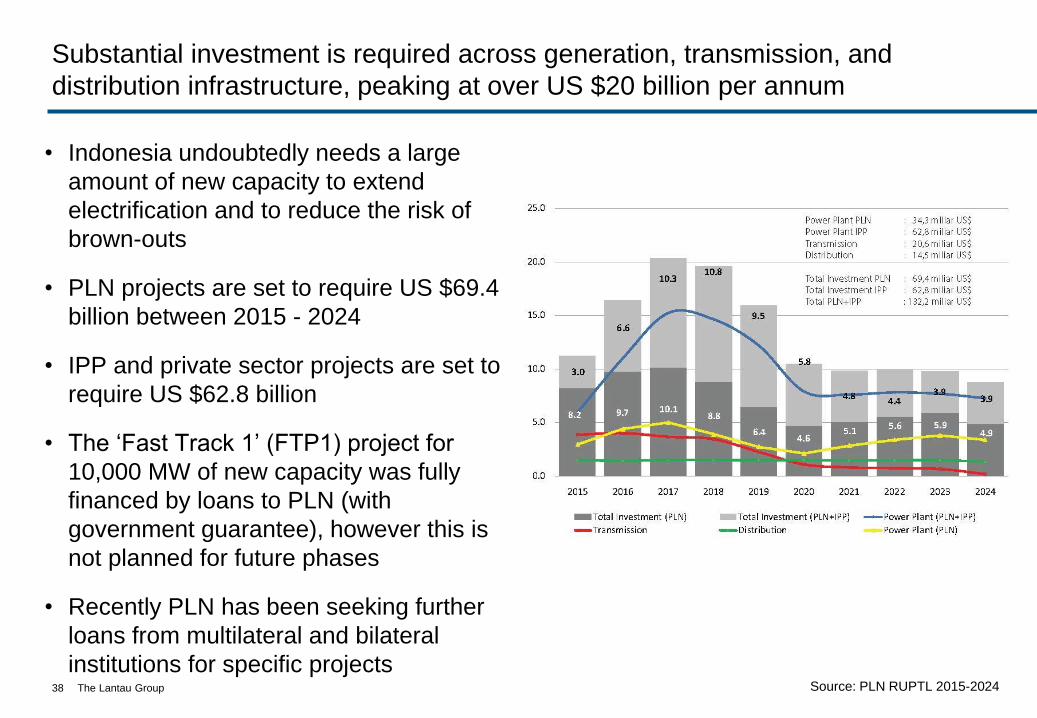
Substantial investment is required across generation, transmission, and
distribution infrastructure, peaking at over US $20 billion per annum
• Indonesia undoubtedly needs a large
amount of new capacity to extend
electrification and to reduce the risk of
brown-outs
• PLN projects are set to require US $69.4
billion between 2015 - 2024
• IPP and private sector projects are set to
require US $62.8 billion
• The ‘Fast Track 1’ (FTP1) project for
10,000 MW of new capacity was fully
financed by loans to PLN (with
government guarantee), however this is
not planned for future phases
• Recently PLN has been seeking further
loans from multilateral and bilateral
institutions for specific projects38 Source: PLN RUPTL 2015-2024
The Lantau Group
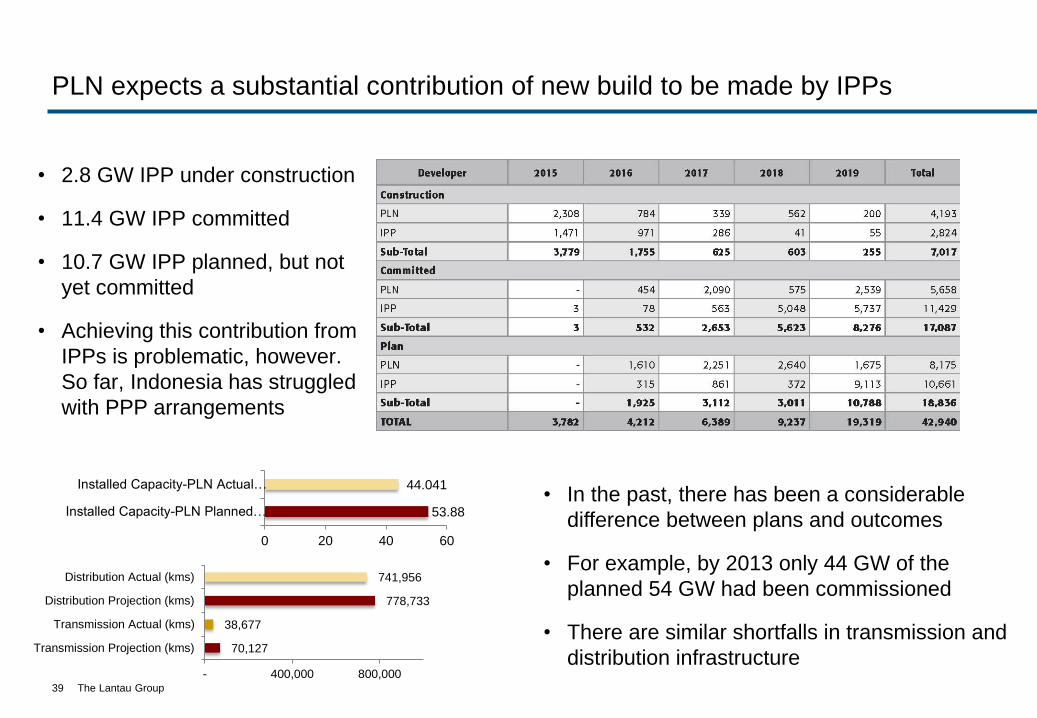
PLN expects a substantial contribution of new build to be made by IPPs
• 2.8 GW IPP under construction
• 11.4 GW IPP committed
• 10.7 GW IPP planned, but not
yet committed
• Achieving this contribution from
IPPs is problematic, however.
So far, Indonesia has struggled
with PPP arrangements
39
• In the past, there has been a considerable
difference between plans and outcomes
• For example, by 2013 only 44 GW of the
planned 54 GW had been commissioned
• There are similar shortfalls in transmission and
distribution infrastructure70,127
38,677
778,733
741,956
- 400,000 800,000
Transmission Projection (kms)
Transmission Actual (kms)
Distribution Projection (kms)
Distribution Actual (kms)
53.88
44.041
0 20 40 60
Installed Capacity-PLN Planned…
Installed Capacity-PLN Actual…
The Lantau Group
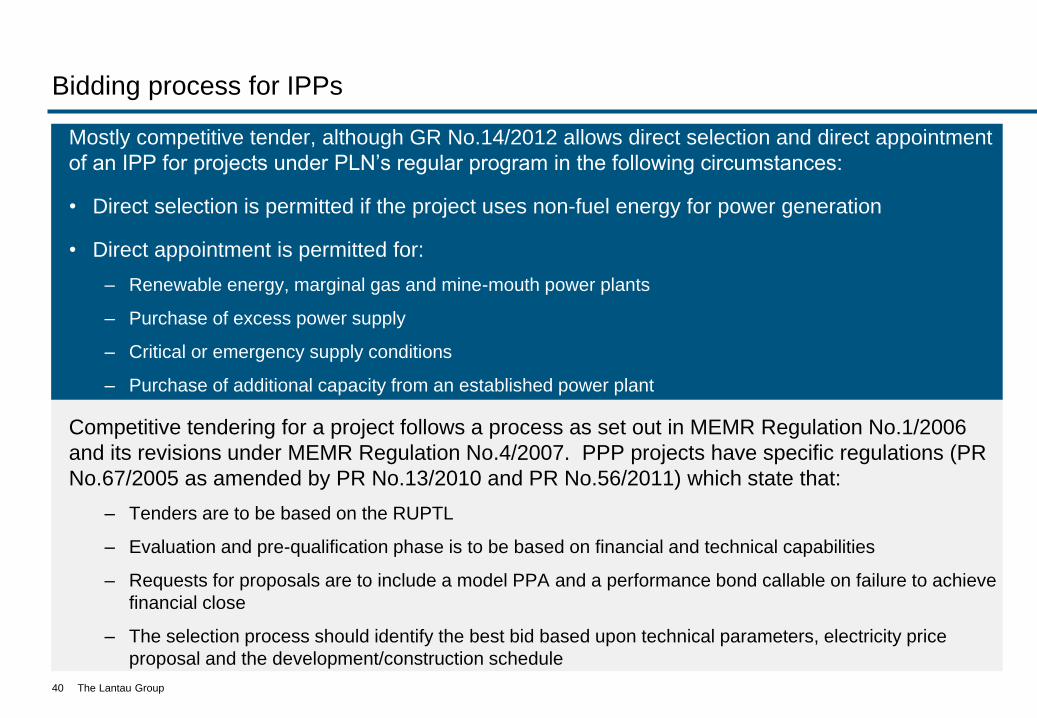
Bidding process for IPPs
Mostly competitive tender, although GR No.14/2012 allows direct selection and direct appointment
of an IPP for projects under PLN’s regular program in the following circumstances:
• Direct selection is permitted if the project uses non-fuel energy for power generation
• Direct appointment is permitted for:
– Renewable energy, marginal gas and mine-mouth power plants
– Purchase of excess power supply
– Critical or emergency supply conditions
– Purchase of additional capacity from an established power plant
Competitive tendering for a project follows a process as set out in MEMR Regulation No.1/2006
and its revisions under MEMR Regulation No.4/2007. PPP projects have specific regulations (PR
No.67/2005 as amended by PR No.13/2010 and PR No.56/2011) which state that:
– Tenders are to be based on the RUPTL
– Evaluation and pre-qualification phase is to be based on financial and technical capabilities
– Requests for proposals are to include a model PPA and a performance bond callable on failure to achieve
financial close
– The selection process should identify the best bid based upon technical parameters, electricity price
proposal and the development/construction schedule
40
The Lantau Group
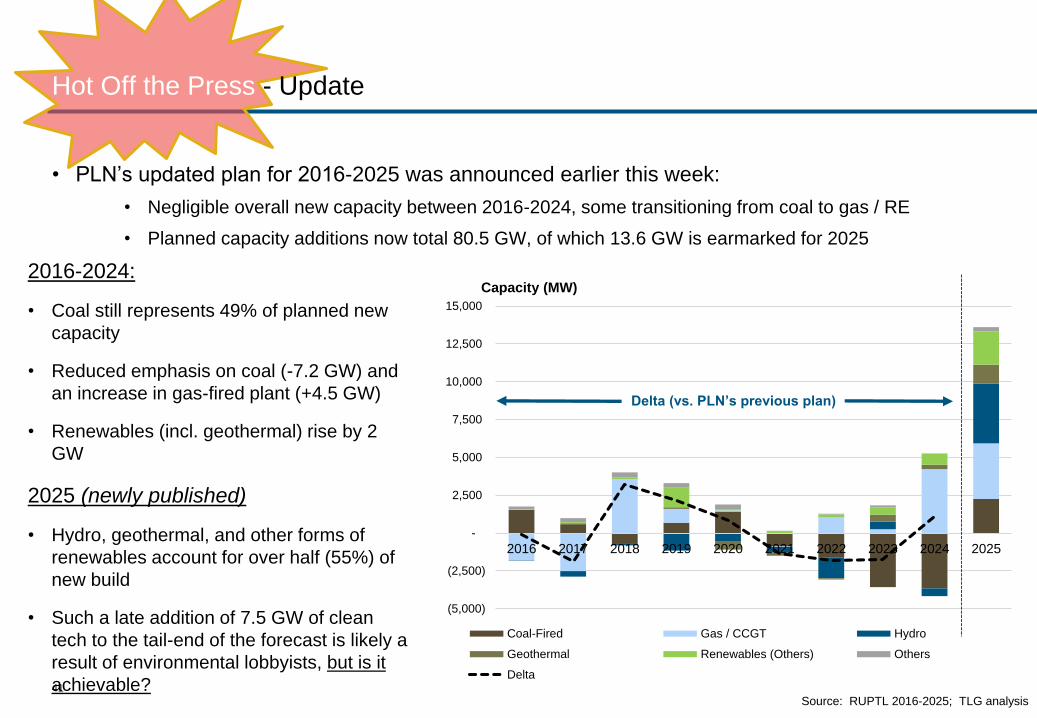
Hot Off the Press - Update
41
(5,000)
(2,500)
-
2,500
5,000
7,500
10,000
12,500
15,000
2016 2017 2018 2019 2020 2021 2022 2023 2024 2025
Coal-Fired Gas / CCGT Hydro
Geothermal Renewables (Others) Others
Delta
Capacity (MW)
Delta (vs. PLN’s previous plan)
• PLN’s updated plan for 2016-2025 was announced earlier this week:
• Negligible overall new capacity between 2016-2024, some transitioning from coal to gas / RE
• Planned capacity additions now total 80.5 GW, of which 13.6 GW is earmarked for 2025
2016-2024:
• Coal still represents 49% of planned new
capacity
• Reduced emphasis on coal (-7.2 GW) and
an increase in gas-fired plant (+4.5 GW)
• Renewables (incl. geothermal) rise by 2
GW
2025 (newly published)
• Hydro, geothermal, and other forms of
renewables account for over half (55%) of
new build
• Such a late addition of 7.5 GW of clean
tech to the tail-end of the forecast is likely a
result of environmental lobbyists, but is it
achievable?Source: RUPTL 2016-2025; TLG analysis
The Lantau Group
In Summary
• Indonesia is a major growth market in Asia
• It needs all kinds of capacity using various fuels in many places
• However, it remains a difficult place to do business and policy and regulatory hurdles remain
42
The Lantau Group
The end
43
For more information please contact us:
By emailSarah Fairhurst
Onlinewww.lantaugroup.com
Rigour
Value
Insight
NetworksElectricity Gas