developments & trends in tanzania’s water sector dar es salaam - september 2005
TRANSCRIPT

Developments & Trends in Tanzania’s Water Sector
Dar es Salaam - September 2005

Urban and Rural water supply coverage against PRS and MDG targets
87 90
35
46
88
6770
73
3843
5053
MDG94
MDG67NSGRP
65
Census85
Census42
0
10
20
30
40
50
60
70
80
90
100
1980 1985 1990 1995 2000 2005 2010 2015 2020Year
% coverage clean and safe drinking water
Urban targetsRural targetsUrban progress reported by surveyRural progress reported by surveyUrban progress reported by MinistryRural progress reported by Ministry
NSGRP90
PRS55

Percentage of rural households using improved water sources
Mainland average = 42%

Why is past performance not a guide to future performance?

Out of:
• rural water projects - Nordic countries all exited leaving only investments from Netherlands and in future JICA.
Into:
• basket funds - health, education, roads
• budget support - including key development partners who worked in rural water
• ‘bankable’ urban water projects - WB, AfDB, EIB, EC, KFW as well as France (small towns), Swiss (Tabora, Dodoma)
Shifting aid modalities and investment priorities of Tanzania’s development partners

• Centrally implemented ‘national’ projects - GOT is channelling >90% of water sector development funding to the Lake Victoria - Kahama- Shinyanaga pipeline.
• Centrally controlled rural water supply project - WB funded RWSSP run by a central project implementation unit.
• No fiscal decentralisation - Only 10% of the water sector budget goes to LGAs.
• No LGA investment in water supply - LGAs are not using their locally raised income to fund water
But no counter-shift by Government of Tanzania

Tanzania water sector budgets 2000 to 2005
0
20
40
60
80
100
120
140
2000/1 2001/2 2002/3 2003/4 2004/5
Financial years
USD millions
Donor Development
Ministry Development
Ministry Recurrent
Local Councils
93% of local development funds for new Lake Victoria-Shinyanga pipeline
Less than 2% of total budget for low cost technologies such as shallow wells and protected springs
Donor funds:62% urban28% small towns10% villages6% sector reform
Local councils receive just 10% of the budget

Research on local government reformREPOA & Chr Michelsen Institute
Citizen survey in six councils found those satisfied with education 70%, with health 36%, with water supply 22%.
Respondents that had seen an improvement in services for education 85%, health services 37%, water supply 20%.
When asked which service is most important to improve now water supply was the priority.
But …
council resources allocated to water sector were by far lowest of the three services at between 0.3 and 2% of total expenditures
Are there disincentives to allocating budget for water (check MTEFs)?

Result of current state of play
• Rural investment vacuum
• Costs of technology up - Shift from low cost to high cost technologies; from shallow well and simple gravity schemes at $30 per capita to large piped systems at $260 per capita
• Equity of investments down - in terms of:• geography - from investment in most regions to investment
in one region• socio-economic - from point sources to piped schemes
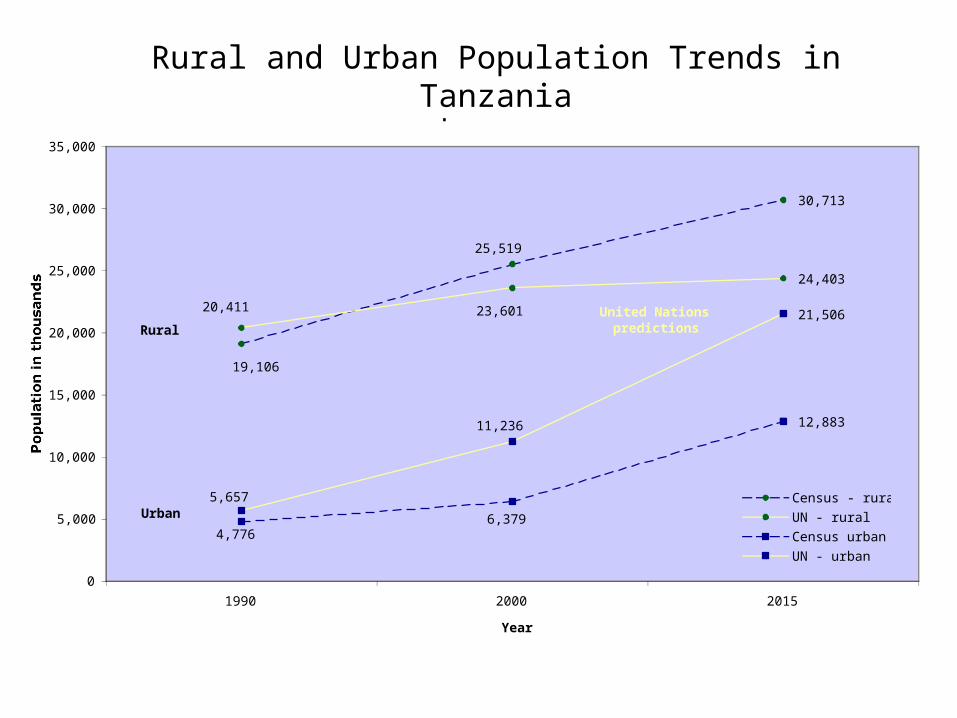
Rural and Urban Population Trends in Tanzania
30,713
24,403
12,883
21,506
19,106
25,519
20,411 23,601
4,7766,379
5,657
11,236
0
5,000
10,000
15,000
20,000
25,000
30,000
35,000
1990 2000 2015
Year
Population in thousands
Census - rural
UN - rural
Census urban
UN - urban
Rural
Urban
United Nations predictions
Rural and Urban Population Trends in Tanzania

1. Build and rehabilitate 3,000 rural water points each year
2. Increase LGA spending on rural water supply by $30 million a year
3. Targeted urban water sector spending of $66 million a year (first generation beneficiaries)
What will it take to meet MDG & MKUKUTA targets for water supply?


Rural Water Supply Dar es Salaam - September 2005

Percentage of rural households using improved water sources
Mainland average = 42%

• 7 districts in which fewer than 10% of rural households have access to improved water supply : Sikonge (4%), Igunga (5%), Kishapu (9.6%), Liwale (8%), Mkuranga (6%), Rufiji (9%) and Mafia (3%)
• 4 districts in which over 80% of households have access: Arumeru (82%), Mwanga (82%), Kyela (83%) and Rombo (93%).
• In 63 % of districts less than 50% of households have access to improved water supply
Extreme inequalities across districts

District Case Studies
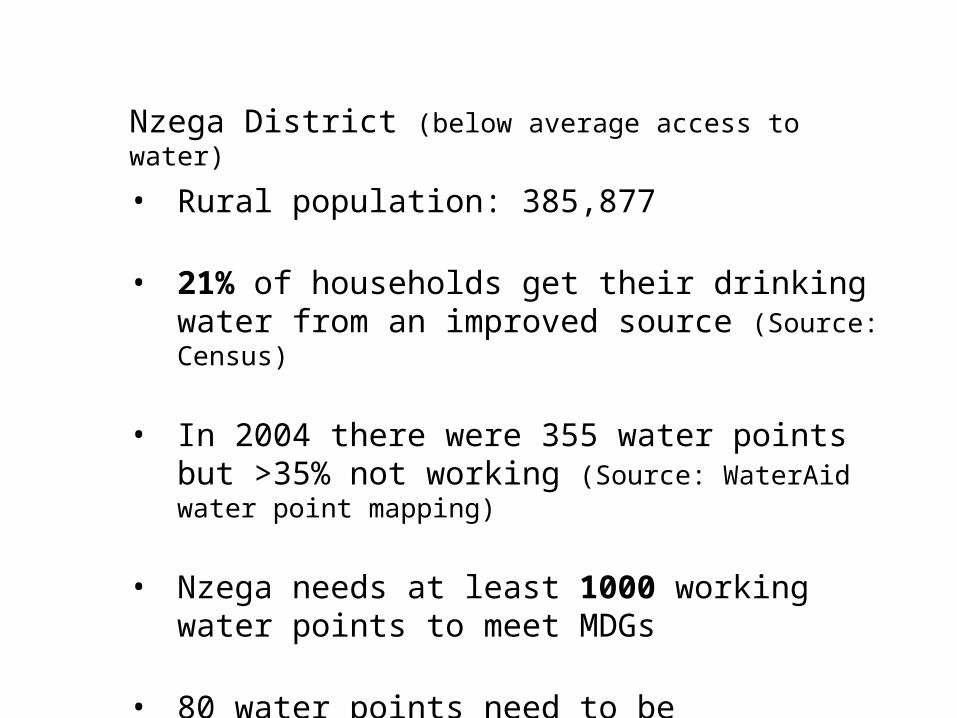
• Rural population: 385,877
• 21% of households get their drinking water from an improved source (Source: Census)
• In 2004 there were 355 water points but >35% not working (Source: WaterAid water point mapping)
• Nzega needs at least 1000 working water points to meet MDGs
• 80 water points need to be built/rehabilitated per year
Nzega District (below average access to water)

Wanaochangia secta ya maji Nzega
0 20 40 60 80 100 120 140
Anglican Church
CARITAS
JICA
TRIDEP - NDC - Community
FUM/Fumu/FURM
SEVEDERA
Community
IFAD - Community
Resolute
Unknown
NDC
WaterAid
Worldvision
Government
Vituo vilivyojengwa
Functional
Not Functional
Stolen
Under construction
All water points ever built in Nzega by funder
Water points
Nzega District Council
19 built since 2000

AINA YA KITUO CHA MAJI FunctionalNot
Functional% Not
working
Hand pump 125 40 24%Communal standpipe 41 45 52%
Functionality by type of water point
Type of water point

• Rural population: 232,909
• 62% of households get their drinking water from an improved source (Source: Census)
• In 2004 there are 357 water points but >25% of not working (Source: WaterAid water point mapping)
• To meet MDGs Mpwapwa needs at least 700 working water points
• 40 water points need to be built/rehabilitated per year
Mpwapwa District (above average)

0 10 20 30 40 50 60 70 80 90
WFP
Community
DANIDA
Mamlaka
Colonial
Water Department
Faith organisations
CMSR - Com
Worldvision
Private individuals (WB)
World Bank
Unknown
Government
WAMMA (WaterAid)
vituo vya maji
Functional
Not Functional
Stolen
Under construction
All water points ever built in Mpwapwa by funder
Water points
Mpwapwa District Council
9 built since 2000


• Strengthen situational analysis + performance monitoring (e.g. thro’ water point mapping)
• Integrate planning with Medium Term Plans and Expenditure Frameworks (e.g. thro’ PlanRep).
• Push for a system of monitoring to prevent ‘terminal’ breakdowns.
• Support LGA contracting process in order to build up local NGO and private sector capacity
Support needed at local government level

• Based on existing LGA set up (at best one qualified district water engineer and 5 - 10 technicians)
• Planning and expenditure managed by LGAs with support from Region
• Low cost technology ($ 20 per capita) sub-contracted to local private sector
• Long-term funding stream has generated capacity both in LGAs and of local private sector
• 200 water points built in Shinyanga Region each year by 7 district councils
Netherlands Rural Water Supply Programme

GoT vision for the rural water supply sub-sector is there
• Responsibility for planning and expenditure for rural water supply with local councils
• Prioritise investments in low-cost water supplies
• Private sector participation at local level
• Cost recovery for operation and maintenance
… and there are examples of good practice
• Netherlands project in Shinyanga
• WaterAid work in Singida

But if no money is getting to LGAs …
… because the core reforms are not delivering
• Public Financial Management, • Local Government, • Public Service.
What can be done in the meantime?

1. Special purpose grant for rural water supply to local councils
2. Sector investment coordination mechanism led by Government
Possible transition arrangements


Urban water supply central to development
• Urban population growing
• Tax base is in urban
Policy for urban water supply in place …
• Autonomous urban water and sewerage authorities
• Bankable investment projects paid back from internal business models
• Grant investment for low income areas
• Sector Wide Approach to investment
… albeit practice still messy
• Dar water reforms
• Subsidies still going to some urban utilities