development_sayantani
TRANSCRIPT

The Demographic DivideMDCs vs LDCs

04/18/2023 MDC vc LCD 2
• Public attention has begun to focus on the "demographic divide," the vast gulf in birth and death rates among the world's countries.
• The North-South Divide (or Rich-Poor Divide) is the socio-economic and political division that exists between the wealthy developed countries, known collectively as “the North,” and the poorer developing countries (least developed countries), or “the South.”
• On one side of this divide are mostly poor countries with relatively high birth rates and low life expectancies.
• The North mostly covers the West and the First World, along with much of the Second World. . Generally, definitions of theGlobal North include North America, Western Europe and developed parts of East Asia. The Global South is made up of Africa, Latin America, and developing Asia including the Middle East.
• What is worrisome about the demographic divide is not the differences among nations' population growth rates, but the disparities associated with these demographic trends—disparities in living standards, personal health, well-being, and future prospects.

04/18/2023 MDC vc LCD 3
In economic terms, the North—with one quarter of the world population—controls four fifths of the income earned anywhere in the world. 90% of the manufacturing industries are owned by and located in the North.[2] Inversely, the South—with three quarters of the world populations—has access to one fifth of the world income.
95% of the North has enough food and shelter.[1] Similarly, 95% of the North has a functioning education system. In the South, on the other hand, only 5% of the population has enough food and shelter. It “lacks appropriate technology, it has no political stability, the economies are disarticulated, and their foreign exchange earnings depend on primary product exports”.
04/18/2023 MDC vc LCD 4
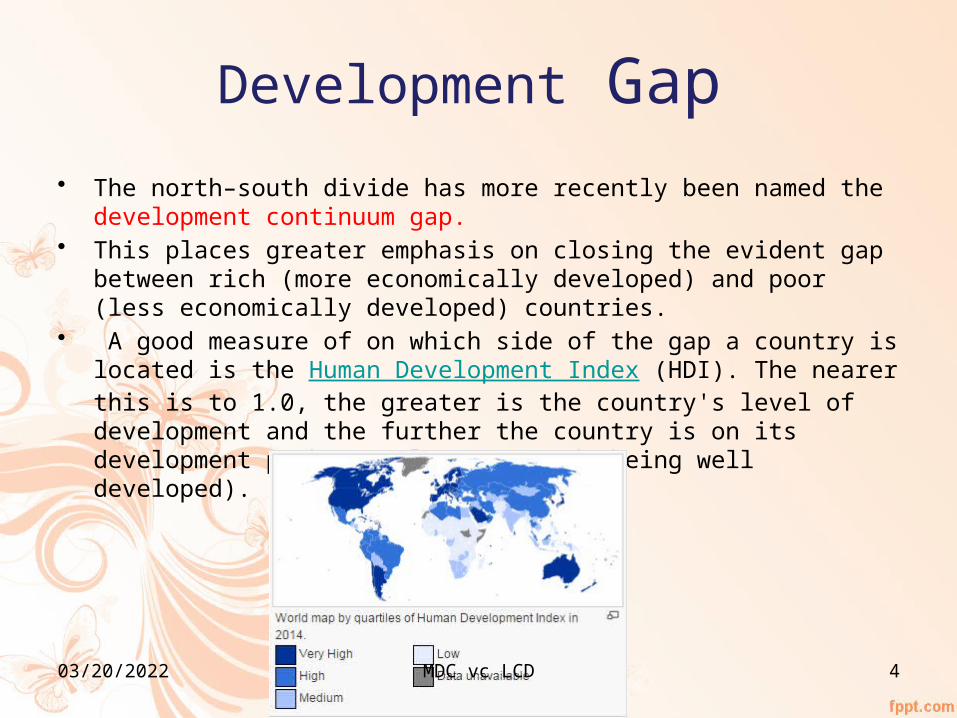
Development Gap• The north–south divide has more recently been named the development
continuum gap. • This places greater emphasis on closing the evident gap between rich
(more economically developed) and poor (less economically developed) countries.
• A good measure of on which side of the gap a country is located is the Human Development Index (HDI). The nearer this is to 1.0, the greater is the country's level of development and the further the country is on its development pathway (closer towards being well developed).

04/18/2023 MDC vc LCD 5
No Global Birth Dearth: The Reality of Different Population Growth Patterns
• As average population growth slowed globally over the last century growth rates have remained high in many countries such as Burkina Faso, Chad, and Iraq, while they have plummeted in others including Italy, South Korea, and Thailand.
• Many other countries are poised at the edge of these extremes—some (such as Germany and Hungary) are on the verge of population decline because of sinking fertility rates, while others (including Cambodia and Nicaragua) could rise into the higher extreme if health conditions improved and death rates fell. Immigration is the wild card: It can hasten or slow these trends.
• Despite media reports about population decline and a global "birth dearth," less than 15 percent of the world's population lives in countries that are projected to lose population between 2005 and 2050. Taken together, these countries account for just under 1 billion people. By 2050, these countries will account for less than 10 percent of global population.
• The media attention and concern arise because the countries slated for decline are among the wealthiest and most influential, including Japan, Germany, Italy, and Russia. Europe is the only continent projected to lose population (70 million) by 2050.

04/18/2023 MDC vc LCD 6

04/18/2023 MDC vc LCD 7
Africa Asia Asia excluding china Europe America Oceania
1136
4351
2987
741 97239
1637
4907
3507
7461106
48
2428
5252
3941
726
1217
60
population in millionspopulation 2014 popuation 2030 population 2050

04/18/2023 MDC vc LCD 8
04/18/2023 MDC vc LCD 9

04/18/2023 MDC vc LCD 10

04/18/2023 MDC vc LCD 11

04/18/2023 MDC vc LCD 12
Africa
Sub S
ahar
an A
frica
North
ern
Africa
Wes
tern
Afri
ca
Easte
rn A
frica
Midd
le Afri
ca
South
ern
Africa
Amer
ica
North
ern
Amer
ica
Latin
Am
erica
Centra
l Am
erica
Carrib
ean
Amer
ica
South
ern
Amer
ica Asia
Asia E
xclud
ing C
hina
Wes
tern
Asia
South
Cen
tral A
sia
Centra
l Asia
South
ern
Asia
South
Eas
tern
Asia
Easte
rn A
sia
Europ
e
Europ
e Unio
n
North
ern
Europ
e
Wes
tern
Eur
ope
Easte
rn E
urop
e
South
ern
Europ
e
Ocean
ia
6.7 6.76.5
6.7
7.1
6.4
5.7
4
2.3
5.3
6.6
4.74.9
5.4
5.9 5.8 5.7
5.1
5.8 5.7
4.9
2.3 2.4 2.3 2.2 2.1
2.6
3.4
4.7
5.1
3.4
5.4
4.9
6.1
2.42.1
1.8
2.22.4 2.3
2.1 2.22.5
2.9
2.52.7
2.5 2.4
1.5 1.6 1.51.8 1.7
1.51.3
2.4
TFR in 1970 & 2003 across the continents Series1 TFR 1970 TFR 2013

04/18/2023 MDC vc LCD 13
Africa
Sub S
ahar
an A
frica
North
ern
Africa
Wes
tern
Afri
ca
Easte
rn A
frica
Midd
le Afri
ca
South
ern
Africa
Amer
ica
North
ern
Amer
ica
Latin
Am
erica
Centra
l Am
erica
Carrib
ean
Amer
ica
South
ern
Amer
ica Asia
Asia E
xclud
ing C
hina
Wes
tern
Asia
South
Cen
tral A
sia
Centra
l Asia
South
ern
Asia
South
Eas
tern
Asia
Easte
rn A
sia
Europ
e
Europ
e Unio
n
North
ern
Europ
e
Wes
tern
Eur
ope
Easte
rn E
urop
e
South
ern
Europ
e
Ocean
ia0
10
20
30
40
50
60
70
80
90
LEB(IN YEARS) ACROSS THE CONTINENTS IN 1970 AND 2013
LEB(years)1970 both sex
LEB(years)2013 both sex
LEB(years)2013 Male
LEB(years)2013 Female

04/18/2023 MDC vc LCD 14
Africa
Sub S
ahar
an
North
ern
Wes
tern
Easte
rn
Midd
le
South
ern
Amer
ica
North
ern
Latin
Centra
l
Carrib
ean
South
ern
Asia
Exclud
ing C
hina
Wes
tern
South
Cen
tral
Centra
l
South
ern
South
Eas
tern
Easte
rn
Europ
e
Europ
e Unio
n
North
ern
Wes
tern
Easte
rn
South
ern
Oce
ania
36 37
28
3936
45
21
1612
1821
18 17 1821 22 22 24
2219
12 11 10 1210 12
9
18
10 117
129
1511
7 86 6 8
6 7 75 7 6
15
7 711 10 9 10
1310
7
Births and Deaths per 1000 population in the year 2014
BIRHTS DEATH

04/18/2023 MDC vc LCD 15
Natural Increase of diff parts of 5 continents

04/18/2023 MDC vc LCD 16
Africa
Sub S
ahar
an A
frica
North
ern
Africa
Wes
tern
Afri
ca
Easte
rn A
frica
Midd
le Afri
ca
South
ern
Africa
Amer
ica
North
ern
Amer
ica
Latin
Am
erica
Centra
l Am
erica
Carrib
ean
Amer
ica
South
ern
Amer
ica Asia
Asia E
xclud
ing C
hina
Wes
tern
Asia
South
Cen
tral A
sia
Centra
l Asia
South
ern
Asia
South
Eas
tern
Asia
Easte
rn A
sia
Europ
e
Europ
e Unio
n
North
ern
Europ
e
Wes
tern
Eur
ope
Easte
rn E
urop
e
South
ern
Europ
e
Ocean
ia0
20
40
60
80
100
120
140
160
IMR 1970 and 2013 across the continents
Series1
IMR 1970
IMR 2013

04/18/2023 MDC vc LCD 17

04/18/2023 MDC vc LCD 18
Percent urban across the continents in 2013

04/18/2023 MDC vc LCD 19
Africa
Sub S
ahar
an A
frica
North
ern
Africa
Wes
tern
Afri
ca
Easte
rn A
frica
Midd
le Afri
ca
South
ern
Africa
Amer
ica
North
ern
Amer
ica
Latin
Am
erica
Centra
l Am
erica
Carrib
ean
Amer
ica
South
ern
Amer
ica Asia
Asia E
xclud
ing C
hina
Wes
tern
Asia
South
Cen
tral A
sia
Centra
l Asia
South
ern
Asia
South
Eas
tern
Asia
Easte
rn A
sia
Europ
e
Europ
e Unio
n
North
ern
Europ
e
Wes
tern
Eur
ope
Easte
rn E
urop
e
South
ern
Europ
e
Ocean
ia
34
29
53
17
39
18
59
7477
7371
61
75
66
5754 54 53 54
62
82
7072
80
7167 66
62
28
23
47
11
31
8
59
6769
6764
59
68
60
48
37
4649
46
55
81
5761
78
68
5048
58
Comparison of married women(15-49) using methods of contraception in 2013 across the continents
Percent of married women(15-49)using all methods of contraception Percent of married women(15-49)using modern methods of contraception

04/18/2023 MDC vc LCD 20
Africa
Sub S
ahar
an A
frica
North
ern
Africa
Wes
tern
Afri
ca
Easte
rn A
frica
Midd
le Afri
ca
South
ern
Africa
Amer
ica
North
ern
Amer
ica
Latin
Am
erica
Centra
l Am
erica
Carrib
ean
Amer
ica
South
ern
Amer
ica Asia
Asia E
xclud
ing C
hina
Wes
tern
Asia
South
Cen
tral A
sia
Centra
l Asia
South
ern
Asia
South
Eas
tern
Asia
Easte
rn A
sia
Europ
e
Europ
e Unio
n
North
ern
Europ
e
Wes
tern
Eur
ope
Easte
rn E
urop
e
South
ern
Europ
e
Ocean
ia0
10000
20000
30000
40000
50000
60000
GNI PPP per capita US $ 2013
Series1 GNI PPP per capita us$ 2013

Case Study of the Demographic Divide: Japan Versus Nigeria
Japan has the world's second-largest economy and enjoys a high per capita income (PPP)—US$30,040 in 2003. Japanese people are highly educated: Most finish secondary school and at least one-third go on to college or
university.
They have the world's longest life expectancy—82 years—TFR around 1.3 which means that the country has one of the most rapidly aging populations in the world. Its TFR was above 4.0 in the 1940s, but fell below 3.0 by 1952 and
below 1.5 by 1995. Life expectancy in Japan rose from about 64 years in the 1950s to an unheard-of 80 years by the late 1990s.
The mean age at first marriage for women in Japan rose from 23.0 in 1950 to 27.8 in 2004. Women there have their first child at age 28.9 on average.
While Nigeria's fertility and mortality rates have also declined since 1950, Nigeria remains a high-fertility, high-mortality country: TFR is aroud 5.9 children on average and LEB around 44 years.
In 2005, Nigeria 's 132 million people made it the most populous country in Africa.
While it is a petroleum-exporting country, Nigeria's per capita income is about US$930,
Some 91 percent of Nigerians live on less than US$2 per day.
Only about one-half of Nigerian women are literate. About 5 percent of Nigerians completed education above high school. Nigerian women marry and have children at young ages—on average before age 20.

04/18/2023 MDC vc LCD 22
Thank you!!
Sayantani ChatterjeeRoll No 10