dewan housing
TRANSCRIPT

‘Growing business at cheap valuation’
DEWAN HOUSING Bliss GVS Pharma ‘Buy,
Add On DIPS’

Shareholding Pattern (%) Particulars Dec’17 Sep'17 Jun'17
Promoters 60.2% 60.2% 60.2%
FPI 7.6% 11.7% 11.2%
DII 0.4% 0.5% 0.6%
Others 31.8% 27.7% 28.0%
Relative Capital Market Strength
Bliss GVS Pharma Ltd
1
March 15, 2018
Rating Matrix
CMP Rs184.85
Rating Buy , Add on DIPS
Holding Period 12 to 18 months
Current Level Investment
Upside Potential 25%-30%
52 week H/L Rs230/Rs.129.0
Face value 1
Sector Pharmaceuticals
Category Mid-Cap
F&O Stock NO
Source: Choice Research/ Annual reports; Financial data-Ace equity
• Bliss GVS Pharma Ltd. is an Indian pharmaceutical and company headquartered in Mumbai, India. Bliss GVS primarily develops, manufactures and markets products across various therapeutic categories including Anti-fungal, Contraceptive, Laxative, Anti-haemorrhoidal, Anti-spasmodic, Anti-malarial, Anti-biotic, Anti-microbial, Anti-inflammatory, Antipyretic, Analgesic and several others.
• Bliss Gvs pharma is among the world leaders in Suppositories and Pessaries dosage forms with one of the largest portfolios in this segment. It has three decades of experience in suppositories and pessaries. It is the only EU-GMP certified suppositories and pessaries manufacturer in India. Suppository is a solid dosage form that is inserted into the rectum (rectal suppository), vagina (vaginal suppository) or urethra (urethral suppository), where it dissolves or melts and exerts local or systemic effects. Suppositories are used to deliver both systemically and locally acting medications.
• A Pessary is a medical device inserted into the vagina, either to provide structural support, or as a method of delivering medication. The other products include are Dry Powder for Oral Suspension, Liquid Preparastions, Oral Solids, Sachets, Parenterals, Topical Preparations along with other Healthcare product
Results of operations: • The Net Sales of the Company increased to Rs. 7997.4MN from Rs. 5468.9 Lakhs
in the previous year, at growth rate of 46.23%. Profit after tax was Rs. 1163.4mn as compared to Rs. 1001.4mn in the previous year. EBITDA was Rs. 1936mn as compared to Rs. 1557.2mn in the previous year growing by 24.4% YoY.
• The Company booked a profit of Rs. 139.3mn due to foreign exchange fluctuation and better Foreign Exchange management. During the year, the Company spent on R&D activities was about Rs. 37.7mn
• Net profit of Bliss GVS Pharma rose 20.6% to Rs 259.83mn in the quarter ended December 2017 as against Rs 215.41mn during the corresponding previous quarter ended December 2016.
• Sales de grew by 15.2% to Rs 1944.5mn in the quarter ended December 2017 as against Rs 2292.97mn during the previous quarter ended December 2016.
• EBITDA grew by 7.5% to Rs 259.8mn in the quarter ended December 2017 as against Rs 215.4mn during the previous quarter ending in December 2016.
• Bliss GVS board is considering disinvesting subsidiary by pulling out plug on the provision of medical care in Kenya, citing over-reliance on tenders, meanwhile focus on expanding its pharmaceutical business in the country. his decision has been made essentially to lower dependence on tender-driven managed healthcare business to focus on growing pharmaceutical business.
Outlook: The Company has established brand operations in existing markets that provide an ideal platform to extend the Bliss GVS product portfolio and with that, build new revenue streams. On the back of significant expansion across both Pharmaceutical & Healthcare verticals, the Company could be poised for an accelerated growth Valuation: At CMP of Rs. 184.8 ,Bliss GVS Ltd. is trading at a P/E multiple of 12.8(x) compared to the industry peer of 25.2(x). The company has an upside potential of 25% to 30% in the next 12 to 18 months. We arrive at a target price in range of Rs231 to Rs.240. Thus we assign a “BUY on DIPS” rating on the stock. :
Particulars FY15 FY16 FY17
OI 4,071.34 5,468.94 7,997.41
Growth Rate (%) 18.1% 34.3% 46.2%
EBITDA 1,034.39 1,557.20 1,936.42
EBITDA Margin (%) 25.4% 28.5% 24.2%
PAT 613.93 1,001.46 1,163.38
NPM (%) 15.1% 18.3% 14.5%
P/E 22.21 15.86 16.4
EPS 5.8 8.0 11.3
EV/EBITDA 11.58 7.56 10.4
P/BV 4.0 3.2 3.5
Particulars Q3FY18 Q3FY17 YoY(%)
Revenue from Operations
1944.49 2292.97 -15.2%
EBITDA (excl OI) 480.61 446.88 7.5%
EBITDA Margin (%) 24.7% 19.5% NA
PAT 259.83 215.41 20.6%
PAT Margin (%) 13.4% 9.4% NA
0.9
1
1.1
1.2
1.3
1.4
1.5
14-
Mar
-17
14-
Ap
r-17
14-
May
-17
14-
Jun
-17
14-
Jul-
17
14-
Au
g-17
14-
Sep
-17
14-
Oct
-17
14-
No
v-17
14
-De
c-1
7
14-
Jan
-18
14-
Feb
-18
Bliss GVS Pharma Ltd. Sensex
3,9
66
.25
3,4
46
.42
4,0
71
.34
5,4
68
.94
7,9
97
.41
28.0%
20.7%
25.4%
28.5%
24.2%
0.0%
5.0%
10.0%
15.0%
20.0%
25.0%
30.0%
0.00
1,000.00
2,000.00
3,000.00
4,000.00
5,000.00
6,000.00
7,000.00
8,000.00
9,000.00
FY13 FY14 FY15 FY16 FY17
Revenue from Operations
EBITDA Margin (%)

2 Source: Choice Research/ Annual reports; Financial data-Ace equity
Particulars FY13 FY14 FY15 FY16 FY17 CAGR
(FY13-FY17)
Revenue from Operations 3,966.25 3,446.42 4,071.34 5,468.94 7,997.41 19.2%
Growth Rate (%) 48.5% -13.1% 18.1% 34.3% 46.2%
EBITDA (excl Other Income) 1,111.56 712.2 1,034.39 1,557.20 1,936.42 14.9%
EBITDA Margin (%) 28.0% 20.7% 25.4% 28.5% 24.2%
PAT 595.85 410.32 613.93 1,001.46 1,163.38 18.2%
NPM (%) 15.0% 11.9% 15.1% 18.3% 14.5%
Net Worth 2,580.06 2,868.81 3,370.83 4,126.22 4,832.26
Total Assets 5,709.11 7,003.54 6,621.68 8,742.32 10,992.36
Debt 1,474.98 1,725.68 1,595.47 1,315.09 1,993.21
Cash Flow from Operations 65.04 411.52 376.12 1,129.47 2,878.56
Current Ratio(x) 1.7 1.5 1.7 1.5 1.3
D/E(x) 0.6 0.6 0.5 0.3 0.4
Profitability ratios (%)
ROCE (%) 28.5% 15.4% 22.0% 28.8% 28.7%
RoE (%) 23.1% 14.3% 18.2% 24.3% 24.1%
ROA (%) 10.4% 5.9% 9.3% 11.5% 10.6%
Efficiency ratios (x)
Receivable days 171.03 241.81 206.07 182.13 119.88
Inventory Days 20.71 34.22 29.51 24.04 19.99
Payable days 105.12 148.76 108.77 95.25 66.51
Financial Analysis
Peer Comparison
Quarter Results (Q3FY18):
Particulars (Rs. MN.) Q3FY18 Q2FY18 QoQ(%) Q3FY17 YoY(%)
Revenue from Operations 1944.49 2244.39 -13.4% 2292.97 -15.2%
EBITDA (excl OI) 480.61 474.6 1.3% 446.88 7.5%
PAT 259.83 394.98 -34.2% 215.41 20.6%
Companies (Rs. Mn.) CMP RoE
(TTM) 12M R (%) M. Cap
EPS (TTM)
BVPS EBIDTA
Margin (%) NPM (%)
M.Cap/ Debt
Bliss GVS Pharma Ltd. 184.85 27.5% 23.56 19,067.3 14.4 52.5 25.2% 16.5% 7.6 Hikal Ltd. 215.2 12.6% 9.12 17,689.4 9.6 76.4 18.8% 6.6% 3.2 Morepen Laboratories Ltd. 32.8 8.2% 61.39 14,753.3 0.7 8.1 11.0% 5.5% 1127.9 Nectar Lifesciences Ltd. 30.1 5.5% -15.8 6,739.0 2.5 46.2 11.9% 3.0% 0.9 Strides Shasun Ltd. 717.9 6.3% -39.9 64,153.5 19.1 304.1 14.3% 4.9% 1.9 Suven Life Sciences Ltd. 180.3 17.2% 5.28 22,942.2 10.7 62.3 32.8% 23.5% 41.6 Average 226.8 0.1 7.3 24,224.1 9.5 91.6 0.2 0.1 197.2
Companies (Rs. Mn.) P/E (x)
P/Bv (x)
P/Sales (x)
EV/EBIDTA (x)
D/E PAT
(TTM) EBIDTA (TTM)
Sales (TTM)
EV/ Sales
Bliss GVS Pharma Ltd. 12.8 3.5 2.1 8.9 0.5 1,487.6 2,266.4 9,000.9 2.2 Hikal Ltd. 22.3 2.8 1.5 10.2 0.9 793.2 2,273.0 12,094.7 1.9 Morepen Laboratories Ltd. 49.6 4.1 2.7 24.6 0.0 297.4 598.0 5,455.6 2.7 Nectar Lifesciences Ltd. 11.9 0.7 0.4 6.5 0.8 568.4 2,223.9 18,656.2 0.8 Strides Shasun Ltd. 37.7 2.4 1.8 19.0 1.2 1,703.5 4,982.8 34,748.2 2.7 Suven Life Sciences Ltd. 16.9 2.9 4.0 12.3 0.1 1,359.9 1,898.4 5,792.8 4.0 Average 25.2 2.7 2.1 13.6 0.6 1,035.0 2,373.7 14,291.4 2.4
2 Source: Choice Research/ Annual reports; Financial data-Ace equity
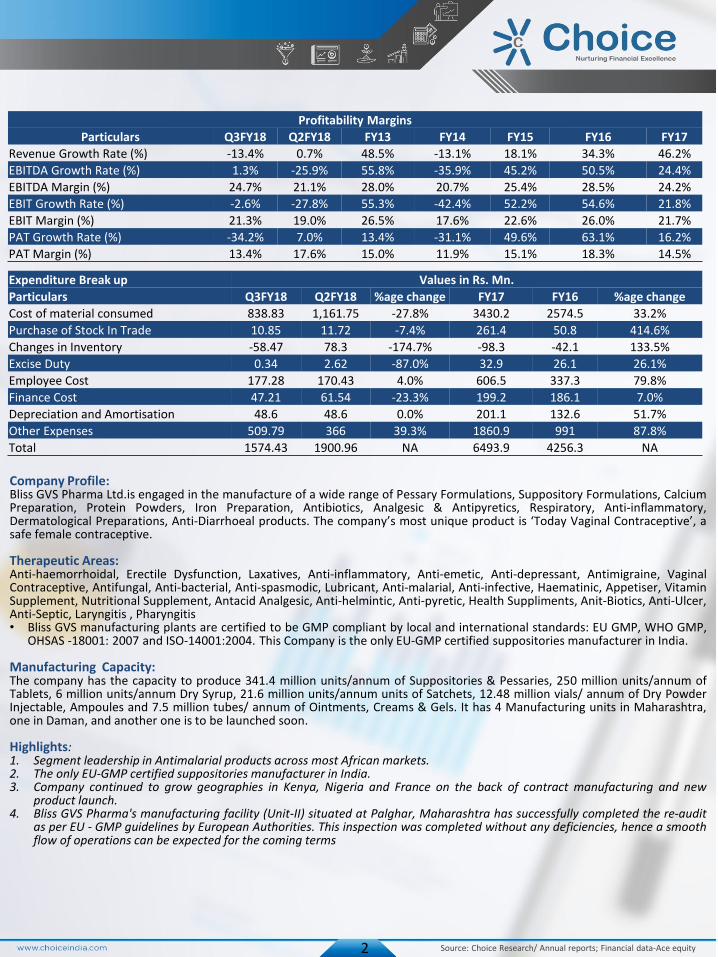
Company Profile: Bliss GVS Pharma Ltd.is engaged in the manufacture of a wide range of Pessary Formulations, Suppository Formulations, Calcium Preparation, Protein Powders, Iron Preparation, Antibiotics, Analgesic & Antipyretics, Respiratory, Anti-inflammatory, Dermatological Preparations, Anti-Diarrhoeal products. The company’s most unique product is ‘Today Vaginal Contraceptive’, a safe female contraceptive. Therapeutic Areas: Anti-haemorrhoidal, Erectile Dysfunction, Laxatives, Anti-inflammatory, Anti-emetic, Anti-depressant, Antimigraine, Vaginal Contraceptive, Antifungal, Anti-bacterial, Anti-spasmodic, Lubricant, Anti-malarial, Anti-infective, Haematinic, Appetiser, Vitamin Supplement, Nutritional Supplement, Antacid Analgesic, Anti-helmintic, Anti-pyretic, Health Suppliments, Anit-Biotics, Anti-Ulcer, Anti-Septic, Laryngitis , Pharyngitis • Bliss GVS manufacturing plants are certified to be GMP compliant by local and international standards: EU GMP, WHO GMP,
OHSAS -18001: 2007 and ISO-14001:2004. This Company is the only EU-GMP certified suppositories manufacturer in India. Manufacturing Capacity: The company has the capacity to produce 341.4 million units/annum of Suppositories & Pessaries, 250 million units/annum of Tablets, 6 million units/annum Dry Syrup, 21.6 million units/annum units of Satchets, 12.48 million vials/ annum of Dry Powder Injectable, Ampoules and 7.5 million tubes/ annum of Ointments, Creams & Gels. It has 4 Manufacturing units in Maharashtra, one in Daman, and another one is to be launched soon. Highlights: 1. Segment leadership in Antimalarial products across most African markets. 2. The only EU-GMP certified suppositories manufacturer in India. 3. Company continued to grow geographies in Kenya, Nigeria and France on the back of contract manufacturing and new
product launch. 4. Bliss GVS Pharma's manufacturing facility (Unit-II) situated at Palghar, Maharashtra has successfully completed the re-audit
as per EU - GMP guidelines by European Authorities. This inspection was completed without any deficiencies, hence a smooth flow of operations can be expected for the coming terms
Profitability Margins
Particulars Q3FY18 Q2FY18 FY13 FY14 FY15 FY16 FY17
Revenue Growth Rate (%) -13.4% 0.7% 48.5% -13.1% 18.1% 34.3% 46.2%
EBITDA Growth Rate (%) 1.3% -25.9% 55.8% -35.9% 45.2% 50.5% 24.4%
EBITDA Margin (%) 24.7% 21.1% 28.0% 20.7% 25.4% 28.5% 24.2%
EBIT Growth Rate (%) -2.6% -27.8% 55.3% -42.4% 52.2% 54.6% 21.8%
EBIT Margin (%) 21.3% 19.0% 26.5% 17.6% 22.6% 26.0% 21.7%
PAT Growth Rate (%) -34.2% 7.0% 13.4% -31.1% 49.6% 63.1% 16.2%
PAT Margin (%) 13.4% 17.6% 15.0% 11.9% 15.1% 18.3% 14.5%
Expenditure Break up Values in Rs. Mn.
Particulars Q3FY18 Q2FY18 %age change FY17 FY16 %age change
Cost of material consumed 838.83 1,161.75 -27.8% 3430.2 2574.5 33.2%
Purchase of Stock In Trade 10.85 11.72 -7.4% 261.4 50.8 414.6%
Changes in Inventory -58.47 78.3 -174.7% -98.3 -42.1 133.5%
Excise Duty 0.34 2.62 -87.0% 32.9 26.1 26.1%
Employee Cost 177.28 170.43 4.0% 606.5 337.3 79.8%
Finance Cost 47.21 61.54 -23.3% 199.2 186.1 7.0%
Depreciation and Amortisation 48.6 48.6 0.0% 201.1 132.6 51.7%
Other Expenses 509.79 366 39.3% 1860.9 991 87.8%
Total 1574.43 1900.96 NA 6493.9 4256.3 NA

Choice’s Rating Rationale The price target for a large cap stock represents the value the analyst expects the stock to reach over next 12 months. For a stock to be classified as Outperform, the expected return must exceed the local risk free return by at least 5% over the next 12 months. For a stock to be classified as Underperform, the stock return must be below the local risk free return by at least 5% over the next 12 months. Stocks between these bands are classified as Neutral. Don’t be an Investor by Force, Be an investor by CHOICE
• Create a Wealth Building Portfolio with the help of CHOICE Fundamental Research. • CHOICE Fundamental Research will handpick stocks for you to invest in an oversold market by helping you build positions in
heavily beaten down fundamentally strong stocks. • Opportunities to invest in fundamentally strong stocks at a low arise only 2-3 times in a full year cycle. • Investors are advised to sell the stock if the recommended upside potential achieves. • If recommended upside potential remains under-achieved, investors are advised to consider the update report on
suggested stock.
4
OUR TEAM Fundamental Research Team
Name Designation Email id Contact No.
Sunder Sanmukhani Head-Fundamental Research [email protected] 022 - 6707 9910
Satish Kumar Research Analyst [email protected] 022 - 6707 9913
Rajnath Yadav Research Analyst [email protected] 022 - 6707 9912
Aman Lamba Research Associate [email protected] 022 - 67079917
Rahul Agarwal Research Associate [email protected] 022 - 67079916
Shrey Gandhi Research Associate [email protected] 022 - 67079914
Dhruv Thakkar Research Associate [email protected] 022 - 67079915

Disclaimer
This is solely for information of clients of Choice Broking and does not construe to be an investment advice. It is also not intended as an offer or solicitation for the purchase and sale of any financial instruments. Any action taken by you on the basis of the information contained herein is your responsibility alone and Choice Broking its subsidiaries or its employees or associates will not be liable in any manner for the consequences of such action taken by you. We have exercised due diligence in checking the correctness and authenticity of the information contained in this recommendation, but Choice Broking or any of its subsidiaries or associates or employees shall not be in any way responsible for any loss or damage that may arise to any person from any inadvertent error in the information contained in this recommendation or any action taken on basis of this information. This report is based on the fundamental analysis with a view to forecast future price. The Research analysts for this report certifies that all of the views expressed in this report accurately reflect his or her personal views about the subject company or companies and its or their securities, and no part of his or her compensation was, is or will be, directly or indirectly related to specific recommendations or views expressed in this report. Choice Broking has based this document on information obtained from sources it believes to be reliable but which it has not independently verified; Choice Broking makes no guarantee, representation or warranty and accepts no responsibility or liability as to its accuracy or completeness. The opinions contained within the report are based upon publicly available information at the time of publication and are subject to change without notice. The information and any disclosures provided herein are in summary form and have been prepared for informational purposes. The recommendations and suggested price levels are intended purely for stock market investment purposes. The recommendations are valid for the day of the report and will remain valid till the target period. The information and any disclosures provided herein may be considered confidential. Any use, distribution, modification, copying, forwarding or disclosure by any person is strictly prohibited. The information and any disclosures provided herein do not constitute a solicitation or offer to purchase or sell any security or other financial product or instrument. The current performance may be unaudited. Past performance does not guarantee future returns. There can be no assurance that investments will achieve any targeted rates of return, and there is no guarantee against the loss of your entire investment.
POTENTIAL CONFLICT OF INTEREST DISCLOSURE (as on date of report) Disclosure of interest statement – • Analyst interest of the stock /Instrument(s): - No. • Firm interest of the stock / Instrument (s): - No.
Choice Equity Broking Pvt. Ltd. Choice House, Shree Shakambhari Corporate Park, Plt No: -156-158,
J.B. Nagar, Andheri (East), Mumbai - 400 099.
+91-022-6707 9999 +91-022-6707 9959 www.choicebroking.in
5