dg 3rd quater 2020 · mr. khalid mahmood chohan mr. raza mansha chief executive officer dr. arif...
TRANSCRIPT
20203rd Quarter Report,
March 31,
D.G. KHAN CEMENTCOMPANY LIMITED
(Un-audited)
Company Information 02
Contact Us 03
Directors’ Report 04
Condensed Interim Unconsolidated
Statement of Financial Position 12
Statement of Profit or Loss - Unaudited 14
Statement of Comprehensive Income - Unaudited 15
Statement of Changes In Equity - Unaudited 16
Statement of Cash Flows - Unaudited 17
Notes to and Forming Part of the Condensed Interim
Unconsolidated Financial Information - Unaudited 18
Condensed Interim Consolidated
Statement of Financial Position 28
Statement of Profit or Loss - Unaudited 30
Statement of Comprehensive Income - Unaudited 31
Statement of Changes In Equity - Unaudited 32
Statement of Cash Flows - Unaudited 33
Notes to and Forming Part of the Condensed Interim
Consolidated Financial Information - Unaudited 34
Contents
DG CementDGK Cement 3rd QUARTER 2020
PAGE 01
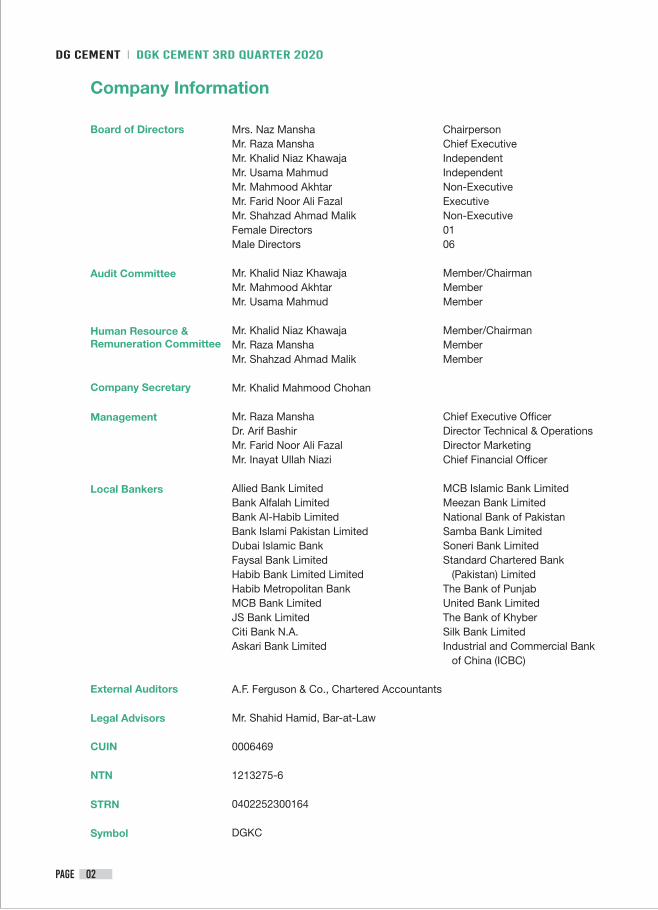
Company Information
Mrs. Naz Mansha ChairpersonMr. Raza Mansha Chief ExecutiveMr. Khalid Niaz Khawaja IndependentMr. Usama Mahmud IndependentMr. Mahmood Akhtar Non-ExecutiveMr. Farid Noor Ali Fazal ExecutiveMr. Shahzad Ahmad Malik Non-ExecutiveFemale Directors 01Male Directors 06
Mr. Khalid Niaz Khawaja Member/ChairmanMr. Mahmood Akhtar MemberMr. Usama Mahmud Member
Mr. Khalid Niaz Khawaja Member/ChairmanMr. Raza Mansha Member Mr. Shahzad Ahmad Malik Member
Mr. Khalid Mahmood Chohan
Mr. Raza Mansha Chief Executive OfficerDr. Arif Bashir Director Technical & OperationsMr. Farid Noor Ali Fazal Director MarketingMr. Inayat Ullah Niazi Chief Financial Officer
Allied Bank Limited MCB Islamic Bank Limited Bank Alfalah Limited Meezan Bank LimitedBank Al-Habib Limited National Bank of PakistanBank Islami Pakistan Limited Samba Bank LimitedDubai Islamic Bank Soneri Bank LimitedFaysal Bank Limited Standard Chartered BankHabib Bank Limited Limited (Pakistan) LimitedHabib Metropolitan Bank The Bank of PunjabMCB Bank Limited United Bank LimitedJS Bank Limited The Bank of KhyberCiti Bank N.A. Silk Bank LimitedAskari Bank Limited Industrial and Commercial Bank of China (ICBC) A.F. Ferguson & Co., Chartered Accountants
Mr. Shahid Hamid, Bar-at-Law
0006469
1213275-6
0402252300164
DGKC
Board of Directors
Audit Committee
Human Resource &Remuneration Committee
Company Secretary
Management
Local Bankers
External Auditors
Legal Advisors
CUIN
NTN
STRN
Symbol
DG Cement DGK Cement 3rd QUARTER 2020
PAGE 02
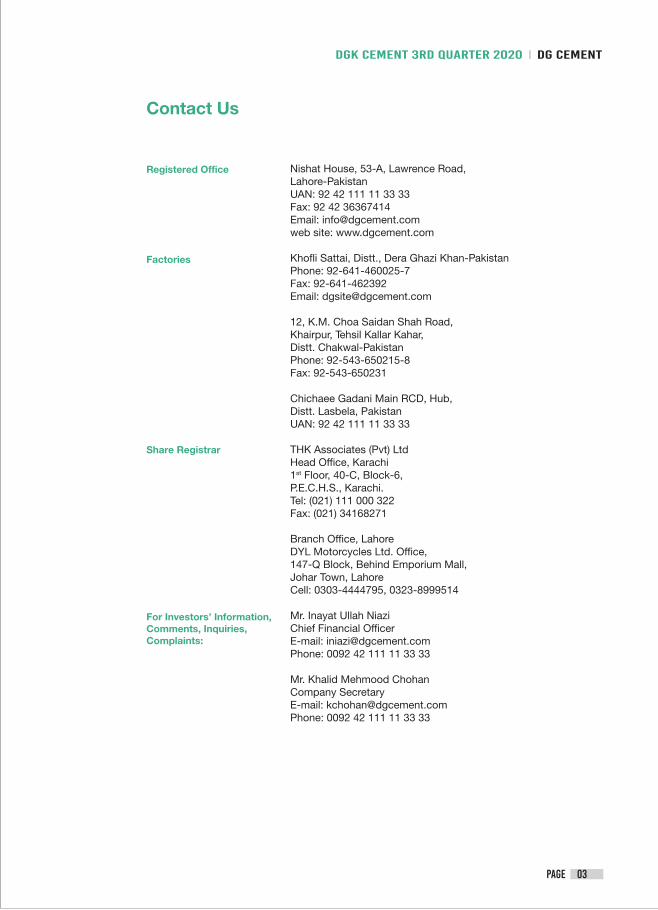
Nishat House, 53-A, Lawrence Road,Lahore-PakistanUAN: 92 42 111 11 33 33 Fax: 92 42 36367414Email: [email protected] site: www.dgcement.com
Khofli Sattai, Distt., Dera Ghazi Khan-PakistanPhone: 92-641-460025-7Fax: 92-641-462392Email: [email protected]
12, K.M. Choa Saidan Shah Road,Khairpur, Tehsil Kallar Kahar, Distt. Chakwal-PakistanPhone: 92-543-650215-8Fax: 92-543-650231
Chichaee Gadani Main RCD, Hub,Distt. Lasbela, PakistanUAN: 92 42 111 11 33 33
THK Associates (Pvt) LtdHead Office, Karachi1st Floor, 40-C, Block-6, P.E.C.H.S., Karachi.Tel: (021) 111 000 322Fax: (021) 34168271
Branch Office, LahoreDYL Motorcycles Ltd. Office,147-Q Block, Behind Emporium Mall, Johar Town, LahoreCell: 0303-4444795, 0323-8999514
Mr. Inayat Ullah Niazi Chief Financial OfficerE-mail: [email protected]: 0092 42 111 11 33 33
Mr. Khalid Mehmood Chohan Company SecretaryE-mail: [email protected]: 0092 42 111 11 33 33
Registered Office
Factories
Share Registrar
For Investors’ Information,Comments, Inquiries,Complaints:
Contact Us
DG CementDGK Cement 3rd QUARTER 2020
PAGE 03
DG Cement DGK Cement 3rd QUARTER 2020
PAGE 04
FY2 2020 is a bumpy ride for cement industry in particular and country in general. The year started with the ongoing stabilization program, tight fiscal and monetary measures, high inflation number, excessive taxation, drive for documentation of economy and slow export market. These factors contributed towards slowing down of construction sector. Capacity expansion in the industry since June 2019 also intensified price war to maintain market share. As the industry moves into the third quarter and country is slowly recovering from its tight fiscal consolidation measures after IMF periodic review, world was hit hard by pandemic flu of novel Covid-19, forcing almost all the countries (including Pakistan) to push for draconian measures to stop its spread particularly in second and third month of the quarter. This led to overall slow down of economy and even closure of any kind of activity relating to assembly of people.
Directors’ Report
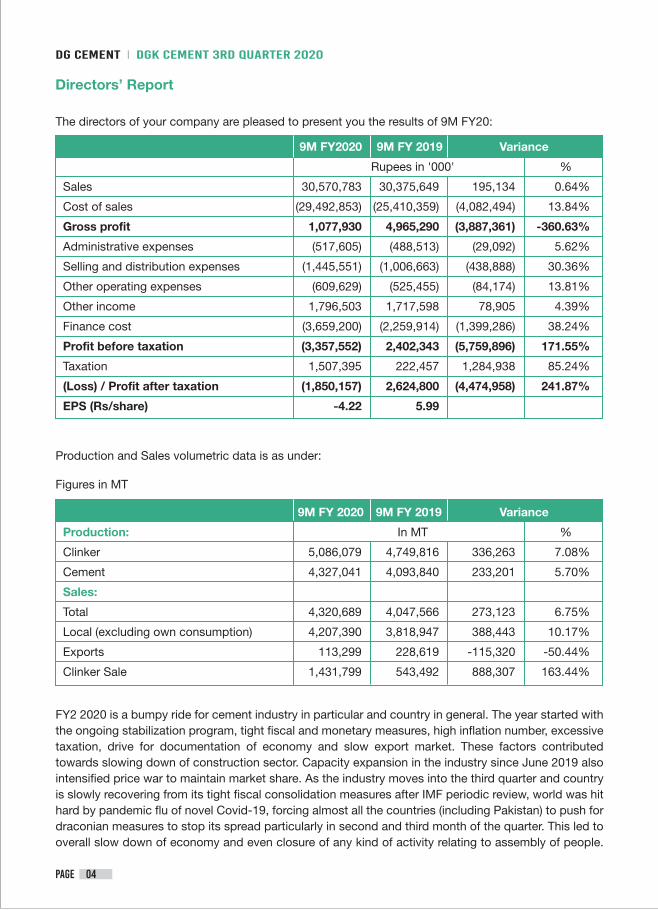
9M FY2020 9M FY 2019 Variance
Rupees in '000' %
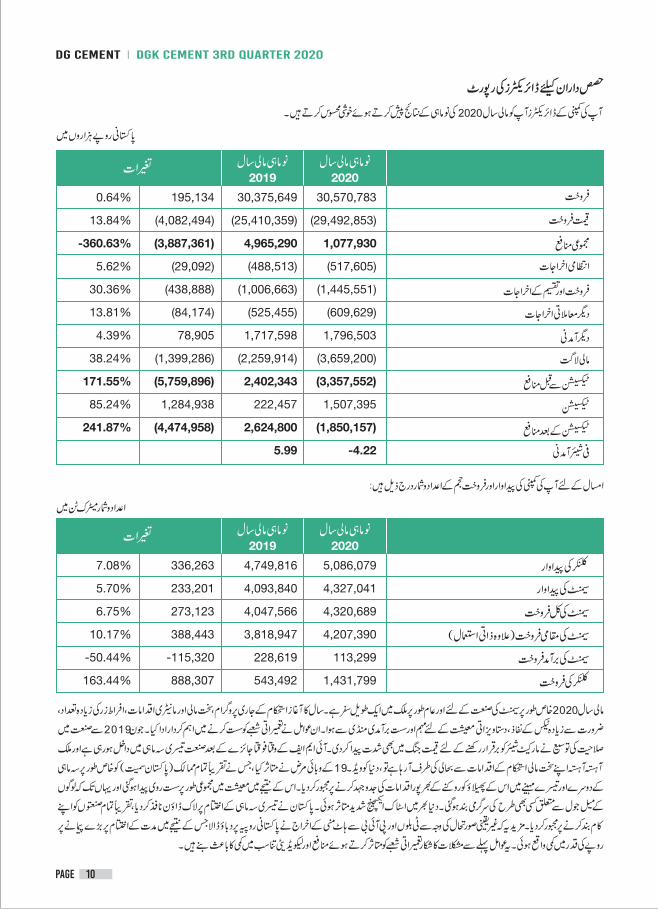
Sales 30,570,783 30,375,649 195,134 0.64%
Cost of sales (29,492,853) (25,410,359) (4,082,494) 13.84%
Gross profit 1,077,930 4,965,290 (3,887,361) -360.63%
Administrative expenses (517,605) (488,513) (29,092) 5.62%
Selling and distribution expenses (1,445,551) (1,006,663) (438,888) 30.36%
Other operating expenses (609,629) (525,455) (84,174) 13.81%
Other income 1,796,503 1,717,598 78,905 4.39%
Finance cost (3,659,200) (2,259,914) (1,399,286) 38.24%
Profit before taxation (3,357,552) 2,402,343 (5,759,896) 171.55%
Taxation 1,507,395 222,457 1,284,938 85.24%
(Loss) / Profit after taxation (1,850,157) 2,624,800 (4,474,958) 241.87%
EPS (Rs/share) -4.22 5.99
The directors of your company are pleased to present you the results of 9M FY20:
9M FY 2020 9M FY 2019 Variance
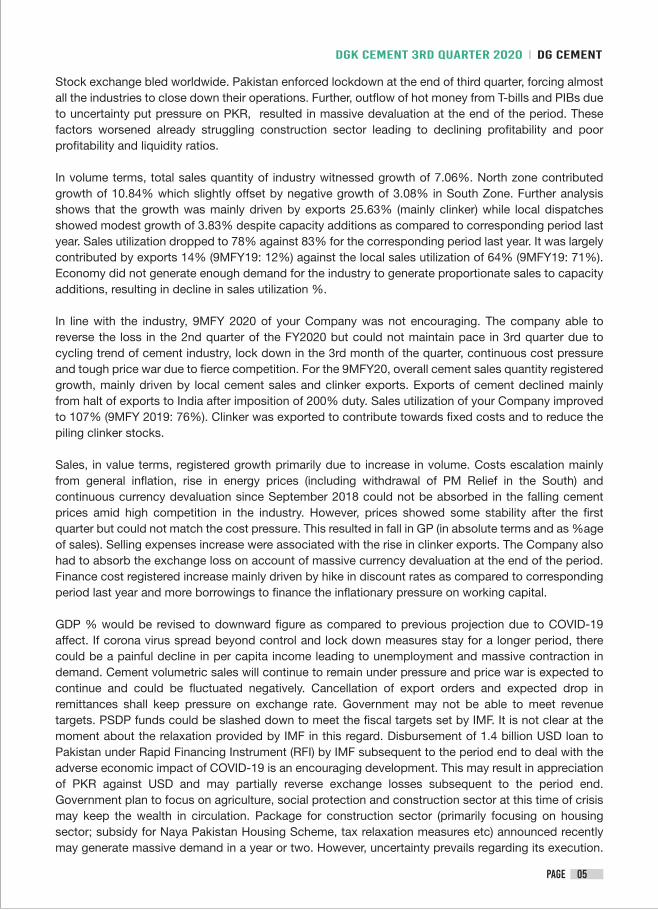
Production: In MT %
Clinker 5,086,079 4,749,816 336,263 7.08%
Cement 4,327,041 4,093,840 233,201 5.70%
Sales:
Total 4,320,689 4,047,566 273,123 6.75%
Local (excluding own consumption) 4,207,390 3,818,947 388,443 10.17%
Exports 113,299 228,619 -115,320 -50.44%
Clinker Sale 1,431,799 543,492 888,307 163.44%
Production and Sales volumetric data is as under:
Figures in MT
DG CementDGK Cement 3rd QUARTER 2020
PAGE 05
Stock exchange bled worldwide. Pakistan enforced lockdown at the end of third quarter, forcing almost all the industries to close down their operations. Further, outflow of hot money from T-bills and PIBs due to uncertainty put pressure on PKR, resulted in massive devaluation at the end of the period. These factors worsened already struggling construction sector leading to declining profitability and poor profitability and liquidity ratios.
In volume terms, total sales quantity of industry witnessed growth of 7.06%. North zone contributed growth of 10.84% which slightly offset by negative growth of 3.08% in South Zone. Further analysis shows that the growth was mainly driven by exports 25.63% (mainly clinker) while local dispatches showed modest growth of 3.83% despite capacity additions as compared to corresponding period last year. Sales utilization dropped to 78% against 83% for the corresponding period last year. It was largely contributed by exports 14% (9MFY19: 12%) against the local sales utilization of 64% (9MFY19: 71%). Economy did not generate enough demand for the industry to generate proportionate sales to capacity additions, resulting in decline in sales utilization %.
In line with the industry, 9MFY 2020 of your Company was not encouraging. The company able to reverse the loss in the 2nd quarter of the FY2020 but could not maintain pace in 3rd quarter due to cycling trend of cement industry, lock down in the 3rd month of the quarter, continuous cost pressure and tough price war due to fierce competition. For the 9MFY20, overall cement sales quantity registered growth, mainly driven by local cement sales and clinker exports. Exports of cement declined mainly from halt of exports to India after imposition of 200% duty. Sales utilization of your Company improved to 107% (9MFY 2019: 76%). Clinker was exported to contribute towards fixed costs and to reduce the piling clinker stocks.
Sales, in value terms, registered growth primarily due to increase in volume. Costs escalation mainly from general inflation, rise in energy prices (including withdrawal of PM Relief in the South) and continuous currency devaluation since September 2018 could not be absorbed in the falling cement prices amid high competition in the industry. However, prices showed some stability after the first quarter but could not match the cost pressure. This resulted in fall in GP (in absolute terms and as %age of sales). Selling expenses increase were associated with the rise in clinker exports. The Company also had to absorb the exchange loss on account of massive currency devaluation at the end of the period. Finance cost registered increase mainly driven by hike in discount rates as compared to corresponding period last year and more borrowings to finance the inflationary pressure on working capital.
GDP % would be revised to downward figure as compared to previous projection due to COVID-19 affect. If corona virus spread beyond control and lock down measures stay for a longer period, there could be a painful decline in per capita income leading to unemployment and massive contraction in demand. Cement volumetric sales will continue to remain under pressure and price war is expected to continue and could be fluctuated negatively. Cancellation of export orders and expected drop in remittances shall keep pressure on exchange rate. Government may not be able to meet revenue targets. PSDP funds could be slashed down to meet the fiscal targets set by IMF. It is not clear at the moment about the relaxation provided by IMF in this regard. Disbursement of 1.4 billion USD loan to Pakistan under Rapid Financing Instrument (RFI) by IMF subsequent to the period end to deal with the adverse economic impact of COVID-19 is an encouraging development. This may result in appreciation of PKR against USD and may partially reverse exchange losses subsequent to the period end. Government plan to focus on agriculture, social protection and construction sector at this time of crisis may keep the wealth in circulation. Package for construction sector (primarily focusing on housing sector; subsidy for Naya Pakistan Housing Scheme, tax relaxation measures etc) announced recently may generate massive demand in a year or two. However, uncertainty prevails regarding its execution.
Coal prices shall remain low and may ease pressure on cost. Oil prices hit rock bottom and is expected to remain on lower side in near future during the time of pandemic. This could provide some relief on monetary side. Discount rate was cut by 225 basis points at the end of the quarter. It was further slashed down by 200 points after period end and are expected to come down further. This may provide some breathing space for the industry. This coupled with deferral of principal repayment for a year may help in meeting current liabilities. Announcement of incentive scheme by SBP in the form of credit facility for payroll at reduced rate to the businesses that commit not to lay off workers for the next three months is an encouraging move to help companies in improving liquidity. The Company has applied to its banks to avail these benefits. Ground breaking of Special economic zones took place this year and Government commitment to the plan regarding its development even in the time of crisis is a positive sign. Flagship projects Diamer-Bhasha Dam and Mohmand Dam are yet to come into construction phase. These factors could offset the negative pressure of COVID-19 on industry.
Principal activity of the Company is manufacture and sale of cement and clinker and following are the principal risks the Company face:
• Tight price market and tough competition• Capacity utilization• Interest rate• Foreign currency fluctuations• Shrinking cement exports market
The Board of Directors has approved Directors’ Remuneration Policy. The main features of the policy are as follows:
• The Company shall not pay remuneration of its non-executive directors including independent directors except for meeting fee for attending Board and its Committee meetings.
• The Company will reimburse or incur expenses of travelling and accommodation of Directors in relation to attending of Board and its Committees meetings.
• The Directors’ Remuneration Policy will be reviewed and approved by the Board of Directors from time to time.
Following are the directors of the Company:Mrs. Naz Mansha (Chairperson) Non- ExecutiveMr. Raza Mansha ExecutiveMr. Khalid Niaz Khawaja IndependentMr. Usama Mahmud IndependentMr. Mahmood Akhtar Non-ExecutiveMr. Farid Noor Ali Fazal ExecutiveMr. Shahzad Ahmad Malik Non-Executive
Female Directors: 01Male Directors: 06
Audit CommitteeMr. Khalid Niaz Khawaja ChairmanMr. Usama Mahmud MemberMr. Mahmood Akhtar Member
DG Cement DGK Cement 3rd QUARTER 2020
PAGE 06
Human Resource & Remuneration CommitteeMr. Khalid Niaz Khawaja ChairmanMr. Raza Mansha MemberMr. Shahzad Ahmad Malik Member
There are no material post balance sheet events affecting the period end position.
Our plants and operations are complying with international and national environmental standards. DGKC is fully cognizant of its responsibility towards society and welfare. The Company is spending on education, health, medical and fire-fighting facilities, water supply to nearby localities, aiding in emergency and disaster situations in nearby areas, awareness campaigns etc.
There are no changes that have occurred during the period under review concerning the nature of the business of the company or of its subsidiaries, or any other company in which the company has interest.
The Directors of your company state that the system of internal control is sound in design and has been effectively implemented and monitored. Significant deviations from last period in operating results of the company are highlighted and reasoned in other parts of Directors report.
We thank all our stakeholders and admire efforts of our employees.
For and on behalf of the Board
Raza Mansha Farid Noor Ali FazalChief Executive Officer Director
LahoreApril 23, 2020
DG CementDGK Cement 3rd QUARTER 2020
PAGE 07
DG Cement DGK Cement 3rd QUARTER 2020
PAGE 08
DG CementDGK Cement 3rd QUARTER 2020
PAGE 09
DG Cement DGK Cement 3rd QUARTER 2020
PAGE 10
0.64% 195,134 30,375,649 30,570,783
13.84% (4,082,494) (25,410,359) (29,492,853)
-360.63% (3,887,361) 4,965,290 1,077,930
5.62% (29,092) (488,513) (517,605)
30.36% (438,888) (1,006,663) (1,445,551)
13.81% (84,174) (525,455) (609,629)
4.39% 78,905 1,717,598 1,796,503
38.24% (1,399,286) (2,259,914) (3,659,200)
171.55% (5,759,896) 2,402,343 (3,357,552)
85.24% 1,284,938 222,457 1,507,395
241.87% (4,474,958) 2,624,800 (1,850,157)
5.99 -4.22
20202019
7.08% 336,263 4,749,816 5,086,079
5.70% 233,201 4,093,840 4,327,041
6.75% 273,123 4,047,566 4,320,689
10.17% 388,443 3,818,947 4,207,390
-50.44% -115,320 228,619 113,299
163.44% 888,307 543,492 1,431,799
20202019
Interim UnconsolidatedFinancial
Statements
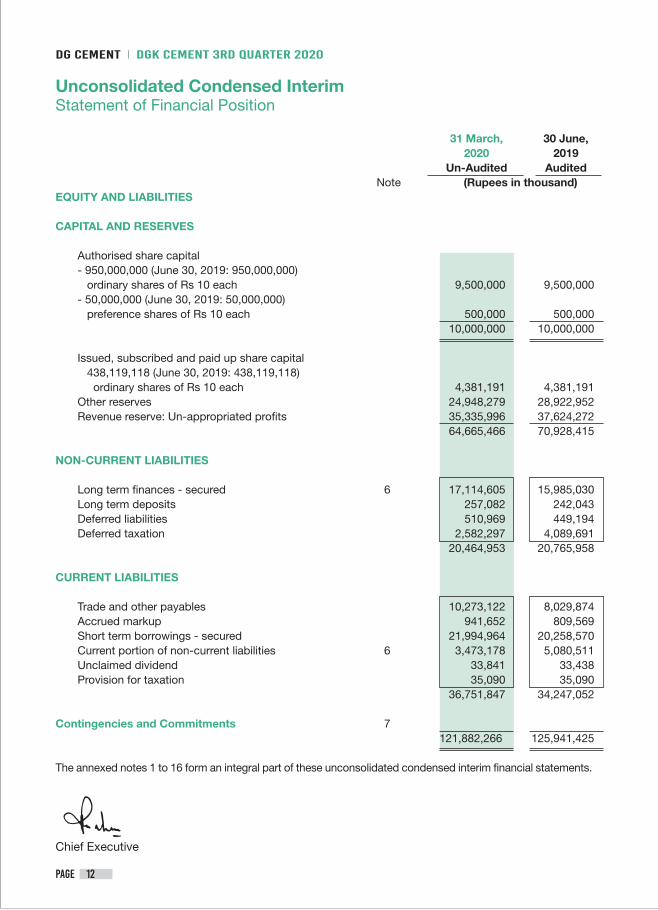
Unconsolidated Condensed InterimStatement of Financial Position
31 March, 30 June, 2020 2019 Un-Audited Audited Note (Rupees in thousand)EQUITY AND LIABILITIES
CAPITAL AND RESERVES
Authorised share capital - 950,000,000 (June 30, 2019: 950,000,000) ordinary shares of Rs 10 each 9,500,000 9,500,000 - 50,000,000 (June 30, 2019: 50,000,000) preference shares of Rs 10 each 500,000 500,000 10,000,000 10,000,000
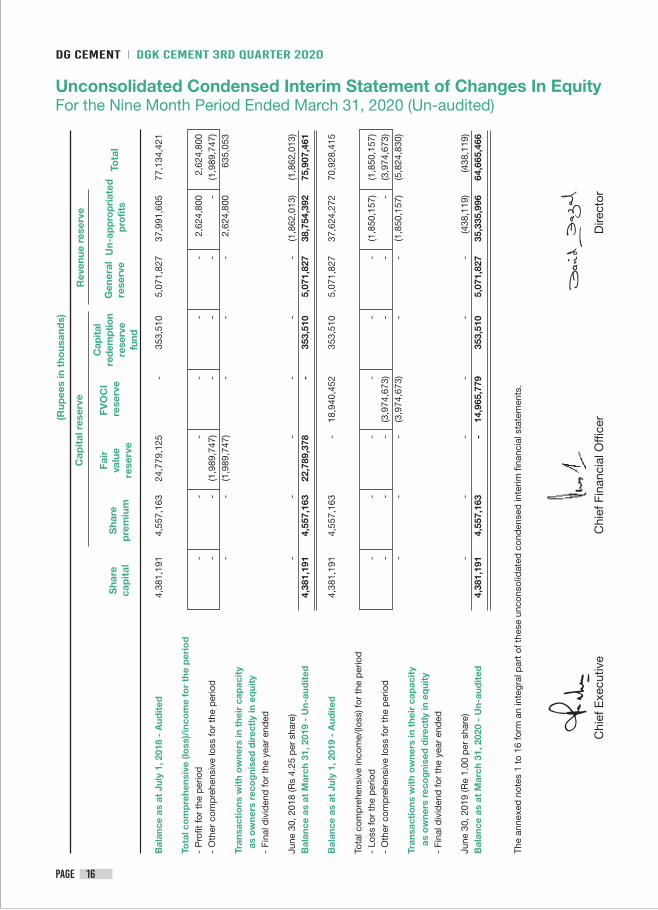
Issued, subscribed and paid up share capital 438,119,118 (June 30, 2019: 438,119,118) ordinary shares of Rs 10 each 4,381,191 4,381,191 Other reserves 24,948,279 28,922,952 Revenue reserve: Un-appropriated profits 35,335,996 37,624,272 64,665,466 70,928,415
NON-CURRENT LIABILITIES
Long term finances - secured 6 17,114,605 15,985,030 Long term deposits 257,082 242,043 Deferred liabilities 510,969 449,194 Deferred taxation 2,582,297 4,089,691 20,464,953 20,765,958
CURRENT LIABILITIES Trade and other payables 10,273,122 8,029,874 Accrued markup 941,652 809,569 Short term borrowings - secured 21,994,964 20,258,570 Current portion of non-current liabilities 6 3,473,178 5,080,511 Unclaimed dividend 33,841 33,438 Provision for taxation 35,090 35,090 36,751,847 34,247,052
Contingencies and Commitments 7 121,882,266 125,941,425
The annexed notes 1 to 16 form an integral part of these unconsolidated condensed interim financial statements.
Chief Executive
DG Cement DGK Cement 3rd QUARTER 2020
PAGE 12
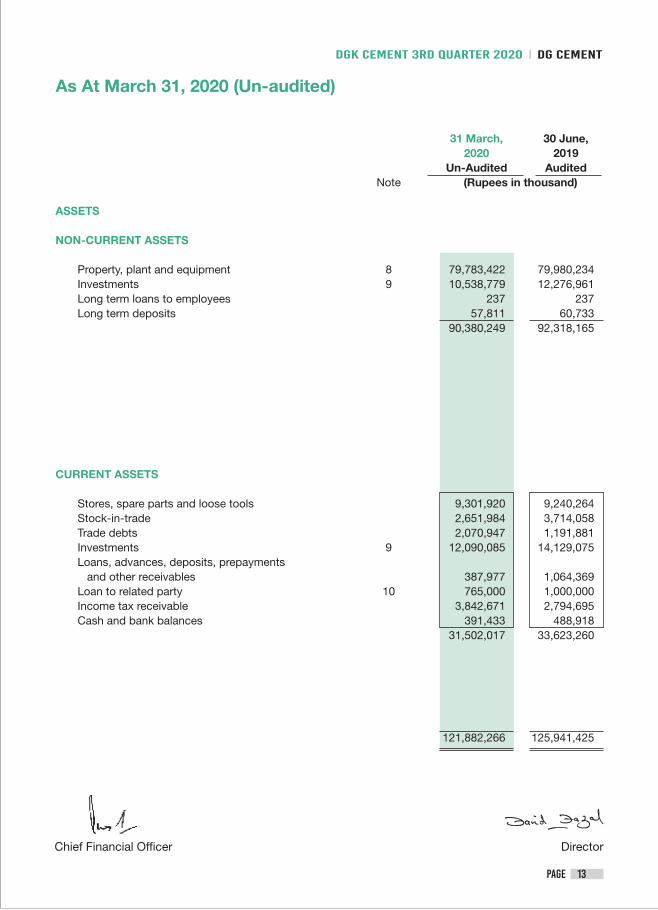
31 March, 30 June, 2020 2019 Un-Audited Audited Note (Rupees in thousand)
ASSETS
NON-CURRENT ASSETS
Property, plant and equipment 8 79,783,422 79,980,234 Investments 9 10,538,779 12,276,961 Long term loans to employees 237 237 Long term deposits 57,811 60,733 90,380,249 92,318,165
CURRENT ASSETS
Stores, spare parts and loose tools 9,301,920 9,240,264 Stock-in-trade 2,651,984 3,714,058 Trade debts 2,070,947 1,191,881 Investments 9 12,090,085 14,129,075 Loans, advances, deposits, prepayments and other receivables 387,977 1,064,369 Loan to related party 10 765,000 1,000,000 Income tax receivable 3,842,671 2,794,695 Cash and bank balances 391,433 488,918 31,502,017 33,623,260
121,882,266 125,941,425
As At March 31, 2020 (Un-audited)
DirectorChief Financial Officer
DG CementDGK Cement 3rd QUARTER 2020
PAGE 13
2020 2019
July to January to July to January to
March March March March
Note (Rupees in thousand) (Rupees in thousand)
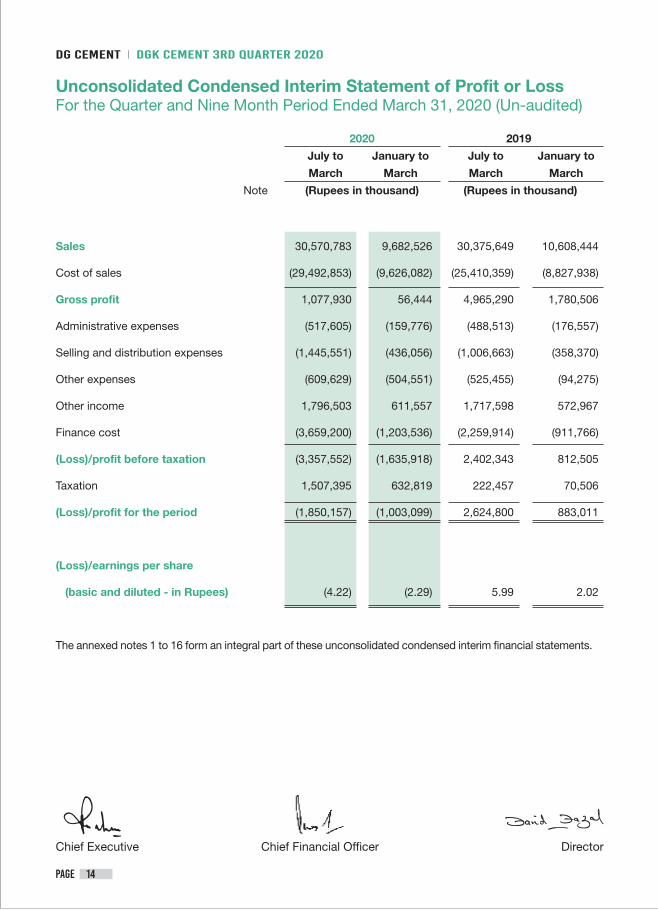
Sales 30,570,783 9,682,526 30,375,649 10,608,444
Cost of sales (29,492,853) (9,626,082) (25,410,359) (8,827,938)
Gross profit 1,077,930 56,444 4,965,290 1,780,506
Administrative expenses (517,605) (159,776) (488,513) (176,557)
Selling and distribution expenses (1,445,551) (436,056) (1,006,663) (358,370)
Other expenses (609,629) (504,551) (525,455) (94,275)
Other income 1,796,503 611,557 1,717,598 572,967
Finance cost (3,659,200) (1,203,536) (2,259,914) (911,766)
(Loss)/profit before taxation (3,357,552) (1,635,918) 2,402,343 812,505
Taxation 1,507,395 632,819 222,457 70,506
(Loss)/profit for the period (1,850,157) (1,003,099) 2,624,800 883,011
(Loss)/earnings per share
(basic and diluted - in Rupees) (4.22) (2.29) 5.99 2.02
The annexed notes 1 to 16 form an integral part of these unconsolidated condensed interim financial statements.
DirectorChief Executive Chief Financial Officer
Unconsolidated Condensed Interim Statement of Profit or LossFor the Quarter and Nine Month Period Ended March 31, 2020 (Un-audited)
DG Cement DGK Cement 3rd QUARTER 2020
PAGE 14
DirectorChief Executive Chief Financial Officer
2020 2019
July to January to July to January to
March March March March
(Rupees in thousand) (Rupees in thousand)
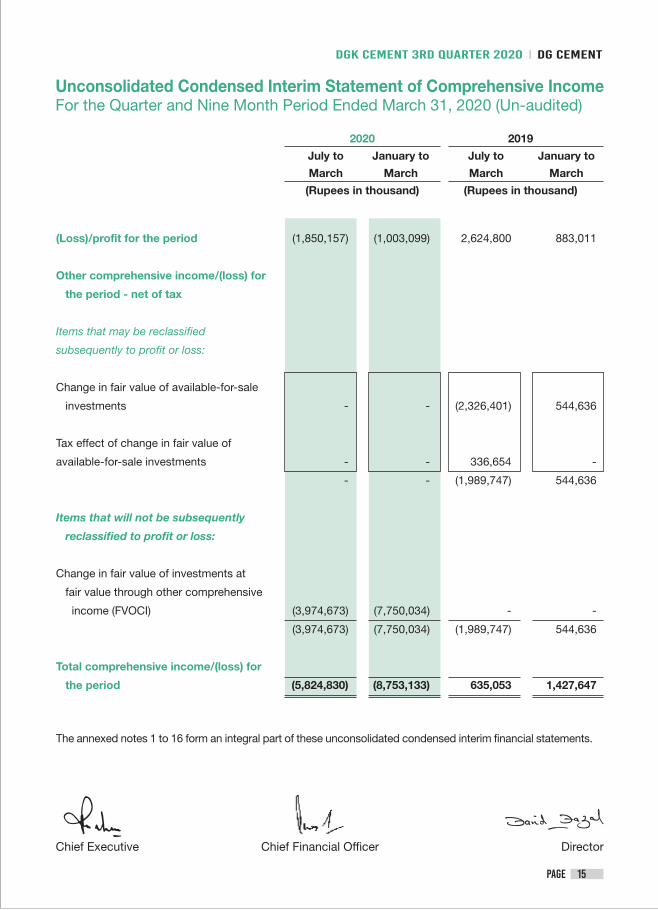
(Loss)/profit for the period (1,850,157) (1,003,099) 2,624,800 883,011
Other comprehensive income/(loss) for
the period - net of tax
Items that may be reclassified
subsequently to profit or loss:
Change in fair value of available-for-sale
investments - - (2,326,401) 544,636
Tax effect of change in fair value of
available-for-sale investments - - 336,654 -
- - (1,989,747) 544,636
Items that will not be subsequently
reclassified to profit or loss:
Change in fair value of investments at
fair value through other comprehensive
income (FVOCI) (3,974,673) (7,750,034) - -
(3,974,673) (7,750,034) (1,989,747) 544,636
Total comprehensive income/(loss) for
the period (5,824,830) (8,753,133) 635,053 1,427,647
The annexed notes 1 to 16 form an integral part of these unconsolidated condensed interim financial statements.
Unconsolidated Condensed Interim Statement of Comprehensive IncomeFor the Quarter and Nine Month Period Ended March 31, 2020 (Un-audited)
DG CementDGK Cement 3rd QUARTER 2020
PAGE 15
DG Cement DGK Cement 3rd QUARTER 2020
PAGE 16
Bal
ance
as
at J
uly
1, 2
018
- A
udit
ed
4,3
81,1
91
4,55
7,16
3 24
,779
,125
-
353,
510
5,07
1,82
7 37
,991
,605
77
,134
,421
Tota
l co
mp
rehe
nsiv
e (lo
ss)/
inco
me
for
the
per
iod
- P
rofit
for
the
per
iod
-
- -
- -
- 2,
624,
800
2,62
4,80
0-
Oth
er c
omp
rehe
nsiv
e lo
ss fo
r th
e p
erio
d
- -
(1,9
89,7
47)
- -
- -
(1,9
89,7
47)
- -
(1,9
89,7
47)
- -
- 2,
624,
800
635,
053
Tran
sact
ions
wit
h o
wne
rs in
the
ir c
apac
ity
as
ow
ners
rec
og
nise
d d
irec
tly
in e
qui
ty-
Fina
l div
iden
d fo
r th
e ye
ar e
nded
June
30,
201
8 (R
s 4.
25 p
er s
hare
) -
- -
- -
- (1
,862
,013
) (1
,862
,013
)B
alan
ce a
s at
Mar
ch 3
1, 2
019
- U
n-au
dit
ed
4,38
1,19
1 4,
557,
163
22,7
89,3
78
- 35
3,51
0 5,
071,
827
38,7
54,3
92
75,9
07,4
61
Bal
ance
as
at J
uly
1, 2
019
- A
udit
ed
4,3
81,1
91
4,55
7,16
3 -
18,9
40,4
52
353,
510
5,07
1,82
7 37
,624
,272
70
,928
,415
Tota
l com
pre
hens
ive
inco
me/
(loss
) for
the
per
iod
- Lo
ss fo
r th
e p
erio
d
- -
- -
- -
(1,8
50,1
57)
(1,8
50,1
57)
- O
ther
com
pre
hens
ive
loss
for
the
per
iod
-
- -
(3,9
74,6
73)
- -
- (3
,974
,673
)
-
- -
(3,9
74,6
73)
- -
(1,8
50,1
57)
(5,8
24,8
30)
Tran
sact
ions
wit
h o
wne
rs in
the
ir c
apac
ity
as
ow
ners
rec
og
nise
d d
irec
tly
in e
qui
ty-
Fina
l div
iden
d fo
r th
e ye
ar e
nded
June
30,
201
9 (R
e 1.
00 p
er s
hare
) -
- -
- -
- (4
38,1
19)
(438
,119
)B
alan
ce a
s at
Mar
ch 3
1, 2
020
- U
n-au
dit
ed
4,38
1,19
1 4,
557,
163
- 14
,965
,779
35
3,51
0 5,
071,
827
35,3
35,9
96
64,6
65,4
66
The
anne
xed
not
es 1
to
16 fo
rm a
n in
tegr
al p
art
of t
hese
unc
onso
lidat
ed c
ond
ense
d in
terim
fina
ncia
l sta
tem
ents
.
Dire
ctor
Chi
ef E
xecu
tive
Chi
ef F
inan
cial
Offi
cer
(Rup
ees
in t
hous
and
s)
Cap
ital
res
erve
Rev
enue
res
erve
Sha
reca
pit
alS
hare
pre
miu
m
Fair
valu
ere
serv
e
FVO
CI
res
erve
Cap
ital
rede
mpt
ion
rese
rve
fund
Gen
eral
rese
rve
Un-
appr
opri
ated
prof
itsTo
tal
Unconsolidated Condensed Interim Statement of Changes In Equity For the Nine Month Period Ended March 31, 2020 (Un-audited)
DG CementDGK Cement 3rd QUARTER 2020
PAGE 17
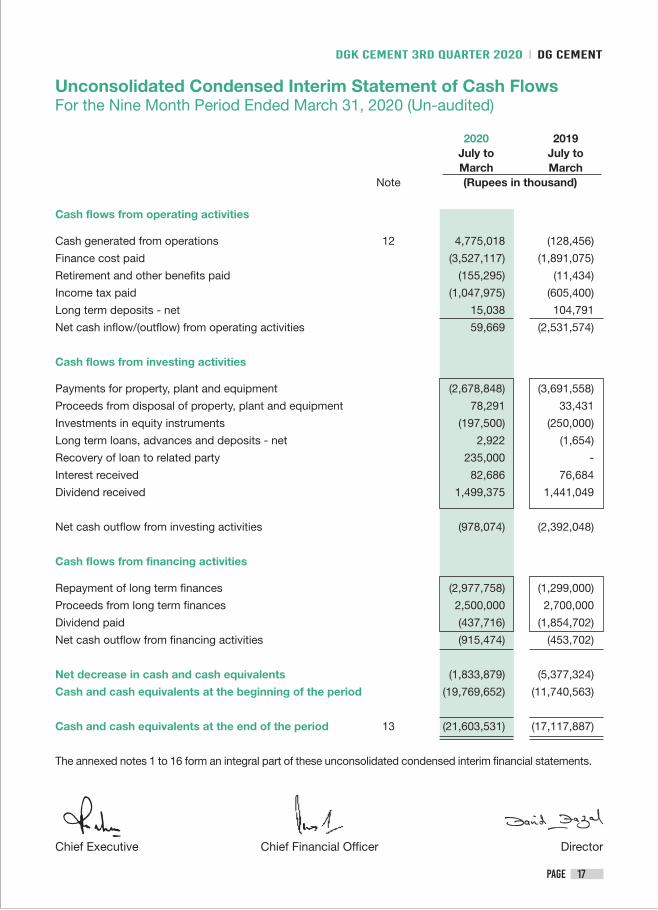
2020 2019 July to July to March March Note (Rupees in thousand)
Cash flows from operating activities
Cash generated from operations 12 4,775,018 (128,456)
Finance cost paid (3,527,117) (1,891,075)
Retirement and other benefits paid (155,295) (11,434)
Income tax paid (1,047,975) (605,400)
Long term deposits - net 15,038 104,791
Net cash inflow/(outflow) from operating activities 59,669 (2,531,574)
Cash flows from investing activities
Payments for property, plant and equipment (2,678,848) (3,691,558)
Proceeds from disposal of property, plant and equipment 78,291 33,431
Investments in equity instruments (197,500) (250,000)
Long term loans, advances and deposits - net 2,922 (1,654)
Recovery of loan to related party 235,000 -
Interest received 82,686 76,684
Dividend received 1,499,375 1,441,049
Net cash outflow from investing activities (978,074) (2,392,048)
Cash flows from financing activities
Repayment of long term finances (2,977,758) (1,299,000)
Proceeds from long term finances 2,500,000 2,700,000
Dividend paid (437,716) (1,854,702)
Net cash outflow from financing activities (915,474) (453,702)
Net decrease in cash and cash equivalents (1,833,879) (5,377,324)
Cash and cash equivalents at the beginning of the period (19,769,652) (11,740,563)
Cash and cash equivalents at the end of the period 13 (21,603,531) (17,117,887)
The annexed notes 1 to 16 form an integral part of these unconsolidated condensed interim financial statements.
DirectorChief Executive Chief Financial Officer
Unconsolidated Condensed Interim Statement of Cash Flows For the Nine Month Period Ended March 31, 2020 (Un-audited)
1. Status and nature of business
D. G. Khan Cement Company Limited (the 'Company') is a public company limited by shares incorporated in Pakistan in 1978 under the repealed Companies Act, 1913 (now the Companies Act, 2017). The Company's ordinary shares are listed on the Pakistan Stock Exchange Limited. The registered office of the Company is situated at 53-A, Lawrence Road, Lahore.
The Company is principally engaged in production and sale of Clinker, Ordinary Portland and Sulphate Resistant Cement. It has four cement plants, two plants located at Dera Ghazi Khan ('D.G. Khan'), one at Khairpur District, Chakwal ('Khairpur') and one at Hub District, Lasbela ('Hub').
2. Basis of preparation
2.1 Statement of compliance
These unconsolidated condensed interim financial statements have been prepared in accordance with the accounting and reporting standards as applicable in Pakistan for interim financial reporting. The accounting and reporting standards as applicable in Pakistan for interim financial reporting comprise of:
- International Accounting Standard ('lAS') 34, Interim Financial Reporting, issued by the International Accounting Standards Board ('IASB') as notified under the Companies Act, 2017; and
- Provisions of and directives issued under the Companies Act, 2017.
Where the provisions of and directives issued under the Companies Act, 2017 differ with the requirements of lAS 34, the provisions of and directives issued under the Companies Act, 2017 have been followed.
2.2 These unconsolidated condensed interim financial statements are un-audited and are being submitted to the members as required by section 237 of the Companies Act, 2017 (the 'Act').
These unconsolidated condensed interim financial statements do not include all of the information required for annual financial statements and should be read in conjunction with the annual financial statements as at and for the year ended June 30, 2019. Selected explanatory notes are included to explain events and transactions that are significant to and understanding of the changes in the Company’s financial position and performance since the last annual financial statements.
The Company is required to issue condensed interim consolidated financial statements along with its condensed interim separate financial statements in accordance with the requirements of accounting and reporting standards as applicable in Pakistan. Condensed interim consolidated financial statements are prepared separately.
3. Significant accounting policies
3.1 The accounting policies and the methods of computation adopted in the preparation of these unconsolidated condensed interim financial statements are the same as those applied in the preparation of preceding annual published financial statements of the Company for the year ended June 30, 2019 except for the adoption of new and amended standards as set out below:
Notes to and Forming Part of the Unconsolidated Condensed Interim Financial Statements (Un-audited)For the Nine Month Period Ended March 31, 2020 (Un-audited)
DG Cement DGK Cement 3rd QUARTER 2020
PAGE 18
3.2 Standards, amendments to published standards and interpretations that are effective in the current period
Certain standards, amendments and interpretations to International Financial Reporting Standards (IFRS) are effective for accounting periods beginning on July 1, 2019, but are considered not to be relevant or to have any significant effect on the Company’s operations (although they may affect the accounting for future transactions and events) and are, therefore, not detailed in these unconsolidated condensed interim financial statements.
3.3 Standards, amendments and interpretations to existing standards that are not yet effective and have not been early adopted by the Company
There are certain standards, amendments to the accounting standards and interpretations that are mandatory for the Company's accounting periods beginning on or after July 01, 2020 but are considered not to be relevant or to have any significant effect on the Company's operations and are, therefore, not detailed in these unconsolidated condensed interim financial statements.
4. Accounting estimates
The preparation of these unconsolidated condensed interim financial statements requires management to make judgments, estimates and assumptions that affect the application of accounting policies and the reported amounts of assets and liabilities, income and expenses. Actual results may differ from these estimates.
In preparing these unconsolidated condensed interim financial statements, the significant judgments made by management in applying accounting policies and key sources of estimation were the same as those that were applied to the annual financial statements of the Company for the year ended June 30, 2019, with the exception of change in estimate that is required in determining the provision for income taxes as referred to in note 5.
5. Taxation
Income tax expense is recognized in each interim period based on best estimate of the weighted average annual income tax rate expected for the full financial year. Amounts accrued for income tax expense in one interim period may have to be adjusted in a subsequent interim period of that financial year if the estimate of the annual income tax rate changes.
March 31, June 30, 2020 2019 Un-audited audited (Rupees in thousand)
6. Long term finances - secured
Long term loans - note 6.1 20,547,566 21,025,324 Current portion shown under current liabilities - note 6.2 (3,432,961) (5,040,294) 17,114,605 15,985,030
6.1 The reconciliation of the carrying amount is as follows:
Opening balance 21,025,324 20,040,471 Disbursements during the period/year 2,500,000 3,600,000 Repayments during the period/year (2,977,758) (2,615,147) Closing balance 20,547,566 21,025,324
DG CementDGK Cement 3rd QUARTER 2020
PAGE 19
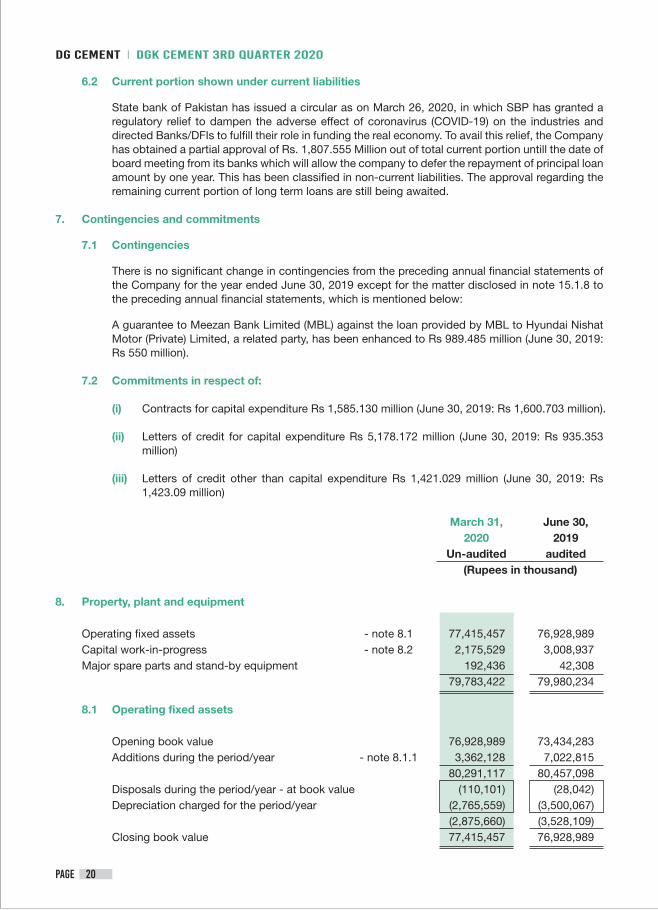
6.2 Current portion shown under current liabilities
State bank of Pakistan has issued a circular as on March 26, 2020, in which SBP has granted a regulatory relief to dampen the adverse effect of coronavirus (COVID-19) on the industries and directed Banks/DFIs to fulfill their role in funding the real economy. To avail this relief, the Company has obtained a partial approval of Rs. 1,807.555 Million out of total current portion untill the date of board meeting from its banks which will allow the company to defer the repayment of principal loan amount by one year. This has been classified in non-current liabilities. The approval regarding the remaining current portion of long term loans are still being awaited.
7. Contingencies and commitments
7.1 Contingencies
There is no significant change in contingencies from the preceding annual financial statements of the Company for the year ended June 30, 2019 except for the matter disclosed in note 15.1.8 to the preceding annual financial statements, which is mentioned below:
A guarantee to Meezan Bank Limited (MBL) against the loan provided by MBL to Hyundai Nishat Motor (Private) Limited, a related party, has been enhanced to Rs 989.485 million (June 30, 2019: Rs 550 million).
7.2 Commitments in respect of:
(i) Contracts for capital expenditure Rs 1,585.130 million (June 30, 2019: Rs 1,600.703 million).
(ii) Letters of credit for capital expenditure Rs 5,178.172 million (June 30, 2019: Rs 935.353 million)
(iii) Letters of credit other than capital expenditure Rs 1,421.029 million (June 30, 2019: Rs 1,423.09 million)
March 31, June 30, 2020 2019 Un-audited audited (Rupees in thousand)
8. Property, plant and equipment
Operating fixed assets - note 8.1 77,415,457 76,928,989 Capital work-in-progress - note 8.2 2,175,529 3,008,937 Major spare parts and stand-by equipment 192,436 42,308 79,783,422 79,980,234
8.1 Operating fixed assets
Opening book value 76,928,989 73,434,283 Additions during the period/year - note 8.1.1 3,362,128 7,022,815 80,291,117 80,457,098 Disposals during the period/year - at book value (110,101) (28,042) Depreciation charged for the period/year (2,765,559) (3,500,067) (2,875,660) (3,528,109) Closing book value 77,415,457 76,928,989
DG Cement DGK Cement 3rd QUARTER 2020
PAGE 20
March 31, June 30, 2020 2019 Un-audited audited (Rupees in thousand)
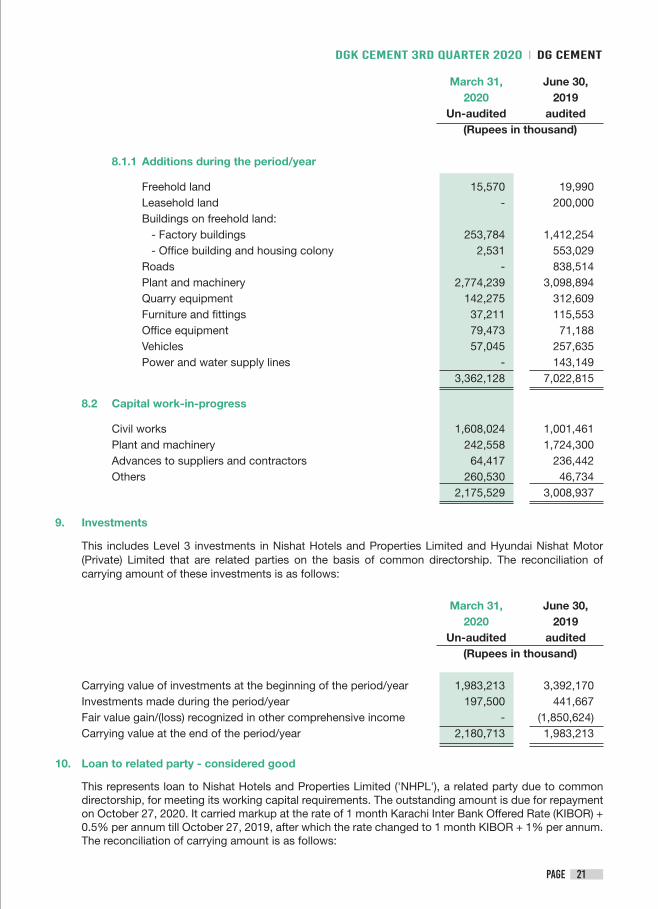
8.1.1 Additions during the period/year
Freehold land 15,570 19,990 Leasehold land - 200,000 Buildings on freehold land: - Factory buildings 253,784 1,412,254 - Office building and housing colony 2,531 553,029 Roads - 838,514 Plant and machinery 2,774,239 3,098,894 Quarry equipment 142,275 312,609 Furniture and fittings 37,211 115,553 Office equipment 79,473 71,188 Vehicles 57,045 257,635 Power and water supply lines - 143,149 3,362,128 7,022,815
8.2 Capital work-in-progress
Civil works 1,608,024 1,001,461 Plant and machinery 242,558 1,724,300 Advances to suppliers and contractors 64,417 236,442 Others 260,530 46,734 2,175,529 3,008,937
9. Investments
This includes Level 3 investments in Nishat Hotels and Properties Limited and Hyundai Nishat Motor (Private) Limited that are related parties on the basis of common directorship. The reconciliation of carrying amount of these investments is as follows:
March 31, June 30, 2020 2019 Un-audited audited (Rupees in thousand)
Carrying value of investments at the beginning of the period/year 1,983,213 3,392,170 Investments made during the period/year 197,500 441,667 Fair value gain/(loss) recognized in other comprehensive income - (1,850,624) Carrying value at the end of the period/year 2,180,713 1,983,213
10. Loan to related party - considered good
This represents loan to Nishat Hotels and Properties Limited ('NHPL'), a related party due to common directorship, for meeting its working capital requirements. The outstanding amount is due for repayment on October 27, 2020. It carried markup at the rate of 1 month Karachi Inter Bank Offered Rate (KIBOR) + 0.5% per annum till October 27, 2019, after which the rate changed to 1 month KIBOR + 1% per annum. The reconciliation of carrying amount is as follows:
DG CementDGK Cement 3rd QUARTER 2020
PAGE 21
DG Cement DGK Cement 3rd QUARTER 2020
PAGE 22
March 31, June 30, 2020 2019 Un-audited audited (Rupees in thousand)
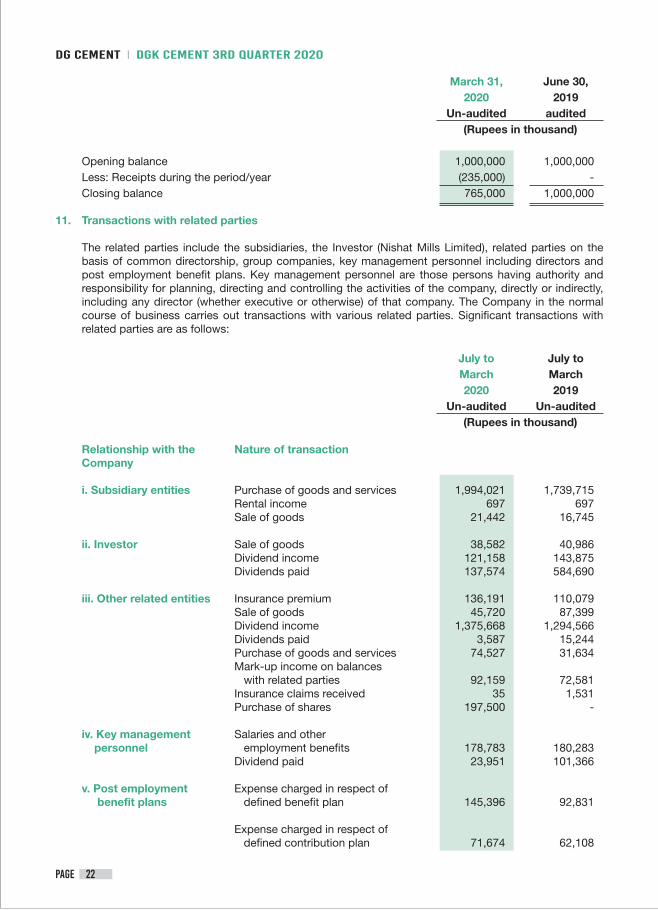
Opening balance 1,000,000 1,000,000 Less: Receipts during the period/year (235,000) - Closing balance 765,000 1,000,000
11. Transactions with related parties
The related parties include the subsidiaries, the Investor (Nishat Mills Limited), related parties on the basis of common directorship, group companies, key management personnel including directors and post employment benefit plans. Key management personnel are those persons having authority and responsibility for planning, directing and controlling the activities of the company, directly or indirectly, including any director (whether executive or otherwise) of that company. The Company in the normal course of business carries out transactions with various related parties. Significant transactions with related parties are as follows:
July to July to March March 2020 2019 Un-audited Un-audited (Rupees in thousand)
Relationship with the Nature of transaction Company
i. Subsidiary entities Purchase of goods and services 1,994,021 1,739,715 Rental income 697 697 Sale of goods 21,442 16,745
ii. Investor Sale of goods 38,582 40,986 Dividend income 121,158 143,875 Dividends paid 137,574 584,690
iii. Other related entities Insurance premium 136,191 110,079 Sale of goods 45,720 87,399 Dividend income 1,375,668 1,294,566 Dividends paid 3,587 15,244 Purchase of goods and services 74,527 31,634 Mark-up income on balances with related parties 92,159 72,581 Insurance claims received 35 1,531 Purchase of shares 197,500 -
iv. Key management Salaries and other personnel employment benefits 178,783 180,283 Dividend paid 23,951 101,366
v. Post employment Expense charged in respect of benefit plans defined benefit plan 145,396 92,831
Expense charged in respect of defined contribution plan 71,674 62,108
March 31, June 30, 2020 2019 Un-audited audited (Rupees in thousand)
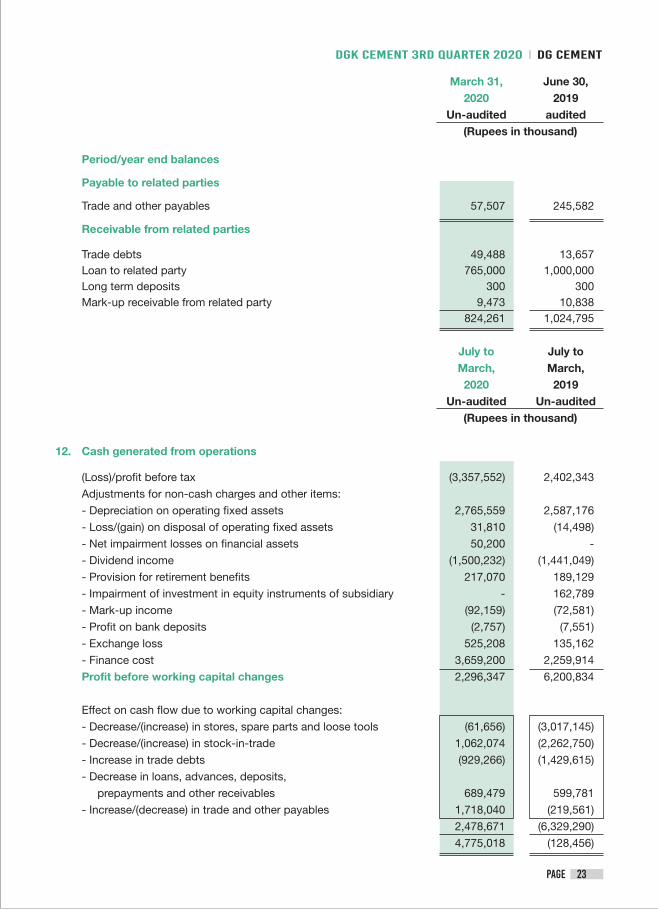
Period/year end balances
Payable to related parties
Trade and other payables 57,507 245,582
Receivable from related parties
Trade debts 49,488 13,657 Loan to related party 765,000 1,000,000 Long term deposits 300 300 Mark-up receivable from related party 9,473 10,838 824,261 1,024,795
July to July to March, March, 2020 2019 Un-audited Un-audited (Rupees in thousand)
12. Cash generated from operations
(Loss)/profit before tax (3,357,552) 2,402,343
Adjustments for non-cash charges and other items:
- Depreciation on operating fixed assets 2,765,559 2,587,176
- Loss/(gain) on disposal of operating fixed assets 31,810 (14,498)
- Net impairment losses on financial assets 50,200 -
- Dividend income (1,500,232) (1,441,049)
- Provision for retirement benefits 217,070 189,129
- Impairment of investment in equity instruments of subsidiary - 162,789
- Mark-up income (92,159) (72,581)
- Profit on bank deposits (2,757) (7,551)
- Exchange loss 525,208 135,162
- Finance cost 3,659,200 2,259,914
Profit before working capital changes 2,296,347 6,200,834
Effect on cash flow due to working capital changes:
- Decrease/(increase) in stores, spare parts and loose tools (61,656) (3,017,145)
- Decrease/(increase) in stock-in-trade 1,062,074 (2,262,750)
- Increase in trade debts (929,266) (1,429,615)
- Decrease in loans, advances, deposits,
prepayments and other receivables 689,479 599,781
- Increase/(decrease) in trade and other payables 1,718,040 (219,561)
2,478,671 (6,329,290)
4,775,018 (128,456)
DG CementDGK Cement 3rd QUARTER 2020
PAGE 23
DG Cement DGK Cement 3rd QUARTER 2020
PAGE 24
December 31, December 31, 2019 2018 Un-audited Un-audited (Rupees in thousand)
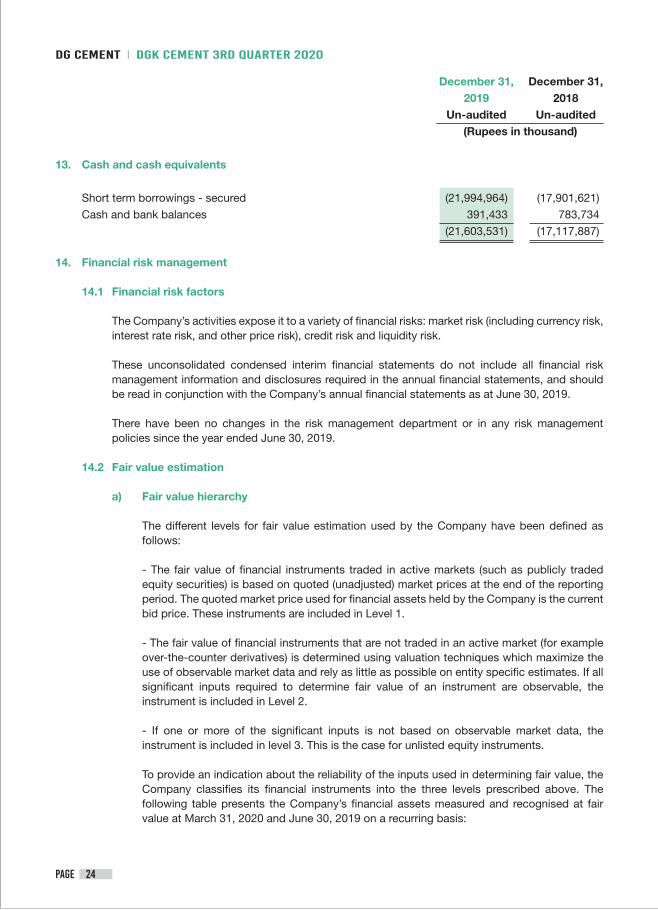
13. Cash and cash equivalents
Short term borrowings - secured (21,994,964) (17,901,621)
Cash and bank balances 391,433 783,734
(21,603,531) (17,117,887)
14. Financial risk management
14.1 Financial risk factors
The Company’s activities expose it to a variety of financial risks: market risk (including currency risk, interest rate risk, and other price risk), credit risk and liquidity risk.
These unconsolidated condensed interim financial statements do not include all financial risk management information and disclosures required in the annual financial statements, and should be read in conjunction with the Company’s annual financial statements as at June 30, 2019.
There have been no changes in the risk management department or in any risk management policies since the year ended June 30, 2019.
14.2 Fair value estimation
a) Fair value hierarchy
The different levels for fair value estimation used by the Company have been defined as follows:
- The fair value of financial instruments traded in active markets (such as publicly traded equity securities) is based on quoted (unadjusted) market prices at the end of the reporting period. The quoted market price used for financial assets held by the Company is the current bid price. These instruments are included in Level 1.
- The fair value of financial instruments that are not traded in an active market (for example over-the-counter derivatives) is determined using valuation techniques which maximize the use of observable market data and rely as little as possible on entity specific estimates. If all significant inputs required to determine fair value of an instrument are observable, the instrument is included in Level 2.
- If one or more of the significant inputs is not based on observable market data, the instrument is included in level 3. This is the case for unlisted equity instruments.
To provide an indication about the reliability of the inputs used in determining fair value, the Company classifies its financial instruments into the three levels prescribed above. The following table presents the Company’s financial assets measured and recognised at fair value at March 31, 2020 and June 30, 2019 on a recurring basis:
DG CementDGK Cement 3rd QUARTER 2020
PAGE 25
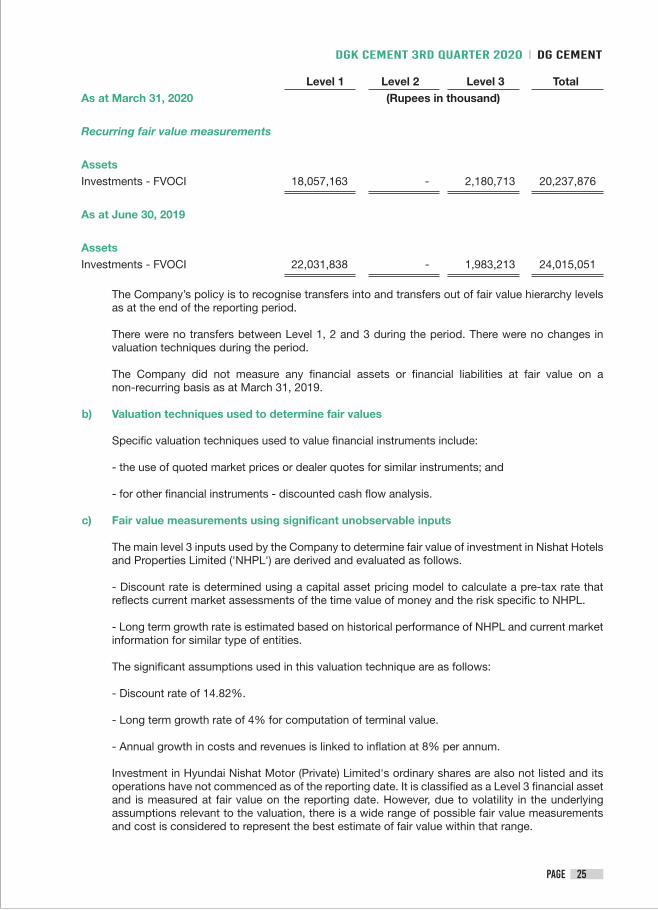
Level 1 Level 2 Level 3 Total As at March 31, 2020 (Rupees in thousand)
Recurring fair value measurements
Assets Investments - FVOCI 18,057,163 - 2,180,713 20,237,876
As at June 30, 2019
Assets Investments - FVOCI 22,031,838 - 1,983,213 24,015,051
The Company’s policy is to recognise transfers into and transfers out of fair value hierarchy levels as at the end of the reporting period.
There were no transfers between Level 1, 2 and 3 during the period. There were no changes in valuation techniques during the period.
The Company did not measure any financial assets or financial liabilities at fair value on a non-recurring basis as at March 31, 2019.
b) Valuation techniques used to determine fair values
Specific valuation techniques used to value financial instruments include:
- the use of quoted market prices or dealer quotes for similar instruments; and
- for other financial instruments - discounted cash flow analysis.
c) Fair value measurements using significant unobservable inputs
The main level 3 inputs used by the Company to determine fair value of investment in Nishat Hotels and Properties Limited ('NHPL') are derived and evaluated as follows.
- Discount rate is determined using a capital asset pricing model to calculate a pre-tax rate that reflects current market assessments of the time value of money and the risk specific to NHPL.
- Long term growth rate is estimated based on historical performance of NHPL and current market information for similar type of entities.
The significant assumptions used in this valuation technique are as follows:
- Discount rate of 14.82%.
- Long term growth rate of 4% for computation of terminal value.
- Annual growth in costs and revenues is linked to inflation at 8% per annum.
Investment in Hyundai Nishat Motor (Private) Limited's ordinary shares are also not listed and its operations have not commenced as of the reporting date. It is classified as a Level 3 financial asset and is measured at fair value on the reporting date. However, due to volatility in the underlying assumptions relevant to the valuation, there is a wide range of possible fair value measurements and cost is considered to represent the best estimate of fair value within that range.
DirectorChief Executive Chief Financial Officer
Sensitivity analysis
Sensitivity analysis of the significant assumptions used in the valuation technique are as follows:
If the discount rate increases by 1% with all other variables held constant, the impact on fair value as at March 31, 2020 would be Rs 292.460 million lower.
If the long term growth rate decreases by 1% with all other variables held constant, the impact on fair value as at March 31, 2020 would be Rs 136.366 million lower.
If inflation decreases by 1% with all other variables held constant, the impact on fair value as at March 31, 2020 would be Rs 18.630 million lower.
15. Date of authorization for issue
These unconsolidated condensed interim financial statements were authorized for issue on April 23, 2020 by the Board of Directors of the Company.
16. Corresponding figures
In order to comply with the requirements of International Accounting Standard 34 - 'Interim Financial Reporting', the unconsolidated condensed interim financial position has been compared with the balances of annual audited financial statements of preceding financial year, whereas, the condensed interim statement of profit or loss, condensed interim statement of comprehensive income, condensed interim statement of changes in equity and condensed interim statement of cash flows have been compared with the balances of comparable period of immediately preceding financial year.
DG Cement DGK Cement 3rd QUARTER 2020
PAGE 26
Interim ConsolidatedFinancial
Statements
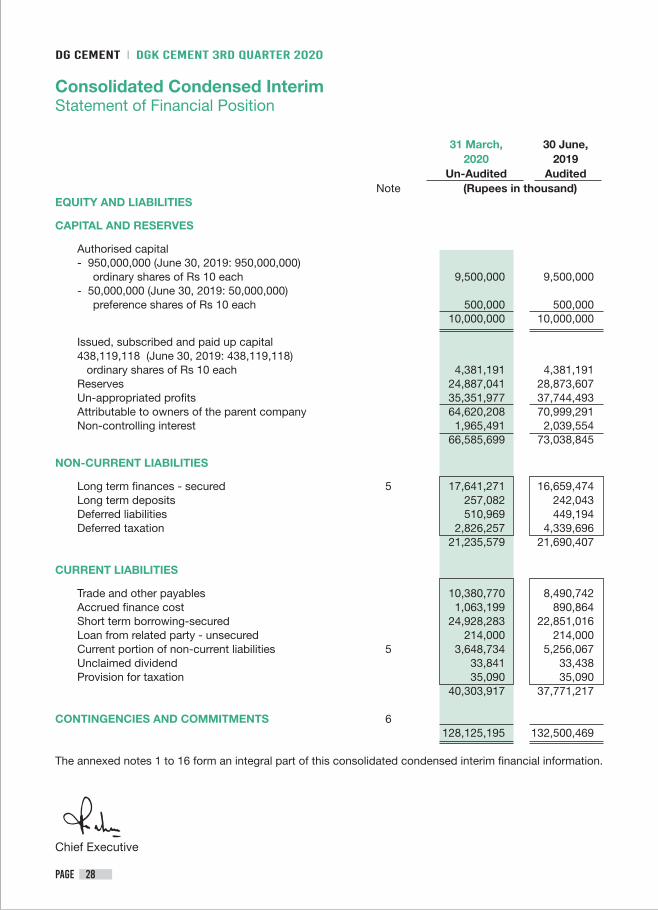
31 March, 30 June, 2020 2019 Un-Audited Audited Note (Rupees in thousand)EQUITY AND LIABILITIES
CAPITAL AND RESERVES
Authorised capital - 950,000,000 (June 30, 2019: 950,000,000) ordinary shares of Rs 10 each 9,500,000 9,500,000 - 50,000,000 (June 30, 2019: 50,000,000) preference shares of Rs 10 each 500,000 500,000 10,000,000 10,000,000
Issued, subscribed and paid up capital 438,119,118 (June 30, 2019: 438,119,118) ordinary shares of Rs 10 each 4,381,191 4,381,191 Reserves 24,887,041 28,873,607 Un-appropriated profits 35,351,977 37,744,493 Attributable to owners of the parent company 64,620,208 70,999,291 Non-controlling interest 1,965,491 2,039,554 66,585,699 73,038,845
NON-CURRENT LIABILITIES
Long term finances - secured 5 17,641,271 16,659,474 Long term deposits 257,082 242,043 Deferred liabilities 510,969 449,194 Deferred taxation 2,826,257 4,339,696 21,235,579 21,690,407
CURRENT LIABILITIES
Trade and other payables 10,380,770 8,490,742 Accrued finance cost 1,063,199 890,864 Short term borrowing-secured 24,928,283 22,851,016 Loan from related party - unsecured 214,000 214,000 Current portion of non-current liabilities 5 3,648,734 5,256,067 Unclaimed dividend 33,841 33,438 Provision for taxation 35,090 35,090 40,303,917 37,771,217
CONTINGENCIES AND COMMITMENTS 6 128,125,195 132,500,469
The annexed notes 1 to 16 form an integral part of this consolidated condensed interim financial information.
Chief Executive
Consolidated Condensed InterimStatement of Financial Position
DG Cement DGK Cement 3rd QUARTER 2020
PAGE 28
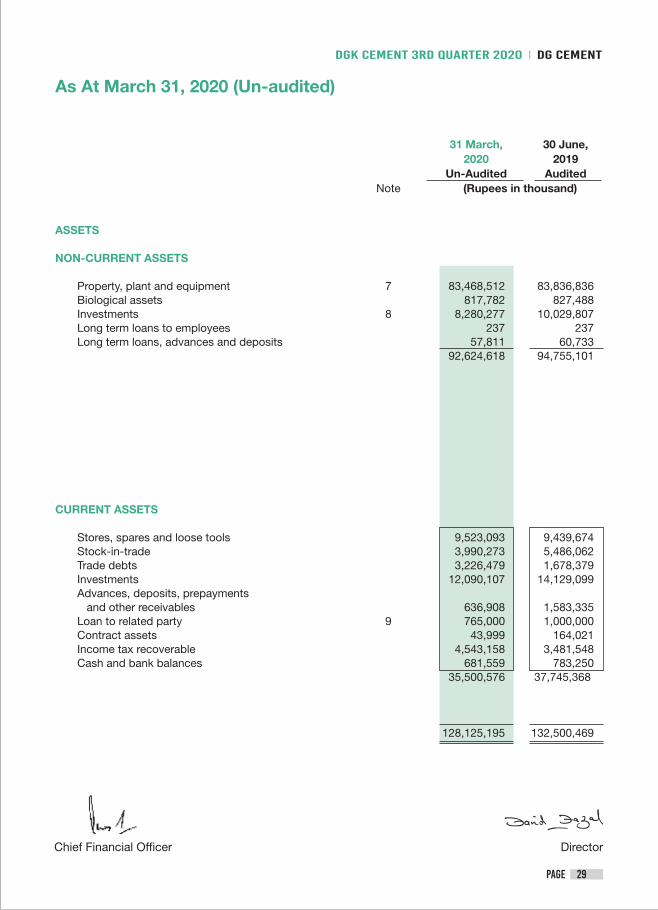
31 March, 30 June, 2020 2019 Un-Audited Audited Note (Rupees in thousand)
ASSETS
NON-CURRENT ASSETS
Property, plant and equipment 7 83,468,512 83,836,836 Biological assets 817,782 827,488 Investments 8 8,280,277 10,029,807 Long term loans to employees 237 237 Long term loans, advances and deposits 57,811 60,733 92,624,618 94,755,101
CURRENT ASSETS
Stores, spares and loose tools 9,523,093 9,439,674 Stock-in-trade 3,990,273 5,486,062 Trade debts 3,226,479 1,678,379 Investments 12,090,107 14,129,099 Advances, deposits, prepayments and other receivables 636,908 1,583,335 Loan to related party 9 765,000 1,000,000 Contract assets 43,999 164,021 Income tax recoverable 4,543,158 3,481,548 Cash and bank balances 681,559 783,250 35,500,576 37,745,368
128,125,195 132,500,469
DirectorChief Financial Officer
As At March 31, 2020 (Un-audited)
DG CementDGK Cement 3rd QUARTER 2020
PAGE 29
DirectorChief Executive Chief Financial Officer
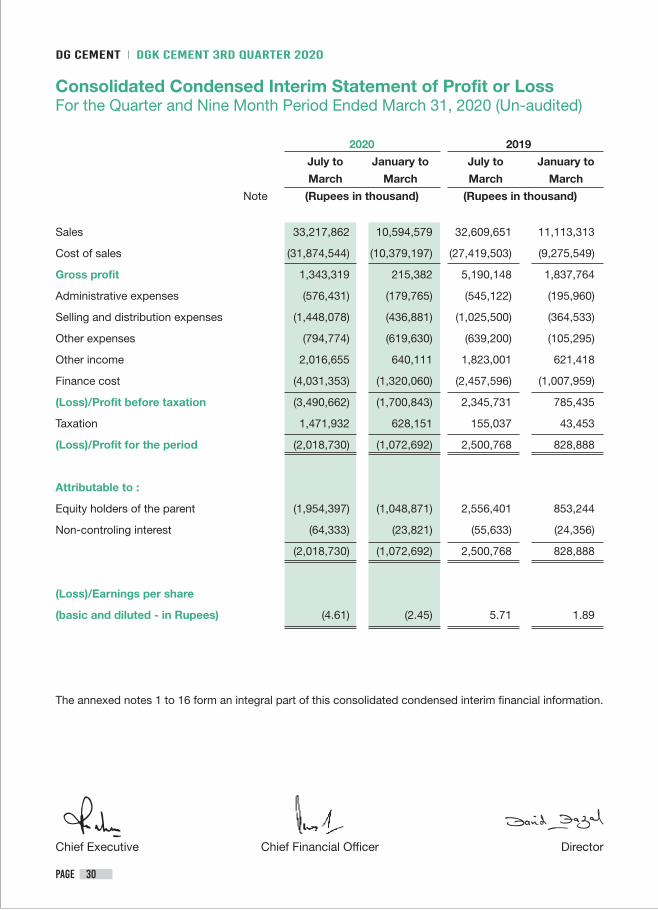
2020 2019
July to January to July to January to
March March March March
Note (Rupees in thousand) (Rupees in thousand)
Sales 33,217,862 10,594,579 32,609,651 11,113,313
Cost of sales (31,874,544) (10,379,197) (27,419,503) (9,275,549)
Gross profit 1,343,319 215,382 5,190,148 1,837,764
Administrative expenses (576,431) (179,765) (545,122) (195,960)
Selling and distribution expenses (1,448,078) (436,881) (1,025,500) (364,533)
Other expenses (794,774) (619,630) (639,200) (105,295)
Other income 2,016,655 640,111 1,823,001 621,418
Finance cost (4,031,353) (1,320,060) (2,457,596) (1,007,959)
(Loss)/Profit before taxation (3,490,662) (1,700,843) 2,345,731 785,435
Taxation 1,471,932 628,151 155,037 43,453
(Loss)/Profit for the period (2,018,730) (1,072,692) 2,500,768 828,888
Attributable to :
Equity holders of the parent (1,954,397) (1,048,871) 2,556,401 853,244
Non-controling interest (64,333) (23,821) (55,633) (24,356)
(2,018,730) (1,072,692) 2,500,768 828,888
(Loss)/Earnings per share
(basic and diluted - in Rupees) (4.61) (2.45) 5.71 1.89
The annexed notes 1 to 16 form an integral part of this consolidated condensed interim financial information.
Consolidated Condensed Interim Statement of Profit or LossFor the Quarter and Nine Month Period Ended March 31, 2020 (Un-audited)
DG Cement DGK Cement 3rd QUARTER 2020
PAGE 30
DirectorChief Executive Chief Financial Officer
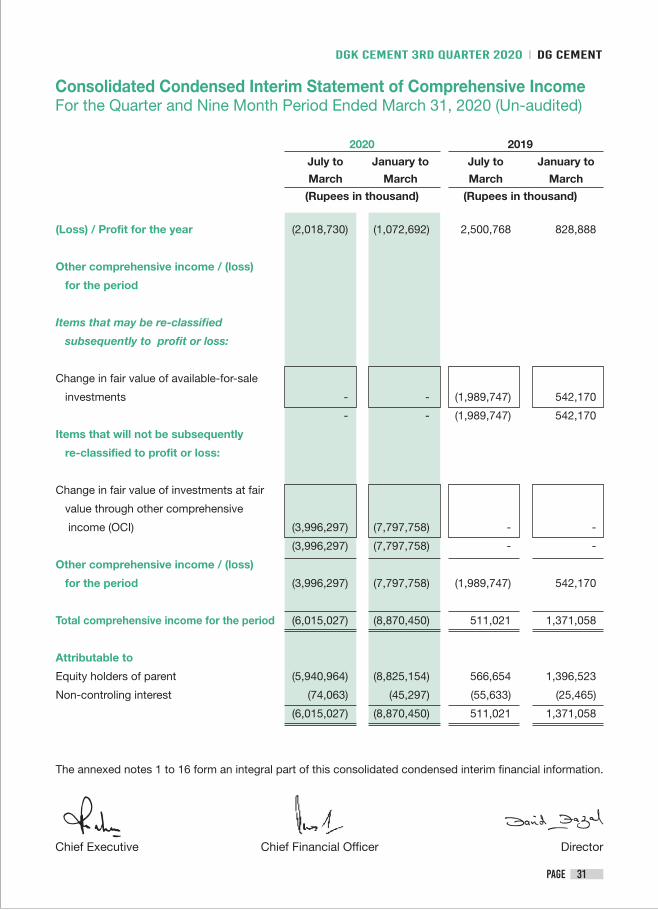
2020 2019
July to January to July to January to
March March March March
(Rupees in thousand) (Rupees in thousand)
(Loss) / Profit for the year (2,018,730) (1,072,692) 2,500,768 828,888
Other comprehensive income / (loss)
for the period
Items that may be re-classified
subsequently to profit or loss:
Change in fair value of available-for-sale
investments - - (1,989,747) 542,170
- - (1,989,747) 542,170
Items that will not be subsequently
re-classified to profit or loss:
Change in fair value of investments at fair
value through other comprehensive
income (OCI) (3,996,297) (7,797,758) - -
(3,996,297) (7,797,758) - -
Other comprehensive income / (loss)
for the period (3,996,297) (7,797,758) (1,989,747) 542,170
Total comprehensive income for the period (6,015,027) (8,870,450) 511,021 1,371,058
Attributable to
Equity holders of parent (5,940,964) (8,825,154) 566,654 1,396,523
Non-controling interest (74,063) (45,297) (55,633) (25,465)
(6,015,027) (8,870,450) 511,021 1,371,058
The annexed notes 1 to 16 form an integral part of this consolidated condensed interim financial information.
Consolidated Condensed Interim Statement of Comprehensive IncomeFor the Quarter and Nine Month Period Ended March 31, 2020 (Un-audited)
DG CementDGK Cement 3rd QUARTER 2020
PAGE 31
DG Cement DGK Cement 3rd QUARTER 2020
PAGE 32
Dire
ctor
Chi
ef E
xecu
tive
Chi
ef F
inan
cial
Offi
cer
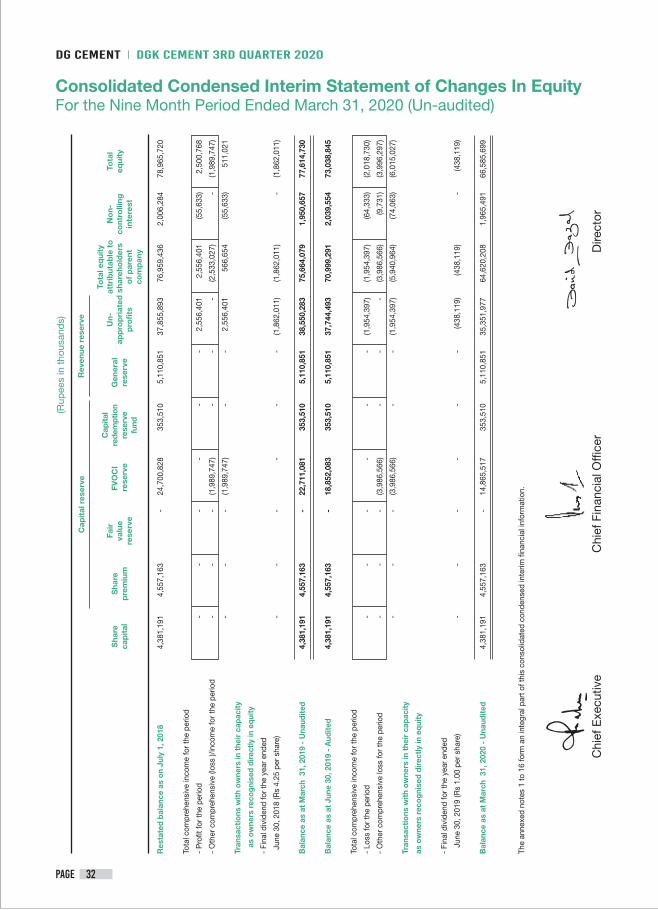
Consolidated Condensed Interim Statement of Changes In Equity For the Nine Month Period Ended March 31, 2020 (Un-audited)
Res
tate
d ba
lanc
e as
on
July
1, 2
018
4,3
81,1
91
4,55
7,16
3 -
24,7
00,8
28
353,
510
5,11
0,85
1 37
,855
,893
76
,959
,436
2,
006,
284
78,9
65,7
20
Tota
l com
preh
ensi
ve in
com
e fo
r the
per
iod
- P
rofit
for t
he p
erio
d -
- -
- -
- 2
,556
,401
2,
556,
401
(55,
633)
2,
500,
768
- O
ther
com
preh
ensi
ve (l
oss
)/inc
ome
for t
he p
erio
d -
- -
(1,9
89,7
47)
- -
- (2
,533
,027
) -
(1,9
89,7
47)
- -
- (1
,989
,747
) -
- 2
,556
,401
56
6,65
4 (5
5,63
3)
511,
021
Tran
sact
ions
with
ow
ners
in t
heir
cap
acity
as
ow
ners
rec
ogni
sed
dire
ctly
in e
quity
- Fi
nal d
ivid
end
for t
he y
ear e
nded
Jun
e 30
, 201
8 (R
s 4.
25 p
er s
hare
) -
- -
- -
- (1
,862
,011
) (1
,862
,011
) -
(1,8
62,0
11)
Bal
ance
as
at M
arch
31,
201
9 -
Una
udite
d 4
,381
,191
4,
557,
163
- 22
,711
,081
35
3,51
0 5,
110,
851
38,5
50,2
83
75,6
64,0
79
1,95
0,65
7 77
,614
,730
Bal
ance
as
at J
une
30, 2
019
- A
udite
d 4
,381
,191
4,
557,
163
- 18
,852
,083
35
3,51
0 5,
110,
851
37,7
44,4
93
70,9
99,2
91
2,03
9,55
4 73
,038
,845
Tota
l com
preh
ensi
ve in
com
e fo
r the
per
iod
- Lo
ss fo
r the
per
iod
-
- -
- -
- (1
,954
,397
) (1
,954
,397
) (6
4,33
3)
(2,0
18,7
30)
- O
ther
com
preh
ensi
ve lo
ss fo
r the
per
iod
- -
- (3
,986
,566
) -
- -
(3,9
86,5
66)
(9,7
31)
(3,9
96,2
97)
- -
- (3
,986
,566
) -
- (1
,954
,397
) (5
,940
,964
) (7
4,06
3)
(6,0
15,0
27)
Tran
sact
ions
with
ow
ners
in t
heir
cap
acity
as o
wne
rs r
ecog
nise
d di
rect
ly in
equ
ity
- Fi
nal d
ivid
end
for t
he y
ear e
nded
Ju
ne 3
0, 2
019
(Rs
1.00
per
sha
re)
- -
- -
- -
(438
,119
) (4
38,1
19)
- (4
38,1
19)
Bal
ance
as
at M
arch
31,
202
0 -
Una
udite
d 4,
381,
191
4,55
7,16
3 -
14,8
65,5
17
353,
510
5,11
0,85
1 35
,351
,977
64
,620
,208
1,
965,
491
66,5
85,6
99
The
anne
xed
note
s 1
to 1
6 fo
rm a
n in
tegr
al p
art o
f thi
s co
nsol
idat
ed c
onde
nsed
inte
rim fi
nanc
ial i
nfor
mat
ion.
(Rup
ees
in t
hous
and
s)
Sha
reca
pit
alS
hare
pre
miu
m
Fair
valu
ere
serv
e
Tota
leq
uity
No
n-co
ntro
lling
inte
rest
Tota
l eq
uity
attr
ibut
able
to
shar
eho
lder
s o
f p
aren
tco
mp
any
Un-
app
rop
riat
edp
rofit
s
Gen
eral
rese
rve
FVO
CI
res
erve
Cap
ital
rede
mpt
ion
rese
rve
fund
Rev
enue
res
erve
Cap
ital
res
erve
DG CementDGK Cement 3rd QUARTER 2020
PAGE 33
DirectorChief Executive Chief Financial Officer
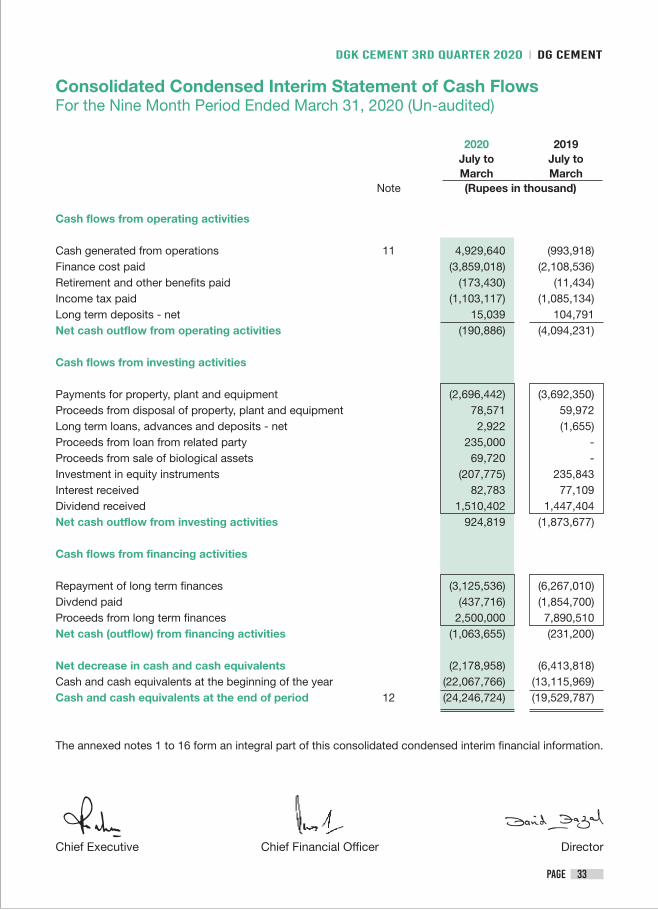
2020 2019 July to July to March March Note (Rupees in thousand) Cash flows from operating activities
Cash generated from operations 11 4,929,640 (993,918)Finance cost paid (3,859,018) (2,108,536)Retirement and other benefits paid (173,430) (11,434)Income tax paid (1,103,117) (1,085,134)Long term deposits - net 15,039 104,791Net cash outflow from operating activities (190,886) (4,094,231)
Cash flows from investing activities
Payments for property, plant and equipment (2,696,442) (3,692,350)Proceeds from disposal of property, plant and equipment 78,571 59,972Long term loans, advances and deposits - net 2,922 (1,655)Proceeds from loan from related party 235,000 -Proceeds from sale of biological assets 69,720 -Investment in equity instruments (207,775) 235,843Interest received 82,783 77,109Dividend received 1,510,402 1,447,404Net cash outflow from investing activities 924,819 (1,873,677)
Cash flows from financing activities
Repayment of long term finances (3,125,536) (6,267,010)Divdend paid (437,716) (1,854,700)Proceeds from long term finances 2,500,000 7,890,510Net cash (outflow) from financing activities (1,063,655) (231,200)
Net decrease in cash and cash equivalents (2,178,958) (6,413,818)Cash and cash equivalents at the beginning of the year (22,067,766) (13,115,969)Cash and cash equivalents at the end of period 12 (24,246,724) (19,529,787)
The annexed notes 1 to 16 form an integral part of this consolidated condensed interim financial information.
Consolidated Condensed Interim Statement of Cash Flows For the Nine Month Period Ended March 31, 2020 (Un-audited)
1. Legal Status and nature of business
The group comprises of: - D. G. Khan Cement Company Limited (the parent company); - Nishat Paper Products Company Limited; - Nishat Dairy (Private) Limited; and
The parent company is a public limited company incorporated in Pakistan and is listed on Pakistan Stock Exchange. It is principally engaged in production and sale of Clinker, Ordinary Portland and Sulphate Resistant Cement. The registered office of the Company is situated at 53-A Lawrence Road, Lahore. The Company is principally engaged in production and sale of Clinker, Ordinary Portland and Sulphate Resistant Cement. It has four cement plants, two plants located at Dera Ghazi Khan ('D.G. Khan'), one at Khairpur District, Chakwal ('Khairpur') and one at Hub District, Lasbela ('Hub')
Nishat Paper Products Company Limited is a public limited company incorporated in Pakistan under the Companies Ordinance, 1984 on July 23, 2004. It is principally engaged in the manufacture and sale of paper products and packaging material.
Nishat Dairy (private) Limited (the company) was incorporated in Pakistan under the Companies Ordinance 1984 on October 28, 2011. The principally activity of the company is to carry on the business of production of raw milk.
The registered office of the Group is situated at 53-A, Lawrence Road, Lahore. The parent company's holding in its subsidiaries is as follows:
Effective percentage of holding - Nishat Paper Products Company Limited 55% - Nishat Dairy (Private) Limited 55.10% 2. Basis of preparation
2.1 Statement of compliance
This condensed interim financial information has been prepared in accordance with the accounting and reporting standards as applicable in Pakistan for interim financial reporting. The accounting and reporting standards as applicable in Pakistan for interim financial reporting comprise of:
- International Accounting Standard (IAS) 34, Interim Financial Reporting, issued by the International Accounting Standards Board (IASB) as notified under the Companies Act, 2017; and
- Provisions of and directives issued under the Companies Act, 2017.
Where the provisions of and directives issued under the Companies Act, 2017 differ with the requirements of IAS 34, the provisions of and directives issued under the Companies Act, 2017 have been followed.
2.2 These consolidated condensed interim financial statements are un-audited and are being submitted to the members as required by section 237 of the Companies Act, 2017 (the 'Act').
These consolidated condensed interim financial statements do not include all of the information required for annual financial statements and should be read in conjunction with the annual financial statements as at and for the year ended June 30, 2019. Selected explanatory notes are included to explain events and transactions that are significant to and understanding of the changes in the Group’s financial position and performance since the last annual financial statements.
Notes to and Forming Part of the Condensed Interim Consolidated FinancialFor the NineMonth Period Ended March 31, 2020 (Un-audited)
DG Cement DGK Cement 3rd QUARTER 2020
PAGE 34
3. Significant accounting policies
3.1 The accounting policies and the methods of computation adopted in the preparation of these consolidated condensed interim financial statements are the same as those applied in the preparation of preceding annual published financial statements of the Group for the year ended June 30, 2019 except for the adoption of new and amended standards as set out below:
3.2 Standards, amendments and interpretations to International Financial Reporting Standards (IFRS) that are effective in the current period
Certain standards, amendments and interpretations to International Financial Reporting Standards (IFRS) are effective for accounting periods beginning on July 1, 2019, but are considered not to be relevant or to have any significant effect on the Group’s operations (although they may affect the accounting for future transactions and events) and are, therefore, not detailed in these consolidated condensed interim financial statements.
3.3 Standards, amendments and interpretations to existing standards that are not yet effective and have not been early adopted by the Group
There are certain standards, amendments to the accounting standards and interpretations that are mandatory for the Group's accounting periods beginning on or after July 01, 2020 but are considered not to be relevant or to have any significant effect on the Group's operations and are, therefore, not detailed in these consolidated condensed interim financial statements.
4. Accounting estimates
The preparation of these consolidated condensed interim financial statements requires management to make judgments, estimates and assumptions that affect the application of accounting policies and the reported amounts of assets and liabilities, income and expenses. Actual results may differ from these estimates.
In preparing these consolidated condensed interim financial statements, the significant judgments made by management in applying accounting policies and key sources of estimation were the same as those that were applied to the annual financial statements of the Group for the year ended June 30, 2019, with the exception of change in estimate that is required in determining the provision for income taxes as referred to below:
Income tax expense is recognized in each interim period based on best estimate of the weighted average annual income tax rate expected for the full financial year. Amounts accrued for income tax expense in one interim period may have to be adjusted in a subsequent interim period of that financial year if the estimate of the annual income tax rate changes.
March 31, June 30, 2020 2019 Un-audited audited (Rupees in thousand)
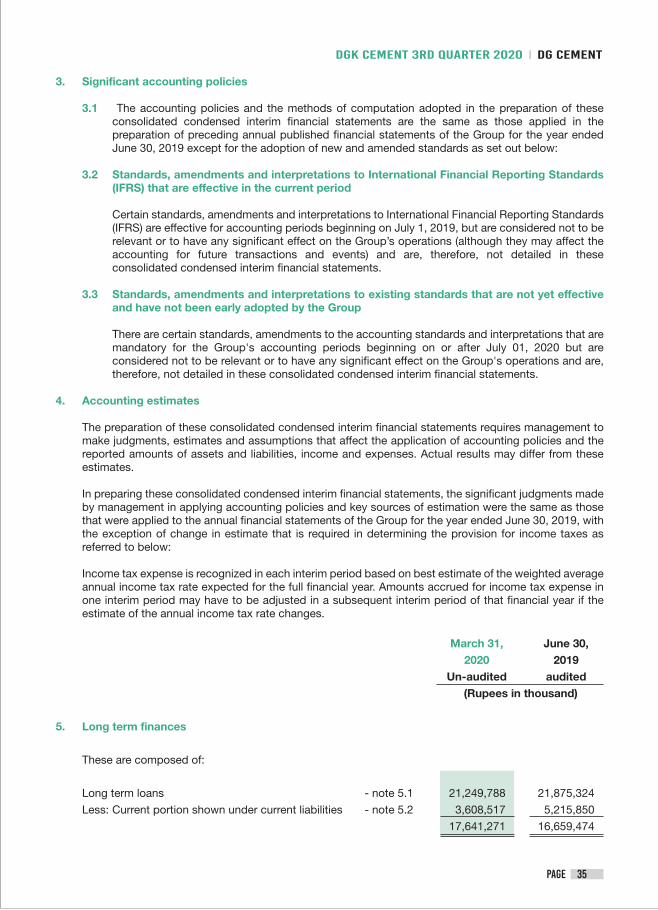
5. Long term finances
These are composed of:
Long term loans - note 5.1 21,249,788 21,875,324
Less: Current portion shown under current liabilities - note 5.2 3,608,517 5,215,850
17,641,271 16,659,474
DG CementDGK Cement 3rd QUARTER 2020
PAGE 35
March 31, June 30, 2020 2019 Un-audited audited (Rupees in thousand)
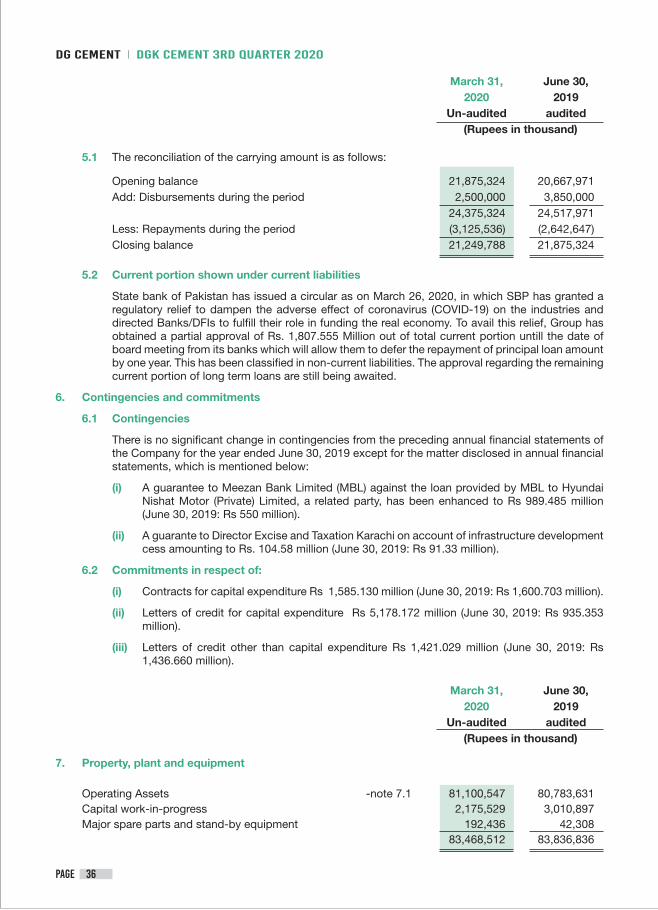
5.1 The reconciliation of the carrying amount is as follows:
Opening balance 21,875,324 20,667,971 Add: Disbursements during the period 2,500,000 3,850,000 24,375,324 24,517,971 Less: Repayments during the period (3,125,536) (2,642,647) Closing balance 21,249,788 21,875,324
5.2 Current portion shown under current liabilities
State bank of Pakistan has issued a circular as on March 26, 2020, in which SBP has granted a regulatory relief to dampen the adverse effect of coronavirus (COVID-19) on the industries and directed Banks/DFIs to fulfill their role in funding the real economy. To avail this relief, Group has obtained a partial approval of Rs. 1,807.555 Million out of total current portion untill the date of board meeting from its banks which will allow them to defer the repayment of principal loan amount by one year. This has been classified in non-current liabilities. The approval regarding the remaining current portion of long term loans are still being awaited.
6. Contingencies and commitments
6.1 Contingencies
There is no significant change in contingencies from the preceding annual financial statements of the Company for the year ended June 30, 2019 except for the matter disclosed in annual financial statements, which is mentioned below:
(i) A guarantee to Meezan Bank Limited (MBL) against the loan provided by MBL to Hyundai Nishat Motor (Private) Limited, a related party, has been enhanced to Rs 989.485 million (June 30, 2019: Rs 550 million).
(ii) A guarante to Director Excise and Taxation Karachi on account of infrastructure development cess amounting to Rs. 104.58 million (June 30, 2019: Rs 91.33 million).
6.2 Commitments in respect of:
(i) Contracts for capital expenditure Rs 1,585.130 million (June 30, 2019: Rs 1,600.703 million).
(ii) Letters of credit for capital expenditure Rs 5,178.172 million (June 30, 2019: Rs 935.353 million).
(iii) Letters of credit other than capital expenditure Rs 1,421.029 million (June 30, 2019: Rs 1,436.660 million).
March 31, June 30, 2020 2019 Un-audited audited (Rupees in thousand)
7. Property, plant and equipment
Operating Assets -note 7.1 81,100,547 80,783,631 Capital work-in-progress 2,175,529 3,010,897 Major spare parts and stand-by equipment 192,436 42,308 83,468,512 83,836,836
DG Cement DGK Cement 3rd QUARTER 2020
PAGE 36
DG CementDGK Cement 3rd QUARTER 2020
PAGE 37
March 31, June 30, 2020 2019 Un-audited audited (Rupees in thousand)
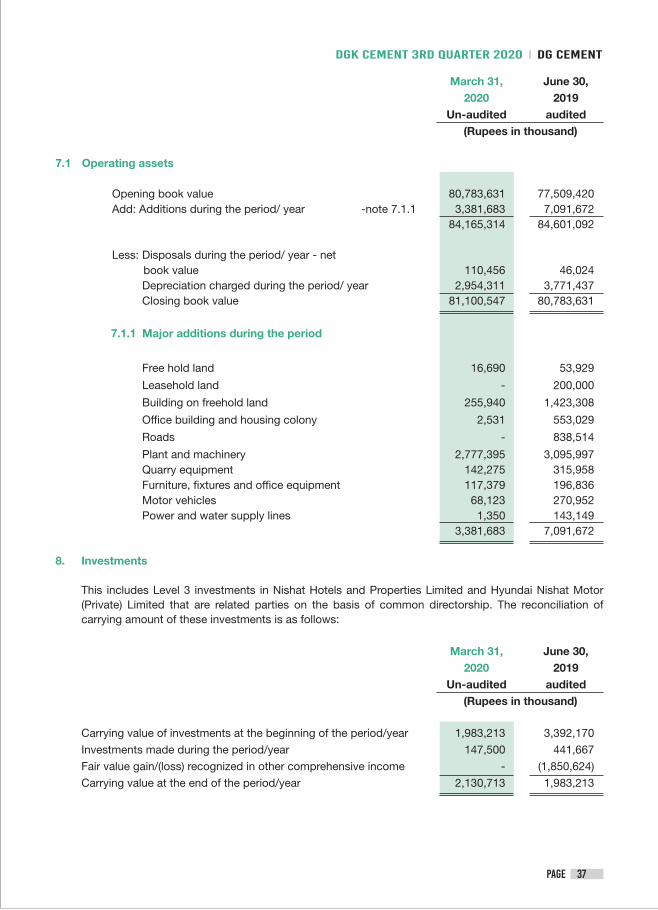
7.1 Operating assets
Opening book value 80,783,631 77,509,420 Add: Additions during the period/ year -note 7.1.1 3,381,683 7,091,672 84,165,314 84,601,092
Less: Disposals during the period/ year - net book value 110,456 46,024 Depreciation charged during the period/ year 2,954,311 3,771,437 Closing book value 81,100,547 80,783,631
7.1.1 Major additions during the period
Free hold land 16,690 53,929
Leasehold land - 200,000
Building on freehold land 255,940 1,423,308
Office building and housing colony 2,531 553,029
Roads - 838,514
Plant and machinery 2,777,395 3,095,997 Quarry equipment 142,275 315,958 Furniture, fixtures and office equipment 117,379 196,836 Motor vehicles 68,123 270,952 Power and water supply lines 1,350 143,149 3,381,683 7,091,672
8. Investments
This includes Level 3 investments in Nishat Hotels and Properties Limited and Hyundai Nishat Motor (Private) Limited that are related parties on the basis of common directorship. The reconciliation of carrying amount of these investments is as follows:
March 31, June 30, 2020 2019 Un-audited audited (Rupees in thousand)
Carrying value of investments at the beginning of the period/year 1,983,213 3,392,170
Investments made during the period/year 147,500 441,667
Fair value gain/(loss) recognized in other comprehensive income - (1,850,624)
Carrying value at the end of the period/year 2,130,713 1,983,213
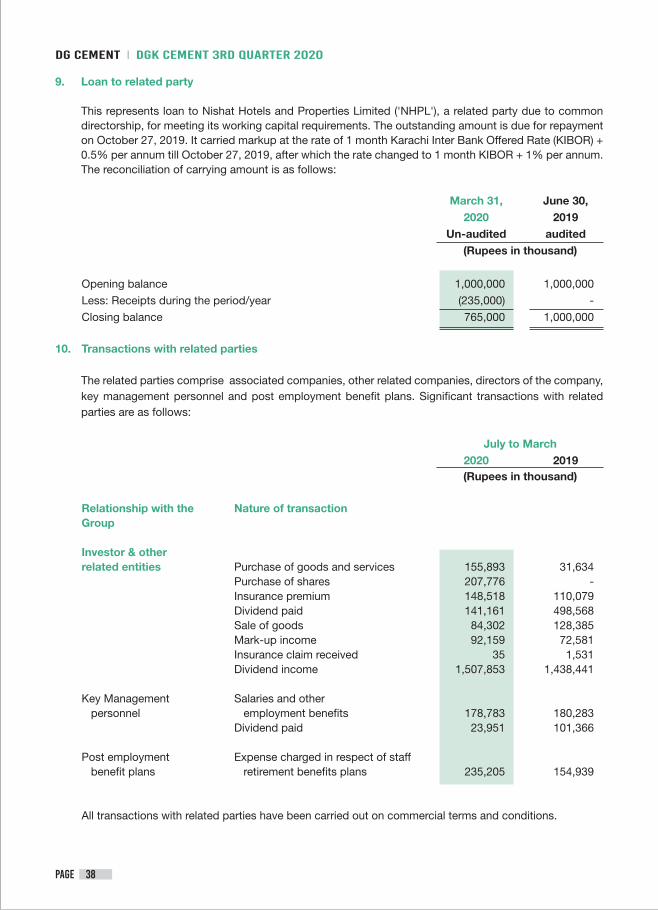
9. Loan to related party
This represents loan to Nishat Hotels and Properties Limited ('NHPL'), a related party due to common directorship, for meeting its working capital requirements. The outstanding amount is due for repayment on October 27, 2019. It carried markup at the rate of 1 month Karachi Inter Bank Offered Rate (KIBOR) + 0.5% per annum till October 27, 2019, after which the rate changed to 1 month KIBOR + 1% per annum. The reconciliation of carrying amount is as follows:
March 31, June 30, 2020 2019 Un-audited audited (Rupees in thousand)
Opening balance 1,000,000 1,000,000
Less: Receipts during the period/year (235,000) -
Closing balance 765,000 1,000,000
10. Transactions with related parties
The related parties comprise associated companies, other related companies, directors of the company, key management personnel and post employment benefit plans. Significant transactions with related parties are as follows:
July to March 2020 2019 (Rupees in thousand)
Relationship with the Nature of transaction Group Investor & other related entities Purchase of goods and services 155,893 31,634 Purchase of shares 207,776 - Insurance premium 148,518 110,079 Dividend paid 141,161 498,568 Sale of goods 84,302 128,385 Mark-up income 92,159 72,581 Insurance claim received 35 1,531 Dividend income 1,507,853 1,438,441
Key Management Salaries and other personnel employment benefits 178,783 180,283 Dividend paid 23,951 101,366
Post employment Expense charged in respect of staff benefit plans retirement benefits plans 235,205 154,939
All transactions with related parties have been carried out on commercial terms and conditions.
DG Cement DGK Cement 3rd QUARTER 2020
PAGE 38
July to March 2020 2019 (Rupees in thousand)
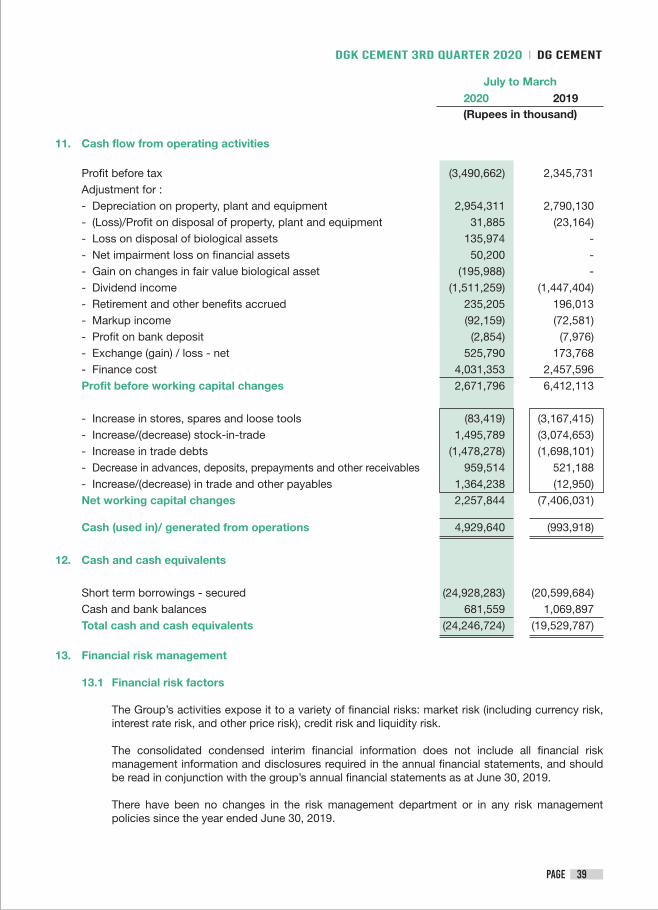
11. Cash flow from operating activities
Profit before tax (3,490,662) 2,345,731 Adjustment for : - Depreciation on property, plant and equipment 2,954,311 2,790,130 - (Loss)/Profit on disposal of property, plant and equipment 31,885 (23,164) - Loss on disposal of biological assets 135,974 - - Net impairment loss on financial assets 50,200 - - Gain on changes in fair value biological asset (195,988) - - Dividend income (1,511,259) (1,447,404) - Retirement and other benefits accrued 235,205 196,013 - Markup income (92,159) (72,581) - Profit on bank deposit (2,854) (7,976) - Exchange (gain) / loss - net 525,790 173,768 - Finance cost 4,031,353 2,457,596 Profit before working capital changes 2,671,796 6,412,113
- Increase in stores, spares and loose tools (83,419) (3,167,415) - Increase/(decrease) stock-in-trade 1,495,789 (3,074,653) - Increase in trade debts (1,478,278) (1,698,101) - Decrease in advances, deposits, prepayments and other receivables 959,514 521,188 - Increase/(decrease) in trade and other payables 1,364,238 (12,950) Net working capital changes 2,257,844 (7,406,031)
Cash (used in)/ generated from operations 4,929,640 (993,918)
12. Cash and cash equivalents
Short term borrowings - secured (24,928,283) (20,599,684) Cash and bank balances 681,559 1,069,897 Total cash and cash equivalents (24,246,724) (19,529,787)
13. Financial risk management
13.1 Financial risk factors
The Group’s activities expose it to a variety of financial risks: market risk (including currency risk, interest rate risk, and other price risk), credit risk and liquidity risk.
The consolidated condensed interim financial information does not include all financial risk management information and disclosures required in the annual financial statements, and should be read in conjunction with the group’s annual financial statements as at June 30, 2019.
There have been no changes in the risk management department or in any risk management policies since the year ended June 30, 2019.
DG CementDGK Cement 3rd QUARTER 2020
PAGE 39
DG Cement DGK Cement 3rd QUARTER 2020
PAGE 40
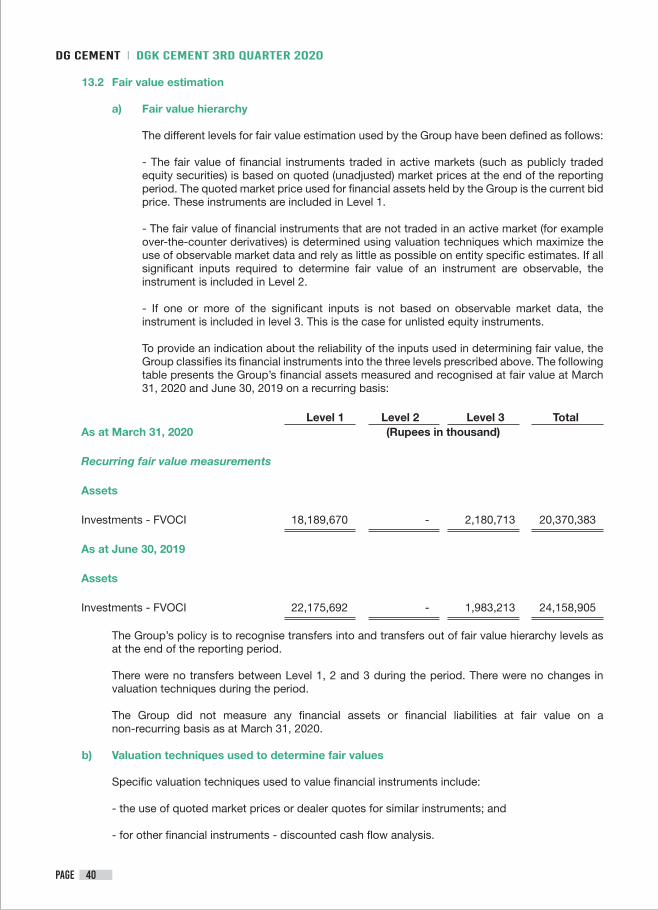
13.2 Fair value estimation
a) Fair value hierarchy
The different levels for fair value estimation used by the Group have been defined as follows:
- The fair value of financial instruments traded in active markets (such as publicly traded equity securities) is based on quoted (unadjusted) market prices at the end of the reporting period. The quoted market price used for financial assets held by the Group is the current bid price. These instruments are included in Level 1.
- The fair value of financial instruments that are not traded in an active market (for example over-the-counter derivatives) is determined using valuation techniques which maximize the use of observable market data and rely as little as possible on entity specific estimates. If all significant inputs required to determine fair value of an instrument are observable, the instrument is included in Level 2.
- If one or more of the significant inputs is not based on observable market data, the instrument is included in level 3. This is the case for unlisted equity instruments.
To provide an indication about the reliability of the inputs used in determining fair value, the Group classifies its financial instruments into the three levels prescribed above. The following table presents the Group’s financial assets measured and recognised at fair value at March 31, 2020 and June 30, 2019 on a recurring basis:
Level 1 Level 2 Level 3 Total As at March 31, 2020 (Rupees in thousand)
Recurring fair value measurements
Assets
Investments - FVOCI 18,189,670 - 2,180,713 20,370,383
As at June 30, 2019 Assets Investments - FVOCI 22,175,692 - 1,983,213 24,158,905
The Group’s policy is to recognise transfers into and transfers out of fair value hierarchy levels as at the end of the reporting period.
There were no transfers between Level 1, 2 and 3 during the period. There were no changes in valuation techniques during the period.
The Group did not measure any financial assets or financial liabilities at fair value on a non-recurring basis as at March 31, 2020.
b) Valuation techniques used to determine fair values
Specific valuation techniques used to value financial instruments include:
- the use of quoted market prices or dealer quotes for similar instruments; and
- for other financial instruments - discounted cash flow analysis.
DG CementDGK Cement 3rd QUARTER 2020
PAGE 41
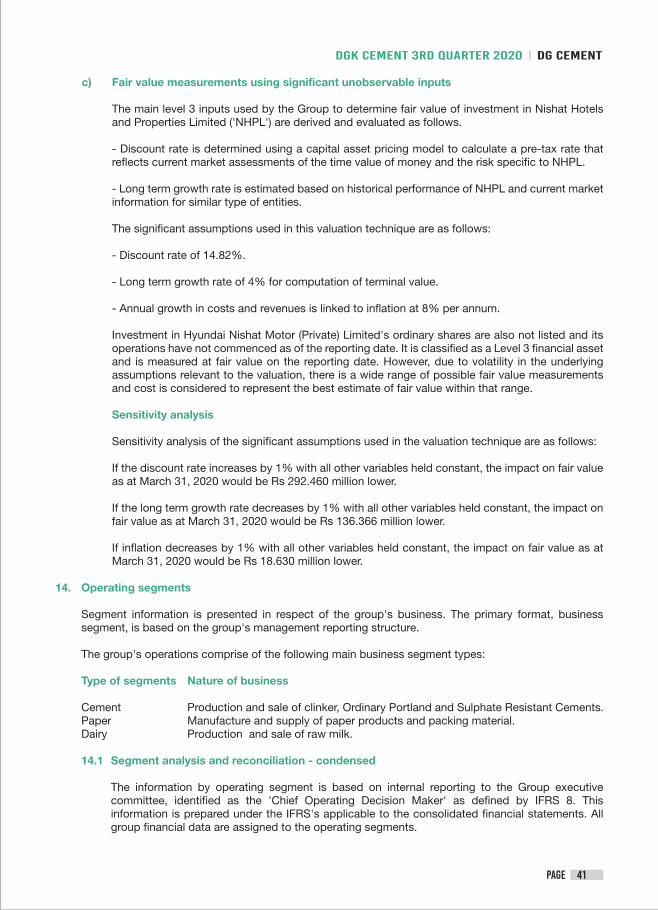
c) Fair value measurements using significant unobservable inputs
The main level 3 inputs used by the Group to determine fair value of investment in Nishat Hotels and Properties Limited ('NHPL') are derived and evaluated as follows.
- Discount rate is determined using a capital asset pricing model to calculate a pre-tax rate that reflects current market assessments of the time value of money and the risk specific to NHPL.
- Long term growth rate is estimated based on historical performance of NHPL and current market information for similar type of entities.
The significant assumptions used in this valuation technique are as follows:
- Discount rate of 14.82%.
- Long term growth rate of 4% for computation of terminal value.
- Annual growth in costs and revenues is linked to inflation at 8% per annum.
Investment in Hyundai Nishat Motor (Private) Limited's ordinary shares are also not listed and its operations have not commenced as of the reporting date. It is classified as a Level 3 financial asset and is measured at fair value on the reporting date. However, due to volatility in the underlying assumptions relevant to the valuation, there is a wide range of possible fair value measurements and cost is considered to represent the best estimate of fair value within that range.
Sensitivity analysis
Sensitivity analysis of the significant assumptions used in the valuation technique are as follows:
If the discount rate increases by 1% with all other variables held constant, the impact on fair value as at March 31, 2020 would be Rs 292.460 million lower.
If the long term growth rate decreases by 1% with all other variables held constant, the impact on fair value as at March 31, 2020 would be Rs 136.366 million lower.
If inflation decreases by 1% with all other variables held constant, the impact on fair value as at March 31, 2020 would be Rs 18.630 million lower.
14. Operating segments
Segment information is presented in respect of the group's business. The primary format, business segment, is based on the group's management reporting structure.
The group's operations comprise of the following main business segment types:
Type of segments Nature of business
Cement Production and sale of clinker, Ordinary Portland and Sulphate Resistant Cements. Paper Manufacture and supply of paper products and packing material. Dairy Production and sale of raw milk.
14.1 Segment analysis and reconciliation - condensed
The information by operating segment is based on internal reporting to the Group executive committee, identified as the 'Chief Operating Decision Maker' as defined by IFRS 8. This information is prepared under the IFRS's applicable to the consolidated financial statements. All group financial data are assigned to the operating segments.
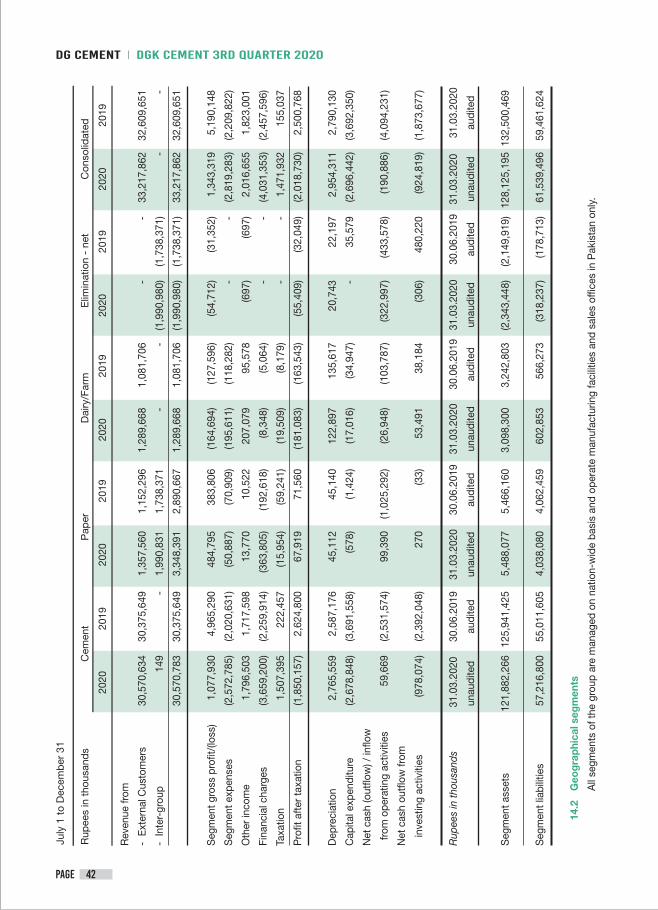
Rup
ees
in t
hous
and
s
July
1 t
o D
ecem
ber
31
Cem
ent
Pap
erD
airy
/Far
mE
limin
atio
n -
net
Con
solid
ated
Rev
enue
from
- E
xter
nal C
usto
mer
s 30
,570
,634
30
,375
,649
1,
357,
560
1,15
2,29
6 1,
289,
668
1,08
1,70
6 -
- 33
,217
,862
32
,609
,651
- In
ter-
grou
p
149
- 1,
990,
831
1,73
8,37
1 -
-
(1,9
90,9
80)
(1,7
38,3
71)
- -
30,5
70,7
83
30,3
75,6
49
3,34
8,39
1 2,
890,
667
1,28
9,66
8 1,
081,
706
(1,9
90,9
80)
(1,7
38,3
71)
33,2
17,8
62
32,6
09,6
51
Seg
men
t gro
ss p
rofit
/(los
s)
1,07
7,93
0 4,
965,
290
484,
795
383,
806
(164
,694
) (1
27,5
96)
(54,
712)
(3
1,35
2)
1,34
3,31
9 5,
190,
148
Seg
men
t exp
ense
s (2
,572
,785
) (2
,020
,631
) (5
0,88
7)
(70,
909)
(1
95,6
11)
(118
,282
) -
- (2
,819
,283
) (2
,209
,822
)
Oth
er in
com
e
1,79
6,50
3 1,
717,
598
13,7
70
10,5
22
207,
079
95,5
78
(697
) (6
97)
2,01
6,65
5 1,
823,
001
Fina
ncia
l cha
rges
(3
,659
,200
) (2
,259
,914
) (3
63,8
05)
(192
,618
) (8
,348
) (5
,064
) -
- (4
,031
,353
) (2
,457
,596
)
Taxa
tion
1,50
7,39
5 22
2,45
7 (1
5,95
4)
(59,
241)
(1
9,50
9)
(8,1
79)
- -
1,47
1,93
2 15
5,03
7
Pro
fit a
fter t
axat
ion
(1,8
50,1
57)
2,62
4,80
0 67
,919
71
,560
(1
81,0
83)
(163
,543
) (5
5,40
9)
(32,
049)
(2
,018
,730
) 2,
500,
768
Dep
reci
atio
n
2,76
5,55
9 2,
587,
176
45,1
12
45,1
40
122,
897
135,
617
20,7
43
22,1
97
2,95
4,31
1 2,
790,
130
Cap
ital e
xpen
ditu
re
(2,6
78,8
48)
(3,6
91,5
58)
(578
) (1
,424
) (1
7,01
6)
(34,
947)
-
35,5
79
(2,6
96,4
42)
(3,6
92,3
50)
Net
cas
h (o
utflo
w) /
inflo
w
fro
m o
pera
ting
activ
ities
59
,669
(2
,531
,574
) 99
,390
(1
,025
,292
) (2
6,94
8)
(103
,787
) (3
22,9
97)
(433
,578
) (1
90,8
86)
(4,0
94,2
31)
Net
cas
h ou
tflow
from
in
vest
ing
activ
ities
(9
78,0
74)
(2,3
92,0
48)
270
(33)
53
,491
38
,184
(3
06)
480,
220
(924
,819
) (1
,873
,677
)
Rup
ees
in th
ousa
nds
31.
03.2
020
30.0
6.20
19
31.0
3.20
20
30.0
6.20
19
31.0
3.20
20
30.0
6.20
19
31.0
3.20
20
30.0
6.20
19
31.0
3.20
20
31.0
3.20
20
unau
dite
d au
dite
d un
audi
ted
audi
ted
unau
dite
d au
dite
d un
audi
ted
audi
ted
unau
dite
d au
dite
d
Seg
men
t ass
ets
12
1,88
2,26
6 12
5,94
1,42
5 5,
488,
077
5,46
6,16
0 3,
098,
300
3,24
2,80
3 (2
,343
,448
) (2
,149
,919
) 12
8,12
5,19
5 13
2,50
0,46
9
Seg
men
t lia
bilit
ies
57,2
16,8
00
55,0
11,6
05
4,03
8,08
0 4,
062,
459
602,
853
566,
273
(318
,237
) (1
78,7
13)
61,5
39,4
96
59,4
61,6
24
14
.2
Geo
grap
hica
l seg
men
ts
All
segm
ents
of t
he g
roup
are
man
aged
on
natio
n-w
ide
basi
s an
d op
erat
e m
anuf
actu
ring
faci
litie
s an
d sa
les
offic
es in
Pak
ista
n on
ly.
2020
2019
2020
2019
2020
2019
2020
2019
2020
2019
DG Cement DGK Cement 3rd QUARTER 2020
PAGE 42
DirectorChief Executive Chief Financial Officer
15. Date of authorization
This interim financial information was authorized for issue by the Board of Directors of the Company on April 23, 2020.
16. Corresponding figures In order to comply with the requirements of the International Accounting Standard 34: 'Interim Financial
Reporting', the condensed interim consolidated balance sheet and condensed interim consolidated statement of changes in equity have been compared with the balances of annual audited financial statements of preceding year, whereas, the condensed interim consolidated profit and loss account, condensed interim consolidated statement of comprehensive income and condensed interim consolidated cash flow statement have been compared with the balances of comparable period of immediately preceding year.
DG CementDGK Cement 3rd QUARTER 2020
PAGE 43
DG Cement DGK Cement 3rd QUARTER 2020
PAGE 44
Notes

Nishat House, 53-A, Lawrence Road, Lahore-Pakistan.UAN:+92-42-111-11-33-33
D.G. KHAN CEMENT COMPANY LIMITED
VERSATILE
Ph
: +92
42
3712
192
0