dh 199 social media analytics
TRANSCRIPT

DH Capstone Social Media AnalyticsMarissa Clifford, Stephanie Wong, Swati Katta, Jonathan Solichin, Joanna Chen, Thanks to Professor Todd Presner, Professor Francis Steen, Yoh Kawano, and David Shepard

The Big Question Then
● Develop World Watcher: A Tool for Automatically Discovering and Recording Events as they are Represented in Social Media ○ Index Users○ Compare elite and social media
Adapting Our Methods and Goals
● Find reliable and sustainable method for identifying and monitoring Index Users
● Gathering data and trying new approaches● Trend toward visualization

The Big Question Now
● Agenda Setting● Primacy in the News● Analogical Reasoning● Explicit Causal Reasoning● Duration and Persistence● Sentiment Analysis
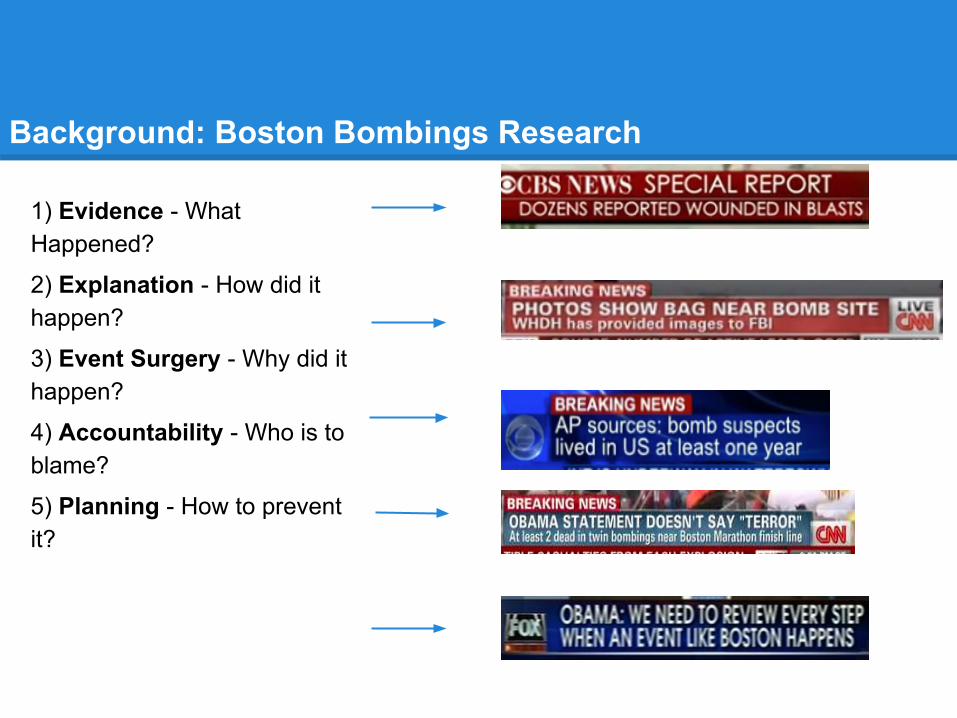
Background: Boston Bombings Research
1) Evidence - What Happened?
2) Explanation - How did it happen?
3) Event Surgery - Why did it happen?
4) Accountability - Who is to blame?
5) Planning - How to prevent it?

Towards a Sentimental Dictionary: Emotional Intensity
0 1 2 3
Highly Subjective Editorial
Completely Neutral Reportage
Just The Facts
• All CAPS• Expletives• !!-!!!

Data
● Twitter● Reddit
Twitter Data
● Twitter’s API was very useful in obtaining the data from the
live stream
● Initially, we decided to find some index users who we could
watch for tweets related to important events
● These index users were selected on the basis of several
parameters
Index Users
● Sample the live stream for tweets and get the twitter handles
of their authors
● Determine if the author has the following:
– High Klout score
● Score obtained from Klout API
– High number of followers
– Geographic location : United States

Twitter Timelines
We obtain the timelines of each of those index users and analyze
whether they are talking about important and interesting
events.

Main issue : SPAM!!!
Reddit Data
● Another source of news and information about
events
● More anonymous unlike twitter which is focused
on the user
● Could help in filtering tweets from twitter
● More organized

Using Reddit to filter Twitter
● Fetch Reddit headlines
–Reddit API is not useful
● Use selected keywords to filter live stream of
Learning Curve
● used D3 examples● replaced with our dataset● altered the json and html codes● created our own tutorial
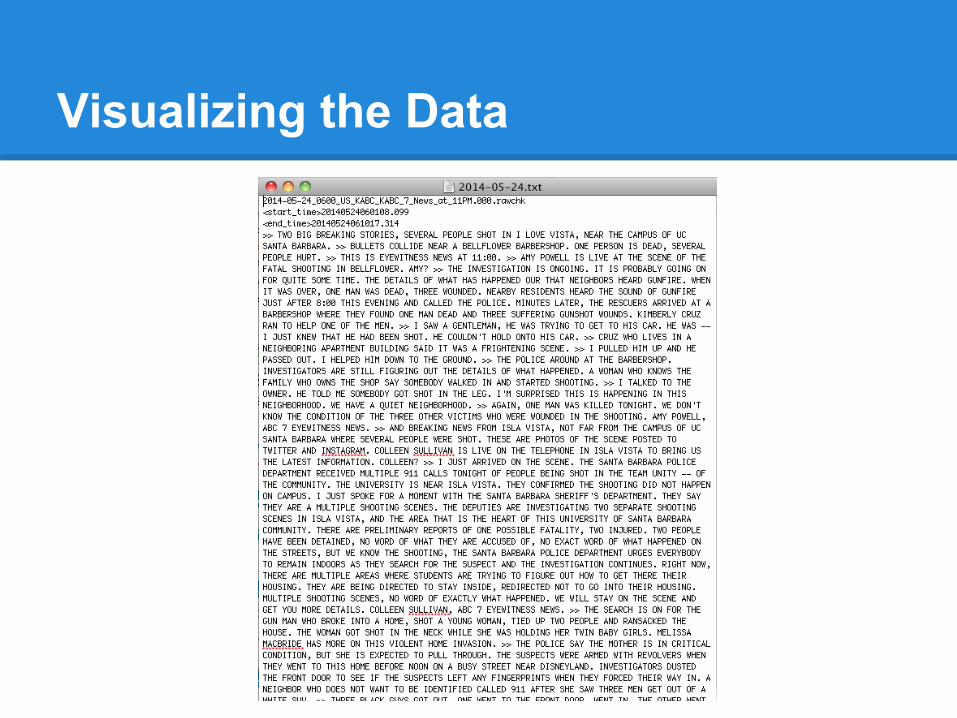
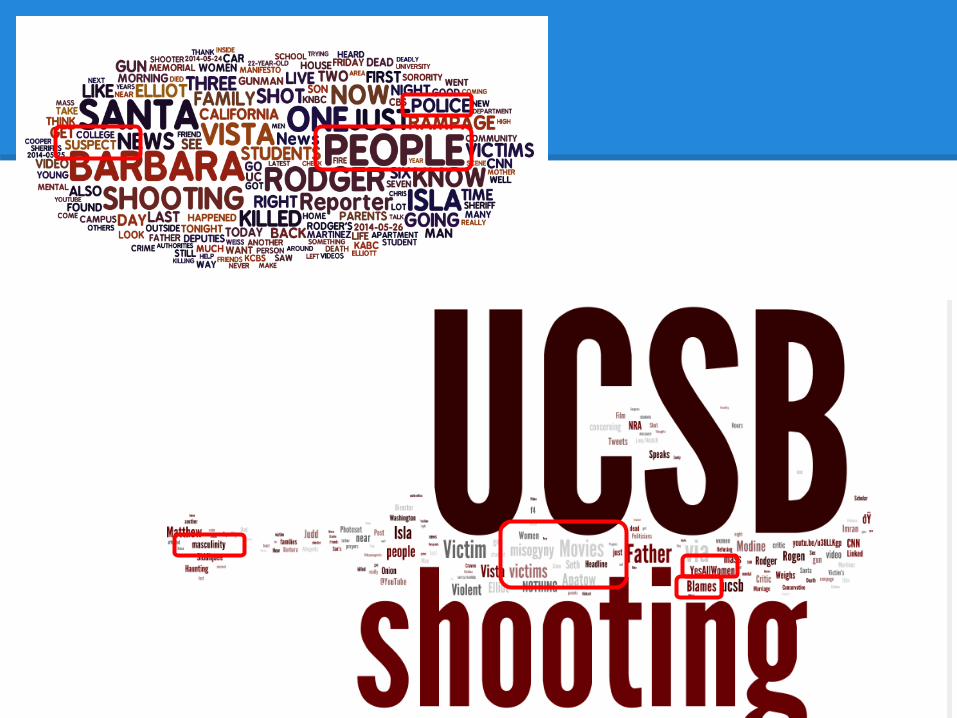
Visualizing the Data

Picking a visualization

Using Anvil

ONTOLOGIES

Visualizing the Ontology
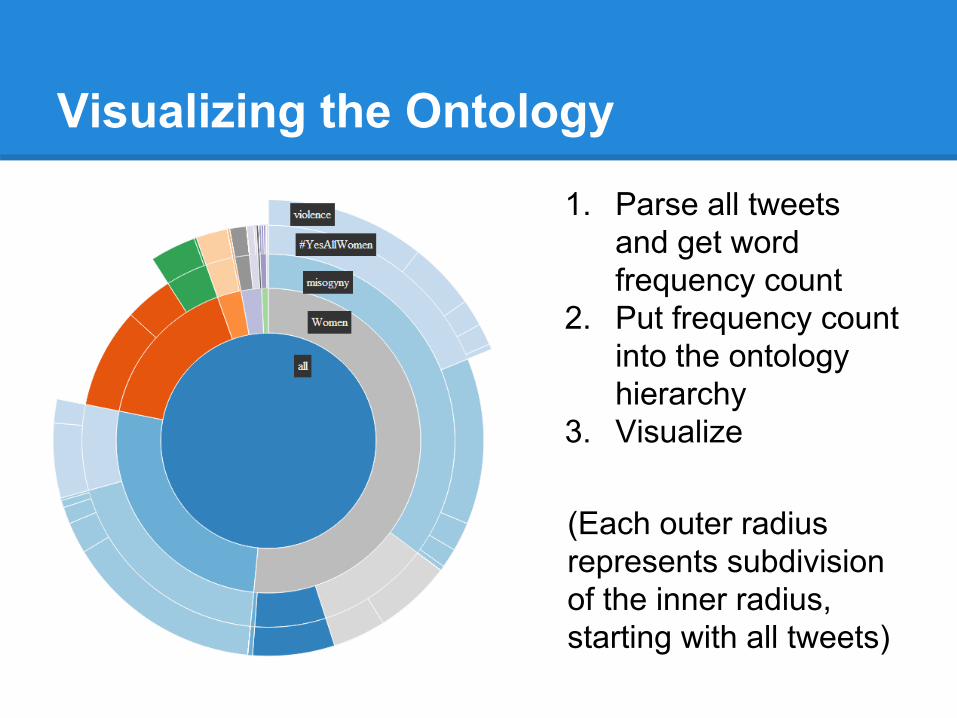
1. Parse all tweets and get word frequency count
2. Put frequency count into the ontology hierarchy
3. Visualize
(Each outer radius represents subdivision of the inner radius, starting with all tweets)

Visualizing the Ontology
eg.We can see that misogyny makes a lot on the topic of women, #yesallwomen makes up a lot on the topic of misogyny, and violences makes a lot on the topic of #yesallwomen.

Visualizing the Ontology
eg.We can see that killing makes a lot on the topic of shooting, rampage makes up a lot on the topic of misogyny.
and so forth...

Demo
http://sandbox.idre.ucla.edu/up206b/2014/dh199/jssolichin/sunburst3/

Issue with this viz
● Tweets are combined into one document, and thus the graph does not represent # of tweets, but the number of mentions ofthe topic.
Visualizing the Ontology Over Time
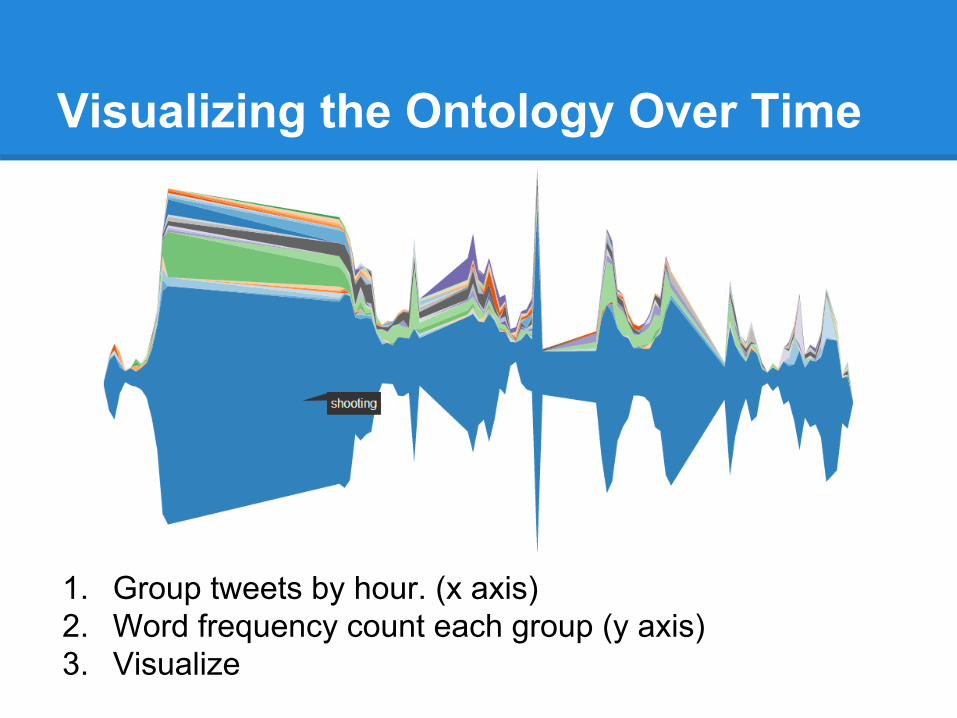
1. Group tweets by hour. (x axis)2. Word frequency count each group (y axis)3. Visualize

Visualizing the Ontology Over Time
Mentions on shooting makes up the bulk of Tweet.

Visualizing the Ontology Over Time
We can see topic enter and leave.eg. Rampage starts early but tapers off.

Visualizing the Ontology Over Time
Sex enters somewhere in the middle and surges briefly before diminishing.

Visualizing the Ontology Over Time
Sorority comes close to the end of the data briefly, but strongly

Demo
● http://sandbox.idre.ucla.edu/up206b/2014/dh199/jssolichin/steamgraph/

Visualizing the Ontology Over Time
● Conversation changes over time● Start from fundamental facts to exploring
cause/social constructs?
Future:● Overlay elite media publishing to see how
they affect conversation.● Overlay time to see why there is period of up
and down.

Moving Forward
● Characterize and visualize the recursive relationship between media
● Build a Foundation○ Event Modeling○ Use Existing Data
Future Goals To explore and answer the questions and relationships between new cycles on social media vs broadcast media through data collection and information visualization. How do news stories develop differently in social media vs broadcast media?-in terms of timeline, what topics are covered, and references that are made
FUTURE GOALS

Final Presentation saved at:http://prezi.com/kluuirlfzfol/dh-capstone-social-media-analytics/