dhs comparative reports no. 14 - measure dhs - quality information
TRANSCRIPT


The MEASURE DHS project assists countries worldwide in the collection and use of data to monitor and evaluate population, health, nutrition, and HIV/AIDS programs. Funded by the United States Agency for International Development (USAID) under Contract No. GPO-C-00-03-00002-00, MEASURE DHS is implemented by Macro International Inc. in Calverton, Maryland.
The main objectives of the MEASURE DHS project are:
• To provide decisionmakers in survey countries with information useful for informed policy choices;
• To expand the international population and health database; • To advance survey methodology; and • To develop in participating countries the skills and resources necessary to conduct high-
quality demographic and health surveys.
Additional information about the MEASURE DHS project is available on the Internet at http://www.measuredhs.com or by contacting Macro International Inc., MEASURE DHS, 11785 Beltsville Drive, Suite 300, Calverton, MD 20705 USA; Telephone: 301-572-0200, Fax: 301-572-0999, E-mail: [email protected].

DHS Comparative Reports No. 14
New Estimates of Unmet Need and the Demand for Family Planning
Charles F. Westoff Office of Population Research
Princeton University
Macro International Inc. Calverton, Maryland USA
December 2006
The author’s views expressed in this publication do not necessarily reflect the views of the United States Agency for International Development or the United States Government.

This publication was made possible through support provided by the United States Agency for International Development under Contract No. GPO-C-00-03-00002-00.
Recommended citation:
Westoff, Charles F. 2006. New Estimates of Unmet Need and the Demand for Family Planning. DHS Comparative Reports No. 14. Calverton, Maryland, USA. Macro International Inc.


iii
Contents
Preface ................................................................................................................................ v
Acknowledgments.............................................................................................................vii
Executive Summary ........................................................................................................... ix
1 Introduction............................................................................................................ 1
1.1 The Concept and Measurement of Unmet Need....................................... 1
2 Estimates of Unmet Need for Any Method and the Demand for Family Planning .................................................................................................... 3
3 Urban-Rural and Wealth Differentials ................................................................... 6
4 Unmet Need and the Demand for Modern Methods............................................ 19
5 Trends in Unmet Need ......................................................................................... 20
5.1 Trends in Unmet Need by Level of Education ....................................... 25
6 Past and Future Use among Women in Need ...................................................... 37
6.1 Trends among Never Users Who Do Not Intend to Use......................... 39
7 Unmet Need among Unmarried Women ............................................................. 44
8 Fertility Implications of Reducing Unmet Need.................................................. 48
9 Conclusions.......................................................................................................... 51
References......................................................................................................................... 53
Appendix A....................................................................................................................... 55


v
Preface
One of the most significant contributions of the MEASURE DHS program is the creation of an internationally comparable body of data on the demographic and health characteristics of populations in developing countries. The DHS Comparative Reports series examines these data across countries in a comparative framework. The DHS Analytical Studies series focuses on specific topics. The principal ob-jectives of both series are to provide information for policy formulation at the international level and to examine individual country results in an international context. Whereas Comparative Reports are primar-ily descriptive, Analytical Studies have a more analytical approach.
The Comparative Reports series covers a variable number of countries, depending on the avail-ability of data sets. Where possible, data from previous DHS surveys are used to evaluate trends over time. Each report provides detailed tables and graphs organized by region. Survey-related issues such as questionnaire comparability, survey procedures, data quality, and methodological approaches are ad-dressed as needed.
The topics covered in Comparative Reports are selected by MEASURE DHS staff in conjunc-tion with the U.S. Agency for International Development. Some reports are updates of previously published reports.
It is anticipated that the availability of comparable information for a large number of developing countries will enhance the understanding of important issues in the fields of international population and health by analysts and policymakers.
Martin Vaessen Project Director


vii
Acknowledgments
The author would like to thank Judie Miller of the Office of Population Research, Princeton University, for secretarial help and for the graphic work, and Albert Themme and Shea Rutstein of Macro International Inc. for help in several tabulations and for ideas for further analyses. Special thanks are due to Luis Ochoa at Macro International Inc. for his invaluable, detailed review of the manuscript, and to Melissa McCormick for her careful editing and corrections.

ix
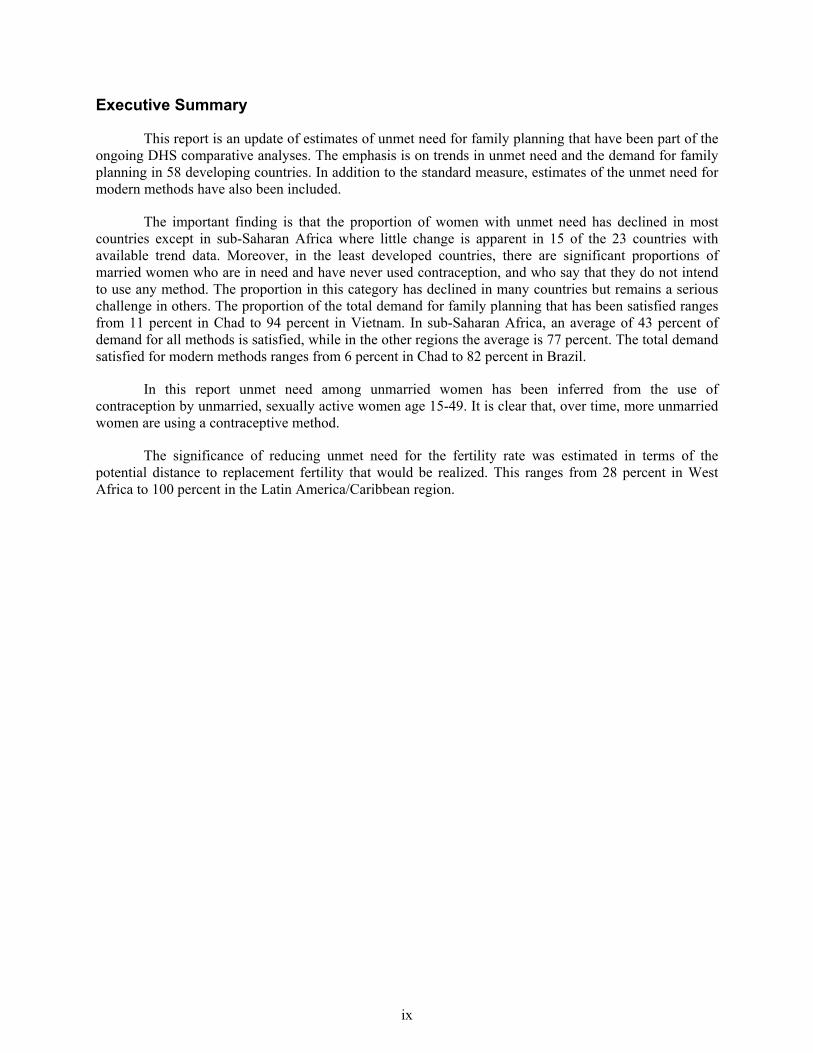
Executive Summary
This report is an update of estimates of unmet need for family planning that have been part of the ongoing DHS comparative analyses. The emphasis is on trends in unmet need and the demand for family planning in 58 developing countries. In addition to the standard measure, estimates of the unmet need for modern methods have also been included.
The important finding is that the proportion of women with unmet need has declined in most countries except in sub-Saharan Africa where little change is apparent in 15 of the 23 countries with available trend data. Moreover, in the least developed countries, there are significant proportions of married women who are in need and have never used contraception, and who say that they do not intend to use any method. The proportion in this category has declined in many countries but remains a serious challenge in others. The proportion of the total demand for family planning that has been satisfied ranges from 11 percent in Chad to 94 percent in Vietnam. In sub-Saharan Africa, an average of 43 percent of demand for all methods is satisfied, while in the other regions the average is 77 percent. The total demand satisfied for modern methods ranges from 6 percent in Chad to 82 percent in Brazil.
In this report unmet need among unmarried women has been inferred from the use of contraception by unmarried, sexually active women age 15-49. It is clear that, over time, more unmarried women are using a contraceptive method.
The significance of reducing unmet need for the fertility rate was estimated in terms of the potential distance to replacement fertility that would be realized. This ranges from 28 percent in West Africa to 100 percent in the Latin America/Caribbean region.

1
1 Introduction
This is the fourth review of unmet need and the demand for family planning in the developing countries included in the Demographic and Health Surveys (DHS) program. In the first publication in 1991 (Westoff and Ochoa, 1991), the concept and the measure were refined and applied to 25 countries surveyed between 1985 and 1989. In the subsequent reviews (Westoff and Bankole, 1995; Westoff, 2001), additional countries were added and time trends for countries with repeat surveys were analyzed. The coverage in the present report now extends to 58 countries in which surveys have been conducted since 1995, with a significant increase in repeat surveys that has enabled trend analyses.
1.1 The Concept and Measurement of Unmet Need
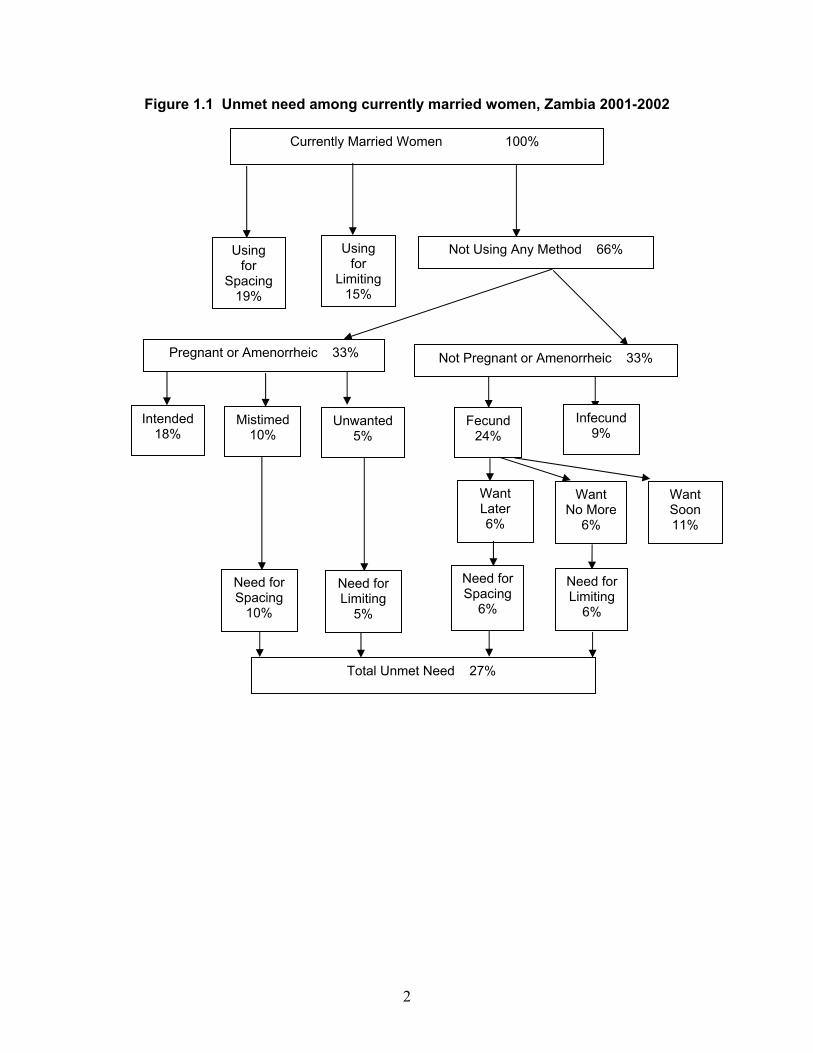
The concept of unmet need was developed more than 25 years ago (Westoff, 1978) and has been refined several times over the years (Westoff and Pebley, 1981; Westoff, 1988; Westoff and Ochoa, 1991). The basic objective is to estimate the proportion of women not using contraception who either want to cease further childbearing (unmet need for limiting) or who want to postpone the next birth at least two more years (unmet need for spacing). These estimates, along with the proportion currently using contraception, are intended to measure the total demand for family planning. Its usefulness lies in identifying groups of women who might be receptive to program efforts and in evaluating the effectiveness of these efforts. Another purpose is to assess the potential impact on the level of fertility, because there is a strong association between contraceptive prevalence and fertility.
While there have been many suggestions over the years to refine or expand the measure of unmet need—for example, to include husbands or to include abortion—the measure used in this report is essentially the same as the one that has been used in all of the DHS reports. This measure is based on currently married women only, though a separate measure is used in this report to gauge the needs of unmarried women. The measure focuses on the use of all methods of contraception, but there is an additional measure in this report that estimates the unmet need for modern methods only, an addition that is particularly relevant for family planning program interests.
Figure 1.1 shows the measurement procedure illustrated with data from the 2001-2002 survey in Zambia. Currently married Zambian women are first divided into those using (34 percent) and those not using a method (66 percent). The nonusers are then divided into currently pregnant or amenorrheic women (33 percent) and nonusers who are in neither category (also 33 percent). The pregnant or amenorrheic women are then classified by whether the pregnancy or birth is reported as having been intended at that time (18 percent), mistimed (10 percent), or not wanted at any time (5 percent). Those in the mistimed or unwanted category are regarded as one component of total unmet need. The other component consists of nonusers who are not pregnant or amenorrheic. These women are first divided into fecund (24 percent) or infecund women (9 percent), with the fecund women then subdivided by their reproductive preferences. Those who want another child soon (11 percent) are excluded from the unmet need estimate, while women who want to wait (6 percent) or who want no more children (6 percent) are classified in the unmet need category. These 12 percent are then combined with the 15 percent for the pregnant or amenorrheic women in need, for an estimate of 27 percent in the total unmet need category.

2
Figure 1.1 Unmet need among currently married women, Zambia 2001-2002
Currently Married Women 100%
Using for
Limiting15%
Not Using Any Method 66% Using for
Spacing 19%
Intended18%
Need for Spacing
10%
Need for Limiting
5%
Need for Spacing
6%
Need for Limiting
6%
Total Unmet Need 27%
Pregnant or Amenorrheic 33% Not Pregnant or Amenorrheic 33%
Mistimed10%
Unwanted5%
Fecund24%
Infecund 9%
WantLater6%
WantNo More
6%
WantSoon11%

3
2 Estimates of Unmet Need for Any Method and the Demand for Family Planning
Estimates of unmet need, contraceptive use, the demand for family planning, and the percentage of total demand satisfied are shown in Table 2.1 for the most recent completed surveys. Table 2.1 also shows unmet need and total demand satisfied by modern methods (described in Section 4).
Table 2.1 Demand for family planning and its components for currently married women from the most recent surveys
Unmet need Current use
Country
Yearof
survey Total(1)
Spacing(2)
Limiting(3)
Total(4)
Spacing(5)
Limiting(6)
Totaldemand1
(7)
Percentageof total demandsatisfied
(8)
Unmet need
modernmethods
(9)
Using modernmethods
(10)
Percentageof total demand
satisfied by modernmethods
(11)
ASIA Bangladesh 2004 11.3 5.1 6.3 58.1 16.2 41.8 71.4 84.1 22.1 47.3 66.3 Cambodia 2000 29.7 14.4 15.2 23.8 9.4 14.4 56.4 44.5 34.7 18.8 35.1 India 1998-99 15.8 8.3 7.5 48.2 3.5 44.7 64.0 75.3 21.2 42.8 66.9 Indonesia 2002-03 8.6 4.0 4.6 60.3 24.2 36.2 69.7 87.6 12.2 56.7 81.4 Kazakhstan 1999 8.7 3.6 5.1 66.1 23.0 43.0 75.2 88.5 22.1 52.7 70.7 Kyrgyz Republic 1997 11.6 4.5 7.2 59.5 26.3 33.3 71.2 83.6 22.3 48.9 68.7 Moldova 2005 6.7 2.5 4.2 67.8 19.3 48.5 75.2 91.1 30.6 43.8 58.2 Nepal 2001 27.8 11.4 16.4 39.3 3.8 35.5 67.1 58.6 31.7 35.4 52.7 Pakistan2 2003 32.7 11.2 21.5 32.1 na na 64.8 49.5 39.6 25.2 38.9 Philippines 2003 17.3 7.9 9.4 48.9 13.7 35.2 68.5 74.7 32.8 33.4 48.8 Turkmenistan 2000 10.1 5.2 4.9 61.8 22.0 39.8 72.2 86.0 18.9 53.1 73.6 Uzbekistan 1996 13.7 6.6 7.0 55.6 20.2 35.4 69.3 80.3 17.9 51.3 74.1 Vietnam 2002 4.8 2.0 2.8 78.5 13.9 64.6 84.3 94.3 26.7 56.7 67.3
NEAR EAST/ NORTH AFRICA
Armenia 2000 11.3 2.1 9.3 60.5 11.8 48.7 73.6 84.5 50.1 22.3 30.3 Egypt 2005 10.3 3.6 6.7 59.2 12.4 46.8 70.4 85.4 13.0 56.5 80.2 Jordan 2002 11.0 5.6 5.5 55.8 25.5 30.3 69.7 84.2 25.6 41.2 59.1 Morocco 2003-04 10.0 3.5 6.6 63.0 22.3 40.6 75.0 86.6 18.2 54.8 73.1 Turkey 2003 6.0 2.3 3.7 71.0 15.8 55.2 77.0 90.6 34.5 42.5 54.2 Yemen 1997 38.6 17.2 21.4 20.8 7.2 13.6 59.4 35.0 49.6 9.8 16.5
LATIN AMERICA/ CARIBBEAN
Bolivia 2003 22.7 6.1 16.6 58.4 15.8 42.5 81.0 72.0 46.1 34.9 43.1 Brazil 1996 7.3 2.6 4.7 76.7 14.0 62.8 85.8 91.5 13.8 70.3 81.9 Colombia 2005 5.8 2.5 3.3 78.2 16.9 61.3 86.2 93.3 15.8 68.2 79.1 Dominican Republic 2002 10.9 6.7 4.2 69.8 14.8 54.9 82.0 86.8 14.8 65.8 80.2 Guatemala 1998-99 23.1 11.8 11.3 38.2 8.5 29.7 62.2 62.9 30.4 30.9 49.7 Haiti 2000 39.8 16.0 23.8 28.1 9.8 18.3 67.7 41.4 44.9 22.8 33.7 Nicaragua 2001 14.6 5.9 8.7 68.6 20.5 48.1 83.2 82.5 17.1 66.1 79.5 Peru 2004 8.8 3.0 5.8 70.5 21.7 48.8 82.4 89.4 30.8 46.7 56.7 Continued...

4
Table 2.1—Continued
Unmet need Current use
Country
Yearof
survey Total(1)
Spacing(2)
Limiting(3)
Total(4)
Spacing(5)
Limiting(6)
Totaldemand1
(7)
Percentageof total demandsatisfied
(8)
Unmet need
modernmethods
(9)
Using modernmethods
(10)
Percentageof total demand
satisfied by modernmethods
(11)
WEST AFRICA Benin 2001 27.2 17.5 9.7 18.6 12.0 6.6 45.8 40.6 38.6 7.2 15.7 Burkina Faso 2003 28.8 21.8 7.0 13.8 9.9 3.9 42.6 32.3 33.9 8.8 20.6 Cameroon 2004 20.2 14.2 6.0 26.0 17.7 8.3 46.2 56.2 33.1 13.0 28.3 Central African Republic 1994-95 16.2 11.6 4.6 14.8 11.9 2.9 31.0 47.7 27.7 3.2 10.3 Chad 2004 23.3 19.2 4.1 2.8 2.2 0.6 26.1 10.6 24.3 1.6 6.1 Congo 2005 16.2 13.0 3.2 44.3 35.2 9.1 60.4 73.3 47.8 12.7 21.0 Côte d'Ivoire 1998-99 27.7 20.0 7.6 15.0 10.0 5.0 42.7 35.2 35.4 7.3 17.0 Gabon 2000 28.0 19.9 8.0 32.7 24.0 8.7 60.7 53.9 47.3 13.4 22.1 Ghana 2003 34.0 21.7 12.3 25.2 13.7 11.4 59.2 42.5 40.5 18.7 31.6 Guinea 2005 21.2 13.1 8.1 9.1 5.9 3.2 30.3 30.0 24.6 5.7 18.8 Mali 2001 28.5 20.9 7.6 8.1 5.1 3.0 36.6 22.1 29.6 7.0 19.1 Mauritania 2000-01 31.6 22.9 8.6 8.0 5.1 2.9 39.5 20.2 34.4 5.1 13.0 Niger 1998 16.6 14.0 2.7 8.2 6.9 1.3 24.9 33.0 20.3 4.6 18.5 Nigeria 2003 16.9 11.8 5.1 12.6 7.8 4.8 29.5 42.7 21.2 8.2 27.8 Senegal 2004-05 31.6 24.2 7.3 11.8 7.3 4.5 43.4 27.2 33.1 10.3 23.7 Togo 1998 32.3 21.4 10.9 23.5 14.6 8.9 55.8 42.1 48.8 7.0 12.5
EAST ANDSOUTHERN AFRICA
Comoros 1996 34.6 21.8 12.9 21.0 11.8 9.2 55.6 37.7 44.2 11.4 20.5 Eritrea 2002 27.0 21.0 6.0 8.0 5.0 3.0 35.1 22.9 27.8 7.3 20.7 Ethiopia 2005 33.8 20.1 13.7 14.7 6.7 8.4 48.7 30.7 34.6 13.9 28.5 Kenya 2003 24.5 14.4 10.1 39.3 14.3 25.0 65.8 62.8 32.3 31.5 47.9 Lesotho 2004-05 30.9 10.9 20.0 37.3 13.8 23.5 68.2 54.7 33.0 35.2 51.6 Madagascar 2003-04 23.6 11.3 12.3 27.1 12.3 14.9 50.8 53.4 32.4 18.3 36.0 Malawi 2004 27.6 17.2 10.4 32.5 15.5 17.0 61.7 55.2 31.9 28.1 45.5 Mozambique 2003 18.4 10.8 7.5 16.5 9.0 7.4 34.8 47.2 23.1 11.7 33.6 Namibia 2000 22.1 9.3 12.8 43.7 13.1 30.7 65.9 66.4 23.3 42.6 64.7 Rwanda 2005 37.9 24.5 13.4 17.4 7.4 9.9 55.3 31.4 45.0 10.3 18.6 South Africa 1998 15.0 4.7 10.3 56.3 14.4 41.8 71.2 79.0 16.1 55.1 77.4 Tanzania 2004-05 21.8 15.1 6.7 26.4 15.5 10.9 49.5 55.9 28.2 20.0 40.4 Uganda 2000-01 34.6 20.7 13.9 22.8 11.2 11.6 57.3 39.7 39.1 18.2 31.7 Zambia 2001-02 27.4 16.8 10.6 34.2 19.2 15.0 61.6 55.5 36.3 25.3 41.1 Zimbabwe 1999 12.9 7.3 5.6 53.5 29.4 24.1 68.2 81.0 16.1 50.4 73.9
1 “Total demand” also includes pregnant or amenorrheic women who became pregnant while using a method. In most of the sub-Saharan countries, this information was not collected. 2 Based on estimates from the National Institute for Population Studies (2003). na = not available

5
Asia
The highest estimates of unmet need in Asia are for Pakistan (33 percent), Cambodia (30 percent), and Nepal (28 percent), while the lowest values are for Vietnam (5 percent) and Moldova (7 percent). The spacing and limiting components of unmet need are fairly evenly divided except in Pakistan where the emphasis is on limiting. In contrast, the actual use of contraception is concentrated among limiters in these Asian countries. The percentage of total demand satisfied is highest in Vietnam (94 percent) and now averages around 85 percent in half of these countries.
Near East/North Africa
In five of the six countries in the Near East/North Africa, the levels of unmet need and of contraceptive prevalence are very similar to those in the Asian countries with the exception of Yemen. Unmet need is 6 to 11 percent in the five countries, and contraceptive prevalence ranges from 56 to 71 percent. Yemen, on the other hand, shows an unmet need of 39 percent and a prevalence of 21 percent (the survey was in 1997). As in the Asian countries, the use of contraception for limiting births is greater than for spacing purposes. Total demand for family planning ranges between 70 and 77 percent; Yemen is at the extreme with 59 percent. The percentage of total demand satisfied ranges from 84 to 91 percent, except in Yemen where it was estimated at 35 percent of women using for spacing births.
Latin America/Caribbean
There are essentially two sub-groups of countries in the Latin America/Caribbean region. Low levels of unmet need and high contraceptive prevalence are evident in Brazil, Colombia, the Dominican Republic, and Peru, with the demand satisfied over 80 percent. At the opposite extreme are Bolivia, Guatemala, and Haiti with the highest estimates of unmet need, reaching 40 percent in Haiti. Nicaragua shows levels in between the lowest and highest levels. The use of contraception to limit rather than to space childbearing is the mode in this region of the world. The overall demand for family planning averages 79 percent, the highest of any region.
Sub-Saharan Africa
There is about the same number of countries in West Africa (16) and in East and Southern Africa (15) represented in this report. In West Africa, unmet need ranges from 16 to 34 percent. A similar range is evident in East and Southern Africa (13 to 38 percent). Contraceptive prevalence is somewhat lower in West Africa, as is the overall demand for family planning and the percentage of demand satisfied. Total demand in West Africa averages 42 percent compared with 57 percent in East and Southern Africa.
Unlike other regions of the world, the unmet need for spacing births, as well as the use of contraception for this purpose, is the main pattern in sub-Saharan Africa. The primary exceptions are South Africa, Namibia, Malawi, Lesotho, and Kenya, where smaller family norms are more developed. All of the countries in West Africa show a greater use as well as unmet need for spacing rather than for the limiting of births. As noted in the last DHS publication on the subject (Westoff, 2001), the main fertility regulation behavior in sub-Saharan Africa is birth spacing rather than limiting, in sharp contrast to other regions of the world. This is probably the result of the emphasis on health rationales for family planning in sub-Saharan Africa as well as the much earlier emergence of a small family norm in other regions. An extreme example is in the Congo, where the total demand satisfied is 73 percent as a consequence of the high proportion (35 percent) of women using spacing.
In West Africa, the total demand satisfied exceeds 50 percent in only three of the 16 countries (Cameroon, Congo, and Gabon), compared with nine of the 15 countries in East and Southern Africa.

6
3 Urban-Rural and Wealth Differentials
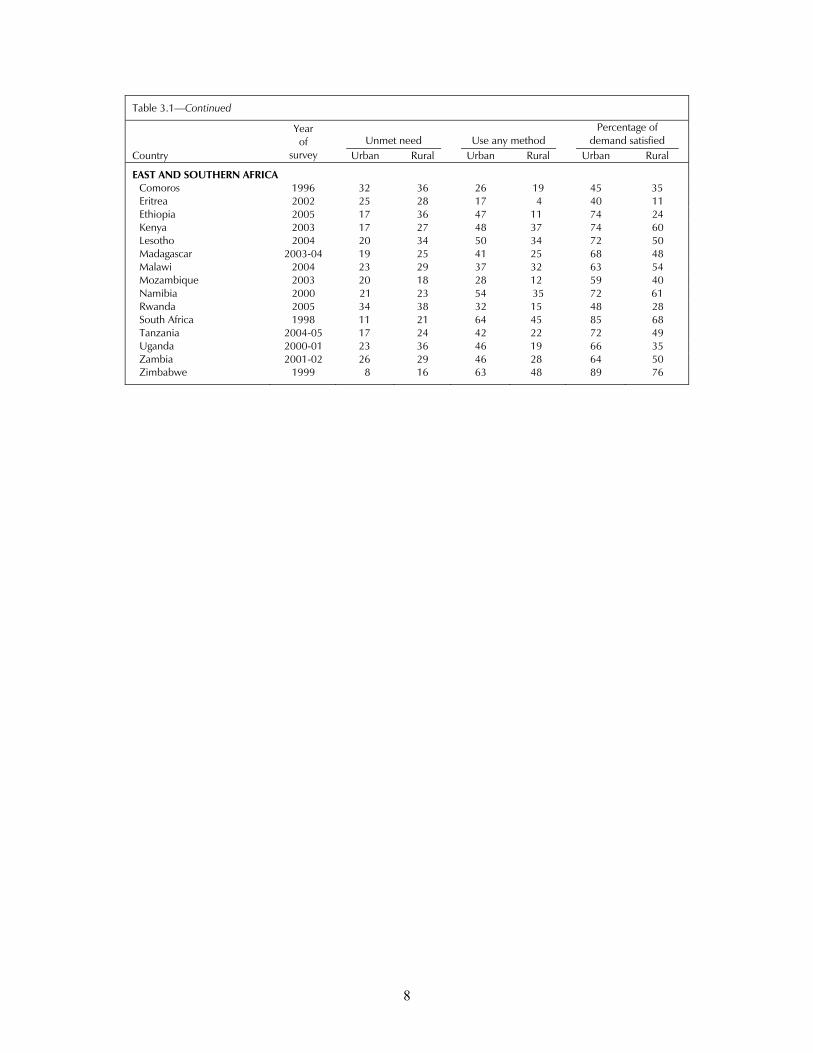
Urban-Rural
There is no instance in countries outside of sub-Saharan Africa in which unmet need for family planning in urban areas exceeds that in rural areas (Table 3.1) except for Moldova where the proportion is slightly higher in urban than in rural areas. Within sub-Saharan Africa, however, unmet need in the cities exceeds the estimates for rural areas in nine of the 31 countries. Most of these nine countries are the least developed, with the latest survey at least five years in the past.
On the other hand, the higher proportion of (married) women in the cities currently using contraception is virtually universal (Armenia1 and Moldova are the only exceptions among the 57 countries). The proportion using a method is particularly high in Brazil, Colombia, and Vietnam (all at 79 percent). At the opposite extreme is Chad at 10 percent in urban areas and 1 percent in rural areas.
The implication of these comparisons, with few exceptions, is that the percentage of total demand for contraception that is satisfied is greater—or at least as high—in urban than in rural communities. The highest satisfied demand in cities is in Vietnam (96 percent); the lowest is in rural areas of Chad (5 percent) and Mauritania (8 percent).
The explanation of these urban-rural differences no doubt includes the easier accessibility of family planning services in cities, the desire for more children in rural places, and the greater education in urban areas. The association of education with unmet need is covered in a later assessment of trends in unmet need by level of schooling.
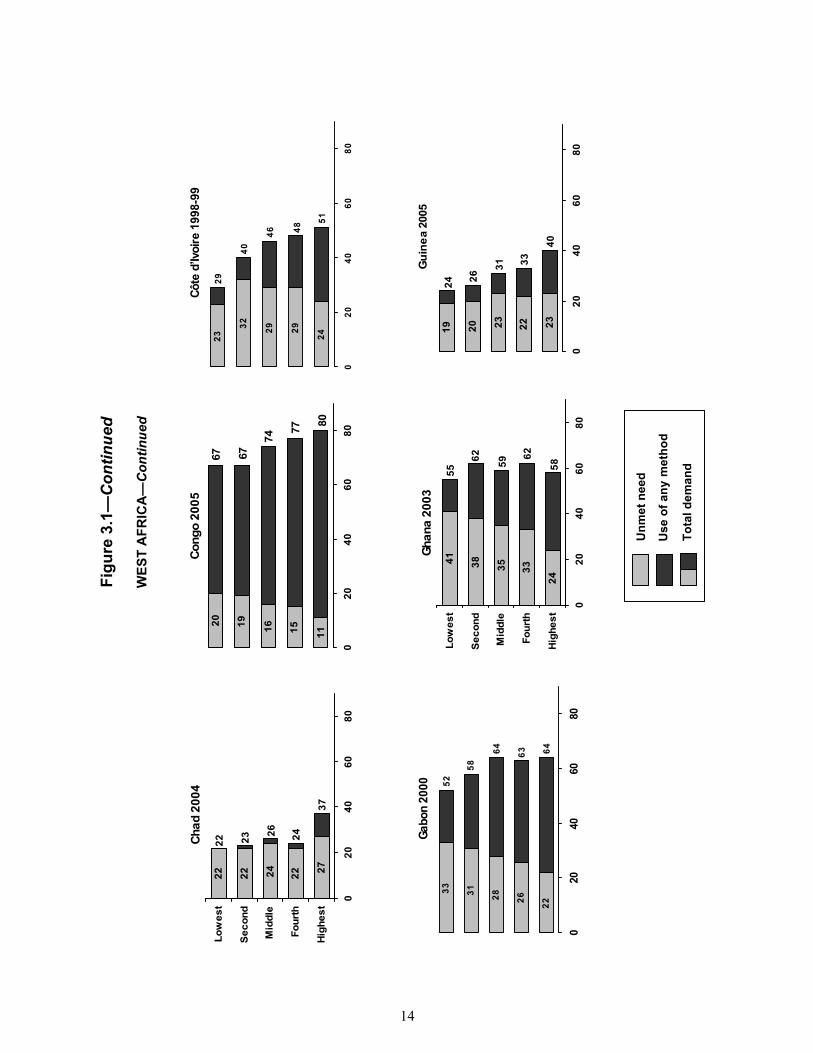
Wealth
The association of the wealth index with unmet need and the total demand for family planning is shown in Figure 3.1. The DHS wealth index typically includes such components as the type of flooring, water supply, sanitation facilities, electricity, radio, television, telephone, refrigerator, type of vehicle, persons per sleeping room, ownership of agricultural land, having a domestic servant, and various other country-specific items (Rutstein and Johnson, 2004).
Unmet need is inversely related to wealth in most of the countries. The exceptions are in some of the least developed African (mostly West African) nations. Total demand for family planning, on the other hand, either increases with wealth or shows no association. The shape of that relationship is determined by the typically offsetting balance of unmet need and contraceptive prevalence. The strongest positive associations between total demand and wealth are in the less developed countries, e.g., Yemen, Guatemala, Benin, Cameroon, Madagascar, and Uganda.
1 The 2005 Preliminary Report for Armenia now shows a higher proportion of women currently using contraception in the cities.
7
Table 3.1 Percentage of currently married women with unmet need, currently using any method, and extent that total demand is satisfied, by urban and rural residence
Unmet need Use any method Percentage of
demand satisfied Country
Yearof
survey Urban Rural Urban Rural Urban Rural
ASIA Bangladesh 2004 9 12 63 57 87 83 Cambodia 2000 25 31 33 22 57 42 India 1998-99 13 17 58 45 81 73 Indonesia 2002-03 9 9 61 60 88 88 Kazakhstan 1999 8 10 67 65 90 87 Kyrgyz Republic 1997 11 12 66 57 86 82 Moldova 2005 7 6 67 68 91 92 Nepal 2001 16 29 62 37 80 56 Philippines 2003 15 20 50 47 77 72 Turkmenistan 2000 9 11 62 61 87 85 Uzbekistan 1996 13 14 56 55 81 80 Vietnam 2002 4 5 79 78 96 94
NEAR EAST/NORTH AFRICA Armenia 2003 12 12 59 63 84 84 Egypt 2005 9 12 50 45 88 83 Jordan 2002 10 15 57 51 86 78 Morocco 2003-04 10 11 66 60 88 85 Turkey 2003 5 9 72 61 94 88 Yemen 1997 33 40 36 16 52 28
LATIN AMERICA/CARIBBEAN Bolivia 2003 18 30 64 48 78 61 Brazil 1996 6 13 79 69 93 85 Colombia 2005 5 8 79 77 94 91 Dominican Republic 2002 11 11 70 70 87 87 Guatemala 1998-99 18 27 52 28 75 51 Haiti 2000 38 40 30 27 44 40 Nicaragua 2001 12 19 73 62 86 77 Peru 2004 7 12 75 63 92 85
WEST AFRICA Benin 2001 30 26 21 17 41 40 Burkina Faso 2003 23 30 34 10 60 25 Cameroon 2004 20 21 36 16 65 44 Central African Republic 1994-95 22 13 19 12 47 49 Chad 2004 27 23 10 1 27 5 Congo 2005 15 17 47 41 75 71 Côte d’Ivoire 1998-99 26 28 24 10 48 27 Gabon 2000 27 30 37 21 57 41 Ghana 2003 28 38 31 21 53 36 Guinea 2005 22 21 15 7 40 25 Mali 2001 31 28 18 5 36 15 Mauritania 2000-01 35 29 16 3 31 8 Niger 1998 21 16 23 6 52 26 Nigeria 2003 17 17 20 9 54 36 Senegal 2004-05 32 31 20 6 39 16 Togo 1998 28 34 27 22 49 39
Continued...

8
Table 3.1—Continued
Unmet need Use any method Percentage of
demand satisfied Country
Yearof
survey Urban Rural Urban Rural Urban Rural
EAST AND SOUTHERN AFRICA Comoros 1996 32 36 26 19 45 35 Eritrea 2002 25 28 17 4 40 11 Ethiopia 2005 17 36 47 11 74 24 Kenya 2003 17 27 48 37 74 60 Lesotho 2004 20 34 50 34 72 50 Madagascar 2003-04 19 25 41 25 68 48 Malawi 2004 23 29 37 32 63 54 Mozambique 2003 20 18 28 12 59 40 Namibia 2000 21 23 54 35 72 61 Rwanda 2005 34 38 32 15 48 28 South Africa 1998 11 21 64 45 85 68 Tanzania 2004-05 17 24 42 22 72 49 Uganda 2000-01 23 36 46 19 66 35 Zambia 2001-02 26 29 46 28 64 50 Zimbabwe 1999 8 16 63 48 89 76

Figu
re 3
.1 U
nmet
nee
d an
d to
tal d
eman
d fo
r fam
ily p
lann
ing
by w
ealth
qui
ntile
A
SIA
9
Unm
et n
eed
Use
of a
ny m
etho
d
Tota
l dem
and
Bang
lade
sh 2
004
911121213
7372727169
020
4060
80
Hig
hest
Four
th
Mid
dle
Sec
ond
Low
est
Cam
bodi
a 20
00
22
313236
4253 51 53 53
57
020
4060
80
Indi
a 19
98-9
9
121415182054
57
64
69
75
020
4060
80
Indo
nesi
a 20
02-0
3
977911
70
73
706967
020
4060
80
Hig
hest
Fo
urth
Mid
dle
Sec
ond
Low
est
Kaza
khst
an 1
999
688111276 74 73
78
75
020
4060
80
Kyrg
yz R
epub
lic 1
997
121110121469
66 68
74
78
020
4060
80

Figu
re 3
.1—
Con
tinue
dA
SIA
—C
ontin
ued
10
Unm
et n
eed
Use
of a
ny m
etho
d
Tota
l dem
and
Nepa
l 200
1
17
26313134
78
6866
6361
020
4060
80
Hig
hest
Four
th
Mid
dle
Sec
ond
Low
est
Phili
ppin
es 2
003
12131520
2767
71 70 70
65
020
4060
80
Turk
men
ista
n 20
00
811111011
70
75
70
7373
020
4060
80
Uzbe
kist
an 1
996
11141215 17
68
72 70
65
71
020
4060
80
Hig
hest
Four
th
Mid
dle
Sec
ond
Low
est
Viet
nam
200
2
3456883 84 88 86
81
020
4060
80

Figu
re 3
.1—
Con
tinue
d
NEA
R E
AST
/NO
RTH
AFR
ICA
11
Unm
et n
eed
Use
of a
nym
etho
d
Tota
l dem
and
Arm
enia
200
0
1213111212
7169
73
7877
020
4060
80
Hig
hest
Four
th
Mid
dle
Sec
ond
Low
est
Egyp
t 200
5
8111214
8
68 69 71 72 71
020
4060
80
Jord
an 2
002
711910
1765 67 69
73
76
020
4060
80
Mor
occo
200
3-04
810111111
79
75757472
020
4060
80
Hig
hest
Fo
urth
Mid
dle
Sec
ond
Low
est
Turk
ey 1
998
561013
2069
74 76 76
80
020
4060
80
Yem
en 1
997
31
4040414048
54
60
65
70
020
4060
80

Figu
re 3
.1—
Con
tinue
d
LATI
N A
MER
ICA
/CA
RIB
BEA
N
12
Unm
et n
eed
Use
of a
ny m
etho
d
Tota
l dem
and
Boliv
ia 2
003
2318
2425
38
818382
7980
020
4060
80
Hig
hest
Four
th
Mid
dle
Sec
ond
Low
est
Colo
mbi
a 20
05
24671186 87 87 87
84
020
4060
80
Dom
inic
an R
epub
lic 2
002
8
20
273232
83818283
80
020
4060
80
Hig
hest
Four
th
Mid
dle
Sec
ond
Low
est
Guat
emal
a 19
98-9
9
8
20
27
323241
47
59
76
81
020
4060
80
Haiti
200
0
35
4137424466 67 67
71
68
020
4060
80
Braz
il 19
96
4458
1883 84 85 87 89
020
4060
8010
0
Figu
re 3
.1—
Con
tinue
d
LATI
N A
MER
ICA
/CA
RIB
BEA
N—
Con
tinue
d
WES
T A
FRIC
A
13
Unm
et n
eed
Use
of a
ny m
etho
d
Tota
l dem
and
Nica
ragu
a 20
01
9121216
25
84868584
78
020
4060
80
Hig
hest
Four
th
Mid
dle
Sec
ond
Low
est
Beni
n 20
01
31292728
22
61
49
46
41
35
020
4060
80
Hig
hest
Four
th
Mid
dle
Sec
ond
Low
est
Cam
eroo
n 20
04
162024231926
37
49
59
62
020
4060
80
Peru
200
4
866111580
84 84 84
81
020
4060
80
Burk
ina
Faso
200
3
22
3231302939 42 41 40
54
020
4060
80

Figu
re 3
.1—
Con
tinue
d
WES
T A
FRIC
A—
Con
tinue
d
14
Unm
et n
eed
Use
of a
nym
etho
d
Tota
l dem
and
Chad
200
4
2722242222
37
2426
2322
020
4060
80
Hig
hest
Four
th
Mid
dle
Sec
ond
Low
est
Gui
nea
2005
232223201924 26
31 33
40
020
4060
80
Ghan
a 20
03
24
33353841
58
62
5962
55
020
4060
80
Hig
hest
Four
th
Mid
dle
Sec
ond
Low
est
Gabo
n 20
00
222628313352
58
64 63 64
020
4060
80
Côte
d’Iv
oire
199
8-99
24
292932
2329
40
46 48
51
020
4060
80
Cong
o 20
05
111516192067 67
74
77 80
020
4060
80

Figu
re 3
.1—
Con
tinue
d
WES
T A
FRIC
A—
Con
tinue
d
15
Unm
et n
eed
Use
of a
nym
etho
d
Tota
l dem
and
Mal
i 200
1
3029272829
51
37
313234
020
4060
80
Hig
hest
Four
th
Mid
dle
Sec
ond
Low
est
Mau
ritan
ia 2
000-
01
313331332931
35 36
44
53
020
4060
80
Nige
r 199
8
201814151721 20 20
25
43
020
4060
80
Nige
ria 2
003
1820171615
48
33
26
2122
020
4060
80
Hig
hest
Four
th
Mid
dle
Sec
ond
Low
est
Sene
gal 2
004-
05
29
3434313034
37
44
50
54
020
4060
80
Togo
1998
28
3334323555 53
58 56 57
020
4060
80

Figu
re 3
.1—
Con
tinue
d
EAST
AN
D S
OU
THER
N A
FRIC
A
16
Unm
et n
eed
Use
of a
nym
etho
d
Tota
l dem
and
Com
oros
199
6
22
323438
47
535253
5961
020
4060
80
Hig
hest
Four
th
Mid
dle
Sec
ond
Low
est
Eritr
ea 2
002
22
2731282729 30
36
41 41
020
4060
80
Ethi
opia
200
5
24
3637383337
45
49
52
61
020
4060
80
Keny
a 20
03
1717
273033
707171
64
53
020
4060
80
Hig
hest
Four
th
Mid
dle
Sec
ond
Low
est
Leso
tho
2004
-05
19
2830
404361
66 68 69
74
020
4060
80
Mad
agas
car 2
003-
04
17
2426272736
41
48
57
68
020
4060
80

Figu
re 3
.1—
Con
tinue
d
EAST
AN
D S
OU
THER
N A
FRIC
A—
Con
tinue
d
17
Unm
et n
eed
Use
of a
nym
etho
d
Tota
l dem
and
Mal
awi 2
004
2227283032
6466
615958
020
4060
80
Hig
hest
Four
th
Mid
dle
Sec
ond
Low
est
Moz
ambi
que
2003
192118181726
28
32
36
59
020
4060
80
Nam
ibia
200
0
16
26273330
80
72
57
52
57
020
4060
80
Hig
hest
Four
th
Mid
dle
Seco
nd
Low
est
Nam
ibia
200
0
16
2627
3330
80
72
57
52
57
020
4060
80
Hig
hest
Four
th
Mid
dle
Sec
ond
Low
est
Rwan
da 2
005
343840384051 53 55 53
66
020
4060
80
Sout
h Af
rica
1998
61115
2225
78
747168
61
020
4060
80
Hig
hest
Four
th
Mid
dle
Sec
ond
Low
est
Figu
re 3
.1—
Con
tinue
d
EAST
AN
D S
OU
THER
N A
FRIC
A—
Con
tinue
d
18
Unm
et n
eed
Use
of a
nym
etho
d
Tota
l dem
and
Tanz
ania
200
4-05
15
2326222440
42
49
54
62
020
4060
80
Ugan
da 2
000-
01
26
3837373449 51
55
62
72
020
4060
80
Zam
bia
2001
-02
21
29292929
77
67
58
55
51
020
4060
80
Hig
hest
Four
th
Mid
dle
Sec
ond
Low
est
Zim
babw
e 19
99
710
17161764
66 64
68
77
020
4060
80

19
4 Unmet Need and the Demand for Modern Methods
In response to family planning program interests, an additional measure of unmet need and the demand for family planning focusing on modern methods is introduced in this report. In effect, this measure—unmet need for modern methods—excludes primarily withdrawal and periodic abstinence; operationally, it treats these two methods, along with folk methods, as nonuse and adds their prevalence to total unmet need. In those countries with significant use of traditional methods, the effect can be considerable. For example, in the Philippines, where traditional methods comprise nearly one-third of all use, unmet need rises from 17 to 33 percent when confined to modern methods. Another example is Moldova where withdrawal is common; when confined to modern methods, unmet need increases from 7 to 31 percent.
These new calculations are shown in columns 9 to 11 of Table 2.1. Column 9 shows the new measure of unmet need for modern methods—the sum of total unmet need and the percentage using traditional methods. Column 10 displays the percentage using modern methods. The last column estimates the percentage of total demand satisfied by the use of modern methods (column 10 divided by column 7). The unmet need for modern methods is higher than the unmet need for any method. It averages 26 percent in the Asian countries, 32 percent in the Near East and North Africa, and 27 percent in Latin America and the Caribbean. In West Africa, the average unmet need for modern methods is 34 percent, and in East and Southern Africa it is 31 percent.
The percentage of total demand satisfied by modern methods is more variable. It is highest in Asia and in the Latin America/Caribbean region. The Near East/North Africa countries have lower levels, while the percentages satisfied in sub-Saharan Africa (where modern method use is very low) are lowest, especially in West Africa. Particular countries with the highest levels of satisfied demand for modern methods are Indonesia, Egypt, Brazil, and the Dominican Republic, all over 80 percent. The lowest is in Chad (6 percent).
Unmet need for modern methods and the extent to which this demand is being met is shown in association with education and wealth in Appendix Table A.1. There is a great amount of detail in the table that is perhaps best summarized by counting the countries that show negative or positive relationships or no association at all.
In connection with education, the dominant picture is no association with unmet need for modern methods. In 56 countries, 31 are in this category while 16 show a negative association (less need with more education), and nine show unmet need increasing with education.
There is not a strong association of wealth with unmet need for modern methods. Negative associations are more prevalent than positive relationships, but the absence of association is as frequent as the negative relationships.
The association of the percentage of total demand satisfied by modern methods with education is mostly positive and extensive except for a few Asian countries. The relationship is much stronger than with unmet need, a reflection of the strong association between education and the prevalence of modern methods. Essentially the same picture emerges with the wealth index.
20
Jordan
6714
11
22
14
1990 1997 2002
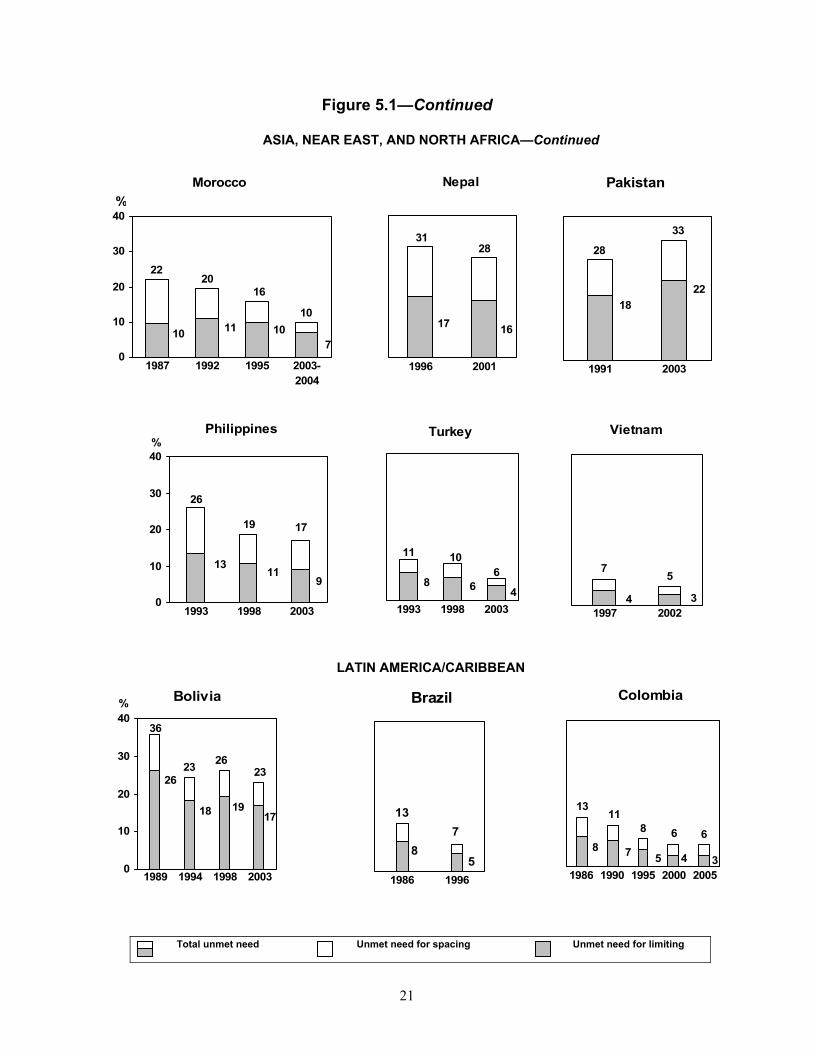
5 Trends in Unmet Need
A decline in unmet need (for any method) is apparent in most of the 44 countries that have conducted more than one survey (Figure 5.1). Only two countries in Asia and the Near East/North Africa—Indonesia and Egypt—show no recent decline and seem to have plateaued in the recent past. Pakistan shows an increase in unmet need. In contrast, Morocco and Kazakhstan show particularly sharp declines.
With the exception of Nicaragua, which shows no change, a general decline is also apparent in the Latin American and Caribbean countries, though the level remains very high in Haiti.
Little change is evident in West Africa, and in several countries unmet need has increased. The same mixed picture appears in East and Southern Africa. Unmet need has also increased in Mozambique and in Uganda but shows plateaus in Eritrea, Ethiopia, Kenya, Madagascar, Namibia, Rwanda, and Zambia. A stall in the level of unmet need is the most common pattern in sub-Saharan Africa.
Figure 5.1 Trends in unmet need for currently married women
ASIA, NEAR EAST, AND NORTH AFRICA
Bangladesh
6789
1115
1816
0
10
20
30
40
1993-1994
1996-1997
1999-2000
2004
%India
8
1916
1992-1993 1998-1999
8
Egypt
1513
118
2025
1611 10
1988-1989
1992-1993
1995-1996
2005 20036
Kazakhstan
12
5
9
16
1995 1999
Total unmet need Unmet need for spacing Unmet need for limiting
Indonesia
55666
991116 14
0
10
20
30
40
1987 1991 1994 1997 2002-2003
%

21
Figure 5.1—Continued
ASIA, NEAR EAST, AND NORTH AFRICA—Continued
LATIN AMERICA/CARIBBEAN
Morocco
7101110
10
16
2220
0
10
20
30
40
1987 1992 1995 2003-2004
%Pakistan
1822
33
28
1991 2003
Nepal
1617
3128
1996 2001
Philippines
911
13
17
26
19
0
10
20
30
40
1993 1998 2003
%Turkey
4686
11 10
1993 1998 2003
Vietnam
34
75
1997 2002
Bolivia
17
26
18 19
2323
36
26
0
10
20
30
40
1989 1994 1998 2003
% Brazil
85
713
1986 1996
Colombia
8 7 5 4 3
1113
8 6 6
1986 1990 1995 2000 2005
Total unmet need Unmet need for spacing Unmet need for limiting

22
Figure 5.1—Continued
LATIN AMERICA/CARIBBEAN—Continued
WEST AFRICA
Dominican Republic
4599
4
1112
19 1712
0
10
20
30
40
1986 1991 1996 1999 2002
%Guatemala
13 12 11
2429
23
1987 1995 1998-1999
Nicaragua
8 9
1515
0
10
20
30
40
1997-1998 2001
%Peru
67
20
11 9910
15
28
12
1986 1992 1996 2000 2004
Benin
9 10
2726
0
10
20
30
40
1996 2001
% Burkina Faso
776
2925 26
1992-1993
1998-1999
2003
Cameroon
65 6
202022
1991 1998 2004
Total unmet need Unmet need for spacing Unmet need for limiting
Haiti
2426
4440
1994 2000

23
Figure 5.1—Continued
WEST AFRICA—Continued
Côte d’Ivoire
7 8
2827
1994 1998-1999
Chad
3 4
23
9
0
10
20
30
40
1996-1997 2004
% Ghana
612 12 12
3735 34 34
1988 1993 1998 2003
Guinea
86 8
212425
0
10
20
30
40
1992 1999 2005
%Mali
866
2923
26
1987 1995-1996
2001
Niger
33
1917
1992 1998
Nigeria
55 5
171721
0
10
20
30
40
1990 1999 2003
%Senegal
7
127
9
3229
37 35
1986 1992-1993
1997 2004-2005
Togo
1112
4032
1988 1998
Total unmet need Unmet need for spacing Unmet need for limiting
24
Figure 5.1—Continued
EAST AND SOUTHERN AFRICA
Tanzania
7889
22222428
1992 1996 1999 2004-2005
Rwanda
131218
39 3638
1992 2000 2005
Namibia
7
13
2222
0
10
20
30
40
1992 2000
%
Mozambique
28
18
7
1997 2003
Malawi
1012 12
283036
1992 2000 2004
Madagascar
1116
12
32
26 24
0
10
20
30
40
1992 1997 2003-2004
%
Kenya
10
15 1410
25
3538
24
1989 1993 1998 2003
Ethiopia
1414
36 34
2000` 2005
Eritrea
6 6
2728
0
10
20
30
40
1995 2002
%
Total unmet need Unmet need for spacing Unmet need for limiting

25
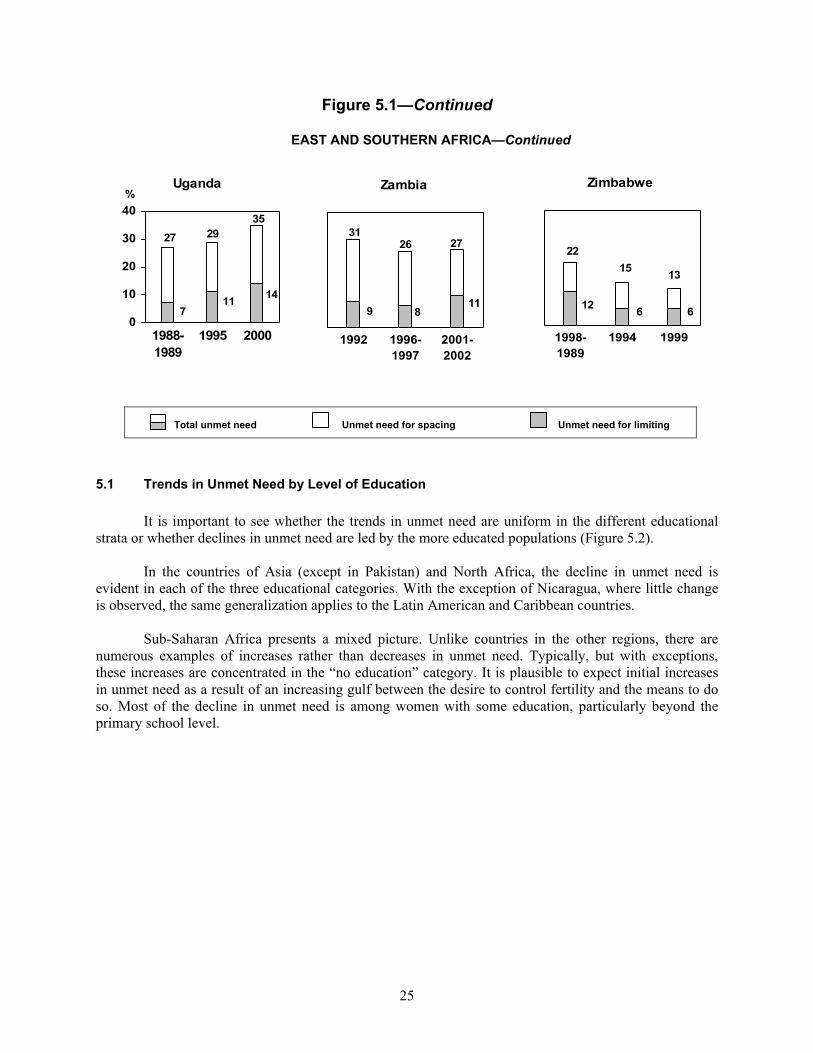
Figure 5.1—Continued
EAST AND SOUTHERN AFRICA—Continued
5.1 Trends in Unmet Need by Level of Education
It is important to see whether the trends in unmet need are uniform in the different educational strata or whether declines in unmet need are led by the more educated populations (Figure 5.2).
In the countries of Asia (except in Pakistan) and North Africa, the decline in unmet need is evident in each of the three educational categories. With the exception of Nicaragua, where little change is observed, the same generalization applies to the Latin American and Caribbean countries.
Sub-Saharan Africa presents a mixed picture. Unlike countries in the other regions, there are numerous examples of increases rather than decreases in unmet need. Typically, but with exceptions, these increases are concentrated in the “no education” category. It is plausible to expect initial increases in unmet need as a result of an increasing gulf between the desire to control fertility and the means to do so. Most of the decline in unmet need is among women with some education, particularly beyond the primary school level.
Zambia
1189
2731
26
1992 1996-1997
2001-2002
Uganda
14117
3527 29
0
10
20
30
40
1988-1989
1995 2000
%Zimbabwe
6612
13
2215
1998-1989
1994 1999
Total unmet need Unmet need for spacing Unmet need for limiting

26
Figure 5.2 Trends in unmet need for currently married women by education
ASIA, NEAR EAST, AND NORTH AFRICA
18 16 1711
0
10
20
30
40
50
1993-1994
1996-1997
1999-2000
2004
Bangladesh
No education
18 16 1612
0
10
20
30
40
50
1993-1994
1996-1997
1999-2000
2004
1813 12 11
0
10
20
30
40
50
1993-1994
1996-1997
1999-2000
2004
%Primary Secondary+
17 16
0
10
20
30
40
50
1992-1993 1998-1999
India
14 15
0
10
20
30
40
50
1992-1993 1998-1999
16 15
0
10
20
30
40
50
1992-1993 1998-1999
2835
0
10
20
30
40
50
1991 2003
Pakistan30 30
0
10
20
30
40
50
1991 2003
26 27
0
10
20
30
40
50
1991 2003
16 1612 9 11
0
10
20
30
40
50
1987 1991 1994 1997 2002
17 1511 10 9
0
10
2030
40
50
1987 1991 1994 1997 2002
13 11 9 8 8
0
10
2030
40
50
1987 1991 1994 1997 2002
Indonesia

27
Figure 5.2—Continued
ASIA, NEAR EAST, AND NORTH AFRICA—Continued
Philippines
No education% Primary Secondary+
3328 27
01020
304050
1993 1998 2003
2922 20
01020304050
1993 1998 2003
2317 16
01020304050
1993 1998 2003
2924
1914 13
01020304050
1988-1989
1992-1993
1995-1996
2000 2005
Egypt 2418 16
11 10
01020304050
1988-1989
1992-1993
1995-1996
2000 2005
15 14 11 7 9
01020304050
1988-1989
1992-1993
1995-1996
2000 2005
2620 16
0
10
20
30
40
50
1990 1997 2002
Jordan 2318 15
0
10
2030
40
50
1990 1997 2002
2013 10
0
10
20
30
40
50
1990 1997 2002
24 2318
11
0
10
20
30
40
50
1987 1992 1995 2003-2004
1611 13 10
0
10
20
30
40
50
1987 1992 1995 2003-2004
11 9 8 8
0
10
20
30
40
50
1987 1992 1995 2003-2004
Morocco

28
Figure 5.2—Continued
ASIA, NEAR EAST, AND NORTH AFRICA—Continued
Nepal
No education%Primary Secondary+
Turkey
Vietnam
31 28
0
10
20
30
40
50
1996 2001
3629
010
2030
4050
1996 2001
2823
010
2030
4050
1996 2001
2016 13
0
10
20
30
40
50
1993 1998 2003
9 10 9
0
10
20
30
40
50
1993 1998 2003
5 6 40
10
20
30
40
50
1993 1998 2003
12 10
01020304050
1997 2002
9 6
01020304050
1997 2002
6 40
1020304050
1997 2002

29
Figure 5.2—Continued
LATIN AMERICA/CARIBBEAN
Bolivia
No education% Primary Secondary+
Brazil
Colombia
DominicanRepublic
3541
3145
0102030405060
1989 1994 1998 2003
2733
26
41
01020304050
1989 1994 1998 2003
14 16 1517
01020304050
1989 1994 1998 2003
30
15
01020304050
1986 1996
12 9
01020304050
1986 1996
5 50
1020304050
1986 1996
2217 13 10 12
01020304050
1986 1990 1995 2000 2005
9 9 6 5 5
01020304050
1986 1990 1995 2000 2005
30 3020 16 13
01020304050
1986 1991 1996 1999 2002
20 1913 10 12
01020304050
1986 1991 1996 1999 2002
15 12 10 13 10
01020304050
1986 1991 1996 1999 2002
15 13 9 7 6
01020304050
1986 1990 1995 2000 2005

30
Figure 5.2—Continued
LATIN AMERICA/CARIBBEAN—Continued
Guatemala
No education% Primary Secondary+
Haitil
Nicaragua
Peru
34 30 29
01020304050
1987 1995 1998-1999
24 26 24
01020304050
1987 1995 1998-1999
10 9 12
01020304050
1987 1995 1998-1999
44 42
0102030405060
1994 2000
4 74 1
01 02 03 04 05 06 0
1 9 9 4 2 0 0 0
4 03 3
0
1 0
2 0
3 0
4 0
5 0
1 9 9 4 2 0 0 0
22 23
01020304050
1997 2001
16 14
01020304050
1997 2001
10 11
01020304050
1997 2001
49
28 2316 16
0102030405060
1986 1991-1992
1996 2000 2004
32
19 15 13 10
01020304050
1986 1991-1992
1996 2000 2004
15 11 8 7 7
01020304050
1986 1991-1992
1996 2000 2004

31
Figure 5.2—Continued
WEST AFRICA
Benin
No education% Primary Secondary+
BurkinaFaso
Cameroon
Chad
25 27
0
10
20
30
40
50
1996 2001
30 31
0
10
20
30
40
50
1996 2001
2126
0
10
20
30
40
50
1996 2001
24 2630
0
10
20
30
40
50
1992-1993 1998-1999 2003
29 28 25
0
10
20
30
40
50
1992-1993 1998-1999 2003
2416 15
0
10
20
30
40
50
1992-1993 1998-1999 2003
19 19 20
0
10
20
30
40
50
1991 1998 2004
2722 23
0
10
20
30
40
50
1991 1998 2004
2016 17
0
10
20
30
40
50
1991 1998 2004
9
22
01020304050
1997 2004
13
30
01020304050
1997 2004
1726
01020304050
1997 2004

32
Figure 5.2—Continued
WEST AFRICA—Continued
Côted'Ivoire
No education% Primary Secondary+
Ghana
Guinea
Mali
26 29
0
10
20
30
40
50
1994 1998-1999
3227
0
10
20
30
40
50
1994 1998-1999
23 21
0
10
20
30
40
50
1994 1998-1999
3237 34 35
0
10
20
30
40
50
1988 1993 1998 2003
39 39 39 40
0
10
20
30
40
50
1988 1993 1998 2003
28
18
31 30
0
10
20
30
40
50
1988 1993 1998 2003
24 24 20
01020304050
1992 1999 2005
26 28 25
01020304050
1992 1999 2005
3125 29
01020304050
1992 1999 2005
22 26 28
01020304050
1987 1995-1996 2001
30 27 31
01020304050
1987 1995-1996 2001
2821 25
01020304050
1987 1995-1996 2001

33
Figure 5.2—Continued
WEST AFRICA—Continued
Niger
No education%Primary Secondary+
Nigeria
Senegal
Togo
18 16
01020304050
1992 1998
2821
01020304050
1992 1998
2 31 6
01 02 03 04 05 0
1 9 9 2 1 9 9 8
19 16 14
0
1020
3040
50
1990 1999 2003
26 22 21
0
1020
3040
50
1990 1999 2003
20 18 20
0
1020
3040
50
1990 1999 2003
2834 31
0
10
20
30
40
50
1991-1992 1997 2004
3441
34
0
10
20
30
40
50
1991-1992 1997 2004
3127 26
0
10
20
30
40
50
1991-1992 1997 2004
3732
010
2030
4050
1988 1998
51
36
0102030405060
1988 1998
39
24
010
2030
4050
1988 1998

34
Figure 5.2—Continued
EAST AND SOUTHERN AFRICA
Eritrea
No education% Primary Secondary+
Kenya
Madagascar
27 26
0
10
20
30
40
50
1995 2002
32 30
0
10
20
30
40
50
1995 2002
27 24
0
10
20
30
40
50
1995 2002
36 3525 21
01020304050
1989 1993 1998 2003
41 39
28 30
01020304050
1989 1993 1998 2003
3226
15 13
01020304050
1989 1993 1998 2003
27 24 25
0
10
20
30
40
50
1992 1997 2003
3829 26
0
10
20
30
40
50
1992 1997 2003
2419 19
0
10
20
30
40
50
1992 1997 2003
35 35
0
10
20
30
40
50
2000 2005
4237
0
10
20
30
40
50
2000 2005
29
17
0
10
20
30
40
50
2000 2005
Ethiopia

35
Figure 5.2—Continued
EAST AND SOUTHERN AFRICA—Continued
Mozambique
No education%
Primary Secondary+
20 17
01020304050
1997 2003
2520
01020304050
1997 2003
2315
01020304050
1997 2003
24 23
01020304050
1992 2000
23 27
01020304050
1992 2000
23 27
01020304050
1992 2000
37 4043
01020
304050
1992 2000 2005
36 3836
01020
304050
1992 2000 2005
27 2927
01020
304050
1992 2000 2005
Namibia
Rwanda
3631 30
0
10
20
30
40
50
1992 2000 2004
Malawi
3730 27
0
10
20
30
40
50
1992 2000 2004
25 24 24
0
10
20
30
40
50
1992 2000 2004

36
Figure 5.2—Continued
EAST AND SOUTHERN AFRICA—Continued
Uganda
No education%
Primary Secondary+
Zambia
Zimbabwe
24 2635
01020304050
1988-1989 1995 2000-2001
29 3137
01020
304050
1988-1989 1995 2000-2001
3530
22
01020
304050
1988-1989 1995 2000-2001
2924 27
01020304050
1992 1996-1997 2001-2002
32 28 29
01020304050
1992 1996-1997 2001-2002
27 24 23
01020304050
1992 1996-1997 2001-2002
19 16
0
10
20
30
40
50
1994 1999
17 16
0
10
20
30
40
50
1994 1999
10 9
0
10
20
30
40
50
1994 1999
2622 23 22
0
10
20
30
40
50
1992 1996 1999 2004-2005
2925 22 23
0
10
20
30
40
50
1992 1996 1999 2004-2005
21 23
13 10
0
10
20
30
40
50
1992 1996 1999 2004-2005
Tanzania
37
6 Past and Future Use among Women in Need
In order to meet the family planning needs of women classified with an unmet need, it is useful to consider four subgroups: women who have used any method in the past who either intend to use again in the future or who do not intend to use; and women who have never used a method, also subdivided by whether they intend to use in the future.
Women who have never used contraception tend, in general, to be younger, less educated, and less wealthy. Women who have used in the past and who intend to resume use are more likely to be at the higher ends of education and wealth. The subset who have used but who do not intend future use are concentrated among women over 40 years of age.
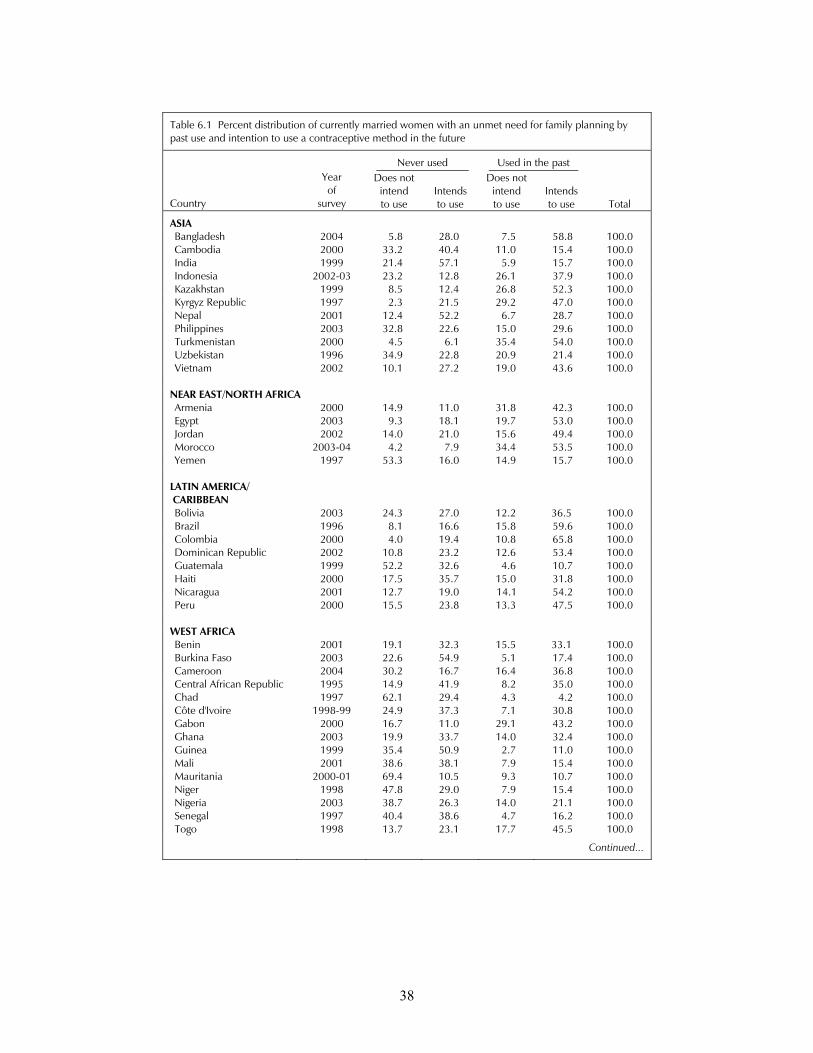
The distribution of women in these four categories is shown in Table 6.1 for the most recent surveys. There is a great variety in the different regions as well as within regions. In Asia, there is a mixed picture. Women in need who have used a method in the past comprise about half of the Asian countries, while in all of the Asian countries included here, those past users who intend to resume use are the larger category. Among Asian women who have never used any method, those who intend to use predominate.
In the Near East and North African countries, with the exception of Yemen, the pattern is very similar to that in Asia and is dominated by past users, especially those who intend to use in the future.
The Latin American/Caribbean pattern is also dominated by past users who intend to use. Guate-mala is a clear exception to this, with those in need concentrated in the category of never users who do not intend to use.
Sub-Saharan Africa is difficult to summarize. Women in need who have never used and who do not intend to use predominate in Chad, Eritrea, Mauritania, Niger, and Senegal, while never users who intend future use are high in Burkina Faso, Congo, Ethiopia, Guinea, and Uganda. Among women who have used in the past, virtually every country shows a predominance of those who plan to resume use.
38
Table 6.1 Percent distribution of currently married women with an unmet need for family planning by past use and intention to use a contraceptive method in the future
Never used Used in the past
Country
Yearof
survey
Does not intend to use
Intends to use
Does not intend to use
Intends to use Total
ASIA Bangladesh 2004 5.8 28.0 7.5 58.8 100.0 Cambodia 2000 33.2 40.4 11.0 15.4 100.0 India 1999 21.4 57.1 5.9 15.7 100.0 Indonesia 2002-03 23.2 12.8 26.1 37.9 100.0 Kazakhstan 1999 8.5 12.4 26.8 52.3 100.0 Kyrgyz Republic 1997 2.3 21.5 29.2 47.0 100.0 Nepal 2001 12.4 52.2 6.7 28.7 100.0 Philippines 2003 32.8 22.6 15.0 29.6 100.0 Turkmenistan 2000 4.5 6.1 35.4 54.0 100.0 Uzbekistan 1996 34.9 22.8 20.9 21.4 100.0 Vietnam 2002 10.1 27.2 19.0 43.6 100.0
NEAR EAST/NORTH AFRICA Armenia 2000 14.9 11.0 31.8 42.3 100.0 Egypt 2003 9.3 18.1 19.7 53.0 100.0 Jordan 2002 14.0 21.0 15.6 49.4 100.0 Morocco 2003-04 4.2 7.9 34.4 53.5 100.0 Yemen 1997 53.3 16.0 14.9 15.7 100.0
LATIN AMERICA/ CARIBBEAN Bolivia 2003 24.3 27.0 12.2 36.5 100.0 Brazil 1996 8.1 16.6 15.8 59.6 100.0 Colombia 2000 4.0 19.4 10.8 65.8 100.0 Dominican Republic 2002 10.8 23.2 12.6 53.4 100.0 Guatemala 1999 52.2 32.6 4.6 10.7 100.0 Haiti 2000 17.5 35.7 15.0 31.8 100.0 Nicaragua 2001 12.7 19.0 14.1 54.2 100.0 Peru 2000 15.5 23.8 13.3 47.5 100.0
WEST AFRICA Benin 2001 19.1 32.3 15.5 33.1 100.0 Burkina Faso 2003 22.6 54.9 5.1 17.4 100.0 Cameroon 2004 30.2 16.7 16.4 36.8 100.0 Central African Republic 1995 14.9 41.9 8.2 35.0 100.0 Chad 1997 62.1 29.4 4.3 4.2 100.0 Côte d'Ivoire 1998-99 24.9 37.3 7.1 30.8 100.0 Gabon 2000 16.7 11.0 29.1 43.2 100.0 Ghana 2003 19.9 33.7 14.0 32.4 100.0 Guinea 1999 35.4 50.9 2.7 11.0 100.0 Mali 2001 38.6 38.1 7.9 15.4 100.0 Mauritania 2000-01 69.4 10.5 9.3 10.7 100.0 Niger 1998 47.8 29.0 7.9 15.4 100.0 Nigeria 2003 38.7 26.3 14.0 21.1 100.0 Senegal 1997 40.4 38.6 4.7 16.2 100.0 Togo 1998 13.7 23.1 17.7 45.5 100.0
Continued...

39
Table 6.1—Continued
Never used Used in the past
Country
Yearof
survey
Does not intend to use
Intends to use
Does not intend to use
Intends to use Total
EAST AND SOUTHERN AFRICA Comoros 1996 30.4 30.0 11.3 28.3 100.0 Eritrea 2002 50.6 29.6 7.1 12.8 100.0 Ethiopia 2005 29.7 57.5 1.8 16.9 100.0 Kenya 2003 18.1 38.2 7.4 36.3 100.0 Madagascar 2003-04 36.3 27.8 19.8 16.1 100.0 Malawi 2000 11.9 46.9 5.1 36.0 100.0 Mozambique 2003 20.8 24.0 19.6 35.7 100.0 Namibia 2000 11.8 23.2 18.3 46.7 100.0 Rwanda 2000 26.7 38.4 12.3 22.7 100.0 South Africa 1998 13.1 10.5 32.0 44.4 100.0 Tanzania 1999 27.7 34.1 11.1 27.1 100.0 Uganda 2000-01 16.7 49.6 6.9 26.8 100.0 Zambia 2001-02 7.9 26.1 10.6 55.3 100.0 Zimbabwe 1999 11.5 14.0 14.1 60.4 100.0
Note: Totals may not add to 100.0 because of rounding.
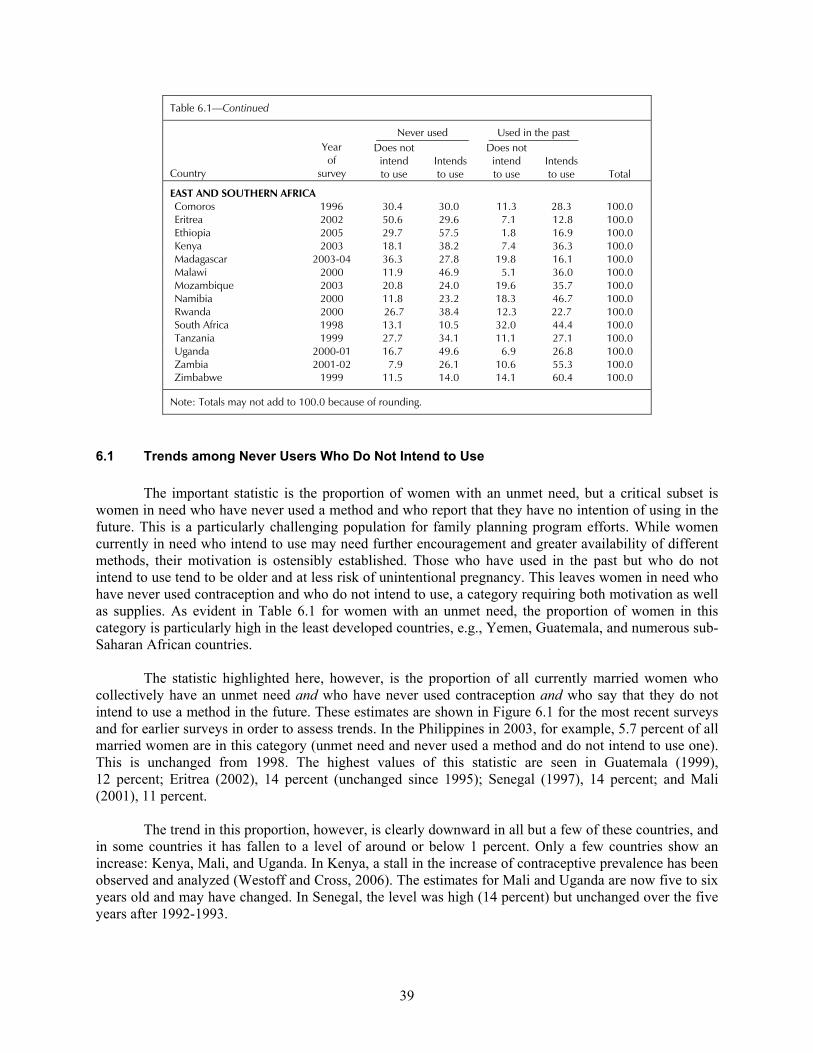
6.1 Trends among Never Users Who Do Not Intend to Use
The important statistic is the proportion of women with an unmet need, but a critical subset is women in need who have never used a method and who report that they have no intention of using in the future. This is a particularly challenging population for family planning program efforts. While women currently in need who intend to use may need further encouragement and greater availability of different methods, their motivation is ostensibly established. Those who have used in the past but who do not intend to use tend to be older and at less risk of unintentional pregnancy. This leaves women in need who have never used contraception and who do not intend to use, a category requiring both motivation as well as supplies. As evident in Table 6.1 for women with an unmet need, the proportion of women in this category is particularly high in the least developed countries, e.g., Yemen, Guatemala, and numerous sub-Saharan African countries.
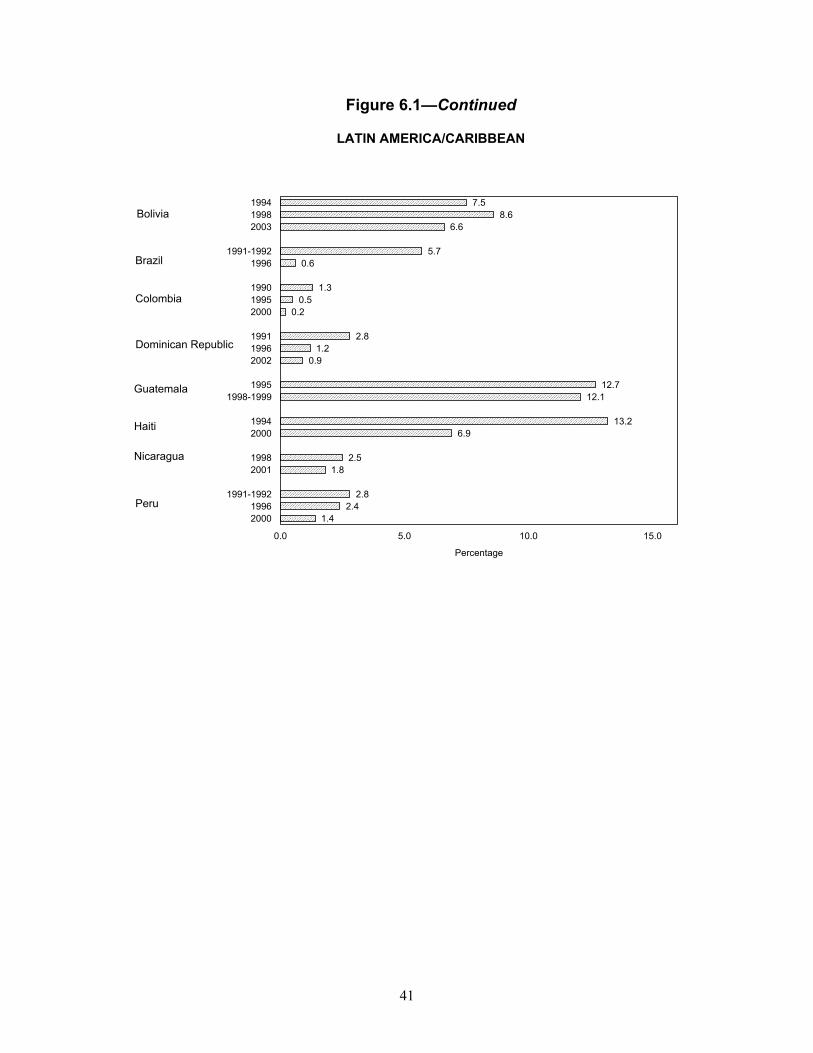
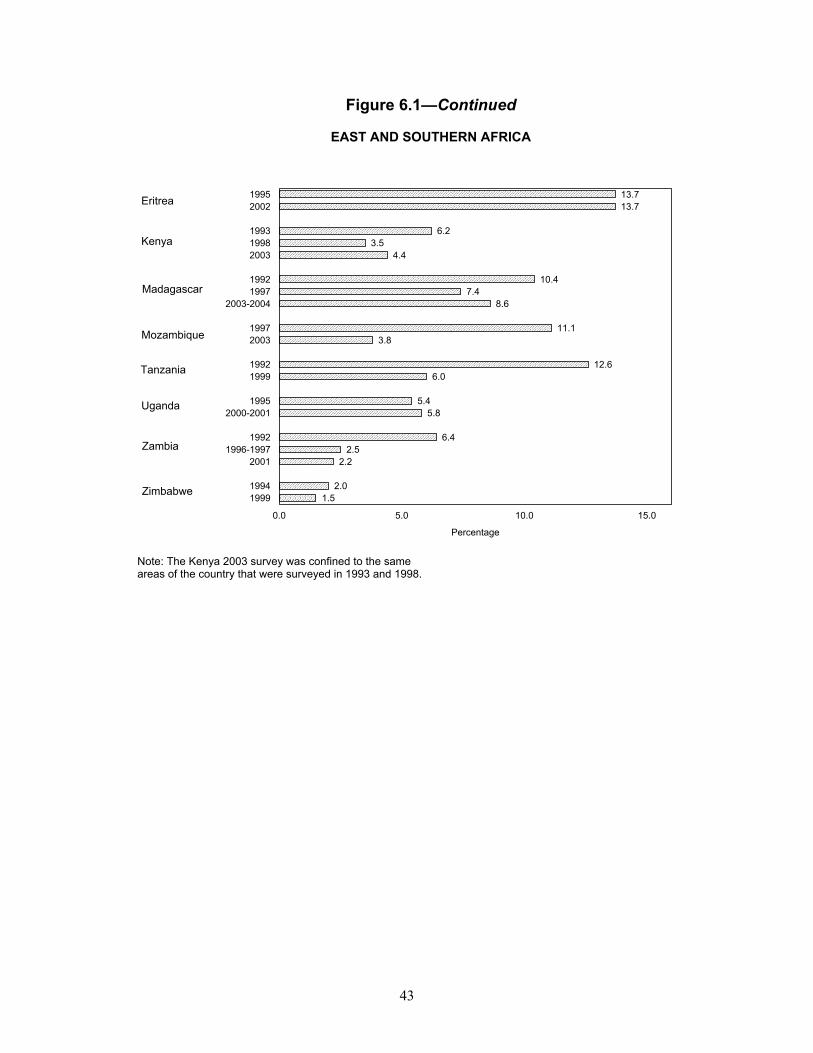
The statistic highlighted here, however, is the proportion of all currently married women who collectively have an unmet need and who have never used contraception and who say that they do not intend to use a method in the future. These estimates are shown in Figure 6.1 for the most recent surveys and for earlier surveys in order to assess trends. In the Philippines in 2003, for example, 5.7 percent of all married women are in this category (unmet need and never used a method and do not intend to use one). This is unchanged from 1998. The highest values of this statistic are seen in Guatemala (1999), 12 percent; Eritrea (2002), 14 percent (unchanged since 1995); Senegal (1997), 14 percent; and Mali (2001), 11 percent.
The trend in this proportion, however, is clearly downward in all but a few of these countries, and in some countries it has fallen to a level of around or below 1 percent. Only a few countries show an increase: Kenya, Mali, and Uganda. In Kenya, a stall in the increase of contraceptive prevalence has been observed and analyzed (Westoff and Cross, 2006). The estimates for Mali and Uganda are now five to six years old and may have changed. In Senegal, the level was high (14 percent) but unchanged over the five years after 1992-1993.
40
There are several other countries not included in Figure 6.1 because only one survey is available to date. High values of the statistic are evident in Comoros (1996), 11 percent; Ethiopia (2000), 11 percent; and Cambodia (2000), 10 percent. Yemen (1997) has the highest value at 21 percent.
As reported in the last review of unmet need (Westoff, 2001), the main reasons offered by never users for not intending to use a method in the future are various kinds of opposition to contraception, including religious considerations, husband’s objections, and personal reasons. Other major reasons include lack of knowledge of methods and where to find them, especially in sub-Saharan Africa.
Figure 6.1 Trends in the percentage of currently married women who have an unmet need for family planning and who have never used
a contraceptive method and who do not intend to use a method in the future
ASIA, NEAR EAST, AND NORTH AFRICA
2.41.7
1.40.6
4.91.9
1.30.9
2.62.4
2.0
6.91.6
1.5
1.10.7
6.23.4
5.85.7
2.11.7
1.20.5
1993-19941996-1997
20002004
1992-19931995-1996
20002003
19941997
2002-2003
199019972002
19951999
19962001
19982003
19931998
19972000
0.0 5.0 10.0 15.0
Percentage
Bangladesh
Egypt
Indonesia
Jordan
Kazakhstan
Nepal
Philippines
Turkey
Vietnam

41
Figure 6.1—Continued
LATIN AMERICA/CARIBBEAN
7.58.6
6.6
5.70.6
1.30.5
0.2
2.81.2
0.9
12.712.1
13.26.9
2.51.8
2.82.4
1.4
199419982003
1991-19921996
199019952000
199119962002
19951998-1999
19942000
19982001
1991-199219962000
0.0 5.0 10.0 15.0
Percentage
Bolivia
Brazil
Colombia
Dominican Republic
Guatemala
Haiti
Nicaragua
Peru
42
Figure 6.1—Continued
WEST AFRICA
6.55.2
8.26.5
6.1
8.76.9
7.08.7
6.8
9.111.0
10.48.0
11.39.1
6.5
13.814.1
19962001
199119982004
19941998-1999
199219982003
19962001
19921998
199019992003
1992-19931997
0.0 5.0 10.0 15.0
Percentage
Benin
Cameroon
Côte d'Ivoire
Ghana
Mali
Niger
Nigeria
Senegal
43
Figure 6.1—Continued
EAST AND SOUTHERN AFRICA
13.713.7
6.23.5
4.4
10.47.4
8.6
11.13.8
12.66.0
5.45.8
6.42.5
2.2
2.01.5
19952002
199319982003
19921997
2003-2004
19972003
19921999
19952000-2001
19921996-1997
2001
19941999
0.0 5.0 10.0 15.0
Percentage
Eritrea
Kenya
Madagascar
Mozambique
Tanzania
Uganda
Zambia
Zimbabwe
Note: The Kenya 2003 survey was confined to the sameareas of the country that were surveyed in 1993 and 1998.
44
7 Unmet Need among Unmarried Women
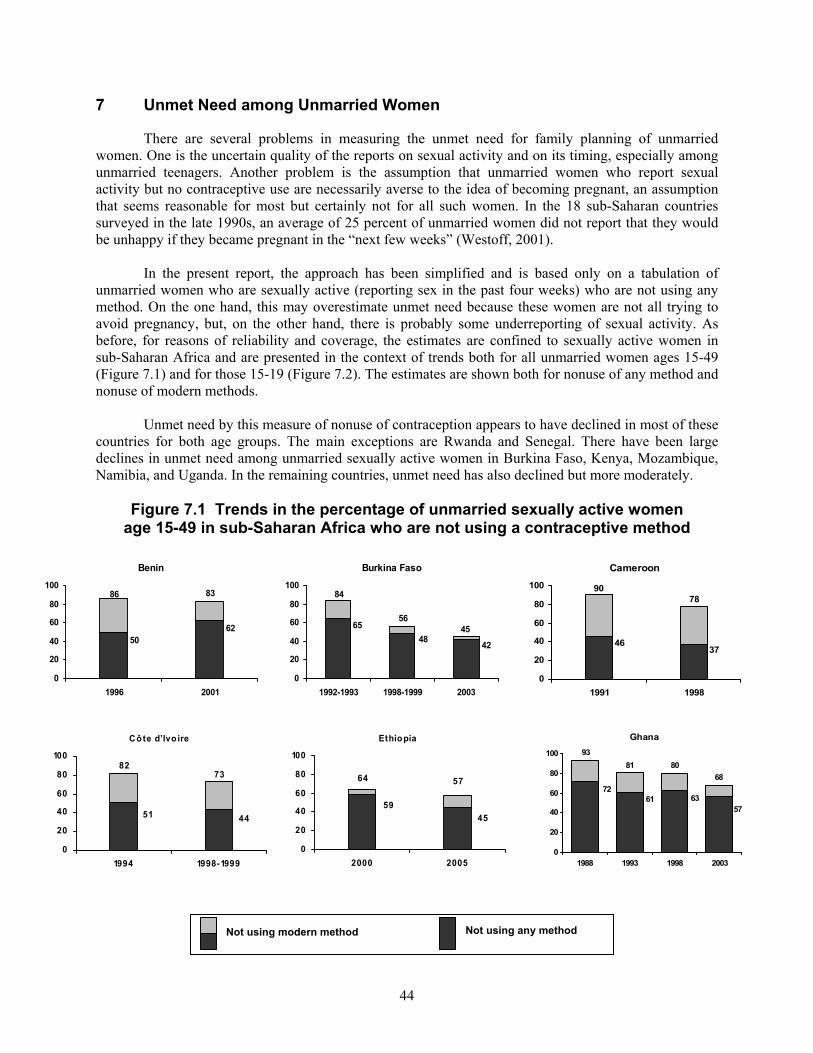
There are several problems in measuring the unmet need for family planning of unmarried women. One is the uncertain quality of the reports on sexual activity and on its timing, especially among unmarried teenagers. Another problem is the assumption that unmarried women who report sexual activity but no contraceptive use are necessarily averse to the idea of becoming pregnant, an assumption that seems reasonable for most but certainly not for all such women. In the 18 sub-Saharan countries surveyed in the late 1990s, an average of 25 percent of unmarried women did not report that they would be unhappy if they became pregnant in the “next few weeks” (Westoff, 2001).
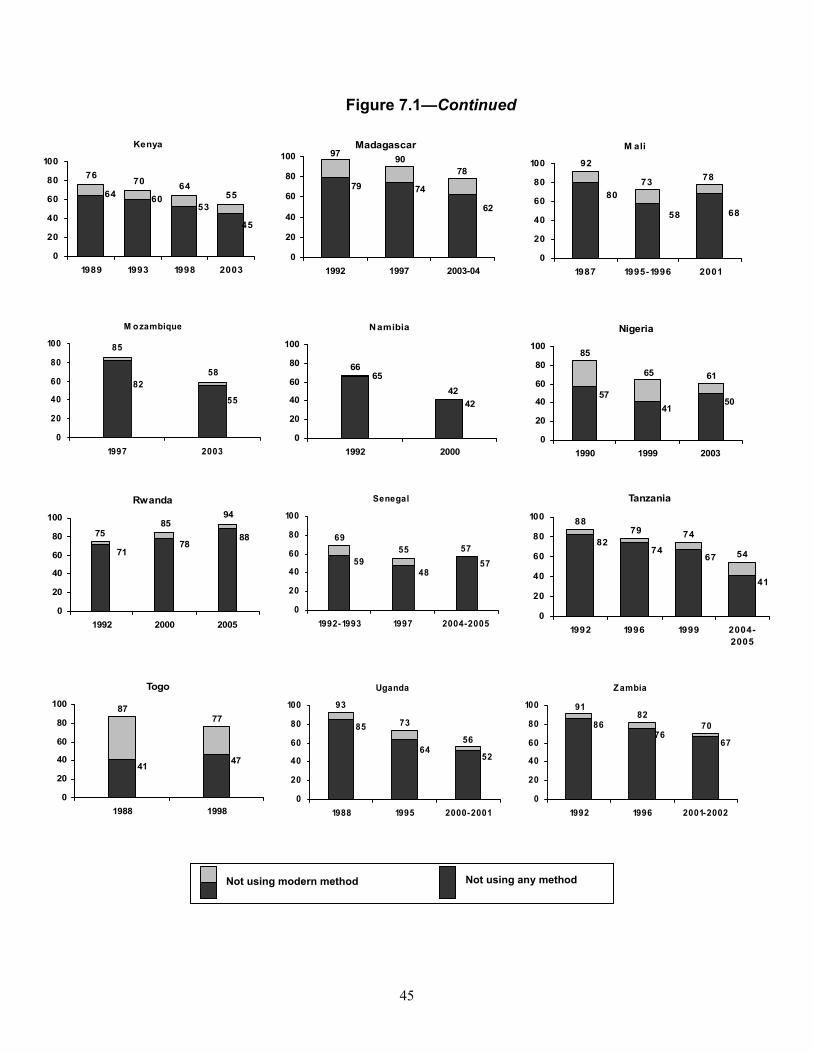
In the present report, the approach has been simplified and is based only on a tabulation of unmarried women who are sexually active (reporting sex in the past four weeks) who are not using any method. On the one hand, this may overestimate unmet need because these women are not all trying to avoid pregnancy, but, on the other hand, there is probably some underreporting of sexual activity. As before, for reasons of reliability and coverage, the estimates are confined to sexually active women in sub-Saharan Africa and are presented in the context of trends both for all unmarried women ages 15-49 (Figure 7.1) and for those 15-19 (Figure 7.2). The estimates are shown both for nonuse of any method and nonuse of modern methods.
Unmet need by this measure of nonuse of contraception appears to have declined in most of these countries for both age groups. The main exceptions are Rwanda and Senegal. There have been large declines in unmet need among unmarried sexually active women in Burkina Faso, Kenya, Mozambique, Namibia, and Uganda. In the remaining countries, unmet need has also declined but more moderately.
Figure 7.1 Trends in the percentage of unmarried sexually active women age 15-49 in sub-Saharan Africa who are not using a contraceptive method
Not using modern method Not using any method
Benin
6250
8386
0
20
40
60
80
100
1996 2001
Burkina Faso
424865 45
56
84
0
20
40
60
80
100
1992-1993 1998-1999 2003
Cameroon
3746
7890
0
20
40
60
80
100
1991 1998
Côte d’Ivo ire
4451
7382
0
20
40
60
80
100
1994 1998-1999
Ghana
7261 63
57
9381 80
68
0
20
40
60
80
100
1988 1993 1998 2003
Ethiopia
4559
5764
0
20
40
60
80
100
2000 2005

45
Figure 7.1—Continued
Not using modern method Not using any method
Kenya
45
536064
6455
7076
0
20
40
60
80
100
1989 1993 1998 2003
M ali
6858
80
7873
92
0
20
40
60
80
100
1987 1995-1996 2001
M ozambique
55
8258
85
0
20
40
60
80
100
1997 2003
Nigeria
5041
57
6165
85
0
20
40
60
80
100
1990 1999 2003
Namibia
42
6542
66
0
20
40
60
80
100
1992 2000
Rwanda
8878
71
9485
75
0
20
40
60
80
100
1992 2000 2005
Senegal
5748
595755
69
0
20
40
60
80
100
1992-1993 1997 2004-2005
Tanzania
41
6774
8254
747988
0
20
40
60
80
100
1992 1996 1999 2004-2005
Uganda
5264
8556
73
93
0
20
40
60
80
100
1988 1995 2000-2001
Zambia
6776
86 7082
91
0
20
40
60
80
100
1992 1996 2001-2002
Togo
4741
7787
0
20
40
60
80
100
1988 1998
Madagascar
62
747978
9097
0
20
40
60
80
100
1992 1997 2003-04

46
Figure 7.1—Continued
Figure 7.2 Trends in the percentage of unmarried sexually active teenage women (age 15-19) in sub-Saharan Africa who are not using a contraceptive method
Not using modern method Not using any method
Benin
6753
8487
0
20
40
60
80
100
1996 2001
Burkina Faso
5057
69 5363
86
0
20
40
60
80
100
1992-1993 1998-1999 2003
Cameroon
2735
8096
0
20
40
60
80
100
1991 1998
Côte d’Ivoire
4653
7584
0
20
40
60
80
100
1994 1998-1999
Ghana
54556774
6677
8599
0
20
40
60
80
100
1988 1993 1998 2003
Kenya
5070
8088
80
62
9296
0
20
40
60
80
100
1989 1993 1998 2003
Zimbabwe
454456 4647
59
0
20
40
60
80
100
1988 1994 1999

47
Figure 7.2—Continued
Not using modern method Not using any method
Madagascar
698283
829498
0
20
40
60
80
100
1992 1997 2003-2004
M ali
7671
88
838488
0
20
40
60
80
100
1987 1995-1996 2001
Mozambique
57
9359
95
0
20
40
60
80
100
1997 2003
Namibia
49
71 49
73
0
20
40
60
80
100
1992 2000
Nigeria
555359
7177
87
0
20
40
60
80
100
1990 1999 2003
Rwanda
72
49
75
60
0
20
40
60
80
100
1992 2000
Senegal
7065
857067
85
0
20
40
60
80
100
1992-1993 1997 2004-2005
Tanzania
68
728690 70
788896
0
20
40
60
80
100
1992 1996 1999 2004-2005
Togo
4449
7589
0
20
40
60
80
100
1988 1998

48
Figure 7.2—Continued
8 Fertility Implications of Reducing Unmet Need
As noted in the introduction, potential reductions of unmet need have implications for the future decline of fertility. One way of estimating this potential, used in earlier work on unmet need (Westoff and Bankole, 1995), is to exploit the high correlation between contraceptive prevalence and fertility across countries. The correlation ranges from 0.84 to 0.94, depending on the sample of countries. The regression equations are very similar regardless of whether the sample is confined to the 60 DHS countries2 or the 120 developing countries in the Population Reference Bureau’s data sheet. Confining the analysis to the prevalence of modern methods rather than to all methods (as used here) significantly reduces the association.
The basic idea is to estimate the contraceptive prevalence (all methods) that would hypothetically result from the reduction of unmet need and substitute the estimated total demand for family planning in the regression equation calculated for the survey data on the most recent total fertility rate (TFR) and current contraceptive prevalence. One assumption is the total elimination of unmet need, but this is obviously an extreme and unrealistic outer limit, though some countries are moving toward low levels (e.g., Vietnam with an unmet need of 4.8 percent). The predicted TFRs are shown in Table 8.1, in the next-to-last column for the maximum estimate and in the last column for the most likely estimates. The maximum estimate is based on the total demand for family planning (the sum of the contraceptive prevalence rate [CPR] and unmet need) while the most likely values lower this demand with two adjustments. The first adjustment is to reduce by 30 percent the birthspacing component of unmet need (Bongaarts, 1991). The rationale for this is that these spacers will sooner or later discontinue contra-ceptive practice in order to have a child. This means that the estimated demand for family planning would exaggerate the steady-state effect of satisfying the unmet need for spacing. The second adjustment is to reduce total unmet need (and therefore the total demand for family planning) by the percentage of women in need who have never used a method and who say that they do not intend to use a method in the future. Of course, many of these women may change their mind and eventually begin to use a method, but others who currently intend to use may also change their minds. The magnitude of this second adjustment can be seen in Figure 6.1. The point of these adjustments is to make the fertility impact estimate more plausible.
2 Five countries from the Centers for Disease Control and Prevention (CDC) program of surveys are also included.
Not using modern methods Not using any method
Uganda
4871
94
52
78
98
0
20
40
60
80
100
1988 1995 2000-2001
Zambia
7784
94 8087
96
0
20
40
60
80
100
1992 1996 2001-2002
Z imbabwe
6563656566
76
0
20
40
60
80
100
1988 1994 1999
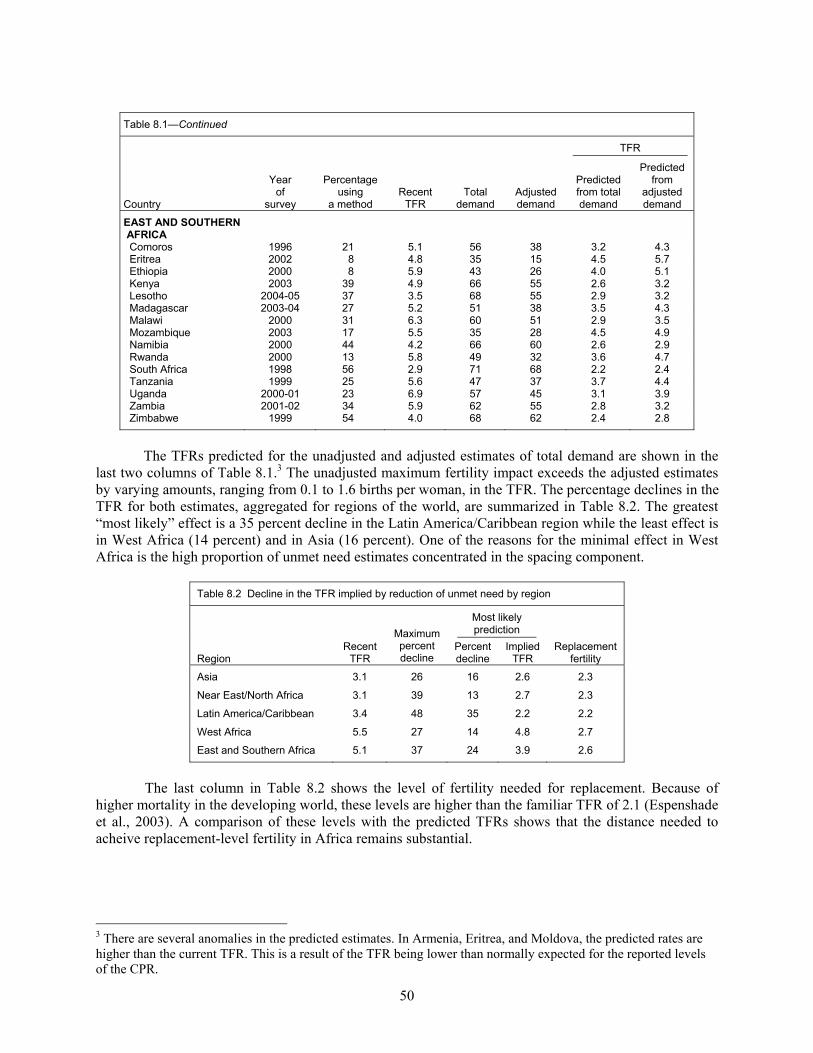
49
Table 8.1 Potential impact on fertility of reducing unmet need
TFR
Country
Year of
survey
Percentageusing
a method Recent
TFRTotal
demandAdjusted demand
Predicted from total demand
Predicted from
adjusted demand
ASIA Bangladesh 2004 58 3.0 71 67 2.2 2.5 Cambodia 2000 24 4.0 56 41 3.2 4.0 India 1998 48 2.9 64 58 2.7 2.8 Indonesia 2002-03 60 2.6 70 66 2.3 2.5 Kazakhstan 1999 66 2.1 75 73 2.0 2.1 Nepal 2001 39 4.1 67 60 2.5 2.9 Philippines 2003 49 3.5 69 58 2.4 2.8 Turkmenistan 2000 62 2.9 72 69 2.2 2.4 Uzbekistan 1996 56 3.8 69 63 2.4 2.7 Vietnam 2002 79 1.9 84 82 1.4 1.6
NEAR EAST/NORTH AFRICA/EUROPE
Armenia 2000 61 1.7 74 69 2.1 2.4 Egypt 2003 60 3.2 71 67 2.2 2.5 Jordan 2002 56 3.7 70 63 2.3 2.7 Moldova 2005 68 1.7 75 67 2.0 2.5 Morocco 2003-04 63 2.5 75 71 2.0 2.2 Turkey 2003 71 2.2 78 73 1.9 2.1 Yemen 1997 21 6.5 59 33 3.0 4.6
LATIN AMERICA/ CARIBBEAN
Bolivia 2003 58 3.8 81 73 1.6 2.1 Brazil 1996 77 2.5 86 82 1.3 1.6 Colombia 2005 78 2.4 86 83 1.3 1.6 Dominican Republic 2002 70 3.0 82 78 1.6 1.8 Guatemala 1999 38 5.0 63 47 2.8 3.7 Haiti 2000 28 4.7 68 56 2.4 3.2 Nicaragua 2001 69 3.2 83 79 1.5 1.7 Peru 2004 71 2.4 82 77 1.6 1.9
WEST AFRICA Benin 2001 19 5.6 46 36 3.8 4.4 Burkina Faso 2003 14 6.2 43 29 4.0 4.9 Cameroon 2004 26 5.0 46 36 3.8 4.4 Central African Republic
1995 15 5.1 31 26 4.7 5.1
Chad 2004 3 6.3 26 22 5.1 5.3 Congo (Brazzaville) 2005 44 4.8 60 50 2.9 3.5 Côte d’Ivoire 1998-99 15 5.2 43 30 4.0 4.8 Gabon 2000 33 4.3 61 50 2.9 3.5 Ghana 2003 25 4.4 59 46 3.0 3.8 Guinea 1999 6 5.5 30 17 4.8 5.6 Mali 2001 8 6.8 37 19 4.4 5.5 Niger 1998 8 7.5 25 13 5.1 5.9 Nigeria 2003 13 5.7 30 19 4.8 5.5 Senegal 2003-04 12 5.3 43 23 4.0 5.2 Togo 1998 24 5.2 56 45 3.2 3.9
Continued...
50
Table 8.1—Continued
TFR
Country
Year of
survey
Percentageusing
a method Recent
TFRTotal
demandAdjusted demand
Predicted from total demand
Predicted from
adjusted demand
EAST AND SOUTHERN AFRICA
Comoros 1996 21 5.1 56 38 3.2 4.3 Eritrea 2002 8 4.8 35 15 4.5 5.7 Ethiopia 2000 8 5.9 43 26 4.0 5.1 Kenya 2003 39 4.9 66 55 2.6 3.2 Lesotho 2004-05 37 3.5 68 55 2.9 3.2 Madagascar 2003-04 27 5.2 51 38 3.5 4.3 Malawi 2000 31 6.3 60 51 2.9 3.5 Mozambique 2003 17 5.5 35 28 4.5 4.9 Namibia 2000 44 4.2 66 60 2.6 2.9 Rwanda 2000 13 5.8 49 32 3.6 4.7 South Africa 1998 56 2.9 71 68 2.2 2.4 Tanzania 1999 25 5.6 47 37 3.7 4.4 Uganda 2000-01 23 6.9 57 45 3.1 3.9 Zambia 2001-02 34 5.9 62 55 2.8 3.2 Zimbabwe 1999 54 4.0 68 62 2.4 2.8
The TFRs predicted for the unadjusted and adjusted estimates of total demand are shown in the last two columns of Table 8.1.3 The unadjusted maximum fertility impact exceeds the adjusted estimates by varying amounts, ranging from 0.1 to 1.6 births per woman, in the TFR. The percentage declines in the TFR for both estimates, aggregated for regions of the world, are summarized in Table 8.2. The greatest “most likely” effect is a 35 percent decline in the Latin America/Caribbean region while the least effect is in West Africa (14 percent) and in Asia (16 percent). One of the reasons for the minimal effect in West Africa is the high proportion of unmet need estimates concentrated in the spacing component.
Table 8.2 Decline in the TFR implied by reduction of unmet need by region
Most likely prediction
Region Recent
TFR
Maximum percentdecline
Percentdecline
Implied TFR
Replacement fertility
Asia 3.1 26 16 2.6 2.3
Near East/North Africa 3.1 39 13 2.7 2.3
Latin America/Caribbean 3.4 48 35 2.2 2.2
West Africa 5.5 27 14 4.8 2.7
East and Southern Africa 5.1 37 24 3.9 2.6
The last column in Table 8.2 shows the level of fertility needed for replacement. Because of higher mortality in the developing world, these levels are higher than the familiar TFR of 2.1 (Espenshade et al., 2003). A comparison of these levels with the predicted TFRs shows that the distance needed to acheive replacement-level fertility in Africa remains substantial.
3 There are several anomalies in the predicted estimates. In Armenia, Eritrea, and Moldova, the predicted rates are higher than the current TFR. This is a result of the TFR being lower than normally expected for the reported levels of the CPR.

51
9 Conclusions
Although declining in many developing countries, unmet need for family planning remains significant, especially in the least developed countries where it reaches levels above 20 percent of married women in 31 of the 58 countries examined. Moreover, even in those countries experiencing declines in unmet need, numerical increases in population growth can more than overcome the gains (Ross and Winfrey, 2002). Regionally, the greatest need remains in sub-Saharan Africa with an average of 26 percent of married women classified in the unmet need category. In other regions, this average is 16 percent, ranging from a low of 5 percent in Vietnam to 40 percent in Haiti. Focusing on the unmet need for modern methods, the average is 32 percent in sub-Saharan Africa and 27 percent in other regions.
With the exception of Pakistan, there is consistent evidence of a decline in total unmet need in the 19 Asian, Near Eastern, and North African countries reviewed here. In the eight Latin American/ Caribbean countries, similar declines are evident except in Haiti and Nicaragua, which show no change. In West Africa, there is hardly any decline apparent in contrast to East and Southern Africa where declines are evident in about half of the countries. Trends in unmet need are fairly uniform across educational categories, but in some sub-Saharan African countries, unmet need shows an increase over time that is concentrated in the least educated populations.
A crucial component of unmet need is the existence of significant proportions of women with unmet need who have never used contraception and who do not intend to use any method in the future. This percentage is declining in most countries but remains above 10 percent of married women in a significant number of sub-Saharan African countries. This presents a particular challenge to family planning service providers.
Unmet need among unmarried women has been approached here by studying trends in nonuse of contraception by unmarried sexually active women in sub-Saharan Africa. The picture is fairly clear and indicates that over time more women in this category are using a method.
In addition to the relevance of unmet need for family planning administrators, the subject is particularly relevant for future fertility levels and rates of population growth. The upshot of this analysis is that the satisfaction of unmet need, even with conservative assumptions, could reduce fertility significantly.
In summary, unmet need remains an important issue in family planning (Casterline and Sinding, 2000; Casterline et al., 2003). Although the percentage of total demand satisfied exceeds 80 percent in most of the countries outside of sub-Saharan Africa, it has reached only 45 percent, on average, in sub-Saharan Africa.

53
References
Bongaarts, J. 1991. The KAP-gap and the unmet need for contraception. Population and Development Review 17(2): 293-313.
Casterline, J.B. and S.W. Sinding. 2000. Unmet need for family planning and implications for population policy. Population and Development Review 26(4): 691-723.
Casterline, J.B., F. El-Zanatay, and L.O. El-Zeini. 2003. Unmet need and unintended fertility: Longitudinal evidence from Upper Egypt. International Family Planning Perspectives 29: 158-166.
Espenshade, T.J., J.C. Guzman, and C.F. Westoff. 2003. The surprising global variation in replacement fertility. Population Research and Policy Review 22(5-6): 575-583.
National Institute for Population Studies (NIPS). 2003. Status of women, reproductive health and family planning survey.
Ross, J.A. and W.L. Winfrey. 2002. Unmet need for contraception in the developing world and the former Soviet Union: An updated estimate. International Family Planning Perspectives 28: 138-143.
Rutstein, S.O. and K. Johnson. 2004. The DHS Wealth Index. DHS Comparative Reports No. 6. Calverton, Maryland: ORC Macro.
Westoff, C.F. 1978. The unmet need for birth control in five Asian countries. Family Planning Perspectives 10: 173-181.
Westoff, C.F. 1988. The potential demand for family planning: A new measure of unmet need and estimates for five Latin American countries. International Family Planning Perspectives 14(2): 45-53.
Westoff, C.F. 2001. Unmet need at the end of the century. DHS Comparative Reports No. 1. Calverton, Maryland: ORC Macro.
Westoff, C.F. and A. Bankole. 1995. Unmet need: 1990-1994. DHS Comparative Studies No. 16. Calverton, Maryland: Macro International Inc.
Westoff, C.F. and A.R. Cross. 2006. The stall in the fertility transition in Kenya. DHS Analytical Studies No. 9. Calverton, Maryland: ORC Macro.
Westoff, C.F. and L.H. Ochoa. 1991. Unmet need and the demand for family planning. DHS Comparative Studies No. 5. Columbia, Maryland: Institute for Resource Development.
Westoff, C.F. and A.R. Pebley. 1981. Alternative measures of unmet need for family planning in developing countries. International Family Planning Perspectives 7(4): 126-136.


55
Appendix A
Table A.1 Unmet need and the demand for modern methods of family planning, by level of education and wealth quintile
Country
Unmet need for a modern
method
Using a modernmethod
Total demand for family planning
Percentage of demand satisfied by
modernmethods
ASIA Bangladesh 2005 22.1 47.3 71.4 66.3 Education
None 21.6 48.3 71.4 67.7 Primary incomplete 23.6 45.4 71.3 63.7 Primary complete 23.5 47.4 72.9 65.0 Secondary incomplete 21.4 46.7 70.2 66.5 Higher 30.8 49.1 73.2 67.1
Wealth quintile Lowest 22.0 44.7 68.7 65.1 Second 21.7 47.7 71.3 66.9 Middle 22.9 46.6 71.5 65.2 Fourth 22.4 47.4 71.8 66.0 Highest 21.1 50.1 73.0 68.5
Cambodia 2000 34.7 18.8 53.5 35.1 Education
None 34.7 16.2 50.9 31.9 Primary 34.7 19.0 53.8 35.4 Secondary 35.0 23.2 58.1 39.9 Higher 21.1 22.6 43.7 51.7
Wealth quintile Lowest 40.5 12.5 53.0 23.6 Second 35.7 15.4 51.2 30.1 Middle 32.8 20.1 52.9 38.1 Fourth 32.7 19.9 52.7 37.8 Highest 32.0 25.4 57.4 44.2
India 1998-1999 21.2 42.8 64.0 66.9 Education
None 20.2 38.4 58.6 65.6 Primary 19.6 49.1 68.7 71.4 Secondary 22.7 47.4 70.1 67.6 Higher 26.8 46.5 73.3 63.5
Wealth quintile Lowest 24.4 29.3 53.7 54.6 Second 22.1 34.9 57.0 61.2 Middle 19.5 44.9 64.4 69.7 Fourth 19.6 49.7 69.2 71.7 Highest 20.6 54.6 75.1 72.6
Indonesia 2002-2003 12.2 56.7 69.7 81.3 Education
None 13.3 44.8 58.7 76.3 Primary 11.2 57.5 69.4 82.9 Secondary 13.0 58.5 72.4 80.8 Higher 16.9 54.4 72.1 75.5
Wealth quintile Lowest 14.2 52.2 66.9 78.0 Second 11.6 57.1 68.6 83.2 Middle 10.9 57.9 69.9 82.8 Fourth 11.2 61.0 72.6 84.0 Highest 13.3 55.3 69.5 79.6
Continued...
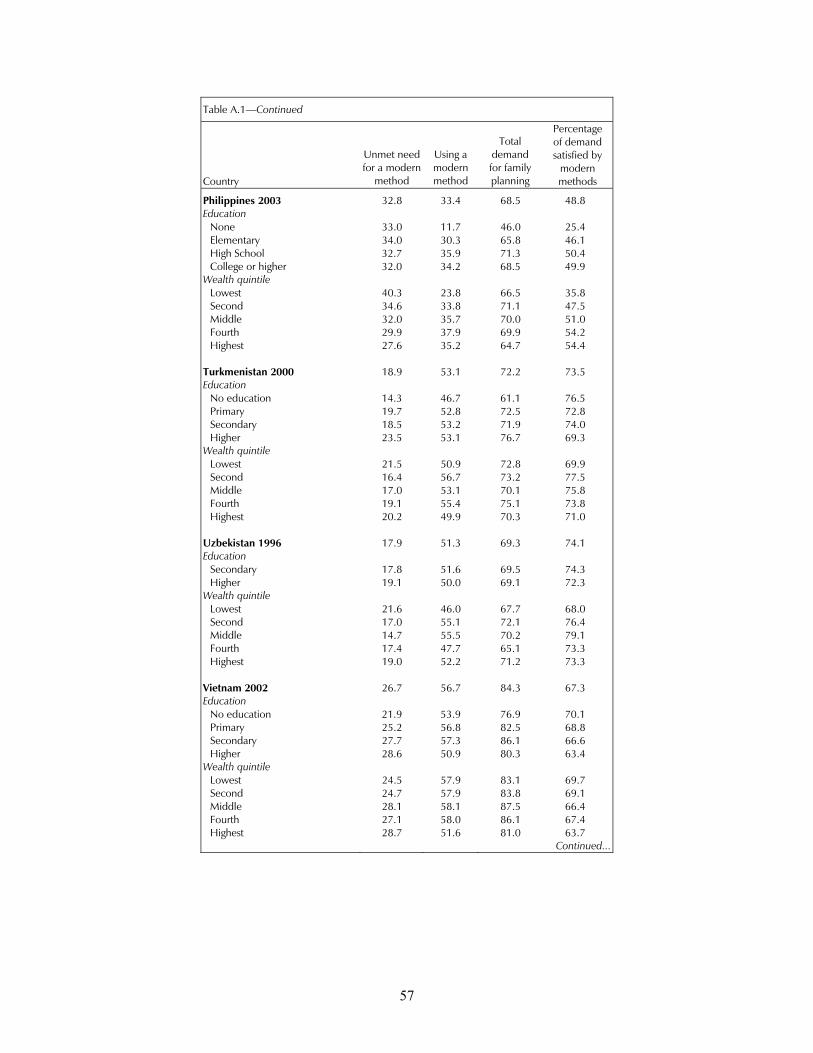
56
Table A.1—Continued
Country
Unmet need for a modern
method
Using a modernmethod
Total demand for family planning
Percentage of demand satisfied by
modernmethods
Kazakhstan 1999 22.1 52.7 75.2 70.1 Education
Secondary 22.6 51.5 74.6 69.0 Higher 19.5 57.6 77.1 74.7
Wealth quintile Lowest 26.8 48.9 76.0 64.3 Second 23.1 50.6 74.3 68.1 Middle 19.3 50.9 72.8 69.9 Fourth 23.2 54.5 77.9 70.0 Highest 19.2 55.1 74.5 74.0
Kyrgyz Republic 1997 22.3 48.9 71.2 68.7 Education
Secondary 22.3 48.6 70.9 68.6 Higher 22.0 51.2 73.2 69.9
Wealth quintile Lowest 24.2 44.4 68.6 64.8 Second 21.2 44.9 66.1 67.9 Middle 19.5 48.4 67.9 71.3 Fourth 22.6 50.9 73.6 69.3 Highest 23.8 54.4 78.1 69.6
Moldova 2005 30.6 43.8 75.2 58.2 Education
Secondary 32.4 40.2 73.5 54.7 Secondary Special 28.2 47.7 76.1 62.7 Higher 27.7 50.9 79.4 64.1
Wealth quintile Lowest 35.4 36.6 73.4 49.9 Second 35.2 38.6 74.8 51.6 Middle 33.3 43.0 76.6 56.1 Fourth 27.2 46.4 74.2 62.5 Highest 24.7 51.3 76.5 67.1
Nepal 2001 31.7 35.4 67.1 52.7 Education
None 31.4 33.5 65.0 51.6 Primary 33.0 37.7 70.7 53.3 Secondary 31.6 42.7 74.3 57.5 Higher 33.8 42.1 75.9 55.4
Wealth quintile Lowest 37.0 23.8 60.8 39.1 Second 34.4 28.7 63.2 45.5 Middle 34.5 31.7 66.1 47.9 Fourth 29.0 38.9 67.9 57.3 Highest 23.1 55.2 78.3 70.5
Continued...

57
Table A.1—Continued
Country
Unmet need for a modern
method
Using a modernmethod
Total demand for family planning
Percentage of demand satisfied by
modernmethods
Philippines 2003 32.8 33.4 68.5 48.8 Education
None 33.0 11.7 46.0 25.4 Elementary 34.0 30.3 65.8 46.1 High School 32.7 35.9 71.3 50.4 College or higher 32.0 34.2 68.5 49.9
Wealth quintile Lowest 40.3 23.8 66.5 35.8 Second 34.6 33.8 71.1 47.5 Middle 32.0 35.7 70.0 51.0 Fourth 29.9 37.9 69.9 54.2 Highest 27.6 35.2 64.7 54.4
Turkmenistan 2000 18.9 53.1 72.2 73.5 Education
No education 14.3 46.7 61.1 76.5 Primary 19.7 52.8 72.5 72.8 Secondary 18.5 53.2 71.9 74.0 Higher 23.5 53.1 76.7 69.3
Wealth quintile Lowest 21.5 50.9 72.8 69.9 Second 16.4 56.7 73.2 77.5 Middle 17.0 53.1 70.1 75.8 Fourth 19.1 55.4 75.1 73.8 Highest 20.2 49.9 70.3 71.0
Uzbekistan 1996 17.9 51.3 69.3 74.1 Education
Secondary 17.8 51.6 69.5 74.3 Higher 19.1 50.0 69.1 72.3
Wealth quintile Lowest 21.6 46.0 67.7 68.0 Second 17.0 55.1 72.1 76.4 Middle 14.7 55.5 70.2 79.1 Fourth 17.4 47.7 65.1 73.3 Highest 19.0 52.2 71.2 73.3
Vietnam 2002 26.7 56.7 84.3 67.3 Education
No education 21.9 53.9 76.9 70.1 Primary 25.2 56.8 82.5 68.8 Secondary 27.7 57.3 86.1 66.6 Higher 28.6 50.9 80.3 63.4
Wealth quintile Lowest 24.5 57.9 83.1 69.7 Second 24.7 57.9 83.8 69.1 Middle 28.1 58.1 87.5 66.4 Fourth 27.1 58.0 86.1 67.4 Highest 28.7 51.6 81.0 63.7
Continued...
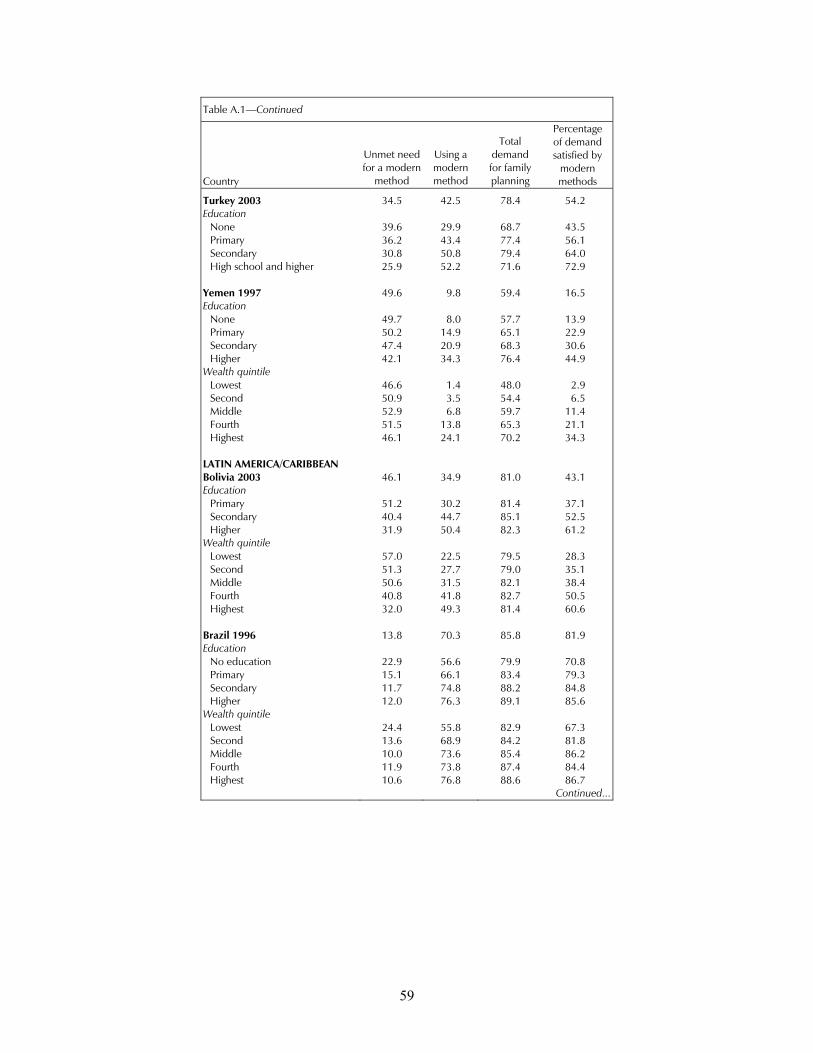
58
Table A.1—Continued
Country
Unmet need for a modern
method
Using a modernmethod
Total demand for family planning
Percentage of demand satisfied by
modernmethods
NEAR EAST/NORTH AFRICA Armenia 2000 50.1 22.3 73.6 30.3 Education
Secondary 52.7 19.6 73.6 26.6 Higher 37.7 35.3 73.8 47.8
Wealth quintile Lowest 58.0 15.5 76.6 20.2 Second 55.8 20.9 78.3 26.7 Middle 49.8 22.4 73.2 30.6 Fourth 46.5 22.3 69.3 32.2 Highest 41.5 29.2 70.9 41.2
Egypt 2005 13.0 56.5 70.4 80.3 Education
None 15.4 52.2 68.5 76.2 Primary 12.2 60.5 73.9 81.9 Secondary 12.3 57.9 70.8 81.3 Higher 11.3 58.4 70.9 82.4
Wealth quintile Lowest 17.5 50.0 68.3 73.2 Second 13.7 54.4 69.3 78.5 Middle 12.9 57.2 70.8 80.8 Fourth 10.9 60.0 71.9 83.4 Highest 10.8 59.6 71.4 83.5
Jordan 2002 25.6 41.2 69.7 59.1 Education
None 23.7 33.0 58.4 56.5 Primary 26.6 34.9 62.8 55.6 Secondary 24.7 43.3 71.2 60.8 Higher 27.5 41.0 72.1 56.9
Wealth quintile Lowest 30.2 31.7 65.3 48.5 Second 24.1 39.1 66.6 58.7 Middle 25.4 40.9 69.3 59.0 Fourth 24.5 46.0 73.1 62.9 Highest 23.6 50.2 75.8 66.2
Morocco 2003-2004 18.2 54.8 75.0 73.1 Education
None 18.3 53.7 74.0 72.6 Primary 15.9 56.8 74.4 76.3 Secondary 18.3 59.0 79.4 74.3 Higher 27.5 46.2 76.5 60.4
Wealth quintile Lowest 18.0 51.4 71.5 71.9 Second 16.3 55.2 73.9 74.7 Middle 17.5 55.4 74.9 74.0 Fourth 18.7 54.8 75.4 72.7 Highest 20.6 56.8 79.2 71.7
Continued...
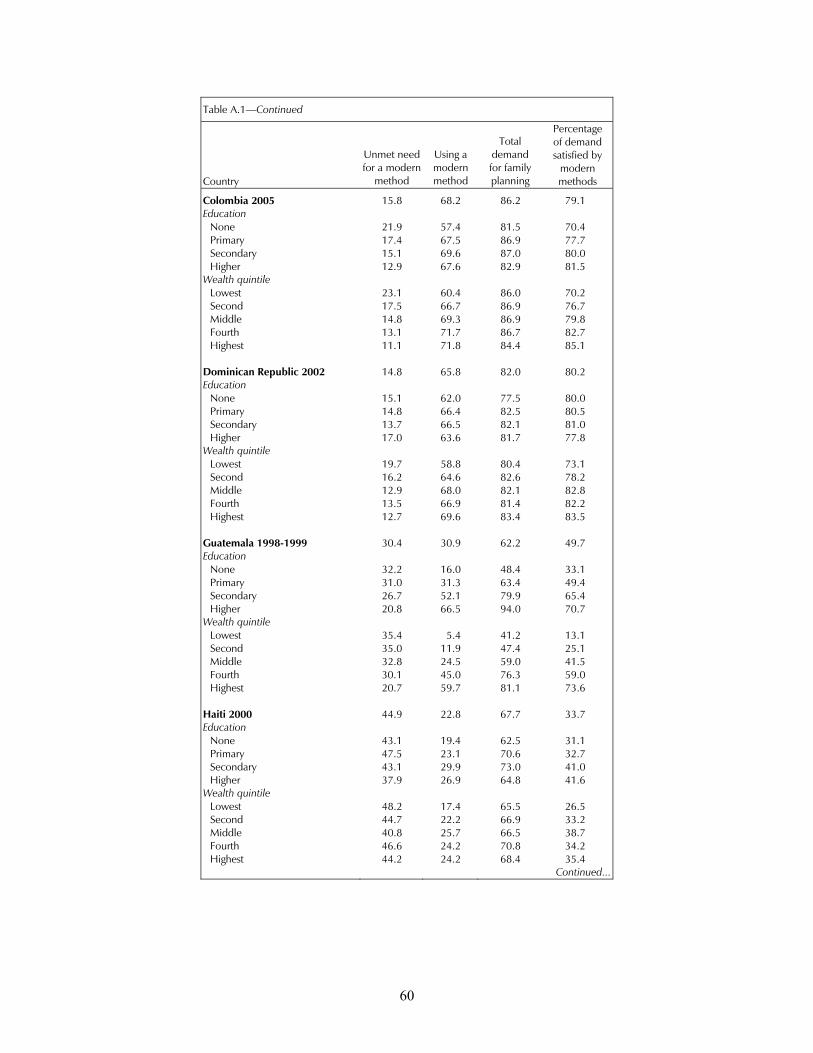
59
Table A.1—Continued
Country
Unmet need for a modern
method
Using a modernmethod
Total demand for family planning
Percentage of demand satisfied by
modernmethods
Turkey 2003 34.5 42.5 78.4 54.2 Education
None 39.6 29.9 68.7 43.5 Primary 36.2 43.4 77.4 56.1 Secondary 30.8 50.8 79.4 64.0 High school and higher 25.9 52.2 71.6 72.9
Yemen 1997 49.6 9.8 59.4 16.5 Education
None 49.7 8.0 57.7 13.9 Primary 50.2 14.9 65.1 22.9 Secondary 47.4 20.9 68.3 30.6 Higher 42.1 34.3 76.4 44.9
Wealth quintile Lowest 46.6 1.4 48.0 2.9 Second 50.9 3.5 54.4 6.5 Middle 52.9 6.8 59.7 11.4 Fourth 51.5 13.8 65.3 21.1 Highest 46.1 24.1 70.2 34.3
LATIN AMERICA/CARIBBEAN Bolivia 2003 46.1 34.9 81.0 43.1 Education
Primary 51.2 30.2 81.4 37.1 Secondary 40.4 44.7 85.1 52.5 Higher 31.9 50.4 82.3 61.2
Wealth quintile Lowest 57.0 22.5 79.5 28.3 Second 51.3 27.7 79.0 35.1 Middle 50.6 31.5 82.1 38.4 Fourth 40.8 41.8 82.7 50.5 Highest 32.0 49.3 81.4 60.6
Brazil 1996 13.8 70.3 85.8 81.9 Education
No education 22.9 56.6 79.9 70.8 Primary 15.1 66.1 83.4 79.3 Secondary 11.7 74.8 88.2 84.8 Higher 12.0 76.3 89.1 85.6
Wealth quintile Lowest 24.4 55.8 82.9 67.3 Second 13.6 68.9 84.2 81.8 Middle 10.0 73.6 85.4 86.2 Fourth 11.9 73.8 87.4 84.4 Highest 10.6 76.8 88.6 86.7
Continued...
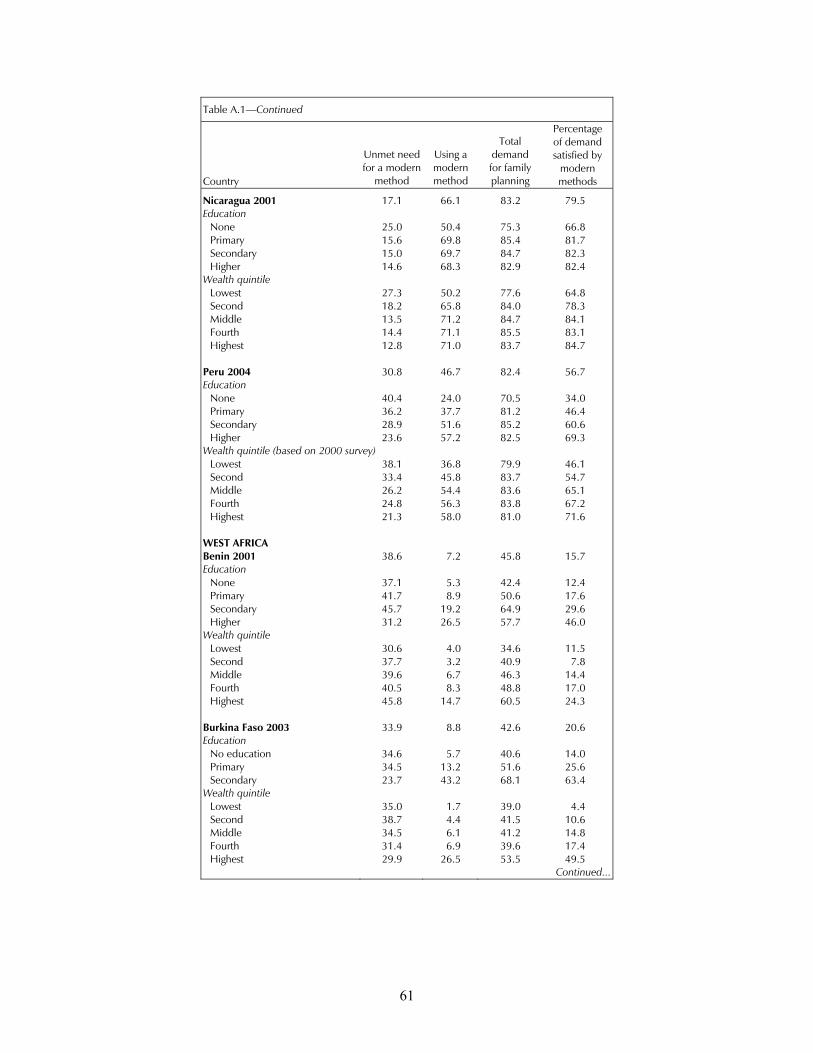
60
Table A.1—Continued
Country
Unmet need for a modern
method
Using a modernmethod
Total demand for family planning
Percentage of demand satisfied by
modernmethods
Colombia 2005 15.8 68.2 86.2 79.1 Education
None 21.9 57.4 81.5 70.4 Primary 17.4 67.5 86.9 77.7 Secondary 15.1 69.6 87.0 80.0 Higher 12.9 67.6 82.9 81.5
Wealth quintile Lowest 23.1 60.4 86.0 70.2 Second 17.5 66.7 86.9 76.7 Middle 14.8 69.3 86.9 79.8 Fourth 13.1 71.7 86.7 82.7 Highest 11.1 71.8 84.4 85.1
Dominican Republic 2002 14.8 65.8 82.0 80.2 Education
None 15.1 62.0 77.5 80.0 Primary 14.8 66.4 82.5 80.5 Secondary 13.7 66.5 82.1 81.0 Higher 17.0 63.6 81.7 77.8
Wealth quintile Lowest 19.7 58.8 80.4 73.1 Second 16.2 64.6 82.6 78.2 Middle 12.9 68.0 82.1 82.8 Fourth 13.5 66.9 81.4 82.2 Highest 12.7 69.6 83.4 83.5
Guatemala 1998-1999 30.4 30.9 62.2 49.7 Education
None 32.2 16.0 48.4 33.1 Primary 31.0 31.3 63.4 49.4 Secondary 26.7 52.1 79.9 65.4 Higher 20.8 66.5 94.0 70.7
Wealth quintile Lowest 35.4 5.4 41.2 13.1 Second 35.0 11.9 47.4 25.1 Middle 32.8 24.5 59.0 41.5 Fourth 30.1 45.0 76.3 59.0 Highest 20.7 59.7 81.1 73.6
Haiti 2000 44.9 22.8 67.7 33.7 Education
None 43.1 19.4 62.5 31.1 Primary 47.5 23.1 70.6 32.7 Secondary 43.1 29.9 73.0 41.0 Higher 37.9 26.9 64.8 41.6
Wealth quintile Lowest 48.2 17.4 65.5 26.5 Second 44.7 22.2 66.9 33.2 Middle 40.8 25.7 66.5 38.7 Fourth 46.6 24.2 70.8 34.2 Highest 44.2 24.2 68.4 35.4 Continued...

61
Table A.1—Continued
Country
Unmet need for a modern
method
Using a modernmethod
Total demand for family planning
Percentage of demand satisfied by
modernmethods
Nicaragua 2001 17.1 66.1 83.2 79.5 Education
None 25.0 50.4 75.3 66.8 Primary 15.6 69.8 85.4 81.7 Secondary 15.0 69.7 84.7 82.3 Higher 14.6 68.3 82.9 82.4
Wealth quintile Lowest 27.3 50.2 77.6 64.8 Second 18.2 65.8 84.0 78.3 Middle 13.5 71.2 84.7 84.1 Fourth 14.4 71.1 85.5 83.1 Highest 12.8 71.0 83.7 84.7
Peru 2004 30.8 46.7 82.4 56.7 Education
None 40.4 24.0 70.5 34.0 Primary 36.2 37.7 81.2 46.4 Secondary 28.9 51.6 85.2 60.6 Higher 23.6 57.2 82.5 69.3
Wealth quintile (based on 2000 survey) Lowest 38.1 36.8 79.9 46.1 Second 33.4 45.8 83.7 54.7 Middle 26.2 54.4 83.6 65.1 Fourth 24.8 56.3 83.8 67.2 Highest 21.3 58.0 81.0 71.6
WEST AFRICA Benin 2001 38.6 7.2 45.8 15.7 Education
None 37.1 5.3 42.4 12.4 Primary 41.7 8.9 50.6 17.6 Secondary 45.7 19.2 64.9 29.6 Higher 31.2 26.5 57.7 46.0
Wealth quintile Lowest 30.6 4.0 34.6 11.5 Second 37.7 3.2 40.9 7.8 Middle 39.6 6.7 46.3 14.4 Fourth 40.5 8.3 48.8 17.0 Highest 45.8 14.7 60.5 24.3
Burkina Faso 2003 33.9 8.8 42.6 20.6 Education
No education 34.6 5.7 40.6 14.0 Primary 34.5 13.2 51.6 25.6 Secondary 23.7 43.2 68.1 63.4
Wealth quintile Lowest 35.0 1.7 39.0 4.4 Second 38.7 4.4 41.5 10.6 Middle 34.5 6.1 41.2 14.8 Fourth 31.4 6.9 39.6 17.4 Highest 29.9 26.5 53.5 49.5
Continued...

62
Table A.1—Continued
Country
Unmet need for a modern
method
Using a modernmethod
Total demand for family planning
Percentage of demand satisfied by
modernmethods
Cameroon 2004 31.2 12.5 46.2 27.1 Education
None 22.2 1.3 23.5 5.5 Primary 36.9 11.0 47.9 23.0 Secondary 40.2 24.7 65.0 38.0
Wealth quintile Lowest 24.0 2.3 26.3 8.8 Second 32.5 4.7 37.1 12.7 Middle 38.1 10.6 48.8 21.7 Fourth 39.6 19.3 59.0 32.7 Highest 35.7 26.4 62.1 42.5
Chad 2004 24.4 1.6 26.1 6.1 Education
None 22.3 0.5 22.8 2.2 Primary 32.1 2.6 34.7 7.5 Secondary 33.1 18.1 51.2 35.4
Wealth quintile Lowest 21.8 0.0 21.8 0.5 Second 22.6 0.2 22.7 0.9 Middle 25.0 1.0 26.0 3.9 Fourth 23.4 0.4 23.8 1.7 Highest 30.0 7.3 37.3 19.6
Congo 2005 47.8 12.7 60.4 21.0 Education
None 40.0 5.9 67.7 8.7 Primary 52.2 8.9 69.1 12.9 Secondary I 48.4 14.5 74.7 19.4 Secondary II 40.9 19.1 80.5 23.7
Wealth quintile Lowest 51.3 9.1 60.4 15.1 Second 50.0 6.9 56.9 12.1 Middle 50.8 12.2 63.0 19.4 Fourth 48.2 16.4 64.7 25.3 Highest 39.3 17.9 57.2 31.3
Côte d'Ivoire 1998-1999 35.4 7.3 42.7 17.0 Education
None 32.1 4.4 36.5 12.0 Primary 41.9 10.4 52.3 19.9 Secondary 41.5 19.8 61.3 32.3
Wealth quintile Lowest 27.5 1.9 29.4 6.3 Second 34.2 5.3 39.5 13.5 Middle 37.5 8.5 46.0 18.5 Fourth 39.3 8.8 48.1 18.2 Highest 38.6 12.6 51.2 24.7 Continued...
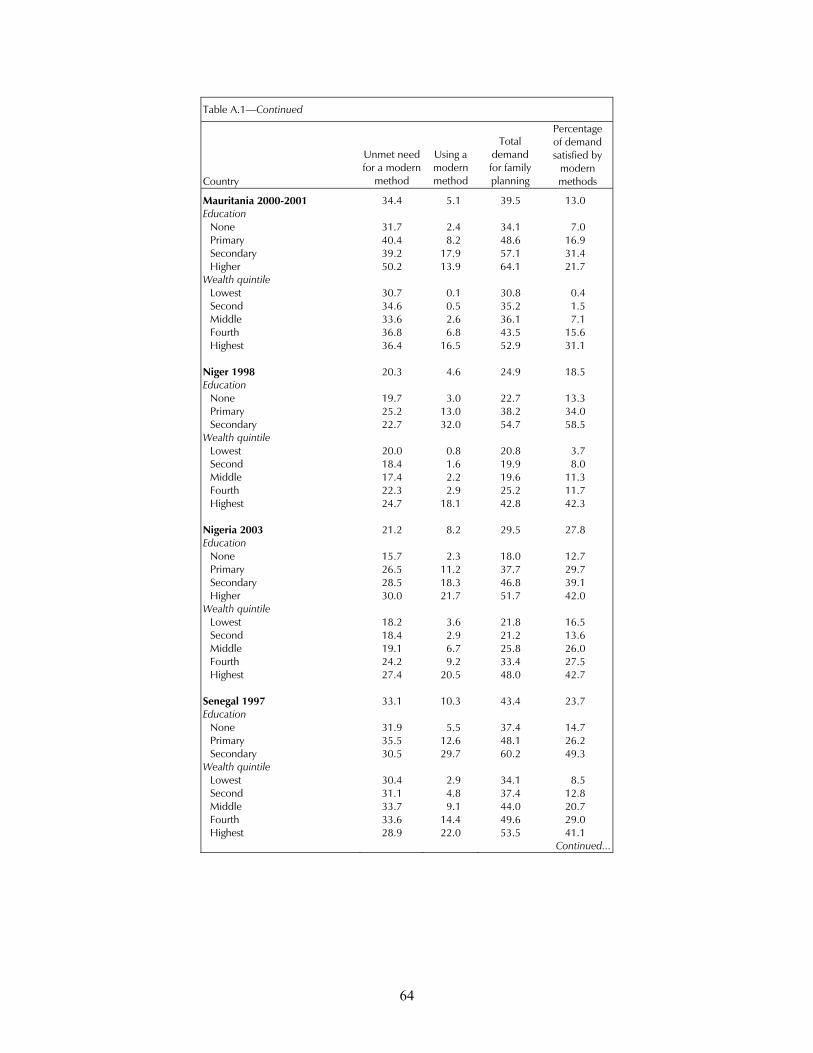
63
Table A.1—Continued
Country
Unmet need for a modern
method
Using a modernmethod
Total demand for family planning
Percentage of demand satisfied by
modernmethods
Gabon 2000 47.3 13.4 60.7 22.1 Education
None 35.8 5.7 41.5 13.8 Primary 46.2 9.2 55.5 16.6 Secondary 51.2 16.3 67.5 24.1 Higher 33.0 33.3 66.3 50.2
Wealth quintile Lowest 44.3 7.7 52.1 14.8 Second 48.8 9.7 58.5 16.6 Middle 49.7 14.6 64.3 22.7 Fourth 47.9 14.8 62.7 23.6 Highest 45.2 18.8 64.0 29.3
Ghana 2003 40.5 18.7 59.2 31.6 Education
None 39.3 11.0 50.4 21.8 Primary 44.9 20.7 65.6 31.6 Secondary 40.4 23.9 64.2 37.2 Higher 35.8 28.1 63.9 44.0
Wealth quintile Lowest 46.2 8.6 54.8 15.7 Second 42.5 19.1 61.7 31.0 Middle 40.8 18.6 59.4 31.3 Fourth 40.7 21.3 62.0 34.4 Highest 32.2 26.3 58.4 45.0
Guinea 2005 24.6 5.7 30.3 18.8 Education
None 23.3 4.3 27.6 15.6 Primary 29.3 9.3 37.9 24.5 Secondary+ 35.9 18.4 54.2 34.0
Wealth quintile Lowest 21.4 2.7 24.1 11.2 Second 23.3 3.0 26.3 11.4 Middle 26.4 4.3 30.6 14.1 Fourth 26.2 7.0 33.2 21.1 Highest 27.0 12.7 39.7 32.0
Mali 2001 29.6 7.0 36.6 19.1 Education
None 29.1 5.2 34.3 15.2 Primary 32.6 11.7 44.2 26.3 Secondary 33.3 24.8 58.1 42.7 Higher 23.1 38.4 61.5 62.4
Wealth quintile Lowest 29.4 4.2 33.7 12.5 Second 28.2 3.6 31.8 11.2 Middle 27.9 3.4 31.3 11.0 Fourth 29.6 7.3 36.9 19.7 Highest 33.5 17.9 51.4 34.8 Continued...

64
Table A.1—Continued
Country
Unmet need for a modern
method
Using a modernmethod
Total demand for family planning
Percentage of demand satisfied by
modernmethods
Mauritania 2000-2001 34.4 5.1 39.5 13.0 Education
None 31.7 2.4 34.1 7.0 Primary 40.4 8.2 48.6 16.9 Secondary 39.2 17.9 57.1 31.4 Higher 50.2 13.9 64.1 21.7
Wealth quintile Lowest 30.7 0.1 30.8 0.4 Second 34.6 0.5 35.2 1.5 Middle 33.6 2.6 36.1 7.1 Fourth 36.8 6.8 43.5 15.6 Highest 36.4 16.5 52.9 31.1
Niger 1998 20.3 4.6 24.9 18.5 Education
None 19.7 3.0 22.7 13.3 Primary 25.2 13.0 38.2 34.0 Secondary 22.7 32.0 54.7 58.5
Wealth quintile Lowest 20.0 0.8 20.8 3.7 Second 18.4 1.6 19.9 8.0 Middle 17.4 2.2 19.6 11.3 Fourth 22.3 2.9 25.2 11.7 Highest 24.7 18.1 42.8 42.3
Nigeria 2003 21.2 8.2 29.5 27.8 Education
None 15.7 2.3 18.0 12.7 Primary 26.5 11.2 37.7 29.7 Secondary 28.5 18.3 46.8 39.1 Higher 30.0 21.7 51.7 42.0
Wealth quintile Lowest 18.2 3.6 21.8 16.5 Second 18.4 2.9 21.2 13.6 Middle 19.1 6.7 25.8 26.0 Fourth 24.2 9.2 33.4 27.5 Highest 27.4 20.5 48.0 42.7
Senegal 1997 33.1 10.3 43.4 23.7 Education
None 31.9 5.5 37.4 14.7 Primary 35.5 12.6 48.1 26.2 Secondary 30.5 29.7 60.2 49.3
Wealth quintile Lowest 30.4 2.9 34.1 8.5 Second 31.1 4.8 37.4 12.8 Middle 33.7 9.1 44.0 20.7 Fourth 33.6 14.4 49.6 29.0 Highest 28.9 22.0 53.5 41.1 Continued...
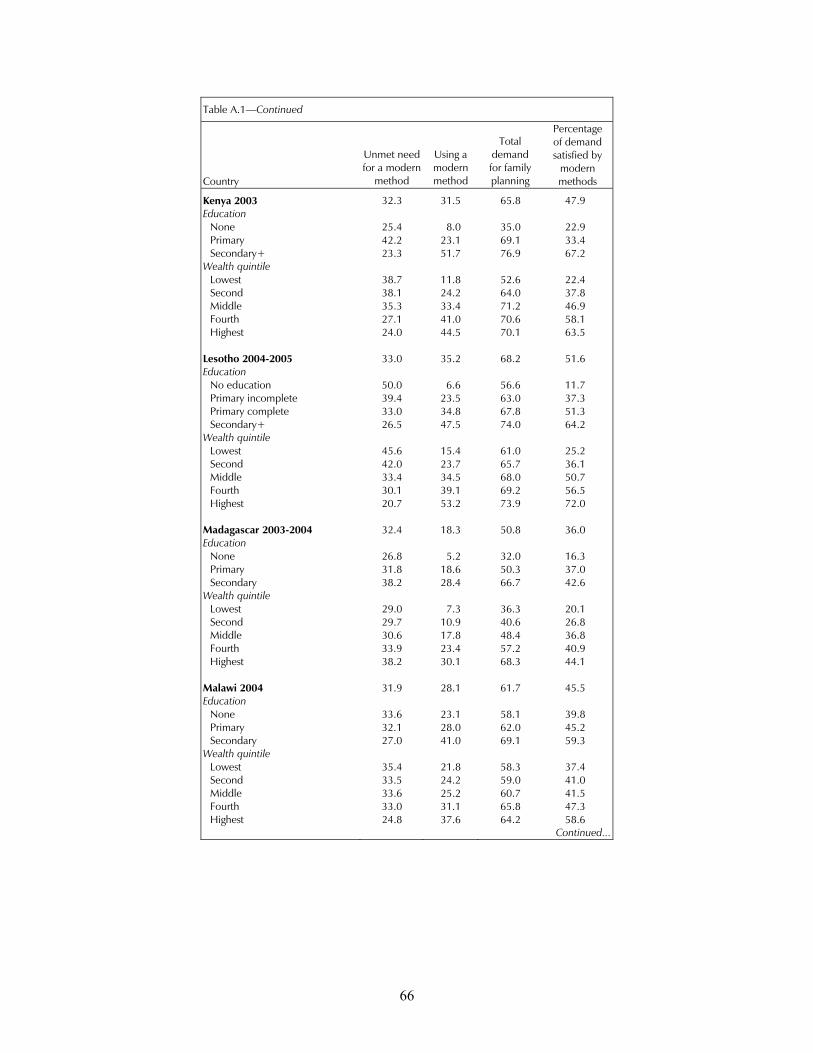
65
Table A.1—Continued
Country
Unmet need for a modern
method
Using a modernmethod
Total demand for family planning
Percentage of demand satisfied by
modernmethods
Togo 1998 48.8 7.0 55.8 12.5 Education
None 48.2 4.3 52.5 8.3 Primary 52.3 9.0 61.3 14.7 Secondary 42.7 15.6 58.3 26.7 Higher 37.2 9.3 46.5 20.0
Wealth quintile Lowest 52.0 3.3 55.3 5.9 Second 48.1 4.9 53.0 9.3 Middle 50.9 7.0 57.9 12.0 Fourth 48.1 7.5 55.6 13.5 Highest 44.7 12.5 57.2 21.9
EAST AND SOUTHERN AFRICA
Comoros 1996 44.2 11.4 55.6 20.5 Education
None 44.0 10.7 54.7 19.6 Primary 49.2 11.0 60.1 18.2 Secondary 39.3 14.2 53.6 26.5
Wealth quintile Lowest 54.4 6.6 60.9 10.8 Second 46.9 11.6 58.5 19.8 Middle 42.5 10.2 52.7 19.3 Fourth 42.4 10.0 52.4 19.1 Highest 34.7 18.6 53.3 34.9
Eritrea 2002 27.8 7.3 35.1 20.7 Education
None 26.6 3.2 29.8 10.8 Primary 31.4 11.3 42.7 26.4 Secondary 25.9 18.9 44.8 42.3 Higher 32.7 21.3 54.0 39.4
Wealth quintile Lowest 27.3 1.4 28.8 5.0 Second 28.1 2.2 30.3 7.3 Middle 31.9 3.7 35.6 10.5 Fourth 28.1 12.8 40.9 31.3 Highest 23.0 17.9 41.0 43.8
Ethiopia 2005 34.6 13.9 48.7 28.5 Education
None 34.7 9.8 44.7 21.9 Primary 38.5 21.9 60.5 36.2 Secondary+ 23.6 45.9 70.8 64.8
Wealth quintile Lowest 33.2 4.0 37.3 10.7 Second 38.0 6.5 44.6 14.6 Middle 37.2 11.6 49.1 23.6 Fourth 36.5 15.2 52.0 29.2 Highest 27.3 33.7 61.3 55.0 Continued...

66
Table A.1—Continued
Country
Unmet need for a modern
method
Using a modernmethod
Total demand for family planning
Percentage of demand satisfied by
modernmethods
Kenya 2003 32.3 31.5 65.8 47.9 Education
None 25.4 8.0 35.0 22.9 Primary 42.2 23.1 69.1 33.4 Secondary+ 23.3 51.7 76.9 67.2
Wealth quintile Lowest 38.7 11.8 52.6 22.4 Second 38.1 24.2 64.0 37.8 Middle 35.3 33.4 71.2 46.9 Fourth 27.1 41.0 70.6 58.1 Highest 24.0 44.5 70.1 63.5
Lesotho 2004-2005 33.0 35.2 68.2 51.6 Education
No education 50.0 6.6 56.6 11.7 Primary incomplete 39.4 23.5 63.0 37.3 Primary complete 33.0 34.8 67.8 51.3 Secondary+ 26.5 47.5 74.0 64.2
Wealth quintile Lowest 45.6 15.4 61.0 25.2 Second 42.0 23.7 65.7 36.1 Middle 33.4 34.5 68.0 50.7 Fourth 30.1 39.1 69.2 56.5 Highest 20.7 53.2 73.9 72.0
Madagascar 2003-2004 32.4 18.3 50.8 36.0 Education
None 26.8 5.2 32.0 16.3 Primary 31.8 18.6 50.3 37.0 Secondary 38.2 28.4 66.7 42.6
Wealth quintile Lowest 29.0 7.3 36.3 20.1 Second 29.7 10.9 40.6 26.8 Middle 30.6 17.8 48.4 36.8 Fourth 33.9 23.4 57.2 40.9 Highest 38.2 30.1 68.3 44.1
Malawi 2004 31.9 28.1 61.7 45.5 Education
None 33.6 23.1 58.1 39.8 Primary 32.1 28.0 62.0 45.2 Secondary 27.0 41.0 69.1 59.3
Wealth quintile Lowest 35.4 21.8 58.3 37.4 Second 33.5 24.2 59.0 41.0 Middle 33.6 25.2 60.7 41.5 Fourth 33.0 31.1 65.8 47.3 Highest 24.8 37.6 64.2 58.6 Continued...

67
Table A.1—Continued
Country
Unmet need for a modern
method
Using a modernmethod
Total demand for family planning
Percentage of demand satisfied by
modernmethods
Mozambique 2003 23.1 11.7 34.8 33.6 Education
None 21.9 4.7 26.6 17.7 Primary 24.4 15.6 40.1 38.9 Secondary 20.4 47.4 67.8 69.9
Wealth quintile Lowest 21.6 3.9 25.6 15.2 Second 23.0 5.1 28.1 18.2 Middle 23.3 8.3 31.8 26.1 Fourth 24.4 11.8 36.1 32.7 Highest 24.1 34.8 58.9 59.1
Namibia 2000 23.3 42.6 65.9 64.7 Education
No education 23.7 27.4 51.1 53.7 Primary 28.7 31.9 60.6 52.6 Secondary 20.4 54.2 74.6 72.7 Higher 5.9 65.4 71.4 91.7
Wealth quintile Lowest 27.6 28.8 56.5 51.1 Second 28.2 24.1 52.4 46.1 Middle 26.3 30.3 56.7 53.4 Fourth 23.9 48.5 72.4 67.0 Highest 15.2 64.2 79.5 80.8
Rwanda 2005 45.0 7.1 55.3 12.8 Education
No education 45.0 5.0 50.1 10.0 Primary 45.9 7.6 55.4 13.7 Secondary 39.8 11.2 68.9 16.3
Wealth quintile Lowest 45.0 5.0 51.1 9.8 Second 46.3 7.8 52.7 14.8 Middle 46.8 7.3 55.2 13.2 Fourth 44.5 6.4 52.9 12.1 Highest 43.3 9.4 65.8 14.3
South Africa 1998 16.1 55.1 71.2 77.4 Education
No education 28.1 30.4 58.5 52.0 Primary 19.9 46.3 66.2 69.9 Secondary 13.2 61.8 75.0 82.4 Higher 6.0 74.7 80.7 92.6
Wealth quintile Lowest 27.0 34.0 61.0 55.7 Second 22.8 45.1 67.9 66.4 Middle 16.4 54.5 70.9 76.9 Fourth 12.2 62.1 74.4 83.6 Highest 7.3 70.3 77.7 90.6 Continued...

68
Table A.1—Continued
Country
Unmet need for a modern
method
Using a modernmethod
Total demand for family planning
Percentage of demand satisfied by
modernmethods
Tanzania 2004-2005 28.2 20.0 49.5 40.4 Education
No education 27.1 8.3 36.1 23.0 Primary 29.2 23.6 54.4 43.4 Secondary 22.8 28.2 61.4 45.9
Wealth quintile Lowest 28.8 10.7 40.4 26.5 Second 28.1 12.8 41.9 30.6 Middle 31.6 15.6 48.5 32.2 Fourth 28.3 24.1 54.0 44.6 Highest 24.6 36.0 62.3 57.8
Uganda 2000-2001 39.1 18.2 57.3 31.7 Education
No education 38.3 9.4 47.7 19.6 Primary 41.7 16.8 58.5 28.7 Secondary 31.2 40.1 71.2 56.2 Higher 18.9 51.1 70.0 73.0
Wealth quintile Lowest 38.2 11.3 49.4 22.8 Second 41.4 9.3 50.7 18.4 Middle 42.5 11.9 54.5 21.9 Fourth 42.7 19.5 62.2 31.4 Highest 30.9 40.6 71.6 56.8
Zambia 2001-2002 36.3 25.3 61.6 41.1 Education
No education 39.4 11.0 50.4 21.8 Primary 38.3 21.8 60.1 36.3 Secondary 30.1 41.2 71.4 57.8 Higher 23.0 56.3 79.2 71.0
Wealth quintile Lowest 39.8 10.8 50.6 21.3 Second 41.7 12.9 54.6 23.6 Middle 38.8 19.5 58.3 33.5 Fourth 35.2 31.8 67.0 47.4 Highest 25.1 52.3 77.4 67.5
Zimbabwe 1999 16.1 50.4 68.2 73.9 Education
No education 21.7 35.2 59.1 59.6 Primary 20.5 44.4 66.4 66.9 Secondary 10.8 58.9 71.6 82.3 Higher 7.2 65.6 73.6 89.1
Wealth quintile Lowest 22.0 41.1 64.2 64.0 Second 21.4 42.1 65.9 63.9 Middle 20.2 42.8 63.8 67.1 Fourth 12.1 53.7 68.0 79.0 Highest 7.9 67.4 77.3 87.2
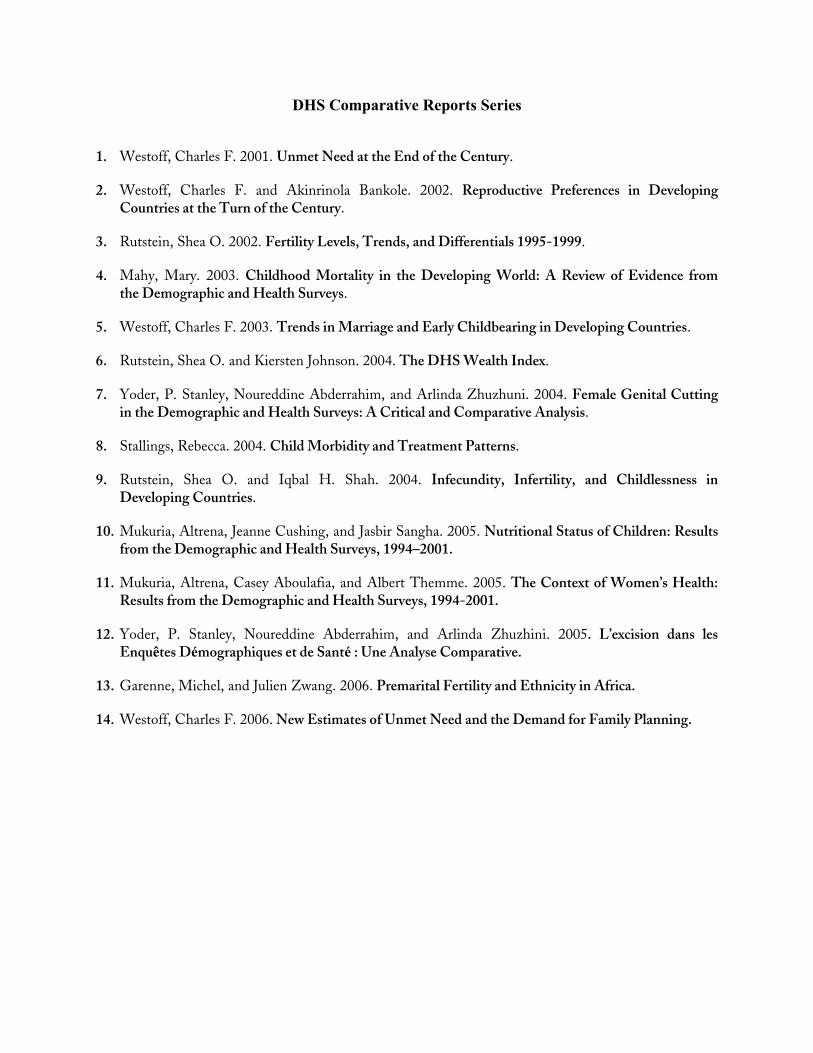

DHS Comparative Reports Series
1. Westoff, Charles F. 2001. Unmet Need at the End of the Century.
2. Westoff, Charles F. and Akinrinola Bankole. 2002. Reproductive Preferences in Developing Countries at the Turn of the Century.
3. Rutstein, Shea O. 2002. Fertility Levels, Trends, and Differentials 1995-1999.
4. Mahy, Mary. 2003. Childhood Mortality in the Developing World: A Review of Evidence from the Demographic and Health Surveys.
5. Westoff, Charles F. 2003. Trends in Marriage and Early Childbearing in Developing Countries.
6. Rutstein, Shea O. and Kiersten Johnson. 2004. The DHS Wealth Index.
7. Yoder, P. Stanley, Noureddine Abderrahim, and Arlinda Zhuzhuni. 2004. Female Genital Cutting in the Demographic and Health Surveys: A Critical and Comparative Analysis.
8. Stallings, Rebecca. 2004. Child Morbidity and Treatment Patterns.
9. Rutstein, Shea O. and Iqbal H. Shah. 2004. Infecundity, Infertility, and Childlessness in Developing Countries.
10. Mukuria, Altrena, Jeanne Cushing, and Jasbir Sangha. 2005. Nutritional Status of Children: Results from the Demographic and Health Surveys, 1994–2001.
11. Mukuria, Altrena, Casey Aboulafia, and Albert Themme. 2005. The Context of Women’s Health: Results from the Demographic and Health Surveys, 1994-2001.
12. Yoder, P. Stanley, Noureddine Abderrahim, and Arlinda Zhuzhini. 2005. L’excision dans les Enquêtes Démographiques et de Santé : Une Analyse Comparative.
13. Garenne, Michel, and Julien Zwang. 2006. Premarital Fertility and Ethnicity in Africa.
14. Westoff, Charles F. 2006. New Estimates of Unmet Need and the Demand for Family Planning.