diabetes 2014 roberts db14 0496
DESCRIPTION
penyakit gulaTRANSCRIPT

Inorganic Nitrate Promotes the Browning of White Adipose
Tissue through the Nitrate-Nitrite-Nitric Oxide Pathway
Journal: Diabetes
Manuscript ID: DB14-0496.R2
Manuscript Type: Original Article
Date Submitted by the Author: 27-Aug-2014
Complete List of Authors: Roberts, Lee; University of Cambridge, Medical Research Council - Human Nutrition Research Ashmore, Tom; University of Cambridge, Physiology, Development and Neuroscience Kotwica, Aleksandra; University of Cambridge, Physiology, Development and Neuroscience
Murfitt, Steven; University of Cambridge, Department of Biochemistry Fernandez, Bernadette; University of Southampton, Faculty of Medicine, Clinical & Experimental Sciences Feelisch, Martin; University of Southampton, Faculty of Medicine, Clinical & Experimental Sciences Murray, Andrew; University of Cambridge, Physiology, Development and Neuroscience Griffin, Julian; University of Cambridge, Medical Research Council - Human Nutrition Research
For Peer Review Only
Diabetes
Diabetes Publish Ahead of Print, published online September 23, 2014

Inorganic Nitrate Promotes the Browning of White Adipose Tissue through
the Nitrate-Nitrite-Nitric Oxide Pathway
Running Title: Nitrate Induces the Browning of White Fat
Lee D Roberts1,2 *
, Tom Ashmore2,3
, Aleksandra O Kotwica3, Steven A Murfitt
2, Bernadette
O Fernandez4, Martin Feelisch
4, Andrew J Murray
3 †, Julian L Griffin
1,2 *
1. Medical Research Council – Human Nutrition Research, Elsie Widdowson
Laboratory, 120 Fulbourn Road, Cambridge, CB2 9NL, UK.
2. Department of Biochemistry and Cambridge Systems Biology Centre, University of
Cambridge, 80 Tennis Court Road, Old Addenbrooke's Site, Cambridge, CB2 1GA,
UK.
3. Department of Physiology, Development and Neuroscience, University of Cambridge,
Downing Street, Cambridge, CB2 3EG, UK.
4. Faculty of Medicine, Clinical & Experimental Sciences, University of Southampton,
Southampton General Hospital, Tremona Road, Southampton, SO16 6YD, UK.
Keywords: Nitrate, White Adipose Tissue, Thermogenesis, Hypoxia, Nitrite, Metabolomics.
† These authors contributed equally
* Corresponding Authors: Lee D. Roberts. MRC Human Nutrition Research, Elsie Widdowson
Laboratory, 120 Fulbourn Road, Cambridge, UK. CB1 9NL.
Email: [email protected] Tel.: +44 1223 427678
or Julian L. Griffin. MRC Human Nutrition Research, Elsie Widdowson Laboratory, 120
Fulbourn Road, Cambridge, UK. CB1 9NL.
Email: [email protected] Tel.: + 44 1223 764922.
Page 1 of 52
For Peer Review Only
Diabetes

Abstract
Inorganic nitrate was once considered an oxidation end-product of nitric oxide metabolism
with little biological activity. However, recent studies have demonstrated that dietary nitrate
can modulate mitochondrial function in man and is effective in reversing features of the
metabolic syndrome in mice. Using a combined histological, metabolomics, and
transcriptional and protein analysis approach we mechanistically define that nitrate not only
increases the expression of thermogenic genes in brown-adipose tissue but also induces the
expression of brown adipocyte-specific genes and proteins in white adipose tissue,
substantially increasing oxygen consumption and fatty acid β-oxidation in adipocytes. Nitrate
induces these phenotypic changes through a mechanism distinct from known physiological
small molecule activators of browning, the recently identified nitrate-nitrite-nitric oxide
pathway. The nitrate-induced browning effect was enhanced in hypoxia, a serious co-
morbidity affecting white adipose tissue in obese individuals, and corrected impaired brown
adipocyte-specific gene expression in white adipose tissue in a murine model of obesity.
Since resulting beige/brite cells exhibit anti-obesity and anti-diabetic effects, nitrate may be
an effective means of inducing the browning response in adipose tissue to treat the metabolic
syndrome.
Page 2 of 52
For Peer Review Only
Diabetes
The diffuse and complex nature of the metabolic syndrome integrates peripheral insulin
resistance and visceral obesity with cardiovascular disease; making the discovery of
underlying molecular mechanisms that unite the aspects of the metabolic syndrome both
challenging and essential. The perturbation of nitric oxide (NO) synthesis and signaling has
emerged as a potential modulator of both cardiovascular morbidity and metabolic dysfunction
(1; 2).
Until recently inorganic nitrate was considered a non-bioactive product of NO oxidation (3).
However, a number of studies have identified nitrate treatment of humans and rodents as
having effects similar to NO (4; 5). The discovery of anti-obesity effects of nitrate in rodents,
including weight loss, a reduction of body fat, reversal of lipodystrophy and an improvement
in glucose and insulin homeostasis, may highlight nitrate as having therapeutic potential for
the treatment of the metabolic syndrome (6).
Dietary nitrate increases the circulating concentration of cGMP in humans (7) and low
nitrate/nitrite diets decrease steady-state concentrations of cGMP in a number of tissues (8).
Recently, cGMP has been shown to regulate energy balance in white adipocytes (9). The
development of a brown adipocyte-like phenotype in white adipocytes, a process known as
“browning”, includes the induction of thermogenesis, the dissipation of chemical energy to
produce heat (10; 11). Peroxisome proliferator activated receptor γ co-activator 1α (PGC-1α)
activates key components of the thermogenic program in white adipocytes, including fatty
acid oxidation, mitochondrial biogenesis, and increased oxygen consumption (12). The
thermogenic process occurs through the activity and increased expression of several brown-
adipocyte specific genes including uncoupling protein 1 (UCP1), an inner mitochondrial
membrane protein that uncouples the mitochondrial proton gradient (13). Cells expressing
brown-adipocyte specific genes are interspersed within the white adipose tissue (WAT) of
rodents and humans (so-called “beige” or “brite” cells) (14; 15)) and demonstrate anti-
Page 3 of 52
For Peer Review Only
Diabetes

diabetic and anti-obesity effects in rodent models (16-19). The recent discovery of a
physiological small molecule activator of browning in WAT highlights metabolites as both
potential mediators of the thermogenic response and therapeutics for the metabolic syndrome
(20).
In this study we investigate the effect of nitrate on WAT metabolism both in the classic
experimental model of browning in vitro, the mouse primary adipocyte, and in vivo in mice
and rats to establish whether this may, in part, explain the anti-obesity activity of nitrate. We
demonstrate that nitrate increases the expression of brown-adipocyte specific genes and
concordant proteins within white adipocytes to confer a brown-adipocyte like phenotype.
Page 4 of 52
For Peer Review Only
Diabetes
Research Design and Methods
Animal Experimentation. Male Wistar rats (6 weeks old) (269 ± 2 g; n = 24) (Charles
River.) were weight matched and received either distilled water or water containing sodium
nitrate (NaNO3) (0.35, 0.7, 1.4 mM; n = 6/group) (Ultra-pure, Sigma-Aldrich) ad libitum for
18 days with food and water intake monitored. Animals were housed in conventional cages
at room temperature with a 12-hour/12-hour light/dark photoperiod. In the hypoxia study,
male Wistar rats (6 weeks old) were weight matched and separated into two groups (n =
10/group), housed in either normoxic or normobaric hypoxic environments (hypoxia
chamber: 13% O2, with 20 air changes per hour). The rats in each group received either
distilled water containing NaCl (n = 5, 0.7mM NaCl) or water containing NaNO3 (0.7 mM; n
= 5) for 14 days. All other details are as above.
Male p129 mice (6 weeks old) received either distilled water containing NaCl (0.7mM,
Control, n = 7) or NaNO3 (0.7mM, n = 7) (Ultra-pure, Sigma-Aldrich) ad libitum for 15 days
with food and water intake monitored.
ob/ob mice (n = 10) and C57bl/6 wild type mice (n = 10) (9 weeks old, The Jackson
Laboratory) received either distilled water containing NaCl (0.7mM, Control, n = 5) or
NaNO3 (0.7mM, n = 5) (Ultra-pure, Sigma-Aldrich) ad libitum for 8 weeks with food and
water intake monitored. Animals were housed in conventional cages at room temperature
with a 12-hour/12-hour light/dark photoperiod.
All animals had micro-nutrient levels normalized by a standardized quality controlled (SQC)
diet (RM1 (E); 55% crude carbohydrate, 3% crude fat, 15% crude protein; Special Diets
Page 5 of 52
For Peer Review Only
Diabetes

Services, UK) one week prior to study commencement. The nitrate content of this diet is 2
mg/Kg and the nitrite content was undetectable below a threshold of 1 mg/Kg.
All procedures were carried out in accordance with UK Home Office protocols by a personal
license holder.
Blood and Tissue Collection. Rats and mice were euthanized with sodium pentobarbital
(200 mg/ml, Vétoquinol UK Ltd.). Blood was obtained by cardiac puncture, collected in N-
ethylmaleimide/EDTA (10 and 2.5 mM, respectively) containing tubes and immediately
centrifuged to obtain plasma. WAT and interscapular brown adipose tissue (iBAT) were
removed and flash frozen in liquid nitrogen.
Histology. WAT was fixed for 24 hr in 10% formalin and washed for 1 hr in PBS before
being set in wax. The tissue was then cut into 8 µm thick slices and stained with
haematoxylin and eosin.
Plasma Nitrate Measurements. Plasma nitrate was measured as described previously (21).
Culture and Differentiation of Primary Adipocytes. Primary white adipose stromal
vascular cells were fractionated from 6 – 10 week old C57BL6 male mice as previously
described (22). Stromal vascular cells were then cultured and differentiated into adipocytes
according to published methods (22; 23). During the 6 day differentiation, cells were
cultured with either saline (control), 25 µM NaNO3, 50 µM NaNO3 or 500 µM NaNO3 (Ultra-
pure, Sigma-Aldrich) or, during the investigation of the effects of sodium nitrite (NaNO2),
with saline (control), 50 µM NaNO2 or 500 µM NaNO2 (Ultra-pure, Sigma-Aldrich). The
Page 6 of 52
For Peer Review Only
Diabetes
pharmacological inhibitor studies utilized 2-Phenyl-4,4,5,5-tetramethylimidazoline-1-oxyl 3-
oxide (PTIO) (50 µM), NG-nitro-L-arginine methyl ester (L-NAME) (1 mM), 1H-[1,2,
4]oxadiazolo[4,3-a]quinoxalin-1-one (ODQ) (1 µM) (Sigma-Aldrich) and KT5823 (1 µM)
(Santa Cruz Biotechnology). Cells were treated with PTIO, L-NAME, ODQ or KT5823 with
and without 500 µM NaNO3. NaNO3 and inhibitors were added at day 1 of differentiation. In
the hypoxia study, cells were isolated and differentiated as above. Hypoxic conditions were
achieved using a New Brunswick Eppendorf Galaxy 14S incubator supplied with nitrogen
and set to maintain a 2% O2 environment.
siRNA Xanthine Oxidoreductase Knockdown. FlexiTube siRNA against XOR, AllStars
negative control siRNA and HiPerFect Transfection Reagent were purchased from Qiagen.
Transfection of primary adipocytes was carried out as per the manufacturer’s instructions (75
ng siRNA, 3 µl transfection reagent per well,10 nM final siRNA concentration) on day 2 and
4 of differentiation.
Tissue and Primary Adipocyte Metabolite Extraction. Metabolites were extracted from
WAT and primary adipocytes as previously described (24).
13C-palmitate Substrate Labeling Study. Palmitate was solubilized using a dialyzed
albumin solution (24). At 6 days post-differentiation medium was removed from primary
adipocytes and replaced with serum free media containing insulin 850 nM, triiodothyronin 1
nM, and rosiglitazone 1 µM and 140 µM U-13
C labeled palmitate (Cambridge Isotope
Laboratories). After 2 days cells were collected and metabolites extracted as previously
described. During the 8 days of the experiments duration, cells were cultured with either
saline (control), 50 µM NaNO3 or 500 µM NaNO3.
Page 7 of 52
For Peer Review Only
Diabetes

Gene Expression Analysis. Total RNA extraction from WAT, BAT, and adipocytes, cDNA
conversion and quantitative RT-PCR was performed according to published protocols (20).
All data were normalized to 18SrRNA (mouse WAT, BAT and adipocytes) or RLPL1 (rat
WAT) and quantitative measures obtained using the ∆-∆-CT method.
Protein Analysis. Analysis of UCP1 and PGC-1α was performed using ELISA as per the
manufacturer’s instructions (UCP1 Kit SEF557Ra, PGC-1α Kit SEH337Ra, Cloud-Clone
Corp. Houston, TX, USA). Immunoblotting for CPT1 was carried out as previously described
(25).
Citrate Synthase Assay. Citrate synthase was assayed according to Houle-Leroy et al.(26).
White Adipocyte Respirometry. Oxygen consumption rates were measured in white
adipocytes (250,000 cells) maintained in Krebs-Henseleit buffer at 37○C, using Clark-type
oxygen electrodes (Strathkelvin Instruments, Strathkelvin, UK) as described previously (27).
Gas Chromatography-Mass Spectrometry Analysis. Dried aqueous and organic phase
samples were derivatized using the method described previously (24). Gas Chromatography-
Mass Spectrometry (GC-MS) and data analysis were performed according to published
methods (24).
13C-labeled Substrate GC-MS Analysis. Analysis of organic and aqueous phases was
carried out as described above and according to published methods (24).
Page 8 of 52
For Peer Review Only
Diabetes

Liquid Chromatography-Mass Spectrometry Analysis of Intact Lipids. Liquid
Chromatography-Mass Spectrometry (LC-MS) was performed on WAT using a Waters Q-
ToF Xevo mass spectrometer (Waters Corporation, Manchester, UK) operating with
electrospray ionization in combination with an Acquity UPLC according to the method
described by Roberts at al. (24). LC-MS spectra and chromatograms were analyzed using the
MarkerLynx Application MassLynx (version 4.1; Waters Corporation) using published
protocols (24).
LC-MS Analysis of cGMP. LC-MS analysis of cGMP was performed using a 4000 QTRAP
triple quadrupole mass spectrometer (Applied Biosystems/Sciex), coupled to an Acquity
UPLC (Waters Corporation, Manchester, UK) according to a previously described method
(28). The multiple reaction monitoring parameters for cGMP were: Q1 = 346.13 m/z, Q3 =
152.1 m/z, collision energy = 23, declustering potential = 41, collision cell exit potential = 10.
Statistical Analyses. Error bars represent standard error of the mean. P-values were
calculated by either one-way or two-way ANOVA as stated with a Dunnett’s post-hoc test
when multiple comparisons where made solely to control and a Tukey’s post-hoc test when
comparisons were made between all treatment groups.
Page 9 of 52
For Peer Review Only
Diabetes
Results
Nitrate Induces a Brown Adipocyte-like Phenotype in White Adipocytes In Vivo
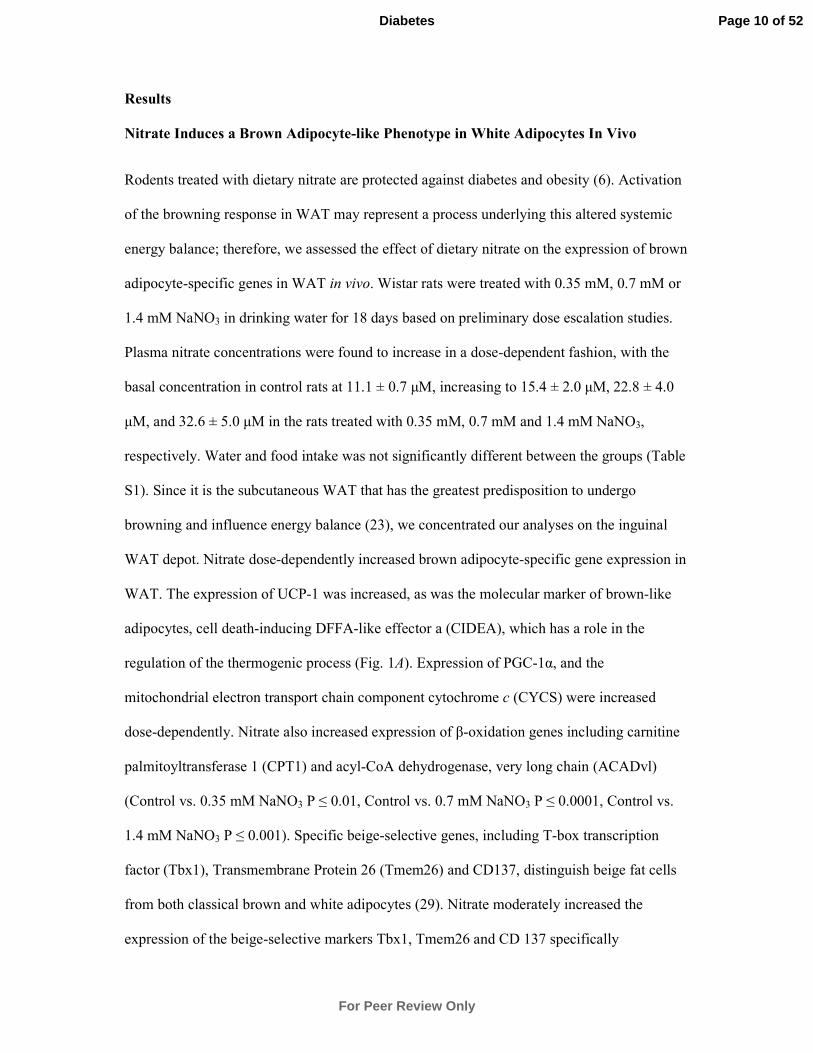
Rodents treated with dietary nitrate are protected against diabetes and obesity (6). Activation
of the browning response in WAT may represent a process underlying this altered systemic
energy balance; therefore, we assessed the effect of dietary nitrate on the expression of brown
adipocyte-specific genes in WAT in vivo. Wistar rats were treated with 0.35 mM, 0.7 mM or
1.4 mM NaNO3 in drinking water for 18 days based on preliminary dose escalation studies.
Plasma nitrate concentrations were found to increase in a dose-dependent fashion, with the
basal concentration in control rats at 11.1 ± 0.7 µM, increasing to 15.4 ± 2.0 µM, 22.8 ± 4.0
µM, and 32.6 ± 5.0 µM in the rats treated with 0.35 mM, 0.7 mM and 1.4 mM NaNO3,
respectively. Water and food intake was not significantly different between the groups (Table
S1). Since it is the subcutaneous WAT that has the greatest predisposition to undergo
browning and influence energy balance (23), we concentrated our analyses on the inguinal
WAT depot. Nitrate dose-dependently increased brown adipocyte-specific gene expression in
WAT. The expression of UCP-1 was increased, as was the molecular marker of brown-like
adipocytes, cell death-inducing DFFA-like effector a (CIDEA), which has a role in the
regulation of the thermogenic process (Fig. 1A). Expression of PGC-1α, and the
mitochondrial electron transport chain component cytochrome c (CYCS) were increased
dose-dependently. Nitrate also increased expression of β-oxidation genes including carnitine
palmitoyltransferase 1 (CPT1) and acyl-CoA dehydrogenase, very long chain (ACADvl)
(Control vs. 0.35 mM NaNO3 P ≤ 0.01, Control vs. 0.7 mM NaNO3 P ≤ 0.0001, Control vs.
1.4 mM NaNO3 P ≤ 0.001). Specific beige-selective genes, including T-box transcription
factor (Tbx1), Transmembrane Protein 26 (Tmem26) and CD137, distinguish beige fat cells
from both classical brown and white adipocytes (29). Nitrate moderately increased the
expression of the beige-selective markers Tbx1, Tmem26 and CD 137 specifically
Page 10 of 52
For Peer Review Only
Diabetes

characterizing these cells as beige adipocytes within the inguinal WAT depot (Fig. S1).
Nitrate did not significantly change the expression of the canonical adipocyte-specific
markers adiponectin (ADIPOQ) and fatty acid binding protein 4 (FABP4) in the WAT
indicating that adipose tissue exposed to nitrate presents similar levels of adipogenesis (Fig.
S2). Furthermore, analysis of brown-adipocyte specific gene expression in the visceral
(epididymal) WAT of nitrate treated rats also revealed a moderate increase in the mRNA of
several genes involved in the thermogenic and browning process (Fig. S3).
To determine whether changes in the expression of key brown adipocyte-specific genes were
translated to the level of protein, the concentrations of UCP-1, PGC-1α and CPT1 protein in
the subcutaneous WAT of nitrate treated rats were analyzed. Nitrate increased the expression
of the brown-adipocyte specific proteins UCP-1 and PGC-1α (Control vs. 0.35 mM NaNO3 P
≤ 0.001, Control vs. 0.7 mM NaNO3 P ≤ 0.05, Control vs. 1.4 mM NaNO3 P = 0.01) (Fig
1.B). Nitrate also increased the concentration of the β-oxidation protein CPT1 within WAT
(Control vs. 0.35 mM NaNO3 P ≤ 0.05, Control vs. 0.7 mM NaNO3 P ≤ 0.05, Control vs. 1.4
mM NaNO3 P ≤ 0.05) (Fig. 1C). The observed induction of characteristic brown adipocyte
genes and increase in the concentration of brown adipocyte-specific proteins suggests a
browning of the subcutaneous WAT.
We next examined whether the changes in gene and protein expression induced by nitrate
resulted in altered energy metabolism within the WAT. The activity of citrate synthase, a
marker of mitochondrial density and TCA cycle flux, was significantly increased following
nitrate treatment, suggesting increased mitochondrial biogenesis consistent with browning of
WAT (Control vs. 0.35 mM NaNO3 P ≤ 0.05, Control vs. 0.7 mM NaNO3 P ≤ 0.05, Control
Page 11 of 52
For Peer Review Only
Diabetes

vs. 1.4 mM P ≤ 0.01) (Fig. 1D). Since beige/brite cells utilize fatty acids as fuel for
thermogenesis, we investigated whether nitrate affected lipid metabolism in the WAT of
treated rats. GC-MS and LC-MS were utilized to measure total fatty acid and triacylglycerol
(TAG) species in the WAT, respectively. Nitrate treatment increased the medium chain fatty
acid (MCFA) (laurate, myristate) / long chain fatty acid (LCFA) (arachidate, behenate) ratio,
indicative of increased β-oxidation shortening fatty acid chain length (Control vs. 0.35 mM
NaNO3 P ≤ 0.05, Control vs. 0.7 mM NaNO3 P ≤ 0.05, Control vs. 1.4 mM NaNO3 P ≤ 0.01)
(Fig. 1E and Fig. S4). LC-MS analysis demonstrated that nitrate also decreased the total TAG
content within WAT (0.95-fold, 0.35 mM NaNO3; 0.94-fold, 0.7 mM NaNO3; 0.98-fold, 1.4
mM NaNO3; Control vs. 0.35 mM P ≤ 0.01, Control vs. 0.7 mM P ≤ 0.01) (Fig. 1F).
Therefore, metabolic changes induced in WAT in vivo by nitrate treatment were characteristic
of a brown adipocyte-like phenotype.
Histological analyses of the inguinal WAT of nitrate treated rats at fifty-times magnification
revealed the presence of fascicles of multilocular brown adipocyte-like cells (Fig 1G). Under
greater magnification the smaller multilocular brown adipocyte-like cells can be observed
confirming morphological changes in the WAT. Together these data indicate that nitrate
induces the browning of WAT.
To ensure nitrate-induced expression of brown adipocyte-specific genes in rat WAT is not
species-specific, mice were treated with 0.7 mM NaNO3 in drinking water. As in rat, brown
adipocyte-specific gene expression was increased in inguinal WAT by nitrate treatment (Fig.
S5A). The expression of thermogenic genes in classical iBAT from nitrate treated mice was
also increased (Fig. S5B).
Page 12 of 52
For Peer Review Only
Diabetes
Nitrate Induces a Brown Adipocyte-like Phenotype in White Adipocytes In Vitro
Nitrate may function directly to increase the expression of brown adipocyte-specific genes in
WAT or indirectly through metabolic bioactivation in cells distinct from those in the target
tissue. Therefore stromal vascular fraction-derived primary adipocytes isolated from inguinal
WAT of mice were treated with nitrate. NaNO3 concentrations of 25 µM, 50 µM and 500 µM
were chosen. The latter two concentrations correspond to plasma levels in mice exhibiting
improved metabolic phenotypes when chronically treated and acutely dosed with 0.1
mmol/kg of NaNO3, respectively (6). Nitrate treatment significantly increased the expression
of brown-adipocyte specific genes UCP-1, CIDEA and PGC-1α. Also increased in expression
were CYCS, CPT1 and ACADvl (Control vs. 25 µM NaNO3 P ≤ 0.01, Control vs. 50 µM
NaNO3 P ≤ 0.0001, Control vs. 500 µM NaNO3 P ≤ 0.0001) (Fig. 2A). By contrast, nitrate did
not significantly affect the expression of a panel of classical mature adipocyte-specific genes
including ADIPOQ, FABP4, and adipsin, suggesting that nitrate dose not directly affect
adipogenesis per se (Fig. S6) (29). These data indicate nitrate mediated induction of brown-
adipocyte specific gene expression occurs directly at the WAT.
We next investigated whether the transcriptional changes induced by nitrate conferred
functional effects on energy expenditure in primary adipocytes. The O2 consumption rates of
adipocytes treated with nitrate (50 µM and 500 µM) were measured (Fig. 2B). The basal O2
consumption rate was dose-dependently increased in adipocytes treated with nitrate (Control
3.1 nmoles O2/min/106 cells, 50 µM NaNO3 4.5 nmoles O2/min/10
6 cells, 500 µM NaNO3 5.1
nmoles O2/min/106 cells, P ≤ 0.05). Maximal respiratory rates were probed using excess
succinate (20 mM) (27), and were found to increase in adipocytes treated with nitrate
(Control 4.2 nmoles O2/min/106 cells, 50 µM NaNO3 6.6 nmoles O2/min/10
6 cells, 500 µM
Page 13 of 52
For Peer Review Only
Diabetes
NaNO3 7.7 nmoles O2/min/106 cells, P ≤ 0.05). These findings indicate that nitrate increases
the respiration of adipocytes consistent with the browning response (Control vs. 50 µM
NaNO3 P ≤ 0.01, Control vs. 500 µM NaNO3 P ≤ 0.001).
GC-MS analysis of the fatty acid metabolism of adipocytes treated with nitrate also
highlighted the increase in the MCFA/LCFA ratio, mirroring the effects observed in WAT in
vivo (Control vs. 50 µM NaNO3 P ≤ 0.05, Control vs. 500 µM NaNO3 P = 0.08) (Fig. 2C).
Nitrate Increases Fatty Acid Uptake and β-oxidation in White Adipocytes In Vitro
To confirm the increased β-oxidation observed in nitrate treated adipocytes, the stable isotope
substrate U-13
C-palmitate was used to monitor flux through the fatty acid oxidation pathway.
Primary adipocytes were incubated in serum-free media containing U-13
C-palmitate and
treated with nitrate. GC-MS analysis was used to determine the relative enrichment of
metabolites. Nitrate significantly increased the 13
C enrichment of palmitate (C16:0) in
adipocytes, indicating increased fatty acid uptake (P ≤ 0.01) (Fig. 3A). Enrichment of shorter
chain fatty acids, myristate (C14:0) and laurate (C12:0) was also increased in nitrate treated
adipocytes (C14:0 P ≤ 0.05, C12:0 P ≤ 0.05) (Fig. 3B and 3C), consistent with augmented
chain shortening through β-oxidation.
The labeled fatty acids are catabolized releasing labeled acetyl-CoA which enters the TCA
cycle. Nitrate treatment increased the labeling of TCA cycle intermediates, citrate (Control
vs. 50 µM NaNO3 P ≤ 0.0001, Control vs. 500 µM NaNO3 P ≤ 0.001) (Fig. 3D), succinate
(Control vs. 500 µM NaNO3 P ≤ 0.05) (Fig. 3E) and malate (Control vs. 500 µM NaNO3 P ≤
0.05) (Fig. 3F). Therefore, nitrate confers a functional effect on white adipocytes, increasing
Page 14 of 52
For Peer Review Only
Diabetes
flux through fatty acid β-oxidation. Taken together, these data demonstrate that nitrate
induces the expression of thermogenic genes and the development of a brown-fat like
phenotype in white adipocytes and WAT.
Nitrate Functions through the Nitrate-Nitrite-NO Pathway to Induce Browning of
Adipocytes
In addition to the classical L-arginine-nitric oxide synthase (NOS)-NO pathway, NO can also
be generated in vivo from nitrate through serial reduction to nitrite and then to NO via the
nitrate-nitrite-NO pathway (30). Therefore, we hypothesized that nitrate might be functioning
via NO to produce the browning response in WAT. Primary adipocytes were differentiated in
the presence of nitrate and the NO scavenger PTIO (Fig. 4A) (Control vs. 500 µM NaNO3 P ≤
0.0001, 500 µM NaNO3 vs. 500 µM NaNO3 + 50 µM PTIO P ≤ 0.0001). Sequestration of NO
by PTIO negated the nitrate-induced expression of brown adipocyte-specific genes,
indicating that nitrate indeed functions via NO to induce browning.
To exclude the induction of NO production through the L-arginine-NOS-NO pathway as a
mechanism of nitrate stimulated browning, control experiments were conducted using the
non-isoform selective NOS inhibitor L-NAME. Inhibition of NOS did not affect nitrate-
stimulated brown adipocyte-specific gene expression in adipocytes (Fig. 4B) (Control vs. 500
µM NaNO3 P ≤ 0.001, Control vs. 500 µM NaNO3 + 1mM L-NAME P ≤ 0.0001, 500 µM
NaNO3 vs. 500 µM NaNO3 + 1mM L-NAME not significant). Therefore, nitrate stimulated
browning functions through NO but independently of NOS.
An enzymatic mechanism for the reduction of nitrate to NO in mammals, catalyzed by XOR,
was recently reported (4). XOR is expressed in WAT and has a role in adipocyte homeostasis
Page 15 of 52
For Peer Review Only
Diabetes

(31). Nitrate dose-dependently increased the expression of XOR in primary adipocytes (Fig.
4C). Using PTIO, the nitrate stimulated increase in XOR expression was demonstrated to be
mediated through NO (Fig. 4D). The expression of XOR in primary adipocytes was knocked
down by approximately 80% using siRNA (Fig 4E). Knockdown of XOR abrogated the
nitrate-induced expression of brown adipocyte-specific genes in white adipocytes (Fig 4F).
Consistent with these results, nitrite promoted brown adipocyte-specific gene expression in
adipocytes via an NO-dependent mechanism (Fig. S7A, B). By examining fold-increases of
brown adipocyte-specific genes, nitrite at equivalent concentrations to nitrate appeared more
potent in inducing the browning response, consistent with the inefficient overall rate of
reduction of nitrate to nitrite and eventually NO (4). These results indicate that nitrate
mediated browning of adipocytes requires XOR and the reduction of nitrate to NO.
Nitrate Increases Browning of Adipocytes Through a cGMP and Protein Kinase G
Mediated Mechanism
We next characterized the downstream signaling/effector pathways mediating nitrate-induced
browning of WAT. NO activates cGMP signaling through stimulation of soluble guanylyl
cyclase (3). cGMP mediates browning of WAT (9) suggesting cGMP signaling as a potential
mechanism underlying nitrate-induced browning. Therefore, we measured the concentration
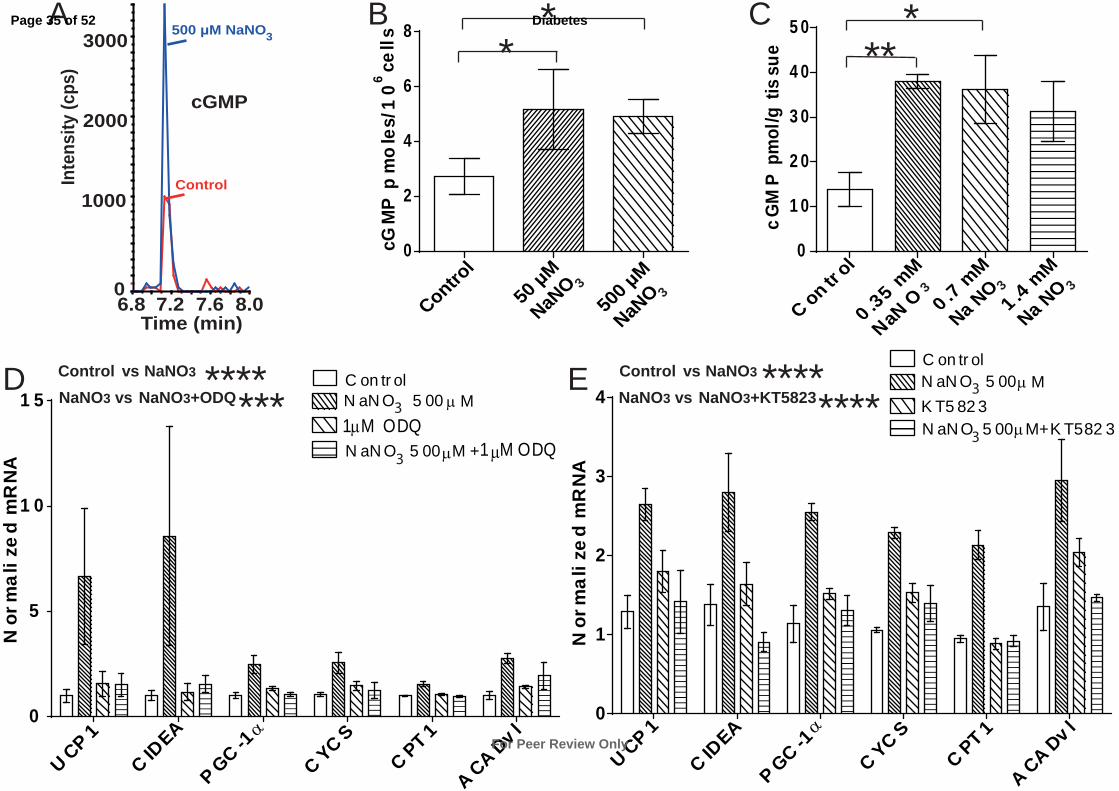
of cGMP in nitrate treated adipocytes using LC-MS (Fig. 5A). Nitrate increased the
concentration of cGMP in adipocytes, from 2.7 pmoles/106 cells in the control to 5.2
pmoles/106 cells and 4.9 pmoles/10
6 cells in the 50 µM NaNO3 and 500 µM NaNO3 treated
cells, respectively (P = 0.04, Control vs. 50 µM NaNO3 P ≤ 0.05, Control vs. 500 µM NaNO3
P ≤ 0.05) (Fig. 5B). Similarly, analysis of WAT from rats demonstrates an increase in cGMP
Page 16 of 52
For Peer Review Only
Diabetes
concentrations in vivo, following nitrate treatment (P < 0.05, Control vs. 0.35mM NaNO3 P ≤
0.01, Control vs. 0.7mM NaNO3 P ≤ 0.05, Control vs. 1.4mM NaNO3 P = 0.07) (Fig. 5C).
The pharmacological inhibitor of guanylyl cyclase, ODQ, was used to confirm a cGMP-
dependent mechanism for nitrate-induced browning. Inhibition of guanylyl cyclase abolished
the nitrate-induced expression of brown adipocyte-specific genes in white adipocytes
(Control vs. 500 µM NaNO3 P ≤ 0.0001, 500 µM NaNO3 vs. 500 µM NaNO3 + 1 µM ODQ
P ≤ 0.001) (Fig. 5D).
The cGMP-dependent protein kinase G (PKG) is expressed in the WAT of rodents and is a
key regulator of adipocyte function (9; 32). Using a pharmacological inhibitor of PKG
(KT5823) we investigated the role of this protein kinase in the nitrate-induced browning
response. Inhibition of PKG abrogated the nitrate-induced expression of brown-adipocyte
specific genes in the adipocytes (Control vs. 500 µM NaNO3 P ≤ 0.0001, 500 µM NaNO3 vs.
500 µM NaNO3 + 1 µM KT5823 P ≤ 0.0001) (Fig. 5E). Therefore, the mechanism
underlying nitrate-induced browning of WAT functions through the cGMP/PKG signaling
axis.
Nitrate Induced Browning of WAT is Enhanced In Hypoxia
Unlike the L-arginine-NOS-NO pathway, which is dependent on oxygen, production of NO
through the nitrate-nitrite-NO pathway is augmented as oxygen concentrations decrease (33)
and may regulate tissue adaptations to hypoxia (34; 35). Since the nitrate-induced browning
of WAT is mediated through the nitrate-nitrite NO pathway, we examined the capacity of
nitrate to increase brown adipocyte-specific gene expression in adipocytes during hypoxia.
Page 17 of 52
For Peer Review Only
Diabetes
Primary adipocytes were treated with NaNO3 (50 µM) in low oxygen conditions (2% O2).
These oxygen concentrations correspond to levels observed in obese WAT (36). In parallel,
adipocytes from the same stromal vascular isolation were treated with NaNO3 (50 µM) under
normoxic conditions. Since nitrate-induced browning requires the reduction of nitrate to NO,
and XOR functions to reduce nitrate to NO (4), we assessed the expression of XOR in the
adipocytes in response to changes in oxygen availability. XOR expression was found to
increase in adipocytes exposed to hypoxia, an effect enhanced by simultaneous nitrate
treatment (Fig. 6A) (Normoxia Control vs. Hypoxia Control P ≤ 0.01, Hypoxia Control vs.
Hypoxia 50 µM NaNO3 P ≤ 0.05, Normoxia 50 µM NaNO3 vs. Hypoxia 50 µM NaNO3 P ≤
0.001). Nitrate also increased the expression of brown adipocyte-specific genes in both the
normoxia and hypoxia conditioned cells (Normoxia Control vs. Normoxia 50 µM NaNO3 P ≤
0.0001, Hypoxia Control vs. Hypoxia 50 µM NaNO3 P ≤ 0.0001) (Fig. S8A). Hypoxia per se
significantly decreased the expression of the brown-adipocyte specific genes compared to
normoxia (Normoxia Control vs. Hypoxia Control P ≤ 0.01). However, nitrate increased the
expression of the brown-adipocyte specific genes and fully restored the expression of UCP1,
CIDEA and CPT1 under hypoxia to levels greater than that of normoxic controls. The
decrease in expression of the genes due to hypoxia alone was corrected for by normalizing
the hypoxia conditioned cells to hypoxia control to facilitate comparison of the fold-changes
in expression of the browning genes following nitrate treatment (Fig. 6B). The fold-change
increase of brown adipocyte-specific gene expression in hypoxic adipocytes treated with
nitrate compared to hypoxic control was significantly greater than that observed in normoxic
cells (Normoxia 50 µM NaNO3 vs. Hypoxia 50 µM NaNO3 P ≤ 0.0001).
To investigate the enhanced browning effect of nitrate in WAT under hypoxic conditions in
vivo, rats were housed in a hypoxia chamber and either received 0.7mM NaCl or 0.7 mM
Page 18 of 52
For Peer Review Only
Diabetes
NaNO3 in their drinking water for 14 days. A parallel group of rats were identically treated
but housed in a normoxic environment. Water and food intake was not significantly different
between the groups (Table S2). As in vitro, XOR expression was increased in WAT of rats
exposed to hypoxia, and further enhanced by nitrate treatment (Fig. 6C) (Normoxia Control
vs. Hypoxia Control P ≤ 0.01, Normoxia 50 µM NaNO3 vs. Hypoxia 50 µM NaNO3 P ≤
0.01). As expected, nitrate increased expression of brown adipose-specific genes in WAT
during normoxia (Normoxia Control vs. Normoxia 0.7 mM NaNO3, P ≤ 0.01) (Fig. 6D).
Brown adipocyte-specific gene expression was also increased in the WAT of rats treated with
nitrate under hypoxic conditions (Hypoxia Control vs. Hypoxia 0.7 mM NaNO3, P < 0.0001).
Interestingly, brown adipocyte-specific gene expression within WAT was significantly
increased in the rats treated with nitrate during hypoxia when compared to those treated with
nitrate and housed in a normoxic environment (Normoxia 0.7 mM NaNO3 vs. Hypoxia
0.7mM NaNO3, P < 0.0001). The expression of ADIPOQ was not significantly affected by
either nitrate or hypoxia (Fig. S8B). Overall, these data indicate that the nitrate-induced
expression of brown adipocyte-specific genes in WAT is augmented in hypoxia.
The WAT of obese humans and rodents is in a hypoxic state that perturbs metabolism,
increasing glycolysis and de novo lipogenesis and decreasing fatty acid breakdown, further
contributing to the pathology of obesity (36-39). Therefore, we investigated the effect of
dietary nitrate on the expression of brown adipocyte-specific genes in WAT in a rodent
model of obesity, the ob/ob mouse. Wild-type C57bl/6 and ob/ob mice received either 0.7
mM NaCl or 0.7 mM NaNO3 in their drinking water for 8 weeks. Plasma nitrate
concentrations were elevated from 59.8 µM ± 4 and 53.8 µM ± 11 in the chloride treated
C57bl/6 and ob/ob mice respectively to 373.1 ± 73 and 323.9 ± 58 in their nitrate treated
counterparts. The expression of several brown adipocyte-specific genes in the WAT of ob/ob
Page 19 of 52
For Peer Review Only
Diabetes
mice was significantly reduced when compared to wild-type mice. Nitrate increased the
expression of the brown adipocyte-specific genes, partially restoring the impaired levels of
expression in this model of obesity (Fig 6E).
Page 20 of 52
For Peer Review Only
Diabetes

Discussion
Nitrate was considered a non-bioactive metabolite of NO and a potentially toxic dietary
constituent. However, studies showing that nitrate reduces blood pressure (5; 7; 40) and the
oxygen demand of exercise (41) indicated that this anion may be beneficial for metabolic
health. Complementary studies demonstrated that nitrate has anti-obesity and anti-diabetic
effects, independent of increased mitochondrial biogenesis or PGC1α expression in liver or
muscle, in endothelial NOS-deficient mice, a strain prone to a metabolic syndrome-like
phenotype (6). Similar anti-diabetic effects of nitrate have since been described in Sprague-
Dawley rats (42). Diets low in nitrate and nitrite reduce the concentration of cGMP in certain
tissues (8). In recent years a role for cGMP signaling in systemic energy balance has emerged
(32; 43; 44). cGMP was recently demonstrated to induce browning within WAT (9). These
beige/brite cells (14; 15) have cardiometabolic protective effects in rodents (11; 16; 18; 19;
22; 23; 45). Thus, we hypothesized that nitrate might contribute to the improved metabolic
phenotype by inducing the browning response in WAT.
In the present study we demonstrate that nitrate increases the expression of thermogenic
genes in BAT and activates a brown adipocyte-like transcriptional and functional phenotype
within WAT. Furthermore, we find that nitrate induces browning of adipocytes through the
NOS-independent nitrate-nitrite-NO pathway. Thus nitrate activates the thermogenic process
in a manner distinct from physiological metabolite activators of browning previously
described (Fig. S9) (20). Our findings suggest a mechanism by which nitrate is reduced to
NO, which in turn increases cGMP production via soluble guanylyl cyclase activation.
Increased cGMP concentrations activate PKG, increasing the expression of PGC-1α and
other key browning genes such as UCP1 and CIDEA in white adipocytes. Increased
expression of brown adipocyte-specific and β-oxidation pathway genes translates to a brown
Page 21 of 52
For Peer Review Only
Diabetes

adipocyte-like functional phenotype characterized by increased fatty acid β-oxidation (Fig.
7). Incidentally, the recently identified mechanism for natriuretic peptide induced browning
of WAT was also revealed to signal through the cGMP cascade (43), underscoring the
importance of this signaling pathway for the physiological activation of thermogenesis in
WAT.
It was observed that the nitrate-induced browning response in WAT was enhanced in
hypoxia. The nitrate-nitrite-NO pathway is significantly augmented during hypoxia, with
both the activity and expression of XOR increased in low oxygen conditions (4). The
pathway has also been implicated in the adaptive response of some tissues to hypoxia (30; 33;
35). It is conceivable that production of NO from nitrate leads to the enhanced nitrate-
induced browning of WAT observed in hypoxia. The WAT of obese humans, and genetic and
dietary models of obesity in rodents, is in a hypoxic state (36; 37). Exposure of adipocytes to
hypoxia leads to cellular metabolic reprogramming, consisting of increased glycolysis and
fatty acid and TAG synthesis and decreased fatty acid catabolism, that contributes to the
pathology of obesity (38; 39). The identification of an enhanced capacity for nitrate to induce
the browning response of WAT in low oxygen conditions through NO, which will likely also
contribute to improved vascular health in obese individuals where NO production is
decreased (46), may represent a significant therapeutic opportunity to partly reverse this
hypoxia mediated pathological state. Indeed, our studies show that the impaired expression of
several brown adipocyte-specific genes in the WAT of the ob/ob mouse model of obesity is
partially reversed by nitrate treatment.
Page 22 of 52
For Peer Review Only
Diabetes
From a nutritional perspective, humans are exposed to nitrate as part of their daily diet, with
green leafy vegetables representing a significant source of the anion. A high vegetable
component to diets is consistently shown to have a protective role in the development of
metabolic morbidity (47; 48). It has been suggested that the high nitrate content of vegetables
is partly responsible for their association with cardiometabolic protection (30; 34). It is worth
speculating that increasing the flux through the nitrate-nitrite-NO pathway may be one
mechanism through which dietary vegetable consumption confers the associated metabolic
protection. Given that the concentrations of nitrate utilized in our study are readily achievable
through dietary vegetable consumption (6; 34), dietary nitrate may also function to activate
cGMP signaling in human WAT. The possibility that this ubiquitous dietary constituent could
induce browning of WAT in humans is tantalizing.
It should be noted that the responses of WAT to nitrate were not universally dose-dependent.
This observation may represent rapid tachyphylaxis and/or resistance to inorganic nitrate, a
phenomenon well characterized in the clinical use of organic nitrates, in particular at high
doses. Alternatively, cellular uptake of inorganic nitrate may become rate-limiting or
saturated at high doses. The NO signaling pathway is also subject to counter regulation
through a number of disparate mechanisms that include the action of phosphodiesterases
(PDEs), which may influence the effect of nitrate in WAT (Fig S10). PDEs such as PDE5,
control cGMP concentrations and therefore inhibit downstream effects such as protein kinase
G stimulation. Indeed, inhibition of PDE5 is known to stimulate the browning of WAT (9).
In summary, we identify nitrate as a novel non-β-adrenergic activator of the browning
response in WAT and highlight this small anion as both a potential dietary mediator of
protection from, and potential therapeutic modality for the treatment of, metabolic disease.
Page 23 of 52
For Peer Review Only
Diabetes
Acknowledgments
LDR is supported by the MRC-HNR Elsie Widdowson Fellowship. This work was supported
by grants from the BBSRC (Bb/H013539/2; bb/I000933/I), the British Heart Foundation and
the MRC (Lipid Profiling and Signalling programme grant; number UD99999906). The
authors wish to thank Professor Steve Jackson and Julia Coates (Wellcome Trust/Cancer
Research UK Gurdon Institute, University of Cambridge, UK) for the use of a low-oxygen
incubator.
Dr. Lee Roberts is the guarantor of this work and, as such, had full access to all the data in
the study and takes responsibility for the integrity of the data and the accuracy of the data
analysis. The authors declare they have no conflicts of interest. LDR conceived the study,
designed the experiments, performed cell culture, mass spectrometry and isotope labelling
experiments, statistical analysis, prepared figures, and wrote the manuscript with input from
all coauthors. TA conceived, designed and performed the animal studies. AOK conceived,
designed and performed the animal studies. SAM performed cell culture and gas
chromatography mass spectrometry experiments. BOF and MF performed nitrate
measurements and contributed to the design of experiments. AJM conceived and designed the
animal studies. JLG conceived and designed the study.
Page 24 of 52
For Peer Review Only
Diabetes

Figure Legends
Fig. 1. Dietary nitrate induces a brown adipocyte-like phenotype in white adipose tissue
(WAT) in vivo. (A) Increased expression of brown-adipocyte specific genes in subcutaneous
WAT of nitrate treated rats (Two-way ANOVA, Control vs. 0.35 mM NaNO3 P ≤ 0.01,
Control vs. 0.7 mM NaNO3 P ≤ 0.001, Control vs. 1.4 mM P ≤ 0.0001). (B) Increased
concentration of brown-adipocyte specific proteins in subcutaneous WAT of nitrate treated
rats determined by ELISA (Two-way ANOVA, Control vs. 0.35 mM NaNO3 P ≤ 0.001,
Control vs. 0.7 mM NaNO3 P ≤ 0.05, Control vs. 1.4 mM P ≤ 0.01) (C) Increased
concentration of carnitine palmitoyltransferase 1 (CPT1) protein in subcutaneous WAT of
nitrate treated rats determined by immunoblotting (One-way ANOVA, Control vs. 0.35 mM
NaNO3 P ≤ 0.05, Control vs. 0.7 mM NaNO3 P ≤ 0.05, Control vs. 1.4 mM NaNO3 P ≤ 0.05).
(D) Increased citrate synthase activity in subcutaneous WAT of nitrate treated rats (One-way
ANOVA, Control vs. 0.35 mM NaNO3 P ≤ 0.05, Control vs. 0.7 mM NaNO3 P ≤ 0.05,
Control vs. 1.4 mM P ≤ 0.01) (E) The medium chain fatty acid (MCFA) / long chain fatty
acid (LCFA) ratio in WAT from nitrate treated rats (One-way ANOVA, Control vs. 0.35 mM
NaNO3 P ≤ 0.05, Control vs. 0.7 mM NaNO3 P ≤ 0.05, Control vs. 1.4 mM NaNO3 P ≤ 0.01).
(F) LC-MS analysis of total triacylglycerols (TAGs) from WAT indicates decreased total
TAGs stored in the WAT of nitrate treated rats (One-way ANOVA, Control vs. 0.35 mM
NaNO3 P ≤ 0.01, Control vs. 0.7 mM NaNO3 P ≤ 0.01). (G) Haematoxylin and eosin staining
of inguinal WAT of control and nitrate treated rats. Cumulative data from a total of 6
independent observations are shown. Data are represented as Mean ± SEM. * P ≤ 0.05, ** P
≤ 0.01, *** P ≤ 0.001, **** P ≤ 0.0001.
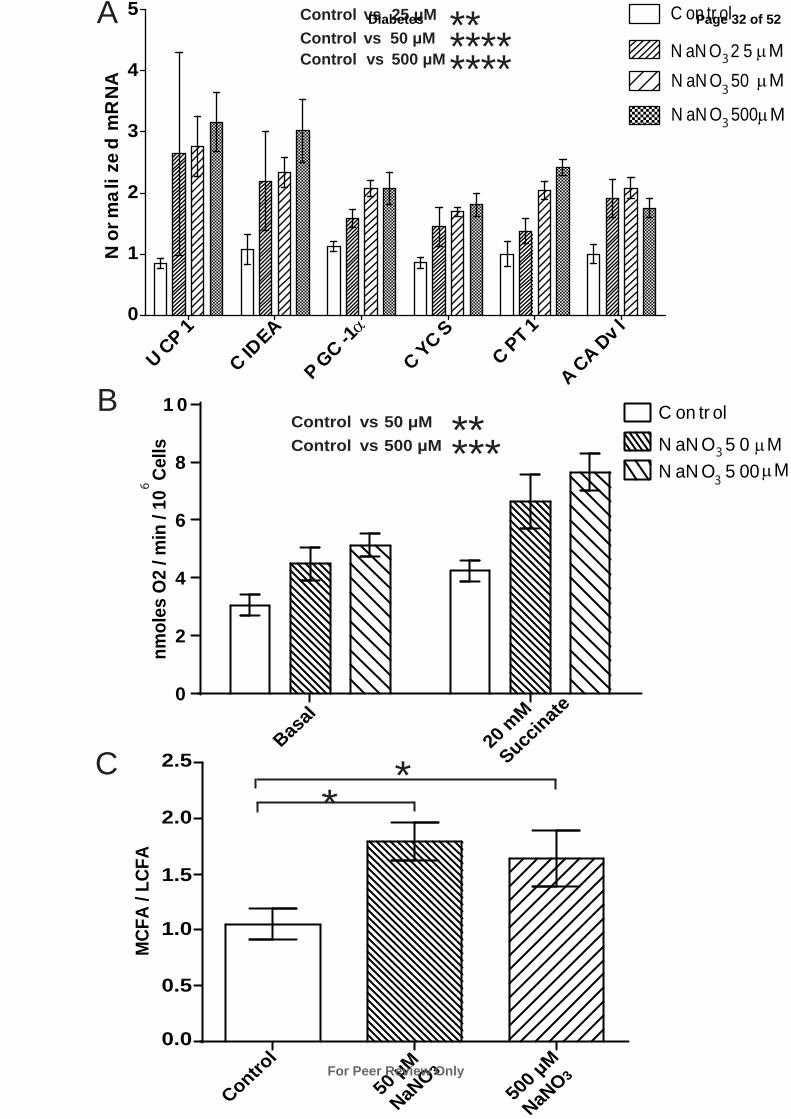
Fig. 2. Nitrate stimulates expression of brown adipocyte-specific genes and induces an
oxidative phenotype in primary white adipocytes. (A) The expression of brown adipocyte-
specific genes in primary white adipocytes treated with nitrate (25 µM NaNO3, 50 µM
NaNO3 and 500 µM NaNO3) (Two-way ANOVA, Control vs. 25 µM NaNO3 P ≤ 0.01,
Control vs. 50 µM NaNO3 P ≤ 0.0001, Control vs. 500 µM NaNO3 P ≤ 0.0001). (B) Basal
and stimulated (succinate 20 mM) oxygen consumption was increased in white adipocytes
treated with nitrate, normalized to 106 cells (Two-way ANOVA, Control vs. 50 µM NaNO3 P
≤ 0.01, Control vs. 500 µM NaNO3 P ≤ 0.001). (C) The medium chain fatty acid (MCFA) /
long chain fatty acid (LCFA) ratio was increased in white adipocytes with nitrate treatment
(ANOVA, Control vs. 50 µM NaNO3 P ≤ 0.05, Control vs. 500 µM NaNO3 P ≤ 0.05).
Cumulative data from a total of 4 independent observations are shown. Data are represented
as Mean ± SEM. * P ≤ 0.05, ** P ≤ 0.01, *** P ≤ 0.001, **** P < 0.0001.
Fig. 3 Fatty acid uptake and β-oxidation is increased in nitrate treated primary white
adipocytes characteristic of the browning response. (A) 13
C-enrichment of palmitate (C16:0)
was significantly increased in nitrate treated adipocytes (One-way ANOVA, P ≤ 0.01). (B) 13
C-enrichment of myristate (C14:0) was significantly increased in nitrate treated adipocytes
(One-way ANOVA, P ≤ 0.05). (C) 13
C-enrichment of laurate (C12:0) was significantly
increased in nitrate treated adipocytes (One-way ANOVA, P ≤ 0.05). (D) 13
C-enrichment of
citrate was significantly increased in nitrate treated adipocytes (Two-way ANOVA, P ≤
0.0001, Control vs. 50 µM NaNO3 P ≤ 0.0001, Control vs. 500 µM NaNO3 P ≤ 0.001) (E)
Page 25 of 52
For Peer Review Only
Diabetes
13C-enrichment of succinate was significantly increased in nitrate treated adipocytes (Two-
way ANOVA, P ≤ 0.05, Control vs. 500 µM NaNO3 P ≤ 0.05). (F) 13
C-enrichment of malate
was significantly increased in nitrate treated adipocytes (Two-way ANOVA, P ≤ 0.05,
Control vs. 500 µM NaNO3 P ≤ 0.05). Red highlighting indicates increased enrichment.
Cumulative data from a total of 4 independent observations are shown. Data are represented
as Mean ± SEM. * P ≤ 0.05, ** P ≤ 0.01,*** P ≤ 0.001, **** P < 0.0001.
Fig. 4. Nitrate functions through the nitrate-nitrite-NO pathway to induce browning of white
adipocytes. (A) Brown adipocyte-specific gene expression in primary adipocytes treated with
the NO scavenger PTIO (50 µM) with and without 500 µM NaNO3 (Two-way ANOVA,
Control vs. 500 µM NaNO3 P ≤ 0.0001, 500 µM NaNO3 vs. 500 µM NaNO3 + 50 µM PTIO P
≤ 0.0001) (n = 3). (B) Brown adipocyte-specific gene expression in primary adipocytes
treated with the NOS inhibitor L-NAME (1 mM) with and without 500 µM NaNO3 (Two-
way ANOVA, Control vs. 500 µM NaNO3 P ≤ 0.001, Control vs. 500 µM NaNO3 + 1 mM L-
NAME P ≤ 0.0001) (n = 3). (C) The expression of xanthine oxidoreductase (XOR) in primary
white adipocytes treated with nitrate (25 µM, 50 µM, 500 µM) (One-way ANOVA, Control
vs. 50 µM NaNO3 P ≤ 0.05, Control vs. 500 µM NaNO3 P ≤ 0.05) (n = 4). (D) XOR
expression in primary adipocytes treated with the NO scavenger PTIO (50 µM) with and
without 500 µM NaNO3 (One-way ANOVA, Control vs. 500 µM NaNO3 P ≤ 0.01, 500 µM
NaNO3 vs. 500 µM NaNO3 + 50 µM PTIO P ≤ 0.01) (n = 3). (E) XOR expression in primary
adipocytes treated with negative control siRNA or siRNA against XOR with and without 500
µM NaNO3 (n = 3 / group) (One-way ANOVA, Control siRNA vs.Control siRNA + 500 µM
NaNO3 P ≤ 0.001, Control siRNA vs XOR siRNA P ≤ 0.001, Control siRNA vs XOR
siRNA+ 500 µM NaNO3 P ≤ 0.001) (F) Brown adipocyte-specific gene expression in primary
adipocytes treated with negative control siRNA or siRNA against XOR with and without 500
µM NaNO3 (n = 3 / group) (Two-way ANOVA, Control siRNA vs Control siRNA + 500 µM
NaNO3 P ≤ 0.0001, Control siRNA + 500 µM NaNO3 vs XOR siRNA+ 500 µM NaNO3 P ≤
0.0001, XOR siRNA vs XOR siRNA+ 500 µM NaNO3 not significant). Data are represented
as Mean ± SEM. * P ≤ 0.05, ** P ≤ 0.01, *** P ≤ 0.001, **** P < 0.0001.
Fig. 5. cGMP signaling mediates the nitrate stimulated browning response in white
adipocytes. (A) LC-MS chromatograms of typical peaks for cGMP from control and 500 µM
NaNO3 treated primary adipocytes. (B) The concentration of cGMP increases in primary
white adipocytes treated with nitrate (ANOVA, P ≤ 0.05, Control vs. 50 µM NaNO3 P ≤ 0.05,
Control vs. 500 µM NaNO3 P ≤ 0.05) (n = 4). (C) The concentration of cGMP increases in
white adipose tissue of rats treated with nitrate (0.35 mM NaNO3, 0.7 mM NaNO3 and 1.4
mM NaNO3) (ANOVA, P < 0.05, Control vs. 0.35 mM NaNO3 P ≤ 0.01, Control vs. 0.7 mM
NaNO3 P ≤ 0.05, Control vs. 1.4 mM NaNO3, P = 0.07) (n = 6). (D) Primary adipocytes
treated with the guanylyl cyclase inhibitor ODQ (1 µM) with and without 500 µM NaNO3
(Two-way ANOVA, Control vs. 500 µM NaNO3 P ≤ 0.0001, 500 µM NaNO3 vs. 500 µM
NaNO3 + 1 µM ODQ P ≤ 0.001) (n = 6). (E) Primary adipocytes treated with the protein
kinase G inhibitor KT5823 (1 µM) with and without 500 µM NaNO3 (Two-way ANOVA,
Control vs. 500 µM NaNO3 P ≤ 0.0001, 500 µM NaNO3 vs. 500 µM NaNO3 + 1 µM KT5823
Page 26 of 52
For Peer Review Only
Diabetes

P ≤ 0.0001) (n = 3). Data are represented as Mean ± SEM. * P ≤ 0.05, ** P ≤ 0.01, **** P <
0.0001.
Fig. 6. The nitrate stimulated browning response is enhanced in hypoxia. (A) Nitrate (50 µM
NaNO3) induced expression of xanthine oxidoreductase (XOR) in white adipocytes is
increased in hypoxia (Two-way ANOVA, Normoxia Control vs. Hypoxia Control P ≤ 0.01,
Normoxia NaNO3 vs. Hypoxia NaNO3 P ≤ 0.001, Hypoxia Control vs. Hypoxia NaNO3 P ≤
0.05) (n = 4). (B) The expression of brown adipocyte-specific genes in primary white
adipocytes treated with nitrate (50 µM NaNO3) in normoxia or hypoxia and normalized to
relevant control (normoxia 50 µM nitrate normalized to normoxia control, hypoxia 50 µM
nitrate normalized to hypoxia control) (Two-way ANOVA, Normoxia NaNO3 vs. Hypoxia
NaNO3 P ≤ 0.001) (n = 4). (C) The expression of XOR in white adipose tissue (WAT) of
nitrate treated (0.7 mM NaNO3) rats is increased in hypoxia (Two-way ANOVA, Normoxia
Control vs. Hypoxia Control P ≤ 0.01, Normoxia NaNO3 vs. Hypoxia NaNO3 P ≤ 0.01,
Hypoxia Control vs. Hypoxia NaNO3 P ≤ 0.05) (n = 5). (D) The increased expression of
brown-adipocyte specific genes in WAT of nitrate treated rats is enhanced during hypoxia
(Two-way ANOVA, Normoxia 0.7 mM NaNO3 vs. Hypoxia 0.7mM NaNO3, P < 0.0001) (n
= 5). (E) The reduced expression of brown adipocyte-specific genes in WAT of the ob/ob
mouse compared to wild type controls is partially restored following nitrate treatment. (Two-
way ANOVA, Wild Type Control vs. ob/ob Control P ≤ 0.0001, Wild Type Control vs. Wild
Type NaNO3 P ≤ 0.01, ob/ob Control vs. ob/ob NaNO3 P ≤ 0.0001) Data are represented as
Mean ± SEM. * P ≤ 0.05, ** P ≤ 0.01, *** P ≤ 0.001, **** P < 0.0001.
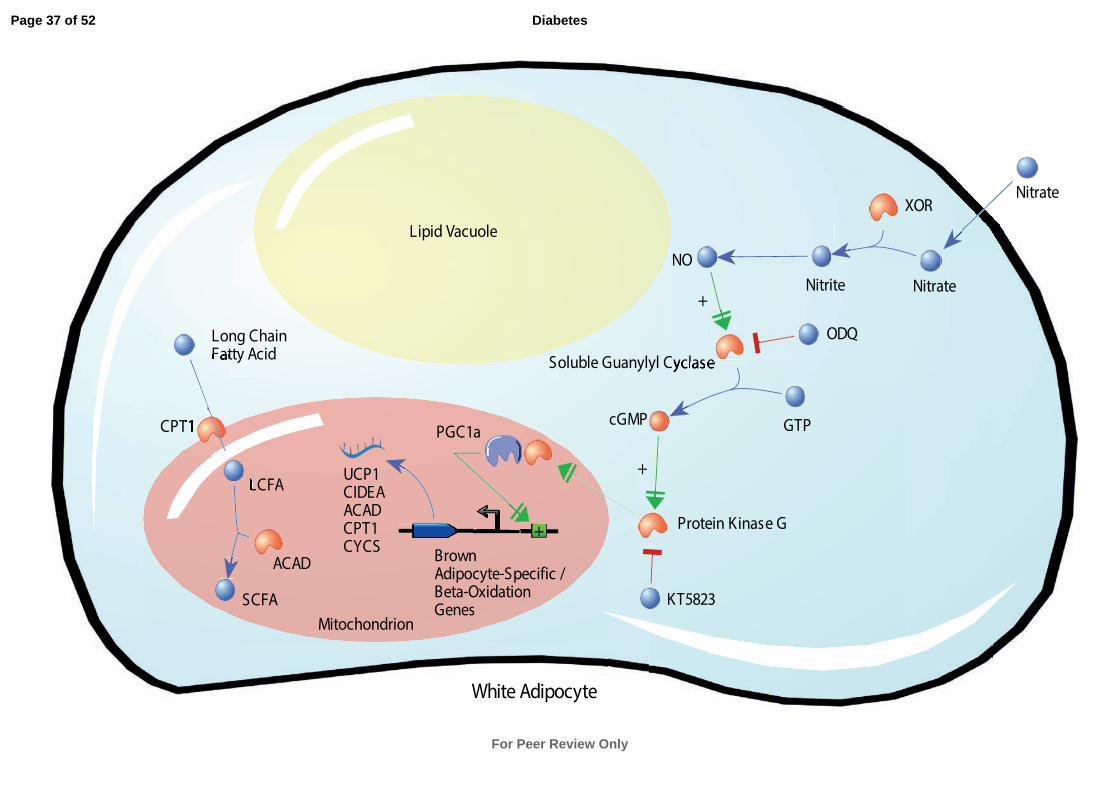
Fig. 7. Proposed mechanism for nitrate-induced browning of white adipocytes. After entering
the cell, nitrate is reduced first to nitrite, then to nitric oxide (NO). NO increases cGMP
production via soluble guanylyl cyclase activation. Increased cGMP concentrations activate
PKG, increasing the expression of PGC-1α and key browning genes. Increased expression of
brown adipocyte-specific and β-oxidation pathway genes confers an oxidative brown
adipocyte-like functional phenotype on the white adipocytes. ACAD, acyl-CoA
dehydrogenase; CIDEA, cell death-inducing DFFA-like effector a; cGMP, cyclic guanosine
monophosphate; CPT1, carnitine palmitoyltransferase; CYCS, cytochrome c; GTP,
Guanosine triphosphate; LCFA, long chain fatty acid; NO, nitric oxide; ODQ, 1H-[1,2,
4]oxadiazolo[4,3-a]quinoxalin-1-one; PGC1α, peroxisome proliferator-activated receptor
gamma coactivator 1-alpha; SCFA, short chain fatty acid; UCP1, uncoupling protein 1; XOR,
xanthine oxidoreductase.
Page 27 of 52
For Peer Review Only
Diabetes

References
1. Huang PL: eNOS, metabolic syndrome and cardiovascular disease. Trends Endocrinol Metab
2009;20:295-302
2. Monti LD, Barlassina C, Citterio L, Galluccio E, Berzuini C, Setola E, Valsecchi G, Lucotti P, Pozza G,
Bernardinelli L, Casari G, Piatti P: Endothelial nitric oxide synthase polymorphisms are associated
with type 2 diabetes and the insulin resistance syndrome. Diabetes 2003;52:1270-1275
3. Moncada S, Higgs A: The L-arginine-nitric oxide pathway. N Engl J Med 1993;329:2002-2012
4. Jansson EA, Huang L, Malkey R, Govoni M, Nihlen C, Olsson A, Stensdotter M, Petersson J, Holm L,
Weitzberg E, Lundberg JO: A mammalian functional nitrate reductase that regulates nitrite and nitric
oxide homeostasis. Nat Chem Biol 2008;4:411-417
5. Larsen FJ, Ekblom B, Sahlin K, Lundberg JO, Weitzberg E: Effects of dietary nitrate on blood
pressure in healthy volunteers. N Engl J Med 2006;355:2792-2793
6. Carlstrom M, Larsen FJ, Nystrom T, Hezel M, Borniquel S, Weitzberg E, Lundberg JO: Dietary
inorganic nitrate reverses features of metabolic syndrome in endothelial nitric oxide synthase-
deficient mice. Proc Natl Acad Sci U S A 2010;107:17716-17720
7. Kapil V, Milsom AB, Okorie M, Maleki-Toyserkani S, Akram F, Rehman F, Arghandawi S, Pearl V,
Benjamin N, Loukogeorgakis S, Macallister R, Hobbs AJ, Webb AJ, Ahluwalia A: Inorganic nitrate
supplementation lowers blood pressure in humans: role for nitrite-derived NO. Hypertension
2010;56:274-281
8. Bryan NS, Fernandez BO, Bauer SM, Garcia-Saura MF, Milsom AB, Rassaf T, Maloney RE, Bharti A,
Rodriguez J, Feelisch M: Nitrite is a signaling molecule and regulator of gene expression in
mammalian tissues. Nat Chem Biol 2005;1:290-297
9. Mitschke MM, Hoffmann LS, Gnad T, Scholz D, Kruithoff K, Mayer P, Haas B, Sassmann A, Pfeifer A,
Kilic A: Increased cGMP promotes healthy expansion and browning of white adipose tissue. FASEB J
2013;27:1621-1630
10. Cannon B, Nedergaard J: Brown adipose tissue: function and physiological significance. Physiol
Rev 2004;84:277-359
11. Lowell BB, Spiegelman BM: Towards a molecular understanding of adaptive thermogenesis.
Nature 2000;404:652-660
12. Wu Z, Puigserver P, Andersson U, Zhang C, Adelmant G, Mootha V, Troy A, Cinti S, Lowell B,
Scarpulla RC, Spiegelman BM: Mechanisms controlling mitochondrial biogenesis and respiration
through the thermogenic coactivator PGC-1. Cell 1999;98:115-124
13. Enerback S, Jacobsson A, Simpson EM, Guerra C, Yamashita H, Harper ME, Kozak LP: Mice lacking
mitochondrial uncoupling protein are cold-sensitive but not obese. Nature 1997;387:90-94
14. Ishibashi J, Seale P: Beige Can Be Slimming. Science 2010;328:1113-1114
15. Petrovic N, Walden TB, Shabalina IG, Timmons JA, Cannon B, Nedergaard J: Chronic Peroxisome
Proliferator-activated Receptor gamma (PPAR gamma) Activation of Epididymally Derived White
Adipocyte Cultures Reveals a Population of Thermogenically Competent, UCP1-containing
Adipocytes Molecularly Distinct from Classic Brown Adipocytes. Journal of Biological Chemistry
2010;285:7153-7164
16. Cousin B, Cinti S, Morroni M, Raimbault S, Ricquier D, Penicaud L, Casteilla L: Occurrence of
Brown Adipocytes in Rat White Adipose-Tissue - Molecular and Morphological Characterization. J
Cell Sci 1992;103:931-942
17. Oberkofler H, Dallinger G, Liu YM, Hell E, Krempler F, Patsch W: Uncoupling protein gene:
quantification of expression levels in adipose tissues of obese and non-obese humans. J Lipid Res
1997;38:2125-2133
18. Melnyk A, Harper ME, HimmsHagen J: Raising at thermoneutrality prevents obesity and
hyperphagia in BAT-ablated transgenic mice. Am J Physiol-Reg I 1997;272:R1088-R1093
19. Kopecky J, Clarke G, Enerback S, Spiegelman B, Kozak LP: Expression of the mitochondrial
uncoupling protein gene from the aP2 gene promoter prevents genetic obesity. J Clin Invest
1995;96:2914-2923
Page 28 of 52
For Peer Review Only
Diabetes

20. Roberts LD, Bostrom P, O'Sullivan JF, Schinzel RT, Lewis GD, Dejam A, Lee YK, Palma MJ, Calhoun
S, Georgiadi A, Chen MH, Ramachandran VS, Larson MG, Bouchard C, Rankinen T, Souza AL, Clish CB,
Wang TJ, Estall JL, Soukas AA, Cowan CA, Spiegelman BM, Gerszten RE: beta-Aminoisobutyric Acid
Induces Browning of White Fat and Hepatic beta-Oxidation and Is Inversely Correlated with
Cardiometabolic Risk Factors. Cell Metab 2014;19:96-108
21. Rassaf T, Bryan NS, Kelm M, Feelisch M: Concomitant presence of N-nitroso and S-nitroso
proteins in human plasma. Free Radic Biol Med 2002;33:1590-1596
22. Bostrom P, Wu J, Jedrychowski MP, Korde A, Ye L, Lo JC, Rasbach KA, Bostrom EA, Choi JH, Long
JZ, Kajimura S, Zingaretti MC, Vind BF, Tu H, Cinti S, Hojlund K, Gygi SP, Spiegelman BM: A PGC1-
alpha-dependent myokine that drives brown-fat-like development of white fat and thermogenesis.
Nature 2012;481:463-U472
23. Seale P, Conroe HM, Estall J, Kajimura S, Frontini A, Ishibashi J, Cohen P, Cinti S, Spiegelman BM:
Prdm16 determines the thermogenic program of subcutaneous white adipose tissue in mice. J Clin
Invest 2011;121:96-105
24. Roberts LD, Murray AJ, Menassa D, Ashmore T, Nicholls AW, Griffin JL: The contrasting roles of
PPARdelta and PPARgamma in regulating the metabolic switch between oxidation and storage of
fats in white adipose tissue. Genome Biol 2011;12:R75
25. Morash AJ, Kotwica AO, Murray AJ: Tissue-specific changes in fatty acid oxidation in hypoxic
heart and skeletal muscle. Am J Physiol Regul Integr Comp Physiol 2013;305:R534-541
26. Houle-Leroy P, Garland T, Jr., Swallow JG, Guderley H: Effects of voluntary activity and genetic
selection on muscle metabolic capacities in house mice Mus domesticus. J Appl Physiol (1985)
2000;89:1608-1616
27. Charalambous M, Ferron SR, da Rocha ST, Murray AJ, Rowland T, Ito M, Schuster-Gossler K,
Hernandez A, Ferguson-Smith AC: Imprinted Gene Dosage Is Critical for the Transition to
Independent Life. Cell Metabolism 2012;15:209-221
28. Roberts LD, Souza AL, Gerszten RE, Clish CB: Targeted metabolomics. Curr Protoc Mol Biol
2012;Chapter 30:Unit 30 32 31-24
29. Wu J, Bostrom P, Sparks LM, Ye L, Choi JH, Giang AH, Khandekar M, Virtanen KA, Nuutila P,
Schaart G, Huang K, Tu H, van Marken Lichtenbelt WD, Hoeks J, Enerback S, Schrauwen P,
Spiegelman BM: Beige adipocytes are a distinct type of thermogenic fat cell in mouse and human.
Cell 2012;150:366-376
30. Lundberg JO, Gladwin MT, Ahluwalia A, Benjamin N, Bryan NS, Butler A, Cabrales P, Fago A,
Feelisch M, Ford PC, Freeman BA, Frenneaux M, Friedman J, Kelm M, Kevil CG, Kim-Shapiro DB,
Kozlov AV, Lancaster JR, Jr., Lefer DJ, McColl K, McCurry K, Patel RP, Petersson J, Rassaf T, Reutov VP,
Richter-Addo GB, Schechter A, Shiva S, Tsuchiya K, van Faassen EE, Webb AJ, Zuckerbraun BS, Zweier
JL, Weitzberg E: Nitrate and nitrite in biology, nutrition and therapeutics. Nat Chem Biol 2009;5:865-
869
31. Cheung KJ, Tzameli I, Pissios P, Rovira I, Gavrilova O, Ohtsubo T, Chen Z, Finkel T, Flier JS,
Friedman JM: Xanthine oxidoreductase is a regulator of adipogenesis and PPAR gamma activity. Cell
Metabolism 2007;5:115-128
32. Haas B, Mayer P, Jennissen K, Scholz D, Berriel Diaz M, Bloch W, Herzig S, Fassler R, Pfeifer A:
Protein kinase G controls brown fat cell differentiation and mitochondrial biogenesis. Sci Signal
2009;2:ra78
33. Castello PR, David PS, McClure T, Crook Z, Poyton RO: Mitochondrial cytochrome oxidase
produces nitric oxide under hypoxic conditions: implications for oxygen sensing and hypoxic
signaling in eukaryotes. Cell Metab 2006;3:277-287
34. Lundberg JO, Weitzberg E, Gladwin MT: The nitrate-nitrite-nitric oxide pathway in physiology and
therapeutics. Nat Rev Drug Discov 2008;7:156-167
35. van Faassen EE, Bahrami S, Feelisch M, Hogg N, Kelm M, Kim-Shapiro DB, Kozlov AV, Li H,
Lundberg JO, Mason R, Nohl H, Rassaf T, Samouilov A, Slama-Schwok A, Shiva S, Vanin AF, Weitzberg
Page 29 of 52
For Peer Review Only
Diabetes
E, Zweier J, Gladwin MT: Nitrite as regulator of hypoxic signaling in mammalian physiology. Med Res
Rev 2009;29:683-741
36. Ye JP, Gao ZG, Yin J, He Q: Hypoxia is a potential risk factor for chronic inflammation and
adiponectin reduction in adipose tissue of ob/ob and dietary obese mice. Am J Physiol-Endoc M
2007;293:E1118-E1128
37. Hosogai N, Fukuhara A, Oshima K, Miyata Y, Tanaka S, Segawa K, Furukawa S, Tochino Y, Komuro
R, Matsuda M, Shimomura I: Adipose tissue hypoxia in obesity and its impact on adipocytokine
dysregulation. Diabetes 2007;56:901-911
38. Krishnan J, Danzer C, Simka T, Ukropec J, Walter KM, Kumpf S, Mirtschink P, Ukropcova B,
Gasperikova D, Pedrazzini T, Krek W: Dietary obesity-associated Hif1 alpha activation in adipocytes
restricts fatty acid oxidation and energy expenditure via suppression of the Sirt2-NAD(+) system.
Gene Dev 2012;26:259-270
39. Wellen KE, Thompson CB: Cellular Metabolic Stress: Considering How Cells Respond to Nutrient
Excess. Mol Cell 2010;40:323-332
40. Webb AJ, Patel N, Loukogeorgakis S, Okorie M, Aboud Z, Misra S, Rashid R, Miall P, Deanfield J,
Benjamin N, MacAllister R, Hobbs AJ, Ahluwalia A: Acute blood pressure lowering, vasoprotective,
and antiplatelet properties of dietary nitrate via bioconversion to nitrite. Hypertension 2008;51:784-
790
41. Larsen FJ, Schiffer TA, Borniquel S, Sahlin K, Ekblom B, Lundberg JO, Weitzberg E: Dietary
inorganic nitrate improves mitochondrial efficiency in humans. Cell Metab 2011;13:149-159
42. Essawy S, Khaled AS, Amani E: Comparing the Effects of Inorganic Nitrate and Allopurinol in
Renovascular Complications of Metabolic Syndrome in Rats: Role of Nitric Oxide and Uric Acid. Acta
Endocrinol-Buch 2012;8:387-401
43. Bordicchia M, Liu DX, Amri EZ, Ailhaud G, Dessi-Fulgheri P, Zhang CY, Takahashi N, Sarzani R,
Collins S: Cardiac natriuretic peptides act via p38 MAPK to induce the brown fat thermogenic
program in mouse and human adipocytes (vol 122, pg 1022, 2012). Journal of Clinical Investigation
2012;122:1584-1584
44. Nisoli E, Clementi E, Paolucci C, Cozzi V, Tonello C, Sciorati C, Bracale R, Valerio A, Francolini M,
Moncada S, Carruba MO: Mitochondrial biogenesis in mammals: the role of endogenous nitric oxide.
Science 2003;299:896-899
45. Seale P, Kajimura S, Yang W, Chin S, Rohas LM, Uldry M, Tavernier G, Langin D, Spiegelman BM:
Transcriptional control of brown fat determination by PRDM16. Cell Metab 2007;6:38-54
46. Siervo M, Jackson SJ, Bluck LJC: In-vivo nitric oxide synthesis is reduced in obese patients with
metabolic syndrome: application of a novel stable isotopic method. J Hypertens 2011;29:1515-1527
47. Liese AD, Nichols M, Sun XZ, D'Agostino RB, Haffner SM: Adherence to the DASH Diet Is Inversely
Associated With Incidence of Type 2 Diabetes: The Insulin Resistance Atherosclerosis Study. Diabetes
Care 2009;32:1434-1436
48. Carter P, Gray LJ, Troughton J, Khunti K, Davies MJ: Fruit and vegetable intake and incidence of
type 2 diabetes mellitus: systematic review and meta-analysis. BMJ 2010;341:c4229
Page 30 of 52
For Peer Review Only
Diabetes

Nor
mal
ized
mR
NA
U CP 1
C IDEA
P GC 1aC YC S
C PT 1
A CA Dv l
C on tr ol0 .35 mM NaNO30 .7 m M NaNO31 .4 m M NaNO3
Control vs 0.35 mMControl vs 0.7 mMControl vs 1.4mM
*******
Control 0.35 mM NaNO3 0.7 mM NaNO3 1.4 mM NaNO3
50 X
630
X
C on tr ol
0 .35 mM
NaNO3 0 .7 m
M
Na NO31 .4 m
M
Na NO3
1 0
C on tr ol
0 .35 mM
NaNO3
0 .7 mM
Na NO31 .4 m
M
Na NO3
20
15
5
0
MCF
A / L
CFA
Nor
mal
ized
TAG
Con
cent
ratio
n 1.1
1.0
0.9
0.8
0.7
0.6
0.5
***
***
*
A B
C
E F
G
D
0 .0
0 .5
1 .0
1 .5
2 .0
2 .5
C on tr ol
0 .35 mM
NaNO3
0 .7 mM
Na NO31 .4 m
M
Na NO3
** *
Nor
mal
ized
CPT
1 Pr
otei
n
0
1 0
2 0
3 0
4 0
pg / mg
Pro
tein
U CP 1
P GC 1a
C on tr ol0 .35 mM NaNO30 .7 m M NaNO31 .4 m M NaNO3
Control vs 0.35 mMControl vs 0.7 mMControl vs 1.4mM
******
Citr
ate
Syn
thas
e A
cti
vity
( µm
ol/m
in/m
g pr
otei
n
0 .0
0 .2
0 .4
0 .6
C on tr ol
0 .35 mM
NaNO3
0 .7 mM
Na NO31 .4 m
M
Na NO3
0
2
4
6
8
10
**
**
Page 31 of 52
For Peer Review Only
Diabetes
0
2
4
6
8
1 0 C on tr ol
N aN O 5 0 µM3
nmol
es O
2 / m
in /
10 C
ells
6
Basal
20 m
M
Succinate
Control vs 50 mM Control vs 500 mM *****
0.0
0.5
1.0
1.5
2.0
2.5
Control
MCF
A / L
CFA
50 mM
NaNO3
500 m
M
NaNO3
*
C on tr ol
N aN O 2 5
N aN O 5 00µM3
µMN aN O 503 µM
N aN O 5003
3
µM
A
B
C *
Control vs 25 mM Control vs 50 mM Control vs 500 mM
**********N
orm
aliz
ed
mR
NA
U CP 1
C IDEA
P GC -1α
C YC SC PT 1
A CA Dv l0
1
2
3
4
5Page 32 of 52
For Peer Review Only
Diabetes

O
OH
CH3
O
OH
CH3
CH3 O
OH
OH
O
OH
O
OH
OH
O
OH
O
OH
O
OH
O
OH
O
OH
M+1
6 / M
0
12
3
4
C on tr ol
50 mM
NaN
O3
500 m
M NaN
O3
C16:0
**
M+1
4 / M
0
0.2
0.4
C14:0
*
C on tr ol
50 mM
NaN
O3
500 m
M NaN
O3
C12:0
M+1
2 / M
0
0.2
0.4
C on tr ol
50 mM
NaN
O3
500 m
M NaN
O3
*
M+n
/ M
0
0.2
0.4
Citrate
M+1/M
M+2/M
M+3/M
M+4/M
Control vs 50 mM Control vs 500 mM *******
M+n
/ M
0
0.2
0.4Malate
Control vs 500 mM*
M+1/M
M+2/M
M+3/M
M+4/M
SuccinateControl vs 500 mM*
M+n
/ M
0
0.2
0.4
M+1/M
M+2/M
M+3/M
M+4/M
C on tr ol5 0 µM NaN O3
5 00µM NaN O3
Key
A
B
C
D
E
F
Palmitate C16:0
Myristate C14:0
Laurate C12:0
Citrate
Succinate
Malate
Page 33 of 52
For Peer Review Only
Diabetes

C on tr ol vs 5 00µM NaN O3 ****5 00µM NaN O3 vs 5 00µM NaN O3 + 5 0µM PTI O
AC on tr ol5 00µM NaN O3
1 mM L -NAM E5 00µM NaN O3 + L -N AME
C on tr ol vs 5 00µM NaN O3
C on tr ol vs 5 00µM NaN O3 + 1mM L-NAMEB
Nor
ma
lize
d X
OR
mR
NA
Con
tr ol
2 5 µM
NaN
O3
5 0 mM
NaN
O3
5 00 mM
NaN
O3 0 .0
0 .5
1 .0
1 .5
2 .0
2 .5
Nor
ma
lize
d X
OR
mR
NA
Con
tr ol
5 00 µ
M N
aNO3
5 0 µM
PTI
O
500m
M NaN
O3
+ PTI
O 50mM
0
1
2
3C D*
*** **
0
1
2
3
4
5N
orm
ali
ze
d m
RN
A
UCP
1
CID
EA
CYC
S
CPT
1
ACA
Dvl
0
2
4
6
PGC
1a
UCP
1
CID
EA
CYC
S
CPT
1
ACA
Dvl
PGC
1a
C on tr ol5 00µM NaN O3
1 mM L -NAM E5 00µM NaN O3 + 50µM PTIO
No
rm
ali
ze
d m
RN
A***********
C on tr ol siR
NA
C on tr ol siR
NA
+ 500
µM N
it rate
X OR siR
NA
X OR siR
NA
+ 500
µM N
it rate
Nor
ma
lize
d X
OR
mR
NA
E
0
2
4
6
******
***F
0
2
4
6
8
C on tr ol siRNAC on tr ol siRNA + 5 00µM NaN O3
XOR siRNAXOR siRNA + 5 00 µ M NaN O3
UCP
1
CID
EA
CYC
S
CPT
1
ACA
Dvl
PGC
1a
No
rm
ali
ze
d m
RN
A
C on tr ol siRNA vs Control siRNA + NaN O3
Control siRNA + NaN O3 vs XOR siRNA + NaN O3********
Page 34 of 52
For Peer Review Only
Diabetes
K T5 82 3N aNO 5 00µM+K T582 3
**
1µM ODQ
Control
50 mM
NaNO
500 m
M
NaNO
C on tr ol
0 .35 mM
NaNO 0 .7 m
M
Na NO1 .4 m
M
Na NO
***
Control vs NaNO3 vs NaNO3+ODQ
C on tr olN aN O 5 00 µ M3
N aN O 5 00 µM ODQ1µM +3
C on tr olN aN O 5 00µ M3
3
A B C
E
Inte
nsity
(cps
)
Time (min)
1000
0
2000
3000
7.26.8 7.6 8.0
Control
500 mM NaNO3
cGM
P pm
ol/g
tis
sue
0
1 0
2 0
3 0
4 0
5 0
cG
MP
pm
ole
s/1
06 cel
ls
0
2
4
6
8
D
cGMP
33 3 3 3
NaNO3
Nor
mal
ize
d m
RN
A
P GC -1α
Nor
mal
ize
d m
RN
A
U CP 1
C IDEA
P GC -1α
C YC SC PT 1
A CA Dv l
*******
Control vs NaNO3 vs NaNO3+KT5823NaNO3
********
U CP 1
C IDEA
C YC SC PT 1
A CA Dv l0
5
1 0
1 5
0
1
2
3
4
Page 35 of 52
For Peer Review Only
Diabetes

Nor
moxia
Co ntro
l
Nor
moxia
50 µM
NaN
O3
Hyp
oxia
C ontr o
l
Hyp
oxia
50 µM
NaN
O30
1
2
3
4
5
0
1
2
5
1 0
1 5N or moxi a Contro l
N or moxi a 50µM NaNO3
H yp ox ia C ontr ol
H yp ox ia 5 0µM NaNO3
Nor
mal
ize
d X
OR
mR
NA
Rel
ativ
e N
orm
aliz
ed
mR
NA
UCP 1
CID
EA
P GC-1a
CYC S
CPT 1
ACA
Dv l
Nor
mal
ize
d XO
R m
RN
A
N or moxia
Co ntrol
N or moxia
0.7m
M NaN
O3
H ypox ia
C ontr ol
H ypox ia
0 .7mM N
aNO30
1
2
3
**
***
**
**** Normoxia NaNO3 vs Hypoxia NaNO3 ***A B
C D N
orm
aliz
ed
mR
NA
1 5
20
1 0
5
0
UCP 1
CID
EA
P GC-1a
CYC S
CPT 1
ACA
Dv l
N or moxi a Contro l
N or moxi a 0.7 mM NaNO3
Hypoxia Contro lHypoxia 0.7 mM NaNO3
****Normoxia NaNO3 vs Hypoxia NaNO3 ****Hypoxia Control vs Hypoxia NaNO3 **Normoxia Control vs Normoxia NaNO3
E
No
rmal
ized
mR
NA
log1
0
U CP 1
C IDEA
C YC SC PT 1
A CA Dv l0 .01
0 .1
1
1 0
1 00W ild Ty pe C on tr olW ild Ty pe 0 .7 mM N itra teO B/ OB C on trolO B/ OB 0 .7 mM N itra te
P GC-1a
****Wild Type Control vs OB/OB Control
****OB/OB Control vs OB/OB NaNO3 **Wild Type Control vs Wild Type NaNO3
Page 36 of 52
For Peer Review Only
Diabetes
White Adipocyte
Nitrate
Soluble Guanylyl Cyclase
GTPcGMP
yclasee
Protein Kinase G
+
Mitochondrion
Lipid Vacuole
LCFA
SCFA
ACAD
CPT1
Long ChainFatty Acid
PGC1a
BrownAdipocyte-Specific / Beta-Oxidation Genes
UCP1CIDEAACADCPT1CYCS
NitriteNO
XOR
ODQ
KT5823
T1
Fat
L
+
Nitrate
Page 37 of 52
For Peer Review Only
Diabetes
Supplementary Information
Inorganic Nitrate Promotes the Browning of White Adipose Tissue through
the Nitrate-Nitrite-Nitric Oxide Pathway
Lee D Roberts1,2 *
, Tom Ashmore2,3
, Aleksandra O Kotwica3, Steven A Murfitt
2, Bernadette
O Fernandez4, Martin Feelisch
4, Andrew J Murray
3, Julian L Griffin
1,2 *
1. Medical Research Council – Human Nutrition Research, Elsie Widdowson
Laboratory, 120 Fulbourn Road, Cambridge, CB2 9NL, UK.
2. Department of Biochemistry and Cambridge Systems Biology Centre, University of
Cambridge, 80 Tennis Court Road, Old Addenbrooke's Site, Cambridge, CB2 1GA,
UK.
3. Department of Physiology, Development and Neuroscience, University of Cambridge,
Downing Street, Cambridge, CB2 3EG, UK.
4. Faculty of Medicine, Clinical & Experimental Sciences, University of Southampton,
Southampton General Hospital, Tremona Road, Southampton, SO16 6YD, UK.
Page 38 of 52
For Peer Review Only
Diabetes

Supplementary Text
Nitrate Increases Browning of White Adipocytes Through a PPARα Independent Mechanism
We have shown that nitrate increases the expression of PGC-1α in vivo and in vitro. PGC-1α
drives the expression of brown adipocyte-specific genes in white adipocytes and regulates
many of its effects through co-activation of transcription factors such as peroxisome
proliferator-activated receptors (PPARs) (1). PPARα has been shown to mediate the effect of
a number of activators of the browning response in white adipocytes (2-4). Therefore, we
examined the effect of nitrate on brown adipocyte-specific gene expression in primary white
adipocytes differentiated from the stromal vascular fraction of subcutaneous WAT of PPARα
knockout mice. The absence of PPARα had no effect on the activity of nitrate to increase
brown adipocyte-specific gene expression within the white adipocytes (Fig. S9). Nitrate
treatment significantly increased the expression of UCP-1, CIDEA, PGC-1α, ELOVL3,
CYCS and CPT1 (ANOVA, P < 0.0001, Control vs. 50 µM NaNO3 P ≤ 0.0001, Control vs.
500 µM NaNO3 P ≤ 0.0001). Thus, nitrate activates the browning response in white
adipocytes independently of PPARα.
Page 39 of 52
For Peer Review Only
Diabetes

Supplementary Figures
Fig. S1 The expression of beige adipocyte-specific markers Tbx1, Tmem26 and
CD137 is increased in white adipose tissue of nitrate treated rats (0.35 mM NaNO3, 0.7 mM
NaNO3, 1.4 mM NaNO3). Cumulative data from a total of 6 independent observations are
shown. Data are represented as Mean ± SEM. * P ≤ 0.05
Page 40 of 52
For Peer Review Only
Diabetes

Fig. S2 The expression of both adiponectin (ADIPOQ) and fatty acid binding protein
4 (FABP4) is not significantly different in white adipose tissue of nitrate treated rats (0.35
mM NaNO3, 0.7 mM NaNO3, 1.4 mM NaNO3). Cumulative data from a total of 6
independent observations are shown. Data are represented as Mean ± SEM.
Page 41 of 52
For Peer Review Only
Diabetes

Fig. S3 The expression of browning genes in epididymal white adipose tissue of rats
treated with inorganic nitrate (0.7 mM) for 18 days. Exposure to nitrate significantly
increased the expression of the brown adipocyte-specific genes UCP-1, CIDEA, PGC-1α and
CYCS. Cumulative data from a total of 5 independent observations are shown. Data are
represented as Mean ± SEM. ****, P ≤ 0.0001.
Page 42 of 52
For Peer Review Only
Diabetes

Fig. S4 The concentration of long chain and medium chain fatty acids measured by
GC-MS in white adipose tissue of rats treated with inorganic nitrate (0.35 mM, 0.7 mM, 1.4
mM). (A). Arachidate. (B) Behenate. (C) Laurate. (D) Myristate. Cumulative data from a total
of 6 independent observations are shown. Data are represented as Mean ± SEM. *, P ≤ 0.05,
**, P ≤ 0.01.
Page 43 of 52
For Peer Review Only
Diabetes

Fig. S5 (A) Brown adipocyte-specific gene expression in subcutaneous WAT of mice
treated with 0.7 mM NaNO3 in drinking water for 15 days. (B) Real-time qPCR analysis
shows increased expression of thermogenic genes in iBAT of nitrate treated mice.
Cumulative data from a total of 7 independent observations are shown. Data are represented
as Mean ± SEM. * P ≤ 0.05, ** P ≤ 0.01, *** P ≤ 0.001, **** P ≤ 0.0001.
Page 44 of 52
For Peer Review Only
Diabetes

Fig. S6 Real-time qPCR analysis shows unchanged expression of classical mature
adipocyte-specific genes adiponectin (ADIPOQ), fatty acid binding protein 4 (FABP4) and
adipsin in primary white adipocytes treated with nitrate (25 µM, 50 µM and 500 µM).
Cumulative data from a total of 4 independent observations are shown. Data are represented
as Mean ± SEM.
Page 45 of 52
For Peer Review Only
Diabetes

Fig. S7 (A) The expression of brown-adipocyte specific genes is increased in primary
white adipocytes treated with NaNO2 (50 µM and 500 µM) (Two-way ANOVA, Control vs.
50 µM NaNO2 P ≤ 0.0001, Control vs. 500 µM NaNO2 P ≤ 0.0001). Cumulative data from a
total of 4 independent observations are shown. (B) Primary adipocytes differentiated from
the stromal vascular fraction treated with the NO scavenger PTIO (50 µM) with and without
500 µM NaNO2 (Two-way ANOVA, Control vs. 500 µM NaNO2 P ≤ 0.0001, 500 µM
NaNO2 vs. 500 µM NaNO2 + 50µM PTIO P ≤ 0.001). Cumulative data from a total of 3
independent observations are shown. Data are represented as Mean ± SEM. ***, P ≤ 0.001,
****, P ≤ 0.0001.
Page 46 of 52
For Peer Review Only
Diabetes

Fig. S8 (A) The expression of brown adipocyte-specific genes in primary white
adipocytes treated with nitrate (50 µM NaNO3) in normoxic and hypoxic conditions (Two-
way ANOVA, Normoxia control vs. Normoxia NaNO3 P ≤ 0.0001, Hypoxia Control vs.
Hypoxia NaNO3 P ≤ 0.0001, Normoxia Control vs. Hypoxia Control P ≤ 0.01) (n = 4). (B)
Real-time qPCR analysis shows unchanged expression of adiponectin (ADIPOQ) in
subcutaneous white adipose tissue of nitrate treated rats both in normoxia and hypoxia.
Cumulative data from a total of 5 independent observations are shown. Data are represented
as Mean ± SEM. **, P ≤ 0.01, ****, P ≤ 0.0001.
Page 47 of 52
For Peer Review Only
Diabetes

Fig. S9 Nitrate increases expression of brown adipocyte-specific genes in primary
white adipocytes differentiated from the stromal vascular fraction isolated from inguinal
WAT of PPARα null mice (Two-way ANOVA, Control vs. 50 µM NaNO3 P ≤ 0.0001,
Control vs. 500 µM NaNO3 P ≤ 0.0001). Cumulative data from a total of 4 independent
observations are shown. Data are represented as Mean ± SEM. ****, P ≤ 0.0001.
Page 48 of 52
For Peer Review Only
Diabetes

Fig. S10 Nitrate increases expression of phosphodiesterase 5 (PDE5) in white
adipocytes in vivo and in vitro. (A) Increased expression of PDE5 in subcutaneous WAT of
nitrate treated rats (One-way ANOVA, Control vs. 0.35 mM NaNO3 P ≤ 0.05, Control vs. 0.7
mM NaNO3 P ≤ 0.05, Control vs. 1.4 mM P ≤ 0.05). Six independent observations are
shown. (B) The expression of PDE5 increased in primary white adipocytes treated with
NaNO3 (25 µM, 50 µM and 500 µM) (One-way ANOVA, Control vs. 25 µM NaNO3 P ≤
0.05, Control vs. 50 µM NaNO3 P ≤ 0.05, Control vs. 500 µM NaNO3 P ≤ 0.001). Cumulative
data from a total of 4 independent observations are shown. Data are represented as Mean ±
SEM. * P ≤ 0.05, ***, P ≤ 0.001.
Page 49 of 52
For Peer Review Only
Diabetes
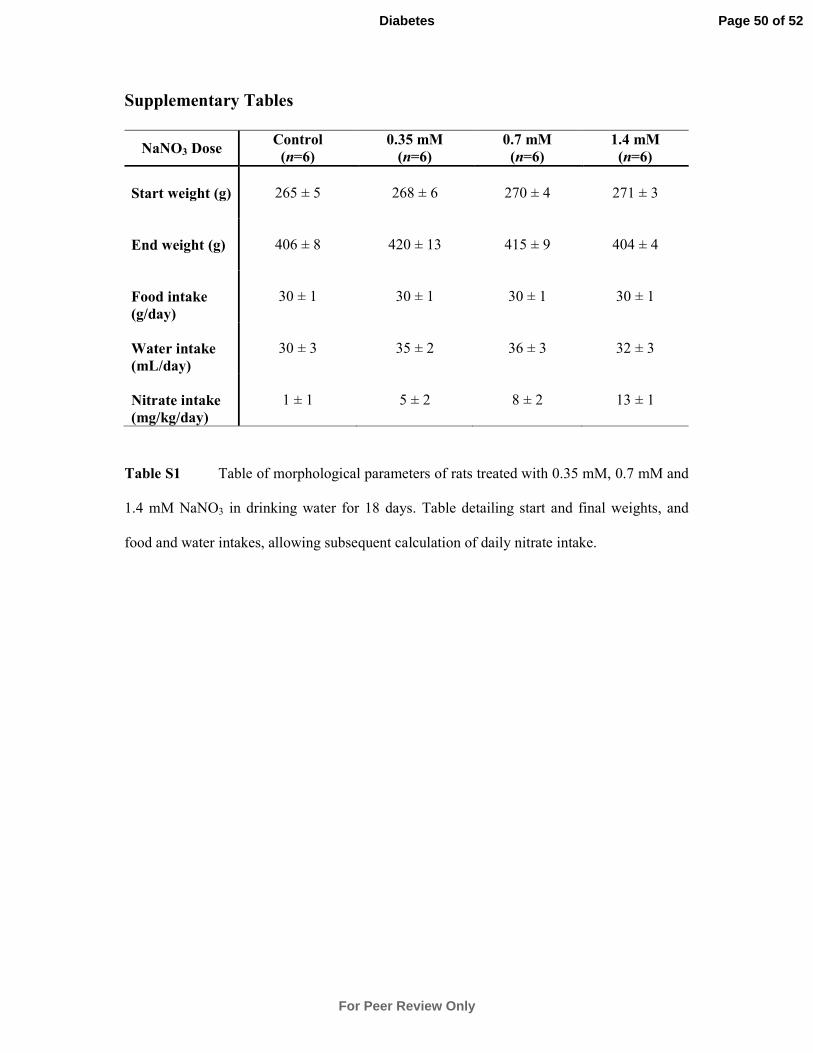
Supplementary Tables
NaNO3 Dose Control
(n=6)
0.35 mM
(n=6)
0.7 mM
(n=6)
1.4 mM
(n=6)
Start weight (g)
265 ± 5 268 ± 6 270 ± 4 271 ± 3
End weight (g)
406 ± 8 420 ± 13 415 ± 9 404 ± 4
Food intake
(g/day)
30 ± 1 30 ± 1 30 ± 1 30 ± 1
Water intake
(mL/day)
30 ± 3 35 ± 2 36 ± 3 32 ± 3
Nitrate intake
(mg/kg/day)
1 ± 1 5 ± 2
8 ± 2 13 ± 1
Table S1 Table of morphological parameters of rats treated with 0.35 mM, 0.7 mM and
1.4 mM NaNO3 in drinking water for 18 days. Table detailing start and final weights, and
food and water intakes, allowing subsequent calculation of daily nitrate intake.
Page 50 of 52
For Peer Review Only
Diabetes

Normoxia
0.7mM NaCl
Normoxia
0.7mM NaNO3
Hypoxia
0.7mM NaCl
Hypoxia
0.7mM NaNO3
Start weight (g) 268 ± 5 268 ± 6 276 ± 2 280 ± 4
End weight (g) 429 ± 8 431 ± 9 416 ± 14 412 ± 12
Food Intake
(g/day)
32 ± 2
33 ± 1
35 ± 2
33 ± 1
Water Intake
(ml/day)
28 ± 1 28 ± 1 27 ± 4 32 ± 2
Adipose tissue
(g)
3.5 ± 0.3 3.2 ± 0.2 4.4 ± 0.3 3.5 ± 0.3
Tibia Length
(mm) 47 ± 0.2 47 ± 0.2 47 ± 0.4 47 ± 0.4
Nitrate intake
(mg/kg/day)
1 ± 0 9 ± 0*** 1 ± 0 7 ± 0†††aa
Plasma
Triglycerides
(mmol / L)
0.93 ± 0.2 1.317 ± 0.1†† aaa
2.98 ± 0.4 *** 1.98 ± 0.2 *†
Plasma Glucose
(mmol/L)
12.9 ± 1.5 15.3 ± 2.9 15.5 ± 0.4 12.4 ± 0.7
Plasma Insulin
(µg/L)
2.7 ± 1 3.392 ± 1.2 1.410 ± 0.3 1.35 ± 0.4
Table S2 Table detailing morphological parameters of rats treated with 0.7 mM NaCl
or 0.7mM NaNO3 in drinking water and housed in normoxic or hypoxic conditions for 14
days. Two-way ANOVA with Tukey’s post-hoc test, significant effect compared to
normoxia/0.7 mM NaCl, * = p ≤ 0.05 ,** = p ≤ 0.01 ,*** = p ≤ 0.001. Two-way ANOVA
with Tukey’s post-hoc test, significant effect compared to hypoxia/0.7 mM NaCl, †† = p ≤
0.01 ,†††= p ≤ 0.001. 2-way ANOVA with Tukey’s post-hoc test, significant effect compared
to normoxia/0.7mM NaNO3, aa = p ≤ 0.01, aaa = p ≤ 0.001.
Page 51 of 52
For Peer Review Only
Diabetes

Supplementary References
1. Wu Z, et al. (1999) Mechanisms controlling mitochondrial biogenesis and respiration
through the thermogenic coactivator PGC-1. Cell 98(1):115-124.
2. Bostrom P, et al. (2012) A PGC1-alpha-dependent myokine that drives brown-fat-like
development of white fat and thermogenesis. Nature 481(7382):463-U472.
3. Komatsu M, et al. (2010) Multiple roles of PPARalpha in brown adipose tissue under
constitutive and cold conditions. Genes Cells 15(2):91-100.
4. Roberts LD, et al. (2014) beta-Aminoisobutyric Acid Induces Browning of White Fat and
Hepatic beta-Oxidation and Is Inversely Correlated with Cardiometabolic Risk Factors. Cell
Metab 19(1):96-108.
Page 52 of 52
For Peer Review Only
Diabetes