diabetes and poor mental health and wellbeing
TRANSCRIPT

DIABETES SERIES Number 16
Australian Institute of Health and Welfare Canberra
Cat. no. CVD 55
Diabetes and poor mental health and wellbeing
An exploratory analysis
June 2011

© Australian Institute of Health and Welfare 2011
© Australian Institute of Health and Welfare 2011
This work is copyright. Apart from any use as permitted under the Copyright Act 1968, no part may be reproduced without prior written permission from the Australian Institute of Health and Welfare. Requests and enquiries concerning reproduction and rights should be directed to the Head of the Communications, Media and Marketing Unit, Australian Institute of Health and Welfare, GPO Box 570, Canberra ACT 2601.
This publication is part of the Australian Institute of Health and Welfare’s diabetes series. A complete list of the Institute’s publications is available from the Institute’s website <www.aihw.gov.au>.
ISSN 1444 8033 ISBN 978 1 74249 175 2
Suggested citation
Australian Institute of Health and Welfare 2011. Diabetes and poor mental health and wellbeing: an exploratory analysis. Diabetes series no. 16. Cat. no. CVD 55. Canberra: AIHW.
Australian Institute of Health and Welfare
Board Chair Hon. Peter Collins, AM, QC Director David Kalisch
Any enquiries about or comments on this publication should be directed to: Communications, Media and Marketing Unit Australian Institute of Health and Welfare GPO Box 570 Canberra ACT 2601 Phone: (02) 6244 1032 Email: [email protected]
Published by the Australian Institute of Health and Welfare Printed by Union Offset Printers
The Australian Institute of Health and Welfare is Australia’s national health and welfare statistics and information agency. The Institute’s mission is
better information and statistics for better health and wellbeing.
Please note that there is the potential for minor revisions of data in this report. Please check the online version at <www.aihw.gov.au> for any amendments.

iii
Contents Acknowledgments.............................................................................................................................. iv Abbreviations ....................................................................................................................................... v Symbols ................................................................................................................................................ vi Summary ............................................................................................................................................. vii 1 Introduction .................................................................................................................................... 1
1.1 Background .............................................................................................................................. 1 1.2 Aim of the report ...................................................................................................................... 2
2 Definitions, data sources, methods and measures .................................................................. 3 2.1 What is diabetes? ...................................................................................................................... 3 2.2 What is poor mental health and wellbeing? ......................................................................... 4 2.3 Measuring prevalence ............................................................................................................. 4 2.4 Data sources and measures ..................................................................................................... 5 2.5 Methods ..................................................................................................................................... 8
3 Prevalence of diabetes and poor mental health and wellbeing in the population ........... 9 3.1 Diabetes ..................................................................................................................................... 9 3.2 Poor mental health and wellbeing ....................................................................................... 12
4 Prevalence of poor mental health and wellbeing among people with diabetes ............. 17 4.1 Psychological distress ............................................................................................................ 17 4.2 Mental disorders ..................................................................................................................... 20 4.3 Hospitalisations with a mental health condition ............................................................... 24 4.4 Mental health-related MBS services for people with diabetes ......................................... 28 4.5 Prevalence of poor mental health and wellbeing among subgroups of the
population with diabetes ..................................................................................................... 30
5 Summary and discussion ........................................................................................................... 35 Appendix 1: Tables............................................................................................................................. 38 Appendix 2: Methods......................................................................................................................... 58
Statistical methods ....................................................................................................................... 58
Appendix 3: Data sources .................................................................................................................. 62 Appendix 4: Sample size and population estimates .................................................................... 64 Appendix 5: Definitions and codes ................................................................................................. 67
5.1 Diabetes ................................................................................................................................... 67 5.2 Poor mental health and wellbeing ....................................................................................... 69 5.3 Additional definitions and codes ......................................................................................... 71
Glossary ................................................................................................................................................ 72 References ............................................................................................................................................ 76 List of tables ........................................................................................................................................ 77 List of figures ...................................................................................................................................... 79

iv
Acknowledgments
This report was prepared by Lany Trinh, Anne Broadbent and Anna Reynolds of the National Centre for Monitoring Diabetes at the Australian Institute of Health and Welfare (AIHW). Valuable input on the report and methods was gratefully received from Anne-Marie Waters, Stan Bennett, Susana Senes and Suzy Saw. This report was prepared under the guidance of the National Diabetes Data Working Group, chaired by Associate Professor Jeff Flack. Members of the working group at the time of publication were Ms Janelle Babare, Professor Stephen Colagiuri, Ms Liz Cotton, Associate Professor Maria Craig, Associate Professor Wendy Davis, Ms Susan Davidson, Mr Robert Guthrie, Professor Mark Harris, Ms Susana Senes, Dr Glynis Ross and Associate Professor Jonathan Shaw. We are also grateful to staff from the AIHW’s Publishing Services Unit and the Communications, Media and Marketing Unit for their help with publishing this report. The Australian Government Department of Health and Ageing funded this report. This report includes analysis of data from the Australian Longitudinal Study on Women’s Health conducted by the University of Newcastle and the University of Queensland and funded by the Australian Government Department of Health and Ageing.

v
Abbreviations
ABS Australian Bureau of Statistics AIHW Australian Institute of Health and Welfare ALSWH Australian Longitudinal Study on Women’s Health ARIA Accessibility/Remoteness Index of Australia ASGC Australian Standard Geographic Classification ASR age-standardised rate CI confidence interval CR crude rate CURF Confidentialised Unit Record Files DoHA Australian Government Department of Health and Ageing ERP estimated resident population GP general practitioner ICD-10-AM International Classification of Diseases and Related Health Problems, 10th revision, Australian Modification K10/K10+ Kessler Psychological Distress Scale MBS Medicare Benefits Schedule MHI-5 Mental Health Inventory, 5-item measure NDDWG National Diabetes Data Working Group NHMD National Hospital Morbidity Database NHS National Health Survey NSMHWB National Survey of Mental Health and Wellbeing RSE relative standard error SE standard error SEIFA Socio-Economic Indexes for Areas SF36 Short Form (36) SIP Service Incentive Payment SQRT square root WHO World Health Organization WMH-CIDI 3.0 World Mental Health–Composite International Diagnostic Interview version 3.0

vi
Symbols
— nil or rounded to zero % per cent ’000 thousands n.a. not available . . not applicable Note: Columns and rows in tables may not add due to rounding.

vii
Summary
This report examines the association between the prevalence of diabetes and poor mental health and wellbeing in the Australian population, based on a range of measures and national data sources. The main findings are: • Diabetes and poor mental health and wellbeing are both common health conditions in
Australia, with over 800,000 adults estimated to have diabetes and over 4 million adults estimated to have medium, high or very high levels of psychological distress.
• Australians with diabetes have a higher prevalence of poor mental health and wellbeing than those without diabetes. – Adults with diabetes had a significantly higher prevalence of medium, high or very
high psychological distress than those without diabetes (43.4% and 32.2% respectively), after adjusting for age differences in the groups, based on the 2007–08 National Health Survey.
– In 2007–08, diabetes hospitalisations were more likely to also have a mental health condition recorded than other hospitalisations (age-standardised rates of 8.4% and 7.5% respectively). Substance use, dementia/Alzheimer disease and depression were the most common mental health conditions.
– The proportion of people who claimed a mental health-related service from the Medicare Benefits Schedule (MBS) in 2008 was twice as high for those with a diabetes-related MBS service than for those without a diabetes-related MBS service (age-standardised rates of 13% and 6% respectively).
• People with diabetes who were current smokers were more likely to have a mental disorder and more likely to have medium, high or very high levels of psychological distress than people with diabetes who were not current smokers.
This analysis also highlights the limitations of existing data for obtaining accurate estimates of the prevalence of poor mental health among people with diabetes. The feasibility of enhancing existing administrative and survey data collections, or undertaking more specific surveys focused on people with diabetes, should be considered.


1
1 Introduction
1.1 Background Both diabetes mellitus (diabetes) and mental illness are major diseases in Australia. It is estimated that in 2003 diabetes contributed 5% (rising to 8% if diabetes-related cardiovascular complications are included) and mental illness 12% to the overall burden of disease (Begg et al. 2007). Together, diabetes and mental illness contribute at least 20% of the total burden of disease in Australia. Latest estimates indicate that more than 800,000 adult Australians are living with diabetes, over 3 million with a mental disorder and over 4 million with medium, high or very high levels of psychological distress. There is growing evidence of an association between chronic disease and poor mental health. Moussavi and others (2007) reported that mental disorders have a deleterious effect on chronic illness, through the immune, endocrine and nervous systems, as well as through behavioural risk factors, such as poor diet, lack of physical activity and substance use. More specifically, the association between diabetes and poor mental health has also been increasingly recognised by clinicians and researchers, with evidence coming mainly from clinical studies. In one such study, Hislop and others (2008) found that one-third of young Australian adults (mean age 22 years) with Type 1 diabetes had also experienced psychological distress. A clinical study of women found a two-way relationship between Type 2 diabetes and clinical depression (Pan et al. 2010). There is some evidence that diabetes may increase the risk of poor mental health through psychological adjustment of a newly diagnosed person to their condition (Chandola et al. 2006); that Type 2 diabetes can increase the risk of developing dementia at later ages through microvascular complications (Pasquier et al. 2006); and that Type 1 diabetes can be associated with eating disorders in young patients (Nielsen 2002). An individual with poor mental health may also have an increased risk of developing diabetes through the neuroendocrine system. A sustained stress level can influence the production of various hormones regulating cholesterol level, blood sugar levels and blood pressure (Chandola et al. 2006). Anti-psychotic drugs may also lead to an increased risk of developing diabetes through high blood sugar levels and weight gain (Bellantuono et al. 2004). There is also an association between poor mental health and health risk factors for diabetes such as physical inactivity, poor diet, smoking and obesity (IDF 2010). Despite this growing evidence, no broad level population-based studies of the association between diabetes and poor mental health have previously been reported in Australia. Some of the factors contributing to this include: • the scarcity of detailed national data on Australians living with diabetes—most diabetes
prevalence information are estimates based on self-reported data in the Australian Bureau of Statistics’ (ABS) National Health Surveys (NHSs), and sample sizes are small
• surveys that collect detailed information on mental health do not include a large sample of those with diabetes
• monitoring of diseases such as diabetes and their outcomes, taking into account broader aspects of patients’ needs and quality of life, is a relatively new development in public health systems

2
• the extent of the prevalence and impact of poor mental health on Australians has only relatively recently been recognised
• both diabetes and poor mental health often go undiagnosed or untreated.
1.2 Aim of the report This report presents the most up-to-date estimates on the number of people with diabetes and poor mental health in Australia, and examines, at a broad population level, whether people with diabetes are more likely to have poor mental health and wellbeing than other Australians. A range of both survey and administrative data are examined. The findings have implications for the delivery of diabetes services and treatment in Australia as well as for models of care. The key research questions considered in this report are: • What is the prevalence of diabetes and of poor mental health in the Australian
population? • What is the prevalence of poor mental health and wellbeing in the population with
diabetes, and how does this compare to those without diabetes? • Does the prevalence of poor mental health and wellbeing in the population with diabetes
differ by age, sex and other population characteristics?

3
2 Definitions, data sources, methods and measures
2.1 What is diabetes? Diabetes mellitus (diabetes) is a chronic condition in which the body makes too little of the hormone insulin, or cannot use it properly. This raises the blood level of the body’s major energy source, glucose, and causes other widespread disturbance of the body’s energy processes. The three main types of diabetes, known as Type 1, Type 2 and gestational diabetes (see Box 2.1), are the result of different causes and clinical histories.
Box 2.1: Types of diabetes Type 1 diabetes is caused by a total or near-total lack of insulin and results from destruction of insulin-producing cells in the pancreas. It most commonly occurs in children and young adults. People with this form of diabetes require daily insulin therapy to survive. Type 2 diabetes is characterised by reduced levels of insulin or the inability of the body to use insulin properly (insulin resistance). It is more common among people aged 45 years and above. It can be treated with changes to diet and exercise, oral hypoglycaemic (glucose-lowering) drugs, but some people may also need insulin therapy. Gestational diabetes is a form of diabetes that develops during pregnancy in some women. It involves high blood sugar levels appearing for the first time during pregnancy and affects women who have not previously been diagnosed with other forms of diabetes. It is a transient form of diabetes and usually disappears after the baby is born. However, it can recur in later pregnancies. It is also associated with an increased risk of developing Type 2 diabetes later in life. Source: AIHW 2008.
Diabetes requires ongoing self-care and management to minimise its impact in both the short and long term. Monitoring of eating habits, weight control and daily clinical control of glucose levels are required to prevent or reduce complications from the disease. If untreated or poorly managed, diabetes can lead to a range of complications, including: • diabetic ketoacidosis due to a lack of insulin, which without urgent medical intervention
can lead to coma and death • hypoglycaemia resulting from too much insulin or insufficient blood sugar, leading to
fainting • an increased vulnerability to infection and decreased ability to heal • diseases of the large vessels (macrovascular diseases) such as coronary heart disease,
stroke and peripheral vascular disease • diseases of the small blood vessels (microvascular diseases) such as retinopathy, kidney
disease and neuropathy (peripheral nerve disease) • disability resulting from amputation, visual impairment or other physical impairment.

4
Good management of diabetes can avoid or delay the development of these complications and improve the quality of life of a person with diabetes. The presence of mental illness in conjunction with diabetes can contribute to poorer management of the disease.
2.2 What is poor mental health and wellbeing? ‘Mental health’ is defined as a state of wellbeing in which every individual realises his or her own potential, can cope with the normal stresses of life, can work productively and fruitfully, and is able to make a contribution to their community (WHO 2010). Mental health is essential to resilience and positive adaptation to change. In this report ‘poor mental health and wellbeing’ includes both mental health problems and mental disorders. Mental health problems and mental disorders refer to the spectrum of cognitive, emotional and behavioural disorders that interfere with the lives and productivity of people. A mental disorder is a diagnosable illness that significantly interferes with an individual’s cognitive, emotional or social abilities. It includes depression, anxiety, substance use disorders, psychosis and dementia. The term mental illness is sometimes used instead of mental disorder. A mental health problem also interferes with a person’s cognitive, emotional or social abilities, but to a lesser extent than a mental disorder. Mental health problems are more common mental complaints and include the mental ill health temporarily experienced as a reaction to life stressors. The distinction between mental health problems and mental disorders is not well defined. Poor mental health can impair a person’s ability to control their behaviour and to manage their life. The impact of poor mental health and wellbeing varies considerably. It can affect a person’s ability to live independently and fulfil their daily needs. It can also impact on the family caring for the person affected. There are many people in Australia living with undiagnosed mental disorders and mental health problems.
2.3 Measuring prevalence The term ‘prevalence’ refers to the number or proportion of people living with a particular disease within a population at a given time. This report provides estimates of the prevalence of diabetes and poor mental health and wellbeing in the Australian population, based on a number of data sources. It also compares the prevalence of poor mental health and wellbeing in the population of Australians with diabetes with the prevalence in the population without diabetes. It is difficult to accurately measure the prevalence of diabetes, particularly Type 2 diabetes, as people will often develop the disease some time before diagnosis. This leads to a general underestimation of the number of people with diabetes in population health surveys, where identification of the disease is through self-reported information. Similarly, accurately measuring the prevalence of poor mental health and wellbeing is difficult. ‘Poor mental health and wellbeing’ reflects a wide spectrum of mental health states ranging from temporary stress to more serious long-term mental health diseases and disorders. Identifying people with poor mental health in population-based surveys usually involves the use of a standard set of questions which, in combination, provide a ‘score’ for

5
each individual. There is a range of accepted mental health scores commonly used to collect this information through surveys (including Kessler Psychological Distress Scale 10 or10+, and the mental health component of Short Form 36(SF36)). To estimate the prevalence of specific mental disorders anxiety, affective and substance use disorders, the 2007 National Survey of Mental Health and Wellbeing (NSMHWB) used the World Mental Health-Composite International Diagnostic Interview, version 3.0 (WMH-CIDI 3.0).
2.4 Data sources and measures
Data sources A number of data sources and measures were used in this report, providing a range of prevalence estimates for diabetes and poor mental health and wellbeing. Two ABS Australia-wide health surveys that collected information on both self-reported diabetes and mental health provide population prevalence estimates are the: • 2007–08 National Health Survey (NHS) • 2007 National Survey of Mental Health and Wellbeing (NSMHWB). However, as these surveys select a sample from most of the Australian population, the number of respondents with specific diseases such as diabetes is relatively small (see sample size (n) in Table 2.1). While the sample is weighted to the total Australian population (see population size (N) in Table 2.1), the small sample sizes of the populations of interest result in large confidence intervals, leading to low precision, and limit the conclusions that can be drawn. To provide more robustness to the analysis and different perspectives on the possible association between diabetes and poor mental health, two large national administrative databases were also analysed, these were the: • National Hospital Morbidity Database (NHMD) 2007–08 • Medicare Benefits Schedule (MBS) 2008. These administrative databases are not representative of all people with diabetes or poor mental health and wellbeing in Australia, as they only include information on people who used those particular services in the specified time period. The NHMD data include only hospitalisations for admitted patients where the patient was separated in 2007–08. Medicare data include only people who claimed an MBS service in 2008. It should be noted that the counts from the NHMD are of hospitalisations, not people. One person may have multiple hospitalisations within the year. As these hospitalisations cannot be linked to an individual, each is counted separately. Despite this, the administrative databases provide useful information on the relationship between diabetes and poor mental health and wellbeing. The numbers of hospitalisations and MBS services are relatively large (see Table 2.1), allowing greater disaggregation of the data than is possible with the survey data. Unweighted data on respondents to the Australian Longitudinal Study on Women’s Health (ALSWH) were also included in this analysis, to provide additional information on women who reported both diabetes and poor mental health. As population weights were unavailable other than for the baseline sample, the counts are unweighted (that is, they refer to respondents only).

6
A summary of the data sources, their scope and associated sample and population estimates is provided in Table 2.1. Detailed information is provided in appendixes 3 and 4.
Measures of diabetes and poor mental health and wellbeing The measures of diabetes and mental health status available varied with the data source. For this report, diabetes status was derived as follows: • For the NHS, diabetes status was derived from self-reported responses to questions on
chronic health conditions. People who reported that they had ever been told by a doctor or nurse that they had diabetes and it was still current and it was a long-term condition were considered to have diabetes.
• For the NSMHWB, diabetes status was also based on self-reported information from respondents to the survey. However, the definition is broader than that for the NHS as it includes ‘high sugar level in blood or urine’ as well as diabetes, and is based only on whether a person has ever been told that they have one of the conditions (that is, it is not restricted to having the condition currently and it being a long-term condition).
• For the ALSWH data, diabetes status was based on whether a woman responded ‘yes’ to questions on whether she had ever been treated or diagnosed with diabetes or high blood sugar in the 3 years before the survey.
• From the NHMD, diabetes hospitalisations were identified as those with a principal or additional diagnosis of diabetes. Counts are of individual hospital separations, not people.
• In the Medicare data, people with diabetes are defined as those who had at least one diabetes-related MBS service claimed from Medicare in 2008.
Poor mental health and wellbeing status was determined as follows: • Medium, high or very high levels of psychological distress based on Kessler 10 score in
the NHS, and Kessler 10+ score in the NSMHWB. • From the NSMHWB a second measure of poor mental health and wellbeing was also
derived. Lifetime mental disorder with 12-months symptoms (anxiety disorders, affective disorders and substance use disorders only), derived based on responses to the World Mental Health–Composite International Diagnostic Interview Version 3.0 (WMH-CIDI 3.0), a self-administered screening module, provided the second measure.
• In the ALSWH, self-reported responses to the Mental Health Index (MHI-5), with a score of less than 53.
• From the NHMD, separations with poor mental health and wellbeing were identified as those with a principal or additional diagnosis of a mental or behavioural disorder, or with an external cause code for intentional self-harm, or with any psychiatric care day. Counts are of individual hospital separations, not people.
• In the Medicare data, people with poor mental health and wellbeing were defined as those who had at least one mental health-related MBS service claimed from Medicare in 2008.
These measures are summarised in Table 2.1 and described in more detail in appendixes 4 and 5. The ICD-10-AM codes and MBS items used to define the populations of interest are provided in Appendix 5.

7
Table 2.1: Summary of definitions, sample size and population estimates by data source(a)
Data source Year Population Diabetes Poor mental health and wellbeing
Sample with
diabetes (n)
Sample with diabetes and poor
mental health (n)
Population with
diabetes (N)
Population with diabetes
and poor mental health
(N)
National Health Survey (NHS) 2007–08 People aged 18+ yrs Self-reported. Ever told by doctor or nurse has diabetes and condition still current and long-term
Medium to very high psychological distress (Kessler 10 >15)(b)
850 849
(excluding missing
K10)
341 809,957 808,947
(excluding missing K10)
336,190
National Survey of Mental Health and Wellbeing (NSMHWB)
2007 People aged 18–85 yrs Self-reported. Ever told by doctor or nurse has diabetes or high sugar level in blood or urine
Medium to very high psychological distress (Kessler 10+ >15)(b)
698 227 1,191,402 369,688
National Survey of Mental Health and Wellbeing (NSMHWB)
2007 People aged 16–85 yrs Self-reported Lifetime mental disorder (anxiety, affective and substance use disorders) with 12-months symptoms
701 139 1,197,910 208,793
National Hospital Morbidity Database (NHMD)
2007–08 Hospitalisations all ages
Hospitalisations with any diagnosis of diabetes based on ICD-10-AM codes (E10–E14, O240–O244, O249)
Hospitalisations with any diagnosis of mental and behavioural disorder (ICD-10-AM codes F00–F99) or intentional self-harm (ICD-10-AM codes X60–84) or with any psychiatric care day
. . . . 668,251 56,842
Medicare data 2008 People all ages Claimed at least one diabetes-related MBS service (see Appendix table 5.3)
Claimed at least one mental health-related MBS service (see Appendix table 5.6)
. . . . 177,465 11,206
Australian Longitudinal Study on Women’s Health (ALSWH)
2006 Women 28–33 yrs Self-reported diabetes Self-reported diabetes Self-reported diabetes/high blood sugar
Mental Health Index of SF36 (MHI–5)<53
247 48 . . . .
2007 Women 56–61 yrs 702 155 . . . .
2008 Women 81–87 yrs 663 95 . . . .
(a) See appendixes 3, 4 and 5 for more detail on data sources and specific codes. (b) Note that the NHS used Kessler 10 while the NSMHWB used Kessler 10+. K10+ includes one additional question as well as a reference to ‘depressed’ rather than ‘sad’ in one of the questions (the K10+ asks ‘during the
past 30 days, how often did you feel so depressed that nothing could cheer you up’? whereas the K10 asks ‘in the past 4 weeks, about how often did you feel so sad that nothing could cheer you up?’). The order of questions is also different in K10 and K10+.

8
2.5 Methods This report provides estimates of the prevalence of diabetes and of poor mental health and wellbeing in terms of both the number of people or number of hospitalisations and rates (expressed as a per cent of the relevant population). Crude and age-standardised rates are provided. Crude or age-specific prevalence rates are calculated by dividing the population with a particular condition by the total population, multiplied by 100 (to give per cent). In this report, crude rates are used to measure the prevalence of poor mental health and wellbeing among people with diabetes at a total population level and by age group. Both the prevalence of diabetes and the prevalence of poor mental health and wellbeing are clearly associated with age. To take account of the impact of age on prevalence rates when comparing rates across populations of interest, rates have been directly age-standardised. The standard populations used were the Australian estimated resident population (ERP) June 2001 for estimates from the two surveys and Medicare data and all hospitalisations in 2007–08 for the NHMD estimates. Confidence intervals (95%) around the crude and age-adjusted prevalence rates have been provided to indicate the reliability of the estimates. These were used to indicate the significance of differences and associations. This relatively conservative approach was taken due to concerns about the representativeness of the data for specific population groups as a result of small sample sizes. The small sample sizes for people with diabetes and poor mental health and wellbeing, in particular, require that results be treated with caution. Data have been grouped to ensure that no estimates have a relative standard error (RSE) greater than 50%. Estimates with an RSE between 25% and 50%, annotated with an asterisk in the tables, should be treated with caution. Estimates from the NHS and NSMHWB were rounded to the nearest 10 and, as a result, totals may not add up.

9
3 Prevalence of diabetes and poor mental health and wellbeing in the population
This chapter provides estimates of the prevalence of diabetes and of poor mental health and wellbeing in the Australian population. The estimates vary according to the source from which they were derived and the measures used. Interpretation of the estimates and the differences should be undertaken bearing in mind the scope and coverage of the data sources and the measures of diabetes and mental health used in each. Details of these are provided in Table 2.1 and in appendixes 3, 4 and 5.
3.1 Diabetes
Estimated prevalence of diabetes in the Australian population Based on self-reported data from the 2007–08 NHS it is estimated that around 800,000 people aged 18 years and over, or one in twenty adult Australians, are living with diabetes (Table 3.1). This is a conservative estimate as not all people with diabetes know that they have the disease, and not all people with the disease would consider that it is a current and a long-term condition. This can be due to a lack of awareness or diagnosis of the disease or the way questions were phrased in the survey, or a combination of both. Diabetes is significantly more prevalent in men than in women, with 6.0% of males and 4.4% of females reporting in the 2007–08 NHS that they have diabetes. It is much more prevalent among older people compared with younger people (Figure 3.1).
Table 3.1: Prevalence of diabetes among people aged 18 years and over, 2007–08
Males Females Persons
Age group (yrs) Number % 95% CI
Number % 95% CI
Number % 95% CI
18–39 18,280 0.6 0.3–0.8 26,990 0.8 0.4–1.3 45,280 0.7 0.5–0.9
40–49 54,570 3.6 2.5–4.8 48,370 3.2 1.9– 4.4 102,940 3.4 2.5–4.3
50–59 110,260 8.5 6.7–10.3 75,120 5.7 3.5–7.8 185,380 7.0 5.5–8.6
60–69 154,010 16.2 13.1–19.2
77,300 8.2 6.2–10.1
231,310 12.2 10.4–13.9
70+ 125,310 15.5 11.6–19.3
119,740 12.2 9.8–14.5
245,050 13.7 11.5–15.8
Total 462,430 6.0 5.3–6.6 347,530 4.4 3.7–5.0 809,960 5.1 4.7–5.6
Source: AIHW analysis of ABS 2007–08 NHS reissue 1 expanded CURF.

10
Note: NHS 2007–08 includes people aged 18 years and over; NSMHWB 2007 includes people aged 18–85 years.
Sources: AIHW analysis of ABS 2007–08 NHS, reissue 1 and 2007 NSMHWB, version 2, expanded CURF.
Figure 3.1: Prevalence of diabetes in people aged 18 years and over, by age, 2007 and 2007–08
The prevalence estimate for people aged 18–85 years obtained from the 2007 NSMHWB, at 1.2 million, is higher than that from the NHS (Table A3.1). While this is also self-reported, in the NSMHWB people were asked if they were ever told by a doctor or nurse that they had diabetes OR high blood sugar levels in their blood or urine. In the NHS the question was restricted to diabetes. The addition of the ‘high blood sugar’ condition, and the lack of extra screening on whether the condition is long term or current (as in the NHS) are likely reasons for the higher prevalence estimate from the NSMHWB. As with the NHS, the NSMHWB found a significantly higher prevalence of diabetes/high blood sugar among older people compared with those in younger age groups (Figure 3.1). However, the prevalence rates for men (7.6%) and women (7.9%) were not found to differ significantly (Table A3.1).
Hospitalisations with diabetes In 2007–08, 8.5% of hospital separations (or hospitalisations) had a principal or additional diagnosis of diabetes. This includes Type 1, Type 2, gestational and other diabetes (see Appendix 5 for ICD-10-AM codes) (Table A3.2). It should be noted that a hospitalisation is not the same as an individual person. An individual may go to hospital more than once in a year and therefore have multiple ‘hospitalisations’. A principal or additional diagnosis of diabetes was more prevalent in hospitalisations of males (9.5%) compared with females (7.6%) and among those for older people compared with younger people (Table A3.2).
0
2
4
6
8
10
12
14
16
18
20
18–39 40–49 50–59 60–69 70+
Per cent
Age group (years)
NHS
NSMHWB

11
In 2007–08 there was a much higher proportion of hospitalisations with a diagnosis of Type 2 diabetes (7.5%) than Type 1 diabetes (0.7%). While the proportions with Type 1 diabetes were similar for males and females (0.7% and 0.6% respectively), male hospitalisations were more likely to be for Type 2 diabetes than female hospitalisations (8.7% compared with 6.4% respectively) (Table A3.3). Type 1 diabetes was more common in hospitalisations for younger people while Type 2 was more common in hospitalisations for older people (Figure 3.2).
Source: AIHW NHMD, 2007–08.
Figure 3.2: Proportion of hospitalisations with a principal or associated diagnosis of diabetes, by type of diabetes and age, 2007–08
Diabetes-related MBS services In 2008, 177,465 people had at least one diabetes-related MBS claim (as defined in Appendix table 5.6, Appendix 5). For the purpose of this report these include a consultation with a medical practitioner for an annual diabetes cycle of care assessment, or with an allied health provider for a diabetes education, exercise physiology or dietetics service specifically for people with diabetes. This represented 0.9% of the 19 million Australians who had at least one claim for any MBS service in that year (Table A3.4). This number is well below the estimated 800,000 people in Australia living with diabetes, indicating a relatively limited claim of these MBS services. This may be due to people with diabetes either not receiving a diabetes-related service, or because the service was not claimed through Medicare. For example, there are some indications that annual cycle of care services are not always claimed by general practitioners due to the complexity and administrative burden of the Diabetes Service Incentive Payment (SIP) (De Domenico et al.
0
2
4
6
8
10
12
14
16
0–14 15–24 25–34 35–44 45–54 55–64 65–74 75–84 85+
Per cent
Age group (years)
Type 1 diabetes
Type 2 diabetes

12
2005). Patients with diabetes where the service was not claimed through Medicare are not included in MBS data. The rate of claims for diabetes-related MBS services was similar for males and females (1.0% compared with 0.9% respectively). Older people were more likely to have a diabetes-related MBS claim than younger people, with those aged 70–79 years having the highest rates (4.2% compared with 4.5% respectively) (Table A3.4).
3.2 Poor mental health and wellbeing
Estimated prevalence of poor mental health and wellbeing in the Australian population As outlined in Chapter 2, there are several measures of poor mental health and wellbeing used in this report, depending on the data source. The following presents prevalence estimates based on these various measures.
Medium, high or very high psychological distress Both the 2007–08 NHS and the 2007 NSMHWB included a 10-item questionnaire about the level of nervousness, agitation, psychological fatigue and depression in the most recent 4-week period (Kessler 10 and Kessler 10+ respectively). K10/K10+ provide a measure of self-reported non-specific psychological distress. For this report, people with a K10 or K10+ score greater than 15 are defined as having medium, high or very high levels of psychological distress. Estimates from the NHS and the NSMHWB indicate that around 4.4–5.1 million people aged 18 years and over had medium, high or very high levels of psychological distress. This is around 30% of the Australian adult population (Table 3.2).
Table 3.2: Prevalence of medium, high or very high levels of psychological distress in people aged 18 years and over, 2007–08
Survey (age group)
Males Females Persons
Number % 95% CI Number % 95% CI Number % 95% CI
NHS (18+ yrs) 2,191,310 28.2 26.7–29.7
2,951,110 37.0 35.6–38.4
5,142,420 32.7 31.6–33.7
NSMHWB (18–85 yrs) 1,907,690 25.1 23.1–27.1
2,529,950 32.6 30.7–34.6
4,437,650 28.9 27.5–30.3
Note: Excludes people with a missing Kessler 10 score. Source: AIHW analysis of ABS 2007–08 NHS reissue 1 and 2007 NSMHWB version 2, expanded CURF.
Both surveys found that women had a significantly higher prevalence of medium, high or very high psychological distress than men (37.0% compared with 28.2% in the NHS, and 32.6% compared with 25.1% in the NSMHWB). The prevalence of medium, high or very high psychological distress was higher in people aged 18–39 years than among older people (Figure 3.3, tables A3.5 and A3.6).

13
Note: NHS 2007–08 includes people aged 18 years and over; NSMHWB 2007 includes people aged 18–85 years.
Sources: AIHW analysis of ABS 2007–08 NHS, reissue 1 and 2007 NSMHWB, version 2, expanded CURF.
Figure 3.3: Prevalence of medium, high and very high psychological distress in people aged 18 years and over, by age, 2007 and 2007–08
Mental disorder The 2007 NSMHWB included a variety of diagnostic modules derived from the World Mental Health-Composite International Diagnostic Interview (WMH-CIDI) instrument. The information collected was used to determine if respondents met diagnostic thresholds for affective disorders, anxiety disorders and substance use disorders. Diagnoses were derived based on information provided by respondents on lifetime experiences and the presence of symptoms of that disorder in the 12 months before the survey interview. This survey did not capture other mental disorders, such as dementia or schizophrenia. From these data it is estimated that in 2007, 3.2 million people aged 16–85 years (20.0% of the population) had a mental disorder as defined above (Table A3.7). Almost 15% of the population were identified as having anxiety disorders such as panic disorder, social phobias, post-traumatic stress disorder and obsessive compulsive disorder; 6.2% had affective disorders such as depression, mania and bipolar affective disorder; and 5.1% had a substance use disorder (Table A3.8). Note that people can have more than one disorder. The prevalence of a mental disorder was significantly higher in women than in men (22.3% and 17.6% respectively) and more prevalent among people aged less than 50 years than in those aged 60 years and over (Table A3.7 and Figure 3.4).
0
5
10
15
20
25
30
35
40
45
18–39 40–49 50–59 60–69 70–85
Per cent
Age group (years)
NHS
NSMHWB

14
Source: AIHW analysis of ABS 2007 NSMHWB, expanded CURF, version 2.
Figure 3.4: Prevalence of mental disorders in people aged 16–85 years, by sex and age, 2007
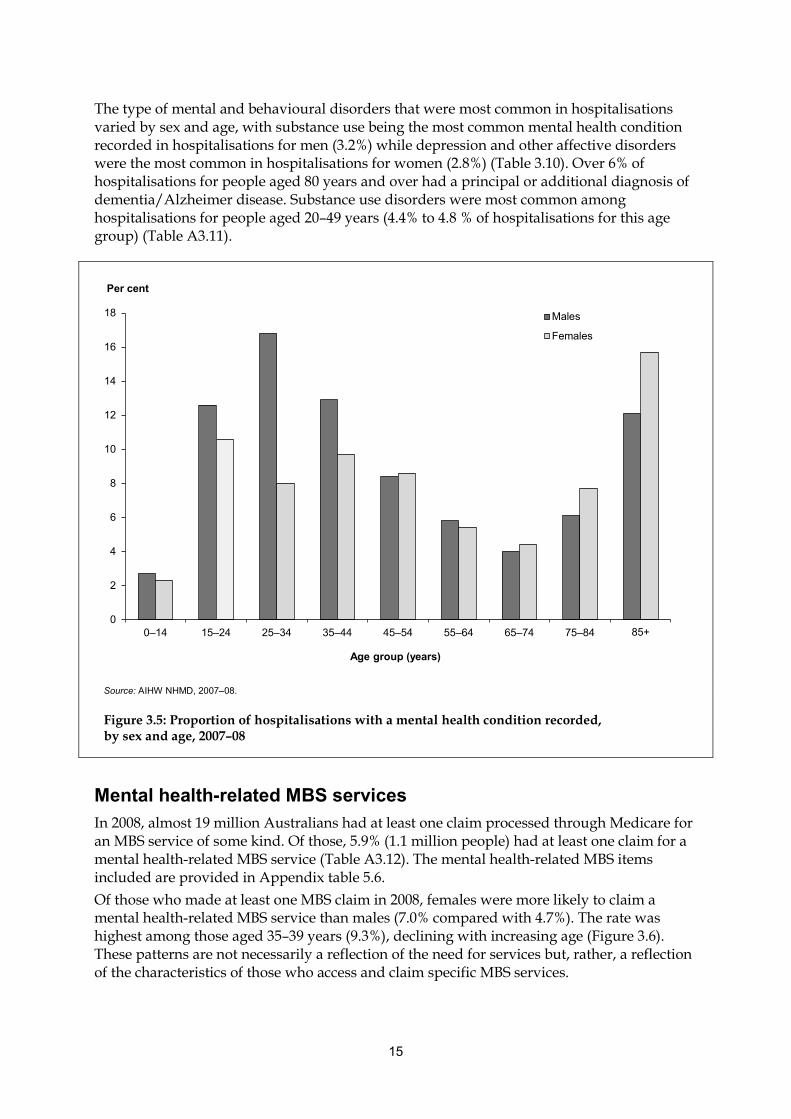
Hospitalisations with a mental health condition In 2007–08, 7.6% of all hospitalisations had a mental health condition recorded (defined in this report as a hospitalisation with a principal or additional diagnosis of a mental and behavioural disorder, an external cause of intentional self-harm, or at least one day in psychiatric care) (Table A3.9). Mental health conditions include all mental and behavioural disorders, including dementia and Alzheimer disease (see Appendix 5 for specific codes). The proportion with a mental health condition was similar for male and female hospitalisations (7.6 and 7.7% respectively). Hospitalisations for people aged 85 years and over had the highest proportion with a mental health condition recorded (14.1%), largely due to the high prevalence of dementia and Alzheimer disease among the elderly (Figure 3.5). Hospitalisations for those aged 15–44 years also had relatively high proportions with a mental health condition recorded. In 2007–08 hospitalisations, substance use disorders (2.4%) were the most prevalent mental and behavioural disorder recorded, followed by depression and other affective disorders (2.2%) and neurotic disorders (1.6%) (Table A3.10).
0
5
10
15
20
25
30
35
16–39 40–49 50–59 60–69 70–85
Per cent
Age group (years)
Males
Females
15
The type of mental and behavioural disorders that were most common in hospitalisations varied by sex and age, with substance use being the most common mental health condition recorded in hospitalisations for men (3.2%) while depression and other affective disorders were the most common in hospitalisations for women (2.8%) (Table 3.10). Over 6% of hospitalisations for people aged 80 years and over had a principal or additional diagnosis of dementia/Alzheimer disease. Substance use disorders were most common among hospitalisations for people aged 20–49 years (4.4% to 4.8 % of hospitalisations for this age group) (Table A3.11).
Source: AIHW NHMD, 2007–08.
Figure 3.5: Proportion of hospitalisations with a mental health condition recorded, by sex and age, 2007–08
Mental health-related MBS services In 2008, almost 19 million Australians had at least one claim processed through Medicare for an MBS service of some kind. Of those, 5.9% (1.1 million people) had at least one claim for a mental health-related MBS service (Table A3.12). The mental health-related MBS items included are provided in Appendix table 5.6. Of those who made at least one MBS claim in 2008, females were more likely to claim a mental health-related MBS service than males (7.0% compared with 4.7%). The rate was highest among those aged 35–39 years (9.3%), declining with increasing age (Figure 3.6). These patterns are not necessarily a reflection of the need for services but, rather, a reflection of the characteristics of those who access and claim specific MBS services.
0
2
4
6
8
10
12
14
16
18
0–14 15–24 25–34 35–44 45–54 55–64 65–74 75–84 85+
Per cent
Age group (years)
Males
Females

16
Source: AIHW analysis of 2008 Medicare data.
Figure 3.6: People with at least one mental health-related MBS service as a proportion of all people who claimed any MBS service in 2008, by sex and age
0
2
4
6
8
10
12
0–29 30–34 35–39 40–44 45–49 50–54 55–59 60–64 65–69 70–74 75–79 80+
Per cent
Age group (years)
MalesFemales

17
4 Prevalence of poor mental health and wellbeing among people with diabetes
The previous chapter presented estimates of the prevalence of diabetes, and the prevalence of poor mental health and wellbeing, in the Australian population. This chapter focuses on the Australian population with diabetes. Estimates of the prevalence of poor mental health and wellbeing in the diabetes populations of interest are provided for males and females and by age group, based on the mental health measures available in the data sources. These are provided as crude rates, unadjusted for age, to show the actual prevalence rate within the diabetes population. This chapter also looks at whether people with diabetes are more likely to have poor mental health and wellbeing than other Australians, taking into account age differences in the two populations. Differences in age structure in the populations with and without diabetes have been accounted for by age-standardising the prevalence rates. The significance of the difference between the two population groups (people with diabetes and people without diabetes) was tested using 95% confidence intervals around the prevalence rates (see Chapter 2 for details). The analysis presented in this chapter was limited by the small sample sizes in the survey populations (see Table 2.1), resulting in wide confidence intervals around some estimates for the population with diabetes and some large relative standard errors (RSEs). As a result the conclusions that could be drawn on differences in prevalence rates were restricted. However, it should be noted that the lack of a statistically significant association does not mean that one does not exist, but rather that it cannot be statistically proven to exist.
4.1 Psychological distress
Prevalence in the diabetes population From the 2007–08 NHS it is estimated that 41.6% of people aged 18 years or over with diabetes also had medium, high or very high levels of psychological distress (Table A4.1). The rate for women was 45.4%, and for men 38.7%. Around half of the population with diabetes aged 40–59 years were found to have medium, high or very high levels of psychological distress (Figure 4.1). The 2007 NSMHWB gives slightly lower estimates of the prevalence of psychological distress among people with diabetes aged 18–85 years. An estimated 31.0% of people with diabetes were found to also have medium, high or very high levels of psychological distress in this survey. However, the patterns by age and sex are similar to those found from the NHS, with a higher prevalence of psychological distress among women with diabetes compared with men (34.0% and 27.9% respectively), and among younger people with diabetes compared with older people (Table A4.2 and Figure 4.1). However, it should be noted that these differences are not significant.

18
Note: NHS 2007–08 includes people aged 18 years and over; NSMHWB 2007 includes people aged 18–85 years.
Sources: AIHW analysis of ABS 2007–08 NHS, reissue 1 and 2007 NSMHWB, version 2, expanded CURF.
Figure 4.1: Prevalence of medium, high and very high psychological distress among people with diabetes aged 18 years and over, by sex, 2007 and 2007–08
Comparison with people without diabetes Estimates based on data from the 2007–08 NHS indicate that people with diabetes had a significantly higher prevalence of medium, high or very high levels of psychological distress than people without diabetes (41.6% compared with 32.2%) (Table A4.1). This difference was found to be significant for both males and females, and for the 40–59 years and 60+ years age groups. After adjusting for differences in the age structure of the two populations, estimates derived from the NHS indicate that people with diabetes still had a significantly higher prevalence of medium, high or very high levels of psychological distress than those without diabetes (43.4% compared with 32.2%) (Table 4.1). Regardless of diabetes status, women had a higher prevalence of medium, high or very high levels of psychological distress than men (Figure 4.2). Women with diabetes had a significantly higher prevalence of medium, high or very high psychological distress than women without diabetes (50.4% compared with 36.8% after adjusting for age). While men with diabetes also had a higher prevalence of medium, high or very high psychological distress than those without diabetes (34.4% compared with 27.3%), the difference was not found to be significant.
0
10
20
30
40
50
60
18–39 40–59 60+
Per cent
Age group (years)
NHS
NSMHWB

19
Table 4.1: Age-standardised prevalence of medium, high and very high psychological distress among people aged 18 years and over, by diabetes status and sex, 2007 and 2007–08
With diabetes Without diabetes
ASR(a) 95% CI ASR(a) 95% CI
Per cent
NHS(b)
Males 34.4 26.6–42.2 27.3 25.9–28.8
Females 50.4 43.7–57.2 36.8 35.3–38.2
Persons 43.4 37.2–49.6 32.2 31.1–33.2
NSMHWB(c)
Males 27.7 19.6–35.8 24.7 22.8–26.5
Females 38.0 29.6–46.4 32.6 30.5–34.7
Persons 33.9 27.2–40.7 28.7 27.2–30.2
(a) Age-standardised rate. Directly standardised to the June 2001 Australian ERP. (b) 2007–08, people aged 18 years and over (c) 2007, people aged 18–85 years
Note: Excludes people with a missing Kessler 10 score. Sources: AIHW analysis of ABS 2007–08 NHS, reissue 1 and 2007 NSMHWB, version 2, expanded CURFs.
Findings from the 2007 NSMHWB are less conclusive, with no significant difference found in the prevalence of medium, high and very high levels of psychological distress among people with diabetes compared with those without (Table A4.2). After adjusting for age, the prevalence rate for people with diabetes was 33.9% compared with 28.7% for those without diabetes (Table 4.1 and Figure 4.2). This survey did find that men with diabetes aged 60–85 years had a significantly higher prevalence of medium, high or very high psychological distress than those without diabetes (26.0% compared with 15.3%). Similar patterns were found for men aged 40–59 years and women in all age groups but these were not statistically significant (Table A4.2). As with data from the NHS, results from the NSMHWB indicate that women have a higher prevalence of medium, high or very high levels of psychological distress than men, regardless of diabetes status (Table 4.1 and Table A4.2).

20
Source: AIHW analysis of ABS 2007–08 NHS, expanded CURF, reissue 1.
Figure 4.2: Age-standardised prevalence of medium, high and very high psychological distress among people aged 18 years and over, by diabetes status and sex, 2007–08
4.2 Mental disorders
Prevalence in the diabetes population Based on the 2007 NSMHWB, an estimated 17.4% of people aged 16–85 years with diabetes also have a mental disorder (anxiety disorder, affective disorder or substance use disorder). Mental disorders were more prevalent in women with diabetes than men (22.2% and 12.3% respectively), and in the younger age groups compared with older people (Table A4.3 and Figure 4.3). Almost 33% of people with diabetes aged 16–39 years also had a mental disorder, compared with 10.5% of people with diabetes aged 60–85 years.
0
10
20
30
40
50
60
70
Males Females Persons
Per cent
With diabetesWithout diabetes

21
Source: AIHW analysis of ABS 2007 NSMHWB, expanded CURF, version 2.
Figure 4.3: Prevalence of a mental disorder among people with diabetes aged 16–85 years, by sex, 2007
Of the specific mental disorders screened for in the 2007 NSMHWB, anxiety disorders were the most prevalent among people with diabetes (14.2%). An estimated 19.0% of women with diabetes also had anxiety disorders, a significantly higher proportion than for men (8.8%) (Table 4.2).`
Table 4.2: Prevalence of a mental disorder among people with diabetes aged 16–85 years, by type of disorder, 2007
Males Females Persons
Types of disorder Number % 95% CI Number % 95% CI Number % 95% CI
Affective disorder(a) *19,730 *3.4 1.0–5.8 *40,050 *6.5 3.3–9.6 59,780 5.0 2.9–7.1
Anxiety disorder(b) 51,040 8.8 5.9–11.7 117,070 19.0 12.9–25.1 168,120 14.2 10.4–17.6
Substance use disorder(c) *12,550 *2.2 0.4–3.9
*7,460 *1.2 0.3–2.1
*20,010 *1.7 0.8–2.6
* The RSE for this estimate is between 25% and 50% and should be treated with caution. (a) Affective disorders include mood disorders such as depression, mania, dysthymia and bipolar affective disorder. (b) Anxiety disorders include panic disorder, social phobia, agoraphobia, generalized anxiety disorders (GAD), post-traumatic stress disorder
(PTSD) and obsessive compulsive disorder (OCD). (c) Substance use disorders include any harmful use and/or dependence on illicit or licit drugs, including alcohol, tobacco and prescription
drugs.
Source: AIHW analysis of ABS 2007 NSMHWB, expanded CURF, version 2.
0
5
10
15
20
25
30
35
Males Females Persons
Per cent

22
Comparison with people without diabetes Comparison of the population aged 16–85 years with diabetes and those without diabetes showed no significant differences in the prevalence of a mental disorder, based on data from the 2007 NSMHWB (Table A4.3). Before adjusting for different age structures in the two populations, the prevalence estimates for people without diabetes were higher than for those with diabetes (20.2% compared with 17.4%) but this difference was not statistically significant. After adjusting for differences in the age distribution between the two populations, this was reversed, with people with diabetes having a higher prevalence of a mental disorder than those without diabetes (23.4% compared with 20.1%) (Table 4.3). Once again, this difference was not found to be statistically significant.
Table 4.3: Age-standardised prevalence of a mental disorder(a) among people aged 16–85 years, by diabetes status and sex, 2007
With diabetes Without diabetes
ASR(b) 95% CI ASR(b) 95% CI
Per cent
Males 14.3 9.2–19.3 17.8 15.9–19.7
Females 28.9 21.2–36.6 22.5 20.7–24.3
Persons 23.4 18.4–28.3 20.1 18.9–21.3
(a) Symptoms of mental disorder in the past 12 months and meeting lifetime diagnosis criteria. Mental disorders included are anxiety disorders, affective (mood) disorders and substance use disorders.
(b) Age-standardised rate. Directly standardised to the June 2001 Australian ERP.
Source: AIHW analysis of ABS 2007 NSMHWB, expanded CURF, version 2.
As with medium, high or very high levels of psychological distress, the estimated prevalence of a mental disorder among women was significantly higher than that for men, regardless of diabetes status. In 2007, the age-adjusted prevalence of a mental disorder for women with diabetes was 28.9% compared with 14.3% for men. The higher prevalence of a mental disorder in women appears to be due to higher rates of anxiety among women than men (Table A4.4 and Figure 4.4). This difference was greater for those with diabetes than those without diabetes, with 25.5% of women with diabetes reported to also have an anxiety disorder compared with 16.3% of men with diabetes. The respective rates for women and men without diabetes were 17.9% and 10.9%. Data from respondents to the ALSWH provide further support to the association between poor mental health and wellbeing and diabetes for women. The prevalence of poor mental health was found to be significantly higher among women with diabetes compared with those without diabetes for those aged 56–61 years (Table 4.4). While the same appears to be the case for the other age groups, the differences found were not statistically significant.

23
Source: AIHW analysis of ABS 2007 NSMHWB, expanded CURF, version 2.
Figure 4.4: Age-standardised prevalence of affective and anxiety disorders in people aged 16–85 years, by diabetes status and sex, 2007
Table 4.4: Crude prevalence of a mental health problem(a) among women, by diabetes status and age
With diabetes Without diabetes
Age group (year of survey) Per cent 95% CI
Per cent 95% CI
28–34 years (2006) 19.4 14.5–24.4 14.7 14.0–15.5
56–61 years (2007) 22.0 19.0–25.0 12.0 11.0–13.0
81–87 years (2008) 14.3 11.7–17.0 11.7 10.8–12.6
(a) Based on the SF36, MHI-5 component. A mental health problem is defined as those women with a MHI-5 score<53.
Note: This table refers to unweighted respondents to the ALSWH. Source: AIHW analysis of ALSWH; survey 4 of young women in 2006, survey 5 of mid-aged women in 2007 and survey 5 of older women in 2008.
0
5
10
15
20
25
30
35
40
Males Females Males Females
Per cent
Affective disorders Anxiety disorders
With diabetes
Without diabetes

24
4.3 Hospitalisations with a mental health condition
Diabetes hospitalisations As outlined in Chapter 2 of this report, diabetes hospitalisations are defined as those hospitalisations in the 2007–08 NHMD with a principal or additional diagnosis of diabetes. Mental health conditions are defined as those hospitalisations with a principal or additional diagnosis of a mental or behavioural disorder, or with an external cause code for intentional self-harm, or with any psychiatric care day. Counts are of individual hospital separations, not people. In 2007–08, 8.5% of diabetes hospitalisations also had a mental health condition recorded (Table A4.5). The proportions were similar for hospitalisations of both males and females (8.4% and 8.7% respectively).
Source: AIHW NHMD, 2007–08.
Figure 4.5: Proportion of diabetes hospitalisations with a mental health condition recorded, by sex and age, 2007–08
Among diabetes hospitalisations, those for men aged 20–39 years had the highest rate of a mental health condition (around 17%)—more than double that for females in the same age group (6–7%) (Figure 4.5). Diabetes hospitalisations for people aged 80 years and over were also associated with relatively high rates of a mental health condition (14.7% for women and 12.2% for men). This is mainly due to the prevalence of dementia/Alzheimer disease in this age group. In
0
2
4
6
8
10
12
14
16
18
0–9 10–19 20–29 30–39 40–49 50–59 60–69 70–79 80+
Per cent
Age group (years)
Males
Females

25
2007–08, 8.1% of diabetes hospitalisations for people aged 80 years and over also had a principal or additional diagnosis of dementia/Alzheimer disease (Table A4.6). Neurotic disorders, depression and substance use disorders were most common in diabetes hospitalisations for people aged 40–49 years. Almost 6% of diabetes hospitalisations of people aged 40–49 years also had a substance use disorder recorded (Table A4.6). Mental health conditions were more common in hospitalisations with Type 2 diabetes than Type 1 diabetes (8.8% compared with 7.7%) (Table A4.7). This was the case for both males and females and across all age groups except those aged 0–9 years (Figure 4.6).
Source: AIHW NHMD, 2007–08.
Figure 4.6: Proportion of diabetes hospitalisations with a mental health condition, by type of diabetes and age, 2007–08
For Type 1 diabetes hospitalisations the most common mental health conditions recorded were substance use (2.6%), followed by depression (2.0%). For Type 2 diabetes hospitalisations the most common mental health conditions recorded were dementia/Alzheimer disease (2.6%), followed by substance use (2.1%) (Table 4.5).
0
2
4
6
8
10
12
14
16
18
20
0–9 10–19 20–29 30–39 40–49 50–59 60–69 70–79 80+
Per cent
Age group (years)
Type 1 diabetes
Type 2 diabetes

26
Table 4.5: Diabetes hospitalisations with specific mental and behavioural disorders(a), by type of diabetes and type of disorder, 2007–08
Dementia/Alzheimer Depression Other affective mood disorders
Neurotic disorders Substance use
Number % Number % Number % Number % Number %
Type 1 diabetes 360 0.7 1,050 2.0 237 0.5 694 1.3 1,318 2.6
Type 2 diabetes 15,209 2.6 8,207 1.4 2,460 0.4 6,572 1.1 12,585 2.1
(a) The number/proportion of hospitalisations with any diagnosis of diabetes that also have any diagnosis of the mental and behavioural disorder recorded.
Source: AIHW NHMD.
In hospitalisations with Type 1 diabetes, mental health conditions were more common in males than females (8.2% and 7.1% respectively). For Type 2 hospitalisations, the opposite was found (8.4% for males compared with 9.4% for females). However, for both Type 1 and Type 2 diabetes, hospitalisations for males aged less than 60 years were associated with a higher proportion of mental health conditions compared with females in the same age group (Table A4.7). After adjusting for age differences in the two populations, the prevalence of a mental health condition was still found to be higher in hospitalisations with Type 2 diabetes than Type 1 diabetes, with ASRs of 10.3% and 7.5% respectively. This was found for hospitalisations of both males and females (Table 4.6). For both Type 1 and Type 2 diabetes, after adjusting for age, male hospitalisations had a higher rate of mental health conditions than female hospitalisations.
Table 4.6: Age-standardised proportion of hospitalisations with a mental health condition(a), by type of diabetes and sex, 2007–08
Type 1 diabetes hospitalisations(b) Type 2 diabetes hospitalisations(c)
ASR(d) 95% CI ASR(d) 95% CI
Per cent
Males 8.2 7.8–8.6 11.1 10.7–11.6
Females 7.0 6.6–7.3 9.9 9.7–10.2
Persons 7.5 7.3–7.8 10.3 10.1–10.5
(a) The proportion of hospitalisations with any diagnosis of a mental and behavioural disorder or an external cause of intentional self-harm or with any psychiatric care day.
(b) Hospitalisations with any diagnosis of Type 1 diabetes. (c) Hospitalisations with any diagnosis of Type 2 diabetes. (d) Age-standardised rate. Directly standardised to 2007–08 hospitalisations.
Source: AIHW NHMD.
After adjusting for age, depression was the only mental health condition more common in Type 1 diabetes hospitalisations than in Type 2 diabetes hospitalisations (1.9% compared with 1.6%) (Table A4.8). All other types of mental health conditions were more common in Type 2 diabetes hospitalisations.
27
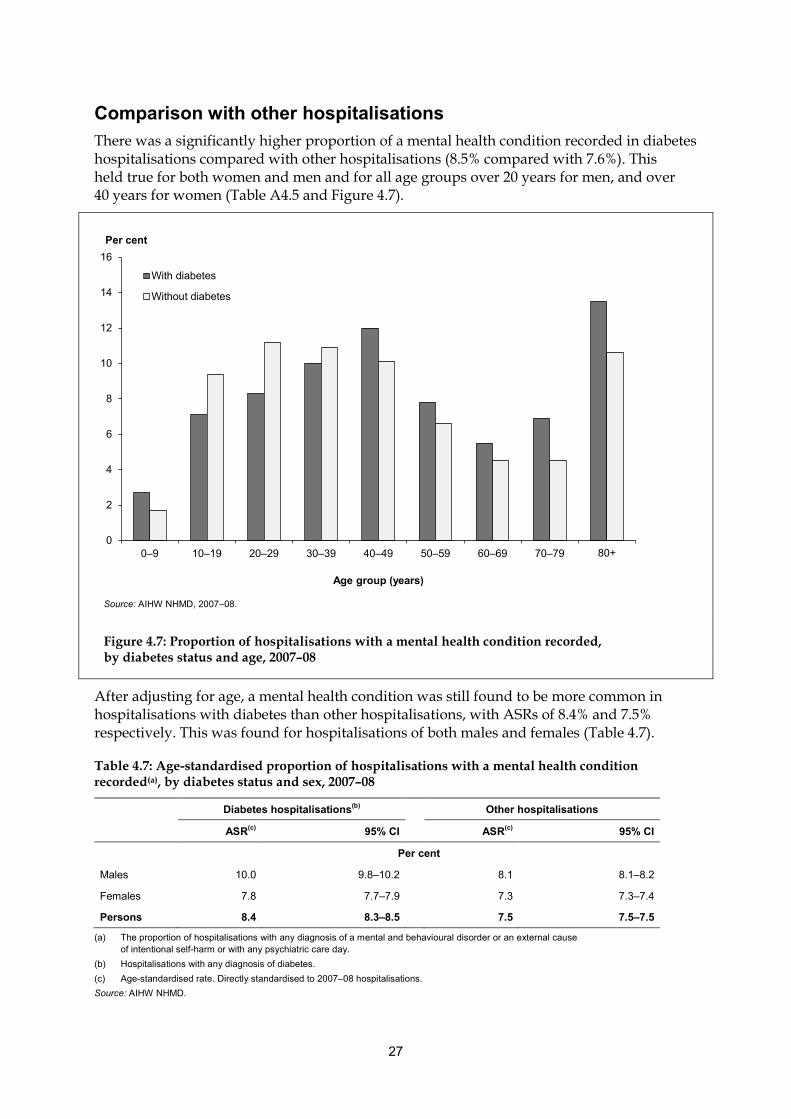
Comparison with other hospitalisations There was a significantly higher proportion of a mental health condition recorded in diabetes hospitalisations compared with other hospitalisations (8.5% compared with 7.6%). This held true for both women and men and for all age groups over 20 years for men, and over 40 years for women (Table A4.5 and Figure 4.7).
Source: AIHW NHMD, 2007–08.
Figure 4.7: Proportion of hospitalisations with a mental health condition recorded, by diabetes status and age, 2007–08
After adjusting for age, a mental health condition was still found to be more common in hospitalisations with diabetes than other hospitalisations, with ASRs of 8.4% and 7.5% respectively. This was found for hospitalisations of both males and females (Table 4.7).
Table 4.7: Age-standardised proportion of hospitalisations with a mental health condition recorded(a), by diabetes status and sex, 2007–08
Diabetes hospitalisations(b) Other hospitalisations
ASR(c) 95% CI ASR(c) 95% CI
Per cent
Males 10.0 9.8–10.2 8.1 8.1–8.2
Females 7.8 7.7–7.9 7.3 7.3–7.4
Persons 8.4 8.3–8.5 7.5 7.5–7.5
(a) The proportion of hospitalisations with any diagnosis of a mental and behavioural disorder or an external cause of intentional self-harm or with any psychiatric care day.
(b) Hospitalisations with any diagnosis of diabetes. (c) Age-standardised rate. Directly standardised to 2007–08 hospitalisations. Source: AIHW NHMD.
0
2
4
6
8
10
12
14
16
0–9 10–19 20–29 30–39 40–49 50–59 60–69 70–79 80+
Per cent
Age group (years)
With diabetes
Without diabetes

28
Regardless of diabetes status, a mental health condition was more common in male hospitalisations than female hospitalisations. This difference was, however, larger among hospitalisations with diabetes recorded than others. In 2007–08, 10% of male hospitalisations with diabetes recorded also had a mental health condition compared with 7.8% of female diabetes hospitalisations. Taking age into account, dementia/Alzheimer disease and substance use were more prevalent in diabetes hospitalisations compared with other hospitalisations. Affective mood disorders and neurotic disorders were less common in hospitalisations with diabetes recorded than in other hospitalisations (Table A4.9).
4.4 Mental health-related MBS services for people with diabetes In 2008, 6.3% of people who had a claim for at least one diabetes-related MBS service also claimed at least one mental health-related MBS service (Table A4.10). This proportion was higher among females than males (7.5% compared with 5.2%).
Source: AIHW analysis of 2008 Medicare data.
Figure 4.8: People with at least one mental health-related MBS service as a proportion of people who had at least one diabetes-related MBS service in 2008, by sex and age
0
5
10
15
20
25
0–29 30–34 35–39 40–44 45–49 50–54 55–59 60–64 65–69 70–74 75–79 80+
Per cent
Age group (years)
MaleFemale

29
The proportion of people with a diabetes-related MBS claim who claimed a mental health-related MBS service declined with age, from around 16% for those under 40 years of age to 2.6% for those aged 80 years and over. This pattern was similar for both men and women (Figure 4.8).
Comparison with the MBS population without diabetes Of people who had an MBS claim in 2008, those with a diabetes-related service were more likely to also claim a mental health-related service than others (6.3% compared with 5.9%) (Table A4.10). This was the case for both males and females and across all age groups (Figure 4.9). Younger people with diabetes-related claims in particular had much higher rates of claims for mental-health related services than those without diabetes. In 2008, 16.0% of people aged 0–29 years with a diabetes-related MBS claim also made a claim for a mental health related service. This was more than three times the rate for people in the same age group without a diabetes-related claim. Among those aged in their 30s, the rate was almost twice as high as for people without a diabetes-related claim.
Source: AIHW analysis of 2008 Medicare data.
Figure 4.9: People with at least one mental health-related MBS service as a proportion of people who had at least one diabetes-related MBS service in 2008, by diabetes status and age
After adjusting for age, 13.0% of people with an MBS diabetes-related claim also had a mental health-related claim. This was significantly larger than for those without a diabetes-related claim (6.0%) (Table 4.8). Both males and females with a diabetes-related MBS claim were more likely to have a mental health-related claim.
0
2
4
6
8
10
12
14
16
18
0–29 30–34 35–39 40–44 45–49 50–54 55–59 60–64 65–69 70–74 75–79 80+
Per cent
Age group (years)
With diabetes
Without diabetes

30
Regardless of diabetes status, females were more likely than males to have a mental-health related claim. For those with at least one diabetes claim the respective age-standardised rates were 15.3% and 10.6%.
Table 4.8: People with at least one mental health-related MBS service as a proportion of all people who had at least one MBS service in 2008, by diabetes status and sex (age-standardised)
With diabetes Without diabetes
ASR(a) 95% CI ASR(a) 95% CI
Per cent
Males 10.6 9.6–11.6 4.8 4.8–4.8
Females 15.3 14.1–16.4 7.0 7.0–7.0
Persons 13.0 12.2–13.8 6.0 5.9–6.0
(a) Age-standardised rate. Directly standardised to the June 2001 Australian ERP.
Source: AIHW analysis of 2008 Medicare data.
4.5 Prevalence of poor mental health and wellbeing among subgroups of the population with diabetes The four main data sources (2007–08 NHS, 2007 NSMHWB, 2007–08 NHMD and 2008 Medicare data) were analysed to determine if the prevalence of poor mental health and wellbeing among people with diabetes was associated with other characteristics. The characteristics examined included socioeconomic status, remoteness, level of education, country of birth, disability status and health risk factors. The analysis was limited by the variables available in each data source and by the scope, coverage and sample size of the two surveys. In both the NHS and NSMHWB, mental health and emotional problems were part of the screening question to derive disability status, with one of the conditions for a disability being ‘Any mental illness for which help or supervision is required’. This will give a bias in the estimates of prevalence of a mental health condition by disability status. Results for disability status have not been included for this reason. As both the NHS and NSMHWB excluded people living in non-private dwellings and very remote areas (with implications for both socioeconomic status and remoteness), no discussion of results from these two surveys by socioeconomic status or geographic region is presented. Tables A4.11 and A4.12 do, however, provide a summary of the analysis results. Small sample sizes in the two surveys also resulted in very large confidence intervals around the estimates for education levels, country of birth and some of the health risk factors. Results from these analyses were not included in this report for this reason. The following section presents results on socioeconomic status and region using data from the NMHD and the MBS. When interpreting these results it should be noted that these are not estimates of prevalence. These administrative data only include people who have accessed a hospital or MBS service in the specified year (as defined in Appendix 5). Those people who had diabetes or poor mental health, but who did not access a diabetes or mental health-related MBS service in 2008 or who were not hospitalised with diabetes or poor mental health in 2007–08, are not included in these data.

31
The following section also presents estimates for the prevalence of poor mental health and wellbeing among people with diabetes by the health risk factors of smoking, physical activity and overweight and obesity, from the NHS and NSMHWB.
Socioeconomic status Both the NHMD and MBS include information on the socioeconomic status of the population with diabetes, based on the ABS’s 2006 Socio-Economic Indexes for Areas (SEIFA). This measure therefore reflects the status of the region in which the person usually resides, which is used as a proxy for the individual’s socioeconomic status. In this section, age-standardised rates are presented for hospitalisations, to take account of differences in age structure of the populations across socioeconomic groups. Insufficient data were available to age-standardise the Medicare data and so crude prevalence rates are presented.
Source: AIHW NHMD, 2007–08.
Figure 4.10: Age-standardised proportion of diabetes hospitalisations with a mental health condition recorded, by socioeconomic status, 2007–08
The proportion of diabetes hospitalisations with a mental health condition recorded varied across socioeconomic quintiles, with the highest rate among hospitalisations of people from the highest and the lowest socioeconomic status groups. After adjusting for age, the rates were 8.8% and 8.6% respectively. The middle group had the lowest rate of diabetes hospitalisations with a mental health condition recorded (7.7%) (Figure 4.10 and Table A4.13). This suggests that, of people who are hospitalised with diabetes, those who are the most advantaged and the least advantaged are most likely to have a mental health condition recorded.
0
1
2
3
4
5
6
7
8
9
10
1 (lowest SES) 2 3 4 5 (highest SES)
Per cent
Socioeconomic status (SEIFA quintiles)

32
The crude rates from Medicare data show a different picture. In 2008, 7.0% of people with at least one diabetes-related MBS claim from the highest socioeconomic quintile also had a mental-health related claim (Table A4.14 and Figure 4.11). For people from the lowest socioeconomic status group the rate was 6.0%. This difference should be interpreted carefully as it could be reflecting to some extent variations in access to, or take-up of, MBS mental health services.
Source: AIHW analysis of 2008 Medicare data.
Figure 4.11: People with at least one mental health-related MBS service as a proportion of people with at least one diabetes-related MBS service in 2008, by socioeconomic status
Remoteness After taking differences in age structure of the populations into account, diabetes hospitalisations for people from Very remote areas and from Major cities had the highest proportion of diagnosed mental health conditions recorded (9.2% and 8.8% respectively), while those for people from inner regional areas had the lowest (7.2%) (Figure 4.12 and Table A4.13). Remoteness categories are explained and illustrated in the Glossary (see ASGC RA and Figure G.1).
0
1
2
3
4
5
6
7
8
1 (lowest SES) 2 3 4 5 (highest SES)
Per cent
Socioeconomic status (SEIFA quintiles)

33
Source: AIHW NHMD, 2007–08.
Figure 4.12: Age-standardised proportion of diabetes hospitalisations with a mental health condition recorded, by region of usual residence, 2007–08
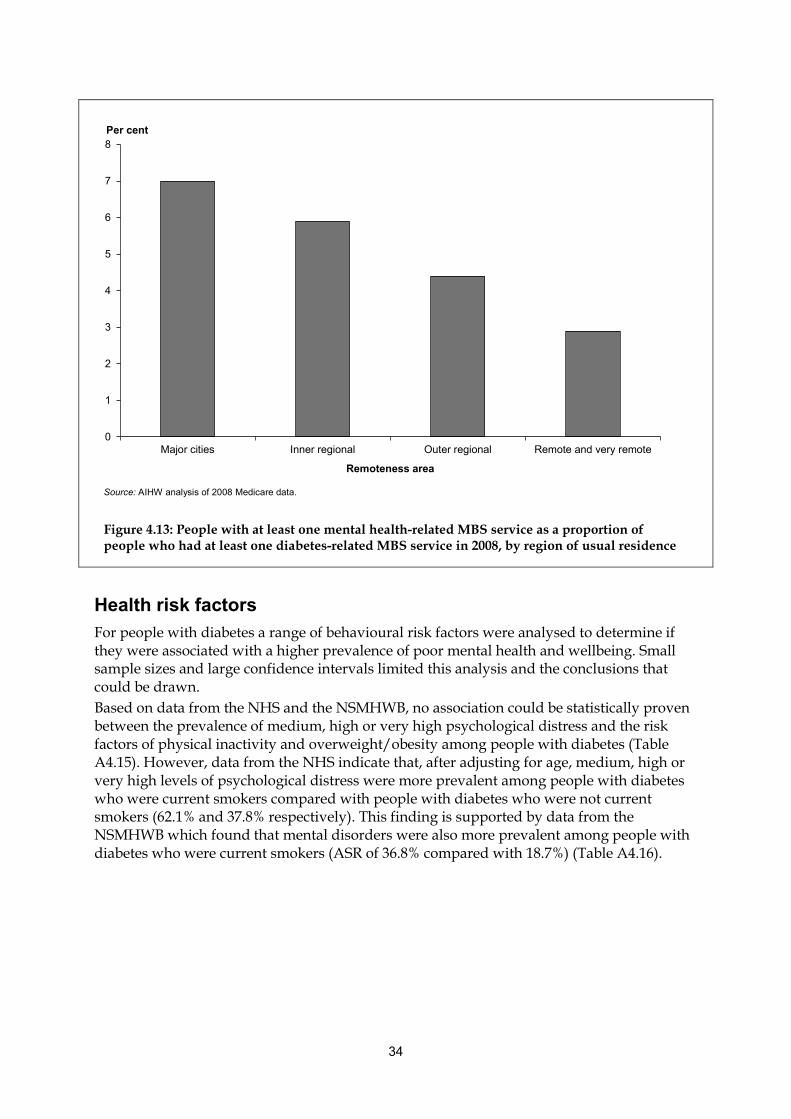
However, the results based on crude rates derived from Medicare data were very different (Table A4.14 and Figure 4.13). The proportion of the MBS population with diabetes who made at least one mental health-related MBS claim in 2008 was highest in Major cities (7.0%), declining with remoteness to 3.1% in Remote/Very remote areas. This could be a reflection of poorer access to MBS mental health-related services outside Major cities.
0
1
2
3
4
5
6
7
8
9
10
Major cities Inner regional Outer regional Remote Very remote
Per cent
Remoteness area
34
Source: AIHW analysis of 2008 Medicare data.
Figure 4.13: People with at least one mental health-related MBS service as a proportion of people who had at least one diabetes-related MBS service in 2008, by region of usual residence
Health risk factors For people with diabetes a range of behavioural risk factors were analysed to determine if they were associated with a higher prevalence of poor mental health and wellbeing. Small sample sizes and large confidence intervals limited this analysis and the conclusions that could be drawn. Based on data from the NHS and the NSMHWB, no association could be statistically proven between the prevalence of medium, high or very high psychological distress and the risk factors of physical inactivity and overweight/obesity among people with diabetes (Table A4.15). However, data from the NHS indicate that, after adjusting for age, medium, high or very high levels of psychological distress were more prevalent among people with diabetes who were current smokers compared with people with diabetes who were not current smokers (62.1% and 37.8% respectively). This finding is supported by data from the NSMHWB which found that mental disorders were also more prevalent among people with diabetes who were current smokers (ASR of 36.8% compared with 18.7%) (Table A4.16).
0
1
2
3
4
5
6
7
8
Major cities Inner regional Outer regional Remote and very remote
Per cent
Remoteness area

35
5 Summary and discussion
The association between diabetes and poor mental health has increasingly been recognised by clinicians and researchers over the past 10 years, based mainly on results from clinical studies. Despite this, no broad level population-based studies of this association have previously been reported in Australia, due mainly to a paucity of data. This report presents the most up-to-date estimates of the number of people with diabetes and poor mental health and wellbeing in Australia, and examines whether people with diabetes are more likely to have poor mental health and wellbeing than other Australians. The findings presented in the report are the result of an in-depth analysis of the two main sources of population level information on the prevalence of diabetes and poor mental health and wellbeing in Australia—the 2007–08 National Health Survey (NHS) and the 2007 National Survey of Mental Health and Wellbeing (NSMHWB). The analysis was hampered by small sample sizes for the population with diabetes, and even smaller sample sizes for the population with both diabetes and poor mental health and wellbeing. Despite this, some interesting results were found that provide an insight into the prevalence of diabetes and poor mental health and wellbeing in the Australian population, and the likely association between the two conditions. Due to the limitations of the survey data for this purpose the results are supplemented with those from a detailed analysis of hospitalisation data from the 2007–08 National Hospital Morbidity Database (NHMD), and the 2008 Medicare Benefits Schedule (MBS) data. While these data capture only a subset of the population with diabetes and poor mental health and wellbeing, they have large numbers of records and provide more robust information on how diabetes and poor mental health and wellbeing are associated. The main findings from the analysis are summarised below. • Diabetes and poor mental health and wellbeing are relatively common health conditions
in Australia. – Over 800,000 adults are estimated to be living with diabetes. This is a conservative
estimate. – Around 4–5 million adult Australians have medium, high or very high levels of
psychological distress, and over 3 million are estimated to have anxiety, affective or substance use disorders.
– In 2007–08, almost 700,000 hospitalisations had a principal or additional diagnosis of diabetes. About 600,000 had recorded either a principal or additional diagnosis of a mental and behavioural disorder, an external cause of intentional self-harm or at least one day in psychiatric care.
– Around 180,000 people had at least one diabetes-related MBS claim in 2008, and 1.1 million made at least one mental-health related claim.
• A large proportion of people with diabetes are living with poor mental health and wellbeing in Australia. – From the 2007–08 NHS an estimated 41.6% adults with diabetes also reported having
medium, high or very high levels of psychological distress. – 17.4% of adults with diabetes also had a lifetime mental disorder with symptoms in
the past 12 months. Most of these (14.2%) had an anxiety disorder.

36
– 8.5% of diabetes hospitalisations in 2007–08 also had a mental health condition recorded. The most common conditions were dementia/Alzheimer disease and substance use disorders.
– 6.3% of people who had at least one MBS diabetes-related service in 2008 also claimed at least one mental health-related service.
• People with diabetes have a higher prevalence of poor mental health and wellbeing compared with other Australians. This was a consistent finding across the four main data sources after adjusting for age differences in the populations with and without diabetes. – The 2007–08 NHS found that adults with diabetes had a significantly higher
prevalence of medium, high or very high psychological distress than those without diabetes (43.4% compared with 32.2%). While estimates of the prevalence of psychological distress from the 2007 NSMHWB were lower and the difference not statistically significant, the pattern was similar (33.9% and 28.7% respectively).
– Based on data from the NSMHWB, an estimated 23.4% of people with diabetes had a mental disorder, compared with 20.1% of those without diabetes. This difference was not statistically significant.
– A higher proportion of hospitalisations with diabetes also had a mental health condition recorded compared with other hospitalisations (age-standardised rates of 8.4% and 7.5% respectively).
– For those with an MBS diabetes-related service, the proportion of people who claimed a mental health-related MBS service in 2008 was twice that of people who did not claim a diabetes-related service (age-standardised rates of 13% compared with 6%).
• The proportion of hospitalisations with a mental health condition recorded varied by type of diabetes. – The age-adjusted rate was higher in hospitalisations with Type 2 diabetes compared
with Type 1 diabetes (10.3% compared with 7.5%). – For both Type 1 and Type 2 diabetes, after adjusting for age, male hospitalisations
were found to have a higher prevalence of mental health conditions than female hospitalisations.
• After taking account of age, women generally had a higher prevalence of poor mental health and wellbeing than men, regardless of diabetes status. The exception to this was found in hospitalisations for Type 1 diabetes, where mental health conditions were more common for males than females.
• The prevalence of poor mental health and wellbeing in people with diabetes appears to be associated with age, with survey data and MBS service data indicating lower rates among older people. However, this result should be interpreted carefully as the surveys did not include aged-care facilities or institutions and the definition of a mental disorder in the surveys does not include dementia/Alzheimer disease. Similarly, MBS service data should be interpreted carefully as not all people access or use these services. For diabetes hospitalisations, a relatively high prevalence of a mental health condition was found for 30–49 year olds (related to a relatively high prevalence of substance use) and those aged 80 years and over (due mostly to high rates of dementia/Alzheimer disease).
• People with diabetes who were current smokers were more likely to have a mental disorder and more likely to have medium, high or very high levels of psychological distress than those with diabetes who were not current smokers.

37
• The effect of socioeconomic status and remoteness on the prevalence of poor mental health and wellbeing among people with diabetes is unclear, with no reliable population-based estimates able to be produced from the surveys and different patterns emerging from analysis of the hospitalisations and Medicare services data.
This analysis, at the Australian population level, supports the evidence from clinical studies of an association between diabetes and poor mental health. Unfortunately, the existing data sources are inadequate for providing accurate estimates of the prevalence of diabetes or poor mental health in the Australian population. Nor do they allow for the exploration of the nature of the association between diabetes and poor mental health and wellbeing. The relationship between the two diseases is most probably complex, yet the current data support only a limited and cursory view. The nature of the association, and the factors that are most likely to lead to a person having both conditions, could not be examined. How mental health impacts on the diagnosis and management of diabetes and the access to appropriate diabetes services is still unknown. To obtain accurate estimates of the prevalence of poor mental health among people with diabetes, and to answer these questions on the likely impact, will require a data collection focused on people with diabetes with sufficient sample numbers to compare those with and without poor mental health and wellbeing, and with appropriate questions on management of diabetes and access to services. Improvement of the capture of relevant items in the Medicare data (such as annual cycle of care), to better enable the identification of people with diabetes through that data source, would also be useful.

38
Appendix 1: Tables Table A3.1: Prevalence of diabetes among people aged 18–85 years, 2007
Males Females Persons
Age group Number % 95% CI
Number % 95% CI
Number % 95% CI
18–39 *60,160 *1.9 0.7–3.1 124,540 4.0 2.9–5.1 184,700 3.0 2.2–3.7
40–49 *108,130 *7.2 2.1–12.3 102,690 7.2 4.1–10.3 210,820 7.2 4.2–10.1
50–59 102,150 8.3 5.8–10.9 145,680 9.9 7.0–12.7 247,820 9.2 7.5–10.8
60–69 170,240 17.6 14.7–20.5 125,160 14.0 9.6–18.3 295,400 15.9 13.3–18.4
70–85 138,050 18.3 15.5–21.1 114,620 13.5 10.9–16.0 252,660 15.7 13.8–17.7
Total 578,720 7.6 6.2–9.0 612,690 7.9 6.9–8.9 1,191,400 7.8 7.0–8.6
* The RSE for this estimate is between 25% and 50% and should be treated with caution.
Source: AIHW analysis of ABS 2007 NSMHWB version 2, expanded CURF.
Table A3.2: Hospitalisations with a principal or additional diagnosis of diabetes, 2007–08
Males Females Persons
Age group Number Per cent
Number Per cent
Number Per cent
0–14 2,245 0.7 2,254 1.0 4,499 0.8
15–24 2,867 1.4 6,332 1.9 9,199 1.7
25–34 4,926 2.1 19,395 3.5 24,321 3.1
35–44 14,671 4.3 22,860 4.3 37,532 4.3
45–54 36,418 7.7 31,793 6.2 68,211 6.9
55–64 77,217 11.5 53,110 8.9 130,327 10.3
65–74 102,292 15.0 71,527 12.4 173,819 13.8
75–84 90,243 14.6 77,124 13.8 167,368 14.2
85+ 23,038 12.8 29,937 12.2 52,975 12.5
Total 353,917 9.5 314,332 7.6 668,251 8.5
Source: AIHW NHMD.

39
Table A3.3: Hospitalisations with a principal or additional diagnosis of diabetes, by type of diabetes, sex and age, 2007–08
Males Females Persons
Age group Number Per cent Number Per cent Number Per cent
Type 1 diabetes
0–14 2,188 0.7 2,146 0.9 4,334 0.8
15–24 2,379 1.2 3,284 1.0 5,663 1.1
25–34 2,265 1.0 3,543 0.6 5,808 0.7
35–44 3,789 1.1 3,087 0.6 6,876 0.8
45–54 4,144 0.9 3,177 0.6 7,321 0.7
55–64 5,224 0.8 2,916 0.5 8,140 0.6
65–74 4,324 0.6 3,204 0.6 7,528 0.6
75–84 2,299 0.4 2,294 0.4 4,593 0.4
85+ 554 0.3 661 0.3 1,215 0.3
Total 27,166 0.7 24,312 0.6 51,478 0.7
Type 2 diabetes
0–14 19 0.0 52 0.0 71 0.0
15–24 359 0.2 990 0.3 1,349 0.3
25–34 2,314 1.0 4,318 0.8 6,632 0.8
35–44 10,621 3.1 12,489 2.4 23,111 2.7
45–54 31,634 6.7 27,962 5.4 59,596 6.0
55–64 71,010 10.6 49,440 8.3 120,450 9.5
65–74 96,951 14.2 67,578 11.7 164,529 13.1
75–84 87,209 14.1 74,268 13.3 161,478 13.7
85+ 22,327 12.4 29,043 11.9 51,370 12.1
Total 322,444 8.7 266,140 6.4 588,586 7.5
Source: AIHW NHMD.

40
Table A3.4: People with at least one diabetes-related MBS service as a proportion of all people who had at least one MBS service in 2008, by sex and age
Males Females Persons
Age group Number Per cent Number Per cent Number Per cent
0–29 911 0.0 1,065 0.0 1,976 0.0
30–34 620 0.1 668 0.1 1,288 0.1
35–39 1,249 0.2 1,265 0.2 2,514 0.2
40–44 2,263 0.4 2,158 0.3 4,421 0.3
45–49 4,326 0.7 3,689 0.5 8,015 0.6
50–54 6,889 1.1 5,911 0.9 12,800 1.0
55–59 10,493 1.8 8,648 1.4 19,141 1.6
60–64 13,925 2.6 11,565 2.1 25,490 2.3
65–69 15,089 3.7 12,672 3.1 27,761 3.4
70–74 14,711 4.6 13,194 3.9 27,905 4.2
75–79 12,219 4.8 11,803 4.1 24,022 4.5
80+ 9,669 3.5 12,463 2.6 22,132 3.0
Total 92,364 1.0 85,101 0.9 177,465 0.9
Source: AIHW analysis of 2008 Medicare data.
Table A3.5: Prevalence of medium, high or very high levels of psychological distress in people aged 18 years and over, 2007–08
Males Females Persons
Age group Number % 95% CI
Number % 95% CI
Number % 95% CI
18–39 993,050 30.9 28.5–33.3 1,326,920 41.5 39.0–43.9 2,319,970 36.2 34.3–38.1
40–49 424,260 28.4 25.0–31.8 594,540 39.1 36.0–42.2 1,018,800 33.8 31.5–36.1
50–59 351,290 27.0 23.9–30.1 437,410 33.0 29.5–36.5 788,700 30.0 27.6–32.4
60–69 250,520 26.3 22.4–30.2 269,250 28.5 24.9–32.0 519,770 27.4 24.6–30.2
70+ 172,190 21.2 18.0–24.5 322,990 33.0 29.7–36.3 495,180 27.7 25.4–29.9
Total 2,191,310 28.2 26.7–29.7 2,951,110 37.0 35.6–38.4 5,142,420 32.7 31.6–33.7
Note: Excludes people with a missing Kessler 10 score. Source: AIHW analysis of ABS 2007–08 NHS reissue 1 expanded CURF.

41
Table A3.6: Prevalence of medium, high or very high levels of psychological distress among people aged 18–85 years, 2007
Males Females Persons
Age group Number % 95% CI
Number % 95% CI
Number % 95% CI
18–39 937,010 29.7 27.0–32.4 1,136,780 36.8 34.3–39.3 2,073,790 33.2 31.2–35.2
40–49 377,750 25.1 19.9–30.3 518,670 36.2 29.8–42.6 896,410 30.5 25.9–35.1
50–59 296,260 24.1 19.5–28.7 473,600 32.0 25.8–38.3 769,850 28.4 24.0–32.9
60–69 170,800 17.7 14.2–21.1 196,930 22.0 18.4–25.6 367,730 19.7 17.1–22.3
70–85 125,880 16.7 13.0–20.4 203,980 24.0 20.7–27.3 329,860 20.5 18.0–23.1
Total 1,907,690 25.1 23.1–27.1 2,529,950 32.6 30.7–34.6 4,437,650 28.9 27.5–30.3
Note: Excludes people with a missing Kessler 10 score.
Source: AIHW analysis of ABS 2007 NSMHWB version 2, expanded CURF.
Table A3.7: Prevalence of a mental disorder(a) among people aged 16–85 years, by age and sex, 2007
Males Females Persons
Age group Number % 95% CI
Number % 95% CI
Number % 95% CI
16–39 772,380 22.1 19.2–25 979,130 28.0 25.6–30.5 1,751,510 25.4 23.6–27.2
40–49 322,440 21.4 15.8–27.1 367,860 24.4 18.9–30.0 690,300 23.5 19.8–27.2
50–59 168,500 13.7 9.4–18.1 255,910 20.8 16.5–25.1 424,410 15.7 12.8–18.5
60–69 96,990 10.0 7.1–12.9 131,630 13.6 10.9–16.3 228,620 12.3 10.0–14.5
70–85 41,740 5.5 3.1–8.0 61,250 8.1 5.3–10.9 103,000 6.4 4.7–8.1
Total 1,402,060 17.6 15.7–19.5 1,795,780 22.3 21.0–23.6 3,197,840 20.0 18.9–21.0
(a) Symptoms of mental disorder in the past 12 months and meeting lifetime diagnosis criteria. Mental disorders included are anxiety disorders, affective (mood) disorders and substance use disorders.
Source: AIHW analysis of ABS 2007 NSMHWB version 2, expanded CURF.

42
Table A3.8: Prevalence of a mental disorder among people aged 16–85 years by type of disorder, sex and age, 2007
Males Females Persons
Age group Number % 95% CI
Number % 95% CI
Number % 95% CI
Affective disorders(a)
16–39 212,140 6.1 4.4–7.8 289,780 8.3 7.2–9.4 501,930 7.3 6.2–8.3
40–49 124,430 8.3 5.2–11.3 135,620 9.0 5.2–12.8 260,050 8.9 6.5–11.2
50–59 54,540 4.4 2.4–6.5 80,590 6.6 4.6–8.5 135,140 5.0 3.6–6.4
60–85 *31,610 *1.8 0.8–2.8 70,115 4.0 2.6–5.4 101,723 2.9 2.1–3.8
Total 422,720 5.3 4.3–6.3 576,110 7.1 6.2–8.1 998,840 6.2 5.6–6.9
Anxiety disorders(b)
16–39 383,950 11.0 9.3–12.6 761,810 21.8 19.4–24.2 1,145,750 16.6 15.1–18.1
40–49 242,790 16.1 11.0–21.2 306,900 20.4 15.4–25.3 549,690 18.7 15.4–22.1
50–59 133,910 10.9 7.1–14.7 218,620 17.8 13.8–21.8 352,530 13.0 10.5–15.6
60–85 101,040 5.9 4.2–7.5 154,020 8.8 6.9–10.7 255,060 7.4 6.0–8.7
Total 861,680 10.8 9.4–12.3 1,441,350 17.9 16.5– 19.2 2,303,030 14.4 13.4–15.3
Substance use disorders(c)
16–39 412,990 11.8 9.5–14.1 189,050 5.5 4.4–6.7 602,040 8.7 7.5–10
40–49 *90,050 *6.0 3–8.9 *46,510 *3.2 1.3–5.2 136,560 4.6 2.9–6.4
50–85 55,300 1.9 1.1–2.6 *25,950 *0.8 0–1.6 81,260 1.3 0.7–1.9
Total(e) 558,340 7.0 5.8–8.2 261,510 3.2 2.6–3.9 819,850 5.1 4.5–5.8
* The RSE for this estimate is between 25% and 50% and should be treated with caution. (a) Affective disorders include mood disorders such as depression, mania, dysthymia and bipolar affective disorder. (b) Anxiety disorders include panic disorder, social phobia, agoraphobia, generalized anxiety disorders (GAD), post-traumatic stress disorder
(PTSD) and obsessive compulsive disorder (OCD). (c) Substance use disorders include any harmful use and/or dependence on illicit or licit drugs, including alcohol, tobacco and prescription
drugs.
Note: People can have more than one disorder and may be included in both anxiety and affective disorder counts. Source: AIHW analysis of ABS 2007 NSMHWB, expanded CURF, version 2.

43
Table A3.9: Hospitalisations with a mental health condition recorded(a), by age and sex, 2007–08
Males Females Persons
Age group Number Per cent Number Per cent Number Per cent
0–14 8,825 2.7 5,367 2.3 14,192 2.5
15–24 25,680 12.6 35,299 10.6 60,979 11.3
25–34 38,635 16.8 44,873 8.0 83,512 10.6
35–44 43,968 12.9 51,132 9.7 95,103 10.9
45–54 39,916 8.4 44,409 8.6 84,325 8.5
55–64 38,608 5.8 32,198 5.4 70,806 5.6
65–74 27,360 4.0 25,311 4.4 52,671 4.2
75–84 37,367 6.1 42,940 7.7 80,307 6.8
85+ 21,678 12.1 38,338 15.7 60,016 14.1
Total(b) 282,037 7.6 319,867 7.7 601,911 7.6
(a) Hospitalisations with any diagnosis of a mental and behavioural disorder or an external cause of intentional self-harm or with any psychiatric care day.
Source: AIHW NHMD.
Table A3.10: Hospitalisations with specific mental and behavioural disorders recorded(a), by type of disorder and sex, 2007–08
Males Females Persons
Mental and behavioural disorder Number Per cent Number Per cent Number Per cent
Substance use 119,578 3.2 69,384 1.7 188,966 2.4
Depression 49,266 1.3 87,179 2.1 136,446 1.7
Other affective mood disorders 15,213 0.4 28,670 0.7 43,883 0.6
Neurotic disorders 50,987 1.4 75,726 1.8 126,714 1.6
Dementia/Alzheimer 33,686 0.9 49,454 1.2 83,140 1.1
Total 282,037 7.6 319,867 7.7 601,911 7.6
(a) Hospitalisations with any diagnosis of the mental and behavioural disorder.
Source: AIHW NHMD.
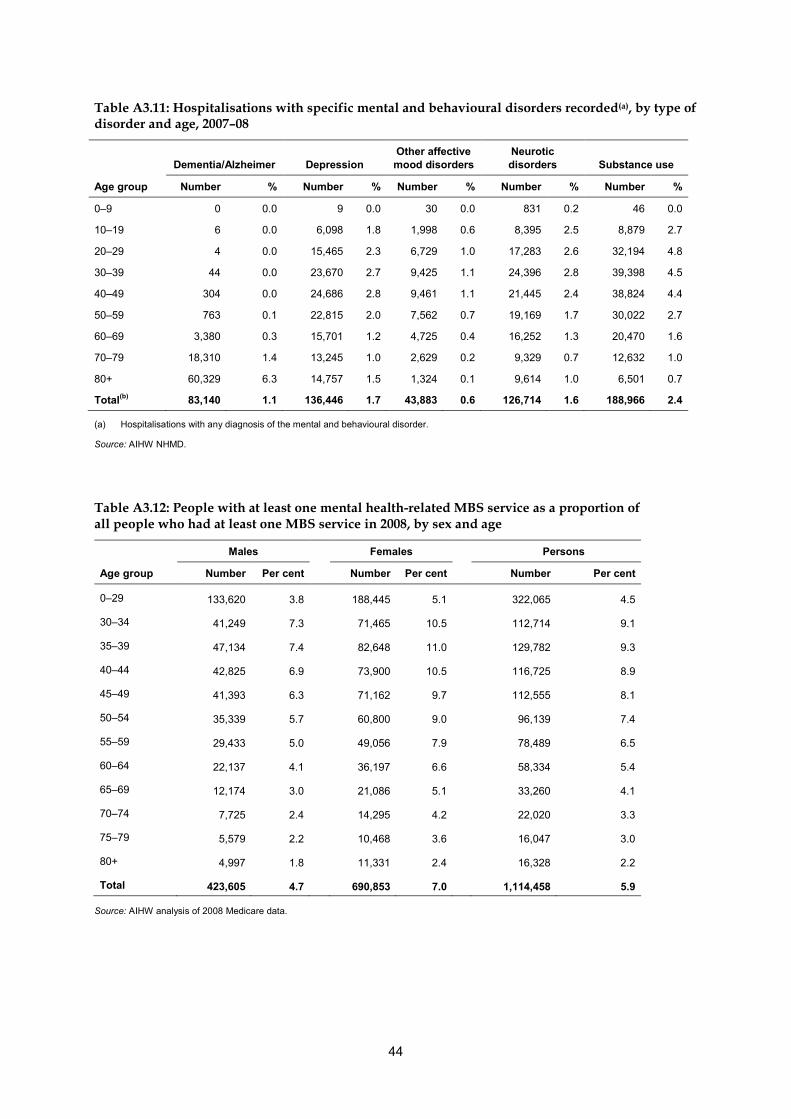
44
Table A3.11: Hospitalisations with specific mental and behavioural disorders recorded(a), by type of disorder and age, 2007–08
Dementia/Alzheimer Depression Other affective mood disorders
Neurotic disorders Substance use
Age group Number % Number % Number % Number % Number %
0–9 0 0.0 9 0.0 30 0.0 831 0.2 46 0.0
10–19 6 0.0 6,098 1.8 1,998 0.6 8,395 2.5 8,879 2.7
20–29 4 0.0 15,465 2.3 6,729 1.0 17,283 2.6 32,194 4.8
30–39 44 0.0 23,670 2.7 9,425 1.1 24,396 2.8 39,398 4.5
40–49 304 0.0 24,686 2.8 9,461 1.1 21,445 2.4 38,824 4.4
50–59 763 0.1 22,815 2.0 7,562 0.7 19,169 1.7 30,022 2.7
60–69 3,380 0.3 15,701 1.2 4,725 0.4 16,252 1.3 20,470 1.6
70–79 18,310 1.4 13,245 1.0 2,629 0.2 9,329 0.7 12,632 1.0
80+ 60,329 6.3 14,757 1.5 1,324 0.1 9,614 1.0 6,501 0.7
Total(b) 83,140 1.1 136,446 1.7 43,883 0.6 126,714 1.6 188,966 2.4
(a) Hospitalisations with any diagnosis of the mental and behavioural disorder.
Source: AIHW NHMD.
Table A3.12: People with at least one mental health-related MBS service as a proportion of all people who had at least one MBS service in 2008, by sex and age
Males Females Persons
Age group Number Per cent Number Per cent Number Per cent
0–29 133,620 3.8 188,445 5.1 322,065 4.5
30–34 41,249 7.3 71,465 10.5 112,714 9.1
35–39 47,134 7.4 82,648 11.0 129,782 9.3
40–44 42,825 6.9 73,900 10.5 116,725 8.9
45–49 41,393 6.3 71,162 9.7 112,555 8.1
50–54 35,339 5.7 60,800 9.0 96,139 7.4
55–59 29,433 5.0 49,056 7.9 78,489 6.5
60–64 22,137 4.1 36,197 6.6 58,334 5.4
65–69 12,174 3.0 21,086 5.1 33,260 4.1
70–74 7,725 2.4 14,295 4.2 22,020 3.3
75–79 5,579 2.2 10,468 3.6 16,047 3.0
80+ 4,997 1.8 11,331 2.4 16,328 2.2
Total 423,605 4.7 690,853 7.0 1,114,458 5.9
Source: AIHW analysis of 2008 Medicare data.

45
Table A4.1: Prevalence of medium, high or very high levels of psychological distress among people aged 18 years and over, by diabetes status, age and sex, 2007–08
With diabetes Without diabetes Total
Sex and age group Per cent 95% CI
Per cent 95% CI
Per cent 95% CI
Males
18–39 *24.7 9.4–40.1 31.0 28.6–33.4 30.9 28.5–33.3
40–59 44.1 35.2–53.0 26.7 24.5–28.9 27.7 25.4–30.0
60+ 36.4 30.7–42.0 21.6 18.9–24.4 24 21.5–26.4
Total 38.7 33.1–44.2 27.5 26.0–29.1 28.2 26.7–29.7
Females
18–39 53.7 39.8–67.6 41.3 38.8–43.9 41.5 39.0–43.9
40–59 49.4 44.7–54.2 35.7 33.5–37.8 36.3 34.1–38.4
60+ 41.8 33.2–50.4 29.6 27.1–32.0 30.8 28.3–33.3
Total 45.4 41.2–49.7 36.6 35.2–38.0 37 35.6–38.4
Persons
18–39 42.0 28.7–55.3 36.1 34.3–38.0 36.2 34.3–38.1
40–59 46.4 40.9–51.9 31.3 29.8–32.7 32 30.5–33.5
60+ 38.6 34.0–43.2 25.9 23.9–27.9 27.5 25.6–29.5
Total 41.6 37.6–45.5 32.2 31.2–33.2 32.7 31.6–33.7
* The RSE for this estimate is between 25% and 50% and should be treated with caution. Note: Excludes people with a missing Kessler 10 score. Source: AIHW analysis of ABS 2007–08 NHS reissue 1 expanded CURF.

46
Table A4.2: Prevalence of medium, high or very high levels of psychological distress among people aged 18–85 years, by diabetes status, age and sex, 2007
With diabetes Without diabetes Total
Sex and age group Per cent 95% CI
Per cent 95% CI
Per cent 95% CI
Males
18–39 *26.0 17.8–34.1 29.8 27.0– 32.5 29.7 27.0–32.4
40–59 *31.3 14.8–47.9 24.1 20.1–28.1 24.7 20.9–28.4
60–85 26.0 18.8–33.1 15.3 12.6–18.0 17.2 14.8–19.7
Total 27.9 21.8–34.1 24.7 22.8–26.5 25.1 23.1–27.1
Females
18–39 42.4 26.8–58.1 36.5 34.0–39.1 36.8 34.3–39.3
40–59 36.5 24.8–48.1 33.9 29.1–38.7 34.1 29.4–38.8
60–85 27.0 19.6–34.4 22.3 19.5–25.1 23.0 20.4–25.5
Total 34.0 26.7–41.2 32.6 30.5–34.7 32.6 30.7–34.6
Persons
18–39 37.1 26.8–47.3 33.1 31.0–35.1 33.2 31.2–35.2
40–59 34.1 22.6–45.6 29.1 25.9–32.3 29.5 26.3–32.7
60–85 26.4 20.5–32.4 18.9 16.9–21.0 20.1 18.2–22.0
Total 31.0 25.5–36.5 28.7 27.3–30.1 28.9 27.5–30.3
* The RSE for this estimate is between 25 and 50% and should be treated with caution. Note: Excludes people with a missing Kessler 10 score.
Source: AIHW analysis of ABS 2007 NSMHWB version 2, expanded CURF.

47
Table A4.3: Prevalence of a mental disorder(a) among people aged 16–85 years, by diabetes status, age and sex , 2007
With diabetes Without diabetes Total
Sex and age group Per cent 95% CI
Per cent 95% CI
Per cent 95% CI
Males
16–39 *16.4 6.7– 26.0 22.2 19.3– 25.1 22.1 19.2– 25.0
40–59 15.3 9.6– 20.9 18.2 14.0– 22.3 18.0 13.9– 22.0
60–85 9.5 5.1– 13.9 7.7 5.6– 9.9 8.0 6.0– 10.1
Total 12.3 8.7– 15.9 18.0 16.1– 20.0 17.6 15.7– 19.5
Females
16–39 40.5 25.6– 55.4 28.3 25.6– 30.9 28.7 26.2– 31.3
40–59 22.9 13.6– 32.1 21.3 17.7– 24.9 21.4 18.0– 24.8
60–85 *11.7 5.4– 18.1 10.9 9.0– 12.9 11.0 9.0– 13.0
Total 22.2 15.7– 28.8 22.3 20.9– 23.7 22.6 21.3– 23.9
Persons
16–39 32.6 22.9– 42.4 25.2 23.4– 26.9 25.4 23.6– 27.2
40–59 19.4 13.4– 25.3 19.8 17.3– 22.3 19.7 17.3– 22.2
60–85 10.5 6.2– 14.7 9.4 7.9– 10.8 9.6 8.1– 11.0
Total 17.4 13.5– 21.4 20.2 19.1– 21.3 20.0 18.9– 21.0
* The RSE for this estimate is between 25% and 50% and should be treated with caution. (a) Symptoms of mental disorder in the past 12 months and meeting lifetime diagnosis criteria. Mental disorders included are anxiety
disorders, affective (mood) disorders and substance use disorders.
Source: AIHW analysis of ABS 2007 NSMHWB version 2, expanded CURF.

48
Table A4.4: Age-standardised prevalence of affective and anxiety disorders in people aged 16–85 years, by diabetes status and sex, 2007
With diabetes Without diabetes
Type of mental disorder ASR(a) 95% CI
ASR(a) 95% CI
Per cent
Affective disorders(b)
Males 5.7 2.1–9.4 5.4 4.4–6.5
Females 6.6 2.8–10.3 7.3 6.2–8.4
Persons 5.9 3.0–8.8 6.4 5.6–7.1
Anxiety disorders(c)
Males 16.3 11.7–20.9 10.9 9.5–12.4
Females 25.5 17.6–33.4 17.9 16.3–19.6
Persons 19.0 13.9–24.1 14.4 13.3–15.5
(a) Age-standardised rate. Directly standardised to the June 2001 Australian ERP. (b) Symptoms of affective disorder in the past 12 months and meeting lifetime diagnosis criteria. Affective disorders
include mood disorders such as depression, mania, dysthymia and bipolar affective disorder. (c) Symptoms of anxiety disorder in the past 12 months and meeting lifetime diagnosis criteria. Anxiety disorders include
panic disorder, social phobia, agoraphobia, generalized anxiety disorders (GAD), post-traumatic stress disorder (PTSD) and obsessive compulsive disorder (OCD).
Note: Substance use disorder is not included as there are insufficient data to allow age standardisation for the population with diabetes. Source: AIHW analysis of ABS 2007 NSMHWB, expanded CURF, version 2.

49
Table A4.5: Hospitalisations with a mental health condition recorded(a), by diabetes status, age and sex, 2007–08
With diabetes Without diabetes Total
Sex and age group Number Per cent
Number Per cent
Number Per cent
Males
0–9 42 4.3 4,958 1.9 5,000 1.9
10–19 202 7.4 13,400 8.6 13,602 8.6
20–29 499 16.7 33,878 15.9 34,377 15.9
30–39 1,487 17.0 41,270 15.0 42,757 15.1
40–49 3,098 12.9 39,806 10.5 42,904 10.7
50–59 4,488 8.2 33,114 6.4 37,602 6.6
60–69 5,441 5.8 27,867 4.6 33,308 4.8
70–79 6,821 6.6 23,652 4.1 30,473 4.5
80+ 7,488 12.2 34,526 8.8 42,014 9.3
Total 29,566 8.4 252,471 7.5 282,037 7.6
Females
0–9 8 0.9 2,404 1.3 2,412 1.3
10–19 257 6.9 17,506 10.2 17,763 10.1
20–29 738 6.2 40,146 8.9 40,884 8.9
30–39 1,750 7.4 50,735 8.9 52,485 8.8
40–49 2,618 11.1 44,443 9.7 47,061 9.7
50–59 3,228 7.5 35,073 6.7 38,301 6.8
60–69 3,231 5.2 23,264 4.4 26,495 4.5
70–79 5,662 7.2 25,392 5.0 31,054 5.3
80+ 9,784 14.7 53,628 12.1 63,412 12.5
Total 27,276 8.7 292,591 7.6 319,867 7.7
Persons
0–9 50 2.7 7,362 1.7 7,412 1.7
10–19 459 7.1 30,906 9.4 31,365 9.4
20–29 1,237 8.3 74,027 11.2 75,264 11.1
30–39 3,237 10.0 92,008 10.9 95,245 10.9
40–49 5,716 12.0 84,250 10.1 89,966 10.2
50–59 7,716 7.8 68,187 6.6 75,903 6.7
60–69 8,672 5.5 51,131 4.5 59,803 4.6
70–79 12,483 6.9 49,044 4.5 61,527 4.8
80+ 17,272 13.5 88,154 10.6 105,426 11.0
Total 56,842 8.5 545,069 7.6 601,911 7.6
(a) Hospitalisations with any diagnosis of a mental health condition or an external cause of intentional self-harm or with any psychiatric care day.
Source: AIHW NHMD.

50
Table A4.6: Diabetes hospitalisations with specific mental and behavioural disorders recorded(a), by type of disorder and age, 2007–08
Dementia/Alzheimer Depression Other affective
mood disorders Neurotic disorders Substance use
Age group Number % Number % Number % Number % Number %
0–19 — — 104 1.6 21 0.3 88 1.4 128 2.0
20–29 — — 236 1.6 113 0.8 230 1.5 432 2.9
30–39 7 0.0 536 1.7 245 0.8 487 1.5 1,520 4.7
40–49 159 0.3 1,040 2.2 394 0.8 975 2.1 2,800 5.9
50–59 108 0.1 1,788 1.8 755 0.8 1,479 1.5 3,148 3.2
60–69 709 0.5 1,918 1.2 668 0.4 1,531 1.0 2,946 1.9
70–79 4,242 2.3 2,045 1.1 410 0.2 1,499 0.8 2,247 1.2
80+ 10,393 8.1 1,786 1.4 164 0.1 1,211 0.9 1,029 0.8
Total 15,618 2.3 9,453 1.4 2,770 0.4 7,500 1.1 14,250 2.1
(a) The number/proportion of hospitalisations with any diagnosis of diabetes that also have any diagnosis of the mental and behavioural disorder.
Source: AIHW NHMD.
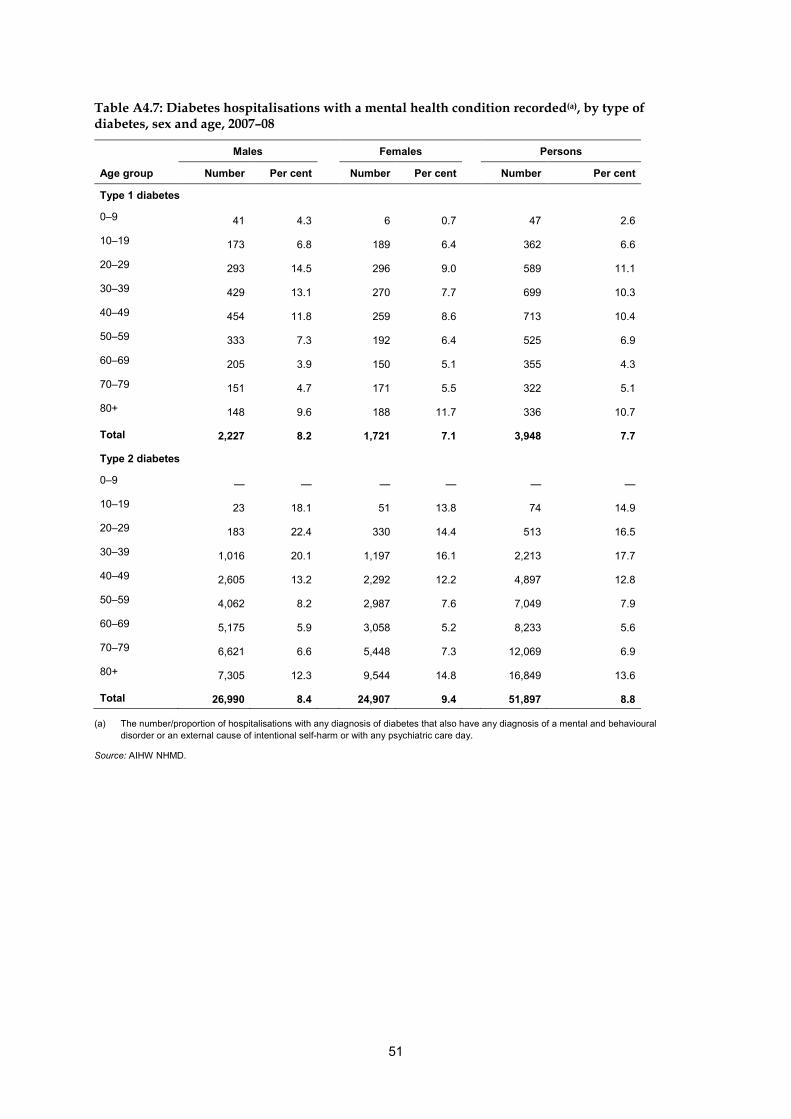
51
Table A4.7: Diabetes hospitalisations with a mental health condition recorded(a), by type of diabetes, sex and age, 2007–08
Males Females Persons
Age group Number Per cent Number Per cent Number Per cent
Type 1 diabetes
0–9 41 4.3 6 0.7 47 2.6
10–19 173 6.8 189 6.4 362 6.6
20–29 293 14.5 296 9.0 589 11.1
30–39 429 13.1 270 7.7 699 10.3
40–49 454 11.8 259 8.6 713 10.4
50–59 333 7.3 192 6.4 525 6.9
60–69 205 3.9 150 5.1 355 4.3
70–79 151 4.7 171 5.5 322 5.1
80+ 148 9.6 188 11.7 336 10.7
Total 2,227 8.2 1,721 7.1 3,948 7.7
Type 2 diabetes
0–9 — — — — — —
10–19 23 18.1 51 13.8 74 14.9
20–29 183 22.4 330 14.4 513 16.5
30–39 1,016 20.1 1,197 16.1 2,213 17.7
40–49 2,605 13.2 2,292 12.2 4,897 12.8
50–59 4,062 8.2 2,987 7.6 7,049 7.9
60–69 5,175 5.9 3,058 5.2 8,233 5.6
70–79 6,621 6.6 5,448 7.3 12,069 6.9
80+ 7,305 12.3 9,544 14.8 16,849 13.6
Total 26,990 8.4 24,907 9.4 51,897 8.8
(a) The number/proportion of hospitalisations with any diagnosis of diabetes that also have any diagnosis of a mental and behavioural disorder or an external cause of intentional self-harm or with any psychiatric care day.
Source: AIHW NHMD.

52
Table A4.8: Age-standardised proportion of hospitalisations with a mental health condition recorded(a) by type of diabetes and type of mental health condition, 2007–08
With Type 1 diabetes(b) With Type 2 diabetes(c)
Type of mental health condition ASR(d) 95% CI
ASR(d) 95% CI
Per cent
Dementia/Alzheimer 1.2 1.0–1.3 1.5 1.5–1.6
Depression 1.9 1.8–2.0 1.6 1.5–1.6
Other affective mood disorders 0.4 0.4–0.5
0.6 0.6–0.7
Neurotic disorders 1.2 1.1–1.3 1.5 1.4–1.6
Substance use 2.2 2.1–2.3 3.3 3.2–3.4
(a) The proportion of hospitalisations with any diagnosis of the mental health condition. (b) Hospitalisations with any diagnosis of Type 1 diabetes. (c) Hospitalisations with any diagnosis of Type 2 diabetes. (d) Age-standardised rate. Directly standardised to 2007–08 hospitalisations.
Source: AIHW NHMD.
Table A4.9: Age-standardised proportion of hospitalisations with a mental health condition recorded(a) by diabetes status, type of mental health condition and sex, 2007–08
Males Females Persons
With
diabetes(b) Without diabetes
With diabetes(b)
Without diabetes
With diabetes(b)
Without diabetes
Type of mental health condition ASR(c)
95% CI ASR(c)
95% CI ASR(c)
95% CI ASR(c)
95% CI ASR(c)
95% CI ASR(c)
95% CI
Per cent
Substance use 4.2 4.1–4.4 3.6 3.6–3.7 1.6 1.5–1.6 1.6 1.5–1.6 2.6 2.5–2.6 2.4 2.4–2.4
Depression 1.4 1.3–1.5 1.4 1.4–1.4 1.6 1.5–1.6 2.0 2.0–2.1 1.4 1.4–1.5 1.7 1.7–1.8
Other affective mood disorders 0.4 0.4–0.5 0.5 0.5–0.5 0.6 0.5–0.6 0.7 0.6–0.7 0.5 0.5–0.5 0.6 0.6–0.6
Neurotic disorders 1.2 1.1–1.2 1.5 1.5–1.5 1.3 1.3–1.4 1.7 1.7–1.8 1.2 1.2–1.3 1.6 1.6–1.6
Dementia/Alzheimer 1.3 1.3–1.3 0.8 0.8–0.8 1.7 1.7–1.7 1.2 1.2–1.2 1.5 1.5–1.5 1.0 1.0–1.0
(a) The proportion of hospitalisations with any diagnosis of a mental and behavioural disorder. (b) Hospitalisations with any diagnosis of diabetes. (c) Age-standardised rate. Directly standardised to 2007–08 hospitalisations.
Source: AIHW NHMD.

53
Table A4.10: People with at least one mental health-related MBS service as a proportion of all people who had at least one MBS service in 2008, by diabetes status, sex and age
With diabetes Without diabetes Total
Sex and age group Per cent 95% CI
Per cent 95% CI
Per cent 95% CI
Males
0–29 12.8 10.7–15.0 3.8 3.8–3.9 3.8 3.8–3.9
30–34 13.5 10.9–16.2 7.3 7.3–7.4 7.3 7.3–7.4 35–39 13.5 11.6–15.3 7.4 7.3–7.5 7.4 7.4–7.5 40–44 11.8 10.5–13.1 6.9 6.9–7.0 6.9 6.9–7.0 45–49 10.1 9.2–11.0 6.2 6.2–6.3 6.3 6.2–6.3 50–54 9.2 8.5–9.9 5.6 5.6–5.7 5.7 5.6–5.7 55–59 7.3 6.8–7.8 5.0 4.9–5.0 5.0 5.0–5.1 60–64 5.6 5.2–6.0 4.1 4.0–4.2 4.1 4.1–4.2 65–69 3.8 3.5–4.1 3.0 2.9–3.0 3.0 3.0–3.1 70–74 3.0 2.7–3.2 2.4 2.4–2.5 2.4 2.4–2.5 75–79 2.6 2.3–2.9 2.2 2.1–2.2 2.2 2.2–2.3 80+ 2.1 1.8–2.4 1.8 1.8–1.9 1.8 1.8–1.9 Total 5.2 5.0–5.3 4.7 4.7–4.7 4.7 4.7–4.7 Females 0–29 18.8 16.4–21.1 5.1 5.1–5.2 5.1 5.1–5.2 30–34 17.7 14.8–20.6 10.5 10.4–10.6 10.5 10.4–10.6 35–39 19.1 17.0–21.3 11.0 10.9–11.0 11.0 10.9–11.0 40–44 16.4 14.8–18.0 10.5 10.4–10.6 10.5 10.5–10.6 45–49 14.9 13.7–16.0 9.7 9.6–9.8 9.7 9.7–9.8 50–54 13.3 12.4–14.1 9.0 8.9–9.0 9.0 8.9–9.1 55–59 10.8 10.1–11.4 7.9 7.8–7.9 7.9 7.8–8.0 60–64 8.5 8.0–9.0 6.5 6.4–6.6 6.6 6.5–6.6 65–69 6.0 5.5–6.4 5.1 5.0–5.1 5.1 5.0–5.2 70–74 4.9 4.6–5.3 4.2 4.1–4.2 4.2 4.1–4.3 75–79 4.0 3.7–4.4 3.6 3.6–3.7 3.6 3.6–3.7 80+ 3.0 2.7–3.3 2.4 2.3–2.4 2.4 2.4–2.4 Total 7.5 7.4–7.7 7.0 7.0–7.0 7.0 7.0–7.0 Persons 0–29 16.0 14.4–17.7 4.5 4.5–4.5 4.5 4.5–4.5 30–34 15.7 13.7–17.7 9.1 9.0–9.1 9.1 9.0–9.1 35–39 16.3 14.9–17.8 9.3 9.3–9.4 9.3 9.3–9.4 40–44 14.0 13.0–15.1 8.8 8.8–8.9 8.9 8.8–8.9 45–49 12.3 11.6–13.0 8.1 8.0–8.1 8.1 8.0–8.1 50–54 11.1 10.5–11.6 7.4 7.3–7.4 7.4 7.4–7.4 55–59 8.9 8.5–9.3 6.5 6.4–6.5 6.5 6.5–6.6 60–64 6.9 6.6–7.2 5.3 5.3–5.4 5.4 5.3–5.4 65–69 4.8 4.5–5.0 4.0 4.0–4.1 4.1 4.0–4.1 70–74 3.9 3.7–4.1 3.3 3.3–3.4 3.3 3.3–3.4 75–79 3.3 3.1–3.5 3.0 2.9–3.0 3.0 2.9–3.0 80+ 2.6 2.4–2.8 2.2 2.1–2.2 2.2 2.2–2.2 Total 6.3 6.2–6.4 5.9 5.9–5.9 5.9 5.9–5.9
Source: AIHW analysis of 2008 Medicare data.

54
Table A4.11: Prevalence of medium, high and very high psychological distress among people with diabetes aged 18 years and over, by socioeconomic status(a), 2007 and 2007–08
Socioeconomic status Crude rate 95% CI ASR(b) 95% CI
Per cent
NHS(c)
Lowest socioeconomic quintiles (Q1+Q2) 44.7 37.6–51.7 41.8 33.1–50.5
Highest socioeconomic quintiles (Q4+Q5) 37.7 28.8–46.7 37.8 24.0–51.7
Total 41.6 37.6–45.5 43.4 37.2–49.6
NSMHWB(d)
Lowest socioeconomic quintiles (Q1+Q2) 31.5 25.1–37.9 33.8 24.7–43.0
Highest socioeconomic quintiles (Q4+Q5) 32.3 20.4–44.1 34.2 22.4–46.1
Total 31.0 25.5–36.5 33.9 27.2–40.7
(a) Socioeconomic quintiles are based on the ABS’s Index of Relative Socio-Economic Disadvantage, derived from area of residence of survey respondents. Quintile 1 are the areas of lowest socioeconomic status and Quintile 5 the highest.
(b) Directly standardised to the June 2001 Australian standardised estimated resident population.
(c) 2007–08, people aged 18 years and over
(d) 2007, people aged 18–85 years
Note: Excludes people with a missing Kessler 10 score. Sources: AIHW analysis of ABS 2007–08 NHS, reissue 1 and 2007 NSMHWB, version 2, expanded CURFs.
Table A4.12: Prevalence of a mental disorder(a) among people with diabetes aged 16–85 years, by socioeconomic status(b), 2007–08
Socioeconomic status Crude rate 95% CI ASR(b) 95% CI
Per cent
Lowest socioeconomic quintiles (Q1+Q2) 14.6 10.1– 19.1 20.0 12.1–27.9
Highest socioeconomic quintiles (Q4+Q5) 20.8 14.9– 26.7 25.0 18.2–31.9
Total 17.4 13.5– 21.4 23.4 18.4–28.3
(a) Symptoms of mental disorder in the past 12 months and meeting lifetime diagnosis criteria. Mental disorders included are anxiety disorders, affective (mood) disorders and substance use disorders.
(b) Socioeconomic quintiles are based on the ABS’s Index of Relative Socio-Economic Disadvantage, derived from area of residence of survey respondents. Quintile 1 are the areas of lowest socioeconomic status and Quintile 5 the highest.
(c) Directly standardised to the June 2001 Australian standardised estimated resident population.
Source: AIHW analysis of ABS 2007 NSMHWB, version 2, expanded CURF.

55
Table A4.13: Diabetes hospitalisations with a mental health condition recorded(a) by socioeconomic status(b) and remoteness(c), 2007–08
Number ASR(d) 95% CI
Socioeconomic status (SEIFA quintiles)(b)
Quintile 1 (lowest socioeconomic group) 12,056 8.6 8.4–8.8
Quintile 2 11,543 8.2 8.0–8.4
Quintile 3 10,882 7.7 7.5–7.9
Quintile 4 10,106 7.9 7.7–8.1
Quintile 5 (highest socioeconomic group) 10,478 8.8 8.5–9.0
Remoteness(c)
Major cities 38,165 8.8 8.7–8.9
Inner regional 10,056 7.2 7.0–7.4
Outer regional 5,825 8.0 7.7–8.3
Remote 1,469 7.7 7.2–8.2
Very remote 1,013 9.2 8.5–9.9
Total 56,842 8.4 8.3–8.5
(a) The number/proportion of hospitalisations with any diagnosis of diabetes that also have recorded any diagnosis of a mental and behavioural disorder or an external cause of intentional self-harm or with any psychiatric care day.
(b) Socioeconomic quintiles are derived from the ABS’s 2006 Index of Relative Socio-Economic Disadvantage, based on postcode of patient’s usual residence at the time of hospitalisation. Quintile 1 are the areas of lowest socioeconomic status and Quintile 5 the highest. Excludes hospitalisations for which the SEIFA status was not known (1.9% of total hospitalisations).
(c) Based on patients’ usual residence at the time of hospitalisation mapped to the ABS’s ASGC Remoteness Structure 2006. Total includes a small number of not stated and missing remoteness areas.
(d) Age-standardised rate. Directly standardised to total hospitalisations 2007–08.
Note: Remoteness categories are explained and illustrated in the Glossary (see ASGC RA and Figure G.1).
Source: AIHW NHMD.

56
Table A4.14: People with at least one mental health-related MBS service as a proportion of people with at least one diabetes-related MBS service in 2008, by socioeconomic status and remoteness
Number Per cent 95% CI
Socioeconomic status (SEIFA quintiles)(a)
Quintile 1 (lowest socioeconomic group) 2,028 6.0 5.7–6.2
Quintile 2 2,292 5.8 5.5–6.0
Quintile 3 2,620 6.3 6.1–6.6
Quintile 4 2,176 6.7 6.4–7.0
Quintile 5 (highest socioeconomic group) 1,977 7.0 6.7–7.3
Remoteness(b)
Major cities 7,457 7.0 6.8–7.1
Inner regional 2,743 5.9 5.7–6.1
Outer regional 923 4.4 4.1–4.6
Remote and Very remote 83 3.1 2.5–3.8
Total 11,206 6.3 6.2–6.4
(a) Socioeconomic quintiles are derived from ABS’s 2006 Index of Relative Socio-Economic Disadvantage, based on patients’ residence. Quintile 1 are the areas of lowest socioeconomic status and Quintile 5 the highest. Excludes patients where the SEIFA status was not known (1.0 % of patients).
(b) Based on patients’ usual residence at the time of hospitalisation mapped to the ABS’s ASGC Remoteness Structure 2006.
Note: Remoteness categories are explained and illustrated in the Glossary (see ASGC RA and Figure G.1).
Source: AIHW analysis of 2008 Medicare data.

57
Table A4.15: Crude and age-standardised prevalence of medium, high and very high psychological distress among people with diabetes aged 18 years and over, by health risk factors, 2007 and 2007–08
NHS(a) NSMHWB(b)
Behavioural risk factors Crude
rate 95% CI ASR(c) 95% CI Crude
rate 95% CI ASR(c) 95% CI
Per cent
Smoking status
Current smokers 59.6 44.6–74.5 62.1 45.8–78.3 37.1 27.6–46.6 40.7 33.5–48.0
Non-smokers(d) 38.1 34.0–42.2 37.8 30.6–45.0 29.6 22.8–36.3 30.8 22.6–39.0
Physical activity status
Physically inactive 44.3 40–48.7 43.0 35.8–50.1 34.7 28.6–40.8 37.9 31.2–44.6
Physically active 31.4 21.7–41.1 43.8 38.9–48.8 25.6 15.9–35.3 27.8 19.5–36.1
Obesity status
Obese or overweight(e) 41.6 37.2–46.1 43.4 36.6–50.2 31.1 24.9–37.4 36.1 28.7–43.5
Not obese or overweight 40.7 29–52.4 39.4 16.0–62.8 31.0 19.9–42.1 33.8 22.0–45.5
Total(f) 41.6 37.6–45.5 43.4 37.2–49.6 31.0 25.5–36.5 33.9 27.2–40.7
(a) 2007–08, people aged 18 years and over. (b) 2007, people aged 18–85 years. (c) Age-standardised rate. Directly standardised to the June 2001 Australian ERP. (d) Includes people who never smoked and ex-smokers. (e) BMI > 24 based on self-reported height and weight. (f) All Australian adults with diabetes.
Note: Excludes people with a missing Kessler 10 score. Sources: AIHW analysis of ABS 2007–08 NHS, reissue 1 and 2007 NSMHWB, version 2, expanded CURF.
Table A4.16: Crude and age-standardised prevalence of a mental disorder(a) in people with diabetes aged 16–85 years, by health risk factors, 2007
Behavioural risk factors Crude rate 95% CI ASR(b) 95% CI
Per cent
Smoking status
Current smokers 31.1 15.9–46.3 36.8 24.4–49.2
Non smokers(c) 14.2 10.8–17.6 18.7 13.8–23.6
Physically inactive status
Physically inactive 18.0 12.0–24.0 24.8 17.5–32.2
Physically active 16.6 13.4–19.7 22.0 16.9–27.1
Obesity status
Obese or overweight(d) 18.0 13.9–22.1 24.0 18.7–29.3
Not obese or overweight 15.8 9.1–22.4 21.4 12.9–29.9
Total 17.4 13.5–21.4 23.4 18.4–28.3
(a) Symptoms of mental disorder in the past 12 months and meeting lifetime diagnosis criteria. Mental disorders included are anxiety disorders, affective (mood) disorders and substance use disorders.
(b) Age-standardised rate. Directly standardised to the June 2001 Australian ERP. (c) Includes people who never smoked and ex-smokers. (d) BMI > 24 based on self-reported height and weight.
Source: AIHW analysis of ABS 2007 NSMHWB, expanded CURF, version 2.

58
Appendix 2: Methods
Statistical methods This appendix presents details of the methods used in analysing data for this report. The approach taken varied according to the data source, with different methods required for survey (NHS and NSMHW) and administrative data (MBS and NHMD). Appendix table 2.1 summarises the statistical methods (explained in the following sections) by data source.
Appendix table 2.1: Statistical methods by data source
NHS 2007–08 NSMHWB 2007 NHMDB 2007–08 MBS 2008 ALWHS
Sample weights applied to respondents . . . . n.a.
Exact standard error with Jackknife method . . . . . .
Relative standard error (numbers and proportions) . . . . . .
95% confidence interval around estimates (number and proportions) . . . .
Direct age standardisation . .
2001 ERP in Australia as standard population . .
2007–08 hospitalisations as standard population . . . . . . . .
Standard error for age-standardised proportion . .
95% confidence interval for age-standardised proportion . .
Significance testing using 95% CI
Weighting of sample data from the NHS and NSMHWB The NHS and NSMHWB both used the same sampling method based on the master sample of the Australian population, derived from the 2001 Census. In sample surveys, estimates derived are subject to sampling error or variability and greater uncertainty of the results than if they were obtained from a full enumeration. ABS attributed a person level weight that corrects for some of the major characteristics (mainly age, sex, state and territory) of the sample to better represent the Australian population. National estimates in this report were derived from applying the ABS inflation weight to the respondents.
Assessing reliability of estimates in surveys The reliability of a survey estimate was assessed by two measures—the standard error (SE) and the relative standard error (RSE).
Exact standard error of number estimates The delete-a-group Jackknife’s weight replication method was used to derive the standard error of number estimates due to sampling design.

59
The variability between these replicate estimates (denoting X(w) for group number w) is used to measure the SE of the original weighted estimate X, using the formula: w SE(X) = SQRT[(((w – 1)/w)*∑(X(w) – X)2))] 1 Where w = the number of replicate weights X(w) = estimate obtained using replicate weights for replicate group w X = estimate from using full sample weights
Standard error of the ratio of two number estimates Once the standard error for the number estimates was produced, the standard error for the proportion was derived as follows: SE(X/Y) = RSE(X/Y)*(X/Y), where RSE(X/Y) is calculated as shown below.
Relative standard error of estimates (number and ratio) The relative standard error (RSE) of an estimate is a measure of the percentage errors likely to have occurred due to sampling. RSE(X)% = (SE/estimate)*100 Estimates with a RSE above 50% are considered unreliable. No estimates in this report have a RSE > 50%. Caution should be used when a RSE is between 25% and 50% and these have been highlighted in the tables in the report. The relative standard error for the proportion was derived from the standard error of both the estimate for the numerator (X) and the denominator (Y) as follows: RSE(X/Y) = SQRT (RSE(X)2 — RSE(Y)2) Where X is a subset of Y and Y is a survey estimate of the number of people in a group.
Confidence interval for estimates (number and ratio) The 95% confidence interval around the proportion estimates (P) or number estimates was derived as follows: UCL= X + 1.96*SE(X) LCL= X — 1.96*SE(X) UCL= P + 1.96*SE(X/Y) LCL= P — 1.96*SE(X/Y) Where UCL = upper confidence limit
LCL = lower confidence limit
Reliability of counts and rates in administrative data Administrative data such as Medicare data and the NHMD differ from survey data as the enumeration of events is considered to be complete. For these sources, standard errors and confidence intervals were calculated for the age-standardised proportions to account for variability due to small numbers and data quality issues.

60
Crude prevalence rates A crude prevalence rate or proportion is defined as the number of events in a specified time period divided by the total number of individuals in the population who are at risk for these events. In this report, crude rates indicate the overall prevalence of diabetes and/or poor mental health and wellbeing in the populations of interest. In calculating rates, those records for which the information of interest was not available were excluded from the denominator as well as the numerator. Of particular note, a small number of respondents with a missing Kessler score were excluded from the population when calculating rates.
Age-standardised prevalence rates Age-standardisation is a technique used to take account of the effect of differences in population age structures when comparing rates across different population groups (such as people with diabetes and people without diabetes). The direct method of standardisation was used to calculate ASRs in this report.
Direct age-standardisation Age-standardised proportions have been calculated using the following formula: Age standardised proportion (ASR) = ∑(ri Pi)/∑Pi where ri is the sex-specific and age group-specific rate for sex and age group i in the
population being studied Pi is the population of age group i in the standard population The Australian population as at 30 June 2001 was the standard population in all analyses derived from survey data and Medicare data. For data from the NHMD, the standard population applied was all hospitalisations in 2007–08. Ten-year age groups were used for standardisation of data from the NHMD. However, due to small sample sizes, broader age groups were used in standardising the survey data.
Standard error of age-standardised proportion and confidence intervals There are a number of methods for calculating SE s and CIs for administrative data. For this report we have chosen to use the following method: The standard error (SE) for an age-standardised proportion per 100 population was calculated as:
SE(ASR) =
where ri = age-specific rate per 100 for age group i ni = population for age group i Pi = standard population for age group i P = total standard population
( )[ ]
××∑ 2
i2
ii P / 100 /n)P(r

61
The 95% confidence interval (CI) for an age-standardised rate was calculated as: 95% CI = ASR ± [1.96 × se(ASR)]
Significance testing Variation or difference in observed values or rates may only reflect a random variation or difference. To assess whether differences in values of rates are statistically significant—that is, that they are not due to chance alone—95% confidence intervals around the rates have been used in this analysis. A difference between rates or values was considered as statistically significant when the confidence intervals around the values or rates did not overlap. Small sample sizes from the NHS and NSMHWB led to large confidence intervals in many cases in this analysis, restricting conclusions that could be drawn.
62
Appendix 3: Data sources
2007 National Survey of Mental Health and Wellbeing (NSMHWB) The survey was funded by the Department of Health and Ageing and enumerated by the ABS. It was conducted between August and December 2007 and covered people aged 16–85 years usually living in private dwellings in urban and rural areas. It aimed to collect information on selected lifetime and 12 months mental disorders, by major disorders groups (affective, anxiety and substance use disorders), as well as other health conditions and characteristics. The sample was framed according to the Population Survey Master Sample (PSMS), initially targeting 11,000 households. Results are available from 8,800 households. The response rate was 60%. People from very remote regions, people in residential facilities and people who were unable to answer for themselves were excluded from the survey.
National Health Survey (NHS) 2007–08, ABS The 2007–08 NHS was conducted by the ABS from August 2007 to June 2008. It collected information from people aged 18 years and over, residing in private dwellings in urban and rural areas of Australia. Information was collected on 20,788 individuals. The response rate to the survey was 90.6%. As with the NSMHWB, people in non-private dwellings such as hotels and motels, hostels, boarding schools and boarding houses, hospitals, nursing and convalescent homes, prisons, reformatories and single quarters of military establishments were not included. Very remote regions were also not included in the sample.
National Hospital Morbidity Database (NHMD) 2007–08, AIHW The NHMD contains demographic, diagnostic, procedural and length of stay information on episodes of care for patients admitted to hospital in Australia. The data collection is maintained by the AIHW using data supplied by each state and territory. The data are episode-based, and do not contain identifiers for individual people. As a result, it is not possible to count patients individually. A ‘hospitalisation’ refers to one episode of care in a hospital, with diagnosis recorded on discharge or separation from each episode. The NHMD includes data from public acute hospitals, public psychiatric hospitals, private acute and psychiatric hospitals, and private freestanding day hospital facilities. Public sector hospitals that are not included are those not within the jurisdiction of a state or territory health authority (hospitals operated by the Department of Defence or correctional authorities, for example, and hospitals located in offshore territories). In addition, for 2007–08, data were not supplied for a mothercraft hospital in the Australian Capital Territory. Within the private sector, data were not provided in 2007–08 for: private day hospital facilities in the Australian Capital Territory; single private free-standing day hospital facility in the Northern Territory; and for a very small private hospital in Victoria. Victoria estimated that its data were essentially complete. In this report counts for hospitalisations exclude those with a care type of: unqualified newborn, organ procurement and hospital boarder.

63
Medicare data Medicare is Australia’s universal health insurance scheme. It was introduced in 1984 and provides access to free treatment as a public (Medicare) patient in a public hospital, and free or subsidised treatment by practitioners such as doctors, including specialists, participating optometrists or dentists (specified services only). Specific services eligible for subsidy are listed in the Medicare Benefits Schedule (MBS). For the purpose of this report, people with diabetes and mental health conditions were defined according to whether they, or their doctor, had claimed a subsidy for specific MBS items in 2008.
Australian Longitudinal Study on Women’s Health (ALSWH) The ALSWH is a longitudinal population-based survey that explores the health of three large cohorts of Australian women over two decades. A researcher from the University of Newcastle (Research Centre for Gender, Health and Ageing) and the University of Queensland manages the study. The first data collection began in 1996 and, to date, at least five waves have been collected among three age cohorts representing different stages of women’s life cycle. The initial representative sample of Australian women was drawn from the Medicare database, with deliberate oversampling in rural and remote areas. In total 40,000 women responded to the first survey. The total attrition rate between survey 1 and survey 4 for each of the cohorts is 38% for young women, 23% for mid-age women and 45% for older women. Women with tertiary backgrounds tended to be over-represented and women from specific migrant groups tended to be under-represented. No weights are available for the later waves to take account of the attrition and to give population estimates. For this report the data were used for cross-sectional rather than time series analysis, and no weights have been applied.

64
Appendix 4: Sample size and population estimates Appendix table 4.1: Populations with diabetes and poor mental health and wellbeing, by data source
Data source Age (years) Populations of interest
Sample size Measures for
diabetes
Measures for poor mental health and
wellbeing Unweighted Weighted
2007 NSMHWB 16–85 With diabetes or high blood sugar and any mental disorder
139 208,793 Self-reported diabetes or high blood sugar
Lifetime mental disorder with 12 months symptoms (including anxiety, affective and substance use disorders) using self-reported information screened with the WHM-CIDI version 3.0 and without applying the hierarchy rules
With diabetes or high blood sugar and no mental disorder
562 989,117
With diabetes or high blood sugar
701 1,197,910 . .
18–85 With diabetes or high blood sugar and medium or high or very high distress
227 369,688 Self-reported diabetes or high blood sugar
Medium, high or very high distress. Kessler score>15
With diabetes or high blood sugar and no or low distress
471 821,715 No or low distress Kessler score<=15
With diabetes or high blood sugar
698 1,193,480 . .
2007–08 NHS 18+ With diabetes high or very high distress
154 161,407 Self-reported diabetes
High or very high distress. Kessler score >29
With diabetes and medium or high or very high distress
341 336,189 Medium or high or very high distress. Kessler score >15
With diabetes and no or low distress
508 472,757 No or low distress. Kessler score <=15
With diabetes 849 808,947 . .

65
Appendix table 4.1 (continued): Populations with diabetes and poor mental health and wellbeing, by data source
Data source Age (years) Populations of interest
Sample size
Measures for diabetes
Measures for poor mental health and wellbeing Unweighted Weighted
2007–08 NHMD All ages Hospitalisations with diabetes and any mental health conditions
56,842 . . Hospitalisations with a principal or additional diagnosis of diabetes
Hospitalisations with a principal or additional diagnosis of mental health conditions (including dementia) or, with an external cause of self-harm or at least one psychiatric care day
All hospitalisations with diabetes
668,251 . .
2008 MBS All ages People with at least one diabetes-related MBS claim and one mental health-related claim in 2008
11,206 . . People who had at least one claim for a diabetes-related MBS service processed by Medicare in 2008. Diabetes-related MBS items include annual cycle of care services and allied health services specifically for diabetes.
People who had at least one claim for a mental health-related MBS service (psychiatrist, GP Mental Health Care Plan services, GP Focussed Psychological Strategies services and allied health services focused on psychological strategies) processed by Medicare in 2008.
People with at least one diabetes-related claim but no mental health-related claim in 2008
166,259 . .
People with at least one diabetes-related claim in 2008
177,465 . .

66
Appendix table 4.1 (continued): Populations with diabetes and poor mental health and wellbeing, by data source
Data source Age Populations of
interest
Sample size
Measures for diabetes
Measures for poor mental
health and wellbeing Unweighted Weighted
ALSWH Specific age groups (women only)
Women with self-reported diabetes and mental health problem Birth years: (1921–26) (1946–51) (1973–78)
298
95 155 48
Women with a self-reported diagnosis or treatment of diabetes in the 3 years before the survey. For the oldest age group the questions referred to diabetes/high blood sugar.
Mental health component (5 items) of the SF 36: MHI-5 <53
Women with self-reported diabetes and no mental health problem Birth years: (1921–26) (1946–51) (1973–78)
1,314
568 547 199
Mental health component (5 items) of the SF 36: MHI-5 <53
Women with self-reported diabetes (1921–26) (1946–51) (1973–78)
1,612
663 702 247

67
Appendix 5: Definitions and codes
5.1 Diabetes
NHS, NSMHWB, ALSWH
Appendix table 5.1: Questions used to identify people with diabetes in the NHS, NSMHWB and ALSWH
Survey and year Questions People with self-reported diabetes
NSMHWB 2007 Whether ever told had diabetes or high sugar levels? Person who answered ‘yes’ to either one of the four question items.
Whether had diabetes/high blood sugar levels/received treatment for it in the last 12 months?
Whether diabetes or high sugar levels has lasted 6 months or more?
Whether had diabetes or high blood sugar as a chronic condition?
NHS 2007–08 Whether ever told by a doctor or nurse had diabetes? Person who answered ‘yes’ to either of the two question items.
Whether the condition is still current and long-term?
ALSWH
Older women cohort (2005) In the past 3 years, have you ever been diagnosed or treated for diabetes (high blood sugar)? In the past 3 years, have you ever been diagnosed or treated for diabetes?
Woman who answered ‘yes’ to the question item.
Mid-age women cohort (2007)
Younger women cohort (2006)
In the past 3 years, have you ever been diagnosed or treated for gestational diabetes, insulin dependent diabetes (Type 1), non-insulin dependent diabetes (Type 2)?
NHMD In the NHMD principal and additional diagnoses are coded according to the WHO International Classification of Diseases, tenth revision (ICD–10-AM). The following ICD-10-AM codes were used to define diabetes for this report.
Appendix table 5. 2: ICD-10-AM codes for diabetes
Diabetes codes ICD-10-AM Diagnosis status
Type 1 diabetes E10, O240 (in pregnancy) Principal or additional
Type 2 diabetes E11, O241 (in pregnancy)
Other diabetes E13,O242 (in pregnancy)
Unspecified diabetes E14, O243, O249 (in pregnancy)
Gestational diabetes O244

68
MBS items
Appendix table 5.3: Diabetes-related MBS items used to identify the MBS population with diabetes
Item description Item number
Annual diabetes cycle of care 2517, 2518, 2521, 2522, 2525, 2526, 2620, 2622, 2624, 2631, 2633, 2635
Diabetes education 81100, 10951, 81305
Exercise physiology 81110, 81115
Dietetics 81120, 81125
Source: Medicare area of the Australian Government Department of Health and Ageing.

69
5.2 Poor mental health and wellbeing
NHS, NSMHWB, ALSWH
Appendix table 5.4: Questions used to identify people with poor mental health and wellbeing in the NHS, NSMHWB and ALSWH
Survey and year Questions/items Poor mental health or wellbeing
NSMHWB 2007 12-months prevalence of a mental disorder (anxiety, depression or substance use disorder)
People who met the diagnostic criteria of having had a mental disorder at some time in their life and having symptoms of the disorder in the 12 months before the interview.
Scale of psychological distress (Kessler 10+)
Person with medium, high or very high psychological distress with a K10+ score >15
NHS 2007–08
Scale of psychological distress (Kessler 10)
Person with medium, high or very high psychological distress with a K10 score >15
Person with high or very high psychological distress with a K10 score >29
ALSWH
Older women cohort (2005)
Mental health index of the SF36 module (MHI-5)
MHI-5 < 53
Mid-age women cohort (2007)
Younger women cohort (2006)

70
NHMD
Appendix table 5.5: ICD-10-AM codes for mental health condition
Mental health condition codes ICD-10-AM Diagnosis status
Dementia and Alzheimer F00–F03 Principal or additional
Organic, including symptomatic, mental disorders excluding dementia and Alzheimer F04–F09
Mental and behavioural disorders due to psychoactive substance use F10–F19
Schizophrenia, schizotypal and delusional disorders F20–29
Depression F32, F33
Mood affective disorders, excluding depression F30, F31, F34–F39
Neurotic, stress-related and somatoform disorders F40–F48
Behavioural syndromes associated with physiological disturbances and physical factors F50–F59
Disorders of adult personality and behaviour F60–F69
Mental retardation F70–F79
Disorders of psychological development F80–F89
Behavioural and emotional disorders with onset usually occurring in childhood and adolescence F90–F98
Unspecified mental disorder F99
OR Self-harm X60–X84
OR Any total psychiatric care days>0
MBS items
Appendix table 5.6: Mental health-related MBS items used to identify the MBS population with poor mental health and wellbeing
Item description Item number
Consultation with a psychiatrist (individual or group and including telepsychiatry, community case conference and ECT)
134,136,138,140,142,289,300,302,304,306,308,310,312,314,316,318,319,320,322,324,326,328,330,332,334,338,342,344,346,348,350,352,353,355,356,357,358,359,361,364,366,367,368,369,370,855,857,858,861,864,866, 14224
Consultation with a GP for mental health care plan (3-step, assessment, review or consultation only), family therapy and focussed psychological strategies
2574,2575,2577,2578,2704,2705,2707,2708,2710, 2702,2712,2713,2721,2723,2725,2727
Consultation with a clinical or registered psychologist (including enhanced primary care plan, ECT and focused psychological strategies)
10968,80000,80005,80010,80015,80020,80100, 80105,80110,80115,80120,82000,82015,81355
Consultation with occupational therapist (for an assessed mental disorder) 80125,80130,80135,80140,80145
Consultation with a mental health worker (for an assessed mental disorder) 10956,81325
Consultation with a social worker (for an assessed mental disorder) 80150,80155,80160,80165,80170
Source: Mental health area of the Australian Government Department of Health and Ageing.

71
5.3 Additional definitions and codes
Behavioural health risk factors in NHS and NSMHWB
Appendix table 5.7: Health risk factors definition in surveys
Health risk factors NHS 2007–08 NSMHWB 2007
Smoking status Self-reported smoking status Currently smoking regardless of the quantity and frequency, excluding ex-smokers and people who never smoked
Self-reported smoking status Currently smoking regardless of the quantity and frequency, excluding ex-smokers and people who never smoked
Physical inactivity Self-reported physical activity Physical activity score derived from self-reported information on the number, duration and frequency of physical activity sessions undertaken during the 2 weeks before the survey. Physical inactivity cut off score < 1,600.
Self-reported physical activity Physical activity score derived from the self-reported number of sessions and time spent during the past 2 weeks before the interview. Physical inactivity derived from insufficient time or sessions of physical activity undertaken.
Obesity/overweight Based on body mass index (BMI) derived from self-reported height and weight Obese or overweight person with a BMI>=25
Based on body mass index (BMI) derived from self-reported height and weight Obese or overweight person with a BMI>=25

72
Glossary
Additional diagnosis: An additional diagnosis is a condition or complaint that either coexists with the principal diagnosis in a hospital separation or arises during the episode of care. Affective disorders: Mood disorders such as depression, mania, dysthymia and bipolar affective disorder. Anxiety disorders: A group of mental disorders revealed by excessive feelings of apprehension, worry, nervousness and stress. It includes panic disorder, social phobia, agoraphobia, generalized anxiety disorders (GAD), post-traumatic stress disorder (PTSD) and obsessive compulsive disorder (OCD). Australian Standard Geographical Classification (ASGC) Remoteness Areas: The ASGC RA classification is based on the Accessibility/Remoteness Index of Australia (ARIA). ARIA is derived from the distance a place is by road from urban centres of different sizes, and therefore provides a relative indication of how difficult it might be for residents to access certain services such as health care and education. Five categories are used in this publication: ‘Major cities of Australia’, ‘Inner regional Australia’, ‘Outer regional Australia’, ‘Remote Australia’ and ‘Very remote Australia’. A map showing the five regions is provided below (Figure G.1). Examples of a Major city are Sydney and Canberra; Inner regional: Hobart, Mackay, Gundagai; Outer regional: Darwin, Broken Hill, Kalgoorlie; Remote: Alice Springs, Blinman; Very remote: Wilcannia, Thursday Island. Depression: Depression is a state of gloom, despondency or sadness lasting at least two weeks. The person usually suffers from low mood, loss of interest and enjoyment and reduced energy. Their sleep, appetite and concentration may be affected. Diabetes: A chronic condition in which the body cannot properly use its main energy source, the sugar glucose. This is due to either the pancreas not producing enough of the hormone insulin or the body being unable to effectively use the insulin produced. Insulin helps glucose enter the body’s cells from the bloodstream and then be processed by them. Diabetes is marked by an abnormal build-up of glucose in the blood and it can have serious short-term and long-term effects on many of the body’s systems, especially the blood vessels and nerves. Diabetes Service Incentive Payments (SIP): Incentive payments to general practitioners (GPs) for an annual cycle of care service for patients with diabetes. The aim of the incentive payment is to enhance prevention, earlier diagnosis and management of people with established diabetes. The payment is paid to individual GPs providing the practice has registered. To claim SIP payment the GP must use the MBS Item Number for annual cycle of care. External cause: an environmental event, circumstance or condition as the cause of injury, poisoning and other adverse event. Hospitalisation or separation: An episode of care for an admitted patient in a hospital, which can be a total hospital stay (from admission to discharge, transfer or death), or a portion of a hospital stay beginning or ending in a change of type of care (for example from acute care to rehabilitation).

73
International statistical classification of diseases and related health problems, Tenth revision – Australian modification, 5th edition (ICD-10-AM): The National Centre for Classification in Health’s (NCCH) classification for diseases and related health problems, used for diagnoses and procedures recorded for patients separated from hospital. It is the Australian modification of the World Health Organization’s internationally accepted statistical classification of disease and injury. Length of stay in hospital: The length of stay for an overnight patient is calculated by subtracting the date the patient is admitted from the date of separation and deducting days the patient was on leave. A same-day patient is allocated a length of stay of 1 day. Mental health: A state of emotional and social wellbeing. It influences how an individual copes with the normal stresses of life and whether he or she can achieve his or her potential. Mental health describes the capacity of individuals and groups to interact, inclusively and equitably with one another and with their environment, in ways that promote subjective wellbeing and optimise opportunities for development and use of mental abilities. Mental disorder: According to the ICD-10 (International Classification of Disease - 10th revision) classification of mental and behavioural disorders, a disorder implies ‘the existence of a clinically recognisable set of symptoms or behaviour associated in most cases with distress and with interference with personal function’ (WHO 1992:5). Most diagnoses require criteria relating to severity and duration to be met. Prevalence: The number or proportion (of cases, instances, and so on) present in a population at a given time. The prevalence rate in this report is calculated by dividing the number of people with the disease by the average population in the same reference period. The resulting number is expressed as a percentage. Principal diagnosis: The principal diagnosis is the diagnosis established after study to be chiefly responsible for occasioning the patient’s episode of admitted patient care. Psychological distress scale (Kessler 10 and Kessler 10+): The Kessler (K10) measure is a 10-item self-report questionnaire intended to yield a global measure of ‘psychological distress’ based on questions about the level of anxiety and depressive symptoms in the most recent 4-week period. This is a widely used scale designed to detect the differing levels of psychological distress in the general population. While high levels of psychological distress are often associated with mental illness, it is not uncommon for some people to experience psychological distress but not meet criteria for a mental disorder. The K10 is based on 10 questions about negative emotional states in the 30 days before interview. It is scored from 10 to 50, with higher score indicating higher levels of distress. A set of cut-off scores for the K10 was developed by the Clinical Research Unit for Anxiety and Depression (CRUfAD), School of Psychiatry, University of New South Wales, to determine the prevalence of anxiety or depressive disorders. CRUfAD recommends: - people with a low level of psychological distress are unlikely to need professional
assistance - people with medium level of psychological distress are encouraged to use self-help
information and techniques - people with high or very high psychological distress are strongly encouraged to see a
doctor. Risk factor: Any factor that represents a greater risk of a health disorder or other unwanted condition or event. Some risk factors are regarded as causes of disease, others are not necessarily so. Along with their opposites, protective factors, risk factors are known as determinants.
74
Socio-Economic Indexes for Areas (SEIFA): An area-based measure of socioeconomic disadvantage derived from the social and economic characteristics of a statistical local area (SLA) including income, education and employment. In this report, quintiles (fifths) of socioeconomic disadvantage are presented: the first quintile represents the most disadvantaged areas; the fifth quintile represents the least disadvantaged areas. Substance use disorder: A disorder of harmful use and/or dependence on illicit or licit drugs including alcohol, tobacco and prescription drugs. Type 1 diabetes: A form of diabetes marked by a complete lack of insulin and needing insulin replacement for survival. This form of diabetes mostly arises in childhood or in young adults, though it can occur at any age. Type 2 diabetes: The most common form of diabetes, which is marked by reduced or less effective insulin. Some cases may be managed with changes to diet along with increased exercise and weight loss. Many require drugs as well—namely oral glucose-lowering drugs that work on the pancreas. Many others require insulin in addition to other treatments.

75
Source: ABS.
Figure G.1: Australia by ASGC Remoteness Area, 2006

76
References
AIHW (Australian Institute of Health and Welfare) 2008. Diabetes: Australian facts 2008. Cat. no. CVD 40. Canberra: AIHW. Begg S, Vos T, Barker B, Stevenson C, Stanley L & Lopez A 2007. The burden of disease and injury in Australia 2003. Canberra: AIHW. Bellantuono C, Tentoni L & Donda P 2004. Antipsychotic drugs and risk of type 2 diabetes: an evidence-based approach. Human Psychopharmacology 19(8):549–558. Chandola T, Brunner E & Marmot M 2006. Chronic stress at work and the metabolic syndrome: prospective study. British Medical Journal 332:521–5. De Domenico M, Yu CF, Taggart J, Harris MF & Powell-Davies PG 2005. Barriers and enablers to the uptake of NIDP diabetes service incentive payments in general practice. Sydney: Centre for General Practice Integration Studies, School of Public Health & Community Medicine, University of New South Wales. Hislop AL, Fegan PG, Schlaepi MJ, Duck M & Yeap BB 2008. Prevalence and associations of psychological distress in young adults with type 1 diabetes. Diabetic Medicine 25(1):91–96. IDF (International Diabetes Federation) 2010. Brussels: IDF. Viewed 1 June 2010, < http://da3.diabetesatlas.org/>. Moussavi S, Chatterjiet S, Verdes E, Tandon A, Patel V and Ustun B 2007. Depression, chronic diseases, and decrements in health: results from the World Health Surveys. The Lancet 370(9590):851–80. Nielsen S 2002. Eating disorders in females with type 1 diabetes: an update of a meta-analysis. European Eating Disorders Review 10(4):241–54. Pan A, Lucas M, Sun Q, van Dam RM, Franco OH, Manson JE et al. 2010. Bidirectional association between depression and type 2 diabetes mellitus in women. Archives of Internal Medicine 170(21):1884–91. Pasquier F, Boulogne A, Leys D & Fontaine P 2006. Diabetes mellitus and dementia. Diabetes and Metabolism 32(5 Pt 1):403–14. WHO (World Health Organization) 2010. Geneva: WHO. Viewed 1 September 2010, <www.who.int/features/qa/62/en/index.html>.

77
List of tables Table 2.1: Summary of definitions, sample size and population estimates by data source ................ 7 Table 3.1: Prevalence of diabetes among people aged 18 years and over, 2007–08 .............................. 9 Table 3.2: Prevalence of medium, high or very high levels of psychological distress in
people aged 18 years and over, 2007-08 .................................................................................. 12 Table 4.1: Age-standardised prevalence of medium, high and very high psychological
distress among people aged 18 years and over, by diabetes status and sex, 2007 and 2007-08 ................................................................................................................................. 19
Table 4.2: Prevalence of a mental disorder among people with diabetes aged 16 to 85 years, by type of disorder, 2007 ............................................................................................... 21
Table 4.3: Age-standardised prevalence of a mental disorder among people aged 16 to 85 years, by diabetes status and sex, 2007 ................................................................................... 22
Table 4.4: Crude prevalence of a mental health problem among women, by diabetes status and age ........................................................................................................................................ 23
Table 4.5: Diabetes hospitalisations with specific mental and behavioural disorders, by type of diabetes and type of disorder, 2007–08 .............................................................................. 26
Table 4.6: Age-standardised proportion of hospitalisations with a mental health condition, by type of diabetes and sex, 2007-08 ....................................................................................... 26
Table 4.7: Age-standardised proportion of hospitalisations with a mental health condition recorded, by diabetes status and sex, 2007-08....................................................................... 27
Table 4.8: People with at least one mental health-related MBS service as a proportion of all people who had at least one MBS service in 2008, by diabetes status and sex (age-standardised) .................................................................................................................... 30
Table A3.1: Prevalence of diabetes among people aged 18 to 85 years, 2007 ......................................... 38 Table A3.2: Hospitalisations with a principal or additional diagnosis of diabetes, 2007-08 ................ 38 Table A3.3: Hospitalisations with a principal or additional diagnosis of diabetes, by type of
diabetes, sex and age, 2007-08 ................................................................................................. 39 Table A3.4: People with at least one diabetes-related MBS service as a proportion of all
people who had at least one MBS service in 2008, by sex and age ..................................... 40 Table A3.5: Prevalence of medium, high or very high levels of psychological distress in
people aged 18 years and over, 2007-08 .................................................................................. 40 Table A3.6: Prevalence of medium, high or very high levels of psychological distress among
people aged 18 to 85 years, 2007 ............................................................................................. 41 Table A3.7: Prevalence of a mental disorder among people aged 16 to 85 years, by age and
sex, 2007 ...................................................................................................................................... 41 Table A3.8: Prevalence of a mental disorder among people aged 16 to 85 years by type of
disorder, sex and age, 2007 ....................................................................................................... 42 Table A3.9: Hospitalisations with a mental health condition recorded, by age and sex, 2007-08 ....... 43 Table A3.10: Hospitalisations with specific mental and behavioural disorders recorded, by
type of disorder and sex, 2007–08 ............................................................................................ 43 Table A3.11: Hospitalisations with specific mental and behavioural disorders recorded, by
type of disorder and age, 2007-08 ............................................................................................ 44 Table A3.12: People with at least one mental health-related MBS service as a proportion of all
people who had at least one MBS service in 2008, by sex and age .................................... 44 Table A4.1: Prevalence of medium, high or very high levels of psychological distress among
people aged 18 years and over, by diabetes status, age and sex, 2007–08 ......................... 45

78
Table A4.2: Prevalence of medium, high or very high levels of psychological distress among people aged 18 to 85 years, by diabetes status, age and sex, 2007 ...................................... 46
Table A4.3: Prevalence of a mental disorder among people aged 16 to 85 years, by diabetes status, age and sex , 2007 .......................................................................................................... 47
Table A4.4: Age-standardised prevalence of affective and anxiety disorders in people aged 16 to 85 years, by diabetes status and sex, 2007 .......................................................................... 48
Table A4.5: Hospitalisations with a mental health condition recorded, by diabetes status, age and sex, 2007–08 ......................................................................................................................... 49
Table A4.6: Diabetes hospitalisations with specific mental and behavioural disorders recorded, by type of disorder and age, 2007–08 .................................................................... 50
Table A4.7: Diabetes hospitalisations with a mental health condition recorded, by type of diabetes, sex and age, 2007–08 ................................................................................................. 51
Table A4.8: Age-standardised proportion of hospitalisations with a mental health condition recorded by type of diabetes and type of mental health condition, 2007-08 ..................... 52
Table A4.9: Age-standardised proportion of hospitalisations with a mental health condition recorded by diabetes status,, type of mental health condition and sex, 2007-08 .............. 52
Table A4.10: People with at least one mental health-related MBS service as a proportion of all people who had at least one MBS service in 2008, by diabetes status, sex and age ......... 53
Table A4.11: Prevalence of medium, high and very high psychological distress among people with diabetes aged 18 years and over, by socio-economic status, 2007 and 2007-08 ........ 54
Table A4.12: Prevalence of a mental disorder among people with diabetes aged 16 to 85 years, by socio-economic status, 2007-08 ........................................................................................... 54
Table A4.13: Diabetes hospitalisations with a mental health condition recorded by socio-economic status and remoteness, 2007-08 .............................................................................. 55
Table A4.14: People with at least one mental health-related MBS service as a proportion of people with at least one diabetes-related MBS service in 2008, by socioeconomic status and remoteness ............................................................................................................... 56
Table A4.15: Crude and age-standardised prevalence of medium, high and very high psychological distress among people with diabetes aged 18 years and over, by health risk factors, 2007 and 2007-08 ....................................................................................... 57
Table A4.16: Crude and age-standardised prevalence of a mental disorder in people with diabetes aged 16 to 85 years, by health risk factors, 2007 ..................................................... 57
Appendix table 2.1: Statistical methods by data source ............................................................................ 58 Appendix table 4.1: Populations with diabetes and poor mental health and wellbeing, by data
source............................................................................................................................. 64 Appendix table 5.1: Questions used to identify people with diabetes in the NHS, NSMHWB
and ALSWH ................................................................................................................. 67 Appendix table 5.2: ICD-10-AM codes for diabetes ................................................................................... 67 Appendix table 5.3: Diabetes-related MBS items used to identify the MBS population with
diabetes ......................................................................................................................... 68 Appendix table 5.4: Questions used to identify people with poor mental health and wellbeing
in the NHS, NSMHWB and ALSWH ........................................................................ 69 Appendix table 5.5: ICD-10-AM codes for mental health condition........................................................ 70 Appendix table 5.6: Mental health-related MBS items used to identify the MBS population
withpoor mental health and wellbeing ..................................................................... 70 Appendix table 5.7: Health risk factors definition in surveys .................................................................. 71

79
List of figures
Figure 3.1: Prevalence of diabetes in people aged 18 years and over, by age, 2007 and 2007–08 ........................................................................................................................................ 10
Figure 3.2: Proportion of hospitalisations with a principal or associated diagnosis of diabetes, by type of diabetes and age, 2007-08 ...................................................................... 11
Figure 3.3: Prevalence of medium, high and very high psychological distress in people aged 18 years and over, by age, 2007 and 2007–08 ................................................................ 13
Figure 3.4: Prevalence of mental disorders in people aged 16 to 85 years, by sex and age, 2007 ............................................................................................................................. 14
Figure 3.5: Proportion of hospitalisations with a mental health condition recorded, by sex and age, 2007–08 ....................................................................................................................... 15
Figure 3.6: People with at least one mental health-related MBS service as a proportion of all people who claimed any MBS service in 2008, by sex and age .......................................... 16
Figure 4.1: Prevalence of medium, high and very high psychological distress among people with diabetes aged 18 years and over, by sex, 2007 and 2007–08 ........................................ 18
Figure 4.2: Age-standardised prevalence of medium, high and very high psychological distress among people aged 18 years and over, by diabetes status and sex, 2007–08 ........................................................................................................................................ 20
Figure 4.3: Prevalence of a mental disorder among people with diabetes aged 16 to 85 years, by sex, 2007 ...................................................................................................................... 21
Figure 4.4: Age-standardised prevalence of affective and anxiety disorders in people aged 16 to 85 years, by diabetes status and sex, 2007 ..................................................................... 23
Figure 4.5: Proportion of diabetes hospitalisations with a mental health condition recorded, by sex and age, 2007–08 ............................................................................................................ 24
Figure 4.6: Proportion of diabetes hospitalisations with a mental health condition, by type of diabetes and age, 2007–08 .................................................................................................... 25
Figure 4.7: Proportion of hospitalisations with a mental health condition recorded, by diabetes status and age, 2007–08.............................................................................................. 27
Figure 4.8: People with at least one mental health-related MBS service as a proportion of people who had at least one diabetes-related MBS service in 2008, by sex and age ................................................................................................................................................ 28
Figure 4.9: People with at least one mental health-related MBS service as a proportion of people who had at least one diabetes-related MBS service in 2008, by diabetes status and age ............................................................................................................................. 29
Figure 4.10: Age-standardised proportion of diabetes hospitalisations with a mental health condition recorded, by socio-economic status, 2007–08 ....................................................... 31
Figure 4.11: People with at least one mental health-related MBS service as a proportion of people with at least one diabetes-related MBS service in 2008, by socioeconomic status ............................................................................................................................................ 32
Figure 4.12: Age-standardised proportion of diabetes hospitalisations with a mental health condition recorded, by region of usual residence, 2007–08 ................................................. 33
Figure 4.13: People with at least one mental health-related MBS service as a proportion of people who had at least one diabetes-related MBS service in 2008, by region of usual residence ........................................................................................................................... 34
Figure G.1: Australia by ASGC Remoteness Area, 2006 ........................................................................... 75