diabetes doc simone 1
TRANSCRIPT

8/13/2019 Diabetes Doc Simone 1
http://slidepdf.com/reader/full/diabetes-doc-simone-1 1/11
Differential effect of hyperglycaemia on the immune response in an
experimental model of diabetes in BALB/cByJ and C57Bl/6J mice:
participation of oxidative stress
M. R. Rubinstein, A. M. Genaro and
M. R. WaldCentro de Estudios Farmacológicos y Botánicos
(CEFYBO), Consejo Nacional de Investigaciones
Científicas y Técnicas (CONICET), Primera
Cátedra de Farmacología, Facultad de Medicina,
Universidad de Buenos Aires (UBA), Buenos
Aires, Argentina
Summary
Diabetes is associated with an increased risk of death from infectious disease.
Hyperglycaemia has been identified as the main factor contributing to the
development of diseases associated with diabetes mellitus. However, experi-
mental evidence indicates individual susceptibility to develop complications
of diabetes. In this context, the aim of this work was to study the immune
response in a streptozotocin-induced type 1 diabetes in two mouse strains:
BALB/cByJ and C57Bl/6J. The participation of hyperglycaemia and oxidative
stress was also analysed. Diabetic BALB/cByJ mice showed a decrease in boththe in-vivo and in-vitro immune responses, whereas diabetic C57Bl/6J mice
had higher blood glucose but exhibited no impairment of the immune
response. The influence of hyperglycaemia over the immune response was
evaluated by preincubation of lymphocytes from normal mice in a high
glucose-containing medium. T and B cells from BALB/cByJ mice showed a
decrease in cell viability and mitogen-stimulated proliferation and an
increase in apoptosis induction. An increase in oxidative stress was impli-
cated in this deleterious effect. These parameters were not affected in the T
and B lymphocytes from C57Bl/6J mice. In conclusion, BALB/cByJ mice were
sensitive to the deleterious effect of hyperglycaemia, while C57BL/6J were
resistant. Although an extrapolation of these results to clinical conditions
must be handled with caution, these results highlight the need to contem-plate the genetic background to establish models to study the deleterious
effect of diabetes in order to understand phenotypical variations that are of
clinical importance in the treatment of patients.
Keywords: BALB/cByJ and C57Bl/6J mice, diabetes, high glucose, immune
response, oxidative stress
Accepted for publication 22 October 2012
Correspondence: M. R. Wald, Paraguay 2155
piso 15, CABA, Buenos Aires, Argentina, CP:
1121ABG.
E-mail: [email protected]
Introduction
Diabetes is widely believed to predispose to serious infec-
tions. Evidence from clinical studies supports a causal rela-
tion between diabetes and infections [1–3]. Individuals with
diabetes might be at a higher risk of moderate or severe
infection-related morbidity caused by altered defence
mechanisms [4–7]. However, while some researchers have
shown that infections are more prevalent and have a higher
case fatality rate among patients with diabetes than among
the general population [8,9], others have not observed such
an association [10]. Despite the clinical importance of this
problem, the mechanisms linking diabetes and immuno-
suppression are not well defined.
Hyperglycaemia has been identified as the main factor
contributing to the development of diseases associated with
diabetes mellitus [11–13]. Concerning the risk of infection,
there are substantial clinical data supporting the hypothesis
that hyperglycaemia influences the susceptibility to, and the
outcome of, infectious disease hospitalization [14–17].
Various pathophysiological and biochemical mechanisms
have been proposed to explain the adverse effects of hyper-
glycaemia. Basic and clinical studies have provided new
insights into the role of oxidative stress, suggesting it as a
bs_bs_banner
Clinical and Experimental Immunology OR I GI NA L A R T I CLE doi:10.1111/cei.12020
319© 2012 British Society for Immunology, Clinical and Experimental Immunology , 171: 319–329

8/13/2019 Diabetes Doc Simone 1
http://slidepdf.com/reader/full/diabetes-doc-simone-1 2/11
key factor in the pathogenesis of diabetes complications
[18,19]. Evidence indicates that hyperglycaemia results in
an excess of reactive oxygen species (ROS) production, cre-
ating a state of oxidative stress [20–22].
In a previous report, we have analysed the immune
response in an animal model of diabetes and the direct
effect of hyperglycaemia on T and B lymphocyte reactivity.We found that diabetes induces an early decrease in
immunoglobulin (Ig)G levels in the secondary immune
response [23]. Preincubation of lymph node and spleen
cells in a high glucose-containing medium leads to a sig-
nificant time- and dose-dependent decrease in T and B cell
proliferation associated with an increase in oxidative stress
[23].
Inbred mice have been used widely as human disease
models. BALB/cByJ (BALB/c) and C57Bl/6J (C57) inbred
mice are useful models to study the effects of genetic differ-
ences in the pathogenesis of many diseases. These two
mouse strains have differences in both innate [24] and
acquired immunity [25], and have been used extensively to
investigate the immunopathogenesis of several intracellular
infections [26–28]. It has also been reported that both
strains show different metabolic responses to a high-fat diet
[29]. Concerning diabetes, the two strains show inherited
differences in the susceptibility to the effects of streptozo-
tocin in the development of hyperglycaemia: C57 are more
susceptible than BALB/c mice [30].
In this context, the aim of this work was to study the
immune response in diabetic mice of the BALB/c and C57
strains. In particular, we analysed the effect of hyperglycae-
mia and oxidative stress in lymphocyte reactivity. For this
purpose, we used the multiple low doses of streptozotocin(MLD-STZ) animal model. Both mouse strains display
chronic stable hyperglycaemia without a requirement for
insulin therapy and have a lifespan similar to that of normal
mice.
Materials and methods
Animals
Inbred female BALB/cByJ and C57Bl/6J mice were pur-
chased from Facultad de Veterinaria, Universidad de Buenos
Aires, Argentina. Sixty-day-old mice weighing between 20
and 25 g at the beginning of the experiments were used.
Mice were maintained on a 12-h light/dark cycle in a room
with controlled temperature (18–22°C). Animals of each
strain were divided randomly into two experimental groups
of 54 animals each. Additional groups of 25 mice of each
strain were used to analyse the in-vitro effect of hypergly-
caemia. Animals were handled in accordance with the prin-
ciples and guidelines of the Guide for the Care and Use of
Laboratory Animals, US National Research (National Insti-
tutes of Health). Experimental protocols were approved by
the Institutional Committee for use and care of Laboratory
Animal (CICUAL, Facultad de Medicina, Universidad de
Buenos Aires, Argentina).
Experimental diabetes
To induce the diabetic state, one daily dose of streptozo-
tocin (STZ, 40 mg/kg; Sigma Aldrich Co., St Louis, MO,USA) was administered intraperitoneally to the mice for 5
consecutive days [23,31]. Blood glucose measurements were
performed with a One Touch Ultra test strip glucometer
(Lifescan; Johnson-Johnson Co., Milpitas, CA, USA; useful
range, 0·02–0·6 g%) in blood samples obtained from mice
through a small skin incision at the tip of the tail. Glycae-
mia was determined after 2 h of fasting. Mice injected with
the vehicle at the same time were used as the respective
controls.
Immunizations
Sheep red blood cells (SRBC) were used as immunogens to
evaluate the T cell-dependent humoral response and
lipopolysaccharide (LPS) (Sigma Aldrich Co.) was used to
determine the T cell-independent humoral response. For
the SRBC response, mice were immunized intraperitoneally
on day 0 and boosted on day 11 with 0·2 ml of 4% SBRC in
saline. Blood samples were collected for antibody determi-
nation on day 10 (primary response) and day 18 (secondary
response). For LPS, each mouse received an intraperito-
neally injection of 10 mg LPS and blood samples were col-
lected on day 10. Mice injected with the vehicles were used
as controls.
Antibody titres
Quantitative enzyme-linked immunosorbent assay (ELISA)
was performed to determine SRBC- and LPS-specific anti-
bodies, as described previously [32]. Briefly, 96-well plates
(MaxiSorp immunoplates; Nunc, Thermo Fisher Scientific,
Langenselbold, Germany) were coated overnight with SRBC
membranes (7·5 mg) or LPS (1 mg). Dilutions of sera were
added and incubated for 2 h at room temperature and then
with a goat immunoglobulin (Ig)G anti-mouse IgM or IgG,
phosphatase alkaline-conjugated (Sigma Aldrich Co.) and
p-nitrophenylphosphate (Sigma Aldrich Co.) as substrate to
develop coloration that was read at 405 nm. Reactions were
considered positive when optical density values were above
the mean value plus 2 standard deviations (s.d.) of normal
sera (sera from non-immunized vehicle-injected mice).
Cell suspensions and culture conditions
Lymphoid cell suspensions from lymph nodes (axil-
lary, inguinal and mesenteric) or spleen were obtained,
as described previously [23]. The cell culture medium
used was RPMI-1640 (Invitrogen, Carlsbad, CA, USA),
M. R. Rubinstein et al .
320 © 2012 British Society for Immunology, Clinical and Experimental Immunology , 171: 319–329

8/13/2019 Diabetes Doc Simone 1
http://slidepdf.com/reader/full/diabetes-doc-simone-1 3/11
containing 0·2 g% glucose (Sigma Aldrich Co.). Briefly,
lymphoid organs were removed aseptically and disrupted
through a 1-mm metal mesh and the resulting cell suspen-
sions were filtered through a 10-mm nylon mesh. After
three washes in RPMI-1640 medium, cells were resus-
pended in RPMI-1640 supplemented with 10% of batch-
tested non-stimulatory fetal bovine serum (Invitrogen),2 mM glutamine (Invitrogen), 100 U/ml penicillin (Invit-
rogen) and 100 mg/ml streptomycin (Invitrogen). To
analyse the effect of high concentrations of glucose,
glucose or mannitol or anti-oxidant was added directly to
the medium in the cell culture to yield the final concentra-
tions indicated in each experiment.
Assessment of cell viability
Cell viability was estimated according to the trypan blue
(Sigma Aldrich Co.) exclusion criteria. Normally, freshly
obtained cell viability was higher than 95%.
Proliferation assay
Cells (1·5 ¥ 106 living cells/ml) were settled at a final volume
of 0·2 ml in 96-well flat-bottomed microtitre plates (Nunc)
in triplicate aliquots and incubated at 37°C in a 5% CO2
atmosphere. The T cell-selective mitogen concanavalin A
(Con A; Sigma Aldrich Co.) and the mitogen selective for B
cells, lipopolysaccharide (LPS) were used [23]. Proliferation
was measured by adding 0·75 mCi [3H]-thymidine (specific
activity: 20 Ci/mmol; Perkin-Elmer, Boston, MA, USA) for
the last 18h of culture. Thymidine incorporation was meas-ured by scintillation counting. The mean of triplicate deter-
minations was calculated for each lectin concentration.
Detection of lymphocyte apoptosis
Apoptosis was estimated by labelling DNA and analysing
chromatin morphology by measuring subdiploid DNA
content by flow cytometric analysis, according to a modifi-
cation of the Nicoletti method [33], as described previously
[23].
Lymph node and spleen cells were harvested after 24 h
incubation, washed and fixed overnight with cold 70%
ethanol. The cells were then stained in the dark for 30 min
at room temperature with propidium iodide (PI) (Sigma
Chemical Co.) and analysed by flow cytometry using a fluo-
rescence activated cell sorter (FACS)can flow cytometer
(Becton Dickinson, Franklin Lakes, NJ, USA) with log
amplification and FACScan research software. For each
sample, 10 000 cells were acquired and analysed using the
WinMDI version 2·9 program. Apoptotic nuclei appeared as
a broad hypodiploid DNA peak which was easily discrimi-
nated from the narrow peak of normal (diploid) DNA
content [23].
Measurement of intracellular reactive oxygen species
(ROS) generation
ROS produced within lymphocytes were detected with the
membrane-permeant probe 2′,7′-dichlorofluorescein diac-
etate (DCFH-DA; Sigma Aldrich Co.) [34]. The lym-
phocytes (1 ¥ 106
living cells) were incubated in the dark with 5 mM DCFH-DA for 15 min at 37°C. The intensity of
dichlorofluorescein (DCF) fluorescence in the supernatant
was measured with an excitation wavelength of 485 nm, and
an emission wavelength of 530 nm (Hitachi F2000 Fluores-
cence Spectrophotometer; Hitachi, Tokyo, Japan). Intracel-
lular ROS production was calculated from a DCF standard
curve (1–40 nmol/ml).
Colorimetric assay for lipid peroxidation
Malondialdehyde (MDA), a marker for lipid peroxidation
formed by the breakdown of polyunsaturated fatty acids,was determined [35]. Lymphocytes (2 ¥ 107 living cells)
were resuspended in 5% trichloroacetic acid and incubated
with 15% trichloroacetic acid, 0·375% thiobarbituric acid
(Sigma Aldrich Co.) and 0·25 N hydrochloric acid. The
samples were heated for 15 min in a boiling waterbath.
After cooling, the flocculent precipitate was removed by
centrifugation and the absorbance in the supernatant was
determined at 535 nm. A standard plot for MDA was pre-
pared using 1,1,3,3-tetraethoxypropane (Sigma Aldrich
Co.).
Measurement of the intracellular total anti-oxidantcapacity (TAC)
TAC within lymphocytes was determined by using the
ABTS [2,2′-azinobis-(3-ethylbenzthiazoline-6-sulphonic
acid)] anti-oxidant assay [36]. Briefly, acetate buffer and the
lymphocyte samples (7 ¥ 106 living cells) were mixed in 96-
well plates (MaxiSorp immunoplates; Nunc) with ABTS+
solution 10 mmol/l (0·549 g of ABTS (MP Biomedicals) in
acetate buffer 30 mmol/l pH 3·6 and 2 mmol/l hydrogen
peroxide). Samples were read at 660 nm on a plate reader.
Results were calculated using a reference curve based on the
anti-oxidant Trolox (Sigma-Aldrich Co) as a standard.
Measurement of glutathione
Glutathione (GSH) analysis was achieved using the GSH
reductase recycling assay as described by Tietze, modified by
Baker [37,38]. Lymphocytes (10 ¥ 107 living cells) were
resuspended in 0·5% trichloroacetic acid, and for quantifi-
cation of oxidized glutathione (GSSG) the samples were
incubated for 1 h with 1 M 3-vinil pyridine, a scavenger
of reduced glutathione (GSH). Then, the reaction mixture
[1 mM 3,3′-dithio-bis(6- nitrobenzoic acid (DTNB)],
Hyperglycaemia and immune response
321© 2012 British Society for Immunology, Clinical and Experimental Immunology , 171: 319–329

8/13/2019 Diabetes Doc Simone 1
http://slidepdf.com/reader/full/diabetes-doc-simone-1 4/11
200 U/ml glutathione reductase (GR), 1 mM nicotinamide
adenine dinucleotide phosphate (NADPH) and 100 mM
sodium phosphate buffer pH 7·5 with 1 mM ethylemedi-
amine tetraacetic acid (EDTA)] was added. Absorbance was
recorded at 2-min intervals for 10 min at 405 nm in an
ELISA plate reader (Bio-Rad, Hercules, CA, USA). Total and
GSSG were determined in each sample in a 96-well microti-tre plate in duplicate. The GSH was calculated as the differ-
ence between the total glutathione and GSSG.
Statistical analysis
Group differences were tested by one- or two-way analyses
of variance (anova), with treatment and time or treatment
and strain as main factors. When the interaction was signifi-
cant, simple effects analysis was carried out. Post-hoc com-
parisons were applied to compare the data between the
groups with the Student–Newman–Keuls (SNK) test. For
antibody titres, the Kruskal–Wallis test was performed fol-
lowing Conover non-parametric post-hoc tests. All tests
were two-sided, and a P -value of 0·05 was considered statis-
tically significant. Statistical and data analyses were per-
formed using GraphPad Prism version 5·00 for Windows
(GraphPad Software, San Diego, CA, USA) and Infostat
Software (Cordoba University, Argentina).
Results
Glucose determination
Hyperglycaemia has been identified as the main factor con-
tributing, through either direct or indirect mechanisms, todiabetic pathogenesis by producing biochemical and meta-
bolic alterations that lead to both functional and structural
alterations. Therefore, we determined glycaemia in both
BALB/c and C57 mice until 6 months of diabetes induction.
As shown in Fig. 1, diabetic mice displayed an increase in
blood glucose concentrations, but C57 showed higher levels
of glucose than BALB/c mice (0·16–0·3 g% versus 0·15–
0·2 g%) (RM anova; main effects: strain F (3,44) = 48·25,
P < 0·0001). However, survival without insulin administra-
tion was similar in both strains.
Antibody production after in-vivo immunization
To investigate if changes in the humoral response are
present in diabetic mice, we examined the antibody produc-
tion after immunization with SRBC (a T cell-dependent
antigen) and LPS (a T cell-independent antigen) at early (15
days and 1 month) and late (6 months) periods of diabetes
induction. To analyse the primary immune response, spe-
cific antibody titres of the IgM type were evaluated. In
BALB/c mice, IgM production after LPS and SRBC immu-
nization was not significantly different between control and
diabetic animals after 15 days and 1 month of diabetes
induction, whereas a significant decrease was observed after
6 months of diabetes induction (Fig. 2a,b). However, during
the secondary response, titres of anti-SRBC IgG were lower
in animals with diabetes than in controls after 1 month of
diabetes induction (Fig. 2c). In contrast, diabetic C57 mice
displayed a decrease in the production of anti-SRBC IgGonly after 6 months of diabetes induction (Fig. 2a–c)
(Kruskal–Wallis test IgM LPS: BALB/c P = 0·0045; C57 P
not significant; IgM GRc: BALB/c P = 0·0093; C57 P not sig-
nificant; IgG GRc: BALB/c P = 0·0084; C57 P = 0·0273).
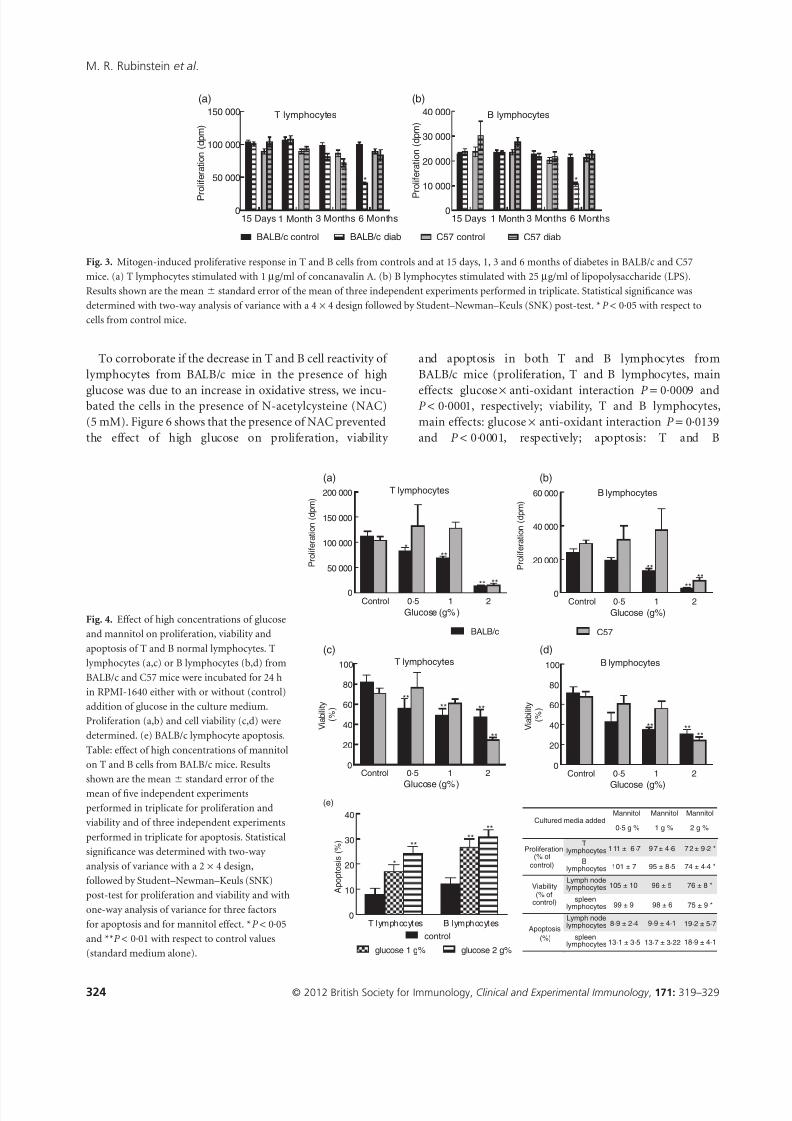
Lymphocyte reactivity
To investigate if in-vivo antibody production is correlated
with in-vitro lymphocyte reactivity, we evaluated the
mitogen-induced T and B cell proliferation. Due to the
well-known lymphoid profile, cell suspension from lymph
nodes was used for the stimulation of the T selective
mitogen ConA, while spleen lymphocyte suspensions were
used to evaluate LPS (B cell selective) mitogen effect. The
maximal proliferation was reached at 1 mg/ml of ConA and
25 mg/ml of LPS for both control and diabetic mice at all
times tested (data not shown). The maximal mitogen-
induced T and B lymphocyte proliferation was altered in
BALB/c diabetic animals 6 months after diabetes induction
(Fig. 3) (simple effect analysis, 6 months, T proliferative
response: P < 0·0001; B proliferative response: P < 0·0001).
However, we found no differences for B and T lymphocyte
reactivity in C57 mice at any of the times tested.
0 50 100 150 200
0·01
0·10
0·15
0·20
0·25
0·30
BALB/c diab C57 diab
**
**** **
** ** **
**** **
**
BALB/c control C57 control
****
** **
**
** ****
** **
**
**
**
##
##
#### ##
#### ##
## ## ##
Days after treatment
G l y c a
e m i a ( g % )
Fig. 1. Glycaemia values in BALB/c and C57 normal and diabetic
mice. Average glycaemia values versus days after streptozotocin
treatment in BALB/c and C57 mice. Data shown are themean standard error of the mean of 12 animals in each group.
Statistical significance was determined with two-way repeated-
measures analysis of variance with a 4 ¥ 12 design followed by
Student–Newman–Keuls (SNK) post-test. **P < 0·01 with respect to
control mice; ##P < 0·01 with respect to BALB/c diabetic mice.
M. R. Rubinstein et al .
322 © 2012 British Society for Immunology, Clinical and Experimental Immunology , 171: 319–329

8/13/2019 Diabetes Doc Simone 1
http://slidepdf.com/reader/full/diabetes-doc-simone-1 5/11
Effect of high glucose on in-vitro lymphocyte
proliferation
In order to gain insight into the potential mechanisms
involved in this alteration, we then evaluated the influence
of hyperglycaemia on the immune response. Lymph node
and spleen lymphocytes isolated from normal BALB/c and
C57 mice were exposed to media containing increasing con-
centrations of glucose for 24 h. After these treatments,
viability, apoptosis and mitogen-induced proliferative
response were determined. As seen in Fig. 4, after 24 h of
culture with high glucose concentrations, T and B lym-
phocytes from BALB/c mice showed a significant decreasein mitogen-stimulated proliferation (Fig. 4a,b, simple effect
analysis, T and B proliferative response: P < 0·0001 for each
one) and cell viability (Fig. 4c,d, simple effect analysis, T
and B proliferative response: P < 0·0001 for each one) and
an increase in apoptosis induction (Fig. 4e, T lymphocytes:
P = 0·0061; B lymphocytes: P = 0·0028). Interestingly, these
parameters were not affected in T and B lymphocytes from
normal C57 mice exposed to 0·5 and 1 g% of glucose;
however, a significant decrease was found with 2 g% of
glucose (Fig. 4). Unlike d-glucose, 0·5 and 1 g% of mannitol
did not change T and B cell proliferation, viability or apop-
tosis in BALB/c lymphocytes when compared with controls,but with 2 g% of mannitol a significant alteration of these
parameters was observed (Table in Fig. 4). Similar results
were observed in C57 mice. These findings suggest that the
effect of 0·5 and 1 g% of glucose, but not of 2 g%, is not the
result of high osmolarity. Thus, the following studies were
performed with 0·5 and 1 g% of glucose.
Oxidative stress participation in hyperglycaemia effects
Oxidative stress in lymph node and spleen lymphocytes was
analysed by the detection of ROS and by the measurement
of lipid peroxidation performed by MDA production. After
24 h incubation with high glucose, T and B lymphocytes
from BALB/c but not from C57 mice showed an increase in
ROS production (simple effect analysis, T lymphocytes and
B lymphocytes: BALB/c P < 0·0001; C57 P not significant
for each one) and lipid peroxidation (MDA production:
simple effect analysis, T lymphocytes: BALB/c P = 0·0026;
C57 P not significant; B lymphocytes: BALB/c P = 0·0002;
C57 P not significant) in comparison with control cells
(Fig. 5). When the same concentration of mannitol was
used, no enhancement of oxidative stress was observed
(data not shown).
Anti-LPS IgM
15 Days 1 Month 6 Months
0
1
2
3
*
- l o g t i t r e
Anti-SRBC IgM
15 Days 1 Month 6 Months
0
1
2
3
*
- l o g t i t r e
Anti-SRBC IgG
15 Days 1 Month 6 Months
0
1
2
3
4
*
*
*
- l o g t i t r e
BALB/c control BALB/c diab
C57 control C57 diab
(a)
(b)
(c)
Fig. 2. Antibody production following sheep red blood cells (SRBC)
and lipopolysaccharide (LPS) immunization in BALB/c and C57
control and diabetic mice. Antibody titres in controls and at 15 days, 1
month and 6 months after diabetes induction in BALB/c and C57
mice. (a) Anti-LPS immunoglobulin (Ig)M production. (b)
Anti-SRBC IgM production. (c) Anti-SRBC IgG production. Data
shown are the mean standard error of the mean of three animals in
each group. Statistical significance was determined with theKruskal–Wallis test followed by Conover post-test. *P < 0·05 with
respect to control mice.
Hyperglycaemia and immune response
323© 2012 British Society for Immunology, Clinical and Experimental Immunology , 171: 319–329
8/13/2019 Diabetes Doc Simone 1
http://slidepdf.com/reader/full/diabetes-doc-simone-1 6/11
To corroborate if the decrease in T and B cell reactivity of
lymphocytes from BALB/c mice in the presence of high
glucose was due to an increase in oxidative stress, we incu-bated the cells in the presence of N-acetylcysteine (NAC)
(5 mM). Figure 6 shows that the presence of NAC prevented
the effect of high glucose on proliferation, viability
and apoptosis in both T and B lymphocytes from
BALB/c mice (proliferation, T and B lymphocytes, main
effects: glucose ¥ anti-oxidant interaction P = 0·0009 andP < 0·0001, respectively; viability, T and B lymphocytes,
main effects: glucose ¥ anti-oxidant interaction P = 0·0139
and P < 0·0001, respectively; apoptosis: T and B
T lymphocytes
15 Days 1 Month 3 Months 6 Months0
50 000
100 000
150 000
*
P r o l i f e r a t i o n ( d p m )
B lymphocytes
15 Days 1 Month 3 Months 6 Months0
10 000
20 000
30 000
40 000
*
P
r o l i f e r a t i o n ( d p m )
BALB/c control BALB/c diab C57 control C57 diab
(a) (b)
Fig. 3. Mitogen-induced proliferative response in T and B cells from controls and at 15 days, 1, 3 and 6 months of diabetes in BALB/c and C57
mice. (a) T lymphocytes stimulated with 1 mg/ml of concanavalin A. (b) B lymphocytes stimulated with 25 mg/ml of lipopolysaccharide (LPS).
Results shown are the mean standard error of the mean of three independent experiments performed in triplicate. Statistical significance was
determined with two-way analysis of variance with a 4 ¥ 4 design followed by Student–Newman–Keuls (SNK) post-test. *P < 0·05 with respect to
cells from control mice.
T lymphocytes
Control 0·5 1 2
50 000
0
100 000
150 000
200 000
(a) (b)
(d)(c)
(e)
**
**
*
**
Glucose (g%)
P r o l i f e r a t i o n ( d p m )
B lymphocytes
Control 0·5 1 20
20 000
40 000
60 000
**
**
**
Glucose (g%)
P r o l i f e r a t i o n ( d p m )
T lymphocytes
Control 0·5 1 20
20
40
60
80
100
** **
**
**
Glucose (g%)
V i a b i l i t y
( % )
B lymphocytes
Control 0·5 1 20
20
40
60
80
100
** ****
Glucose (g%)
V i a b i l i t y
( % )
T lymphocytes B lymphocytes0
10
20
30
40
control
glucose 1 g% glucose 2 g%
****
*
**
A p o p t o s i s ( % )
BALB/c C57
Cultured media addedMannitol
0·5 g %
Mannitol
1 g %
Mannitol
2 g %
Tlymphocytes 111 ± 6 ·7 97 ± 4 ·6 72 ± 9 ·2 *Proliferation
(% ofcontrol)
Blymphocytes 101 ± 7 95 ± 8·5 74 ± 4·4 *
75 ± 9 *
Lymph nodelymphocytes 105 ± 10 96 ± 5
9·9 ± 4·1
13·7 ± 3·22
98 ± 699 ± 9
8·9 ± 2·4
13·1 ± 3·5
76 ± 8 *Viability(% of
control) spleenlymphocytes
Lymph nodelymphocytes 19·2 ± 5·7
18·9 ± 4·1
Apoptosis
(%) spleenlymphocytes
Fig. 4. Effect of high concentrations of glucose
and mannitol on proliferation, viability and
apoptosis of T and B normal lymphocytes. T
lymphocytes (a,c) or B lymphocytes (b,d) from
BALB/c and C57 mice were incubated for 24 h
in RPMI-1640 either with or without (control)
addition of glucose in the culture medium.
Proliferation (a,b) and cell viability (c,d) were
determined. (e) BALB/c lymphocyte apoptosis.
Table: effect of high concentrations of mannitol
on T and B cells from BALB/c mice. Results
shown are the mean standard error of the
mean of five independent experiments
performed in triplicate for proliferation and
viability and of three independent experiments
performed in triplicate for apoptosis. Statistical
significance was determined with two-way
analysis of variance with a 2 ¥ 4 design,
followed by Student–Newman–Keuls (SNK)
post-test for proliferation and viability and with
one-way analysis of variance for three factors
for apoptosis and for mannitol effect. *P < 0·05
and **P < 0·01 with respect to control values
(standard medium alone).
M. R. Rubinstein et al .
324 © 2012 British Society for Immunology, Clinical and Experimental Immunology , 171: 319–329

8/13/2019 Diabetes Doc Simone 1
http://slidepdf.com/reader/full/diabetes-doc-simone-1 7/11
T lymphocytes
Control 0·5 10
2
4
6
8
10
**
(a) (b)
(c) (d)
**
Glucose (g%)
R O
S p r o d u c t i o n
( n m o l D C F / 1 0 6
c e l l s )
B lymphocytes
Control 0·5 10
2
4
6
8
10
**
**
Glucose (g%)
R O
S p r o d u c t i o n
( n m o l D C F / 1 0 6
c e l l s )
T lymphocytes
Control 0·5 10·0
0·2
0·4
0·6
0·8
**
Glucose (g%)
M D A p r o d u c t i o n
( n
m o l M D A / 1 0 7
c e l l s )
B lymphocytes
Control 0·5 10·0
0·5
1·0
1·5
2·0
2·5
Glucose (g%)
**
M D A p r o d u c t i o n
( n
m o l M D A / 1 0 7
c e l l s )
BALB/c C57
Fig. 5. Effect of high concentrations of glucoseon oxidative stress. Reactive oxygen species
(ROS) production and lipid peroxidation.
Lymph node (a,c) and spleen (b,d) lymphocytes
from BALB/c and C57 mice were incubated for
24 h in RPMI-1640 either with or without
(control) addition of glucose in the culture
medium. ROS (a,b) or malondialdehyde (MDA)
production (as a measure of lipid peroxidation)
(c,d) were determined. Data shown are the
mean standard error of the mean of five
independent experiments performed in
duplicate. Statistical significance was
determined with two-way analysis of variance
with a 2 ¥ 3 design followed by Student–Newman–Keuls (SNK) post-test.
**P < 0·01with respect to control values.
T lymphocytes
Control 0·5 10
50 000
100 000
150 000
(a) (b)
(c) (d)
(e) (f)
** **
**
Glucose (g%)
P r o l i f e r a t i o n ( d p m )
B lymphocytes
Control 0·5 10
10 000
20 000
30 000
**
Glucose (g%)
P r
o l i f e r a t i o n ( d p m )
T lymphocytes
Control 0·5 1
0
50
100
150
****
Glucose (g%)
V i a b i l i t y ( % )
B lymphocytes
Control 0·5 1
0
20
40
60
80
100
****
Glucose (g%)
V i a b i l i t y ( % )
T lymphocytes
Control 0·5 10
5
10
15
20
25
**
**
Glucose (g%)
A p o p t o s i s ( % )
B lymphocytes
Control 0·5 10
10
20
30
**
**
Glucose (g%)
A p o p t o s i s ( % )
– NAC + NAC
Fig. 6. N-acetylcysteine (NAC) action on the
effect of high glucose on mitogen-induced
proliferative response, viability and apoptosis in
T and B cells from normal BALB/c mice. Lymph
node (a,c,e) and spleen lymphocytes (b,d,f)
from BALB/c mice were incubated for 24 h in
RPMI-1640 either with or without (control)
the addition of glucose or NAC in the culture
medium. Proliferation (a,b), cell viability (c,d)
and apoptosis (e,f) were determined. Results
shown are the mean standard error of the
mean of five independent experiments
performed in triplicate for proliferation and
viability and of three independent experiments
performed in triplicate for apoptosis. Statistical
significance was determined with two-way
analysis of variance with a 2 ¥ 3 design followed
by simple effects analysis. **P < 0·01 with
respect to control values.
Hyperglycaemia and immune response
325© 2012 British Society for Immunology, Clinical and Experimental Immunology , 171: 319–329

8/13/2019 Diabetes Doc Simone 1
http://slidepdf.com/reader/full/diabetes-doc-simone-1 8/11

8/13/2019 Diabetes Doc Simone 1
http://slidepdf.com/reader/full/diabetes-doc-simone-1 9/11
both functional and structural alterations [11–13,44]. In
fact, in a previous work, we have observed a negative corre-
lation between plasma glucose levels and T and B cell prolif-
eration [45]. Diabetic BALB/c mice exposed to chronic mild
stress had a sustained increase in blood glucose levels. In
these animals, a decrease in T and B cell proliferation was
observed earlier, after 3 and 6 weeks under stress exposure,respectively [45]. We have also reported previously that
in-vitro high glucose levels can alter the reactivity of both
normal T and B lymphocytes in a time- and concentration-
dependent interaction manner [23]. In addition, we have
observed that the presence of high glucose in lymph node
and spleen lymphocyte cultures decreases cell viability with
a higher percentage of apoptotic cells. We have also found
that an increase in oxidative stress, in particular an excess
of reactive oxygen species (ROS) production, would be
implicated in these deleterious effects [23]. Under normal
conditions, these toxic species are produced by cellular
metabolism and neutralized by endogenous anti-oxidant
defences. However, in adverse conditions, such as hypergly-
caemia, cellular defences might be insufficient, leading to
damage of cellular components [46]. Glutathione (GSH,
L-glutamyl-L-cysteinyl-glycine) is the most abundant non-
protein thiol in mammalian cells and is one of the major
cellular defences against ROS and free radicals [47]. GSH is
essential for cell survival and has been implicated as an
important regulator of T cell function and proliferation
[39]. Furthermore, GSH depletion is necessary for lym-
phocyte apoptosis [47]. N-acetylcysteine (NAC) is a small
thiol compound that leads to increased glutathione levels
[39]. In this study we found that co-incubation with the
anti-oxidant NAC prevented the deleterious effects of highglucose.
Interestingly, diabetic C57 mice showed impaired IgG
production only after 6 months of diabetes induction.
These results indicate that although diabetic C57 mice
have higher plasma glucose levels than BALB/c mice, the
immune response is less affected. In addition, lymphocyte
reactivity was not altered at this time. In accordance with
these findings, proliferation, viability and apoptosis were
not altered by high glucose incubation. Moreover, we did
not find an increase in oxidative stress under this condition.
To assess the involvement of anti-oxidant mechanisms, we
determined the TAC of lymphocytes. In the presence of
high glucose, BALB/c lymphocytes show a decrease in TAC;
however, an increment was observed in those from C57.
The same pattern of response was observed for the
GSH : GSSG ratio. Changes in the intracellular GSH : GSSG
balance are considered major determinants in the redox
status/cell signalling [48]. Taking these results into account,
it can be postulated that the increase in the GSH : GSSG
ratio observed in lymphocytes from C57 mice may consti-
tute a mechanism of protection against the deleterious
effects of oxidative stress induced by high glucose. Consist-
ent with this observation, an up-regulation of anti-oxidant
enzymes was reported as an adaptation to oxidative stress
during the formation of acquired bleomycin resistance in a
cell line [49]. However, the involvement of other anti-
oxidant mechanisms that would protect C57 lymphocytes
cannot be ruled out. Further studies are necessary to eluci-
date the precise biochemical and molecular mechanisms
involved.In conclusion, BALB/cByJ mice are more sensitive to the
deleterious effect of hyperglycaemia on the immune
response than C57Bl/6J mice. Qi et al . [50] characterized
the severity of diabetic nephropathy in six inbred mouse
strains, including C57Bl/6J, DBA/2J, FVB/NJ, MRL/MpJ, A/J
and KK/HlJ mice, by inducing diabetes by multiple low-
dose streptozotocin injection and found that KK/HlJ mice
seemed to be relatively resistant to STZ-induced hypergly-
caemia with lower levels of blood glucose. Without insulin
supplementation, most diabetic mice survived for more
than 25 weeks. After that, the mortality increased in most
strains studied, especially in DBA/2J, KK/HlJ and A/J mice.
In contrast, C57Bl/6J mice seemed to tolerate persistent
hyperglycaemia well, with a group of diabetic C57Bl/6J
mice surviving for longer than 45 weeks despite fasting
glucose levels of 0·3–0·6 g%. With respect to renal injury,
DBA/2J and KK/HlJ mice developed significantly more
albuminuria than C57Bl/6J, MRL/MpJ and A/J mice. These
results highlight the need to contemplate the genetic back-
ground in order to establish models to study the deleterious
effect of diabetes. These results also open the possibility of
using mouse models to map genes for susceptibility to dif-
ferent diabetic complications. Nowadays, individual vari-
ability is an important challenge in current clinical practice
and phenotypical variations are of clinical importance inthe treatment of patients. Knowledge of the genetic deter-
minants of the disease pathogenesis is not always available.
Although the extrapolation of these results to clinical con-
ditions should be handled with caution, it is important to
emphasize the importance of conducting studies with large
samples that can provide better estimates of the magnitude
of the genetic contributions to major individual variability,
and deliver solid results to decision-making in clinical prac-
tice, both preventive and therapeutic.
Acknowledgements
This study was supported by grants from CONICET, PIP
11220080100281. The authors wish to thank Daniel
Gonzalez and Marcela Marquez for their valuable help in
the animal care, María Rosa Gonzalez Murano for technical
support and Patricia Fernandez for secretarial assistance.
We thank LifeScan Argentina for supplying One Touch
Ultra strips for the glucometer.
Disclosure
The authors declare that there are no conflicts of interest.
Hyperglycaemia and immune response
327© 2012 British Society for Immunology, Clinical and Experimental Immunology , 171: 319–329

8/13/2019 Diabetes Doc Simone 1
http://slidepdf.com/reader/full/diabetes-doc-simone-1 10/11
References
1 Peleg AY, Weerarathna T, McCarthy JS, Davis TM. Common
infections in diabetes: pathogenesis, management and relationship
to glycaemic control. Diabetes Metab Res Rev 2007; 23:3–13.
2 Joshi N, Caputo GM, Weitekamp MR, Karchmer AW. Infections in
patients with diabetes mellitus. N Engl J Med 1999; 341:1906–12.
3 Pozzilli P, Leslie RD. Infections and diabetes: mechanisms andprospects for prevention. Diabet Med 1994; 11:935–41.
4 Shah BR, Hux JE. Quantifying the risk of infectious diseases for
people with diabetes. Diabetes Care 2003; 26:510–3.
5 Boyko EJ, Fihn SD, Scholes D, Abraham L, Monsey B. Risk
of urinary tract infection and asymptomatic bacteriuria among
diabetic and nondiabetic postmenopausal women. Am J Epide-
miol 2005; 161:557–64.
6 Muller LM, Gorter KJ, Hak E et al . Increased risk of common
infections in patients with type 1 and type 2 diabetes mellitus.
Clin Infect Dis 2005; 41:281–8.
7 Bertoni AG, Saydah S, Brancati FL. Diabetes and the risk of
infection-related mortality in the US. Diabetes Care 2001;
24:1044–9.8 Marrie TJ. Bacteraemic pneumococcal pneumonia: a continuously
evolving disease. J Infect 1992; 24:247–55.
9 Watanakunakorn C, Bailey TA. Adult bacteremic pneumococcal
pneumonia in a community teaching hospital, 1992–1996. A
detailed analysis of 108 cases. Arch Intern Med 1997; 157:1965–
71.
10 Thomsen RW, Hundborg HH, Lervang HH, Johnsen SP, Sorensen
HT, Schonheyder HC. Diabetes and outcome of community-
acquired pneumococcal bacteremia: a 10-year population-based
cohort study. Diabetes Care 2004; 27:70–6.
11 The Diabetes Control and Complications Trial Research Group
(DCCT). The effect of intensive treatment of diabetes on the
development and progression of long-term complications in
insulindependent diabetes mellitus. N Engl J Med 1993; 329:977–86.
12 The Diabetes Control and Complications Trial Research Group
(DCCT). Intensive diabetes treatment and cardiovascular disease
in patients with type 1 diabetes. N Engl J Med 2005; 353:2643–53.
13 UK Prospective Diabetes Study Group. Intensive blood-glucose
control with sulphonylureas or insulin compared with conven-
tional treatment and risk of complications in patients with type 2
diabetes (UKPDS 33). Lancet 1998; 352:854–65.
14 McMahon MM, Bistrian BR. Host defenses and susceptibility to
infection in patients with diabetes mellitus. Infect Dis Clin North
Am 1995; 9:1–9.
15 Benfield T, Jensen JS, Nordestgaard BG. Influence of diabetes
and hyperglycaemia on infectious disease hospitalisation and
outcome. Diabetologia 2007; 50:549–54.
16 Butler SO, Btaiche IF, Alaniz C. Relationship between hyperglyc-
emia and infection in critically ill patients. Pharmacotherapy
2005; 25:963–76.
17 Latham R, Lancaster AD, Covington JF, Pirolo JS, Thomas CS.
The association of diabetes and glucose control with surgical-site
infections among cardiothoracic surgery patients. Infect Control
Hosp Epidemiol 2001; 22:607–12.
18 Baynes JW. Role of oxidative stress in the development of compli-
cations in diabetes. Diabetes 1991; 40:405–12.
19 Rosen P, Nawroth PP, King G, Moller W, Tritschler HJ, Packer L.
The role of oxidative stress in the onset and progression of
diabetes and its complications: a summary of a Congress Series
sponsored by UNESCO-MCBN, the American Diabetes Associa-
tion and the German Diabetes Society. Diabetes Metab Res Rev
2001; 17:189–212.
20 Brownlee M. Biochemistry and molecular cell biology of diabetic
complications. Nature 2001; 414:813–20.
21 Ceriello A, Bortolotti N, Crescentini A et al . Antioxidant defenses
are reduced during the oral glucose tolerance test in normal andnon-insulin-dependent diabetic subjects. Eur J Clin Invest 1998;
28:329–33.
22 Vincent AM, Russell JW, Low P, Feldman EL. Oxidative stress
in the pathogenesis of diabetic neuropathy. Endocr Rev 2004;
25:612–28.
23 Rubinstein R, Genaro AM, Motta A, Cremaschi G, Wald MR.
Impaired immune responses in streptozotocin-induced type I dia-
betes in mice. Involvement of high glucose. Clin Exp Immunol
2008; 154:235–46.
24 Watanabe H, Numata K, Ito T, Takagi K, Matsukawa A. Innate
immune response in Th1- and Th2-dominant mouse strains.
Shock 2004; 22:460–66.
25 Guiñazú N, Pellegrini A, Giordanengo L et al . Immune responseto a major Trypanosoma cruzi antigen, cruzipain, is differentially
modulated in C57BL/6BL/6 and BALB/c mice. Microbes Infect
2004; 6:1250–58.
26 Ulett GC, Ketheesan N, Hirst RG. Cytokine gene expression in
innately susceptible BALB/c mice and relatively resistant C57BL/6
mice during infection with virulent burkholderia pseudomalle.
Infect Immun 2000; 68:2034–42.
27 Roggero E, Pérez AR, Bottasso OA, Besedovsky HO, Del Rey A.
Neuroendocrine-immunology of experimental Chagas’ disease.
Ann NY Acad Sci 2009; 1153:264–71.
28 Autenrieth IB, Beer M, Bohn E, Kaufmann SH, Heesemann J.
Immune responses to Yersinia enterocolitica in susceptible BALB/c
and resistant C57BL/6 mice: an essential role for gamma inter-
feron. Infect Immun 1994; 62:2590–9.29 Nishikawa S, Yasoshima A, Doi K, Nakayama H, Uetsuka K.
Involvement of sex, strain and age factors in high fat diet-induced
obesity in C57BL/6J and BALB/cA mice. Exp Anim 2007; 56:263–
72.
30 Herold KC, Baumann E, Vezys V, Buckingham F. Expression
and immune response to islet antigens following treatment with
low doses of streptozotocin in H-2d mice. J Autoimmun 1997;
10:17–25.
31 Like AA, Rossini AA. Streptozotocin-induced pancreatic insulitis:
new model of diabetes mellitus. Science 1976; 193:415–17.
32 Silberman DM, Wald MR, Genaro AM. Acute and chronic stress
exert opposing effects on antibody responses associated with
changes in stress hormone regulation of T-lymphocyte reactivity.
J Neuroimmunol 2003; 144:53–60.
33 Nicolletti I, Migliorati G, Pagliacci MC, Grignani F, Riccardi C. A
rapid and simple method for measuring thymocyte apoptosis by
propidium iodide staining and flow cytometry. J Immunol
Methods 1991; 139:271–9.
34 Bass DA, Parce JW, Dechatelet LR, Szejda P, Seeds MC, Thomas
M. Flow cytometric studies of oxidative product formation
by neutrophils: a graded response to membrane stimulation.
J Immunol 1983; 130:1910–7.
35 Buege JA, Aust SD. Microsomal lipid peroxidation. Methods
Enzymol 1979; 52:302–10.
36 Erel O. A novel automated direct measurement method for total
M. R. Rubinstein et al .
328 © 2012 British Society for Immunology, Clinical and Experimental Immunology , 171: 319–329

8/13/2019 Diabetes Doc Simone 1
http://slidepdf.com/reader/full/diabetes-doc-simone-1 11/11
antioxidant capacity using a new generation, more stable ABTS
radical cation. Clin Biochem 2004; 37:277–85.
37 Tietze F. Enzymic method for quantitative determination of
nanogram amounts of total and oxidized glutathione. Anal
Biochem 1968; 27:502–22.
38 Baker MA, Cerniglia GJ, Zaman A. Microtiter plate assay for the
measurement of glutathione and glutathione disulfide in large
numbers of biological samples. Anal Biochem 1990; 90:360–5.39 Hadzic T, Li L, Cheng N, Walsh SA, Spitz DR, Knudson CM. The
role of low molecular weight thiols in T lymphocyte proliferation
and IL-2 secretion. J Immunol 2005; 175:7965–72.
40 Eibl N, Spatz M, Fischer GF et al . Impaired primary immune
response in type-1 diabetes: results from a controlled vaccination
study. Clin Immunol 2002; 103:249–59.
41 Spatz M, Eibl N, Hink S et al . Impaired primary immune response
in type-1 diabetes. Functional impairment at the level of APCs
and T-cells. Cell Immunol 2003; 221:15–26.
42 Saiki O, Negoro S, Tsuyuguchi I, Yamamura Y. Depressed immu-
nological defence mechanisms in mice with experimentally
induced diabetes. Infect Immun 1980; 28:127–31.
43 Sakowicz-Burkiewicz M, Kocbuch K, Grden M, Szutowicz A,Pawelczyk T. Diabetes-induced decrease of adenosine kinase
expression impairs the proliferation potential of diabetic rat T
lymphocytes. Immunology 2006; 118:402–12.
44 Stratton IM, Adler AI, Neil HA et al . on behalf of the UK Prospec-
tive Diabetes Study Group. Association of glycaemia with macrov-
ascular and microvascular complications of type 2 diabetes
(UKPDS 35): prospective observational study. BMJ 2000;
321:405–12.
45 Rubinstein MR, Cremaschi GA, Oliveri LM, Gerez EN,
Wald MR, Genaro AM. Possible involvement of stress
hormones and hyperglycaemia in chronic mild stress-inducedimpairment of immune functions in diabetic mice. Stress 2010;
13:384–91.
46 Burdon RH. Superoxide and hydrogen peroxide in relation to
mammalian cell proliferation. Free Radic Biol Med 1995; 18:775–
94.
47 Franco R, Cidlowski JA. Apoptosis and glutathione: beyond an
antioxidant. Cell Death Differ 2009; 16:1303–14.
48 Jones DP. Redefining oxidative stress. Antioxid Redox Signal 2006;
8:1865–79.
49 Yen HC, Li SH, Majima HJ et al . Up-regulation of antioxidant
enzymes and coenzyme Q(10) in a human oral cancer cell line
with acquired bleomycin resistance. Free Radic Res 2011; 45:707–
16.50 Qi Z, Fujita H, Jin J et al . Characterization of susceptibility of
inbred mouse strains to diabetic nephropathy. Diabetes 2005;
54:2628–37.
Hyperglycaemia and immune response
329© 2012 British Society for Immunology, Clinical and Experimental Immunology , 171: 319–329