diagnose, detect, optimise: from an overall site view, down to section-level analyses
TRANSCRIPT

12/02/2014
DIAGNOSE, DETECT, OPTIMISEFROM AN OVERALL SITE VIEW, DOWN TO SECTION-
LEVEL ANALYSES
Marion Joffre – Product Manager
Florian Rieupet – Product Manager
1

AGENDA
› Focus – AT Internet’s structure
› Business examples
› Live demo:
› How to benefit from it in just 2 clicks in Data Query
› Build a section by section dashboard
› Questions
› Survey
2

AT INTERNET’S STRUCTURE
3

AT INTERNET’S STRUCTURE
4
A COMPLEMENTARY VISION
Global performance at a
glance
Volume of data +++
Level 1

AT INTERNET’S STRUCTURE
5
A COMPLEMENTARY VISION
0
100
200
300
400
500
600
01/0
1/2
01
5
02/0
1/2
01
5
03/0
1/2
01
5
04/0
1/2
01
5
05/0
1/2
01
5
06/0
1/2
01
5
07/0
1/2
01
5
08/0
1/2
01
5
09/0
1/2
01
5
10/0
1/2
01
5
11/0
1/2
01
5
12/0
1/2
01
5
13/0
1/2
01
5
14/0
1/2
01
5
15/0
1/2
01
5
16/0
1/2
01
5
17/0
1/2
01
5
18/0
1/2
01
5
19/0
1/2
01
5
20/0
1/2
01
5
21/0
1/2
01
5
22/0
1/2
01
5
23/0
1/2
01
5
24/0
1/2
01
5
25/0
1/2
01
5
26/0
1/2
01
5
27/0
1/2
01
5
28/0
1/2
01
5
29/0
1/2
01
5
30/0
1/2
01
5
31/0
1/2
01
5
Pages visits
Average

AT INTERNET’S STRUCTURE
6
A COMPLEMENTARY VISION
0
200
400
600
800
1000
1200
01/0
1/2
01
5
02/0
1/2
01
5
03/0
1/2
01
5
04/0
1/2
01
5
05/0
1/2
01
5
06/0
1/2
01
5
07/0
1/2
01
5
08/0
1/2
01
5
09/0
1/2
01
5
10/0
1/2
01
5
11/0
1/2
01
5
12/0
1/2
01
5
13/0
1/2
01
5
14/0
1/2
01
5
15/0
1/2
01
5
16/0
1/2
01
5
17/0
1/2
01
5
18/0
1/2
01
5
19/0
1/2
01
5
20/0
1/2
01
5
21/0
1/2
01
5
22/0
1/2
01
5
23/0
1/2
01
5
24/0
1/2
01
5
25/0
1/2
01
5
26/0
1/2
01
5
27/0
1/2
01
5
28/0
1/2
01
5
29/0
1/2
01
5
30/0
1/2
01
5
31/0
1/2
01
5
Visits per page
Page A
Page B
Average
An average is not always meaningful

AT INTERNET’S STRUCTURE
7
A COMPLEMENTARY VISION
Sub-sections
Micro visionLevel 2

AT INTERNET’S STRUCTURE
8
A COMPLEMENTARY VISION
Vision per
sub-
sections,
etc…
Chapter, sub
chapter,
pages

BUSINESS EXAMPLES
9
BUSINESS EXAMPLES
10
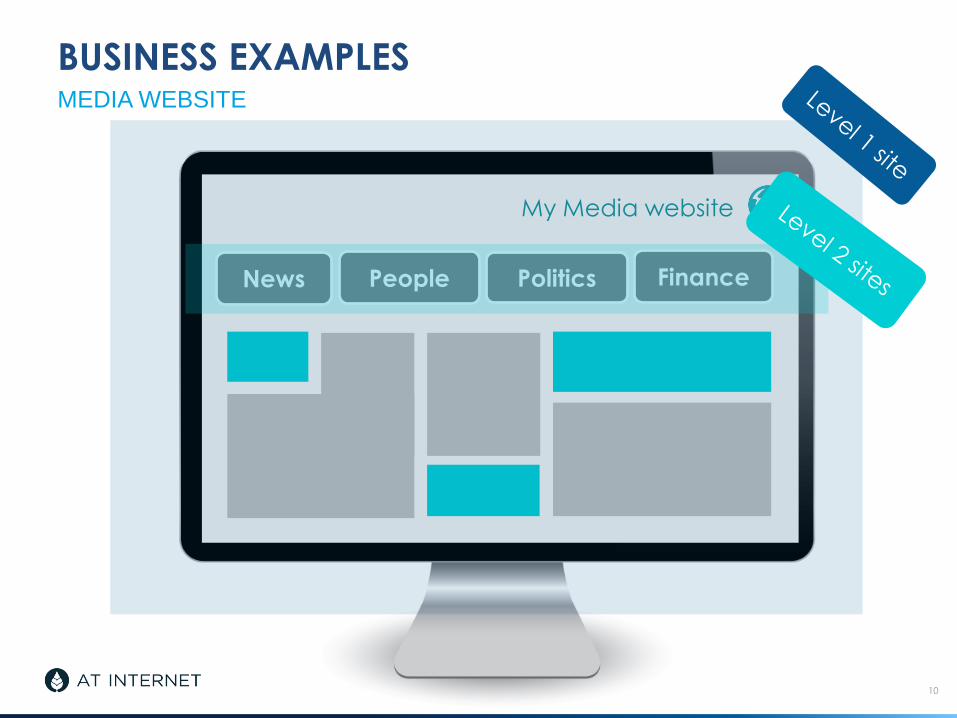
MEDIA WEBSITE
News People Politics Finance
My Media website

BUSINESS EXAMPLES
› Global analysis
11
MEDIA WEBSITE
Sources Visits
Direct traffic 800 000
Search engines 450 000
Social network 345 000
Referrer sites 180 000
Others 150 000
Total 1 925 000
Level 1 site

BUSINESS APPLICATION
12
MEDIA WESITE
finance
People
News
Sources Visits
Google News 700 500
Bing 450 000
Email Marketing 315 000
Sources Visits
News section 140 000
Yahoo search engine
65 000
Rss feed 28 000
Sources Visits
Facebook 230 000
Direct traffic 180 000
Email Marketing 86 000
BUSINESS APPLICATION
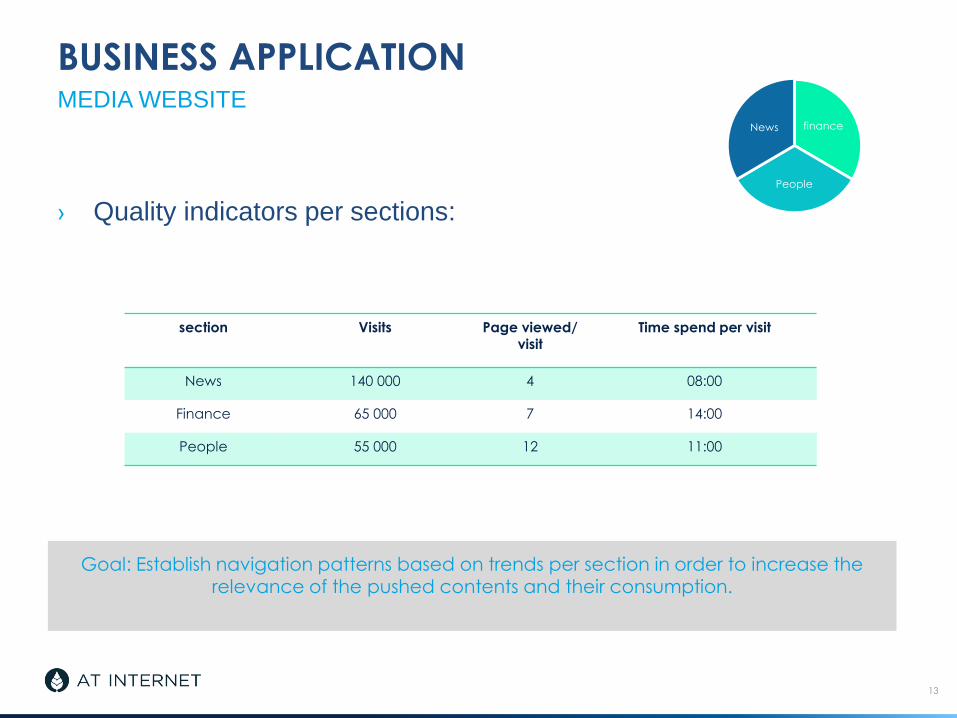
› Quality indicators per sections:
13
MEDIA WEBSITEfinance
People
News
section Visits Page viewed/ visit
Time spend per visit
News 140 000 4 08:00
Finance 65 000 7 14:00
People 55 000 12 11:00
Goal: Establish navigation patterns based on trends per section in order to increase the relevance of the pushed contents and their consumption.

BUSINESS APPLICATION
› Transverse analysis
14
MEDIA WEBSITE
finance
News
people
website
finance
News
people
Mobile site
finance
News
people
Application
Goal: analyse exclusive content versus combined content in order to identify the variousnavigation paterns per device

BUSINESS APPLICATION
› Identify the specific behavior of each section in order to adapt
content promotion
› Tailor messages according to the channel to increase your
advertising revenue
› Optimize audience retention by content
15
MEDIA WEBSITE

BUSINESS APPLICATION
› 3 axis analysis:
16
RETAIL
Attraction Performances Malfunctions

BUSINESS APPLICATION
17
RETAIL
Traffic Conversion
Category 1
Category 2
Category 3
Category 4
Goal: Establish a compete diagnosis through a combined approach

BUSINESS APPLICATION
18
RETAIL
Conversion
Audience
PV / Visits
BUSINESS APPLICATION
19
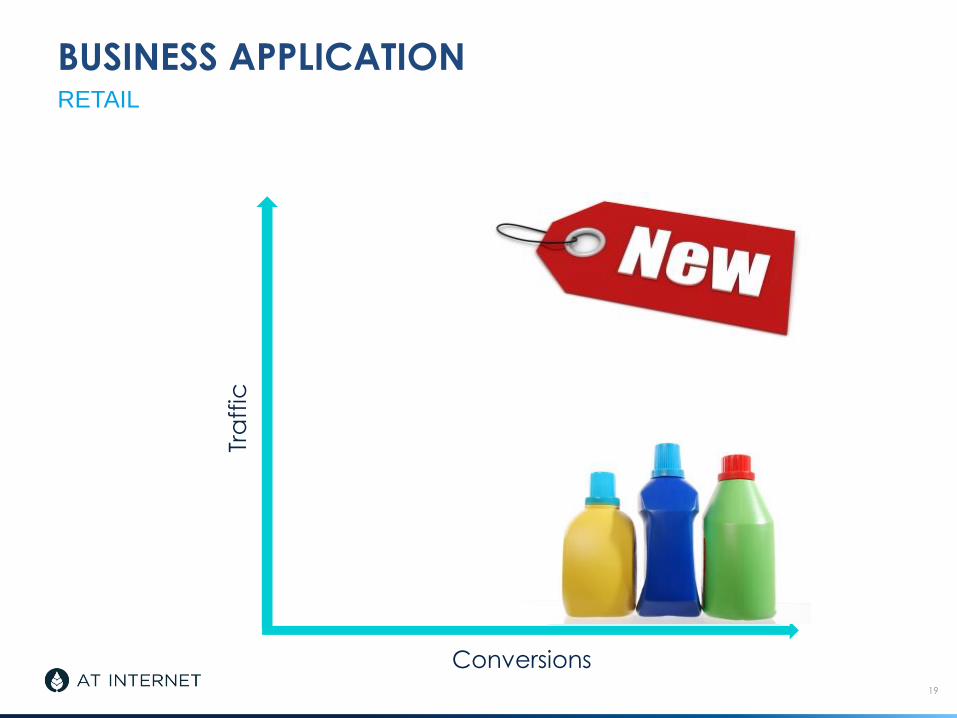
RETAIL
Conversions
Tra
ffic

BUSINESS APPLICATION
20
RETAIL
Books
Concerts
Goal: Organize topics so as to highlight the sections with a higher attraction rate

EXEMPLE D’APPLICATION
› Measure the section’s contribution to the websites’ sales.
› Identify product sections with the greatest loss rate
› Adjust the visibility of product categories according to their level of
attractiveness
21
RETAIL

NEW PRODUCT FEATURE
22

NEW PRODUCT FEATURES
23
DATA QUERY / APP DASHBOARD
Level 2 sites

NEW PRODUCT FEATURE
24
DATA QUERY / APP DASHBOARD
API Query builder accessible to all, to extract
information in a few clicks

NOUVEAUTÉS PRODUIT
25
DATA QUERY / APP DASHBOARD
Powerful application for smart and eye-catching
dashboarding

NEW PRODUCT FEATURE
26
API / DATA QUERY / APPLICATION DASHBOARD

NEW PRODUCT FEATURE
27
API / DATA QUERY / APPLICATION DASHBOARD
?